Nutrient Trends in the Nation's Rivers and Streams since 1972 Lori Sprague Coordinator, Surface-Water Trend Studies U.S. Geological Survey National Water-Quality Program The U.S. Geological Survey sampling the Missouri River. Photo by Kelly Brady, U.S. Geological Survey.

Welcome message from author
This document is posted to help you gain knowledge. Please leave a comment to let me know what you think about it! Share it to your friends and learn new things together.
Transcript

Nutrient Trends in the Nation'sRivers and Streams since 1972
Lori SpragueCoordinator, Surface-Water Trend Studies
U.S. Geological SurveyNational Water-Quality Program
The U.S. Geological Survey sampling the Missouri River.Photo by Kelly Brady, U.S. Geological Survey.

Data sources
NWIS, STORET, and other Federal, State, and local databases
25 million nutrient records from 322,000 sites and over 500organizations
Scope
Nutrients, pesticides, sediment, carbon, salinity, and aquaticecology
Nutrient focus: total nitrogen, total phosphorus, nitrate,ammonia, orthophosphate
Four trend periods: (1) 1972-2012, (2) 1982-2012, (3) 1992-2012, and (4) 2002-2012
NAWQA TREND ANALYSIS
Data screening Complete metadata
Start and end of data within one year of start and end ofspecified trend period
At least quarterly sampling
No more than a 30% gap in data coverage
Paired with gage
Coverage over a range of streamflow
Trend testWeighted regressions on time, discharge, and season
(WRTDS)
METHODS
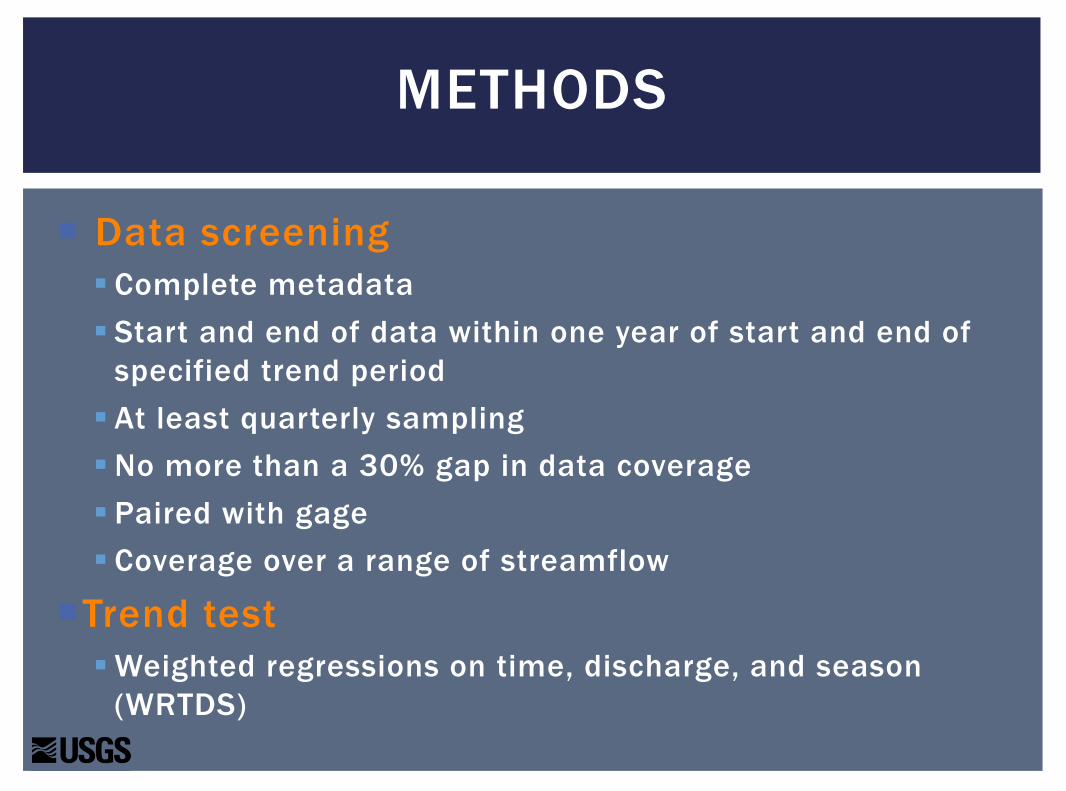
Finaltrendsites
The U.S. Geological Survey sampling the Colorado River.

Nutrient sites in all trend periods (856 sites)
PROVISIONAL DATA – SUBJECT TO REVISION

Nutrient sites in all trend periods (856 sites)
PROVISIONAL DATA – SUBJECT TO REVISION
Area, in mi2
2.2 - 1,204,000Agricultural area
0 – 93%Developed area
0 – 95%Mean rainfall
3 – 329 mm/yrBase flow index
1 – 85%

Total phosphorus sites by trend period
1972-2012 (41) 1982-2012 (145)
1992-2012 (304) 2002-2012 (489)
PROVISIONAL DATA – SUBJECT TO REVISION
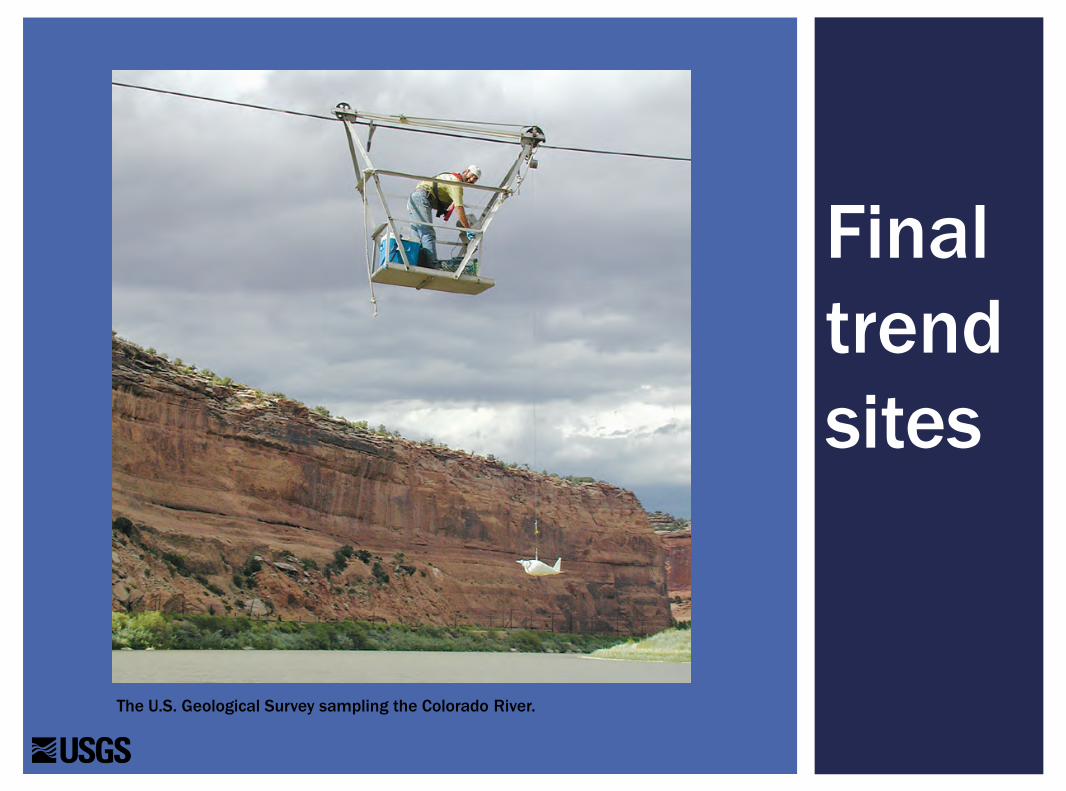
Results
Photograph from Franklin D. Roosevelt Presidential Library Museum

−100 −50 50 100 150 200
0.0
0.2
0.4
0.6
0.8
1.0
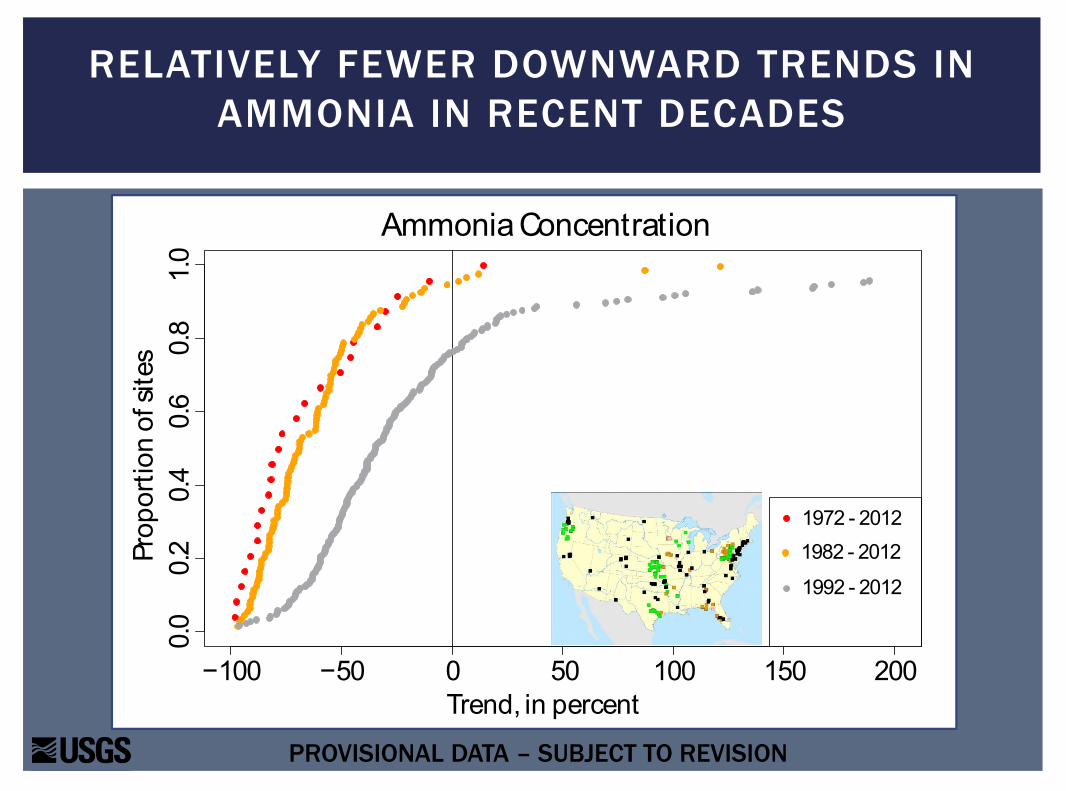
Ammonia Concentration
Trend, in percent
Pro
port
ion
ofs
ites
1972 - 2012
0
RELATIVELY FEWER DOWNWARD TRENDS INAMMONIA IN RECENT DECADES
PROVISIONAL DATA – SUBJECT TO REVISION

−100 −50 50 100 150 200
0.0
0.2
0.4
0.6
0.8
1.0
Ammonia Concentration
Trend, in percent
Pro
port
ion
ofs
ites
1972 - 2012
0
1982 - 2012
PROVISIONAL DATA – SUBJECT TO REVISION
RELATIVELY FEWER DOWNWARD TRENDS INAMMONIA IN RECENT DECADES
−100 −50 50 100 150 200
0.0
0.2
0.4
0.6
0.8
1.0
Ammonia Concentration
Trend, in percent
Pro
port
ion
ofs
ites
1972 - 2012
0
1982 - 2012
1992 - 2012
PROVISIONAL DATA – SUBJECT TO REVISION
RELATIVELY FEWER DOWNWARD TRENDS INAMMONIA IN RECENT DECADES

−100 −50 50 100 150 200
0.0
0.2
0.4
0.6
0.8
1.0
Ammonia Concentration
Trend, in percent
Pro
port
ion
ofs
ites
1972 - 2012
0
1982 - 2012
1992 - 2012
2002 -2012
PROVISIONAL DATA – SUBJECT TO REVISION
RELATIVELY FEWER DOWNWARD TRENDS INAMMONIA IN RECENT DECADES

SMALLER DIFFERENCES IN TOTALPHOSPHORUS TRENDS AMONG DECADES
PROVISIONAL DATA – SUBJECT TO REVISION
−100 −50 50 100 150 200
0.0
0.2
0.4
0.6
0.8
1.0
Total PhosphorusConcentration
Trend, in percent
Pro
port
ion
ofs
ites
1972 - 2012
1982 - 2012
1992 - 2012
2002 -2012
0

AMMONIA DECREASED AT SITES WITH THEHIGHEST CONCENTRATIONS
PROVISIONAL DATA – SUBJECT TO REVISION
0.01 0.05 0.10 0.50 1.00 5.00 10.00
Ammonia
1972−2012
Concentration at start of trend period, in mg/L
Tren
d,i
np
erce
nt
−100−50
0100
150
200
50
2002−2012
PROVISIONAL DATA – SUBJECT TO REVISION
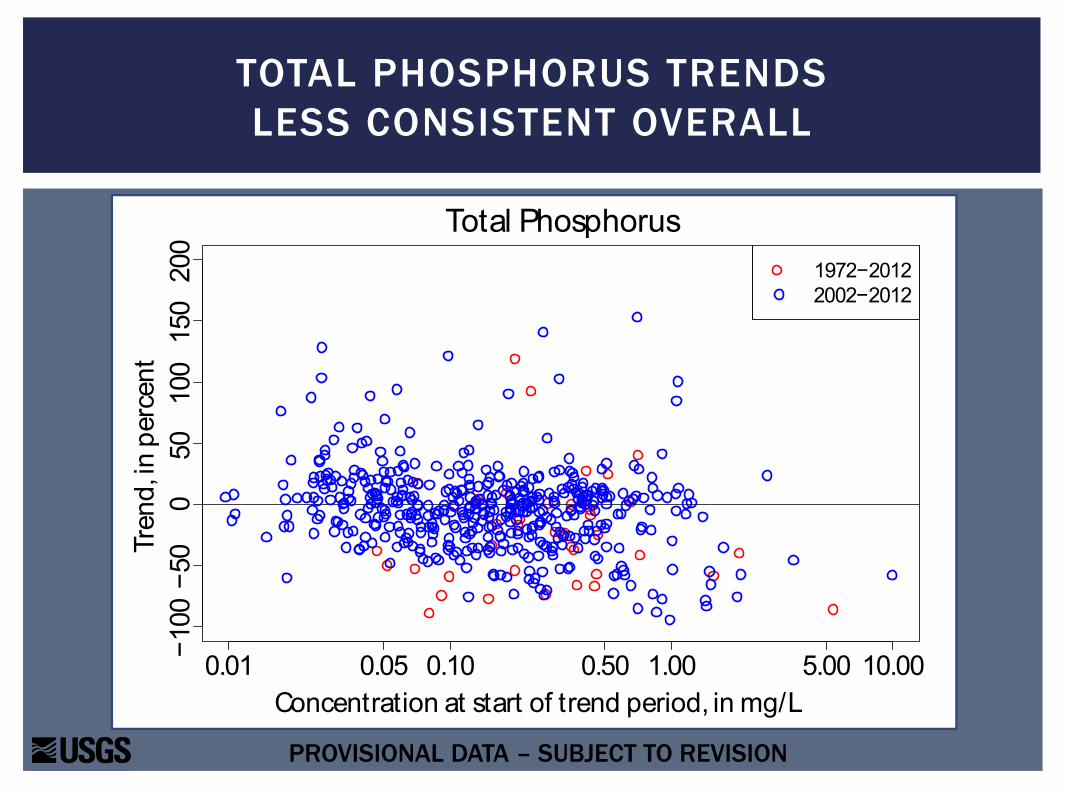
0.01 0.05 0.10 0.50 1.00 5.00 10.00
Total Phosphorus
1972−2012
Concentration at start of trend period, in mg/L
Tren
d,i
np
erce
nt
−100−50
0100
150
200
50
2002−2012
TOTAL PHOSPHORUS TRENDSLESS CONSISTENT OVERALL
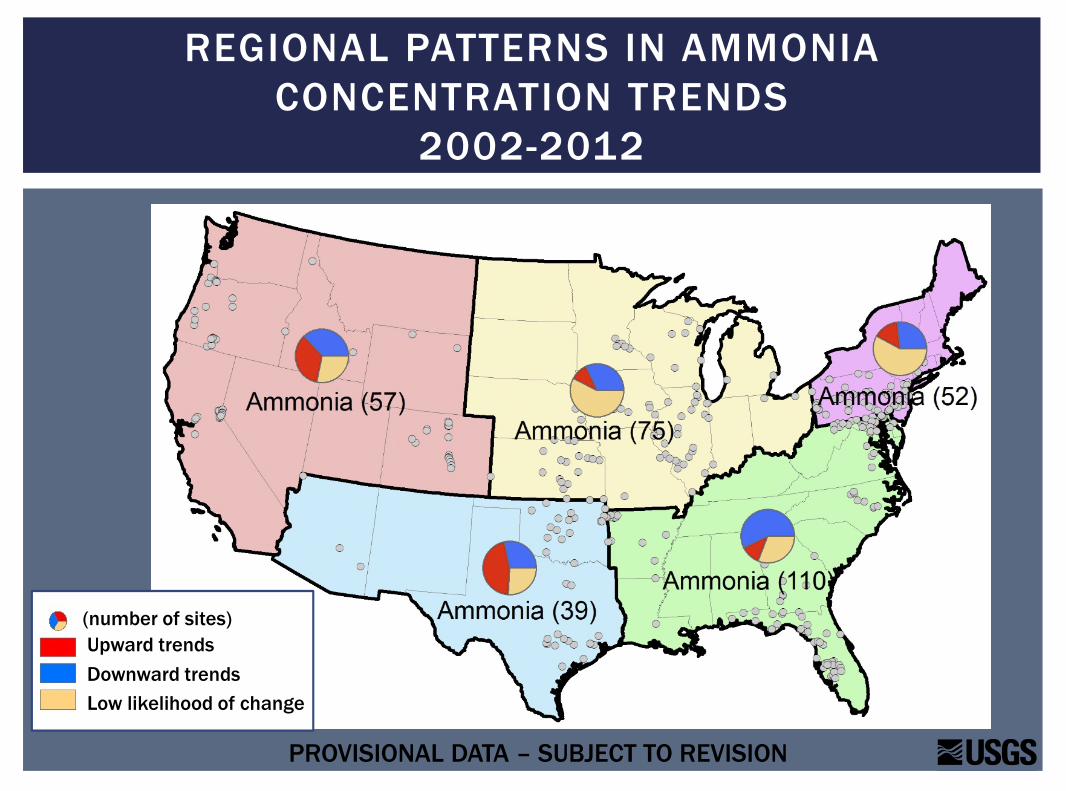
Upward trends
Downward trends
Low likelihood of change
(number of sites)
REGIONAL PATTERNS IN AMMONIACONCENTRATION TRENDS
2002-2012
PROVISIONAL DATA – SUBJECT TO REVISION
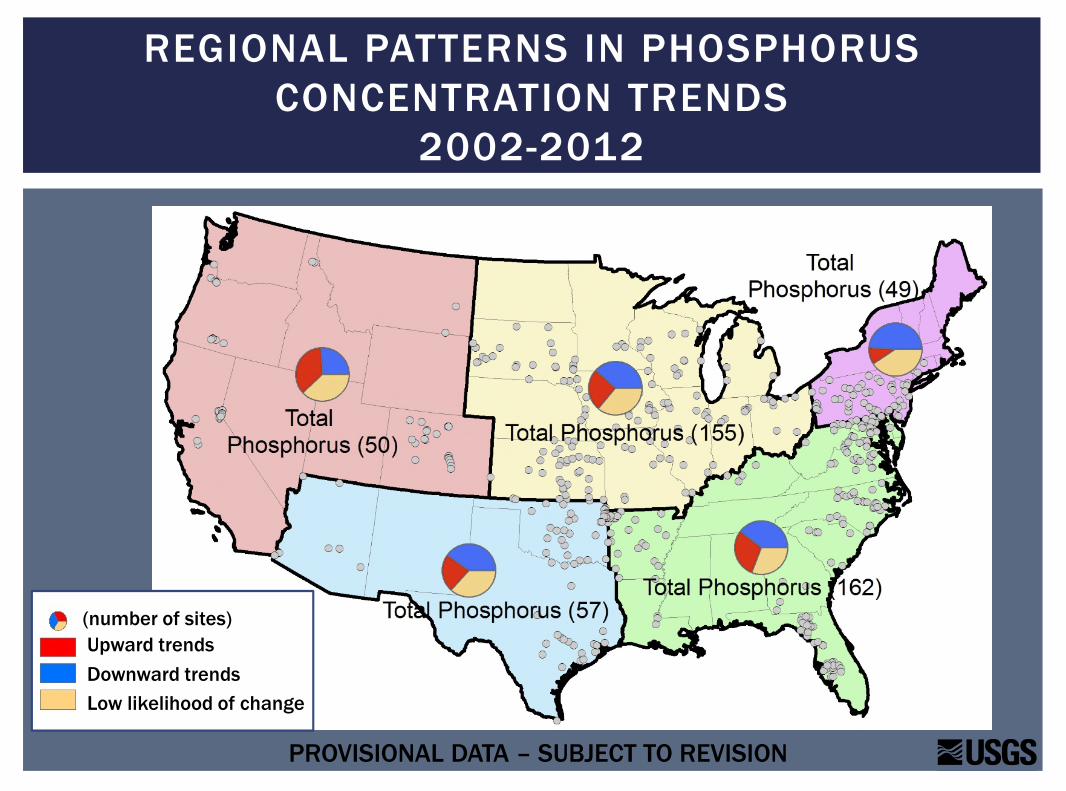
Upward trends
Downward trends
Low likelihood of change
(number of sites)
REGIONAL PATTERNS IN PHOSPHORUSCONCENTRATION TRENDS
2002-2012
PROVISIONAL DATA – SUBJECT TO REVISION
Trend results in this study
7,000+ for nutrients
22,000+ for all constituents
Topics for further study
Geographic distribution
Environmental significance
Major causes of change
Comparison across constituents
FUTURE WORK
Photograph by Lynn Betts, U.S.Department of Agriculture,Natural Resources Conservation Service

QUESTIONS?
Acknowledgments• James Falcone, Hank Johnson, Jenny Murphy, Gretchen Oelsner, Karen
Ryberg, Ted Stets, Skip Vecchia, Bob Zuellig, Melissa Riskin, LauraDeCicco, Bob Hirsch, Denise Argue, Jeff Deacon, Christine Wieben, AmyLudtke, Jeff Martin, and Candice Hopkins
• All of the organizations in the United States that have monitored streamquality over the years
Related Documents