RESEARCH ARTICLE Nutrient retention in plant biomass and sediments from the salt marsh in Hangzhou Bay estuary, China Xuexin Shao & Ming Wu & Binhe Gu & Yinxu Chen & Xinqiang Liang Received: 21 January 2013 / Accepted: 28 March 2013 / Published online: 16 April 2013 # Springer-Verlag Berlin Heidelberg 2013 Abstract Nutrient load into the ocean can be retained dur- ing the process of plant uptake and sedimentation in marshes along the bay zone. Seasonal variations of biomass and nutrient concentration in three dominated plant assem- blages and associated sediments were monitored in this study area to determine effects of salt marsh on nutrient retention. Results showed that plant aboveground biomass displayed a unimodal curve with nutrient concentration gen- erally decreased from spring to winter. Belowground bio- mass was relatively low during the rapid growth period with nutrient concentration tending to decrease and then increase during this period. Plant total nitrogen (TN) pools are higher than total phosphorus (TP) pools, and both pools showed significant seasonal variations. Water purification coeffi- cients (WPC) of nutrients by plant assimilation were 34.4/17.3, 19.3/24.0, and 5.14/6.04 t/(m 2 year) (TN/TP) for Phragmites australis , Spartina alterniflora , and Scirpus mariqueter, respectively. Overall, these results sug- gest that higher annual plant biomass and nutrient assimila- tion contribute to greater nutrient retention capacity and accumulation in sediments, thereby enabling reduced eutro- phication in transitional waters. Keywords Estuaries . Eutrophication . Salt marshes . Primary production . Nutrients . Retention Introduction In coastal areas, population growth and rapid economic development contribute to many point and nonpoint source nutrient inputs, both directly or indirectly, which largely lead increases in nutrient concentration in ocean waters. Nitrogen (N) and phosphorus (P) are essential nutrient elements in ecosystems, and P is a limiting nutrient for phytoplankton growth (Redfield 1958; Boers et al. 1998). Eutrophication in aquatic ecosystems caused by excessive input of N and P is recognized as a major water quality problem globally (Smith 2003; Schindler 2006). Coastal wetland is one type of wetlands, which is located between ocean and terrestrial land, and is composed of a complex and assemblage of swamps, marshes, mudflats, etc. (Bai et al. 2012a). Salt marsh is typically dominated by halophytic (salt-tolerant) plants such as herbs, grasses, or low shrubs, with daily tidal flow that occurs and continu- ously floods the area (Adam 1990). As a transitional zone between terrestrial and marine ecosystems, salt marshes are one of the most biologically productive habitats that drive nutrient cycles and food webs supporting estuarine and coastal ecosystems (Marinucci 1982). Plants and sediment nutrient pools may greatly affect nutrient cycles in salt marshes. Salt marsh plants have high assimilative capacity for N, P, and heavy metals (Quan et al. 2007; González-Alcaraz et al. 2012; Negrin et al. 2012). Sediment N mineralization, nitrification, and denitrification are critical processes of the N cycle (Bai et al. 2010, 2012a; Gao et al. 2012). Nitrification is an important source of NO 3 - for denitrification, while denitrification was the main mechanism associated with removal of nitrate in wetlands (DeLaune et al. 2005; Bai et al. 2010; González-Alcaraz et al. 2011). There was a higher contribution of Spartina maritima marshes and cypress swamps to N removal through denitrification, highlighting the role of the wetlands in this ecosystem service (Lindau et al. 2008; Sousa et al. Responsible editor: Hailong Wang X. Shao : Y. Chen : X. Liang (*) Institute of Environmental Science and Technology, Zhejiang University, Hangzhou 310058, People’ s Republic of China e-mail: [email protected] X. Shao : M. Wu Research Institute of Subtropical Forestry, Chinese Academy of Forestry, Fuyang, Zhejiang 311400, People’ s Republic of China B. Gu Department of Soil and Water Science, University of Florida, Gainesville, FL 32611, USA Environ Sci Pollut Res (2013) 20:6382–6391 DOI 10.1007/s11356-013-1698-6

Welcome message from author
This document is posted to help you gain knowledge. Please leave a comment to let me know what you think about it! Share it to your friends and learn new things together.
Transcript
RESEARCH ARTICLE
Nutrient retention in plant biomass and sedimentsfrom the salt marsh in Hangzhou Bay estuary, China
Xuexin Shao & Ming Wu & Binhe Gu & Yinxu Chen &
Xinqiang Liang
Received: 21 January 2013 /Accepted: 28 March 2013 /Published online: 16 April 2013# Springer-Verlag Berlin Heidelberg 2013
Abstract Nutrient load into the ocean can be retained dur-ing the process of plant uptake and sedimentation inmarshes along the bay zone. Seasonal variations of biomassand nutrient concentration in three dominated plant assem-blages and associated sediments were monitored in thisstudy area to determine effects of salt marsh on nutrientretention. Results showed that plant aboveground biomassdisplayed a unimodal curve with nutrient concentration gen-erally decreased from spring to winter. Belowground bio-mass was relatively low during the rapid growth period withnutrient concentration tending to decrease and then increaseduring this period. Plant total nitrogen (TN) pools are higherthan total phosphorus (TP) pools, and both pools showedsignificant seasonal variations. Water purification coeffi-cients (WPC) of nutrients by plant assimilation were34.4/17.3, 19.3/24.0, and 5.14/6.04 t/(m2 year) (TN/TP)for Phragmites australis, Spartina alterniflora, andScirpus mariqueter, respectively. Overall, these results sug-gest that higher annual plant biomass and nutrient assimila-tion contribute to greater nutrient retention capacity andaccumulation in sediments, thereby enabling reduced eutro-phication in transitional waters.
Keywords Estuaries . Eutrophication . Salt marshes .
Primary production . Nutrients . Retention
Introduction
In coastal areas, population growth and rapid economicdevelopment contribute to many point and nonpoint sourcenutrient inputs, both directly or indirectly, which largely leadincreases in nutrient concentration in ocean waters. Nitrogen(N) and phosphorus (P) are essential nutrient elements inecosystems, and P is a limiting nutrient for phytoplanktongrowth (Redfield 1958; Boers et al. 1998). Eutrophication inaquatic ecosystems caused by excessive input of N and P isrecognized as a major water quality problem globally (Smith2003; Schindler 2006).
Coastal wetland is one type of wetlands, which is locatedbetween ocean and terrestrial land, and is composed of acomplex and assemblage of swamps, marshes, mudflats, etc.(Bai et al. 2012a). Salt marsh is typically dominated byhalophytic (salt-tolerant) plants such as herbs, grasses, orlow shrubs, with daily tidal flow that occurs and continu-ously floods the area (Adam 1990). As a transitional zonebetween terrestrial and marine ecosystems, salt marshes areone of the most biologically productive habitats that drivenutrient cycles and food webs supporting estuarine andcoastal ecosystems (Marinucci 1982).
Plants and sediment nutrient pools may greatly affectnutrient cycles in salt marshes. Salt marsh plants have highassimilative capacity for N, P, and heavy metals (Quan et al.2007; González-Alcaraz et al. 2012; Negrin et al. 2012).Sediment N mineralization, nitrification, and denitrificationare critical processes of the N cycle (Bai et al. 2010, 2012a;Gao et al. 2012). Nitrification is an important source ofNO3
− for denitrification, while denitrification was the mainmechanism associated with removal of nitrate in wetlands(DeLaune et al. 2005; Bai et al. 2010; González-Alcaraz etal. 2011). There was a higher contribution of Spartinamaritima marshes and cypress swamps to N removalthrough denitrification, highlighting the role of the wetlandsin this ecosystem service (Lindau et al. 2008; Sousa et al.
Responsible editor: Hailong Wang
X. Shao :Y. Chen :X. Liang (*)Institute of Environmental Science and Technology, ZhejiangUniversity, Hangzhou 310058, People’s Republic of Chinae-mail: [email protected]
X. Shao :M. WuResearch Institute of Subtropical Forestry, Chinese Academy ofForestry, Fuyang, Zhejiang 311400, People’s Republic of China
B. GuDepartment of Soil and Water Science, University of Florida,Gainesville, FL 32611, USA
Environ Sci Pollut Res (2013) 20:6382–6391DOI 10.1007/s11356-013-1698-6
2012). Sediments play an important role in P retention bysorption and precipitation reactions (Pant and Reddy 2001;Lai and Lam 2008). Under oxic and anoxic conditions, Cacompounds were the main inorganic soil components con-tributing to P retention in the salt marsh, except in sites withlow CaCO3 concentration, where Fe and Al oxides contrib-ute more to P retention (Álvarez-Rogel et al. 2007).Retention of suspended particles in sediment colonized bymarsh vegetation also acts as a trap for nutrients and con-taminants (Cartaxana and Catarino 1997; Palomo et al.2004; Quan et al. 2007; Sousa et al. 2010). Differences innutrient accumulation levels occur among plant species aswell as between sediments (Cartaxana and Catarino 1997;Palomo et al. 2004). Considering the role of plants in thisprocess, salt marshes are crucial to N and P remediation.Nutrient cycling and accumulation processes partitioned bysalt marsh halophytes have been found to reduce eutrophi-cation and lower atmospheric CO2 (Sousa et al. 2010).
There are several threats to existence and functioning ofsalt marshes, particularly direct and indirect anthropogenicimpacts such as leveeing of rivers, beach reclamation, aqua-culture and marine construction, and other activities(DeLaune et al. 2005; Bromberg-Gedan et al. 2009).Notably, these effects have resulted in the sharp decline ofnatural intertidal beach and increased pollutant loads tointertidal and coastal waters in the vicinity of HangzhouBay, adjacent to the East China Sea.
In recent years, increased delivery of N and P resulting insevere eutrophication of Hangzhou Bay has been document-ed in various government reports (MEPC 2010; OFBZ
2011), which indicate that the bay's environmental qualityis below Grade IV Sea Water Quality Standard of China(0.50 and 0.045 mg/kg for inorganic N and orthophosphate,respectively). In addition, land reclamation is decreasing thesize of Hangzhou Bay area. For example, 70 % of the totalland area (1,154 km2) in Cixi County, located in southHangzhou Bay, was reclaimed from salt marshes (Fengand Bao 2006). The decline in salt marshes minimizes thebuffer zone between the continent and the ocean that acts asa biological filter, thereby accelerating the eutrophicationprocess as the marsh nutrient retention capacity is reduced.
To date, limited studies have been conducted to evaluatethe role of N and P cycling in the impacted salt marshes ofHangzhou Bay. Hence, the aims of this study were to eval-uate the nutrient (N and P) pools and the seasonal changes inplants (Phragmites australis (Cav.) Trin. ex Steud., Spartinaalterniflora Loisel., and Scirpus mariqueter Wang et Tang.)and sediments of the Hangzhou Bay salt marsh.
Material and methods
Study site
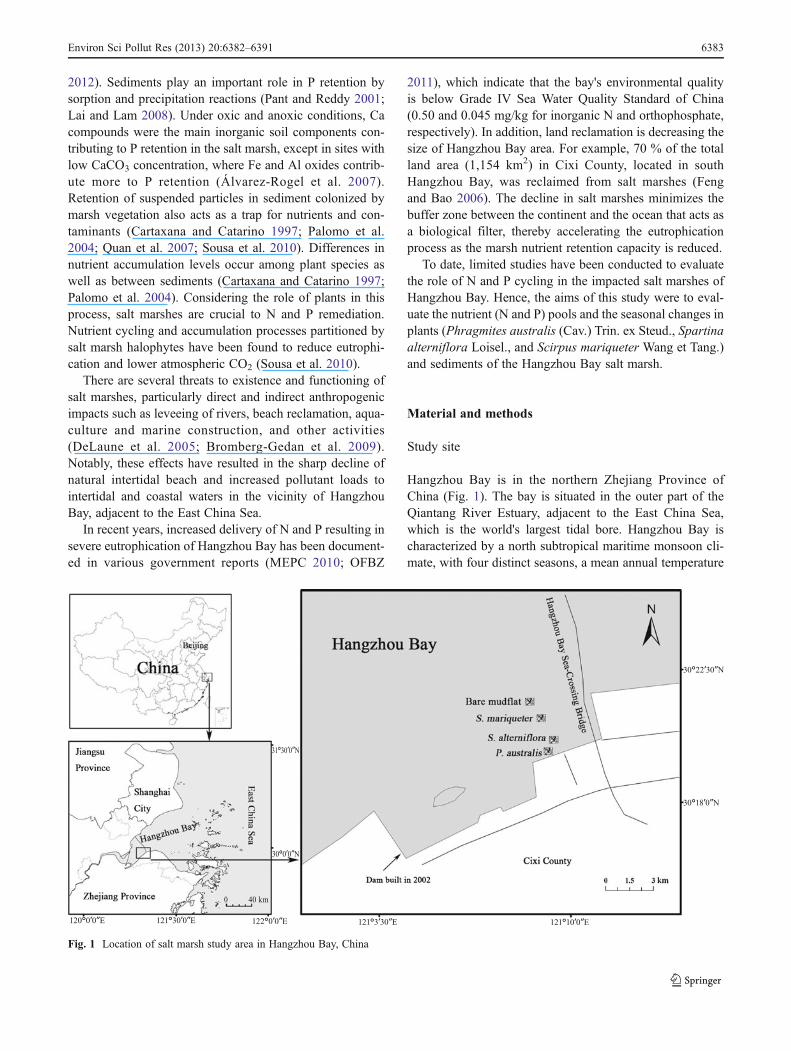
Hangzhou Bay is in the northern Zhejiang Province ofChina (Fig. 1). The bay is situated in the outer part of theQiantang River Estuary, adjacent to the East China Sea,which is the world's largest tidal bore. Hangzhou Bay ischaracterized by a north subtropical maritime monsoon cli-mate, with four distinct seasons, a mean annual temperature
Fig. 1 Location of salt marsh study area in Hangzhou Bay, China
Environ Sci Pollut Res (2013) 20:6382–6391 6383
of 16 °C, annual rainfall of 1,273 mm, and water depth of8–10 m. The study area is located in the south HangzhouBay. The area's strong tidal currents have a high carryingcapacity for suspended sediments that were carrieddownstream from the Yangtze River and QiantangRiver (Zhou and Gao 2004) and allow rapid accumula-tion of sediments that extend the shoreline at a velocityof 292 m/year (Yang et al. 2004). Semidiurnal tidesregularly flood the low marsh and mudflat zones, whilethe high marsh is irregularly inundated, and spring hightides may also flood the entire salt marsh area.
The main characteristics of the sediment indicated by aprevious investigation in the research area were shown inTable 1. The water in Hangzhou bay estuary is a mixture ofseawater and fresh water and its salinity can range from 5 to15 g/kg. There are only a few plant species in natural marsh.Native dominant plant species includes P. australis and S.mariqueter, each of which can form a dense monoculture inthe marsh zone (Shao et al. 2011). Monocultures of P.australis are often found around the high marsh zone, whileS. mariqueter, a pioneer plant that is endemic to China,dominates the low marsh zone. S. alterniflora often invadesthe midmarsh zone and then quickly expands toward thehigh and low marsh zones (Quan et al. 2007).
Sampling strategy
Three randomly selected 0.5×0.5 plots representative of P.australis, S. alterniflora, and S. mariqueter were located atthe high, mid, and low marsh separated by at least 100 m.Plant biomass was collected bimonthly in March, May, July,September, and November 2009, and these months general-ly corresponded to the four seasons in our research area.During each sampling event, live aboveground plant wasclipped at the ground level. Belowground samples (rootsand rhizomes) were collected from the same plots using a0.5×0.5×0.6-m box corer. Sediment cores were washedover a 2-mm mesh screen and retained roots and rhizomeswere collected for analysis. Additionally, three sedimentcores with two layers (0–5 cm as surface sediment and 5–20 cm as rooted sediment) were sampled using anEijkelkamp gouge auger (50 cm length by 6 cm diameter)
from each plant species. Sediment in bare mudflat that waslocated near the plots of S. mariqueter was taken as control.
Analytical procedures
Plant samples were rinsed thoroughly with tap water andthen cleaned with deionized water. Samples were first driedat 105 °C for 30 min and then dried at 60 °C to constantweight for approximately 48 h. The above- and below-ground biomass of the three salt marsh plants were calcu-lated on a dry weight basis (grams per square meter),respectively. Sediment was dried at room temperature.Each of the dry sediment and plant samples was homoge-nized by grinding to powder for analysis of total N (TN) andtotal P (TP) concentration. TN concentration of the sedimentand plant was determined by the Kjeldahl method (Nelsonand Sommers 1980). TP was measured using amolybdophosphoric blue colorimetric method after acid di-gestion (Murphy and Riley 1962).
Calculation of nutrient pools and production
Elemental concentration and above- and belowground bio-mass were multiplied to yield total amounts of above- andbelowground nutrient pools for each plant species, respec-tively. Annual net primary production for aboveground wasestimated by peak live aboveground biomass, and below-ground was calculated based on the differences between themaximum and minimum belowground biomass recordedduring the study period (De la Cruzz and Hackney 1977).Annual net nutrient primary production (ANNPP) was esti-mated similarly.
Data analysis
Repeated ANOVA (analysis of variance) measurementswere carried out in order to compare the evolution over timeand among different sampling plots for the parameters ana-lyzed in sediment and plant samples, separately, using SPSS16.0. Dependent variables were above- and belowgroundbiomass, plant and sediment nutrient concentrations, andplant nutrient pools. Data were log-transformed, when
Table 1 Main characteristics of the sediment in research area. The values are average±SD
pHa Salinitya (g/kg) OCa (g/kg) TNa (g/kg) TPa (g/kg) PSCb (g/kg)
Value 8.42±0.15 5.17±1.45 5.86±1.45 0.56±0.22 0.60±0.03 0.33±0.12
Sanda (%) Silta (%) Claya (%) Caa (g/kg) Fea (g/kg) Ala (g/kg)
Value 5.55±2.72 81.8±1.46 12.6±2.89 33.5±5.00 26.5±3.88 42.4±13.1
a n=24b Phosphate sorption capacity (PSC) (n=4). Estimated by nonlinearly fitting the sorption data obtained from batch incubations into the Langmuiradsorption isotherm according to the method of Lai and Lam (2008)
6384 Environ Sci Pollut Res (2013) 20:6382–6391
necessary, to achieve homogeneity of variance (Levene'stest). When data did not fulfill the sphericity requirement forMauchly's sphericity test, univariate F statistics using a cor-rector index of epsilon were applied, based on Greenhouse–Geisser, Huynh–Feldt, or lower-bound corrections. Pearson'scorrelation analyses were performed among plant biomass,nutrient concentrations, and nutrient pools. Differences wereconsidered significant if probabilities for nonsignificancewere <0.05.
Results
Above- and belowground biomass
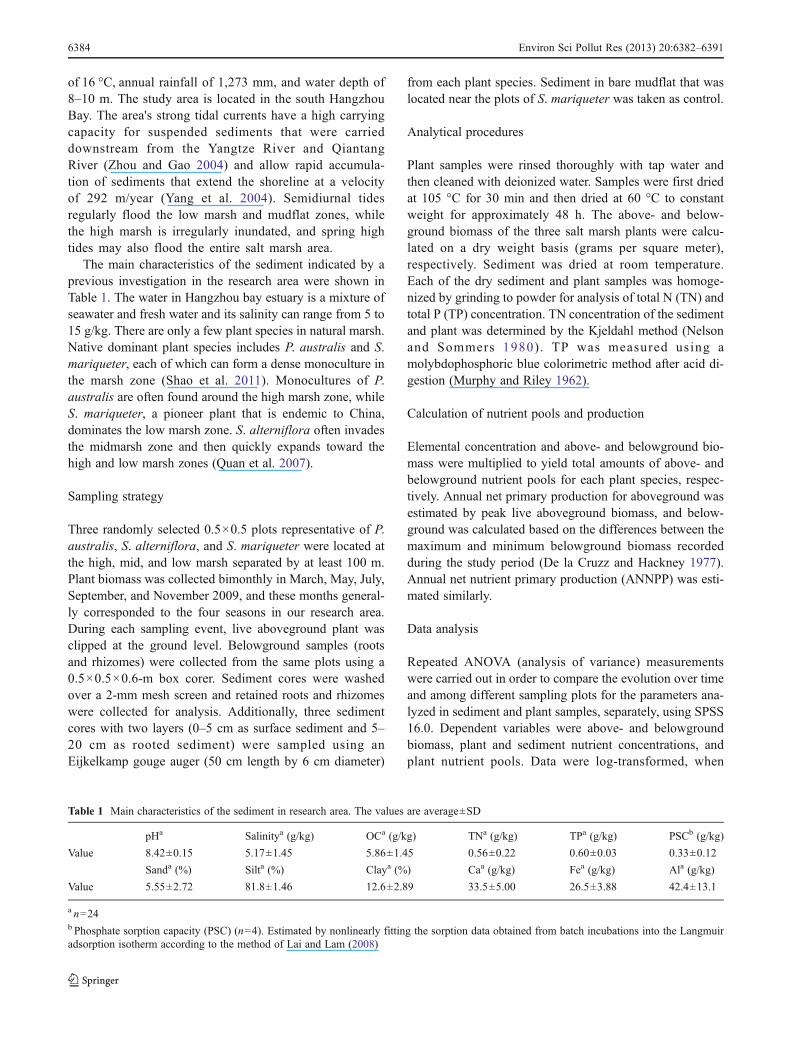
The ANOVA of repeated measures indicated that plantaboveground and belowground biomass differed significant-ly across seasons (Fig. 2, p<0.05). The aboveground bio-mass of all species showed similar seasonal patterns with aunimodal curve. P. australis and S. mariqueter reached thehighest average aboveground biomass (3,731.7 and487.4 g/m2, respectively) in July, whereas S. alternifloraachieved its highest level (3,105.9 g/m2) in September.Overall, the belowground biomass was relatively high in theearly stage of plant growth or in the fall during wilting anddecreased during the rapid growth phase.
The aboveground biomass of the three species was rela-tively low compared to belowground biomass during the firstsampling. Subsequently, the aboveground biomass was higherthan belowground biomass (p<0.05), accounting for morethan 60 % of total plant biomass between May andSeptember. In November, the trend was the same for P.australis and S. alterniflora, while for S. mariqueter, theaboveground biomass was lower than belowground as itwithered earlier than the other two species. The meanbelowground/aboveground biomass ratios during the
growing season for P. australis, S. alterniflora, and S.mariqueter were 2.44, 1.38, and 0.62, respectively.However, the mean ratios were 0.38, 0.31, and 0.62, respec-tively, if we don't include the date of the early stage in March.
Plant biomass showed a significant difference betweenplants (p<0.05). The aboveground biomass of P. australisand S. alterniflora was significantly greater than those of S.mariqueter (Fig. 2, p<0.05), while there was no significantdifference between the native plant (P. australis) and inva-sive plant (S. alterniflora). Belowground biomass displayeda trend of S. alterniflora>P. australis>S. mariqueter duringthe entire study period.
Nitrogen and phosphorus concentrations in plants
Seasonal patterns of TN and TP concentrations in plant ofthree species are shown in Fig. 3. TN and TP concentrationsin aboveground part of P. australis and S. alterniflora werehighest at the early period of growth and gradually de-creased along the study period. The variation of S.mariqueter is similar for TP concentration, while thechanges were not significant for TN concentration. Theconcentrations of TN and TP in the belowground partshowed a decreasing and then an increasing tendency overthe year. The concentrations in the belowground part of P.australis and S. mariqueter were lowest (3.64 and 6.20 g/kgfor TN, 0.655 and 1.65 g/kg for TP, respectively) in Julywhen the aboveground biomass was highest. The turningpoint for S. alterniflora was in September (2.26 and0.25 g/kg for TN and TP, respectively) when its above-ground biomass reached the highest value (Fig. 2).
The TN concentration of the three plant species was muchgreater in the aboveground than the belowground part(Fig. 3), and the TP concentration had varying trends be-tween above- and belowground parts across seasons (Fig. 3).The ANOVA of repeated measures indicates significant dif-ferences of plant TN and TP concentrations among thespecies (p<0.05). Both TN and TP concentrations weresignificantly greater in S. mariqueter than in P. australisand S. alterniflora (Fig. 3, p<0.05), except in March whenS. mariqueter had no burgeoned aboveground growth.
Nitrogen and phosphorus concentrations in sediment
The TN and TP concentrations and seasonal dynamics invegetated and unvegetated sediments are shown in Fig. 4.Study results indicate that sediment TN and TP concentra-tions varied significantly across seasons (p<0.05) but didnot differ significantly between depths. The sediment TNconcentration had significant variation among plant speciesand bare mudflat (p<0.05). TN concentration was signifi-cantly greater in the plots of P. australis, S. alterniflora, andS. mariquete than in the plots of bare mudflats (Fig. 4, p<
Fig. 2 Above- and belowground plant biomass (average±SD, n=3,g/m2) in salt marsh
Environ Sci Pollut Res (2013) 20:6382–6391 6385
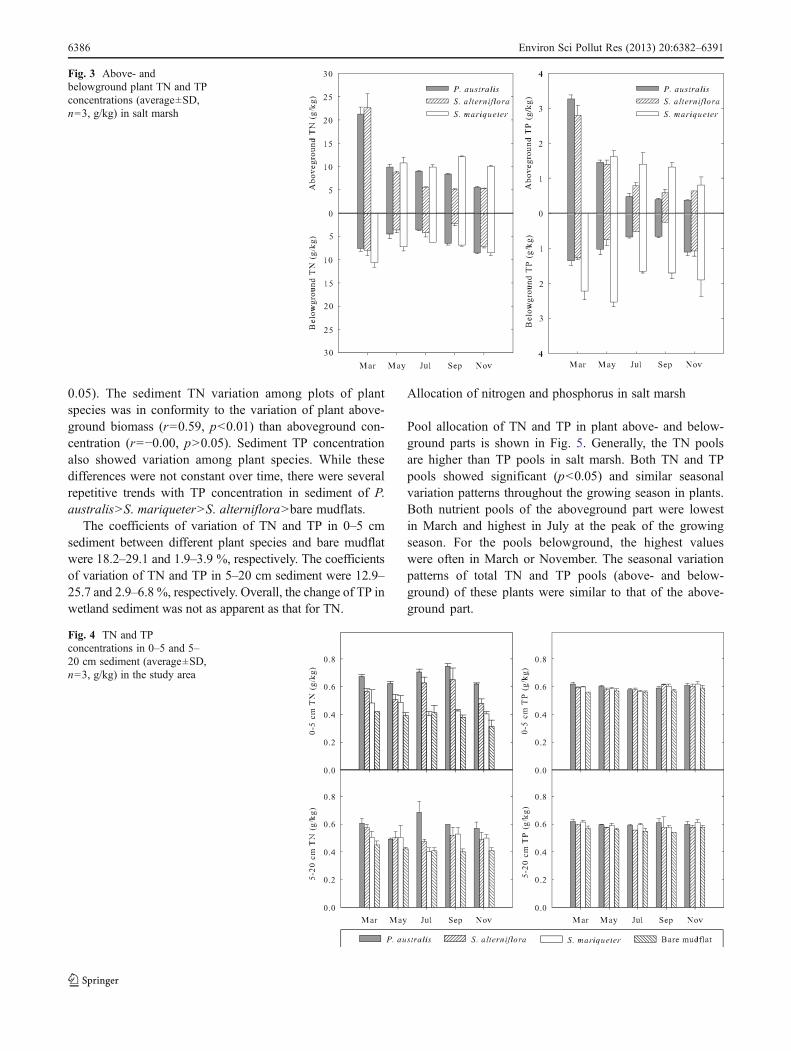
0.05). The sediment TN variation among plots of plantspecies was in conformity to the variation of plant above-ground biomass (r=0.59, p<0.01) than aboveground con-centration (r=−0.00, p>0.05). Sediment TP concentrationalso showed variation among plant species. While thesedifferences were not constant over time, there were severalrepetitive trends with TP concentration in sediment of P.australis>S. mariqueter>S. alterniflora>bare mudflats.
The coefficients of variation of TN and TP in 0–5 cmsediment between different plant species and bare mudflatwere 18.2–29.1 and 1.9–3.9 %, respectively. The coefficientsof variation of TN and TP in 5–20 cm sediment were 12.9–25.7 and 2.9–6.8 %, respectively. Overall, the change of TP inwetland sediment was not as apparent as that for TN.
Allocation of nitrogen and phosphorus in salt marsh
Pool allocation of TN and TP in plant above- and below-ground parts is shown in Fig. 5. Generally, the TN poolsare higher than TP pools in salt marsh. Both TN and TPpools showed significant (p<0.05) and similar seasonalvariation patterns throughout the growing season in plants.Both nutrient pools of the aboveground part were lowestin March and highest in July at the peak of the growingseason. For the pools belowground, the highest valueswere often in March or November. The seasonal variationpatterns of total TN and TP pools (above- and below-ground) of these plants were similar to that of the above-ground part.
Fig. 3 Above- andbelowground plant TN and TPconcentrations (average±SD,n=3, g/kg) in salt marsh
Fig. 4 TN and TPconcentrations in 0–5 and 5–20 cm sediment (average±SD,n=3, g/kg) in the study area
6386 Environ Sci Pollut Res (2013) 20:6382–6391
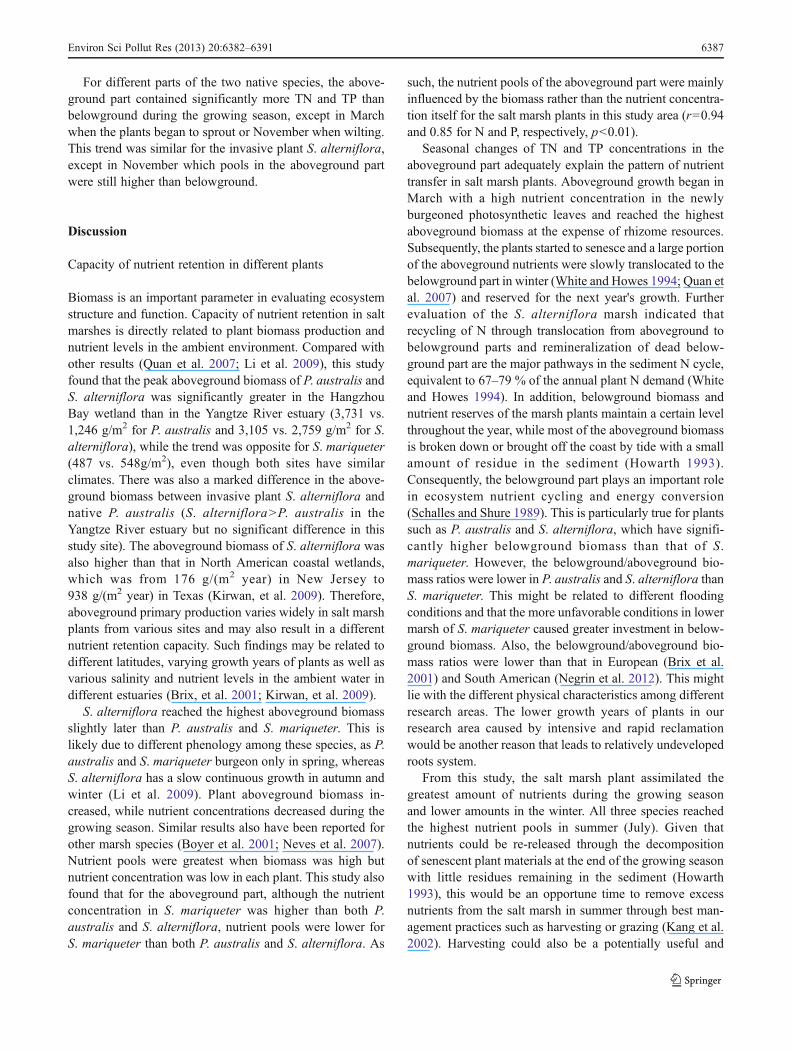
For different parts of the two native species, the above-ground part contained significantly more TN and TP thanbelowground during the growing season, except in Marchwhen the plants began to sprout or November when wilting.This trend was similar for the invasive plant S. alterniflora,except in November which pools in the aboveground partwere still higher than belowground.
Discussion
Capacity of nutrient retention in different plants
Biomass is an important parameter in evaluating ecosystemstructure and function. Capacity of nutrient retention in saltmarshes is directly related to plant biomass production andnutrient levels in the ambient environment. Compared withother results (Quan et al. 2007; Li et al. 2009), this studyfound that the peak aboveground biomass of P. australis andS. alterniflora was significantly greater in the HangzhouBay wetland than in the Yangtze River estuary (3,731 vs.1,246 g/m2 for P. australis and 3,105 vs. 2,759 g/m2 for S.alterniflora), while the trend was opposite for S. mariqueter(487 vs. 548g/m2), even though both sites have similarclimates. There was also a marked difference in the above-ground biomass between invasive plant S. alterniflora andnative P. australis (S. alterniflora>P. australis in theYangtze River estuary but no significant difference in thisstudy site). The aboveground biomass of S. alterniflora wasalso higher than that in North American coastal wetlands,which was from 176 g/(m2 year) in New Jersey to938 g/(m2 year) in Texas (Kirwan, et al. 2009). Therefore,aboveground primary production varies widely in salt marshplants from various sites and may also result in a differentnutrient retention capacity. Such findings may be related todifferent latitudes, varying growth years of plants as well asvarious salinity and nutrient levels in the ambient water indifferent estuaries (Brix, et al. 2001; Kirwan, et al. 2009).
S. alterniflora reached the highest aboveground biomassslightly later than P. australis and S. mariqueter. This islikely due to different phenology among these species, as P.australis and S. mariqueter burgeon only in spring, whereasS. alterniflora has a slow continuous growth in autumn andwinter (Li et al. 2009). Plant aboveground biomass in-creased, while nutrient concentrations decreased during thegrowing season. Similar results also have been reported forother marsh species (Boyer et al. 2001; Neves et al. 2007).Nutrient pools were greatest when biomass was high butnutrient concentration was low in each plant. This study alsofound that for the aboveground part, although the nutrientconcentration in S. mariqueter was higher than both P.australis and S. alterniflora, nutrient pools were lower forS. mariqueter than both P. australis and S. alterniflora. As
such, the nutrient pools of the aboveground part were mainlyinfluenced by the biomass rather than the nutrient concentra-tion itself for the salt marsh plants in this study area (r=0.94and 0.85 for N and P, respectively, p<0.01).
Seasonal changes of TN and TP concentrations in theaboveground part adequately explain the pattern of nutrienttransfer in salt marsh plants. Aboveground growth began inMarch with a high nutrient concentration in the newlyburgeoned photosynthetic leaves and reached the highestaboveground biomass at the expense of rhizome resources.Subsequently, the plants started to senesce and a large portionof the aboveground nutrients were slowly translocated to thebelowground part in winter (White and Howes 1994; Quan etal. 2007) and reserved for the next year's growth. Furtherevaluation of the S. alterniflora marsh indicated thatrecycling of N through translocation from aboveground tobelowground parts and remineralization of dead below-ground part are the major pathways in the sediment N cycle,equivalent to 67–79 % of the annual plant N demand (Whiteand Howes 1994). In addition, belowground biomass andnutrient reserves of the marsh plants maintain a certain levelthroughout the year, while most of the aboveground biomassis broken down or brought off the coast by tide with a smallamount of residue in the sediment (Howarth 1993).Consequently, the belowground part plays an important rolein ecosystem nutrient cycling and energy conversion(Schalles and Shure 1989). This is particularly true for plantssuch as P. australis and S. alterniflora, which have signifi-cantly higher belowground biomass than that of S.mariqueter. However, the belowground/aboveground bio-mass ratios were lower in P. australis and S. alterniflora thanS. mariqueter. This might be related to different floodingconditions and that the more unfavorable conditions in lowermarsh of S. mariqueter caused greater investment in below-ground biomass. Also, the belowground/aboveground bio-mass ratios were lower than that in European (Brix et al.2001) and South American (Negrin et al. 2012). This mightlie with the different physical characteristics among differentresearch areas. The lower growth years of plants in ourresearch area caused by intensive and rapid reclamationwould be another reason that leads to relatively undevelopedroots system.
From this study, the salt marsh plant assimilated thegreatest amount of nutrients during the growing seasonand lower amounts in the winter. All three species reachedthe highest nutrient pools in summer (July). Given thatnutrients could be re-released through the decompositionof senescent plant materials at the end of the growing seasonwith little residues remaining in the sediment (Howarth1993), this would be an opportune time to remove excessnutrients from the salt marsh in summer through best man-agement practices such as harvesting or grazing (Kang et al.2002). Harvesting could also be a potentially useful and
Environ Sci Pollut Res (2013) 20:6382–6391 6387
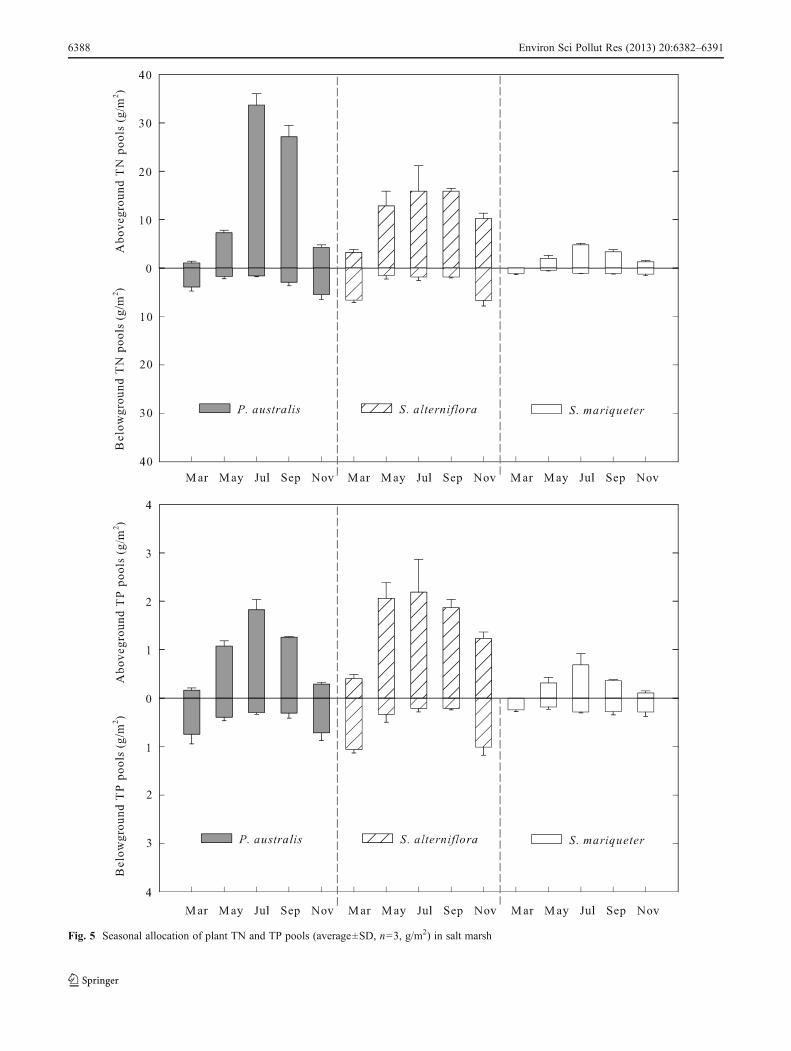
Fig. 5 Seasonal allocation of plant TN and TP pools (average±SD, n=3, g/m2) in salt marsh
6388 Environ Sci Pollut Res (2013) 20:6382–6391
effective approach for the control and management of theexotic and invasive plant S. alterniflora.
The influence of plants on sediment nutrient retention
Distribution and accumulation of N and P in sediment arerelated to allochthonous and autochthonous sources, sedi-ment characteristics (composition, grain size, hydrology, Eh,and pH), and nutrient properties (Pant and Reddy 2001;Álvarez-Rogel et al. 2007; Song et al. 2007; Zhou et al.2007; Bai et al. 2012b). Changes in species compositionalso may alter ecosystem structure (e.g., vertical root pro-file) and processes (e.g., nutrient cycling and carbon alloca-tion) (Liao et al. 2008; Ehrenfeld 2010), suggesting thatsediment nutrient concentration may consequently bechanged with different plant species.
In this study, the variation of sediment TN concentrationamong plant species was more consistent for plant above-ground biomass, as plants remove N from water and en-hance TN storage in sediment by increasing the organicfraction. Phosphorous concentration is affected less byplant species because it is dominated by sediment adsorp-tion rather than biological processes (Picard et al. 2005).The variation of sediment TP concentration is more relatedto P fractionation and is affected by sediment characteris-tics such as grain size composition. Preliminary studies(Liang et al. 2012) in this area have shown that calciumcarbonate-bound P was the main form of P, which wasrelatively evenly distributed in the sediment of differentgrain sizes. Therefore, the spatial variation of TP in sed-iment is not as apparent as TN.
Sediment reflects historic accumulation of nutrient inputand storage. The variation among plant species may bedue to heterogeneity of sediments or external sources.Sedimentation rate in vegetated sediment should also beconsidered. Vegetated salt marshes often show rapid sedi-ment accretion and growth of marshlands because of slowflow rate caused by especially short, stiff species and bydirectly trapping sediment on leaves and stems and withinjoints (Stumpf 1983; Leonard et al. 1995; Li and Yang2009). For example, a 27-cm net accretion in 100 years for
an unstable Barataria Bay S. alterniflora marsh of Louisianaand a 45-cm net accretion in 100 years for a stable S.alterniflora marsh in Four League Bay have been estimated(Mitsch and Gosselink 2000). In Dongtai (China), S.alterniflora has accelerated natural land formation withvertical accretion rates of 48.5–52.1 cm compared to 10.5–16.9 cm in bare mudflat in 3.4 years (Chung et al. 2004).The contribution of vegetation-trapped sediment to the localtotal deposition rate was likely responsible for >10 % of thetotal depositional rate in the S. alternifloramarsh and <10 %of the total depositional rate in the S. mariqueter marsh (Liand Yang 2009). The retained P by increasing sedimentationof plant materials contributed up to 25 % of the total month-ly P retention (Schulz et al. 2003). Although the sedimen-tation rate in this study was not investigated, it is speculatedfrom the above reports that vegetated marshes have highernutrient retention than bare mudflats.
Implication for reducing eutrophication in Hangzhou Bay
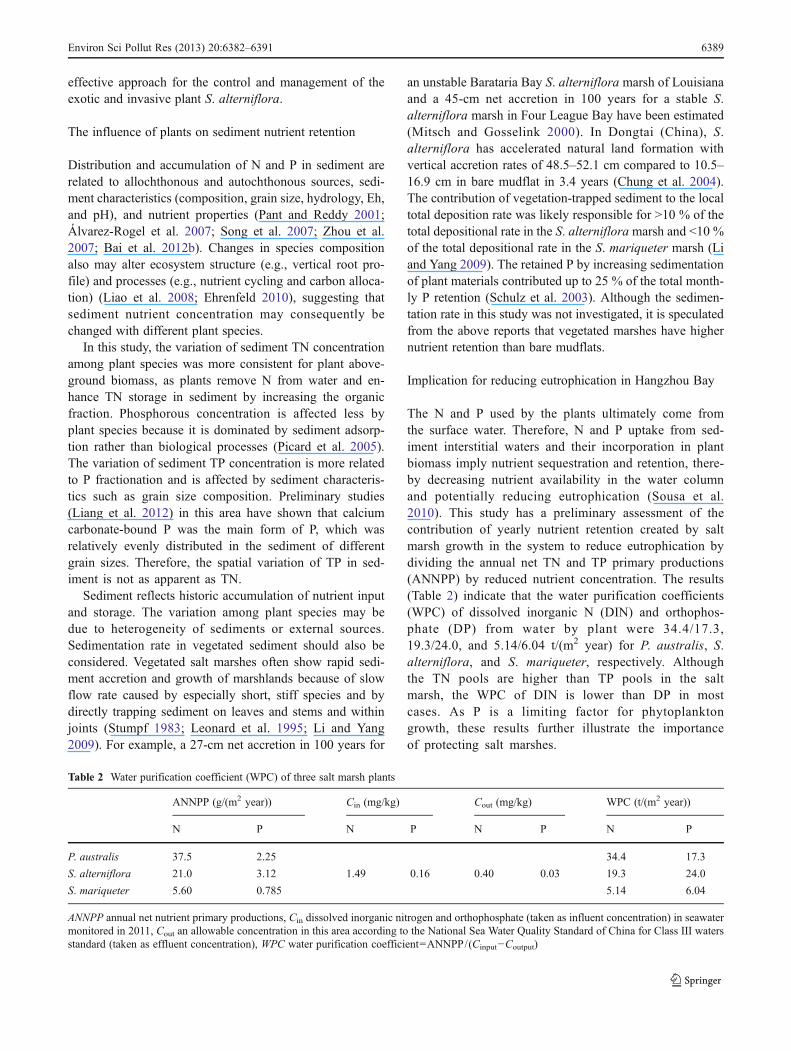
The N and P used by the plants ultimately come fromthe surface water. Therefore, N and P uptake from sed-iment interstitial waters and their incorporation in plantbiomass imply nutrient sequestration and retention, there-by decreasing nutrient availability in the water columnand potentially reducing eutrophication (Sousa et al.2010). This study has a preliminary assessment of thecontribution of yearly nutrient retention created by saltmarsh growth in the system to reduce eutrophication bydividing the annual net TN and TP primary productions(ANNPP) by reduced nutrient concentration. The results(Table 2) indicate that the water purification coefficients(WPC) of dissolved inorganic N (DIN) and orthophos-phate (DP) from water by plant were 34.4/17.3,19.3/24.0, and 5.14/6.04 t/(m2 year) for P. australis, S.alterniflora, and S. mariqueter, respectively. Althoughthe TN pools are higher than TP pools in the saltmarsh, the WPC of DIN is lower than DP in mostcases. As P is a limiting factor for phytoplanktongrowth, these results further illustrate the importanceof protecting salt marshes.
Table 2 Water purification coefficient (WPC) of three salt marsh plants
ANNPP (g/(m2 year)) Cin (mg/kg) Cout (mg/kg) WPC (t/(m2 year))
N P N P N P N P
P. australis 37.5 2.25 34.4 17.3
S. alterniflora 21.0 3.12 1.49 0.16 0.40 0.03 19.3 24.0
S. mariqueter 5.60 0.785 5.14 6.04
ANNPP annual net nutrient primary productions, Cin dissolved inorganic nitrogen and orthophosphate (taken as influent concentration) in seawatermonitored in 2011, Cout an allowable concentration in this area according to the National Sea Water Quality Standard of China for Class III watersstandard (taken as effluent concentration), WPC water purification coefficient=ANNPP/(Cinput−Coutput)
Environ Sci Pollut Res (2013) 20:6382–6391 6389
Overall, salt marsh plants display high sequestration forN and P, thereby helping reduce eutrophication in the estu-arine ecosystem. It should be pointed out that for TN, exceptplant uptake and immobilization in plant biomass, anothermajor mechanism for reducing mineral N loading is denitri-fication (DeLaune et al. 2005; González-Alcaraz et al.2011). González-Alcaraz et al. (2011) have compared deni-trification considering the presence or absence of plantrhizhosphere. Results indicated that in fine-textured basicwastes, the process is intense regardless of the existence ofplant rhizosphere, while the role of vegetation is morerelevant in sandier acidic wastes. However, according tothe research done by Sousa et al. (2012), it seems that itcannot be concluded whether or not annual denitrificationwas significantly different between the vegetated sedimentand the bare mudflats. N and P in water can also be absorbedby sediment. The maximal phosphate sorption capacity(PSC) is a useful measure of the P removal capacity ofsediment–water system (Lai and Lam 2008). The PSCdetermined in our study area (shown in Table 1) revealsthat the sediment can theoretically bind more P and couldbe about 1.5-fold higher than is currently reflected insediment. Yet, considering the denitrification of nitrateand sorption of orthophosphate in sediment, the actualpurification of water N and P by the whole system isexpected to be even greater.
Conclusions
Our research showed significant distribution patterns andseasonal variations of N and P concentrations and pools indifferent parts of marsh plants. This can provide detailedinformation about changes in salt marsh retention capacityand contribute to explain seasonal variations in nutrientretention. It can also help to determine the optimal biomassharvesting time of salt marsh plants for maximum nutrientremoval.
There was a significant relationship between plant netprimary productivity and wetland nutrient retention, so theprotection of localized wetlands would create more favor-able environmental conditions for increasing plant biomassand help improve deteriorated water quality. However, inorder to assess the nutrient retention capacity in the wholesystem, we should take into account of the nutrient quanti-ties coming in and out of the salt marsh in water, thedenitrification process of N cycling, and the maximal PSCin sediment.
Acknowledgments This research was supported by the NationalNatural Science Foundation of China (21077088; 31000296) and theNational Major Science and Technology Programs for Water PollutionControl and Treatment (2012ZX07506-006). We thank Stacey Ollis forlanguage editing.
References
Adam P (1990) Salt marsh ecology. Cambridge University Press,Cambridge
Álvarez-Rogel J, Jiménez-Cárceles FJ, Egea-Nicolás C (2007)Phosphorus retention in a coastal salt marsh in SE Spain. SciTotal Environ 378:71–74
Bai JH, Gao HF, Deng W, Yang ZF, Cui BS, Xiao R (2010)Nitrification potential of marsh soils from two natural saline–alkaline wetlands. Biol Fertil Soils 46:525–529
Bai JH, Gao HF, Xiao R, Wang JJ, Huang C (2012a) A review of soilnitrogen mineralization as affected by water and salt in coastalwetlands: issues and methods. Clean Soil Air Water 40:1099–1105
Bai JH, Wang QG, Deng W, Gao HF, Tao WD, Xiao R (2012b) Spatialand seasonal distribution of nitrogen in marsh soils of a typicalfloodplain wetland in Northeast China. Environ Monit Assess184:1253–1263
Boers PCM, Van-Raaphorst W, Van-der-Molen TD (1998) Phosphorusretention in sediments. Water Sci Technol 37:31–39
Boyer KE, Fong P, Vance RR, Ambrose RF (2001) Salicorniavirginica in a southern California salt marsh: seasonal pat-terns and nutrient-enrichment experiment. Wetlands 21:315–326
Brix H, Sorrell BK, Lorenzen B (2001) Are Phragmites-dominatedwetlands a net source or net sink of greenhouse gases? Aquat Bot69:313–324
Bromberg-Gedan K, Silliman BR, Bertness MD (2009) Centuries ofhuman driven change in salt marsh ecosystems. Annu Rev MarSci 1:117–141
Cartaxana P, Catarino F (1997) Allocation of nitrogen and carbon in anestuarine salt marsh in Portugal. J. J Coast Conserv 3:27–34
Chung CH, Zhuo RZ, Xu GW (2004) Creation of Spartina plantationsfor reclaiming Dongtai, China, tidal flats and offshore sands. EcolEng 23:135–150
De-la-Cruz AA, Hackney CT (1977) Energy value, elemental compo-sition, and productivity of belowground biomass of a Juncus tidalmarsh. Ecology 58:1165–1170
DeLaune RD, Jugsujinda A, West JL, Johnson CB, Kongchum M(2005) A screening of the capacity of Louisiana freshwater wet-lands to process nitrate in diverted Mississippi River water. EcolEng 25:315–321
Ehrenfeld JG (2010) Ecosystem consequences of biological invasions.Ann Rev Ecol Evol Syst 41:59–80
Feng LH, Bao YX (2006) Relationship between population, resource,environment and development of reclamation area of tidal flats—a case of Cixi City. Mar Sci 30:88–91 (in Chinese)
Gao HF, Bai JH, Xiao R, Yan DH, Huang LB, Huang C (2012) Soil netnitrogen mineralization in salt marshes with different floodingperiods in the Yellow River Delta, China. Clean-Soil Air Water40:1111–1117
González-Alcaraz MN, Egea C, Jiménez-Cárceles FJ, Párraga I, María-Cervantesa A, Delgado MJ, Álvarez-Rogel J (2012) Storage oforganic carbon, nitrogen and phosphorus in the soil–plant systemof Phragmites australis stands from a eutrophicatedMediterranean salt marsh. Geoderma 185–186:61–72
González-Alcaraz MN, Egea C, María-Cervantesa A, Jiménez-Cárceles FJ, Álvarez-Rogel J (2011) Effects of eutrophic waterflooding on nitrate concentrations in mine wastes. Ecol Eng37:693–702
Howarth RW (1993) Microbial processes in salt-marsh sediments. In:Ford ET (ed) Aquatic microbiology. Blackwell, Oxford, pp 239–261
Kang S, Kang H, Ko D, Lee D (2002) Nitrogen removal from ariverine wetland: a field survey and simulation study ofPhragmites japonica. Ecol Eng 18:467–475
6390 Environ Sci Pollut Res (2013) 20:6382–6391
Kirwan M, Guntenspergen GR, Morris JT (2009) Latitudinal trends inSpartina alterniflora productivity and the response of coastalmarshes to global change. Glob Chang Biol 15:1982–1989
Lai DYF, Lam KC (2008) Phosphorus retention and release by sedi-ments in the eutrophic Mai Po Marshes, Hong Kong. Mar PollutBull 57:349–356
Leonard LA, Hine AC, Luther ME (1995) Surficial sediment transportand deposition processes in a Juncus roemarianus marsh, West-Central Florida. J Coast Res 11:322–336
Li B, Liao CZ, Zhang XD, Chen HL, Wang Q, Chen ZY, Gan XJ, WuJH, Zhao B, Ma ZJ, Chen XL, Jiang LF, Chen JK (2009) Spartinaalterniflora invasions in the Yangtze River estuary, China: anoverview of current status and ecosystem effects. Ecol Eng35:511–520
Li H, Yang SL (2009) Trapping effect of tidal marsh vegetation onsuspended sediment, Yangtze Delta. J Coast Res 25:915–924
Liang W, Shao XX, Wu M, Li WH, Ye XQ, Jiang KY (2012)Phosphorus fraction in the sediments from different vegetationtype in Hangzhou Bay coastal wetlands. Acta Ecol Sin 32:5025–5033 (in Chinese)
Liao CZ, Peng RH, Luo YQ, Zhou XH, Wu XW, Fang CM, Chen JK,Li B (2008) Altered ecosystem carbon and nitrogen cycles byplant invasion: a meta-analysis. New Phytol 177:706–714
Lindau CW, Delaune RD, Scaroni AE, Nyman JA (2008)Denitrification in cypress swamp within the Atchafalaya RiverBasin, Louisiana. Chemosphere 70:886–894
Marinucci AC (1982) Trophic importance of Spartina alternifloraproduction and decomposition to the marsh–estuarine ecosystem.Biol Conserv 22:35–58
Ministry of Environmental Protection of the People's Republic ofChina (MEPC) (2010) Bulletin of China's coastal sea environ-mental status. http://www.mep.gov.cn/gzfw/xzzx/wdxz/201206/P020120613558299715101.pdf
Mitsch WJ, Gosselink JG (2000) Wetlands, 3rd edn. Wiley, New York,p 919
Murphy J, Riley JP (1962) A modified single solution method for thedetermination of phosphate in natural waters. Anal Chim Acta27:31–36
Negrin VL, de Villalobos AE, González-Trilla G, Botté SE,Marcovecchio JE (2012) Above- and belowground biomass andnutrient pools of Spartina alterniflora (smooth cordgrass) in aSouth American salt marsh. Chem Ecol 28:391–404
Nelson DW, Sommers LE (1980) Total nitrogen analysis of soil andplant tissues. J Assoc Offic. Anal Chem 63:770–778
Neves JP, Ferreira LF, Simões MP, Gazarini LC (2007) Primary pro-duction and nutrient content in two salt marsh species, Atriplexportulacoides L. and Limoniastrum monopetalum L., in SouthernPortugal. Estuar Coasts 30:459–468
Ocean and Fisheries Bureau of Zhejiang Province (OFBZ) (2011)Bulletin of marine environmental status in Zhejiang Province,China. ht tp: / /www.zjoaf .gov.cn/a t taches/2012/07/11/2012071100007.pdf
Palomo L, Clavero V, Izquierdo JJ, Avilés A, Becerra J, Niell FX(2004) Influence of macrophytes on sediment phosphorus accu-mulation in a eutrophic estuary (Palmones River, Southern Spain).Aquat Bot 80:103–113
Pant HK, Reddy KR (2001) Phosphorus sorption characteristics ofestuarine sediment under different redox conditions. J EnvironQual 30:1474–1480
Picard CR, Fraser LH, Steer D (2005) The interacting effects oftemperature and plant community type on nutrient removal inwetland microcosms. Bioresour Technol 96:1039–1047
Quan WM, Han JD, Shen AL, Ping XY, Qian PL, Li CJ, Shi LY, ChenYQ (2007) Uptake and distribution of N, P and heavy metals inthree dominant salt marsh macrophytes from Yangtze River estu-ary, China. Mar Environ Res 64:21–37
Redfield AC (1958) The biological control of chemical factors in theenvironment. Am Sci 46:205–211
Schalles JF, Shure DJ (1989) Hydrology, community structure, andproductivity patterns of a dystrophic Carolina Bay wetland. EcolMonogr 59:365–385
Schindler DW (2006) Recent advances in the understanding and man-agement of eutrophication. Limnol Oceanogr 151:356–363
Schulz M, Kozerski HP, Pluntke T, Rinke K (2003) The influence ofmacrophytes on sedimentation and nutrient retention in the lowerRiver Spree (Germany). Water Res 37:569–578
Shao XX, Yang WY, Wu M (2011) Soil organic carbon content and itsdistribution pattern in Hangzhou Bay coastal wetlands. Chin JAppl Ecol 22:658–664 (in Chinese)
Smith VH (2003) Eutrophication of freshwater and coastal marineecosystems: a global problem. Environ Sci Pollut Res 10:126–139
Song KY, Zoh KD, Kang H (2007) Release of phosphate in a wetlandby changes in hydrological regime. Sci Total Environ 380:13–18
Sousa AI, Lillebø AI, Pardal MA, Caçador I (2010) Productivity andnutrient cycling in salt marshes: contribution to ecosystem health.Estuar Coast Shelf Sci 87:640–646
Sousa AI, Lillebø AI, Risgaard-Petersen N, Pardal MA, Caçador I(2012) Denitrification: an ecosystem service provided by saltmarshes. Mar Ecol Prog Ser 448:79–92
Stumpf RP (1983) The process of sedimentation on the surface of a saltmarsh. Estuar Coast Shelf Sci 17:495–508
White DS, Howes BL (1994) Long-term 15N-nitrogen retention in thevegetated sediments of a New England salt marsh. LimnolOceanogr 39:1878–1892
Yang JZ, Zhao YL, Wang Y (2004) Remote sensing dynamic moni-toring of tidal banks in the Hangzhou Bay. Chin J Geol 39:168–177 (in Chinese)
Zhou JL, Wu Y, Kang QS, Zhang J (2007) Spatial variations of carbon,nitrogen, phosphorous and sulfur in the salt marsh sediments ofthe Yangtze Estuary in China. Estuar Coast Shelf Sci 71:47–59
Zhou XJ, Gao S (2004) Spatial variability and representation of seabedsediment grain sizes: an example from the Zhoushan-Jinshanweitransect, Hangzhou Bay, China. Chin Sci Bull 49:2503–2507
Environ Sci Pollut Res (2013) 20:6382–6391 6391
Related Documents