NUTRIENT MANAGEMENT SUPPORT SYSTEM (NuMaSS), Version 2.0 SOFTWARE INSTALLATION AND USERS GUIDE United States Agency for International Development Soil Management Collaborative Research Support Program Technical Bulletin No. 2002-02, September 2002 D.L. Osmond 1 , T. Jot Smyth 1 , R.S. Yost 2 , W.S. Reid 3 , D.L. Hoag 4 , W. Branch 5 , X. Wang 2 , and H. Li 2 1 Soil Science Department, Box 7619, North Carolina State University, Raleigh, NC 27695 2 Department of Agronomy and Soil Science, 1910 East West Rd., University of Hawaii at Monoa, Honolulu, HI 96822 3 Soil and Crop Sciences Department, 803 Bradfield Hall, Cornell University, Ithaca, NY 14853 4 Department of Agriculture & Resource Economics, B328 Andrew G. Clark, Colorado State University, Ft. Collins, CO 80523 5 Understanding Systems, Inc., 1005 Capability Dr., Raleigh, NC 27606

Welcome message from author
This document is posted to help you gain knowledge. Please leave a comment to let me know what you think about it! Share it to your friends and learn new things together.
Transcript
NUTRIENT MANAGEMENT SUPPORT SYSTEM (NuMaSS), Version 2.0SOFTWARE INSTALLATION AND USER�S GUIDE
United States Agency for International DevelopmentSoil Management Collaborative Research Support Program
Technical Bulletin No. 2002-02, September 2002
D.L. Osmond1, T. Jot Smyth1, R.S. Yost2, W.S. Reid3, D.L. Hoag4, W. Branch5,X. Wang2, and H. Li2
1Soil Science Department, Box 7619, North Carolina State University, Raleigh, NC276952 Department of Agronomy and Soil Science, 1910 East West Rd., University of Hawaiiat Monoa, Honolulu, HI 968223Soil and Crop Sciences Department, 803 Bradfield Hall, Cornell University, Ithaca, NY148534Department of Agriculture & Resource Economics, B328 Andrew G. Clark, ColoradoState University, Ft. Collins, CO 805235Understanding Systems, Inc., 1005 Capability Dr., Raleigh, NC 27606

2
TABLE OF CONTENTS
CREDITS ....................................................................................................................................................... 3Personnel Involved In The Development Of NuMass ........................................................................ 3Citation ............................................................................................................................................... 4Disclaimers ......................................................................................................................................... 4
GETTING STARTED.................................................................................................................................... 4Computer Settings .............................................................................................................................. 4Loading NuMaSS ............................................................................................................................... 4Starting NuMaSS After the Initial Installation ................................................................................... 4Running NuMaSS............................................................................................................................... 5To Save Your NuMaSS Values: ......................................................................................................... 5To Open a NuMaSS Values File (*.num):.......................................................................................... 5
NUTRIENT MANAGEMENT SUPPORT SYSTEM (NuMaSS) ................................................................. 6Project Summary ................................................................................................................................ 6Project Objectives............................................................................................................................... 6Strategy............................................................................................................................................... 6
NuMaSS MODULES ..................................................................................................................................... 7Introduction ........................................................................................................................................ 7Acidity Module................................................................................................................................. 11Nitrogen Module............................................................................................................................... 13Phosphorus Module .......................................................................................................................... 17Integrated Economic Analysis .......................................................................................................... 18
DEVELOPMENT of NuMaSS..................................................................................................................... 20Version 1.0 (Release September 1999) ............................................................................................ 20Version 1.5 (Release May 2000) ...................................................................................................... 21Version 2.0 (Release September 2002) ............................................................................................ 21
DATA BASES for NuMaSS ........................................................................................................................ 23Data Base Description ...................................................................................................................... 23Data Base Structure .......................................................................................................................... 26Data Dictionary for NuMaSS ........................................................................................................... 27

3
CREDITSThe Integrated Soil Nutrient Management Decision Support System (NuMaSS) softwarehas been developed under the grant � Decision Aids for Integrated Soil NutrientManagement - a project of the Soil Management Collaborative Research SupportProgram. This software and user's guide were made possible through support provided bythe Office of Agriculture and Food Security, Bureau for Global Programs, Field Supportand Research, U.S. Agency for International Development, under the terms of Award No.LAG-G-00-97-00002-00. The opinions expressed herein are those of the authors and donot necessarily reflect the views of the U.S. Agency for International Development. TheUSAID project officer is Charlie Sloger. Project manager for the Decision Aids forIntegrated Soil Nutrient Management is Jot Smyth (NCSU).
The development of this decision support system is a cooperative effort between CornellUniversity (Crop, Soil and Atmospheric Sciences Department), Texas A&M University(Soil and Crop Sciences Department), N.C. State University (Soil Science Department),and University of Hawaii (Agronomy and Soil Science Department).
Personnel Involved In The Development Of NuMassI. Program Integration - Deanna L. Osmond (NC State University), Jot Smyth (NC StateUniversity), W. Shaw Reid (Cornell University), Russ Yost (University of Hawaii), WillBranch (Understanding Systems), Xinmin Wang (University of Hawaii) and Hu Li(University of Hawaii)
II. Data Base Development - Deanna L. Osmond (NC State University), Russ Yost(University of Hawaii), Pedro Luna (NC State University), Steve Pratt (UnderstandingSystems) and Will Branch (Understanding Systems)
III. Acidity Module - Jot Smyth (NC State University), Russ Yost (University of Hawaii),Anthony Juo (Texas A&M University), Eugene Kamprath (NC State University) andWill Branch (Understanding Systems).
IV. Nitrogen Module - W. Shaw Reid (Cornell University), Deanna L. Osmond (NCState University), Jot Smyth (NC State University), Pedro Luna (NC State University),Dan Israel (NC State University) and Will Branch (Understanding Systems)
V. Phosphorus Module - Russ Yost (University of Hawaii), Xinmin Wang (University ofHawaii), Hu Li (University of Hawaii) and Fred Cox (NC State University)
VI. Economics Section � Dana Hoag (Colorado State University), Deanna Osmond (NCState University), Jot Smyth (NC State University), Russ Yost (University of Hawaii) andShaw Reid (Cornell University)
We would also like to express our thanks for our many colleagues throughout the worldwho have provided us information, tested the system, and participated in so manydifferent and important ways.
4
CitationNuMaSS should be cited as follows: Osmond, D.L., T.J. Smyth, R.S. Yost, D. L. Hoag,W.S. Reid, W. Branch, X. Wang and H. Li. 2002. Nutrient Management SupportSystem (NuMaSS), v. 2.0. Soil Management Collaborative Research Support Program,Technical Bulletin No. 2002-02, North Carolina State University, Raleigh, NC.
DisclaimersThe contents and views expressed in this document are those of the authors and do notnecessarily reflect the policies or positions of the North Carolina State University, orother organizations named, nor does the mention of trade names for products or softwareconstitute their endorsement. North Carolina State University is not responsible for anyundesirable outcomes attributed to decisions made by users based on NuMaSSrecommendations.
GETTING STARTEDComputer SettingsBefore you load the Nutrient Management Support System (NuMaSS), you MUST checkthat your font size setting in Windows is on small, otherwise the program will not displayproperly. The checking is done, by clicking on your "Control Panel", then click on"Display" and finally on the "Settings" tab. Then click on the "Advanced" button in thelower right portion of the window.
Loading NuMaSSThe NuMaSS software is stored on a CD-ROM and must be installed onto the computerbefore it will run. Insert the CD into the CD-ROM drive and display the contents of theCD-ROM using Explorer.
Change directories on the CD to: "NuMaSS_Install". In this directory, you will see aexecutable program named "Setup" (or "Setup.exe"). Double click on the setup programto start the installation. During the installation you will be asked two questions. The firstquestion is where to install the program files for NuMaSS. This is the directory where allthe program files and database files will be stored. You can either select the defaultdirectory ("C:\Program Files\USI\NuMaSS ") or click on the browse button in order toselect the directory you want. Map data for NuMaSS will always be installed in thefollowing directory: "C:\Program Files\USI\NuMaSS\world_maps". The second questionthat you will be asked during the install is what you want the NuMaSS shortcut directoryto be named in your Start menu Programs group. The default name is "NuMaSS".
After NuMaSS is loaded onto your computer, the install program will give you theopportunity to run the program. To start the program at this time, simply check the"launch" box that is found at the end of the installation program and the software willrun. Otherwise, the program will terminate.
Starting NuMaSS After the Initial Installation1) Using the Windows Start menu find the location that you indicated that you wanted
the program shortcut to be installed in the Programs group.

5
2) Click on the NuMaSS shortcut icon.
Running NuMaSSThe program is composed by five sections: Geography, Diagnosis, Prediction,Economics and Results. Geography, Diagnosis, Prediction, and Economics constitute thebackbone of this program that gathers and collates information from the user; and Resultsdisplays the results of the processed information.
With the exception of a few variables, NuMaSS 2.0 runs whether the informationrequired is fully provided or not. However, it is highly advisable to enter as muchinformation as possible. Otherwise you may not get the expected results. If you shouldenter a value that is outside the possible range for any given parameter, a notification boxwill pop-up. The box reads, "Your entered value is (above / below) the acceptable limitof X." Close the notification box and either change the value to within the rangeidentified or continue.
To Save Your NuMaSS Values:1) Click on File from the main menu2) Click on "Save Current Values..." in the File sub-menu
A Save As dialogue window will appear and ask you to save your file. You may saveyour files anywhere on your system, but the file names must end in ".num". Also, thereis no limit to the number of files you can save.
To Open a NuMaSS Values File (*.num):1) Click on File from the main menu2) Click on "Open Previous Values..."An Open dialogue window will appear and ask you to select a file to open.
When you open a NuMaSS Values File, the program will take a few seconds to populatethe interface with the values from the file. You may also see a popup message regardingthe depth of incorporation, just click OK to proceed with loading the values.
NOTE: You may save and load values at anytime. However, if you load a set of valuesfrom a file after having already entered values, all of the values you entered manuallywill be over-written.
WARNING: Although the .num files are text files, it is not advisable for the user to editthese files manually in a word processor or text file editor. These files (.num) are in aspecific format, and if this format is not maintained, you could render the file unusable.
In addition, the values files (*.num files) cannot be shared between users with differentdecimal / comma separator settings. For example, if you are using "English (US)" as theregional setting, you cannot load a .num file created by a user whose regional setting is"Portuguese (Brazilian)".
6
NUTRIENT MANAGEMENT SUPPORT SYSTEM (NuMaSS)Project SummarySoil acidity and nutrient deficiencies limit crop yields in most developing countries. Theconsequences of poor yields include food insecurity, economic hardship, furtherdeforestation, and increased soil exposure, erosion and downstream pollution. Uponovercoming soil acidity and nutrient constraints, new cropping strategies are possible,products and services are diversified, vegetative soil protection increases and off-sitenutrient transport is minimized. However, the knowledge requirements to properlydiagnose and prescribe best management alternatives for location-specific soil acidity andnutrient problems throughout the world exceed the capacity of any human expert.Numerous combinations of crops, social, political, economic and resource conditionsmust be considered. Scarcity and cost of experts can be alleviated if the requiredknowledge is organized in a manner accessible to inexperienced personnel. Whencombined with local data and observations, decision support systems (DSS) make thisknowledge available for agriculturists to choose appropriate management strategies.
Nutrient interaction problems are of such complexity that they need to be addressedsimultaneously. This integrated nutrient management decision support system (NuMaSS)is a tool that diagnoses soil constraints and selects the appropriate management practices,based on agronomic, economic and environmental criteria, for location-specificconditions.
Project Objectives1. Improve the diagnosis and recommendations for soil acidity and nutrient problems by
identifying and resolving knowledge gaps through extensive literature reviews and,when necessary, developmental research;
2. Develop an integrated computerized knowledge base for diagnosing andrecommending practical solutions to soil acidity and N and P problems, whichconsiders location-specific differences in resource availability, soil, climate, crop andmanagement factors; and
3. Develop auxiliary tools to the integrated knowledge base to enable agriculturists todiagnose and solve soil acidity and nutrient problems that predominate within thesocial, economic and agronomic conditions of their regional domains.
StrategyThree existing nutrient decision support systems, Acid Decision Support System (ADSS),Nitrogen Decision Support System (NDSS) and Phosphorus Decision Support (PDSS),have been reprogrammed as modules into an integrated user interface (NuMaSS). This isthe third release of NuMaSS (Version 2.0). The first version, which was called IntDSSVersion 1.0, was beta tested by soil fertility experts. Some of the major errors detected inthe first release were corrected in the second version (NuMaSS 1.5). In the third version(NuMaSS 2.0), which has also been reviewed by users, the three soil constraints arediagnosed and predicted individually within the system. However, the modules are fullyintegrated in the Economics section.
7
NuMaSS MODULESIntroductionThe NuMaSS is a synthesis of five distinct programmatic sections - Geography,Diagnosis, Prediction, Economics and Results � each differentiated by a tab. You will beasked for information through the use of input boxes. Not all input boxes needinformation for NuMaSS 2.0 to work. The input information needed for the integratedsystem to run is dependent on the information needed by the individual modules. Databases have been constructed that will provide default values in some, but not all, inputboxes. There are some input boxes that must be completed. For instance, in order for theacidity or phosphorus module to work you must either enter % clay or textural class, aswell as other parameters. Necessary inputs for the nitrogen module consist of intendedcrop, crop yield, plant N content, and, if you use organic inputs, the amount of manure orresidues that you apply. Depending on your location and crop, some other necessaryinputs can be accessed from the data base. However, the precision of your Nrecommendation improves dramatically the more information you supply. Necessaryinputs to the acidity module for a recommendation are soil order, crop critical % Alsaturation, exchangeable Al, effective cation exchange capacity, bulk density and either% clay or textural class.
Geography: NuMaSS automatically starts on the Geography tab. Geography requiresinformation on the Region (continent), Country, and Agricultural Area (basicallydefined by the rainfall regime). Inputs for all of these categories are accessed through thepull-down lists. Alternatively, the area you want to pick can be selected by using theinteractive world map. To see your area more closely, click Zoom In. Conversely, tomake an area smaller click Zoom Out or, to see the entire world map, click Full Extent.To select the area you want, simply move the cursor to that area and click Select. Thecorresponding, country and agricultural area will automatically be selected into the user-input boxes.
The region, country and, finally, the agricultural area can all be selected using the pull-down menus. There are three generic agricultural areas: humid tropical, wet/dry, andsemi-arid. In some cases, when we have specific names that correspond to theseagricultural areas, such as Cerrado or Guinea Zone, we have used these names. The threegeneralized agricultural areas were identified by country using the Climate, Continentsand Islands map (Stricker and Rodriguez, 1991).
Diagnosis: Proceed to the Diagnosis section. This section allows users to identify soilconstraints but does not give nutrient recommendations or economic analysis of nutrientapplication needs. Each constraint is treated differently in the Diagnosis section.Diagnosis provides an early indication of whether there is a nutrient managementproblem. If not, further data is not required and nutrient status is probably sufficientrequiring no further attention. Much of the information entered in this section is used in
** Stricker and Rodriguez, 1991. Climate, Continents and Islands (map). Gainesville, FL& Bogata, Columbia

8
the Prediction and Economics sections. Unless the crop to be grown is a legume or thefield is coming out of long-term fallow, most cropping systems will be N deficient. Thusthe Diagnostic section for the Nitrogen module is used primarily to determine the priorland use and to collect information for the Prediction section. The Acidity module usesthe information obtained in Diagnosis to determine the amount of acidity that needs to beneutralized. The Diagnosis section should be filled out as completely as possible beforecontinuing on to the next sections.
There are four subsections in Diagnosis: Intended Crop, Previous Cropping, Soil andPlant. Start with the Intended Crop page. Proceed through the Diagnosis section,answering questions as fully as possible.
Depending on your selections, different input boxes will become visible. Many of theseinput boxes have associated default values that may be provided as a guide from the datatables. If a default value is available, a small check box will be activated next to thedefault value in red. When the default box is activated, you can click on the checkbox topull the default value into the input box. If you do not like the default value, simply typeover the value. The data in the data tables have been gathered through literature reviewsor, in some cases, based on expert opinion. (See the section on data base description formore specific information on how the default data is derived.)
Intended CropThe one parameter that you MUST enter is Crop. This is the crop you intend to produce.Once you have selected the �Crop�, the Prediction section will be available. The Targetyield and Al Saturation input boxes must also have values; otherwise the programcannot provide answers.
If you are in a humid tropical or wet dry agricultural area, peach palm is one of the cropsprovided in the crop list. NuMaSS 2.0 will not provide a diagnosis for the nursery phaseof peach palm, but it will provide information for the other three growth phases.
Previous CroppingThis page collects your previous crop information: crop, yield, fertilization history andother necessary information. Again, input boxes change depending on the selected cropand many of these boxes have associated default values.
SoilSoil Order is the first input box on this page. The eleven soil orders listed in the U.S.taxonomic system are available for selection along with "Unknown" and "Other"categories. "Unknown" implies that you do not know what the category is, and "Other"indicates that you may know your category but it is not listed. There are never defaultvalues associated with �Unknown� or �Other.
You can either use your own soil data (select �use your site specific soil data�) or use soilpedon data derived from The United States Department of Agriculture Natural ResourceConservation Service's National Soil Characterization Database (select �use soil pedon

9
data�). Only data from the tropics are included in the pedon database. Data werescreened by location criteria for either latitude and longitude coordinates or description ofa particular location. Soils data that did not meet the location criteria were omitted fromour soil pedon data table.
There are three helps screens available. The �Soil Order Info� help screen explains themajor divisions of soils within the U.S. Taxonomy classification. The help screens �SoilChemical Property Info� and �Soil Physical Property Info� describes soil inputinformation.
PlantThere are three subtabs in the Plant section: Plant Analysis, Nutrient DeficiencySymptoms, and Indicator Plants. The Plant Analysis tab displays critical tissue nutrientlevels for the previous crop. You can either use the defaults or your own values. Cropnutrient deficiencies are displayed for the previous crop on the Nutrient DeficiencySymptoms page. Plants, other than the crop, can often suggest nutrient managementproblems. These plants are viewable on the Indicator Plants page.
When you are through with the Diagnosis section, you can either proceed on toPrediction or you can select the "Run Diagnosis� button found in the upper right-handcorner of NuMaSS 2.0. Clicking �Run Diagnosis� analyzes the data entered duringDiagnosis and finishes with the results of the Diagnosis module. The diagnosis resultsare displayed in the Results section, under Diagnosis/Summary. The Diagnosis is thelikelihood of an acidity, nitrogen or phosphorus constraint for the intended crop based onBayesian conditional probabilities for each of the diagnostic factors. Probability valuesfor diagnostic factors are based on extensive surveys of nutrient management �experts�throughout the tropics. A conclusion of the likelihood of each nutrient constraint isprovided in a tabular format in the Diagnosis/Summary section. The final probability forlime, P and N are based on the cumulative probability for information provided on allfactors. The Diagnosis/ Summary also alerts you to conflicts in information and warnsyou about other data needed for Prediction.
The input values you used for making the diagnosis are found underResults/Diagnosis/Values. The program evaluates or re-evaluates the data entered onlyafter selecting "Run Diagnosis", which means that every time you change an input value,you must click the �Run Diagnosis� button again.
Prediction: Proceed to the Prediction section by clicking the Prediction tab. ThePrediction section recommends the amount of nutrients (N and P) and lime needed toproduce the target yield. Economics and interaction between the nutrients are notconsidered in the Prediction section.
There are three subsections in Prediction: Organic Application, Lime Application, andNutrient Application. Enter the available information. Defaults may be available forsome, but not all, entry boxes. Prediction results will be displayed after clicking the �RunPrediction� button. The results are the nutrient recommendations without consideration
10
of economics. Two sections will appear in the Results/Prediction section: Summary,which is the summary of the results, and Values, which is the display of the inputs used inPrediction. In addition, there are three additional pages within the Results/Prediction:Nitrogen Report, Acidity Report, and Phosphorus Report. The Nitrogen and AcidityReports display either the calculations or the logic used in making the lime and Nrecommendations. The Phosphorus Report simply restates the P recommendation foundin the Results/Prediction/Summary page.
Economics: The Economics section considers costs and revenues associated with nutrientapplications. The results from the Economics section will help you determine whether ornot to apply the amounts of fertilizer recommended. There is one input page in theEconomics section. Please enter costs and prices and further information for additionalanalyses. When you are through entering information, click the "Run Economics" buttonto view the economic analysis of the different lime and nutrient applications. The outputinformation is available in the Results/Economics/Summary section.
Unlike the other sections, however, the Economics/Summary section is interactive. Theupper part of the Economics/Summary output is a standard section that calculates thenutrient amounts, costs and revenues for the target yield you entered in the Diagnosissection. Below the standard section is an options section that allows you to review costsand revenues under four different scenarios. First, you can select to compare the returnsat the target yield goal for other types of fertilizers and/or change the prices of thesefertilizers. Once you have selected the option and changed any inputs that are allowed,press the �compare� button next to the �options� box for a new analysis. Second, if youhave a limited amount to spend, you can find the most profitable combination of inputsgiven your cash constraints. If you have a fixed amount of fertilizer or lime, you can alsouse the economics section to find the best combination of additional amendments givenyour fertilizer constraints. Fourth, you can change all fertilizers and prices to find bestprofit, regardless of your target yield.
For both the �fertilizer� and �cash constraint� options, the fertilizers and prices of thefertilizers are fixed from whatever previous option was selected. To change the types offertilizers or the costs, click on either �best profit� or �compare fertilizer mixes� and thenclick back on either �fertilizer constraints� or �cash constraints.� You will now have thefertilizers and costs that you want. You may also want to reset your target yield equal tothe most profitable yield found in best profit, then re-examine comparisons of fertilizers,cash constraints, or fertilizer constraints.
Another dynamic feature in the economics section can be found by clicking on the�Response Curve� box near the top of the screen. Use your mouse to drag the slider barat the bottom of the page. Best yield is where the curve kinks, but best yield is notalways the best profit.
Results: The Results section presents conclusions from the Diagnosis, Prediction, andEconomics sections of NuMaSS 2.0. You can press the run button after each section(Diagnosis, Prediction and Economics) or you can wait until you have entered all the

11
information required in all three sections. The conclusions will only be displayed afterrunning the program using the �Run� buttons. Results for each of the model components(Diagnosis, Prediction, and Economics) are displayed separately within Results underSummary. For all three sections, the input values you used are found underResults/Values.
Acidity ModuleThe Acidity module is designed to help you diagnose and correct soil problems due to Altoxicity and/or deficiencies of Ca and Mg. The primary approach used in the evaluationof soil acidity problems is to compare existing soil levels of Al with values whereproduction of the intended crop is not limited. The knowledge for Al-based soil aciditymanagement centers on soils belonging to the Alfisol, Inceptisol, Oxisol and Ultisolorders of the U.S. Soil Taxonomy. Although most soils belonging to the Aridisol,Mollisol, and Vertisol orders and many in the Entisol orders are not naturally acid, Al-based management can also be used to correct the acidity developed through theirintensive agricultural use. Diagnosis and subsequent prediction and economic analysis ofsoil acidity problems, therefore, only exclude the Andisol, Gelisol and Histosol soilorders.
Diagnosis: the diagnosis requires the selection of an intended crop and the threshold orcritical level of % Al saturation of the soil cation exchange capacity above which thecrop�s yields are depressed. Default critical % Al saturation values are provided for eachcrop and some cultivars, but the user has the option to specify a different value that maybe more appropriate for their particular crop cultivar or site-specific conditions. Althoughnot mandatory, information about the agricultural area, cropping history, soil order, soiland plant tissue analysis, nutrient deficiency symptoms and presence of plants indicativeof acid soil conditions are also used and will improve the evaluation of soil acidityproblems. Furthermore, considerations on liming in Prediction and Economics haveminimum data set requirements that include some of the information requested inDiagnosis.
Among the soil analytical information there is a hierarchy in the data that is used.Preference is given to data needed to calculate the soil�s Al saturation %, namely theexchangeable acidity (Al + H) extracted with a neutral unbuffered salt solution and theeffective cation exchange capacity (ECEC). In the absence of this information, the % Alsaturation of the soil can be estimated from soil pH in water through a relation developedacross liming experiments in Africa, Asia and Latin America. If Al saturation % cannotbe calculated or estimated from soil pH, soil Ca and Mg data will be used to evaluate theacidity problem. Potential deficiencies of Ca and Mg for the intended crop also areevaluated whenever the user provides soil or plant tissue data for these nutrients.
Prediction: If the soil�s Al saturation % is greater than the critical value for the intendedcrop or soil Ca supply is limiting then a lime application is suggested. Estimation of thelime needed to reduce the soil�s Al saturation % to the critical level of the intended cropis based on a modified version of the equation developed by Cochrane et al. (1980).Rather than liming soils to neutralize all of the exchangeable acidity, the equation

12
computes the lime needed to only neutralize the quantity of exchangeable acidity thatexceeds the intended crop�s tolerance level. The original equation proposed a constantlime factor (LF) of 1.8 equivalents of CaCO3 to neutralize each equivalent ofexchangeable acidity.
Through our review of lime trials with soils in the tropics, we found that the lime factordiffered among soils and between high (>20) and low (<20) % Al saturation valueswithin a soil. The difference in lime factors among soils in the high (>20) % Al saturationrange was related to an index of the soil�s clay activity estimated by the cmolc of whole-soil ECEC/l or kg of clay in the soil. The efficiency of CaCO3 in neutralizingexchangeable acidity of soils with low �clay-based ECEC� was lower (higher LF value)than in soils with high �clay-based ECEC� values.
The original equation of Cochrane et al. (1980) was, therefore, revised so that suggestedlime requirements include consideration of differences in lime factors among soils as wellas between high and low % Al saturation within soils. The complete revised equation is
LR = LF[Al - (TAS(ECEC)/100)] + 7.5[(19 - TAS)ECEC/100]
whereLR = lime requirement in CaCO3 equivalents, t ha-1;LF = lime factor, equivalents of CaCO3 / equivalent of exchangeable acidity, for
neutralization of soil exchangeable acidity in the range of 20 - 100% Al saturation; if[ECEC(100/%clay] < or = 4.5, then LF = 2.5; otherwise LF = 1.3;
Al = soil extractable acidity with M KCl, cmol/l or kg;TAS = targeted or critical % Al saturation for the intended crop;ECEC = effective cation exchange capacity of the soil, cmol/l or kg of soil; and7.5 = lime factor for neutralization of soil exchangeable acidity in the range of < 20% Al
saturation.Information for Al, TAS and ECEC are entered in the Diagnosis section.
There are two conditions where a fixed amount of lime is suggested instead of the valuederived from the equation:� soils with low ECEC where equation-derived lime requirements for acid-sensitive cropswould not provide sufficient Ca; a lime application equivalent to 1 t CaCO3 ha-1 issuggested.� current evidence suggests that yield responses of peach palm to lime are associated withsoil Ca and Mg deficiencies rather than Al toxicity. A lime application equivalent to 1 tCaCO3 ha-1 is suggested when soil Ca is less than 0.8 cmol/l or kg.
**Cochrane, T.T., J.G. Salinas and P.A. Sanchez. 1980. An equation for limingacid mineral soils to compensate for crop aluminium tolerance. Trop. Agric.57:133-140.
13
The final lime recommendation includes adjustments of the value predicted by theequation for the following factors:� depth of lime incorporation - when the depth is different from 15 cm an adjustment ismade through the ratio �(intended depth/15)�;� bulk density - soil exchangeable acidity and ECEC data are converted from weight-by-weight lab units to weight-by-volume at the field level;� lime quality - the lime recommendation by the equation is for pure CaCO3 with a fineparticle size (100% finer than 60 mesh). Information on the quality of lime material thatwill be used can be provided as either (a) the particle size distribution and the CaCO3-equivalence or (b) the effective CaCO3 content which is the product of the particle sizeand CaCO3-equivalence.� lime effect of organic inputs - the lime requirement is reduced by 1 t ha-1 for every 10 tha-1 (fresh weight basis) of applied organic material.
Information on depth of lime incorporation and lime quality are entered on the LimeApplication page in the Prediction section. Bulk density information is entered on theSoils page in the Diagnosis section, and information on organic inputs is entered on theOrganic Application page in the Prediction section. The final, adjusted lime recommendation is accompanied by comments and suggestionson lime management for the particular crop and soil conditions. Information on residualeffects of the suggested lime application to subsequent crop cycles and years is providedas predicted % Al saturation values for the soil up to the 4th year after liming. If data forCa and Mg content are provided for both the soil (in the Diagnosis section) and the limematerial (in the Lime Application page of the Prediction section), the Soil Acidity Reportprovides estimates of soil Ca and Mg levels after liming and the suitability of the soilCa:Mg ratio for the intended crop.
Nitrogen ModuleThe Nitrogen module is primarily designed to help you determine appropriate nitrogenfertilizer rates after accounting for any organic applications. The Nitrogen moduledepends on an extensive data base.
Diagnosis: N is almost always deficient in tropical soils unless a legume is being grownor the crop is preceded by a fallow or green manure system. Therefore, diagnosis of Ndeficiencies almost always produces the need to add N.
Prediction: Unlike most other nutrients, there are few reliable soil tests to determine cropN needs. This is particularly true in humid regions where N can be readily transformedand moved below the rooting zone. Generally N fertilizer recommendations are based onextensive data sets developed over many years.
When extensive field data is not available for determining N fertilizer rates, crop Nfertilizer needs can be calculated using available soil and crop data. The equation belowpredicts the N fertilizer requirement for crops, except grain legumes, peach palm, andcotton. Since grain legumes fix their own nitrogen, no fertilizer nitrogen calculations are

14
made for these crops. The algorithms for peach palm and cotton will be discussed at theend of this section.
Nfert = (Yr*Ncr) - [(Nsoil) + (Nresidue.*Cr) + (Nmanure*Cm)] /Ef
Equation abbreviations Definitions
Nfert N fertilizer needed
Yr Target dry matter yield, both vegetative and/orreproductive and/or total dry matter
Ncr Concentration of nitrogen (%N) in vegetative and/orreproductive and/or total dry matter
Nsoil Nitrogen absorbed by the crop that is derived from soilorganic matter and previous crop residue mineralization,and from atmospheric deposition during growing season
Nr. Nitrogen mineralized from green manures or residues,such as stover or compost that are added to the field.
Cr Proportion of nitrogen mineralized from green manures orresidues that are absorbed by the plant.
Nmanure Nitrogen mineralized from manure
Cm Proportion of nitrogen mineralized from manure that thecrop absorbs
Nfert N fertilizer needed
Ef Fertilizer efficiency
Determining Crop N: The first step is to determine the total crop N need. The equationfor this determination is: Total Crop N Needs = Yr * Ncr = Yg*%Ng + Ys*%Ns
Abbreviation DefinitionYr Total dry matterNcr Nitrogen concentration in the total plantYg Reproductive yield%Ng Nitrogen concentration in the reproductive portion of the cropYs Vegetative yield%Ns Nitrogen concentration in the vegetative portion of the plant
The amount of additional N needed to produce the target yield that you want is a functionof the capacity of the soil to supply N and the total amount of crop N needed. In order to

15
determine the total crop demand for N, it is important to know the yield that you aretrying to obtain so that you can determine the amount of N fertilizer you will need. Youwill obtain better results if you enter either the total amount of dry matter or yield thatyou realistically believe you can obtain. If you do not enter this information, a defaultvalue will be obtained from the data base for your location, based on region, countryand/or agricultural area. Since total crop N is a function of both total crop dry matter andthe N content, if you do not have information for N content, again a default value will beobtained from the data base. The input information necessary to determine the amount ofN that the crop needs is entered in the Diagnosis section of NuMaSS 2.0.
Determining Crop Available N: Once the amount of N is calculated for the target yield,the Nitrogen module calculates the amount of N available to the crop from the soil (NSoil),manure (NManure) , organic amendments (NResidue), and green manure crops (NResidue). Theequation used to calculate crop available N is:
Crop available N = NCrop(available_to) = NSoil + NManure + NResidue
Determining Soil N: There are four different methods that you can use to determine theamount of N supplied by the soil (NSoil). The program automatically selects the methodfor calculating NSoil based on the data availability. The hierarchy for determining NSoil isoutlined below. If sufficient data is available for Method 1, then that is the method used.However, if there is insufficient data the program will continue sequentially checking foravailable data until a method can be found. The precision for calculating NSoil changes asthe program moves through the methods. Method 1 is the most precise calculation ofNSoil , Method 4 is the least precise.
Soil N is pulled in the following hierarchy:1. The amount of N contained in an unfertilized crop gives you an indication of the
N supplying capacity of the soil. If the previous crop and the current crop are thesame and the previous crop was not fertilized, then soil N can be calculated. Youwill have already entered this information in the Diagnosis section under CropHistory.
2. If you know your soil N value, enter this value in the Prediction/FertilizerApplication.
3. If you do not know your soil N value, you may prefer to use the default N valuethat is derived from the default table. You simply click on the default check box.However, default soil N values are not available for all locations.
4. The least precise method for determining soil N supply is by calculating Nmineralization either from soil % organic matter, %C or %N content. The defaultrate of mineralization is 2% per year multiplied by the proportion of months thecrop is grown. User supplied soil N, C, or organic matter content will come fromthe Diagnosis section. A default value for either soil %N, %C, or % organicmatter will be available for many soils, if you do not have your own value.
16
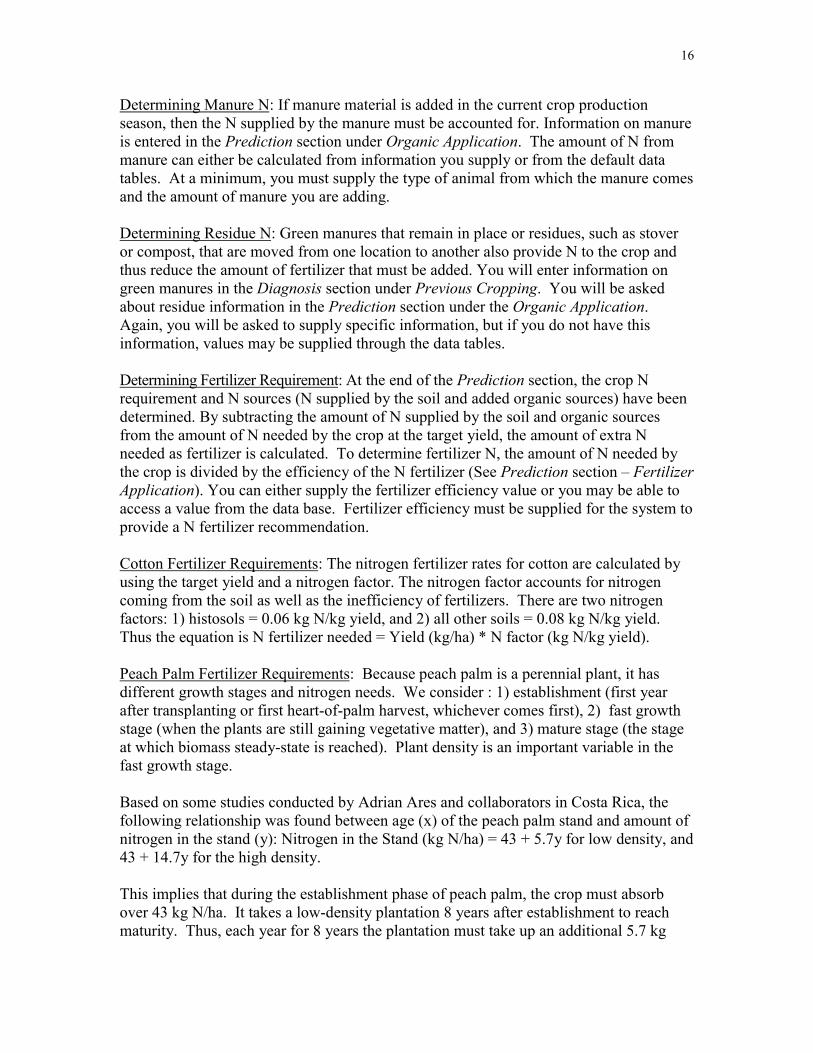
Determining Manure N: If manure material is added in the current crop productionseason, then the N supplied by the manure must be accounted for. Information on manureis entered in the Prediction section under Organic Application. The amount of N frommanure can either be calculated from information you supply or from the default datatables. At a minimum, you must supply the type of animal from which the manure comesand the amount of manure you are adding.
Determining Residue N: Green manures that remain in place or residues, such as stoveror compost, that are moved from one location to another also provide N to the crop andthus reduce the amount of fertilizer that must be added. You will enter information ongreen manures in the Diagnosis section under Previous Cropping. You will be askedabout residue information in the Prediction section under the Organic Application.Again, you will be asked to supply specific information, but if you do not have thisinformation, values may be supplied through the data tables.
Determining Fertilizer Requirement: At the end of the Prediction section, the crop Nrequirement and N sources (N supplied by the soil and added organic sources) have beendetermined. By subtracting the amount of N supplied by the soil and organic sourcesfrom the amount of N needed by the crop at the target yield, the amount of extra Nneeded as fertilizer is calculated. To determine fertilizer N, the amount of N needed bythe crop is divided by the efficiency of the N fertilizer (See Prediction section � FertilizerApplication). You can either supply the fertilizer efficiency value or you may be able toaccess a value from the data base. Fertilizer efficiency must be supplied for the system toprovide a N fertilizer recommendation.
Cotton Fertilizer Requirements: The nitrogen fertilizer rates for cotton are calculated byusing the target yield and a nitrogen factor. The nitrogen factor accounts for nitrogencoming from the soil as well as the inefficiency of fertilizers. There are two nitrogenfactors: 1) histosols = 0.06 kg N/kg yield, and 2) all other soils = 0.08 kg N/kg yield.Thus the equation is N fertilizer needed = Yield (kg/ha) * N factor (kg N/kg yield).
Peach Palm Fertilizer Requirements: Because peach palm is a perennial plant, it hasdifferent growth stages and nitrogen needs. We consider : 1) establishment (first yearafter transplanting or first heart-of-palm harvest, whichever comes first), 2) fast growthstage (when the plants are still gaining vegetative matter), and 3) mature stage (the stageat which biomass steady-state is reached). Plant density is an important variable in thefast growth stage.
Based on some studies conducted by Adrian Ares and collaborators in Costa Rica, thefollowing relationship was found between age (x) of the peach palm stand and amount ofnitrogen in the stand (y): Nitrogen in the Stand (kg N/ha) = 43 + 5.7y for low density, and43 + 14.7y for the high density.
This implies that during the establishment phase of peach palm, the crop must absorbover 43 kg N/ha. It takes a low-density plantation 8 years after establishment to reachmaturity. Thus, each year for 8 years the plantation must take up an additional 5.7 kg

17
N/ha. In high-density stands, it only takes 3 years for the plantation to reach steady-stateor maturity, thus each year for 3 years the stand must add an additional 14.7 kg N/ha toincrease the standing biomass. These additional nitrogen needs must be met for theplantation to reach maturity.
After establishment, heart-of-palm harvest starts and nitrogen accumulated in themeristems that are harvested and removed from the field must be added back into thesystem. Research from Costa Rica suggests that for each heart-of-palm harvested andremoved from the field, the crop needs 0.0178 kg N/ha. The amount of residue returnedto the system from the harvesting of heart-of-palm is 0.0148 kg N/ha for each heart-of-palm harvested times a nitrogen recycling factor of 80%. Nitrogen fertilizer efficiency(Ef) was found to be approximately 35% in these systems.
Based on this preliminary research we have proposed the following nitrogen fertilizerequations for peach palm and are using these equations in NuMaSS 2.0.
� Nitrogen fertilizer (establishment) = 43/Ef� Nitrogen fertilizer (fast growth, low density) = ((0.0178 * # harvested heart-of-palm)
+ 5.7) � (Soil N + (0.0148 * # previously harvested heart-of-palm * 0.80))/Ef� Nitrogen fertilizer (fast growth, high density) = ((0.0178 * # harvested heart-of-palm)
+ 14.7) � (Soil N + (0.0148 * # previously harvested heart-of-palm * 0.80))/Ef� Nitrogen fertilizer (mature growth) = (0.0178 * # harvested heart-of-palm) � (Soil N
+ (0.0148 * # previously harvested heart-of-palm * 0.80))/Ef
Phosphorus ModuleObjectives:The purpose of the Phosphorus (P) module is to:1. Diagnose whether the soil P supply is sufficient for your intended to crop to grow andyield at its capacity.2. If the soil P supply is not sufficient, predict the amount of P fertilizer necessary toalleviate the deficiency.3. Provide the amount of fertilizer and expected yield increase to the economics modulefor an economic analysis.4. The P module has no recommendation mode in NuMaSS 2.
Diagnosis: The diagnosis of whether your soil P supply is sufficient is based oninformation that includes general knowledge about the area, cropping history, cropobservations/symptoms, soil and plant tissue analyses, and the presence of certainindicator plants generally representative of soil P status. The minimum dataset todiagnose a phosphorus deficiency includes: 1) intended crop, 2) soil test P method, 3) soiltest P value, and 4) percent clay content. Additional data is needed in the Prediction andEconomics sections in order to complete a recommendation.
Prediction: If the extractable P level of your field is less than the P critical level, then a Pprediction will be suggested. To make a P prediction further information is needed onfertilizer type, application method, and application depth (Fertilizer Application tab).

18
The Phosphorus module also makes an estimate of the extractable P level after the crop isharvested. This option provides the results needed to estimate the costs of maintainingextractable P at the critical level and the economic consequences of doing so. Theestimate of extractable P after the crop is harvested should also be useful if a crop with adifferent critical soil P level follows the present crop.
When the minimum dataset is provided, the Phosphorus module estimates both thecritical P level for the crop and the buffering coefficient. If the user has more specificestimates of these coefficients they can be entered directly in the Fertilizer Applicationpage and the subsequent calculations will use the revised values. Our experience is thatmaking such predictions of the fertilizer P requirement involves much uncertainty, hencewe have implemented an estimate of the combined uncertainty of all factors thatcontribute directly to the calculation of the P prediction.
Integrated Economic AnalysisIt is within the Economics section that nutrient predictions are integrated. Although eachamendment has an optimum rate, optimum rates may not be economically the bestsolution. In addition, amendment types (such as the types of fertilizer or lime sold), thequantities of the amendments, the price of the amendments, or the amount of cash aproducer may have available, can determine the amendment rate. Thus, this section iscritical in determining useable amendment rates based on prevailing market conditions.
Each nutrient response is based on an underlying linear-plateau production function, Y =min (a + bx, T) where �Y� is the yield, �a� is the intercept, �b� is the slope coefficientand �T� is the optimum yield. We are assuming the von Liebig law of the minimumresponse. This assumes that one nutrient is most limiting and it is only when that nutrientneed is met that other nutrients contribute to yield. In order to do the economic analysisin NuMaSS 2.0, we have assumed that each nutrient is independent, although werecognize that this may not be true.
Return attributable for each of the inputs is based on the marginal value productcompared to input cost. Marginal value product (MVP) is the output price (P) times thederivative of Y with respect to the input (b). In this case, the derivative is always equal to�b�, and thus marginal value product is MVP=Pb. The most profitable level of eachinput is found where MVPx = Px.
These are the basic equations underlying the integrated economics section. You mustenter the optimum yield, the minimum yield (for cotton only), cost of the amendmentsand price of the commodity. Entering the cost of lime or fertilizer application is optional.Once you have entered these values, simply click the �Run Economics� button and theprogram will display the Results/Summary screen for Economics. Displayed on the pageis the target yield level for which the economic solution has been determined, the amountof the amendments needed, the cost of amendments (on a per hectare basis) and the netreturn for the amendments.

19
Unlike the other result pages, the Economics/Result/Summary page is interactive. Thereare four options described below:
Compare Fertilizer Mixes: This option allows you to compare different fertilizers � bothelemental and mixes (or blends). You will have the option of selecting only elemental,only mixed, or both types of fertilizer using the drop down menus provided. You willneed to enter the cost of the fertilizer on a per kg basis. You can also change the price ofthe lime, although you cannot change the type or quality of lime that you are using. Tochange your lime type or quality you will need to return to the Prediction/LimeApplication page. Lime is priced by the ton. Click on the �compare� button for theoutput. The economic solution is given for the target yield you are trying to obtain. Ifyou have selected to use fertilizer mixes, as opposed to only elemental fertilizers, theamendment amounts may oversupply one of the nutrients. The header, �ExcessNutrients� displays the amount of excess N or P that you have applied due to the use of amixed fertilizers. If excess nutrients are supplied, this may or may not affect your netreturn. Finally, the program computes the optimum inputs for your target yield, whichmay not be the most profitable yield to target. Your results in this section will not be themost profitable combinations if target yield exceeds best profit yield.
Compare Fertilizer Constraints: This option allows you to enter different amounts offertilizer. In particular, this option was designed for areas where fertilizer is often inshort supply. The type and price of fertilizer and the price of lime must be selected in the�Compare Fertilizer Mixes� option. Then proceed to the compare fertilizer constraintsoption. Change the amount of fertilizer or lime you have available. The solution will tellyou the yield you can obtain with that type and amount of fertilizer and the amount oflime you have selected. Click on the �compare� button for the output. The economicsolution works toward the target yield. You may, however, have insufficient fertilizer toreach the target yield. Therefore, you will have a reduced yield level. This yield levelwill be listed. Your results will not be the most profitable combination if your fertilizer-constrained yield is greater than the best profit yield; results will be the best combinationof inputs to meet your fertilizer constraint.
Compare Cash Constraints: This option allows you to enter the amount of money youhave available to spend on amendments. The type and price of fertilizer and the price oflime must be selected in the �Compare Fertilizer Mixes� option. Then put in the amountof money you have available in the �cost� input box. Click on the �compare� button forthe output. The economic solution works toward the target yield. You may, however,have insufficient money to reach the target yield. Therefore, you will have a reducedyield level. This yield level will be listed, as well as the amount of fertilizer and lime thatcan be purchased with the amount of money that you have. Your results will not be themost profitable combination if your cash constrained yield is greater than the best profityield; results will be the best combination of inputs to meet your cash constraint.
Compare Best Profit: This option allows you to enter the type and price of fertilizer andthe amount of lime. Click on the �compare� button for the output. This option works
20
towards the best profit level. This may or may not be optimum yield or target yield. Theyield level and fertilizer and lime amounts will be listed for the best profit.
In addition to the interactive options, there is information provided about the value of anyorganic sources you have used (Organic and Residual Effects). A note will tell you yoursavings value in fertilizer N and lime from organic applications, and also savings in limecosts to crops after the intended crop due to the residual effects of these amendments.
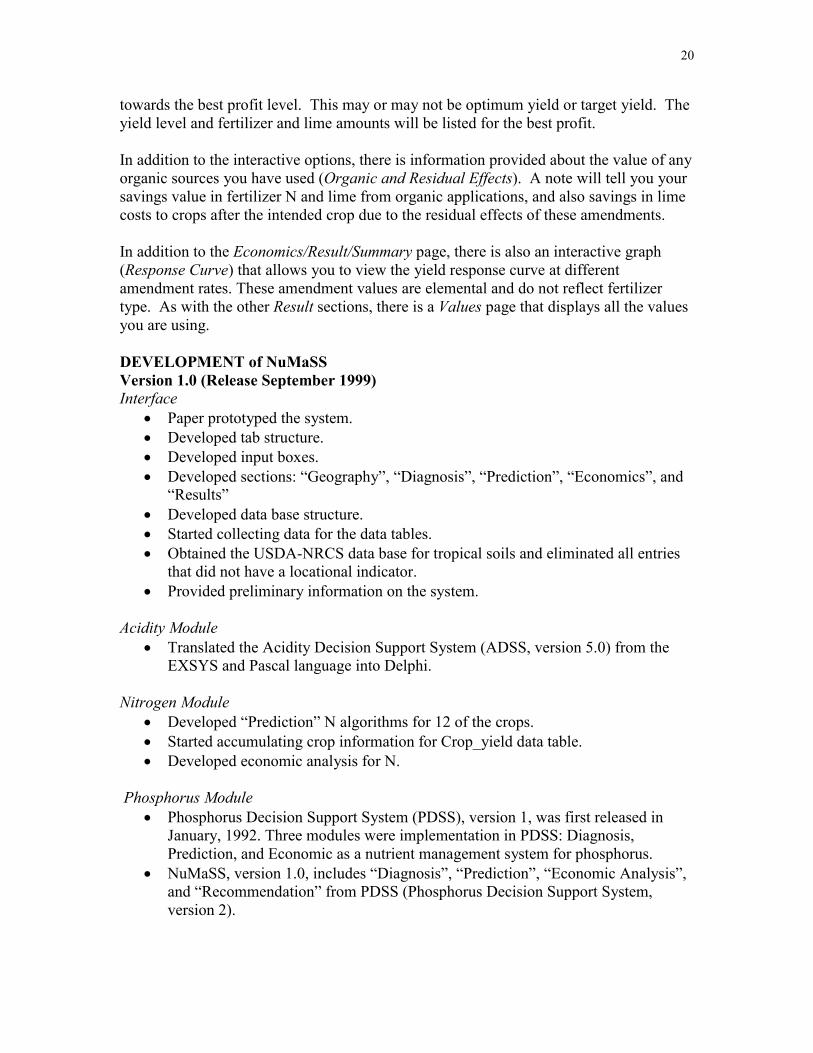
In addition to the Economics/Result/Summary page, there is also an interactive graph(Response Curve) that allows you to view the yield response curve at differentamendment rates. These amendment values are elemental and do not reflect fertilizertype. As with the other Result sections, there is a Values page that displays all the valuesyou are using.
DEVELOPMENT of NuMaSSVersion 1.0 (Release September 1999)Interface
� Paper prototyped the system.� Developed tab structure.� Developed input boxes.� Developed sections: �Geography�, �Diagnosis�, �Prediction�, �Economics�, and
�Results�� Developed data base structure.� Started collecting data for the data tables.� Obtained the USDA-NRCS data base for tropical soils and eliminated all entries
that did not have a locational indicator.� Provided preliminary information on the system.
Acidity Module� Translated the Acidity Decision Support System (ADSS, version 5.0) from the
EXSYS and Pascal language into Delphi.
Nitrogen Module� Developed �Prediction� N algorithms for 12 of the crops.� Started accumulating crop information for Crop_yield data table.� Developed economic analysis for N.
Phosphorus Module� Phosphorus Decision Support System (PDSS), version 1, was first released in
January, 1992. Three modules were implementation in PDSS: Diagnosis,Prediction, and Economic as a nutrient management system for phosphorus.
� NuMaSS, version 1.0, includes �Diagnosis�, �Prediction�, �Economic Analysis�,and �Recommendation� from PDSS (Phosphorus Decision Support System,version 2).

21
Version 1.5 (Release May 2000)Interface
� Added a component that allowed either �.� or �,� to be used for the decimaldelimiter
� Provided help modules on such topics as �Soil Taxonomy�, �Soil Testing�,�Environmental Affects of Fertilizers�.
� Provided a range check function that notifies users when a input value is beyondthe normal range.
� Changed the name from Integrated Soil Nutrient Management Decision SupportSystem (IntDSS) to Nutrient Management Support System (NuMaSS).
� Save and retrieve feature was added, allowing users to save input data and retrieveit.
� Print function for �Results� section was added.
Acidity Module� Corrected calculations for �Economic Analysis�.� Revised diagnosis and prediction for potato.
Nitrogen Module� Input boxes for nitrogen entries were programmed to be activated only when
necessary.� Corrected N inputs for leguminous crops.
Version 2.0 (Release September 2002)Interface
� Streamlined interface by reducing 18 tabs as well as a number of input boxes.� Added over 70 images of plant nutrient deficiencies and related previous crop to
these nutrient deficiencies.� Added over 5 images of indicator plants.� Added close to 500 records to the Crop_yield table. There are over 20 fields for
each record. The table primarily provides default yield information and N datafor the 18 crops in the system.
� Added agricultural regions to each country.� The map became functional so that users can click on a country to pull up
information in the �Geography� section.� Viewable data base records.� Added multiple popup warning messages when there is a user input error.
Acidity Module� �Diagnosis� was upgraded to include Bayesian probabilities for soil acidity.� Reprogrammed �Diagnosis and Prediction� as distinct entities to ensure
compatibility with Nitrogen and Phosphorus modules.� Developed algorithms for relations between soil pH and % Al saturation based on
data from the tropics.

22
� Assembled critical soil % Al saturation data for crop cultivars and diagnosticfoliar Ca and Mg levels.
� Expanded acidity module application for 4 additional soil orders in the U.S. SoilTaxonomy.
� Revised lime factor algorithms in �Prediction� to account for soils with high andlow activity clays.
� Revised algorithms for adjustment of lime quality to account for different types ofinformation available to users.
� Developed algorithms for peach palm in �Diagnosis� and �Prediction� based onsoil and plant Ca and Mg deficiencies.
� Developed algorithms for �Economics� to estimate location-specific yieldresponses to liming for all crops.
� Developed algorithms to estimate savings in lime due to organic inputs in�Economics.�
� Revised algorithms, based on analyses of long-term trial data in the tropics, toestimate future cost savings from applied lime in �Economics.�
Nitrogen Module� �Diagnosis� was upgraded to include Bayesian probabilities for N.� Peach palm, cotton, and tuber algorithms were added to �Prediction.�� Nitrogen economic algorithms were developed for all crops.� Developed algorithms to estimate savings for N due to organic inputs in
�Economics.�
Phosphorus Module� Includes data from Mali, West Africa for sandy soils (5-12% clay) and improved
data for soils with high clay content (60-80%) from S. America and S.E. Asia.This data is used to better estimate P critical level and P buffer coefficients.
� Additional crops are now included in estimates of P requirement: cotton, potato,and peach palm.
� Removal of Economic options, Residual effects, and Phosphate fertilizer materialchoice.
Economics� The �Economics� section was completely overhauled. The interface was
dramatically changed to provide for integration of the three modules.� Extensive cost and benefit programming for the integrated response functions of
the three modules was developed and implemented in NuMaSS.� A response curve for the �Economic� section was developed.� Economic benefits of organic amendments were added.

23
DATA BASES for NuMaSSData Base DescriptionThe NuMaSS data base is comprised of 19 data tables (see data structure tab). These databases provide default values for some of the input variables or they provide criticalinformation for the system. One data table, Econ_output, is created during the economicanalysis. The information contained in this data table will change each time an economicanalysis is performed.
Criteria for the default data depends on the available data, but, often, is a function ofregion, country, agricultural area, crops and soil (see data structure and data dictionarysections for more information). Most of the data tables described below can be viewedwithin NuMaSS 2.0. At the top left-hand corner of the program is the �Options� button.Press this and then go to select �View Data Tables.� This list of data tables that can beviewed will be visible. Simply click on the table you want to view. The data table will�pop-up.� Just click the �close� button of the data table when you are through viewingthe table.
The geographical information provided by the system is located in the Agroecosystemsdata table. This table organizes the world by continents, countries within continents, andagroecoregions (humid tropical, wet/dry, and semi-arid) within countries. When regionalnames exist for an agroecosystem, for example the Amazon, that specific name is usedrather than the more general agroecosystem name, such as humid tropical in thisparticular example.
The crops used in the NuMaSS are stored in the Crop data table. Crop data, such asoptimal, average and minimum yields, has been and is continuing to be collected frompublished and gray literature. Considerable crop information has been added to the database for cassava, cowpeas, maize, pearl millet, potatoes, sorghum, upland rice, wheat,pasture grasses and legumes, potatoes, yams and green manures (Crop_yield). There isless data available for the other crops, such as bambarra groundnut, cotton, mung beans,phaseolus beans, and soybeans.
Data on the nitrogen supplying capacity of manures (Manure data table) and legumecover crops (Fallow_greenmanure data table) has been collected and organized into thedata tables. The Manure table lists the nutrient content of manure from different animaltypes. This manure information has been derived from tropical areas. Nutrient content ofmanures is highly variable. We have selected ranges in the middle and believe these tobe best estimates. Nitrogen contributions from grain legumes to the preceding crop arecalculated two ways � either using the stover or as a default value based on data fromliterature. These default values can be found in the Crop_yield table. Fertilizer tablelists the elemental content of the different fertilizer types.
The soil pedon data contained in NuMaSS comes from United States Department ofAgriculture Natural Resource Conservation Service's National Soil CharacterizationDatabase. The pedon data table in NuMaSS consists of only soil characterization data

24
from tropical countries. We have excluded tropical pedons that do not have any spatialidentification. This means that any pedons that did not have either locations or referencepoints (longitude and latitude) associated with them are not part of the Soil_pedons table.
Each soil pedon record consists of soils information (e.g. exchangeable cations, ECEC,bulk density, texture, etc.) based on layers. Depending on the pedon, there are 2 to 5layers per pedon. Each layer has a thickness associated with it. When a soil pedon isselected (Diagnosis/Soil and Soil Pedon), the soil data of interest is calculated based on asoil depth of 15 cm. Therefore, if layer 1 is less than 15 cm, the default soil data will bethe proportionate combination of data from layer 1 and layer 2 based on layer thickness.For example, if the first layer is 10 cm thick with a bulk density of 1.0 g cm-3 and thesecond layer is 40 cm with a bulk density of 1.5 g cm-3, the bulk density displayed will be1.17 g cm-3 for the 15 cm depth (1.0 g cm-3 for 10 cm and 1.5 g cm-3 for 5 cm).
Soil pedon default data is used by acidity, nitrogen and phosphorus, especially the acidityand phosphorus modules. As discussed above, default values for the soil propertiesdisplayed in the Diagnosis section of NuMaSS are based on a 15 cm depth. However, inthe Prediction section, users select the depth of lime incorporation (Lime Application)and phosphorus incorporation (Fertilizer Application) separately. These depths ofincorporation may be different from each other and they may also be different from thedefault depth of 15 cm. A different depth of incorporation will trigger a recalculation ofthe parameters of interest, based on the new depth. For example, if depth ofincorporation in the Lime Application page is selected to be 20 cm, then the new bulkdensity (based on the example above) will be 1.25 g cm-3 (1.0 g cm-3 for 10 cm and 1.5 gcm-3 for 10 cm). This newly calculated bulk density will be used to calculate the limingrate. If at the same time, the depth of incorporation in the Phosphorus Application ismaintained at 15 cm, then the bulk density value of 1.17g cm-3 will be used. Note thatthe bulk density values used to calculate the lime and phosphorus application rates aredifferent. Because there are two different bulk density values, newly calculated valueswill not display. Soil depth for NITROGEN MODULE is always set at 15 cm and anydefault data derived from the Soil_pedon table will be based on a 15 cm depth.
There are three other soil tables that are part of the NuMaSS data base - Soil_fertility,Soil_critical, and Bulk_density. The Soil_fertility table contains information on thequantity of nitrogen mineralized by soils. Soil critical values for particular elements andcrops are listed in the Soil_critical table and used for the lime and phosphorus modules.The Bulk_density table provides bulk density default values based on soil order andtexture. The bulk density information for this table was gathered from the pedon table.Bulk density values were taken from the Pedon table and both average and median valueswere calculated. Because no differences were identified, average bulk density is used inthe table.
Some soil nutrient deficiencies can be assessed either from pictures of plant nutrientdeficiencies, pictures of indicator plants, or nutrient content of previously grown crops.The data tables associated with the plant images are Indicator_plant for the indicator

25
plants and Crop_observation for the associated nutrient deficiency images. TheCrop_critical data table contains the critical levels of nutrients for different.
Probabilities of a nitrogen, phosphorus or acidity problems associated with particularconditions are stored in the Probability table. Additional probability values forphosphorus are located in the Prob_loc_order table. The probability values from thesedata tables are used in the Diagnosis section to calculate the probability of a particularnutrient deficiency (or sufficiency). Values that are used to check the acceptable range ofan input value are stored in Range_check. Tables used for the P module includeCV_paramter and PuptakeFactor.

26
Data Base Structure
27
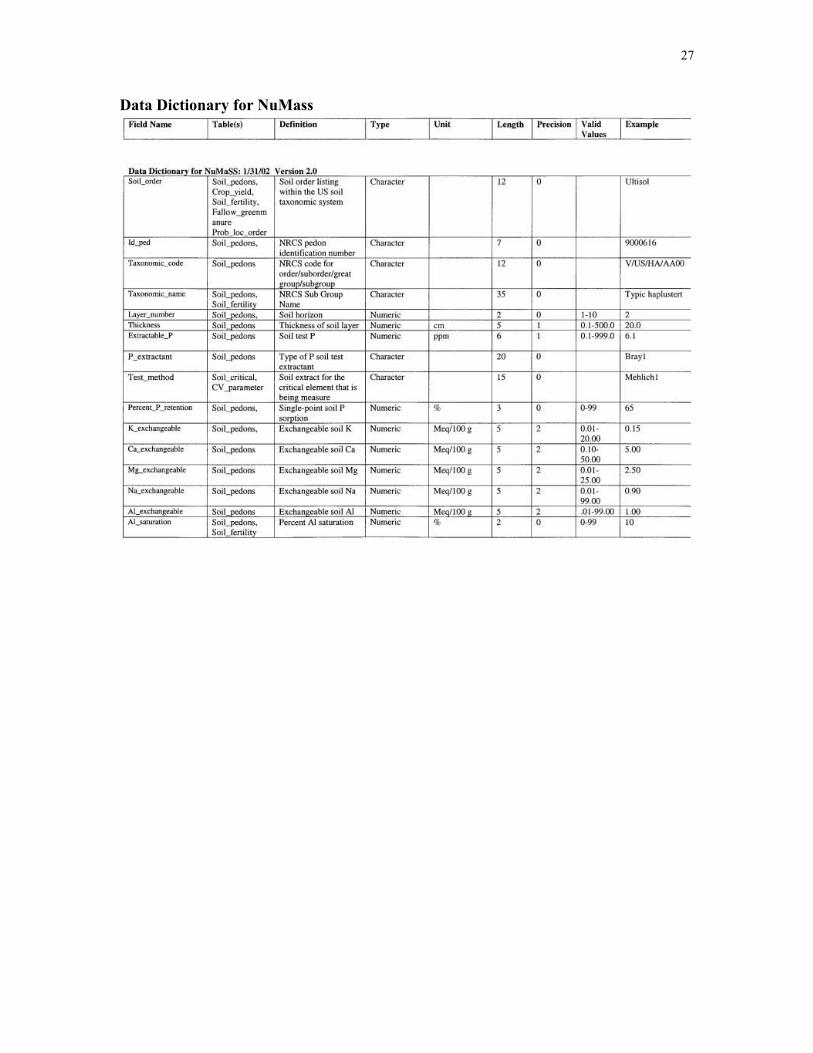
Data Dictionary for NuMass

28

29
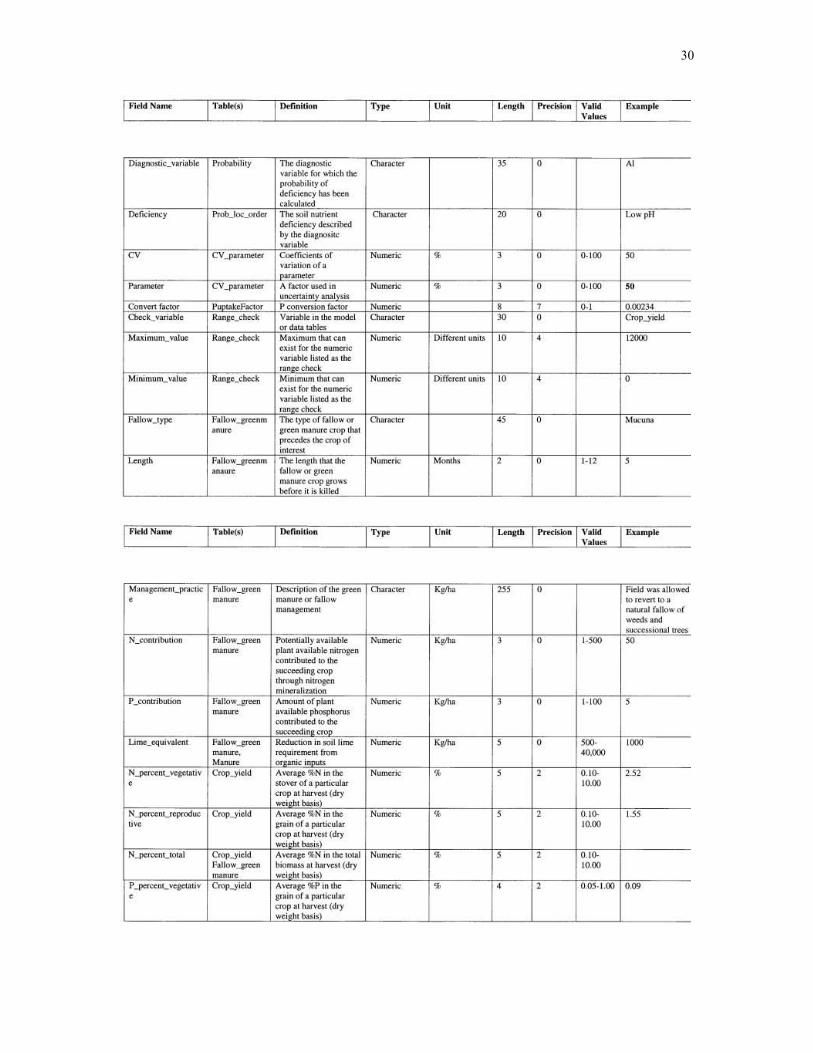
30

31

32
Related Documents