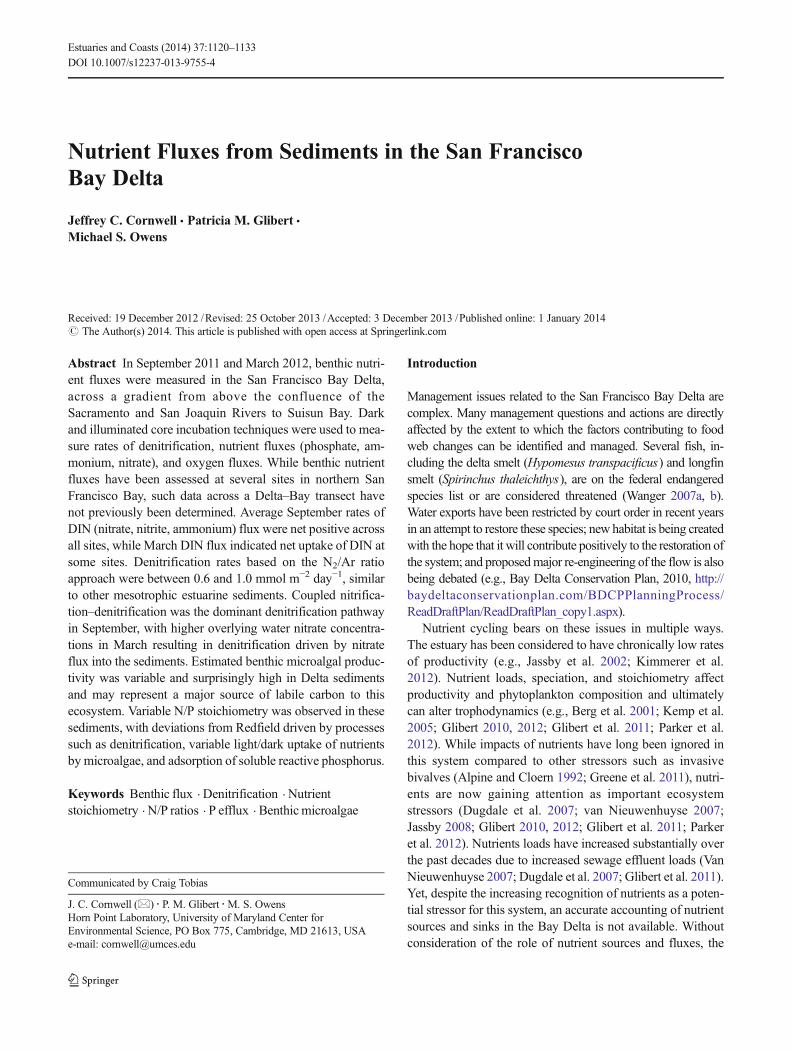
Nutrient Fluxes from Sediments in the San Francisco Bay Delta Jeffrey C. Cornwell & Patricia M. Glibert & Michael S. Owens Received: 19 December 2012 /Revised: 25 October 2013 /Accepted: 3 December 2013 /Published online: 1 January 2014 # The Author(s) 2014. This article is published with open access at Springerlink.com Abstract In September 2011 and March 2012, benthic nutri- ent fluxes were measured in the San Francisco Bay Delta, across a gradient from above the confluence of the Sacramento and San Joaquin Rivers to Suisun Bay. Dark and illuminated core incubation techniques were used to mea- sure rates of denitrification, nutrient fluxes (phosphate, am- monium, nitrate), and oxygen fluxes. While benthic nutrient fluxes have been assessed at several sites in northern San Francisco Bay, such data across a Delta–Bay transect have not previously been determined. Average September rates of DIN (nitrate, nitrite, ammonium) flux were net positive across all sites, while March DIN flux indicated net uptake of DIN at some sites. Denitrification rates based on the N 2 /Ar ratio approach were between 0.6 and 1.0 mmol m −2 day −1 , similar to other mesotrophic estuarine sediments. Coupled nitrifica- tion–denitrification was the dominant denitrification pathway in September, with higher overlying water nitrate concentra- tions in March resulting in denitrification driven by nitrate flux into the sediments. Estimated benthic microalgal produc- tivity was variable and surprisingly high in Delta sediments and may represent a major source of labile carbon to this ecosystem. Variable N/P stoichiometry was observed in these sediments, with deviations from Redfield driven by processes such as denitrification, variable light/dark uptake of nutrients by microalgae, and adsorption of soluble reactive phosphorus. Keywords Benthic flux . Denitrification . Nutrient stoichiometry . N/P ratios . P efflux . Benthic microalgae Introduction Management issues related to the San Francisco Bay Delta are complex. Many management questions and actions are directly affected by the extent to which the factors contributing to food web changes can be identified and managed. Several fish, in- cluding the delta smelt (Hypomesus transpacificus ) and longfin smelt (Spirinchus thaleichthys ), are on the federal endangered species list or are considered threatened (Wanger 2007a, b). Water exports have been restricted by court order in recent years in an attempt to restore these species; new habitat is being created with the hope that it will contribute positively to the restoration of the system; and proposed major re-engineering of the flow is also being debated (e.g., Bay Delta Conservation Plan, 2010, http:// baydeltaconservationplan.com/BDCPPlanningProcess/ ReadDraftPlan/ReadDraftPlan_copy1.aspx). Nutrient cycling bears on these issues in multiple ways. The estuary has been considered to have chronically low rates of productivity (e.g., Jassby et al. 2002; Kimmerer et al. 2012). Nutrient loads, speciation, and stoichiometry affect productivity and phytoplankton composition and ultimately can alter trophodynamics (e.g., Berg et al. 2001; Kemp et al. 2005; Glibert 2010, 2012; Glibert et al. 2011; Parker et al. 2012). While impacts of nutrients have long been ignored in this system compared to other stressors such as invasive bivalves (Alpine and Cloern 1992; Greene et al. 2011), nutri- ents are now gaining attention as important ecosystem stressors (Dugdale et al. 2007; van Nieuwenhuyse 2007; Jassby 2008; Glibert 2010, 2012; Glibert et al. 2011; Parker et al. 2012). Nutrients loads have increased substantially over the past decades due to increased sewage effluent loads (Van Nieuwenhuyse 2007; Dugdale et al. 2007; Glibert et al. 2011). Yet, despite the increasing recognition of nutrients as a poten- tial stressor for this system, an accurate accounting of nutrient sources and sinks in the Bay Delta is not available. Without consideration of the role of nutrient sources and fluxes, the Communicated by Craig Tobias J. C. Cornwell (*) : P. M. Glibert : M. S. Owens Horn Point Laboratory, University of Maryland Center for Environmental Science, PO Box 775, Cambridge, MD 21613, USA e-mail: [email protected] Estuaries and Coasts (2014) 37:1120–1133 DOI 10.1007/s12237-013-9755-4

Welcome message from author
This document is posted to help you gain knowledge. Please leave a comment to let me know what you think about it! Share it to your friends and learn new things together.
Transcript
Nutrient Fluxes from Sediments in the San FranciscoBay Delta
Jeffrey C. Cornwell & Patricia M. Glibert &Michael S. Owens
Received: 19 December 2012 /Revised: 25 October 2013 /Accepted: 3 December 2013 /Published online: 1 January 2014# The Author(s) 2014. This article is published with open access at Springerlink.com
Abstract In September 2011 and March 2012, benthic nutri-ent fluxes were measured in the San Francisco Bay Delta,across a gradient from above the confluence of theSacramento and San Joaquin Rivers to Suisun Bay. Darkand illuminated core incubation techniques were used to mea-sure rates of denitrification, nutrient fluxes (phosphate, am-monium, nitrate), and oxygen fluxes. While benthic nutrientfluxes have been assessed at several sites in northern SanFrancisco Bay, such data across a Delta–Bay transect havenot previously been determined. Average September rates ofDIN (nitrate, nitrite, ammonium) flux were net positive acrossall sites, while March DIN flux indicated net uptake of DIN atsome sites. Denitrification rates based on the N2/Ar ratioapproach were between 0.6 and 1.0 mmol m−2 day−1, similarto other mesotrophic estuarine sediments. Coupled nitrifica-tion–denitrification was the dominant denitrification pathwayin September, with higher overlying water nitrate concentra-tions in March resulting in denitrification driven by nitrateflux into the sediments. Estimated benthic microalgal produc-tivity was variable and surprisingly high in Delta sedimentsand may represent a major source of labile carbon to thisecosystem. Variable N/P stoichiometry was observed in thesesediments, with deviations from Redfield driven by processessuch as denitrification, variable light/dark uptake of nutrientsby microalgae, and adsorption of soluble reactive phosphorus.
Keywords Benthic flux . Denitrification . Nutrientstoichiometry . N/P ratios . P efflux . Benthic microalgae
Introduction
Management issues related to the San Francisco Bay Delta arecomplex. Many management questions and actions are directlyaffected by the extent to which the factors contributing to foodweb changes can be identified and managed. Several fish, in-cluding the delta smelt (Hypomesus transpacificus) and longfinsmelt (Spirinchus thaleichthys), are on the federal endangeredspecies list or are considered threatened (Wanger 2007a, b).Water exports have been restricted by court order in recent yearsin an attempt to restore these species; new habitat is being createdwith the hope that it will contribute positively to the restoration ofthe system; and proposedmajor re-engineering of the flow is alsobeing debated (e.g., Bay Delta Conservation Plan, 2010, http://baydeltaconservationplan.com/BDCPPlanningProcess/ReadDraftPlan/ReadDraftPlan_copy1.aspx).
Nutrient cycling bears on these issues in multiple ways.The estuary has been considered to have chronically low ratesof productivity (e.g., Jassby et al. 2002; Kimmerer et al.2012). Nutrient loads, speciation, and stoichiometry affectproductivity and phytoplankton composition and ultimatelycan alter trophodynamics (e.g., Berg et al. 2001; Kemp et al.2005; Glibert 2010, 2012; Glibert et al. 2011; Parker et al.2012). While impacts of nutrients have long been ignored inthis system compared to other stressors such as invasivebivalves (Alpine and Cloern 1992; Greene et al. 2011), nutri-ents are now gaining attention as important ecosystemstressors (Dugdale et al. 2007; van Nieuwenhuyse 2007;Jassby 2008; Glibert 2010, 2012; Glibert et al. 2011; Parkeret al. 2012). Nutrients loads have increased substantially overthe past decades due to increased sewage effluent loads (VanNieuwenhuyse 2007; Dugdale et al. 2007; Glibert et al. 2011).Yet, despite the increasing recognition of nutrients as a poten-tial stressor for this system, an accurate accounting of nutrientsources and sinks in the Bay Delta is not available. Withoutconsideration of the role of nutrient sources and fluxes, the
Communicated by Craig Tobias
J. C. Cornwell (*) : P. M. Glibert :M. S. OwensHorn Point Laboratory, University of Maryland Center forEnvironmental Science, PO Box 775, Cambridge, MD 21613, USAe-mail: [email protected]
Estuaries and Coasts (2014) 37:1120–1133DOI 10.1007/s12237-013-9755-4

potential success of restoration of habitat restoration for nativespecies will likely remain unpredictable.
Sediments are key components of shallow water estuarineecosystems, both responding to changing environmental con-ditions and, at the same time, modifying the chemistry of theoverlying water column. The role of sediments as “sinks” ofcontaminants, organic matter, and nutrients has been studiedfor decades, and their role as nutrient transformers has beenwell described. Sediments can be sinks for nutrients via burialand microbial denitrification and via assimilation into benthicalgae and rooted macrophytes (Joye and Anderson 2008;Lehtoranta et al. 2009). Conversely, sediments are alsosources of remineralized nutrients to support water columnprimary production. Sediments recycle fixed nitrogen (N) andphosphorus (P) to the water column at rates that do notnecessarily reflect their rates of deposition. Remineralized Ncan be returned to the water column as fixed N (NH4
+ or NOx)or as N2 after the process of denitrification. Phosphorus can bereturned to the water column as soluble reactive P (SRP,essentially equivalent to PO4
3−) or retained within the sedi-ments as both inorganic (mineral or adsorbed) and organic P.Rates of sediment–water exchange of nutrients can be affectedby a large number of factors, including input rates of labile C,N, and P; presence/absence of dissolved O2 in overlying water(Mortimer 1971; Rysgaard et al. 1994; Kemp et al. 2005);salinity (Caraco et al. 1990; Gardner et al. 1991); availabilityof terminal electron acceptors including NO3
−, Mn(IV),Fe(III), and SO4
2− (Anderson 1982; Cornwell et al. 1999;Lehtoranta et al. 2009); activity of bioturbating andbioirrigating animals (Aller 1980; Pelegri et al. 1994; Owens2009); and pH (Seitzinger 1991; Glibert et al. 2011; Gao et al.2012). The relative importance of sediment processes to thebiogeochemistry of coastal systems is inversely related to thedepth of the water column and directly related to the residencetime of the water within the system (Nixon et al. 1996).
In systems in which P loading has been reduced from pointsource effluent or detergents, as occurred in the 1990s in the BayDelta (Van Nieuwenhuyse 2007; Glibert 2010; Glibert et al.2011), sediments can become the major source of this importantmacronutrient. In non-calcareous freshwater sediments, P is mostoften bound to iron oxyhydroxides (FeOOH; Williams et al.1971; Jordan et al. 2008). The FeOOH-bound P may be deliv-ered to estuaries with transport of suspended solids or maybecome adsorbed to particulates when P is discharged from othersources, such as from point source discharges. When this boundP meets saline or sulfate-rich water, either from transport down-estuary or from salt intrusion to sediments, formation of ironsulfide minerals can release P to overlying water (Caraco et al.1990; Jordan et al. 2008; Lehtoranta et al. 2009). In theBayDeltastrong salinity gradients, shallow water depths and variableamounts of primary production/algal biomass are expected tohave an important effect on sediment nutrient recycling (as inother coastal ecosystems; Boynton andKemp 2008). Prior to this
study, few measurements of sediment nutrient dynamics in theBay Delta have been made (Caffrey 1995; Kuwabara et al.2009).
Here, we report on a series of measurements of N (NH4+,
NO3−, N2–N) and P (soluble reactive P or SRP) fluxes from
sites encompassing the salinity gradient in the Bay Deltaregion (e.g., Jassby et al. 1995). Our observations were con-ducted under high flow conditions in fall 2011 and in spring2012. We hypothesized that fluxes of N from the sediment tothe water column would be higher in late summer than inspring, that site differences would vary with N form, and thatN/P stoichiometry of the fluxes would differ from Suisun Bayto upper Delta sites. We also hypothesized that shallow sedi-ments in this system would be sites of considerable benthicproductivity.
Methodology
Sampling and Experimentation
Sampling included a transect of 12 sites during each of twoseasons, from the flooded islands above the confluence of theSacramento and San Joaquin Rivers in the Bay Delta toSuisun Bay (Table 1, Fig. 1). Sediments were collected in“Delta” environments (including Mildred’s Island, FranksTract, Big Break, and Sherman Island) on September 14,2011 and March 15, 2012, and in “Bay” environments (in-cluding Browns, Honker, Grizzly, and Suisun Bays) onSeptember 16, 2011 and March 17, 2012. Each site wassampled in duplicate, except for Big Break in 2012, whensix cores were collected from that site. An aluminum polecorer was used for sediment collection in the generally shal-low deltaic environments, using 7 cm id acrylic cores with asediment depth of 15 cm. In the Bay environments, both thepole corer and a Soutar-designed non-metallic box corer wereused. Sub-cores were inserted into the box corer at each site.Although undisturbed cores were collected at all sites, bothsampling approaches had limitations: (1) the pole corer wasable to collect samples to a water column depth of ∼3 m,making core collection at Mildred’s Island limited to ashallower water site on the northern edge, and (2) the boxcorer did not have sufficient penetration power at some deeperwater sites, limiting sampling to shallow water sites.
At each site, the station location was recorded using GPS;photosynthetically active radiation (PAR) from both the watersurface and the sediment surface was recorded using a 2πLiCor light sensor, and salinity and temperature were mea-sured using either YSI sondes or a Sea Bird CTD (selected baysites only). At each site water was collected using rosette-mounted water sampling bottles or by direct submersion ofcarboys at the shallow water sites for use in subsequentincubations as described below.
Estuaries and Coasts (2014) 37:1120–1133 1121

Cores were shaded and kept in a water-filled cooler untiltransport to the Romberg Tiburon Center, Tiburon, CA, wherethe experiments were conducted. Upon return to the laborato-ry, each sediment core was bathed overnight in the overlyingwater from the respective site. A water-only control core wasadded to provide an estimate of water column effects on netfluxes. The cores were completely flushed to maintain O2
saturation, and the overnight pre-incubation allowed the corestime to come to a thermal equilibrium and to equilibrate theN2, O2, and Ar in the plastics with the water column.
To initialize flux experiments, a spinning top was installedon each core. All cores were then incubated in 5–7 h ofdarkness, followed, for a subset of the cores, by a 2–3-hilluminated period using natural sunlight. Dark-only experi-ments were conducted on those cores that were collected fromnaturally turbid waters receiving little to no light at the sedi-ment surface. Light incubations were added only for thosecores collected from shallower sites that could receive light atthe sediment surface. Dark incubation times were chosen toprovide sufficient signal for nutrient concentration changes
Table 1 Site locations, salinity, temperature, and depth for sampling transect
Site Latitude Longitude Salinity Temperature Depth
N W September 11 March 12 September 11 March 12°C m
Mildred Island 37.9975 121.5229 0.1 0.2 22.2 13.3 2.5
Franks Tract I 38.0557 121.5886 0.1 0.2 21.6 12.8 1.1
Franks Tract II 38.0262 121.6085 0.1 0.2 22.2 12.8 3.1
Big Break 38.0221 121.7201 0.1 0.2 21.5 13.1 2.0
Sherman Island I 38.0470 121.7918 0.2 0.4 21.3 12.7 1.7
Sherman Island II 38.0452 121.8003 0.2 0.4 20.9 12.9 1.7
Brown 38.0442 121.8739 0.4 2.7 20.8 12.7 2.0
Honker I 38.0733 121.9230 0.9 2.7 19.8 12.6 3.1
Honker II 38.0715 121.9338 1.2 2.7 19.3 12.7 2.0
Grizzly 38.1175 122.0397 3.4 6.0 19.0 12.5 3.1
Suisun I 38.0555 122.1200 8.3 10.2 19.7 12.3 3.0
Suisun II 38.0915 122.0583 5.5 8.4 19.5 12.3 3.2
The 2011 samples were collected on September 14, 2011 and September 16, 2011. The 2012 samples were collected onMarch 15, 2012 and March 17,2012
Fig. 1 Location map for San Francisco Bay Delta and enlarged mapillustrating sampling sites for sediment flux work conducted duringSeptember 2011 and March 2012. Herein, we consider the Suisun I to
Browns set of six sites to be “Bay” sites and the Sherman Island toMildred’s Island sites to be “Delta” sites
1122 Estuaries and Coasts (2014) 37:1120–1133

without depletion of O2 below ∼75 % of saturation. Lightincubation times were sufficient to measure changes withoutO2 supersaturation. Neutral density screening was used withnatural sunlight to match the irradiances observed in the field(typically PAR values of 50–300 μmol m−2 s−1). During theMarch sediment incubations, heavy rains required that theincubations were carried out inside the SAV greenhouse areaat the Tiburon Center; dark overcast conditions resulted invariable light levels.
Cores were sampled seven times during the incubationperiod, three times in the dark, once at the light/dark transition,and three times in the light, yielding a four-point time seriesfor dark conditions and four-point time series for illuminatedconditions. At each time point, samples of the overlying waterwere collected for dissolved O2, N2, argon (Ar), SRP, NH4
+,and NO3
−+NO2− (also referred to as NOx). Samples for gas
analysis of N2, O2, and Ar were collected in 7 mL glassstoppered vials with 10 μL of 50 % saturated HgCl2 addedfor preservation. Samples for nutrient analysis were collectedin syringes, filtered (0.4 μm polycarbonate filter), and frozenuntil analysis.
At the end of the incubation, the water volume overlyingthe sediments was measured and triplicated; samples for chlo-rophyll a analysis were sub-cored from the surface 0–1 cm ofeach core using a cut-off syringe. Chlorophyll a samples wereimmediately frozen to −20 °C.
Analytical Methodology
Membrane inlet mass spectrometry (MIMS) was used foranalysis of O2, N2, and Ar (Kana et al. 1994). MIMS sampleswere analyzed by pumping the water through a membranetube situated inside the mass spectrometer vacuum. Gas ratios(e.g., N2/Ar) were measured with a precision of <0.03 % c.v.with minimal corrections for O2 depletion (Kana and Weiss2004). Argon-normalized gas ratios were converted to gasconcentrations using air equilibrated standards. Replicateanalyses on the initial sampling (i.e., time zero) from eachcore were conducted.
Nutrient analysis was conducted using standard automatedanalysis techniques, with NOx measured with Cd reduction.Chlorophyll a was determined using acetone extraction ac-cording to Van Heukelem et al. (1994). These analyses wereall carried out with ∼10 % replication.
Data Calculations
Sediment–water exchange rates were calculated from theslope of the change of chemical constituent concentrations inthe overlying water:
F ¼ ΔC
Δt� V
A
where F is the flux (micromoles per square meter perhour), ΔC /Δt is the slope of the concentration changein overlying water (micromoles per liter per hour), V isthe volume of the overlying water (liters), and A is thearea of the incubated core (per square meter). When thewater-only control core had a significant slope, theslope of the flux cores was adjusted accordingly. Dailyrates of nutrient exchange for the dark only conditionsin Bay sediments were calculated by multiplying darkrates of flux by 24 h; for Delta cores with illuminatedtime periods, the appropriate light/dark flux estimatewas multiplied by the light/dark period length andsummed.
Benthic Microalgal Productivity Calculations
The production of benthic microalgae was determined asthe difference in O2 fluxes under illuminated and underdark incubation conditions. This implies that the rates ofdark O2 flux represent a true measure of respiration andthat dark and light rates of heterotrophic respiration arethe same. Temporal changes in the depth distribution ofredox processes resulting from diel changes in O2 pen-etration may affect net effluxes during changes fromdark to light conditions (Hochard et al. 2010), thoughcomparison of O2-based benthic microalgal photosynthe-sis to CO2-based estimates have shown good agreement(Newell et al. 2002). Daily rates of benthic microalgalproduction were calculated as the product of the photo-synthetic rate and day length.
The variability between duplicate core flux rates dif-fered for the analytes and was assessed as a coefficientof variability (COV) using half the range between coresdivided by the absolute value of the average flux rate.Median O2 and N2–N duplicate core variability was12 % for rates less than −500 and 40 μmol m−2 h−1,respectively, increasing three- to fivefold for slowerrates. Median SRP, NOx , and NH4
+ COVs ranged from31 to 34 % for absolute value rates greater than 10, 20,and 40 μmol m−2 h−1 respectively, increasing more thanthreefold for lower rates.
Statistical Tests
A two-way analysis of variance was carried out on theflux and sediment chlorophyll a data using the Sigmaplotstatistical package (Version 11, Systat Software, Inc.).Under dark conditions, comparisons were made for eachparameter, examining the data for differences betweenDelta and Bay environments, and March and Septembertime periods. For the illuminated Delta sediments, wecompared dark versus light conditions. Significance wasaccepted for P <0.05.
Estuaries and Coasts (2014) 37:1120–1133 1123

Results
Ambient Environmental Conditions
The sampled sites encompassed regions from <1 to 10.2salinity (Table 1). All sites had depths≤3.2 m at the time ofsampling. Temperatures varied across sites by up to 3.2 °C inSeptember (19.5–22.2 °C), but a much smaller temperaturegradient (12.3–13.3 °C) across sites was observed in March(Table 1). September concentrations of NOx were<5 μmol L−1 in Delta sites other than Sherman Lake, whileSherman Lake and Bay concentrations were 17–22 μmol L−1.In March, all Bay and Delta sites had NOx concentrations of40–43 μmol L−1.
Nitrogen Fluxes
With few exceptions, virtually all cores from all sites, bothDelta and Bay, exhibited net effluxes of N2–N or denitrifica-tion (Fig. 2). The dark N2–N fluxes averaged 34±30 μmol m−2 h−1 with a median of 32 μmol m−2 h−1 inSeptember and 48±31 μmol m−2 h−1 with a median rate of48 μmol m−2 h−1 in March; these temporal differences werenot significant (see ANOVA results in Table 2). The Baydenitrification rates were significantly lower (P <0.05) thanDelta rates, and within the Delta, dark rates were significantly(P <0.05) greater than light rates.
Fluxes of NOx were generally directed into the sedimentsin March and out of the sediment during September (Fig. 3).Spatially, most of the sites in the Delta (Sherman Islandexcepted) had NOx fluxes directed into the sediments duringboth seasons, whereas the flux was in the opposite direction atthe Bay sites. Overall, March NOx fluxes were less thanSeptember fluxes and Bay fluxes were greater than Deltafluxes (P <0.05). Fluxes in the light were not significantlydifferent than dark fluxes.
Fluxes of NH4+ (Fig. 4) were higher in September than in
spring (P <0.05). Spatially, the fluxes of NH4+ generally
exhibited the opposite pattern to those of NOx: although anumber of the highest effluxes occurred in the Delta sites withhighest influxes at the Bay sites, Bay and Delta environmentswere not statistically different. Lower flux rates (i.e., highrates of NH4
+ uptake) were measured under illuminated con-ditions in both September (Sherman Island I) and March(Franks Tract I, Big Break). Under dark conditions, 8 of the12 measured sites appeared to be important sources of NH4
+,with a substantial amount of benthic microalgal attenuation ofNH4
+ effluxes at four of these sites.
Phosphorus Fluxes
Overall trends in SRP fluxes were similar in direction to thoseof NH4
+ (Fig. 5). Higher rates were generally observed in
March than in September (P <0.05), and there was a greatertendency for efflux in the Delta compared to the Bay(P <0.05). Overall, dark fluxes were less than light fluxes(P <0.05). SRP fluxes under illumination were directed intothe sediment, with particularly high (>10 μmol m−2 h−1) ratesobserved in March at Mildred Island, Franks Tract II, Big
Fig. 2 Sediment–water exchange rates of N2–N (di-nitrogen). Datainclude dark fluxes for all sites and light (“illuminated”) flux incubationsfor sites when light reaches the sediment surface. Each bar is the mean ofduplicate cores, and error bars show the data range (except for the March2012 data at Big Break where N =6 and error bars are the standarddeviation). Negative rates are likely incubation artifacts that are mostcommonly observed in sediments with benthic microalgal production.Positive rates indicate a flux directed from the sediment to the watercolumn. For the September sampling, Mildred I had no illuminated data
1124 Estuaries and Coasts (2014) 37:1120–1133

Break, and Sherman I and II. Moreover, in March, dark SRPfluxes had a distinct spatial pattern, with moderate to largeeffluxes in Mildred to Big Break, large rates of uptake inSherman Island, moderate efflux at Brown, and minimal fluxat Honker, Grizzly, and Suisun sites.
Oxygen Fluxes and Sediment Chlorophyll a
Fluxes of O2 in aquatic sediments are the summation of directuptake of O2 during anaerobic sediment decomposition, up-take during re-oxidation of reduced species (e.g., sulfides,Fe(II), NH4
+), and autotrophic O2 production by benthicmicroalgae. Dark uptake of O2 was observed at all sites(Fig. 6). On a seasonal basis, higher O2 flux rates wereobserved at all sites during the September sample periodcompared to March (P <0.05). This is consistent with in-creased sediment metabolic rates as temperature increased to19–22 °C in September from 12–13 °C in March (Table 1).Large spatial differences were observed, with higher averagedark O2 uptake in Delta sediments than in Bay sediments(P <0.05).
Significantly higher rates of benthic photosynthesis(P <0.05) were calculated in September (range=393–1,924 μmol O2m
−2 h−1; mean, 1,029±628 μmol O2m−2 h−1)
than in March (range=144–498 μmol O2m−2 h−1; mean, 115
±33 μmol O2m−2 h−1). These values should be considered as
broad estimates only as cores were exposed to single lightlevels only, and ambient light levels varied between seasons.The concentrations of sediment chlorophyll a were signifi-cantly higher (P <0.05) in Delta sediments compared to Baysediments (Fig. 7), but seasonal differences were notsignificant.
Discussion
The measurements reported here represent the first seasonalcomparison of comprehensive nutrient fluxes from sediments
in the San Francisco Bay Delta. Here, we discuss these rates inthe context of available data for regionally similar estuariesand for estuaries and coasts worldwide, differential regulationof stoichiometry of the fluxes across the gradient of sitesmeasured, and, finally, the potential contribution of these ratesto overall Bay Delta productivity and nutrient loads.
Table 2 ANOVA results for sediment–water exchange and chlorophyllmeasurements
Fluxparameter
Dark fluxes byseason (March vsSeptember)
Dark Fluxes ByLocation (Deltavs Bay)
Delta Only ByIllumination (darkvs light)
N2–N ns Bay<Delta Dk>Lt
NOx Mar<Sept Bay>Delta ns
NH4+ Mar<Sept – Dk>Lt
SRP Mar>Sept Bay<Delta Dk>Lt
O2 Mar<Sept Bay<Delta Dk<Lt
Chlorophyll ns Bay<Delta na
Significant differences (P<0.05) in fluxes are indicated by < or > sym-bols, ns is non-significant, and na is non-applicable
Fig. 3 Sediment–water exchange rates of NOx− (i.e., the sum of nitrate
and nitrite). Data include dark fluxes for all sites and light (“illuminated”)flux incubations for sites when light reaches the sediment surface. Eachbar is the mean of duplicate cores, and error bars show the data range(except for the March 2012 data at Big Break where N =6 and error barsare the standard deviation). Positive rates indicate a flux directed from thesediment to the water column. For the September sampling, Mildred I hadno illuminated data
Estuaries and Coasts (2014) 37:1120–1133 1125

Measured Rates in a Regional and Global Context
Fluxes of N were directed both into and out of the sedimentsand both direction and magnitude varied as a result of themultiple processes contributing to such fluxes, including deni-trification, nitrification, assimilation by benthic microalgae, anddissimilatory reduction of NO3
− to NH4+ (DNRA), as well as a
broad range of organic matter loading to the different sediments
tested. When compared to previous measured rates of denitri-fication worldwide compiled by Joye and Anderson (2008)using similar MIMS techniques, the rates measured herein arecomparable to most other estuaries (Table 3). Uptake rates ofNOx in the upper Delta are much higher than observed in othernorthern California sites such as Tomales Bay, but similar rateshave previously been reported in the NOx-enriched ElkhornSlough (Dollar et al. 1991; Caffrey et al. 2002). The NH4
+
Fig. 4 Sediment–water exchange rates of NH4+. Data include dark fluxes
for all sites and light (“illuminated”) flux incubations for Delta sites whenlight reaches the sediment surface. Each bar is the mean of duplicatecores, and error bars show the data range (except for the March 2012data at Big Break where N=6 and error bars are the standard deviation).Positive rates indicate a flux directed from the sediment to the watercolumn. For the September sampling, Mildred I had no illuminated data
Fig. 5 Sediment–water exchange rates of SRP (soluble reactive phos-phorus). Data include dark fluxes for all sites and light (“illuminated”)flux incubations for sites when light reaches the sediment surface. Eachbar is the mean of duplicate cores, and error bars are show the data range(except for the March 2012 data at Big Break where N =6 and error barsare the standard deviation). Positive rates indicate a flux directed from thesediment to the water column. For the September sampling, Mildred I hadno illuminated data
1126 Estuaries and Coasts (2014) 37:1120–1133

effluxes in the Delta–Bay transect had most effluxes<100 μmol m−2 h−1, with many sites showing uptake in thelight and occasionally in the dark. In the Bay Delta region,Caffrey (1995) reported net NH4
+ production rates at Rio Vistaand Suisun Bay that were <100 μmol m−2 h−1 at all seasons.However, regionally, NH4
+ flux rates measured in Tomales Bay
and Elkhorn Slough were somewhat higher than our observa-tions (Dollar et al. 1991; Caffrey et al. 2002, 2010). Boyntonand Kemp (2008) also compiled a comparative data set of darkNH4
+ effluxes for many estuaries, and these values also showedmost effluxes <100 μmol m−2 h−1.
Similar to previously reported data for Elkhorn Slough andTomales Bay (Caffrey et al. 2002), the SRP fluxes in the Bay–Delta transect had large rates of efflux and influx. The onlypreviously available study on benthic fluxes nutrients in theupper Bay Delta in late summer reported P efflux rates thatranged from insignificant to ∼0.06 mmol m2 day−1, consider-ably lower than rates previously found for the more salinereaches of the estuary and considerably lower than those ofNH4
+ (Kuwabara et al. 2009). The SRP efflux rates reportedherein are significantly higher than those of Kuwabara et al.(2009), but different methodologies were applied in these twostudies. In Tomales Bay, California, USA, Chambers et al.(1995) estimated that release of particle-bound P was ∼12 %of the benthic flux of P in sediments that were sulfide-rich. Intheir global comparison, Boynton and Kemp (2008) showedthat roughly one in ten dark SRP flux measurements had a netuptake of SRP into the sediment, indicating that SRP uptake isnot uncommon in estuarine sediments. In fact, of the 228studies they summarized in which SRP fluxes were measuredfor sediments <5 m depth, the SRP fluxes for the Bay Deltawere in the upper range, if not exceeding these previousstudies. In the Bay Delta, where P was previously measuredin the upper few centimeters of sediment, concentrations were5–10 μmol g−1 in the confluence region, but significantlyhigher at freshwater sites (Nilsen and Delaney 2005). It hasbeen suggested that localized regions of high benthic produc-tivity may result in elevated pH which, in turn, may result in achange in SRP fluxes, from influx to efflux (Glibert et al.2011; Gao et al. 2012). That higher efflux of SRP was ob-served in all Bay Delta sites would be consistent with thishypothesis.
Coastal and estuarine sediments with benthic microalgaehave a broad range of chlorophyll a concentrations, rangingup to 560 mg m−2 (MacIntyre et al. 1996); the highest chlo-rophyll a concentrations measured in this study were found inSeptember at Franks Tract I (replicate cores with 66 and91 mg m−2; Fig. 7). The sediment chlorophyll a data reportedhere compared favorably, on average, with those previouslyreported by Kuwabara et al. (2009), but there were spatialdifferences. As an example, at Sherman Island, the data re-ported here are much higher than Kuwabara et al.’s (2009)observations that showed no detectable chlorophyll a ; basedon single analyses from four cores during each season, theaverage observed during this study was 14±3 and 10±4 mg m−2 chlorophyll a in September and March. Darksediment O2 fluxes were <2000 μmol m−2 h−1, a numberconsistent with estuarine observations worldwide (Boyntonand Kemp 2008). The highest rate of O2 uptake are similar to
Fig. 6 Sediment–water exchange rates of oxygen for Delta (top panel)and Bay (bottom panel) environments. Data include dark fluxes for allsites and light (“illuminated”) flux incubations for Delta sites where lightreaches the sediment surface. Each bar is the mean of duplicate cores, anderror bars show the data range (except for the March 2012 data at BigBreak where N=6 and error bars are the standard deviation). Positiverates indicate a flux directed from the sediment to the water column. Forthe September sampling, Mildred I had no illuminated data
Estuaries and Coasts (2014) 37:1120–1133 1127

those in nearby Tomales Bay (Dollar et al. 1991), with theTomales Bay annual average O2 uptake similar to the March2012 rates reported herein.
Elemental Stoichiometry of Fluxes
The rates of ΣN flux (ΣN=NH4++NOx
−+N2–N flux) can becompared to sediment O2 demand to examine the stoichio-metric relationship of N flux to organic matter decomposition.Implicit in this analysis is that (1) organic matter sources havea reasonably similar composition, with Redfield algal organicmatter used as a key metric, (2) microbial processes yieldremineralized N and P in expected ratios, and (3) O2 fluxesare a suitable measure of metabolism. Sediment O2 demandhas the opposite sign of O2 fluxes and while an imperfectmeasure of metabolism (Banta et al. 1994), provides a usefulcomparison to nutrient fluxes.
In September, ΣN fluxes generally increased with increas-ing sediment O2 demand, with the greatest scatter in the lightfluxes from Delta sediments (Fig. 8). In March, the agreementwith stoichiometry was much weaker, with illuminated Deltasediments showing a ΣN deficit while dark Delta sedimentsshowed a N excess. The balance of N on a diel cycle maybetter reflect the true net balance of these Delta sites. InMarch, the bay sediments appeared to follow stoichiometrymuch more closely. The September flux of SRP relative to O2
demand generally showed that dark incubations tended tohave a SRP deficit, while illuminated sediments had SRPfluxes slightly in excess of stoichiometry. In March, illumi-nated sediment showed a SRP deficit relative to O2 uptake,suggesting excess SRP uptake beyond nutritionalrequirements.
Overall, the lack of tight relationships between observedand expected C/N/P suggests that controls beyond the rates oforganic matter remineralization are important. Nitrificationand denitrification change dissolved inorganic N effluxes,but conserved stoichiometry is not observed, even when N2–N fluxes are considered. Such conservation of ratios wouldnot necessarily be expected (Glibert et al. 2011). Benthicmicroalgae can skew elemental ratios by “luxury” uptakeduring periods without light and by intercepting remineralizedN and P. Stoichiometric relationships for SRP are affected by
September MarchDelta Bay Delta Bay
0
20
40
60
80S
edim
ent C
hlor
ophy
ll a
mg
m-2
Fig. 7 Sediment chlorophyll a concentrations from Delta and Bayenvironments in September 2011 and March 2012. The box plots showthe median as the line within the box, the box represents the 25–75thpercentiles, and the error bars are the 0–25 and 75–100 percentiles. AKruskal–Wallis one-way analysis of variance on ranks showed that theDelta and Bay locations were significantly different (P<0.01) and thatthere were no temporal differences
Table 3 Compilation of rates of denitrification measured in estuaries andcoastal regions worldwide
Estuary orcoastal region
Denitrificationrate (mmol m−2
day−1)
Reference
Kana et al. (1998)
Laguna Madre, TX 0.48 An et al. (2001)
0.2–0.98 An and Gardner (2002)
Mid-Atlantic Bight 1.74 Laursen andSeitzinger (2002)
Chesapeake Bay 5.4–12 Newell et al. (2002)
Baffin Bay, TX 0.4–1.63 An and Gardner (2002)
Lagoons, Sydney, AU 0.19–1.66 Eyre and Ferguson (2002)
Readings Bay, NewBrunswick, AU
1.2–7.2 Webb and Eyre (2004)
Bremer River, AU 3.78 Cook et al. (2004b)
Huon Estuary, AU 0.01–0.12 Cook et al. (2004a)
Brunswick Estuary, AU 0.38-5.95 Ferguson et al. (2004)
0.07–1.4 Eyre and Ferguson (2005)
Neuse River Estuary, NC 0–6.62 Fear et al. (2005)
Matagorda Bay, TX 0.54+0.1 Gardner et al. (2006)
Nueces Estuary, TX 0.96±0.2 Gardner et al. (2006)
Sapelo Island, GA 0.1–0.2 Porubsky et al. (2009)
Dover Bluff, GA 0–0.4 Porubsky et al. (2009)
Okatee Estuary, SC 0–0.2 Porubsky et al. (2009)
Randers Fjord, DK 5.2–8.0 Risgaard-Petersenet al. (2004)
Norsminde Fjord, DK 4.6–5.7 Risgaard-Petersenet al. (2004)
Delta sites 0.7–0.9 This study
Bay sites 0.6–1.0 This study
All rates reported here were determined using MIMS methodology. Thiscompilation is a subset of all denitrification rates reported by Joye andAnderson (2008). For our Delta sites, we used day length to determine adaily denitrification rate from our light and dark incubations, the rangerepresents the data from the two sample times
1128 Estuaries and Coasts (2014) 37:1120–1133

SRP retention/release on the surface of iron oxide minerals;the predominance of inorganic forms of P in these sediments(Nilsen and Delaney 2005) can result in (1) P retention and (2)possible release under low redox conditions (Lehtoranta et al.2009), changes in salinity (Froelich 1988; Gardolinski et al.2004), and changes in pH (Glibert et al. 2011; Gao et al.2012).
The salinity gradient encompassed in this study did notshow consistent large differences in sediment N or P biogeo-chemistry, although stoichiometric changes along the salinitygradient were expected and observed. Three Bay sites hadsignificant P retention relative to DIN, while all the Delta sitesfrom the light experiments had excess P release relative to N.
Large differences along the spatial (salinity) gradient werealso observed in the form of N flux, i.e., the ratio of NOx/NH4
+. Salinity generally has an opposite effect on N fluxescompared to P fluxes. Whereas P flux rates are often higher insaltwater, rates of NH4
+ flux are higher in freshwater (Jordanet al. 2008 and references therein), and this can accentuate thediscrepancy between N/P ratios along the salinity gradient,and indeed the patterns herein are consistent with this gener-ally expected pattern. Consistent with this idea, comparisonsof the NH4
+/PO43− ratio along the salinity gradient of four
sub-estuaries of Chesapeake Bay (Patuxent, Potomac,Choptank, and Bush Rivers) also revealed in common aswitch from molar ratios >16 to <16 as salinity increased,
-60
-40
-20
0
20
40
60
-1000 -500 0 500 1000 1500 2000 2500
Delta Dark
Bay Dark
Delta Light
O2:P = 106
-60
-40
-20
0
20
40
60
-50 0 50 100 150 200
Delta Dark
Bay Dark
Delta Light
N:P = 16:1
Delta Dark
Bay Dark
Delta Light
O2:N = 106:16
D
E
F
September March
-200
-100
0
100
200
300
-200
-100
0
100
200
300
-1000 -500 0 500 1000 1500 2000 2500 -1000 -500 0 500 1000 1500 2000 2500
Delta Dark
Bay Dark
Delta Light
O2:N = 106:16
-60
-40
-20
0
20
40
-1000 -500 0 500 1000 1500 2000 2500
Delta Dark
Bay Dark
Delta Light
O2:P = 106
-60
-40
-20
0
20
40
-50 0 50 100 150 200
Delta Dark
Bay Dark
Delta Light
N:P = 16:1
DIN Flux mol m-2 h-1μ DIN Flux mol m-2 h-1μ
Sediment O2 Demand mol m-2 h-1μSediment O2 Demand mol m-2 h-1μ
Sediment O2 Demand mol m-2 h-1μSediment O2 Demand mol m-2 h-1μ
SR
P F
lux μm
ol m
-2 h
-1
SR
P F
lux μm
ol m
-2 h
-1
SR
P F
lux μm
ol m
-2 h
-1
SR
P F
lux μm
ol m
-2 h
-1ΣN
Flu
x μm
ol m
-2 h
-1
ΣN F
lux μm
ol m
-2 h
-1
N D
eficient
N R
eten
tio
n
A
B
C
P R
eten
tio
nP
Def
icie
nt
Fig. 8 A–C September 2011 property plots of sediment–water ex-change; sediment oxygen demand has the opposite sign of oxygen fluxes,with negative values for net photosynthetic fluxes. Data include baystations and both light and dark incubations of Delta sediments. A showsa plot of sediment oxygen demand versus ΣN flux (N2–N+NH4
++NOx)showing general agreement, with N efflux in excess of the Redfield ratio.
The SRP fluxes below the Redfield line in B indicate a net retention oforganic P within the sediments. The SRP versus DIN plot (C) indicatesthat SRP is generally lower than predicted by stoichiometry, suggestingthat during sediment nutrient recycling that N is generally in excess of P.D–F: As for A–C except for March 2012
Estuaries and Coasts (2014) 37:1120–1133 1129

with a major breakpoint in the salinity range of 1–4 (Hartzellet al. 2010). Seitzinger et al. (1991b) suggested that lowerdenitrification efficiencies in saltwater compared to freshwaterarise, at least in part, due to decreased adsorption of NH4
+ athigher ionic strengths which leads to poor efficiency ofnitrification.
Potential Delta Impact
Estimated benthic microalgal productivity was surprisinglyhigh in Delta sediments, with a large range in both biomassand productivity. The median rates of O2-based photosynthe-sis estimated here were 795 and 395 μmol O2m
−2 h−1 forSeptember and March, respectively; these data are equivalentto 119 and 57 mg C m−2 day−1 for the day length at eachsample period. While these rates are estimates and moredetailed measurements as a function of irradiance are required,these rates are similar to benthic microalgal photosyntheticrates observed in a wide range of coastal environments(MacIntyre et al. 1996). Guarini et al. (2002) examined po-tential productivity in San Francisco Bay tidal environmentsusing resuspended benthic algae and a modeling extrapola-tion, concluding that spatial variation in benthic productivitywould be large, but measured no in situ or ex situ benthicmicroalgal production.
Jassby et al. (2002) modeled phytoplankton production inthe River Delta with a predicted annual range of 24–131 gCm−2 year−1, equivalent to 66–359mg Cm−2 day−1, based onwater column estimated rates only. Kimmerer et al. (2012)suggested phytoplankton photosynthetic rates were at thelower end of Jassby et al.’s range. Jassby et al. (2002) calcu-lated an average water column chlorophyll a concentration of∼5 mg m−3; to obtain the equivalent median areal concentra-tion of sediment chlorophyll a at the Delta sites measuredhere, a ∼4 m water column would be required. Given that theBay Delta has long been considered a system of exceptionallylow phytoplankton productivity (Jassby et al. 2002; Kimmerer
et al. 2012), the potentially high contribution of benthic pro-ductivity could significantly alter that perspective. Dependingon depth, or the proportion of Delta sediment that has suffi-cient light to support benthic microalgal photosynthesis, ben-thic microalgae could represent an important proportion ofphotosynthesis in the Delta. However, further measurementsof benthic chlorophyll a , photosynthesis, and benthicmicroalgal effects on nutrient flux (e.g., Sundback et al.2000; MacIntyre et al. 2004) are necessary to better constrainthe relative importance of benthic microalgae, particularlyusing controlled light incubations. The role of variable depthand light attenuation in such macrotidal environments requiremodeling efforts to best predict productivity. The lack ofdetailed hypsography necessarily limits the strength of theseconclusions, but inclusion of microalgae in system productiv-ity estimates may be important.
A difference in the eastern delta and the more saline bays isthe presence/absence of benthic microalgae, with systemhypsography and light penetration being major controls onbenthic algal biomass. Regardless of salinity, the supply oflabile organic matter to sediment is also a key determinant ofsediment N fluxes. As in other shallow ecosystems, benthicmicroalgae exert a large influence on nutrient flux dynamics(Tyler et al. 2003). Moreover, the potential nutritional benefitsof benthic microalgae to higher trophic levels (Middelburget al. 2000) may be important to the Bay Delta ecosystemtrophic dynamics.
The release of sediment DIN (the sum of NH4++NO3
−)represent a potentially important N input to the water columnthat can support water column primary production (Fisheret al. 1982). The average rates of DIN release in Delta andBay environments were 1.1 and 1.7 mmol m−2 day−1 inSeptember; using Redfield stoichiometry for C/N, this couldsupport algal productivity of 87 and 135 mg C m−2 day−1,respectively. Thus, in September, such remineralization pro-vides an amount of N roughly equivalent to the nutritionalneeds of the phytoplankton community. In March, there was a
Table 4 Summary of total net N input for the length of Sacramento (SAC) and San Joaquin Rivers (SJR) indicated
Total area River TN yield Daily TN yield Total daily net TN yield Total daily net N yield(km−2) (kg N km−2 year−1) (kg N km−2 day−1) (kg N day−1) (tonnes N day−1)
SAC 61,721 126 0.35 21,602 21
SJR 19,030 135 0.36 6,851 6.8
All data are based on values from the early 2000s, as reported by Sobota et al. (2009)
Table 5 Summary of total net Pinput for the length of Sacramento(SAC) and San Joaquin Rivers(SJR) indicated
All data are based on values fromthe early 2000s, as reported bySobota et al. (2011)
Total area River TP yield Daily TP yield Total dailynet TP yield
Total dailynet P yield
(km−2) (kg P km−2 year−1) (kg P km−2 day−1) (kg P day−1) (tonnes P day−1)
SAC 61,721 21 0.057 3,518 3.5
SJR 19,030 14 0.038 723 0.7
1130 Estuaries and Coasts (2014) 37:1120–1133

net uptake of DIN balanced by N2–N flux that results in apotential loss of N to the phytoplankton community.
The role of Delta sediments in the nutrient balance in thisecosystem can be compared to nutrient loading rates for theBay Delta ecosystem, recognizing that any extrapolations atthe current time are constrained because of indeterminateareas of photosynthetic sediments. We view these calculationsas providing preliminary information on the relative scales ofthese processes. The daily average N2–N flux rate calculatedover 24 h of light/dark conditions from this study ranged from0.7 to 0.9 mmol m−2 day−1; when extrapolated to the wholeDelta area of 2.3 108 m2 (Jassby et al. 2002), 2.2–2.9 t N day−1
would be removed via this process. For comparison, recog-nizing that such estimates at the current time are approximate,the ∼2.5 t N removed via denitrification is roughly one sixth ofthe ∼15 t N day−1 of the wastewater load from the SacramentoRegional Wastewater Facility on the Sacramento River(Glibert et al. 2011). Using the integrative estimates from theLower Sacramento and San Joaquin Rivers provided bySobota et al. (2009; Table 4), denitrification would representone tenth of the total daily net N yield of these two rivers.Using the benthic microalgal requirement for N based onRedfield stoichiometry, a maximum uptake estimate of 2–5 tN day−1 within this community is calculated. Depending onthe area of benthic photosynthetic uptake, this suggests that anamount up to ∼20 % of the inputs could either be removed viadenitrification or taken up by benthic microalgalphotosynthesis.
The benthic microalgal requirement for P would be equiv-alent to 0.3–0.7 t P day−1, with wastewater loading rates fromthe Sacramento Wastewater Treatment Facility of 1–2 tP day−1 (Glibert et al. 2011). Similarly, using the integrativeestimates of total P yields for these rivers provided by Sobotaet al. (2011; Table 5), the removal of P due to benthic uptakewould be in the range of 10-100 %. Although such budgetaryestimates are approximate, they suggest a greater potential forN relative to P to be exported downstream where it maysupport phytoplankton production displaced spatially fromthe upstream sources.
In summary, rates of sediment nutrient fluxes were shownto be significant and dynamic, with regional variability fromthe freshwater delta to the more saline Suisun Bay. Rates ofthe processes measured here fell largely within the broadrange of rates for such processes reported worldwide. Whilerates of N and P fluxes had been hypothesized to be higher inthe late summer than spring, due to the contribution of in-creased microalgae during late summer, many of the fluxeswere, in fact, higher in spring than summer. Extrapolatingfrom both chlorophyll a and O2 fluxes, the sediments maypotentially have large impacts on estimates of total systemproductivity. While these data have provided the first suchestimates of nutrient fluxes for this region of the Bay Delta,these rates are nevertheless limited in scope. They represent
only two seasons and only the more shallow sites of the BayDelta. There is much more to be understood regarding thecontrols on these rates, their regional and seasonal variability,and how such rates may be impacted by biotic changes, suchas those of the invasive clam, Potamocorbula .
Acknowledgments This work was supported by the State and FederalContractors Water Agency, grant 12-12. We thank David Morgan andDavid Bell from the R/V Questuary and Jeffrey Alexander for field andlogistical assistance. Logistical support was also provided by R. Dugdale,F. Wilkerson, and A.E. Parker of the Romberg Tiburon Laboratory, andanalytical support was provided by the Horn Point Analytical ServicesLaboratory. This is contribution number 4851 from the University ofMaryland Center for Environmental Science.
Open AccessThis article is distributed under the terms of the CreativeCommons Attribution License which permits any use, distribution, andreproduction in any medium, provided the original author(s) and thesource are credited.
References
Aller, R.C. 1980. Diagenetic processes near the sediment-water interfaceof Long Island Sound. I. Decomposition and nutrient element geo-chemistry (S, N, P). Advances in Geophysics 22: 237–350.
Alpine, A.E., and J.E. Cloern. 1992. Trophic interactions and directphysical effects control phytoplankton biomass and production inan estuary. Limnology and Oceanography 37: 946–955.
An, S.M., and W.S. Gardner. 2002. Dissimilatory nitrate reduction toammonium (DNRA) as a nitrogen link, versus denitrification as asink in a shallow estuary (LagunaMadre/Baffin Bay, Texas).MarineEcology-Progress Series 237: 41–50.
An, S., W.S. Gardner, and T.M. Kana. 2001. Simultaneous measurementof denitrification and nitrogen fixation using isotope pairing withmembrane inlet mass spectrometry analysis. Applied andEnvironmental Microbiology 67: 1171–1178.
Anderson, J.M. 1982. Effect of nitrate concentration in lake water onphosphate release from the sediment. Water Research 16: 1119–1126.
Banta, G.T., A.E. Giblin, J. Tucker, and J.E. Hobbie. 1994. Comparisonof two indirect methods for estimating denitrification rates forBuzzards Bay, Massachusetts. In Changes in fluxes in estuaries:implications from science to management, ed. K.R. Dyer and R.J.Orth, 203–209. Fredensborg: Olsen & Olsen.
Berg, G.M., P.M. Glibert, N.O.G. Jorgensen, M. Balode, and I. Purina.2001. Variability in inorganic and organic nitrogen uptake associat-ed with riverine nutrient input in the Gulf of Riga, Baltic Sea.Estuaries 24: 176–186.
Boynton, W.R., and W.M. Kemp. 2008. Estuaries. In Nitrogen in themarine environment, eds. Capone, D.G, Bronk, DA, Mulholland,M.R., and E.J. Carpenter, 809–866. New York: Academic Press.
Caffrey, J.M. 1995. Spatial and seasonal patterns in sediment nitrogenremineralization and ammonium concentrations in San FranciscoBay, California. Estuaries 18: 219–233.
Caffrey, J.M., N. Harrington, and B.B. Ward. 2002. Biogeochemicalprocesses in a small California estuary. 1. Benthic fluxes and porewater constituents reflect high nutrient freshwater inputs. MarineEcology-Progress Series 233: 39–53.
Caffrey, J.M., J.T. Hollibaugh, N. Bano, and J. Haskins. 2010. Effects ofupwelling on short-term variability in microbial and biogeochemical
Estuaries and Coasts (2014) 37:1120–1133 1131

processes in estuarine sediments from Elkhorn Slough, California,USA. Aquatic Microbial Ecology 58: 261–271.
Caraco, N., J. Cole, and G.E. Likens. 1990. A comparison of phosphorusimmobilization in sediments of freshwater and coastal marine sys-tems. Biogeochemistry 9: 277–290.
Chambers, R.M., J.W. Fourqurean, J.T. Hollibaugh, and S.M.Vink. 1995.Importance of terrestrially-derived, particulate phosphorus to phos-phorus dynamics in a west-coast estuary. Estuaries 18: 518–526.
Cook, P.L.M., E.C.V. Butler, and B.D. Eyre. 2004a. Carbon and nitrogencycling on intertidal mudflats of a temperate Australian estuary. I.Benthic metabolism. Marine Ecology-Progress Series 280: 25–38.
Cook, P.L.M., B.D. Eyre, R. Leeming, and E.C.V. Butler. 2004b. Benthicfluxes of nitrogen in the tidal reaches of a turbid, high-nitrate sub-tropical river. Estuarine, Coastal and Shelf Science 59: 675–685.
Cornwell, J.C., W.M. Kemp, and T.M. Kana. 1999. Denitrification incoastal ecosystems: environmental controls and aspects of spatialand temporal scale. Aquatic Ecology 33: 41–54.
Dollar, S.J., S.V. Smith, S.M. Vink, S. Obrebski, and J.T. Hollibaugh.1991. Annual cycle of benthic nutrient fluxes in Tomales Bay,California, and conttributions of the benthos to total ecosystemmetabolism. Marine Ecology Progress Series 79: 115–125.
Dugdale, R.C., F.P. Wilkerson, V.E. Hogue, and A. Marchi. 2007. Therole of ammonium and nitrate in spring bloom development in SanFrancisco Bay. Estuarine, Coastal and Shelf Science 73: 17–29.
Eyre, B.D., and A.J.P. Ferguson. 2002. Comparison of carbon productionand decomposition, benthic nutrient fluxes and denitrification inseagrass, phytoplankton, benthic microalgae- and macroalgae-dominated warm-temperate Australian lagoons. Marine Ecology-Progress Series 229: 43–59.
Eyre, B.D., and A.J.P. Ferguson. 2005. Benthic metabolism and nitrogencycling in a subtropical east Australian Estuary (Brunswick): tem-poral variability and controlling factors. Limnology andOceanography 50: 81–96.
Fear, J.M., S.P. Thompson, T.E. Gallo, and H.W. Paerl. 2005.Denitrification rates measured along a salinity gradient in the eutrophicNeuse River Estuary, North Carolina, USA. Estuaries 28: 608–619.
Ferguson, A.J.P., B.D. Eyre, and J.M. Gay. 2004. Benthic nutrient fluxesin euphotic sediments along shallow sub-tropical estuaries, northernNew SouthWales, Australia. Aquatic Microbial Ecology 37: 219–235.
Fisher, T.R., P.R. Carlson, and R.T. Barber. 1982. Sediment nutrientregeneration in three North Carolina estuaries. Estuarine, Coastaland Shelf Science 14: 101–116.
Froelich, P.N. 1988. Kinetic control of dissolved phosphate in naturalrivers and estuaries: a primer on the phosphate buffer mechanism.Limnology and Oceanography 33: 649–668.
Gao, Y., J.C. Cornwell, D.K. Stoecker, and M.S. Owens. 2012. Effects ofcyanobacterial-driven pH increases on sediment nutrient fluxes andcoupled nitrification-denitrification in a shallow fresh water estuary.Biogeosciences 9: 2697–2710.
Gardner, W.S., S.P. Seitzinger, and J.M. Malczyk. 1991. The effect of seasalts on the forms of nitrogen released for estuarine and freshwatersediments: does ion pairing affect ammonium flux? Estuaries 14:157–166.
Gardner, W.S., M.J. McCarthy, D. Sobolev, A. Soonmo, K.S. Sell, and D.Brock. 2006. Nitrogen fixation and dissimilatory nitrate reduction toammonium (DNRA) support nitrogen dynamics in Texas estuaries.Limnology and Oceanography 51: 558–568.
Gardolinski, P., P.J. Worsfold, and I.D. McKelvie. 2004. Seawater in-duced release and transformation of organic and inorganic phospho-rus from river sediments. Water Research 38: 688–692.
Glibert, P.M. 2010. Long-term changes in nutrient loading and stoichi-ometry and their relationships with changes in the food web anddominant pelagic fish species in the San Francisco Estuary,California. Reviews in Fisheries Science 18: 211–232.
Glibert, P.M., D. Fullerton, J.M. Burkholder, J.C. Cornwell, and T.M.Kana. 2011. Ecological stoichiometry, biogeochemical cycling,
invasive species, and aquatic food webs: San Francisco Estuaryand comparative systems. Reviews in Fisheries Science 19: 358–417.
Glibert, P.M., J.M. Burkholder, and T.M. Kana. 2012. Recent insightsabout relationships between nutrient availability, forms, and stoichiom-etry, and the distribution, ecophysiology, and foodweb effects of pelagicand benthic Prorocentrum species. Harmful Algae 14: 231–259.
Greene, V.E., L.J. Sullivan, J.K. Thompson, and W.J. Kimmerer. 2011.Grazing impact of the invasive clam Corbula amurensis on themicroplankton assemblage of the northern San Francisco Estuary.Marine Ecology-Progress Series 431: 183–193.
Guarini, J.M., J.E. Cloern, J. Edmunds, and P. Gros. 2002.Microphytobenthic potential productivity estimated in three tidalembayments of the San Francisco Bay: a comparative study.Estuaries 25: 409–417.
Hartzell, J.L., T.E. Jordan, and J.C. Cornwell. 2010. Phosphorus burial insediments along the salinity gradient of the Patuxent River, asubestuary of the Chesapeake Bay (USA). Estuaries and Coasts33: 92–106.
Hochard, S., C. Pinazo, C. Grenz, J.L.B. Evans, and O. Pringault. 2010.Impact of microphytobenthos on the sediment biogeochemical cy-cles: a modeling approach. Ecological Modelling 221: 1687–1701.
Jassby, A. 2008. Phytoplankton in the upper San Francisco Estuary:recent biomass trends, their causes and their trophic significance.San Francisco Estuary and Watershed Science . http://escholarship.org/uc/item/71h077r1. Accessed 2008
Jassby, A.D., W.J. Kimmerer, S.G. Monismith, C. Armor, J.E. Cloern,T.M. Powell, J.R. Schubel, and T.J. Vendlinski. 1995. Isohalineposition as a habitat indicator for estuarine populations. EcologicalApplications 5: 272–289.
Jassby, A.D., J.E. Cloern, and B.E. Cole. 2002. Annual primary produc-tion: patterns and mechanisms of change in a nutrient-rich tidalecosystem. Limnology and Oceanography 47: 698–712.
Jordan, T.E., J.C. Cornwell, W.R. Boynton, and J.T. Anderson. 2008.Changes in phosphorus biogeochemistry along an estuarine salinitygradient: the iron conveyer belt. Limnology and Oceanography 53:172–184.
Joye, S. B., and I. C. Anderson. 2008. Nitrogen cycling in coastalsediments, p. 868-915. In Nitrogen in the marine environment ,2nd edition, eds. Capone, D.G., Bronk, D.A., Mulholland, M.R.,and E. J. Carpenter. New York: Academic Press.
Kana, T.M., and D.L. Weiss. 2004. Comment on “Comparison of isotopepairing and N-2: Ar methods for measuring sediment denitrifica-tion”. By Eyre, B.D., Rysgaard, S., Daisgaard, T., and P. BondoChristensen. 2002. Estuaries 25: 1077–1087. Estuaries 27:173–176.
Kana, T.M., C. Darkangelo, M.D. Hunt, J.B. Oldham, G.E. Bennett, andJ.C. Cornwell. 1994. Membrane inlet mass spectrometer for rapidhigh-precision determination of N2, O2, and Ar in environmentalwater samples. Analytical Chemistry 66: 4166–4170.
Kana, T.M., M.B. Sullivan, J.C. Cornwell, and K. Groszkowski. 1998.Denitrification in estuarine sediments determined bymembrane inletmass spectrometry. Limnology and Oceanography 42: 334–339.
Kemp, W.M., W.R. Boynton, J.E. Adolf, D.F. Boesch, W.C. Boicourt, G.Brush, J.C. Cornwell, T.R. Fisher, P.M. Glibert, J.D. Hagy, L.W.Harding, E.D. Houde, D.G. Kimmel, W.D. Miller, R.I.E. Newell,M.R. Roman, E.M. Smith, and J.C. Stevenson. 2005. Eutrophicationof Chesapeake Bay: historical trends and ecological interactions.Marine Ecology-Progress Series 303: 1–29.
Kimmerer, W.J., A.E. Parker, U.E. Lidstrom, and E.J. Carpenter. 2012.Short-term and interannual variability in primary production in thelow-salinity zone of the San Francisco Estuary. Estuaries andCoasts 35: 913–929.
Kuwabara, J.S., Topping, B.R., Parchaso, F., Engelstad, A.C., and V. E.Greene. 2009. Benthic flux of nutrients and trace metals in thenorthern component of San Francisco Bay, California: U.S.
1132 Estuaries and Coasts (2014) 37:1120–1133
Geological Survey Open-File Report 2009-1286, p. 14. U.S.Geological Survey.
Laursen, A.E., and S.P. Seitzinger. 2002. The role of denitrification innitrogen removal and carbon mineralization in Mid-Atlantic Bightsediments. Continental Shelf Research 22: 1397–1416.
Lehtoranta, J., P. Ekholm, and H. Pitkanen. 2009. Coastal eutrophicationthresholds: a matter of sediment microbial processes. Ambio 38:303–308.
MacIntyre, H.L., R.J. Geider, and D.C.Miller. 1996. Microphytobenthos:the ecological role of the “secret garden” of unvegetated, shallow-water marine habitats 0.1. Distribution, abundance and primaryproduction. Estuaries 19: 186–201.
MacIntyre, H.L., M.W. Lomas, J. Cornwell, D.J. Suggett, C.J. Gobler,E.W. Koch, and T.M. Kana. 2004. Mediation of benthic-pelagiccoupling by microphytobenthos: an energy- and material-basedmodel for initiation of blooms of Aureococcus anophagefferens.Harmful Algae 3: 403–437.
Middelburg, J.J., C. Barranguet, H.T.S. Boschker, P.M.J. Herman, T.Moens, and C.H.R. Heip. 2000. The fate of intertidalmicrophytobenthos carbon: an in situ 13C labeling study.Limnology and Oceanography 45: 1224–1234.
Mortimer, C.H. 1971. Chemical exchanges between sediments and waterin the Great Lakes—speculations on probable regulatory mecha-nisms. Limnology and Oceanography 16: 387–404.
Newell, R.I.E., J.C. Cornwell, and M.S. Owens. 2002. Influence ofsimulated bivalve biodeposition and microphytobenthos on sedi-ment nitrogen dynamics: a laboratory study. Limnology andOceanography 47: 1367–1379.
Nilsen, E.B., and M.L. Delaney. 2005. Factors influencing the biogeo-chemistry of sedimentary carbon and phosphorus in theSacramento–San Joaquin Delta. Estuaries 28: 653–663.
Nixon, S.W., J.W. Ammerman, L.P. Atkinson, V.M. Berounsky, G.Billen, W.C. Boicourt, W.R. Boynton, T.M. Church, D.M. DiToro,R. Elmgren, J.H. Garber, A.E. Giblin, R.A. Jahnke, N.J.P. Owens,M.E.Q. Pilson, and S.P. Seitzinger. 1996. The fate ofnitrogen andphosphorus at the land-sea margin of the North Atlantic Ocean.Biogeochemistry 35: 141–180.
Owens, M.S. 2009. Nitrogen cycling and controls on denitrification inmesoahaline sediment of Chesapeake Bay. College Park: MEESProgram, University of Maryland.
Parker, A.E., V.E. Hogue, F.P.Wilkerson, andR.C. Dugdale. 2012. The effectof inorganic nitrogen speciation on primary production in the SanFrancisco Estuary. Estuarine, Coastal and Shelf Science 104: 91–101.
Pelegri, S.P., L.P. Nielsen, and T.H. Blackburn. 1994. Denitrification inestuarine sedimentstimulated by the irrigation activity of the amphi-pod Corophium volutator. Marine Ecology Progress Series 105:285–290.
Porubsky, W.P., N.B. Weston, and S.B. Joye. 2009. Benthic metabolismand the fate of dissolved inorganic nitrogen in intertidal sediments.Estuarine, Coastal and Shelf Science 83: 392–402.
Risgaard-Petersen, N., R.L. Meyer, M. Schmid, M.S.M. Jetten, A.Enrich-Prast, S. Rysgaard, and N.P. Revsbech. 2004. Anaerobic
ammonium oxidation in an estuarine sediment. Aquatic MicrobialEcology 36: 293–304.
Rysgaard, S., N. Risgaard-Petersen, N.P. Sloth, K. Jensen, and L.P.Nielsen. 1994. Oxygen regulation of nitrification and denitrificationin sediments. Limnology and Oceanography 39: 1643–1652.
Seitzinger, S.P. 1991. The effect of pH on the release of phosphorus fromPotomac estuary sediments: implications for blue-green algalblooms. Estuarine, Coastal and Shelf Science 33: 409–418.
Seitzinger, S.P., W.S. Gardner, and A.L. Spratt. 1991. The effect ofsalinity on ammonium sorption in aquatic sediments: implicationsfor benthic nutrient recycling. Estuaries 14: 167–174.
Sobota, D.J., J.A. Harrison, and R.A. Dahlgren. 2009. Influences ofclimate, hydrology, and land use on input and export of nitrogenin California watersheds. Biogeochemistry. doi:10.1007/s10533-009-9307-y.
Sobota, D.J., J.A. Harrison, and R.A. Dahlgren. 2011. Linking dissolvedand particulate phosphorus export in rivers draining California’sCentral Valley with anthropgenic sources at the regional scale.Journal of Environmental Quality 40: 1290–1302.
Sundback, K., A. Miles, and E. Goransson. 2000. Nitrogen fluxes,denitrification and the role of microphytobenthos in microtidalshallow-water sediments: an annual study. Marine Ecology-Progress Series 200: 59–76.
Tyler, A.C., K.J. McGlathery, and I.C. Anderson. 2003. Benthic algaecontrol sediment-water column fluxes of organic and inorganicnitrogen compounds in a temperate lagoon. Limnology andOceanography 48: 2125–2137.
Van Heukelem, L., A.J. Lewitus, T.M. Kana, and N.E. Craft. 1994.Improved separations of phytoplankton pigmets usingtemperature-controlled high performance liquid chromatorgrapy.Marine Ecology Progress Series 114: 303–313.
Van Nieuwenhuyse, E. 2007. Response of summer chlorophyll concen-tration to reduced total phosphorus concentration in the Rhine River(Netherlands) and the Sacramento–San Joaquin Delta (California,USA). Canadian Journal of Fisheries and Aquatic Sciences 64:1529–1542.
Wanger, O.W. 2007a. Findings of fact and conclusions of law re interimremedies re: delta smelt ESA remand and reconsultation . Case 1:05-cv-01207-OWW-GSA, Document 01561. United States DistrictCourt, Eastern District of California, Fresno, California.
Wanger, O.W. 2007b. Interim remedial order following summary judg-ment and evidentiary hearing . Case 1:05-cv-01207-OWW-GSA,Document 01560. United States District Court, Eastern District ofCalifornia, Fresno, California.
Webb, A.P., and B.D. Eyre. 2004. Effect of natural populations ofburrowing thalassinidean shrimp on sediment irrigation, benthicmetabolism, nutrient fluxes and denitrification. Marine Ecology-Progress Series 268: 205–220.
Williams, J.D.H., J.K. Syers, S.S. Shukla, R.F. Harris, and D.E.Armstrong. 1971. Levels of inorganic and total phosphorus in lakesediments as related to other sediment paramenters. EnvironmentalScience and Technology 5: 1113–1120.
Estuaries and Coasts (2014) 37:1120–1133 1133
Related Documents