Nutri-Metabolomics Effect and Exposure Markers of Apple and Pectin Intake Mette Kristensen PhD Thesis 2011 Department of Food Science Department of Human Nutrition Faculty of Life Science, University of Copenhagen National Food Institute, Technical University of Denmark

Welcome message from author
This document is posted to help you gain knowledge. Please leave a comment to let me know what you think about it! Share it to your friends and learn new things together.
Transcript
Nutri-Metabolomics
Effect and Exposure Markers of Apple and Pectin Intake
Mette Kristensen
PhD Thesis
2011
Department of Food Science
Department of Human Nutrition
Faculty of Life Science, University of Copenhagen
National Food Institute, Technical University of Denmark
Title:
Nutri-Metabolomics. Effect and Exposure Markers of Apple and Pectin Intake.
Supervisors:
Professor Søren Balling Engelsen
Institute of Food Science, Faculty of Life Science, University of Copenhagen, Denmark
Professor Lars Ove Dragsted
Institute of Human Nutrition, Faculty of Life Science, University of Copenhagen,
Denmark
Opponents:
Associate Professor Tine Tolstrup, Institute of Human Nutrition, University of
Copenhagen, Denmark
Dr Hector Keun, Imperial College London, UK
Professor Augustin Scalbert, International Center for Research on Cancer, France
PhD Thesis · 2011 © Mette Kristensen
Printed by SL Grafik, Frederiksberg C, Denmark
ISBN: 978-87-7611-436-7

I
PREFACE
The first year of this PhD project was conducted at Department of Toxicology and Risk
Assessment, The National Food Institute, Technical University of Denmark (FOOD, DTU).
The two last years of the project were carried out at Quality and Technology (Q&T),
Department of Food Science, Faculty of Life Science, and in collaboration with Department
of Human Nutrition (IHE), Faculty of Life Science, University of Copenhagen. The project
has been sponsored by a large European project called ISAFRUIT (Thematic Priority 5 –
Food Quality and Safety of the 6th Framework Programme of RTD), and by SYSDIET, a
Nordic Centre of Excellence in systems biology supported by the Nordic Council of
Ministers, as well as NuBI, a Nutrigenomics data-integration grant from the Danish Ministry
of Food, Agriculture and Fisheries. ISAFRUIT aims to reveal the biological explanation for
the epidemiologically well-established health effects of fruits, and apples were selected as the
study subject. SYSDIET support the work with multivariate analyses and NuBI supports the
establishment of various ‘omics platforms. The project has been supervised by Professor
Søren Balling Engelsen and Professor Lars Ove Dragsted from University of Copenhagen.
I am grateful to my two supervisors, Søren, for your valuable knowledge, help and inspiration
in regard to spectroscopy and multivariate analysis. Lars, for all kind of support during this
process and for always keeping your door open for a fruitful and exciting scientific
discussion.
I would like to thank my colleagues at Q&T, IHE and FOOD for a very pleasant, humorous
and professional working environment. Special thanks to Flemming and Francesco for
introducing me to NMR analysis and to my research group at IHE for valuable discussions
and cheerful times.
I am grateful for the support from friends and family during this process and to Louise and
Petrine for proof reading. Finally, thanks to Casper and Noah for your patience and for taking
my mind elsewhere.
II
Summary
Consumption of nutrients and other bioactive compounds from food interact with numerous
targets, metabolic pathways and physiological functions in the organism and hereby
potentially reduce or increase the risk of diseases. Analytical methods that can handle
multiple responses may therefore seem particular beneficial compared to the univariate
approaches most often used in nutrition research. Metabolomics is a new technique that
allows measuring a large number of metabolites present in a given biological sample and the
metabolic effect of e.g. a specific food intake can hereby be explored in a more global way
than with traditional methods.
The aim of this project has been the establishment of a metabolomics platform utilising Mass
Spectrometry (MS), Nuclear Magnetic Resonance (NMR) spectroscopy and chemometrics to
investigate health potentials of apple and apple-pectin intake.
An explorative metabolomics approach was employed in Paper I to identify exposure and
effect markers of 24 Fisher rats fed a diet supplemented with fresh apple or apple-pectin for 4
weeks. Urine was analyzed by liquid chromatography and mass spectrometry (LC-MS) and
metabolites that responded to the apple or pectin diets were selected and classified as either
exposure or effect markers based on response patterns. Quinic acid, m-coumaric acid and
(-)epicatechin were identified as exposure markers and hippuric acid as one of the effect
markers of apple intake. Pyrrole-2-carboxylic acid and 2-furoylglycine were identified as
pectin exposure markers while 2-piperidinone was recognized as a pectin effect marker. None
of these metabolites have been related to intake of pectin or other fibre products before. The
metabolism and potential health aspects of these markers are discussed in this paper.
A targeted NMR-based metabolomics approach was employed in Paper II as an alternative,
fast and reliable method to quantify cholesterol distribution in the different lipoprotein
fractions in rats. Plasma from two rat studies (n = 68) was used in determining the lipoprotein
profile by an established ultracentrifugation method and proton NMR spectra of replicate
samples were obtained. From the ultracentrifugation reference data and the NMR spectra,
interval partial least-square (iPLS) regression models were constructed in order to predict the
amount of cholesterol in high, low and very low density lipoprotein (HDL, LDL and VLDL)
as well as the total plasma cholesterol. The iPLS approach yielded fine regression models and
was used to determine HDL, LDL, VLDL and total cholesterol in a study where 24 rats had
been supplemented with two doses of apple-powder. A dose of 20% apple-powder
significantly lowered HDL cholesterol. Thus, this method seems to be a strong and efficient
way to quantify lipoprotein cholesterol in rat studies.

III
In Paper III the NMR-based PLS regression models developed in Paper II were used to
investigate the cholesterol distribution in plasma lipoproteins in the same rat study as
described in Paper I. Additionally, faecal bile acid excretion, plasma activities of selected
hepatic enzymes and gene expression of antioxidant enzymes in the liver were investigated.
LDL, HDL and total cholesterol as well as total and primary bile acids were significantly
reduced in the apple group. Secondary bile acids showed a significant reduction after apple
intake. Pectin did not exhibit any effects on cholesterol metabolism but significantly up-
regulated plasma alkaline phosphatase (AlP). Both apple and apple-pectin intake revealed
significant effects on genes involved in the hepatic glutathione redox cycle, indicating a
higher capability to handle oxidative stress.
Overall, these investigations indicate that fresh apple may have health beneficial effects on
cholesterol metabolism but from our results pectin cannot be appointed as the major decisive
apple component that causes this effect. However, the investigations were conducted with rat
models and it is important to stress cautious extrapolation to humans. The utilisation of the
MS and NMR-based metabolomics approaches have served as competent platforms during
these studies and the metabolomics technology seems very promising in further unravelling of
the interplay between dietary intake and health status.

IV
Resumé
Indtag af næringsstoffer og andre bioaktive stoffer fra fødevarer påvirker adskillige
metaboliske processer og fysiologiske funktioner i organismen og kan herigennem potentielt
øge eller minske risikoen for at udvikle sygdom. Analytiske metoder, der kan håndtere mange
responser samtidigt, er derfor særligt attraktive i forhold til de univariate metoder, som oftest
anvendes i ernæringsforskning. Metabolomics er en ny teknik, hvor ideen er at måle
størsteparten af de stoffer/metaboliter, der er tilstede i en given biologisk prøve. Herved kan
den metaboliske effekt af f.eks. en bestemt fødevare undersøges i en større helhed, end det er
muligt med traditionelle metoder.
Formålet med dette projekt har været at etablere en metabolomics platform, der anvender
massespektrometri (MS), kernemagnetisk resonans (NMR) spektroskopi og kemometri for
herigennem at undersøge sundhedsrelaterede egenskaber af æble og æble pektin.
En eksplorativ metabolomics tilgang blev anvendt i Artikel I for at identificere eksponerings
og effekt markører fra 24 Fisher rotter der havde indtaget en kost tilsat frisk æble eller æble
pektin gennem 4 uger. Urinen blev analyseret vha. væske-kromatografi og massespektrometri
(LC-MS), og metabolitter, der reflekterede kosten tilsat æble eller pektin, blev udvalgt og
klassificeret som enten eksponerings eller effekt markører på baggrund af deres respons
mønster. Quinasyre, m-cumarsyre og (-)epicatechin blev identificeret som eksponerings
markører og hippursyre som en af effekt markørerne for æbleindtag. Pyrrol-2-carboxylsyre
and 2-furoylglycin blev identificeret som pektin eksponerings markører, hvorimod 2-
piperidinon blev fundet som en effekt markør. Ingen af disse har tidligere været relateret til
indtag af pektin eller andre fiber produkter. Metabolismen og potentielle sundhedsmæssige
aspekter af disse markører diskuteres i artiklen.
En kvantitativ NMR-baseret metabolomics tilgang blev anvendt i Artikel II som en alternativ,
hurtig og pålidelig metode til at kvantificere kolesterol-fordelingen i forskellige lipoprotein
fraktioner i plasma fra rotter. Plasma fra to rottestudier (n = 68) blev anvendt til at bestemme
lipoprotein profilen vha. en veletableret ultracentrifugerings metode og desuden blev proton
NMR spektrer optaget af den samme prøve. Interval partial least-square (iPLS) regressions
modeller blev opbygget ud fra ultracentrifugering reference data og fra NMR spektrene for at
bestemme mængden af kolesterol i høj-, lav- og meget lav densitet lipoproteiner (HDL, LDL
and VLDL) og total kolesterol i plasma. iPLS-metoden resulterede i gode regressions
modeller, og blev brugt til at bestemme HDL, LDL, VLDL og total kolesterol i et forsøg, hvor
24 rotter havde fået tilsat to doser af tørret æble pulver til fodret. En dosis på 20% æble pulver

V
reducerede signifikant HDL kolesterol. Den anvendte metode vurderes som en kompetent og
effektiv måde at kvantificere kolesterol i de forskellige lipoprotein fraktioner i rotte studier.
I Artikel III blev de NMR-baserede PLS regressions–modeller, der var udviklet i Artikel II,
brugt til at undersøge kolesterol-fordelingen i plasma lipoproteiner i det samme rottestudie,
som er beskrevet i Artikel I. Derudover blev galdesyre udskillelse i fæces undersøgt samt
aktiviteten af udvalgte plasma enzymer og genekspression af antioxidant enzymer i leveren.
LDL, HDL and total kolesterol samt total og primære galdesyrer var signifikant reduceret i
æble gruppen. Sekundære galdesyrer viste en signifikant sænkning efter æble indtag. Pektin
havde ingen effekter på kolesterol metabolisme, men opregulerede signifikant alkalisk
fosfatase (AlP) i plasma. Både æble- og pektin-indtag viste signifikante effekter på gener
involveret i leverens glutathion redox cyklus, hvilket tolkes som en forbedret evne til at
håndtere oxidativt stress.
Forskningen præsenteret i denne afhandling antyder at indtag af frisk æble har fordelagtige
helbredsmæssige effekter på kolesterol metabolisme, og ud fra resultaterne ser pektin ikke ud
til at være den afgørende komponent i æble, der inducer denne effekt. Undersøgelserne
præsenteret her er foretaget i rotter, og der må udvises forsigtighed med at overføre
resultaterne direkte til mennesker. Anvendelsen af MS- og NMR-baseret metabolomics har i
disse undersøgelser vist sig som kompetente analytiske platforme, og metabolomics
teknologien som helhed vurderes som meget lovende i forhold til den fremtidige forståelse af
samspillet mellem kost-indtag og sundhedsstatus.

VI
List of publications
Paper IKristensen, M., Engelsen, S.B. and Dragsted, L.O. 2010. LC-MS metabolomics top-down
approach reveals new exposure and effect biomarkers of apple and apple-pectin intake.
Submitted to Metabolomics.1
Paper IIKristensen, M., Savorani F., Ravn-Haren, G., Poulsen, M., Markowski, J., Larsen, F.H.,
Dragsted, L.O. and Engelsen, S.B. 2010. NMR and interval PLS as reliable methods for
determination of cholesterol in rodent lipoprotein fractions. Metabolomics, 6:129–136.
Paper IIIKristensen, M., Jensen, R.I., Krath, B.N, Markowsky, J., Poulsen, M. and Dragsted, L.O.
2010. Effects of apple and apple-pectin feeding on cholesterol metabolism and antioxidant
response in healthy rats. Submitted to British Journal of Nutrition.
Supplemental materialGürdeniz, G., Kristensen, M., Skov, T., Bro R. and Dragsted, L.O. The effect of LC-MS data
processing methods on the selection of plasma biomarkers in fed vs. fasted rats. 2011.
Submitted to Analytical and Bioanalytical Chemistry.
1This paper was accepted after submission of the thesis and before press. Some changes have been made in the
manuscript during the revision process and to avoid disturbance in relation to the thesis context the accepted
version is enclosed as supplemental material instead of replacing the submitted manuscript.

VII
Other publications by the author
Roldán-Marín, E., Krath, B.N., Jensen, R.I., Kristensen, M., Poulsen, M., Cano, M.P.,
Sánchez-Moreno, C. and Dragsted, L.O. 2010. An onion by-product affects plasma lipids in
healthy rats. Journal of Agricultural and Food Chemistry, 58(9), 5308-5314.
Dragsted, L.O., Tjønneland, A., Ravn-Haren, G., Kristensen, M., Poulsen, M., Plocharsky,
W., Bügel, S.G. 2008. Health benefits of increased fruit intake - integrating observational
studies with experimental studies on fruit health and nutrigenomics. In: Increasing fruit
consumption to improve health: ISAFRUIT Forum. Belgium: International Society for
Horticultural Science (ISHS), 55-69 (Scripta Horticulturae; 8).
Kristensen, M., Krogholm, K.S., Frederiksen, H., Duus F., Cornett C., Bügel, S.H. and
Rasmussen S.E. 2007. Improved synthesis methods of standards for quantitative
determination of total isothiocyanates from broccoli in human urine. Journal of
Chromtogarphy B, 852: 229–234.
Kristensen, M., Krogsholm, K.S., Frederiksen, H., Bügel, S.H. and Rasmussen, S.E. 2007.
Urinary excretion of total isothiocyanates from cruciferous vegetables shows high dose-
response correlation and may be a useful biomarker of ITC exposure. European Journal of
Nutrition, 46: 377–382.

VIII
List of abbreviations
2D Two dimensional
3D Three dimensional
AcCoA Acetyl coenzyme A
BA Bile acids
C Cholesterol
CETP Cholesterol ester transfer protein
CoA Coenzyme A
COMT Catechol-O-methyltransferases
CVD Cardiovascular disease
EDTA Ethylenediaminetetraacetic acid
ESI Electrospray ionisation
FID Free induction decay
GC Gas chromatography
HDL High-density lipoprotein
HMDB Human Metabolome Data Base
HMG-CoA 3-Hydroxy-3-methylglutaryl coenzyme A
iPLS Interval partial least square
LC Liquid chromatography
LDL Low-density lipoprotein
LDL-R Low-density lipoprotein cholesterol receptor
LPH Lactase phloridizin hydrolase
MLR Multiple linear regression
MS Mass spectrometry
m/z Mass to charge ratio
NMR Nuclear magnetic resonance
IX
PCA Principal component analysis
PLS Partial least square
PLS-DA Partial least square discriminate analysis
QTOF Quadropole time-of-flight
RCT Reverse cholesterol transport
RF Radio frequency
RMSE Root mean square error
SCFA Short chain fatty acid
SULT Sulfotransferase
SGLT1 Sodium-dependent glucose transporter 1
TAG Triacylglycerides
TOF Time-of-flight
TSP 3-Trimethylsilylpropionic acid
UGTs Uridine-5´-diphosphate glucuronosyltransferases
UPLC Ultra high pressure liquid chromatography
VLDL Very low-density lipoprotein
X
Table of contents
1 Introduction............................................................................................................................. 1
1.1 Background................................................................................................................................................................................................................ 1
1.2 AiM of the thesis................................................................................................................................................................................................ 2
1.3 Thesis outline......................................................................................................................................................................................................... 2
2 Metabolomics ............................................................................................................................4
2.1 metabolomics in Nutrition studies.....................................................................................................................4
2.1.1 Non-targeted analysis.................................................................................................... 5
2.1.2 Targeted analysis........................................................................................................... 5
2.2 The metabolomics pipeline ...........................................................................................................................................................5
2.3 Study design and sampling strategies .......................................................................................................... 6
2.3.1 Study design................................................................................................................... 6
2.3.2 Sample collection ........................................................................................................... 7
2.3.3 Sample preparation....................................................................................................... 8
2.4 Analytical platforms...........................................................................................................................................................................8
2.4.1 UPLC-QTOF-MS.......................................................................................................... 9
2.4.1.1 Ultra high Pressure Liquid Chromatography ............................................................. 9
2.4.1.2 Quadropole Time-of-Flight Mass Spectrometry ......................................................... 9
2.4.1.3 Application of UPLC-QTOF-MS in metabolomics experiments ............................... 11
2.4.21H NMR spectroscopy ................................................................................................. 12
2.4.2.1 Nuclear magnetic resonance spectroscopy ............................................................... 12
2.4.2.2 Application of NMR in metabolomics experiments ................................................... 13
2.5 Data extraction and preprocessing..............................................................................................................14
2.5.1 Data extraction of LC-QTOF-MS data ..................................................................... 14
2.5.2 Data extraction of NMR data ..................................................................................... 16
2.5.3 Normalisation, centering and scaling of metabolomics data ................................... 16
2.6 Data analysis.........................................................................................................................................................................................................18
2.6.1 Principal component analysis..................................................................................... 18
2.6.2 Partial least square regression ................................................................................... 19
2.6.2.1 Validation.................................................................................................................. 20
2.6.3 Variable selection ........................................................................................................ 21
2.7 Metabolite identification......................................................................................................................................................22
2.8 Biological interpretation..................................................................................................................................................24

XI
3 Potential disease prevention from apple intake....................................25
3.1 Composition of an apple...................................................................................................................................................................25
3.1.1 Fibres in apples............................................................................................................ 25
3.1.2 Phytochemicals in apples ............................................................................................ 26
3.2 Absorption, metabolism and mechanism of action of apple
components............................................................................................................................................................................................................27
3.2.1 Fibre ............................................................................................................................. 27
3.2.1.1 Absorption and metabolism....................................................................................... 27
3.2.1.2 Mechanism of action inducing physiological effects of apple fibre .......................... 27
3.2.2 Phenolics and polyphenols.......................................................................................... 29
3.2.2.1 Absorption and metabolism....................................................................................... 29
3.2.2.2 Mechanism of action inducing physiological effects of apple polyphenols............... 32
4 Results and Discussion ...................................................................................................34
4.1 Methodological consideration........................................................................................................................... 34
4.1.1 Study design................................................................................................................. 34
4.1.2 Rat studies and extrapolation to humans.................................................................. 34
4.1.3 Considerations with regard to selected markers ...................................................... 35
4.2 Evaluation of effects of apple and pectin intake..........................................................36
4.2.1 Effect of apple and pectin on cholesterol metabolism markers............................... 36
4.2.1.1 Apple and cholesterol metabolism ............................................................................ 36
4.2.1.2 Pectin and cholesterol metabolism............................................................................ 38
4.2.1.3 Pectin as an isolated apple component ..................................................................... 38
4.2.2 Metabolomics exposure and effect markers of apple and pectin intake ................ 39
4.2.2.1 Apple exposure and effect markers ........................................................................... 39
4.2.2.2 Pectin exposure and effect markers........................................................................... 40
4.2.2.3 Catecholamine metabolism ....................................................................................... 40
4.2.2.4 Cholesterol metabolism............................................................................................. 41
4.2.3 Why does an apple a day keep the doctor away? ..................................................... 42
5 Conclusion ...............................................................................................................................44
6 Perspectives .............................................................................................................................. 45
7 References.................................................................................................................................. 46
Paper I-III
Supplemental material


1
1 Introduction
1.1 Background
The inter-play between dietary intake and disease has been investigated for many years with
gradually more refined measuring methods being developed over time. Consumption of
nutrients and other bioactive compounds from food will interact with numerous targets,
metabolic pathways and functions in the organism and hereby potentially reduce or increase
the risk of disease. Methods that can handle multiple responses may therefore be particularly
beneficial compared to the classical univariate approaches most often used in nutrition
research. Metabolomics is one of the latest developed approaches to access environmental
influence on living systems, and this technique enables simultaneously measurement of large
part of the metabolites present in a given biological sample, whereby the metabolic effect of
e.g. a specific food intake can be explored in a more global way than with traditional methods
(Scalbert et al., 2009). This approach offers a unique possibility to measure the real end-
points of physiological regulatory processes, the metabolites, either by use of nuclear
magnetic resonance (NMR) spectroscopy or mass spectrometry (MS) techniques and with
subsequent exploration of the metabolic profiles with multivariate statistical analysis for
biomarker identification. However, many factors may have a crucial influence on the final
result and minimisation of unwanted sources of variation is very important in establishment of
a reliable metabolomics platform. When this technology is properly established, the
metabolomics approach may reveal new biomarkers, alterations in biochemical pathways and
highlight associations between diet and disease risk. The measurement of metabolite profiles
may also be applied profitably in a more targeted way to subtract quantitative information of a
priori known effect markers, and the dual applicability of the metabolomics technology
makes it a very suited and versatile tool in investigations of e.g. food intake and the
corresponding physiological responses in living organisms.
In this project apple was selected as the nutritional subject, and its physiological responses
were explored by means of the metabolomics technique. Apple remains one of the most
consumed fruits in the Western World, and the health impact from intake of this fruit seems
particularly relevant to investigate. Apple has a historical reputation of being a healthy
component as illustrated by the popular expression, “an apple a day keeps the doctor away”,
and several lines of scientific evidence suggest that apple and apple products posses a wide
range of biological activities that may contribute to health beneficial effects against cancer,
asthma, obesity, diabetes and cardiovascular diseases (CVD) (Boyer & Liu, 2004). However,
the active factors and mechanisms responsible for these potential health promoting actions
still remain unclear. In particular, an inverse association between apple intake and cholesterol
metabolisms seems convincing (Aprikian et al., 2001; Judd & Truswell, 1982; Sable-Amplis

2
et al., 1983a), and it has been reported that the cell wall polysaccharide, pectin, may be the
fraction responsible for a lipid-lowering effect of apple consumption (Gonzalez et al., 1998).
Metabolomics analysis of biological samples from in vivo investigations of apple and pectin
intake may shed new light on health aspects related to apple intake and assist in elucidation of
mechanisms and bioactive components of this fruit.
1.2 AiM of the thesis
The purpose of this project has been establishment of a reliable metabolomics platform
utilising MS, NMR spectroscopy and chemometrics to investigate effects of apple intake. The
project was divided into the following parts:
Identify metabolomics exposure and effect markers of apple and pectin intake from a
rat experiment (Paper I).
Establish NMR-based Partial Least Square (PLS) regression models for rapid and
reliable quantification of the plasma lipoprotein profile in rats (Paper II).
Apply the NMR-based PLS regression model to the same rat study as in Paper I and to
rats supplemented with apple-powder. Hereby to investigate the effect on cholesterol
metabolism of dried apple (Paper II), fresh apple and pectin intake (Paper III).
Evaluate the health effects of apple intake through the various markers.
1.3 Thesis outline
The thesis consists of an introductory part followed by three papers (Paper I, II and III). A co-
authoring paper (not yet published) is enclosed as supplemental material. Papers I and III are
based on the same animal experiment. In the introductory part some experimental results from
the papers are presented to highlight general concepts.
Chapter1 emphasises the importance of novel tools in nutrition research, explains why apple
was selected as the nutritional case and provides the general aims of the thesis.
Chapter 2 serves as an introductory text to the field of metabolomics research and provides a
brief theoretical background of the different methods used in this project as well as the
considerations of ‘good practice’ when performing nutri-metabolomics experiments.
Chapter 3 describes the chemical composition of an apple and the absorption, metabolism and
potential mechanisms of action in relation to CVD of proposed bioactive apple components.
Chapter 4 provides an overview of results and discussion of Paper I, II and III and further
considers aspects and reflections that did not found their way into the papers.

3
Chapter 5 summarises with a conclusion of the thesis and provides the perspectives for the
future use of metabolomics in nutrition research.
4
2 Metabolomics
2.1 metabolomics in Nutrition studies
Metabolomics is a term used to describe the study of small molecule intermediates and
products of metabolism present in biofluids, tissues and cellular extracts. The word is coined
in analogy with genomics and proteomics, and while these two terms reveal possible
functions of a biological system, metabolomics represents its actual state (Giovane et al.,
2008). The word metabolome was introduced for the first time by Oliver et al. (1998) as the
set of low-molecular-mass compounds synthesised by an organism. A few years later the term
metabolomics was introduced, as the identification and quantification of every single
metabolite in a biological system (Fiehn, 2002). The two terms metabolomics and
metabonomics are often used intertwined. They were initially defined separately with origins
in plant science and pharmacology, respectively, but in effect mean the same, and the word
metabolomics is now more widely accepted (Metabolomics Society, 2010) and will be the
term used in the ensuing sections. The word nutri-metabolomics is used in this thesis to cover
in vivo metabolomics studies in relation to nutrition.
The metabolome consists of a large number of small metabolites (< 1,500 Da) belonging to a
variety of different compound classes, such as amino acids, peptides, organic acids, lipids,
nucleotides etc. The exact number of metabolites from humans is unknown but is estimated to
be around 20,000 with wide concentration ranges spreading over nine orders of magnitude
(Giovane et al., 2008). Several players have an impact on the metabolome in humans and
animal, and the metabolome can be divided into 1) the endogenous metabolome, which
includes the metabolites produced by cells or tissues in the host, 2) the xenometabolome,
which includes foreign metabolites derived from e.g. drugs and dietary compounds, 3) the
food metabolome with the metabolites deriving from digestion of food and 4) the microbial
metabolome produced by the gut microbiota (Manach et al., 2009). Altogether, this leaves a
complex metabolome signature depending on genetics and on diet as well as environmental
variations that the host has been exposed to.
The first published study in which the metabolomics approach was used in a nutritional
experiment applied NMR technology to measure the effect of dietary soy supplementation
(Solanky et al., 2003), and after this several other NMR-based nutri-metabolomics studies
have been conducted e.g. Holmes et al. (2008), Lenz et al. (2004), Stella et al. (2006). MS-
based nutri-metabolomics had its beginning a little later with one of the first studies
investigating polyphenol concentrations in human urine after intake of polyphenol-rich
beverages (Ito et al., 2005), and more studies have followed (Paper I; Fardet et al., 2008a;
Fardet et al., 2008b; Shen et al., 2008; Gürdeniz et al., 2011). Typically, the different types of
5
metabolomics analysis can be separated into two major groups: non-targeted and targeted,
depending on the aim of the research, and these approaches are briefly described below.
2.1.1 Non-targeted analysis
The non-targeted, or explorative, metabolomics approach provides a hypothesis-free global
overview of abundant metabolites. During a non-targeted approach, the compounds are not
initially identified, and the features of all potential compounds are considered for further
analyses. This approach is often referred to as metabolic fingerprinting, since the intention is
not to identify each observed metabolite, but instead to compare ‘fingerprints’ or patterns of
changes in response to e.g. dietary intake or disease status (Dettmer et al., 2007). However, a
completely ‘true’ non-targeted analysis is never possible, since the chosen analytical method
and experimental perturbation always affects the metabolite outcome. After selection of
metabolites of interest from the non-targeted analysis a more targeted approach is required for
biological interpretation. Identification and to some extent quantification of the selected
metabolites is necessary in order to provide biological insight and understanding of
underlying mechanism of action.
2.1.2 Targeted analysis
The targeted metabolomics approach focus on identified metabolites or pre-selected metabolic
pathways. The term targeted metabolomics analysis in this thesis covers what is sometimes
called targeted analysis, targeted profiling or quantitative metabolomics in the literature. The
central thing for these terms is that analytical peaks (or latent peak regions) are initially
identified and subsequently quantified. This kind of analysis is characterised as a hypothesis-
driven approach rather than a hypothesis-generating. The term metabolic profiling is often
used for a partly non-targeted approach where the metabolomics data are scanned for specific
compounds normally collected in a reference library, but at least some of the metabolites may
not be known in advance. However, the metabolic profiling approach is not used in this
project and will not be considered further.
2.2 The metabolomics pipeline
To obtain fruitful and reliable results from metabolomics studies, numerous factors have to be
carefully considered. These aspects are summarised in Figure 1, which illustrates the
workflow of a metabolomics study. The following sections will consider the issues that need

6
special concern when working through the metabolomics pipeline, and examples from Paper
I-III will be given when appropriate.
2.3 Study design and sampling strategies
2.3.1 Study design
Selection of an adequate study design is a recurring issue in all experimental studies;
however, the high dimensionality of ‘omics data means that it needs special attention in these
types of studies. A general problem in metabolomics studies is the relatively low number of
samples compared to the number of variables, and this rectangular shape of the data can be
problematic in data analysis and hereby in extracting the correct biological information.
Therefore, the highest possible number of samples should be on aim when designing a study.
In nutri-metabolomics studies it seems particularly important to control the dietary intake due
to the large diversity of compounds present in different food items. Additionally, because of
the often high inter-individual variation (especially in human studies), a full cross-over design
should be preferred to parallel studies (Scalbert et al., 2009). The most commonly used
biological samples for nutritional metabolomics studies are the easy accessible samples; urine,
saliva and blood/plasma/serum (Giovane et al., 2008), and sampling time is an important
issue to consider in the study design in regard to the research question asked, especially for
urine due to high diurnal variation (Maher et al., 2007).
Figure 1. Illustration of the metabolomics pipeline, the workflow of a metabolomics study.
7
2.3.2 Sample collection
Metabolomic experiments are most often designed to capture a snapshot of the metabolome,
and the objective of sampling is to inhibit or stop metabolic flux to allow the snapshot to be
representative of the metabolome before sampling. Therefore, great care must be taken to
preserve the original information and variance in the biological sample, and any degradation
of metabolites after sample collection should be avoided to the greatest possible extent, to
ensure appropriate quantification and reproducibility among samples.
The work included in this thesis explores urine and plasma samples analysed by ultra high
pressure liquid chromatography quadropole time-of-flight MS (UPLC-QTOF-MS) and1H
NMR spectroscopy, and the best possible preservation procedures for these sample has been
worked out as a compromise between the two analytical techniques. A proton-free
preservative is preferred to limit interference with1H NMR spectra, and addition of NaN3 was
selected as the urinary preservative (Paper I) as recommended from investigations by
Lauridsen et al. (2007). This was confirmed by Saude & Sykes (2007), who showed that
NaN3 reduced the changes in metabolite concentration when urine was kept at room
temperature. Addition of NaN3 to the sample collection devise (as described in Paper I) is only
possible prior to collection in animal studies and not in human studies, due to safety issues of
this highly toxic chemical. Urine will most often be contaminated with microorganisms, and
the added preservative, but also cooled conditions, will minimise the microbial conversion of
metabolites and in this way keep them representative for the biological situation they
originally derived from. Keeping the urine below 5˚C is recommended (Maher et al., 2007)
and a urinary cooling method was developed for collection of 24 hour rat urine as described in
Paper I.
When considering blood sample collection, the microbial aspect is less important, but instead
enzymatic metabolite degradation may be pronounced. Blood samples should therefore be
handled as cold as possible to preserve the metabolic snapshot in the most optimal way. For
plasma samples, the anticoagulant to be used must be considered carefully, hereby avoiding
possible unwanted peaks in the mass or NMR spectrum and additionally reducing oxidation
of plasma to the highest possible extent. EDTA, heparin and citrate are the normal
anticoagulants to choose from. Heparin is the preferred plasma anticoagulant to be used in
NMR-based metabolomics experiments due to low introduction of interfering peaks
(Beckonert et al., 2007) whereas no general recommendations is present for LC-MS based
metabolomics. However, for targeted lipidomics by LC-MS the used of EDTA is
recommended to minimise loss of lysophospholipids (Seppanen-Laakso & Oresic, 2009).
Both urine and plasma samples should be handled quickly and stored preferably at -80˚C,

8
where they can be kept for at least 9 months without significant changes in the metabolic
profile (Beckonert et al., 2007).
2.3.3 Sample preparation
Sample workup before analysis depends on the type of sample being analysed, the analytical
method and whether specific metabolites or all metabolites are of interest. For non-targeted
LC-MS analysis of urine, no specific sample preparation (besides centrifugation) has to be
employed, but dilution with water and/or filtration is a possibility to protect the LC-MS
system. On the contrary, plasma contains a lot of proteins which will need removal before
LC-MS metabolomics studies. Different plasma and serum deproteinisation methods in
combination with LC-MS profiling were investigated by Want et al. (2006) and Bruce et al.
(2008) who found that protein precipitation with respectively, 100% methanol and 80%
methanol resulted in the highest number of metabolites and reproducibility. During
establishment of the LC-MS metabolomics platform in our laboratory a high-throughput
plasma deproteinisation method was further developed from the results of Bruce et al. (2008)
and Want et al. (2006), and the procedure is presented in Gürdeniz et al. (2011) (see
supplemental material). Regarding NMR-based metabolomics, no particular pre-treatment is
necessary for plasma samples besides dilution with a deuterated lock solvent. Addition of the
reference compound 3-trimethylsilylpropionic acid (TSP), which is normally used in1H NMR
experiments, is not recommended in plasma or other samples with high protein content due to
protein binding and hereof much reduced signals (Beckonert et al., 2007). The natural
occurrence of α-glucose was used as reference compound in Paper II as suggested by Pearce
et al. (2008). In1H NMR analysis of urine samples, special concerns has to be focused on
minimising the chemical shift due to difference in pH between the samples, and a buffer
should be applied to the sample. Typically, a phosphate buffer in D2O and with TSP as a
reference compound is used. Generally, samples should be kept cold while queued for
analysis, and it is recommended to run one or two aliquots of a representative biofluid sample
across the whole run as quality control measure (Beckonert et al., 2007).
2.4 Analytical platforms
The metabolome is dynamic, changing from second to second. Although the metabolome can
be defined readily, it is not currently possible to analyse the entire range of metabolites by a
single analytical method and multiple analytical platforms are needed to increase the coverage
of the metabolome. LC-MS, GC-MS and1H NMR spectroscopy are the most suited and
commonly most used platforms for metabolomics studies (Oresic, 2009). LC-QTOF-MS

9
utilising electro spray ionisation (ESI) and NMR spectroscopy were the platforms selected in
this research project. The basic principles of these two techniques are initially described, and
their individual application for metabolomics are discussed at the end of this section.
2.4.1 UPLC-QTOF-MS
UPLC-QTOF-MS is a hyphenated technique, initially taking advantage of chromatography
whereby it is possible to separate constituents of complex mixtures into single components
(chromatographic peaks) and subsequently introduction of the fractionated eluate into a mass
spectrometer for measurement of mass in relation to charge (m/z) of molecules and atoms.
2.4.1.1 Ultra high Pressure Liquid Chromatography
Liquid chromatography in general is a very efficient separation technique, where molecules
are separated by using small differences in their distribution in two-phase systems, consisting
of a mobile and a stationary phase. Aqueous solutions of acetonitrile and methanol are the
most common mobile phases, and molecules dissolved in the mobile phase are separated as
the mobile phase passes through the stationary phase, depending on their distribution
coefficient in the two phases. By reversed phase chromatography, which is the method
applied in Paper I, separation mechanism depends on the hydrophobic interaction between the
molecules in the mobile phase and the immobilised hydrophobic ligand in the stationary
phase. Experimental conditions are designed initially to favour adsorption of the molecules
from the mobile phase to the stationary phase and subsequently, the mobile phase
composition is modified to favour desorption of the molecules from the stationary phase back
into the mobile phase (Plumb et al., 2004; Poole, 2003).
One of the primary drivers for the growth of the chromatographic technique has been the
evolution of packing materials used to improve separation between peaks. Compared to the
more classical high pressure liquid chromatography, the recently developed UPLC technology
takes additional advantage of chromatographic principles in running separations by using
columns packed with smaller particles and/or higher flow rates for increased speed, resulting
in improved resolution and sensitivity (Plumb et al., 2004).
2.4.1.2 Quadropole Time-of-Flight Mass Spectrometry
The main features of a mass spectrometer consist of: an ion source, where the analytes are
ionised and transferred to the high vacuum of the mass spectrometer; a mass analyser where
ions are separated according to mass to charge ratio; a detector to measure the ion current

10
(amount of ions) or the ion number (by counting) as a function of time (Villas-Boas et al.,
2007). A QTOF mass spectrometer is illustrated in Figure 2.
When the sample elutes from the chromatographic system, the sample is injected into the ion
source where the molecules are converted to a charged or ionised form. Various different ion
source techniques are used in metabolomics with the electro spray ionisation (ESI) being the
most commonly used when coupled to liquid chromatography (Dettmer et al., 2007). ESI
involves the passage of a solution through a needle held at high voltage relative to a counter
electrode. The fine mist of droplets that emerge from the needle tip possess a net positive or
negative charge determined by the polarity of the needle and are attracted to the entrance of a
mass analyser (Villas-Boas et al., 2007).
From the ion source the ions are guided into the mass analyser. The QTOF technology
provides both a quadropole and time-of-flight mass analysers with an intermediate collision
cell for possible fragmentation. A quadrupole mass analyser consists of four metal rods
arranged in parallel where those opposite to one another are electrically connected by a radio
frequency (RF) voltage supply. This creates an alternating electrical field between the rods.
The charged molecules enter the quadrupole axially after they have been accelerated to a
Figure 2. Schematic illustration of a Waters Q-TOF Premier mass spectrometer with a single V reflectron
flight path. From Waters (2005) with permission.

11
required linear energy. Once inside the quadrupole they start spinning within an imaginary
cylinder created by the RF voltages. The diameter of the imaginary cylinder depends on the
mass-to-charge ratio (m/z) of the ion and the RF voltage. Only ions within a certain m/z range
will survive all the way through the quadrupole (Villas-Boas et al., 2007). In the study
reported in Paper I the quadropole was operated as an ion filter, allowing the ions from 50-
1000 m/z to pass through the quadropole for accurate measurement by the TOF. The TOF is a
high resolution MS instrument and functions by applying high voltage pulses to orthogonally
accelerate ions into a high vacuum flight tube and a reflectron to reflect them back towards a
detector. The mass-to-charge ratio is related to time-of-flight with smaller m/z’s reaching the
detector first (Waters, 2005), and mass spectra can be created with a mass resolution up to
10,000.
2.4.1.3 Application of UPLC-QTOF-MS in metabolomics experiments
The excellent sensitivity and high selectivity of a UPLC-QTOF-MS platform makes this
instrument a great candidate for explorative metabolomics experiments of non-volatile
compounds in a solution. The high resolution allows detection of metabolites of the same
nominal mass but different monoisotopic mass, and, combined with a 5 ppm mass accuracy,
the molecular formula can tentatively be determined of many metabolite peaks. The UPLC
chromatographic separation minimises the overlap of peaks, which again improves mass
accuracy, and additionally this method facilitates high-throughput analysis (e.g. 6 min/sample
for the study in Paper I). The chromatographic separation provides very efficient knowledge
of the polarity of an unknown molecule, and the elution time is an important characteristic in
structure elucidation of unknown and/or isomeric compounds.
A major issue and disadvantage encountered in ESI is what is known as matrix effects or ion
suppression, and e.g. when analysing complex mixtures like urine and plasma, one analyte
may be much more efficiently ionised than others (stealing more charge that expected from
the concentration) resulting in suppression of other compounds. This will result in some types
of compounds being quantitatively over estimated and others under estimated (Villas-Boas et
al., 2007). Therefore, the best quantitative results may be observed by use of isotopically
labelled reference metabolites for each metabolite in a targeted analysis, but this is not a
usable approach for non-targeted profiling (Scalbert et al., 2009). Compared to triple
quadropole MS, ion-trap-MS and NMR, the TOF-MS has a limited dynamic range and is
therefore not suited for highly quantitative purposes.
Analysis of the sample in both positive and negative ionisation mode will result in numerous
overlapping analytes detected in the two modes but also a significant amount of unique
compounds and it is highly recommended to do ionisation in both modes in non-targeted
12
analysis to obtain a broad coverage of the metabolome (Dettmer et al., 2007). Additionally, a
minimum of two analytical replicates should be obtained when running ESI LC-MS
metabolomics experiments, since the matrix effect may cause some slip in the detection of
analytes.
2.4.21HNMR spectroscopy
2.4.2.1 Nuclear magnetic resonance spectroscopy
High-resolution NMR spectroscopy is capable of providing detailed information on solution-
state molecular structures based on atom nuclear interactions and properties. The theory of
NMR was initially proposed by Pauli in 1924 who suggested that certain atomic nuclei
should have the properties of spin and magnetic moment and that exposure to a magnetic field
would consequently lead to the splitting of their energy levels (Pauli, 1924). However, it was
first in 1946 that the NMR phenomena was experimentally discovered independently by
Block & Packard (1946) and Purcell et al. (1946) and they were later awarded the Nobel price
in physics 1952.
Subatomic particles (electrons, protons and neutrons) can be considered as spinning on their
axes. In atoms such as12
C and16
O, where the number of neutrons and protons are both even,
these spins are paired against each other, such that the nucleus of the atom has no overall spin
and cannot be detected by NMR. However, in some atoms, such as1H and
13C, where the
number of neutrons and/or the number of protons is odd, then the nucleus has a half-integer
spin (i.e. 1/2, 3/2, 5/2), and the nucleus does possess an overall spin measurable by NMR
(Lambert & Mazzola, 2004; Stryer, 1995).
NMR spectroscopy functions by the application of strong magnetic fields and RF pulses to the
nuclei of atoms. All nuclei are electrically charged, and any that have a spin generate a small
magnetic field. When an external magnetic field is applied, an energy transfer is possible from
the low-level to a high-energy level of the nuclei. The energy transfer takes place at a
frequency that corresponds to the RF, and when the spin returns to its low-level state, energy
is emitted at the same frequency. The signal that matches this energy transfer is measured in
several different ways and processed in order to give an NMR spectrum for the nucleus
concerned. The precise resonant frequency of the energy transition is dependent on the
effective magnetic field at the nucleus, and this field is affected of shielding by electrons
orbiting the nucleus. Consequently, nuclei in different chemical environments absorb energy
at slightly different resonance frequencies, and this effect is referred to as the chemical shift.
This also means that sample conditions, such as pH and ion strength, will affect the observed
13
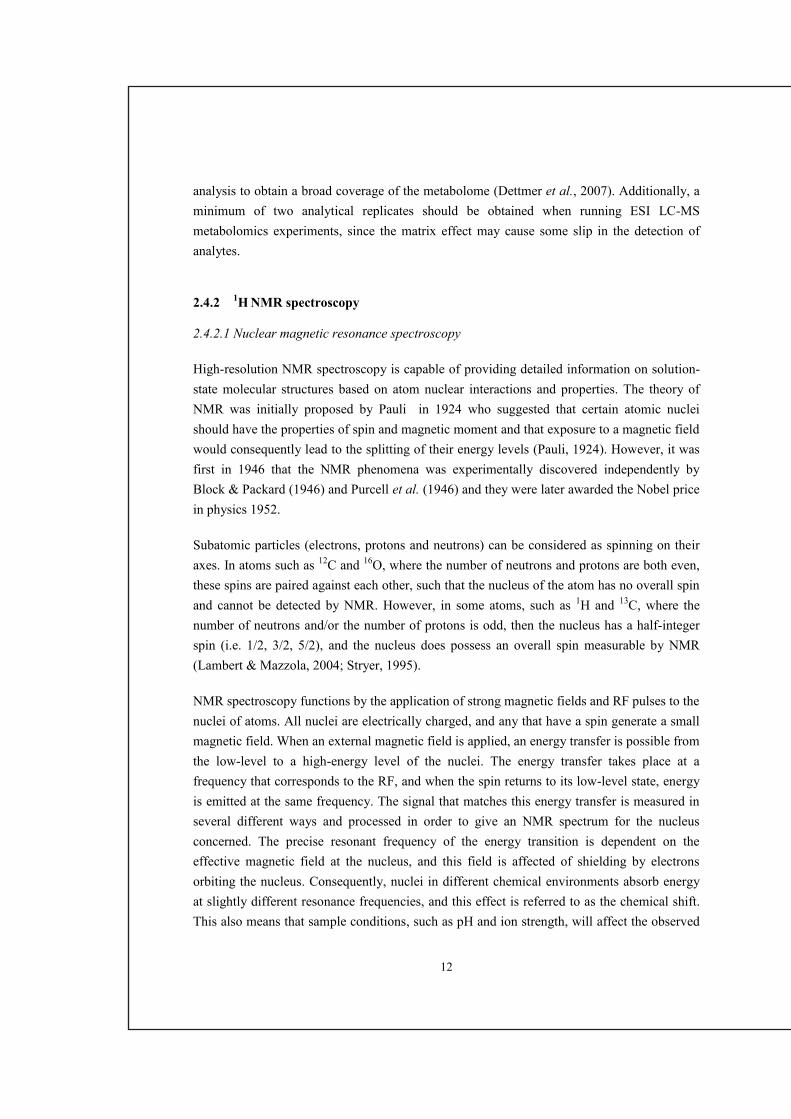
spectrum. The chemical shift for1H NMR is determined as the difference in fractional units, δ
(ppm), between the resonance frequency of the observed proton and that of a reference
compound (e.g. α-glucose set at 5.23 ppm in Paper II). The measured chemical shift of most
protons is typically in the range of 0-10 ppm. A particular proton usually gives rise to more
than one NMR signal because of the influence of non-equivalent neighbouring protons, an
effect called spin-spin coupling. The signal intensity depends on the number of identical
nuclei, and thus inherently quantitative (Dunn & Ellis, 2005; Lambert & Mazzola, 2004;
Stryer, 1995). An example of a1H NMR spectrum of rat plasma from 0-6 ppm is shown in
Figure 3. A recurring issue in NMR measurement of biofluids is the extreme high signal of
water which reduces metabolic information in the spectrum. To eliminate this, a water-
suppression pulse sequence can be applied as illustrated in Paper II.
2.4.2.2 Application of NMR in metabolomics experiments
NMR spectroscopy is a nondestructive and noninvasive technique with a high reproducibility
and ability to simultaneously quantify multiple classes of metabolites.1H NMR spectroscopy
exhibits high non-selectivity, meaning e.g. that this technique excels in identifying all proton-
containing compounds in a sample. Because of the high natural abundance of1H (~99.985%),
it high gyromagnetic ratio and its prevalence in metabolites, this nucleus is the most used for
metabolomics experiments in NMR measurements (Beckonert et al., 2007; Moco et al.,
2007). Generally, metabolomics studies of biofluids have shown high reproducibility when
Figure 3. An average1H NMR spectrum of rat plasma at 311 K including assignment of the most prominent
peaks.
14
using NMR and in most cases only one analytical replicate is sufficient per time point
(Beckonert et al., 2007).
The major disadvantage of NMR spectroscopy, as compared to MS, is the low sensitivity and
resolution of this technique. From this point NMR application is not a first-choice for
explorative metabolomics analysis to identify new biomarkers. Thus, the development of
instruments with higher magnetic field strength and cryogenically cooled probes has pushed
the limits of detection (Keun, 2006), improving their use in non-targeted metabolomics. In
this case the later spectral comparison demands that the spectrum acquisition and control of
conditions should be very precise. Small changes in pH, temperature and presence of
impurities or degradation of sample material should be minimised since these factors may
lead to detection of false metabolic changes and hereby incorrect selection of potential
biomarkers (Moco et al., 2007).
The nature of NMR as a quantitative technique due to the number of nuclear spins is directly
related to the intensity of the signal, makes a targeted metabolomics approach an evident
option. Biofluid NMR analysis is also often done with a priori knowledge of what the data
will reveal about a specific target. It would be expected that the response pattern of several
analytes is reflective of a physiological change in e.g. disease status or dietary habits, and the
comprehensive nature of an NMR metabolome data set may enable a global evaluation of the
systemic response. This can be useful in itself but the pattern may also be searchable for
specific analyte information that, solely or in combination, can provide new mechanistic
relevance (Robertson, 2005).
2.5 Data extraction and preprocessing
The complexity and richness which are some of the key qualities of metabolomics data also
makes data extraction and analysis very complicated. Since the metabolome changes from a
dietary intervention may be rather discreet (e.g. compared to a medical intervention) data
extraction errors will have a dramatic impact on the outcome of a study and therefore needs
great attention.
2.5.1 Data extraction of LC-QTOF-MS data
Metabolomics raw data from MS systems are normally collected in centroid spectra or at least
transformed to this format from continuous spectra as the first thing to reduce spectra
15
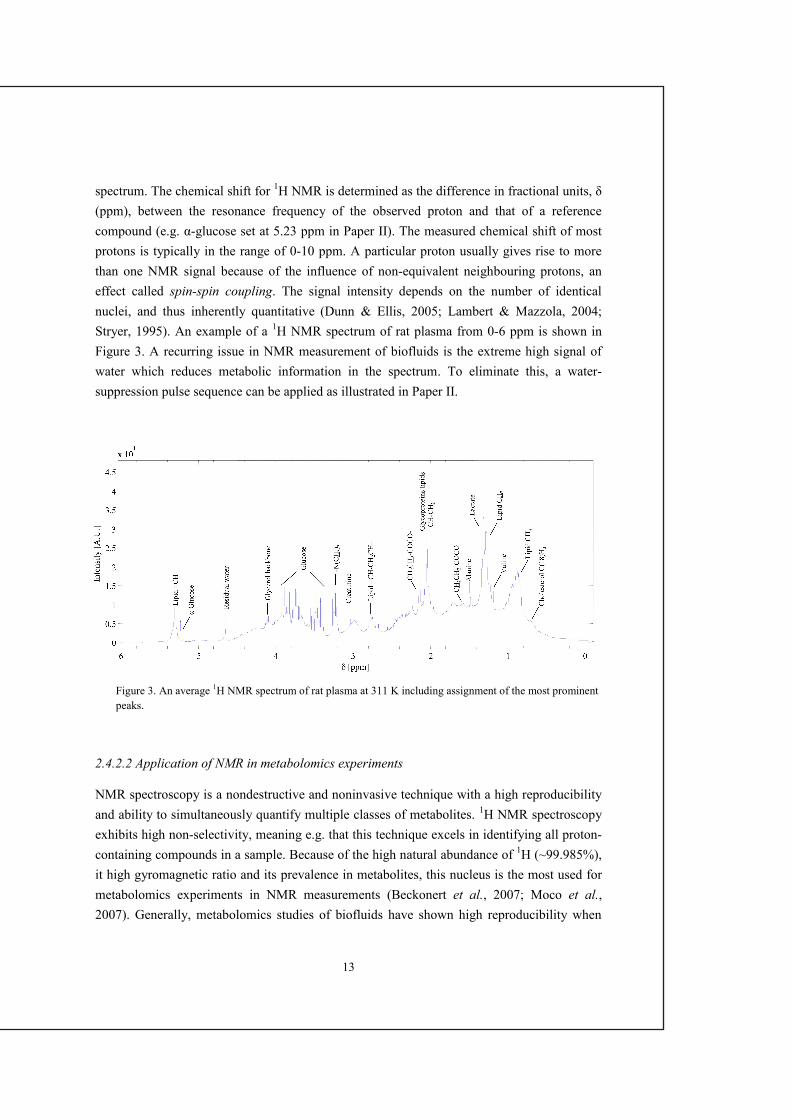
complexity before peak extraction. The software that obtains LC-MS data usually stores data
as non-uniform sample data files, each consisting of a two-dimensional (2D) intensity matrix
represented by scan number or retention time in the first dimension and m/z values in the
second dimension. These data can be transformed to uniform length and combined as a 3-
dimentional (3D) array (mass x scan x sample) for later multi-way data analysis, such as
parallel factor analysis (Smilde et al., 2004). However, the statistical analysis of this 3D high-
resolution array demands extreme computational power and is therefore difficult to handle.
Consequently, this kind of data is usually processed as a collapsed two-way data matrix where
specific retention times with corresponding mass (a feature or marker) serve as the first
dimension and samples as the second dimension (see Figure 4).
Various different software products are available to assist in data extraction, and an overview
and description of commercial and freely available software up until 2007 is described in
Katajamaa & Oresic, (2007). Data can also be extracted by used of in-house built
software/algorithms, where Matlab (MatWorks) is a suitable and flexible environment,
although it demands highly experienced user knowledge.
The central aspects of data extraction include matching the peaks extracted from the different
samples and aligning all masses and scans across the entire data set. A reasonable threshold
level should be applied to reduce noise and to be able to identify significant markers among
the peaks. Values lower than the threshold are then considered as zero, and to reduce
disturbance of these zero values in the subsequent data analysis, variables with a low number
of non-zero values in all groups should be removed as suggested by Bijlsma et al. (2006) and
in Paper I.
Rt.
time Mass
Sample
#1
Sample
#2
Sample
#3
Sample
#4 …
1,7686 458,0276 0,1893 0 1,3816 1,1824
2,2397 433,1481 2,8412 3,1691 9,7891 8,306
1,5782 415,1156 0,2038 0 0,1509 0
1,5117 401,1095 0,5289 0,5715 0,3131 0,4461
… …
Figure 4. Three-dimensional structure of LC-MS raw data (left) and the two-dimensional structure (right) of the
collapsed dataset after MarkerlynxTM
data extraction.
16
The commercial software, MarkerlynxTM
(Waters), was used in Paper I and it was found that
different preprocessing parameters resulted in extraction of several non-identical features. As
a compromise two different data sets, preprocessed with different parameters, were extracted
and subsequently combined. Peters et al. investigated the impact of parameter selection in
different software packages (MarkerlynxTM
, MZmine and MetAlign) by used of spiked and
non-spiked control samples to evaluated the number of retrieved spiked compounds together
with the number of false positive (Peters et al., 2009). They recommended introduction of
such samples in a metabolomics sample run for optimal parameter selection. Gürdeniz et al.
(2011) found that data extracted by two different preprocessing approaches (MarkerLynxTM
and in-house built extraction by Matlab) caused large differences in the rank of selected
markers, but the majority of them were found by the two quite different preprocessing
methods (Gürdeniz et al., 2011). This work also concluded that to achieve successful
biomarker detection it is important to inspect the quality of the raw data (shift in mass and
retention time) and preprocess according to its specific structure.
2.5.2 Data extraction of NMR data
NMR signals are collected as a function of time. The decaying signal that follows a pulse is
called the free induction decay (FID). The chemical shift can be derived from the FID by
utilising a Fourier transformation, whereby the time domain is converted into the frequency
domain (Lambert & Mazzola, 2004). However, prior to Fourier transformation data is
typically zerofilled and apodised to a certain line broadening. Hereafter, NMR spectra needs
to be corrected for deviations from a flat horisontal baseline and phase errors. The employed
NMR software can usually do this automatically but especially the phase errors may be more
appropriately corrected by hand.
Different factors (e.g. sample pH, temperature and minor instrumental drifts) may cause
chemical shift variations, and the overall variation between samples needs to be compensated
by a shift of the entire spectra by use of an internal reference compound. If this shifting is not
sufficient a co-shifting algorithm can be applied (as in Paper II), whereby spectral alignment
are performed in spectral intervals, hereby preserving the shape of the peaks. Additionally,
before data analysis the residual water signal should be removed.
2.5.3 Normalisation, centering and scaling of metabolomics data
Data normalisation (scaling between samples) and scaling between variables is typically
applied to remove unwanted systematic bias in ion or signal intensity measurements while

17
retaining the interesting biological information. The sources of obscuring variation may arise
from inhomogeneity of samples, minor differences in sample preparation, instrumental
pertubation and also data extraction steps may introduce an additional error (Sysi-Aho et al.,
2007).
Each sample is usually normalised to unit sample intensity sum (as in Figure 5) or to unit
sample vector length (Euclidean norm), since normalisation to a single or few selected
variables will not be appropriate representatives for the chemically diverse metabolites profile
present in these types of samples (Katajamaa & Oresic, 2007). However, these statistical
normalisation approaches may not always be the most optimal procedure, since metabolite
concentration increase in one group is not automatically balanced by a decrease of another
group. A novel and very promising normalisation approach has been suggested by Sysi-Aho
et al. (2007) utilising optimal assignment of multiple internal and/or external standards across
multiple sample runs to help determine how the standards are correlated, which variation is
specific to a particular standard, and which patterns of variation are shared between the
measured metabolites and the standards. From this a mathematical model was developed to
detect the systematic variation of metabolites as a function of variation of standard
compounds. This advanced normalisation method was evaluated on LC-QTOF-MS
metabolomics data, but the same strategy was considered applicable to other analytical
platforms used in metabolomics as well.
Before multivariate data analysis the data matrix is normally mean centered in order to focus
on the difference between the samples rather than the direction of the overall variance.
Centering converts all the concentrations to fluctuations around zero instead of around the
mean of the metabolite concentration and hereby adjusts for offset variation between the high
Figure 5. Chemical-shift referred (a) and co-shifted and normalised (b)1H NMR spectra of 24 rat plasma
samples (data from Paper III). The peak (~1.27 ppm) refers to the CH2 groups of different lipids in
lipoprotein particles.
a b
18
and low abundant metabolites (van den Berg et al., 2006). The addition of a scaling method
should also be considered before data analysis in order to adjust for the fold difference
between the detected metabolites. The most commonly used scaling methods for
metabolomics data are autoscaling and pareto scaling. The first method employs the standard
deviation as the scaling factor, whereas the square root of the standard deviation is the scaling
factor for pareto scaling (van den Berg et al., 2006). It should always be considered that each
type of data pretreatment emphasises different aspects of the experimental data, and each
approach has both advantages and disadvantages.
2.6 Data analysis
Metabolomics data obtained from spectroscopy and spectrometry typically contains thousands
of variables from each sample. Variables attained from NMR spectroscopy are normally
highly correlated, whereas in mass spectrometry data, the individual variables are not directly
correlated but hyphenated to a chromatographic dimension that sorts the variables by polarity,
allowing some relation to the neighbouring variable.
The multidimensionality of this type of data is difficult to comprehend and visualise, and
invoke for analytical techniques which can extract the relevant information. Chemometric
methods are here an obvious choice due to their ability to decompose complex multivariate
data into simpler and potentially interpretable structures (Wold, 1987). Depending on the aim
of the analysis, unsupervised or supervised methods may be applied and assist in e.g.
obtaining an overview of data, in variable selection, in group classification or to relate the
data set to a reference value for construction of prediction models. The following section aims
at introducing the data analytical approaches applied in this project.
2.6.1 Principal component analysis
Principal component analysis (PCA) was first introduced in statistics by Pearson in 1901
(Pearson, 1901) with a geometric interpretation of ‘lines and planes of closest fit to systems of
point in space’, and Hotelling (1933) further developed PCA to its present stage. PCA can be
generally described as a method that reveals the internal structure of a data set in a way which
best explains the variance in the data. Mathematically a PCA model can be written as:
X = T · P'+E
19
where X is the data matrix representing samples and variables decomposed into a score matrix
(T) and a transposed loading matrix (P'). The E matrix contains the residuals, the part of the
data not ‘explained’ by the principal component model. In this way, the score and loading
matrix contains the systematic variation with respect to samples and variables, leaving the
unsystematic variation in the residual (Wold, 1987). PCA offers a reduced dimensional model
that summarises the major variation in the data into few axes, and in this way, systematic
variation is captured in a model that can be used to quickly visualise which samples in the
data set are similar or dissimilar to each other. From this, possible spectral loadings causing
any treatment-related separation may be identified. In Paper I, PCA was used as an initial
explorative method to investigate to which extent the different treatments (apple and pectin)
could be discriminated by the urinary metabolite profile. PCA was also used in a non-
metabolomics context in Paper III to obtain an overview of the variance structure of classical
health related biomarkers and physiological data. Additionally, in both studies PCA was used
to investigate for ‘outliers’, by inspection for highly deviating samples with respect to residual
and hotelling values, but none such were detected.
2.6.2 Partial least square regression
The most commonly used chemometric method for quantification is partial least square (PLS)
regression. This method is a very robust and powerful algorithm that can analyse data with
numerous strongly correlated X-variables (e.g. spectra) and also simultaneously model one or
several Y-variables (e.g. a response variable/biomarker) (Wold et al., 2001). This enables
establishment of a linear model that can predict Y from the measured spectra in X. Like PCA,
PLS regression generates a linear model of the data, but where PCA models the major
variation in the data itself, PLS derives a model that describes the correlation between the X
variables and a feature (Y variable) of interest (Keun, 2006).
In Paper II, PLS regression was successfully applied in modelling of NMR spectra and
cholesterol content in lipoprotein fractions from rat plasma samples. Cholesterol
concentration in the main plasma lipoprotein fractions could hereby be predicted in unknown
samples after NMR measurement (illustrated in Paper II and III). The development of these
prediction models took advantage of the interval partial least square (iPLS) regression
developed by Nørgaard et al. (2000), which is an extension of PLS regression. The iPLS
regression model splits the NMR spectrum into a number of intervals, and PLS models are
calculated towards the response variable for each interval. The predictive performance of the
PLS model for each interval is compared with the predictive performance of the full spectrum
model. The advantage of this approach is that the limited intervals contains less interference
20
from irrelevant parts of the spectrum and provides more precise and easier interpretable
models with a comprehensive overview of which spectral regions are best correlated with the
response variables.
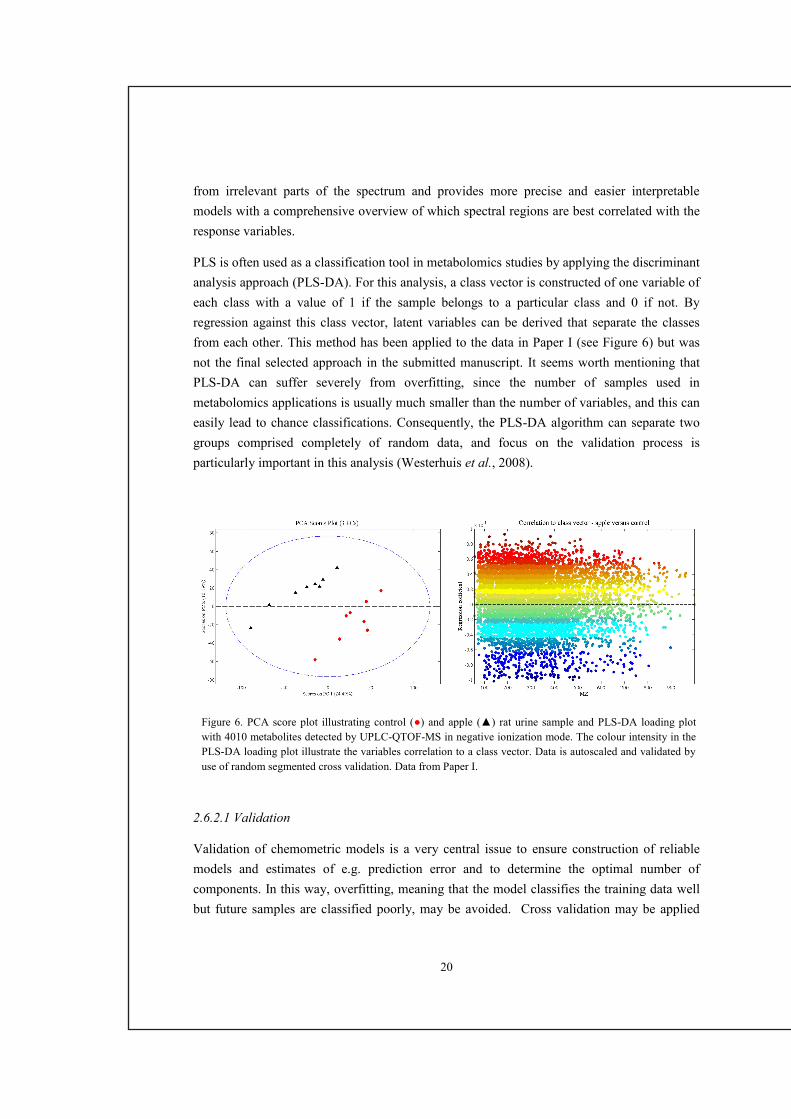
PLS is often used as a classification tool in metabolomics studies by applying the discriminant
analysis approach (PLS-DA). For this analysis, a class vector is constructed of one variable of
each class with a value of 1 if the sample belongs to a particular class and 0 if not. By
regression against this class vector, latent variables can be derived that separate the classes
from each other. This method has been applied to the data in Paper I (see Figure 6) but was
not the final selected approach in the submitted manuscript. It seems worth mentioning that
PLS-DA can suffer severely from overfitting, since the number of samples used in
metabolomics applications is usually much smaller than the number of variables, and this can
easily lead to chance classifications. Consequently, the PLS-DA algorithm can separate two
groups comprised completely of random data, and focus on the validation process is
particularly important in this analysis (Westerhuis et al., 2008).
2.6.2.1 Validation
Validation of chemometric models is a very central issue to ensure construction of reliable
models and estimates of e.g. prediction error and to determine the optimal number of
components. In this way, overfitting, meaning that the model classifies the training data well
but future samples are classified poorly, may be avoided. Cross validation may be applied
Figure 6. PCA score plot illustrating control (●) and apple (▲) rat urine sample and PLS-DA loading plot
with 4010 metabolites detected by UPLC-QTOF-MS in negative ionization mode. The colour intensity in the
PLS-DA loading plot illustrate the variables correlation to a class vector. Data is autoscaled and validated by
use of random segmented cross validation. Data from Paper I.
21
when the number of samples is limited, and all samples have to be used in the calibration
model. By this approach the X data matrix is divided into a number of segments containing
one or more samples (full or segmented cross validation, respectively). One by one the
segments are left out, and the model is calibrated with the remaining sample and used to
predict the samples in the omitted segment (Wold et al., 2001). Random segmented cross
validation was used in Paper II for development of the PLS calibration models and to
determine the optimal number of components to be used.
As a stronger validation method, test set validation can be used when a study contains enough
samples to be divided into a calibration set and a validation test set. Here, the calibration set is
used to build the model, and the test set is subsequently applied to estimate the prediction
error. Test set validation was used in Paper II, where the PLS calibration models was build
from 40 samples, and an independent test set consisting of 20 samples was applied to the
model to test the model performance in future predictions. The often used estimate of
prediction error is the root mean square error (RMSE), which mimics the traditional standard
deviation and is described in detail in Paper II.
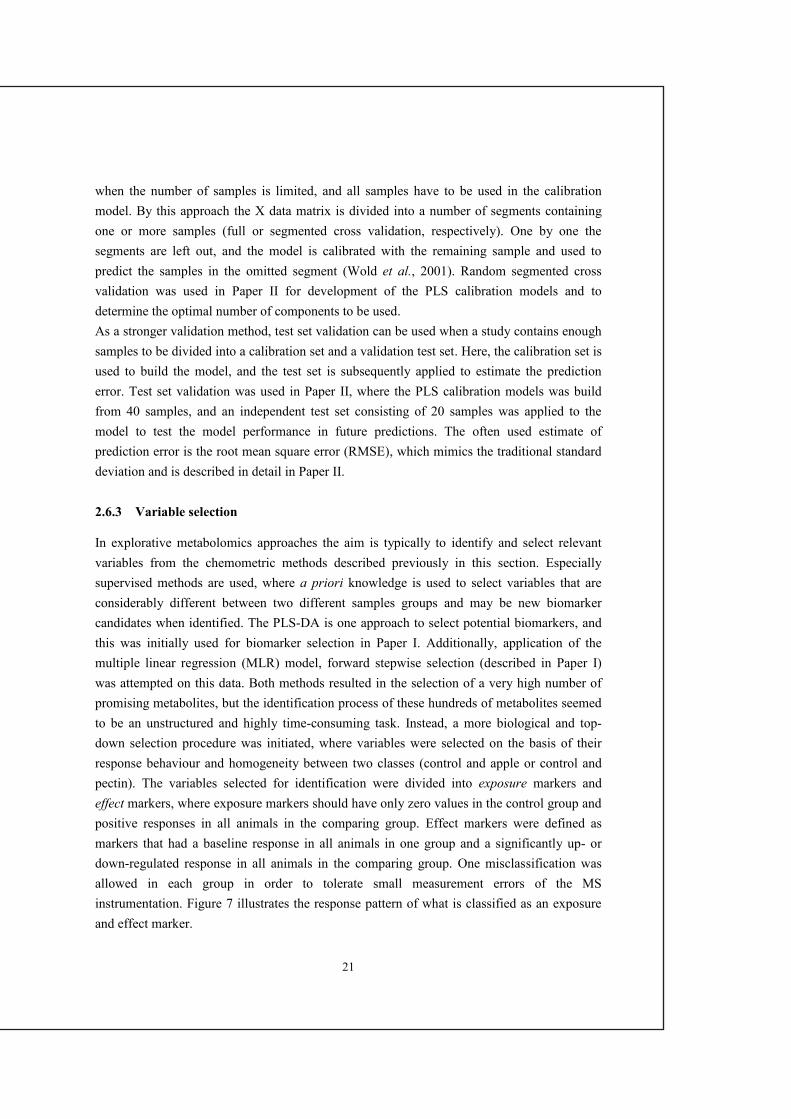
2.6.3 Variable selection
In explorative metabolomics approaches the aim is typically to identify and select relevant
variables from the chemometric methods described previously in this section. Especially
supervised methods are used, where a priori knowledge is used to select variables that are
considerably different between two different samples groups and may be new biomarker
candidates when identified. The PLS-DA is one approach to select potential biomarkers, and
this was initially used for biomarker selection in Paper I. Additionally, application of the
multiple linear regression (MLR) model, forward stepwise selection (described in Paper I)
was attempted on this data. Both methods resulted in the selection of a very high number of
promising metabolites, but the identification process of these hundreds of metabolites seemed
to be an unstructured and highly time-consuming task. Instead, a more biological and top-
down selection procedure was initiated, where variables were selected on the basis of their
response behaviour and homogeneity between two classes (control and apple or control and
pectin). The variables selected for identification were divided into exposure markers and
effect markers, where exposure markers should have only zero values in the control group and
positive responses in all animals in the comparing group. Effect markers were defined as
markers that had a baseline response in all animals in one group and a significantly up- or
down-regulated response in all animals in the comparing group. One misclassification was
allowed in each group in order to tolerate small measurement errors of the MS
instrumentation. Figure 7 illustrates the response pattern of what is classified as an exposure
and effect marker.

22
This kind of variable selection may have particular suitability in studies with numerous very
clear markers, as it can be found in animal studies, due to isogenetic animal strains and
controllable dietary habits. In human intervention studies more pronounced inter-individual
variation and diverging habits will most likely entail a more blurred response profile, and in
this case this ‘exposure and effect marker’ approach may not be the optimal selection.
Forward stepwise selection was also applied to identify a potential dose-response relationship
between any of the urinary variables and the pectin intake (zero in the control group, 1 in the
apple group and 16.5 in the pectin group) in Paper I. This method selects variables in a
stepwise manner based on their capability to improve an MLR model established between the
chromatographic features and the pectin dose (described in more detail in Paper I). Due to the
relatively high independence of variables in an LC-MS data set, the forward stepwise
selection method may be well suited for this type of data. However, this method is also prone
to overfit due to the low number of samples as compared to the number of variables, and
careful validation is an important issue in this case.
2.7 Metabolite identification
Metabolite identification is an essential part of most metabolomics studies, but since this task
is difficult and a time consuming step at the end of the metabolomics pipeline, it is sometimes
ignored or left unfinished (Scalbert et al., 2009). Without compound identification no new or
confirming metabolic information is gained, and the goal of a metabolomics study is not
achieved.
The effort required for identification of metabolites depends on the scope of the study, be it
targeted or explorative. If the search is for known metabolites the identification involves
[M-H-] 261.0079; rt 1.454[M-H
-] 191.0555; rt 0.641
0.641.454
Figure 7: Example of exposure (left) and effect (right) marker selected from urinary UPLC-QTOF-MS
analysis. Control (×), pectin (□) and apple (+) samples.

23
comparing the experimental data with that of pure standards. If the metabolites can be
predicted, then the metabolic identification involves finding representative standards and
searching for the predicted metabolites. If nothing is known about the metabolites in the
experimental data, as in explorative studies, the metabolite identification is much more
complicated. This last approach is most widespread in MS metabolomics due to the high
sensitivity and hereby the possibility to discover new and low-abundant metabolites. The
explorative metabolite identification was investigated in Paper I and resulted in identification
of metabolites linked to apple or pectin intake in rats. The identification strategy in this study
took advantage of the accurate mass measurement and fragmentation pattern obtained from
the QTOF instrument. The m/z value of the selected exposure and effect markers was
searched in the Human Metabolome Data Base (HMDB). The database (version 2.5) contains
over 7900 metabolite entries including both water-soluble and lipid soluble metabolites
(Human Metabolome Database, 2010). If one or several metabolite hits matched the accurate
mass of a searched metabolite, this was taken further in the identification process. The
particular isotopic pattern in the mass spectra was inspected by use of the MarkerlynxTM
elemental composition software, where particular the natural13
C abundance is taken into
account. Then fragment ions in the raw data were considered by applying a mass fragment
tool (MassFragmentTM
, Waters) and finally an authentic standard of the proposed compounds
was analysed by the UPLC-MS system to verify retention time and the fragmentation and/or
adduct-forming pattern.
However, several of the metabolites were left as tentatively identified, since the pure standard
of these are not commercially available.
NMR metabolite identification in this project has been limited to peak assignment from
comparison of chemical shift with previous work (Paper II, Figure 2). However, the NMR
technique can elucidate chemical structures and provide highly specific evidence for the
identification of an unknown molecule, if they are at a high enough quantity (Moco et al.,
2007). For most organic compounds in biological samples, the acquisition of one-dimensional1H NMR spectrum is not sufficient for full structure elucidation, and more advanced NMR
measurements like homonuclear1H-2D spectra or heteronuclear 2D spectra are very helpful
for identification of unknown compounds (Dunn & Ellis, 2005). However, this task was
beyond the scope of this project.

24
2.8 Biological interpretation
When a metabolite has been identified, a relevant biological interpretation should be drawn
related to the research question. Information about numerous biochemical pathways and
metabolites interacting in these pathways is available in e.g. the KEGG pathway database
(http://www.genome.jp/kegg/pathway) or the Nutritional Metabolomics Database
(http://www.nugowiki.org). Additionally in the HMDB database most metabolites are
described briefly in a ‘MetaboCard’ designed to contain chemical, clinical and biochemistry
data. Besides these approaches the literature has to be thoroughly searched to put the
identified metabolite into an appropriate biological context. When/if the identified metabolite
is placed into a metabolic pathway this may lead to identification of additional unknown
metabolites belonging to the same pathway, and the data set can be searched again now in a
more targeted approach.
Biological interpretation of urinary metabolites from apple and pectin intervention in rats is
discussed in Paper I, just as the more classical biomarkers in relation to apple-powder, fresh
apple and pectin intake are discussed in Paper II and III. The biological interpretation of all
these markers is jointly discussed in the ‘Results and Discussion’ section.

25
3 Potential disease prevention from apple intake
Apple was selected as the nutritional case to be investigated during the establishment of our
metabolomics platform. To enable biological interpretation of both well-established CVD risk
markers and newly discovered metabolomics markers, some background knowledge of apple
is needed. The following section describes the composition of apple, absorption and
metabolism of presumed bioactive apple components as well as their physiological effects and
potential mechanisms of action in relation to prevention of CVD.
3.1 Composition of an apple
Apples are primarily composed of water and carbohydrate with fructose accounting for the
main part of the sugars and sucrose and glucose as minor parts. The macronutrient
composition of an apple (the ‘Shampion’ cultivar) can be seen in Table 2 in Paper III. Apples
contain several micronutrients as well, with the most predominant being pro-vitamin A (β-
carotene), vitamin C and E, folic acid, magnesium and potassium (National Food Institute,
2010). Apples contain normally >2 g fibre/100 g and different phenolic compounds (see Table
2, Paper III), and in particular these two components are linked with potential health effects
of apple intake (Gonzalez et al., 1998; Nagasako-Akazome et al., 2005), for which reason
their composition is further detailed in the following.
3.1.1 Fibres in apples
The fibre part in apples can be divided into a soluble and an insoluble fraction. The insoluble
fibres account for the major part and is made of cellulose, which consists of repeating
monomers of glucose attached end to end. The cellulose framework is interpenetrated by a
cross-linked matrix consisting of lignin, hemicelluloses, pectin and structural glycoproteins
(Thakur et al., 1997). Cellulose, lignin and to some extent hemicelluloses contribute to the
insoluble fibre fraction of apple (Rani & Kawatra, 1994). Pectin is a highly hydrophilic
polysaccharide that account for the majority of the soluble fibre fraction in apples. It has a
complex structure and apple-pectin exhibits a high degree of esterification and has a very high
content of branched side chains (Thakur et al., 1997) (see Figure 8).
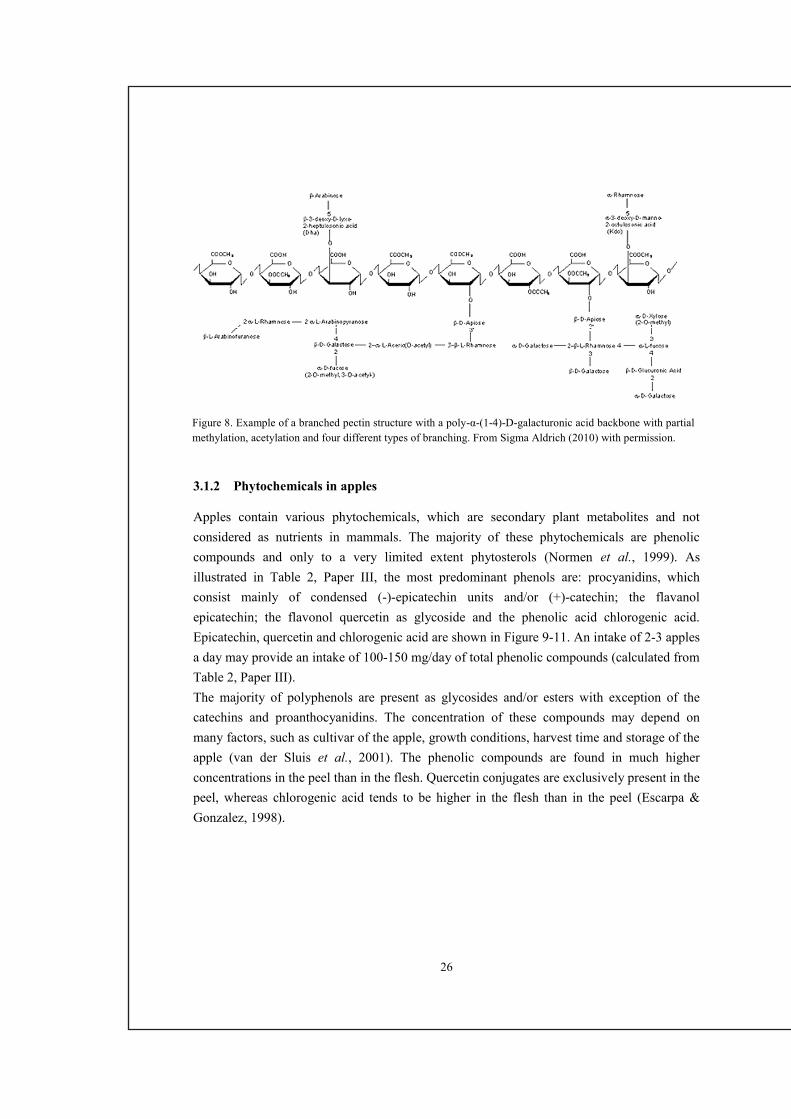
26
3.1.2 Phytochemicals in apples
Apples contain various phytochemicals, which are secondary plant metabolites and not
considered as nutrients in mammals. The majority of these phytochemicals are phenolic
compounds and only to a very limited extent phytosterols (Normen et al., 1999). As
illustrated in Table 2, Paper III, the most predominant phenols are: procyanidins, which
consist mainly of condensed (-)-epicatechin units and/or (+)-catechin; the flavanol
epicatechin; the flavonol quercetin as glycoside and the phenolic acid chlorogenic acid.
Epicatechin, quercetin and chlorogenic acid are shown in Figure 9-11. An intake of 2-3 apples
a day may provide an intake of 100-150 mg/day of total phenolic compounds (calculated from
Table 2, Paper III).
The majority of polyphenols are present as glycosides and/or esters with exception of the
catechins and proanthocyanidins. The concentration of these compounds may depend on
many factors, such as cultivar of the apple, growth conditions, harvest time and storage of the
apple (van der Sluis et al., 2001). The phenolic compounds are found in much higher
concentrations in the peel than in the flesh. Quercetin conjugates are exclusively present in the
peel, whereas chlorogenic acid tends to be higher in the flesh than in the peel (Escarpa &
Gonzalez, 1998).
Figure 8. Example of a branched pectin structure with a poly-α-(1-4)-D-galacturonic acid backbone with partial
methylation, acetylation and four different types of branching. From Sigma Aldrich (2010) with permission.

27
3.2 Absorption, metabolism and mechanism of action of apple
components
3.2.1 Fibre
3.2.1.1 Absorption and metabolism
The water-insoluble fibre fraction in apples (cellulose, lignin and some hemicelluloses) is
resistant to hydrolysis by the human digestive enzymes. Cellulose and hemicelluloses may to
a limited extent be fermented by the microbiota in the colon, whereas lignin passes
undegraded. Pectin, as the main soluble fibre fraction in apples, has high gelling properties
and forms a viscous solution in the small intestine. Pectin is, like the insoluble fibres, resistant
to hydrolysis by the human digestive enzymes but it is rapidly and completely fermented by
the microbiota in the proximal part of colon. The end products of this fermentation are short
chain fatty acids (SCFA) together with CO2, CH4 and H2 (Spiller, 2001). The SCFAs are
organic fatty acids with up to 6 carbon atoms with acetate, butyrate and propionate being
produced at the highest rate (Wong et al., 2006). Pectin seems to induce particularly high
production of acetate (Schweizer & Edwards, 1992). SCFAs are very efficiently absorbed in
caecum and colon by direct diffusion or cellular uptake involving Na+
and K+. Acetate is
rapidly transported to the liver and to a lesser extent to the muscle cells, where it functions as
fuel. Propionate functions as a primary substrate for hepatic gluconeogenesis, and butyrate
serves as the preferred fuel of the colonic epithelial cells (Wong et al., 2006).
3.2.1.2 Mechanism of action inducing physiological effects of apple fibre
One of the most investigated physiological properties of soluble fibres is its ability to lower
blood cholesterol. Several human and animal studies have been conducted with pectin
supplementation from various sources, and most investigations find a significant reduction in
cholesterol (Judd & Truswell, 1982; Keys et al., 1961; Stasse-Wolthuis et al., 1980; Sable-
A
B
C
Figure 9. (-)Epicatechin Figure 10. Quercetin Figure 11. Chlorogenic acid

28
Amplis et al., 1983b; Kay & Truswell, 1977) others find no effect (Aprikian et al., 2003;
Sable-Amplis et al., 1983b; Schwab et al., 2006; Trautwein et al., 1998). There are typically
two suggested mechanism whereby pectin may exhibit cholesterol-lowering effect. One
suggested mechanism involves interference with lipid and/or bile acid metabolism. The gel-
forming properties of pectin may bind bile acids plus cholesterol and prevent the
(re)absorption in the small intestine (Kay & Truswell, 1977), leading to increased excretion of
bile acids via faeces. As a consequence, hepatic conversion of cholesterol into bile acids will
increase, hepatic pools of free cholesterol will decrease and endogenous cholesterol synthesis
will increase. This is thought to increase activity of 7-α-hydroxylase and HMG-CoA
reductase to compensate for the loss of bile acids and cholesterol from the liver stores.
Furthermore, hepatic LDL cholesterol receptors become upregulated to restore the hepatic
cholesterol pool, and this will lead to decreased serum LDL cholesterol concentrations
(Theuwissen & Mensink, 2008). This is a proposed mechanism for water-soluble fibres in
general, and Figure 12 gives an overview of this proposed regulation.
Figure 12. A proposed cholesterol-lowering mechanism of water-soluble fibres like pectin. The soluble
fibers form a gel in the intestinal lumen, whereby (re)absorption of cholesterol and bile acids may be
decreased. This leads to an increased faecal output of these two components. As a result hepatic conversion
of cholesterol into bile acids increases, hepatic pools of free cholesterol decrease and endogenous
cholesterol synthesis increases. In addition, hepatic LDL cholesterol receptors are up-regulated to re-
establish hepatic free cholesterol stores. These processes will ultimately lead to decreased serum LDL
cholesterol concentrations (from Theuwissen & Mensink, 2008).
29
The other suggested mechanism whereby pectin may exhibit a cholesterol-lowering effect
links to effects of the SCFA produced by fermentation of microbiota in the colon. Propionate
has been reported to inhibit cholesterol synthesis in the liver (Rodwell et al., 1976; Venter et
al., 1990), and this is the main argument in the SCFA-cholesterol lowering theory. However,
consensus is not established in this area. Propionate is at the same time found as a substrate
for hepatic gluconeogenesis and in this way it seems to have two opposite and competing
effects on the gluconeogenesis (Wong et al., 2006). Acetate is hypothesised as a primary
substrate for cholesterol synthesis. Wolever et al. (1989) studied the effect of rectal infusion
of SCFA on lipid metabolism, and subjects given infusion of two doses of a mixture of
acetate and propionate (90:30 nmol and 180:60 nmol) showed a dose-dependent increase in
serum total cholesterol and triglyceride level. Another study by the same research group
showed that acetate infused alone (180 nmol) produced a significant rise in total and LDL
cholesterol (Wolever et al., 1991). The authors concluded that these findings revealed indirect
evidence that SCFA is utilised in lipid synthesis and that the exact effect of SCFA may
depend on the ratio of propionate and acetate. The infusion method used in these studies can
be debated, since the dosage rate may not simulate that of the SCFA produced by the colonic
microbiota, and in general the effects of SCFA in cholesterol metabolism may still be
regarded as unclear.
No cholesterol-lowering effects have been seen by cellulose and hemi-cellulose directly, but
since these fibres are fermented to some extent, the resultant SCFAs may also have a certain
impact with respect to this proposed mechanism. However, the insoluble fibre fraction is
primarily regarded as being responsible for an increased stool bulk and helping to regulate
bowel movements.
3.2.2 Phenolics and polyphenols
3.2.2.1 Absorption and metabolism
Various factors have an impact on the bioavailability of polyphenols. As stated earlier, the
majority of polyphenols are present as glycosides in the apple, and this influences absorption
in the gut. The bioavailability and metabolism of the most predominant apple phenolics are
detailed here.
Procyanidins: Procyanidins are found as the B2 dimer (epicatechin-(4β-8)-epicatechin) in
apple (INRA, 2010). The high molecular weight of procyanidins seems to hinder the intestinal
absorption (Donovan et al., 2002), and they pass unaltered into the colon where they can be
catabolised by the gut microbiota. Appeldoorn et al. (2009) conducted an in vitro

30
fermentation of different purified procyandins (also the B2 dimer) with human microbiota and
found 2-(3,4-dihydroxyphenyl)acetic acid and 5-(3,4-dihydroxyphenyl)-γ-valerolactone as the
main metabolites. Bioavailability and metabolism have not yet been investigated with pure
procyanidins in humans, but in accordance with Appeldoorn et al., we tentitatively identified
dihydroxyphenyl-γ-valerolactone as a urinary marker from apple supplemented rats (Paper I).
5-(3,4-dihydroxyphenyl)-γ-valerolactone was also identified by Li et al. (2000) as a major
human urinary metabolite after intake of (-)-epicatechin, and some extent of microbial
breakdown of procyanidins to monomer (-)epicatechin and further to 5-(3,4-
dihydroxyphenyl)-γ-valerolactone seems plausible.
Catechins: Especially (-)epicatechin, but also its isomer (+)catechin, is prevalent in apples to
some extent. These catechins are believed to have a relatively high bioavailability and can be
absorbed directly in the small intestine. The absorbtion and metabolism of catechin was
investigated by Donovan et al. (2001) via an in situ model of small intestinal perfusion in
living rats, and absorption and metabolism of epicatechin are believed to proceed in the same
way. These authors suggested that catechin enters the enterocytes by passive diffusion, and
here they are primarily glucuronidated and/or to a lesser extent methylated. From the
enterocytes the conjugated catechins are transported to the liver, where further re-/de-
glucuronidation/methylation or sulphation can occur. The glucuronated and methylated forms,
are the circulating forms whereas the glucuronated+sulphated forms primarily are thought to
be eliminated by bile (Figure 13). The formation of sulphate, glucuronide and/or methylated
metabolites occur through the respective action of sulfotransferase (SULT), uridine-5´-
diphosphate glucuronosyltransferases (UGTs) and catechol-O-methyltransferases (COMT)
(Crozier et al., 2009).
Figure 13. A schematic representation of the possible mechanisms of absorption and metabolism of catechin
in rats. Abb.: 3´OMC, 3´-O-methylcatechin (From Donovan et al. (2001)).

31
Natsume et al. (2003) has elucidated the chemical structure of (-)-epicatechin metabolites in
human and rat urine after oral administration of this compound, and the major circulating
metabolites in humans were found as: epicatechin-3´-O-glucuronide, 4´-O-methylepicatechin-
3´-O-glucuronide, 4´-O-methylepicatechin-5- or 7-O-glucuronide, and in rats: epicatechin-3´-
O-glucuronide, epicatechin-7-O-glucuronide and 3´-O-methyl-epicatechin-7-O-glucuronide.
The aglycones epicatechin was also found in both humans and rats. The authors stated that the
difference in catechin metabolism between humans and rats was that the glucuronidation of
epicatechin occurs at the 7´ position of the A ring for rats and at the 3´position of the B ring in
humans.
(-)Epicatechin was identified as a urinary exposure marker from apple intake in Paper I, and
the epicatechin glucuronide, methylated epicatechin and catechin glucuronide were also
recognised, although only tentitatively identified, because lack of authentical standards
hindered confirmation of retention time for these compounds.
Quercetin: Quercetin is primarily found as quercetin-3-glycoside, rutinoside, rhamnosides,
xylosides and galactosides in apple (Boyer & Liu, 2004; INRA, 2010). Some glycosides are
able to be absorbed in the small intestine, and there are two possible routes by which
glucoside conjugate can be hydrolysed and the resultant aglycones can be formed in the
epithelial cells. One possibility is that the glycoside is hydrolised by lactase phloridizin
hydrolase (LPH) in the brush-border of the small intestine epithelial cells and hereafter enters
the cell as aglycone by passive diffusion. Alternatively, the intact glycoside conjugate may be
transported into the epithelial cells by the sodium-dependent glucose transporter SGLT1,
where after cytosolic β-glucosidase can mediate hydrolysis (Crozier et al., 2009). Quercetin-
3-glycoside is thought to utilise the LPH, whereas the quercetin rutinoside, rhamnosides,
xylosides and galactosides are not easily hydrolysed, and most likely pass unchanged through
the small intestine and may be degraded/hydrolysed by the microbiota in colon (Boyer & Liu,
2004). Like the catechins, quercetin is subjected to glucuronidation, sulphation and/or
methylation before passage into the blood stream and further phase II metabolism occurring in
the liver by hepatocytes, which contain b-glucuronidase activity (Mullen et al., 2006). Some
of the quercetin conjugates may be recycled back into the intestine via the bile, but most will
be excreted in urine (Crozier et al., 2009).
Chlorogenic acid: Only very small amounts of chlorogenic acid are believed to be absorbed
intact in the intestine, and the majority appears to be metabolised by the gut microbiota in the
colon (Gonthier et al., 2003). Gonthier et al. (2003) found that rats supplemented with
chlorogenic acid primary increased excretion of hippuric acid and m-coumaric acid. Quinic
acid is also a known microbial metabolite of chlorogenic acid, and this metabolite was found

32
as an apple exposure marker in Paper I. However, quinic acid is also naturally present in
apples and the origin of this phenol may not only derive from chlorogenic acid.
3.2.2.2 Mechanism of action inducing physiological effects of apple polyphenols
The interest in health effects of dietary polyphenols have primarily been driven from
epidemiological studies that indicate an inverse relationship between intake of polyphenol
rich foods and different diseases such as CVD, diabetes and cancers. Based on this, numerous
in vitro studies have been performed with the aglycone form of polyphenols showing
promising disease preventive effects of these compounds. However, most circulating
polyphenols are glucuronidated, methylated and/or sulphated but there are only limited
studies elaborating on the biological properties of the conjugated derivatives (Crozier et al.,
2009). The lack of commercially available compounds complicates improvements in this area.
Studies where the biologically relevant substances are used to investigate mode of action in
relation to health effects are considered in the following.
Procyanidins: Since the procyanidins are not absorbed, they do not exhibit a direct systemic
response but during their passage in the intestine they may exert some effects through
interactions with other components, such as lipids. However, a potential health effect of these
structures may most likely be attributable not to direct actions of procyanidins themselves but
to actions of some of their microbial metabolites that can be more readily absorbed. Only very
limited investigations have been conducted with the presumed procyanidin metabolite, 5-(3,4-
dihydroxyphenyl)-γ-valerolactone. Li et al. (2000) suggested antioxidative activities of this
compound based on the chemical structure (Figure 14), and a study by Unno et al. (2003)
found that 5-(3,4-dihydroxyphenyl)-γ-valerolactone had stronger antioxidant potential than
vitamin C in vitro, but no studies have been performed elaborating on the biological effects of
this compound in vivo.
Catechins: A study by Spencer et al. (2001) compared the epicatechin aglycone with 3´-O-
methylepicatechin and epicatechin glucuronides (epicatechin-7- and epicatechin-5-O-β-D-
glucuronides) regarding the ability to protect against oxidative stress of primary cultures of
Figure 14. 5-(3,4-dihydroxyphenyl)-γ-valerolactone from Li et al. (2000).

33
neurones. They found that the epicatechin glucuronides were not able to protect against
oxidative stress as it was the case for the native form of epicatechin and 3´-O-
methylepicatechin. Cren-Olive et al. (2003) studied the ability of 3´-O-methylcatechin and
4´-O-methylcatechin to protect LDL from in vitro oxidation and found these metabolites less
efficient in protection than catechin. The authors concluded that their results did not support a
direct physiological relevance of catechins as antioxidants in lipid processes. No animal or
human studies have been conducted with an isolated epicatechin or catechin supplement to
elaborate on health effects of these compounds.
Quercetin: Kawai et al. (2008) developed a monoclonal antibody targeting the quercetin-3-O-
glucoronide in humans and demonstrated the target sites of the metabolite that specifically
accumulates in macrophage-derived foam cells in atherosclerotic lesions in human arteries. At
this location the quercetin conjugate was found to be converted to the aglucone quercetin that
subsequently reduced the lesion size. Manach et al. (2004) have reported on, the existence of
intermolecular bonds between serum albumin and quercetin conjugates in the blood stream,
and this mechanism slows the elimination of quercetin from the body, whereby a prolonged
systemic effect is possible. The reported half-life of quercetin ranges from 11 to 28 hours,
whereas it appears shorter for catechins (3-8 hours) (Manach et al., 2005).
Generally, the evidence of potential disease preventive mechanism of apple polyphenols is
very limited, and more in vitro and in particular in vivo investigation, are needed to reveal
health effects of these substances.

34
4 Results and Discussion
This section initiates with methodological considerations of the research that is the basis for
Paper I, II and III in this project. The reader is referred to the individual papers for a detailed
survey of the results, and the aim of this section is to link together the results of Paper I-III
and to consider aspects and reflections that did not found their way into the papers.
4.1 Methodological consideration
4.1.1 Study design
This project deals with four different animal experiments, whereof two were used purely to
build NMR-based PLS calibration models (Paper II), and these models were utilised to predict
cholesterol in different lipoprotein fractions in two other rat studies; one with different doses
of apple-powder (Paper II) and one where fresh apple and apple-pectin were used as
supplements (Paper I and III).
The animal study used for Paper I and III has some limitations in its study design, especially
with regard to its use in the explorative metabolomics approach (Paper I). The study had a
parallel design, but the isogenic nature of the animals, as compared to humans, may justify the
choice of design to some extent. However, our attempt to detect pectin dose response markers
would have benefitted from a cross-over designed study whereby the exact individual
response for each dose level could have been measured for each rat. Additionally, inclusion of
more animals (n=24) in the studies would have aided in the data analysis and interpretation of
this study.
4.1.2 Rat studies and extrapolation to humans
The use of animal studies has its peculiarities and limitations as compared to human studies.
The rats selected for these studies had a relatively standardised genotype, and their habits are
more controllable compared to humans. This will induce a lower level of variation and make
potential biological effects or metabolome biomarkers clearer. However, the genetic
differences between rats and humans may result in some effects and physiological responses
that are completely ignored, because the rat is insufficiently sensitive to the specific treatment.
Rats have a higher metabolism rate than humans, and there will be some deviation in
metabolism, e.g. they seem to methylate dietary phenols far more extensively than humans
(Crozier et al., 2009). Regarding cholesterol metabolism, the rats are deficiency in cholesterol

35
ester transfer protein (CETP) (Ha & Barter, 1982), and the major part of cholesterol is carried
in the HDL particles in contrast to humans where LDL particles carry most cholesterol. These
factors clearly state that there are many cautions to be taken when extrapolating data from
animal to humans. However, investigation of organs, such as the liver and intestine is not
possible in humans to the same extent as in rats, and the experimental conditions can be much
more controlled. These aspects make animal models suited to study mechanisms of action but
confirming experiments in humans is always recommended.
4.1.3 Considerations with regard to selected markers
In Paper I the markers were selected depending on their MS intensity response pattern as
either effect or exposure markers. The effect markers should ideally be an expression of
changes in the endogenous metabolome or the microbial metabolome of the host induced by
e.g. apple intake. Identification of the specific metabolite can provide insight into metabolic
pathways that are affected by apple intake, and this may generate new knowledge of the site
of action for a potential health effect of apples. This will give rise to several new questions
and highlight new places to search for mechanistic answers. However, the effect marker
response may also derive from the food metabolome and illustrate imbalances in the standard
feed between the groups.
Exposure markers are ideally an expression of changes in the xenometabolome, which
correspond to compounds not used in the energy metabolism. Identification of these
metabolites can imform about compounds that the organism has been exposed to and how
these have been metabolised (at least the last step) before they are excreted. From previously
conducted studies it is possible to elaborate on potential health effects from exposure of the
specific compound, but the key quality of this type of markers is that, they may later be used
as biomarkers of the specific food item. Thus, this will involve quantitative analysis and the
specific marker should be validated for uniqueness in its food group and subsequently in
dose-response investigations. The rat study in Paper I uncovered numerous exposure markers,
and it would not be expected to find a similar result in a human intervention study. The
collection of these markers may be used to unravel the presumed more blurred response
behaviour of markers in human studies investigating apple or even fruit-related interventions.
Despite the metabolic differences between rats and humans, it is thought possible to identify
some of the apple and pectin related markers in humans as well, and potentially these could be
combined selectively by multivariate modeling to search for associations between response
patterns and dietary intake. An apple, pectin or fruit exposure or intake biomarker,
considering several metabolites at the same time, could hereby be developed.

36
Several more classical health related biomarkers were measured in the rat study used for non-
targeted metabolomics and they were reported in Paper III. A PCA was constructed with these
markers to give an overview of the rats response variation in the different markers (Figure 3,
Paper III). The traditional biomarkers and physiological data could be combined with e.g. the
metabolome effect markers in a PCA (autoscaled data), and potential co-variance between
these two types of markers could be identified as markers with nearby location in the
multivariate space. This could highlight metabolomics markers of particular interest and
obvious candidates for identification. After identification, a causal biological connection
between the traditional marker and the metabolome marker may at best be verified.
4.2 Evaluation of effects of apple and pectin intake
4.2.1 Effect of apple and pectin on cholesterol metabolism markers
4.2.1.1 Apple and cholesterol metabolism
The main findings in relation to cholesterol distribution in the different lipoprotein fractions
in Paper II and III showed that rat feeding with a moderate amount of fresh apple during 4
weeks reduced total, HDL and LDL cholesterol compared to the control group, whereas a
10% and 20% apple-powder dose only showed significant reduction of HDL cholesterol for
the high dose. The amount of apple used in these studies can be estimated to correspond to a
human intake of 3-4 apples/day for the fresh apple, and the 10% apple-powder dose
corresponds to the same amount. Considerable evidence has shown a clear association
between decreased total and LDL cholesterol and reduced risk of CVD (Briel et al., 2009),
and based on this, intake of fresh apples seems to be favourable to improve cardiovascular
health. The explanation of why the same effect is not found in apple-powder supplemented
rats may most likely relate to the formulation of the apple supplement or the standard feed,
since these rats were the same age, same strain and kept at the same conditions. The standard
feed differed slightly between the studies, since fructose and sucrose were balanced in the
apple-powder study and not in the fresh apple study. The finding of non-significantly elevated
VLDL cholesterol and triacylglyceride TAG in the fresh apple group compared to the control
could be caused by the high fructose content in apples. When fructose is consumed it will
enter the hepatic glycolytic pathway, and in contrast to glucose metabolism, fructose can
serve as an unregulated source of both glycerol-3-phosphate and acetyl-CoA, facilitating
enhanced VLDL and triglyceride production in the liver (Havel, 2005). However, TAG was
not measured in the apple-powder study, and VLDL appeared to rise in the 20% apple-powder
group in the same way as seen in the fresh apple study, indicating that the fructose balancing

37
difference does not give a straightforward clarification on the divergences between the two
studies. The formulation of the apple supplement, dried and grounded apple-powder versus
fresh apple, is most likely the cause of the different results between the studies.
Just as high total and LDL cholesterol have been declared as independent risk markers of
CVD in humans, so has a low HDL cholesterol (Grundy et al., 2004). The significant
decrease of HDL cholesterol observed in both Paper II and III seems surprising, since we
expected a rise in HDL, when LDL and total cholesterol were decreased. This may be brushed
aside as a coincidence or due to the rats CETP deficiency and the different distribution of
cholesterol between HDL and LDL as compared to humans. However, from the literature
(human and rat studies) it seems striking that a lowering in total and LDL cholesterol is not
always accompanied with an increase in HDL cholesterol (Ohashi et al., 2005; Aprikian et al.,
2001; Briel et al., 2009), and a more varied view on cholesterol metabolism may be needed. A
study by Ohashi et al. (2005) has shown that very low HDL cholesterol levels can be present
in rodents, where atherosclerosis is markedly reduced. This result was explained by hepatic
over-expression of the scavenger receptor (SR-BI) in the reverse cholesterol transport (RCT)
pathway. The RCT pathway delivers free cholesterol from macrophages or other cells to the
liver or intestine. Major constituents of the RCT pathway include acceptors, such as HDL and
apolipoprotein A-I, and enzymes, such as lecithin cholesterol acyltransferase and CETP,
which regulate cholesterol transport. Introduction of exogenous active compounds, e.g. from
apple in rats as well as in humans, may induce or decrease activity and production of enzyme,
transporters and receptors acting in the RCT pathway. Lewis & Rader (2005) stated that the
flux of cholesterol through the RCT pathway may be a more important determinant of
cardiovascular disease risk than steady-state HDL cholesterol concentrations. The HDL
cholesterol-lowering effect we observed from the apple treatment may be due to increased
activity of players in the RCT pathway, which thereby might cause a higher throughput and
lower net cholesterol concentrations in HDL particles. Additionally, in this investigation
(Paper II and III), we only measured the main lipoprotein fractions, and since what is
classified as a fraction (e.g. HDL) spans over several sub-fractions with dynamic change in
size and density, this has to be taken into account as well. There is substantial evidence that
different HDL sub-fractions have differing functional properties (Ansell, 2007; Briel et al.,
2009), and their varying effects most likely affect their relation to cardiovascular protection.
Therefore, indiscriminate evaluation of the main HDL fraction as ‘good’ or ‘bad’ does not
seem reliable and future studies should evaluate the risk related to HDL by considering
subfractions as well. The targeted metabolomics approach applying NMR spectroscopy and
PLS modelling could here serve as an elegant and time-saving alternative to the troublesome
separation of subfractions by ultracentrifugation.

38
4.2.1.2 Pectin and cholesterol metabolism
An apple-pectin supplement was introduced in the study in Paper III, and this facilitates
interpretation of pectin as a cholesterol decreasing component of apple as proposed by the two
cholesterol-lowering mechanisms stated in chapter 3.2.1.2. Pectin was not found to exhibit a
lowering effect on total and LDL cholesterol and did not significantly increase the total faecal
bile acids excretion. This finding was supported in the study by Aprikian et al. (2003), who
also found no effect of apple-pectin on total plasma cholesterol. However, these authors found
that hepatic cholesterol significantly decreased and faecal neutral sterol excretion significantly
increased by the pectin treatment. From this result it seems likely that apple-pectin may
enhance neutral sterol excretion (cholesterol and different metabolites hereof) to a higher
degree than bile acid excretion. This is confirmed by an earlier study (Gonzalez et al., 1998),
where apple-pectin was shown to increase cholesterol in faeces. Investigation of hepatic
cholesterol and neutral sterol excretion was unfortunately not examined in the Paper III
investigation, and these aspects would have strengthened our understanding of pectins
influence on cholesterol metabolism in this study.
A high dose of apple-pectin was used in our investigation and since pectin seems to
particularly induce production of acetate (Schweizer & Edwards, 1992), this may to some
extend explain why LDL and total cholesterol are not decreased to the same extent in the
pectin group as in the apple group. As stated in chapter 3.2.1.2, acetate may be a substrate for
cholesterol synthesis and hereby cause a higher total and LDL cholesterol in the pectin group.
4.2.1.3 Pectin as an isolated apple component
From our investigations pectin does not seem to be the main cause of a plasma cholesterol-
lowering effect of apple, but it may still be one of the active players in inducing this effect.
Performing nutritional experiments with purified components may not always be comparable
to how these components are and act when located in their original matrix. Apple-pectin is
typically extracted from dried apple pomace, and the native pectin is made soluble through
heated acid extraction. After this, the pectin is precipitated with alcohol from the aqueous
phase and dried (Obi-Pectin AG, 2010; Thakur et al., 1997). These procedures will
undoubtably introduce some deviating characteristics of pectin as compared to their structure
in the fruit, and pectin may potentially lose its 3 dimensional structure during processing.
Furthermore, one of the pectin markers identified in the metabolomics analysis in Paper I (2-
furoylglycine) indicates that the cleaning procedure may give rise to furan derivatives. In
Paper III we reported a significant increase in plasma alkaline phosphatase in the pectin

39
group, indicating that some adverse health effects may be caused by the high pectin dose, and
the furan derivative may be speculated to partially cause this effect.
Compounds occurring naturally in the apple may even trail pectin through the purification
procedure, and a urinary metabolite from the study in Paper I (pyrrole-2-carboxcylic acid)
indicates a high intake of hydroxyproline in the pectin group. Apple fruit tissue has a high
content of readily soluble glycoproteins, rich in hydroxyproline, and Knee (1973) found this
amino acid still present in the pectin fraction after the purification process. Therefore, when
introducing isolated components in interventions, the knowledge of purity and comparability
of the component in the source material is a crucial factor in interpretation of results and
involved mechanisms. Specific for pectin, it remains questionable if it is at all possible to
isolate and use this component to obtain results that are comparable to the component
embedded in the whole food matrix.
4.2.2 Metabolomics exposure and effect markers of apple and pectin intake
4.2.2.1 Apple exposure and effect markers
Epicatechin, one of the main polyphenols in apples was, not surprisingly, detected as a urinary
exposure marker of this fruit (Paper I). The epicatechin glucuronide, methylated epicatechin
and catechin glucuronide were also tentitatively identified, and illustrates the phase II
metabolism of the parent compound. Only limited research has been conducted to clarify
potential health effects of these compounds (Crozier et al., 2009; Manach et al., 2004), and it
seems likely that the mammalian phase II enzymatic protection mechanism neutralises most
health beneficial effects of catechins by glucuronidation. The compound dihydroxyphenyl-γ-
valerolactone was also tentitatively identified and is possibly a microbial metabolite
originating from procyanidin and epicatechin. This metabolite and the epicatechin aglycone
may more likely be contributors to the health effects of apple that we observed in Paper III,
especially in regard to the increased hepatic gene expression related to glutathione synthesis
as well as glutathione utilisation that potentially demonstrate a higher ability to handle
oxidative stress in the apple fed rats.
Since apple contains a relatively high level of quercetin glycosides some metabolites with this
origin was expected, but none were found. Quercetin conjugates are exclusively present in the
peel, and since all rats did not have the same preference for the eating the apple peel (as stated
in Paper III), this may have caused an uneven quercetin exposure among the animals. The
procedure for marker selection based on a consistent response among all rats in a group and
was not able to select such markers.

40
Several markers were identified that very likely have their origin from chlorogenic acid
(quinic acid, m-coumaric acid, hippuric acid and potentially 3-hydroxyhippuric acid).
Hippuric acid and 3-hydroxyhippuric acid were present as effect markers (high response in
the apple group and low response in the control group), and this may indicate a higher
efficacy of specific metabolic pathways of the gut microbiota and glycine conjugation system
in liver and kidney. An effect on the composition and efficacy of the gut microbiota in the
present study is therefore indicated and is in accordance with previously published findings
from this study, where apple intake was shown to affect caecal microbial composition by
applying a PCA to data from denaturing gradient gel electrophoresis profiles of 34 different
bacteria strains (Licht et al., 2010).
4.2.2.2 Pectin exposure and effect markers
Pectin is thought to be completely fermented by the intestinal microbiota and the resulting
SCFA primarily used as fuel in different compartments of the organism. Consequently, it was
not expected to discover any pectin exposure markers in our metabolomics analysis, except
potential residues of SCFA and metabolites hereof. However, 39 pectin exposure markers
were detected, whereof two were identified (pyrrole-2-carboxylic and 2-furoylglycine). These
two markers emphasise the influence of the pectin purification method and how this may
affect what we at first think is completely comparable with the unisolated component in the
original material. This highlights the value of the non-targeted and hypothesis-free
metabolomics approach; it promotes new and unexpected findings that may be helpful in
interpretation of results from a specific intervention.
4.2.2.3 Catecholamine metabolism
Several apple and pectin effect markers were tentatively identified, and four of these seemed
to be catecholamine metabolites that may describe changes in the hormonal metabolism after
the apple and pectin diet. In the apple group 3-methoxy-4-hydroxyphenylethyleneglycol
sulphate was increased compared to the control group. This compound is the major metabolite
of norepinephrine (Goldstein et al., 2003), and to support our identification a fragment ion
with a mass of 165.0557 m/z was found, and it seems likely to be the unconjugated parent ion
(loss of the sulphate group, SO3-). Homovanillic acid sulphate, as another catecholamine
metabolite that originates from L-dopa, was also tentatively identified as an effect marker that
increased in the apple group. Metanephrine, which is a catechol O-methyltransferase
derivative of epinephrine (adrenalin), was found to decrease in the apple group compared to
the control group. Additionally, in the pectin group we found an upregulation of
hydroxyphenylacetylglycine and methoxytyrosine, which are both metabolites that originate

41
from L-dopa (Goldstein et al., 2003). Several different enzymes are active in catecholamine
metabolism, and it seems likely that these are affected in different ways by circulating
bioactive components from apple and pectin intake. It may cautiously be hypothesised that the
physiological response to apple-pectin intake (from fresh apple and purified) especially
affects gene(s) or enzyme(s) related to conversion of L-dopa and norepinephrine, and other
apple components affect gene or enzyme systems related to liberation of metanephrine and
epinephrine. Both norepinephrine and epinephrine have been subject to substantial research
attempting to establish a link between various health disorders and the catecholaminerigic
system, but their mechanisms of action are still highly debated (Kasparov & Teschemacher,
2008). Special focus has been on the function of the cardiovascular system, and drugs that
interact with norepinephrine and epinephrine receptors are widely used in cardiovascular
medicine (Kasparov & Teschemacher, 2008).
4.2.2.4 Cholesterol metabolism
The tentatively identified apple effect marker, 3-methylglutaconic acid, seems very interesting
with regard to the total and LDL cholesterol lowering effect observed for apple in Paper III. 3-
methylglutaconic acid is an intermediate metabolite in the mevalonate shunt, the isoprenoid
biosynthetic pathway that appears to participate in the regulation of cholesterol synthesis
(Marinier et al., 1987). Mevalonate is the direct product of the rate-limiting step in cholesterol
synthesis, which is catalysed by HMG CoA reductase and 3-methylglutaconic acid is
produced in a co-pathway to the mevalonate-cholesterol pathway (Pappu et al., 2002). The
down-regulation of 3-methylglutaconic acid in the apple group is in concordance with the
high, although non-significant, decrease in the hmgcr gene expression described for these rats
in Paper III, and it is expected that also mevalonate is downregulated with reduced cholesterol
synthesis as a consequence. If these findings hide the truth, there are some divergences with
our discovery of increased total bile acid excretion in the apple group (Paper III), since this is
thought to induce increased cholesterol synthesis. We did not find 3-methylglutaconic acid or
other directly related cholesterol markers being up- or down-regulated in the pectin group,
and it appears to be other bioactive components or factors than pectin that are responsible for
a potential reduction in cholesterol synthesis. In general, the reduction of plasma cholesterol
by apple seems more complex than that illustrated by generally known mechanisms, and it
seems evident that more/other players in cholesterol metabolism should be investigated more
comprehensively.

42
4.2.3 Why does an apple a day keep the doctor away?
From the studies included in this project fresh apple seems to be a health promoting food item
with the ability to reduce total and LDL cholesterol, increase total and primary bile acids,
decrease secondary bile acids, and a higher capability to handle oxidative stress is indicated
due to effects on gene expression responses related to glutathione formation and utilisation.
Additionally, urinary excretion of phenolics, polyphenols and potential metabolites involved
in catecholamine and cholesterol metabolism point tentatively towards health promoting
abilities of fresh apple, but since no firm evidence excists considering these markers, this is
only mentioned cautiously as possible health effects. It is important to state that these results
were obtained from rat studies and that extrapolation to humans should be done carefully
considering the aspects stated in section 4.1.2.
To answer the question of ‘why does an apple a day to keep the doctor away?’ the soluble
fibre fraction of apple, namely pectin, was inspected. Our investigations could not ascribe this
component major health promoting effects, with regard to cholesterol metabolism, but it is
worth mentioning that a much higher pectin dose was used as compared to the pectin dose
naturally occuring in the apple. Consistent with our results Aprikian et al. (2003) found no
effect of apple-pectin on total plasma cholesterol in rats, but a combined treatment with apple
polyphenols, and apple-pectin showed a significant plasma cholesterol lowering effect. The
plasma cholesterol-lowering effect we observed with fresh apple, and not with pectin alone
(Paper III), may be caused by a combined effect of the polyphenols and pectin present in
whole apple. However, we did not find total or LDL cholesterol lowering potential of dried
apple-powder, which contains both pectin and polyphenols, and the formulation of the
bioactive components in the whole fruit matrix may instead be suggested as responsible for
the health beneficial effects. It seems evident that the bioavailability of both the polyphenol
fraction and the fibre fraction from apple are highly dependent on the composition and the
competences of the host intestinal microbiota, and the apple matrix as a whole may be
speculated to have a particularly beneficial prebiotic effect.

43
44
5 Conclusion
During the research in this project MS and NMR-based metabolomics were employed as new
approaches to evaluate the health effects of apple and pectin intake. The results from the three
papers included in this thesis can be summarised as follows:
The application of a non-targeted MS-based metabolomics approach (Paper I)
demonstrated that intake of apple and apple-pectin had a high impact on the urinary
metabolome. Numerous clear exposure and effect markers of apple and apple-pectin
intake were found and several new apple-related urinary metabolites were identified.
Most of the excreted metabolites were products of diverse metabolic processes
including phase II glucuronidation, glycine-conjugation and/or microbial metabolism.
A targeted NMR-based metabolomics approach facilitated construction of
chemometric models (Paper II) capable of fast and reliable prediction of cholesterol in
different lipoprotein fractions of stored rat plasma. Application of these models
demonstrated a significant HDL cholesterol lowering effect of dried apple-powder in
rats.
Based on the chemometric prediction models in Paper II, cholesterol in the different
plasma lipoprotein fractions was predicted from rats fed with fresh apple or apple-
pectin (Paper III). Apple intake induced a significant decrease in plasma LDL, HDL
and total cholesterol whereas pectin intake did not induce any significant changes in
this aspect. Non-metabolomics measurements illustrated that apple increased excretion
of bile acids and revealed significant effects on genes involved in the hepatic
glutathione redox cycle indicating a higher capability to handle oxidative stress. Pectin
only affected expression related to glutathione utilisation.
In general, both the non-targeted and targeted MS and NMR-based metabolomics approach
have served as powerful platforms during these studies, and the metabolomics technology
seems very promising in further deconvolution of the interplay between dietary intake and
health status. The investigation revealed overall that particularly fresh apple appears to have
health beneficial effects on cholesterol metabolism, but from our results pectin cannot be
appointed as the major apple component that caused this effect. The formulation of the
bioactive components in the apple fruit matrix and the interaction with the intestinal
microbiota seems of key importance for the potential health effects of apple. However, since
these investigations were conducted with rat models, it is important to stress careful
extrapolation to man, and confirming experiments are warranted in humans.

45
6 Perspectives
Metabolomics is a discipline dedicated to the study of metabolites, their dynamics,
composition, interactions and responses to interventions or to changes in the environment.
Numerous factors along the metabolomics pipeline have to be considered in the establishment
of this technique to achieve successful and reliable results. Once firmly established, there
seems to be various ways to use this technique, especially the use of every analytical run in a
multipurpose approach seems promising. In this way the maximum yield can be gained from
expensive intervention studies and possible new correlating variables or patterns among
multiple samples and measurements can be revealed. For instance, plasma NMR spectra could
provide a metabolite profile of around 100 known compounds, and at the same time the
lipoprotein profile (even the subclasses of the lipoproteins) could be examined. Several other
well-established disease risk markers may possibly be predicted at the same time from these
same spectra. These results could again be compared with data from MS-based metabolomics,
from which a much higher number of metabolites could be identified. However, the
identification procedure of metabolites of interest is continuously a difficult and time-
consuming task, but fortunately databases are constantly growing in reported metabolites,
making the task somewhat easier for the researcher. When a metabolite is appropriately
identified it would be of high benefit to quantify this by a targeted analysis. In fact, the
maximum gain of metabolomics may be obtained when qualitative and quantitative analysis is
combined. The knowledge of metabolite identity and their quantitative perturbations will
provide information that can be very useful in interpretation of affected biochemical
pathways.
A final way to combine and correlate data should be mentioned. An ultimate challenge
includes integration of the different ‘omics technologies: proteomics, genomics and
metabolomics, to obtain a more complete picture of health status and in this way to unravel
links between disease prevention and dietary intake.

46
7 References
Ansell BJ (2007). The two faces of the 'good' cholesterol. Cleve Clin J Med 74, 697-5.
Appeldoorn MM, Vincken JP, Aura AM, Hollman PC, & Gruppen H (2009). Procyanidin dimers are
metabolized by human microbiota with 2-(3,4-dihydroxyphenyl)acetic acid and 5-(3,4-dihydroxyphenyl)-
gamma-valerolactone as the major metabolites. J Agric Food Chem 57, 1084-1092.
Aprikian O, Duclos V, Guyot S, Besson C, Manach C, Bernalier A, Morand C, Remesy C, & Demigne C (2003).
Apple pectin and a polyphenol-rich apple concentrate are more effective together than separately on cecal
fermentations and plasma lipids in rats. J Nutr 133, 1860-1865.
Aprikian O, Levrat-Verny MA, Besson C, Busserolles J, Remesy C, & Demigne C (2001). Apple favourably
affects parameters of cholesterol metabolism and of anti-oxidative protection in cholesterol-fed rats. Food
Chemistry 75, 445-452.
Beckonert O, Keun HC, Ebbels TM, Bundy J, Holmes E, Lindon JC, & Nicholson JK (2007). Metabolic
profiling, metabolomic and metabonomic procedures for NMR spectroscopy of urine, plasma, serum and tissue
extracts. Nat Protoc 2, 2692-2703.
Bijlsma S, Bobeldijk I, Verheij ER, Ramaker R, Kochhar S, Macdonald IA, van OB, & Smilde AK (2006).
Large-scale human metabolomics studies: a strategy for data (pre-) processing and validation. Anal Chem 78,
567-574.
Block FH & Packard M (1946). The nuclear induction experiment. Physical Review 70, 474-485.
Boyer J & Liu RH (2004). Apple phytochemicals and their health benefits. Nutr J 3, 5.
Briel M, Ferreira-Gonzalez I, You JJ, Karanicolas PJ, Akl EA, Wu P, Blechacz B, Bassler D, Wei X, Sharman
A, Whitt I, ves da SS, Khalid Z, Nordmann AJ, Zhou Q, Walter SD, Vale N, Bhatnagar N, O'Regan C, Mills EJ,
Bucher HC, Montori VM, & Guyatt GH (2009). Association between change in high density lipoprotein
cholesterol and cardiovascular disease morbidity and mortality: systematic review and meta-regression analysis.
BMJ 338, b92.
Bruce SJ, Jonsson P, Antti H, Cloarec O, Trygg J, Marklund SL, & Moritz T (2008). Evaluation of a protocol for
metabolic profiling studies on human blood plasma by combined ultra-performance liquid chromatography/mass
spectrometry: From extraction to data analysis. Anal Biochem 372, 237-249.
Cren-Olive C, Teissier E, Duriez P, & Rolando C (2003). Effect of catechin O-methylated metabolites and
analogues on human LDL oxidation. Free Radic Biol Med 34, 850-855.
Crozier A, Jaganath IB, & Clifford MN (2009). Dietary phenolics: chemistry, bioavailability and effects on
health. Nat Prod Rep 26, 1001-1043.
Dettmer K, Aronov PA, & Hammock BD (2007). Mass spectrometry-based metabolomics. Mass Spectrom Rev
26, 51-78.
Donovan JL, Crespy V, Manach C, Morand C, Besson C, Scalbert A, & Remesy C (2001). Catechin is
metabolized by both the small intestine and liver of rats. J Nutr 131, 1753-1757.

47
Donovan JL, Manach C, Rios L, Morand C, Scalbert A, & Remesy C (2002). Procyanidins are not bioavailable
in rats fed a single meal containing a grapeseed extract or the procyanidin dimer B3. Br J Nutr 87, 299-306.
Dunn WB & Ellis DI (2005). Metabolomics: Current analytical platforms and methodologies. Trends in
Analytical Chemistry 24, 285-294.
Escarpa A & Gonzalez MC (1998). High-performance liquid chromatography with diode-array detection for the
determination of phenolic compounds in peel and pulp from different apple varieties. J Chromatogr A 823, 331-
337.
Fardet A, Llorach R, Martin JF, Besson C, Lyan B, Pujos-Guillot E, & Scalbert A (2008a). A liquid
chromatography-quadrupole time-of-flight (LC-QTOF)-based metabolomic approach reveals new metabolic
effects of catechin in rats fed high-fat diets. J Proteome Res 7, 2388-2398.
Fardet A, Llorach R, Orsoni A, Martin JF, Pujos-Guillot E, Lapierre C, & Scalbert A (2008b). Metabolomics
provide new insight on the metabolism of dietary phytochemicals in rats. J Nutr 138, 1282-1287.
Fiehn O (2002). Metabolomics--the link between genotypes and phenotypes. Plant Mol Biol 48, 155-171.
Giovane A, Balestrieri A, & Napoli C (2008). New insights into cardiovascular and lipid metabolomics. J Cell
Biochem 105, 648-654.
Goldstein DS, Eisenhofer G, & Kopin IJ (2003). Sources and significance of plasma levels of catechols and their
metabolites in humans. J Pharmacol Exp Ther 305, 800-811.
Gonthier MP, Verny MA, Besson C, Remesy C, & Scalbert A (2003). Chlorogenic acid bioavailability largely
depends on its metabolism by the gut microflora in rats. J Nutr 133, 1853-1859.
Gonzalez M, Rivas C, Caride B, Lamas MA, & Taboada MC (1998). Effects of orange and apple pectin on
cholesterol concentration in serum, liver and faeces. J Physiol Biochem 54, 99-104.
Grundy SM, Cleeman JI, Merz CN, Brewer HB, Jr., Clark LT, Hunninghake DB, Pasternak RC, Smith SC, Jr.,
& Stone NJ (2004). Implications of recent clinical trials for the National Cholesterol Education Program Adult
Treatment Panel III guidelines. J Am Coll Cardiol 44, 720-32.
Gürdeniz G, Kristensen M, Skov T, Bro R, & Dragsted LO (2011). The effect of LC-MS data processing
methods on the selection of plasma biomarkers in fed vs. fasted rats. Submitted to Analytical and Bioanalytical
Chemistry Enclosed as supplemental material.
Ha YC & Barter PJ (1982). Differences in plasma cholesteryl ester transfer activity in sixteen vertebrate species.
Comp Biochem Physiol B 71, 265-269.
Havel PJ (2005). Dietary fructose: implications for dysregulation of energy homeostasis and lipid/carbohydrate
metabolism. Nutr Rev 63, 133-157.
Holmes E, Loo RL, Stamler J, Bictash M, Yap IK, Chan Q, Ebbels T, De IM, Brown IJ, Veselkov KA, Daviglus
ML, Kesteloot H, Ueshima H, Zhao L, Nicholson JK, & Elliott P (2008). Human metabolic phenotype diversity
and its association with diet and blood pressure. Nature 453, 396-400.

48
Hotelling H (1933). Analysis of complex statistical variable into principal components. Journal of Educational
Phychology 24, 417-441.
Human Metabolome Database. http://www.hmdb.ca. 2010. 15-6-2010.
Ref Type: Internet Communication
INRA. Phenol-explorer. http://www.phenol-explorer.eu. 2010. 20-6-2010.
Ref Type: Internet Communication
Ito H, Gonthier MP, Manach C, Morand C, Mennen L, Remesy C, & Scalbert A (2005). Polyphenol levels in
human urine after intake of six different polyphenol-rich beverages. Br J Nutr 94, 500-509.
Judd PA & Truswell AS (1982). Comparison of the effects of high- and low-methoxyl pectins on blood and
faecal lipids in man. Br J Nutr 48, 451-458.
Kasparov S & Teschemacher AG (2008). Altered central catecholaminergic transmission and cardiovascular
disease. Exp Physiol 93, 725-740.
Katajamaa M & Oresic M (2007). Data processing for mass spectrometry-based metabolomics. J Chromatogr A
1158, 318-328.
Kawai Y, Nishikawa T, Shiba Y, Saito S, Murota K, Shibata N, Kobayashi M, Kanayama M, Uchida K, & Terao
J (2008). Macrophage as a target of quercetin glucuronides in human atherosclerotic arteries: implication in the
anti-atherosclerotic mechanism of dietary flavonoids. J Biol Chem 283, 9424-9434.
Kay RM & Truswell AS (1977). Effect of citrus pectin on blood lipids and fecal steroid excretion in man. Am J
Clin Nutr 30, 171-175.
Keun HC (2006). Metabonomic modeling of drug toxicity. Pharmacol Ther 109, 92-106.
Keys A, Grande F, & Anderson JT (1961). Fiber and pectin in the diet and serum cholesterol concentration in
man. Proc Soc Exp Biol Med 106, 555-558.
Knee M (1973). Polysaccharides and glycoproteins of apple fruit cell walls. Phytochemistry 12, 637-653.
Lambert LB & Mazzola EP (2004). Nuclear Magnetic Resonance Spectroscopy. An Introduction to Principles,
Applications, and Experimental methods., 1 ed. Pearson Education Inc., New Jersey, USA.
Lauridsen M, Hansen SH, Jaroszewski JW, & Cornett C (2007). Human urine as test material in 1H NMR-based
metabonomics: recommendations for sample preparation and storage. Anal Chem 79, 1181-1186.
Lenz EM, Bright J, Wilson ID, Hughes A, Morrisson J, Lindberg H, & Lockton A (2004). Metabonomics,
dietary influences and cultural differences: a 1H NMR-based study of urine samples obtained from healthy
British and Swedish subjects. J Pharm Biomed Anal 36, 841-849.
Lewis GF & Rader DJ (2005). New insights into the regulation of HDL metabolism and reverse cholesterol
transport. Circ Res 96, 1221-1232.

49
Li C, Lee MJ, Sheng S, Meng X, Prabhu S, Winnik B, Huang B, Chung JY, Yan S, Ho CT, & Yang CS (2000).
Structural identification of two metabolites of catechins and their kinetics in human urine and blood after tea
ingestion. Chem Res Toxicol 13, 177-184.
Licht TR, Hansen M, Bergstrom A, Poulsen M, Krath BN, Markowski J, Dragsted LO, & Wilcks A (2010).
Effects of apples and specific apple components on the cecal environment of conventional rats: role of apple
pectin. BMC Microbiol 10, 13.
Maher AD, Zirah SF, Holmes E, & Nicholson JK (2007). Experimental and analytical variation in human urine
in 1H NMR spectroscopy-based metabolic phenotyping studies. Anal Chem 79, 5204-5211.
Manach C, Hubert J, Llorach R, & Scalbert A (2009). The complex links between dietary phytochemicals and
human health deciphered by metabolomics. Mol Nutr Food Res 53, 1303-1315.
Manach C, Scalbert A, Morand C, Remesy C, & Jimenez L (2004). Polyphenols: food sources and
bioavailability. Am J Clin Nutr 79, 727-747.
Manach C, Williamson G, Morand C, Scalbert A, & Remesy C (2005). Bioavailability and bioefficacy of
polyphenols in humans. I. Review of 97 bioavailability studies. Am J Clin Nutr 81, 230S-242S.
Marinier E, Lincoln BC, Garneau M, David F, & Brunengraber H (1987). Contribution of the shunt pathway of
mevalonate metabolism to the regulation of cholesterol synthesis in rat liver. J Biol Chem 262, 16936-16940.
Metabolomics Society. http://www.metabolomicssociety.org. 2010. 4-5-2010.
Ref Type: Internet Communication
Moco S, Bino RJ, De Vos RCH, & Vervoort J (2007). Metabolomics technologies and metabolite identification.
Trends in Analytical Chemistry 26, 855-866.
Mullen W, Edwards CA, & Crozier A (2006). Absorption, excretion and metabolite profiling of methyl-,
glucuronyl-, glucosyl- and sulpho-conjugates of quercetin in human plasma and urine after ingestion of onions.
Br J Nutr 96, 107-116.
Nagasako-Akazome Y, Kanda T, Ikeda M, & Shimasaki T (2005). Serum cholesterol-lowering effect of apple
polyphenols in healthy subjects. Journal of Oleo Science 54, 143-151.
National Food Institute. Danish food composition databank. Version 7.01. 2010.
Ref Type: Internet Communication
Natsume M, Osakabe N, Oyama M, Sasaki M, Baba S, Nakamura Y, Osawa T, & Terao J (2003). Structures of
(-)-epicatechin glucuronide identified from plasma and urine after oral ingestion of (-)-epicatechin: differences
between human and rat. Free Radic Biol Med 34, 840-849.
Nørgaard L, Saudland A, Wagner J, Nielsen JP, Munck L, & Engelsen SB (2000). Interval partial least-squares
regression (iPLS): A comparative chemometric study with an example from near-infrared spectroscopy. Applied
Spectroscopy 54, 413-419.
Normen L, Johnsson M, Andersson H, van GY, & Dutta P (1999). Plant sterols in vegetables and fruits
commonly consumed in Sweden. Eur J Nutr 38, 84-89.

50
Obi-Pectin AG. www.obipektin.ch. 2010. 10-6-2010.
Ref Type: Internet Communication
Ohashi R, Mu H, Wang X, Yao Q, & Chen C (2005). Reverse cholesterol transport and cholesterol efflux in
atherosclerosis. QJM 98, 845-856.
Oliver SG, Winson MK, Kell DB, & Baganz F (1998). Systematic functional analysis of the yeast genome.
Trends Biotechnol 16, 373-378.
Oresic M (2009). Metabolomics, a novel tool for studies of nutrition, metabolism and lipid dysfunction. Nutr
Metab Cardiovasc Dis 19, 816-824.
Pappu AS, Steiner RD, Connor SL, Flavell DP, Lin DS, Hatcher L, Illingworth DR, & Connor WE (2002).
Feedback inhibition of the cholesterol biosynthetic pathway in patients with Smith-Lemli-Opitz syndrome as
demonstrated by urinary mevalonate excretion. J Lipid Res 43, 1661-1669.
Pauli W (1924). The question of the theoretical meaning of the satelite of some spectralline and their impact on
the magnetic fields. Naturwissenschaften 12, 741-743.
Pearce JT, Athersuch TJ, Ebbels TM, Lindon JC, Nicholson JK, & Keun HC (2008). Robust algorithms for
automated chemical shift calibration of 1D 1H NMR spectra of blood serum. Anal Chem 80, 7158-7162.
Pearson K (1901). On lines and planes of cloest fit to systems of point in space. Philosophical Magazine 2, 559-
572.
Peters S, van Velzen E, & Janssen HG (2009). Parameter selection for peak alignment in chromatographic
sample profiling: objective quality indicators and use of control samples. Anal Bioanal Chem 394, 1273-1281.
Plumb R, Castro-Perez J, Granger J, Beattie I, Joncour K, & Wright A (2004). Ultra-performance liquid
chromatography coupled to quadrupole-orthogonal time-of-flight mass spectrometry. Rapid Commun Mass
Spectrom 18, 2331-2337.
Poole CE (2003). The essence of chromatography, 1 ed. Amsterdam, Netherlands.
Purcell EM, Torrey HC, & Pound RV (1946). Resonace absorbtion by nuclear magnetic moments in a solid.
Physical Review 69, 37-38.
Rani B & Kawatra A (1994). Fibre constituents of some foods. Plant Foods Hum Nutr 45, 343-347.
Robertson DG (2005). Metabonomics in toxicology: a review. Toxicol Sci 85, 809-822.
Rodwell VW, Nordstrom JL, & Mitschelen JJ (1976). Regulation of HMG-CoA reductase. Adv Lipid Res 14, 1-
74.
Sable-Amplis R, Sicart R, A, & d R (1983a). Further studies on the cholesterol-lowering effect of apple in
human. Biochemical mechanisms involved. Nutrition Research 3, 325-328.
Sable-Amplis R, Sicart R, & Bluthe E (1983b). Decreased cholesterol ester levels in tissues of hamster fed with
apple fiber enriched diet. Nutrition Reports International 27, 881-889.
51
Saude EJ & Sykes BD (2007). Urine stability for metabolomic studies: effects of preparation and storage.
Metabolomics 3, 19-27.
Scalbert A, Brennan L, Fiehn O, Hankemeier T, Kristal BS, van OB, Pujos-Guillot E, Verheij E, Wishart D, &
Wopereis S (2009). Mass-spectrometry-based metabolomics: limitations and recommendations for future
progress with particular focus on nutrition research. Metabolomics 5, 435-458.
Schwab U, Louheranta A, Torronen A, & Uusitupa M (2006). Impact of sugar beet pectin and polydextrose on
fasting and postprandial glycemia and fasting concentrations of serum total and lipoprotein lipids in middle-aged
subjects with abnormal glucose metabolism. Eur J Clin Nutr 60, 1073-1080.
Schweizer TF & Edwards CA (1992). Dietary fibre - A component of food. Nutritional function in health and
disease. Springer-verlag, London, United Kingdom.
Seppanen-Laakso T & Oresic M (2009). How to study lipidomes. J Mol Endocrinol 42, 185-190.
Shen Q, Li X, Qiu Y, Su M, Liu Y, Li H, Wang X, Zou X, Yan C, Yu L, Li S, Wan C, He L, & Jia W (2008).
Metabonomic and metallomic profiling in the amniotic fluid of malnourished pregnant rats. J Proteome Res 7,
2151-2157.
Sigma Aldrich. Pectin structure. http://www.sigmaaldrich.com/life-science/metabolomics/enzyme-explorer/
learning-center/carbohydrate-analysis/carbohydrate-analysis-iii.html#Pectin.2010.25-6-2010.
Ref Type: Internet Communication
Smilde A, Bro R, & Geladi P (2004). Multi-way Analysis. Applications in the chemical sciences. J. Wiley &
Sons.
Solanky KS, Bailey NJ, Beckwith-Hall BM, Davis A, Bingham S, Holmes E, Nicholson JK, & Cassidy A
(2003). Application of biofluid 1H nuclear magnetic resonance-based metabonomic techniques for the analysis
of the biochemical effects of dietary isoflavones on human plasma profile. Anal Biochem 323, 197-204.
Spencer JP, Schroeter H, Crossthwaithe AJ, Kuhnle G, Williams RJ, & Rice-Evans C (2001). Contrasting
influences of glucuronidation and O-methylation of epicatechin on hydrogen peroxide-induced cell death in
neurons and fibroblasts. Free Radic Biol Med 31, 1139-1146.
Spiller GA (2001). CRC handbook of dietary fibre in Human Nutrition, 3 ed. CRC Press, Florida, USA.
Stasse-Wolthuis M, Albers HF, van Jeveren JG, Wil de JJ, Hautvast JG, Hermus RJ, Katan MB, Brydon WG, &
Eastwood MA (1980). Influence of dietary fiber from vegetables and fruits, bran or citrus pectin on serum lipids,
fecal lipids, and colonic function. Am J Clin Nutr 33, 1745-1756.
Stella C, Beckwith-Hall B, Cloarec O, Holmes E, Lindon JC, Powell J, van der OF, Bingham S, Cross AJ, &
Nicholson JK (2006). Susceptibility of human metabolic phenotypes to dietary modulation. J Proteome Res 5,
2780-2788.
Stryer L (1995). Biochemistry, 4 ed. W.H.Freeman and Company, New Youk, USA.
Sysi-Aho M, Katajamaa M, Yetukuri L, & Oresic M (2007). Normalization method for metabolomics data using
optimal selection of multiple internal standards. BMC Bioinformatics 8, 93.
52
Thakur BR, Singh RK, & Handa AK (1997). Chemistry and uses of pectin--a review. Crit Rev Food Sci Nutr 37,
47-73.
Theuwissen E & Mensink RP (2008). Water-soluble dietary fibers and cardiovascular disease. Physiol Behav 94,
285-292.
Trautwein EA, Rieckhoff D, Kunath-Rau A, & Erbersdobler HF (1998). Psyllium, not pectin or guar gum, alters
lipoprotein and biliary bile acid composition and fecal sterol excretion in the hamster. Lipids 33, 573-582.
Unno T, Tamemoto K, Yayabe F, & Kakuda T (2003). Urinary excretion of 5-(3',4'-dihydroxyphenyl)-gamma-
valerolactone, a ring-fission metabolite of (-)-epicatechin, in rats and its in vitro antioxidant activity. J Agric
Food Chem 51, 6893-6898.
van den Berg RA, Hoefsloot HC, Westerhuis JA, Smilde AK, & van der Werf MJ (2006). Centering, scaling,
and transformations: improving the biological information content of metabolomics data. BMC Genomics 7, 142.
van der Sluis AA, Dekker M, de JA, & Jongen WM (2001). Activity and concentration of polyphenolic
antioxidants in apple: effect of cultivar, harvest year, and storage conditions. J Agric Food Chem 49, 3606-3613.
Venter CS, Vorster HH, & Cummings JH (1990). Effects of dietary propionate on carbohydrate and lipid
metabolism in healthy volunteers. Am J Gastroenterol 85, 549-553.
Villas-Boas SG, Roessner U, Hansen MAE, Smedsgaard J, & Nielsen.J. (2007). Metabolome analysis: An
introduction., 1 ed. John Wiley and Sons Inc., Hoboken, New Jersey, USA.
Want EJ, O'Maille G, Smith CA, Brandon TR, Uritboonthai W, Qin C, Trauger SA, & Siuzdak G (2006).
Solvent-dependent metabolite distribution, clustering, and protein extraction for serum profiling with mass
spectrometry. Anal Chem 78, 743-752.
Waters (2005). Waters Micromass Q-Tof Premier Mass Spectrometry. Operator's Guide, Revision B ed. Waters
Corporation, Milford, USA.
Westerhuis J, Hoefsloot H, Smith S, Vis D, Smilde A, van Velzeb E, van Duijnhoven JPM, & van Dorsten FA
(2008). Assessment of PLSDA cross validation. Metabolomics 4, 81-89.
Wold S (1987). Principal Component Analysis. Chemometrics and Intelligent Laboratory Systems 2, 37-52.
Wold S, Sjöström M, & Eriksson L (2001). PLS-regression: a basic tool of chemometrics. Chemometrics and
intelligent Laboratory Systems 58, 109-130.
Wolever TM, Brighenti F, Royall D, Jenkins AL, & Jenkins DJ (1989). Effect of rectal infusion of short chain
fatty acids in human subjects. Am J Gastroenterol 84, 1027-1033.
Wolever TM, Spadafora P, & Eshuis H (1991). Interaction between colonic acetate and propionate in humans.
Am J Clin Nutr 53, 681-687.
Wong JM, de SR, Kendall CW, Emam A, & Jenkins DJ (2006). Colonic health: fermentation and short chain
fatty acids. J Clin Gastroenterol 40, 235-243.


1
LC-MS metabolomics top-down approach reveals new exposure and effect
biomarkers of apple and apple-pectin intake
Mette Kristensen · Søren B. Engelsen · Lars O. Dragsted
M. Kristensen · S.B. Engelsen
Department of Food Science, Faculty of Life Sciences, University of Copenhagen,
Rolighedsvej 30, 1958 Frederiksberg, Denmark. Email: [email protected], tlf: +45 35 33 25
70, fax: +45 35 33 32 45
L.O. Dragsted
Department of Human Nutrition, Faculty of Life Sciences, University of Copenhagen,
Denmark
ABBREVIATED TITLE: LC-MS metabolomics markers of apple and pectin intake
ACKNOWLEGEDMENT OF FINANCIAL SUPPORT: Funded by the European
Commission (ISAFRUIT) under the Thematic Priority 5–Food Quality and Safety of the 6th
Framework Programme of RTD (Contract no. FP6-FOOD–CT-2006-016279)
2
Abstract
In order to investigate exposure end effect markers of fruit and fruit fibre intake we
investigated how fresh apple or apple-pectin affects the urinary metabolome of rats. Twenty-
four Fisher 344 male rats were randomized into 3 groups and fed a standard diet with different
supplementations added in two of the groups (7% apple-pectin or 10 g raw apple). After 24
days of feeding, 24 hour urine was collected and analyzed by UPLC-QTOF-MS in positive
and negative ionization mode. Metabolites that responded to the apple or pectin diets were
selected and classified as either exposure or effect markers based on their response patterns.
An initial principal component analysis (PCA) of all detected metabolites showed a clear
separation between the groups and during marker identification several new apple and/or
pectin markers were found. Quinic acid, m-coumaric acid and (-)epicatechin were identified
as exposure markers and hippuric acid as one of the effect markers of apple intake. Pyrrole-2-
carboxylic acid and 2-furoylglycine were identified as pectin exposure markers while 2-
piperidinone was recognized as a pectin effect marker. None of them has earlier been related
to intake of pectin or other fibre products. We discuss these new potential exposure and effect
markers and their interpretation.
Keywords: Metabolomics · LC-MS · apple · pectin · exposure and effect biomarkers

3
1 Introduction
It is well known that fruit consumption has preventive effects on degenerative diseases and
especially cardiovascular disease (Bazzano et al., 2002; Liu et al., 2000), however the causal
factors and their mechanisms of action are not well known. Apples represent one of the major
fruits consumed throughout the western countries and the disease preventive factors of this
fruit seem particularly relevant to investigate. Consumption of nutrients and other bioactive
compounds from fruit will most likely interact with several physiological functions and
metabolic pathways in the organism and hereby reduce the risk of disease. Methods that can
handle multiple responses therefore seem particularly beneficial compared to the classical
univariate approaches most often used in nutrition research. Metabolomics aim for
measurement of all metabolites present in a given biological sample and by use of this
technique the metabolic effect of e.g. apple intake can hereby be explored in a top-down
manner compared to more targeted analytical methods. The open-minded approach of
metabolomics has great potential to generate new hypotheses and thereby to improve our
mechanistic understanding of why ‘an apple a day keeps the doctor away’. Compared to a
human study, the rats in this investigation are expected to exhibit a much lower level of
background variation due to their isogenic nature and controllable habits and consequently a
larger number of exposure- and effect related features in the recorded metabolome profiles.
This may ease interpretation of effects in future human intervention studies where exposure to
apple, pectin or fruit intake in general may be partially hidden in the large inter-individual
variation. The combination of several features recorded in rat studies as related to apple
exposure or effect would therefore help to identify more robust biomarkers in humans.
Besides being helpful in our mechanistic understanding of dietary effects of apple intake, such
objective biomarkers will be useful for the estimation of apple or fruit intake in samples from
epidemiological studies, where the current methods based on questionnaires are prone to bias.
Improved markers of intake should be useful to identify possible associations between dietary
apple intake and disease prevention at the population level.
In the research presented here we want to focus on the cell wall polysaccharide, pectin, as a
potentially disease preventive component in apples and in many other fruits. Pectins are
presumed to prevent the reabsorbtion of bile acids in the intestine and to enhance steroid
excretion so that more cholesterol is diverted into the bile acid pool (Ahrens et al., 1986).

4
However, pectins from different plant origins have a large structural diversity and thus
possibly varied health effects, which presumably is the main reason why previous animal
studies reporting on pectin feeding and plasma cholesterol have been inconsistent (Aprikian et
al., 2003; Aprikian et al., 2001; Aprikian et al., 2002; Trautwein et al., 1998; Yamada et al.,
2003). Thus, there is a need to sort out mechanisms and active components in order to
understand the physiological effect of apple intake and of its associated pectin component. In
this study we investigate the urinary metabolome following feeding of fresh apple and apple-
pectin to rats in a nutritionally balanced feeding trial.

5
2 Materials and Methods
2.1 Materials
All apples used were from a single batch of the variety Shampion, grown in Skierniwice,
Poland. Apple-pectin was a commercial unrefined product kindly provided by Obi-Pectin AG
(Basel, Switzerland).
2.2 Animal study and sample collection
Twenty-four Fisher 344 male rats were randomized into 3 groups and all rats were fed a
standard diet with different supplementations added in two of the groups. One group had 7%
apple-pectin added to the diet, one group 10 g of raw apple and one group had no
supplementation added to the diet (control). The diet was balanced so that all animals received
the same amount of macro- and micronutrients (details to be published elsewhere). After 24
days of feeding, urine was collected in a collection vessel preconditioned with 1ml 1mM
NaN3 to avoid microbial growth. The collection vessel was surrounded by an insulated
container filled with dry-ice to ensure that the urine kept a temperature below 5°C during a 24
hour collection period. The dry ice was replenished every eight hours during the collection
period. Each urine sample was diluted with a fixed volume of 3 mL water used to wash the
collection device in the metabolism cage and then weighed and immediately frozen at -80°C.
2.3 LC-QTOF-MS analysis
Before analysis the samples were thawed, filtered through a 40 µm Millipore filter (Millipore,
Billerica, Massachusetts) and distributed randomly into a 96-well auto-injector tray. The tray
was centrifuged to precipitate debris and 10 µL of each sample were injected into an UPLC
(Waters, Milford, Massachusetts) with a 1.7µm C18 BEH column (Waters) operated with a
6.0 min gradient from 0.1% formic acid to 0.1% formic acid in 20% acetone: 80%
acetonitrile. The eluate was analyzed in duplicate by Waters Premier QTOF-MS in both
negative and positive modes. Ionization of molecules was achieved by applying a voltage of
2.8 or 3.2 kV to the tip of the capillary in negative or positive mode, respectively. This
represents relatively soft ionization conditions but optimised so that fragmentation can occur
and be helpful in our later structural interpretation. Data were collected in centroid mode
using leucine-enkephalin as a lock-spray to calibrate mass accuracy every 10s. A blank (0.1%

6
formic acid) and a metabolomics standard containing 40 different physiological compounds
were analyzed three times during the sample run. This standard was used to check mass error
(<20 ppm) and retention time shift (<0.05min) during the run and when running authentic
standards for verification.
2.4 Data preprocessing of LC-MS data
The raw data were extracted and aligned in retention time- and mass-direction by
MarkerLynxTM
(Waters) by using two different processing conditions as detailed below, to
discover as many important peaks as possible. MarkerlynxTM
works by customized
predefinition of several parameters and applies a peak picking algorithm to select potential
markers. In the following the detected metabolites are termed ‘features’ when collected after
the peak picking and alignment procedure and ‘markers’ after selection by data analysis. Two
sets of parameters for data processing were used: A retention time window of 0.05 (0.1) s, a
mass window of 0.05 (0.02) Da, a noise elimination level of 3 (6) standard deviations above
background and an intensity threshold of 20 (30) cps. The first method resulted in 5350
features in the negative mode and 7668 features in the positive mode and the second method
(parameters in brackets) resulted in 5574 and 8783 features in the negative and positive
modes, respectively. The two datasets were exported to Excel (Microsoft) and after removing
overlapping features the combined matrix consisted of 7380 and 12775 features in negative
and positive mode, respectively. Duplicate sample analyses were combined as described by
Bijlsma et al. (2006) meaning that if both measurement values were zero the combined value
was zero and if both values were nonzero, the combined value was equal to the average of the
two measurement values. If one replicate has a nonzero value and the other replicate is zero,
the combined value is set to the nonzero measurement. The rationale for this procedure is that
the combined value is most likely closer to the nonzero value since the measured zero value is
expected to be due to a slip in the peak picking or because the analyte was not measured in the
MS (e.g. momentary ion suppression). Moreover, due to the threshold level applied in the data
processing step with the MarkerLynxTM
software some ‘false’ zero values will be present in
the dataset. Consequently, before performing explorative analysis the data were divided into
subsets (control/apple and control/pectin) and if a feature had more than 20% zero values
within one of the groups in both subset it was excluded from the dataset (adapted from
Bijlsma et al. (2006)) leaving 4010 and 7353 features in the negative and positive modes,

7
respectively. Finally, before data analysis the data was normalized to unit vector length
(Euclidean norm) to reduce variations caused by instrumental variation, concentration
difference in the urine samples etc. When using this type of normalization the ‘closure’ effect
should always be considered, concerning that the true depletion of some peaks between
samples will automatically be reflected in increased intensities for other peaks (and vice
versa). However, since non-targeted metabolomics data are unlikely to be dominated by few
high or low intensity variables, the risk of closure is considered minimal (Backstrom et al.,
2007) and this normalization approach has earlier been applied successfully to other
explorative metabolomics investigations (Nielsen et al., 2010; Scholz et al., 2004).
2.5 Data analysis of LC-MS data
A principal component analysis (PCA) was performed in Matlab (Matlab version R2009a,
Matworks) for the whole dataset. Features were then divided into exposure markers and effect
markers for apple and pectin intake, respectively. The selection criterion for exposure markers
was that they should have only zero values in the control group and positive responses in all
animals in the apple and/or pectin group (see Figure 1 marker #2 for an example). One
misclasification was allowed in each group in order to tolerate small measurement errors of
the MS instrumentation. In contrast, effect markers were defined as markers that have a
baseline response in all animals in one group and a significantly up- or down-regulated
response in all animals in the comparing group (one misclasification is allowed in each
group). Simple binomial calculations give a P=0.00124 for a chance finding indicating that
we can expect less than 5 false positives among the negative mode features and less than 10 in
the positive mode. Less than one of these would be found among features without
misclassifications. Figure 1 marker #3 illustates an effect marker.
Since pectin is present in the fresh apple it was investigated if any features display an
apparent dose-response relationship to apple-pectin, given that a factor of 16.5 was the mean
difference in apple-pectin consumed by the pectin group as compared with the apple group.
The dose-response relationship was investigated using forward stepwise selection (Nørgaard
et al., 2000). This method selects variables in a stepwise manner based on their capability to
improve a multiple linear regression model (MLR) established between the chromatographic
features and the pectin dose. By this method all markers are first tested individually in
univariate linear regression models with the pectin dose as the dependent variable. All these

8
models are cross validated, and the variable with the lowest RMSECV is chosen. Then, all
two-variable MLR models are investigated on the basis of the chosen variable in combination
with all the remaining variables, one by one. All these models are cross validated, and the
variable that (in combination with the first chosen variable) gives the lowest RMSECV is
chosen. This procedure was continued as long as RMSECV decreased each time a new
variable was introduced. A Partial Least Square (PLS) regression (Martens & Næs, 1993)
model with the selected metabolites and the pectin dose as the dependent variable was then
built to validate the dose response relationship.
2.6 Marker identification
After selection of exposure and effect markers the primary focus was to identify as many
markers as possible. The nature of a QTOF-MS instrument allows very accurate mass
measurement but despite the high data quality the chemical identification part of this kind of
untargeted metabolomics experiments remains a highly laborious task involving interpretation
of isotope patterns and fragmentation patterns, database or literature search and finally
experimental verification of the selected markers by co-elution experiments. The lack of
commercial availably authentic standards for some markers hinders their identification and
these markers are left as tentatively identified. For some markers there are no known
compounds that fit the characteristics observed by MS and these markers will need more
advanced identification experiments which are beyond the scope of the present paper.
Therefore, only a part of the markers listed in this publication will be chemically identified at
the present time. As the first step in the identification work, retention time and response
behaviour was compared between the markers to detect potential interrelated fragment-ions.
Hereafter, the measured mass of a particular marker was searched in a database and the results
compared to the isotopic fit in the mass spectra by use of the MarkerlynxTM
elemental
composition software. Then fragment ions were taken into consideration by looking directly
in the raw data and by applying a mass fragment tool (MassFragmentTM
, Waters) and finally a
pure standard of the proposed compounds were analyzed by the UPLC-MS system to verify
retention time and the fragmentation and/or adduct-forming pattern.

9
3 Results and Discussion
3.1 Exposure and effect marker identification
The initial PCA model of the urinary rat metabolome data (negative mode) is shown in Figure
1. The first 2 components of this model accounted for approximately 40% of the variation in
the data. Urine samples from the different groups were separated by PCA with complete
separation between the apple group and control/pectin groups (Figure 1).
Inset Figure 1
The total number of exposure and effect markers is shown in Figure 2 and their m/z values are
listed in supplemental material, Table 1S and 2S. As seen from Figure 2 we observed 119
apple and 39 pectin exposure markers combined from positive and negative mode, with no
overlapping markers between the groups. For the metabolites selected as effect markers 52 are
found up-regulated in the apple group compared to the control group and 33 are found to be
down-regulated. Likewise for the pectin group 42 markers are found as up-regulated pectin
effect markers and 19 as down-regulated effect markers. When searching for overlapping
apple and pectin effect markers we found 3 and 1 for the up- and down-regulated markers,
respectively. Altogether, this is a high number of unambiguous exposure or effect markers
and it is not expected to be possible to receive a similar result in a human intervention study.
Therefore, the collection of these markers may be used to unravel the presumed more blurred
response behavior of markers in human studies investigating apple or even fruit-related
interventions. If it is possible to identify some of the markers found in this study, these could
be combined selectively by multivariate modeling to search for response patterns.
Inset Figure 2
The location of the identified exposure and effect markers in the multivariate space is
illustrated as different colors on the loading plot in Figure 1. Inspection of the PCA loading
plot reveals that it is not only the features selected as exposure and effect markers, which are
responsible for the grouping in the score plot. Other features may show an even stronger
effect on the multivariate discrimination between the sample groups. This is because PCA
reflects the overall variation in the data across the 24 rats and thus is insensitive to
’imperfections‘ of single features. The PCA shows no clear separation between the exposure

10
and effect markers in the loading plot, not even for the ‘perfect’ markers with no
misclassifications, but it can be observed that e.g. up-regulated apple effect markers (Apple
Effect Markers) and down-regulated apple effect markers (Ctrl-Apple Effect Markers) are
mirrored across the center of the model and likewise for the apple exposure and pectin
effect/exposure markers (Figure 1, colored marker groups). The single feature that contributes
most strongly to distinguish the apple samples from the other samples is highlighted as #1 in
the loading plot of Figure 1, and its analytical pattern across the 24 samples is shown in the
upper right insert. Despite its clear response behavior this feature was not selected as an
exposure marker by our present conditions due to a inconsistent response in the control group.
Several other features with similar characteristics appear in the dataset, but will not be the
target for this present investigation.
Our definition of an exposure marker in this present work represents potential biomarkers of
apple or fruit/plant-based diet intake in general as well as of pectin intake. However,
quantification of the markers and proper validation studies are needed before these markers
can be used as true exposure biomarkers in e.g. observational studies. The term effect marker
covers metabolites that are believed to reflect changes in the endogenous or gut microbial
metabolome of the host and in this way may enlighten how apple and pectin intake
physiologically affects the organism. In the variable selection procedure we distinguish
between exposure and effect markers based on zero values or a constant baseline level.
Though, before identification of markers it cannot be ruled out that exposure markers are not
truly effect markers and vice versa. This investigation applied a low threshold level in the data
extraction step in order to eliminate too much noise in the data. Without the threshold the
dataset will be too large and unmanageable. If a true effect marker has a response that is lower
than the threshold level this will appear as zeros in the data set and it will mistakenly be
classified as an exposure marker. Likewise some effect markers may be regarded as wrongly
classified if they are markers of dietary factors existing at different levels in both the control
and the apple or pectin groups, as observed in the case of hippuric acid. However, this marker
may also be seen as an effect of diet on the metabolic capacity of the microbiota and of the
endogenous glycine-conjugation systems. Nevertheless, for the majority of the markers
identified this does not appear to be a problem and the quality grading of markers was
effective to ease the systematization and interpretation of unknown compounds, see the
section below on identified markers.

11
3.2 Features exhibiting pectin dose-response relation
Since the fresh apple dose contains pectin in the relationship 1:16.5 compared to the pure
pectin dose this accommodates the selection of features displaying a dose response
relationship. By the use of forward selection the positive and negative mode features were
investigated for a response relationship with the pectin dose. Approximate dose-response
relationships were observed for 3 of the markers in the positive mode and the result of the
PLS model built on these 3 selected markers is shown in Figure 3. The correlation coefficient
(r2=0.95) is very high although the samples show considerable deviations from the expected
means within each group. The markers were forward selected and the first selected marker has
the highest correlation to the pectin dose vector and is also selected as a pectin effect marker
(134.0967 m/z). This marker appears to be a fragment ion of another pectin effect marker with
mass 239.1386 m/z and also a fragment of 197.1286 m/z shows the same response pattern
between the samples at this specific retention time (2.21 min). Unfortunately, it has not been
possible to identify this compound but the isotopic pattern indicates that the chemical
structures of these compounds are most likely: C12H19N2O3 (239.1386 m/z), C10H17N2O2
(197.1286 m/z) and C9H12N (134.0967 m/z). Our present study was not designed as a dose
response study and even though the pectin had the same origin the animals were fed with
either isolated pectin or pectin in fresh apple and this may not leave the same physiological
response. This probably explains why we do not find numerous markers with pectin dose
response characteristics. Another possibility is that pectin is degraded more slowly when it is
fed as a component of the apple food matrix and that the concentration of pectin degradation
products in different segments of the gut would therefore only partially be reflected by the
total pectin dose in the food.
Inset Figure 3
3.3 Identification and interpretation of markers
In the following the markers identified to date (listed in Table 1) will be discussed with regard
to their origin, metabolism and whenever possible, their health related perspectives. Only the
markers verified with an authentic standard will be discussed in details whereas the tentatively
identified markers (markers in italic font in Table 1) will only be discussed to a very limited
extent.
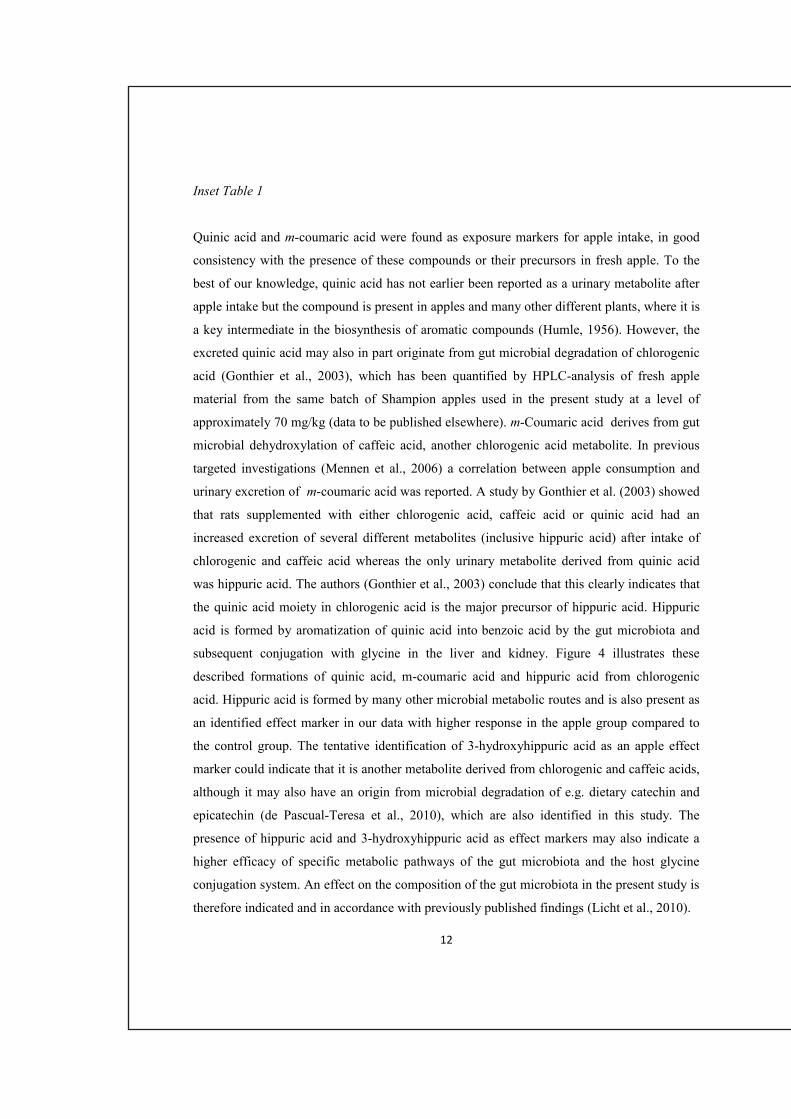
12
Inset Table 1
Quinic acid and m-coumaric acid were found as exposure markers for apple intake, in good
consistency with the presence of these compounds or their precursors in fresh apple. To the
best of our knowledge, quinic acid has not earlier been reported as a urinary metabolite after
apple intake but the compound is present in apples and many other different plants, where it is
a key intermediate in the biosynthesis of aromatic compounds (Humle, 1956). However, the
excreted quinic acid may also in part originate from gut microbial degradation of chlorogenic
acid (Gonthier et al., 2003), which has been quantified by HPLC-analysis of fresh apple
material from the same batch of Shampion apples used in the present study at a level of
approximately 70 mg/kg (data to be published elsewhere). m-Coumaric acid derives from gut
microbial dehydroxylation of caffeic acid, another chlorogenic acid metabolite. In previous
targeted investigations (Mennen et al., 2006) a correlation between apple consumption and
urinary excretion of m-coumaric acid was reported. A study by Gonthier et al. (2003) showed
that rats supplemented with either chlorogenic acid, caffeic acid or quinic acid had an
increased excretion of several different metabolites (inclusive hippuric acid) after intake of
chlorogenic and caffeic acid whereas the only urinary metabolite derived from quinic acid
was hippuric acid. The authors (Gonthier et al., 2003) conclude that this clearly indicates that
the quinic acid moiety in chlorogenic acid is the major precursor of hippuric acid. Hippuric
acid is formed by aromatization of quinic acid into benzoic acid by the gut microbiota and
subsequent conjugation with glycine in the liver and kidney. Figure 4 illustrates these
described formations of quinic acid, m-coumaric acid and hippuric acid from chlorogenic
acid. Hippuric acid is formed by many other microbial metabolic routes and is also present as
an identified effect marker in our data with higher response in the apple group compared to
the control group. The tentative identification of 3-hydroxyhippuric acid as an apple effect
marker could indicate that it is another metabolite derived from chlorogenic and caffeic acids,
although it may also have an origin from microbial degradation of e.g. dietary catechin and
epicatechin (de Pascual-Teresa et al., 2010), which are also identified in this study. The
presence of hippuric acid and 3-hydroxyhippuric acid as effect markers may also indicate a
higher efficacy of specific metabolic pathways of the gut microbiota and the host glycine
conjugation system. An effect on the composition of the gut microbiota in the present study is
therefore indicated and in accordance with previously published findings (Licht et al., 2010).

13
Until recently quinic acid and hippuric acid were believed to have no biological effects but
investigations by Pero et al. (2009) have revealed that quinic acid via microbial conversion
nutritionally supports the synthesis of tryptophan and nicotinamide in the intestine, and that
this in turn leads to DNA repair enhancement and NF-kB inhibition via increased
nicotinamide and tryptophan production in humans. This may be an important health aspect to
consider when evaluating health effect of apple and other plant products containing quinic
acid. It remains to be established whether hippuric acid is a surrogate marker for the
activation of these pathways.
Inset Figure 4
We also found an apple exposure marker at the retention time of (-)epicatechin (=1.78 min)
with a m/z value of 139.0397 corresponding to the retro-Diels-Alder fragmentation patteren
that usually occurs when performing MS analysis of flavan-3-ols (Shaw & Griffiths, 1980).
The detected marker derives from the A-ring of epicatechin and this parent molecule was not
itself detected as a feature but its mass peak was visible when inspecting mass spectra from
the apple group. Epicatechin and its isomer catechin are well-known components in apple and
unlike most other flavonoids, catechins are not on a glycosylated form in the source material
(Escarpa & Gonzalez, 1998). Only a minor part of ingested catechins are thought to be
circulating and excreted as the unconjugated form since these compounds are primarily
glucuronidated in the enterocytes after absorbtion and even often further deglucuronidated
and methylated and/or re- glucuronidated or sulphated in the liver before excretion (Donovan
et al., 2001). Accordingly, we found the epicatechin glucuronide and catechin glucuronide
among our exposure markers although the retention times (and positions of glucoronide
groups) of these markers are not verified due to lack of commercial standards. However, as
expected, their elution time is prior to the elution time of their unconjugated forms (catechin
=1.68 min and epicatechin = 1.78 min) and their fragmetation pattern is comparable to what is
observed in a targeted MS/MS experiments with these compounds (Schroeter et al. 2006).
Methyl epicatechin was also tentatively identified with a longer retention time than
epicatechin and a retro-Diels-Alder fragmentation patteren confirming its identity. The
metabolite, dihydroxyphenyl-γ-valerolactone, was also tentatively identified and this
compound has earlier been identified as a major human urinary metabolite after intake of (-)-
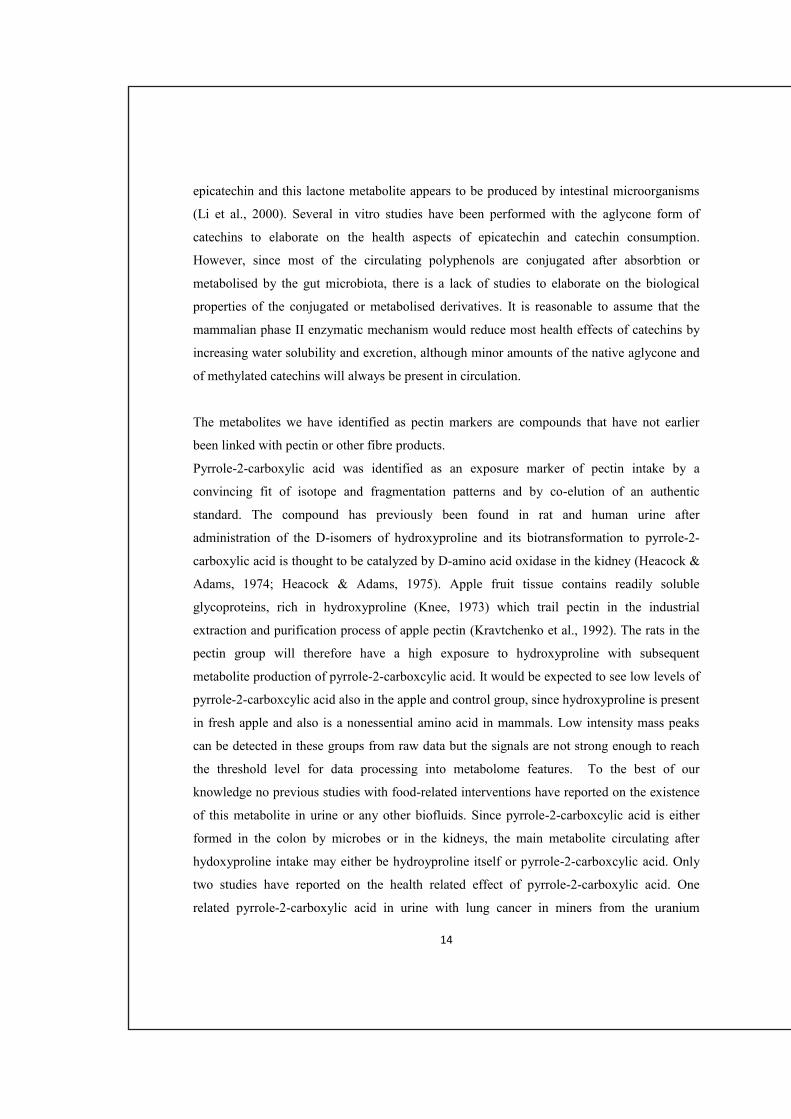
14
epicatechin and this lactone metabolite appears to be produced by intestinal microorganisms
(Li et al., 2000). Several in vitro studies have been performed with the aglycone form of
catechins to elaborate on the health aspects of epicatechin and catechin consumption.
However, since most of the circulating polyphenols are conjugated after absorbtion or
metabolised by the gut microbiota, there is a lack of studies to elaborate on the biological
properties of the conjugated or metabolised derivatives. It is reasonable to assume that the
mammalian phase II enzymatic mechanism would reduce most health effects of catechins by
increasing water solubility and excretion, although minor amounts of the native aglycone and
of methylated catechins will always be present in circulation.
The metabolites we have identified as pectin markers are compounds that have not earlier
been linked with pectin or other fibre products.
Pyrrole-2-carboxylic acid was identified as an exposure marker of pectin intake by a
convincing fit of isotope and fragmentation patterns and by co-elution of an authentic
standard. The compound has previously been found in rat and human urine after
administration of the D-isomers of hydroxyproline and its biotransformation to pyrrole-2-
carboxylic acid is thought to be catalyzed by D-amino acid oxidase in the kidney (Heacock &
Adams, 1974; Heacock & Adams, 1975). Apple fruit tissue contains readily soluble
glycoproteins, rich in hydroxyproline (Knee, 1973) which trail pectin in the industrial
extraction and purification process of apple pectin (Kravtchenko et al., 1992). The rats in the
pectin group will therefore have a high exposure to hydroxyproline with subsequent
metabolite production of pyrrole-2-carboxcylic acid. It would be expected to see low levels of
pyrrole-2-carboxcylic acid also in the apple and control group, since hydroxyproline is present
in fresh apple and also is a nonessential amino acid in mammals. Low intensity mass peaks
can be detected in these groups from raw data but the signals are not strong enough to reach
the threshold level for data processing into metabolome features. To the best of our
knowledge no previous studies with food-related interventions have reported on the existence
of this metabolite in urine or any other biofluids. Since pyrrole-2-carboxcylic acid is either
formed in the colon by microbes or in the kidneys, the main metabolite circulating after
hydoxyproline intake may either be hydroyproline itself or pyrrole-2-carboxcylic acid. Only
two studies have reported on the health related effect of pyrrole-2-carboxylic acid. One
related pyrrole-2-carboxylic acid in urine with lung cancer in miners from the uranium

15
industry (Svojtkova et al., 1982). Another study reported that pyrrole-2-carboxcylic acid at a
dose of 200 mg/kg in rats and rabbits caused a suppression of platelet aggregation (Komiyama
et al., 1986). Future investigations on the effects of pectin or other plant cell wall constituents
should take the potentially high hydroxyproline-intake and its metabolism into consideration
as potentially bioactive effectors.
2-Furoylglycine was also identified as a pectin exposure marker by the use of an authentic
standard and we could identify a glycine fragment (74.0242 m/z) at the same retention time.
2-Furoylglycine is an acyl glycine and an earlier uncontrolled study showed presence of this
metabolite in urine of 20 normal adults (Pettersen & Jellum, 1972). To detect if the precursors
of this compound was of exogenous dietary origin these authors also provided a male adult
with a simple synthetic diet (tripalmin, triolein, sucrose and water) for 3 days. No 2-
furoylglycine was detected in the urine after 2 days but the compound reappeared when an
ordinary diet was reintroduced. From these findings it was suggested that furan derivatives or
their precursors were introduced into food by cooking when reduced sugars are heated in the
presence of free amino groups. Purified apple pectin carries a lot of neutral sugar molecules
and some proteins (Kravtchenko et al., 1992) and the same Maillard reaction may happen
either during the industrial pectin extraction procedure where the apple pomace is boiled in
hot acid or during the hot drying process giving rise to furan derivatives such as furfural (2-
furanaldehyde). An alternative explanation is that furfural which is naturally present in apple
and apple products have affinity for pectin and may be concentrated with the pectin fraction
during industrial processing. Further investigations are needed to identify the exact source of
the 2-furane-precursor in pectin and to ascertain whether it is specific to pectin intake. 2-
Furoylglycine was found to be the primary urinary metabolite in rats after oral administration
of furfural and furfuryl alcohol. The latter appears to be oxidised to furfural which is further
oxidised to furoic acid (Nomeir et al., 1992). Furoic acid is conjugated with glycine to form 2-
furoylglycine by the enzyme acyl-CoA:glycine N-acyltransferase, which is located in the
mitochondria of liver and kidney tissue (Knights et al., 2007). In this study we identified other
acyl glycines that have been conjugated in the same way; hippuric acid, 3-hydroxyhippuric
acid and hydroxyphenylacetylglycine. The last two have not been verified by authentic
standards but glycine fragments were observed in the raw data at their specific retention times
indicating the expected fragmentation. In general, the amino acid conjugation serves to

16
inactivate reactive acyl-CoA thioesters of carboxylic acids of endogenous and exogenous
origin (Knights et al., 2007) and these acyl glycines will probably exhibit relatively low
physiological activity. However, their precursors and intermediate metabolites may be more
likely to affect health status prior to their enzymatic conversion.
2-Piperidinone was identified as an upregulated effect marker of pectin intake in this study.
To the best of our knowledge no previous studies have reported on the existence of this
metabolite in urine or blood. The compound has been identified in a forensic study in the
decomposition fluids from pig carcasses (Swann et al., 2010). 2-Piperidinone was also found
in the anal sac secretions of different animals and it was discussed that this compound could
be formed by the elimination of water from the precursor 5-aminovaleric acid by microbial
fermentation processes (Albone et al., 1976; Burger et al., 2001). However, from the studies
conducted to date it is not possible to decide if 2-piperidinone or its precursors are of dietary
origin or is exclusively an endogenous or microbial metabolite. We have previously shown
that pectin in this study caused a marked change in the caecum microbiota (Licht et al., 2010).
We are currently investigating the relationships between these changes and the metabolomic
patterns in fecal water and urine.
Among the effect markers that we have tentatively identified there are several catecholamine
metabolites (3-methoxy-4-hydroxyphenylethyleneglycol sulphate, homovanillic acid sulphate,
metanephrine, hydroxyphenylacetylglycine and methoxytyrosine) indicating changes in the
hormonal metabolism or in metabolite transport after the apple and pectin diets. The identities
of these markers seem likely with respect to accurate mass, elemental composition and
fragment patterns but no coelution experiments with pure standards have been performed,
again due to lack of commercial standards. Firm conclusions will therefore have to await the
confirmation of an effect of apple intake on the excretion of these hormonal effector
compounds.

17
4 Conclusion
By applying an untargeted MS-based metabolomics approach it has been demonstrated that
intake of apple and apple pectin has a high impact on the urinary metabolome. Numerous
clear exposure and effect markers of apple and apple-pectin intake have been found and
several new apple-related urinary metabolites have been identified in this study. Most of these
excreted metabolites are products of diverse metabolic processes including phase II
glucuronidation, glycine-conjugation and/or microbial metabolism and a combination of
several of the markers recorded in this rat study could ease identification of more robust
biomarkers in human studies. Additionally, the markers identified in this study should shed
new light on health interpretations of fruit intake in previous as well as future conducted
studies. The explorative top-down metabolomics approach employing a division into effect
and exposure markers seems promising as a powerful tool in formation of new ideas and
hypothesis to deconvolute the interplay between dietary intake and health status.
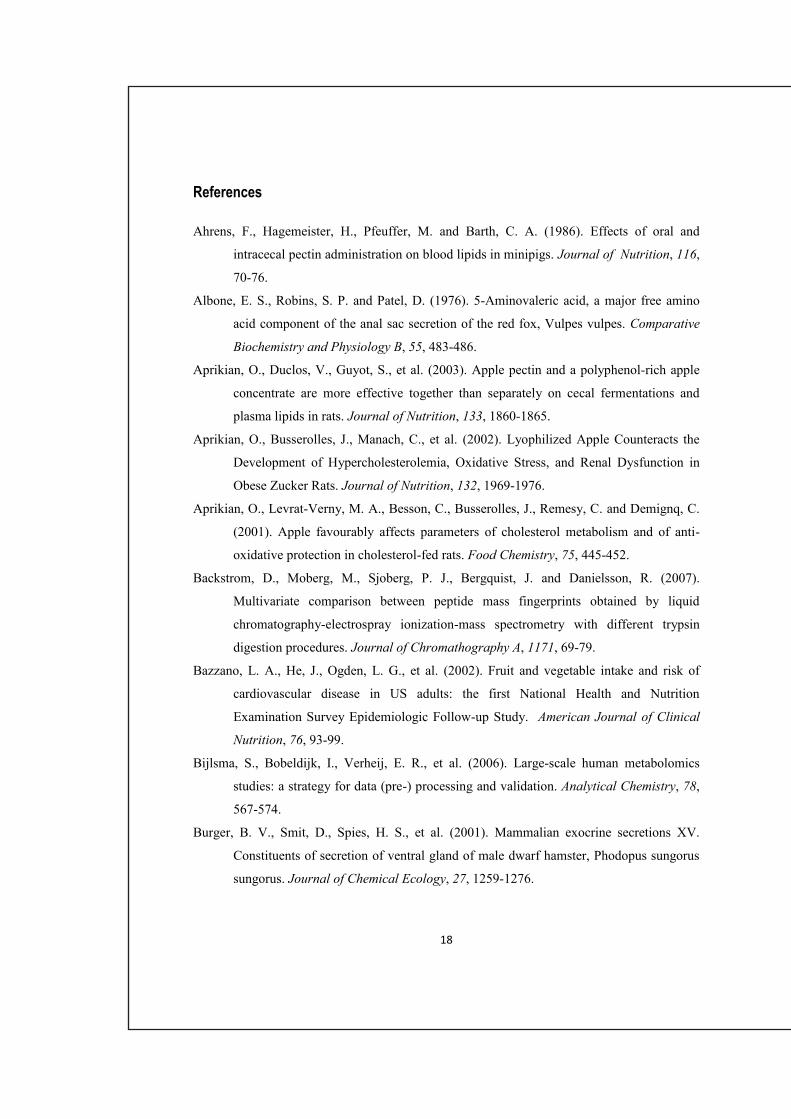
18
References
Ahrens, F., Hagemeister, H., Pfeuffer, M. and Barth, C. A. (1986). Effects of oral and
intracecal pectin administration on blood lipids in minipigs. Journal of Nutrition, 116,
70-76.
Albone, E. S., Robins, S. P. and Patel, D. (1976). 5-Aminovaleric acid, a major free amino
acid component of the anal sac secretion of the red fox, Vulpes vulpes. Comparative
Biochemistry and Physiology B, 55, 483-486.
Aprikian, O., Duclos, V., Guyot, S., et al. (2003). Apple pectin and a polyphenol-rich apple
concentrate are more effective together than separately on cecal fermentations and
plasma lipids in rats. Journal of Nutrition, 133, 1860-1865.
Aprikian, O., Busserolles, J., Manach, C., et al. (2002). Lyophilized Apple Counteracts the
Development of Hypercholesterolemia, Oxidative Stress, and Renal Dysfunction in
Obese Zucker Rats. Journal of Nutrition, 132, 1969-1976.
Aprikian, O., Levrat-Verny, M. A., Besson, C., Busserolles, J., Remesy, C. and Demignq, C.
(2001). Apple favourably affects parameters of cholesterol metabolism and of anti-
oxidative protection in cholesterol-fed rats. Food Chemistry, 75, 445-452.
Backstrom, D., Moberg, M., Sjoberg, P. J., Bergquist, J. and Danielsson, R. (2007).
Multivariate comparison between peptide mass fingerprints obtained by liquid
chromatography-electrospray ionization-mass spectrometry with different trypsin
digestion procedures. Journal of Chromathography A, 1171, 69-79.
Bazzano, L. A., He, J., Ogden, L. G., et al. (2002). Fruit and vegetable intake and risk of
cardiovascular disease in US adults: the first National Health and Nutrition
Examination Survey Epidemiologic Follow-up Study. American Journal of Clinical
Nutrition, 76, 93-99.
Bijlsma, S., Bobeldijk, I., Verheij, E. R., et al. (2006). Large-scale human metabolomics
studies: a strategy for data (pre-) processing and validation. Analytical Chemistry, 78,
567-574.
Burger, B. V., Smit, D., Spies, H. S., et al. (2001). Mammalian exocrine secretions XV.
Constituents of secretion of ventral gland of male dwarf hamster, Phodopus sungorus
sungorus. Journal of Chemical Ecology, 27, 1259-1276.
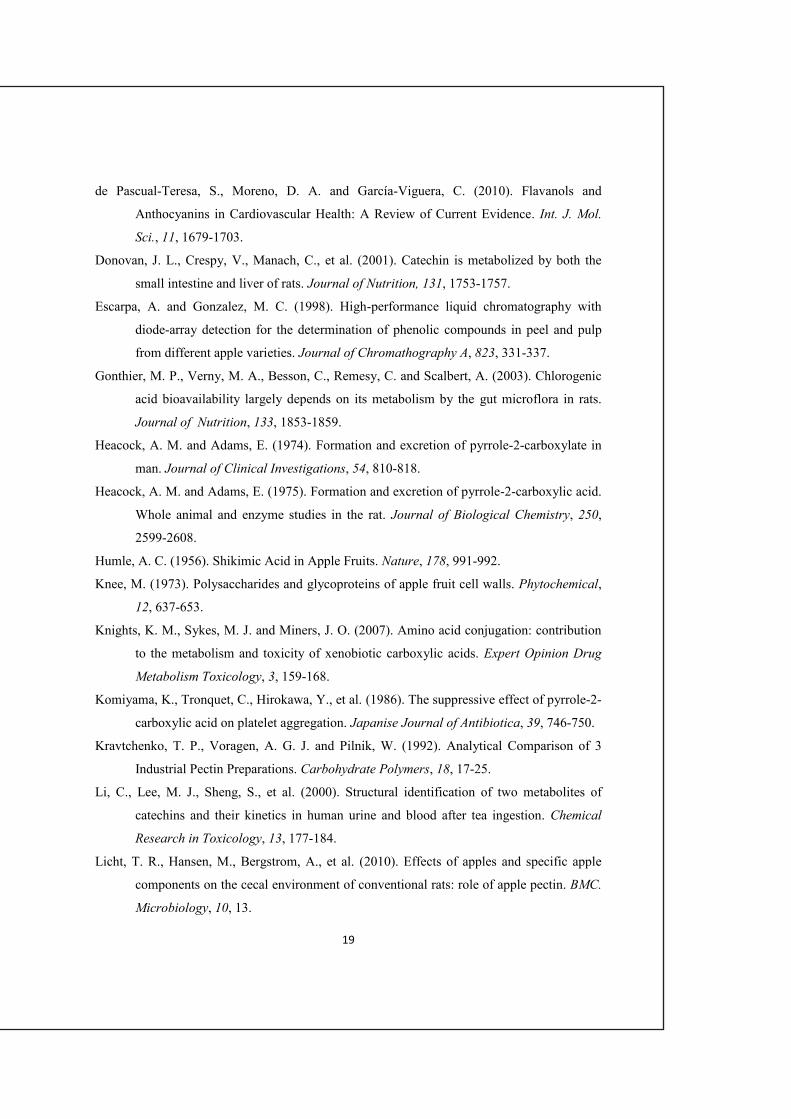
19
de Pascual-Teresa, S., Moreno, D. A. and García-Viguera, C. (2010). Flavanols and
Anthocyanins in Cardiovascular Health: A Review of Current Evidence. Int. J. Mol.
Sci., 11, 1679-1703.
Donovan, J. L., Crespy, V., Manach, C., et al. (2001). Catechin is metabolized by both the
small intestine and liver of rats. Journal of Nutrition, 131, 1753-1757.
Escarpa, A. and Gonzalez, M. C. (1998). High-performance liquid chromatography with
diode-array detection for the determination of phenolic compounds in peel and pulp
from different apple varieties. Journal of Chromathography A, 823, 331-337.
Gonthier, M. P., Verny, M. A., Besson, C., Remesy, C. and Scalbert, A. (2003). Chlorogenic
acid bioavailability largely depends on its metabolism by the gut microflora in rats.
Journal of Nutrition, 133, 1853-1859.
Heacock, A. M. and Adams, E. (1974). Formation and excretion of pyrrole-2-carboxylate in
man. Journal of Clinical Investigations, 54, 810-818.
Heacock, A. M. and Adams, E. (1975). Formation and excretion of pyrrole-2-carboxylic acid.
Whole animal and enzyme studies in the rat. Journal of Biological Chemistry, 250,
2599-2608.
Humle, A. C. (1956). Shikimic Acid in Apple Fruits. Nature, 178, 991-992.
Knee, M. (1973). Polysaccharides and glycoproteins of apple fruit cell walls. Phytochemical,
12, 637-653.
Knights, K. M., Sykes, M. J. and Miners, J. O. (2007). Amino acid conjugation: contribution
to the metabolism and toxicity of xenobiotic carboxylic acids. Expert Opinion Drug
Metabolism Toxicology, 3, 159-168.
Komiyama, K., Tronquet, C., Hirokawa, Y., et al. (1986). The suppressive effect of pyrrole-2-
carboxylic acid on platelet aggregation. Japanise Journal of Antibiotica, 39, 746-750.
Kravtchenko, T. P., Voragen, A. G. J. and Pilnik, W. (1992). Analytical Comparison of 3
Industrial Pectin Preparations. Carbohydrate Polymers, 18, 17-25.
Li, C., Lee, M. J., Sheng, S., et al. (2000). Structural identification of two metabolites of
catechins and their kinetics in human urine and blood after tea ingestion. Chemical
Research in Toxicology, 13, 177-184.
Licht, T. R., Hansen, M., Bergstrom, A., et al. (2010). Effects of apples and specific apple
components on the cecal environment of conventional rats: role of apple pectin. BMC.
Microbiology, 10, 13.

20
Liu, S., Manson, J. E., Lee, I. M., et al. (2000). Fruit and vegetable intake and risk of
cardiovascular disease: the Women's Health Study. American Journal of Clininical
Nutrition, 72, 922-928.
Martens, N. and Næs, T. (1993). Multivariate Calibration. Wiley, New York.
Mennen, L. I., Sapinho, D., Ito, et. al. (2006). Urinary flavonoids and phenolic acids as
biomarkers of intake for polyphenol-rich foods. British Journal of Nutrition, 96, 191-
198.
Nielsen, N. J., Tomasi, G., Frandsen, R. J. N., et al. (2010). A pre-processing strategy for
liquid chromatography time-of-flight mass spectrometry metabolic fingerprinting data.
Metabolomics, 6, 341-352.
Nomeir, A. A., Silveira, D. M., McComish, M. F. and Chadwick, M. (1992). Comparative
metabolism and disposition of furfural and furfuryl alcohol in rats. Drug Metabolism
and Disposition, 20, 198-204.
Nørgaard, L., Saudland, A., Wagner, J., Nielsen, J. P., Munck, L. and Engelsen, S. B. (2000).
Interval partial least-squares regression (iPLS): A comparative chemometric study
with an example from near-infrared spectroscopy. Appied Spectroscopy, 54, 413-419.
Pero, R. W., Lund, H. and Leanderson, T. (2009). Antioxidant metabolism induced by quinic
acid. Increased urinary excretion of tryptophan and nicotinamide. Phytotherapy
Research, 23, 335-346.
Pettersen, J. E. and Jellum, E. (1972). The identification and metabolic origin of 2-
furoylglycine and 2,5-furandicarboxylic acid in human urine. Clinical Chimica Acta,
41, 199-207.
Scholz, M., Gatzek, S., Sterling, A., Fiehn, O. and Selbig, J. (2004). Metabolite
fingerprinting: detecting biological features by independent component analysis.
Bioinformatics, 20, 2447-2454.
Schroeter, H., Heiss, C., Balzer, J., et al. (2006). (-)-Epicatechin mediates beneficial effects of
flavanol-rich cocoa on vascular function in humans. Proceedings of the National
Academy of Sciences of the U.S.A., 103, 1024-1029.
Shaw, I. C. and Griffiths, L. A. (1980). Identification of the major biliary metabolite of (+)-
catechin in the rat. Xenobiotica, 10, 905-911.
Svojtkova, E., Deyl, Z. and Andrlikova, J. (1982). Decrease in pyrrole-2-carboxylic acid
excretion during lung cancer disease. Neoplasma, 29, 625-629.

21
Swann, L., Chidlow, G. E., Forbes, S. and Lewis, S. W. (2010). Preliminary studies into the
characterization of chemical markers of decomposition for geoforensics. Journal of
Forensic Science, 55, 308-314.
Trautwein, E. A., Rieckhoff, D., Kunath-Rau, A. and Erbersdobler, H. F. (1998). Psyllium,
not pectin or guar gum, alters lipoprotein and biliary bile acid composition and fecal
sterol excretion in the hamster. Lipids, 33, 573-582.
Yamada, K., Tokunaga, Y., Ikeda, et al. (2003). Effect of dietary fiber on the lipid metabolism
and immune function of aged Sprague-Dawley rats. Bioscience, Biotechnology and
Biochemistry, 67, 429-433.

22
LEGEND TO FIGURES
Fig. 1 PCA score (top) and loading plot (lowest) of PC1/PC2 with all features measures in
negative mode (n = 4010). Data are mean centred and two times pareto scaled. Diagram 1-3
illustrates the corresponding response pattern of a selected feature and markers from the
loading plot.
Fig. 2 Venn diagrams showing summarized number of selected exposure (left) and effect
markers (right) obtained from positive and negative ionization mode.
Fig. 3 PLS model (1 PLSC, mean centred) based on 3 metabolites selected by forward
selection of features from positive mode. Black triangles represent the control group, filled
red circles the apple group and white diamonds the pectin group.
Fig. 4 Formation pathway of m-coumaric acid, quinic acid and hippuric acid. Structures
drawn in ACD/ChemSketch ver. 12.0 (www.acdlabs.com).

23
Table 1 Summary of identified metabolites
Metabolite Molecular formula
m/z – in pos
or neg mode
(+/-)
Rt
time
(min)
↑↓a
Apple exposure markers
Quinic acid C7H12O6 191.0555 (-) 0.641 ↑
m-Coumaric acid C9H8O3 163.0393 (-) 2.227 ↑
(-)-Epicatechin C15H14O6 139.0397b(+) 1.779 ↑
Epicatechin
glucuronideC21H22O12 465.1045 (-) 1.671 ↑
Methylepicatechin
C16H16O6 305.1008 (+) 2.031 ↑
Dihydroxyphenyl-
γ-valerolactoneC11H12O4 209.0799 (+) 1.735 ↑
Catechin
glucuronideC21H22O12 465.1043 (-) 1.578 ↑
Apple effect markers
Hippuric acid C8H9NO 134.0606c(-) 1.893 ↑
3-Hydroxyhippuric
acidC9H9NO4 196.0633 (+) 1.579 ↑
3-Methoxy-4-hydroxyphenyl
ethyleneglycol sulfate
C9H10O6S 245.0108d(-) 1.761 ↑
Homovanillic acidsulfate
C9H10O7S 261.0079 (-) 1.454 ↑
Metanephrine C10H15NO3 198.1132 (+) 2.493 ↓
3-Methylglutaconic
acidC6H8O4 143.0351 (-) 1.389 ↓
Pectin exposure markers
Pyrrole-2-carboxylicacid
C5H5NO2 110.0244 (-) 1.606 ↑
2-Furoylglycine C7H7NO4 168.0314 (-) 1.523 ↑
Pectin effect markers
2-Piperidinone C5H9NO 100.0758 (+) 1.373 ↑
Hydroxyphenylacetylglycine
C10H11NO4 210.0762 (+) 1.516 ↑
3-Methoxytyrosine C10H13NO4 210.0769 (-) 2.391 ↑
aUp- or down-regulated response of marker.bRetro-Diels-Alder MS-fragment, b2-Phenylacetamide;well-known dautherion of hippuric acid
and cWater loss. Names in italics refer to compound identifications that
are highly probable due to isotope- and fragmentation pattern, howevernot verified by an authentic standard.

24
FIGURE 1
Control Pectin Apple
[M-H]-
480.128
2
Figure 1. PCA score (top) and loading plot (lowest) of
PC1/PC2 with all features measures in negative mode (n
= 4010). Data are mean centred and two times pareto
scaled. Diagram 1-3 illustrates the corresponding
response pattern of a selected feature and markers from
the loading plot.
1
2
3
Control Pectin Apple
1
[M-H]-
384.105
Exposure marker
Control Pectin Apple
Effect marker
3
[M-H]-
282.122

25
52 3 42 33 1 19119 39
Apple Pectin
FIGURE 2
Exposure markers Effect markers
Apple PectinPectinApple

26
FIGURE 3

27
FIGURE 4
Quinic acid
Benzoic acid
Chlorogenic acid
m-Coumaric acid
Caffeic acid
Hippuric acid

28
SUPPLEMENTAL MATERIAL
Table 1S Observed exposure markers for apple and pectin intake. Markers are selected if only zero
values appear in one group and responses are measured in all animals in the comparing group (bold
font means perfect classification and normal font means one misclasification is allowed in each
group). Markers are listed in the order of perfect markers first and subsequently markers are ranked
according to the highest mean response values. All m/z values represent measured mass (negative
and positive ionization modes, respectively).
Rank
No.
Apple markers Pectin markers
Negative
ionization
mode
[M-H]-
Positive
ionization
mode
[M+H]+
Negative
ionization
mode
[M-H]-
Positive
ionization
mode
[M+H]+
1 289.0387 149.06 303.0923 197.1286
2 191.0555 305.1018 268.085 295.1296
3 465.1043 455.106 343.116 157.1223
4 367.1054 109.0655 269.0197 139.1118
5 479.1205 210.0398 110.0244 305.1109
6 725.1395 272.1138 168.0314 129.1391
7 748.2204 407.0946 159.0318 72.0805
8 283.1534 95.0501 295.1405 95.0698
9 407.194 305.1008 264.9698 283.1296
10 526.3048 105.0382 265.1153 268.0791
11 353.1828 83.085 240.0916 853.5921
12 505.1206 351.1075 263.0973 445.0923
13 341.124 439.1216 524.1376 345.1291
14 239.1664 621.2308 185.0509 329.1541
15 465.1045 459.1606 585.2152 201.1252
16 245.0944 369.1494 224.0916 100.023
17 140.975 514.2309 453.285 556.8564
18 577.0857 170.0437 616.1503 97.1004
19 143.0711 209.0799 359.2565
20
21
543.141
767.2019
223.0964
305.1038
445.2658
953.141821 767.2019 305.1038 953.1418
22 543.1411 177.061
23 237.1537 191.0705
24 273.0424 445.1443
25 100.0393 170.029
26 369.1185 346.15
27 692.1282 96.0465
28 513.0159 139.0397
29 163.0393 416.1553
30 287.0256 385.1122
31 491.0351 139.04
32 317.0378 367.0996
33 165.0556 105.0375
34 557.0969 95.0493
35 487.1462 421.1105
36 281.1384 367.101
37 499.0771 336.1111
38 479.12 350.8857
39 653.1094 481.1354
40 301.0386 100.0247
41 543.9475 373.2733
42 267.0012 358.0762
43 463.0867 437.0856
44 191.0682 239.0596
45 248.5909 337.1614
46 345.1464 528.3171
47 441.1968 660.8224
48 248.7767 291.2371
49 295.0272
50
51
447.0658
447.060252
53
295.0291
319.05154 209.0704
55 403.196
56 382.011
57 475.059
58 411.0803
59 803.2265
60 417.1736
61 105.0381
62 303.0571
63 477.991
64 395.1915
65 361.15
66 579.0778
67 331.9478
68 185.0134
69 723.1206
70 449.2082
71 276.6633

Table 2S Observed effect markers of apple and pectin intake. Effect markers are here defined as
markers that have a baseline response in all animals in the control group and this response is up- or
down-regulated in all animals in the comparing group (bold font means perfect classification and
normal font means one misclasification is allowed in each group). Markers are listed in the order of
perfect markers first and subsequently markers are ranked according to the highest difference in
mean response between the compared groups. All m/z values represent measured mass (negative
and positive ionization modes, respectively).
Rank
No.
Negative ionization mode [M-H]-
Positive ionization mode [M+H]+
Apple markers (m/z) Pectin markers (m/z) Apple markers (m/z) Pectin markers (m/z)
Upregulated by
apple intake
Downregulated
by apple intake
Upregulated by
pectin intake
Downregulated
by pectin intake
Upregulated by
apple intake
Downregulated
by apple intake
Upregulated by
pectin intake
Downregulated
by pectin intake
1 245.0108 208.0631 212.000 269.1055 142.0543 105.0698 82.014 282.2774
2 305.0435 74.024 281.114 383.1253 209.0761 229.1219 239.1386 247.1335
3 134.0606 307.1179 80.9643 307.1179 112.8979 229.1255 134.0967 265.2519
4 369.1158 216.0872 288.0185 309.1156 223.1036 83.0488 114.0913 254.2472
5 319.0571 390.1311 252.0379 216.0648 122.0423 261.1311 228.2317
6 100.0247 357.1003 282.0461 165.0549 226.1437 112.8979 247.1344
7 142.0508 114.0923 321.155 123.0457 233.1178 261.1326 167.1079
8 397.1047 143.0351 470.0596 121.0456 427.1876 100.0758 237.2211
9 121.0399 162.0224 308.0786 196.0482 198.1132 210.0762 330.2602
10 107.0496 222.1127 691.9436 196.0633 188.1278 441.3339 219.2104
11 186.0308 215.1286 176.9862 68.9982 113.0953 333.1492 242.2493
12 261.0079 224.127 210.0769 85.0291 251.1292 400.7675 265.0661
13 119.0497 145.0143 391.2486 175.0734 612.2042 555.2775 82.0653
14 121.0288 329.1623 393.2659 272.1088 839.4365 445.3128 265.0659
15 171.1022 307.0971 232.8866 235.1155 635.4167 184.1014
16 410.0157 291.0972 413.0417 199.1092 558.6806
17 589.08 510.7663 530.0668 191.0568 542.6993
18 331.049 329.1006 465.1657 195.1009 171.1199
19 173.0577 292.0861 343.0596 269.0989 195.1009
20
21
366.7686
458.0696
422.1653
390.1471
613.3418
422.165321 458.0696 390.1471 422.1653
22 383.0951 390.093
23 415.1156 723.4687
24 184.0982
25 209.0312
26 175.0613
27 118.9312
28 191.0467
29 343.1352
30 403.0368
31 165.0193

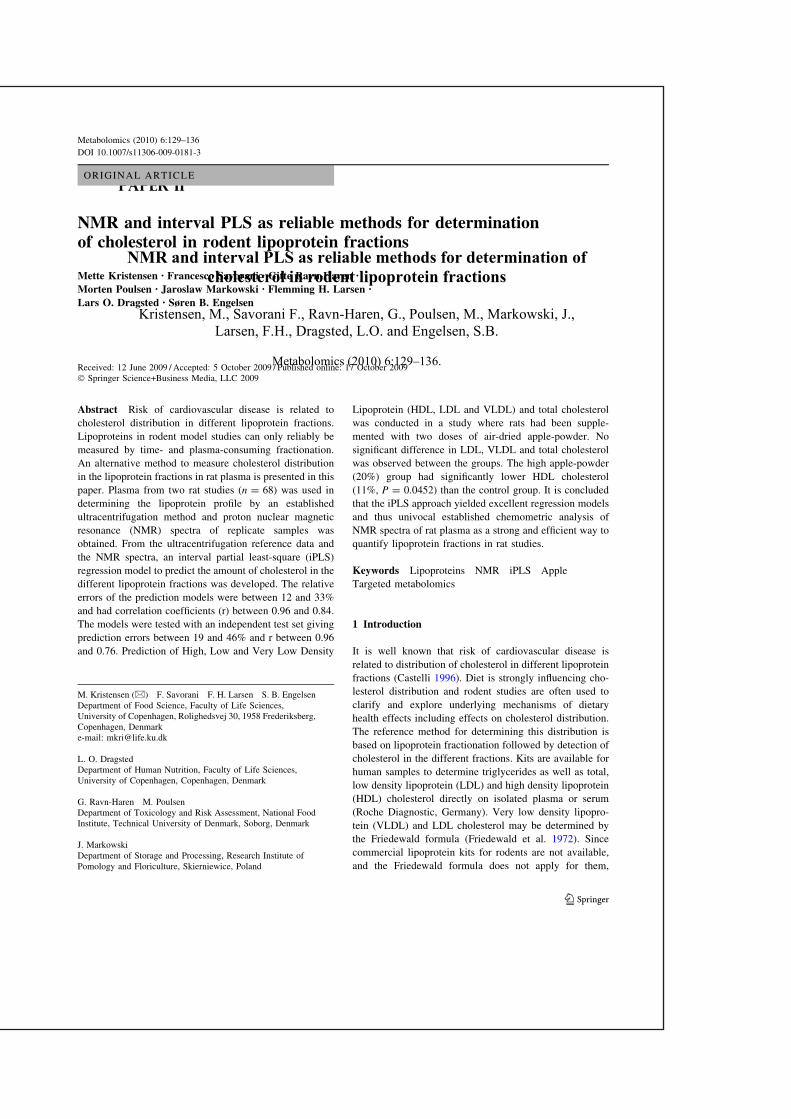
ORIGINAL ARTICLE
NMR and interval PLS as reliable methods for determinationof cholesterol in rodent lipoprotein fractions
Mette Kristensen • Francesco Savorani • Gitte Ravn-Haren •
Morten Poulsen • Jaroslaw Markowski • Flemming H. Larsen •
Lars O. Dragsted • Søren B. Engelsen
Received: 12 June 2009 / Accepted: 5 October 2009 / Published online: 17 October 2009
� Springer Science+Business Media, LLC 2009
Abstract Risk of cardiovascular disease is related to
cholesterol distribution in different lipoprotein fractions.
Lipoproteins in rodent model studies can only reliably be
measured by time- and plasma-consuming fractionation.
An alternative method to measure cholesterol distribution
in the lipoprotein fractions in rat plasma is presented in this
paper. Plasma from two rat studies (n = 68) was used in
determining the lipoprotein profile by an established
ultracentrifugation method and proton nuclear magnetic
resonance (NMR) spectra of replicate samples was
obtained. From the ultracentrifugation reference data and
the NMR spectra, an interval partial least-square (iPLS)
regression model to predict the amount of cholesterol in the
different lipoprotein fractions was developed. The relative
errors of the prediction models were between 12 and 33%
and had correlation coefficients (r) between 0.96 and 0.84.
The models were tested with an independent test set giving
prediction errors between 19 and 46% and r between 0.96
and 0.76. Prediction of High, Low and Very Low Density
Lipoprotein (HDL, LDL and VLDL) and total cholesterol
was conducted in a study where rats had been supple-
mented with two doses of air-dried apple-powder. No
significant difference in LDL, VLDL and total cholesterol
was observed between the groups. The high apple-powder
(20%) group had significantly lower HDL cholesterol
(11%, P = 0.0452) than the control group. It is concluded
that the iPLS approach yielded excellent regression models
and thus univocal established chemometric analysis of
NMR spectra of rat plasma as a strong and efficient way to
quantify lipoprotein fractions in rat studies.
Keywords Lipoproteins � NMR � iPLS � Apple �Targeted metabolomics
1 Introduction
It is well known that risk of cardiovascular disease is
related to distribution of cholesterol in different lipoprotein
fractions (Castelli 1996). Diet is strongly influencing cho-
lesterol distribution and rodent studies are often used to
clarify and explore underlying mechanisms of dietary
health effects including effects on cholesterol distribution.
The reference method for determining this distribution is
based on lipoprotein fractionation followed by detection of
cholesterol in the different fractions. Kits are available for
human samples to determine triglycerides as well as total,
low density lipoprotein (LDL) and high density lipoprotein
(HDL) cholesterol directly on isolated plasma or serum
(Roche Diagnostic, Germany). Very low density lipopro-
tein (VLDL) and LDL cholesterol may be determined by
the Friedewald formula (Friedewald et al. 1972). Since
commercial lipoprotein kits for rodents are not available,
and the Friedewald formula does not apply for them,
M. Kristensen (&) � F. Savorani � F. H. Larsen � S. B. EngelsenDepartment of Food Science, Faculty of Life Sciences,
University of Copenhagen, Rolighedsvej 30, 1958 Frederiksberg,
Copenhagen, Denmark
e-mail: [email protected]
L. O. Dragsted
Department of Human Nutrition, Faculty of Life Sciences,
University of Copenhagen, Copenhagen, Denmark
G. Ravn-Haren � M. Poulsen
Department of Toxicology and Risk Assessment, National Food
Institute, Technical University of Denmark, Soborg, Denmark
J. Markowski
Department of Storage and Processing, Research Institute of
Pomology and Floriculture, Skierniewice, Poland
123
Metabolomics (2010) 6:129–136
DOI 10.1007/s11306-009-0181-3

researchers need to find other ways to explore effects on
the lipoprotein profile in rodents. A common practice is to
use human lipoprotein kits instead. However, the lipopro-
tein profile of rats differs significantly from those of
humans, since HDL is the major carrier of cholesterol in
rats, whereas LDL carries most of the cholesterol in
humans (Davis and Vance 1996). Thus, the use of human
lipoprotein kits in rat studies may most likely cause invalid
results. The limited volume of blood available is another
important issue, when setting up rodent studies to explore,
e.g. the lipoprotein profile. The standard methods to
determine cholesterol content in the different lipoprotein
fractions are ultracentrifugation or gel electrophoresis
(Baumstark et al. 1990; Contois et al. 1999) which are very
time and labour consuming techniques, and require con-
siderable amounts of plasma. Furthermore, only fresh
plasma may be used for lipoprotein fractionation and a
methodology to determine lipoprotein cholesterol distri-
bution in stored frozen plasma is desirable. Therefore, an
alternative method to measure the lipoprotein profile in
rodents is needed. Previous studies in humans (Dyrby et al.
2005; Petersen et al. 2005; Bathen et al. 2000) have taken
advantage of the proton nuclear magnetic resonance
(NMR) spectra of plasma since these contains latent
information about the concentration of lipoproteins and the
use of partial least-square (PLS) regression models may
allow specific extraction of this information. In the present
study we employ this approach on rat plasma samples,
which is to our best knowledge still unexplored. We report
here its application to samples from rats fed different doses
of dried apple powder.
2 Materials and methods
2.1 Materials
The apple pomace and powder used in the present study
were produced from the apple variety Shampion, grown in
Skierniwice, Poland. The apple pomace used in Study B
was the remaining from production of clear juice. The
pomace was freeze-dried and ground. The apple powder for
Study C was produced by air-drying and grinding of the
apples. Macronutrient, total phenolics and pectin compo-
sition of the apple products is shown in Table 1.
2.2 Study design
Three different rat studies were exploited in this investi-
gation and they are summarized in the following. Study A
and B were used to build calibration models, whereas the
cholesterol distribution in the different lipoproteins were
Table 1 Composition of the experimental diets
Ingredients (g/kg feed) Study Ae
and Study B control
Study B
2.1% pomace
Study B
6.3% pomace
Study C
control
Study C 10%
apple-powder
Study C 20%
apple-powder
Na-caseinate 200 200 200 200 200 200
Sucrose 100 93 78 100 75 50
Fructose – – – 54 27 –
Cornstarch 456 446 426 402 370 338
Soybean oil ? AEDK 50 50 50 50 50 50
Soybean oil 20 20 20 20 20 20
Corn oil 80 80 80 80 78 76
Cellulose 50 46 37 50 36 22
Mineral mixturea 32 32 32 32 32 32
Vitamin mixtureb 12 12 12 12 12 12
Apple pomacec – 21 65 – – –
Apple-powderd – – – – 100 200
a Containing in mg/kg diet: 2500 Ca; 1600 P; 3600 K; 300 S; 2500 Na; 1500 Cl; 600 Mg; 34 Fe; 30 Zn; 10 Mn; 0.20 I; 0.15 Mo; 0.15 Se; 2.5 Si;
1.0 Cr; 1.0 F; 0.5 Ni; 0.5 B; 0.1 B; 0.1 V; 0.07 Cob Containing in mg/kg diet: 5000 (IU) vitamin A; 1000 (IU) vitamin D3; 50 (IU) vitamin E; 5 thiamin; 6 riboflavin; 8 pyridoxol; 2 folic acid; 0.3
D-biotin; 0.03 vitamin B-12; 20 pantothenate; 2600 cholinhydrogentartrat; 400 inositol; 40 nicotinic acid; 1 phylloquinine; 40 p-aminobenzoic
acid; 1000 methionine; 2000 L-cystinec Dry matter (g/100 g), macronutrient (%), total phenolics (mg/kg) and pectin (g/kg) composition of apple pomace: 92.5 dry matter; 6.6 protein;
3.8 fat; 1.6 ash; 21.1 carbohydrates; total dietary fiber 59.5; total phenolics 3659.5; 32 total pectins; 7.3 water soluble pectinsd Dry matter (g/100 g), macronutrient (%), total phenolics (mg/kg) and pectin (g/kg) composition of apple pomace: 99.0 dry matter; 1.8 protein;
0.6 fat; 1.1 ash; 81.2 carbohydrates; total dietary fiber 13.2; total phenolics 2407.0; 97 total pectins; 20 water soluble pectinse 10.1 g and 20.3 g cholesterol/kg is mixed in the diet for group 2 and 3, respectively, in Study A
130 M. Kristensen et al.
123
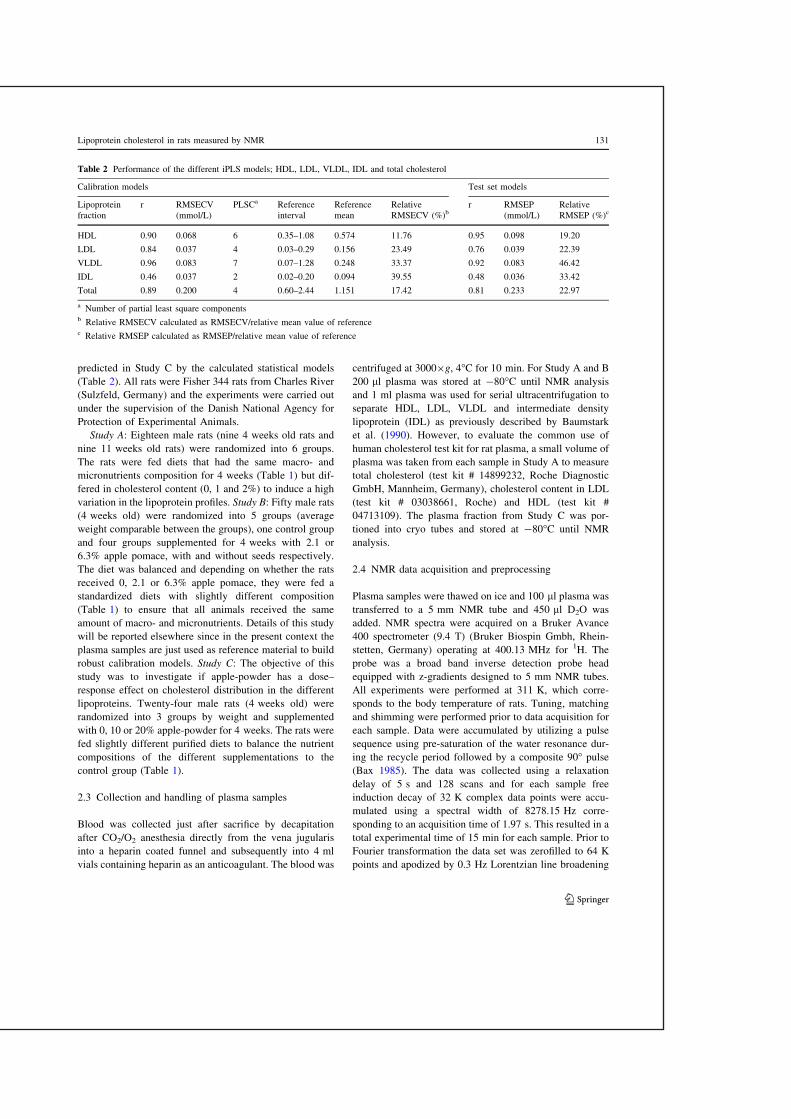
predicted in Study C by the calculated statistical models
(Table 2). All rats were Fisher 344 rats from Charles River
(Sulzfeld, Germany) and the experiments were carried out
under the supervision of the Danish National Agency for
Protection of Experimental Animals.
Study A: Eighteen male rats (nine 4 weeks old rats and
nine 11 weeks old rats) were randomized into 6 groups.
The rats were fed diets that had the same macro- and
micronutrients composition for 4 weeks (Table 1) but dif-
fered in cholesterol content (0, 1 and 2%) to induce a high
variation in the lipoprotein profiles. Study B: Fifty male rats
(4 weeks old) were randomized into 5 groups (average
weight comparable between the groups), one control group
and four groups supplemented for 4 weeks with 2.1 or
6.3% apple pomace, with and without seeds respectively.
The diet was balanced and depending on whether the rats
received 0, 2.1 or 6.3% apple pomace, they were fed a
standardized diets with slightly different composition
(Table 1) to ensure that all animals received the same
amount of macro- and micronutrients. Details of this study
will be reported elsewhere since in the present context the
plasma samples are just used as reference material to build
robust calibration models. Study C: The objective of this
study was to investigate if apple-powder has a dose–
response effect on cholesterol distribution in the different
lipoproteins. Twenty-four male rats (4 weeks old) were
randomized into 3 groups by weight and supplemented
with 0, 10 or 20% apple-powder for 4 weeks. The rats were
fed slightly different purified diets to balance the nutrient
compositions of the different supplementations to the
control group (Table 1).
2.3 Collection and handling of plasma samples
Blood was collected just after sacrifice by decapitation
after CO2/O2 anesthesia directly from the vena jugularis
into a heparin coated funnel and subsequently into 4 ml
vials containing heparin as an anticoagulant. The blood was
centrifuged at 30009g, 4�C for 10 min. For Study A and B
200 ll plasma was stored at -80�C until NMR analysis
and 1 ml plasma was used for serial ultracentrifugation to
separate HDL, LDL, VLDL and intermediate density
lipoprotein (IDL) as previously described by Baumstark
et al. (1990). However, to evaluate the common use of
human cholesterol test kit for rat plasma, a small volume of
plasma was taken from each sample in Study A to measure
total cholesterol (test kit # 14899232, Roche Diagnostic
GmbH, Mannheim, Germany), cholesterol content in LDL
(test kit # 03038661, Roche) and HDL (test kit #
04713109). The plasma fraction from Study C was por-
tioned into cryo tubes and stored at -80�C until NMR
analysis.
2.4 NMR data acquisition and preprocessing
Plasma samples were thawed on ice and 100 ll plasma was
transferred to a 5 mm NMR tube and 450 ll D2O was
added. NMR spectra were acquired on a Bruker Avance
400 spectrometer (9.4 T) (Bruker Biospin Gmbh, Rhein-
stetten, Germany) operating at 400.13 MHz for 1H. The
probe was a broad band inverse detection probe head
equipped with z-gradients designed to 5 mm NMR tubes.
All experiments were performed at 311 K, which corre-
sponds to the body temperature of rats. Tuning, matching
and shimming were performed prior to data acquisition for
each sample. Data were accumulated by utilizing a pulse
sequence using pre-saturation of the water resonance dur-
ing the recycle period followed by a composite 90� pulse
(Bax 1985). The data was collected using a relaxation
delay of 5 s and 128 scans and for each sample free
induction decay of 32 K complex data points were accu-
mulated using a spectral width of 8278.15 Hz corre-
sponding to an acquisition time of 1.97 s. This resulted in a
total experimental time of 15 min for each sample. Prior to
Fourier transformation the data set was zerofilled to 64 K
points and apodized by 0.3 Hz Lorentzian line broadening
Table 2 Performance of the different iPLS models; HDL, LDL, VLDL, IDL and total cholesterol
Calibration models Test set models
Lipoprotein
fraction
r RMSECV
(mmol/L)
PLSCa Reference
interval
Reference
mean
Relative
RMSECV (%)br RMSEP
(mmol/L)
Relative
RMSEP (%)c
HDL 0.90 0.068 6 0.35–1.08 0.574 11.76 0.95 0.098 19.20
LDL 0.84 0.037 4 0.03–0.29 0.156 23.49 0.76 0.039 22.39
VLDL 0.96 0.083 7 0.07–1.28 0.248 33.37 0.92 0.083 46.42
IDL 0.46 0.037 2 0.02–0.20 0.094 39.55 0.48 0.036 33.42
Total 0.89 0.200 4 0.60–2.44 1.151 17.42 0.81 0.233 22.97
a Number of partial least square componentsb Relative RMSECV calculated as RMSECV/relative mean value of referencec Relative RMSEP calculated as RMSEP/relative mean value of reference
Lipoprotein cholesterol in rats measured by NMR 131
123

and thereafter baseline- and phase corrected manually. All
spectra referenced according to a-D-glucose at 5.23 ppm.
The spectral area chosen for multivariate data analysis was
0–6 ppm with exclusion of the 4.5–4.8 ppm region domi-
nated by the residual water region (Fig. 1). After pre-
liminary data analysis the region 0.6–1.4 ppm was selected
for subsequent analysis. To correct for spectral misalign-
ment the entire dataset was Co-shifted (Correlation opti-
mized shifting) using an in-house developed algorithm
(www.models.life.ku.dk). In this procedure the sample
spectra are aligned towards a reference spectrum by simple
‘left–right’ shifting of the signal vector until the best cor-
relation is found with respect to a predetermined window.
Furthermore, after alignment data were normalized to unit
area.
2.5 Data analysis
To build robust calibration models 40 samples were
selected from Studies A and B, to ensure maximal variation
of reference data, and 20 samples were used for an inde-
pendent test set. Eight samples were not included in the
models due to odd reference value or poor NMR spectrum
quality.
From the ultracentrifugation based reference data and
the NMR spectra from Studies A and B, interval partial
least-square (iPLS) regression models (Nørgaard et al.
2000) were developed for predictions of the amount of
cholesterol in the different lipoprotein fractions. One iPLS
model was developed for each lipoprotein fraction. The
iPLS regression model splits the NMR spectrum into a
number of intervals and then PLS models are calculated
towards the response variable for each interval. The pre-
dictive performance of the PLS model for each interval can
then be compared with the predictive performance of the
full spectrum model. This gives complete overview of
which regions are best correlated with the response vari-
ables in the regression equation (Fig. 2). To evaluate the
performance of the prediction models the Root Mean
Square Error (RMSE) in combination with the correlation
4.5
x 104
pidsA
2 5
3
3.5
4
A.U
.]
d C
H3
Lip
id C
H2
Lac
tate
Gly
copr
otei
ns li
p=
CH
-CH
2
H=3 -OC
O-
1
1.5
2
2.5
Inte
nsit
y [A
Cho
lest
erol
C(1
8)H
3
Lip
id
Ala
nine
Cre
atin
ine
Lip
id =
CH
-CH
2CH
Glu
cose
Glu
cose
Lip
id =
CH
-N(C
H3)
3
CH
2CH
2-C
OC
O
CH
2CH
2-C
O
Gly
cero
l bac
kbon
e
Val
ine
Res
idua
l wat
er
4
0123456
0
0.5
1
δ [ppm]
α-G R
3
4
5x 10
[A.U
.]
δ [ppm]
RatHuman
B
0 60 70 80 911 11 21 3
1
2
Inte
nsit
y
0.60.70.80.911.11.21.3δ [ppm]
Fig. 1 An average 1H NMR spectrum of rat plasma at 311 K including assignment of the most prominent peaks (a). The average rat and an
average human NMR profile in the selected area (0.6–1.35 ppm) for iPLS modelling (b)
132 M. Kristensen et al.
123

coefficient (r) are used as a measure. RMSE is defined as
follows:
RMSE ¼
ffiffiffiffiffiffiffiffiffiffiffiffiffiffiffiffiffiffiffiffiffiffiffiffiffiffiffiffiffiffiffiffiffiPypred � yref� �2q
N
where ypred is the predicted value, yref is the laboratory
measured value, and N is the number of samples.
RMSECV is the Root Mean Square Error of Cross Vali-
dation and RMSEP is the Root Mean Square Error of
Prediction calculated on the independent test set. If the
model is good the RMSECV and RMSEP should be quite
similar. Future predictions are expected to be with-
in ± RMSEP. To validate our predictions, repeated ran-
dom cross validation with 6 segments and 100 repetitions
was used. All chemometric models were computed in
MATLAB (Math Works Inc., Massachusetts, US) and
predictions were calculated in LatentiX version 2.0
(Latent5, Copenhagen, Denmark).
The results from cholesterol prediction of Study C were
tested for normal distribution by Shapiro-Wilks test, and
the homogeneity of variance among groups was evaluated
by judgement of standardised residual plots. Normally
distributed data were further analysed by analysis of vari-
ance (GLM) followed by a least significant difference test,
whereas data that were not normally distributed were
compared using Wilcoxons nonparametric tests (HDL
data). A probability, P\ 0.05 was considered statistically
significant. All statistical analyses were performed using
SAS Enterprise Guide 3.0.2.414 software (SAS Institute
Inc., Cary, NC).
3 Results
Measurement of cholesterol content in HDL and LDL by
the human cholesterol kit and ultracentrifugation showed a
large disagreement between the two methods (Fig. 3a, b)
whereas measurement of total cholesterol had much higher
agreement (r = 0.86) between the two techniques
(Fig. 3c).
An example of the 400 MHz 1H NMR spectra of the rat
plasma is displayed in Fig. 1. Broad resonances from
protein and lipoprotein contribute strongly to the spectra.
Assignment of the spectra is done according to previous
investigations (Ala-Korpela 2007; Tang et al. 2004) with
the most important resonances for this research, being the
cholesterol backbone –C(18)H3 at 0.70 ppm and the broad
signals around 0.9 and 1.3 ppm which refers respectively to
the –CH3 and –CH2 groups of triglycerides, cholesterol
compounds and phospholipids.
Dividing the spectra into intervals enabled us to find the
spectral regions best predicting the reference data. Figure 2
shows an iPLS plot for HDL cholesterol prediction with
interval numbers versus root mean square error of cross-
validation (RMSECV) superimposed on the average spec-
trum. Interval 4 (1.24–1.27 ppm) has the lowest prediction
error (RMSECV) compared to the rest of the intervals, but
also interval 17 exhibit an improved prediction model.
Interval 4 and 17 includes resonances from –CH2 groups
and –CH3 groups, respectively, of triglycerides, cholesterol
compounds and phospholipids. However, since interval 4
perform slightly better than interval 17 (higher correlation
Fig. 2 iPLS plot with interval
number versus RMSECV,
superimposed on the average
spectrum for HDL cholesterol
prediction. Data is divided into
25 intervals and PLS models are
calculated for each interval.
Digits in the columns indicate
number of components used in
each local PLS model. The
dotted line marks the RMSECV
(8 components) of the global
model
Lipoprotein cholesterol in rats measured by NMR 133
123
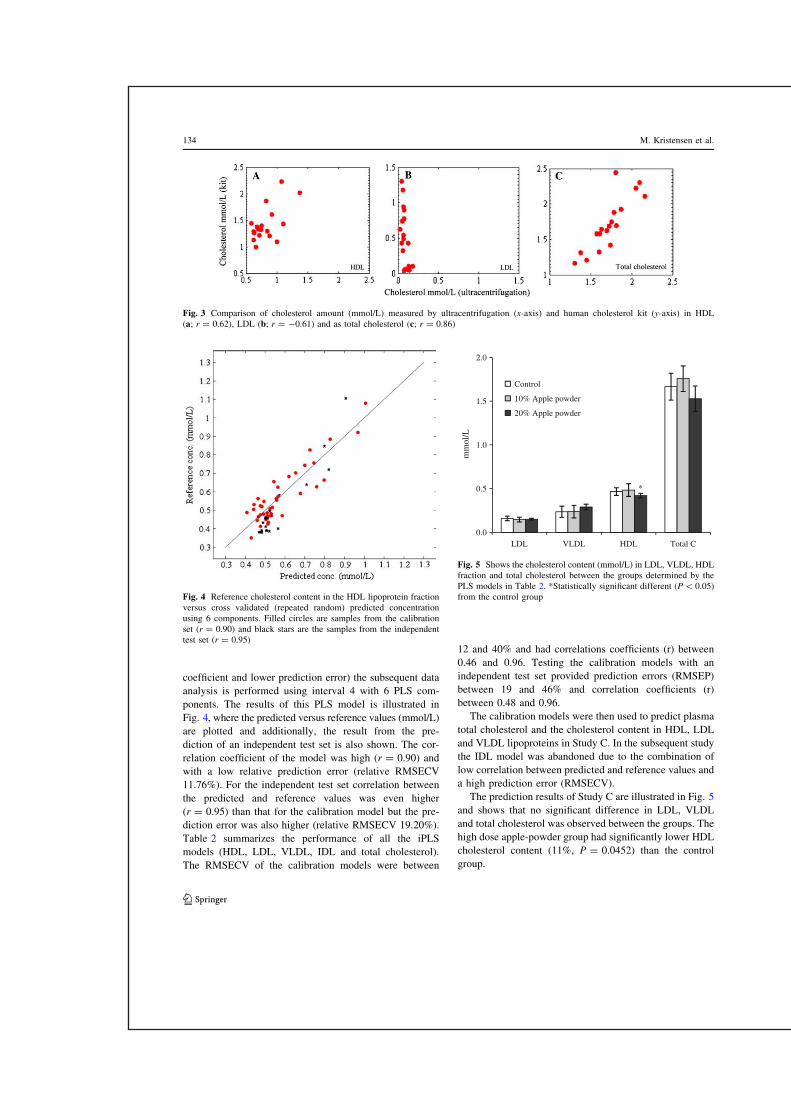
coefficient and lower prediction error) the subsequent data
analysis is performed using interval 4 with 6 PLS com-
ponents. The results of this PLS model is illustrated in
Fig. 4, where the predicted versus reference values (mmol/L)
are plotted and additionally, the result from the pre-
diction of an independent test set is also shown. The cor-
relation coefficient of the model was high (r = 0.90) and
with a low relative prediction error (relative RMSECV
11.76%). For the independent test set correlation between
the predicted and reference values was even higher
(r = 0.95) than that for the calibration model but the pre-
diction error was also higher (relative RMSECV 19.20%).
Table 2 summarizes the performance of all the iPLS
models (HDL, LDL, VLDL, IDL and total cholesterol).
The RMSECV of the calibration models were between
12 and 40% and had correlations coefficients (r) between
0.46 and 0.96. Testing the calibration models with an
independent test set provided prediction errors (RMSEP)
between 19 and 46% and correlation coefficients (r)
between 0.48 and 0.96.
The calibration models were then used to predict plasma
total cholesterol and the cholesterol content in HDL, LDL
and VLDL lipoproteins in Study C. In the subsequent study
the IDL model was abandoned due to the combination of
low correlation between predicted and reference values and
a high prediction error (RMSECV).
The prediction results of Study C are illustrated in Fig. 5
and shows that no significant difference in LDL, VLDL
and total cholesterol was observed between the groups. The
high dose apple-powder group had significantly lower HDL
cholesterol content (11%, P = 0.0452) than the control
group.
Fig. 3 Comparison of cholesterol amount (mmol/L) measured by ultracentrifugation (x-axis) and human cholesterol kit (y-axis) in HDL
(a; r = 0.62), LDL (b; r = -0.61) and as total cholesterol (c; r = 0.86)
Fig. 4 Reference cholesterol content in the HDL lipoprotein fraction
versus cross validated (repeated random) predicted concentration
using 6 components. Filled circles are samples from the calibration
set (r = 0.90) and black stars are the samples from the independent
test set (r = 0.95)
0.0
0.5
1.0
1.5
2.0
LDL VLDL HDL Total C
mm
ol/L
Control
10% Apple powder
20% Apple powder
*
Fig. 5 Shows the cholesterol content (mmol/L) in LDL, VLDL, HDL
fraction and total cholesterol between the groups determined by the
PLS models in Table 2. *Statistically significant different (P\ 0.05)
from the control group
134 M. Kristensen et al.
123

4 Discussion
The present investigation have established 1H NMR based
iPLS models to estimate total cholesterol concentration in
plasma and the distribution of cholesterol within different
lipoprotein particles (VLDL, LDL and HDL) in the rat
plasma. The NMR based approach has shown a high level
of agreement with an established ultracentrifugation
method and at the same time the expenditure of plasma
volume is reduced by a factor of 10 (100 ll vs. 1 ml). This
significant reduction is of general interest due to the limited
amount of plasma available from rodent studies. It is
common practice to use human cholesterol test kits for
estimation of cholesterol fractions in rodent studies, but as
shown in the present work, this approach does not seem
valid for quantification of cholesterol content in HDL and
LDL in rat plasma. However, the kits seem applicable to
quantify total cholesterol in rat studies.
The consistency between concentrations of total choles-
terol, VLDL and HDL cholesterol measured by the ultra-
centrifugation and predicted by iPLS was high (r = 0.89,
0.96 and 0.90, respectively). A little lower correlation was
observed for LDL (r = 0.84) and this may be due to lower
amounts of this fraction in rat plasma presumably causing a
slightly more inaccurate measurement by the reference
method and NMR than what is seen for total cholesterol and
for the HDL and the VLDL fractions. Prediction of the
independent test set in each model gave quite similar cor-
relation coefficients, except for LDL and total cholesterol
where the correlation decreased by 8%. This could probably
be avoided by using a larger test set than the one available for
the present study. The relative prediction error (RMSECV)
of the VLDLmeasurement is moderately higher than for the
other accepted models (IDL not taken into account here) and
this trend was also observed in a previous study on human
blood by Petersen et al. (2005). However, the cause of this
phenomenon is not clear but might be due to problems with
an accurate measurement of this fraction by the ultracentri-
fugation method. Overall, the results from this study are in
agreement with previously published studies where chemo-
metric methods for the quantification of human lipoproteins
from NMR spectra were used (Dyrby et al. 2005; Petersen
et al. 2005). However, in this study models using the full
NMR spectrum could not be obtained wherefore selection of
minor parts (intervals) of the spectrum was required in order
to obtain reasonable prediction models of the cholesterol
distribution in rat plasma. It is important to observe that the
two intervals with the lowest RMSECV represent the –CH2
groups and –CH3 groups of the same lipids in a particular
lipoprotein fraction as are both displaced in chemical shift
due to the slower diffusion as elegantly demonstrated by
Dyrby et al. (2005) using diffusion edited NMR and
PARAFAC modeling.
When using the calibration models to estimate choles-
terol distribution in Study C we observed that the apple-
powder treatments did not have any significant effects on
LDL, VLDL and total cholesterol but a significantly
decreased HDL cholesterol in the 20% apple-powder
group. No dose–response effect was observed on the
lipoprotein profile between the 10 and 20% apple-powder
dose. This indicates that the apple-powder has to be con-
sumed in quite large amounts before any effect is reflected
in the lipoprotein profile.
A previous study by Aprikian et al. (2002) where lean
Zucker rats were fed 20% lyophilized apples for 3 weeks
showed no significant effect of the apple diet on the lipo-
protein profile of lean rats. In our study the rats were on the
apple-powder diet for one week more than those in the
referred study (Aprikian et al. 2002). Also, different apple
varieties, processing (air-dried versus freeze-dried) and
different rat strains were used. These variations may have
caused the significant effect on HDL cholesterol of dried
apple in our study compared to no effect on the lean rats in
the study of Aprikian et al. (2002).
The diet used in this study was regulated in sucrose/
fructose and total fiber content to obtain a similar sugar-
and total fiber composition in the control and apple diets.
The remaining potential bioactive ingredients in apples,
e.g. polyphenols and soluble fiber content (pectin) was not
regulated and may be the responsible components for the
significantly lowered HDL cholesterol in the high apple-
powder group. A rat study by Aprikian et al. (2003) sug-
gested that apple pectin and polyphenols act in synergy
since no total plasma cholesterol lowering was observed
when clean apple pectin was introduced but a significantly
lowering effect was found when introducing apple poly-
phenol and pectin jointly. This has conformity to our
findings where total cholesterol is lowered, although non-
significantly, in the high apple-powder group compared to
the control group. Unfortunately, HDL cholesterol was not
measured separately in the study by Aprikian et al. (2003).
When performing human intervention studies with
potential cholesterol lowering compounds a decrease in
LDL and total cholesterol and additionally an increase or
no change in HDL cholesterol would be expected. Com-
pared to humans, rats are naturally deficient in cholesterol
ester transfer protein activity (Ha and Barter 1982), which
is an important factor in the reverse cholesterol transport
pathway (RCT). In RCT cholesterol is delivered from
macrophages or other cells to the liver or to excretion in the
intestine. Rats may have developed some compensatory
mechanisms for this deficiency and this should be taken
into account when evaluating physiological effects of die-
tary interventions in rats. Introduction of exogenous active
compounds, e.g. from apple may induce or decrease
activity and production of enzymes, transporters and
Lipoprotein cholesterol in rats measured by NMR 135
123

receptors acting in the RCT pathway. Hereby the flux of
cholesterol through the RCT pathway may be up regulated,
resulting in a higher throughput and lower net cholesterol
concentrations in HDL particles. However, the actual
mechanisms causing the characteristics of the lipoprotein
profile in this study needs further investigation to elucidate
the implicated pathways.
Summarizing, this study shows that the iPLS approach is
in good accordance with spectral interpretation and that
chemometric analysis of NMR spectra of rat plasma seems
to be a feasible and facile way to quantify lipoprotein
fractions in small amounts of stored, frozen plasma from
rodent studies. Additionally, this work also illustrates a
significant HDL cholesterol lowering effect of dried apple-
powder in rats.
Acknowledgements We thank Joan Elisabeth Frandsen and Lars
Bentzen for their help and technical support. Funded by the European
Commission (ISAFRUIT) under the Thematic Priority 5—Food
Quality and Safety of the 6th Framework Programme of RTD
(Contract no. FP6-FOOD-CT-2006-016279).
References
Ala-Korpela, M. (2007). Potential role of body fluid 1H NMR
metabonomics as a prognostic and diagnostic tool. ExpertReview of Molecular Diagnostics, 7, 761–773.
Aprikian, O., Busserolles, J., Manach, C., Mazur, A., Morand, C.,
Davicco, M. J., et al. (2002). Lyophilized apple counteracts the
development of hypercholesterolemia, oxidative stress, and renal
dysfunction in obese Zucker rats. Journal of Nutrition, 132,1969–1976.
Aprikian, O., Duclos, V., Guyot, S., Besson, C., Manach, C.,
Bernalier, A., et al. (2003). Apple pectin and a polyphenol-rich
apple concentrate are more effective together than separately on
cecal fermentations and plasma lipids in rats. Journal ofNutrition, 133, 1860–1865.
Bathen, T. F., Krane, J., Engan, T., Bjerve, K. S., & Axelson, D.
(2000). Quantification of plasma lipids and apolipoproteins by
use of proton NMR spectroscopy, multivariate and neural
network analysis. NMR in Biomedicine, 13, 271–288.Baumstark, M. W., Kreutz, W., Berg, A., Frey, I., & Keul, J. (1990).
Structure of human low-density lipoprotein subfractions, deter-
mined by X-ray small-angle scattering. Biochimica et BiophysicaActa, 1037, 48–57.
Bax, A. (1985). A spatially selective composite 90� radiofrequency
pulse. Journal of Magnetic Resonance, 65, 142–145.Castelli, W. P. (1996). Lipids, risk factors and ischaemic heart
disease. Atherosclerosis, 124, S1–S9.Contois, J. H., Gillmor, R. G.,Moore, R. E., Contois, L. R.,Macer, J. L.,
& Wu, A. H. (1999). Quantitative determination of cholesterol in
lipoprotein fractions by electrophoresis. Clinica Chimica Acta,282, 1–14.
Davis, R. A., & Vance, J. E. (1996). Structure, assembly and secretion
of lipoproteins. In D. E. Vance & J. E. Vance (Eds.),
Biochemistry of lipids, lipoproteins and membranes (pp. 473–
493). New York, NY: Elsevier.
Dyrby, M., Petersen, M., Whittaker, A. K., Lambert, L., Nørgaard, L.,
Bro, R., et al. (2005). Analysis of lipoproteins using 2D
diffusion-edited NMR spectroscopy and multiway chemomet-
rics. Acta Chimica Analytica, 531, 209–216.Friedewald, W. T., Levy, R. I., & Fredrickson, D. S. (1972).
Estimation of the concentration of low-density lipoprotein
cholesterol in plasma, without use of the preparative ultracen-
trifuge. Clinical Chemistry, 18, 499–502.Ha, Y. C., & Barter, P. J. (1982). Differences in plasma cholesteryl
ester transfer activity in sixteen vertebrate species. ComparativeBiochemistry and Physiology B: Comparative Biochemistry, 71,265–269.
Nørgaard, L., Saudland, A., Wagner, J., Nielsen, J. P., Munck, L., &
Engelsen, S. B. (2000). Interval partial least-squares regression
(iPLS): A comparative chemometric study with an example from
near-infrared spectroscopy. Applied Spectroscopy, 54, 413–419.Petersen, M., Dyrby, M., Toubro, S., Engelsen, S. B., Norgaard, L.,
Pedersen, H. T., et al. (2005). Quantification of lipoprotein
subclasses by proton nuclear magnetic resonance-based partial
least-squares regression models. Clinical Chemistry, 51, 1457–1461.
Tang, H., Wang, Y., Nicholson, J. K., & Lindon, J. C. (2004). Use of
relaxation-edited one-dimensional and two dimensional nuclear
magnetic resonance spectroscopy to improve detection of small
metabolites in blood plasma. Analytical Biochemistry, 325, 260–272.
136 M. Kristensen et al.
123


1
Effects of apple and pectin feeding on cholesterol metabolism and antioxidant
response in healthy rats
Mette Kristensen1*
, Runa I. Jensen2, Britta N. Krath
2, Jaroslaw Markowski
3, Morten Poulsen
4and
Lars O. Dragsted2
1Department of Food Science and
2Department of Human Nutrition, University of Copenhagen,
30 Rolighedsvej, 1958, Frederiksberg, Denmark
3Research Institute of Pomology and Floriculture, Department of Storage and Processing,
Pomologiczna 18, 96-100, Skierniewice, Poland
4Department of Toxicology and Risk Assessment, National Food Institute, Technical University
of Denmark, Mørkhøj Bygade 19, 2860 Søborg, Denmark
Runing title: Effects of apple and pectin feeding in rats
Key words: Apple, Pectin, Cholesterol metabolism, Antioxidant enzymes, Gene expression
Abbreviations: ALAT, alanine aminotransferase; AlP, alkaline phosphatase; Cat, catalase; GGT,
γ-glutamyl transpeptidase; Gr, gene expression of glutathione reductase; Gxp1, gene expression
of glutation peroxidase; Hb, haemoglobin; HDL, high-density lipoprotein; Hmgcr, gene
expression of 3-hydroxy-3-methylglutaryl coenzyme A reductase; LDL, low-density lipoprotein;
Nqo1, NAD(P)H:quinine oxidoreductase; TAG, triacylglycerides; TC, total cholesterol; VLDL,
very low-density lipoprotein
Corresponding author: Mette Kristensen, tlf: +45 35332570, fax: +45 35333245, e-mail:
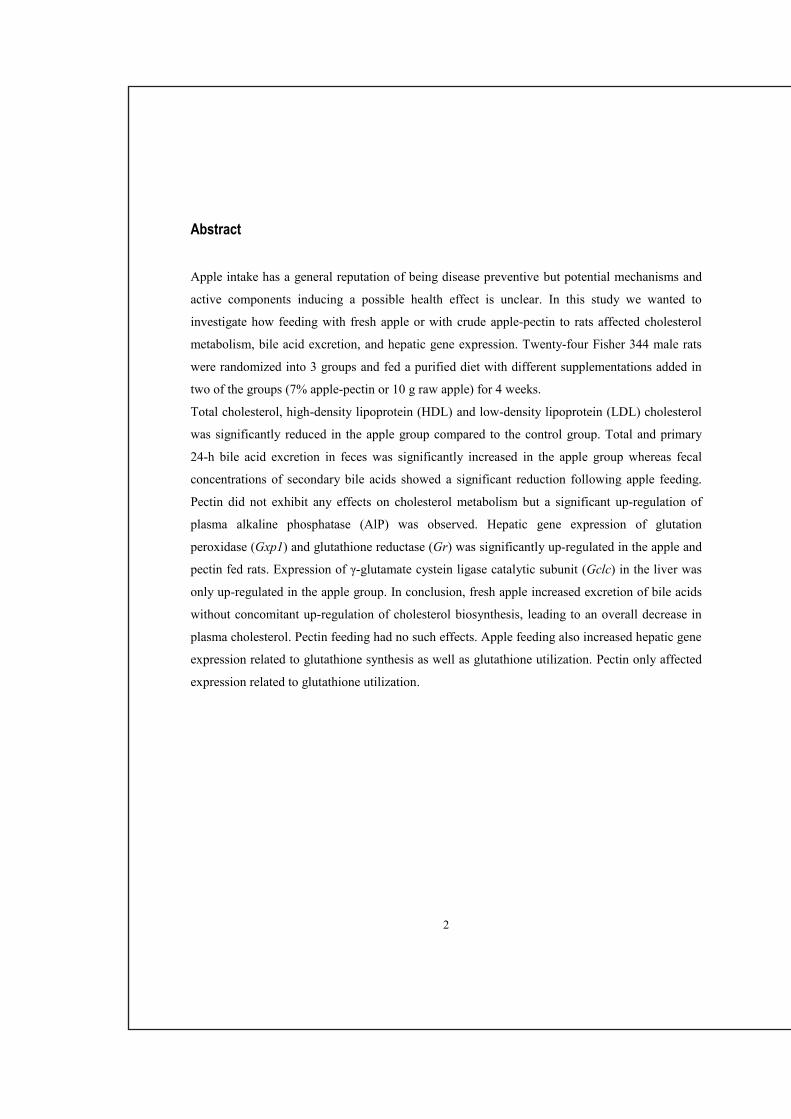
2
Abstract
Apple intake has a general reputation of being disease preventive but potential mechanisms and
active components inducing a possible health effect is unclear. In this study we wanted to
investigate how feeding with fresh apple or with crude apple-pectin to rats affected cholesterol
metabolism, bile acid excretion, and hepatic gene expression. Twenty-four Fisher 344 male rats
were randomized into 3 groups and fed a purified diet with different supplementations added in
two of the groups (7% apple-pectin or 10 g raw apple) for 4 weeks.
Total cholesterol, high-density lipoprotein (HDL) and low-density lipoprotein (LDL) cholesterol
was significantly reduced in the apple group compared to the control group. Total and primary
24-h bile acid excretion in feces was significantly increased in the apple group whereas fecal
concentrations of secondary bile acids showed a significant reduction following apple feeding.
Pectin did not exhibit any effects on cholesterol metabolism but a significant up-regulation of
plasma alkaline phosphatase (AlP) was observed. Hepatic gene expression of glutation
peroxidase (Gxp1) and glutathione reductase (Gr) was significantly up-regulated in the apple and
pectin fed rats. Expression of γ-glutamate cystein ligase catalytic subunit (Gclc) in the liver was
only up-regulated in the apple group. In conclusion, fresh apple increased excretion of bile acids
without concomitant up-regulation of cholesterol biosynthesis, leading to an overall decrease in
plasma cholesterol. Pectin feeding had no such effects. Apple feeding also increased hepatic gene
expression related to glutathione synthesis as well as glutathione utilization. Pectin only affected
expression related to glutathione utilization.

3
Introduction
The evidence of health beneficial effects of fruit and vegetables are continually growing and
especially an inverse association with cardiovascular diseases (CVD) is becoming well-
established(1,2)
. Based on these findings the current dietary advice in Europe and America is to
consume five or more portions of fruit and vegetables each day and fruits in particular appear as
food products with wide popularity since it is often eaten fresh as an easy and convenient snack.
Apple remains one of the most consumed fruits in the western world and the health impact from
intake of this fruit seems very relevant to investigate. Apple has a historical reputation of being a
healthy component in the diet and scientific evidence has been able to support this assertion in
some regards(3,4)
although the active factors and mechanisms responsible for these health
promoting actions still remain uncertain. Previous human intervention studies(5-7)
have linked
apple intake with a lower risk of developing CVD although the quality of these studies do not
meet todays’ design and quality demands. Some of the early risk markers of CVD are related to
plasma lipids: high levels of plasma triacylglycerides (TAG), total cholesterol (TC), low-density
and very low-density lipoprotein (LDL and VLDL) along with low levels of high-density
lipoprotein (HDL) cholesterol and the ability of apple to reduce some of these main CVD risk
factors need further confirmation. Most of the earlier conducted animal studies investigating the
effect of apple on these risk markers have used freeze-dried apple, apple pomace or purified
constituents and to the best of our knowledge no previous animal studies have been investigating
effects of freshly cut apple.
The cholesterol-lowering properties of apples have partially been ascribed to the fibre moiety of
the fruit where particular pectin is believed to play a major role(8)
. Apple-pectin can be extracted
as a by-product from apple juice production and this fibre component is frequently used in
various food products due to its high viscosity. Recently highly methoxylated apple-pectin with
ultra low viscosity has been developed(9)
to be applied as a functional food ingredient that
improves mouthfeel and helps to increase fibre contents in e.g. beverages. Daily human intake of
pectins from various sources may therefore, in some cases, exceed many-folds the natural intake
from moderate consumption of apples or other fruits. Pectins in general are presumed to prevent
the reabsorbtion of bile acids in the intestine and to enhance steroid excretion, diverting more
4
cholesterol into the bile acid pool(10)
. However, pectins from different plant origins have a large
structural diversity, thus possibly having varied health effects, and previous animal studies
reporting on pectin feeding and plasma cholesterol have been inconsistent(11-13)
.
Apples also contain a variety of phenolic compounds (catechins, anthocyanidins,
dihydrochalcones, etc.) which exhibit antioxidative properties in vitro(14)
but whether these
effects have biological relevance in vivo is not well examined. Additionally, some researchers
claim that dietary fibres, including pectin, may exhibit antioxidant properties(15,16)
or that the
polyphenols reduce cholesterol(17)
. Since the liver has a central role for regulation of plasma
lipids and antioxidant systems this organ seems particularly relevant to investigate in this context.
Therefore, in the present study we aimed to investigate markers related to cholesterol synthesis,
status and loss, as well as hepatic gene expression responses related to glutathione formation and
utilization, which are both health related aspects possibly affected by intake of whole raw apple
or apple-pectin.
5
Materials and methods
Chemicals
All chemical reagents used were analytical grade from Fluka (Steinheim, Germany), Merck
(Darmstadt, Germany) and Sigma-Aldrich (Brøndby, Denmark). Ethanol (96%) was purchased
from De Danske Spritfabrikker, Aalborg, Denmark. Water is MilliQ (Millipore, Bedford, MA)
with >18 Ω resistivity. The bile acids: dehydrocholic acid, 13C glycocholic acid, ursodeoxycholic
acid, chenodeoxycholic acid, litocholic acid were purchased from Sigma-Aldrich (Brøndby,
Denmark). Tauroursodeoxycholic acid, glycoursodeoxycholic acid, taurocholic acid, glycocholic
acid, taurochenodeoxycholic acid, cholic acid, taurodeoxycholic acid, glycodeoxycholic acid,
deoxycholic acid were purchased from Merck (Darmstadt, Germany). Alpha-muricholic acid and
beta-muricholic acid were obtained from Steraloids (Newport, Rhode Island, USA).
Apple and pectin analysis
Apples used in the present study were of the variety ‘Shampion’ and were delivered from an
orchard near Skierniewice, Poland. The chemical composition of this apple variety is shown in
Table 1. The apple-pectin used was a commercial, unrefined pectin, kindly provided by Obi-
Pectin AG (Basel, Switzerland).
Rat study design and sample collection
Twenty four healthy male Fisher 344 rats, which is an inbreed strain with very limited genetically
variance, were obtained from Charles River (Sulzfeld, Germany). The rats were fed either a
control diet; a modified control diet added 7% of crude apple-pectin, or a modified control diet
together with 10g of fresh apple per animal/d during four weeks. Every diet was based on a
purified rodent diet produced at the National Food Institute, Technical University of Denmark
and was nutritionally balanced as described in Table 2. Animal experiments were carried out
under the supervision of the Danish National Agency for the Protection of Experimental Animals.
All animal study procedures have been approved by the Institutional Committee for Animal
Experimentation and the National Food Institute has been approved for this type of experiment
with rodents by the Danish Ministry of Justice. Faeces samples were collected after 24 d of

6
feeding while the rats were housed singularly in metabolic steel cages with a device to separate
urine from faeces. Total faeces from a 24-h collection were stored frozen at -80 ºC until analysis.
After 4 weeks on the experimental diets the animals were fasted overnight. The next day the rats
were anesthetized in CO2/O2 and sacrificed by decapitation. Immediately after the decapitation,
blood was collected into two different vials, and the liver, colon and caecum removed. The
control group of this experiment was shared with another experiment on onion and onion fibre
that has been published previously(18)
.
Processing of blood samples
One mL of blood was collected into a PAXgene blood RNA tube for purification of RNA from
the white blood cells (WBC) (BD Denmark A/S, Brøndby, Denmark). The rest of the blood was
collected in vacutainerTM
tubes containing heparin as an anticoagulant. After 10 min of
incubation on ice the samples were centrifuged at 1500g for 10 min at 4 °C. Plasma was removed
for later analysis of enzymes, triacylglycerides and lipoproteins. The erythrocyte fraction was
haemolysed by adding an equal volume of ice-cold water. All collected fractions were
immediately frozen at –80 °C.
Biochemical analysis of plasma TAG, TC and markers of hepatic function
Alkaline phosphatase (AlP), alanine aminotransferase (ALAT), gamma glutamyl transferase
(GGT), TC and TAG concentrations were measured in rat plasma samples using an automated
Roche/Hitachi 912 analyzer at 37 ºC in accordance with the instructions of the manufacturers
(Roche Diagnostic GmbH Mannheim, Germany).
1H NMR analysis and chemometric models for quantification of cholesterol contents in plasma
lipoproteins
Cholesterol content in HDL, LDL and VLDL were analyzed in rat plasma samples. For1H NMR
analysis, plasma samples were thawed on ice and 100 μL plasma was transferred to a 5 mm NMR
tube and 450 μL D2O was added. NMR spectra were acquired on a Bruker Avance 400 MHz
spectrometer (9.4 T) (Bruker Biospin Gmbh, Rheinstetten, Germany) at 311K, which corresponds
to the body temperature of rats. Cholesterol content in HDL, LDL and VLDL lipoproteins were
7
then predicted by previously developed chemometric models based on NMR data and interval
Partial Least Square models from 60 Fisher 344 rats(19)
.
Haemoglobin analysis
On the day of analysis the 50% haemolysates were thawed slowly on ice and diluted 2.5x in
water and sonicated 10s on ice. The samples were further diluted to 40x in 100 mM KH2PO4
buffer pH 7.4 containing 1 mM DTT and 1 mM EDTA. Haemoglobin (Hb) were determined
spectrophotometrically on an Automated Roche/Hitachi 912 Analyzer (Roche Diagnostic A/S,
Hvidovre, Denmark) at 37 ºC using Drapkins Reagent (Randox HG980) as recommended by the
manufactor (Randox Laboratories Ltd., Crumlin, UK.
Sampling of liver, RNA isolation and quantitative real-time PCR
The rat liver was removed, weighted and grinded in liquid N2 to a fine powder which was stored
at -80 ºC. On the day of analysis total RNA was isolated from 30 mg liver powder using Qiagen
RNeasy Mini kit according to the protocol described by the manufacturer (Qiagen, Hilden,
Germany). Reverse transcriptase reactions were performed using Random Hexamer and
SuperScript™ II Reverse Transcriptase kit according to the manufacturer’s instructions
(Invitrogen).
Relative mRNA expression was quantified by Real-time PCR on an ABI 7900HT FAST System
as described previously(20)
. TaqMan® Gene Expression Assays used were the following:
Eukaryotic 18S rRNA Endogenous Control (catalog number 4352930E); rat catalase (Cat)
(catalog number Rn00680386_m1), rat γ-glutamate cystein ligase catalytic subunit (Gclc)
(catalog number Rn00689048_m1); rat glutathione peroxidase (Gpx1) (catalog number
Rn00577994_g1), rat glutathione reductase (Gr) (catalog number Rn01482160_m1); and rat
NAD(P)H:quinine oxidoreductase (Nqo1) (catalog number Rn00566528_m1) and rat 3-hydroxy-
3-methylglutaryl coenzyme A reductase (Hmgcr) (catalog number Rn_00695772_g1).
Bile acids analysis by LC/MS and transit time measurement
The concentration of bile acids in faeces samples was measured by a novel LC/MS/MS method
(Jensen et al., in prep.). Briefly, total faces were weighed, homogenized with 14 volumes (w/v) of

8
water to slurry, and 0.3 g samples were aliquoted. 0.3 mg of this homogenate was added 13C
glycocholic acid as internal standard and extracted three times with acetonitrile. The eluate was
diluted with 0.1% formic acid and concentrated on an Oasis HLB 3cc column (Waters, Milford,
MA). The acetonitrile eluate was evaporated to dryness and redissolved in 20% acetonitrile, 24%
methanol, 0.1% formic acid (80% mobile phase A). Samples and standards were analysed on an
Acquity UPLC with a TQ detector (Waters, operated in MRM mode with a gradient from phase
A to B (100% acetonitrile) over 5 min. Between run CV% for the internal standard (n=48) was
13.5%. The individual compounds were quantified using QuanLynx version 4.1 (Waters) based
on internal standards and external calibrants. Based on the analytical results for the individual
primary and secondary bile acids these were summed for each rat.
One week before sacrifice the transit time was measured as described in Roldán-Marin et al.(21)
Statistical analysis
The data were analyzed for normal distribution using the Shapiro-Wilcks W-test and for
homogeneity of variance Levenes test (P>0.05) was used. Some data had to be log transformed in
order to meet these criteria. The normally distributed and variance homogenous data were
analysed by ANOVA. If significant differences were found between groups further comparisons
were done using least square means, whereas data that were not normally distributed were
compared using Wilcoxons nonparametric tests. We used the SAS statistical package v. 9 (SAS
Institute, Cary, NC, USA) and consider a P-value below 0.05 significant.
Principal component analysis (PCA) was conducted on all of the effect variables (except gene
expression markers since these were only performed for five animals per group) including earlier
published effect marker on the gut environment(22)
by use of Matlab (MatWorks). Variables were
autoscaled before analysis. Residual and Hotelling plots were used to search for possible outliers.

9
Results
Animal weight and feed intake
Animals were increasing their weight stably during the trial and there were no significant
differences between groups. The liver weight was significant lower in the apple group
(P=0.0123) as compared to the control group (Table 3). The relative liver weights did not differ
significantly between the groups. The animals in the apple group had a significantly lower intake
of feed than the other groups, due to their intake of apples given beside the diet (Table 4). The
rats in the apple group consumed 9.3 ± 1.4g (mean ± SD, range 8.9 ± 1.7 to 9.8 ± 0.6) per day of
the apple pieces offered with no differences between the study weeks. A night video recorded for
one of the cages revealed that both rats in the cage were eating apple and apparently sharing the
pieces offered but that the apple skin was the last to be consumed. The skin was also the most
common leftover in the cages. The pectin group did not differ from the control group with respect
to feed intake. The pectin intake was 6.5g/week in the pectin group and pectin intake from apples
could be calculated to reach 0.4g/week in the apple group.
Lipids
The cholesterol distribution in the different lipoprotein fractions are shown in Figure 1.
Cholesterol content in the LDL fraction was significantly lower (P = 0.0005) in the apple group
as compared to the control group and the apple group had also significantly lower HDL
cholesterol and TC (P = 0.0002 and P = 0.0018, respectively) than the control group. Apple
pectin was without effects on the plasma lipids, except for a slight, but statistically non-
significant decrease in TAG and VLDL cholesterol.
Bile acid in feces and transit time
Bile acid excretion was significantly affected by the feeding with whole apple, increasing total
bile acid (P = 0.0196) as well as primary bile acid (P = 0.0171) in feces during 24 h (Figure 2).
The secondary bile acid excretion was non-significantly decreased in the total 24-h feces samples
in the apple group whereas the fecal concentration (umol/g) of secondary bile acids was
significantly reduced (P<0.05) compared to the control group (data not shown). Pectin showed no
10
significant changes when compared to the control group although a trend towards increased
excretion of primary and total bile acids was observed. Transit time was not affected significantly
by any of the treatments (data not shown).
Markers of liver function and gene expression
Plasma activities of the liver enzyme AlP was significantly up-regulated in the pectin group
compared to the control group (P = 0.0009) where as ALAT and GGT were not significantly up-
or down-regulated in any of the groups (Table 5). Hb concentration, expressed as g/l of
erythrocytes, was not affected by the apple or pectin treatment.
The hepatic gene expression of antioxidant enzymes showed a significant up-regulation of Gclc
(P = 0.009), Gxp1 (P = 0.028) and Gr (P = 0.028) activity in the apple fed rats (Table 5). The
activity of Gpx1 and Gr were also significantly up-regulated in the pectin group (P = 0.028 and
0.047, respectively). Hepatic gene expression of Hmgcr, Nqo1 and Cat were not significantly
affected by any of the treatments.
Multivariate analysis
To obtain an overview of all measured biomarkers a PCA was conducted. A PCA summarizes the
major variation in the data into a few axes and in this way systematic variation can be captured
and used to visualize which samples in a data set are similar or dissimilar to each other, and
which variables (biomarkers) are having high impact of potential clustering of samples. Figure 3
shows a combined scores and loading PCA plot (biplot) of all samples and effect markers,
respectively. The 3 first principal components explain approximately 54% of the variation in the
data and illustrate a clear separation between the pectin and the apple group by principal
component 1 (PC1) and PC3. Rat #3 seems to be an outlier, deviating from the rest of the control
group with a much higher PC2 score value, however it did not exhibit outlier behavior from
residual and Hotelling plots (data not shown). The control and the pectin group is overlapping
and especially the plasma lipids markers (TC, LDL, HDL, VLDL, TAG) and the liver weight
seems responsible for the separation between the apple fed rats and those in the control or pectin
groups.

11
Discussion
In the current study we report on different biological responses caused by fresh apple and apple-
pectin in healthy rats.
We found that a moderate level of apple intake during 4 weeks reduced total, HDL and LDL
cholesterol compared to the control group. Substantial evidence has shown a clear association
between decreased total and LDL cholesterol and reduced risk of CVD and from this point of
view, intake of whole apples seems to be favorable to improve cardiovascular health. To the best
of our knowledge no earlier rat studies have explored cholesterol effects after intake of fresh
apple. Previous rat studies conducted by Aprikian et al.(23)
showed a significant lowering of total
plasma cholesterol in healthy rats after intake of freeze-dried (lyophilized) apples. Another study
by the same authors found no significant effect of a 20% lyophilized apple diet on the lipoprotein
profile of lean rats but for obese hypercholesterolemic rats, fed the same diet, total and LDL
cholesterol was significantly lowered after apple intake(24)
. In this last study HDL cholesterol was
reduced by 28% in the obese rats fed apples, but whether the decrease was significant is not
stated in the paper. Salgado et al.(25)
observed an increase in the amount of HDL cholesterol and
decrease in total and LDL cholesterol in Wistar rats after intake of 5, 15 and 25% apple-powder
in a cholesterol-containing diet during 30 d. However, the measurement method of HDL and
LDL cholesterol in this study is of doubtful quality due to use of commercial cholesterol kits and
the Friedewald formula in rat studies, as earlier pointed out(19)
. In humans we would expect an
increase in HDL cholesterol when total and LDL cholesterol is lowered by an exogenous agent,
but in our rat study HDL was significantly decreased. In contrast to humans, rats are naturally
deficient in cholesterol ester transfer protein activity(26)
and may have developed some
compensatory mechanisms for this deficiency. These aspects have to be taken into account when
evaluating physiological effects of dietary interventions in rats. HDL plays a major role in the
reverse cholesterol transport pathway (RCT) which delivers free cholesterol from macrophages or
other cells to the liver or intestine. Lewis and Rader(27)
stated, that the flux of cholesterol through
the RCT pathway, and hereby the activity of enzymes, transporters and receptors, may be a more
important determinant of cardiovascular disease risk than steady-state HDL cholesterol
concentrations. The HDL cholesterol lowering effect we observed from the apple treatment may

12
be due to increased activity of players in the RCT pathway which thereby cause a higher
throughput and lower net cholesterol concentrations in HDL particles. However, these
mechanisms have to be investigated further to draw firm conclusions on implicates players and
pathways.
Pectin intake was not found to affect cholesterol distribution in any significant manner in the
present study. Previous animal studies reporting on apple-pectin feeding and plasma cholesterol
have been inconsistent; Trautwein et al.(28)
did not observe any effect of introducing apple-pectin
to cholesterol-fed hamsters whereas Samble-Amplis et al.(29)
found a significant reduction in
plasma TC in hamsters when apple-pectin was added to a cholesterol diet at a very high dose
level. In consistency with our results Aprikian et al.(30)
found no effect of apple-pectin on total
plasma cholesterol in Wistar rats. In the same study, treatments with apple polyphenols showed
no cholesterol effect by polyphenols alone but a significant plasma cholesterol lowering effect
was observed when introducing polyphenol and pectin jointly. This highlights that apple-pectin
and polyphenols may act in synergy to exhibit a stronger cholesterol lowering potential, directing
us to a possible explanation of our results. The plasma cholesterol lowering effect we observe by
apple, and not by pectin alone, may be caused by a combined effect of the polyphenol and pectin
present in whole apple.
Pectins in fruit are frequently thought to prevent the reabsorbtion of bile acids in the intestine and
to enhance steroid excretion, diverting more cholesterol into the bile acid pool(31)
. However we
did not find a significant increase of total fecal bile acids excretion in the pectin supplemented
group and this finding was supported in the study by Aprikian et al.(32)
which likewise found no
effect of apple-pectin on total plasma cholesterol.
The apple treatment was found to increase total and primary bile acid excretion corroborating our
finding of a significant decrease in total plasma cholesterol. Increased bile acid excretion may to
some extent be a consequence of increased bile acid production and this might explain the
decrease in plasma cholesterol by apples. Free cholesterol is the preferred substrate for 7α-
hydroxylase, which is the rate-limiting enzyme in bile acid synthesis, and a higher bile acid
production in the liver will remove more cholesterol from plasma. Sable-Amplis et al.(33,34)
measured the activity of 7α -hydroxylase in hamsters and found an enhanced activity of this

13
enzyme after intake of fresh apple. Increased bile acid excretion is often compensated by an
increased cholesterol synthesis. In our study we examined hepatic gene expression of Hmgcr
which is the gene coding for 3-hydroxy-3-methylglutaryl-coenzyme A reductase, the rate-limiting
enzyme for cholesterol synthesis. This gene was non-significantly down-regulated in the apple
group, indicating that a compensatory up-regulation was clearly not observed.
In support of our findings, Sembries et al.(35)
and Aprikian et al.(36)
observed a significant
increase in total faecal bile acid excretion in rats after feeding with an apple extraction juice and
lyophilized apple, respectively. The former study differentiated between primary and secondary
bile acids and found significantly decreased faecal excretion of secondary bile acids. Secondary
bile acids are formed after enzymatic deconjugation and dehydroxylation of primary bile acids in
colon by anaerobic bacteria. Secondary bile acids are toxic to several cell systems at
physiological concentrations and have shown tumour-promoting capacities in animal
experiments(37)
. The significantly lower concentration of secondary bile acids that we observed in
the apple group may be secondary to the change in the excretion of primary bile acids, or reflect a
change in intestinal milieu or gut microbiota. Analysis of the effects of apple feeding on the
caecal environment and the denaturing gradient gel electrophoresis profile of the microbiota from
this present study has earlier been published(22)
and results from that study are included in the
PCA presented here (Figure 3). Butyrate concentration was significantly increased, pH in caecum
content was significantly decreased in both the pectin and apple group and the composition of the
microbiota was altered. Some of these factors may be involved in the lower excretion of
secondary bile acids in the apple group. A lower pH value in faeces probably reflects a higher
concentration of short chain fatty acids and a decreased pH has earlier shown to reduce the
activity of 7α-dehydroxylase, one of the enzymes responsible for converting primary to
secondary bile acids(38)
. The concentration of excreted secondary bile acids does not decrease in
the pectin group and it seems reasonable to speculate that pectin per se does not strongly affect
bile acid excretion and to consider other fractions in the apple as more likely to be responsible for
the effect. Polyphenols reaching the caecum and colon can be extensively metabolised by the
microbiota to various phenolic acids. This may change the chemical or biological environment
affecting bile acid metabolism. Another hypothesis is that a greater proportion of primary bile

14
acids is excreted by binding to unabsorbed polyphenols during passage through the small
intestine(39)
, hereby leaving fewer free bile acids for conversion into secondary bile acids.
The effect of apple intake on glutathione-related gene expression has not been reported
previously. We observed here that apple and pectin can affect genes involved in the hepatic
glutathione (GSH) redox cycle. The genes encoding GSH peroxidase and reductase were
significantly up-regulated in both the apple and pectin groups indicating a higher capability to
handle oxidative stress in these rats. GSH is synthesised enzymatically with γ-glutamate cystein
ligase catalytic subunit (Gclc) as the rate-limiting enzyme(40)
. We found expression of Gclc to be
significantly up-regulated in the apple group in concordance with the up-regulation of Gpx1 and
Gr. Gclc expression was non-significantly higher in the pectin fed rats as compared to controls.
This points towards other factors than pectin as responsible for the elevation of Gclc expression
by apple. In vivo studies by others have shown that various extracted polyphenols fractions are
capable of modulating GSH synthesis(41)
, indicating that the apple polyphenol fraction may be a
key player in the observed effect.
Additionally, AlP activity in plasma was significantly elevated in the pectin group. AlP is a
widely used marker for liver disorders, but its activity is also increased in atherosclerosis and
peripheral vascular disease, and AlP can serve as an inflammatory marker(42)
. The increased AlP
activity by pectin might therefore be interpreted as an adverse health effect. No change in AlP
activity was observed in the apple group and it is considered that either the high pectin dose or
some changed physico-chemical properties of the purified pectin may be responsible. Urinary
metabolites have earlier been investigated from this study (data to be published elsewhere) and
here 2-furoylglycine was identified as an exposure marker of apple-pectin. This metabolite is a
conjugate of a furan derivative which is thought to be up-concentrated during pectin cleaning or
formed as a Maillard product under industrial pectin extraction. This compound might cause
toxic effects in hepatic or endothelial cells, and hereby contribute to the elevated AlP activity, but
further studies are needed to investigate this. Based on the findings in this study, consumption of
high doses of isolated apple-pectin does not seem to positively affect markers of cardiovascular
health.
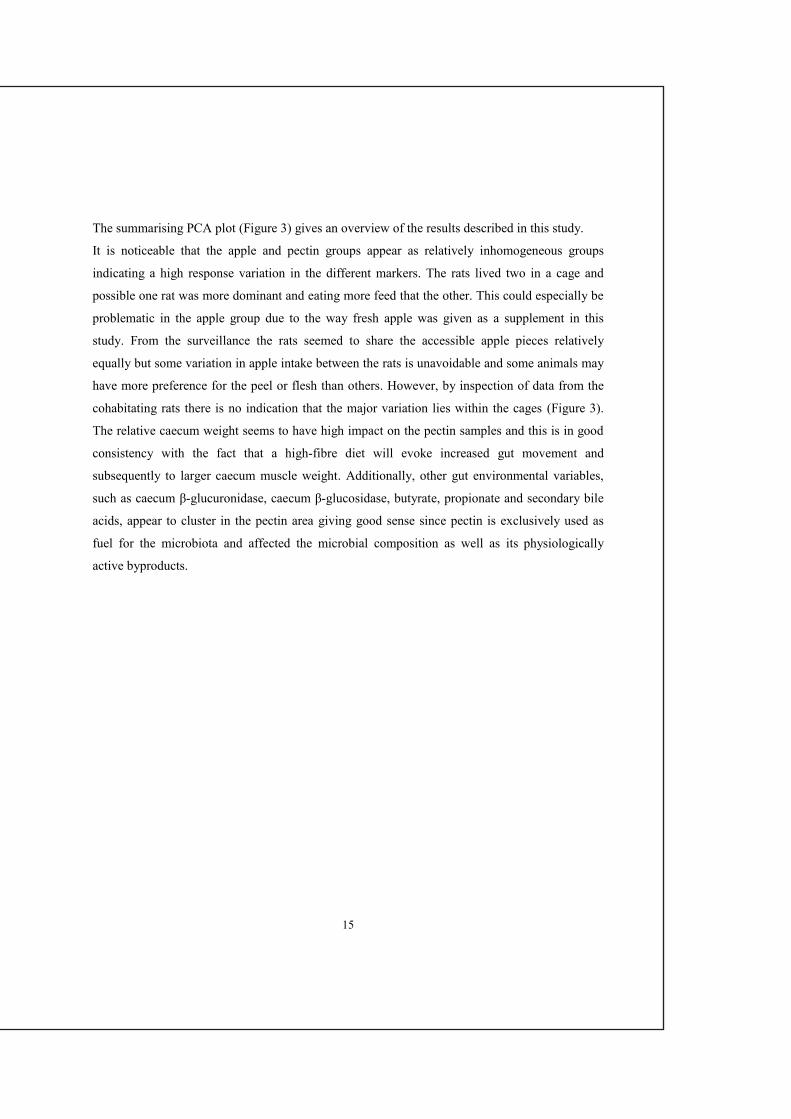
15
The summarising PCA plot (Figure 3) gives an overview of the results described in this study.
It is noticeable that the apple and pectin groups appear as relatively inhomogeneous groups
indicating a high response variation in the different markers. The rats lived two in a cage and
possible one rat was more dominant and eating more feed that the other. This could especially be
problematic in the apple group due to the way fresh apple was given as a supplement in this
study. From the surveillance the rats seemed to share the accessible apple pieces relatively
equally but some variation in apple intake between the rats is unavoidable and some animals may
have more preference for the peel or flesh than others. However, by inspection of data from the
cohabitating rats there is no indication that the major variation lies within the cages (Figure 3).
The relative caecum weight seems to have high impact on the pectin samples and this is in good
consistency with the fact that a high-fibre diet will evoke increased gut movement and
subsequently to larger caecum muscle weight. Additionally, other gut environmental variables,
such as caecum β-glucuronidase, caecum β-glucosidase, butyrate, propionate and secondary bile
acids, appear to cluster in the pectin area giving good sense since pectin is exclusively used as
fuel for the microbiota and affected the microbial composition as well as its physiologically
active byproducts.
16
Conclusion
The administration of a moderate dose of fresh apple showed significant in vivo effects on
cholesterol metabolism and especially the reduction of LDL and total cholesterol as well as
increased faecal excretion of bile acids supports observational evidence that fresh apple as part of
fruit in general is an important dietary factor decreasing the risk of cardiovascular diseases.
Pectin was not found as the responsible cholesterol lowering component of apple and the
relatively high dose of apple-pectin introduced in this study does not strongly support pectin as a
functional food ingredient. However, both apple and apple-pectin intake revealed significant
effects on genes involved in the hepatic GSH redox cycle indicating a higher capability to handle
oxidative stress. Longer-term and more detailed analyses of these effects in model organisms and
future human intervention studies are needed to fully interpret and corroborate the effects
observed in this study and to ascertain that they also relate to human health.
Acknowlegdement
The present study was part of the integrated European project, ISAFRUIT
(http://www.isafruit.org), which was set out to unravel biological effects of fruit. The ISAFRUIT
Project is funded by the European Commission under Thematic Priority 5 – Food Quality and
Safety of the 6th Framework Programme of RTD (Contract No. FP6-FOOD-CT-2006-016279).
The work with multivariate analyses was supported by SYSDIET, a Nordic Centre of Excellence
in systems biology supported by the Nordic Council of Ministers.
The author’s responsibilities were as follows: L.O.D. and M.P. designed this study; J.M. provided
the apples; M.P. was responsible for the animal study protocol and diets; M.K. conducted the
NMR-based lipoprotein cholesterol measurement and predictions, R.I.J. was in charge for the bile
acid analysis; B.N.K. was responsible for the gene expression and antioxidant enzyme analysis,
L.O.D. provided support for the SAS statistical analysis and M.K. conducted the multivariate
analysis; M.K. wrote the first draft and L.O.D. supervised the following drafts. All authors
approved the final draft and all authors declared that they had no conflict of interest.

17
References
1. He FJ, Nowson CA & MacGregor GA (2006) Fruit and vegetable consumption and stroke: meta-
analysis of cohort studies. Lancet 367, 320-326.
2. He FJ, Nowson CA, Lucas M et al. (2007) Increased consumption of fruit and vegetables is
related to a reduced risk of coronary heart disease: meta-analysis of cohort studies. J Hum
Hypertens 21, 717-728.
3. Boyer J & Liu RH (2004) Apple phytochemicals and their health benefits. Nutr J 3, 15pp.
4. Gerhauser C (2008) Cancer chemopreventive potential of apples, apple juice, and apple
components. Planta Med 74, 1608-1624.
5. Judd PA, Truswell AS (1982) Comparison of the effects of high- and low-methoxyl pectins on
blood and faecal lipids in man. Br J Nutr 48, 451-458.
6. Sable-Amplis R, Sicart R et al. (1983) Further studies on the cholesterol-lowering effect of apple
in human. Biochemical mechanisms involved. Nutr Res 3, 325-328.
7. Gormley TR, Kevany J, Egan JP et al. (1977) Effect of apples on serum cholesterol levels in
humans. Irish J of Food Sci and Tech 1, 117-128.
8. Jensen EN, Buch-Andersen T, Ravn-Haren G et al. (2009) Mini-review:The effects of apples on
plasma cholesterol levels and cardiovascular risk - a review of the evidence. J of Hort Sci &
Biotech, 34-41.
9. Obi-Pectin AG (2010) http://www.obipektin.ch/ (Accessed June 2010)
10. Ahrens F, Hagemeister H, Pfeuffer M et al. (1986) Effects of oral and intracecal pectin
administration on blood lipids in minipigs. J Nutr 116, 70-76.
11. Aprikian O, Duclos V, Guyot S et al. (2003) Apple pectin and a polyphenol-rich apple
concentrate are more effective together than separately on cecal fermentations and plasma lipids
in rats. J Nutr 133, 1860-1865.
12. Trautwein EA, Rieckhoff D, Kunath-Rau A et al. (1998) Psyllium, not pectin or guar gum, alters
lipoprotein and biliary bile acid composition and fecal sterol excretion in the hamster. Lipids 33,
573-582.
13. Yamada K, Tokunaga Y, Ikeda A et al. (2003) Effect of dietary fiber on the lipid metabolism and
immune function of aged Sprague-Dawley rats. Biosci Biotech Biochem 67, 429-433.
14. van der Sluis AA, Dekker M, de JA et al. (2001) Activity and concentration of polyphenolic
antioxidants in apple: effect of cultivar, harvest year, and storage conditions. J Agric Food Chem
49, 3606-3613.
15. Gorinstein S, Zachwieja Z, Folta M et al. (2001) Comparative contents of dietary fiber, total
phenolics, and minerals in persimmons and apples. J Agric Food Chem 49, 952-957.

18
16. Larrauri JA, Goni I, Martin-Carron N et al. (1996) Measurement of health-promoting properties in
fruit dietary fibers: antioxidant capacity, fermentability and glucose retardation index. J Sci Food
Agri 71, 515-519.
17. Nagasako-Akazome Y, Kanda T, Ikeda M et al. (2005) Serum cholesterol-lowering effect of
apple polyphenols in healthy subjects. J Oleo Sci 54, 143-151.
18. Roldan-Marin E, Krath BN, Poulsen M et al. (2009) Effects of an onion by-product on bioactivity
and safety markers in healthy rats. Br J Nutr 102, 1574-1582.
19. Kristensen M, Savorani F, Ravn-Haren G et al. (2010) NMR and interval PLS as reliable methods
for determination of cholesterol in rodent lipoprotein fractions. Metabolomics 6, 129-139.
20. Licht TR, Hansen M, Bergstrom A et al. (2010) Effects of apples and specific apple components
on the cecal environment of conventional rats: role of apple pectin. BMC Microbiol 10, 13-19.
21. Aprikian O, Levrat-Verny MA, Besson C et al. (2001) Apple favourably affects parameters of
cholesterol metabolism and of anti-oxidative protection in cholesterol-fed rats. Food Chem 75,
445-452.
22. Aprikian O, Busserolles J, Manach C et al. (2002) Lyophilized Apple Counteracts the
Development of Hypercholesterolemia, Oxidative Stress, and Renal Dysfunction in Obese Zucker
Rats. J Nutr 132, 1969-1976.
23. Salgado JM, Curte F & Mansi DN. (2008) Effect of gala apples (Malus domestica Borkh) on
lipidemia of hyperlipidemic rats. Ciência e Tecnologia de Alimentos 28, 477-484.
24. Ha YC & Barter PJ (1982) Differences in plasma cholesteryl ester transfer activity in sixteen
vertebrate species. Comp Biochem.Physiol B 71, 265-269.
25. Lewis GF & Rader DJ (2005) New insights into the regulation of HDL metabolism and reverse
cholesterol transport. Circ Res 96, 1221-1232.
26. Sable-Amplis R, Sicart R & Bluthe E (1983) Decreased cholesterol ester levels in tissues of
hamster fed with apple fiber enriched diet. Nutr Rep Int 27, 881-889.
27. Kay RM & Truswell AS. (1977) Effect of citrus pectin on blood lipids and fecal steroid excretion
in man. Am J Clin Nutr 30, 171-175.
28. Sable-Amplis R & Dupouy D (1983) Increase in cholesterol 7alpha-hydroxylase activity in
hamsters fed with a fruit-supplemented diet. IRCS J Med Sci 11, 69-70.
29. Sable-Amplis R, Sicart R & Dupouy D (1987) Reduced cholesterol 7alpha-hydroxylase activity in
hypercholesetrolemic hamsters. Preventive effect of a fruit enriched diet. Nutr Res 7, 645-653.
30. Sembries S, Dongowski G, Mehrlander K et al. (2006) Physiological effects of extraction juices
from apple, grape, and red beet pomaces in rats. J Agric Food Chem 54, 10269-10280.

19
31. Nagengast FM, Grubben MJ & van Munster I (1995) Role of bile acids in colorectal
carcinogenesis. Eur J Cancer 31A, 1067-1070.
32. Owen RW. Faecal steroids and colorectal carcinogenesis. Scand.J.Gastroenterol.Suppl 1997; 222:
76-82.
33. Kahle K, Kraus M, Scheppach W et al. Studies on apple and blueberry fruit constituents: do the
polyphenols reach the colon after ingestion? Mol.Nutr.Food Res. 2006; 50: 418-23.
34. Lu SC. Regulation of hepatic glutathione synthesis. Semin.Liver Dis. 1998; 18: 331-43.
35. Moskaug JO, Carlsen H, Myhrstad MC et al. Polyphenols and glutathione synthesis regulation.
Am.J.Clin.Nutr. 2005; 81: 277S-83S.
36. Webber M, Krishnan A, Thomas NG et al. Association between serum alkaline phosphatase and
C-reactive protein in the United States National Health and Nutrition Examination Survey 2005-
2006. Clin.Chem.Lab Med. 2010; 48: 167-73.
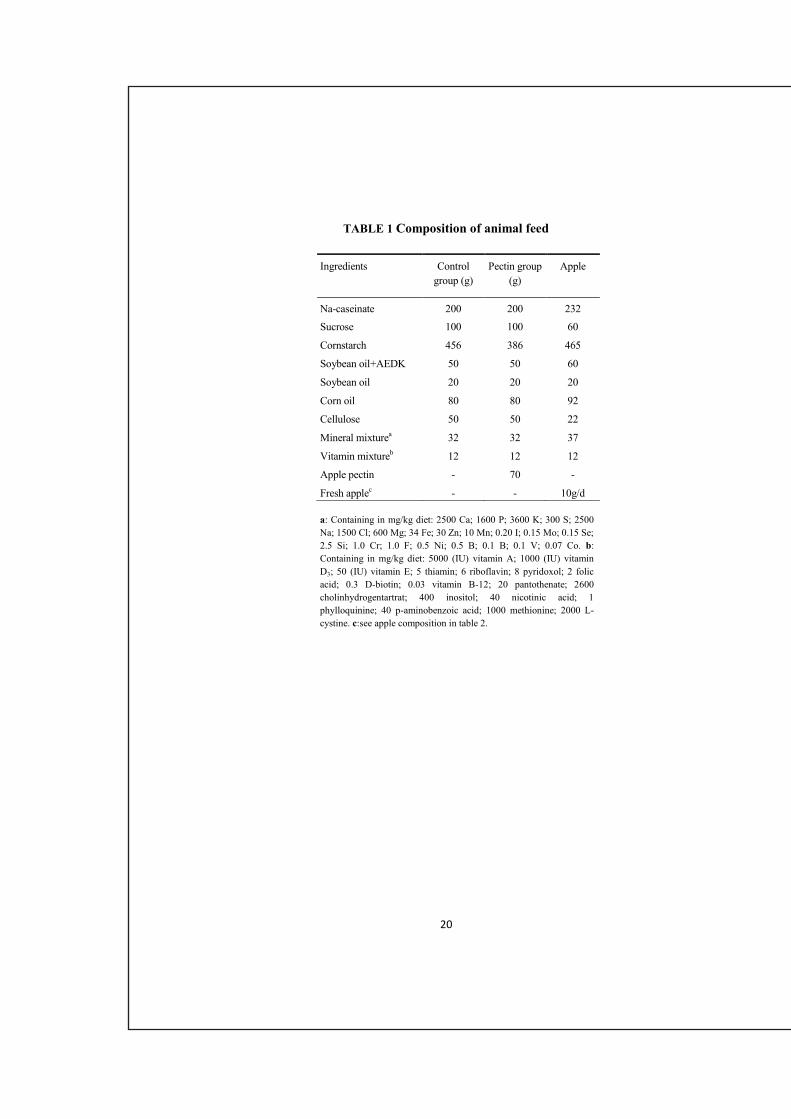
20
TABLE 1 Composition of animal feed
Ingredients
(g/kg feed)
Control
group (g)
Pectin group
(g)
Apple
group (g)
Na-caseinate 200 200 232
Sucrose 100 100 60
Cornstarch 456 386 465
Soybean oil+AEDK 50 50 60
Soybean oil 20 20 20
Corn oil 80 80 92
Cellulose 50 50 22
Mineral mixturea
32 32 37
Vitamin mixtureb
12 12 12
Apple pectin - 70 -
Fresh applec
- - 10g/d
a: Containing in mg/kg diet: 2500 Ca; 1600 P; 3600 K; 300 S; 2500
Na; 1500 Cl; 600 Mg; 34 Fe; 30 Zn; 10 Mn; 0.20 I; 0.15 Mo; 0.15 Se;
2.5 Si; 1.0 Cr; 1.0 F; 0.5 Ni; 0.5 B; 0.1 B; 0.1 V; 0.07 Co. b:
Containing in mg/kg diet: 5000 (IU) vitamin A; 1000 (IU) vitamin
D3; 50 (IU) vitamin E; 5 thiamin; 6 riboflavin; 8 pyridoxol; 2 folic
acid; 0.3 D-biotin; 0.03 vitamin B-12; 20 pantothenate; 2600
cholinhydrogentartrat; 400 inositol; 40 nicotinic acid; 1
phylloquinine; 40 p-aminobenzoic acid; 1000 methionine; 2000 L-
cystine. c:see apple composition in table 2.
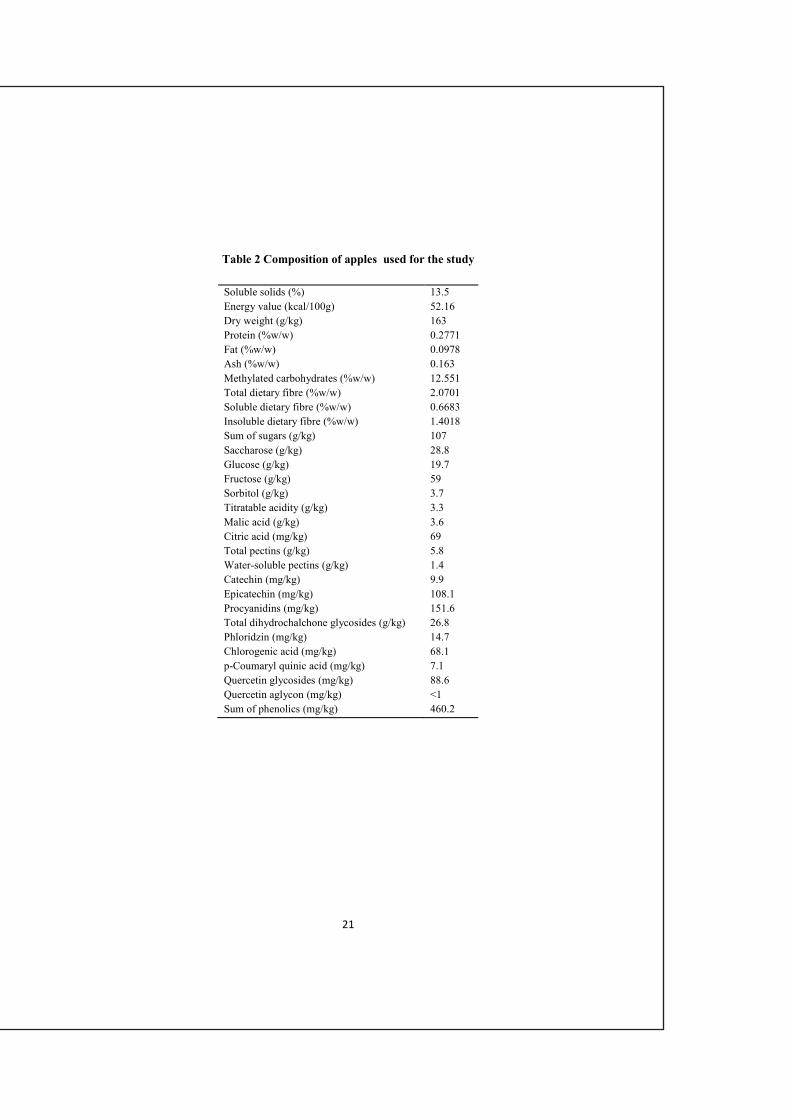
21
Table 2 Composition of apples used for the study
Soluble solids (%) 13.5
Energy value (kcal/100g) 52.16
Dry weight (g/kg) 163
Protein (%w/w) 0.2771
Fat (%w/w) 0.0978
Ash (%w/w) 0.163
Methylated carbohydrates (%w/w) 12.551
Total dietary fibre (%w/w) 2.0701
Soluble dietary fibre (%w/w) 0.6683
Insoluble dietary fibre (%w/w) 1.4018
Sum of sugars (g/kg) 107
Saccharose (g/kg) 28.8
Glucose (g/kg) 19.7
Fructose (g/kg) 59
Sorbitol (g/kg) 3.7
Titratable acidity (g/kg) 3.3
Malic acid (g/kg) 3.6
Citric acid (mg/kg) 69
Total pectins (g/kg) 5.8
Water-soluble pectins (g/kg) 1.4
Catechin (mg/kg) 9.9
Epicatechin (mg/kg) 108.1
Procyanidins (mg/kg) 151.6
Total dihydrochalchone glycosides (g/kg) 26.8
Phloridzin (mg/kg) 14.7
Chlorogenic acid (mg/kg) 68.1
p-Coumaryl quinic acid (mg/kg) 7.1
Quercetin glycosides (mg/kg) 88.6
Quercetin aglycon (mg/kg) <1
Sum of phenolics (mg/kg) 460.2

22
Table 3. Animal weights and liver weight by week of the study
Week 1 Week 2 Week 3 Week 4 Week 5 Liver
Weight
Control 130 ± 10.1a)
169 ± 12.4 203 ± 14.5 225 ± 13.6 235 ± 13.7 8.3±0.3
Pectin 7% 129 ± 7.8 165 ± 8.9 198 ± 8.9 215 ± 3.4 231 ± 5.3 7.9±1.0
Apple 10g/d 128 ± 8.8 155 ± 10 187 ± 11.1 213 ± 12.2 218 ± 13.3 7.0±0.9*b)
a) Numbers are mean animal weights in g ± standard deviations.
b) Differences to control group, * P<0.05
Table 4. Animal feed intake by week of the study
Week 1 Week 2 Week 3 Week 4 Total
Control 97. ± 5.3a)
98. ± 7.0 90. ± 8.2 84. ± 6.1 370 ± 9.8
Pectin 7% 88. ± 4.2*b)
96. ± 5.2 86. ± 11.9 102 ± 9.1** 373 ± 12.3
Apple 10g/d 69. ± 5.2** 84. ± 5.5** 81. ± 11.1 68. ± 8.4** 303 ± 22.4**
a) Numbers are mean animal feed intake in g ± standard deviations.
b) Differences to control group, * P<0.05, **P<0.01

23
Table 5. Effects of apple-pectin and apple on plasma
activities of hepatic enzymes (AlP, ALAT and GGT), on
haemoglobin concentration (Hb) and on hepatic gene
expression of antioxidant enzymes (Hmgcr, Gclc, Nqo1,
Gpx1, Gr and Cat)
Marker Control Apple-Pectin Apple
AlP (UI/L) 753.6 ± 71.6 895.9 ± 78.0* 756.14 ± 57.0
ALAT (UI/L) 91.14 ± 8.21 93.375 ± 10.8 99.375 ± 13.0
GGT (UI/L 2.4 ± 0.59 3.16 ± 2.30 2.47 ± 0.43
Hb (g/L) 20.91 ± 4.83 23.98 ± 5.77 20.69 ± 5.05
Hmgcra 0.94 ± 0.69 0.86 ± 0.47 0.62 ± 0.17
Gclca 0.76 ± 0.42 1.56 ± 0.66 2.18 ± 0.51*
Nqo1a 0.79 ± 0.25 2.40 ± 2.54 0.85 ± 0.67
GPx1a 0.80 ± 0.30 1.61 ± 0.60* 1.35 ± 0.26*
Gra 0.73 ± 0.27 1.22 ± 0.33* 1.20 ± 0.19*
Cata 0.95 ± 0.36 1.14 ± 0.58 1.19 ± 0.40
Results are expressed as mean ± SD, n=8. *P<0.05 as compared with the
control group. aGene expression (n=5) is given relative to the endogenous
reference 18S rRNA and a calibrant. AlP, alkaline phosphatase; ALAT,
alanine aminotransferase; GGT, γ-glutamyl transferase; Hb, Haemoglobin
concentration; Hmgcr, 3-hydroxy-3-methylglutaryl coenzyme A
reductase; Gclc, γ-glutamate cystein ligase catalytic subunit; Nqo1,
NAD(P)H:quinine oxidoreductase Gr, Glutathione reductase; Gpx1,
Glutathione peroxidase; Cat, catalase.

24
FIGURE 1
Figure 1. Rats were fed with 7% pectin in the feed, 10g fresh raw apple, or a control feed balanced
to ascertain similar nutrient intakes in all groups. Data shown are means of total cholesterol,
cholesterol contents in different lipoprotein fractions (HDL, LDL and VLDL) and triglyceride in
plasma. Error bars showing standard deviations. *Significant differences between apple and control
group (P<0.05).
mm
ol/L

25
FIGURE 2
�mol
/24
h
Figure 2. Rats were fed with 7% pectin in the feed, 10g fresh, raw apple, or a control
feed balanced to ascertain similar nutrient intakes in all groups. Data shown are means
of total 24 h fecal excretion of primary, secondary and total bile acid with error bars
showing standard errors. *Significant differences between apple and control group
(P<0.05).

26
FIGURE 3
Figure 3. Principal component analysis (PCA) of rat samples after feeding with apple and apple-pectin. Scores and
loadings are combined (biplot). The numbers next to the sample marker illustrate animal number and they have been
living in the cage with a rat with the consecutive number (1 and 2; 3 and 4;...). Abbreviations: ALAT, plasma
alanine aminotransferase; AlP, plasma alkaline phosphatase; BGL, caecum β-glucuronidase; GUS, caecum β-
glucosidase activity; Caec-WtE, caecum weight (empty); GGT, plasma γ-glutamyl transpeptidase; Hb, erythrocyte
total haemoglobin; HDL, plasma HDL cholesterol; LDL, plasma LDL cholesterol; VLDL, plasma VLDL
cholesterol; Liver-Wt, total liver wet weight; RatWt, total rat weight at sacrifice; Tot BA, total bile acid excretion;
Prim BA, total primary bile acid excretion; Sec BA, total secondary bile acid excretion; TAG, plasma
triacylglycerides; Transit, gut transit time.


1
The effect of LC-MS data processing methods on the selection of plasma
biomarkers in fed vs. fasted rats
Gözde Gürdeniz • Mette Kristensen • Thomas Skov • Rasmus Bro • Lars O. Dragsted
Gözde Gürdeniz() • Lars O. Dragsted
Department of Human Nutrition, Faculty of Life Sciences, University of Copenhagen
Rolighedsvej 30, 1958, Frederiksberg C, Denmark
Phone: +45 29176389
Fax: +45 35332483
E-mail: [email protected]
Mette Kristensen • Thomas Skov • Rasmus Bro
Department of Food Science, Faculty of Life Sciences, University of Copenhagen
Rolighedsvej 30, 1958, Frederiksberg C, Denmark
2
Abstract
The metabolic composition of plasma is affected by time passed since the last meal and by
individual variation in metabolite clearance rates. Rat plasma in the fed and fasted states was
analyzed with liquid chromatography quadrupole-time-of-flight mass spectrometry (LC-
QTOF) for an untargeted investigation of metabolite patterns. This data set was used to
investigate the effect of data processing using four different methods; MarkerLynx, MZmine,
XCMS and a customized processing method that performs binning of m/z channels followed
by summation through retention time. Direct comparison of the markers selected by partial
least square analysis (PLS-DA) from each processed data, resulted in relatively few
overlapping markers. Further identification revealed that differences were due to markers
representing adducts or daughter ions of the same metabolite. Moreover, many markers
identified by only one or two of the methods were members of the same chemical subclasses
as those identified by the others, e.g. lyso-phosphatidylcholines (LPC) and lyso-
phosphatidylethanolamines (LPE), which were found more abundant in the fed state.
Carnitine and acetylcarnitine were also identified by all methods as biomarkers. The results
illustrate that as long as proper parameter settings is attained, the data processing method has
limited effect on the extracted biological information.
Keywords Plasma ·Fasting vs. fed states· LC-QTOF · Data processing methods

3
Introduction
In dietary interventions and frequently also in observational studies, blood samples are
collected in order to relate nutritional conditions with metabolic markers. The blood is
obtained from individuals either in the fasted or postprandial state, depending on the
hypothesis being tested. The fasting state, typically following an overnight fast, is considered
to be more reproducible and can be defined as a baseline level for metabolic studies.
However, imbalances in diet-dependent metabolism may not be detectable in the fasted state
[1]. On the other hand, determination of the metabolic response in the extended postprandial
state, which is the normal metabolic situation of human beings throughout the day, is more
challenging as the individual variability is high [2]. The meal frequency is a function of the
metabolic rate and an overnight fasting period in rats having an eight times higher rate of
energy metabolism than humans may therefore represent a more extreme condition than
overnight fasting in humans. A rat model may therefore be convenient to study the major
differences between the fasting and the fed states, the latter defined as the state of rats
following a normal ad libitum meal pattern. A rat model also offers full control of the food
intake in the study subjects.
In this study, an untargeted metabolomics based approach to study the metabolic
differences between rat plasma at fasted and fed states was performed. Metabolomics is
defined as the process of monitoring and evaluating changes in metabolites during
biochemical processes and has become an emerging tool to understand responses of cells and
living organisms with respect to their gene expression or alterations in their lifestyles and
diets [3]. Application of metabolomics in nutritional studies offers the opportunity to have a
broader understanding of biochemical variation with respect to a specific diet intake.
By nuclear magnetic resonance (NMR) spectroscopy and mass spectrometry (MS), a wide
range data of metabolites and other compounds can be detected in various human biofluids.
These approaches can be either untargeted through total data capture or highly targeted, such
as measuring a large number of defined lipids. MS based instruments, with higher sensitivity
compared to NMR [4;5], are an increasingly important tool in metabolomics studies. Liquid
chromatography (LC) coupled with time-of-flight (TOF) MS offers high resolution,
reasonable sensitivity and improved data acquisition for complex sample mixture analyses.
The system has served as a powerful tool in many other studies focusing on untargeted
metabolic profiling of biofluids [6-8].
4
LC-MS analysis produces large amount of data with complex chemical information. An
important task is to arrange data in a way so that relevant information can be extracted. The
complexity of LC-MS data brings out the concept of data handling which can be roughly
summarized in two basic steps [9]. The first step is data processing, which includes the
methods to go from raw instrumental data to clean data. The next step is data analysis,
including conventional data scaling and normalization methods followed by univariate and
multivariate methods applied to screen the patterns in the processed data.
Recently many software tools (commercially or freely available) have emerged to process
LC-MS data. All of these tools aim to provide user-friendly platforms and high speed
automated data processing. The basic principles of these software packages have recently
been summarized [9]. To be able to obtain high efficiency in data processing, the software
tool employed should be understood and its parameter settings are required to match the
structure of the specific data set.
Existence of various data processing tools brings out concerns on whether all these tools
perform in a similar way. There are some studies attempting to define quality parameters for
comparison of peak detection [10;12] or alignment [13] algorithms of different data
processing tools, however, comparison of algorithms was outside of the scope of this study.
The question to be addressed in this study is whether there is agreement between the
biological information as represented by the biomarkers extracted by processing the same data
set with different data processing methods using similar settings. Therefore we chose to
compare the potential biomarkers extracted from an LC-QTOF generated dataset of plasma
analyzed in the fed and fasted state using four different software packages; (1) MarkerLynx
(MassLynx (Waters, Milfold, MA)), (2) MZmine [14], (3) XCMS[15] and (4) a customized
method that is implemented in MATLAB (The Mathworks, Inc., MA, US). MarkerLynx is a
commercial software whereas XCMS and MZmine are freely available software tools.
MATLAB is also commercially available but represents here any programming tool offering
simple, customized processing. For the customized method we applied a simpler algorithm,
which is comprised of m/z binning and retention time collapsing. The applicability of this
method for LC-MS data has been illustrated in other studies[16-17] but an extensive
comparison with three other softwares have not been published previously.
In this study UPLC-QTOF profiles of rat’s plasma in the fasted and fed states were
analyzed for two different purposes: (1) to identify the effect of data processing on the final

5
biomarker selection, and (2) to interpret the biology behind the biomarkers identified for the
two states based on each data processing.
Materials and Methods
Animal Study and Sample Collection
Eighty male Fisher 344 rats (4 weeks old) were obtained from Charles River (Sulzfeld,
Germany). The animals had a one week run-in period to adapt to the standardized diet. The
rats were subsequently randomised into five groups of 16 rats, each with equal total body
weights and then fed five different diets which were all nutritionally balanced to give exactly
the same amounts of all important macro- and micronutrients [18]. After 16 weeks all rats
were sacrificed by decapitation after CO2/O2 anesthesia. Before sacrifice 56 of the animals
had fasted for 12 hours and 24 of the animals were given access to food up until termination.
Blood samples were collected immediately after sacrifice directly from the vena jugularis into
a heparin coated funnel drained into 4 mL vials containing heparin as an anticoagulant. The
blood was centrifuged at 3000 g, 4oC for 10 min. The plasma fraction was aliquoted into 2 mL
cryotubes and stored at -80oC until further processing. The animal experiment was carried out
under the supervision of the Danish National Agency for Protection of Experimental Animals.
Plasma pre-processing and LC-QTOF Analysis
Removal of plasma proteins was performed before LC-MS analysis of the plasma metabolites.
The plasma samples were thawed on ice and 40 µL of each sample was added into a 96-well
Sirocco™ plasma protein filtering plate (#186002448, Waters) containing 180 µL of 90%
methanol 0.1% formic acid solution, and the plates were vortexed for 5 minutes to extract
metabolites from the plasma protein precipitate. A 96-well plate for the ultra-performance
liquid chromatograms UPLC autosampler (Waters, cat # 186002481) was placed underneath
the protein filtering plate and vacuum was applied to the plates (using a manifold) whereby
the rubber wells in the Sirocco™ plates opened and the crash solvent including metabolites
dripped into the 96-well UPLC plate. When the filtering plates were dry, 180 uL of a 20%
acetone 80% acetonitrile 0.1 % formic acid solution was added to each well to further extract
metabolites from the precipitated protein and vacuum was connected until dryness. The

6
solvent was evaporated from the UPLC plates by using a cooled vacuum centrifuge and the
dry samples were redissolved in 200 µL milliQ acidic water before analysis. A blank sample
(0.1% formic acid) and a standard sample containing 40 different physiological compounds
(metabolomics standard) was also added to spare wells to evaluate possible contamination
and/or loss of metabolites in the filtering procedure.
10 µL of each sample were injected into the UPLC equipped with a 1.7µm C18 BEH
column (Waters) operated with a 6.0 min gradient from 0.1% formic acid to 0.1% formic acid
in 20% acetone: 80% acetonitrile. The eluate was analyzed in duplicates by TOF-MS (QTOF
Premium, Waters). The instrument voltage was 2.8 or 3.2 kV to the tip of the capillary and
analysis was performed in negative or positive mode, respectively. In the negative mode
desolvation gas temperature was 400°C, cone voltage 40 V, and Ar collision gas energy 6.1
V; in the positive mode we used the same settings except for collision energy of 10 V). A
blank (0.1% formic acid) and the metabolomics standard were analyzed after every 50
samples during the run.

7
Authentic Standards
L-carnitine, linoleic acid and gamma-linolenic acid were purchased from Sigma Aldrich
(Copenhagen, Denmark). 1-acyl LPC(18:1), 1-acyl LPE(18:1), PC(16:0/18:1) and
PE(16:0/18:1) were obtained from Avanti Lipids (Alabaster, AL, USA). For the synthesis of
acetyl L-carnitine, carnitine acetyltransferase from pigeon and acetyl coenzyme A were
purchased from Sigma Aldrich. Acetylation of L-carnitine was performed as described by
Bergmeyer et al. [19]. The 2-acyl lyso-forms were synthesized with phospholipase A1 from
Thermomyces lanuginosus (Sigma Aldrich). Phospholipase A1 hydrolyzes the acyl group
attached to the 1-position of PC(16:0/18:1) and PE(16:0/18:1) so that acyl-2 LPC(18:1) and
LPE(18:1) were produced. The description of the method was given by Pete et al.[20].
Briefly, the phospholipids and fatty acids were initially diluted in iso-propanol to 100 mg/L
and further dilution was performed in water to 2 mg/L whereas other standard compounds
were diluted in water to 10 mg/L. For the chemical verification of identified metabolites, one
plasma sample from a rat in the fasted and another from the fed state were spiked with
LPC(18:1) and LPE(18:1) individually before analysis by the procedure outlined above.
Raw Data
The MassLynxTM
(Version 4.1, Waters, Milford, MA, USA) software collected centroided
mass spectra in real time using leucine-enkephalin as a lock-spray standard injected every 10s
to calibrate mass accuracy. Each of the 80 samples was analyzed in duplicates. For negative
mode both measurements were included in the data analysis. However, for the positive mode
only 24 samples with duplicates and 52 samples without duplicates were included based on an
initial outlier detection considering the instrumental error that occurred during analysis. In this
case the outliers had very low intensity due to injection errors.
The software stores data as non-uniform sample data files, each consisting of a two-
dimensional intensity matrix represented by scan number or retention time (0-6 min) in the
first dimension and m/z values (non-uniform) in the second dimension. The raw data was
converted to an intermediate netCDF format with the DataBridgeTM
utility provided with the
MassLynx software.

8
Software Tools for Data Processing
Raw data was transferred to MarkerLynxTM
(Version 4.1, Waters, Milford, MA, USA)
directly from MassLynx whereas netCDF files were imported to MZmine [14] and XCMS
[15]. The data processing parameters were given in electronic supplementary material (Table
1S) for the three software tools. Final outcome from the software tools was feature sets where
each feature is denoted with its exact m/z and retention time. Feature sets were transferred to
the MATLAB interface for further data analysis.
Custom Methods for Data Processing
An alternative data processing was performed with MATLAB (Version 7, The Mathworks,
Inc., MA, US). To transfer netCDF files to MATLAB, the iCDF function [16;21] was
employed. The steps of the custom data processing are shown in Fig. 1. As the first step,
binning was performed on the m/z dimension as described by Nielsen et al. [16].
Alignment and offset correction was applied only to positive mode data as the instrumental
response was observed to be significantly lower during the duplicate runs in the positive
mode. To correct for instrumental response differences, prior alignment was performed using
ICOshift [22]. The lower response of duplicates was corrected by calculating the difference
matrices between each duplicate set, averaging and adding the average difference to the
matrix with the lower response. Here it is assumed that the first injection of a sample holds
the correct instrumental response whereas its duplicate with lower response is the one being
corrected. The effect of this procedure is shown in electronic supplementary material (Fig.
1S).
A threshold level was applied for the elimination of small peaks/intensities lower than the
analytical detection level. The values lower than a certain threshold level was considered as
zero. The strategy to define the threshold was as follows: (1) The first median value of the
whole data set (excluding zeros) was calculated (2) That median was evaluated as a threshold
(by the ability of principle component analysis (PCA) score plots to fully separate the fasted
vs. the fed state, data not shown) (3) The next median was calculated by using only those data
from the whole data set that were higher than the previous median, and again the
corresponding PCA scores plot (not shown) was evaluated. (4) This procedure was iterated
until a good separation was achieved by PCA. The threshold level of the 4th median with the
value of 16.17 in the negative mode and 24.85 in the positive mode were selected as adequate.

9
This strategy for calculation of thresholds by medians provided a good estimation for setting
the threshold parameters in other software tools (MarkerLynx, MZmine and XCMS).
To enable the application of subsequent two-dimensional data analysis methods, the
intensity values of each sample matrix were summed (or collapsed) throughout the retention
time index. The resulting data matrix (two-dimensional) is described by samples vs. m/z bins
(Fig. 1) and is also referred to as feature sets throughout this paper.
Data Analysis
The feature sets processed by MZmine, XCMS and customized methods were normalized to
Unit length (in MATLAB) whereas MarkerLynx processed data were normalized to a total
sum of 10,000 (the default setting in MarkerLynx).
Afterwards, mean centering combined with Unit scaling as well as Pareto scaling was
performed on the feature sets (Fig. 2). Unit scaling employs the standard deviation as the
scaling factor whereas the square root of the standard deviation is the scaling factor in Pareto
scaling.
The PLS_Toolbox (version 5.3, Eigenvector Research, Inc., MA, US) was used to
implement the data analysis. PCA [23] was applied individually on feature sets obtained from
each data processing method for general visualization of discrimination of samples from rats
in the fasted vs. fed states.
PLS-DA is based on the development of a PLS model [24] to predict class membership of a
data set X with a y vector including only 0 and 1 (1 indicates that one sample belongs to a
given class). The PLS-DA model was cross validated by 500 times iteratively excluding
random subsets from the data matrix. The number of latent variables (LV) was determined to
minimize the classification errors using cross validation (CV).
Variable (Feature) Selection
A rough and effective variable reduction procedure was performed specifically during
MarkerLynx and custom data processing by only keeping a feature if it had a nonzero
measurement in at least 80% of the intensity values recorded within one of the two subsets;
otherwise the feature was removed (80% rule) [25]. This rule is not directly applicable for
softwares with gap filling procedures.
10
Further variable selection was performed with PLS-DA. The features or m/z bins with
larger regression coefficients were considered as more discriminative between fasted and fed
states, these are regarded as the potential biomarkers. Due to the fact that the selected
variables will be later considered as potential biomarkers it is important to be confident with
them, so we applied an advanced method for cross validation. Instead of applying only a
single cross-validated PLS-DA model on all samples we performed repeated submodel testing
every time PLS-DA was performed. This implies taking out samples randomly (here 10%
were taken out at a time), constructing a PLS-DA model on the remaining 90% samples and
repeating this 1000 times. By doing this the influence of each feature is comprehensively
tested. For each model the features are given a rank in the order of their regression
coefficients and the final rank of each feature for all the 1000 submodels were summarized
with one number using the product of the 1000 ranks per feature. This gives a much more
robust ranking, hereby suggesting a solution to the global model problem in the paper on
cross model validation methods by Westerhuis et al. [26].
Selection of potential biomarkers was performed in several steps as illustrated in Fig. 2.
Each processed feature set was scaled individually with Unit as well as Pareto scaling to
create two subsets. PLS-DA was applied on each subset as described above after each kind of
scaling and the 200 (arbitrary number) features and m/z bins with the largest absolute
regression coefficient products were picked out from each (Fig. 2, step 1). Then, these 2 x 200
features were combined for each feature set omitting duplicates (Fig. 2, step 2), and PCA was
used to ascertain that the resulting sets gave good separation between samples from fed and
fasted states. The three sets were unit scaled and a final variable selection was performed with
PLS-DA (Fig. 2, step 3), again using cross model validation as described above. The 25 top
rank features from each feature set, i.e. those with highest absolute regression coefficient
products, were selected as they may potentially represent biomarkers. However, since these
features might be daughter ions, adducts, summed ions, etc. we choose here to simply call
them markers whereas after identification the compounds represented by these markers in the
top rank feature sets will be termed biomarkers.
Marker Identification
The initial identification of markers was performed according to their exact mass compared
with those that were registered in the Human Metabolome Database [27]. Possible fragment
11
ions were investigated by an automated tool to look for such ions in any recorded spectrum
using a mol-file format of a candidate compound (MassFragmentTM
, Waters). Further
confirmation of candidate biomarkers was obtained by verification of the retention time and
fragmentation pattern of an authentic standard (see authentic standards section above). The
authentic standards were in some cases selected as one representative of biomarkers
belonging to the same chemical compound class, i.e only one LPC out of a series was
confirmed by a standard. Additionally, acyl-1 and acyl-2 LPC(18:1) and LPE(18:1) were
spiked into two plasma samples collected in the fed and the fasted states, respectively, at a
concentration of 0.5 mg/L for a more reliable confirmation.
Results and Discussion
An Overview of Data Processing Methods
All the softwares employed here were able to produce a feature set that were showing some
separation of samples from the fasted and fed states as shown in PCA scores plot (Fig. 3).
MarkerLynx and MZmine are both user friendly tools for users who do not want to go into R,
MATLAB, or similar programming tools. Processing the data with MarkerLynx requires just
a few user-defined settings, however the software does not provide any possibility for
checking the success of any data processing step. In comparison, MZmine provides a
powerful visualization side that can be considered as quite useful for tuning the settings.
Visualization of peak detection results is also included in the XCMS package in R. An
important missing part of MarkerLynx is that it does not contain any gap filling algorithm
resulting in many zero values in the final extracted feature set. Zeros may obscure the later
data analysis step and may result in incorrect definition of ‘effect markers’ as ‘exposure
markers’, because ‘true’ zeros as well as smaller and larger peaks missed by the algorithm are
given the same zero value [28].
The number of features obtained from each processing method is given in electronic
supplementary material (Table 1S). We aimed to extract a similar number of features from the
data processed by each software for either mode (positive or negative). This is a difficult task
since each software tool has its own specific algorithm that requires optimization with user
defined settings so they cannot be operated in exactly the same manner. For instance the
12
algorithms of MZmine and XCMS include gap-filling, so they have few zero entries and it
makes no point to implement an 80% rule based on zeros. The effect of the 80% rule on the
reduction of the number of features by the other methods is shown for comparison in
electronic supplementary material (Table 2S ). For positive and negative modes,
approximately 50% of features (MarkerLynx) and 70% of m/z bins (custom processing) were
eliminated with the 80% rule. In positive mode we seemed to succeed in getting similar
numbers of features with the different software tools were obtained, however, the numbers
varied somewhat in the negative mode.
An Overview of Data Analysis Methods
The scaling method (Unit- or Pareto-scaling) had an effect on the PCA scores plots for the
feature sets created by the four software tools but neither of the scaling methods was superior
in all cases. Here superior implies the better separation of fasted and fed groups by PCA
scores plot. For instance, Pareto scaling performed better for MarkerLynx processed data
whereas Unit scaling gave a better description of fasted-fed discrimination for XCMS
processed data (electronic supplementary material, Fig. 2S). In addition, by comparing the
selected 200 features using each of the two scaling methods before PLS-DA from any
software and mode (Fig. 2, step 1), only 40-60% were found to be in common (electronic
supplementary material, Fig. 3S). Consequently, the scaling methods are strongly affecting
the feature selection. Since the intention in this study was to compare different processing
algorithms in an objective manner it is an important point to satisfy the commonality in the
whole subsequent data analysis pipeline. Hence, instead of selecting the better scaling method
for each feature set we decided to combine the results from both scaling methods as illustrated
in Fig. 2, step1. PLS-DA was then applied to each of the sets to select the 200 top rank
features before combining them. The CV classification errors from the output PLS-DA
models did not exceed 4% (with maximum of 6 LV) for any of the subsets produced by Unit
scaling or Pareto scaling. The combined sets for each software and mode had 277-332
resulting features after including the unique ones.
In this study, we aimed to detect possible differences between two states for any feature
regardless of its concentration, so in the third step we treated the combined data only with
Unit scaling prior to the final variable selection step (Fig. 2, step 3). The main advantage of
Unit scaling is that it is able to remove the influence of the signal intensity on the final rank of
13
the markers [29]. The crucial point is to keep in mind that the choice of scaling method
depends on the biological question to be answered, the properties of the data set, and the data
analysis method. Different strategies were used for the data analysis steps 1 and 3 because the
data structures and the questions posed at these steps were different as explained above.
After the last scaling each feature set was evaluated with PLS-DA and the 25 features
having the highest rank were extracted as markers potentially representing biomarkers
discriminating the fasted and fed states.
Comparison of Data Processing Methods
We compared first the custom method with the three dedicated software methods. The
algorithm of the custom processing method differs from the others by not having any peak
detection and alignment steps. It can therefore be considered as a more primitive method,
however, many markers were found to be in common with the other three methods. The point
was to evaluate whether a very different data processing method would succeed in detecting
similar markers. When custom processing was compared with each of the other methods we
observed quite a large overlap which was generally larger for the positive than for the
negative mode (Fig. 4a). In the positive mode the overlap with XCMS seemed slightly lower
compared to other two methods.
A further comparison of the 25 markers for positive and negative mode data from each of
the three dedicated software tools is illustrated in two Venn diagrams (Fig. 4b). In general
these three methods seem to have only 3-6 markers in common among the top 25 markers
detected in the negative and positive mode. This is the same level of overlap seen for each of
these methods with the custom method (Fig. 4a). There is a trend towards a larger difference
between XCMS and each of the other methods in the pairwise comparisons. So in
consequence all of the data processing methods seem to miss out potentially important
markers observed to be ranked among the top-25 markers by the other methods. In fact, only
3-4 markers would be observed to be in common if four research groups would investigate the
same biological phenomenon using different softwares for data processing, provided they had
recorded similar LC-MS data. On top of this comes the difference caused by parameter
settings and other factors in the metabolomics experiment.
The 25 markers from each method and their various ranks are compared in Tables 1 & 2 for
the negative and positive modes, respectively. The higher rank values for the selected markers
14
are also added in these tables for reference (Table 1 & 2, column 3). Obviously, the markers
selected here have very different ranks with the four data processing methods. The
consequence is that there is no basis for putting too much emphasis on the rank in PLS-DA
methods. Consider that in many metabolomics studies, PLS-DA regression coefficients or
VIP cut-offs have commonly been employed for marker selection. In order to make a rational
selection of the cut-off and reduce the overoptimistic variable selection by PLS-DA additional
statistical methods would be needed [30].
Another perspective in the comparison of different data processing methods is illustrated in
electronic supplementary material (Fig. 4S). In this Figure, each row represents the rank of
one marker from Table 1 (column 3) for all four different data processing methods. The first
impression from electronic supplementary material (Fig. 4Sa) may be that the number of
black regions (undetected peaks) might seem alarmingly high for some of the methods. It is
important here to state that the custom data processing leads to a number of false positives,
which were not detected as peaks by any of the other methods, thereby explaining part of the
black regions. The false positives are probably a consequence of summation across retention
times, causing baseline noise to increase and cover the significant differences in peak
intensities. MarkerLynx and MZmine have similar patterns for negative mode data. XCMS
seemed to have higher numbers of undetected peaks. One crucial remark is that the detection
of peaks depends very much on the data processing settings of each software algorithm.
Although we attempted to attain the largest possible similarity in the processing parameters of
MarkerLynx, MZmine and XCMS, we were aware that it is not possible to obtain exactly the
same results, since each method is based on different algorithms. To illustrate this point, we
processed MZmine with less conservative settings and constructed the heat map again leading
to a new pattern much more similar to XCMS (figure not shown). So in reality it may be
possible to obtain more or less the same patterns with all three softwares, depending on their
individual parameter settings. This points to the user defined settings as the major effector
rather than the peak-detection algorithm, and also underlines that it is not possible to conclude
that any of the three software algorithm performs less well than the others since their
performance depends on the proper optimization of experimental settings. Moreover,
combining feature sets from several settings during data processing with any software is likely
to improve marker detection in untargeted metabolomics. In this study the patterns of fasted
and fed state were very clear in the feature set whereas in many other metabolomics studies
15
this may not be the case. Improper settings of data processing parameters may therefore
obscure the extraction of the relevant information. Proper settings are based on careful
inspection of raw data as well as insight into the function of the software parameters. The heat
map for positive mode data is shown in electronic supplementary material (Fig. 4Sb) and
shows a pattern very similar to that for negative mode.
Trend views for some of the markers with high ranks are presented as electronic
supplementary material (Fig. 5S). These raw data plots show that for most of these markers
the differences between intensities in the fed and fasted states are visible to the naked eye.
Biomarker patterns
Three patterns are immediately visible for markers of the fed state in Tables 1 & 2. The first
of these is the presence of sets of isomers having very similar masses but slightly different
retention times, indicating that some specific groups of isomers are typical markers. The slight
mass difference may be attributed to the mass accuracy of the instrument. Examples are
clusters at 512.29, 478.29 and 590.35 in the negative mode and at 468.32, 520.34, and 522.36
in the positive mode. In many cases the earlier eluting isomeric form was not detected in the
XCMS processed dataset, possibly because they are much smaller peaks. Considering the
parameters set while processing the data with XCMS (electronic supplementary material,
Table 1S), additional filtering or a too high bw parameter (for setting the RT shift) might be
the cause of not detecting those peaks. Furthermore, these patterns are always spotted with
the custom data processing as they were included into the same m/z bin thereby intensifying
their relative importance. As can be seen from Tables 1 & 2, the possible isomers were
therefore given the same rank for the custom data processing.
Another pattern in the marker sets is the presence of peaks with mass differences
corresponding to 2 or 4 hydrogen atoms but with different retention times. These pairs are
observed in both modes (e.g. 476/478, 520/522 or 586/590 in negative mode, and 506/508 or
520/522/524 in the positive, Table 1 & 2). These clusters and patterns are all observed for
compounds with retention times in the same (unpolar) range pointing towards series of lipids
with varying levels of saturation (-2 for each double bond) and similar patterns can also be
observed for changes in chain lengths (+ 26 for adding –CH=CH- ) as the underlying
biomarkers.

16
Pattern recognition therefore identified lipids as potential discriminative markers between
plasma samples collected in the fasted and fed states. This confirms an expected finding and
further identification of some of the lipids as well as some of the more polar peaks were
therefore perused.
Marker identification
Most of the masses belonging to the lipid-related patterns and clusters in the positive mode fit
well with the masses expected for positively charged LPCs and LPEs of varying chain lengths
and degrees of saturation. Lysophosphatidylcholine (LPC) is a plasma lipid that has been
recognized as an important cell signaling molecule and it is produced by the action of
phospholipases A1 and A2, by endothelial lipase or by lecithin-cholesterol acyltransferase
(LCA) which transfers one of the fatty acids from phosphatidylcholine to cholesterol. LCA
has a well-known function in catalyzing the transfer of fatty acids to free cholesterol in
plasma for the formation of cholesteryl esters [31]. In the rat LPCs with more saturated acids
are formed mainly in the plasma whereas unsaturated LPC is formed from PCs in the liver.
We observe here a mixture of both saturated and unsaturated LPCs indicating that the source
may be dual. The cytolytic and pro-inflammatory effects of LPCs are well known so their
level is closely regulated. However, in blood plasma the LPCs form complexes with albumin
and lipoproteins, especially LDL and are therefore not as likely to cause direct cell injury
[32]. Another action of LPCs seems to be related to increased insulin resistance [33]. A slow
clearance of postprandial lipids is known to be a risk factor for diabetes but the LPCs might
be a lipid fraction contributing more strongly to this action. It is interesting in this context to
note that Kim et al. identified LPCs as the major discriminative compounds of plasma species
separating fasting plasma from obese/overweight and lean men [7]. They reported higher
levels of saturated LPCs and lower level of unsaturated LPCs in the plasma of obese or
overweight men. We found a similar profile here in lean rats as reported for the lean humans
in the study of Kim et al. with a higher level of unsaturated LPCs. The unsaturated LPCs have
been found also to pass the blood-brain barrier and to be important vehicles for delivering
unsaturated lipids to the brain [34]. We speculate that the high level of unsaturated LPCs in
the postprandial state of healthy individuals might be a part of the satiety signaling system
which is malfunctioning in obesity. The LPCs appear usually in two isomeric forms, as 1-acyl
or 2-acyl LPCs. The true separation of isomeric groups of LPC(18:1) in a fed state plasma
17
sample is illustrated in electronic supplementary material (Fig. 6S). These isomers were
unstable and spontaneously positionally isomerized as also recognized in 1-acyl authentic
standards of LPC and LPE(18:1) where 9% of the authentic standard was detected as another
peak belonging to the 2-acyl form. For the confirmation of the 2-acyl LPC form, standards of
PC and PE(16:0/18:1) were hydrolyzed by phospholipase A1. In addition to the 2-acyl LPC
and LPE(18:1) the 7% of the acyl group spontaneously migrated to the 1-acyl position
electronic supplementary material (Fig. 6S). Croset et al. studied the significance of
positional acyl isomers of unsaturated LPCs in blood [35]. They concluded that 50% of PUFA
was located at the 2-acyl position where they are available for tissue uptake, and that they can
be re-acylated at the 1-acyl position to form membrane phospholipids. The lipid species
observed here as important for the fed and fasting states reflect also that we would only be
able to extract the more polar lipids and lipids with m/z below 1000 daltons. We can
therefore not conclude here that the LPCs, LPEs and free fatty acids are the major
discriminative lipid species and lipidomics studies have previously reported less polar lipid
classes which may have m/z above 1000 daltons, such as PCs, sphingomyelins and
triacylglycerols [36;37]. With our current method, we are able to identify PCs but they were
not discriminative in this study.
A group of carnitine based compounds were also detected as markers in the positive mode
data. The main function of carnitine is to assist the transport and metabolism of fatty acids in
mitochondria, where they are oxidized as a major source of energy [38]. In plasma samples
from the fasting state levels of L-carnitine was found to be lower whereas acetyl-L-carnitine
is higher. During fasting an elevated concentration of acetyl coenzyme A favors the
production of acetyl-L-carnitine and the ketone body, 3-hydroxybutanic acid, and these were
identified as characteristic markers for the fasting state [39].
One of the amino acids, isoleucine, was found to be strongly discriminating between the fed
and fasted states. Isoleucine belongs to the group of branched-chain amino acids which have
been implicated in altered protein catabolism, insulin resistance and obesity [40;41].
However, only isoleucine was associated with the fed state here whereas at least leucine did
not display similar differences (data not shown). It seems therefore that isoleucine may be a
marker of recent food ingestion and decrease with fasting.
Many adduct or daughter ions were also included in our markers as given in Table 1 & 2. In
the negative mode, LPCs form ion pairs with formate ions from the UPLC-solvent rendering
18
them neutral and by loss of a hydrogen ion the same compounds as observed in the positive
mode may be observed in the negative mode with a net increase in mass by 44 Daltons
(formate – H+) and with the same RT. Instead LPEs and free fatty acids were detected only
with loss of a hydrogen atom (Table 2). In the positive mode data, LPCs were observed not
only in proton bound form but also as sodium and potassium adducts or even dimers (Table
2). The loss of CH3 from the choline end of parent LPCs forms the characteristic LPC
fragments in negative mode data (Table 1). In positive mode the LPC fragments were
observed with the removal of one molecule of water from the parent compound (Table 2).
One conclusion from this study is that in LC-MS based metabolomics studies a single
molecular species is represented together with its parent ion and its inter-convertible isomers,
their adduct forms, and the fragment ions. In many cases different adducts or fragment ions of
the same metabolite may emerge with a higher or lower rank than the parent ion, and this is an
important cause of differences in the ranking orders between methods. To illustrate the higher
commonality at the metabolite level, we established a new rank for each metabolite (each
metabolite attained the lowest rank value from among its representative adducts, fragments or
isomers). The unidentified features were considered as representing the same metabolite as
long as they are within the range of an 0.02min retention time window. The metabolite ranks
of different methods are represented in Fig. 5. Fig. 5 illustrates that there are a higher number
of undetected metabolites for MarkerLynx which may be a result of the parameter selection or
the peak detection algorithm. For both negative and positive mode data, the rank patterns
were much more similar between different methods at the metabolite level than at the feature
level (electronic supplementary material, Fig. 4S). Metabolites with a high rank with any one
method also tend to attain higher rank values (yellowish color on Fig. 5) for the other
methods. Thus, it seems correct to conclude that different data processing methods employed
in this study provide 36% to 64% common markers (Fig. 4a), but the commonality is actually
much higher at the metabolite level as different features (adducts or fragment ions), selected
from the different methods actually represent the same metabolite.
The observation that all these related ions come up with high ranks and that their high ranks
are shared between the positive and negative modes as in this study, would strengthen not
only the confidence in the identification step but also in our variable selection method.

19
Conclusions
We aimed here to explore the effect of four data processing methods on the pattern of final
biomarkers. The selection of proper experimental parameters based on the specifics of the
dataset is the key for obtaining a high quality data analysis, regardless of applied data
processing method. The better parameter setting is a matter of experience and wrong settings
may obscure the extraction of relevant information. Combination of several such settings with
any of the data processing methods may increase the coverage of relevant markers.
Here we defined the markers as the 25 features having the highest regression coefficients by
each data processing method. Although the comparison of the selected markers from different
data processing methods revealed many different features, further chemical identification
revealed that they were often just adducts or daughter ions representing the same biomarker
compound. Another point is that many of the biomarkers identified were biologically closely
related so that any of the softwares and procedures applied here could identify biomarkers
explaining a major part of the biological processes causing the differences between the fasting
and the fed states.
The major lipid classes, LPCs, LPEs and free fatty acids, emerged as discriminative between
fed and fasted states in rats. The high level in the postprandial state of LPCs, generally known
to be pro-inflammatory, is interesting and their importance for low-grade inflammation should
be further explored. L-carnitine and acyl carnitines were also found as important markers and
the shift from free to acylated carnitine during fasting might be useful for the development of
a marker to follow the switch from lipid storage to lipid degradation from feeding to fasting
by using the ratio between the two.
Electronic supplementary material
The online version of this article contains supplementary material, which is available to
authorized users.
Acknowledgement
This study has been funded in part by the DanORC project that is funded by Danish Research
Council and the ISAFRUIT project that was funded by the European Commission (Contract
no. FP6-FOOD 016279).

20
References
1. Zivkovic AM, Wiest MM, Nguyen U, Nording ML, Watkins SM, and German JB
(2009) Metabolomics 5:209-218.
2. Sharman MJ, Gomez AL, Kraemer WJ, and Volek JS (2004) J Nutr 134:880-885.
3. Lindon JC, Nicholson JK, and Holmes E (2007) The handbook of metabonomics and
Metabolomics. Elsevier, Amsterdam.
4. Brindle JT, Nicholson JK, Schofield PM, Grainger DJ, and Holmes E (2003) Analyst
128:32-36.
5. Constantinou MA, Tsantili-Kakoulidou A, Andreadou I, Iliodromitis EK, Kremastinos
DT, and Mikros E (2007) Eur J Pharm Sci 30:303-314.
6. Fardet A, Llorach R, Martin JF, Besson C, Lyan B, Pujos-Guillot E, and Scalbert A
(2008) J Proteome Res 7:2388-2398.
7. Kim JY, Park JY, Kim OY, Ham BM, Kim HJ, Kwon DY, Jang Y, and Lee JH (2010)
J Proteome Res 9:4368-4375.
8. Wilson ID, Nicholson JK, Castro-Perez J, Granger JH, Johnson KA, Smith BW, and
Plumb RS (2005) J Proteome Res 4:591-598.
9. Katajamaa M and Oresic M (2007) J Chromatogr A 1158:318-328.
10. Yu TW, Park Y, Johnson JM, and Jones DP (2009) Bioinformatics 25:1930-1936.
11. Schulz-Trieglaff O, Hussong R, Gropl C, Leinenbach A, Hildebrandt A, Huber C, and
Reinert K (2008) J Comput Biol 15:685-704.
12. Tautenhahn R, Bottcher C, and Neumann S (2008) BMC Bioinformatics 9:504.
13. Lange E, Tautenhahn R, Neumann S, and Gropl C (2008) BMC Bioinformatics 9:375.
14. Pluskal T, Castillo S, Villar-Briones A, and Oresic M (2010) BMC Bioinformatics
11:395.
15. Smith CA, Want EJ, O'Maille G, Abagyan R, and Siuzdak G (2006) Anal Chem
78:779-787.
16. Nielsen NJ, Tomasi G, Frandsen RJN, Kristensen MB, Nielsen J, Giese H, and
Christensen JH (2010) Metabolomics 6:341-352.
17. Smedsgaard J and Nielsen J (2005) J Exp Bot 56:273-286.
18. Poulsen M, Mortensen A, Binderup ML, Langkilde S, Markowski J, and Dragsted LO
(2011) Nutr Cancer 63:402-409.

21
19. Bergmeyer HU, Gawahn G, and Grassl M (1974) Methods of Enzymatic Analysis.
Acad Press, New York.
20. Pete MJ, Ross AH, and Exton JH (1994) J Biol Chem 269:19494-19500.
21. Skov T and Bro R (2008) Anal Bioanal Chem 390:281-285.
22. Savorani F, Tomasi G, and Engelsen SB (2010) J Magn Reson 202:190-202.
23. Wold S, Esbensen K, and Geladi P (1987) Chemom Intell Lab Syst 2:37-52.
24. Wold S, Sjostrom M, and Eriksson L (2001) Chemom Intell Lab Syst 58:109-130.
25. Bijlsma S, Bobeldijk I, Verheij ER, Ramaker R, Kochhar S, Macdonald IA, van OB,
and Smilde AK (2006) Anal Chem 78:567-574.
26. Westerhuis JA, Hoefsloot HCJ, Smit S, Vis DJ, Smilde AK, van Velzen EJJ, van
Duijnhoven JPM, and van Dorsten FA (2008) Metabolomics 4:81-89.
27. Wishart DS, Tzur D, Knox C, Eisner R, Guo AC, Young N, Cheng D, Jewell K, Arndt
D, Sawhney S, Fung C, Nikolai L, Lewis M, Coutouly MA, Forsythe I, Tang P,
Shrivastava S, Jeroncic K, Stothard P, Amegbey G, Block D, Hau DD, Wagner J,
Miniaci J, Clements M, Gebremedhin M, Guo N, Zhang Y, Duggan GE, MacInnis
GD, Weljie AM, Dowlatabadi R, Bamforth F, Clive D, Greiner R, Li L, Marrie T,
Sykes BD, Vogel HJ, and Querengesser L (2007) Nucleic Acids Res 35:D521-D526.
28. Kristensen M, S. B. Engelsen, and L. O. Dragsted. LC-MS metabolomics top-down
approach reveals new exposure and effect biomarkers of apple and apple-pectin
intake. Metabolomics 2011.
29. van den Berg RA, Hoefsloot HCJ, Westerhuis JA, Smilde AK, and van der Werf MJ
(2006) BMC Genomics 7:142.
30. Anderssen E, Dyrstad K, Westad F, and Martens H (2006) Chemom Intell Lab Syst
84:69-74.
31. Subbaiah PV and Liu M (1996) J Lipid Res 37:113-122.
32. Weltzien HU (1979) Biochim Biophy. Acta 559:259-287.
33. Han MS, Y. M. Lim, W. Quan, J. R. Kim, C. W. Chung, M. Kang, S. Kim, S. Y. Park,
J. S. Han, S. Y. Park, H. G. Cheon, S. D. Rhee, T. S. Park, and M. S. Lee.
Lysophosphatidylcholine as an effector of fatty acid-induced insulin resistance. J Lipid
Res 2011.
Ref Type: In Press
34. Sekas G, Patton GM, Lincoln EC, and Robins SJ (1985) J Lab Clin Med 105:190-194.
35. Croset M, Brossard N, Polette A, and Lagarde M (2000) Biochem J 345:61-67.

22
36. Seppanen-Laakso T and Oresic M (2009) J Mol Endocrinol 42:185-190.
37. Sandra K, Pereira AD, Vanhoenacker G, David F, and Sandra P (2010) J Chromatogr
A 1217:4087-4099.
38. Kerner J and Hoppel C (2000) BBA-Mol Cell Biol L 1486:1-17.
39. Pearson DJ and Tubbs PK (1967) Biochem J 105:953-963.
40. Shaham O, Wei R, Wang TJ, Ricciardi C, Lewis GD, Vasan RS, Carr SA, Thadhani
R, Gerszten RE, and Mootha VK (2008) Mol Syst Biol 4.
41. Pietilainen KH, Naukkarinen J, Rissanen A, Saharinen J, Ellonen P, Keranen H,
Suomalainen A, Gotz A, Suortti T, Yki-Jarvinen H, Oresic M, Kaprio J, and Peltonen
L (2008) Plos Medicine 5:472-483.

23
Figure Captions
Fig. 1 Custom data processing scheme
Fig. 2 The scheme summarizing the steps for the selection of markers in data analysis. Steps 1
to 3 were applied on each feature set extracted using any processing method (2variable
selection)
Fig. 3 PCA scores plots of negative mode data processed with MarkerLynx (A), MZmine (B),
XCMS (C) and customized methods (D)
Fig. 4 (a) Bar plot illustrating the number of markers in the intersection of custom and other
three data processing software tools (A: MarkerLynx, B: MZmine, C:XCMS). (b) Venn
diagrams illustrating the number of common and method specific markers extracted from
three software tools (left: positive mode; right: negative mode)
Fig. 5 Heatmap illustrating the comparison of metabolite ranks between four different
methods for (a) negative and (b) positive mode data. Each row represents the lowest value
rank of a metabolite for four different methods (Table 1,3rrd column). The markers were
sorted in ascending order based on the rank obtained with method A (A: MarkerLynx; B:
MZmine, C: XCMS and D: Custom data processing). (yellow to red: rank 1-25; claret red:
rank higher than 25; black: not detected; green: detected)

24
Tables
Table 1. Retention times and measured masses of the markers obtained from MarkerLynx,
MZmine, XCMS and custom data processing of negative mode data that contributed most to
the separation of samples in fasted and fed states.
RT
(min)
Measured
m/zRank Group
Suggested
Compound
Suggested
Adduct
Monoisotopic
mass
0.64017 105.02 ndA110
B12
Cd
Dfed U1
1.3652 103.039 30A15
B75
C49
Dfasted
3-hydroxybutanoic
acid[M-H]
-104.0473
1.3662 59.01 40A46
B6
C9
Dfasted
3-hydroxybutanoic
acid fragment
(-C2H4O)
1.37 418.125 ndAnd
Bnd
C25
Dfasted U2
1.37 576.3235 ndAnd
Bnd
C19
Dfasted U2
1.3638 259.9988 54A49
B24
C3
Dfasted U2
1.3748 130.09 39A52
B22
C115
Dfed Isoleucine [M-H]
-131.0946
1.8788 178.0495 23A13
B18
C69
Dfasted Hippuric acid* [M-H]
-179.0582
2.4654 623.8663 31A25
Bnd
C10
Dfed U3
2.4665 365.0683 11A33
Bnd
C48
Dfed U3
2.4715 343.08 5A8
B3
C2
Dfed U4
2.4715 623.36 18A38
B9
Cd
Dfed U4
2.68 198.1021 ndAnd
Bnd
C14
Dfed U5
3.5713 580.33 ndA88
B21
C129
Dfed U6
4.0573 512.2995 8A12
Bnd
C29
Dfed LPC(14:0) [M+FA-H]
-467.3012
4.0577 452.2779 21And
Bnd
Cd
Dfed
LPC(14:0) fragment
(-CH3)
4.099 562.3133 ndA11
Bnd
Cd
Dfed U7
4.1104 586.3145 ndA7
Bnd
C1
Dfed LPC(20:5) [M+FA-H]
-541.3168
4.1232 309.2035 2A20
B2
C303
Dfed
LPC(20:5) fragment
(-C7H22NO5P)
4.1578 979.6007 24A41
Bnd
C8
Dfed LPC(14:0) [2M+FA-H]
-467.3012
4.158 512.2978 9A9
B5
C29
Dfed LPC(14:0) [M+FA-H]
-
4.1581 452.2772 13A14
Bd
Cd
Dfed
LPC(14:0) fragment
(-CH3)
4.1622 514.31 ndA44
B10
C291
Dfed U8
4.177 474.2612 ndA16
Bnd
Cd
Dfed
LPC(18:3) fragment
(-C3H7)
4.1789 502.2917 20A22
Bnd
C13
Dfed
LPC(18:3) fragment
(-CH3)
4.1811 562.3148 27A1
B92
Cd
Dfed LPC(18:3) [M+FA-H]
-517.3168
4.1826 526.2948 10A10
B4
Cd
Dfed
LPC(20:5) fragment
(-CH3)
4.1847 586.32 3A6
B1
C1
Dfed LPC(20:5) [M+FA-H]
-541.3168
4.1948 538.3145 25A40
Bnd
C11
Dfed LPC(16:1) [M+FA-H]
-493.3168
4.2285 562.3143 47A21
B11
Cd
Dfed LPC(18:3) [M+FA-H]
-517.3168
4.2288 502.29 dA27
B17
C13
Dfed
LPC(18:3) fragment
(-CH3)
4.23 634.2 ndAnd
Bnd
C24
Dfed U9
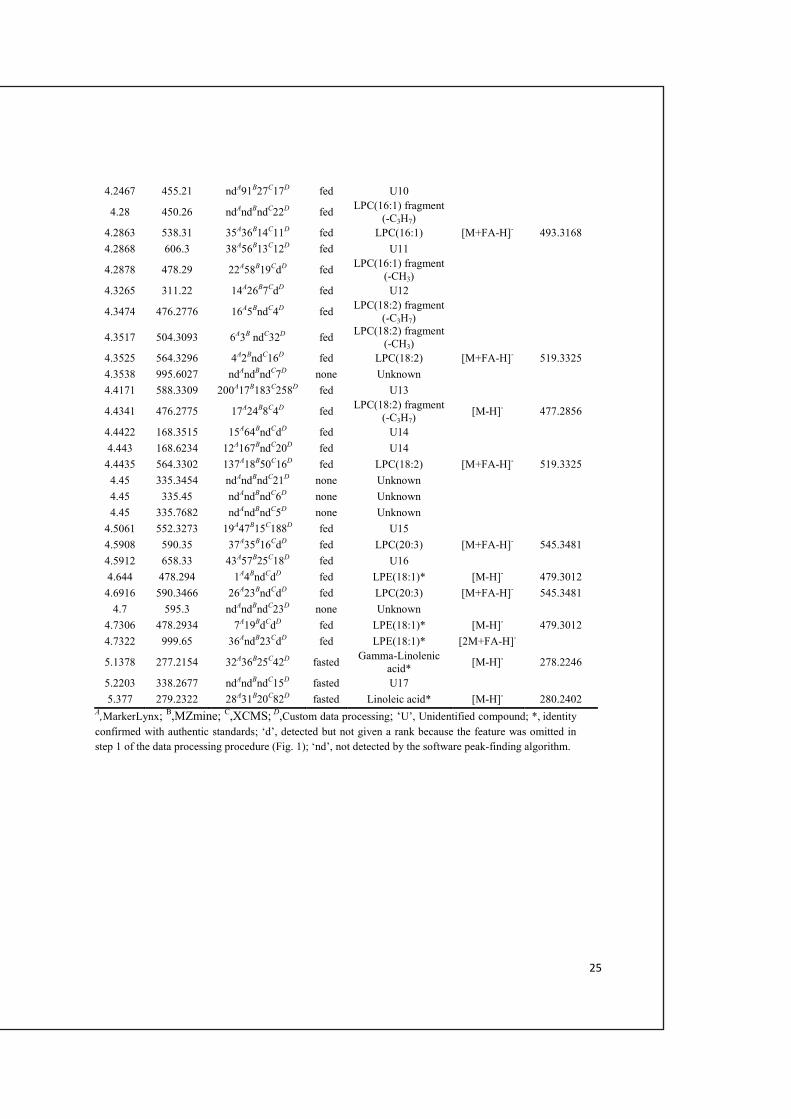
25
4.2467 455.21 ndA91
B27
C17
Dfed U10
4.28 450.26 ndAnd
Bnd
C22
Dfed
LPC(16:1) fragment
(-C3H7)
4.2863 538.31 35A36
B14
C11
Dfed LPC(16:1) [M+FA-H]
-493.3168
4.2868 606.3 38A56
B13
C12
Dfed U11
4.2878 478.29 22A58
B19
Cd
Dfed
LPC(16:1) fragment
(-CH3)
4.3265 311.22 14A26
B7
Cd
Dfed U12
4.3474 476.2776 16A5
Bnd
C4
Dfed
LPC(18:2) fragment
(-C3H7)
4.3517 504.3093 6A3
Bnd
C32
Dfed
LPC(18:2) fragment
(-CH3)
4.3525 564.3296 4A2
Bnd
C16
Dfed LPC(18:2) [M+FA-H]
-519.3325
4.3538 995.6027 ndAnd
Bnd
C7
Dnone Unknown
4.4171 588.3309 200A17
B183
C258
Dfed U13
4.4341 476.2775 17A24
B8
C4
Dfed
LPC(18:2) fragment
(-C3H7)[M-H]
-477.2856
4.4422 168.3515 15A64
Bnd
Cd
Dfed U14
4.443 168.6234 12A167
Bnd
C20
Dfed U14
4.4435 564.3302 137A18
B50
C16
Dfed LPC(18:2) [M+FA-H]
-519.3325
4.45 335.3454 ndAnd
Bnd
C21
Dnone Unknown
4.45 335.45 ndAnd
Bnd
C6
Dnone Unknown
4.45 335.7682 ndAnd
Bnd
C5
Dnone Unknown
4.5061 552.3273 19A47
B15
C188
Dfed U15
4.5908 590.35 37A35
B16
Cd
Dfed LPC(20:3) [M+FA-H]
-545.3481
4.5912 658.33 43A57
B25
C18
Dfed U16
4.644 478.294 1A4
Bnd
Cd
Dfed LPE(18:1)* [M-H]
-479.3012
4.6916 590.3466 26A23
Bnd
Cd
Dfed LPC(20:3) [M+FA-H]
-545.3481
4.7 595.3 ndAnd
Bnd
C23
Dnone Unknown
4.7306 478.2934 7A19
Bd
Cd
Dfed LPE(18:1)* [M-H]
-479.3012
4.7322 999.65 36And
B23
Cd
Dfed LPE(18:1)* [2M+FA-H]
-
5.1378 277.2154 32A36
B25
C42
Dfasted
Gamma-Linolenic
acid*[M-H]
-278.2246
5.2203 338.2677 ndAnd
Bnd
C15
Dfasted U17
5.377 279.2322 28A31
B20
C82
Dfasted Linoleic acid* [M-H]
-280.2402
A,MarkerLynx;
B,MZmine;
C,XCMS;
D,Custom data processing; ‘U’, Unidentified compound; *, identity
confirmed with authentic standards; ‘d’, detected but not given a rank because the feature was omitted in
step 1 of the data processing procedure (Fig. 1); ‘nd’, not detected by the software peak-finding algorithm.

26
Table 2. Retention times and measured masses of the markers obtained from obtained from
MarkerLynx, MZmine, XCMS and custom data processing of positive mode data that
contributed most to the separation of samples in fasted and fed states.
RT
(min)
Measured
m/zRank Group
Suggested
Compound
Suggested
Adduct
Mono-
isotopic mass
0.51917 112.1138 ndA62
B21
C226
Dfasted U1
0.6134 162.1128 40A41
B37
C12
Dfed L-Carnitine* [M+H]
+161.1052
0.66298 116.0719 44A16
B20
C9
Dfed U2
0.66313 70.0658 ndA21
B40
C17
Dfed U2
0.822 143.1201 55A42
B24
C135
Dfasted U3
0.8881 204.125 7A31
B7
C16
Dfasted L-Acetylcarnitine* [M+H]
+203.1158
0.8881 144.1036 28And
B16
C318
Dfasted
L-Acetylcarnitine*
fragment
(-C2H4O2)
0.9003 60.0816 13And
Bnd
Cd
Dfasted
L-Acetylcarnitine*
fragment
(-C6H12NO3)
0.9012 85.028 17A64
B10
C175
Dfasted
L-Acetylcarnitine*
fragment
(-C5H13NO2)
0.9013 145.051 4A19
B3
C110
Dfasted
L-Acetylcarnitine*
fragment (-C6H9N)
1.1552 248.1521 dA56
B15
C25
Dfasted U4
1.6373 231.1215 ndAd
B1
Cd
Dfasted U5
1.8878 105.0348 100A80
B6
C244
Dfasted U6
2.63 570.3439 20And
B5
Cd
Dfed U7
3.2285 552.3341 91A32
B12
Cd
Dfed U8
3.2795 107.0871 dA74
B19
Cd
Dfasted U9
3.2797 121.1028 114And
B25
Cd
Dfasted U9
3.2798 163.15 57A63
B23
Cd
Dfasted U9
3.2798 205.1613 73A85
B18
Cd
Dfasted U9
3.409 550.3199 ndAnd
B13
Cd
Dfed U10
3.4286 536.3383 1And
Bnd
C14
Dfed U10
3.5823 518.3278 ndAnd
B17
C15
Dfed U11
3.7402 534.321 ndA24
B9
Cd
Dfed U12
4.0664 468.3109 5A33
Bnd
C6
Dfed LPC(14:0) [M+H]
+467.3012
4.1187 542.328 ndA3
Bnd
C3
Dfed LPC(20:5) [M+H]
+541.3168
4.1213 564.3085 ndA11
Bnd
C2
Dfed LPC(20:5) [M+Na]
+541.3168
4.1588 468.3101 2A13
B2
C6
Dfed LPC(14:0) [M+H]
+467.3012
4.1626 957.6048 11And
Bnd
Cd
Dfed LPC(14:0) [2M+Na]
+467.3012
4.1642 985.641 9And
Bnd
C9
Dfed LPC(14:0)
4.1643 506.2667 14A23
B31
Cd
Dfed LPC(14:0) [M+K]
+467.3012
4.1645 490.2931 8A6
B8
C7
Dfed LPC(14:0) [M+Na]
+467.3012
4.1649 935.6182 10A17
Bnd
C24
Dfed LPC(14:0) [2M+H]
+467.3012
4.1911 564.3099 12A7
B22
C2
Dfed LPC(20:5) [M+Na]
+541.3168
4.193 524.3201 19And
Bnd
C129
Dfed
LPC(20:5) fragment
(-H2O)
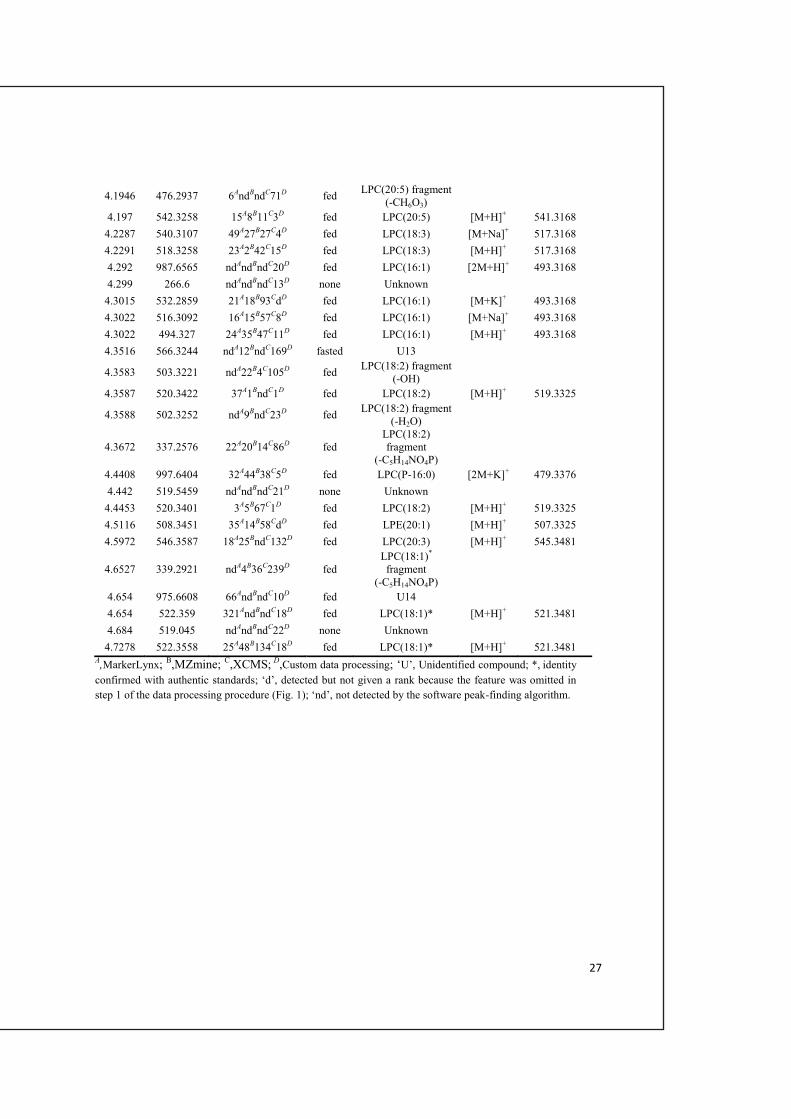
27
4.1946 476.2937 6And
Bnd
C71
Dfed
LPC(20:5) fragment
(-CH6O3)
4.197 542.3258 15A8
B11
C3
Dfed LPC(20:5) [M+H]
+541.3168
4.2287 540.3107 49A27
B27
C4
Dfed LPC(18:3) [M+Na]
+517.3168
4.2291 518.3258 23A2
B42
C15
Dfed LPC(18:3) [M+H]
+517.3168
4.292 987.6565 ndAnd
Bnd
C20
Dfed LPC(16:1) [2M+H]
+493.3168
4.299 266.6 ndAnd
Bnd
C13
Dnone Unknown
4.3015 532.2859 21A18
B93
Cd
Dfed LPC(16:1) [M+K]
+493.3168
4.3022 516.3092 16A15
B57
C8
Dfed LPC(16:1) [M+Na]
+493.3168
4.3022 494.327 24A35
B47
C11
Dfed LPC(16:1) [M+H]
+493.3168
4.3516 566.3244 ndA12
Bnd
C169
Dfasted U13
4.3583 503.3221 ndA22
B4
C105
Dfed
LPC(18:2) fragment
(-OH)
4.3587 520.3422 37A1
Bnd
C1
Dfed LPC(18:2) [M+H]
+519.3325
4.3588 502.3252 ndA9
Bnd
C23
Dfed
LPC(18:2) fragment
(-H2O)
4.3672 337.2576 22A20
B14
C86
Dfed
LPC(18:2)
fragment
(-C5H14NO4P)
4.4408 997.6404 32A44
B38
C5
Dfed LPC(P-16:0) [2M+K]
+479.3376
4.442 519.5459 ndAnd
Bnd
C21
Dnone Unknown
4.4453 520.3401 3A5
B67
C1
Dfed LPC(18:2) [M+H]
+519.3325
4.5116 508.3451 35A14
B58
Cd
Dfed LPE(20:1) [M+H]
+507.3325
4.5972 546.3587 18A25
Bnd
C132
Dfed LPC(20:3) [M+H]
+545.3481
4.6527 339.2921 ndA4
B36
C239
Dfed
LPC(18:1)*
fragment
(-C5H14NO4P)
4.654 975.6608 66And
Bnd
C10
Dfed U14
4.654 522.359 321And
Bnd
C18
Dfed LPC(18:1)* [M+H]
+521.3481
4.684 519.045 ndAnd
Bnd
C22
Dnone Unknown
4.7278 522.3558 25A48
B134
C18
Dfed LPC(18:1)* [M+H]
+521.3481
A,MarkerLynx;
B,MZmine;
C,XCMS;
D,Custom data processing; ‘U’, Unidentified compound; *, identity
confirmed with authentic standards; ‘d’, detected but not given a rank because the feature was omitted in
step 1 of the data processing procedure (Fig. 1); ‘nd’, not detected by the software peak-finding algorithm.

28
FIGURE 1

29
FIGURE 2

30
FIGURE 3

31
FIGURE 4
a
b
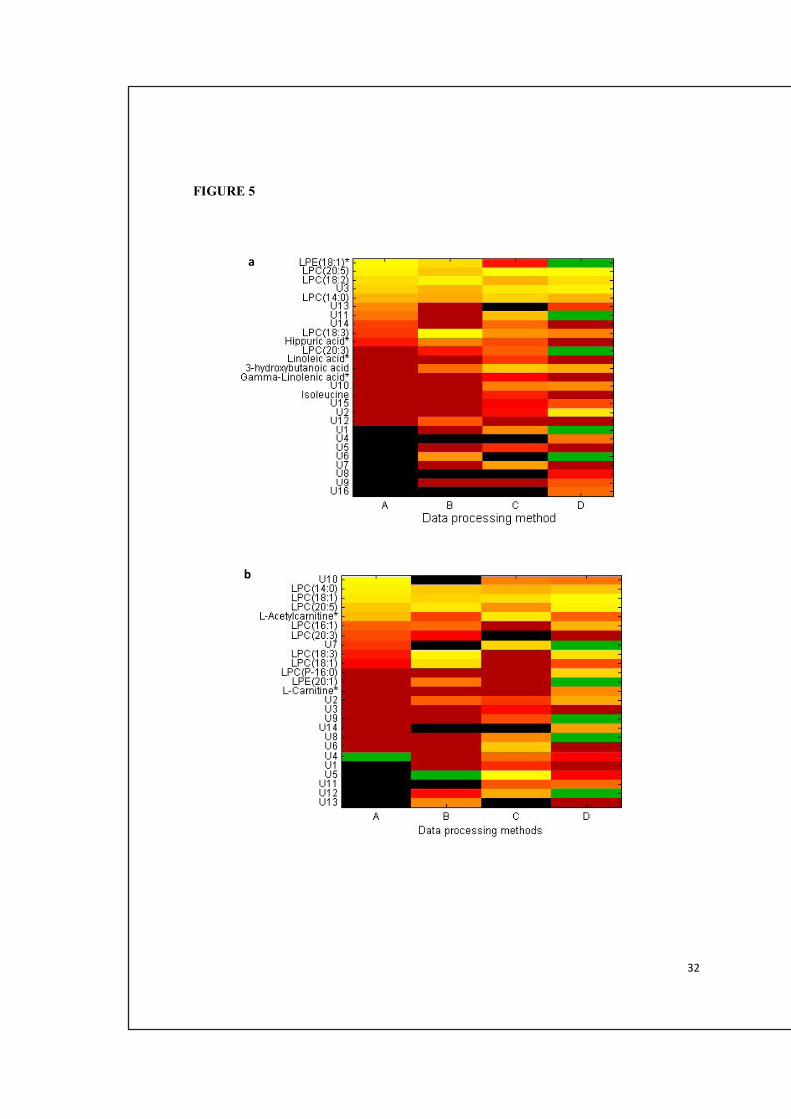
32
FIGURE 5
a
b
ORIGINAL ARTICLE
LC–MS metabolomics top-down approach reveals new exposureand effect biomarkers of apple and apple-pectin intake
Mette Kristensen • Søren B. Engelsen •
Lars O. Dragsted
Received: 26 July 2010 / Accepted: 28 January 2011
� Springer Science+Business Media, LLC 2011
Abstract In order to investigate exposure end effect
markers of fruit and fruit fibre intake we investigated how
fresh apple or apple-pectin affects the urinarymetabolome of
rats. Twenty-four Fisher 344 male rats were randomized into
three groups and fed a standard diet with different supple-
mentations added in two of the groups (7% apple-pectin or
10 g raw apple). After 24 days of feeding, 24 h urine was
collected and analyzed by UPLC-QTOF-MS in positive and
negative ionization mode. Metabolites that responded to the
apple or pectin diets were selected and classified as either
potential exposure or effect markers based on the magnitude
and pattern of their response. An initial principal component
analysis (PCA) of all detected metabolites showed a clear
separation between the groups and during marker identifi-
cation several new apple and/or pectin markers were found.
Quinic acid, m-coumaric acid and (-)epicatechin were iden-
tified as exposure markers of apple intake whereas hippuric
acid behaved as an effect marker. Pyrrole-2-carboxylic acid
and 2-furoylglycine behaved as pectin exposure markers
while 2-piperidinone was recognized as a potential pectin
effect marker. None of them has earlier been related to intake
of pectin or other fibre products. We discuss these new
potential exposure and effectmarkers and their interpretation.
Keywords Metabolomics � LC–MS � Apple � Pectin �Exposure and effect biomarkers
1 Introduction
It is well known that fruit consumption has preventive
effects on degenerative diseases and especially on cardio-
vascular disease (Bazzano et al. 2002; Liu et al. 2000),
however the causal factors and their mechanisms of action
are not well known. Apples represent one of the major fruits
consumed throughout the western countries and the disease
preventive factors of this fruit seem particularly relevant to
investigate. Consumption of nutrients and other bioactive
compounds from fruit will most likely interact with several
physiological functions and metabolic pathways in the
organism and hereby reduce the risk of disease.Methods that
can handle multiple responses therefore seem particularly
beneficial compared to the classical univariate approaches
most often used in nutrition research. Metabolomics aim for
measurement of all metabolites present in a given biological
sample and by use of this technique the metabolic effect of
e.g., apple intake can hereby be explored in a top-down
manner compared to more targeted analytical methods. The
open-minded approach of metabolomics has great potential
to generate new hypotheses and thereby to improve our
mechanistic understanding of why ‘an apple a day keeps the
doctor away’. Compared to a human study, the rats in this
investigation are expected to exhibit a much lower level of
background variation due to their isogenic nature and con-
trollable habits and consequently a larger number of expo-
sure- and effect related features in the recorded metabolome
profiles. This may ease interpretation of effects in future
human intervention studies where exposure to apple, pectin
or fruit intake in general may be partially hidden in the large
Electronic supplementary material The online version of thisarticle (doi:10.1007/s11306-011-0282-7) contains supplementarymaterial, which is available to authorized users.
M. Kristensen (&) � S. B. EngelsenDepartment of Food Science, Faculty of Life Sciences,
University of Copenhagen, Rolighedsvej 30, 1958 Frederiksberg,
Denmark
e-mail: [email protected]
L. O. Dragsted
Department of Human Nutrition, Faculty of Life Sciences,
University of Copenhagen, Frederiksberg, Denmark
123
Metabolomics
DOI 10.1007/s11306-011-0282-7

inter-individual variation. The combination of several fea-
tures recorded in rat studies as related to apple exposure or
effect would therefore help to identify more robust bio-
markers in humans. Besides being helpful in ourmechanistic
understanding of dietary effects of apple intake, such
objective biomarkers would be useful for the estimation of
apple or fruit intake in samples from epidemiological stud-
ies, where the current methods based on questionnaires are
prone to bias. Improved markers of intake should be useful
to identify possible associations between dietary apple
intake and disease prevention at the population level.
In the research presented here we want to focus on the
cell wall polysaccharide, pectin, as a potentially disease
preventive component in apples and in many other fruits.
Pectins are presumed to prevent the reabsorbtion of bile
acids in the intestine and to enhance steroid excretion so
that more cholesterol is diverted into the bile acid pool
(Ahrens et al. 1986). However, pectins from different plant
origins have a large structural diversity and thus possibly
varied health effects, which presumably is the main reason
why previous animal studies reporting on pectin feeding
and plasma cholesterol have been inconsistent (Aprikian
et al. 2001, 2002, 2003; Trautwein et al. 1998; Yamada
et al. 2003). Thus, there is a need to sort out mechanisms
and active components in order to understand the physio-
logical effect of apple intake and of its associated pectin
component. In this study we investigate the urinary me-
tabolome following feeding of fresh apple and apple-pectin
to rats in a nutritionally balanced feeding trial.
2 Materials and Methods
2.1 Materials
All apples used were from a single batch of the variety
Shampion, grown in Skierniwice, Poland. Apple-pectin
was a commercial unrefined product kindly provided by
Obi-Pectin AG (Basel, Switzerland).
2.2 Animal study and sample collection
Twenty-four Fisher 344 male rats were randomized into
three groups and all rats were fed a standard diet with
different supplementations added in two of the groups. One
group had 7% apple-pectin added to the diet, one group
10 g of raw apple and one group had no supplementation
added to the diet (control). The diet was balanced so that all
animals received the same amount of macro- and micro-
nutrients (details to be published elsewhere). After 24 days
of feeding, urine was collected in a collection vessel pre-
conditioned with 1 ml 1 mM NaN3 to avoid microbial
growth. The collection vessel was surrounded by an insu-
lated container filled with dry-ice to ensure that the urine
kept a temperature below 5�C during a 24 h collection
period. The dry ice was replenished every 8 h during the
collection period. Each urine sample was diluted with a
fixed volume of 3 ml water used to wash the collection
device in the metabolism cage and then weighed and
immediately frozen at -80�C.
2.3 LC-QTOF-MS analysis
Before analysis the samples were thawed, filtered through a
40 lm Millipore filter (Millipore, Billerica, Massachusetts)
and distributed randomly into a 96-well auto-injector tray.
The tray was centrifuged to precipitate debris and 10 ll ofeach sample were injected into an UPLC (Waters, Milford,
Massachusetts) with a 1.7 lm C18 BEH column (Waters)
operated with a 6.0 min gradient from 0.1% formic acid to
0.1% formic acid in 20% acetone: 80% acetonitrile. The
eluate was analyzed in duplicate by Waters Premier QTOF-
MS in both negative and positive modes. Ionization of
molecules was achieved by applying a voltage of 2.8 or
3.2 kV to the tip of the capillary in negative or positive
mode, respectively. This represents relatively soft ioniza-
tion conditions but optimised so that fragmentation can
occur and be helpful in our later structural interpretation.
Data were collected in centroid mode using leucine-
enkephalin as a lock-spray to calibrate mass accuracy every
10 s. A blank (0.1% formic acid) and a metabolomics
standard containing 40 different physiological compounds
were analyzed three times during the sample run. This
standard was used to check mass error (\20 ppm) and
retention time shift (\0.05 min) during the run and when
running authentic standards for verification.
2.4 Data preprocessing of LC–MS data
The raw data were extracted and aligned in retention time-
and mass-direction by MarkerLynxTM (Waters) by using
two different processing conditions as detailed below, to
discover as many important peaks as possible. Marker-
lynxTM works by customized predefinition of several
parameters and applies a peak picking algorithm to select
potential markers. In the following the detected ions are
termed ‘features’ when collected after the peak picking and
alignment procedure and ‘markers’ after selection by data
analysis. Two sets of parameters for data processing were
used: A retention time window of 0.05 (0.1) s, a mass
window of 0.05 (0.02) Da, a noise elimination level of 3
(6) standard deviations above background and an intensity
threshold of 20 (30) cps. The first method resulted in 5,350
features in the negative mode and 7,668 features in the
positive mode and the second method (parameters in
M. Kristensen et al.
123
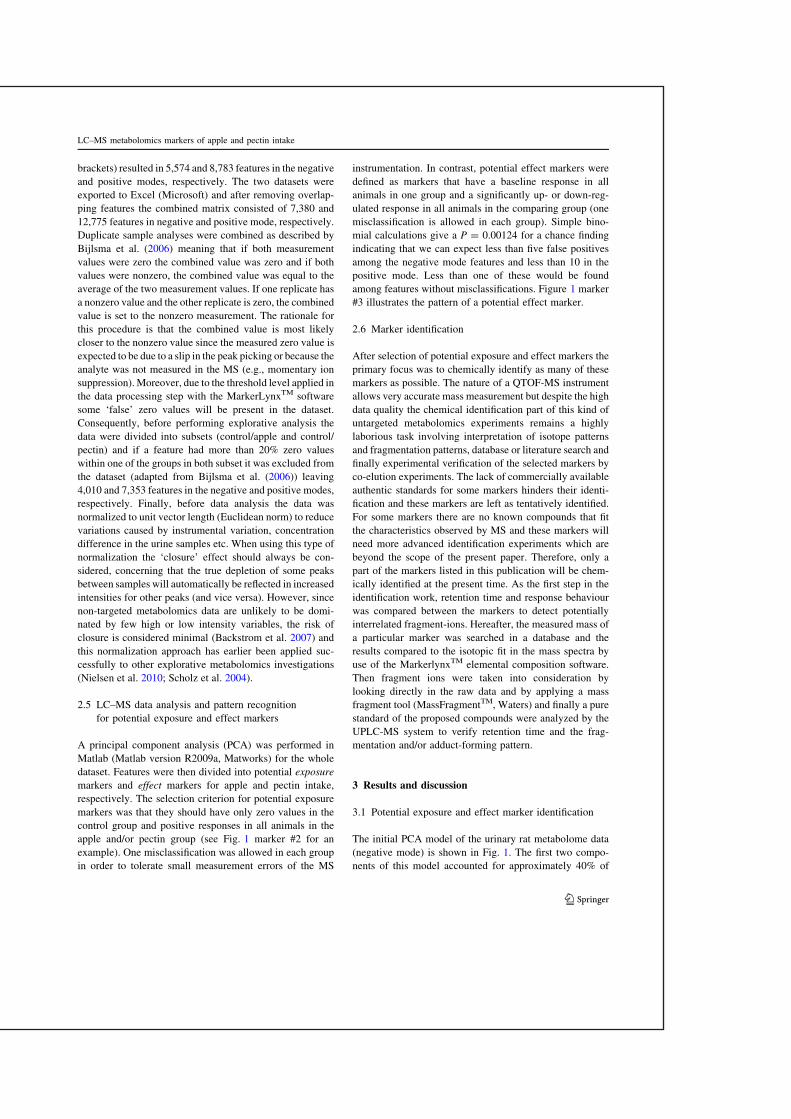
brackets) resulted in 5,574 and 8,783 features in the negative
and positive modes, respectively. The two datasets were
exported to Excel (Microsoft) and after removing overlap-
ping features the combined matrix consisted of 7,380 and
12,775 features in negative and positive mode, respectively.
Duplicate sample analyses were combined as described by
Bijlsma et al. (2006) meaning that if both measurement
values were zero the combined value was zero and if both
values were nonzero, the combined value was equal to the
average of the two measurement values. If one replicate has
a nonzero value and the other replicate is zero, the combined
value is set to the nonzero measurement. The rationale for
this procedure is that the combined value is most likely
closer to the nonzero value since the measured zero value is
expected to be due to a slip in the peak picking or because the
analyte was not measured in the MS (e.g., momentary ion
suppression). Moreover, due to the threshold level applied in
the data processing step with the MarkerLynxTM software
some ‘false’ zero values will be present in the dataset.
Consequently, before performing explorative analysis the
data were divided into subsets (control/apple and control/
pectin) and if a feature had more than 20% zero values
within one of the groups in both subset it was excluded from
the dataset (adapted from Bijlsma et al. (2006)) leaving
4,010 and 7,353 features in the negative and positive modes,
respectively. Finally, before data analysis the data was
normalized to unit vector length (Euclidean norm) to reduce
variations caused by instrumental variation, concentration
difference in the urine samples etc. When using this type of
normalization the ‘closure’ effect should always be con-
sidered, concerning that the true depletion of some peaks
between samples will automatically be reflected in increased
intensities for other peaks (and vice versa). However, since
non-targeted metabolomics data are unlikely to be domi-
nated by few high or low intensity variables, the risk of
closure is considered minimal (Backstrom et al. 2007) and
this normalization approach has earlier been applied suc-
cessfully to other explorative metabolomics investigations
(Nielsen et al. 2010; Scholz et al. 2004).
2.5 LC–MS data analysis and pattern recognition
for potential exposure and effect markers
A principal component analysis (PCA) was performed in
Matlab (Matlab version R2009a, Matworks) for the whole
dataset. Features were then divided into potential exposure
markers and effect markers for apple and pectin intake,
respectively. The selection criterion for potential exposure
markers was that they should have only zero values in the
control group and positive responses in all animals in the
apple and/or pectin group (see Fig. 1 marker #2 for an
example). One misclassification was allowed in each group
in order to tolerate small measurement errors of the MS
instrumentation. In contrast, potential effect markers were
defined as markers that have a baseline response in all
animals in one group and a significantly up- or down-reg-
ulated response in all animals in the comparing group (one
misclassification is allowed in each group). Simple bino-
mial calculations give a P = 0.00124 for a chance finding
indicating that we can expect less than five false positives
among the negative mode features and less than 10 in the
positive mode. Less than one of these would be found
among features without misclassifications. Figure 1 marker
#3 illustrates the pattern of a potential effect marker.
2.6 Marker identification
After selection of potential exposure and effect markers the
primary focus was to chemically identify as many of these
markers as possible. The nature of a QTOF-MS instrument
allows very accurate mass measurement but despite the high
data quality the chemical identification part of this kind of
untargeted metabolomics experiments remains a highly
laborious task involving interpretation of isotope patterns
and fragmentation patterns, database or literature search and
finally experimental verification of the selected markers by
co-elution experiments. The lack of commercially available
authentic standards for some markers hinders their identi-
fication and these markers are left as tentatively identified.
For some markers there are no known compounds that fit
the characteristics observed by MS and these markers will
need more advanced identification experiments which are
beyond the scope of the present paper. Therefore, only a
part of the markers listed in this publication will be chem-
ically identified at the present time. As the first step in the
identification work, retention time and response behaviour
was compared between the markers to detect potentially
interrelated fragment-ions. Hereafter, the measured mass of
a particular marker was searched in a database and the
results compared to the isotopic fit in the mass spectra by
use of the MarkerlynxTM elemental composition software.
Then fragment ions were taken into consideration by
looking directly in the raw data and by applying a mass
fragment tool (MassFragmentTM, Waters) and finally a pure
standard of the proposed compounds were analyzed by the
UPLC-MS system to verify retention time and the frag-
mentation and/or adduct-forming pattern.
3 Results and discussion
3.1 Potential exposure and effect marker identification
The initial PCA model of the urinary rat metabolome data
(negative mode) is shown in Fig. 1. The first two compo-
nents of this model accounted for approximately 40% of
LC–MS metabolomics markers of apple and pectin intake
123
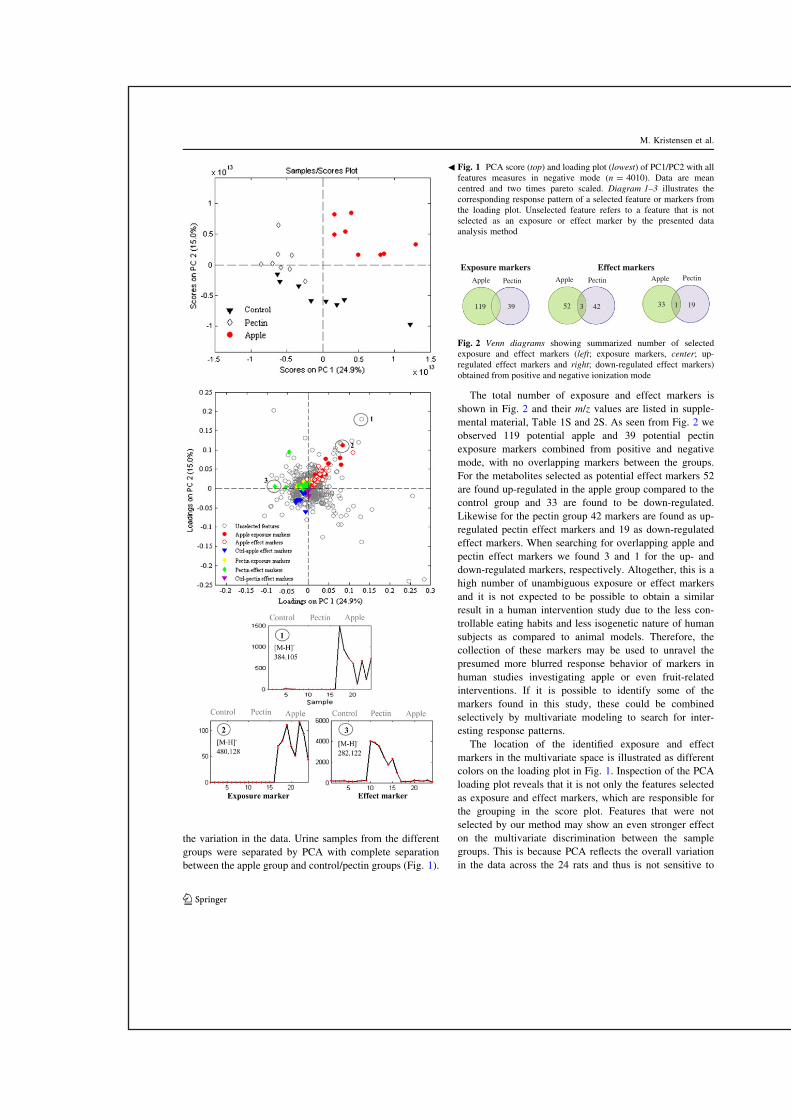
the variation in the data. Urine samples from the different
groups were separated by PCA with complete separation
between the apple group and control/pectin groups (Fig. 1).
The total number of exposure and effect markers is
shown in Fig. 2 and their m/z values are listed in supple-
mental material, Table 1S and 2S. As seen from Fig. 2 we
observed 119 potential apple and 39 potential pectin
exposure markers combined from positive and negative
mode, with no overlapping markers between the groups.
For the metabolites selected as potential effect markers 52
are found up-regulated in the apple group compared to the
control group and 33 are found to be down-regulated.
Likewise for the pectin group 42 markers are found as up-
regulated pectin effect markers and 19 as down-regulated
effect markers. When searching for overlapping apple and
pectin effect markers we found 3 and 1 for the up- and
down-regulated markers, respectively. Altogether, this is a
high number of unambiguous exposure or effect markers
and it is not expected to be possible to obtain a similar
result in a human intervention study due to the less con-
trollable eating habits and less isogenetic nature of human
subjects as compared to animal models. Therefore, the
collection of these markers may be used to unravel the
presumed more blurred response behavior of markers in
human studies investigating apple or even fruit-related
interventions. If it is possible to identify some of the
markers found in this study, these could be combined
selectively by multivariate modeling to search for inter-
esting response patterns.
The location of the identified exposure and effect
markers in the multivariate space is illustrated as different
colors on the loading plot in Fig. 1. Inspection of the PCA
loading plot reveals that it is not only the features selected
as exposure and effect markers, which are responsible for
the grouping in the score plot. Features that were not
selected by our method may show an even stronger effect
on the multivariate discrimination between the sample
groups. This is because PCA reflects the overall variation
in the data across the 24 rats and thus is not sensitive to
52 3 42 33 1 19119 39
Apple Pectin
Exposure markers Effect markers Apple Pectin Pectin Apple
Fig. 2 Venn diagrams showing summarized number of selected
exposure and effect markers (left; exposure markers, center; up-
regulated effect markers and right; down-regulated effect markers)
obtained from positive and negative ionization mode
Fig. 1 PCA score (top) and loading plot (lowest) of PC1/PC2 with all
features measures in negative mode (n = 4010). Data are mean
centred and two times pareto scaled. Diagram 1–3 illustrates the
corresponding response pattern of a selected feature or markers from
the loading plot. Unselected feature refers to a feature that is not
selected as an exposure or effect marker by the presented data
analysis method
b
M. Kristensen et al.
123
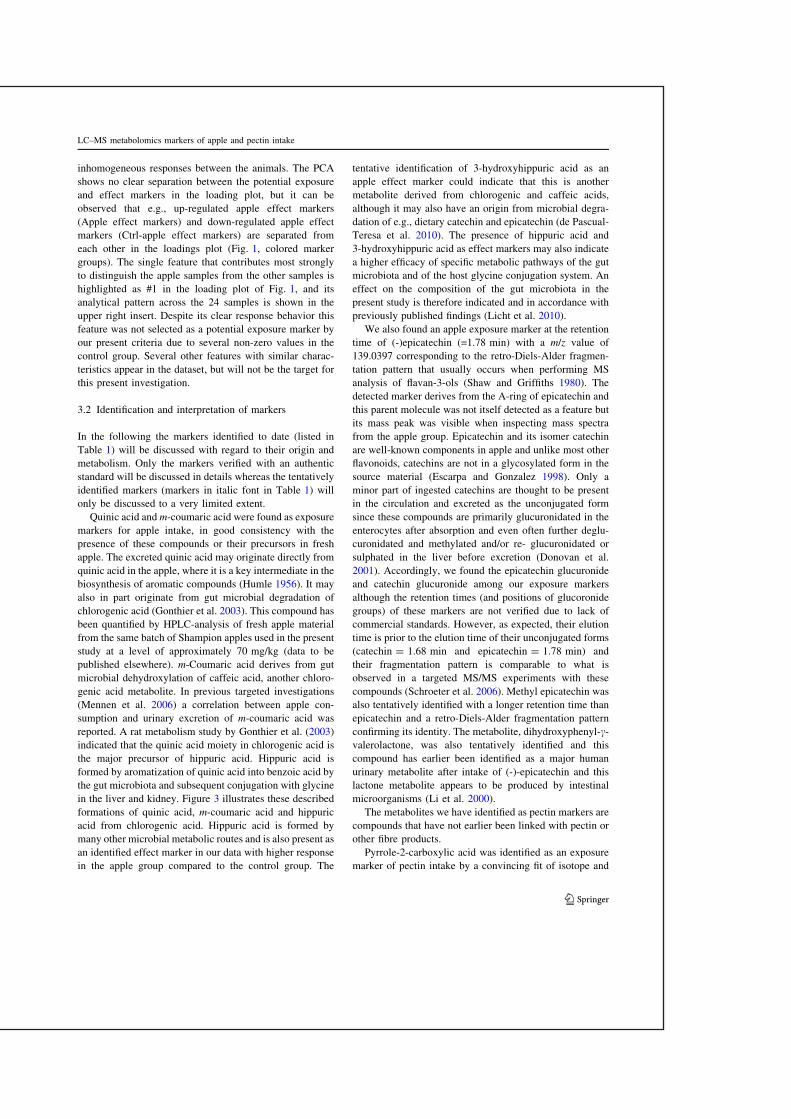
inhomogeneous responses between the animals. The PCA
shows no clear separation between the potential exposure
and effect markers in the loading plot, but it can be
observed that e.g., up-regulated apple effect markers
(Apple effect markers) and down-regulated apple effect
markers (Ctrl-apple effect markers) are separated from
each other in the loadings plot (Fig. 1, colored marker
groups). The single feature that contributes most strongly
to distinguish the apple samples from the other samples is
highlighted as #1 in the loading plot of Fig. 1, and its
analytical pattern across the 24 samples is shown in the
upper right insert. Despite its clear response behavior this
feature was not selected as a potential exposure marker by
our present criteria due to several non-zero values in the
control group. Several other features with similar charac-
teristics appear in the dataset, but will not be the target for
this present investigation.
3.2 Identification and interpretation of markers
In the following the markers identified to date (listed in
Table 1) will be discussed with regard to their origin and
metabolism. Only the markers verified with an authentic
standard will be discussed in details whereas the tentatively
identified markers (markers in italic font in Table 1) will
only be discussed to a very limited extent.
Quinic acid andm-coumaric acid were found as exposure
markers for apple intake, in good consistency with the
presence of these compounds or their precursors in fresh
apple. The excreted quinic acid may originate directly from
quinic acid in the apple, where it is a key intermediate in the
biosynthesis of aromatic compounds (Humle 1956). It may
also in part originate from gut microbial degradation of
chlorogenic acid (Gonthier et al. 2003). This compound has
been quantified by HPLC-analysis of fresh apple material
from the same batch of Shampion apples used in the present
study at a level of approximately 70 mg/kg (data to be
published elsewhere). m-Coumaric acid derives from gut
microbial dehydroxylation of caffeic acid, another chloro-
genic acid metabolite. In previous targeted investigations
(Mennen et al. 2006) a correlation between apple con-
sumption and urinary excretion of m-coumaric acid was
reported. A rat metabolism study by Gonthier et al. (2003)
indicated that the quinic acid moiety in chlorogenic acid is
the major precursor of hippuric acid. Hippuric acid is
formed by aromatization of quinic acid into benzoic acid by
the gut microbiota and subsequent conjugation with glycine
in the liver and kidney. Figure 3 illustrates these described
formations of quinic acid, m-coumaric acid and hippuric
acid from chlorogenic acid. Hippuric acid is formed by
many other microbial metabolic routes and is also present as
an identified effect marker in our data with higher response
in the apple group compared to the control group. The
tentative identification of 3-hydroxyhippuric acid as an
apple effect marker could indicate that this is another
metabolite derived from chlorogenic and caffeic acids,
although it may also have an origin from microbial degra-
dation of e.g., dietary catechin and epicatechin (de Pascual-
Teresa et al. 2010). The presence of hippuric acid and
3-hydroxyhippuric acid as effect markers may also indicate
a higher efficacy of specific metabolic pathways of the gut
microbiota and of the host glycine conjugation system. An
effect on the composition of the gut microbiota in the
present study is therefore indicated and in accordance with
previously published findings (Licht et al. 2010).
We also found an apple exposure marker at the retention
time of (-)epicatechin (=1.78 min) with a m/z value of
139.0397 corresponding to the retro-Diels-Alder fragmen-
tation pattern that usually occurs when performing MS
analysis of flavan-3-ols (Shaw and Griffiths 1980). The
detected marker derives from the A-ring of epicatechin and
this parent molecule was not itself detected as a feature but
its mass peak was visible when inspecting mass spectra
from the apple group. Epicatechin and its isomer catechin
are well-known components in apple and unlike most other
flavonoids, catechins are not in a glycosylated form in the
source material (Escarpa and Gonzalez 1998). Only a
minor part of ingested catechins are thought to be present
in the circulation and excreted as the unconjugated form
since these compounds are primarily glucuronidated in the
enterocytes after absorption and even often further deglu-
curonidated and methylated and/or re- glucuronidated or
sulphated in the liver before excretion (Donovan et al.
2001). Accordingly, we found the epicatechin glucuronide
and catechin glucuronide among our exposure markers
although the retention times (and positions of glucoronide
groups) of these markers are not verified due to lack of
commercial standards. However, as expected, their elution
time is prior to the elution time of their unconjugated forms
(catechin = 1.68 min and epicatechin = 1.78 min) and
their fragmentation pattern is comparable to what is
observed in a targeted MS/MS experiments with these
compounds (Schroeter et al. 2006). Methyl epicatechin was
also tentatively identified with a longer retention time than
epicatechin and a retro-Diels-Alder fragmentation pattern
confirming its identity. The metabolite, dihydroxyphenyl-c-valerolactone, was also tentatively identified and this
compound has earlier been identified as a major human
urinary metabolite after intake of (-)-epicatechin and this
lactone metabolite appears to be produced by intestinal
microorganisms (Li et al. 2000).
The metabolites we have identified as pectin markers are
compounds that have not earlier been linked with pectin or
other fibre products.
Pyrrole-2-carboxylic acid was identified as an exposure
marker of pectin intake by a convincing fit of isotope and
LC–MS metabolomics markers of apple and pectin intake
123

fragmentation patterns and by co-elution of an authentic
standard. Figure 4 shows an extracted ion chromatogram
and mass spectrum with pyrrole-2-carboxylic acid. The
compound has previously been found in rat and human
urine after administration of the D-isomers of hydroxy-
proline and its biotransformation to pyrrole-2-carboxylic
Table 1 Summary of identified metabolites
Metabolite Molecular
formula
Theoretical
monoisotopic
mass
Measured
mass (±)aFragments
(atom loss)
RT time
(min)
Difference in mean
response between control
and apple/pectin group (:;)b,relative intensity
Apple exposure markers
Quinic acid C7H12O6 192.0634 191.0555 (-) – 0.641 251 (:)
m-Coumaric acid C9H8O3 164.0473 163.0393 (-) 147.0446 (–O)
119.0497 (–CO2)
2.227 209 (:)
(-)-Epicatechin C15H14O6 290.0790 291.0876 (?) 139.0397c (–C8H8O3) 1.779 57 (:)
Epicatechin glucuronide C21H22O12 466.1111 465.1045 (-) 137.0238 (–C14H16O9)
175.0243 (–C15H14O6)
297.0613 (–C8H8O4)
1.671 33 (:)
Methyl epicatechin C16H16O6 304.0947 305.1008 (?) 139.0395 (–C9H10O3) 2.031 47 (:)
Dihydroxyphenyl-c-valerolactone
C11H12O4 208.0735 209.0799 (?) 123.0446 (–C4H6O2) 1.735 313 (:)
Catechin glucuronide C21H22O12 466.1111 465.1043 (-) 137.0239 (–C14H16O9)
175.0242 (–C15H14O6)
297.0610 (–C8H8O4)
1.578 202 (:)
Apple effect markers
Hippuric acid C8H9NO 179.0582 178.0498 (-) 134.0606d (–CO2)
77.0395 (–C3H3NO3)
1.893 1941 (:)
3-Hydroxyhippuric acid C9H9NO4 195.0532 196.0633 (?) 136.0408 (–C2H4O2) 1.579 22 (:)
3-Methoxy-4-hydroxyphenylethyleneglycol sulfate
C9H10O6S 264.0304 245.0108e (-) 79.9569 (–C9H11O4)
163.0392 (–H4O4S)
1.761 25469 (:)
Homovanillic acid sulfate C9H10O7S 262.0147 261.0079 (-) 79.9572 (–C9H8O4)
181.0510 (–O3S)
1.454 158 (:)
Metanephrine C10H15NO3 197.1052 198.1132 (?) 165.0527 (–CH7N)
137.0615 (–C2H7NO)
2.493 31 (;)
3-Methylglutaconic acid C6H8O4 144.0422 143.0351 (-) 111.0091 (–CH4O)
99.0446 (–CO2)
1.389 52 (;)
Pectin exposure markers
Pyrrole-2-carboxylic acid C5H5NO2 111.0320 110.0244 (-) 66.0349 (–CO2) 1.606 91 (:)
2-Furoylglycine C7H7NO4 169.0375 168.0314 (-) 74.0242 (–C5H2O2) 1.523 57 (:)
Pectin effect markers
2-Piperidinone C5H9NO 99.0684 100.0758 (?) 84.0800 (–O) 1.373 24 (:)
Hydroxyphenylacetylglycine
C10H11NO4 209.0688 210.0762 (?) 76.0385 (–C8H6O2)
109.0654 (–C3H3NO3)
137.0591 (–C2H3NO2)
1.516 45 (:)
3-Methoxytyrosine C10H13NO4 211.0845 210.0769 (-) 137.0600 (C2H3NO2) 2.391 66 (:)
Names in italics refer to compound identifications that are highly probable due to isotope- and fragmentation pattern, however not verified by an
authentic standarda Positive (?) or negative (-) ionisation modeb Up- or down-regulated response of markerc Retro-Diels-Alder MS-fragment which is found as the marker iond 2-Phenylacetamide, a well-known dautherion of hippuric acid and the one found as markere Water loss
M. Kristensen et al.
123

acid is thought to be catalyzed by D-amino acid oxidase in
the kidney (Heacock and Adams 1974, 1975). Apple fruit
tissue contains readily soluble glycoproteins, rich in
hydroxyproline (Knee 1973) which trail pectin in the
industrial extraction and purification process of apple
pectin (Kravtchenko et al. 1992). The rats in the pectin
group will therefore have a high exposure to hydroxypro-
line with subsequent metabolite production of pyrrole-2-
carboxcylic acid. To the best of our knowledge no previous
studies with food-related interventions have reported on the
existence of this metabolite in urine or any other biofluids.
Since pyrrole-2-carboxcylic acid is either formed in the
colon by microbes or in the kidneys, the main metabolite
circulating after hydoxyproline intake may either be hy-
droyproline itself or pyrrole-2-carboxcylic acid.
2-Furoylglycine was also identified as a pectin exposure
marker by the use of an authentic standard and we could
identify a glycine fragment (74.0242 m/z) at the same
retention time. 2-Furoylglycine is an acyl glycine and an
earlier uncontrolled study showed presence of this metab-
olite in urine of 20 normal adults (Pettersen and Jellum
1972). To detect if the precursors of this compound was of
exogenous dietary origin these authors also provided a
male adult with a simple synthetic diet (tripalmin, triolein,
sucrose and water) for 3 days. No 2-furoylglycine was
detected in the urine after 2 days but the compound reap-
peared when an ordinary diet was reintroduced. From these
findings it was suggested that furan derivatives or their
precursors were introduced into food by cooking when
reduced sugars are heated in the presence of free amino
Fig. 3 Formation pathway of
m-coumaric acid, quinic acid
and hippuric acid. Structures
drawn in ACD/ChemSketch ver.
12.0 (www.acdlabs.com)
Fig. 4 Extracted ion chromatogram of pyrrole-2-carboxylic acid and mass spectrum of the peak with retention time at 1.61 min
LC–MS metabolomics markers of apple and pectin intake
123

groups. Purified apple pectin carries a lot of neutral sugar
molecules and some proteins (Kravtchenko et al. 1992) and
the same Maillard reaction may happen either during the
industrial pectin extraction procedure where the apple
pomace is boiled in hot acid or during the hot drying
process giving rise to furan derivatives such as furfural (2-
furanaldehyde). An alternative explanation is that furfural
which is naturally present in apple and apple products have
affinity for pectin and may be concentrated with the pectin
fraction during industrial processing. Further investigations
are needed to identify the exact source of the 2-furane-
precursor in pectin and to ascertain whether it is specific to
pectin intake. 2-Furoylglycine has been found previously to
be the primary urinary metabolite in rats after oral
administration of furfural and furfuryl alcohol. The latter
appears to be oxidised to furfural which is further oxidised
to furoic acid (Nomeir et al. 1992). Furoic acid is conju-
gated with glycine to form 2-furoylglycine by the enzyme
acyl-CoA:glycine N-acyltransferase, which is located in the
mitochondria of liver and kidney tissue (Knights et al.
2007). In this study we identified other acyl glycines that
have been conjugated in the same way; hippuric acid,
3-hydroxyhippuric acid and hydroxyphenylacetylglycine.
The last two have not been verified by authentic standards
but glycine fragments were observed in the raw data at
their specific retention times indicating the expected
fragmentation.
2-Piperidinone was identified as an up-regulated effect
marker of pectin intake in this study. To the best of our
knowledge no previous studies have reported on the exis-
tence of this metabolite in urine or blood. The compound
has been identified in a forensic study in the decomposition
fluids from pig carcasses (Swann et al. 2010). 2-Piperidi-
none was also found in the anal sac secretions of different
animals and it was discussed that this compound could be
formed by the elimination of water from the precursor
5-aminovaleric acid by microbial fermentation processes
(Albone et al. 1976; Burger et al. 2001). However, from the
studies conducted to date it is not possible to decide if
2-piperidinone or its precursors are of dietary origin or is
exclusively an endogenous or microbial metabolite. We
have previously shown that pectin in this study caused a
marked change in the caecum microbiota (Licht et al.
2010). We are currently investigating the relationships
between these changes and the metabolomic patterns in
fecal water and urine.
Among the effect markers that we have tentatively iden-
tified there are several catecholamine metabolites (3-meth-
oxy-4-hydroxyphenylethyleneglycol sulphate, homovanillic
acid sulphate, metanephrine, hydroxyphenylacetylglycine
and methoxytyrosine) indicating changes in the hormonal
metabolism or in metabolite transport after the apple and
pectin diets. The identities of these markers seem likely with
respect to accurate mass, elemental composition and frag-
ment patterns but no coelution experiments with pure stan-
dards have been performed, again due to lack of commercial
standards. Firm conclusions will therefore have to await the
confirmation of an effect of apple intake on the excretion of
these hormonal effector compounds.
3.3 Importance of markers for other studies
In the variable selection procedure we distinguish between
potential exposure and effect markers based on zero values
or a constant baseline level. However, without unambigu-
ous identification of the markers it cannot be ruled out that
potential exposure markers are in reality effect markers and
vice versa. This investigation applied a threshold level in
the data extraction step in order to eliminate too much
noise in the data. Without the threshold the dataset will be
too large and unmanageable. If a true effect marker has a
response that is lower than the threshold level this will
appear as zeros in the data set and it will mistakenly be
classified by our selection procedure as an exposure mar-
ker. The identification of a number of potential exposure
and effect markers gives us an opportunity to evaluate
whether the pattern-based classification leads to biologi-
cally plausible results and points to markers, which might
serve as true exposure and effect markers. While the apple
exposure markers are likely metabolites of apple compo-
nents and therefore most likely markers of apple or fruit/
vegetables in general, they would also be affected by the
metabolic capacity of the exposed subject and might
therefore show a more variable response in other species
and particularly in humans. They might therefore also have
features that make them markers of effects such as meta-
bolic capacity or genetic polymorphisms. The pectin
exposure markers could potentially be markers of food
contaminant exposures or they may be seen as effect
markers, i.e., products of specific microorganisms, which
increase with pectin consumption. For all exposure markers
proper validation studies with human volunteers would
therefore be needed before these markers can be used in
e.g., observational studies. In analogy some effect markers
may be wrongly classified if they are markers of dietary
components existing at different levels in both the control
and the apple or pectin groups, as observed in the case of
hippuric acid. However, this marker may also be seen as an
effect of diet on the metabolic capacity of the microbiota
and of the endogenous glycine-conjugation systems, so
classification as an effect marker is not altogether mis-
leading. So the classification into exposure and effect
markers would depend on the biological system investi-
gated. Nevertheless, for the qualitative grading of markers,
our classification was effective and has eased the system-
atization and interpretation of unknown compounds.
M. Kristensen et al.
123
4 Conclusion
By applying an untargetedMS-basedmetabolomics approach
it has been demonstrated that intake of apple and apple pectin
has a high impact on the urinary metabolome. Numerous
potential exposure and effect markers of apple and apple-
pectin intake have been found and several new apple-related
urinarymetabolites have been identified in this study.Most of
these excreted metabolites are products of diverse metabolic
pathways including phase II glucuronidation, glycine-conju-
gation and/or microbial metabolism and a combination of
several of the markers recorded in this rat study could ease
identification of more robust exposure biomarkers for human
studies. Additionally, the markers identified in this study
should shed new light on health interpretations of fruit intake
in previous as well as future conducted studies. The explor-
ative top-down metabolomics approach employing a division
into potential effect and exposure markers was effective for
the rat study and seems promising as a tool in formation ofnew
ideas, however, the classification of markers has to be vali-
dated in subsequent human studies.
Acknowledgments This work was funded by the European Com-
mission (ISAFRUIT) under the Thematic Priority 5-Food Quality and
Safety of the 6th Framework Programme of RTD (Contract no. FP6-
FOOD-CT-2006-016279).
References
Ahrens, F., Hagemeister, H., Pfeuffer, M., & Barth, C. A. (1986).
Effects of oral and intracecal pectin administration on blood
lipids in minipigs. Journal of Nutrition, 116, 70–76.Albone, E. S., Robins, S. P., & Patel, D. (1976). 5-Aminovaleric acid,
a major free amino acid component of the anal sac secretion of
the red fox, Vulpes vulpes. Comparative Biochemistry andPhysiology B, 55, 483–486.
Aprikian, O., Busserolles, J., Manach, C., et al. (2002). Lyophilized
apple counteracts the development of hypercholesterolemia,
oxidative stress, and renal dysfunction in obese Zucker rats.
Journal of Nutrition, 132, 1969–1976.Aprikian, O., Duclos, V., Guyot, S., et al. (2003). Apple pectin and a
polyphenol-rich apple concentrate are more effective together
than separately on cecal fermentations and plasma lipids in rats.
Journal of Nutrition, 133, 1860–1865.Aprikian, O., Levrat-Verny, M. A., Besson, C., Busserolles, J.,
Rampsy, C., & Demigne, C. (2001). Apple favourably affects
parameters of cholesterol metabolism and of anti-oxidative
protection in cholesterol-fed rats. Food Chemistry, 75, 445–452.Backstrom, D., Moberg, M., Sjoberg, P. J., Bergquist, J., &
Danielsson, R. (2007). Multivariate comparison between peptide
mass fingerprints obtained by liquid chromatography-electro-
spray ionization-mass spectrometry with different trypsin diges-
tion procedures. Journal of Chromatography. A, 1171, 69–79.Bazzano, L. A., He, J., Ogden, L. G., et al. (2002). Fruit and vegetable
intake and risk of cardiovascular disease in US adults: The first
National Health and Nutrition Examination Survey Epidemiol-
ogic Follow-up Study. American Journal of Clinical Nutrition,76, 93–99.
Bijlsma, S., Bobeldijk, I., Verheij, E. R., et al. (2006). Large-scale
human metabolomics studies: A strategy for data (pre-)
processing and validation. Analytical Chemistry, 78, 567–574.Burger, B. V., Smit, D., Spies, H. S., et al. (2001). Mammalian
exocrine secretions XV. Constituents of secretion of ventral
gland of male dwarf hamster, Phodopus sungorus sungorus.
Journal of Chemical Ecology, 27, 1259–1276.de Pascual-Teresa, S., Moreno, D. A., & Garcı́a-Viguera, C. (2010).
Flavanols and anthocyanins in cardiovascular health: A review
of current evidence. International Journal of Molecular Sci-ences, 11, 1679–1703.
Donovan, J. L., Crespy, V., Manach, C., et al. (2001). Catechin is
metabolized by both the small intestine and liver of rats. Journalof Nutrition, 131, 1753–1757.
Escarpa, A., & Gonzalez, M. C. (1998). High-performance liquid
chromatography with diode-array detection for the determination
of phenolic compounds in peel and pulp from different apple
varieties. Journal of Chromatography. A, 823, 331–337.Gonthier, M. P., Verny, M. A., Besson, C., Remesy, C., & Scalbert,
A. (2003). Chlorogenic acid bioavailability largely depends on
its metabolism by the gut microflora in rats. Journal of Nutrition,133, 1853–1859.
Heacock, A. M., & Adams, E. (1974). Formation and excretion of
pyrrole-2-carboxylate in man. Journal of Clinical Investigations,54, 810–818.
Heacock, A. M., & Adams, E. (1975). Formation and excretion of
pyrrole-2-carboxylic acid. Whole animal and enzyme studies in
the rat. Journal of Biological Chemistry, 250, 2599–2608.Humle, A. C. (1956). Shikimic acid in apple fruits. Nature, 178,
991–992.
Knee, M. (1973). Polysaccharides and glycoproteins of apple fruit cell
walls. Phytochemistry, 12, 637–653.Knights, K. M., Sykes, M. J., & Miners, J. O. (2007). Amino acid
conjugation: Contribution to the metabolism and toxicity of
xenobiotic carboxylic acids. Expert Opinion Drug MetabolismToxicology, 3, 159–168.
Kravtchenko, T. P., Voragen, A. G. J., & Pilnik, W. (1992).
Analytical comparison of 3 industrial pectin preparations.
Carbohydrate Polymers, 18, 17–25.Li, C., Lee, M. J., Sheng, S., et al. (2000). Structural identification of
two metabolites of catechins and their kinetics in human urine
and blood after tea ingestion. Chemical Research in Toxicology,13, 177–184.
Licht, T. R., Hansen, M., Bergstrom, A., et al. (2010). Effects of apples
and specific apple components on the cecal environment of
conventional rats: Role of apple pectin.BMCMicrobiology, 10, 13.Liu, S., Manson, J. E., Lee, I. M., et al. (2000). Fruit and vegetable
intake and risk of cardiovascular disease: The Women’s Health
Study. American Journal of ClinicalNutrition, 72, 922–928.Mennen, L. I., Sapinho, D., Ito, H., et al. (2006). Urinary flavonoids
and phenolic acids as biomarkers of intake for polyphenol-rich
foods. British Journal of Nutrition, 96, 191–198.Nielsen, N. J., Tomasi, G., Frandsen, R. J. N., et al. (2010). A pre-
processing strategy for liquid chromatography time-of-flight
mass spectrometry metabolic fingerprinting data. Metabolomics,6, 341–352.
Nomeir, A. A., Silveira, D. M., McComish, M. F., & Chadwick, M.
(1992). Comparative metabolism and disposition of furfural and
furfuryl alcohol in rats. Drug Metabolism and Disposition, 20,198–204.
Pettersen, J. E., & Jellum, E. (1972). The identification and metabolic
origin of 2-furoylglycine and 2, 5-furandicarboxylic acid in
human urine. Clinical Chimica Acta, 41, 199–207.Scholz, M., Gatzek, S., Sterling, A., Fiehn, O., & Selbig, J. (2004).
Metabolite fingerprinting: Detecting biological features by inde-
pendent component analysis. Bioinformatics, 20, 2447–2454.
LC–MS metabolomics markers of apple and pectin intake
123

Schroeter, H., Heiss, C., Balzer, J., et al. (2006). (-)-Epicatechin
mediates beneficial effects of flavanol-rich cocoa on vascular
function in humans. Proceedings of the National Academy ofScience of the USA, 103, 1024–1029.
Shaw, I. C., & Griffiths, L. A. (1980). Identification of the major
biliary metabolite of (?)-catechin in the rat. Xenobiotica, 10(12),905–911.
Swann, L., Chidlow, G. E., Forbes, S., & Lewis, S. W. (2010).
Preliminary studies into the characterization of chemical markers
of decomposition for geoforensics. Journal of Forensic Science,55, 308–314.
Trautwein, E. A., Rieckhoff, D., Kunath-Rau, A., & Erbersdobler, H. F.
(1998). Psyllium, not pectin or guar gum, alters lipoprotein and
biliary bile acid composition and fecal sterol excretion in the
hamster. Lipids, 33, 573–582.Yamada, K., Tokunaga, Y., Ikeda, A., et al. (2003). Effect of dietary
fiber on the lipid metabolism and immune function of aged
Sprague-Dawley rats. Bioscience, Biotechnology, and Biochem-istry, 67, 429–433.
M. Kristensen et al.
123
Related Documents