NUSInvest Workshop Series Session Two Candlesticks Patterns

NUSInvest Workshop Series Session Two Candlesticks Patterns.
Dec 18, 2015
Welcome message from author
This document is posted to help you gain knowledge. Please leave a comment to let me know what you think about it! Share it to your friends and learn new things together.
Transcript
NUSInvest Workshop Series
Session Two
Candlesticks Patterns

NUS Students’ Investment Society
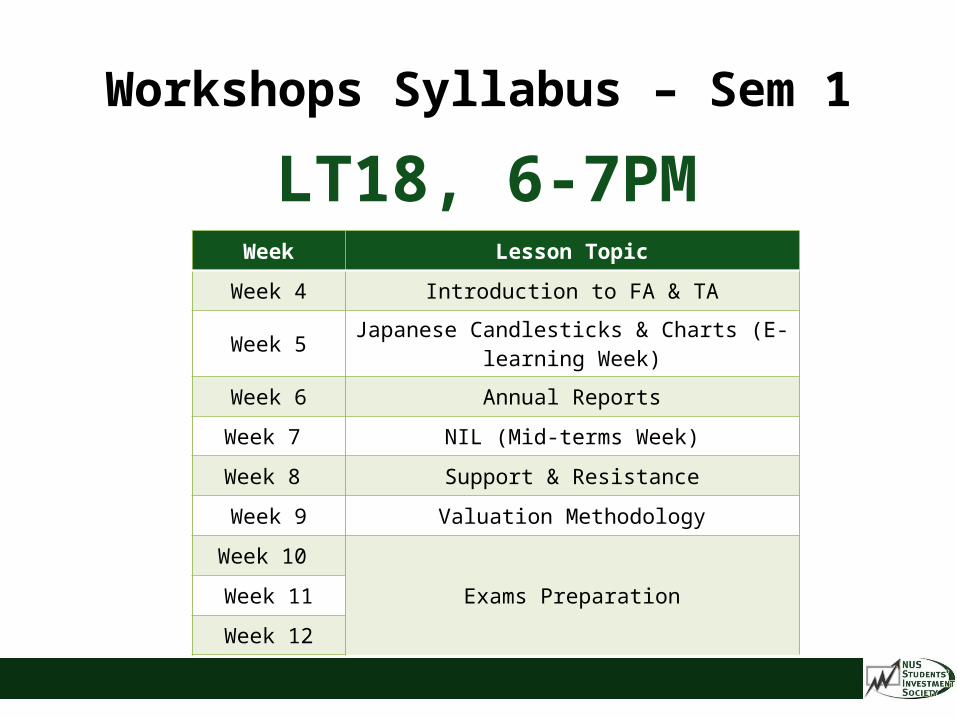
Workshops Syllabus – Sem 1
LT18, 6-7PMWeek Lesson Topic
Week 4 Introduction to FA & TA
Week 5 Japanese Candlesticks & Charts (E-learning Week)
Week 6 Annual Reports
Week 7 NIL (Mid-terms Week)
Week 8 Support & Resistance
Week 9 Valuation Methodology
Week 10
Exams PreparationWeek 11
Week 12
PROFILE
• NUS Invest Research Analyst, Acting FA Director
• Year 2 BBA (Finance)
• First trading experience in 2010
• Does both FA & TA, mostly FA
DISCLOSURES & DISCLAIMERSThis research material has been prepared by NUS Invest.
NUS Invest specifically prohibits the redistribution of this material in whole or in part without the written permission of NUS Invest.
The research officer(s) primarily responsible for the content of this research material, in whole or in part, certifies that their views are accurately expressed and they will not receive direct or indirect compensation in exchange for expressing specific recommendations or views in this research material.
Nothing in this research material constitutes a representation that any investment strategy or recommendation contained herein is suitable or appropriate to a recipient’s individual circumstances or otherwise constitutes a personal recommendation. It is published solely for information purposes, it does not constitute an advertisement and is not to be construed as a solicitation or an offer to buy or sell any securities or related financial instruments.
No representation or warranty, either expressed or implied, is provided in relation to the accuracy, completeness or reliability of the information contained herein. The research material should not be regarded by recipients as a substitute for the exercise of their own judgement. Any opinions expressed in this research material are subject to change without notice.

Background
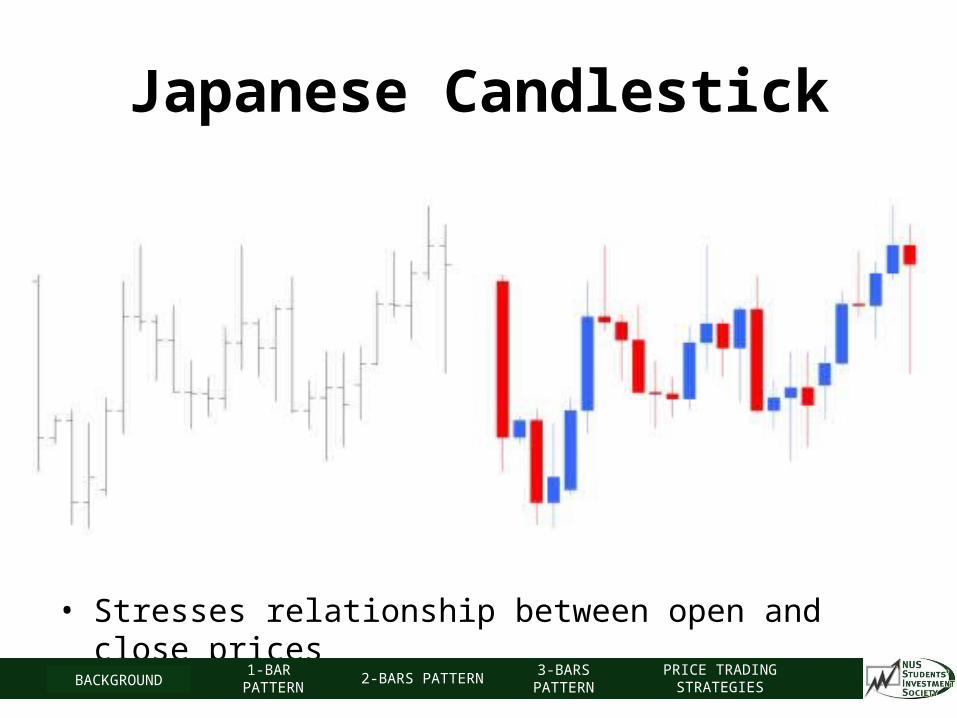
Japanese Candlestick
• Stresses relationship between open and close prices
BACKGROUND1-BAR
PATTERN2-BARS PATTERN
3-BARS PATTERN
PRICE TRADING STRATEGIES
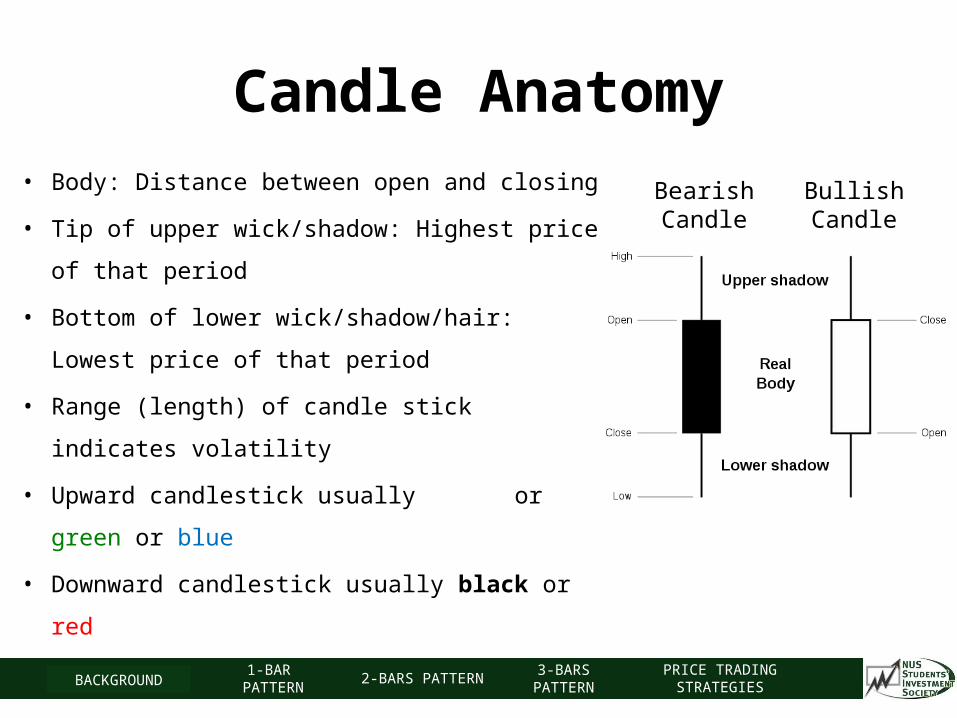
Candle Anatomy• Body: Distance between open and closing
• Tip of upper wick/shadow: Highest price of that
period
• Bottom of lower wick/shadow/hair: Lowest
price of that period
• Range (length) of candle stick indicates volatility
• Upward candlestick usually white or green or
blue
• Downward candlestick usually black or red
BullishCandle
BearishCandle
BACKGROUND1-BAR
PATTERN2-BARS PATTERN
3-BARS PATTERN
PRICE TRADING STRATEGIES
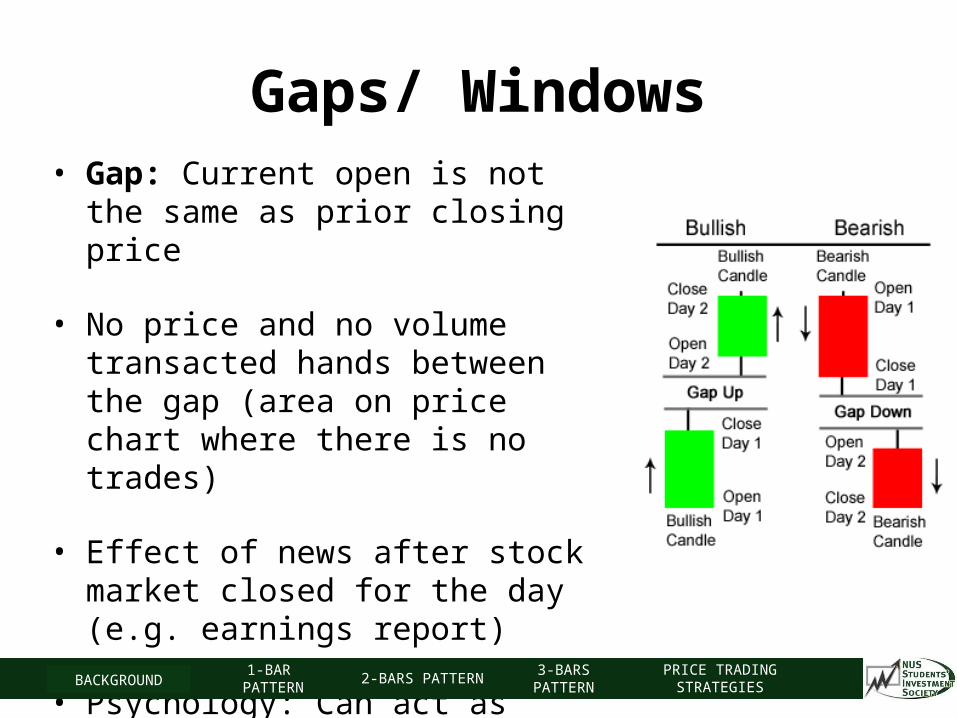
Gaps/ Windows• Gap: Current open is not the same as
prior closing price
• No price and no volume transacted hands between the gap (area on price chart where there is no trades)
• Effect of news after stock market closed for the day (e.g. earnings report)
• Psychology: Can act as resistance/ support (news that sparked the gap is still in play)
BACKGROUND1-BAR
PATTERN2-BARS PATTERN
3-BARS PATTERN
PRICE TRADING STRATEGIES
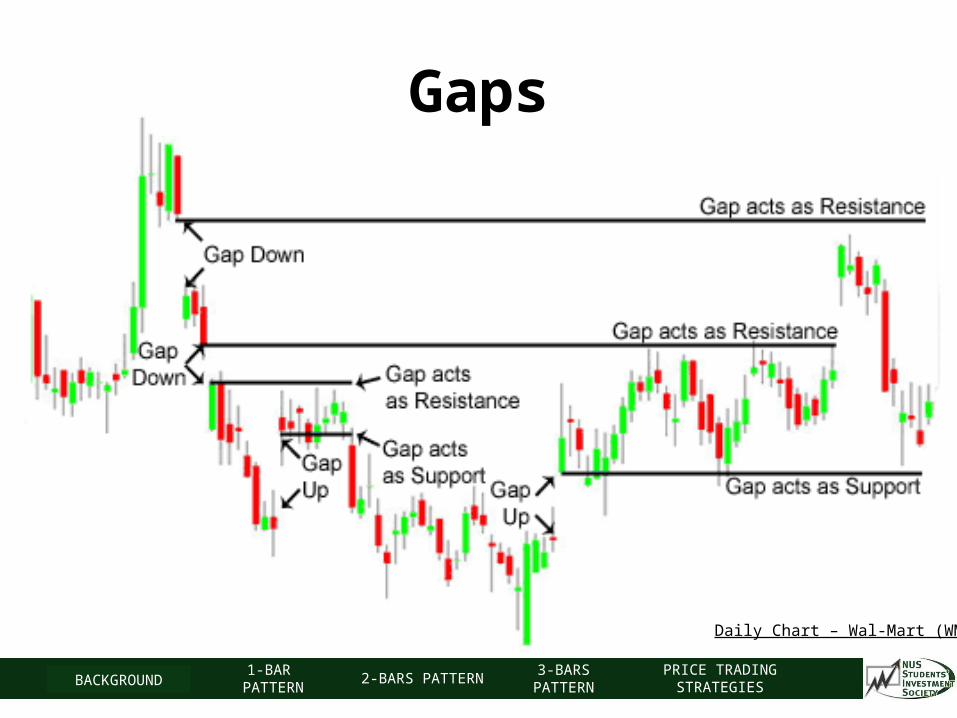
Daily Chart – Wal-Mart (WMT)
Gaps
BACKGROUND1-BAR
PATTERN2-BARS PATTERN
3-BARS PATTERN
PRICE TRADING STRATEGIES

1-Price Bar Patterns
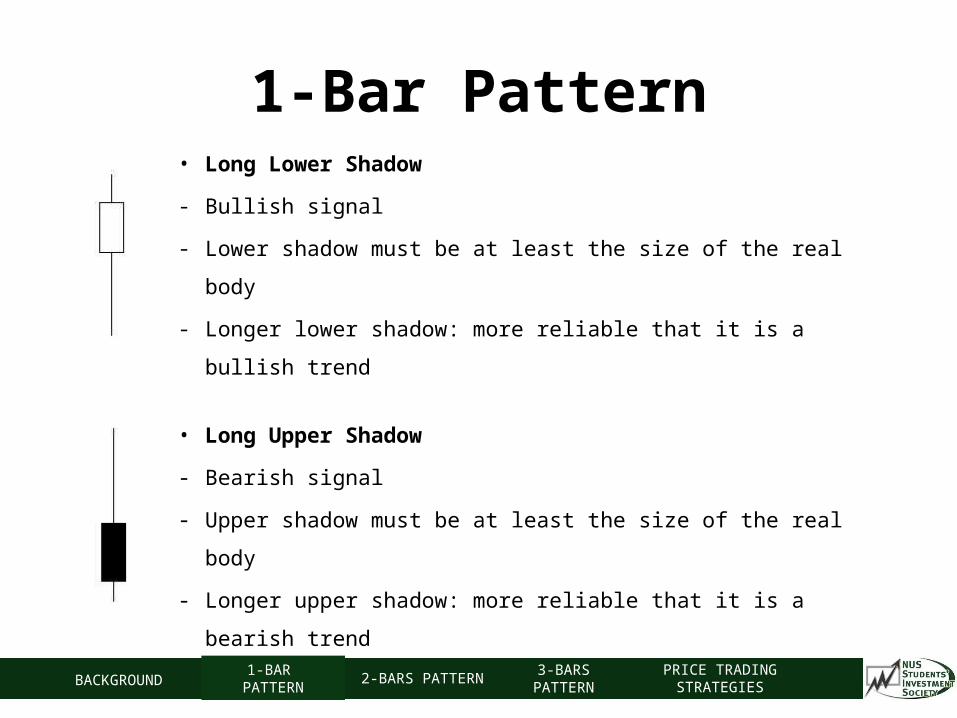
1-Bar Pattern• Long Lower Shadow
- Bullish signal
- Lower shadow must be at least the size of the real body
- Longer lower shadow: more reliable that it is a bullish trend
• Long Upper Shadow
- Bearish signal
- Upper shadow must be at least the size of the real body
- Longer upper shadow: more reliable that it is a bearish trend
BACKGROUND1-BAR
PATTERN2-BARS PATTERN
3-BARS PATTERN
PRICE TRADING STRATEGIES
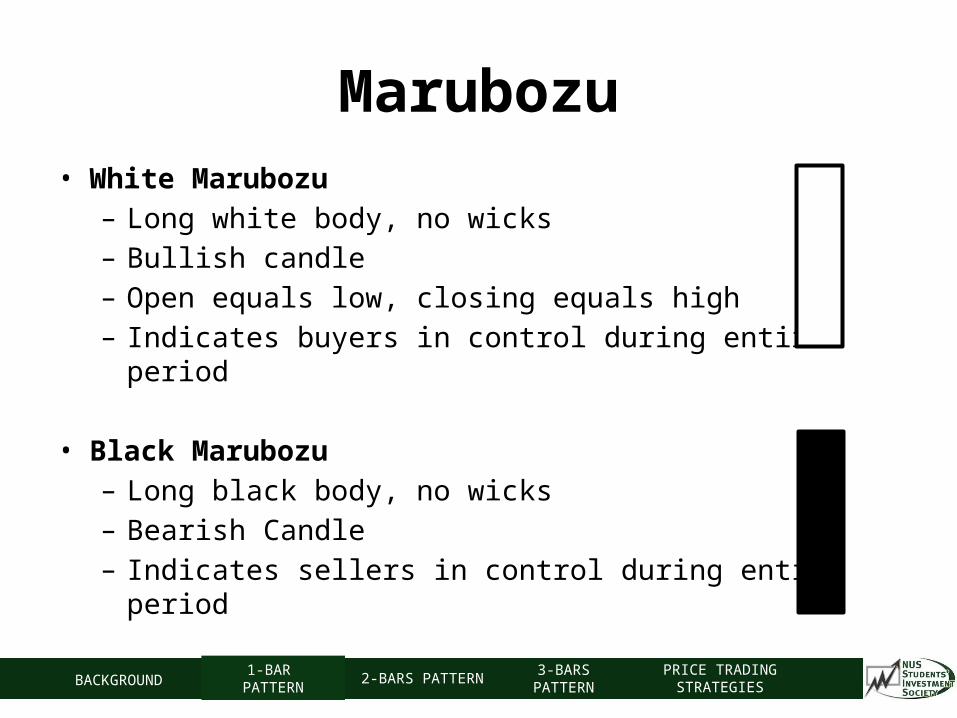
Marubozu• White Marubozu
– Long white body, no wicks– Bullish candle– Open equals low, closing equals high– Indicates buyers in control during entire period
• Black Marubozu– Long black body, no wicks– Bearish Candle– Indicates sellers in control during entire period
BACKGROUND1-BAR
PATTERN2-BARS PATTERN
3-BARS PATTERN
PRICE TRADING STRATEGIES
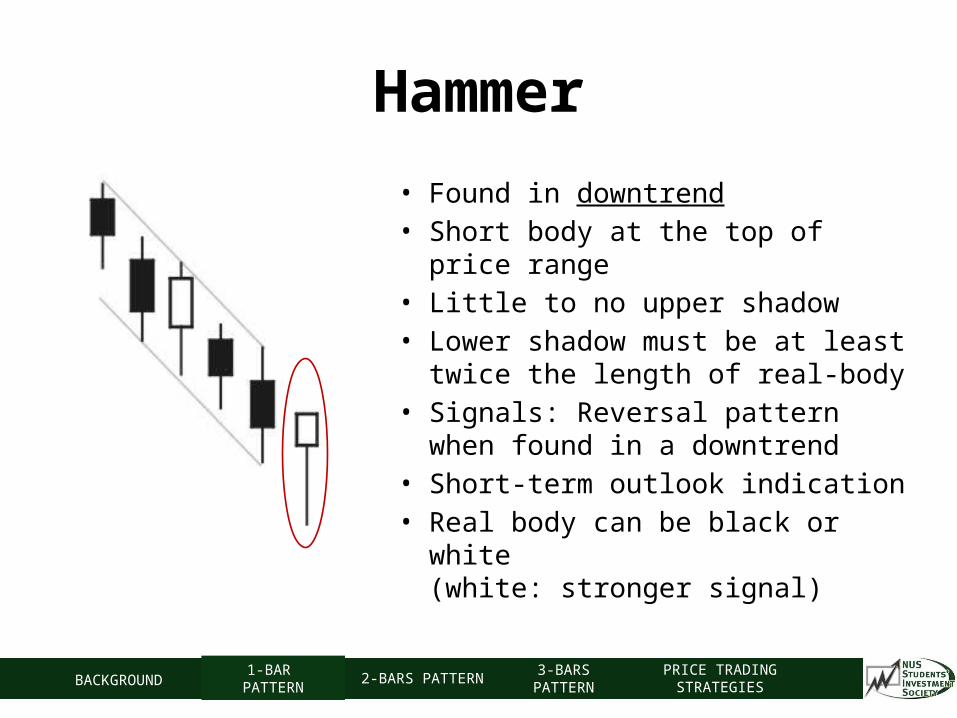
Hammer
• Found in downtrend• Short body at the top of price range• Little to no upper shadow• Lower shadow must be at least
twice the length of real-body• Signals: Reversal pattern when
found in a downtrend• Short-term outlook indication• Real body can be black or white
(white: stronger signal)
BACKGROUND1-BAR
PATTERN2-BARS PATTERN
3-BARS PATTERN
PRICE TRADING STRATEGIES
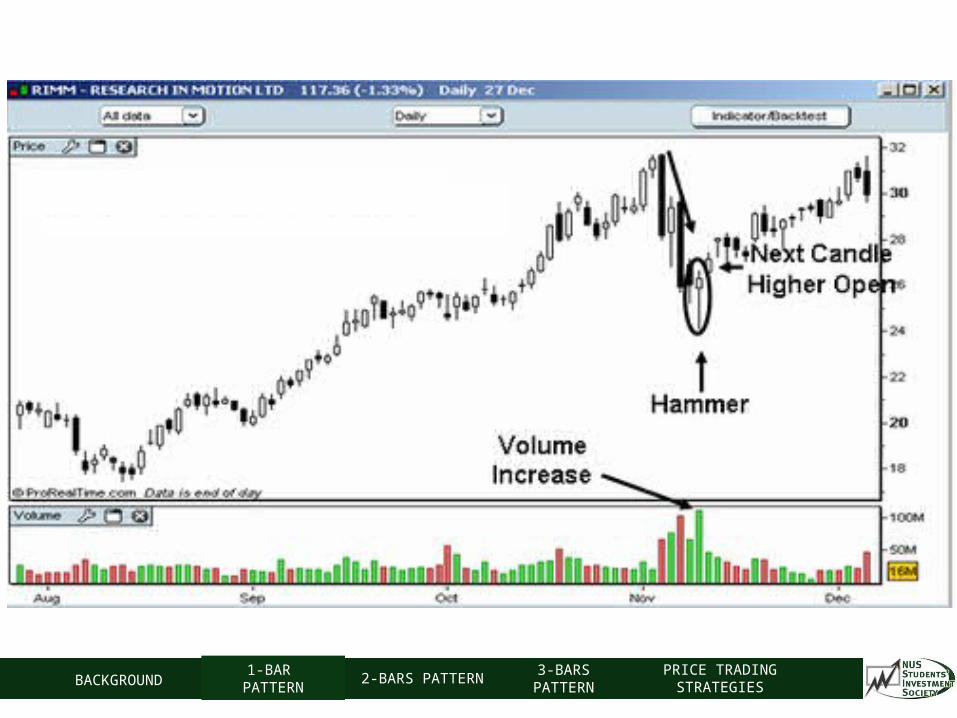
Hammer
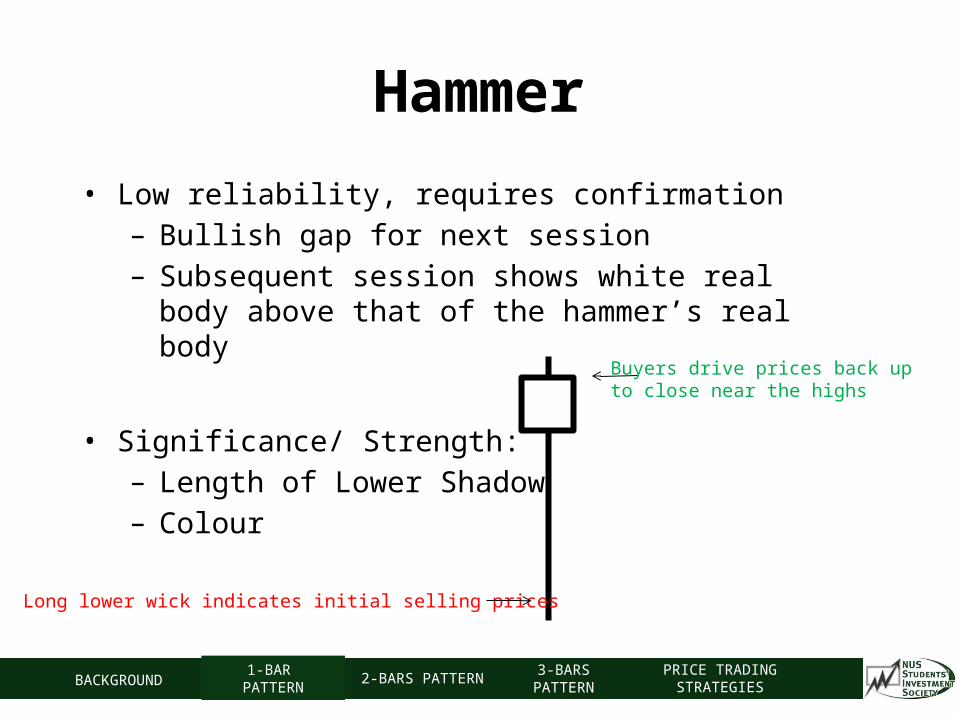
• Low reliability, requires confirmation– Bullish gap for next session– Subsequent session shows white real body above that of
the hammer’s real body
• Significance/ Strength:– Length of Lower Shadow– Colour
Long lower wick indicates initial selling prices
Buyers drive prices back upto close near the highs
BACKGROUND1-BAR
PATTERN2-BARS PATTERN
3-BARS PATTERN
PRICE TRADING STRATEGIES
BACKGROUND1-BAR
PATTERN2-BARS PATTERN
3-BARS PATTERN
PRICE TRADING STRATEGIES
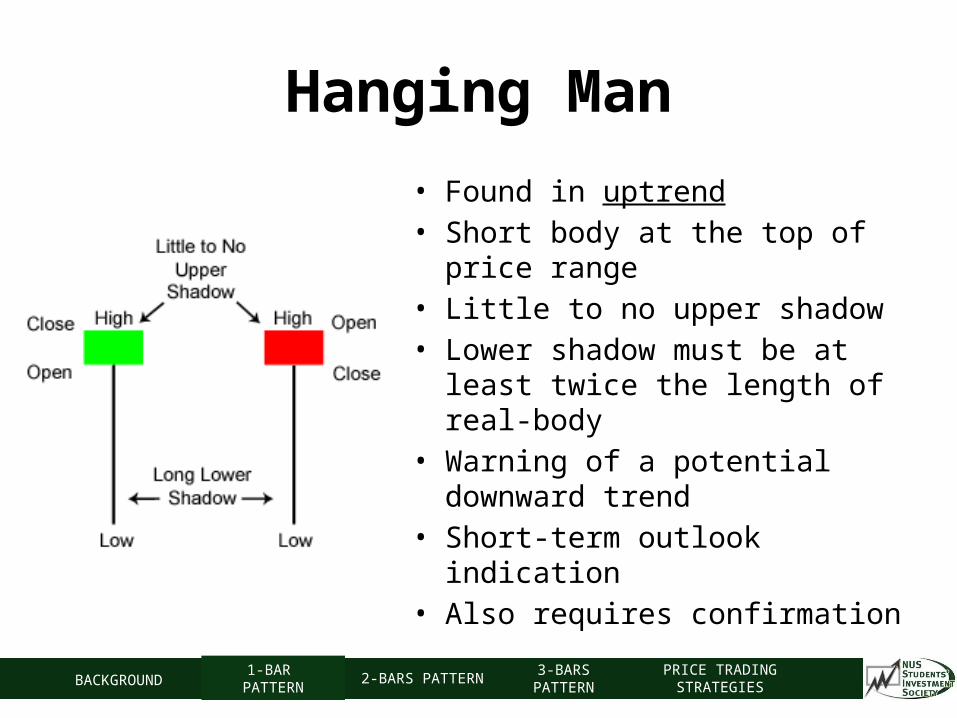
Hanging Man
• Found in uptrend• Short body at the top of price range• Little to no upper shadow• Lower shadow must be at least
twice the length of real-body• Warning of a potential downward
trend• Short-term outlook indication• Also requires confirmation
BACKGROUND1-BAR
PATTERN2-BARS PATTERN
3-BARS PATTERN
PRICE TRADING STRATEGIES
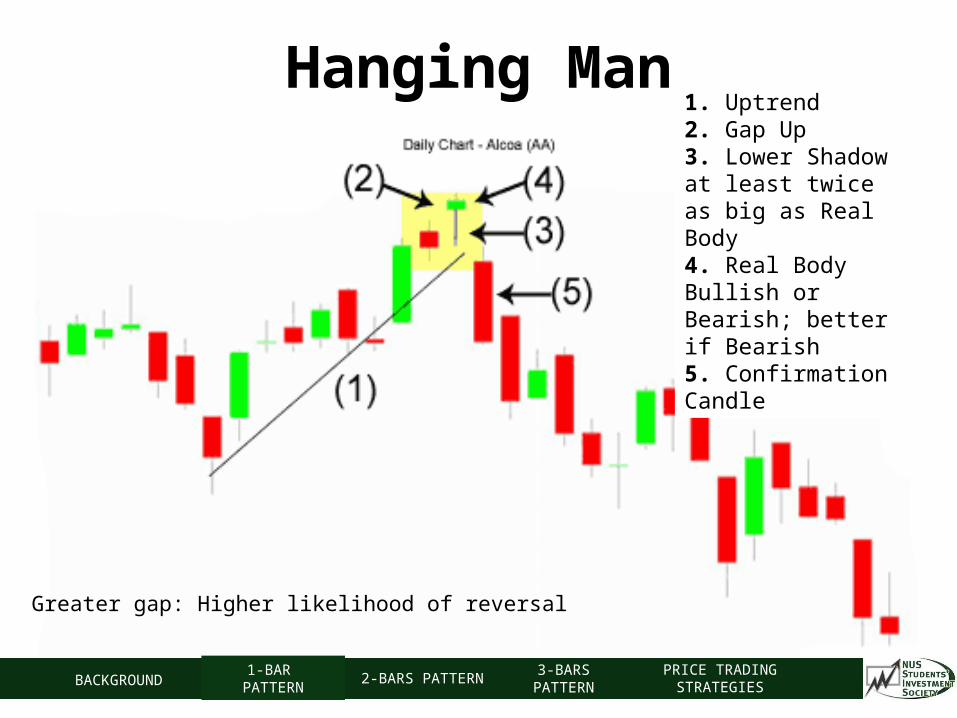
1. Uptrend2. Gap Up3. Lower Shadow at least twice as big as Real Body4. Real Body Bullish or Bearish; better if Bearish5. Confirmation Candle
Greater gap: Higher likelihood of reversal
Hanging Man
BACKGROUND1-BAR
PATTERN2-BARS PATTERN
3-BARS PATTERN
PRICE TRADING STRATEGIES
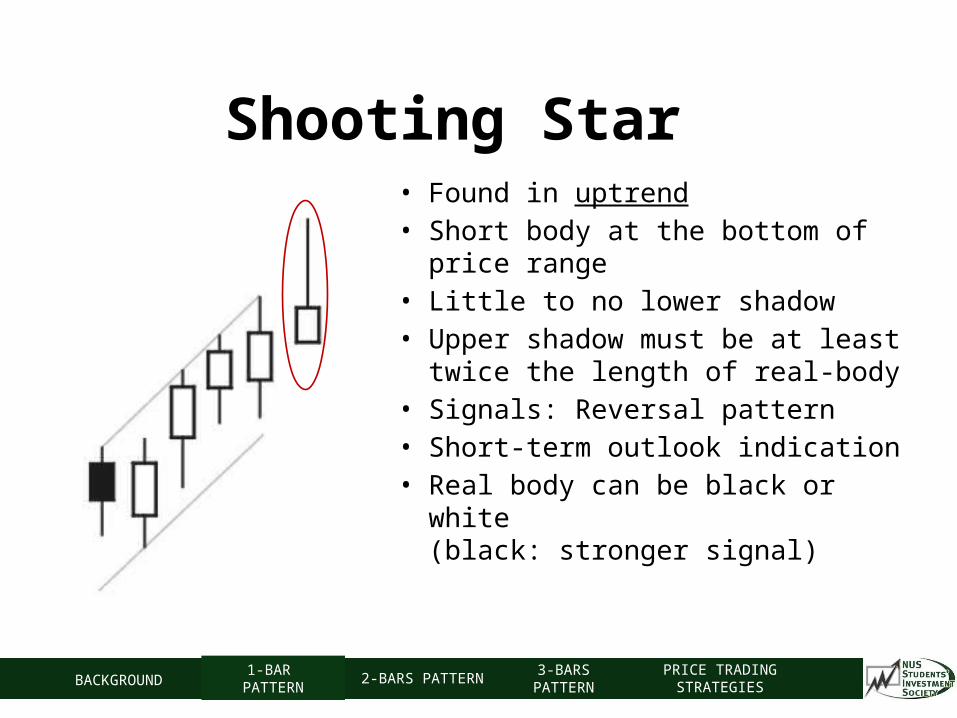
Shooting Star• Found in uptrend• Short body at the bottom of price
range• Little to no lower shadow• Upper shadow must be at least
twice the length of real-body• Signals: Reversal pattern• Short-term outlook indication• Real body can be black or white
(black: stronger signal)
BACKGROUND1-BAR
PATTERN2-BARS PATTERN
3-BARS PATTERN
PRICE TRADING STRATEGIES

Shooting Star• Low reliability, requires confirmation
– Bearish gap for next session– Subsequent session shows black real body below that of
the shooting star’s real body
• Significance/ Strength:– Length of Upper Shadow– Colour
Long upper wick indicatesinitial buying prices
Bears were able to rejectbulls completely (or push prices evenlower by closing below open)
Open
BACKGROUND1-BAR
PATTERN2-BARS PATTERN
3-BARS PATTERN
PRICE TRADING STRATEGIES
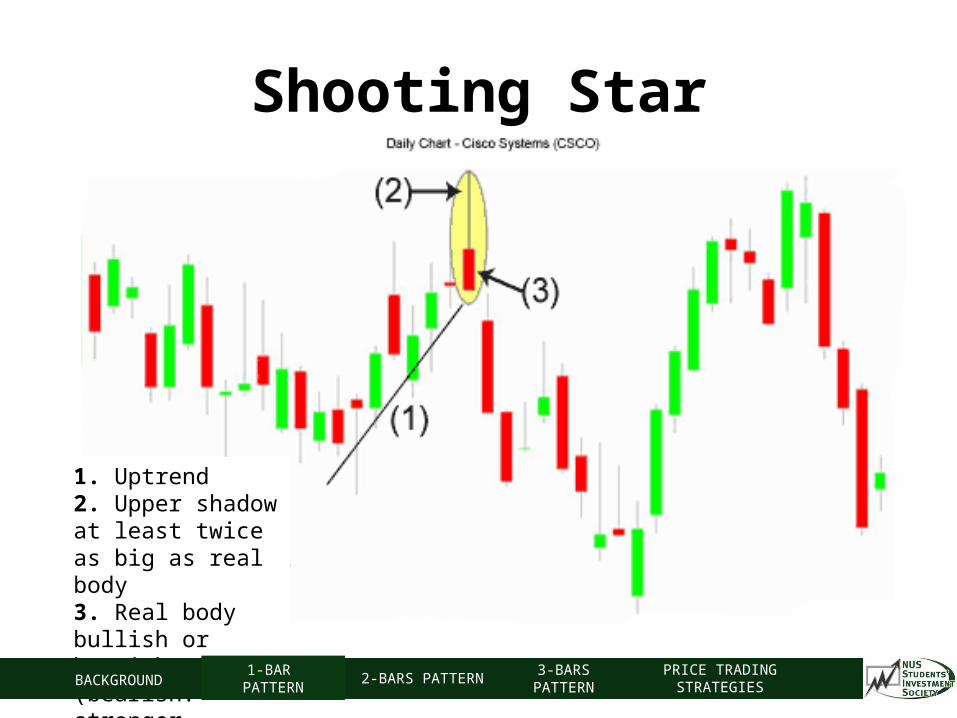
Shooting Star
1. Uptrend2. Upper shadow at least twice as big as real body3. Real body bullish or bearish (bearish: stronger indication)
BACKGROUND1-BAR
PATTERN2-BARS PATTERN
3-BARS PATTERN
PRICE TRADING STRATEGIES
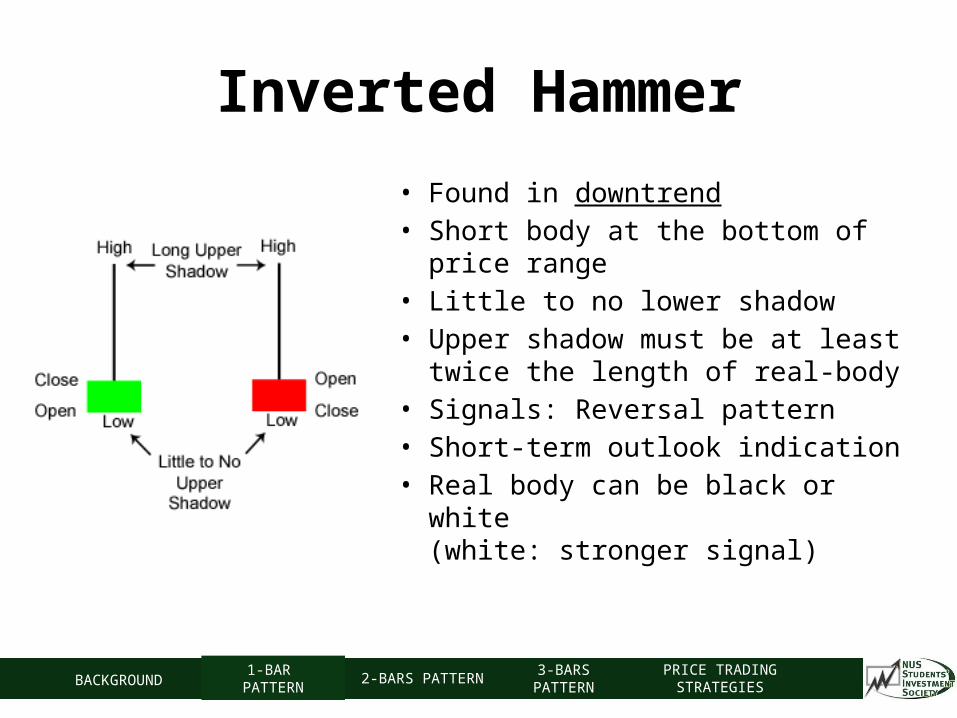
Inverted Hammer
• Found in downtrend• Short body at the bottom of price
range• Little to no lower shadow• Upper shadow must be at least
twice the length of real-body• Signals: Reversal pattern• Short-term outlook indication• Real body can be black or white
(white: stronger signal)
BACKGROUND1-BAR
PATTERN2-BARS PATTERN
3-BARS PATTERN
PRICE TRADING STRATEGIES
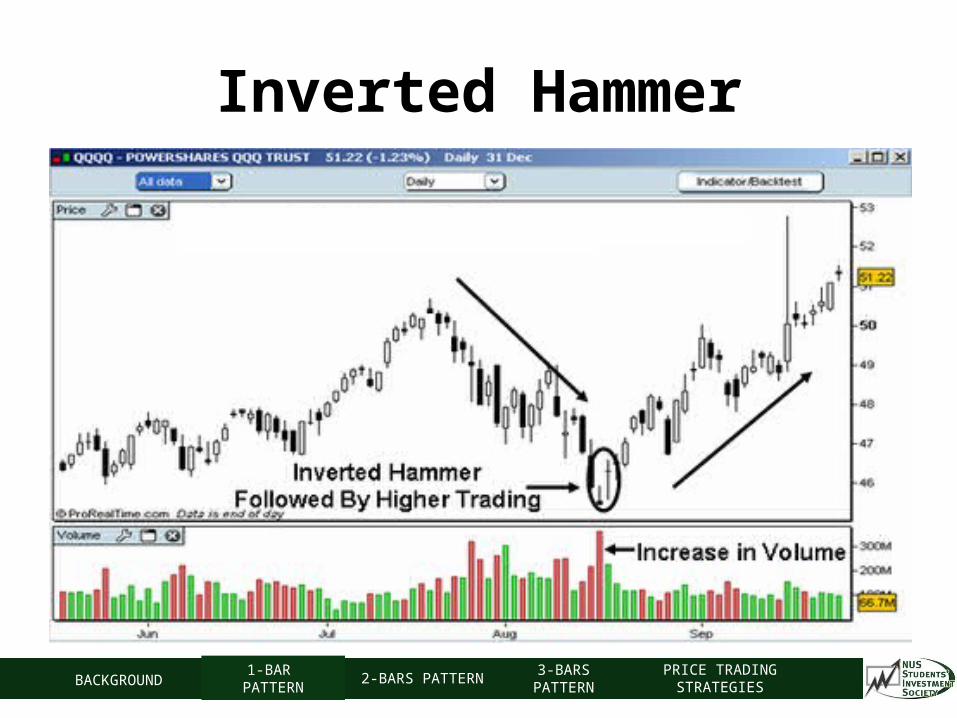
Inverted Hammer
BACKGROUND1-BAR
PATTERN2-BARS PATTERN
3-BARS PATTERN
PRICE TRADING STRATEGIES
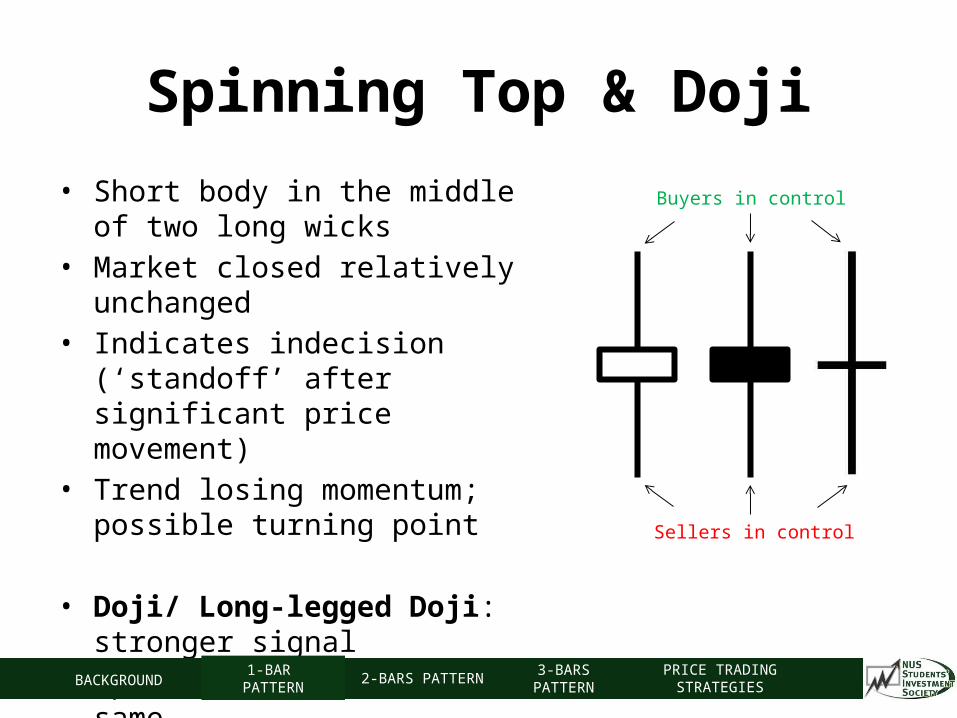
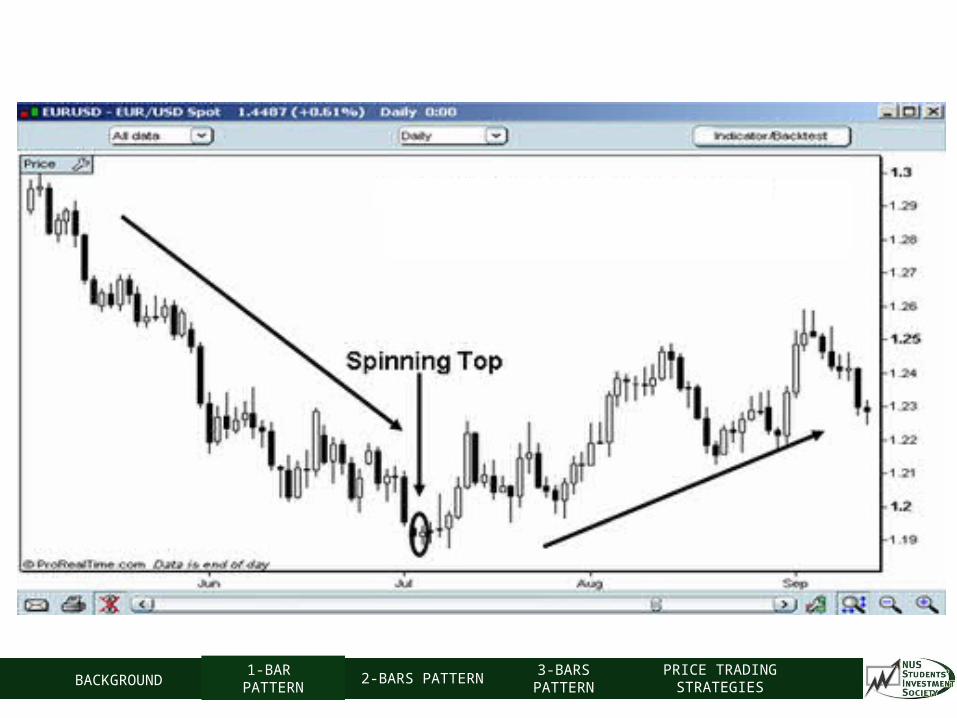
Spinning Top & Doji• Short body in the middle of two long
wicks• Market closed relatively unchanged• Indicates indecision (‘standoff’ after
significant price movement)• Trend losing momentum; possible
turning point
• Doji/ Long-legged Doji: stronger signal
• Open and close are the same• Insignificant in sideway markets
Buyers in control
Sellers in control
BACKGROUND1-BAR
PATTERN2-BARS PATTERN
3-BARS PATTERN
PRICE TRADING STRATEGIES
BACKGROUND1-BAR
PATTERN2-BARS PATTERN
3-BARS PATTERN
PRICE TRADING STRATEGIES
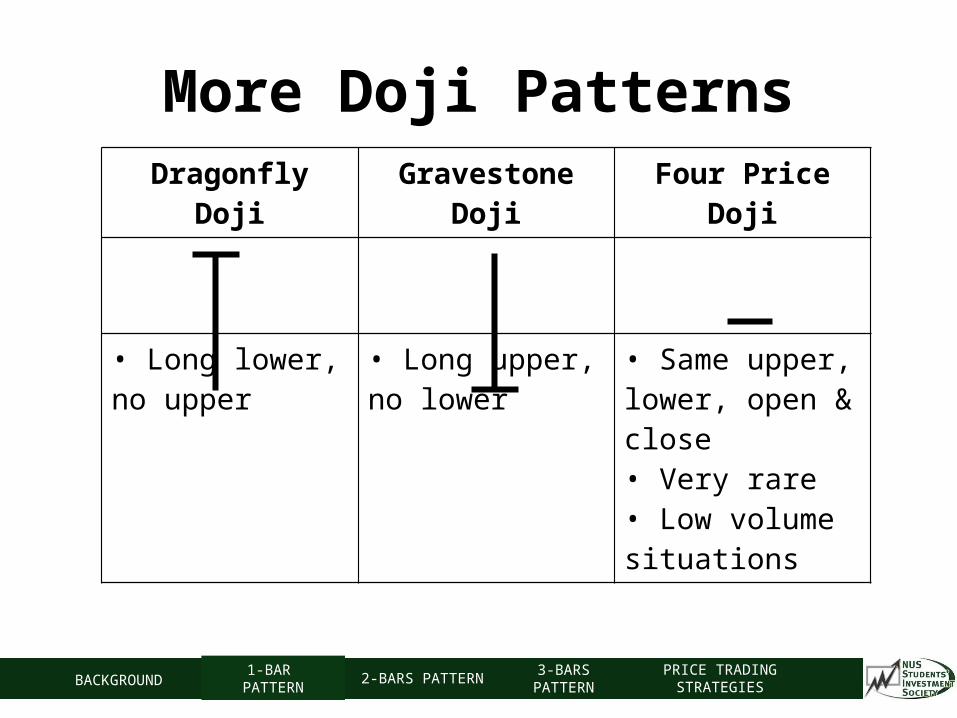
Dragonfly Doji Gravestone Doji Four Price Doji
• Long lower, no upper
• Long upper, no lower
• Same upper, lower, open & close• Very rare• Low volume situations
More Doji Patterns
BACKGROUND1-BAR
PATTERN2-BARS PATTERN
3-BARS PATTERN
PRICE TRADING STRATEGIES

2-Price Bar Patterns
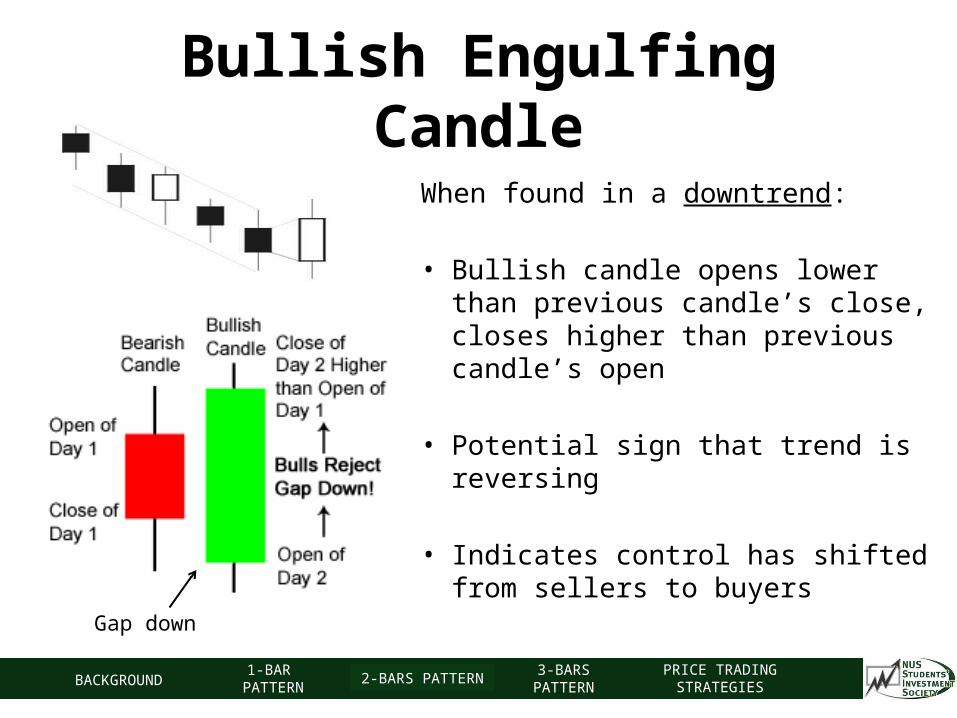
Bullish Engulfing Candle
Gap down
When found in a downtrend:
• Bullish candle opens lower than previous candle’s close, closes higher than previous candle’s open
• Potential sign that trend is reversing
• Indicates control has shifted from sellers to buyers
BACKGROUND1-BAR
PATTERN2-BARS PATTERN
3-BARS PATTERN
PRICE TRADING STRATEGIES
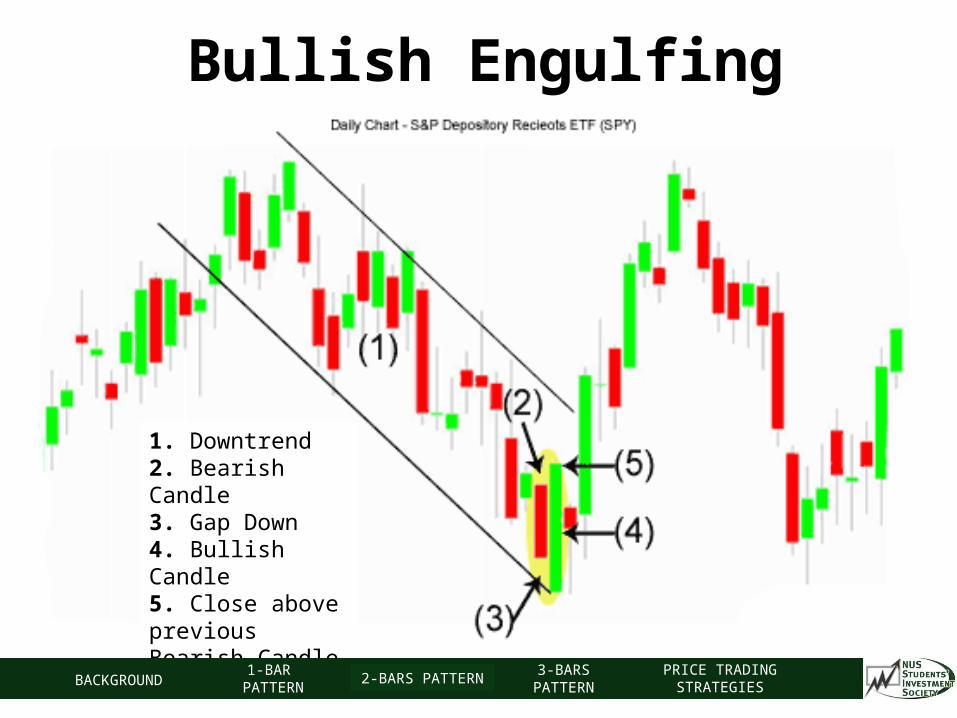
Bullish Engulfing
1. Downtrend2. Bearish Candle3. Gap Down4. Bullish Candle5. Close above previous Bearish Candle
BACKGROUND1-BAR
PATTERN2-BARS PATTERN
3-BARS PATTERN
PRICE TRADING STRATEGIES
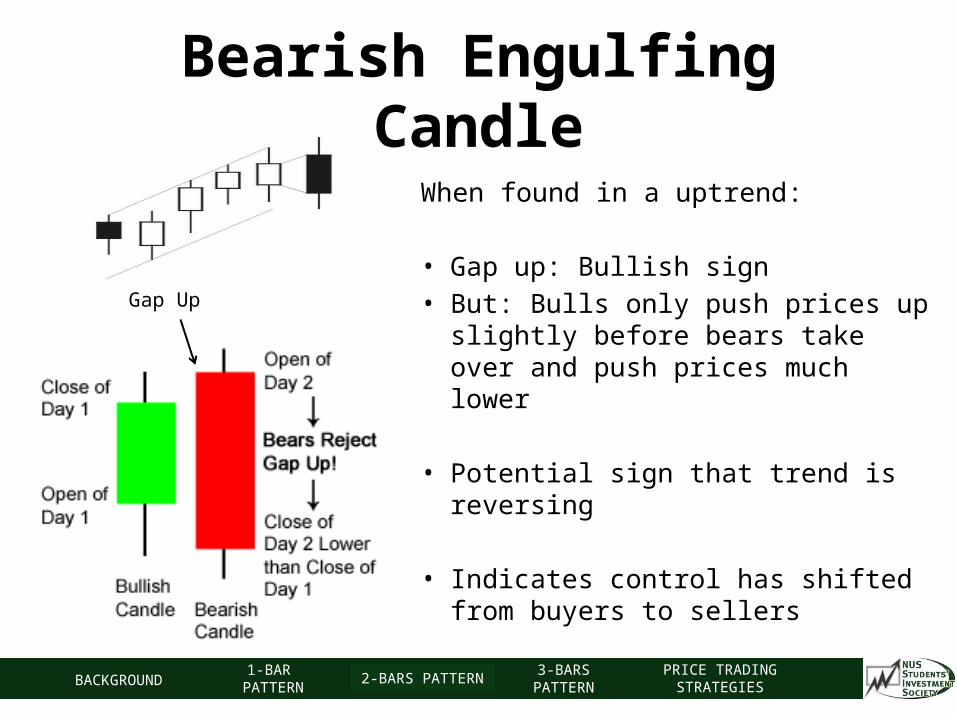
Bearish Engulfing Candle
When found in a uptrend:
• Gap up: Bullish sign• But: Bulls only push prices up
slightly before bears take over and push prices much lower
• Potential sign that trend is reversing
• Indicates control has shifted from buyers to sellers
Gap Up
BACKGROUND1-BAR
PATTERN2-BARS PATTERN
3-BARS PATTERN
PRICE TRADING STRATEGIES
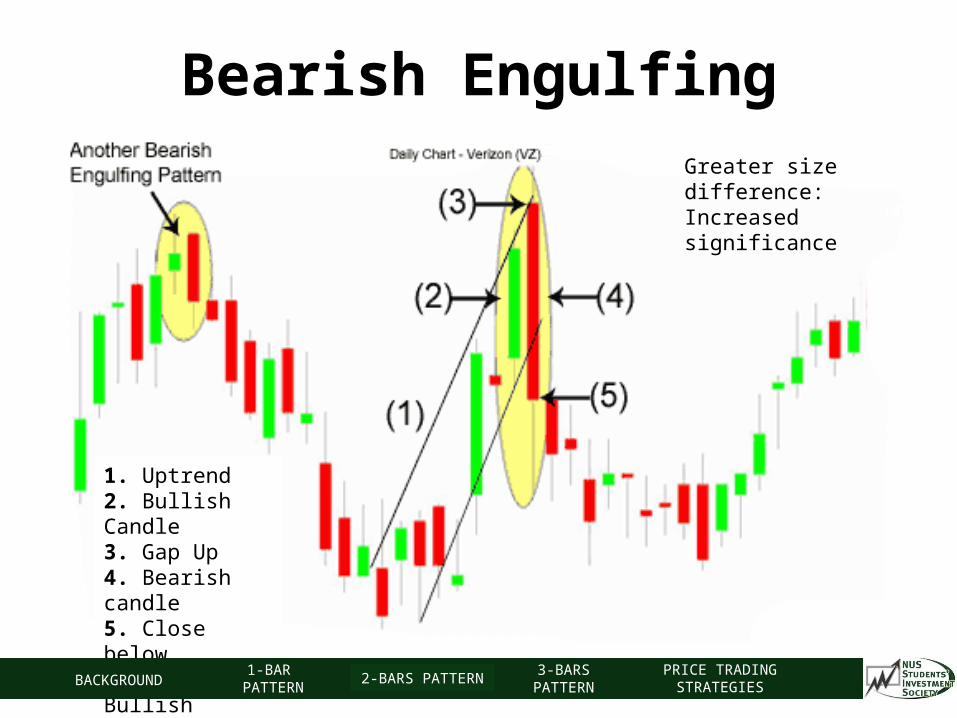
Bearish Engulfing
1. Uptrend2. Bullish Candle3. Gap Up4. Bearish candle5. Close below previous Bullish Candle
Greater size difference: Increased significance
BACKGROUND1-BAR
PATTERN2-BARS PATTERN
3-BARS PATTERN
PRICE TRADING STRATEGIES
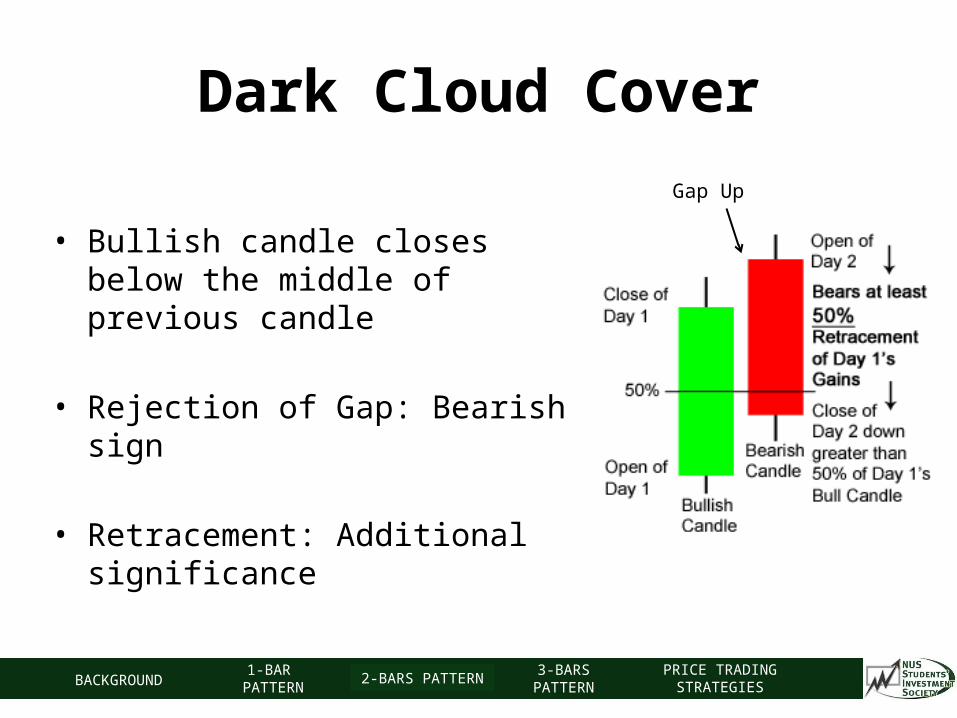
Dark Cloud Cover
• Bullish candle closes below the middle of previous candle
• Rejection of Gap: Bearish sign
• Retracement: Additional significance
Gap Up
BACKGROUND1-BAR
PATTERN2-BARS PATTERN
3-BARS PATTERN
PRICE TRADING STRATEGIES
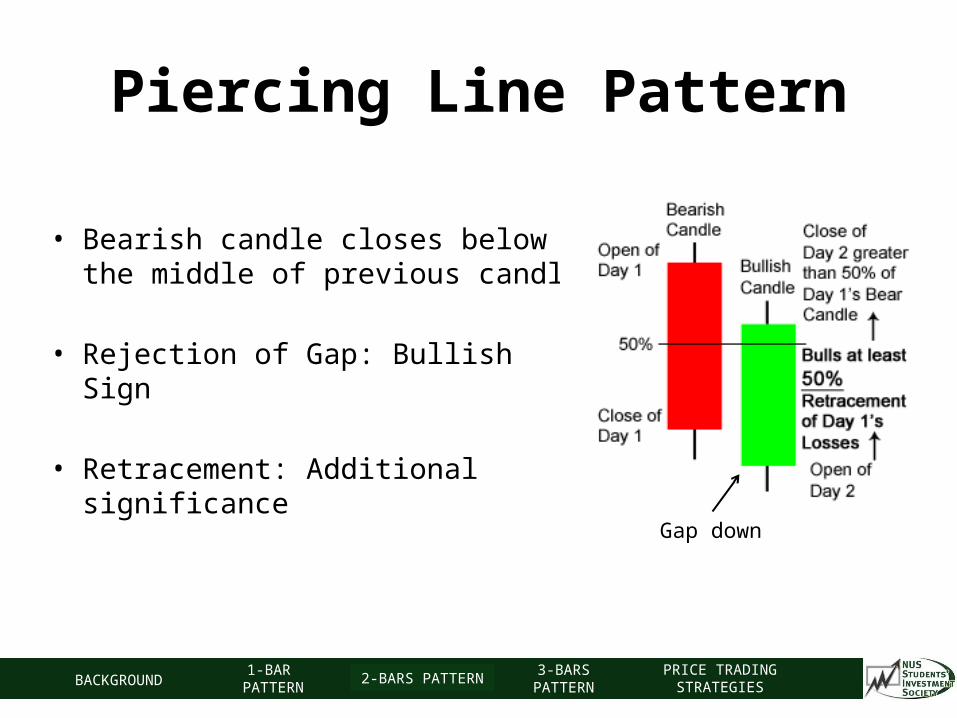
Piercing Line Pattern
• Bearish candle closes below the middle of previous candle
• Rejection of Gap: Bullish Sign
• Retracement: Additional significance
Gap down
BACKGROUND1-BAR
PATTERN2-BARS PATTERN
3-BARS PATTERN
PRICE TRADING STRATEGIES
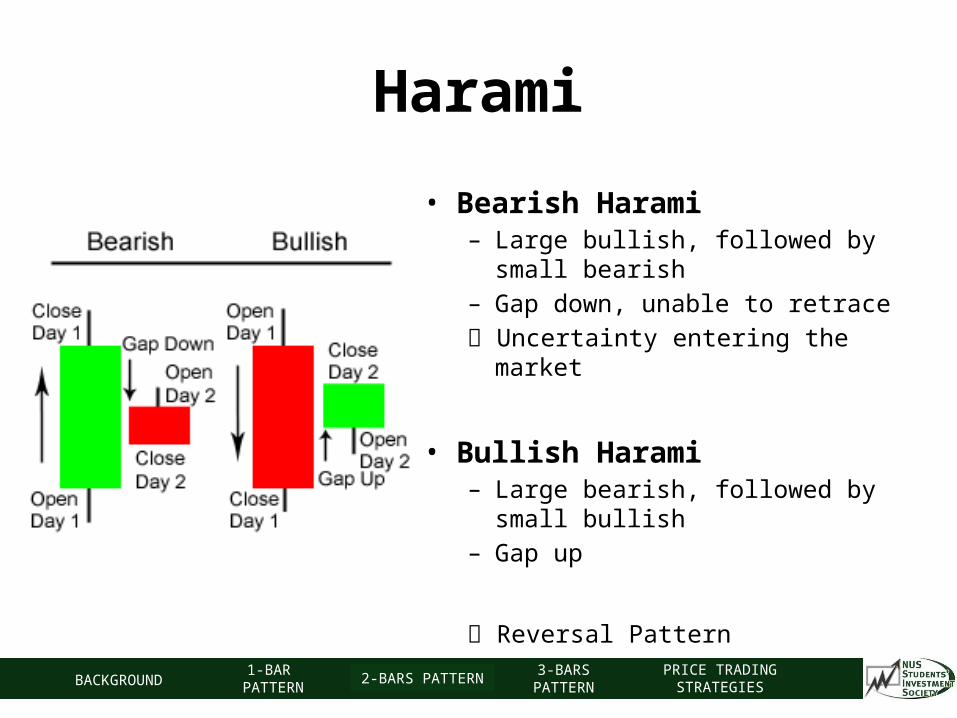
Harami
• Bearish Harami– Large bullish, followed by small bearish– Gap down, unable to retrace Uncertainty entering the market
• Bullish Harami– Large bearish, followed by small bullish– Gap up
Reversal Pattern
BACKGROUND1-BAR
PATTERN2-BARS PATTERN
3-BARS PATTERN
PRICE TRADING STRATEGIES
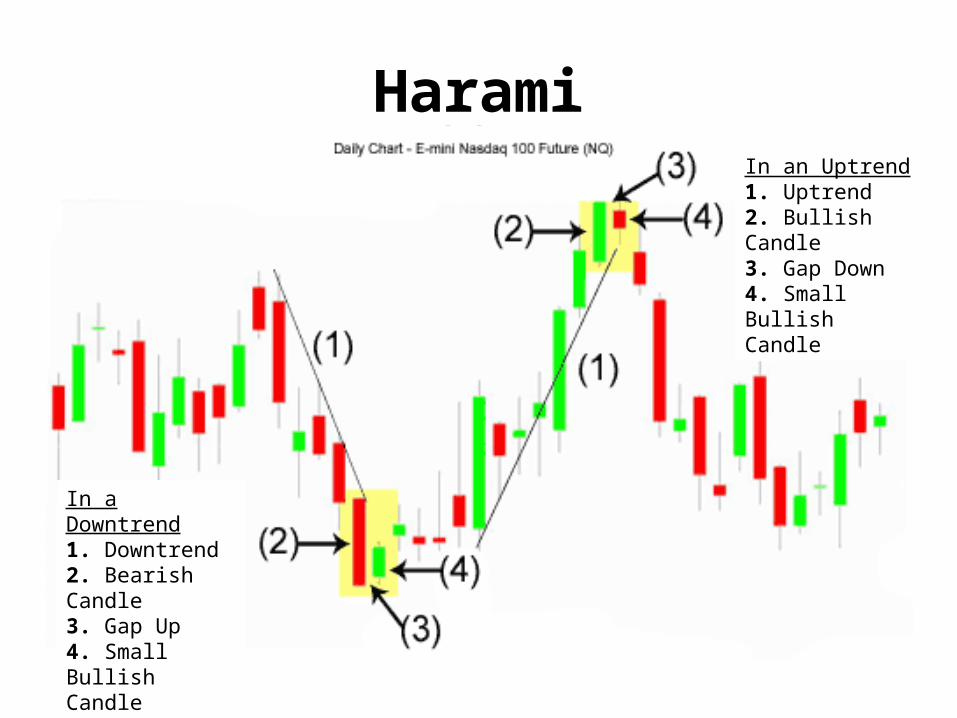
Harami
In a Downtrend1. Downtrend2. Bearish Candle3. Gap Up4. Small Bullish Candle
In an Uptrend1. Uptrend2. Bullish Candle3. Gap Down4. Small Bullish Candle
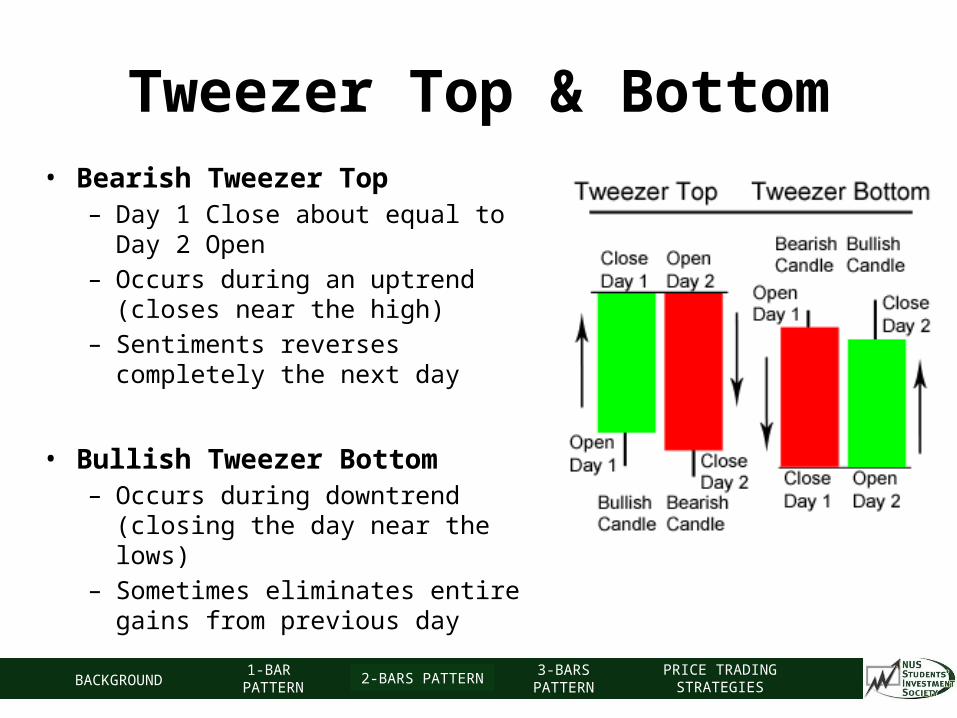
Tweezer Top & Bottom• Bearish Tweezer Top
– Day 1 Close about equal to Day 2 Open
– Occurs during an uptrend (closes near the high)
– Sentiments reverses completely the next day
• Bullish Tweezer Bottom– Occurs during downtrend (closing the
day near the lows)– Sometimes eliminates entire gains
from previous day
BACKGROUND1-BAR
PATTERN2-BARS PATTERN
3-BARS PATTERN
PRICE TRADING STRATEGIES
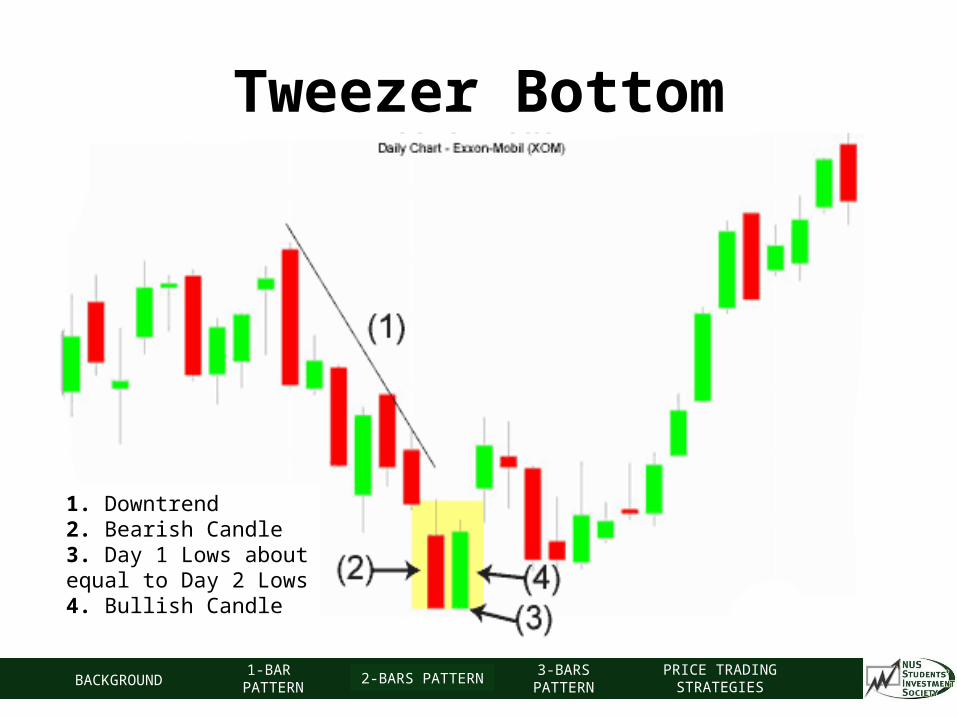
Tweezer Bottom
1. Downtrend2. Bearish Candle3. Day 1 Lows about equal to Day 2 Lows4. Bullish Candle
BACKGROUND1-BAR
PATTERN2-BARS PATTERN
3-BARS PATTERN
PRICE TRADING STRATEGIES
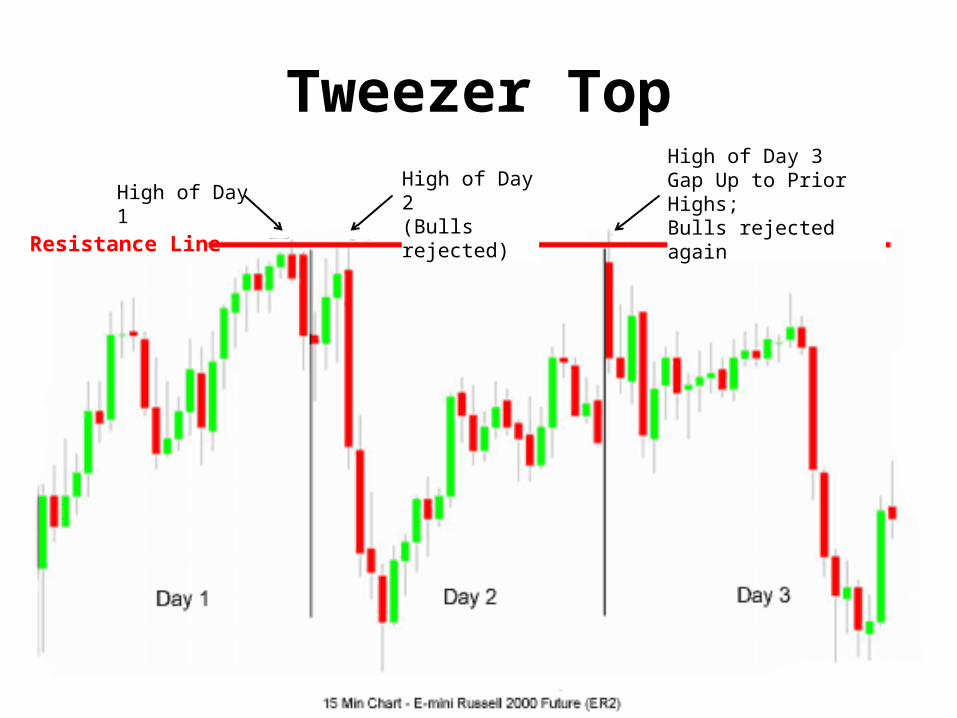
Tweezer Top
Resistance Line
High of Day 1High of Day 2(Bulls rejected)
High of Day 3Gap Up to Prior Highs;Bulls rejected again

3-Price Bar Patterns
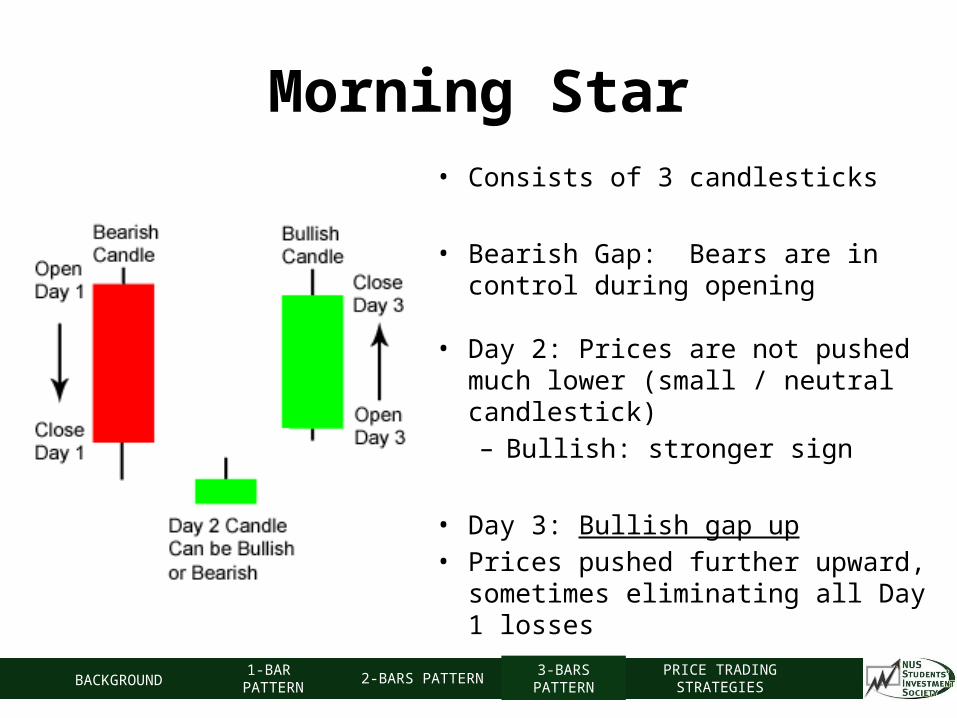
• Consists of 3 candlesticks
• Bearish Gap: Bears are in control during opening
• Day 2: Prices are not pushed much lower (small / neutral candlestick)– Bullish: stronger sign
• Day 3: Bullish gap up• Prices pushed further upward,
sometimes eliminating all Day 1 losses
Morning Star
BACKGROUND1-BAR
PATTERN2-BARS PATTERN
3-BARS PATTERN
PRICE TRADING STRATEGIES
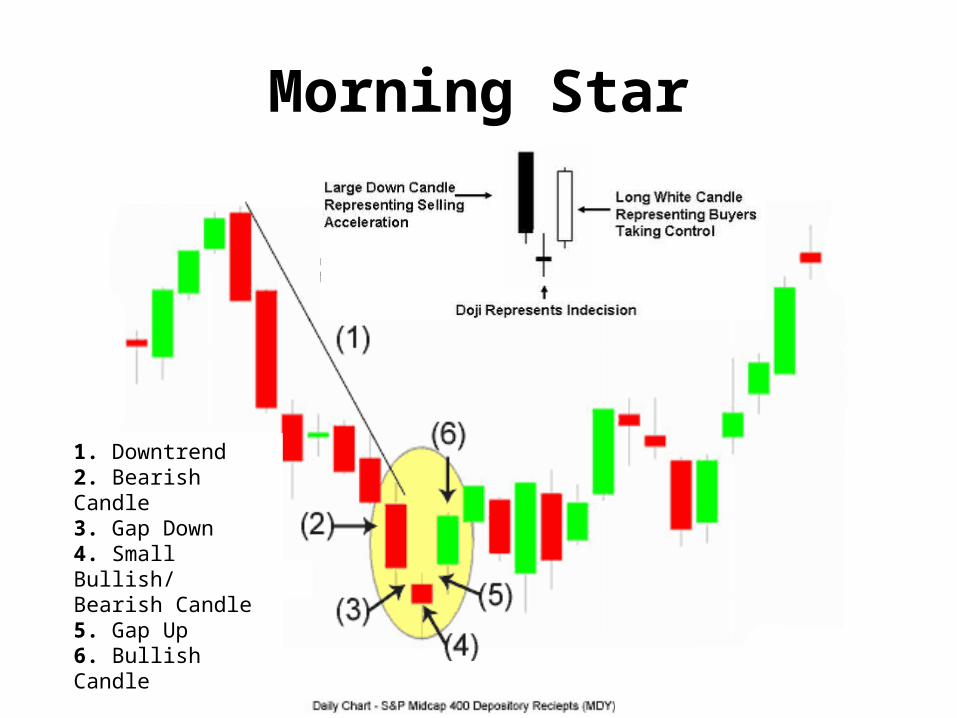
Morning Star
1. Downtrend2. Bearish Candle3. Gap Down4. Small Bullish/ Bearish Candle5. Gap Up6. Bullish Candle

Evening Star• Consists of 3 candlesticks:
- Bullish, Small/ Neutral, Bearish
• Presence of bullish gap & bearish gap
• Day 2: Prices are not pushed much higher– Bearish: stronger sign
• Day 3: Large bearish candlestick• Prices pushed further downward,
sometimes eliminating all of Day 1’s gains
BACKGROUND1-BAR
PATTERN2-BARS PATTERN
3-BARS PATTERN
PRICE TRADING STRATEGIES
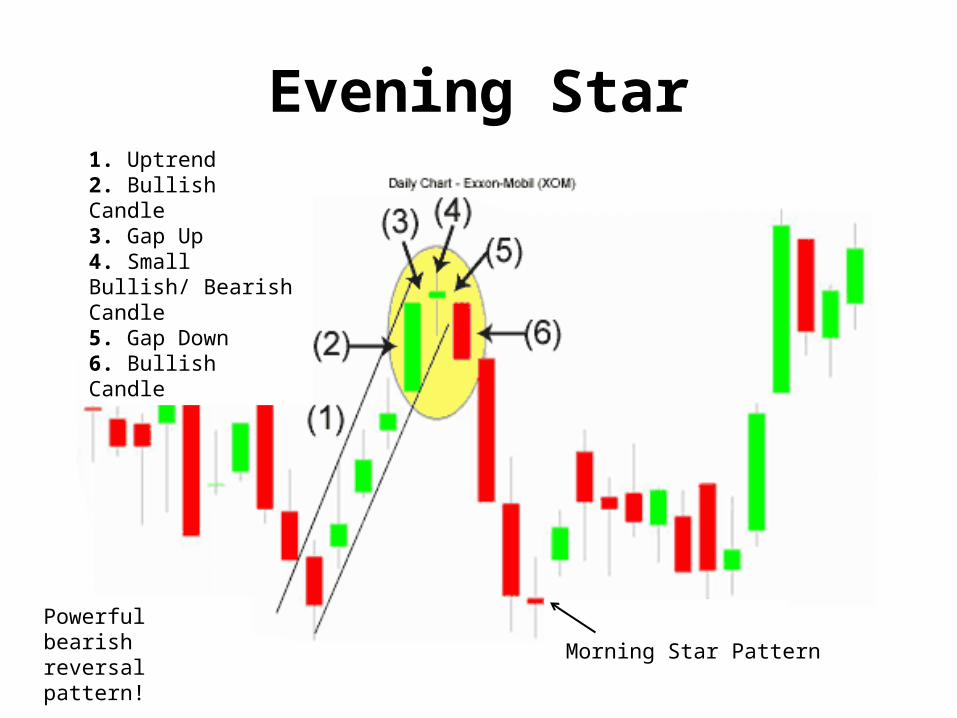
Evening Star
1. Uptrend2. Bullish Candle3. Gap Up4. Small Bullish/ Bearish Candle5. Gap Down6. Bullish Candle
Morning Star PatternPowerful bearish reversal pattern!
Price Action Trading Strategies
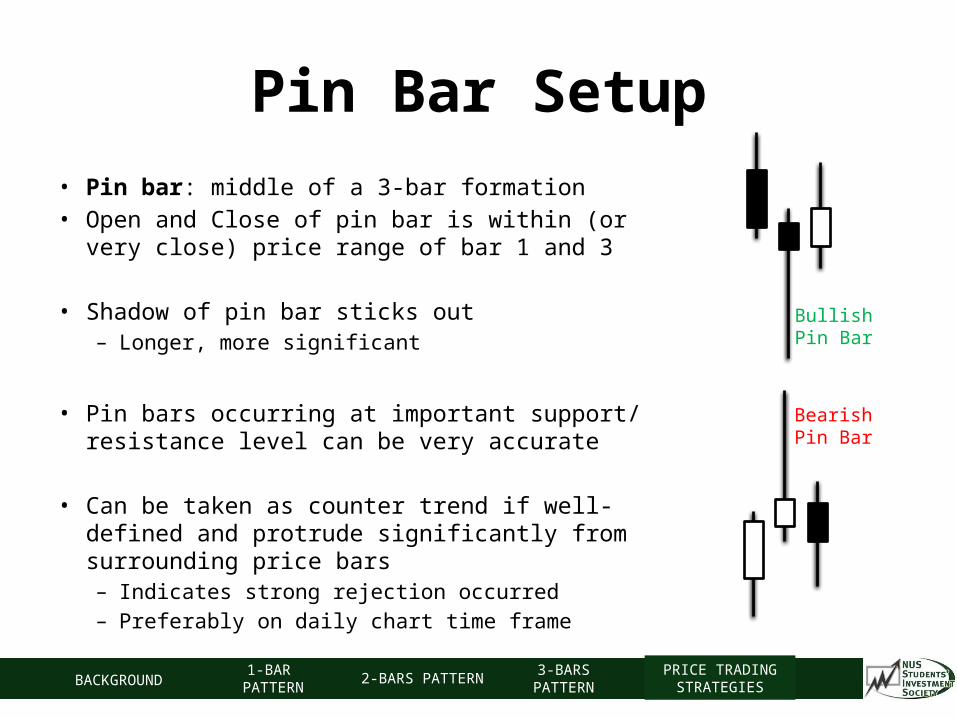
Pin Bar Setup• Pin bar: middle of a 3-bar formation• Open and Close of pin bar is within (or very close)
price range of bar 1 and 3
• Shadow of pin bar sticks out– Longer, more significant
• Pin bars occurring at important support/ resistance level can be very accurate
• Can be taken as counter trend if well-defined and protrude significantly from surrounding price bars– Indicates strong rejection occurred– Preferably on daily chart time frame
Bullish Pin Bar
Bearish Pin Bar
BACKGROUND1-BAR
PATTERN2-BARS PATTERN
3-BARS PATTERN
PRICE TRADING STRATEGIES

Pin Bar Setup
Two large bullish pin bars bringan end to the previous downtrend
Obvious bullish pin bars with the overall uptrend
• Pin bars occurring the context of a trending market
BACKGROUND1-BAR
PATTERN2-BARS PATTERN
3-BARS PATTERN
PRICE TRADING STRATEGIES
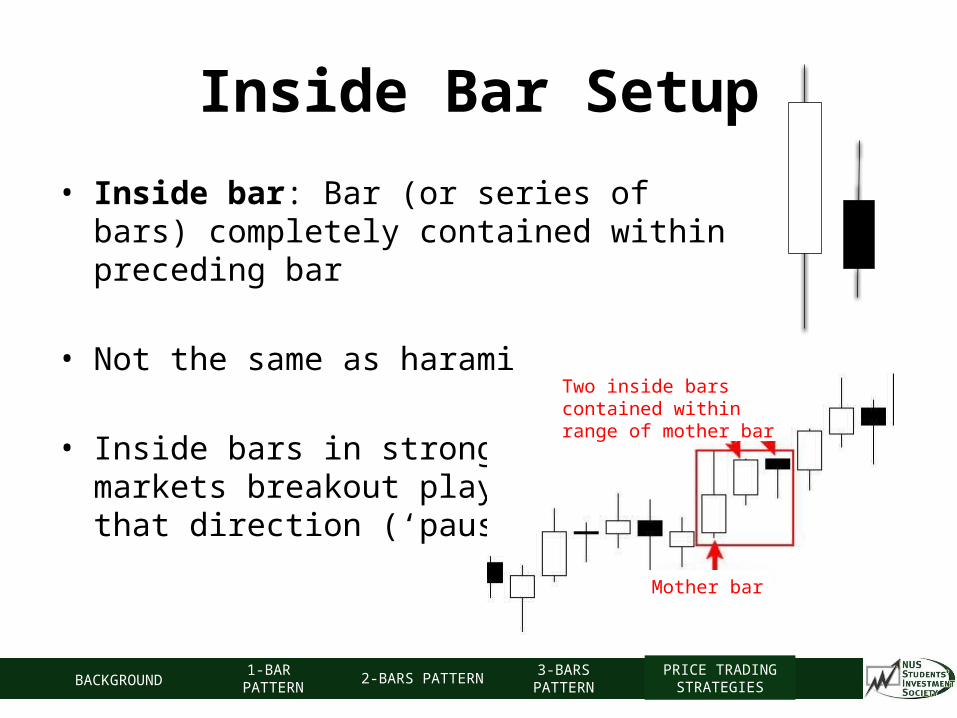
Inside Bar Setup
• Inside bar: Bar (or series of bars) completely contained within preceding bar
• Not the same as harami
• Inside bars in strong trending markets breakout plays in that direction (‘pauses’)
Mother bar
Two inside bars contained within range of mother bar
BACKGROUND1-BAR
PATTERN2-BARS PATTERN
3-BARS PATTERN
PRICE TRADING STRATEGIES
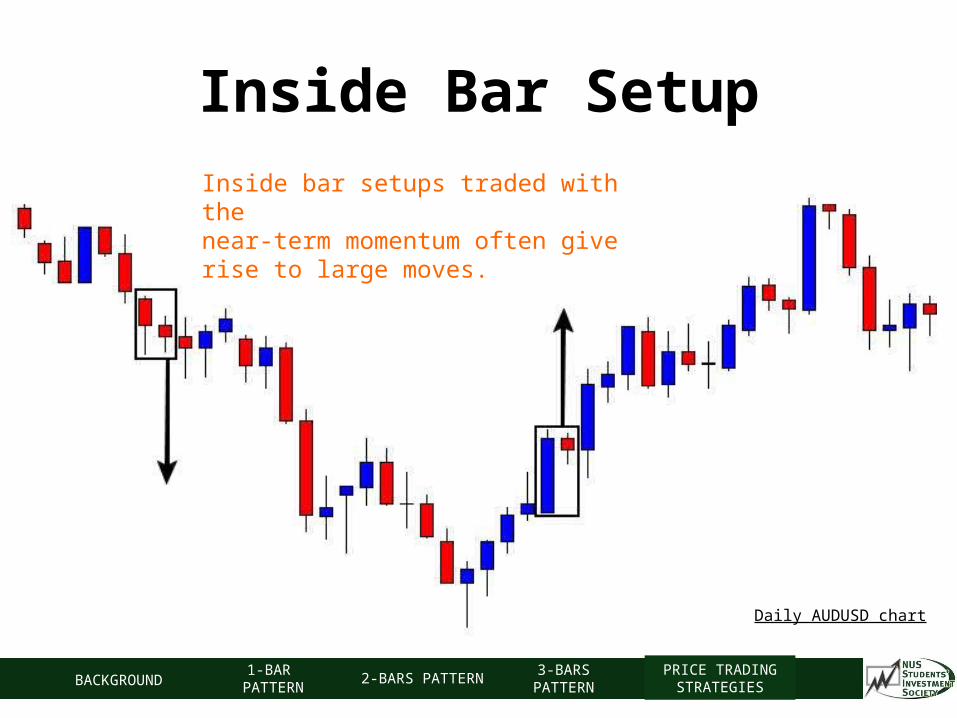
Inside Bar SetupInside bar setups traded with the near-term momentum often give rise to large moves.
Daily AUDUSD chart
BACKGROUND1-BAR
PATTERN2-BARS PATTERN
3-BARS PATTERN
PRICE TRADING STRATEGIES
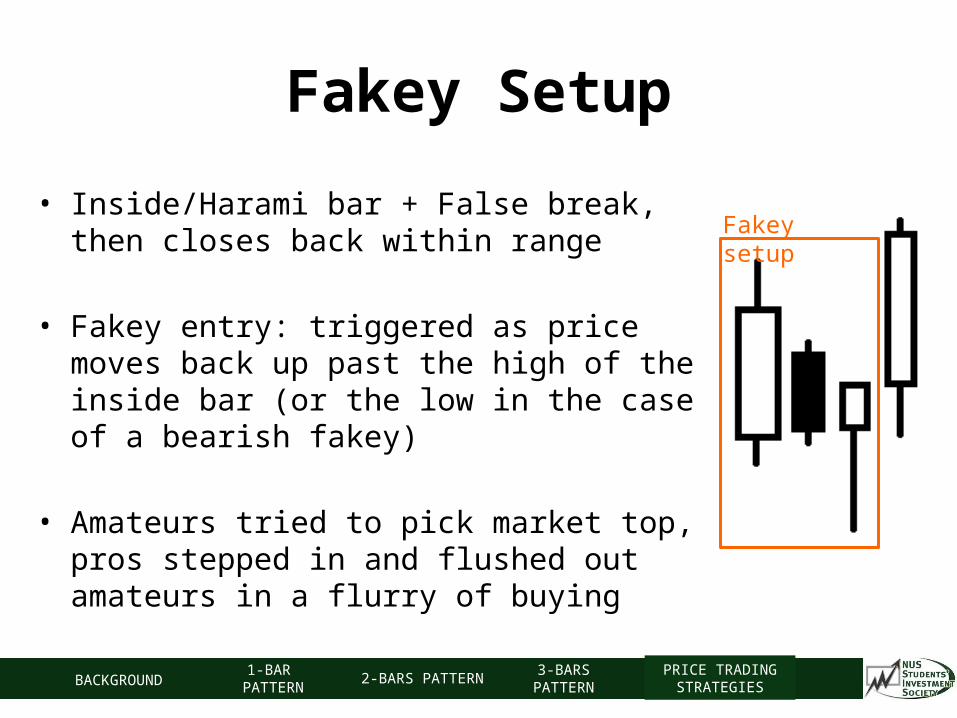
Fakey Setup
• Inside/Harami bar + False break, then closes back within range
• Fakey entry: triggered as price moves back up past the high of the inside bar (or the low in the case of a bearish fakey)
• Amateurs tried to pick market top, pros stepped in and flushed out amateurs in a flurry of buying
Fakey setup
BACKGROUND1-BAR
PATTERN2-BARS PATTERN
3-BARS PATTERN
PRICE TRADING STRATEGIES
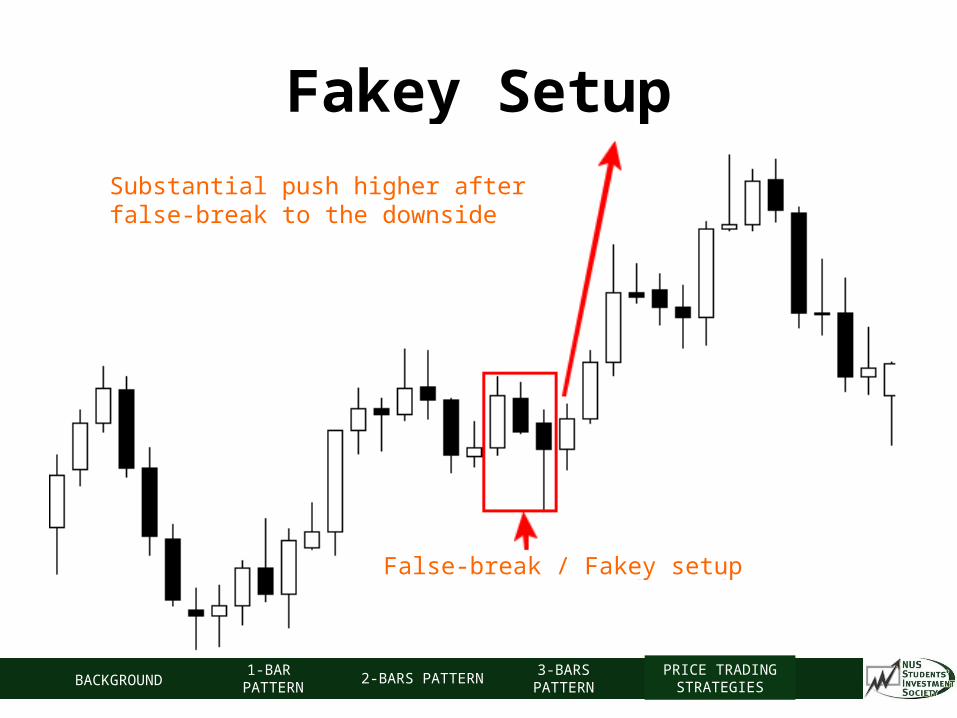
Fakey SetupSubstantial push higher after false-break to the downside
False-break / Fakey setup
BACKGROUND1-BAR
PATTERN2-BARS PATTERN
3-BARS PATTERN
PRICE TRADING STRATEGIES
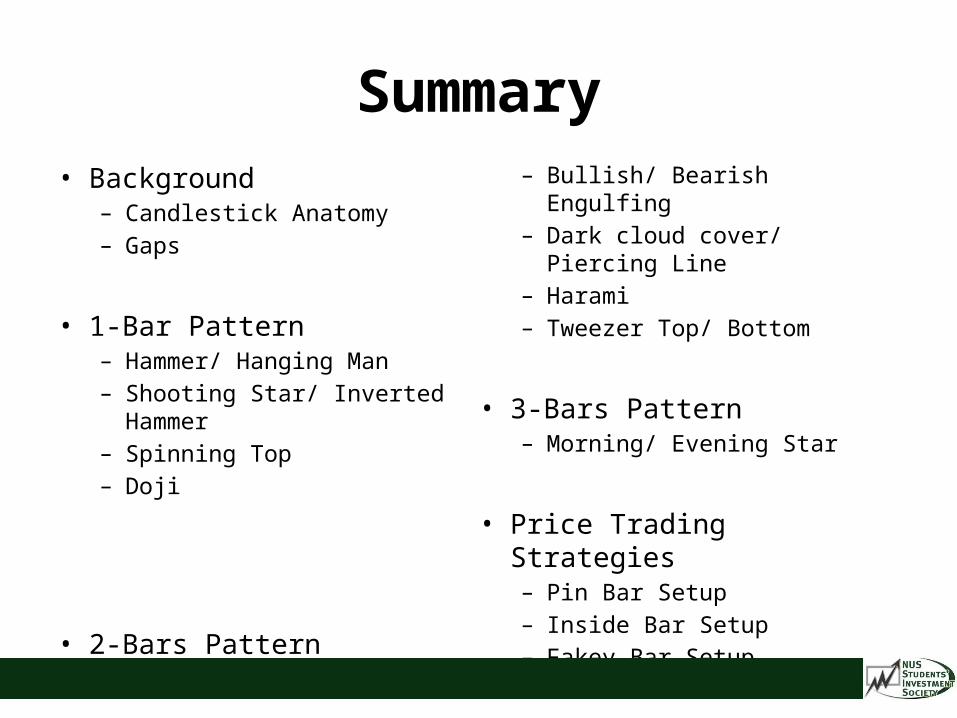
• Background– Candlestick Anatomy– Gaps
• 1-Bar Pattern– Hammer/ Hanging Man– Shooting Star/ Inverted
Hammer– Spinning Top– Doji
• 2-Bars Pattern– Bullish/ Bearish Engulfing– Dark cloud cover/ Piercing Line– Harami– Tweezer Top/ Bottom
• 3-Bars Pattern– Morning/ Evening Star
• Price Trading Strategies– Pin Bar Setup– Inside Bar Setup– Fakey Bar Setup
Summary

Resources
• Babypips.com• Forexfactory.com

Thank You!
Related Documents