NUREG/IA-0089 PSI-Bericht Nr. 91 International Agreement Report Post-Test-Analysis and Nodalization Studies of OECD LOFT Experiment LP-LB-1 With RELAP5/MOD2 CY36-02 Prepared by D. Liibbesmeyer Paul Scherrer Institute (PSI) Wurenlingen and Villigen 5232 Villigen PSI Switzerland Office of Nuclear Regulatory Research U.S. Nuclear Regulatory Commission Washington, DC 20555 October 1992 Prepared as part of The Agreement on Research Participation and Technical Exchange under the International Thermal-Hydraulic Code Assessment and Application Program (ICAP) Published by U.S. Nuclear Regulatory Commission

Welcome message from author
This document is posted to help you gain knowledge. Please leave a comment to let me know what you think about it! Share it to your friends and learn new things together.
Transcript

NUREG/IA-0089PSI-Bericht Nr. 91
InternationalAgreement Report
Post-Test-Analysis andNodalization Studies ofOECD LOFT Experiment LP-LB-1With RELAP5/MOD2 CY36-02
Prepared byD. Liibbesmeyer
Paul Scherrer Institute (PSI)Wurenlingen and Villigen5232 Villigen PSISwitzerland
Office of Nuclear Regulatory ResearchU.S. Nuclear Regulatory CommissionWashington, DC 20555
October 1992
Prepared as part ofThe Agreement on Research Participation and Technical Exchangeunder the International Thermal-Hydraulic Code Assessmentand Application Program (ICAP)
Published byU.S. Nuclear Regulatory Commission

NOTICE
This report was prepared under an international cooperativeagreement for the exchange of technical information. Neitherthe United States Government nor any agency thereof, or any oftheir employees, makes any warranty, expressed or implied, orassumes any legal liability or responsibility for any third party'suse, or the results of such use, of any information, apparatus pro-duct or process disclosed in this report, or represents that its useby such third party Would not infringe privately owned rights.
I
Available from
Superintendent of DocumentsU.S. Government Printing Office
P.O. Box 37082Washington, D.C. 20013-7082
and
National Technical Information ServiceSpringfield, VA 22161

NUREG/IA-0089SI ePSI-Bericht Nr. 91, International
Agreement Report
Post-Test-Analysis andNodalization Studies ofOECD LOFT Experiment LP-LB-1With RELAP5/MOD2 CY36-02
Prepared byD. Liibbesmeyer
Paul Scherrer Institute (PSI)Wurenlingen and Villigen5232 Villigen PSISwitzerland
Office of Nuclear Regulatory ResearchU.S. Nuclear Regulatory CommissionWashington, DC 20555
October 1992
Prepared as part ofThe Agreement on Research Participation and Technical Exchangeunder the International Thcrmal-Hydraulic Code Assessmentand Application Program (ICAP)
Published byU.S. Nuclear Regulatory Commission

NOTICE
This report is based on work performed under the sponsorship of the
Swiss Federal Off ice of Energy. The information in this report has
been provided to the USNRC under the terms of the International
Code Assessment and Application Program (ICAP) between the United
States and Switzerland (Research Participation and Technical
Exchange between the United States Nuclear Regulatory Commission
and the Swiss Federal Office of Energy in the field of reactor
safety research and development, May 1985). Switzerland has
consented to the publication of this report as a USNRC document in
order to allow the widest possible circulation among the reactor
safety community. Neither the United States Government nor
Switzerland or any agency thereof, or any of their employees, makes
any warranty, expressed or implied, or assumes any legal liabilityof responsibility for any third party's use, or the results of such
use, or any information, apparatus, product or process disclosed
in this report, or represents that its use by such third party
would not infringe privately owned rights.

Abstract
Experiment LP-LB-1 was conducted on February 3, 1984, in the Loss-Of-Fluid-Test (LOFT)facility at the Idaho National Engineering Laboratory under the auspicies of the OECD. Itsimulated a double-ended offset shear of one inlet pipe in a four loop PWR and was initiatedfrom conditions representative of licensing limits in a PWR. Additional boundary conditionsfor the simulation were loss of offsite power, rapid primary coolant pump coastdown, and UKminimum safeguard emergency core coolant injection rates.
This report presents the results and analysis of ten post-test calculations of the experimentLP-LB-1 by using the RELAP5/Mod2 cy36-02 computer code with different nodalizations;these calculations have been performed within the International Code Assessment Program(ICAP). Starting with the "standard nodalization" as more or less used by the code developers atEG&G, for different nodalization studies, we hate reduced the number of volumes and junctions(especially in the pressurizer, the'steam generator secondary side and the intact loop) as wellas the number of radial zones in the fuel rods.
Generally, the code has calculated most of the thermohydraulic parameters of the LOFT-experiment LP-LB-1 within an accuracy of approximately ±20%, but always has underpredictedthe cladding temperatures up to a value of 150 K. Except for the cladding temperatures, onlysmall discrepancies have been observed between the results of calculations using different nodal-izations. Reduced numbers of volumes and junctions usually have decreased the running timeof the problem but in one case, due to numerical instabilities even has prolonged it a little bit.
The time behaviours of the cladding temperatures have been significantly affected by thechoosen nodalizations but surprisingly, the results for the cases with a reduced number of vol-umes and junctions seem to be slightly closer to the experimental data.
With respect to top-down rewetting, one of the key-events of experiment LP-LB-1 during theblow-down phase, RELAP5/Mod2 was not at all able to predict this phenomenon.
iii


I
Contents
1 Introduction 51.1 Short Description of the LOFT Experiment LP-LB-1 ........... . . . .... 51.2 The Aim of the Present Investigations .............................. 8
2 Nodalization Schemes Used to Analyse Experiment LP-LB-1 102.1 Standard Nodalization ........................................ ... 102.2 Stripped Nodalisations ................................... .. .... 14
3 Results 193.1 Experimental Results ......................................... 203.2 Influence of the Nodalization on Computer Time and Mass Error ............ 233.3 Discussion of the Code-Predictions of the Main Events . . ............. 26
3.3.1 Calculation of Mass Flows in the Broken Leg . ............ ..... 283.3.2 Minimum Collapsed Liquid Level ............................ 373.3.3 Emptying Points of Pressurizer and Accumulator .................. 373.3.4 Peak Cladding Temperatures During the Blowdown Phase ............ 373.3.5 Quench Front Positions During the Reflooding Phase ........ .... .. 38
3.4 Time Behaviour of Significant Thermo-Hydraulic Parameters ............ 393.4.1 Cladding Temperatures .......................... ....... . 393.4.2 Fuel Center Temperatures .................................. 693.4.3 System Pressures ........................................ 693.4.4 Fluid-Temperature in'the Downcomer ........... . . ..-..... . 733.4.5 Core Mass Flows.... ..................... ....... 763.4.6 Core Average Liquid Fractions . .................... 763.4.7 Mass-Flow Out of the Broken Loop ..... ...... ............... 813.4.8 Intact Loop Mass Flow and Pump Speed ........................ 853.4.9 ECC System . .... ................................... 89
3.5 Investigation on' the Prediction of Top- Down Rewetting ................ 96
4 Conclusions 106
5 Appendices 1095.1 References ....... ....... .................................... 109
5.2 Listing of RELAPS/Mod2 - Input Mk. 6-00C .......................... ill

2
List of Figures
1.1 LOFT components showing thermo-fluid instrumentation ................ 6
2.12.22.32.4
3.13.13.23.33.43.53.63.73.83.93.103.113.123.133.143.153.163.173.183.193.193.203.21
" 3.223.233.243.25
Nodalization 6-00/6-01 of the LOFT system (most detailed version;.Detail of the nodalization of the LOFT core ...................Nodalization 8-00 /8-10 of the LOFT-system ................Nodalization 8-03 of the LOFT system (rnost simplified version; .
11121517
Measured cladding temperatures in center bundle 5.......Measured cladding temperatures in center bundle5 .......CPU-time to Real time ratio vs. time ................Mass error as defined by RELAP5/Mod2 vs. time .......Tricon n~nfn frifc #--%- PAýA T.P..T.R.1H-chanrel c t v .ti e a a l ... ...... . ....Hot-channel cladding temperatures. vs. time at axial level 0.2 .............Hot-channel cladding temperatures vs. time at axial level 11 ..... .........Hot-channel cladding temperatures vs. time at axial level 21 . . . .... . . . .Hot-channel cladding temperatures vs. time at axial level 27 ..........
Hot-channel cladding temperatures vs. time at axial level 23...............Hot-channel cladding temperatures vs. time at axial level 39 ............Hot-channel cladding temperatures vs. time at axial level 3.9 .........Hot-channel cladding temperatures vs. time at axial level 9. . . . . ........Hot-channel claddi temperatures vs. time at axial level 43.8 ...... .......Hot-channel cladding temperatures vs. time at axial level 49 . . ..........Hot-channel cladding temperatures vs. time at axial level 62 ............Average channel cladding temperatures vs. time at axial level 11 ............Averaged channel cladding temperatures vs. time at axial level 21 .. .. .. ...Averaged channel cladding temperatures vs. time at axial level 28 . . .... .. .
Averaged channel cladding temperatures vs. time at axial level 39 ..........Axial cladding temperature distribution in the hot channel compared ........Axial cladding temperature distribution in the hot channel compared ..........Calculated void fraction, flow regime and HTC (nodalization 6-00) . .......Calculated void fraction, flow regime and HTC (nodalization 6-01) ..........Calculated void fraction, flow regime and HTC (nodalization 8-10) .... .. ..
Calculated void fraction, flow regime and HTC (nodalization 8-03) ..........Calculated void fraction, flow regime and HTC (nodalization 6-00) .......
Calculated void fraction, flow regime and HTC (nodalization 6-01)
212225272840424344454647484950525354.55575860616263
* 6465

3
3.26 Calculated void fraction, flow regime and HTC (nodalization 8-10) ............ 663.27 Calculated void fraction, flow regime and HTC (nodalization 8-03) ............ 673.28 Fuel center temperature in the hot channel at level-27 compared ............. 703.29 Fuel center temperature in the hot channel at level-43.8 compared . ......... 713.30 System pressures in the cold leg vs. time compared with pressure ............. 723.31 Pressures in the pressurizer vs. time compared with pressure .......... ..... 743.32 Downcomer fluid temperatures vs. time compared with ...... .............. 753.33 Mass fluxes into the hot channel of the core as calculated .............. .... 773.34 Mass fluxes out of the hot channel of the core as calculated ..... ............ 783.35 Momentum fluxes into the hot channel of the core as calculated . . . . . . . 793.36 Momentum fluxes out of the hot channel of the core as calculated . .......... 803.37 Core averaged liquid fractions vs. time as calculated by RELAP5/Mod2 . ... 823.38 Calculated mass flows out of the broken cold leg vs. time ....... ............ 833.39 Calculated mass flows out of the broken hot leg vs. time ................... 843.40 Calculated mass losses out of the double ended break vs. time ............... 863.41 Calculated mass flows in the intact hot leg vs. time ............... ........ .873.42 Calculated mass flows in the intact cold leg vs. time ...... ................ 883.43 Calculated relative pump speed vs. time compared with ................... 903.44 Calculated accumulator fluid levels vs. time compared with ..... ............ 923.45 Calculated accumulator pressure vs. time compared with ..... ............. 933.46 Calculated accumulator mass flows vs. time compared with ..... ............ 943.47 Calculated LPIS discharges vs. time compared with the measurement ......... 953.48 Comparison of cladding temperatures calculated by RELAP5/Mod2 .......... 983.48 Comparison of cladding temperatures calculated by RELAP5/Mod2 .......... 993.48 Comparison of cladding temperatures calculated by RELAP5/Mod2 .......... 1003.48 Comparison of cladding temperatures calculated by RELAP5/Mod2 .......... 1013.48 Comparison of cladding temperatures calculated by RELAP5/Mod2 .......... 1023.49 Comparison of cladding temperatures calculated by RELAP5/Mod2 .......... 1033.49 Comparison of cladding temperatures calculated by RELAP5/Mod2 .......... 104

4
List of Tables
1.1 Initial Conditions for LOFT-experiment LP-LB-1 ........ ...... 7
2.1 Numbers of volumes, junctions, heat-structures and fine-meshes as well .... . . .18
3.1 RTM values in different intervals of the transient ....... .................. 243.2 Comparison of characteristic parameters inferred from experiment ......... 303.2 ... cont .............. .......................................... 313.2 ... cont ........................... ............................ 323.2 ... cont .... . . . ......... ... ...... .................. ....... .. 333.2 ... cont ........... .......................................... .. 343.2 ... cont. ......................................................... 353.2 ... cont. ................... ..................................... 36

5
Chapter 1
Introduction
1.1 Short Description ofthe LOFTExperiment LP-LB- 1
The LOFT facility at Idaho National Engi-neering Laboratory was designed to simulatethe major components and system responsesof a commercial PWR during a LOCA for thedetermination of system transient character-istics and for the assessment of code predic-tive capabilities for design basis large- andsmall break LOCAs in pressurized water re-actors. The experimental assembly includesfive major subsystems which have been in-strumented such that system variables can bemeasured and recorded during LOCA simula-tion. The subsystems include the reactor ves-sel, the intact and the broken loop, the blow-down suppression system and the ECC sys-terns; the arrangement of these major compo-nents is shown in Fig. 1.1. The entire nuclearcore consists of five square and four triangu-lar fuel bundles with a total of 1300 fuel pinseach of 1.67m long and an outside diameter of10.72 mm. A complete system description isgiven in ref.[1] and a discussion of the LOFTscaling philosophy is provided in ref.[2].
Experiment LP-LB-1 was conducted onFebruary 3, 1984, in the Loss-Of-Fluid Test(LOFT) facility at the Idaho National Engi-neering Laboratory. It was the second large-
break loss-of-coolant accident (LOCA) sim-ulation and the fifth experiment at all con-ducted in the LOFT facility under the aus-picies of the OECD. This experiment sim-ulated a double-ended off-set shear of oneinlet pipe in a four loop PWR. The exper-iment was initiated from conditions repre-sentative of PWR licensing limits and sim-ulated a loss of offsite power coincident witha large leg break LOCA. The boundary con-ditions included minimum UK safeguard as-sumptions for emergency core coolant injec-tion (no HIPIS) and rapid primary coolantpump coast-down. In addition, a loss of off-site power has been assumed.
The initial conditions for experimentLP-LB-1 have listed in table 1.
The transient was initiated by openingthe quick-opening blowdown valves in brokenloop hot and cold legs. Pressure decreasedrapidly due to the blowdown, with saturatedconditions being reached in the upper plenumat 0.04 seconds.
The reactor scrammed automatically whenthe intact loop hot leg pressure dropped to14.5 MPa at 0.1 seconds.
The primary coolant pumps were trippedmanually and decoupled from their flyweelswithin one second, effecting a rapid coast-down.
The core flow stagnated immediately af-

Intact loop Broken loop
il A
'1%
0Q
0Q

7
Initial Conditions for experiment LP-LB-1
parameter unit measured value
powermaximum linear heat
ATcorepressurehot leg
mass flow rate
fluid temperaturecold leg,intact loop
fluid temperaturecold leg,broken loop
fluid temperaturecold leg,broken loop
pressurizerliquid levelpressurewater temperature
ECC system accumulator:liquid levelstandpipe position from bottompressure
liquid temperatureECC system LPIS:liquid temperature
flow rate
MWkW/m
KMPakg/s
KKK
mMPa
K
mm
MPaK
KI/s
49.3 -51.7 -
1.23.6
29.8 ± 1.4.14.9 - 0.08305.9 ± 2.6556.0 ± 1.0552.0 ± 6.0561.0 ± 6.0
1.04 - 0.0414.9 - 0.11615.0 ± 5.8
2.36 ± 0.012.11 ± 0.034.21 ± 0.06
302.0 ± 6.1
305.0 ± 7.0depending on pressuredifference between LPISand downcomer
Table 1.1: Initial Conditions for LOFT-experiment LP-LB-1

8
ter the initiation of the transient and fuelrod cladding temperatures started to in-crease. All fuel rods in the central fuel as-sembly (box 5) experienced temperatures inexcess of 1100 K in their high power re-gions (about 24 inches from the bottom- ofthe core), whereas the maximum claddingtemperatures reached peak values of 1261K during blowdown and 1257 K during re-fill/reflood which were the highest tempera-tures ever measured in LOFT. The core-widetemperature increase continued until a par-tial core top-down quench occured, startingat 13 seconds, which affected the top thirdof the core. It is assumed that this top-downquench was caused by liquid fallback from theupper plenum induced by gravity. After this,the fuel rod cladding again experienced de-parture from nucleate boiling. There wereadditional thermal cycles prior to the finalcore quench, which was complete at 72 sec-onds. For more details see ref. [3].
One of the major concerns with Experi-ment LP-LB-1 was whether fuel rod damagewould occur. Based on the indicated claddingtemperatures, the pressure differential acrossthe cladding and the evidence from isotopedetection systems, no fuel rod ballooning orcladding rupture occured.
A comparison of results of ExperimentLP-LB-1 with previous LOFT large breakLOCA experiments e.g. L2-3, L2-5 andLP-02-6 (the first with continous pump op-eration, the last two with pumps discon-nected from their flywheels) shows signifi-cant differences in the primary system ther-mal hydraulic responses, specifically partialcore top-down quench depressurization dur-ing blowdown. These differences are believedto be largely due to differences in the primarycoolant pump operation, and, to a lesser ex-tend, in ECC injection and initial core power.Because of these significant thermal hydraulic
behaviour, experiment LP-LB-1 seems to bevery usefull for testing the predicting ca-pabilities of a best-estimate code like RE-LAP5/Mod2 .
1.2 The Aim of the Pre-sent Investigations
Codes like RELAP5/Mod2 and TRAC havebeen often used for the analysis of LOFT ex-periments and LOFT results have been exten-sively used to eliminate insufficiencies bothin the codes themselves and the more plant-specific nodalization of the problem by com-paring the predictions of the code with thereal measurements. Therefore, one has to beaware of the fact that both the code and theLOFT-specific nodalization, normally usedfor pre- and post-test analyses, are somehow"LOFT-tuned" resulting in quite acceptablepredicting capabilities.
Of course, the genuine field of applicationfor best estimate codes is believed not to bethe analysis of LOFT experiments but theprediction of the behaviour of commercialLWR's, where the should predict accuratelyif the system remains always in safe condi-tions. To be sure of the code's predicting ca-pability of abnormal situations in real powerplants, two main conditions have to be. full-filled :
" the different models of the code have tobe adequate for the problem
" the plant has to be nodalized adequately,such that main expected phenomena aresimulated
For the verification and possibly also for theoptimization of the different models of thecode, comparisons of the results of "integraltest" like LOFT may be not an appropriate

9
choice because possible deviations cannot besimply attributed to a specific model. Here,one should prefer the comparison with the re-sults of "separate effect tests".
For the plant to be analysed an "adequatenodalization" is usually unknown and onlysome very rough criteria can be given to thecode user. Consequently, the accuracy of aprediction may be strongly related to the "ex-perience" of the user, a quite unsatisfactoryconclusion.
To get a feeling, how the nodalization mayinfluence the prediction of the code, exper-iment LP-LB-1 has been analysed with re-spect to the following questions :
The general predicting capability of thecode, i.e. how accurate the sequence ofevents of experiment LP-LB-1 is calcu-lated by RELAP5/Mod2 cy36-02 in timeand value, especially, if the code is ableto predict the phenomena of top-downquenching during the blow-down phaseof the experiment which in the upperthird of the core has some influence onthe peak cladding temperatures.
" The influence of the nodalization (num-ber of volumes, junctions and heat struc-tures which describe the whole system)on the calculation, i.e. how the nodal-ization may influence the accuracy of theresults obtained.
Therefore, in what follows, we shall analysethe LP-LB-1 experiment by using the bestestimate code RELAP5/Mod2 cy36-02 withdifferent nodalizations of the LOFT system.Starting with a nodalization similar to theone used by the code developers at INEL(especially for the analysis of small breakLOCAs) we shall reduce the number of vol-umes, junctions and heat structures in theprimary loop of the LOFT system to nearly
half whereas the entire vessel stays nearlyunchanged to meet the requirements of thegiven experimental axial positions in the coreregion, especially for the cladding tempera-ture measurements. We shall further inves-tigate on the influence of the fine-meshingin the core zone during reflooding on quenchtime and quench temperature.
Finally, we shall see, how the reduction ofvolumes and junctions will influence the com-puter time, needed to analyse the experiment,a question which is important from the finan-cial point of view. On the other hand, in theframework of this contribution, no attemptswill be made to improve models within thecode.

10
Chapter 2
Nodalization Schemes Used to AnalyseExperiment LP-LB-1
The basis of all schemes of nodalizationnormally used for LOFT analyses are thosedeveloped at INEL for the RELAP5/Modlcalculations of the small break experimentsLP-SB-1 to LP-SB-3. Similar schemes havebeen applied for the analyses of experiementLP-SB-3 by Andreani and Griitter, ref. (4],as well as for all of the other LOFT post-testanalyses initiated by the OECD- LOFT- Con-sortium and using RELAP5/Modl or -Mod2codes.
This basic INEL LOFT nodalizationscheme for the RELAP5/Modl as well as the-Mod2 code is divided in seven main partswhich may be distinguished by their "capitalcomponent" numbers :
due course, whereas the steam generator pri-mary and secondary sides, the pressurizer aswell as intact and broken loops have been un-dergone drastic reductions with respect to theinitial number of volumes and junctions re-sulting in reduced computer time and simpli-fication of the problem.
2.1 StandardNodalization
Let us start with the "standard nodalization"(later on marked by 6-00...) which, com-pared to the above mentioned INEL-schemes,only has slightly modified to better meet therequirements of the large break experimentLP-LB-1 , especially in the core region (Fig.2.1).
The REACTOR VESSEL constists of thereactor core, of the intact and broken loopsdowncomer sections (volumes 200 to 210 and270 to 280 respectively), the lower plenum(220 to 225) and the upper plenum with thevessel dome (240 to 260).
The REACTOR CORE itself has beenmodeled by three parallel channels, the av-erage channel (230) subdivided into 5 hy-drodynamic volumes, the hot channel (231)subdivided into 13 volumes and the bypass
(1...)(2...)(3...)(4...)(5...)
(6...)(7...)
Intact LoopReactor VesselBroken LoopPressurizerSteam generator,secondary sideECC systemContainment(suppression tank)
The ECC systems, the containment andthe reactor vessel remained quite unchangedfor the different nodalizations discussed in

oq
0
o03
0
~tj
0
CL04
C.,
0
54O
Steamgenerator
42O
Seondary side
C500]515 41S
Pressurizer[400]
Reactor ve sset[200] 315
Broken loop[300]
I,='

12
5
039
028
021
011
4
3-
2
13
12
11
10
9
8
7
6
5
4
3
2
4-
- 062
4-• 049
43.8
4- 039
4 031
4- 027
4 024
- 021
- 011
4 002
avg channel79%
of totalmass flow
1
hot channel16%
of totalmass flow
Figure 2.2: Detail of the nodalization of the LOFT core(average and hot channels)

13
channel (235) into three equally spaced vol-umes. In Fig. 2.2, a separate scheme il-lustrating the nodalization of the active corehas been given. Here, the hydrodynamic vol-umes are not equally sized and they were di-mensioned so that the "reference thermocou-ple location" (cladding temperature measure-ment indicated by arrows) are always locatednearly in the axial center of the requested vol-ume.
The hot channel represents the center partof the core (mainly fuel-assembly 5) and con-tains 219 pins, the remaining 1081 pins areassigned to the avergage channel. The ax-ial linear heat flux distribution was choosenaccording to ref. [5].
The total mass-flow through the core isshared approximatly 79% by the averagechannel, 16% by the hot channel and the re-maining 5% by the bypass. Note that themass-flow distribution in the core region issomehow arbitrary. The choice of these val-ues is based on the relation of the pin num-bers associated with each of the channels (ar-bitrary!) minus the bypass flow which isagain an estimated parameter. No crossflowhas been assumed between the three chan-nels, because preliminary runs using junc-tion elements between the different nodes ofthe two heated channels had shown that theamount of mass exchange in traverse direc-tion remained negligible during the wholetransient.
The fuel pins have been modeled by heatstructures each radially meshed into 5 (av-erage channel) and 10 nodes (hot channel)respectively. In the "average pin", one zonerepresents the cladding, one the gap and twothe fuel. For the "hot channel", there are 3cladding zones, one gap and 5 fuel zones. Incase of reflooding, the code performs an axialfinemeshing for better modelling the advance-ment of the quench front. The maximum
number of allowable fine meshes has to bepreset. The influence of two different presetshas been investigated namely 4 (avg.) and 2(hot) as a minimum (nodalization 6-00) and64 (avg.) and 32 (hot) as a maximum value(nodalization 6-01).
The INTACT LOOP consists of 20 vol-umes with 2 or 3 subvolumes. As in the ac-tual LOFT system, the pumping system isdivided into two pump lines with two individ-ual pumps numberd 135 and 165 respectively.The EGG-injection system consisting of aLow Pressure Injection System (LPIS) andan accumulator is connected to the cold legof the intact loop (volume 185). In additionto the usual EGG line valve (600), an sup-plementary control valve (610) has been in-serted in the accumulator line to close thisline when the accumulator is empty. Thishappens to be necessary in order to continuewith the calculation. Probably due to thefact that the version RELAP5/Mod2 cy36-02 used for these calculations was not able tohandle noncondensibles, the transient alwayswas terminated by an execution error whenthe accumulator was just emptied and nitro-gen was released into the system.
The STEAM GENERATOR consists of 8volumes on the primary and 5 volumes onthe secondary side. A simplified feed, back-flow and steam separator modeling as wellas a steam flow control valve and conden-sator unit complete the nodalization of thesecondary side. The steam flow valve is con-trolled by a control logic which allows to keepthe secondary side pressure constant. Heat isexchanged from the primary to the secondaryside of the steam generator via the wall whichis modeled by 8 heat structures each having7 radial zones (8 nodes).
The PRESSURIZER is composed of thesurge line (2 volumes) and the entire pressur-izer. The latter is nodalised by a pipe com-

14
ponent (6 subvolumes) which represents themain vessel, and another pipe (2 subvolumes)which describes the pressurizer dome.
The BROKEN LOOP consists of two indi-vidual lines. The hot line has been nodalisedby 3 volumes (300 to 310) and one pipe com-ponent (315), representing the steam genera-tor simulator. The cold line is consisting of 4volumes (335-344). At the end of each of thelines, the two break-valves which have to beopened by a trigger signal are placed and con-nected with the suppression tank, modeledhere by two time-dependent volumes (pres-sure is a function of time). In addition, forpreheating the broken loop, a bypass line ex-ist-, between volumes 310 and 342. This by-pass line has been nodalized by two pipe com-ponents. In our calculations, the connectingvalve (375) remained always closed.
Not included in Fig. 2.1 are some addi-tional control-valves and heat structures, es-pecially for the pressurizer which are onlyneccessary for steady-state runs to force thesystem to a stable stationary solution atthe desired thermal conditions like circu-lation mass-flow, core-inlet and core-outletfluid temperatures, liquid level in the pres-surizer, etc.
Because of the rather fast transient of alarge break LOCA (the total duration of thetransient is about 100 seconds), heat capac-ity effects of the piping walls, vessel wallsand other structures in thermal contact withthe coolant, may not play an important role.Consequently, for the sake of saving computertime, in the normal versions of nodalization,heat structures were used only for modelingthe heat generation in the reactor core and forthe heat transfer from the primary to the sec-ondary side of the steam generator. For someruns, the influence of the heat capacity of the
reactor vessel on the transient behaviour ofthe thermal-hydraulic parameters of interesthas been investigated and therefore, some ad-ditional heat structures have been insertedin the downcomer and the lower plenum ofthe reactor vessel (heat-structures 200-210,220, 222, 225 and 270-280); these runs aremarked by an additional "C" to the nodal-ization number (e.g. 6-00C).
2.2 StrippedNodalisations
To investigate the influence of reduced num-ber of volumes and junctions on the accuracyof the analysis as well as on a probable sav-ing of computer time, the number of junctionsand volumes of the standard nodalization hasbeen drastically reduced.
A scheme of the first stripped version, thenodalization 8-00, is shown in Fig. 2.3. Themain changes have been made in the pressur-izer, the intact- as well as in the broken loopsand on the secondary side of the steam gen-erator, whereas the REACTOR VESSEL andthe ECC-system remained nearly unchanged.
The INTACT LOOP now mainly consistsof three pipe sections (110, 120 and 150 withfour, seven and six subvolumes respectively),only one pump component instead of two (butof course, with the same pump-head) and asteam generator primary side with six insteadof the previous 8 subvolumes.
The BROKEN LOOP consists of only twopipe systems (310 and 330) with 11 and 4subvolumes respectively. Since the bypass-valve (see component 375 in Fig.2.1) is alwaysclosed, in this stripped version of nodaliza-tion, the whole bypass-line has been omitted.Consequently, possible mass and heat capac-ity effects in this line are neglected.
The whole PRESSURIZER system (vessel

Secondary[500]
side
ftj
-. 0
0-00
-. 00
00
a..
Pressurizer[400]
U1G'
t.15
Broken loop
Reactor vessel [300]
[200] _L_.,1
347 I-'0(.4
150 330
ECCSSystem
[600]Ia0

16
and surge-line) has been reduced to one pipecomponent with four subvolumes only.
The SECONDARY SIDE of the steam gen-erator and the attributed system has been un-dergone drastic reductions. In principle, thesteam generator has been turned into a sim-ple heat exchanger with single-phase flow onthe secondary side. The flow is simply con-trolled by a time-dependent junction (566)and dumped into an outlet volume (542). Tomaintain correct primary side inlet and outletconditions, the mass flow has been adjustedto quite higher values than for the real steamgenerator conditions where the evaporationof the water is the main heat sink. The wallbetween the primary and secondary side ofthe steam generator has been modeled by sixheat structures each radially divided by threezones.
Nodalization 8-10 is identical to 8-00 withrespect to the number of volumes, junctionsand heat structures but differs in modelingthe nuclear fuel rods by reducing the numberof radial meshes of the heat structures in thecore zone from 10 to 5 in the hot channel (onezone for the cladding, one for the gap and twofor the fuel) and from 5 to 4 in the averagechannel (one zone for the cladding, one forthe gap and one for the fuel). Fine-meshingremains at 2 (hot) and 4 (avg.).
The reduced nodalization 8-00 can bestripped even more by simply reducing thesubvolumes of each of the pipe components;for the pipe 110 to two, for pipe 120 and 310to three and for pipe 150 and 330 to onlyone subvolume each. The nodalization of thesteam generator has been reduced to only twoon both sides but the radial meshing of the re-lated heat structures remained at three nodes(fig. 2.4).
The maximum number of fine meshes of the
heat structures of the core during refloodingremains at two in the hot and at four in theaverage channels. This very much reducednodalization is called 8-03.
All the stripped versions have been usedwith and without heat capacity contributionin the vessel component, as described above.
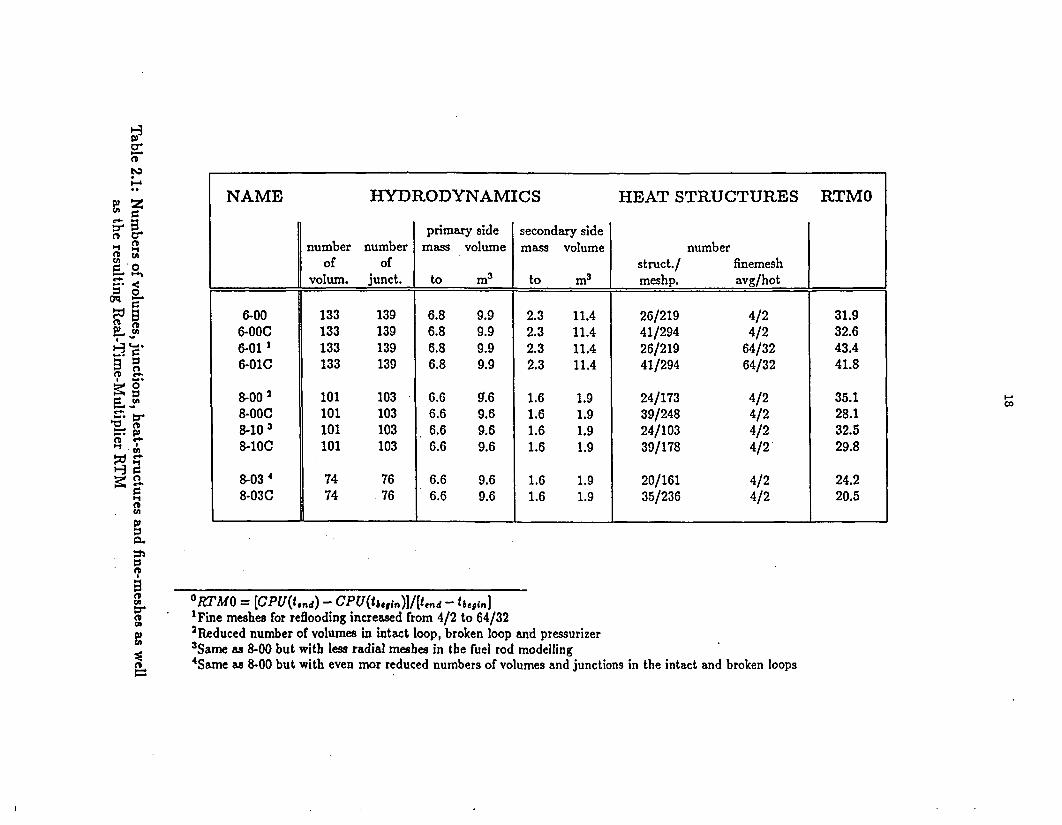
Finally, in table 2.1, characteristic param-eters of the different nodalizations (e.g. num-ber of volumes, junctions and heatstructures,mass inventory of primary and secondarysides as well as the corresponding system vol-umes) used for this study have been listed.Included in table 2.1 are the average "Real-Time-Multipliers" RTMO which are the quo-tient of the CPU time (on a CYBER-855 ma-chine) divided by the duration of the analyzedtransient; the RTMO should illuminate the ef-fect of nodalization from the economical pointof view.

09
.0
0- 0
0
0
U1
0
Secondary
[500]side
Pressurizer[400]
U'In
415
Broken loop
Reactor vessel [300] 317
[200] r I E
310
I-'-J3470
(~4
150 330
ECCSSystem
[600]
or.
n0'
t0
tb .
NAME HYDRODYNAMICS HEAT STRUCTURES RTMO
primary side secondary sidenumber number mass volume mass volume number
of of struct./ finemeshvolum. junct. to M3 to m 3 meshp. avg/hot
6-00 133 139 6.8 9.9 2.3 11.4 26/219 4/2 31.96-00C 133 139 6.8 9.9 2.3 11.4 41/294 4/2 32.66-01 ' 133 139 6.8 9.9 2.3 11.4 26/219 64/32 43.46-01C 133 139 6.8 9.9 2.3 11.4 41/294 64/32 41.8
8-00 2 101 103 6.6 9.6 1.6 1.9 24/173 4/2 35.18-00C 101 103 6.6 9.6 1.6 1.9 39/248 4/2 28.18-10 3 101 103 6.6 9.6 1.6 1.9 24/103 4/2 32.58-10C 101 103 6.6 9.6 1.6 1.9 39/178 4/2 29.8
8-03 4 74 76 6.6 9.6 1.6 1.9 20/161 4/2 24.28-03C 74 76 6.6 9.6 1.6 1.9 35/236 4/2 20.5
i-.
U'
C,U
C,I-
°RTMO = (CPU(tend) - CPU(t&.)]/(t.ed - ,begin]'Fine meshes for reflooding increased from 4/2 to 64/322Reduced number of volumes in intact loop, broken loop and pressurizer3Same as 8-00 but with less radial meshes in the fuel rod modelling4Same as 8-00 but with even mor reduced numbers of volumes and junctions in the intact and broken loops

19
Chapter 3
Results
Starting from thermal-hydraulic conditionsvery close to the ones given in table 2.1,total of ten calculations of the LOFT-experiment LP-LB-1 each lasting 120 sec-onds have been performed using the codeRELAP5/Mod2 , cy36-02 and the differentnodalization schemes described in chapter 2.
In our understanding, with respect to re-actor safety one set of "key-parameters" of alarge break calculation are mainly the timebehaviours of the cladding temperatures atdifferent axial positions (peak temperature,as well as the duration of being over a cer-tain temperature level, which may cause par-tial zircaloy- water reaction) and with mi-nor importance the peak fuel temperatures.Because the reactor was scrammed after avery short time from the initiation of the ex-periment, the center fuel temperatures sel-dom exceed the values of normal operationat full power. Consequentely, we shall fo-cus on the time behaviour of the claddingtemperatures. But even a satifactory ag-greement between the experimental and thecalculated cladding temperatures or betweenother significant parameters of the experi-ment like pressures, densities or mass-flowsshould not automatically lead to the conclu-sion that the code predictions are accurateand RELAP5/Mod2 perfectly has done itsjob. Because one may argue that the codehas given "right answer for the wrong rea-
sons", i.e. a satisfactory calculation of thetime behaviour of the cladding temperaturescould be the result of an "optimized summa-tion" of individual errors. Therefore, one hasto look carefully if the code has accuratelydescribed the main phenomena occuring dur-ing the experiment. Consequentely, one hasto investigate in detail the time traces of theother thermal-hydraulic parameters of impor-tance as well.
In what follows, we would like to start withsome words on the updating of the experi-mental data especially on the averaging pro-cess of some temperature traces and of thepower (neutron flux data).
The discussion of the results of the calcu-lations we shall start by looking at the influ-ence of the nodalizations on computer timeand mass errors.
Second, we shall discuss the capability ofRELAP5/Mod2 to predict significant eventsof the experiment like peak cladding temper-atures (value and time of their occurence),the time when pressurizer and accumulatorempties as well as the positions of the quenchfront during the reflood period of the experi-ment.
Third, we shall analyse additional thermal-hydraulic parameters of the LOFT-plantas given by RELAP5/Mod2 , starting with:

20
the time behaviour of our "key parameters"(cladding and center fuel temperatures) andwe shall compare these results with the cor-responding data of Experiment LP-LB-1 , ifavailable.
Finally, in a separate chapter, we shall in-vestigate in the ability of the code to predicttop-down rewetting, a phenomenon which hasoccured in LP-LB-1 during 15 and 20 secondsafter the initiation of the experiment.
3.1 Experimental Results
The experimental results have been retrievedfrom the LOFT-transmittal tape. For most ofthe experimental values only one set of datais available except for the temperature dataof the core region and a few other variables.
The uncertainty of most of the experimen-tal data can be found in table VI of the"Transmittal Tape Description" (ref. [8)).We have used the values listed there for givingthe respective uncertainty of the "reference"on each individual plot, if possible.
Difficulties may occur in using the claddingtemperature traces at the different coreheights of the "hot bundle" 5, only whenthese values are averaged. In Figs. 3.Maand 3.1d, the temperature traces of all theavailable thermocouple signals radially dis-tributed in the center box (box 5) at .onespecific core level have been plotted at fourdifferent levels, namely at level 24 (24 inchesfrom the bottom of the core), at level 31, atlevel 43.8 and at level 49. We have selectedthe first two examples because at level 24,the highest surface temperatures have beenmeasured during the experiment, whereas thecode predicted the highest temperatures atlevel 31. The last two levels have been se-lec'ted because top-down rewetting, one of thekey events of experiment LP-LB-1 , mainly
took place in this upper third of the core.In Fig. 3.1a, the traces of all the available
six thermocouple signals radially distributedin the center box (box 5) at core level 24have been plotted. Whereas two of thembehave quite similar (the deviation of thecladding temperatures never exceeds 30 K),the other four have remained at operationaltemperatures during the whole blow-downphase and started heating up 25 seconds af-ter the initiation of the experiment. This be-haviour certainly would lead to a much lower"average temperature" especially during theblow-down phase of the experiment. There-fore, when computing the "reference temper-ature", we have omitted these four signals;the resulting reference temperature is indi-cated by squares. Nevertheless, this "manip-ulation" of the reference temperature may beregarded as to be somehow dubious.
In Fig. 3.1b, the time behaviour of all theavailable 14 thermocouple signals at core level31 have been plotted. One of the 14 thermo-couples has undergone a significant temper-ature drop followed by a heat-up for whichreason we can only speculate. Because itsuniqueness, this thermocouple has not beenused to form the "reference temperature",again indicated in fig. 3.1b by symbols.
At core level 43.8, a total of 13 thermo-couples radially distributed in the center box(box 5) are available. Only four of these13 thermocouples have undergone a. signif-icant top-down quench whereas the othersnearly remained on their high temperaturelevel. Because top-down rewetting has beenregarded as one of the key events of experi-ment LP-LB-1 , all thermocouples have beenused to form the "reference temperature; top-down rewetting is clearly indicated in the ref-erence (fig. 3.1c).
Finally, at level 49, both of the two avail-able thermocouple signals experienced top-

21
1200.
1100.
S1000.
9LEVEL 24 (LOFT LP-LB-I)C 900.tu
700.
600._in
500.
400. ---- I I 1 1-5. 5. 15. 25. 35. 45. 55. 65. 75.
TIME (SEC)
1200.
1100.
1000.
c 800.0-
6700.U-
500.
Li
LEVEL 31 (LOFT LP-LB-1)400. 1 A f J -.
-5. S. 15. 25. 35. 45. 55. 65. 75.TIME (SEC)
Figure 3.1:' Measured cladding temperatures in center bundle 5(averaged values (symbols) used as reference)
a.) at axial level 24b.) at axial level 31

22
1200.. . . . . *
1100.
1000.
- 900.I-I
Cr 800.hiCL
hiI- 700.
CJ eU-LLI°-
cr 600.
500.S LEVEL A3.8 (LOFT LP-LB-1I),,,,
400. •-5. 5. 15. 25. 35. 45. 55. 65. 75.
TIME (SEC)
1200.
1100.
1000.
900. LEVEL 49 (LOFT LP-LB-1IUi
c-cr 600.hi
- 700.LiiCr
600.
500.
400.-5. 5. 15. 25. 35. 45. 55. 65. 75.
TIME (SEC)
Figure 3.1: Measured cladding temperatures in center bundle 5(averaged values (symbols) used as reference)
c.) at axial level 43.8d.) at axial level 49

23
down rewetting at approximately 15 secondsafter the initiation of the experiment. Theaverage of the two signals has been used as"reference temperature".
Because the different, radially distributedthermocouples at one specific level havequenched at not excactly the same time, the"one dimensional quench front position" ascalculated by RELAP5/Mod2 has to be com-pared to a slightly uncertain reference whichvaries between least 10 and 20 seconds.
In addition to the problem of averaging,the uncertainty of the temperature measure-ment itsself is not fully established yet. Be-cause the thermocouples of the LOFT facil-ity were surface mounted ones, there are stillsome doubts whether these thermocouples al-ways measure the temperature of the sour-rounding cladding material or e.g. did nothave quenched in advance by impinging wa-ter droplets (ref. [9]).
3.2 Influence of the Noda-lization on ComputerTime and Mass Error
Starting with the influence of the nodaliza-tion on the computer time and disregardingthe accuracy of the predictions themselves forthe present, a first look to the RTMOs in table2.1 will lead to the conclusion that a severereduction of the number of volumes and junc-tions will not lead automatically to a signifi-cant decrease of the computer time consump-tion, as can be seen with the cases 6-00 and 8-00 where the much reduced version 8-00 runsslightly slower. Nevertheless, in general a re-duction of the number of volumes, junctionsand radial meshes as well as fine-meshes haslead to more economic calculations.
A more detailed analysis of the computer
time needed to analyse the LOFT experi-ment LP-LB-1 is shown in table 3.1. Here,the transient times have been subdivided intonine time intervals, the stationary part from-10 to zero seconds, the initial blowdown part(zero to 2 s) three entire blowdown parts (2to 8 s), (8 to 15 s) and (15 to 25 s), two re-flood intervals (25 to 50 s) and (50 to 70 s)with the starting sequence of the EmergencyCore Cooling System (ECCS) during the firstof these intervals (i.e. the feed of cold waterout of the accumulator and the Low PressureInjection System (LPIS) into the saturatedfluid of the intact loop) and finally two morestationary intervals (70 to 85) and (85 to 120s).
The reduction of the computer time due toa reduction of volumes, junctions and heatstructures became mostly significant withinthe first and the last time intervals, i.e. inthe more or less stationary part of the tran-sient; in addition, also the interval immedi-ately after the opening of the break wherethe scram of the reactor has taken place ischaracterized by a rather low consumption ofcomputer time.
The relatively low RTM-values during themore or less stationary parts of the transienthave been somehow compensated during thethird blowdown (15 to 25s) and especiallyduring the first reflood interval (25 to 50 s)where large number of numerical instabilitiesoccured due to a great degree of thermody-namic non-equilibrium in the intact cold legand downcomer region mainly caused by theinjection of cold water of the ECC system intothe saturated fluid inside the intact cold leg.
A visualization of the table 3.1 has beenpresented in figs. 3.2a and 3.2b where theRTM-values for the different nodalizationshave been plotted versus the experimentaltime.
In Fig. 3.2a, the RTM values are shown for

1TIj,. = [CPU(t2 ) - CPU(t,)J/[t2 - t] ((computer : CYBER-855)
ptA
CL
0'
Time interval Nodalisation
Oi 6-00 6-0OC 6-01 6-01C 8-00 8-00C 8-10 8-10C 8-03 8-03C
-10 - 0 17.1 17.6 17.4 17.5 12.4 13.3 12.3 12.9 9.6 10.10 - 2 13.3 13.9 13.6 13.8 9.7 10.5 10.0 10.5 6.2 5.32 - 8 23.6 24.7 23.9 24.5 17.4 19.0 18.0 19.4 6.4 6.58 - 15 35.8 37.9 36.3 37.6 26.7 29.0 26.9 28.8 14.3 11.415 - 25 33.6 35.7 33.8 35.3 29.0 30.4 29.4 30.7 12.6 11.925 - 50 52.5 44.7 70.0 51.7 61.3 38.0 84.0 -1 57.1 30.450 - 70 39.0 34.3 51.6 45.6 33.1 33.0 29.1 - 25.8 27.770 - 85 32.2 33.8 47.1 42.6 2 25.1 24.7 - 20.3 22.485 - 120 18.6 27.4 34.9 46.6 - 25.5 12.7 - 15.2 19.1
-10 - 120 31.9 32.6 43.4 41.8 35.1 28.1 32.5 29.8 24.2 20.5
1Abnormal termination of transient after 40.7 s due to water property error when accumulator got empty2Abnormal termination of transient due to water property error

25
100. 6-00
- -- 6-01!I [ 8-006-03
7 5 . - -- - 1,
IIjI-JI* I.1 I I
.JI 50.
25. ] :I .h ."-
LOFT-LP-LB-1 / CPU-TIME-RATIO0 . .. .. ------ I .. ... .. .. .J . * _1 .... ..
-10. 10. 20. 30. 40. 50. 60. 70. 80. 90. 110.TIME (SEC)
100. ii NODRLIZRTION ,
I j 6-OOC
--- 6-01C75.800C7 . 8-03C
Uj 8-_1C
LLJ 50.0.-
0. ..- . ., ... L
-10. 10. 20. 30. 40. 50. 60. 70. 60. 90. 110.TIME (SEC)
Figure 3.2: CPU-time to Real time ratio vs. timea) by neglecting wall heat capacityb) by taking into account wall heat capacity ("C")

26
the case of all the nodalizations which are nottaking into account heat capacity effects (nor-mal nodalization). One easily recognizes verystrong instabilities of all the calculations inthe interval 30 to 65 seconds (with peak val-ues between 30 and 40 seconds) probably dueto the cold water injection out of the accumu-lator into the saturated flow of the intact loopcold leg. High non-equilibrium leads to theabove mentioned relatively high RTM-valuein this interval of the transient. The overallbenifits of the simplified versions of nodaliza-tion can well be noticed in the time regions-10 to 30 seconds and 70 to 120 seconds.
In Fig. 3.2b, the RTM-values for all theC-versions have been plotted (i.e. the ver-sions of nodalization where the heat capacityeffects of the wall material of the vessel havebeen taken into account). Obviously, com-pared to fig. 3.2a, the large number of oscil-lations in the region of 30 to 65 seconds aredampened significantly for all types of nodal-izations.
In both plots, the very narrow first peaksat nearly zero seconds are probably due to thethermodynamic non-equilibrium during thesubcooled blowdown phase which only lastedsome hundreds of milliseconds after the open-ing of the break valves.
A second basic criteria for the quality of acertain nodalization is the "mass error" whichis a measure for the numerical accuracy of thecode because it represents a check of the massbalance in all of the system volumes. There-fore, in Figs. 3.3a and 3.3b, the mass er-rors have been plotted versus the experimen-tal time for all the calculations using differentnodalizations, refered to in table 2.1. In gcn-eral, quantitatively no significant differenceshave been found between the results with thenormal and the "C" nodalizations. The abso-
lute value of the mass error never exeeded val-ues of 0.8 kg and is not inverse-proportionalto the sophistication of the nodalization, i.e.a higher sophisticated nodalization automat-ically leads to smaller mass-errors. For the"C" versions, this error remains nearly con-stant after 40 seconds, i.e. during the refillphase of the experiment, but its stationaryvalue strongly depends on the nodalization.But in any case, because the total mass in-ventory of the LOFT system is in the orderof 7 tons, a "numerical loss" of not more thanone kilogram is negligible.
3.3 Discussion of theCode-Predictionsthe Main Events
of
Before starting the discussion of the perfor-mance of RELAP5/Mod2 in calculating themain events of the experimeht, first, in Fig.3.4, a graphic representation of the maintrip setpoints has been plotted where a valueof nearly one indicates that the trip is set.Shown here are the settings of the breakvalves, which opened at zero seconds, thepower-trip at 0.13 seconds (difficult to dis-tinguish from the break valve line) and thepump-trip at 0.63 seconds. The behaviourof the ECC-system is indicated by the .....line. For the accumulator, its value is 0.66and for the LPIS 0.33. The accumulatorstarted injection at 17.5 seconds, followed bythe LPIS at 32.0 seconds (trip value one).The trip curve falls back again to 0.33 whenthe accumulator has emptied at nearly 40 sec-onds (the exact time is calculated by RE-LAP5/Mod2 and therefore is slightly depend-ing on the nodalization of the problem; seefig. 3.44 a and b) and the LPIS remainedfunctioning.

27
0.6
0.2
0.0
0
cc
-0.2
-0.4
-0.6
-0.8
-1.2
-1.4
-1.6
0.6
0.4
0.2
0.0
-0.2
-0.4
-0.6
-0.8
-1.0
CD
a:M
LinccX:
V _
NOORLIZATION
6-OOC----6-01IC
8-00c
8-03C6- .,0C
-1.2
-I.A
-1.6-10. 10. 20. 30. 40. 50. 60. 70. 80. 90.
TIME (SEC)110.
Figure 3.3:a)b)
Mass error as defined by RELAP5/Mod2 vs. timeby neglecting wall heat capacityby taking into account wall heat capacity ("g")

28
C,
z¢I_
1.20
0.75
2.50
0.25
0.20
S I I I I I I I I
! j
I I.
* I, . * . I I I I
-1i. 10. 20. 30. 40. 50. 60. 70. 82. 90. 11TIME (SEC)
- TRIP SETTINGS s SCRAM - BREAK ---- PUMP__ ECCS
0.
Figure 3.4: Trip setpoints for experiment LP-LB-1
In Table 3.2, some main events have beenlisted and their occurence during the exper-iment (time and value) have been comparedto the equivalent code results using the dif-ferent nodalizations as given in table 2.1.The setpoints of the different trips are againlisted in table 3.2. First, one should noticethat in contradiction to the experiment whereboth the reactor power and the accumula-tor injection have been initiated by an actualpressure- dependent setpoint, for the calcula-tion we have used a time-dependent setpointretrieved from the experiment thus avoidinga multiplication of errors (if the pressure ispredicted wrong, this error will heavily influ-ence the predictions of the other parametersin the following time sequences).
3.3.1 CalculationFlows in the
of MassBroken Leg
We start our comparison with the broken loopand have to look at the peak mass-flow ratesas well as at the end of the subcooled breakflows in the hot and cold legs.
For all of the different runs, the end of thesubcooled break flow in the hot leg lies be-tween zero and 0.4 seconds. In the cold leg,the end of subcooled break flow occurs be-tween 3.4 and 4.2 seconds, slightly depend-ing on the selected nodalizations; the small-est values have been calculated by the 8-03 nodalizations where the cold leg is repre-sented by only one single volume thus inval-idating a correct. positioning of the measure-ment station.
For all the nodalizations, the peak valueof the mass-flow has occured at the firstprinted time step after initiation of the tran-sient (0.4 s) and has to be compared to a ref-erence value measured at 0.25 seconds of the

29
transient. All the nodalizations except 8-03and 8-03C produce very similar peak valuesof approximately 536 kg/s from the cold legand 170 kg/s from the hot leg which are quiteclose to the measured values of 515 kg/s forthe cold leg and 184 kg/s for the hot leg, re-spectively; the values of the 8-10 nodaliza-tion are slightly higher and lower. Even forthe nodalizations 8-03 and 8-03C with theirstrongly simplified piping in the intact andbroken loops, the peak value for the cold legis less than 10% off whereas the peak valuefor the hot leg exceeds the experimental dataat least 30%.
As a general trend, it can be obserired thatonly a severe simplification of the piping ofthe broken loop tends to give higher predic-tions of the peak break flows, especially inthe hot leg, whereas smaller simplificationsseem not to affect the accuracy of the calcula-tion (compare results 6-00 and 8-00, the latterwith a simplified piping in the broken loop).A severe reduction of the number of volumesand junctions in the broken loop of nodaliza-tion 8-03 has lead to an increase of the peakvalue of the cold and hot leg results whichreached overestimations of nearly 30% for thehot leg. On the other hand, one has to keep inmind that two-phase flow mass flow measure-ments both under stationary and transientconditions are increasingly difficult tasks be-cause the mass flow measurement is the re-sult of a multiplication of two independentmeasurements which are assumed 'to producearea averaged quantities. These independentmeasurements are the momentum flux mea-surement by drag bodies (or the velocity mea-surement by mini-turbines) and the densitymeasurement by a three beam X-ray densito-meter. Both signals are errorneous, especiallyin high void flow regimes. Furthermore, it isassumed that the product of each of the in-dividual two integrals (i.e. the area-average
of the measurements) is equal to the inte-gral of the product of the two variables, anassumption which is fullfilled rather seldom.The quantification of the error of the mass-flow measurements is quite difficult becauseits dependence of a variety of parameters likeflow-regime, void fraction, velocities, etc.
A better picture of what is going on inthe broken leg can be achieved by lookingat the integral mass losses through the breakat different times as listed in table 3.2 whereboth code predictions and experimental val-ues have been determined by simply summingup the product values of time-step times theinstantaneous mass flow at the two breaks.Here, the general trend is that the code cal-culated higher losses for the first 30 secondsand then stayed on a certain level (see alsofigs. 3.40a and b) and finally underpredictedthe actual mass losses through the break. Infact, the sign of the flow through he breakeven changed, indicating a small amount ofbackflow out of the containment into the pri-mary system due to slightly higher contain-ment pressures (defined as boundary con-ditions using the experimental data of ex-periment LP-LB-1 ) than calculated by RE-LAP5/Mod2 for the primary system. Be-cause the containment has been modeled asan additional time dependent volume down-stream of the break, this backflow is not "un-physical" with respect to the special "LOFT-system" as described by our nodalizationschemes. To indicate the occurence of theflow reversal, the calculated peak mass lossand the time of its occurence have been givenin table 3.2.
. The code calculated similar mass lossesfor the different nodalizations. In fact, twogroups may be distinguished, the results ofthe most detailed 6-00 versions which haveproduced slightly higher mass losses than themore simplified 8-0... versions.

(b"
°,
CA.
0
*=.
Oi-
0
I• tI
0
EVENT MEAS. RELAP5/Mod2 CALCULATIONSDATA
__ I unit _ _ 6-00 6-01 8.00 8-10 8-03 6-000 6-010 8-000 8-100 8-030
Blowdown valves open T s 0.0 set by time tripReactor scrammed 1 T s 0.13 set by time tripStop coolant pumps T s 0.6 set by time tripStart accumul. inject. z T a 17.5 set by time tripStart LPIS T s 32.0 set by time trip
End of subc. break flowcold leghot leg
Peak mass flowbroken looP.otd le 2
broken loophot [.0 2
TT
TVTV
a
8
skg/s
akg/B
3.51.0
0.25514.70.25184.1
4.0 4.21.0 1.0
4.2 3.81.0 1.0
0.4536.1
0.4170.6
0.4536.1
0.4170.6
0.4534.8
0.4170.3
0.4537.0
0.4164.7
3.41.0
0.4560.1
0.4233.5
4.0 4.0 4.21.0 1.0 1.0
0.4536.2
0.4170.6
0.4536.20.4
170.6
0.4534.7
0.4170.2
4.00.6
0.4537.0
0.4164.7
3.41.0
0.4559.6
0.4242.9
0,
'Symbol in the Q-row stands for T=time and V=value'during the experiment tripped by system pressure signal2 Differences may be due to different time steps of the measurement and the calculation

EVENT MEAS. RELAP5/Mod2 CALCULATIONSDATA
unit] t ___ 6.oo 6-01 8-00 8-10 8-03 6-ooc 6-00 8-0oc 8-10c 8-030
break mass loss (5 s) V ts 1.91 2.36 2.36 2.33 2.33 2.42 2.37 2.37 2.34 2.33 2.43(10s) V ts 2.79 3.37 3.37 3.22 3.24 3.32 3.36 3.36 3.23 3.23 3.27(30s) V to 4.67 5.14 5.15 4.95 4.82. 4.98 5.10 5.10 4.81 4.82 4.97(70s) V ta 5.45 5.30 5.32 4.95 4.94 4.98 5.55 5.52 5.22 -3 5.19(120s) V ts 5.93 5.30 5.36 4.97 4.96 5.00 5.54 5.52 5.24 - 5.17
Peak mass loss&,,k 4 T s - 53.6 40.4 55.6 38.4 30.8 64.4 65.6 61.5 - 57.2V kg -- 5.5.32 5.31 4.96 4.95 4.99 5.55 5.52 5.23 - 5.19
0Minimum collapsed Eiq.lvl. reached (hot chann.)
(average chann.)
TVTV
5 6.8 6.8 9.6 6.8 6.8 6.43.6 3.5 2.9 5.0 2.9 3.96.8 6.8 9.6 6.8 6.8 6.43.5 3.6 3.6 4.8 4.6 4.2
6.43.96.44.2
7.24.26.84.6
6.85.16.45.3
7.24.27.24.3
3Abnormal termination after 40.67 seconds of transient due to "water property error"4 Calculated integral Break losses reached a defined peak value because flow reversal occured due to negative pressure difference between system pressureand suppression tank pressureSno experimental value available

EVENT MEAS. RELAP5/Mod2 CALCULATIONSDATA
.. _____ .Q unit _ 6.00 6-01 8-00 8-10 8-03 6-000 6-010 8-000 8-100 8-03CPressurizer emptying 6 T 9 15.0 14.4 14.4 17.6 17.4 17.6 14.4 14.4 17.6 17.6 18.8
-pressure V MPa 7.6 7.8 7.8 3.9 4.0 3.7 7.9 7.9 4.0 4.0 3.5
Accumulator emptying T s 40.0 40.0 40.0 39.6 39.2 37.2 42.4 42.4 41.2 40.77 39.6
0
0~
Peak cladding temp..' 9
Blowdown peakcladding temperature 10
in hot channel level-02
level-ll
level-21
TV
TVT
V
S
K
3
Ks
KS
K
26.41238
5.88445.8
11148.3
1162
6.8 6.8 26.0 41.2 37.61090 1090 1097 1118 1137
6.8 6.8 13.6 14.4 8.0691 691 705 720 7147.2 7.2 13.6 13.6 7.2725 725 739 758 9546.8 6.8 12.4 16.4 7.2
1037 1037 1043 833 1040
6.4 6.4 6.8 28.0 24.81084 1084 1074 1081 1095
6.46836.87186.4
1033
6.46836.87186.4
1033
7.26661.27226.8
1029
14.465413.674714.4818
1.67546.49556.4
1039
6Empty point for the calculation is a pressurizer level less than 0.01 m7Abnormal termination due to "water property error" when accumulator got nearly empty$Experimental value at level-24. Indicated temperature is an average of thermocouples TE-J08-024 and TE-F08-0249All predicted peak cladding temperatures at level-31"0 Reference values are averages of several temperatures inferred from thermocouple signals at the same axial level but different radial positions

EYENT MEAS. RELAP5/Mod2 CALCULATIONSDATA
[Qtunit P P 6-00 6-01 8-00 8-10 8-03 6-00c 6-01C 8-00C 8-10C 8-03C
level-24 T s 12.8 6.8 6.8 11.2 9.2 7.2 6.4 6.4 6.8 6.8 6.4V K 1230 1054 1054 1059 1045 1056 1047 1047 1042 1032 1061
level-27 T s 13.3 6.8 6.8 11.2 9.2 7.2 6A 6.4 6.8 6.8 6.4V K 1123 1082 1082 1085 1071 1086 1075 1075 1067 1056 1086
level-31 T s 12.8 6.8 6.8 11.2 9.6 7.2 6.4 6.4 6.8 6.4 6.8V K 1110 1090 1090 1090 1081 1091 1084 1084 1074 1065 1093
level-39 T s 11.8 6.8 6.8 9.6 10.0 7.2 6.4 6.4 6.8 6.8 6.6V K 1079 1023 1023 1025 1016 1037 1017 1017 1018 1005 1038
level-43.8 T s 12.3 6.4 6.4 6.8 1.2 7.2 6.0 6.0 6.4 1.2 6.4
V K 993 949 950 947 731 950 944 944 945 731 954o level-49 T s 12.3 0.8 0.8 0.8 0.8 1.2 0.8 0.8 0.8 0.8 1.2
V K 946 683 683 699 687 721 682 682 698 687 690
level-62 11 T s 7.8 - - - - - - - - - -
V K 770 - . . . .
11no significant peak of the cladding temperature found

EVENT MEAS. RELAP5/Mod2 CALCULATIONSDATA
_ __ _Qnit _ __ 6-00 6-01 8-00 8-10 8-03 -00C 6-01C 8-000 8-100 8-03C
0~
tr'
oo
0O
level-24
level-27
level-31
level-39
level-43.8
level-49
level-62'
TVTVTVTVTVTVTV
SK
SKSK
SK
s
KSKs
K
12.8123013.3112312.8111011.8107912.399312.39467.8770
6.8 6.8 11.2 9.2 7.2 6.41054 1054 1059 1045 1056 10476.8 6.8 11.2 9.2 7.2 6.4
1082 1082 1085 1071 1086 10756.8 6.8 11.2- 9.6 7.2 6.4
1090 1090 1090 1081 1091 10846.8 6.8 9.6 10.0 7.2 6.4
1023 1023 1025 1016 1037 10176.4 6.4 6.8 1.2 7.2 6.0949 950 947 731 950 9440.8 0.8 0.8 0.8 1.2 0.8683 683 699 687 721 682
6.4 6.8 6.8 6.41047 1042 1032 10616.4 6.8 6.8 6.4
1075 1067 1056 10866.4 6.8 6.4 6.81084 1074 1065 10936.4 6.8 6.8 6.6
1017 1018 1005 10386.0 6.4 1.2 6.4944 945 731 9540.8 0.8 0.8 1.2682 698 687 690
11no significant peak of the cladding temperature found

EVENT MEAS. RELAP5/Mod2 CALCULATIONSDATA
_Qjunit ý _6-00 6-01 8-00 8-10 8-03 6-0OC 6-01C 8-00C 8-10C 8-03C
H0~Cl
t'3
Cl0
Quench front' 4duringrefloodingin hot channel level-0215
level-1l
level-21
level-24
level-27
level-31
level-39
TVTVTVTVTVTVTV
s
Ks
KS
Ks
Ks
KS
KS
K
33.573048.398055.593564.5810
65.717805
67.51a850
61.519850
- - 30.5 31.2 34.0- - 580 570 580
33.2 42.2 32.5 40.2 55.0580 685 610 630 71055.5 68.0 62.5 52.0 71.5755 630 760 745 76062.5 75.5 69.0 62.0 79.0755 615 760 781 74070.5 83.0 77.5 71.0 88.3743 625 755 724 72576.5 90.0 85.5 78.5 94.5725 615 720 713 74376.5 91.0 86.0 74.5 94.0765 622 765 776 763
26.257029.562065.574578.678588.071294.571285.0730
26.157129.757089.5635
100.5640
111.5612118.0612
106.0643
31.853532.557081.083590.075598.5724
107.069595.0720
31.053532.3563
ist
25.257549.882575.077084.777394.5732
102.5722
100.5772
Ln
14Time and value of "knee temperature"Is- sign means no significant increase of the cladding temperatures16R1un terminated before quench front has reached this level17 Quench time varies between 62 and 70 a at the different thermocouples of level-27"Quench time varies between 61 and 74 a at the different thermocouples of level-311 9Quench time varies between 53 and 69 a at the different thermocouples of level-39

0
0o
EVENT MEAS. RELAP5/Mod2 CALCULATIONSDATA
__ unit ___ U6-00 6-01 8-00 8-10 8-03 6-000 6-010 8-00C 8-100 8-03C
level-43.8 T s 60.820 57.5 72.0 68.5 43.0 71.5 62.5 79.0 71.5 _21 75.5V K 825 765 700 760 656 740 752 612 670 - 740
level-49 T a 46.022 _.23 23 _23 35.0 37.5 28.2 27.5 34.5 - 25.0V K 730 - - - 550 594 651 657 511 - 548
level-62 23 T s 37.5 .--..- -.
V K 580 -- - -
in avg. channel level-ll T s 33.0 - - 37.2 30.0 44.2 26.0 26.5 28.2 29.0 28.5V K 645 __.23 _23 572. 560 594 532 530 600 528 605
level-21 T s 33.0 35.0 42.5 41.5 42.0 54.5 28.8 31.0 42.5 30.0 45.1V K 550 608 652 715 670 670 655 582 590 548 660
level-28 T s 39.0 48.0 58.0 49.2 43.0 54.0 36.0 49.0 28.0 - 29.5V K 580 720 605 595 665 635 672 625 600 - 548
level-392' T s 39.0 26.5 37.5 (31.8) (30.5) 37.5 27.5 27.2 30.0 - 28.5V K 580 642 625 (543) (545) 570 623 620 515 - 525
ON
"0Quench time varies between 41 and 51 a at the different thermocouples of level-43.821Run has been terminated before the quench front has reached level22Quench time varies between 42 and 52 s at the different thermocouples of level-4923No significant increase of cladding temperature24Values in brackets indicate the "quenching" of a rod which didn't heat-up very much

37
3.3.2 Minimum Collapsed Liq-uid Level
The next value of interest is the time whenthe collapsed liquid level in the core regionhas reached its first minimum, i.e. when thecore region was nearly emptied during theblowdown phase of the transient. Unfortu-nately, for the collapsed liquid level (or equiv-alent to it, the average liquid fraction in thecore region), no experimental data is avail-able. In table 3.2, the collapsed liquid level isgiven in percents relative to the total heatedcore height of 1.63 m. The comparison of theresults with the different nodalizations indi-cated no severe discrepancies with respect tothe values of the minimum collapsed liquidlevels. Their ranges varied between 2.9% and5.1% in the hot and 3.5% and 5.3% in theaverage channels. No significant trends havebeen observed with respect to the sophistica-tion of the nodalizations. The minimum col-lapsed liquid level has been reached between6.4 and 7.2 seconds after initiating the tran-sient except for runs 8-00 where it took 9.6.
3.3.3 Emptying Points of Pres-surizer and Accumulator
Two of the significant events during theLOFT-experiment have been found to be theemptying of the pressurizer and the accumu-lator.
The pressurizer emptied during the experi-ment at about 15.0 seconds after the openingof the break valves; at this moment, pressurein the pressurizer has decreased to a valueof 7.6 MPa. RELAP5/Mod2 calculated thisemptying point between 14.4 seconds for themost elaborated 6-00 and 6-01 nodalizationsand 18.8 seconds for the most simplified 8-03C but not for the equivalent (with respectto the namber of volumes and junctions) 3-02
nodalization, where this value was 17.6 sec-onds. It is not surprising that the time foremptying the pressurizer strongly dependedon the choosen nodalization. The pressuresin the pressurizer as calculated by the codehave been found to be quite close to the ex-perimental data for the 6-00 and 6-01 nodal-izations, for the 8-0... series of nodalizationswith their crude modelling especially in thepressurizer, the RELAP5/Mod2 -calculationsof the pressurizer pressures are rather poor,namely around 4 MPa or even less instead ofthe measured 7.6 MPa (the 4 MPa is compa-rable to the system pressure at the time ofemptying point).
The accumulator empties at about 40 sec-onds after the initiation of the experiment. Ingeneral, the code predictions seem to be suf-ficiently close to this experimental setpoint.This relatively good aggreement of the coderesults with the experimental findings is notat all surprising because the emptying timehas been tuned once for all for the 6-00 ver-sion of nodalization by increasing the forwardand reverse flow energy loss coefficients of theaccumulator junction from 13, as given in theoriginal EG&G, to about 125.
3.3.4 Peak Cladding Tempera-tures During the Blow-down Phase
Peak cladding temperatures of more than1200 K have been measured by only two ofthe six thermocouples radially distributed infuel assembly 5 (center of core) at core level24, i.e. 24 inches from the bottom of the core;one indicated 1220 K and the other the max-imum value of 1238 K.
The calculated peak cladding temperaturesalways occured at level-31, i.e. 31 inchesfrom the bottom of the core (by the way,for the original EG&G nodalization of the

38
core which was used for nearly all of the pre-and post-test analyses of the LOFT experi-ments, core levels-24 and levels-31 fall in thesame volume of the nodalization and conse-quentely indicated the same calculated tem-peratures). Their values only depend on thechoosen nodalization and vary between 1074K (8-00C) up to 1137 K (8-03), where the"C" versions always calculated slightly lowertemperatures. The highest values have beenpredicted by the most simplified 8-03 and 8-030 versions of nodalizations.
The next values of interest are the peakcladding temperatures reached at differentcore heights during the blowdown period ofthe experiment which occur in the first 15seconds after opening the break valves. Withrespect to the central core region (hot chan-nel), the blowdown peak cladding tempera-tures usually have been underpredicted byRELAP5/Mod2 in the range between 50 and350 K at all core levels. At the bottom andthe top of the core, for some runs no signif-icant increase of the cladding temperatureshas been calculated. With respect to theouter core (average channel), for all nodal-izations, the blowdown peak cladding tem-peratures have been underpredicted betweenapproximately 100 K and 200 K.
At the higher levels of the LOFT-core,top-down rewetting took place during theblow-down period of the experiment. Thistop-down quenching has not been calculatedby RELAP5/Mod2 (next item in table 3.2).Whereas at very high core levels (e.g. level-62), no significant increase of the claddingtemperatures at all has been calculated, atslightly lower levels (49 and 43.8) no char-acteristic drops of the cladding temperatureshave been predicted by RELAP5/Mod2 .Somehow exceptional are the results of nodal-izations 8-10 and 8-100 which have indicatedno stromg increases of the cladding temper-
atures even during the blow-down phase forall levels above level-43.8.
3.3.5 QuenchDuringPhase
Front Positionsthe Reflooding
The quench front positions during the re-flooding phase of the experiment have beenfound to be one of the most sensitive param-eters of the calculations. Therefore, the lastitem of table 3.2 will show the Comparisonbetween the experimental results (time andvalue at the "knee-point" of the temperaturetrace of one individual thermocouple at a cer-tain axial core level) and the equivalent codepredictions at 10 different core levels wherethermocouples have been installed. Becauseat a certain core height -the core-wide radi-ally distributed thermocouples may indicatedifferent quench front positions, we have usedan averaged value for time and temperatureat one core level but we have given the rangeof quench times of the different radially dis-tributed thermocouples at one core level inthe footnotes, if necessary.
The comparison of experimentally inferredand the RELAP5/Mod2 -calculated QF-positions using our different nodalizationshave shown the largest discrepancies of all thevariables listed in table 3.2. The calculatedQF-positions (i.e. times at a given core level)range from the quite accurate ones of the 6-00 and 8-00 nodalizations to the rather poorones using the "C"-versions of nodalization,i.e. taking into account the heat capacity ef-fects of the vessel walls. Here, at least inthe center of the core between levels-21 andlevels-31, the quench-times have been over-predicted by RELAP5/Mod2 more than 20seconds. The QF-temperatures calculated byRELAP5/Mod2 are usually 50 K to 200 Klower than the experimentally inferred ones.

39
For the average channel, the temperatureincrease as calculated by RELAP5/Mod2 wasusually higher than the cladding tempera-tures measured during experiment LP-LB-1
3.4 Time Behaviour ofSignificant Thermo-
Hydraulic Parameters
3.4.1 Cladding Temperatures
As we already have observed in table 3.2,RELAP5/Mod2 usually has underpredictedthe peak-cladding temperatures in the cen-ter channel of the core in the order of 50 Kto 200 K. By looking at the time history ofthe cladding temperatures at different axialheights of the core, it will become even moreclear that rather significant discrepancies be-tween the RELAP5/Mod2 calculations usingdifferent nodalizations and the experimentaldata exist.
Due to our specific nodalization of the coreregion which is identical for all of the investi-gated schemes, RELAP5/Mod2 is able to cal-culate the cladding temperatures in only twodifferent representative channels, namely the"hot channel" attributed here to the center-box 5 and the "average channel" which canbe attributed to one of the side boxes of theLOFT core; for the comparison with experi-mental data, we have used the side-box 4 (inprinciple, any other of the four side-boxes oran average of all of them could be used).
Let us start our discussion of the RE-LAP5/Mod2 calculations of the claddingtemperatures in the "hot channel", i.e. box 5of the LOFT core.
Cladding Temperatures in the CenterBox
In Figs. 3.5 to 3.14, the time traces of thecladding temperatures at 10 different coreheights in the center box (box 5) as calcu-lated by RELAP5/Mod2 ("hot channel" havebeen compared to the average temperature (!)at the specific core height where the averag-ing process has been described in chapter 3.1,using the different nodalizations as listed intable 2.1. For the sake of better readability,for each axial position two figures are givenin which it is shown five comparisons of "nonC"-type (plot a; versions 6-00, 6-01, 8-00, 8-03 and 8-10) and again five comparisons of"C"-type nodalizations (plot b; versions 6-00C, 6-01C, 8-00C, 8-03C and 8-10C), i.e.where the heat capacity effects of the vesselmaterial have been taken into account ("C"-
type) and where these have been neglected.At axial level 02, i.e. 2 inches from the bot-
tom of the core, the experimental claddingtemperatures have undergone a significanttemperature increase of nearly 300 degreesduring the blowdown phase of the experi-ment, which RELAP5/Mod2 has failed tocalculate both in time behaviour and in value.Whereas the experimentally inferred claddingtemperature remained at a high temperaturelevel during nearly 40 seconds, independentlyof the nodalization, the code calculated aquite cyclic behaviour. The final "cool-down"of the calculated cladding temperatures oc-curs nearly at the same time the QF reachedthe first level during the experiment; it oc-curs some 5 seconds earlier for the "C"-version calculations. It is worth noticing theRELAP5/Mod2 calculations using the mostdetailed nodalizations 6-00 and 6-000 (twopumps, most sophisticated modeling of thesteam generator secondary side, broken loopwith the highest number of volumes) seem to

40
900.
NOORLIZATION a
800. - 6-00806. ---- 6-01
8-00
CC B __ -10l
W_,, 600. oo"~i i.#•:,
C3
z 00. .83
C38j
.I-cr
U00 40 .f'
LOFT LP-LB-1 / POS 002
3 0 0 . . . ... r . . . . . . . ._ 1 . . . . . . . . . . . . . . . . . . . ., . .... . .. .. . . . . . . . . .-10. 0. 10. 20. 30. 40. 50. 6F. 70. 80.
TIME (SEC)
900.
800. 0 ? NOORLIZATION ,
7oo.•r .i o ... , .o- 6-O~CS-- 1C
Il"i ""8-_• _ C8-03C
a:.. 8_10C
CL I 0 (D TE-5LEVEL-02,,, ,o o . 1• ': _t '.>
I-,500.
0a:400.
3 0 0 . . .. - . . . . ........ -- -- -.. . . ........ ........ ......... ,. . . . .i. . . .
-10. 0. 10. 20. 30. 40. 50. 60. 70. 80.TIME (SEC)
Figure 3.5: Hot-channel cladding temperatures vs. time at axial level 02compared with'the equivalent reference temperature
a) by neglecting wall heat capacityb) by taking into account wall heat capacity ("C")

41
produce the poorest results.Generally, RELAP5/Mod2 seems to calcu-
late to much water in this lowest level whichdisables any significant core heat-up. Thereason for this overprediction of the watercontent may be due to the size of this hydro-dynamic volume which is around two timesthe size of a volume in the center of the core.
The "predicting capabilities" seem to have
only slightly been improved at the follow-ing axial level 11 (figs. 3.6). Again, ex-cept for nodalizations 8-03 and 8-03C, RE-LAP5/Mod2 -calculations are poor with re-spect to both time behaviour and value.Using nodalizations 8-03 or 8-03C, RE-LAP5/Mod2 has produced the right time be-haviour of the cladding temperatures but stillhas underpredicted the temperature rise atleast 200 K. The time of final "cool-down"varies between 30s (6-O0C) and 56s.(8-03).
Things have changed completely at axiallevel 21 (fig. 3.7). Here, except for nodal-izations 8-10 and 8-10C, RELAP5/Mod2 hasbeen able to reproduce at least qualitativelythe time behaviour of the cladding tempera-ture but still has underpredicted the temper-attire level for at least 120 K. The times offinal quenching vary in a range of 53s (8-10)and more than 80s, depending on the nodal-ization used for the calculation.
For the next four axial positions (24, 27, 31and 39 inches from the bottom of the core),figs. 3.8 to 3.12, the predicting capabilitiesof RELAP5/Mod2 may be characterized bysatisfactorly describing the qualitative time-behaviour of the cladding temperatures butstill missing it quantitatively.
As mentioned above, the highest claddingtemperature has been measured at level-24(the average value of the signals of two of theradially distributed thermocouples at this ax-
ial level) to be 1240 K. All of the calculationshave missed this value at least 180 K, thehighest underpredictions being those of the 6-00 and 6-00C nodalizations, i.e. the most de-tailed versions of nodalization (straight linesin both of the plots). On the other hand, thecalculation using the 6-00 nodalization cameclosest when tracing the QF position, where,except version 8-10, all the other calculationsfailed significantly.
For levels 27, 31 and 39 (figs. 3.9 to 3.11)calculated and experimental inferred valuesof the cladding temperatures came closer.Whereas for the nodalizations without tak-ing into account heat capacity effects, thediscrepancies are less than 50 K (underpre-diction), for the "C" versions we still have anunderprediction of more than 100 K. In ad-dition to this, again the "C" versions havedone a worse job in calculating the time offinal quenching of the cladding, i.e they usu-ally were off between 30 and 50 seconds com-pared to the "normal" versions which haveoverpredicted the final quench not more than30 seconds.
The last three levels under investigation,levels 43.8, 49 and 62 (inches from the bot-tom of the core) from the experimental sideof view are characterized by a significant top-down quench following the heat-up of thewhole core during the blow-down phase of theexperiment (figs. 3.12 to 3.14). This top-down quench is only slightly indicated in theexperimental results at level 43.8 (due to theaveraging process described in chapter 3.1)but clearly seen in the references at levels 49(fig. 3.13) and 62 (fig. 3.14).
Generally, RELAP5/Mod2 has been un-able to calculate this top-down quench; thequalitatively reasonable reproduction of thecladding - temperatures generated by RE-

42
LU
I_-
I.-
C.,z
cc0jUJ
1200.
1100.
1000.
900.
800.
700.
600.
500.
400.
.. .. . . . .. . . .. . .. . .. . . .. . . ........ I......... I ..... .
a A#5 "Aita~~
• %• NODRLIZATION'
A AA-6 6-00A --- 6-01
8-00
8-10
* \Ai ~~A TE-SLEVEL- 11
LOFT LP-LB-1 / P5 011
. . .. .. . . . I . . . . .I .. . . . .. . . , .. . . . .. . . .I . . . , I . . . . .:300.
1200.
1100.
1000.
-10. 0. 10. 20. 30. A4.TIME (SEC)
50. 60. 70. 80."
Cr
0-Lii
CD
C,cr-J
900.
800.
700.
600.
500.
400.
300.-10. 0. 10. 20. 30. 40. 50. 60. 70. 80.
TIME (SEC)
Figure 3.6: Hot-channel cladding temperatures vs. time at axial level 11compared with the equivalent reference temperature
a) by neglecting wall heat capacityb) by taking into account wall heat capacity ("C")

43
1200.
1100.
W
I.-
u-iC3
Cc
_jU
900.
800.
700.
600.
500.
400.
300.
1200.
1100.
1000.
900.
800.
700.
600.
500.
TIME (SEC)
Cr
L*J
C3cc_jU
400.
300.-10. .0. 10. 20. 30. 40. 50. 60. 70. 80.
TIME (SEC)
Figure 3.7: Hot-channel cladding temperatures vs. time at axial level 21compared with the equivalent reference temperature
a) by neglecting wall heat capacityb) by taking into account wall heat capacity ("C")

44
1200.
1100. L x
w•X ,,•X X x.100-.
9 700.
-- 008-00 jor A
.. sLOFT LP-LB-I / POS 024 6-10~~X TE-SLEVEL-24 s
400.
-10. 0. 10. 20. 30. 40. 50. 60. 70. 80.TIME (SEC)
1100. 6 "
0- 800.0
a-0
700. NOORLIZATION '
"'- 6-GOC
60 . 8-0OOC38-03C
500.---- - C
-J SOO 8-10C
40U . X TE-SLEVEL-24
3 0 0 . . . . .'..... . . ......... I ... . - ........ . . . . .'. . . . .'. . . . .'. . . .
-10. 0. 10. 20. 30. 40. 5.0. 60. 70. 80.TIME (SEC)
Figure 3.8: :Hot-channel cladding temperatures vs. time at axial level 24
compared with the'equivalent reference temperaturea) by neglecting .wall het .capacity .b) by taking into account wall heat capacity ("C"1

45
CLl
I.-
C3,
-JU-
1200.
1100.
1000.
900.
800.
700.
600.
500.
Cr(L"1:I.-
_.J
C-
CM
C.,
-jUi
400.
300.
1200.
1100.
1000.
900.
800.
700.
600.
500.
400.
300.
-10. 0. 10. .20. 30. 40. 50. 60. 70. 80.TIME (SEC)
-10. 0. 10. 20. 30. 40. 50. 60. 70. 80.TIME (SEC)
Figure 3.9: Hot-chiannel cladding temperatures vs. time at axial level 27compared with the equivalent reference temperature
a) by neglecting wall heat capacityb) by taking into account wall heat capacity ("C")

46
CcLai0-
C.,zr0j0
1200.
1100.
1000.
900.
800.
700.
600.
500.
400.
300.
1200.
1100.
1000.
TIME (SEC)
lii
I.-
C,
00r_jUJ
900.
800.
700.
600.
400.
300.-10. 0. 10. 20. 30. A4. 50. 60. 70. 80.
TIME (SEC)
Figure 3.10:
a)b)
Hot-channel cladding temperatures vs..time at axial level 31compared with the equivalent reference temperature
by neglecting wall heat capacity_by taking into account wall heat capacity ("0")

47
wra:I-
a:
C1~
0
-1Ui
1200.
1100.
1000.
900.
800.
700.
600.
500.
400.
300.
1200.
1100.
1000.
TIME (SEC)
LU-a:
LD.
C3C3LZJ_jU
900.
800.
700.
600.
500.
400.
300.
Figure 3.11:
a)b)
-10. 0. 10. 20. 30. 40. 50. 60. 70. 80.TIME (SEC)
Hot-channel cladding temperatures vs. time at axial level 39compared with the equivalent reference temperature
by neglecting wall heat capacityby taking into account wall heat capacity ("C")

48
wa:Q=U:
C3_jJ
0U
1000.
900.
800.
700.
600.
500.
400.
300.
1000.
900.
800.
700.
600.
500.
400.
TIME (SEC)
LJ
a:ICr"
{Li"a-tLJ
0-
0
-C.. JUJ
300.
Figure 3.12:
a)b)
-10. 0. 10. 20. 30. 40. 50. 60. 70. 80.TitlE (SEC)
Hot-channel cladd. temperatures vs. time at axial level.43.8compared with the equivalent reference temperature
by neglecting wall heat capacityby taking into account wall heat capacity ("C")

49
cr
LD
0
Cc
1000.
900.
800.
700.
600.
500.
400.
300.
1000.
900.
800.
700.
600.
500.
400.
TIME (SEC)
LU
0~
C3
C-,_j0
300.
Figure 3.13:
a)b)
-10. 0. 10. 20. 30. 40. 50. 60. 70. 80.TIME (SEC)
Hot-channel cladding temperatures vs. time at axial level 49compared with the equivalent reference temperature
by neglecting wall heat capacityby taking into account wall heat capacity ("C")

50
800.
x ~NOORLIZRTION600.0
700. X. 6-01
8-00er 8-03
-x8-10
•JX TE-SLEVEL-62a-
., 500.Z
,_j 40.
LOFT LP-LB-I / POS 062
-10. 0. 10. 20. 30. 40. 50. 60. 70. 80.TIME (SEC)
900.
800. NOORLIZATION a
6-OOC__6-01C
____8-00C7 0 0 . X . . - 0X 8-03C
WX 6_10x 8-18C
)X TE-5LEVEL-62Cr 600. " , X
LU
CLI_-
500.z
Li 400.:_
3 0 0 . .... t . . . . . . . . . . . . . . . . ....... ........ . ........ N .... . .
-10. 0. 10. 20. 30. 40. 50. 6R. 70. 80.TIME (SEC)
Figure 3.14: Hot-channel cladding temperatures vs. time at axial level 62compared with the equivalent reference temperature
a) by neglecting wall heat capacityb) by taking into account wall heat capacity ("C")

51
LAP5/Mod2 using the 8-10/8-10C nodaliza-tions seems to have other reasons. Whereasat level 43.8, for all the nodalizations except8-10, RELAP5/Mod2 calculated a drastic in-crease of the cladding temperature nearlyreaching the experimentally inferred values,it totally failed in describing the followingtemperature drop due to the top-down rewet-ting (fig. 3.12). The cladding temperaturerather stayed at a high temperature level un-til the QF reached axial level 43.8. The timeof final quenching was calculated more or lessexact by the 6-00 version; all the other ver-sions of nodalization have overpredicted thistime between 12 and 20 seconds.
On axial levels 49 and 62 (figs. 3.13 and3.14) even the drastic increase of the claddingtemperature has not been calculated by RE-LAP5/Mod2 and only some small tempera-ture spikes have been predicted which not atall give a qualitative right picture of what hashappened in this region of the core during thetransient. Whereas at level 49, some heat-upcycles have been created by RELAP5/Mod2,the code assumed no heat-up at all for level62.
Different to this general trend are the cal-culations of RELAP5/Mod2 using nodaliza-tions 8-10 and 8-10C. Here, the "hydraulicnodalization" is identical to the 8-00 nodal-ization, but the modelling of the fuel rodsdiffers significantly, namely, the number ofradial meshes has been reduced from 10 to5 radial nodes in the hot rod (one cladding,one gap and 2 fuel zones). Obviously andas long as the cladding temperatures areconcerned, these simplifications have a se-vere influence on the predicting capabilitiesof RELAP5/Mod2 in the upper part of theLOFT core for a large break experiment likeLP-LB-1.
Cladding Temperatures in Side Box 4(Average Channel)
In figs. 3.15 to 3.18, the time traces of thecladding temperatures at four different coreheights in the side box 4 as calculated by RE-LAP5/Mod2 for the "average channel" havebeen compared to an average temperature atthe specific core height (if the reference is in-dicated by the word "level") or to one singlethermocouple signal (if a specific number isgiven as reference, e.g. 4G14). Again, forthe four axial positions, located 11, 21, 28and 39 inches from the bottom of the core,two plots are given showing the comparisonof the normal (plot a) and the "C" type ofnodalizations (plot b).
RELAP5/Mod2 was not successfull in cal-culating the time behaviour of the claddingtemperatures at the four different axial levelseither qualitatively or quantitatively. Insteadof describing a significant core heat-up fol-lowed by a steep temperature drop and a sec-ond heat-up to lower peak values, it has pre-dicted a more or less instantaneous core heat-up for levels 11 and 21 and less pronouncedalso for levels 28 and 39. The peak values ofthe temperatures and their time of occurenceare not at all comparable to the experimen-tal data. Furthermore, the discrepancies be-tween the results of the different nodaliza-tions were found to be high.
Summarizing Remarks on the CladdingTemperature Calculations
Summarizing our findings with respect toRELAP5/Mod2 -calculations of the claddingtemperatures in both the hot and the averagechannels one has to conclude that:
* in the lower and upper parts of the hotzone of the core (less 15 inches or higherthan 45 inches from the, bottom of the

52
1000.
900. NOORLIZATION
Ago- 6-00
- 800. 6-018-008-03
,., 700. .oB_ _ -10cc
a: .. 0 TE-AG14-011
W 600. 0.X: 0I
CI-
z 500.400.
LOFT LP-LB-I / CLRDDING TEMPERRTURE RVG-011300 . .. .. . .... ....
-10. 0. 10. 20. 30. 40. 50. 60. 70. 80.TIME (SEC)
1000 . .........
900. NODRLIZATION ,
a 6-OOC
800. - 6-01Cc .. 8-00C
8-03C
700._ 8-10C
(D TE-4GI4-011
"' 600.
z 500.
400.
3 00.
-10. 0. 10. •20. 30. 40. 50. 60. 70. 80.TIME (SEC)
Figure 3.15: Average channel clidding temperatures vs. time at axial level 11compared with the equivalent reference temperature
a) by neglecting wall heat capacityb) by taking into account wall heat capacity ("C")

53
1000.
900. - NOORLIZATIONA -• 6-00
- 800. A 6-01. -00
.- "\", 8-03. , 700. • 8-10
. TE-LEVEL-021
U 600. A A A
z 500.- ,A
'- 400.-1. 0 10 2. 3.LOFT LP-L8-] / CLADDING TEMPERATURE RVG-021
-1. 8. 1. 0 3. 40. 50. 60. 70. 80-TIME (SEC)
1000.
900. ,A NOORLIZATION,cA 6-00C
400. , 6-aiC
- " A __ 8 0-3C
L- L.1- \v TE-LEVEL-02!
6 500.
'-a 400. I
300. A - -- 6.1
-10. 0. 10. 20. 30. 40. 50. 60. 70. 80.
TiMle (SEC)
Figure 3.16: Averaged channel cladding temperatures vs. time at axial level 21compared with the equivalent reference temperature
•a) by neglecting wall heat capacityb) by taking into account wall heat capacity ("C")

54
900. .
800.+ NOORLIZATION 64* 6-00
8-4 -" 700. •. /, " 8-03"
'A ,8-10M + IE-4HIA-028a: i'. .'
*- 500. ••i•
a::
S400.LOFT LP-LB-I / CLRDOING TEMiPERRTURE FRVG-028
-10. 0. 10. 20. 30. 40. 50. 60. 70. 80.
TItiE [SEC)
900.*
boo..
+ NOORLIZRTION '
800. 6-OOC
6-00W4W
4•.. 6-01C+ -.. 8-00C
S700.• _ 8-03C.,8-OC
•"600. ""
_-i
500.
C3
300. .
-10.. 0. 10. 20. 30. 40. 50. 60. 70. 80.TIME (SEC)
Figure 3.17: Averaged :channel cladding temperatures vs. time at axial level 28compared with the equivalent reference te'mperature
a) by neglecting wall heat capacityb) by taking into account wall heat capacity ("0")

55
900.
800.x NODRLIZRTION '
-- 6-00x • 6-01
v 700. _ _ _. 8-00__ 8-03
8-10Ui
SX TE-AIIA-039600.cc
C=XV
LdC-2.:
500.
81 400.
X 6-B1C700. .... 8-C
X TE-,4114-03910. 0
•- 500.goo.
0 00
0i
7i 00. -- 0C
- 10. 0. 10. 20. 30. 40. 50. 60. 70. 80TIM-E (SEC)
Figure 3.18: Averaged channel cladding temperatures vs. time at axia~l level 39compared with the equivalent reference temperature
a) by neglecting wall heat capacityb) by taking into account wall heat capacity ("C")

56
core) as well as in the average chan-
nel, RELAP5/Mod2 was not success-full in describing the time behaviour ofthe cladding temperatures either quali-tatively or quantitatively.
" in the center part of the hot zone ofthe core, RELAP5/Mod2 calculated thetime behaviour of the cladding temper-ature qualitatively but underpredictedthe temperature level between 50 and200 degrees.
" generally, the time of final quenching hasbeen overpredicted by RELAP5/Mod2 .In the hot channel, these overpredictionsare usually higher for the "C"-versionsof nodalization; for the average channel,the opposite is the case.
" RELAP5/Mod2 has calculated the peakcladding temperature at axial level 31,i.e. 31 inches from the bottom ofthe core, whereas the experimentally in-ferred hotspot is located at level-24.
The reasons for the deviations are multi-ple. Concerning the axial shift of the hot spot(third item), one of the reasons may be anincorrect assumption of the axial power dis-tribution in the LOFT core; as mentioned insection 2.1, we have used the one publishedby 15].
For investigating on this problem, the ax-ial distributions of the cladding tempera-tures in the hot channel as calculated byRELAP5/Mod2 using all the "non-C" typesof nodalization have been compared to theequivalent experimental data for four differ-ent time points of the transient, namely at-1.2 seconds (i.e. the stationary part of thetransient), at 5.3 seconds (blowdown phase),at 20.5 seconds (intermediate phase, start of.refill) and at 70.5 seconds, i.e. during the re-,flood phase (figs. 3.19 a to d).
In fig. 3.19a, the comparison was madefor the stationary phase of experimentLP-LB-1 . All RELAP5/Mod2 calculationsindicated very similar axial distributions ofthe cladding temperatures which only in themiddle and in the upper part of the core (coreheights .6 to 1.6) are close to the experimen-tal data (circles in the plot) whereas they dif-fer at the bottom about 40 K. In fact, theexperimentally inferred axial cladding tem-perature distributions have been found to bemuch more variing than the one calculatedby RELAP5/Mod2. One of the reasons maybe the fact that RELAP5/Mod2 neglects theaxial heat conduction in the cladding as wellas in the fuel thus preventing from smooth-ing out steep axial temperature gradient inthe cladding and the fuel (axial conduction isonly considered by RELAP5/Mod2 near thequench- front when the reflood model is ap-plied). On the other hand, if a change in theaxial power distribution would bring any im-provements is an open question and has notbeen tested yet.
During the blowdown interval, i.e. 5.3 sec-onds after the initiation of the transient (fig.3.19b), the axial cladding temperature distri-butions as calculated by RELAP5/Mod2 us-ing different nodalization schemes differ quitesignificantly both to each other as well asin comparison to the experimental findings.The calculated peak cladding temperaturesare centered around 0.75m whereas the cor-responding experimental values (triangles)have been found at approximately 0.55m. Ontop of this, the RELAP5/Mod2 calculatedcore heat-ups were rather concentrated inthe center region of the core (0.4 to 1.2m)whereas the experimental data indicated amore widened core heat up. Again, one ofthe 'reasons may be the neglection of axialheat conduction in the' cladding as well as inthe fuel by the 'code.

57
650;
640.
.630.
I-.Cc
CLi
zU
620.
610.
600.
590.
580.
7
LOFT-LP-LD-1. AXIAL DISTR. OF CLO-T (HOT), T=-1.25 -C)0j 570.
560.
550.
1200.
1100. "
0
NODRLIZATION ,
0 EXPERIMENT, LP-LB-1
I - - I I " . I - I
6-006-018-008-038-10
1. 0.2 0.4 0.6 0.8CORE HEIGHT (MI)
1.0 1.2 1.4 1".6
0-z:
U.,I~ ,
Cc
1000.
900.
700.
600.
500.0.
CORE HEIGHT (M)
Figure 319: Axial cladding temperature distribution in the hot channel comparedwith the equivalent averaged reference temperatures in box 5
a) at -1.2 seconds (stationary phase)b) at 5.3 seconds (blow-down phase)

58
Lda-1:
LU
CC0j
L0
120(3.
1100.
1000.
900.
800.
700.
600.
500.
900.
850.
800.
750.
700.
650.
600.
550.
500.
450.
400.
CORE HEIGHT (M)
,NO DALIZAiTION|
I..-, I.
LOFT-fl1STR
6-00C-61 I
CC
a:CE
8-00 /8-10/
X EXPERIMENT a /LP-LB-I/" \
: I \I
i I A
IP-LB-1. AXIAL.7
OF CLO-T
(HOT), T=70.5
k______
I = I I I I I ] I I I iI I I . . . . . . .
0. 0.2 0.4 0.6 0.8 1.0CORE HEIGHT (M)
1.2 1.4 1.6
Figure 3.19: Axial cladding temperature distribution in the hot channel'comparedwith the equivalent averaged reference temperatures in box 5
c) at 20.5 seconds (intermediate phase)d) at 70.5 seconds (reflood-down phase)

59
Closest to the experimental data are the RE-LAP5/Mod2 calculations based on the 8-03nodalization, i.e. the most simplified version( - -.. . l i n e s ) . . .
Things do not change significantly for thetwo remaining time point of consideration,namely 20.5 seconds (intermediate stage be-tween end of blow-down and beginning of re-fill) and 70.5 seconds (reflood phase) after theinitiation of the transient (figs. 3.19 c andd). Compared to the experimental findingsof a heat-up of nearly the whole core withthe peak value at 0.6 m, RELAP5/Mod2 stillhas calculated a core heat up centered to themiddle of the core with the peak value at 0.75m. In contrary to time-point 20.5s, whereRELAP5/Mod2 still has underpredicted thepeak cladding temperatures, at 70.5s RE-LAP5/Mod2 overpredicted the cladding tem-peratures in the center of the core dependingon the choosen nodalization between 250Kand 400 K; but these overpredictions have tobe attributed to errors in the calculation ofthe time of final quenching which usually hasbeen overpredicted 10 to at least 25 seconds(from the codes point of view, parts of therods are still in high temperature conditionswhereas in the experiment, they already havebeen quenched at this time).
Void Fraction, Flow Regime and HeatTransfer Coefficients in the Core Zone
Besides the heat generation in the fuel(source), the other important quantity influ-encing the cladding temperature is the heattransfer from the cladding to the .surround-ing fluid (sink). To find some reasons for thedeviations of the time traces of the claddingtemperatures for different nodalizations, onehas to investigate the heat transfer to thefluid at the specific nodes for these differentnodalizations even no experimental reference
is available.The heat transfer, expressed by the heat
transfer coefficient (HTC), is dependingon the mass flow, the local void frac-tion and the flow-regime "assumed" by RE-LAP5/Mod2 which itself mainly refers to thelocal void fraction as well as to the mass flowand the system pressure. Consequentely, er-rorneous mass flows and void fraction distri-butions will lead to wrong heat transfer coeffi-cients and finally to questionable predictionsof the cladding temperatures.
In Figs. 3.20 to 3.27 from top to bot-tom the local void fractions, the flow regimesas choosen by RELAP5/Mod2 and the heattransfer coefficients have been plotted ver-sus time for axial levels 27 inches (figs. 3.20to 3.23) and 43.8 inches from the bottom ofthe core (fig. 3.24 to 3.27). The comparisonhas been made for four versions of nodaliza-tions, namely 6-00, 6-01 (most detailed), 8-10(medium simplified) and 8-03 (most simpli-fied).
For all four types of nodalizations, the timebehaviour of the local void fraction at theequivalent axial level seem to be comparable,although the decrease for times higher than70 seconds is more pronounced for the 6-01and 8-10 versions. After the initiation of thetransient, the void fraction has increased veryrapidly from zero to nearly 100%, where itremained until refilling has reached the levelunder investigation. Then the void fractionremained quite unstable for another 10 to 20seconds, where the oscillations of the voidfraction nearly covered half of its range.With regard to these oscillations, the mostsimplified 8-03 versions of nodalization (moresimplified with respect to the outer primarysystem and not to the core region which re-mained unchanged for all the different nodal-izations) seems not to be more unstable thanthe most detailed versions 6-00 and 6-01. But

60
1. 00
U-
Cr
X
0.
0.75
0.50
0.25
0.00
mistInverted slugInverted annularAnnular-mistSlugBubblyHigh mixing mistHigh mixing transitionHigh mixing bubbly
i010
U_
LL_U-U,
U_LO
0
Cc
Uj
"a-
10-10. 0. 10. 20. 30. 40. 50. 680. 70. 80. 90. 100.
TIME (SEC)
ligure 3.20: Calculated void fraction, flow regime and HTC (nodalization 6-00)for level-27 in the hot channel

61
0
C-
U-
0
CD
1.00
0.75
0.50
0.25- LOFT LP-LB-I (NOD. 6-01) /POS. 27H 7
0.00
MistInverted slugInverted annularAnnular-mistSlugBubblyHigh mixing mist-High mixing transitionHigh mixing bubbly
S
10
10U-U-LJ
Cr
10
cc)
U.tJU_
10.a...t:"r 1
- , 9 , 9 *t 9 9 9 9 9
I: 9 9 9 x .:.9.:..9 9.. 9 9
-10. 0. 10. 20. 30. 40. 50.TIME (SEC)
60. 70. 80. 90. 100.
F'igure 3.21: Calculated void fraction, flow regime and HTC (nodalization 6-01)for level-27 in the hot channel

62
CCMU_.
C)
1.00
0.75
0.50
0.25
0.00
MistInverted slugInverted annularAnnular-mistSlugBubblyHigh mixing mistHigh mixing transitionHigh mixing bubbly
S.
10
A
S10
U_
S10
cr
10 .... ,I,,--- ..- ........ .... .... .... .... .... .... .... ....
-10. 0. 10. 20. 30. 40. 50. 60. 70. 80. 90. 100.TIME (SEC)
Figure 3.22: Calculated void fraction, flow regime and HTO (nodalization 8-10)for level-27 in the hot channel

63
1.00
0.75z
I-
cr
UL.
03
e.50
0.25
MistInverted slugInverted annularAnnular-mistSlugBubblyHigh mixing mistHigh mixing transitionHigh mixing bubbly
S10
N
-,
LL.U..
W 10'I.LLLi.
z
S102crLLI
1-:10. :0. 10. 20. 30. 40. 0. 60. 70. 80. 90. 100.
Figure 3.23: Calculated void fraction, flow regime and HTC (nodalization 8-03)for level-27 in the hot channel

64
z
0CD,
1.00
0.75
0.50
0.25
0.00
MistInverted slugInverted annularAnnular-mi StSlugBubblyHigh mixing mistHigh mixing tran•High mixing bubb
sitionl
I y
S10
N
S10,ILLILL
C-) 3b~10
cc
C= 2'T10
10
L .. .-- ... I . I .... I ...... I ......... I - ---- -------. . . . .I . . . . .I. . . . .I . . . . .I......... I......... I......... l......... l......... I . .. . . I . .. . .
I I I I I I I I
-10. 0. 10. 20. 30. 40. 50. 60. 70. 8E. 90.TIME (SEC)
100.
Figure 3.24: Calculated void fraction, flow regime and HTC (nodalization 6-00)for level-43.8 in the hot channel

65
1.00
0.75z0
crW:LRCD
0.50
0.25
MistInverted slug
Inverted annularAnnular-mistSlug
BubblyHigh mixing mist
High mixing transit
High mixing bubbly
$10
S10U-U
10
Li
cc 1Cr,
• 102
10-10. 0. 10. 20. 30. 40. 50. 60.
TIME (SEC)70. 80. 90. 100.
Figure 3.25: Calculated void fraction, flow regime and HTC (nodalization 6-01)for level-43.8 in the hot channel

66
0
Ci9=
CL
1.00
0.75
0.50
0.25
0 . 0 0 t = = --------- -- -- . . . . . . . . . . . . . . .!. . . . . . . . .......... ......... !........ --.......
MistInverted slug
Inverted annularAnnular-mistSlugBubblyHigh mixing mistHigh mixing transition
High mixing bubbly
10
S10
LA_LL.
(C)W 10
LL.za:
F10
"rLiJ
10 -----I. ....- ----10. 0. 10. 20. 30. 40. 50. 60. 70. 60. 90. 100.
TIMiE (SEC)
Figure 3.26: Calculated void fraction, flow regime and HTC (nodalization 8-10)for level-43.8 in the hot channel

67
1.00
z
U
Cr.U_CD
0.75
0.50
0.25
0 .0 0 -- -- -.. . . . . . . . . . . . . ..... I ----..... !I.... ý..... 1 - -. . ý...! I........ .! ...... ._1 .......... I I ......... I I I .... I .........
MistInverted slugInverted annularAnnular-mi StSlugBubblyHigh mixing mistHigh mixing transitionHigh mixing bubbly
S
10
N,4"2 10tL.ti-IL)
W 10,LL.
cc
10 .........-10. 0. 10. 20. 30. 40. 50. 60. 70. 83. 90. 100.
TIME (SEC)
Figure 3.27: Calculated void fraction, flow regime and HTC (nodalization 8-03)for level-43.8 in the hot channel

68
generally, compared to axial level 27, theseoscillations have been found to be signifi-cantly smaller at axial level 43.8.......
The void fraction is one of the main param-eters of RELAP5/Mod2 to determine the flowregime which itself is a key information forthe evaluation of the interfacial heat trans-fer as well as of the interfacial shear stresscoefficient which, to close the circle, againhighly influences the void fraction distribu-tion. Therefore, the graphs in the center offigs. 3.20 to 3.27 show the flow regimes, asdefined by the code, as a function of time. Inthe stationary phase of the experiment, RE-LAP5/Mod2 decided for slug-flow in the hotzone of the core. After the initiation of thetransient, it decided for inverted slug-flow oralternatively mist-flow until the occurence ofthe quench at the level under investigation.Then again, slug-flow has been assumed alter-natively with annular-mist-flow. Dependingon the nodalization used for the calculation, asmaller or even greater number of "switches"between inverted slug and mist-flow on oneside and between slug and annular-mist-flowon the other side may occur. The differencesof the latter two flow regimes are minor im-portant for the determination of the heat-transfer-coefficient (HTC) from the wall tothe liquid but may result in enormous differ-ences when evaluating the interfacial frictionfactors and the interfacial heat transfer coeffi-cients. Probable oscillations in these two im-portant quantities are then feedbacked, caus-ing instabilities in the void fraction calcula-tion.
The lower graphs on figs. 3.20 to 3.27show the heat-transfer-coefficients (HTC) asa fuction of time. As expected, heat-transfer-coefficient drops rapidly within the inverted-slug / mist-flow regimes thus resulting inheat-up of the fuel. Occurance-of the rewet-ting is well indicated by the steel) increase of
the heat-transfer-coefficient between 40 and90 seconds, depending on the axial locationand the type of nodalization.
We would like to focus the attention ofthe reader on some inconsistencies betweenthe flow regime indicator (middle plot) andthe heat-transfer-coefficient (lower plot) moreor less pronounced in all of the eight calcu-lated cases, namely that the time-traces ofthe flow regime indicator and of the heat-transfer-coefficient indicate "quench" at dif-ferent times. Whereas at axial level 27 (figs.3.20 to 3.23), this discrepancy is only afew seconds (the "quench time" of the heat-transfer coefficient is comparable to the valuegiven by the steep negative gradient of thecladding temperature, see fig. 3.9), at ax-ial level 43.8 (figs. 3.24 to 3.27) this dif-ference is raised up to 40 seconds, slightlydepending on the nodalization (again, theheat-transfer-coefficient "quench" is compa-rable to the cladding temperature "quench"on fig. 3.12). In other words, for longer pe-riods, RELAP5/Mod2 calculated the heat-transfer-coefficient from the cladding to thecoolant assuming completely other flow con-ditions than the heat-transfer-coefficient be-tween the steam and liquid phases.
As we have already mentioned above, flowregime and heat transfer coefficients in thecore region are strongly depending on the ax-ial void fraction distribution as well as on themass flows in the core region. Both of themare determined by the thermohydraulic con-ditions in the primary system of the LOFTreactor like the intact and broken loops, thepressurizer, the heat sink (steam generatorsecondary side or a more simplified version ofit), the primary coolant pumps and the be-haviour of the ECO-systems. The predictionsof their behaviour during the transient de-

69
pend on the ability of the code in describingthe sequence of thermohyraulic phenomena.Therefore, a realistic description of the mainphenomena has to be regarded as a "conditiosine qua non" for the predicting capability ofthe key parameters like the cladding temper-atures.
In what follows, we shall concentrate on thedescription of these phenomena by. consider-ing some other important parameters. Butbefore we start this discussion, we would liketo look also at the second key parameter,the center fuel temperatures, with respect tosafety aspects, which in the case of a largebreak are of less importance because the re-actor has been scrammed within parts of asecond after the initiation of the transient,thus drastically, reducing the heat generationwithin the fuel.
3.4.2 Fuel Center Temperatu-res
Only at two axial levels experimentally in-ferred fuel center temperatures are avail-able, namely at levels 27'and 43.8 (i.e. 27inches and 43.8 inches from the bottom ofthe core). The equivalent prediction's of RE-LAP5/Mod2 for the different- nodalizationschemes have been compared to the exper-imental data and plotted in figs. 3.28 and3.29. The experimental data are average val-ues of fuel center temperature data at 10 ra-dially distributed positions on axial level 27of the center box 5 and of 5 thermocouples ataxial position 43.8.
Obviously, at both levels the highest fueltemperatures have been reached at full powerconditions, before the transient has been ini-tiated. For these stationary conditions, thecalculated temperatures at both axial levelsare quite close to the experimental data, in-dependenitly of the type of nodalization, al-
though the temperature is approximately 400K lower at the higher core position.
During the transient, at axial level 27 (fig.3.28), the calculated fuel center tempera-tures have been found to be in satisfactorlygood aggreement with the experimentally in-ferred reference temperatures both qualita-tively and quantitatively and the differencesbetween the results of RELAP5/Mod2 usingdifferent nodalizations are quite small.
At level 43.8 (fig. 3.29), the aggreementwith the experimental data is a little bitworse with respect to the qualitative time be-haviour. Probably due to top-down quench-ing in the upper part of the core, the ex-perimentally inferred center fuel temperaturehas dropped significantly between 18 and30 seconds of the transient. This temper-ature drop has not been calculated by RE-LAP5/Mod2 because it failed to catch thetop-down quench phenomenon as we have al-ready discussed in section 3.4.1. An excep-tional behaviour is indicated by the resultsof the 8-10 / 8-10C calculations. Here, thereduction of the number of radial meshes inthe fuel rod has lead to results which totallyunderestimated the experimentally inferreddata.
3.4.3 System Pressures
It is a well-known fact, that most of thebest-estimate codes do a quite satisfactoryjob when predicting the system pressures.Our investigation also confirms this commonknowledge.
In figs. 3.30a and b, the system pressuresas calculated by RELAP5/Mod2 have beencompared to the experimental data, i.e. theabsolute pressures as measured by the pres-sure transducer mounted in the cold leg ofthe intact loop at station PC-002. As usualin this contribution, we again have separated

70
2000.
1800.
Ld
I--
Lij
LI-J
1600.
1400.
1200.
1000.
500.
600.
400.
2000.
1800.
-1600.
NODRLIZATION*6-00
6-01.8-00
__0-3
_-_8-10- TC-SLBVEL-027 f- 37 K
LOFT LP-LB-I / FUEL CENTRAL TEMPERATURE (POS-027)
' . . .. . I . . . . . . . . . . . . . I . . . . . I -.. . . .I.. . . 1 . .
-10. 0. 10. 20. 30. 40. 50. 60.TIME (SEC)
70. 80.
Li
0..
LiI--
z
U-
1200.
1000.
800.
600.
400.20. 30. 40. 50. 60. 70. 80.
TIME (SEC)
Figure 3.28: Fuel center temperature in the hot channel at level-27 comparedwith averaged fuel temperatures measured at level-27
a) by neglecting wall heat capacityb) by taking into account wall heat capacity ("C")

71
1600.LOFT LP-LB-I / FUEL CENTRAL TEMPERATURE (POS-43.8)"
NODALIZRTION
1400. - 6-00
6-010 .... 8-00
1200. - -03CC "" i,•,8-10'
Cc 0 TC-5LEVEL-43.8 + 37 K1000
LLI-
c 800.
4U 00.tLL.
-10. 0. 10. 20. 30. 40. 50. 60. 70. 80.TIME (SEC)
1600.NOOALIZATION .
6-OOC1400. 6-01C
8-00C8-03.1200.• 6 -- -10C.
Il 0 TC-5LEVEL-43.8 + 37 K
al:W 1000."L
I- \W9 800.
-j
-10. 0. 10. 20. 30. 40. 50. 60. 70. 80.TIME (SEC)
Figure 3.29: Fuel center temperature in the hot channel at level-43.8 comparedwith averaged fuel temperatures measured at level-43.8
a) by neglecting wall heat capacityb) by taking into account wall heat capacity ("C")

72
IS.
14.
13.
12.
11.
10.
9.
8.
7.
6.
5.
4.
3.
2.
1.
0.-
TIME (SEC)
15.
14.
13.
12.
11.
10.
9.
8.
7.
6.
5.
4.
3.
2.
1.
0.-10. 0. 10. 20.
TIME (SEC30. 40. 50. 60.
Figure 3.30: System pressures in the cold leg vs. time compared with pressuremeasured at station PC-002
a) by neglecting wall heat capacityb) by taking into account wall heat capacity ("C")

73
our results into two plots, the upper show-ing the results of the predictions using thenormal nodalizations and the lower showingthe ones using the "C" versions. Obviously,for all the different nodalizations, the RE-LAP5/Mod2 calculations are fairly good eventhough smaller discrepancies occur between 5and 30 seconds of the transient. Closest tothe experimental findings seem to be the cal-culations of versions 6-00, 6-01 and equivalent"C"-versions, i.e. the results of calculationsusing the most detailed type of nodalizationsof the LOFT-system.
Compared to those of the system pressure,the predictions of the pressure in the pressur-izer have been found less accurate as one maysee in figs. 3.31a and 3.31b. Here, the calcu-lations of the runs with 8-... type of nodal-ization, i.e. the cases with a reduced mod-elling of the pressurizer (instead of 11 vol-umes used for the pressurizer in the standardversion 6-00, in the 8-... versions only 5 vol-umes have been used), are fairly poorer thanthose of the standard version 6-... which suf-ficiently follow the experimental data. Es-pecially between 3 and 20 seconds, the un-derprediction of RELAP5/Mod2 runs using8-... nodalizations may exceed 2 MPa. Thesedeviations only occur in the pressurizer andare not to be found at any other location inthe system; we therefore believe that thesedeviations are tolerable for the course of thetransient because the predictions of the pres-sure inside the pressurizer seem to be of sec-ondary importance.
3.4.4 Fluid-Temperature in theDowncomer
Besides the system pressure, the fluid temper-atures in the downcomer may be important
with respect to the void formation in the coreregion because these temperatures are moreor less identical to those at the entrance of thecore, provided a positive flow out of the down-comer into the core region occurs. Therefore,in figs. 3.32a and 3.32b, we would first like tocompare the fluid temperatures as predictedby RELAP5/Mod2 using the different nodal-izations with equivalent temperature tracesas measured in the downcomer at position1ST-005.
The initial values of the fluid temperatureshave been predicted fairly well (-10 to zeroseconds). This is also the case for the follow-ing time interval between zero and approx-imately 20 seconds where the temperaturesfollow the saturation line. Because of therapid drop of the system pressure, the fluidtemperature becomes saturated at about 8seconds after initiation of the transient.
For all the versions of nodalizations, thefluid temperatures start to deviate from satu-ration at approximately 22 seconds and reachthe saturation temperature again at about 50seconds. Beginning at 42 seconds, the sys-tem pressure is more or less constant (seefigs. 3.30a and 3.30b). The straight line infigs. 3.32a and 3.32b for times higher than50 seconds can be regarded as the saturationtemperature at this pressure, i.e. all tem-peratures below this line indicate subcooledfluid. Consequentely, RELAP5/Mod2 pre-dicted a certain amount of liquid subcoolingin the time interval between 20 and 50 sec-onds which has reached peak values of upto 45 K for all of the "non-C" versions ofnodalization and peak subcoolings of 35 de-grees for most of the "C" versions. On theother hand, the thermocouple signals haveindicated a significant "liquid superheat" ofnearly 15 K which probably is due to a dryout of the thermocouple tip, measuring some-thing in between saturated steam tempera-

74
15.
14.
13.
12.
11.
10.
9.
8.
7.
6.
S.
4.
3.
2.
1.
0.
15.
14.
13.
12.
11.
10.
9.
8.
7.
6.
5.
4.
3.
2.
1.
0.
-10. 0. 10. 20. 30.TIME (SEC)
40. 50. 60.
TIME [SEC)
Figure 3.31: Pressures in the pressurizer vs. time compared with pressuremeasured at station PC-004 of the pressurizer
a) by neglecting wall heat capacityb) by taking into account wall heat capacity ("C")

75
550.NOORLIZRTION ,
500. 6-0a8-"08-03
a8-l
8 -1
350.U-iLU 400.
350.LOFT LP-LB-! / FLUID-7EMPERATURE IN DOWNCOMER
300 . I . . I ........ L ........ I ......-10. 10. 20. 30. 40. 50. 60. 70. 80. 90. 110.
TIME (SEC)
550.. NOORLIZATION
6-OOC" .... 6-01C
500. --- _-00C8-03C
• _•__8-10C-"" CD8 •,•( TE-IST-005 :h6 K
I,--ccCL
" 400.
350.
300. ---- -----10. 10. 20. 30. 40. 50. 60. 70. 80. 90. 110.
TIME (SEC)
Figure 3.32: Downcomer fluid temperatures vs. time compared withfluid temperatures measured at station 1ST-005
a) by neglecting wall heat capacityb) by taking into account wall heat capacity ("C")

76
ture and thermocouple heat-up due to radia-tion heat transfer.
3.4.5 Core Mass Flows
Now, we have to look at mass flows intoand out of the core as calculated by RE-LAP5/Mod2 . In figs. 3.33a and 3.33b, themass fluxes into the core and in figs. 3.34aand 3.34b, the mass fluxes out of the hotchannel have been plotted. Unfortunately,no corresponding experimental reference dataare available.
In figs. 3.33a and 3.33b, the inlet massfluxes into the hot channel as calculated byRELAP5/Mod2 using different nodalizationshave been plotted. Generally, depending onthe nodalization, the mass fluxes are slightlypositive only for some seconds between 6.5and 11 seconds time of transient and thenremain around the zero line. Consequentely,only a very small amount of water has beenpumped into the core during the blow-downphase of the experiment.
The mass-fluxes out of the core (figs. 3.34aand 3.34b) behaved similar. For the first 6seconds, the flux is again strongly negativ,i.e the fluid flows from the upper plenumthrough the core into the downcomer. Thena short time of positive flux can 1,e observedfollowed by nearly zero flux conditions.
With respect to top-down rewetting, one ofthe key phenomena of experiment LP-LB-1 ,which RELAP5/Mod2 failed to describeproperly (figs. 3.12 to 3.14) but which hasbeen observed within the experiment between15 and 20 seconds after its initialization atthe higher levels of the core, figs. 3.34a and3.34b allow us an insight view into the ac-tual hydraulic conditions inside the core ascalculated by the code. From these figures,our conclusion can only be that even if themodels within RELAP5/Mod2 theoretically
would be able to predict top-down quench-ing, in our case the code was bound to failbecause there was not enough mass flux toallow top-down rewetting.
Somehow related to the mass fluxes are themomentum fluxes. Therefore, in addition tothe mass fluxes, we shall plot the in- and out-flow momentum fluxes in figs 3.35a, 3.35b,3.36a and 3.36b, because for these param-eters experimental references are available.Although these references inferred from verylocal measurements (small drag bodies) andas indicated in the individual plots observedhigh transducer uncertainties, they may allowus to see a trend of the time behaviour of themass flows. Indeed, the time traces of the mo-mentum fluxes and mass fluxes as calculatedby RELAP5/Mod2 behave quite similar.
Whereas the momentum fluxes at the en-trance of the core (figs. 3.35a and b) cal-culated by RELAP5/Mod2 are comparableto the measured ones both qualitatively andquantitatively, the momentum fluxes at thecore outlet differ significantly from the mea-surements (fig.3.36a and b). If we concen-trate on times between 10 and 20 seconds (thetime period where top-down rewetting has oc-cured during the experiment), we are not ableto find any negative values of the experimen-tally inferred momentum fluxes which couldenable the top-down rewetting.Comparing the results of the different RE-LAP5/Mod2 calculations to each other, wecannot found significant differences.
3.4.6 Core Average
FractionsLiquid
Very important for the behaviour of thecladding temperatures are the average liq-uid fractions in the core region (identical to
/

77
".1000. . ..
500.LOFT LP-LB-1 / MASS-FLOW CORE IN (HOT)
c¢J
0.
\ ,,-•' NOORLIZRTION" '•'"6-00
o: -500. ---- 6-01
8-008-03
10.8-10
0. 5. 10. 15. 20.
TIME (SEC)
1000.
500.
Li0 . .- . . . . . . . .
NNODIL
* .NOOLIZATION
-- - 6-01C
8-03C8-100
-1000.0., 5. 10. 15. 20.
, TIME (SEC)
Figure*3.33: Mas's'fluxes int6 the hot channel of the core as calculatedby RELAP5/Mod2
a) by neglecting wall heat capacityb)'by taking into account wall heat capacity ("C")

78
1000.
U)
-D
Xz
C)(ncc
500.
- - - --- - - i . . _ . . . . . . . . .. | . . . . . . . . ..
NODALIZATION
6-00-.-.-. 6-01l
.. .8-00_•8-03__ _ -10
v'.1 VLOFT LP-LB-I / MRSS-FLOW CORE OUT (HOT)
I . . . . . I . . . .-500.
1000.
5. 10.TIME (SEC)
IS. 20.
Li
U)
-J(ncc
500.
0.
-500.10.
TIME (SEC)
Figure 3.34: Mass fluxes out of the hot channel of the.core as calculatedby RELAP5/Mod2
a) by neglecting wall heat capacityb) by taking-into account wall heat capacity ("C")

79
1500.
1250. NOORLIZATION
1000. 6-08'6-01
750. _ .. 8-00
- B.. -03500. 8-10
o- 20.D ME-5LP-002 ± 680 kg m- s-2r 250.out of range except for the first seconds
0. .. .. 000
X 00-D01-,- -250. "
-500.I.- I 'z3-- -750. ' 0 e
-1000. 0 LOFT LP-LB-I / MOMENTUM FLUX LOWER PLENUM
-1250. 0
-1500. .0. 5. 10. 15. 20.
TIME (SEC)
1500.
1250. NODRLIZATION v
1000. 6-OOC-.-.-. 6-01C
750 .... 8-00C
- - 500.8-03Cr., 500.8-10C
r. 250. 0 ME-5LP-002 ± 680 kg m-1 s-2o ,.-,out of range except for the first seconds
0 .o . ........- 50.LL.
-500.
-1500. , . . . 0 . . . . . i . . . . . , . ,
X- 7 0. 5 0 5
x:
-1000.
-1250.
-1500.0. 5. 10. 15. 20.
TIME (SEC)
Figure 3.35: Momentum fluxes into the hot channel of the core as calculatedby RELAP5/Mod2
a) by neglecting wall heat capacityb) by taking into account wall heat capacity ("C")

80
2500.
2000.
c'.
X
z
1500.
1000.
50.
-0.
-500.
-1000.
7'
55 £ A
A
1 1-1 , * , , , , I I
NONDOLIZATION
.6-00-.-.-. 6-01
8-008-038-18
A ME-5UP-0O01- 730 kg m-l S-2
• &~A..... 555, ,
a
A
LOFT LP-LB- / MOMENTUM FLUX UPPER PLENUM
0. S. 10.TIME (SEC)
15. 20.
X:
zC)
2500.
2000.
1500.
1000.
500.
-0.
-500.
-1000.10.
TIE (SEC)
Figure 3.36: Momentum fluxes out of the hot channel of the core as calculatedby RELAP5/Mod2
a) by neglecting wall heat capacityb) by taking into account wall heat capacity ("C")

81
the relative collapsed liquid levels) becauselow liquid fractions are essentially neccessaryto allow core heat-up whereas increasing liq-uid fractions are the consequence of a refill-ing process. Therefore, in figs. ý3.37a and3.37b, the average liquid fractions as calcu-lated by RELAP5/Mod2 for different nodal-izations have been plotted. Unfortunately,for this very important quantity again no ex-perimental references have been available.
For all the different nodalizations, RE-LAP5/Mod2 calculated a minimum liquidlevel at approximately 30 seconds after ini-tiation of the experiment. Afterwards, liq-uid fractions increase indicating the refill pro-cess. This refill process is clearer seen inthe RELAP5/Mod2 -results of the "non-C"nodalization (fig. 3.37a) than in those of the"C" versions. A minor increase of the liquidfraction may be observed between 10 and 20seconds which might have caused the "cool-down" at very low and very high core levels.
According to fig. 3.37a, the results of runsusing the "non C" types of nodalization indi-cate that refilling has been terminated at ap-proximately 65 seconds where the collapsedliquid level remained quite unstable. The re-suilts of the runs using "C"-types of nodaliza-tion end tip with much lower refill rates (fig.3.37b) which, on the other hand, seem to bequite stable.
3.4.7 Mass-Flow Out of theBroken Loop
The comparison between predicted and ex-perimental mass flows out of the break of thebroken loop allows us to check the capabilityof RELAP5/Mod2 to describe two-phase flowunder critical flow conditions. Therefore, infigs. 3.38 to 3.40, we would like to comparethe RELAP5/Mod2 calculations of the massflows in the cold and in the hot leg of the bro-
ken loop as well as the integral mass loss withthe equivalent experimental data; the lattergives a clearer picture how calculations andexperimetal data deviate. Nevertheless, onehas to keep in mind that mass flow measure-ments in transient two-phase flows are also arather difficult task, because the data are theresult of a multiplication of two independentmeasurements which are assumed to producearea averaged values.
In figs. 3.38a and 3.38b, let us start withthe mass flow in the cold leg of the brokenloop. When opening the break valves, fora few hundred milliseconds the fluid is sub-cooled and the mass flow reaches its maxi-mum value of 515 kg/s which value is slightlyoverpredicted by all the RELAP5/Mod2 cal-culations. During the following time period,some instabilities have occured for some RE-LAP5/Mod2 -runs which probably are dueto numerical instabilities. These instabili-ties more often have occured in more simpli-fied versions of nodalizations, e.g. the 8-...versions of nodalization. No severe discrep-akicies have been observed between the RE-LAP5/Mod2 results using the "non C" andthe "C" types of nodalization but the resultsof the latter seem to be slightly more stable.
In figs. 3.39a and 3.39b, the mass flows inthe hot leg of the broken loop have been plot-ted versus time. Except for the most simpli-fied 8-03 and 8-03C versions of nodalization(the break line consists of only 4 volumes in-stead of 11 for the 6-00/6-01 and 8-00/8-10versions), the peak values of the mass flowduring the few hundred milliseconds of sub-cooled liquid flow conditions (measured value184 kg/s) seemed to be slightly underpre-dicted whereas the two RELAP5/Mod2 runs(8-03 and 8-03C) overpredicted this peakvalue 27% and 32% respectively.
Because of the uncertainties of mass flowmeasuring techniques in stationary and tran-

82
1.0
2.9
2.8
0.7
0.6
0.5
zr
C3
U-
0.3
0.2
0.1
0.0
TIME (SEC)
z
CC
CM
0.8
0.7
0.6
0.5
0.4
2.3
0.2
0.1
0.0-10. 0. 10. 20. 30. 40.
TIME (SEC)50. 60. 70. 80.
Figure 3.37:a)b)
Core averaged liquid fractions vs. time as calculated by RELAP5/Mod2by neglecting wall heat capacityby taking into account wall heat capacity ("C")

83
lidU)NC.,
0-JLL
(I)U)cr
600.
550.
500.
450.
400.
350.
300.
250.
200.
150.
100.
50.
0.
-50.
TIME (SEC)
600.
550.
500.
450.
400.
350.Ur)N, 300.
250.0
" 200.
in 150.Cr
100.
50.
0.
-50.
TIME (SEC)
Figure 3.38:
a)b)
Calculated mass flows out of the broken cold leg vs. timecompared to the mass flow measured at position BL-105by neglecting wall heat capacityby taking into account wall heat capacity ("C")

84
300.
250.
200.
I I I
iOFT LP-LB-I / MRSS-FLOW BROKEN LOOP /HOT
i) 150.
g 100.In(n
cc 50
Q
NOOALIZRTION ,
6-01
6-00.8-03
6 8-10
iF FR-BL-205 no explicit range of error given• homogeneous model used for evaluation
'A AL & A A &AAA A A A A AA A A A & A A ý
B
0.
-50.
ý4 kW a AMA
F. I F I I I-5. 0. 5. 10. 15. 20.
TIME (SEC)25. 30. 35. 40.
Ui
wU)
Cr
250.
200.
150.
100.
50.
0.
-50.
TIME (SEC)
Figure 3.39: Calculated mass flows out of the broken hot leg vs. timecompared to the mass flow measured at position BL-205
a) by neglecting wall heat capacityb) by taking into account wall heat capacity ("C")

85
sient two phase flows it cannot be totally ex-cluded that deviations also are due to errorsin the experimental reference values.
A plot of the loss of mass focusses more di-rectly on the loss of water inventory ratherthan the time traces of the indiv'idual massflows through the break. Therefore, we fi-nally shall compare the instantaneous timeintegrals of the two mass flows in the coldand hot legs of the broken loop (i.e. the masslosses through the breaký) as predicted by RE-LAP5/Mod2 with the equivalent values of themeasurement. The integration of the massflows for both the calculations and the ex-periment has been performed numerically bysimply summing up the products of the twoinstantaneous values of the mass flows (coldand hot leg of the broken loop) times the ac-tual time step.
In figs. 3.40a and 3.40b, these masslosses have been plotted as a function oftime. Generally, for all types of nodalizationsthe mass losses have been overpredicted byRELAP5/Mod2 for the first 45 seconds (6-00/6-01) to 60 (8-...) seconds of the tran-sient from which time on the mass-lossesmore or less stagnated or even slightly de-creased. The reason for the latter obser-vation is the fact that the system pressurehas decreased to' the pressure in the suppres-sion tank (for the code, the suppression tankpressure as a function of time is a boundarycondition; the pressure history inferred fromexperiment LP-LB-1 has been used); RE-LAP5/Mod2 sometimes calculated system-pressures slightly lower than the suppressiontank pressures enabeling a certain amount offluid flowing back out of the supression tankinto the primary system; in reality an unphys-ical process. Because of this backflow (whichbecause rf itfssmallness cannot beseen in the
two plots of the mass flows) and in opposite tothe experimental data, RELAP5/Mod2 cal-culated no significant increase but a slightlydecrease of the mass losses. Again, somequestion marks can be raised with respectto the accuracy of the experimental referencedata.
In figs. 3.40a and 3.40b, one may distin-guish two different sets of curves, namely, thetwo 6-... type results and the other threeresults of the 8-... nodalizations. For themore detailed 6-... nodalizations, the lossof inventory is significantly higher than forthe more simplified 8-... versions. On theother hand, no severe differences have beenobserved when looking at the mass losses ofthe 8-00/8-10 and 8-03 runs even the simplifi-cation, especially of the broken loop, has beenrather drastic.
3.4.8 Intact Loop Massand Pump Speed
Flow
In figs. 3.41a, 3.41b, 3.42a and 3.42b, themeasured mass flows in the hot and coldlegs of the intact loop have been comparedwith the equivalent quantities as calculatedby RELAP5/Mod2 using our different nodal-izations. In both cases, the stationary values(-10 to zero seconds) which were derived fromthe values given in table one (305 kg/s) .differslightly from the measured values. Surpris-ingly, the measured mass flows in this sta-tionary phase (even if all possible leaks areclosed) differ from 295 kg/s in the cold leg to315 kg/s in the hot leg. With respect to theaccuracy of the measurements, the uncertain-ties of mass flow measurements in two-phaseflows as mentioned above, again, have to betaken into account.
In fig. : 3.41a and 3.41b, the hot legmass flows inferred from LOFT experimentLP-LB-1 have been compared to the RE-

86
C3,
-J
CA
6000.
5000.
4000.
3000.
2000.
1000.
0.
6000.
5000.
4000.
3000.
2000.
1000.
0.
TIME (SEC)
CnC,)CD-'j
ch(ncr
10. 20. 30. 40. 50. 60. 70. 80. 90.TIME (SEC)
Figure 3.40: Calculated mass losses out of the double ended break vs. timecompared to the integrated mass flows measured at positionBL-105 and BL-205
a) by neglecting wall heat capacityb) by taking into account wall heat capacity ("C")

87
350.
300.
250.
C6tocc
200.
150.
100.
50.
0.
-50.
-100.
350.
300.
250.
200.
150.
100.
LOFT LP-LB-1 / MASS-FLOW (INTACT-HOT)
NOORLIZATION
6-006-018-008-038-10
0( FR-PC-205 no explicit range of error givenhomogeneous model used for evaluation
i I~~ I
-10. 0. 10. 20. 30. 40.TIME (SEC)
50. 60. 70. ý0.
I I I I U
QLii
cc
NOORLIZATION
- - 6-01C... 6-0tC
8-SOC_ 8-3C
___8-lOC
It) FA-PC-205 no explicit range of error givenhomogeneous model used for evaluation:
I-0.
-50.
-100. E--------- --- --- ---- --------- ---- - __ ,__-10. 0. 10. 20. 30. 40.
TIME (SEC)
I__
50. 60. 70. 80.
Figure 3.41: Calculated mass flows in the intact hot leg vs. timecompared to the mass flow measured at position PC-205
a) by neglecting wall heat capacityb) by taking into account wall heat capacity ("C")

88
L)J
C')_j
cc
350.
300.
250.
200.
150.
100.
50.
0.
-50.
-100.
350.
300.
250.
TIME (SEC)
C)Li_(I
cr,
200.
150.
100.
50.
0.
-50.
-100.
- NOORLIZRTION
-.... 6-01Co r ... 8-00C
_oo_,8-03C"I., __ 8-19C
FR-PC-105 no explicit range of error given(D homogeneous model used for evaluation:
I7
0- ~0-
I I
-10. 0. 10. 20. 30. 40.TIME (SEC)
50. 60. 70. 80.
Figure 3.42: Calculated mass flows in the intact cold leg vs. timecompared to the mass flow measuredat position PC-105
a) by neglecting wall heat capacityb) by taking into account wall heat capacity ("C")

89
LAP5/Mod2 calculations. For the first sec-ond (highly transient part of the experiment)and after 30 seconds, the discrepancies be-tween the measurement and all of the cal-culations with different nodalizations are re-markably small. Between six and 20 seconds,all RELAP5/Mod2 cases have calculated asignificant reversal of the mass flow whichalso is observable to a lesser degree in themeasured data. For the time period after 30seconds, the calculated mass flows are nearlyzero, whereas the measurement still indicatedsome positive amount of flow. But becausethe measured flowrate is relatively low, it maybe due to uncertainties of the measuring tech-nique.
In figs. 3.42a and 3.42b, the mass flow inthe cold leg of the intact loop has been com-pared to the equivalent RELAP5/Mod2 cal-culations. Generally, the predictions seemto be more unstable than both the experi-mental data and the hot leg results. Onlythe curves of very low mass flow at timesgreater than 45 seconds seem to be somehowsmoother. The stepwise increase of the ex-perimentally inferred mass flow immediatelyafter opening of the break valves (295 kg/sto 310 kg/s) has been slightly overpredictedby all the RELAP5/Mod2 runs. A second in-crease of the mass flow at approximately 7.5seconds again has been overpredicted by allthe RELAP5/Mod2 runs.
Relatively high instabilities of the massflow occur both in the results of all of the cal-culations as well as in the experimental databetween 20 and 40 seconds of the transient,probably due to high thermodynamic unequi-librium during the injection of approximately35 kg/s of cold water out of the accumulatorinto the cold leg; this injection has stoppedafter 40 seconds. With respect to the cal-
culational results, the instabilities are morepronounced in the "non-C" versions of nodal-ization.
Finally, in figs. 3.43a and b, the rela-tive pump speed, defined as the actual valuedivided by the initial speed under station-ary conditions (because the absolute valueof the pump speeds has been used to adjustthe intact loop mass flow to the experimen-tal one given on table 1.1, only relative val-ues can be compared) as predicted by RE-LAP5/Mod2 has been compared to the equiv-alent average experimental value of the pumpspeeds of the two individual pumps. For allof the nodalizations, the run-out behaviour ofthe pumps seems to be in satisfactorly goodaggreement with the measured data, even thereproduction of the "peak" at 43 seconds ispoor for most of the runs. The accuracyof the results of the RELAP5/Mod2 calcula-tions using "non C" nodalizations is slightlyhigher than using the "C" versions. The bestjobs have been done by the more simplified8-... versions of nodalization.
3.4.9 EGG System
In figs. 3.44 to 3.47, experimentally in-ferred accumulator liquid level, accumula-tor pressure, accumulator flowrate as well asthe flowrates of the low pressure injectionsystems (LPIS) have been compared to theequivalent RELAP5/Mod2 calculations.
The time point of starting the accumula-tor injection has been defined by a time-trip(boundary condition) instead of a code cal-culated pressure trip which would model theLOFT system in a more realistic way, buton the other hand would multiply deviationsin the RELAP5/Mod2 calculation of the sys-tem pressure to other parameters of interestof the whole LOFT system (e.g. a later startof the ECCS would probably influence signif-

90
0.8 LOFT LP-LB-I / PUMP SPEED
Q 0.7. NOORLIZRTIONC 0.6 -(n) { __ 6-01
D 0.5 .. 8-0
a -D RP-OO1,002,. 0.005
.a:0.1
"
8 .1 • •..8-1... r ' 0
-10. 10. 20. 30. 40. 50. 60. 70. 80. 90. 110.
TIME (SEC)
1.0. ....... ........ I . . . I . . . .
0.8 NOORLIZRTION
o- r6-00C---- 6-01C
C3 0.6----B-eec0.6 8-03CL"u,,, _ _ __ 8-3Co~u• __ __ 810C
-
-
0.-.- 0.4 ) PE-0OO,020..At. 0.005
cc 0.2
LJ
0.0 0.2 ....... . . . . ... ,
-0. 2 .... ......... ......... t .... .... .... ........ I .. ...... -a.... w.....l ........ t.... .... I........
-10. 10. 20. 30. 40. 50. 60. 70. 80. 90. 110.TIME (SEC)
Figure 3.43: Calculated relative pump speed vs. time compared withthe measured ones (averaged value of two pumps)
a) by neglecting wall heat capacityb) by taking into account wall heat capacity ("C")

91
icantly the shapes of the cladding tempera-ture traces). Furthermore, the empty-pointof the accumulator, i.e. the time when theaccumulator level approaches zero, has beenadjusted once for all for the 6-00 nodalizationby multiplying the forward and backward en-ergy loss coefficients of the accumulator vol-ume by nearly 3; for all the other types ofnodalizations, the same coefficients have beenused. In addition, it was necessary to closethe valve 610 (see figs. 2.1, 2.3 and 2.4) af-ter the accumulator was emptied to avoid anexecution error of RELAP5/Mod2 (message:arithmetic overflow). This error is prob-ably due to an improper modelling of incon-densibles (nitrogen) by RELAP5/Mod2 ; ni-trogen is released by the accumulator into thesystem after emptying.
First, in figs. 3.44a and 3.44b, the liq-uid levels in the accumulator as calculatedby RELAP5/Mod2 have been plotted in thetime interval the accumulator is activatedand compared to the experimental data.The curves are satisfactory close to the ex-perimental points. The longest accumula-tor times have been achieved by using themost detailed 6-... types of nodalizations(nodalization of adjustment) which are ex-actly on time, whereas the results of the otherthree types of nodalization underpredictedthe emptying time of the accumulator notmore than 4 seconds.
In figs. 3.45a and 3.45b, the pressurein the accumulator vessel inferred from themeasurement has been compared to theequivalent pressures as calculated by RE-LAP5/Mod2 . Generally, the code tended toslightly overpredict the real pressures but thedifference is less than 0.3 MPa. Because incontrary to the experiment, as already men-tioned above, for the RELAP5/Mod2 predic-tions for numerical reasons a valve has to beclosed when the accumulator has emptied,
the predicted pressure remained constant af-ter this valve has been closed.
Closest to the measurements we have foundthe results of the 8-03 nodalizations, i.e. ofthe most simplified versions of the LOFT sys-tem. The poorest results on the other handhave been found to be the results of the 6-00and 6-01 calculations.
In figs. 3.46a and 3.46b, the flowratesout of the accumulator as calculated by RE-LAP5/Mod2 using our different nodalizationshave been plotted and have been comparedto the experimental data.. Generally, the re-sults of the calculations are quite satisfactoryand more or less have reproduced the massflow out of the accumulator both qualitativelyand quantitatively. Closest to the experi-mental data we have found the results of theRELAP5/Mod2 calculations using the mostsimplified 8-03 and 8-03C types of nodaliza-tion, whereas the poorest results have beenachieved with the most detailed 6-00/6-01nodalizations.
Finally, in figs. 3.47a and 3.47b, theflowrates of the Low Pressure Injection Sys-tem (LPIS) have been compared to the equiv-alent RELAP5/Mod2 results. For all thedifferent nodalizations, the calculated resultshave been found to be rather poor althoughwith respect to the quantitative aspect of thetotal mass injected, the predictions are ac-ceptable.
At the beginning of the LPIS action, a sud-den decrease from 6 to 4 kg/s followed by anincrease from 4 to 8 kg/s can be observed inthe experimental data which has not at allbeen calculated by RELAP5/Mod2 . Thisstrange behaviour of the LPIS mass flow isbelieved to be due to a short high pressurenitrogen release out of the accumulator intothe system at the moment when it has beenemptied completely. This nitrogen releasefor some seconds caused a small increase of

92
8.6
0.5LOFT LP-LB-I / ACCUMULATOR LEVEL
.4. NOORLIZATION
-- 6-81. 8.3 ." " .. . 8-8838-83
8-188.2 .. "+ LIT-P120.044 -22 mm
8.0 "1÷
18. 28. 30. 40. 50. 68.TIME (SEC)
8.6
4-4 "6-88C
---.. 6-81C8.4 + - - 8-60C
8-83C
0 8.3u .+ LIT-P120-044 + 22 mm>LUM
-44\
8.2 4
8.1
8.810. 20. 30. 40. 50. 68.
TIME (SEC)
Figure 3.44: Calculated accumulator fluid levels vs. time compared withthe measured level
a) by neglecting wall heat capacityb) by taking into account wall heat capacity ("C")

93
4. NOORLIZATION,
6 -00--.-.- 6-61.
8-00S3.. 8-03crU- "'n, 8-10
ccO. (D PT-P120-043 0.05 MPa:
2. ý`\Nci:'
CC(na: 000.
1. LOFT LP-LB-1 / ACCUMULATOR PRESSURE
0. .
10. 20. 30. 40. 50. 60.TIME (SEC)
.. NODALIZATION ,
6-OOC-- 6-01C
... 8-66CCc .8-03C
Un 8-10C
cc" PT-P120-043 ±- 0.05 NWa
I..UJ 2.
(A
0-1. . ..
10. 20. 30. AO. 50. 60.
TIME (SEC)
Figure 3.45' Calculated accumulator pressure vs. time compared withthe measured pressure
a) by neglecting wall heat capacityb) by taking into account wall heat capacity ("C")

94
50.
AA
/* A/
830. _A I
LOFT LP-LB-1/ ACCUMULATOR FLOW20. 0 RTO20. NODRLIZATION I £
- -0- 6- -- 6-0
10. 8-00!
8-03 .A 8-10
A FT-P120-036-1 -0.9 Kg/s A
10. 20. 30. i10. 50. 60.TIME (SEC)
50.A
A
A
40. :7aAA/. ••1•4
0.
N"
20. NOLIZBTION
.. -OOC . 1... 6-01C
10.... 8-03C i:8-10c 1:
A FT-P120-036-1 - 0.9 Kg/s
0 . . .. ... --------. . . . . . . . . .. . JU L .l[ ..=...._... , . .. . . . . •10. 20. 30. 40. 50. 6t.
TIME (SEC)
Figure 3.46: Calculated accumulator mass flows vs. time compared withthe measured flow rate
a) by neglecting wall heat capacityb) by taking into account wall heat capacity ("C")

95
...... I I I I I I I I I
8.
7.
6.
~0300*
o C0oce ý e* e,
V"V
(ni
C'.X:
S.
4.
3.
2.
0
LOFT LP-LB-I / LPIS tiRSSFLOW0000
0
C
NOORLIZRTION ,
- 6-00-- 8--6-81
8-088-038-18
0 FT-P120-085 ± 0.37 Kg/s1.
0.
8.
7.
6.
5.
A.
3.
2.
1.
20.
Lii
-j
In.tncc
A ,- - ....... ...... .....I --- ---- .I -----.... . . ... I ... ..... I ......... ! ........ . - -. .
20. 30. 40. 50. 60. 70. 80. 90. 100. 110. 1TIME (SEC)
A °,• NODRLIZATION
6-00
....- 6-01C
.. 8-08C8-03C8-18C
0 FT-P120-085 - 0.37 Kg/s
20. 30. 40. 50. 60. 78. .88.TIME (SEC)
90. 100. 110. 120.
Figure 3.47: Calculated LPIS discharges vs. time compared with the measurementa) by neglecting wall heat capacityb) by taking into account wall heat capacity ("C")

96
the system pressure (which can be observedin the system pressure data of figs. 3.30aand 3.30b at around 50 seconds) and even alarger increase directly in the EGGS-pipingthus reducing the LPIS flow-rate which isgoverned by the pressure difference betweenEGGS-piping pressure and the constant LPISpressure. After some seconds, this increasein the ECCS-piping pressure diminishes andthe LPIS flowrate recovered. Because the"nitrogen injection" has not been taken intoaccount by the RELAP5/Mod2 calculations,the code has calculated a more or less smoothcurve which is close to the experimental dataafter the experimentally observed flow insta-bility has been dampened and which more orless represents the time-average of the experi-mentally inferred LPIS mass flow between 35and 65 seconds.
3.5 Investigation on thePrediction of Top-
Down Rewetting
The occurence of a top-down rewetting fronthas been regarded as one of the"key-events"of LOFT experiment LP-LB-1 .. This top-down rewetting front quenched the upper30% of the core, between 15 and 20 sec-onds after initiation of the experiment dur-ing the blow-down phase thus reducing thecore heat-up in this core region signifi-cantly. As we have already seen before,RELAP5/Mod2 was unable to calculate thisphenomenon.
One of the features of RELAP5/Mod2 codeis the fact that it uses different sets of heat-transfer correlations under non-reflood andreflood conditions (e.g. correlations for nu-cleate boiling, transition boiling and filmboiling). On top of this, the calculation
of the temperature distribution of the fuelrod is enhanced by subdividing the axiallength (corresponding to the length of theconnected hydrodynamic volume) into sev-eral "fine meshes" to better model the oc-curence of steep temperature gradients insidethe cladding during reflooding. The "switch-ing" from normal operation to reflooding canbe achieved by three different methods :
1. external trip (to be set by user definedoptions)
2. internally set by the code when the con-nected hydrodynamic volumes are nearlyempty
3. internally set by the code when dryoutbegins in the connected hydrodynamicvolumes
In addition, the last two cases are limitedto system pressures less than 10 bars. Oncethe reflood calculation has been initiated, itremains activated until the end of the calcu-lation.
The choice of a slightly different heat trans-fer correlations combined with a better trac-ing of the axial cladding temperature distri-bution by "fine meshing" may have an impor-tant influence on the prediction of claddingtemperatures. Consequently, the time of thereflood initiation, i.e. the "switch" betweenboth the different sets of correlations andthe numerical solution schemes may have animpact on the result. Therefore, one mayargue that the calculation of the top-downrewetting by RELAP5/Mod2 in experimentLP-LB-1 only failed because the reflood op-tion has not been initiated between 15 and 20seconds after the initiation of the transient.
For investigation of this problem, we haveperformed

97
three different RELAP5/Mod2 calculations,using nodalization 8-00 with the three refloodinitiation options, namely one (8-OOT), two(8-00) and three (8-O0A). For version 8-00 /8-O0A, the reflood option usually has beeninitiated automatically by the code between25 and 30 seconds after opening of the breakvalves when the system pressure has fallenbelow 10 bars and the collapsed liquid levelin the core has reached its minimum (see figs.3.30 and 3.37). For version 8-OOT, the refloodoption initiation trip has been set externallywhen the average collapsed liquid level in thecore-region reached a value of less than 10%.According to fig. 3.37, this happened for thefirst time approximately 6 seconds after theinitiation of the experiment; this external ini-tiation of the reflood option is independent ofthe system pressure.
In figs. 3.48 a to k, the cladding tem-peratures measured at all the 10 axial posi-tions in the center box 5 (hot channel) havebeen compared to the equivalent two RE-LAP5/Mod2 calculations; even we have ex-pected the top-down rewetting only at thetipper three positions of the core, we haveplotted the results at all position investigat-ing wether or not our modifications will influ-ence the results in the lower part of the coretoo.
At all axial levels, RELAP5/Mod2 resultsof the 8-00 and 8-OOA versions of nodaliza-tion have been found identical. The straightcurves in all of the plots always cover thedashed lines of the 8-OOA version totally.
Small discrepancies may be observed be-tween the calculations of the 8-00/8-OOA andthe 8-MOT versions, i.e. the version with ex-ternal initiation of the reflood option. Thedeviations are relatively small in the lowerpart of the core at levels 02 and 11 (figs. 3.48aand b) and then slightly increase at levels 21to 29 (firs. 3.48c and g), where the results of
the 8-MOT runs indicate a significant decreaseof the cladding temperatures of nearly 200 Kbetween 15 and 20 seconds after the initia-tion of the transient, i.e. immediately afterthe reflood option has been triggered.
At axial level 43.8 (fig. 3.48h), the 8-MOTrun of RELAP5/Mod2 has calculated a "top-down quench like" drop of the cladding tem-perature at approximately 20 second of thetransient which is in good aggreement withthe signals of at least four of the radial dis-tributed thermocouples on axial core level43.8 (see fig. 3.1c); as we shall rememberthe reference temperature given in fig. 3.48his an average of all the thermocouples on thisaxial level and therefore expresses top downquenching in a rather dampened manner.
At even higher core levels (figs. 3.48i andk), no significant core heat-up at all has beencalculated by RELAP5/Mod2 . Here, as atthe bottom of the core, the RELAP5/Mod2 -results using the different versions of nodal-ization did not deviate dramatically.
In figs. 3.49a to d, the comparison has beenmade for the calculations of the average chan-nel at the four available core levels of side box4. Here, both sets of RELAP5/Mod2 calcula-tions (8-00/8-OOA and 8-QOT) are poor com-pared to the experimental data (symbols).Whereas the three RELAP5/Mod2 calcula-tions each have been unable to predict thecore heat-up during the first 10 to 15 secondswhich is significant in the experimental data,the 8-00/8-OOA results tended to overpredictthe core heat-up during the refill phase ofthe experiment and the 8-MOT results usuallyhave underpredicted them. Generally, by us-ing these three different nodalizations, RE-LAP5/Mod2 has done an unsatisfactory job.

98
LU
crLU
0d
C,
900.
800.
700.
600.
500.
400.
300.
1200.
1100.
1000.
TIME (SEC)
LU
0-Xrci:
LD
z
cr
900.
800.
700.
600.
500.
400.
300.30. 40. 50. 6:.
TIME (SEC)60.
Figure 3.48:
a)b)
Comparison of cladding temperatures calculated by RELAP5/Mod2without (8-00 /A) and with (8-OOT) external triggering of thereflood optionat level-02at level-Il

99
CcI--crc
LUrILuI--0-
:3-j
1200.
1100.
1000.
900.
800.
700.
600.
500.
400.
300.
1200.
1100.
1000.
900.
800.
700.
603.
500.
TIME (SEC)
CC:
I--a:
I--Ln
I-
U
400.
300.-10. 0. 10. 20. 30. 40.
TIME (SEC)50. 60. 70. 80.
Figure 3.48: Comparison of cladding temperatures calculated by RELAPS/Mod2without (8-00 /A) and with (8-O0T) external triggering of thereflood option
c) at level-21d) at level-24

100
Lii
0-3:
I--
cc-j
1200.
1100.
1000.
900.
800.
700.
600.
500.
400.
300.
1200.
1100.
1000.
-10. 0. 10. 20. 30. 40. 50. 6R. 70. 80.I TIME (SEC)
'a
0-
900.
800.
700.
600.
500.
400.
300.-10. 0. 10. 20. 30. 40. 50. 60. 78. 80.
TIME (SEC)
Figure 3.48: Comparison of cladding temperatures calculated by RELAP5/Mod2without (8-00 /A) and with (8-GOT) external triggering of thereflood option
e) at level-27f) at level-32

101
LU0-
r-
DL
F_
cr
LiI-.-
U
1200.
1100.
1000.
900.
600.
700.
600.
500.
400.
300.
1000.
900.
800.
700.
600.
500.
400.
300.
-10. 0. 10. 20. 30. 40. 50. 60. 70. 80.TIME (SEC)
Lii
M.
a:
0cr-JUi
20. 30. 40.TIME (SEC)
50. 60. 80.
Figure 3.48:
g)h)
Comparison of cladding temperatures calculated by RELAP5/Mod2without (8-00 /A) and with (8-OOT) external triggering of thereflood optionat level-39at level-43.8

102
zj2;CDaLiJ
Li
1000.
900.
800.
700.
600.
500.
400.
300.
930.
TIME (SEC)
1~*~~~'..........................................................I I I I F--I I I I -r- r-
LzJa_I-
u-jU-
800.
700.
600.
500.
,00.
NOODLIZATION a
- 8-008-00R
S...-00TxX X TE-SLEVEL-62
LOFT LF-LB-1 / POS 662
300.-10. 0. 10. 20. 30. 40.
TIME (SEC)50. 60. 73. 80.
Figure 3.48: Comparison of cladding temperatures calculated by RELAP5/Mod2without (8-00 /A) and with (8-0OT) external triggering of thereflood option
i) at level-49k) at level-62

103
LU
I-
LU
1000.
900.
800.
700.
600.
500.
400.
*---------------------------------------------.......I ...... i.....
A0A0
NOORLIZATION
-8-00
B-0088-OOT
CD TE-4GIA-011
-I-
LOFT LF-LB-i I CLRODING TEMPERRTURE RVG-011
I I-----------------I I-I
LuC.::
0--a:
C,
300.
1000.
900.
800.
700.
600.
500.
400.
-10. 0. 10. 20. 30. 4A. 50. 60.-TIME (SEC)
73. E
300.30. 40. 50. 60. 73.
TIME (SEC)
Figure 3.49: Comparison of cladding temperatures calculated by RELAP5/Mod2without (8-00 /A) and with (8-00T) external triggering of thereflood option
a) at level-11 (average channel) . ....-.
b) at level-21 (average channel)

104
9 . . ......... P .
4*. + NOORLIZATION
800. 8-008-00T
700. + TE-AH14-028
ft4.4
CL+
TE-IH1A-02
+ } 4300.
-10". 0. 10. 20. 30. .40. 50. 60. 70. 80.TIME (5EC)
900. "•" '".... ......... I......... I......... I......... I ......... ..... ......
8 . At\x800.NOORLIZATION
- x - 8-00v 700. 8-00Fi
- • ... 8-00T.u-ia X TE-4I 14-0:'9
600.a::
w3 +
c" 5___.__,___i_"_
.a 40.LOFT LP-LB-I / CLADDINcG TEMFERATURE RV,-0-239
300. -.------10. 0. 10. 20. 30. 40. 50. 63. 70. 80.
TIME (SEC)
Figure 3.49: Comparison of cladding temperatures calculated by RELAP5/Mod2without (8-00 /A) and with (8-00T) external triggering of thereflood option"
c) at level-28 (average channel)d) at level-39 (average channel)
Summarizing our observations with respectto top-down rewetting, one has to concludethat RELAP5/Mod2 generally has not beenable to predict this phenomenon. A changein the logic of initiating the reflood option(which forces RELAP5/Mod2 both to use aslightly modified heat transfer package and tosubdivide the axial meshing of the cladding aspredetermined by the length of the adjacenthydrodynamic volume in order to keep bettertrack of the axial temperature distribution inthe vicinity of the quench front) only resultedat one axial level (43.8 inches from the bot-tom of the core) in a better prediction with-out explaining the physical phenomena buton the other hand created worse results inother phases of the transient like the "top-down quenching" like drop of the claddingtemperatures in the middle of the core whichis not supported by the experimental data.
105

Chapter 4
Conclusions
Experiment LP-LB-1 was conducted onFebruary 3, 1984, in the Loss-Of-Fluid-Test(LOFT) facility at the Idaho National En-gineering Laboratory under the auspicies ofthe OECD. It simulated a double-ended off-set shear of one inlet pipe in a four loop PWRand was initiated from conditions representa-tive of licensing limits in a PWR. Additionalboundary conditions for the simulation wereloss of offsite power, rapid primary coolantpump coastdown, and UK minimum safe-guard emergency core coolant injection rates.
During this experiment, all fuel rods inthe central fuel assembly (box 5) experiencedtemperatures in excess of 1100 K in theirhigh power regions (about 24 inches from thebottom of the core), whereas the maximumcladding temperatures reached peak values of1261 K during blowdown and 1257 K duringrefill/rcflood which were the highest tempera-tures ever measured in LOFT. The core-widetemperature increase continued until a par-tial core top-down quench occured, startingat 13 seconds, which affected the top third ofthe core. This top-down rewetting was one ofthe key-phenomena of the LOFT experimentLP-LB-1.
For the plant to be analysed, the "ade-quate nodalization" is usually unknown andonly some very rough criteria can be givento the code user which may make the accu-racy of a prediction be strongly related to the
"experience" of the code user, a quite un-satisfactory conclusion. Therefore, we haveanalysed the LP-LB-1 experiment by usingthe best estimate code RELAP5/Mod2 cy36-02 With different nodalizations of the LOFTsystem. Starting with a nodalization sim-ilar to the one used by the code develop-ers at INEL (specially developed for smallbreak LOCAs), we have reduced the num-bers of volumes, junctions and heat struc-tures in the primary loop of the LOFT systemto nearly half whereas the entire vessel stayedunchanged to meet the requirements of thegiven experimental axial positions, especiallyfor the cladding temperature measurements.We further have investigated on the influenceof fine meshing in the core zone during re-flooding on quench time and -temperatureand on the influence of the time of initial-ization of the reflood option with respect toRELAP5/Mod2 's predicting capabilities ofthe rewetting phenomena.
RELAP5/Mod2 , cy36-02 has calculatedthe general thermo-hydraulic behaviour of ex-periment LP-LB-1 satisfactorly although itfailed in describing the top-down rewettingwhich happened in the upper third of thecore between 15 and 20 seconds of the tran-sient (blowdown phase). Independently ofthe choosen nodalization, most of the inves-tigated parameters like pressures, mass flowsin the broken and intact loops, pump speed
106

and ECC systems have error bounds less than±20% but the cladding temperatures usuallyhave been underpredicted between 10 and upto 150 K (hot spot). We believe that the, gen-erally spoken, relatively good agreement ofmost of the RELAP5/Mod2 results with themeasured LOFT data is not really surprisingbecause codes like RELAP5/Mod2 have beenextensively used for analysing LOFT exper-iments and LOFT results have been exten-sively used to eliminate insufficiencies bothin the codes themselves as well as in themore plant specific nodalization of the prob-lem. Therefore, even if these "adjustements"have been mainly made for small break LO-GAs, one has to be aware of the fact thatboth the code and the LOFT specific nodal-ization (also used here as the basic nodaliza-tion scheme), are somehow "LOFT tuned"which resulted in these quite acceptable re-sults.
We may summarize our findings in the fol-lowing points :
With respect to the computation time,the degree of specification of the nodal-ization, i.e. the numbers of volumes andjunctions, is of course an important pa-rameter. But not always a lower numberof junctions and volumes automaticallyhas lead to a faster calculation. Some-times, with respect to computing timeand because of numerical instabilities,the profit of a much reduced nodaliza-tion is rather small.
The cladding temperatures usually havebeen underpredicted between 10 and upto 150 K (hot spot). In additition, for allnodalizations, the hot spot has been cal-culated at a position more downstreamof the core; instead at the experimentallyinferred position 24 inches from the bot-tom of the core, RELAP5/Mod2 always
calculated the hot spot at axial level 31.
- For large break LOCAs, the nodaliza-tion seems to be important only forthe cladding temperatures, where sig-nificant differences can be observed forthe different nodalizations under inves-tigation. Especially, the times of finalquench differ from nodalization to nodal-ization some 20 to 30 seconds.
- For the other parameters, the deviationsbetween the results of the calculationswith the different nodalizations under in-vestigation have error bound of less than±20%, but surprisingly, the results ofruns with less detailed nodalizations usu-ally seem to be closer to the experimen-tal data than the ones with the more de-tailed basic nodalization scheme which issimilar to the original EG&G nodaliza-tion of LOFT.
- A negative influence on the RE-LAP5/Mod2 calculations seems to havethe modeling of the stored energy of thevessel material, especially on the timeof final quenching. When taking intoaccount the heat capacity of the down-comer walls as well as of some entire corematerial (version "C" of nodalization),the predictions have been found to bepoorer than by neglecting these effects.
- The modeling of the fuel rod, i.e. thenumber of radial meshes, has been foundto have an important influence both onthe cladding temperatures as well as onthe center fuel temperatures. Comparedto the equivalent results obtained usingthe other nodalizations, the temperaturetraces of the 8-10 and 8-10C results (re-duction of the number *of radial meshesfrom 10 to 5 (hot) and from 5 to 4 (avg.))
107

differ quite significantly at very low andvery high core elevations, but influence ofthe nodalization used on the other ther-modydraulic parameters is small.
" The influence of the allowed fine meshingduring the reflooding on the code predic-tions seems to be small when we comparee.g. the results of the 6-00 (only 2 finemeshes in the hot channel) with those ofthe 6-01 nodalization (32 fine meshes).
" The time point of initiating the re-flood option determines the "quench be-haviour" of the code because it startsthe fine-meshing in the core-zone thusenabling a more correct tracing of theaxial cladding temperature distributionand consequentely a better reflood mod-eling. Therefore, the comparison threepossible methods of initiating the refloodoption have manifested a strong depen-dence of the results on this settings.
- The results of RELAP5/Mod2 runsusing one of the two code-internaltrips for the initiation of the refloodoption are identical.
- An external trip based on the fluidlevel in the core alone has lead tomuch lower values of the claddingtemperatures at nearly all axial lev-els of the LOFT core but still wasnot able to correctly calculate thetop-down rewetting in the upperthird of the core (the "good" resultsat level 43.8 seems to us to be a lit-tle bit coincidental).
* Finally, a remarkable inconsistency hasbeen observed concerning the heat trans-fer and flow regime logics of RE-LAP5/Mod2 . During the refill phaseof the calculation, at the same time
RELAP5/Mod2 assumed different flowregimes on one side for its calculationof the interfacial shear stresses and in-terfacial heat transfers and on the otherside for the determination of the heattransfer from the wall to the fluid (liq-uid). This unphysical modeling of thethermo-hydraulic conditions in the coreregion of the LOFT reactor may invali-date even results which have been provedas to be satisfactory by a pure compari-son with the experimental data, e.g. atthe same axial position and at the sametime, RELAP5/Mod2 assumed both wetand dry surface by defining mist flow andslug flow for the same volume.
108

Chapter 5
Appendices
5.1 References
[1 ] Reeder, D.G. : LOFT System and Test DescriptionNUREG/CR-0247 Tree-1208 (1978, update 9/80)
[2] Ybaronndo, et.al. : Examination oft LOFT Scaling74-WA-HT-53, ANS proceedings, New York (1974)
[3] Adams, J.P.; Birchley, J.C. : Quick Look Reporton OECD LOFT-Experiment LP-LB-1
OECD LOFT-T-3504, EG&G Idaho Inc. (1984)
[4 ] Andreani, M and Grfitter, H.P : Post-Test Analysis ofOECD LOFT-Experiment LP-SB-3 by RELAP5/Mod2
EIR internal report TM-32-85-18 (1985)
[5] Lorenzini, E; Orlandelli, C.M. and Spada, A : LOFT 1,P-LB3-1Post-Test Analysis using RELAP5/Modl computer
codeENEA Safety Research Program (1984)
[6] Ransom, V.H., et.al. : RELAP5/Mod2 Code ManualNUREG/CR-4312 (1985)
[7 1 Lilbbesmeyer, D. : Post-Test-Analysis of OECD LOFT Experiment LP-02-6with RELAP5/Mod2 -cy36-02
NUREG/IA-00086 (1991)
109

[ 8 ] Anonymous: OECD LOFT Experiment LP-LB-1 : Tape Descriptions andSupplementary Information-
[9] Brittain, I. and Aksan, S.N. : OECD-LOFT Large Break LOCA Experi-ments : Phenomenology and Computer Code AnalysesPSI-report 72 (or AEEW-TRS-1003), August 1990
110

5.2 Listing of RELAP5/Mod2 - Input Mk. 6-OOC
Finally, as an example, the RELAP5/Mod2 - inputdeck Mk. 6-00C -will be listed (for the "Nor-mal Version", lines LB1-1729 to LB1-1876 and lines LB1-2242 to LB1-2280 have to bedeleted)
* LB1- 1
LOFT LP-LB-1 [post test analysis] / nk 6-00C (13.4.87) *LBI- 2* LB1- 3"
• LP-LB-1 initial conditions LBI- 4* LB1- 5* power = 49.3 MW LBI- 6* pcs flow = 305.8 kg/s LB1-:` 7* t hot = 585.8 K LBI- 8• tcold = 556.0 K LBI- 9• pcs pressure = 14.95 MPascal LBI- 10* LB1- 11
* pzr pressure = 14.82 MPascal LBI- 12* pzr level = 1.04 m (41 in) LBI- 13
• LB1- 14
S"LB1- 15
* LB1- 16
* nodalisation LB1- 17* ------------- LB1- 18
• corebereich thermoelement-lokationen angepasst. LB1- 19* 13 volumen in hot- und 5 in average channel. LBI- 20* core-aufteilung hotchann.-averagechann.-bypass 82 - 14 - 4 LB1- 21* core-aufteilung pins 1081 219 LBI- 22• LBI- 23
* heat structures fur downcomer und corebarrel. LB1- 24: ."LBi 25
* LBI- 26* it It tl ittf Ii it iii• II t It It it lift I~tti It It It ft It il I ~t It tit lit,, lftl It It t tilt 1111 tt itli lilt ft It I itt It t I t l , It It itti It litt it t- lHft I t- LB 1- 27
*111111 t i Ii it Ii It It It it II It il 1 1 Ii It iltI t It it It it t ft it It lilt it t It it I it It It ft It tilt 111t t It lif t Iti It 1 t i Ill LB1- 28
• LB1- 29
00000100 new transnt *LBI- 3000000101 run *LB1- 3100000105 5.0 10.0 850. *LB1- 3200000110 nitrogen '*LBI- 33• LBI- 34
• time step control cards * required LBI- 35* end time min dt max dt optn mnr mjr rst LB1- 36
00000201 10. 1.0-6 .2 15003 10 1000 1000 *LBI- 37
111

00000202 12.00000203 1.+5"
1.0-121.0-12
.01 15003 1 1000 1000
.1 15003 1 1000 1000
* minor edit variables
* transient plot requests----1 ----.---- 1 ----
* ------------- 1-- ---- ---- ----- 1----
00000301 cputime 000000302 emass 000000303 p 340010000
00000304 rho 34001000000000305 mflowj 340010000
00000306 cntrlvar 404
00000307 tempf 340010000
00000308 tempg 340010000
00000309 p 342010000
00000310 p 344010000
---- 1 ----.----- 1 ----.--- 1 ----
*LB1-*LBI-
LB1-LB1-LB1-LB1-LB1-LB1-LB1-LB1-
LB1-
LB1-LB1-
*LB1-*LB1-*LBI-*LBI-*LBI-*LBI-*LBI-*LB1-*LBI-
*LB1-
LB1-*LBI-*LBI-*LBI-*LB1-
*LB1-*LBI-
*LBI-
LBI-*LBI-*LBI-
*-LBI-
*LBI-*LBI-*•LB1-*LB1-
LB1-*LB1-
*LB1-
*LB1-
3839
40
41424344454647
48
4950515253545556
5758
59
6061
62636465
666768697071
72
73
74
757677
787980
000003110000031200000313
00000314
00000315
00000316
00000317
0000031800000319
00000320
00000321
00000322
0000032300000324
00000325
0000032600000327
prhomf lowj
cntrlvar
tempftempg
p
rhomflowjcntrlvarvelftempftempgcntrlvar
rhoMf lowjcntrlvar
305010000305010000305010000414305010000
305010000
315070000
180010000
185020000
424180010000180010000
18001000080
100010000
100020000
434
112

00000328000003290000033000000331
0000033200000333
000003340000033500000336
00000337000003380000033900000340
000003410000034200000343000003440000034500000346
00000347
00000348
00000349
0000035000000351
00000352
00000353
0000035400000355
00000356
0000035700000358
00000359
0000036000000361
0000036200000363
00000364
00000365
00000366
tempftempg
pp
cntrlvarcntrlvarcntrlvarcntrlvarcntrlvar
mflowjcntrlvar
pmflowj
100010000100010000
100010000420010000
460461462463464
6100000004620010000630000000
p 240010000voidf 240010000cntrlvar 240voidf 225010000voidf 210020000
velfj 225020000cntrlvar 444
cntrlvar 454
cntrlvar 90cntrlvar 91cntrlvar 93cntrlvar 98
voidg 231010000voidg 231020000
voidg 231040000
voidg 231050000
voidg 231060000
voidg 231070000voidg 231090000voidg 231100000voidg 231110000
voidg 231130000
cntrlvar 470
*LB1- 81*LB1- 82
*LB1- 83*LB1- 84
LB1- 85*LB1- 86*LBI- 87*LBI- 88*LBI- 89*LBI- 90
LBI- 91*LBI- 92*LBI- 93*LBI- 94*LBI- 95
LB1- 96*LB1- 97*LBI- 98*LBI- 99
*LBI- 100*LB1- 101*LB1- 102*LB1- 103
*LB1- 104
*LB1- 105*LB1- 106
*LB1- 107*LB1- 108
*LB1- 109*LBI- 110
*LB1- 111*LB1- 112*LB1- 113
*LB1- 114
*LB1- i15
*LB1- 116
*LBI- 117*LBI- 118
*LB1- 119
LBI- 120*LBI- 121*LBI- 122
*LB1- 123
tempf
tempf
tempf
202010000
210020000
210030000
113

0000036700000368
00000369000003700000037100000372
000003730000037400000375000003760000037700000378
tempftempf
httemp
httemphttemphttemp
httemphttemp
httemphttemphttemphttemp
210040000220010000
231000110231000210231000410231000510
231000610231000710
231000910231001010231001110231001310
231000601231001001
230000105
230000205230000305230000405
00000379 httemp
00000380 httemp
00000381
00000382
00000383
00000384
0000038500000386
000003870000038800000389
00000390
0000039100000392
00000393
00000394
httemphttemphttemp
httemp
*LB1-
*LB1-LB1-
*LB1-
*LB1-*LB1-*LB1-
*LB1-*LB 1-
*LB1-
*LB1-*LB1-*LB1-
LB1-*LB1-*LB1-
LB1-*LB1-*LB1-
*LBi-
*LBI-
LBI-*LB1-
*LBI-
*LBI-*LBI-*LBI-
LBI-*LB 1-
*LB1-
*LB 1-
*LB1-LB 1-
LB 1-
LBI1-
LBI1-
LB 1-
LB 1-
LB 1-
LBI1-
LB 1-LBI-
124125
126127128129130
131132133134135136
137138139140141
142
143144
145146
147
148149150
151
152
153
154
155156
157
158159
160161
162
163
164
165
166
cntrlvar
cntrlvarcntrlvarcntrlvar
cntrlvar
2230
23125076
mflowj
mflowj
mn lowj
mflowjmf lowj
245020000
201000000
205000000
271000000275000000
* trips
* [t-500) end of job trip
114

* --- --- -I . .. .. --- I.... ....I-- - -- 1 ----00000500 time 0 ge null 000000600 500*--------------------I-------.I ----.----. ----
•--m--1--
90.
•----1----..
* 510-515 test specific trips
* break opens
00000510 time 0 ge
---- 1 ----
----1 --------- 1 ----
null 0
1---- LB1- 1671 *LBI- 168
*LBI- 169
---- 1---- LB1- 170LB1- 171
... ----. LB1- .A72
LB1 173---- - LB1- 174
LB1- 175
10.0 1 *LBI- 176LB1- 177LB1- 178LB1- 179
0.13 1 *LB1- 180LB1- 181
0.6 1 *LBI- 182LB1- 183
32.0 1 *LBI-.184
LB1- 1851.0+9 1 *LB1- 186
LB1- 18717.5 1 *LBI- 188
* scram
00000511 time 0* pcp trip
00000512 time 0* Ipis on
00000513 time 0* broken leg bypass
00000514 time 0* accumulator valve
00000515 time 0
ge timeof
ge timeof
510
510
ge timeof 510
ge null 0
ge timeof 510
* different related trips
*-... . .1-.... ....- 1-.... ....- 1-.... ....- 1-- - ---- 1-...-
* it 681 ecc check valve card 6000301
00000577 mflowj 600000000 ge null 0.
00000578 p 605010000 gt p 185010000
00000681 577 and 578 n*---- ---- I--1------ 1 ---1------ -- 1-- ------- ------------* it 682 accumulator valve card 6100301
*J ------ 1---- ---- -------- -------- ---- --------
00000582 cntrlvar 4 It null 0
00000682 -582 and 515 n* .....---- 1-- ------- 1 -------- 1---- --- 1 -------- 1 ----* It 685-686 steam valve card 5400301*-----------1------1 ---------1---------.1-.... --....... 1....
------ 1-....
0.00.
-•---•1----.
1.0-4
5.55+65.50+6
LB1-LB1-LB1-LBl-
LB1-
LB1-
- LB1-n *LBI-n *LBi-
*LB1-
LB1-
LB1-
- LB1-
1 *LB1-*LBI-
- LB1-
LB1-
LB1-
LB1-
n *LB1-
n *LB1-
189190191
.192193
194
195196197
198199-200
201
202
203
204
205
206207
208
209
* open trip
00000589 p00000590 p
530010000 gt530010000 it
nullnull
00
115

00000670 68500000671 -59000000685 671* close trip
00000591 p00000592 p00000672 68600000673 -59100000674 -68500000686 673
orandand
589-686670
nnn
530010000 gt530010000 It
or 592
and 672and 511and 674
nullnull
00
5.10+65.05+6
nn
n
nnn
....- 1----------1----------1....* .-------- 1 -------- 1 -------- 1 ----* job termination valve trips*------------1----------1----------1-.... ----1 --------- 1 ---- ---- ----
* open00000687 685* close
or 685 n
00000688 686 or 686 n*------------1---------1---------.1-........-1.... ---- 1 ----.---- I ----
*LB1-*LB1-
*LB1-
LBI-*LB1-*LB1-*LB1-
*LB1-*LB1-*LB1-
LB1-LBI-
LB1-
LB1-*LB1-
LB1-*LB1-
LB1-
LB1-
LB1-LB1-LB1-LB1-
LB1-LB1-LB1-
LB1-
LB1-
LB1-LB1-
LB1-
LB1-LB1-
*LB1-*LB1-
*LB1-
*LB1-*LB1-*LBI-
*LBI-
LB1-
LBI-
LBI-
210211212213214215216
217218219220221222
223224225226227
228229230231232
233
234235236
237238
239
240-241242
243244245246247248249250251252
* intact loop [ 100 1
* reactor vessel nozzle - intact loop hot leg
1000000 "rvn ilhl" branch1000001 2 010001011000102
1000200
1001101
1002101
1001201
1002201
0.04.0e-50
252010000
100010000
6.8816528
6.8770447
1.58878 0.102752 0.0
0.0 00
1.48646+7 1386877. 246:100000000 0.0634 0.1105000000 0.0 0.1
6.9143944 0. * (M*6.8802338 0. * (M
0.0 0.0
2854. 0.
0.10.1
= 304.54 kg/s)
= 304.54 kg/s)
00020000
116

* pressurizer connection tee reactor vessel side*--------1--------1----------1----------1------1--------1---.
1050000 "pzr t rv" branch
1050001 1 01050101 0.0634444 1.0531192 0.0 0.0 0.0 0.01050102 4.0e-5 0.0 00
1050200 0 1.48614+7 1386879. 2462922. 0.
1051101 105010000 107000000 0.0 0.12 0.12 00001051201 7.0344353 7.0361328 0. * (M = 304.54 kg/s)
* pressurizer connection tee
1070000 "pzr branch
1070001 1 01070101 0.0620253 0.2810215 0.0 0.0 0.0 0.01070102 4.0e-5 0.0 001070200 0 1.48580+7 1386884. 2462992. 0.
1071101 107010000 110000000 0.0 0.135 0.135 00001071201 7.1995277 7.1999016 0. * (M = 304.55 kg/s)* ------- ---- .---- 1-- ----.----.1 ----.---- 1 -------- ----.---- 1 ----* pressurizer connection tee steam generator side
1100000 "pzr t sg" branch
1100001 1 01100101 0.0606063 0.9207292 0.0 0.0 0.0 0.01100102 4.0e-5 0.0 00
1100200 0 1.48543+7 1386887. 2463072. 0.
1101101 110010000 112000000 0.0 0.15 0.15 0000
1101201 7.6043472 7.6044426 0. * (M = 304.55 kg/s)*------------1-------- 1--1-------------------1------- ....---. 1....
* hot leg piping*------------1----------1----------1----------1------1---------1-•--
1120000 "hotleg p" pipe
1120001 2
1120101 0.0 2
1120201 0.0 11120301 1.38893 1
1120302 0.707687 2
1120401 0.0796973 1
1120402 0.0579614 2
1120501 0.0 2
1120601 0.0 1
1120602 90.0 2
LB1- 253LB1- 254
*LB1- 255*LBI- 256*LB1- 257*LB1- 258*LBI- 259
*LBI- 260
LB1- 261
LB1- 262LB1- 263LB1- 264
*LB1- 265
*LB1- 266*LB1- 267*LBI- 268*LBI- 269*LB1- 270
LBI- 271LB1- 272
LB1- 273
LB1- 274*LBI- 275
*LB1- 276*LB1- 277
*LBI- 278
*LB1- 279*LBI- 280
LB1- 281LBI- 282LB1- 283LBI- .284
*LBI- 285
*LBI- 286
*LBI- 287*LB1- 288
*LBI- 289
*LBI- 290*LBI- 291
*LB1- 292
*LB1- 293
*LB1- 294
*LB1- 295
117

1120701 0.0 11120702 0.246447 2
1120801 4.0e-5 0.0 2
1120901 0.20 0.20 1
1121001 00 21121101 0000 1
1121201 0 1.48481+7 1386890. 2463202. 0. 0.
1121202 0 1.48527+7 1386893. 2463106. 0. 0.
1121300 01121301 7.6044426 7.6044197 0. 1 * (M 304.55 kg/s)*------------1--------1----------1----------1----------1----------1----.
* sg inlet plenum* 1--------- -...1---------1----------1----------1------1--
1140000 "sg in pl" branch1140001 2 0
12
114010111401021140200
114110111421011141201
1142201
0.04.e-50
1120100001140100005.3275757
2.8866138
0.629795 0.33532 0.0 90.0.0102 00
1.48161+7 1386901. 2463878. 0.
114000000 0.0512 0.0 0.0115000000 0.0 0.0 0.05.3275909 0. * (M-= 304.55 k•
2.8866138 0. * (M = 304.55 k•
0.512756
0100
~/s)
;/ 5)
0100
*LB1-*LB1-*LB1-*LB1-*LB1-*LB1-*LB1-
*LB1-*LBI-
LB1-LB1-LB1-
* LB1-*LB1-*LBI-*LB1-*LB1-*LB1-
*LB1-*LB1-
LB1-LB1-LB1-
LB1-
LB1-*LB1-
*LB1-*LBI-
*LB1-*LB1-*LB1-
*LB1-*LB1-
*LB1-
*LB1-*LBI-*LBI-*LBI-
*-LBI-
*LBI-*LBI-
*LB1-
*LB1-
296
297
298
299
300
301
302
303
304
305
306
307
308
309
310
311
312
313
314
315
316
317
318
319
320
321
322
323
324
325
326
327
328
329
330
331
332
333
334
335
336
337
338
* sg u-tubes
1150000 "sg tubes"
1150001 8
1150101 0.0 8
1150201 0.151171 7
1150301 0.902 11150302 0.6096 3
1150303 0.462908 5
1150304 0.6096 7
1150305 0.902 - 81150401 0.136356 1
1150402 0.0921538 3
1150403 0.0699783 5
1150404 0.0921538 7
1150405 0.136356 8
1150501 0.0 8
1150601 90.0 4
1150602 -90.0 8
1150701 0.902 1
pipe
---- 1---------1---------1----
---- 1---------1---------1----
118
11507021150703
1150704
1150705115070611508011150901
11510011151101115120111512021151203
1151204
11512051151206115120711512081151300
1151301115130211513031151304
1151305
1151306
1151307
0.6096
0.299572-0.299572
-0.6096-0.9021.27-70.0
0.01022 80.0 7
87
00
0000000
0
00
000
2.82808882.78260042.7494032.7273464
2.7084923
2.6880608
2.6694927
1.48048+71.47958+71.47884+71.47825+7
1.47803+71.47810+71.47825+71.47845+7
2.82808882.78260042.7494032.7273464
2.7084923
2.6880608
2.6694927
1351158.1321791.1298703.1283106.
1269219.1253570.
1239114.1226471.
2464114.2464306.2464462.
2464586.
2464634.2464618.2464586.2464544.
0.
0.
0.
0.
0.
0.
0.
0.
*.LB1- 339
*LB1- 340
*LBi- 341*LB1- 342
*LB1- 343*LB1- 344
*LB1- 345
*LB1- 346
*LBI- 347
0. 1 *,LB1-. 3480...... 2 *LB1- 3490. 3 *-LBI- 3500. 4 .*LBI- 351
0. 5 *LB1- 3520. 6 *.LB1- 353
0. 7 *LBI" 3540. 8 *LB1- 355
*LB1- 356kg/s) LB1- 357
kgls) LB1,7 358kg/s) :. LB1i 359kg/s) LBi'. 360
kg/s) LP!'- 361
kg/s) LB1- '362
kg/s). LBI- 363---1---- LB1- 364
LB1- 365--- .... LB1- 366
*.LB1- 367
0.
0.
0.
0.
0.
0.
0.
1.2.
3
4
5
6
7
* (M* (M
,(M* (M* (M.* (M* (M
= 304.55304.55
r=304.55
=304.55
= 30.4.55
= 304.55= 304.55
* sg outlet plenum* --------- I ----.---- 1 --1------------ ----- 1-- -7----- - ---
1160000 "sgout pl" branch
11600011160101
1160102
1160200
11611011162101
-11612011162201
0.0
4.e-5
0
115010000116010000
2.6536255
4.9208031
00.629795
0.0102
1.47885+7
116000000
1180000002.6536255
4.9208031
0.33532
00
1226479.0.0 ,0.05120.
0.
0.0 -90. -0.512756
246440.0
0.0(M=(M=
r-60 0.0.0 . 0100
0.0 0100304.55, kg/s), Z304.55 kg/s)
*
*
*LB1-*.368*LB1- 369
*LB1- 3879
* LB1- 371
*LBI- 372
*LB1- 3fi3
LB1- 3r7
LBI- 376
LB1-- 37.7
LBI-. 378
.*LB1- 379*LB17 380
*LB1- 381
*------------1------1-------- --1---------1----- ---- 1.---...-* pump suction piping ......
1180000 "pmp suc" pipe .1180001 3
1180101 0.0 3
119

118020111803011180302
11803031180401
11804021180403118050111806011180701118070211807031180801
118090111809021181001118110111812011181202
1181203
1181300
0.00.646638
0. 688596
0.5585770. 0445625
0.04451370.03542780.0-90.0-0.498052-0.688596-0. 3556044.e-5
0.083
0.104000000000
0
0.00.0830.104321.47603+71. 47578+7
1.47591+7
312
1226479.
1226481.
1226482.
2465056.
2465110.
2465082.
0.
0.0.
0.
0.0.
123
1181301 6.2057037 6.2057037 0. 1 * (M = 304.55 kg/s)1181302 6.3250008 6.3250008 0. 2 * (M = 304.55 kg/s)*------------1----.....-1-.....----1----------1----------1------1--
* pump suction tee
1200000 "pmp scte" branch1200001 3 01200101 0.0 0.759614 0.0487901 0.0 0.0 0.01200102 4.0e-5 0.0 00
1200200 0 1.47604+7 1226484. 2465056. 0.1201101 118010000 120000000 0.063427 0.0 0.0 00001202101 120010000 125000000 0.063427 1.075 1.25 00001203101 120010000 155000000 0.063427 1.075 1.25 00001201201 6.3248024 6.3248024*0. * (M = 304.55 kg/s)1202201 2.9577122 2.9577122 0. * (M = 142.42 kg/s)1203201 3.3670826.3.3670826 0. * (M = 162.13 kg/s)
*LB1-*LB1-
*LB1-
*LB1-*LB1-
*LB1-*LB1-*LB1-
*LBI-*LB1-*LB1-*LBI-*LB1-
*LB1-*LB1-*LBI-*LBI-*LBI-*LBI-*LBI-*LB1-*LBI-
LB1-
LB1-
LB1-LBI-LB1-
*LBI-*LB1-*LBI-
*LBi-
*LBI-
*LB1-*LBI-
*LB1-
LB1-
LB1-
LBI-LB1-
LBI-
LBI-*LBI-
*LBI-
*LBI-
382383
384
385386387388
389390
391392393394
395396397
398399400
401
402403
404
405406
407408
409
410411
412
413
414415
416
417
418419
420
421
422
423
424
*--------1-----------------1----------1----------1------1--
* pumpi suction tee outlet
1250000 "pmplsuco" branch12500011250101
I0.0
01.00308 0.0640548 0.0 90. 0.520704
120

1250102 4.0e-5 0.0 001250200 0 1.47662+7 1226488. 2464932. 0.1251101 125010000 130000000 0.0 0.13 0.131251201 4.8336296 4.8336296 0. * (M = 142.42 kg/s)
0000
* .......- 1---- ---- 1--1-- --------- --- --- 1 ----.---- 1 -------- 1 ----* pump 1 inlet
1300000 "pmpl in" snglvol1300101 0.0 0.457201 0.0177444 0.0 90.
1300102 4.0e-5 0.0 001300200 0 1.47556+7 1226490. 2465156. 0.* ------------- ---- ---- ---- ------------ ---- ---- ----* primary coolant pump I
1350000 "pump," pump1350101 .0366 0.0 0.0991 0.0 90.
1350102 01350108 130010000 0.0 0.017 0.017 00001350109 140000000 0.0 0.05 0.05 0000
1350200 0 1.48526+7 1226604. 2463108. 0.
---- ----
0.457201
0.317900
L42.42 kg/s)L42.42 kg/s)
*LBI-*LB1-
*LBI-
LB1-LB1-
LBI-LB1-
*LBI-*LB1-
*LB1-
*LB1-
LB1-LB1-
LB1-*LBI-*LBI-
*LBI-*LBI-
*LBI-*LBi-
425
426
427428429430
431432433
434
435436437438439440
441442
443444
1350201 0
1350202 01350301 0
1350302 369.
1350303 613.61350310 0.0
5.1256828 5.1256828 0.5.1253471 5.1253471 0.
* (M=* (M=
LBI- 445
LB1- 446
0 0 -1 -1 5120.5506231 .3155 96. 500.6
-- (pump speed = 203.17993 rev/s
0. 207.433 .0444 19.5987
0.0 0.0* --------- 1----- ---- 1 -----.---- 1 ..-------- ----.---- 1----* pump 1 outlet pump side* --------- 1 --1-------- ---.---- 1--- ---- 1 .---- --- 1 ----
1400000 "pmpl out" snglvol i1400101 0.0 0.502185 0.0183849 0.0 0.0
1400102 4.0e-5 0.0 001400200 0 1.49520+7 1226608. 2461010. 0.
* pumpi outlet pipe tee side
1450000 "pmpl ote" branch1450001 2 0
1450101 0.0 1.40843 0.0633861 0.0 0.0
1450102 4.0e-5 0.0 001450200 0 1.49550+7 1226613. 2460944. 0.1451101 140010000 145000000 0.0 0.0 0.0
0 *LBI- 4471.431 *LBI- 448
LB1- 4490. *LBI- 450
*LB1- 451
-1 ---- LB1-. 452
LB1- 453-1 ---- LB1- 454
*LBI- 455
0.0 *LB1- 456*LB1- 457
*LB1- 458
-1 ---- LBI- 459LB1- 460
.1 ---- LB1- 461*LB1- 462*LB1- 463
0.0 *LB1- 464*LB1- 465
*LB1- 466
0000 *LB1- 467
121

1452101 145010000 150000000 0.0 0.57456 0.050347 00001451201 5.1233711 5.1233711 0. * (M = 142.42 kg/s)
1452201 4.1676712 4.1676712 0. * (M = 142.42 kg/s)* ---- ------------- 1 --1-- ---- --1-- ---- --1-- ---- --1-- ---- 1 ----• pump outlet tee•------------1------1--------1------1--------1----------1----.
1500000 "pmp oute" branch
1500001 1 01500101 0.0 0.496511 0.0316011 0.0 0.0 0.0
1500102 4.0e-5 0.0 001500200 0 1.49424+7 1226616. 2461222. 0.
1501101 150010000 175000000 0.063427 0.0 0.0 00001501201 6.3237686 6.3237686 0. * (M = 304.55 kg/s)
* pump 2 suction tee outlet
1550000 "pmp2 sct" branch1550001 1 01550101 0.0 1.00308 0.0640548 0.0 90.1550102 4.0e-5 0.0 001550200 0 1.47641+7 1226488. 2464976. 0.
1551101 155010000 160000000 0.0 0.13 0.131551201 5.5026512 5.5026512 0. * (M = 162.13 kg/%
* pump 2 inlet pipe
1600000 "pmp2 in" snglvol1600101 0.0 0.457201 0.0177444 0.0 90.
1600102 4.0e-5 0.0 00
1600200 0 1.47515+7 1226489. 2465244. 0.* ----- 1 ------- ---- ---- ------------ -------- 1 ----* primary coolant pump 2
1650000 "pump2" pump'
1650101 .0366 0.0 0.0991 0.0 90.
1650102 01650108 160010000 0.0 0.017 0.017 0000
1650109 170000000 0.0 0.1 0.1 0000
1650200 0 1.48496+7 1226611. 2463170. 0.
0.520704
0000S)
0.457201
0.317900
162.13 kg/s)
162.13 kg/s)0
1.431
*LB1-LBI-LB1-LBI-LB1-
LB1-*LBI-
*LB1-
*LBI-*LB1-
*LBI-
*LBI-
LB1-LBI-LBI-LB1-
*LBI-,*LBI-
*LBI-
*LBI-
*LBI-*LBI-
LBI-
*LBI-LB1-
LBI-*LBI-*LBI-
*LBI-*LBI-
LBI-
LBI-
LBI-
*LB1-*LBI-*LBI-*LB1-
*LBI-
*LBI-
LBI-
LBI-*LB1-
*LBI-
468
469470471472473474
475476
477478
479480481482483
484485486487488
489490
491
492
493
494495
496
497498
499
5oo
501
502
503504
505
506
507
508
509
510
16502011650202
1650301
1650302
00
135
369.
5.83514795.8347816
135 135
0.5831434
5.83514795.8347816
-1
.3155
0.
0.
-1
96.
*
*
(M =
(M =
512
500.6
122

* (pump speed = 215.17993 rev/s) LBI- 511
1650303 613.6 0. 207.433 .0444 19.5987 0. *LBI- 512-1650310 0.0 0.0 0.0 *.LB1- -513* .......---- .---.---1 ----.---- 1 --- ---- --1------ --1---------- .. LBI- 514* pump 2 outlet LBI- 515* -------------- 1------ 1 --1-------I--1------- I ---1-- ---- --1-- ----- ---- -LB1- 516
1700000 "pmp2 out" branch *-LBI- .517
1700001 1 0 *LB1- 518
17001011700102170020017011011701201
0.04.0e-50
1700100005.8323326
0.514071 0.0190.0 00
1.49504+7 122661
150000000 0.036(5.8323326 0.
?958 0.0 0.0 0.
L5. 2461048. 0.
311 0.3847 0.6316 0* (M = 162.13 kg/s)
.... 1----------1----------1-* ........----- -- --------1---------1----
* intact loop cold leg pipe
1750000 "ilcl pip" pipe1750001 2
1750101 0.0 21750201 0.0 11750301 0.558577 11750302 0.613244 2
1750401 0.035428 11750402 0.038895 21750501 0.0 2
1750601 0.0 2
1750701 0.0 2
1750801 4.0e-5 0.0 2
1750901 0.0 0.0 11751001 00 2
---- 1 -------- 1---- ---- 1-
0 *LB1- :519*LBI- 520
... *LB1- 521
00 *LB1- 522- t LBl- 523:
LBi-.524'LB1- 525
--- LBI- 526*LBI'-. 527,*LBI- 528
*LB1- 529*LBI- 530*LB1- 531..*LB1- 532
'*LB1- 533.
*LBi-.r.534*LB1--.535
*LB-. 536-
*LB1- 537
*LBi- 538"
". . *LB - 539 ..
*.LBI-;,540
•LBI-: 541I *LB1-:.542,-"
,2, *LB1- 543"*LB1- 544
s) LB1-. 54.5LB1- 546LB1- 547.
LB1- 548
1751101175120117512021751300
0000
000
i
1.49419+7 1226617.1.49415+7 1226619.
2461232.
2461240.0.0.
0.0.
1751301 6.3239746 6.3239746 0. 1 * (M = 304.55 kg/-- connection tee1----------1----------1----------1-. ....- 1---- 1-"
* ecc connection tee'
1800000 "ecc tee"
1800001 1
1800101 0.01800102 4.0e-5
1800200 0
branch0
1.15189 0.0730598 0.0
0.0 00
0.0 0.0
- *LB1- '549*LB1- 550.
*LB1- 551 ,
*LB1- 552
*LB1-, 5531.49409+7 1226623. 2461252. 0.
123

1801101 175010000 180000000 0.0 0..0 0.0 0000 *LBI- 554
1801201 6.3239784 6.3239784 0. *-(M = 304.55 kg/s) LB1- 555* ----- ---- .-- -- 1-- I------- 1 ----.---- 1---- -----1--- ---- 1 ---- LB1- 556
* reactor vessel nozzle - intact loop cold leg LBI- 557* .......---- --- ---- ---- I----------------- ---- ---- I ----.---- I ---- LBI- 558
1850000 "rvn ilcl" branch *LBI- 559
1850001 2 0 *LB1- 5601850101 0.0 1.00965 0.0644920 0.0 0.0 0.0 *LB1- 5611850102 4.0e-5 0.0 00 *LB1- 562
1850200 0 1.49404+7 1226625. 2461262. 0. *LB1- 563
1851101 185010000 202000000 0.0634 2.8 2.8 0001 *LBI- 5641852101 180010000 185000000 0.0 0.0 0.0 0000 *LB1- 565
.1851201 6.3264885 6.3264885 0. * (M = 304.55 kg/s) LB1- 566
1852201 6.3238869 6.3238869 0. * (M = 304.55 kg/s) LBI- 567* LBI- 568
LBI- 569LB1- 570
a LBI- 571
* reactor vessel [ 200 ] LBi- 572* LBI- 573
LB1- 574
* LB1- 575--* ---- ---- --1-- ---- 1 --- ---- 1 --------1--- ---- 1 --- ---- 1 ---- LB1- 576* inlet annulus upper volume intact side LB1- 577* -------- I ---- ---- 1 ---.---- 1 ---.---- 1 ---.----- 1--- ---- 1 ---- LB1- 578
2000000 "inanupri" annulus *LBI- 5792000001 1 *LB1- 5802000101 0.1308530 1 *LB1- 581
2000301 0.1876129 1 *LB1- 582
2000401 0.0 1 *LBI- 5832000501 0.0 1 *LB1- 584
2000601 90.0 1 *LB1- 585
2000801 3.81-6 0.172 1 *LB1- 586
2001001 00 1 *LBI- 587.2001201 0 1.49102+7 1226631. '2461894. 0. 0. 1 *LB1- 588* -------.------------ 1- I - -- 1 I .----- ---- 1 --------- 1--- ---- 1 ---- LB1- 589
* junction - upper to lower inlet annulus intact side LB1- 590* ----. ---- --- ---- ----.--- 1 ---- ---- 1---- -----1--- ---- 1 ---- LB1- 591
2010000 "inanmuin" sngljun *LB1- 5922010101 202000000 200000000 0.129467 0.0000 0.0000 0100 *LB1- 593
2010201 0 0.8944483 0.8944483 0. * M= 88.864 kg/s) LB1- 594* ----- ---- --1-- --- I -- 1--- ---- ----.---- ---- ----- --- ---- 1---- LBI- 595
* inlet annulus middle volume intact side LBI- 596
124

* - - - - . .- - - I . . . . . . . .- 1 ----. . . . . 1 ---- . .--- . . . . .--- ----. .I -- -. . .- -2020000 "inanmidi" annulus2020001 12020101 0.1308530 12020301 0.2851823 12020401 0.0 1
2020501 0.0 12020601 -90.0 12020801 3.81-6 0.172 12021001 00 12021201 0 1.49124+7 1226627. 2461850. 0. 0.
* --------------- ---------------- I .---- -- 1-- I----.----1----* junction - middle to lower inlet annulus intact side
---- ----
* -------------- 1------ --- ------------ ---- -1---.2050000 "inanmlin" sngljun2050101 202010000 210000000 0.0709408 0.02050201 0 2.1709213 2.1709213 0.*-------------1------1--------1----------1....
* inlet annulus lower volume intact side*-------------1------1--------1----------1-...
2100000 "int down" annulus2100001 4
2100101 0.1464354 1
2100102 0.0 4
2100201 0.0709408 32100301 0.2525361 1
2J00302 1.5200561 22100303 1.2616333 32100304 1.0792591 42100401 0.0 12100402 0.1581866 2
2100403 0.1217000 3
2100404 0.0986806 4
2100501 0.0 4
2100601 -90. 4
2100801 3.81-6 0.172 42100901 0.0 0.0 3
2101001 00 04
2101101 00000 03
2101201 0 1.49069+7 1226629. 24619(
2101202 0 1.49120+7 1226639. 24618E2101203 0 1.49216+7 1226648. 24616E
2101204 0 1.49296+7 1226655. 24614E
0.0 0100*,(M = 215.68 kg/s
-..-- 1----------1-....
....1----------1-....
LB1-*LB1-*LB1-*LB1-*LB1-*LB1-*LB1-
*LB1-*LB1-*LB1-
I *LB1-
LB1-LB1-LB1-
*LB1-.*LB1-
,) LB1-
LBI-LBI-LBI-
*LBI-*LBI-
*LBI-
*LBi-
*LBI-
*LBi-*LBI-*LB1-
*LBI-.
*LB1-*LB1-*LB1-
*LB I-
*LBI-
*LBI-
*LB1-*LB I-*LB1-
*LBI-
1 *LBI-
2 *LBI-3 *LBI-
4 *LB1-
597598599600601
602603604
605606
607608609610611612613
614615616617618
619
620
621
622
623624625626627628
629
630
631
632633
634
635
636
637
638
639
4.8.
58.
38.
0.
0.
0.
0.
0.
0.
0.
0.
i25

2101300 02101301 4.0043716 4.0043716 0. 1 * (M = 215.68 kg/s)2101302 4.0043564 4.0043564 0. 2 * (M = 215.68 kg/s)2101303 4.0043182 4.0043182 0. 3 * (M = 215.68 kg/s)* -------------1-- ---- I--1-- ----- I--1-------1 i ---- ---- 1 ----* junction - lower downcomer to lower plenum intact side*--------------1----------1----------1----------1----------1----------1-....
21500002150101
2150201
inanmuin2100100000
sngljun222000000 0.0709408 0.0000
3.1068134-3.1068134 0.0.0000 0100
* (M = 215.68 kg/s)
* lower plenum top volume*----------1--------1----------1---------1--.......1-. ...------1-.-
2220000 "lwr plto" branch
2220001 2 02220101 0.0 0.3533183 0.2592277 0.0 -90. -0.35331832220102 3.81-6 0.0 002220200 0 1.49326+7 1226677. 2461426. 0.2221101 222010000 220000000 0-0 0.005 0.005 00002222101 222000000 225000000 0.1499 1.5 1.5 00002221201 0. 0. 0. * (M =-2.135-4 kg/s)
2222201 2.6758347 2.6758347 0. * (M = 304.54 kg/s)
*.LB1-LB1-LB1-
LB1-LB1-LB1-LB1-
*LB1-*LB1-
LB1-LB1-LB1-
LB1-*LBi-*LB1-*LB1-
*LB1-*LBI-
*LB1-*LB1-
LB1-LB1-
LB1-
LB1-
LB1-*LB1-*LB1-
*LB1-
*LB1-
LB1-
LB1-LB1-
*LB1-
*LB1-
*LBI-
*LB1-*LB1-
*LB1-
*LB1-
*LB1-
LB1-
LB1-
LB1-
640641642643644645646
647648649650651
652
653654655656657658659
660661
662
663
664665666
667
668669
670671
672
673
674675
676
677
678
679
680
681
682
* lower plenum bottom volume*-------------1----------1----------1---------------1---
2200000 "lwr plbo" snglvol
2200101 0.0 0.3741720 0.29656 0.0 -90.2200102 4.0e-5 0.0 00
2200200 0 1.49353+7 1227759. 2461370. 0.* ----.---- 1 --- 1--- 1----- ---- 1-- ---- ---- 1 ----- ---- 1 ----* lower core support structure*-------------1----------1----------1------1----------1...
2250000 "1 coresp" branch
2250001 3 0
-----I ----
-0.3741720
....- 1----
...--- 1---
2250101 0.2832456 0.5709989 0.0 0.0 90. 0.5709989
2250102
2250200
2251101
2252101
2253101
2251201
2252201
2253201
3.81-6
0
225010000
225010000
225010000
2.1676121
2.0351467
0.8832984
0.095
1.49243+7230000000
231000000
235000000
2.6011333
2.4421768
0.8832984
001226681.
0.0
0.0
0.0
0. *
0. *
0. *
2461600. 0.
1.5 1.51.5 1.5
12. 12.
0010000100
00100(M =
(M=
(M=
242.76 kg/s)
47.741 kg/s)
14.036 kg/s)
126

* ---- 1--- I - ---- 1 - 1 ---- 1 ---- 1 ...---- .* active core average channels (82 1)
2300000 "core avg" pipe
2300001 52300101 0.147510 12300102 0.137871 22300103 0.139239 32300104 0.138031 42300105 0.140191 5
2300201 0.142384 12300202 0.120254 22300203 0.142384 3
2300204 0.120254 42300301 0.432000 1
2300302 0.195000 32300303 0.280000 42300304 0.5744204 5
2300401 0.0 52300501 0.0 52300601 90.0 52300801 1.27-7 0.0124 5
2300901 0.0 0.0 1
2300902 0.66 0.66 2
2300903 0.0 0.0 42301001 100 5
2301101 0000 4
2301201 0 1.49160+7 1267540. 2461774. 0. 0.
2301202 0 1.49125+7 1290328. 2461848. 0. 0.
2301203 0 1.49087+7 1315376. 2461928. 0. 0.
2301204 0 1.49062+7 1347631. 2461972. 0. 0.
2301205 0 1.49019+7 1382139. 2462058. 0. 0.
2301300 0
2301301 2.2899361 2.7479229 0. 1 * (M = 242.76 kg/s)
2301302 2.742588 3.4933643 0. 2 * (M = 242.76 kg/s)
2301303 2.3472824 2.9397068 0. 3 * (M = 242.76 kg/s)
2301304 2.8279877 3.5388184 0. 4 * (M = 242.76 kg/s)* ------- ---- ---- 1-- ---- ----1 -------- 1 -------- ---- ---- 1 ----* active core hot channels (14 %)
2310000 "core hot" pipe
2310001 13
2310101 3.0897-2 1
LB1-LB1-
LB1-
*LB1-*LB1-*,LB1-
*LB1-
*LB1-*LB 1-
*LBI-
*LB1-*LBI-*.LB1-
*.LBI-*LBI-*LBI-*LB1-.*LB1-
*LBI-*LB1-*LBI-*LB1-
*LB1-
*LB1-*LB1-
*LB1-
*LBI-I *LBi-
2 *LB1-3 *LBI-4 *LBI-5 *LB1-
*LB1-
LB1-
LB1-
LB1-LB1-LB1-
LB1-
LB1-*LB1-
*LBI-
*LB1-
683684685
686.,687..688-689690691692693694695
696697698699700
701702
703704
705
706. -
707
708709
710
711
712713
714
715
716
717.
718719720721
722
723
724
725
127

23101022310103231010423101052310201
2310202231020323102042310205231030123103022310303231030423103052310501231060123108012310901
231090223109032310904
23109052311001
2311101231120123112022311203
2311204
2311205
2311206
2311207
2311208
2311209
2311210
231121123112122311213
2311300
2311301
2311302
2311303
2311304
2311305
2.98875-22.90272-2
2.89101-22. 9881-23.1031-22.6208-23. 1031-2
2.6208-23.1031-20.13970170.2650.08833
0.13250.21173870.090.01.27-70.0
0.660.00.66
0.0100
0000000
0
00
0
0
0
0
000
0
2. 0435925
2.0827312
2.0993977
2.5073719
2.1380539
1213
1012
121313130.01240.00.660.00.66
0.0
13
121.49181+71.49160+71.49141+71.49132+7
1.49107+7
1.49098+7
1.49089+7
1.49080+7
1.49069+7
1.49056+7
1.49026+71.49013+71.48998+7
2.571722
2.6167469
2.6302261
3.2380276
2.68367
13349
1012
*LB1-*LB1-*LB1-
*LB1-*LB1-*LB1-*LB1-
*LBI-*LB1-*LB1-*LB1-
*LB1-*LB1-*LB1-*LB1-
*LBI-
*LB1-*LB1-*LB1-*LB1-*LB1-
*LBI-*LB1-
*LBI-*LBI-
*LBI-*LBI-*LB1-
*LB1-
*LBI-*LBI-
*LB1-
*LB1-
*LB1-
*LB1-*LB1-*LB1-*LB1-
LB1-
LB1-
LB1-
LB1-
LB1-
726727
728729
730731732
733734735736
737738
739740
741742743744745746
747748
749750
751752
753
754755
756
757
758
759
760761
762763
764
765
766
767
768
1244536.1282626.1296847.
1311867.
1327478.
1343438.
1359360.
1374806.
1395716.
1413516.
1427835.
1439243.1452086.
2461730.2461776.2461812.
2461832.
2461880.2461900.
2461916.
2461932.
2461950.
2461968.
2461998.2462028.2462070.
0.
0.
0.00124
0.0023387
0.00390290.0068514
0.0109944
0.0157993
0.0231137
0.0283452
0.0316463
0.03097690.0254654
0.
0.
0.
0.
0.
0.
0.
0.
0.
0.
0.
0.
0.
123
4
56
7
8
9
10
111213
0.
0.
0.
0.
0.
1
2
3
4
5
*
*
*
*
*
(M
(M(M(M(M
47.741
47.741
47.741
47.741
47.741
kg/s)
kg/s)
kg/s)
kg/s)
kg/s)
128

2311306 2.1622353 2.7156086 0. 6 * (M = 47.741 kg/s)2311307 2.1893768 2.7527866 0. 7 * (M = 47.741 kg/s)2311308 2.2174587 2.7930908 0. 8 * (M = 47.741 kg/s)2311309 2.2589722 2.8472137 0. 9 * (M = 47.741 kg/s)2311310 2.7163639 3.4960823 0. 10 * (M = 47.741 kg/s)2311311 2.3214836 2.9286175 0. 11 * (M = 47.741 kg/s)2311312 2.3371143 3.021553 0. 12 * (M = 47.741 kg/s)* ---- 1 ....------1----- ---- ----.------------ 1 -------- 1 ------- 1 ----* core bypass volum6 (4 prozent)
2350000 "core byp" pipe
2350001 32350101 2.0930-2 3
2350201 0.0 22350301 0.5588068 32350401 0.0 32350501 0.0 32350601 90.0 32350801 3.81-6 0.003 32350901 0.0 0.0 2
2351001 00 32351101 0000 22351201 0 1.49160+7 1226691. 2461774. 0. 0.
2351202 0 1.49100+7 1226700. 2461900. 0. 0.
2351203 0 1.49041+7 1226709. 2462024. 0. 0.
2351300 02351301 0.8833084 0.8833084 0. 1 * (M = 14.036 kg/s)2351302 0.883316 0.883316 0. 2 * (M = 14.036 kg/s)
* upper end boxes and support structure
2400000 "uprend b" branch
2400001 3 02400101 0.2423341 0.5867979 0.0 0.0 90. 0.58679792400102 3.81-6 0.145 00
2400200 0 1.48946+7 1386723. 2462212. 0.
2401101 230010000 240000000 0.0 1.5 1.5 001002402101 231010000 240000000 0.0 1.5 1.5 001002403101 235010000 240000000 0.0 12. 12. 00100
2401201 2.4738331 3.0367889 0. * (M = 242.76 kg/s)2402201 2.4358578 3.3036118 0. * (M = 47.741 kg/s)2403201 0.8833241 0.9368153 0. * (M = 14.036 kv/s)
LB1-LB1-LB1-LB1-LBi-LB1-LB1-
LB1-
LB1-
LB1-*LB1-*LB1-
*LB1-*LB1-*LB1-*LB1-*LB1-
*LB1-
*LB1-
*LB1-*LB1-*LB1-*LB1-
*LB1-*LB1-*LB1-
LB1-
LB1-
LB1-LB1-LB1-
*LB1-*LB 1-
*LB1-
*LB1-*LB1-
*LB1-
*LB1-
*LB1-
LB1-LB1-LB1-
769770771772773774775
776777
778779
780
781782783784785786
787788789790
791
792793
794795
796
797798799
800801802
803
804
805
806807
808
809810
12
3
* ----- -----1---- 1---- -------- -------- 1 ---- ---- 1 ----.---- 1 ---- LB1- 811
129

* upper core support structure - cross flow region*---- ---- 1---- ---- I .-------1 J ----.---- I --------- I ----.---- I----
2450000 "uprcores" branch2450001 2 024501012450102
2450200
2451101
2452101
2451201
2452201
0.03.81-60
240010000
2450100001.80150030.
0.4933248 0.12808060.145 00
1.48910+7 1386845.
245000000 0.0251000000 0.01.8521795 0. *
0.0733461 0. *
90. 0.4933248
2462282. 0.
0.0 0.0
0.0 0.0(M = 304.54 kg/s)(M =-2.198-4 kg/s)
0000
0000
* ......- 1---- --- --- 1- --------- --- --- 1 -------- 1 -------- 1 ----* upper flow skirt region
2500000 "uflw skr" branch2500001 1 02500101 0.1547532 0.7850547 0.0 0.0 90. 0.78505472500102 3.81-6 0.131 00
2500200 0 1.48847+7 1386868. 2462412. 0.
2501101 245010000 250000000 0.0 0.0 0.0 00002501201 2.81954 2.9243202 0. * (M = 304.54 kg/s)
* dead end of fuel modules
LB1-LB1-
*LB1-
*LB1-*LB1-*LB1-*LB1-
*LB1-*LB1-
LB1-LBI-LB1-
LB1-
LB1-*LB1-
*LB1-
*LB1-*LB1-
*LB1-
*LB1-
LB1-LBI-LB1-
LBI-*LBI-*LB1-*LB1-
*LBI-
LB1-LB1-
LB1-
*LB1-*LB1-
*LB1-
*LB1-
*LBI-
*LBI-
LB1-
LBI-
LBI-
LBI-*LBI-*LBI-
812813814815816817818
819820821822823824825826827
828829830
831832833834
835
836
837838
839
840841
842843844
845
846
847
848
849
850
851
852
853
854
* -------------- --------I ---- ---- ---- -- 1-- --------1----
25100002510101
25101022510200
"dfl mods" snglvol0.0 0.7844123 0.1154214 0.0 9C
3.81-6 0.214 00
0 1.48876+7 1388454. 2462370. 0.
.
* ------- ---- .---- 1-- I ---- ---- 1---- ---- 1 -------- 1 ----* upper head
2520000 "upr head" branch2520001 1 02520101 0.2622585 0.2869580 0.0 0.0 90.2520102 3.81-6 0.0 002520200 0 1.48827+7 1386872. 2462472. 0.
2521101 250010000 252000000 0.0 0.006 0.006
---- ----
0.7844123
0. 2869580
0000
2521201 2.8193226 2.8648758 0. * (M = 304.54 kg/s)
* upper plenum bottom volume
2550000 "uprpl bt" branch
2550001 2 0
130

25501012550102255020025511012552101
25512012552201
0.2622585 0.6312304 0.0 0.0 90. 0.6
3.81-602500100002550100000.0.
0.0 001.48826+7 1387563.255000000 0.0260000000 0.0
0.040443 0.
0. 0.
2462476. 0.0.006 0.0060.03 0.03
* (M =-3.725-4 kg/s)* (M =-1.957-4 kg/s)
* ----- ....------ ------- ----.---- 1--------- --- ----. -- - ---* upper plenum top volume
2600000 "uprpl tp" snglvol2600101 0.0 0.7747094 0.1914909 0.0 90.2600102 3.81-6 0.0 002600200 0 1.48778+7 1391166. 2462576. 0.* ----------- I-------- ---- ---- I -------- ---- ---- ----* inlet annulus upper volume broken side*------------1----------1----------1-----.1-------
2700000 "inanuprb" annulus2700001 12700101 0.1308530 12700301 0.1876129 12700401 0.0 12700501 0.0 12700601 90.0 12700801 3.81-6 0.172 12701001 00 12701201 0 1.48994+7 1226634. 2462122. 0.
0.71
M12304 *LB1- 855*LBI- 856
"jLB1- 8570000 *LBI- 8580000 *LBI- 859
LB1- 860LBI- 861
1---- LB1- 862. LBI-. 863
1---- LB1- 864*LBI- 865
747094 *LBI- 866*LB1- 867
*LB1- 868
-1---- LBI- 869LBI- 870
-1---- LB1- 871*LB1- 87.2
*LB1- 873*LB1- 874
. *LB1- 875
*LB1- 876*LB1- 877
*LB1- 878*LBI- 879*LBI- 880
0. 1 *LB1- 881
* ----- --------------- 1 ---------1--- ----.--1--- ----- ---- ---- 1 ----* junction - middle to upper inlet annulus broken side
*- .. 1------ ---- I.------ .---- .---- ----- - 1-- -------- 1 ----2710000 "inanmubk" sngljun
2710101 272000000 270000000 0.129467 0.0000 0.0000 0100
2710201 0 -0.894464 -0.894464 0. * (M =88.864 kg/s)
* inlet annulus middle volume broken side
2720000 "inanmidb" annulus2720001 1
2720101 0.1308530 1
2720301 0.2851823 1
2720401 0.0 1
2720501 0.0 1
2720601 -90.0 1
LB1- 882LB1- 883LB1- 884
*LB1-.885-+LB1- 886
LBI- 887LB1- 888:LBI- 889LB1- 890
*LBI- 891*LB1- 892*LBI- 893
*LB1- 894
*LB1- 895*LB1- 896• LB1- 897.
131

2720801 3.81-6 0.172 12721001 00 12721201 0 1.49008+7'1226641. 2462092. 0. 0.junction .... .1to low----1 inlet annu--1-- ------ 1 1----
• junction - middle to lower inlet annulus broken side
2750000 "inanxnlbk" sngljun2750101 272010000 280000000 0.0709408 0.02750201 0 0.8944659 0.8944659 0.*inlet an------1----- .... . v e .1b n s 1* inlet annulus lower volume broken side
0.0 0100* (M 88.864 kg/s
---- 1----------1-..-.
---- 1----------1....* --------- I------- ---1-..-2800000 "brok dow"
2800001 42800101 0.1464354 12800102 0.0 42800201 0.0709408 32800301 0.2525361 1
2800302 1.5200561 22800303 1.2616333 32800304 1.0792591 42800401 0.0 12800402 0.1581866 2
2800403 0.1217000 32800404 0.0986806 4
2800501 0.0 42800601 -90. 42800801 3.81-6 0.172
2800901 0.0 0.02801001 00 042801101 0000 032801201 0 1.490:
2801202 0 1.490w2801203 0 1.4911
2801204 0 1.492
2801300 02801301 1.6498756 1.649I2801302 1.6498709 1.64912801303 1.6498575 1.6491* ------------ 1 ----.----1----2850000 "lrdc2lpb"2850101 280010000 22200(
annulus
*LB1-*LB1-
1 *LB1-LB1-
LB1-LB1-
*LB1-*LB1-
;) LBl-LB 1-
LB1-LB1-
*LB1-*LBI-
*LB1-*LB1-*LBI-*LBI-
*LB1-*LBI-*LBI-*LB1-*LBI-
*LB1-
*LB1-
*LB1-
*LBI-*LB1-*LB1-
*LBI-
*LBI-*LBI-
2 *LBI-3 *LB1-
4 *LB1-
*LB1-
LB1-
LB1-
LB1-
LBI-
*LB1-
*LB1-
898899900901
902903904905
906907908909910
911
912913914915
916917918919
920921
922
923924
925
926927928
929930
931
932
933
934
935936
937
938
939
43
19+7
82+784+7rO+7
1226646.1226669.
1226688.
1226703.
2462070.,2461938.
2461722.
2461542.
* -0 .
0.
0.
0.
0.0.0.
0.
8756 0. 1 * (M = 88.864 kg/s)8709 0. 2 * (M = 88.863 kg/s)8575 0. 3 * (M = 88.863 kg/s)----1 --------- ------- -------- ----
sngljun0000 0.0709408 0.0000 0.0000 0100
2850201 0 1.2800694 1.2800694 0. * (M = 88.862 kg/s) LB1- 940
132

* ....---- 1 -- 1 -1 - I.......1 ..-...... 1 - i .... I -- - ---- .... LB1- 941
2900000 lwrinann sngljun *LB1- 942
2900101 200000000 270000000 0.0296780 1.8341 1.8341 0003 *LB1- 9432900201 0 3.943718 3.943718 0. * (M = 88.864 kg/s) LB1- 944* LBI-! 945* LB1- 946
LB1- 947* LBI- 948
* broken loop [ 300 3 LB1- 949* LB1- 950
LB1- 951* LB1- 952
* ---------- 1-----1 --- 1-..------------- -- 1-- ---- ---- 1 ----.---- 1 ---- LB1- 953
* reactor vessel nozzle - broken loop hot leg LB1- 954* ....- 1---- --- ---1 ---- ---- --- ----- --- ---- --1-- ---- 1 ---- LBI- 955
3000000 '"rvn blhl" branch *LBI- 956
3000001 2 0 *LBI- 9573000101 0.0 0.876303 0.0575410 0.0 0.0 0.0 *LB1- 958
3000102 4.0e-5 0.0 00 *LB1- 9593000200 0 1.48827+7 1227851. 2462474. 0. *LB1- 9603001101 252010000 300000000 0.067014 0.7385868 1.2309481 0002 *LB1- 9613002101 300010000 305000000 0.063426 0.1005 0.1005 0000 *LB1- 962
3001201 0. 0. 0. * (M =-6.939-4 kg/s) LB1- 963
3002201 0. 0. 0. * (M =-6.533-4 kg/s) LBi- 964* ........- 1---- 1--- --- 1----------I--- --- ---- ---- 1 ---- ---- 1 ---- LB1- 965
* hot leg pipe to reflood assist bypass tee LB1- 966* ........- 1---- 1--- ---1-------------- --- ---- ---- 1 ---- ---- 1 ---- LBI- 967
3050000 "hlp-rabs" branch *LBI- 9683050001 1 0 *LB1- 9693050101 0.0 0.698336 0.0442927 0.0 0.0 0.0 *LB1- 970
3050102 4.0e-5 0.0 00 *LB1- 971
3050200 0 1.48827+7 1227509. 2462474. 0. *LB1- 972
3051101 305010000 310000000 0.063426 0.1005 0.1005 0000 *LB1- 9733051201 0. 0. 0. * (M =-6.220-4 kg/s) LB1- 974* ----.---- 1 --1------- --1------ 1 ...---- 1-- ---- ----1 -------- 1 ---- LB1- 975
* broken loop hot leg contraction LB1- 976* ----.---- I ------------.----- .---- ----- 1 ----.----.1 --- ---- 1 ---- LB1- 977
3100000 "blhl ctr" branch *LB1- 9783100001 2 0 *LB1- 979
3100101 0.0 1.50013 0.0678467 0.0 0.0 0.0 *LB1- 9803100102 4.0e-5 0.0 00 *LB1- 981
3100200 0 1.48827+7 1227508. 2462474. 0. *LB1- 9823101101 380010000 310000000 0.0388 0.84 0.84 0000 *LB1- 983
133

3102101 310010000 315000000 8.3647-3 0.553 1.09056 0000
3101201 0. 0. 0. * (M = 1.333-4 kg/s)
3102201 0. 0. 0. * (M =-4.406-4 kg/s)* --------- 1 --- ----- 1-- -------- 1 -------- 1 ---- ---- I ---- ----- ----* steam generator and pump simulatior
3150000 "sg+pmp s" pipe
3150001 83150101 0.0 8
3150201 8.3647-3 13150202 1.12-2 2
3150203 0.105626 3
3150204 1.12-2 4
3150205 8.3647-3 73150301 0.919969 13150302 1.987956 23150303 0.849744 4
3150304 1.987956 53150305 1.371350 6
3150306 1.365029 7
3150307 1.674812 8
3150401 7.75291-3 13150402 0.1721108 2
3150403 8.97552-2 4
3i50404 0.1721108 5
3150405 1.82303-2 6
3150406 5.46687-2 73150407 1.82489-2 8
3150601 90.0 3
3150602 -90.0 7
3150603 90.0 8
3150701 0.679201 1
3150702 1.987956 2
3150703 0.457202 3
3150704 -0.457202 4
3150705 -1.987956 5
3150707 -1.371350 63150708 -0.520701 7
3150709 1.212851 8
3150801 4.0e-5 0.0 8
3150901 0.93596 0.93596 1
3150902 2.0 2.0 2
3150903 0.5 0.5 3
*LB1- 984LB1- 985
LBI- 986
LB1- 987LBI- 988LB1- 989
*LBI- 990*LBI- 991*LBI- 992
*LBI- 993*LBI- 994*LB1- 995*LBI- 996*LB1- 997*LB1- 998*LB1- 999
*LBI-1000
*LBI-1001*LB1-iO02
*LBI-1003*LBI-1004
*LBI-1005
*LB1-1006
*LBI-1007*LBI-1008*LBI-1009
*LBI-1010*LBI-1011
*LBI-1012*LBI-1013
*LBI-1014
*LB1-1015*LB1-1016
*LB1-1017
*LB1-1Oi8*LBI-1019
*LB1-1020*LB1-1021
*LB1-1022
*LB1-1023
*LBI-1024
*LB1-1025*LB1-1026
134

31509043150905
31509063150907315100131511013151201
315120231512033151204315120531512063151207315120831513003151301
2.00. 23025
2.5345.06900
00000
000000000.
2.0 4
0.23025 5
2.534 6
5.069 787
1.48802+71.48703+7
1.48612+71.48612+71.48703+71.48828+71.48898+71.48872+7
0.
1227509.1227509.
1227509.1227510.
1227510.1227510.1227510.
1227510.
2462526.
2462736.2462928.2462928.2462736.2462472.2462324.
2462378.
0.
0.
0.
0.
0.
0.
0.
0.
0.
0."0.
0.
0.
0.
0.
0.
12-
345678
*LB1-1027*LB1-1028
*LB1-1029*LBI-1030*LB1-1031*LB1-1032
*LB1-1033*LBI-1034*LB1-1035*LB1-1036
*LB1-1037*LB1-1038*LB1-1039*LB1-1040*LB1-1041
LB1-10420. 7 * (M =-4.351-4 kg/s)* .--------1 ----------1--- ---- I -- -1 ---- ----. -- ------- -- I ----1* hot leg break valve
3170000 "hl break" valve3170101 315010000 700000000 8.3647-3 1.10813 1.06560 01003170102 0.93 0.843170201 0 0. 0. 0. * (M = 0.0000 kg/!
3170300 trpvlv3170301 510*reactor ves1el .. 1- - -- 1 broken loop c .... 1od ---* reactor vessel nozzle - broken loop cold leg •
3350000 "rvn blcl" branch3350001 2 0
3350101 0.0 0.749305 0.047979 0.0
---- 1-.
0.0 0.0
LBI-1043LBI-1044
LB1-1045*LB1-1046*LBI-1047
*LB1-1048
s) LBI-1049*LBI-1050
*LBI-1051
LBI-1052: LBI-1053
LB1-1054*LB1-1055*LBI-1056*LB1-1057
*LB1-1058*LB1-1059*LBI-1060
*.LB1-1061
LBI-1062
LBI-1063LB1-1064
LB1-1065
LB1-1066*LB1-1067
*LB1-1068
*LBI-1069
3350102 4.0e-5 0.0 00
3350200 0 1.49008+7 1227507. 2462092. 0. "
3351101 272000000 335000000 0.064130 1.455594 0.812933 0002
3352101 335010000 340000000 0.063426 0.1005 0.1005 0000
3351201 0. 0. 0. * (M =-2.646-4 kg/s)
3352201 0. 0. 0. * (M =-2.307-4 kg/s)*------------1----------1----------1--------...1----------1---------1--...
• cold leg pipe to reflood assist bypass tee
•3.......01- ----1----------1----------1----------1 b3400000 "clp-rabs" branch:
3400001
3400101I
0.000.698336 0.0443927 0.0 0.0 0.0
135

3400102 4.0e-5 0.0 00
3400200 0 1.49008+7 1227506. 2462092. 0.3401101 340010000 342000000 0.063426 0.1005 0.1005 0000
3401201 0. 0. 0. * (M =-1.993-4 kg/s)•--------1--------1----------1-----------------1--------1----
* broken loop cold leg rabs to dtt.-1 ---- I ---- ---- 1---- ---- 1-1-7 ----1---- ------1-. ....-1----
3420000 "blcl 2dt" branch
3420001 1 0
3420101 0.0 0.5715069 0.0362484 0.0 0.0. 0.03420102 4.0e-5 0.0 00.
3420200 0 1.49008+7.1227506. 2462092. 0.
3421101 342000000 370000000 0.0388 0.84 - 0.84 0000
3421201 0. 0. 0. * (M =-1.517-4 kg/s)
* broken loop cold leg dtt to break plane
3440000 "blcl 2br" branch-.
3440001 1 0
3440101 0.0 0.9286231 0.0310679,0.0 0.0 0.03440102 4.0e-5 0.0 00
3440200 0 1.49008+7 1227507. 2462092. 0.
3441101 342010000 344000000 0.0540157 6.545 14.05 0000
3441201 0. 0. 0. * (M =-2.198-5 kg/s)•------------1----------1-....------1-- -...... 1------1--------1-...
• cold leg break valve*---------....1----------1----------1----1- ...--....-----..
3470000 "cl break" valve
3470101 344010000 705000000 8.3647-3 0.81969 0.96836 0100
3470102 0.93 0.84 .
3470201 0 0. 0. 0. * (M 0.0000kg/s)
3470300 trpvlv - •3470301 510
* reflood assist bypass piping- cold leg side*--------------1----------1--------1-........1----------1----------1-....
3700000 "rabs clg" pipe
3700001 3
3700101 0.0388 2
3700102 0.0776 3
3700201 0.0388 2
3700301 0.0 3
3700401 0.0279 1
*LBI-1070*LB1-1071
*LBI-1072
LBI-1073LBI-1074LB1-1075LBI-1076
*LBI-1077*LB1-1078
*LBI-1079*LB1-1080*LBI-1081*LBI-1082
LBI-1083LBI-1084LBI-1085LBI-1086
*LB1-1087
*LB1-1088
*LB1-1089*LBI-1090
*LB1-1091*LBI-1092
LBI-1093
LBI-1094
LBI-1095LBl-1096
*LB1-1097
*LB1-1098
*LB1-1099
LBI-1100*LB1-1101
*LB1-1102
LBI-1103LBI-1104
LBI-1105*LB1-1106
*LB1-1107
*LB1-1108
*LB1-1109
*LBI-1110
*LB1-1111
*LBI-1112
136
3700402
370040337006013700602370070137007023700801
37009013700902370100137011013701201370120237012033701300
0.0700.116590.00.00.64
0.04.0-5
0.280.8400000000
00
23
13130.0
0.280.84321.48985+71.48961+7
1.48961+7
3I2
1227506.1227506.1227506.
2462142.2462192.
2462192.
0.0.0.
0.0.0.
12
3
3701301 0. 0. 0. 2 * (M =-1.319-4 kg/s)* ----.......---- -- ------------ ---- ---- ---- ---- -----1 ----* reflood assist bypass valves•*........----... 1-....----1---- ---- 1 1----1--- ----1-------
3750000 "rab vlv" valve
3750101 370010000 380000000 0.03750201 0 0. 0.3750300 trpvlv
3750301 514
0.90+•0.
4 0.90+4 0000( CM = 0.0000 kg/s)
..--- 1----------1----.
.... 1----------1-...-
*LB1-1113*LB1-1114
*LB1-1115*LB1-1116*LB1-1117*LBI-1118*LB1-1119
*LB1-1120*LB1-1121*LB1-1122*LBI-1123*LBI-1124*LBI-1125
*LB1-1126*LB1-1127
LB1-1128
LB1-1129LB1-1130
LB1-1131*LBI-1132
*LB1-1133
LBI-Ii34*LBI-1135
*LBI-Ii36
LBi-1137
LB1-1138LB1-1139
*LB1-1140
*LBI-1141
*LBi-1142*LB1-1143*LBI-1144
*LBI-114t
*LB1-1146
*LB1-1147
*LBI-1148
*LBI-1149*LBI-1150
*LB1-1151
*LB1-1152
*LB1-1153
*LBI-1154*LBI-1155
* .-------- 1 ----.---- 1 --1-------------- ----1----* reflood assist bypass piping - hot leg side
3800000 "rabs h 1" pipe
3800001 3
3800101 0.0776 13800102 0.0388 3
3800201 0.0388 2
3800301 0.0 3
3800401 0.0915 1
3800402 0.048 2
3800403 0.0489 3
3800601 0.0 1
3800602 -90.0 2
3800603 0.0 3
3800701 0.0 1
3800702 -0.64 2
3800703 0.0 3
3800801 4.0-5 0.0 3
137

3800901 03800902 03801001 0O3801101 0O3801201 03801202 03801203 0
3801300 0
.84
.280000
0.840.2832
12
1.48780+7 1227508.1.48803+7 1227508.1.48827+7 1227508.
2462574.2462524.2462474.
0.
0.
0.
0.
0.
0.
123
3801301 0. 0. 0. 2 * (M = 6.475-5 kg/s)*-----------1----------1----------1----------1----------1----------1---..
* pressurizer ['400 ]
*-----------1----------1----------1 -- 1--------1-......---1-....
* surge line pcs side
4000000 "srgli pc" branch4000001 2 0
*LB1-1156*LB1-1157
*LB1-1158*LB1-1159*LB1-1160
*LBI-1161*LB1-1162
*LBi-1163
LB1-1164LB1-1165LB1-1166LB1-1167LBI-1168
LB1-1169LBl-1170LBI-1171LBl-1172LBI-1173LB1-1174LB1-1175
LB1-1176*LBI-1177*LB1-1178
*LB1-1179
*LBI-1180*LB1-1181
*LB1-1182*LB1-1183
LBl-1184
LBI-1185LBI-1186LBI-1187LB1-1188
*LBI-1189
*LB1-1190
*LB1-1191
*LBI-1192
*LB1-1193
*LB1-1194
*LBI-1195
*LB1-1196
*LB1-1197*LB1-1198
40001014000102
4000200
4001101
4002101
40012014002201
1.44561-3 2.30 0.0 .0.0 90.0
2.3622-5 0.0 00
0 1.48563+7 1476973. 2463030. 0.
107000000 400000000 1.44561-3 3.9 3.9400010000 405000000 1.44561-3 2.85 2.85
-0.014768 -0.01474 0. * (M =-0.0141 kg/s)
-0.014763 -0.014763 0. * (M =-0.0139 kg/s)
0.54
0002
1000
* pressurizer surge line
4050000 "srgli pz" pipe4050001 2
4050101 1.44561-3 24050201 1.44561-3 14050301 2.30 24050401 0.0 24050601 90.0 24050701 0.30 24050801 2.3622-5 0.0 24050901 2.85 2.85 1
138

40S1O01 00
40S1101 1000
4051201 04051202 04051300 04051301 -0.0:
211.48536+7 1488259.1.48517+7 1490898.
2463086. 0.
2463126. 0.
0.
0.12
14758 -0:014758 0. i * (M =-0.0139 kg/s)---- 1 ----.---- 1 ---- ---- ----
* pressurizer surge line
4100000 "srg line" sngljun4100101 405010000 415000000 1.44561-3 0.424100201 0 -0.014754 -0.014754 0.* ------- ---- ------ ---- ----.---- ---- ----
1.00 1000* (M =-0.0139 kg/s)----1--------1..-
---..--.-----..-.* pressurizer vessel*------------1----------1-...-
4150000 "pzr vess"4150001 64150101 0.0 24150102 0.5653 54150103 0.0 64150201 0.0 54150301 0.1815 1
4150302 0.1524 24150303 0.3967 34150304 0.5289 44150305 0.3967 54150306 0.1943 6
4150401 0.0684 14150402 0.0838 24150403 0.0 54150404 0.0732 64150501 0.0 64150601 90.0 64150801 4.0e-5 0.04151001 00 64151101 0000 54151201 0 1.48514151202 0 1.4844151203 0 1.484'4151204 0 1.48414151205 0 1.484,4151206 0 1.484;4151300 0
pipe----1----
*LB1-1199*LBI-1200
-*LB1-1201
*LB1-1202*LBI-1203
LBI-1204LBI-1205LB1-1206
LB1-1207*LB1-1208*LBI-1209
LBI-1210LB1-1211
.LB1-1212LB1-1213
*LBI-1214*LBI-1215*LB1-1216
*LB1-1217*LB1-1218*LB1-1219
*LB1-1220
*LB1-1221
*LB1-1222
*LB1-1223
*LB1-1224
*LB1-1225*LB1-1226
*LB1-1227*LB1-1228*LB1-1229*LB1-1230
*LB1-1231*LB1-1232
*LB1-1233
*LB1-1234*LBI-1235
*LB1-1236*LB1-1237
*LBI-1238
*LB1-1239
*LB1-1240
*LBI-1241
6
01+7
91+774+7
52+740+7
37+7
1492807.
1527267.1554552.
1576769.
1580450.1580440.
2463160.
2463182.2463216.
2468302.
2463752.2463292.
0.
0.
0.
0.4131663
1.
0.9999995
0.
0.0.0.0.0.
12
3
4
5
6
139

4151301 0. 0. 0.4151302 0. 0.8630719 0.4151303 -0.667499 0. 0.
4151304 0. 0. 0.
2 ý-*:(M ='0.0130 kg/s)3 * (M =-0.0124 kg/s)4 * (M =-0.0014 kg/s)5 * (M =-4.440-4 kg/s)
* pressurizer vessel to top hat*------------1--------1--------1--------1 ... 1----------1---- ...
417000041701014170201
"vssl-tph" sngljun415010000 420000000 0.00 0. 0.
0.00.
0.0 0000* (M =-1.442-4 kg/s)
* ........- 1----- ---- 1 ---- ---- 1 ---------- ---- ---- 1 -------- 1----* pressurizer top hat and relief connection
4200000 "pzr toph" pipe4200001 24200101 0.0 24200201 0.0 14200301 0.1104915 24200401 0.0139870 24200601 90.0 2
4200801 4.e-5 0.346066 2
4201001 00 2
4201101 0000 1
4201201 0 1.48436+7 1580434. 2483610.
4201202 0 1.48434+7 1580431. 2483894.4201300 0
4201301 0. 0. 0. 1 * (]
-- ---- -----
LB1-1242LB1-1243LB1-1244LB1-1245
LB1-1246LB1-1247LB1-1248
LB1-1249*LBI-1250*LB1-1251
LB1-1252..LB1-1253LB1-1254LB1-1255
*LBI-1256*LB1-1257
*LB1-1258*LBI-1259
*LBI-1260*LBI-1261*LBI-1262*LBI-1263
*LB1-1264
*LB1-1265
*LB1-1266*LBI-1267*LB1-1268
LB1-1269
LBl-1270
LB1-1271
LB1-1272
LB1-1273
LB1-1274
LB1-1275
LB1-1276
LB1-1277LB1-1278LB1-1279
LB1-1280
LBl-1281*LBI-1282
*LBI-1283
*LBI-1284
1.
1.0.0.
1
2
M =-7.213-5 kz/s)*-------------1----------1----------1----------1----------1----------1----
*
*
* steam generator secondary side [ 500 ]
*------------1----------1----------1-- ---- 1------1--------1....
* primary separator*---- ---- .--1-- ----- 1 -. 1 ---------- -----1 1---- .---- 1-...
5000000 "separat" separatr5000001 3 05000101 0.0 0.4445 0.2425 0.0 90. 0.4445
1,10

50001025000200
5001101
50021015003101500120150022015003201
4.e-50
500010000
5000000005150100001.61831670.38818912.8275032
0.28405283040.
520000000
5050000005000000001.59610650.35949133.6115189
00
1165084.
0.087745
0.0877450.291870. *
0.0.
2595300. 0.9202552
0.0 0.0
0.0 0.00.4 0.4(M = 23.413 kg/s)(M = 89.399 kg/s)
(M = 112.81 kg/s)
0100
01000100
* .1----.---- 1 - .-- I ----. ---- I ---- 1 --- I ---- ---- 1---- ---- 1 ----* separator bypass*--------1--------1----------1----------1---- ---- 1-------1 .-
5030000 "sepbypas" branch5030001 2 0
5030101 0.0 0.4445 0.4384 0.0 90. 0.44455030102 4.e-5 0.3678 00
5030200 0 5280204. 1161810. 2595276. 0.72499425031101 505000000 503000000 0.98627 0.0 0.0 01005032101 503010000 520000000 0.98627 0.8 0.0 0100
5031201 0. 0.4406047 0. * (M = 2.4847 kg/s)5032201 -2.538778 0.1243373 0. * (M = 2.3887 kg/s)* ....... 1---- -- ---- 1 ----- ------ --- ---- ------------- 1 ----* separator outlet region
5050000 "lwr sepa" branch
5050001 1 05050101 0.0 1.2131 1.4850 0.0 -90. -1.2131
5050102 4.e-5 1.9048 00
5050200 0 5284396. 1165162. 2595304. 0.2041452
5051101 505010000 508000000 0.0 0.0 0.0 01005051201 0.3895128 0.0426888 0. * (M = 86.880 kg/s)* --------- 1 --..----.-----1------ 1 ...1 ..---- 1-- -------- --------1----
* feed inlet volume
5080000 "upr dwnc" branch
5080001 1 05080101 0.0 0.6096 0.22107 0.0 -90. -0.6096
5080102 4.e-5 0.163697 00
5080200 0 5290364. 1098976. 2595264. 0.
5081101 508010000 510000000 0.0 0.0 0.0 0100
5081201 0.611732 0.4626126 0. * (M = 112.65 kg/s)*---- --------- 1--------1--- ---- 1---- -1--1--1-* steam generator downcomer
*------------1----------1----------1---------... ------ 1 ....... 1....
*LBI-1285*LB1-1286
*LBI-1287*LBI-1288
*LBI-1289
LBi-1290LB1-1291LBI-1292LBI-1293
LBl-1294LB1-1295
,*LBI-1296*LB1-1297
*LB1-1298*LB1-1299*LBI-1300
*LBI-1301*LBI-1302
LBl-1303LBI-1304LBI-1305LBI-1306
LBI-1307*LBI-1308*LBI-1309*LB1-1310
*LBI-1311*LBI-1312
*LBI-1313
LBI-1314LBI-1315
LBI-1316
LBl-1317*LB1-1318
*LB1-1319
*LBI-1320
*LBI-1321*LBI-1322
*LBI-1323
LBI-1324
LBI-1325
LB1-1326
LBI-1327
141

51000005100001
51001015100201510030151004015100601
51007015100801
51009015101001
51011015101201
51012025101203510130051013015101302
"dwncmr"
3
0.2320.0
0.60960.0-90.0
-0.60964.e-5
0.000
00000
00
0
annulus
3233330.107930.0
325295012.
5299744.5304476.
32
1099055.
1099085.1099094.
2595228.
2595192.2595158.
0.
0.
0.
0.
0.
0.
123
0.6112771 0.5503535 0.0.6112561 0.5977697 0.
12
* (M• (M
= 112.65 kg/s)= 112.65 kg/s)
----1---- ----1----
*junction - downcomer to boiler
5130000 "dncmr-bl" sngljun5130101 510010000 515000000 0.0 17.5
5130201 0 0.6112523 1.1637983 0.* --------- 1 ----.---- 1 -------- I. ---- ---- ----* steam generator boiler*--------------.-.-------I---------1-----1--
5150000 "boiler" pipe5150001 55150101 0.2776 45150102 0.306294 5
5150201 0.0 4
5150301 1.8288 45150302 1.2131 5
5150401 0.0 5
5150601 60.0 4
5150602 90.0 5
5150701 0.6096 4
5150702 1.2131 5
5150801 4.e-5 0.0234 4
5150802 4.e-5 0.5962 5
5150901 4.05 4.05 4
5151001 100 5
17.5 0100* (M = 112.64 kg/s)
---- 1---- ------
*LB1-1328
*LBI-1329
*LB1-1330
*LBI-1331*LBI-1332*LBI-1333*LBI-1334
*LB1-1335*LBI-1336
*LBI-1337*LB1-1338*LBI-1339
!LB1-1340*LB1-1341*LBI-1342*LBI-1343
LB1-1344LB1-1345LB1-1346LB1-1347
LB1-1348*LB1-1349
*LB1-1350
LB1-1351
LBI-1352
LBI-1353LB1-1354
*LB1-1355
*LB1-1356
*LBI-1357
*LB1-1358*LBI-1359
*LB1-1360
*LBI-1361
*LBI-1362
*LBI-1363*LBI-1364
*LBI-1365
*LB1-1366
*LBI-1367
*LB1-1368*LB1-1369
*LBI-1370
142

515110151512015151202515120351512045151205
01000
0000
45302500.5298308.5294204.5288872.5283872.
1158141.
1165292.1165726.1165431.1165135.
2595172.
2595200.2595232.2595270.2595284.
0.3849933
0.58503150.800272'0.84878060.8699965
0.
0.
0.
0.
0.
1
3.45
*LBI-1371*LBI-1372*LB1-1373*LBi-1374*LB1-1375*LBI-1376
5151300 0
5151301 0.8139486 1.7552299 0. 1 * (M = 112.69 kg/s)
5151302 1.1226511 2.9489403 0. 2 * (M = 112.76 kg/s)
5151303 2.1623707 3.382637 0. 3 * (M = 112.79 kg/s)-
5151304 2.6827507 4.0784149 0. 4 * (M= 112.81 kg/s)* --------- 1 ....1.---- 1-- -------1---- ----1--------1---------1 ----* lower portion of steam dome
5200000 "lwr stm" branch5200001 1 05200101 0.0 0.46956 0.705312 0.0 90." 0.46956
5200102 4.e-5 1.383 00
5200200 0 5279680. 1164883. 2595244. 0.9999995
5201101 520010000 525000000 0.0 0.0 0.0 0000'
5201201 0.4930089 0.6392183 0. * (M = 25.802 kg/s)*-------------- ....----...... 1----- ---- 1--------1------L1--
* upper portion of steam dome•--------------.--.-----1-........-1-----1-------- . - -
5250000 "upr stm" branch5250001 1 05250101 0.0 0.46956 0.705312 0.0 90. 0.469565250102 4.e-5 1.383 00
5250200 0 5279556. 1164876. 2595272. 0.9999976
5251101 525010000 530000000 0.0 0.8 0.8 01005251201 12.456696 20.716293 0. * (M = 25.802-kg/s)''
* steam pipe from generator to control valve----------.------ 1---------.-----.---I-.......-1-....-----1-...-
5300000 "steam pi" snglvol5300101 0.04635 25.074 0.0 0.0 0.0 0.0
5300102 4.e-5 0.0 00
5300200 0 5263152. 1163897. 2595360. 0.9999852•---------1------...-1-........-1-........-1-........-1-----
* steam flow control valve------------ 1----.....-I--.......-I-........1-.....----1--'--'----....
5400000 "cv-p4-10" valve5400101 530010000 541000000 0.0047772 0.0 0.0 1100
*LB1"1377
LB1-1378
LB1-1379LB 1-1380LB1-1381LB1-1382
* LBI-1383LBI-1384
*LB1-1385'*LBi-1386
*LB1-1387*LBI-1388
*LB1-1389
*LB1-1390LB1-1391
LB1-1392LBi-1393
* LBI-1394*LBi-1395*LB1-1396*LB1-1397
*LB1-1398
*LB1-1399*:tLBI-1400"
LB1-1401ý
LB1-1402'
LB1-1403LB1-1404
*LB1-1405*LB1-1406*LBI-1407"*LB1-1408
LBI-1409
LBl-1410
LBI-141I*LBI-14i2*LBI-1413
143

5400201 05400300 mtri
5400301 68720254000 non20254001 0.020254002 9.21
20254003 1.0
rlv
narea
16.441193 20.7786710.: 'l.. * (HM 25.803 kE
688- ." 0.20 0.64829 540
/
0.0 - :,
5-4 9.25-41.0-
*-------------1---------... -- .--....---... ....---... ..-- 1 .. -.. "f-
* pipe downstream of steam control valve*----- 1 ----- ----- 1--- ------ •----- ---- 1 ----- ---- 1-7----
5410000 "cond. inl" branch . . . -
5410001 1 0
5410101 0.06557 54.44 - 0.0 -0.0 0.0 0.0
5410102 4.e-5 0.0 005410200 0 2078494. 915144.5 2598364. 0.99815655411101 541010000.542000000 0.0 0.0 "- 0.0 ' 0100
5411201 16.681183 35.27243 0. * M= 25.803 kg/s)* --------- 1 --1-- ---- ----- ----- I---------- i-------------- ---- 1----
* air cooled condenser*------- ----- 1--- ---- . -- -----..--- -1--- ---- 1 ----- -- 15420000 "condens." tmdpvol5420101 0.21677 17.67 0.0 0.0 0.05420102 4.e-5 0.02 00 .. ..
---- I---
0.0
54202005420207
20.0
it. -• • .o.
2.069e6 1.0*-------------1----------1-----1--------1-........--1-.-.
* simplified feed system
*feed ...... 1--------1- tank----1----------1-.--...-.-1* feed storage tank
-..- 1_--
s) LBI-1414*LB1-1415
*LBI-1416*L81-1417*LB1-1418*LB1-1419
LB1-1421LBI-1422LB1-1423
*LBI-1424*LB1-1425*LBI-1426*LBI-1427*LB1-1428*LB1-1429
LB1-1430LBI-1431LB1-1432
LB1-1433*LBi-1434*LB1-1435*LBI-1436*LB1-1437*LBI-1438
LB1-1439LBI-1440LBI-1441LBI-1442
LBl-1443*LBI-1444*LBI-1445*LBI-1446*LBI-1447*LBI-1448LBl-1449LBI-1450LB1-1451
*LBI-1452*LB1-1453*LBI-1454
LBI-1455
LB1-1456
-1--- ---- 1 ------ I 15650000 "feedtank" tmdpvol
5650101 29.81 3.048 0.0 0.*05650102 4.e-5 0.0 . - 00-5650200 3 0
5650201 0.0 2.15323e6 477.6
----. .- ----
0.0 0.0
*.feed water
*---------------1-------1- - ---- -----1----5660000 "feed" tmdpjun
5660101 565000000 508000000 0.05 .....
---- 1---- ---- 1----
5660200
5660201
5660202
1 511-100.0 25.7700.0 25.770
0.00.0
0.0
0.0
*lp-lb-1*lp-lb-1
144
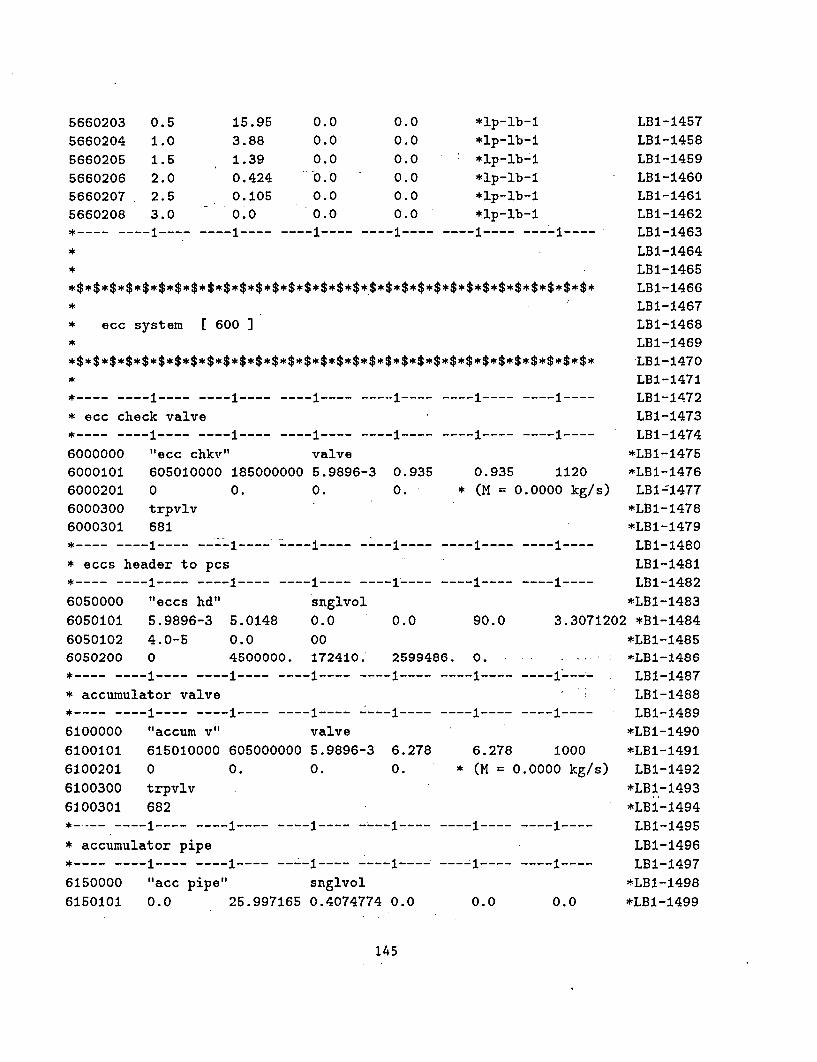
5660203 0.5 15.95 0.0 0.0 *lp-lb-1
5660204 1.0 3.88 0.0 0.0 *lp-lb-1
5660205 1.5 1.39 0.0 0.0 *lp-lb-1
5660206 2.0 0.424 0.0 0.0 *lp-lb-15660207 2.5 0.105 0.0 0.0 *lp-lb-15660208 3.0 0.0 0.0 0.0 *lp-lb-1*------------1----------1----------1---------1----------1------1--
*
* ecc system [ 600 ]
*------------1--------1 ---1------- ....--...1------1--------1----.
* ecc check valve
6000000 "ecc chkv" valve6000101 605010000 185000000 5.9896-3 0.935 0.935 1120
LB1-1457LB1-1458
LB1-1459LB1-1460LBi-1461LBi-1462LB1-1463
LB1-1464LB1-1465LB1-1466LB1-1467LB1-1468LB1-1469LB1-1470LB1-1471LB1-1472LB1-1473
LB1-1474*LB1-1475*LB1-1476
6000201 0 0. 0. 0. * (M = 0.0000 kg/6000300 trpvlv6000301 681*------------1----------1----------1------1--------1----------1....
* eccs header to pcs•---------1----------1----------1----------1--.......-1----------1-....
6050000 "eccs hd" snglvol
6050101 5.9896-3 5.0148 0.0 0.0 90.0 3.3076050102 4.0-5 0.0 00
6050200 0 4500000. 172410.ý 2599486. 0.
* accumulator valve•------------1----------1------1------1----------1 ....... 1-....
s) LBI-1477*LB1-1478*LB1-1479
LB1-1480
LBl-1481LBI-1482
*LBI-1483
1202 *B1-1484*LB1-1485*LB1-1486
LBM-1487LB1-1488LB1-1489
6100000 "accum v" valve
6100101 615010000 605000000 5.9896-3 6.2786100201 0 0. 0. 0.
6100300 trpvlv
6100301 682*-.....1----------1----------1----------1-....
* accumulator pipe* 1------1------- .- 1 . -------- I.--
6150000 "acc pipe" snglvol
6150101 0.0 25.997165 0.4074774 0.0
6.278 1000* (M = 0.0000 kg/s)
-1---.. .. . -
*LB1-1490*LB1-1491
LB1-1492*LB1-1493
*LBi-1494
LB1-1495
LB1-1496
LB1-1497*LB1-1498
*LB1-14990.0 0.0
145

6150102 4.0-56150200 0
0.0 00
4236740. 112409.12 2600476. 0.
* accumulator vessel
6200000 "accumul." accum6200101 1.2938 1.136 0.0 0.06200102 4.0-5 0.0 006200200 4.223+6 305.00 0.06201101 615000000 8.2132-3 125. 125.6202200 0.0 0.588 3.3266 0.8+ 0.0 0.0
90.0
000000.0444
* bwst ipis
62500006250101625010262502006250201
"bwst lps"
20.44 5.04.0e-5 0.0
tmdpvol0.000
300.0
0.0 90.0
0.0 1.0+5
* low pressure injection system*------------1-------1------1 ---------... 1-...-
*LBI-1500*LB1-1501
----1---- LB1-1502LBI-1503
--- 1---- LBI-1504
*,LBI-15051.136 *LBI-1506
*LBI-1507*LBI-1508*LB1-1509
5 1 *LB1-1510*LB1-1511
.... 1 •LBl-1512
LBI-1513--- 1---- LB1-1514
*LB1-1515
5.0 *LBI-1516*LBI-1517
*LBI-1518*LBI-1519
-.- I----- LBI-1520
LBl-1521----1---- .LBl-1522
*LB1-1523
*LBI-1524
*LB1-1525*LB1-1526*LB1-1527
*LB1-1528*LBI-1529
*LB1-1530
*LB1-1531*LBI-1532
*LBI-1533
*LBI-1534
*LB1-1535*LB1-1536
*LB1-1537
*LB1-1538
-1---- LB1-1539
LBI-1540LB1-1541
LB1-1542
---- 1-..--
63000006300101
6300200
6300201
6300202
6300203
6300204
63002056300206
6300207
6300208
6300209
6300210
6300211
63002126300213
"lpis"625000000
1
-1.00.0
8.483+4
4. 297+5
7.745+59.448+5
1.119+6
1.186+6
1. 257+6
1.326+6
1.395+6
1.464+61.517+6
tmdpjun605000000 5.9896-3513 p0.0 0.00.0 0.07.045 0.06.091 0.05.045 0.04.313 0.03.454 0.03.173 0.02.673 .0.02.159 0.01.536 0.00.7182 0.00.0 0.0
605010000
0.0
0.0
0.0
0.00.0
0.0
0.0
0.0.
0.0
0.0
0.0
0.0
0.0
*------------1---------1------1------...1----------1--
*k
**************************** *
146

* containment [ 700 ]
* containment broken loop hot leg
*7000000 ... .-1---- ----- 1-------1- ..... 1----------1-1--7000000 "cont tkh" tmdpvol
700010170001027000200
7000201
700020270002037000204700020570002067000207700020870002097000210
5.1956-20.02-1.0
0.00.250.51.02.0
10.20.40.70.
0.00.0511115210.
115210.115555.173056.239590.207806.
270203.330945.282682.335496.
104.6800
1.0
1.01.01.01.01.0
1.01.01.01.0
0.0 0.0 0.
* containment-pressure 11
LB1-1543
LB1-1544LB1-1545LB1-1546
LB1-1547"--- LB1-1548
LB1-1549--- LBI-1550'
*LB1-15510 *LBI-1552
*LBI-1553t,*LB1-1554"
bl "LB1-1555*LB1-1556*LBI-1557
*LB1-1558*LB1-1559*LB1-1560
*LB1-1561*LB1-1562
*LB1-1563*LB1-1564
*LB1-1565
LB1-1566
LB1-1567LB1-1568
*LB1-1569
0 *LB1-1570
*LB1-1571*LBI-1572
Al LBI-i573*LB1-1574
*LB1-1575*.LBI-1576*LB1-1577
*LB1-1578
*LB1-1579
*LBI-1580
*LB1-1581
.LBI-1582
*LBI-1583
LB1-1584
LB1-1585
7000211 1.+5 100000. 1.0
* containment broken loop cold leg
7050000 "cont tkc" tmdpvol
---- 1-...--- -"
------------ 1-
7050101
705010270502007050201
7050202
70502037050204
7050205
7050206
705020770502087050209
7050210
7050211
2.35203-2
0.02
-1.0
0.0
0.250.5
1.0
2.0
10.20.40.
70.1.+5
0.0
0.0511115210.115210.
115555.
173056.
239590.
207806.270203.330945.
282682.
335496.100000.
104.703
00
0.0 0.0 . .0.¢
1.01.0
1.0
1.0
1.0
1.0
1.01.01.0
1.0
1.0
* containment-pressure i- . f
*-------------1 --------- 1---------1----------1----------1--
147

* heat structures
* steam generator heat structures
111500001115010011150101
11150201111503011115040011150401111504021115040311150404
11150405
1115040611150407
1115040811150501
1115050211150503
11150601
1115060211150603
8
07
60.0-1565.91562.78560.84558.74556.93
554.98
552.60
550.79
8 2 0 0.0051054
0.006348984
77
563.13560.50
559.04557.14
555.50
553.76
551.47
549.80
560.36558.22
557.25555.53554.07
552.54550.35
548.81
557.59555.94555.46553.92
552.64
551.32
549.22
547.83
115010000115040000
115060000
515010000
515040000515040000
10000
10000
10000,1000000
~1
11
I
1
100
0
554.82553.66
553.67552.32
551.21550.10
548.09
546.84
1
0
I
1111
000
552.04551.38
551.88550.71549.78
548.89
546.96
545.85
549.27549.10550.09549.11
548.35547.67
545.83
544.86
546.50546.82548.29547.50
546.92546.45544.70
543.87
35
83
45
8
LBI-1586LBI-1587
LB1-1588LB1-1589
LBI-1590LB1-1591LBI-1592LBI-1593LB1-1594
LBI-1595*LB1-1596
*LB1-1597*LB1-1598*LBI-1599*LBI-1600*LBI-1601
*LBI-1602*LB1-1603*LBI-1604*LB1-1605*LB1-1606
*LBI-1607*LBI-1608
*LBI-1609*LB1-1610
*LB1-1611*LB1-1612
*LB1-1613
*LBI-1614*LB1-1615*LB1-1616
*LB1-1617
*LB1-1618*LBI-1619
LBI-1620
LBI-1621
LBI-1622
LBI-1623LBI-1624
LBI-1625*LB1-1626
*LB1-1627
*LB1-1628
1124.71849.063
1124.71
1124.71849.063849.063
1124.71
8
8
8
11150604 515030000 -1000011150701 0 0
11150801 0 0
11150901 0 0
* active core
* peripheral fuel modules
12300000 5 10 2 0 0.0 2 1 32
1230000112300011
7.869e+6
1.-6
230050000
2.-6 0.0 0.0 5
148

12300100
12300101123001021230010312300201123002021230020312300301123003021230040012300401+
12300402+12300403+
12300404+
05
131
-2-31.00.0
14.647-4.742-5.359-56959
*LB1-1629-3 *LB1-1630
-3 *LB1-1631-3 *LB1-1632
*LB1-1633*LBI-1634
*LBI-1635*LB1-1636
*LBI-1637
*LB1-16381089.99 979.13 840.18 692.43 623.21 615.06 *LBI-1639
*LB1-1640
1236.16 1094.56 917.07 728.34 639.93 629.51 *B1-1641*LBI-1642
1325.44 1165.17 964.28 750.67 650.61 638.82 *BI-1643*LBI-1644
1126.05 1010.07 864.68 710.09 637.68 629.15 *B1-1645
-11186.01 1161.45607.14 599.461358.81 1327.45619.40 609.581464.25 1428.75627.38 616.271226.51 1200.83620.86 612.82
12300405 789.09 781.04 757.62 721.30+ 599.39 596.87
12300501 0 0 012300502 0 0 0
12300503 0 0 0
12300504 0 0 0
12300601 230010000 0 1
12300602 230020000 10000 1
12300603 230040000 0 112300604 230050000 0 112300701 900 .20308197 0.012300702 900 .11333616 0.012300703 900 .12500311 0.0
12300704 900 .16034587 0.0
12300705 900 .17183945 0.012300901 0 0.013633 0.0*------------I--------.--------I-----
* center fuel module*------------1------1------1-----
12310000 13 i0 212310001 7.869e+6 231130000
12310011 1.0-6 2.0-6 0.0
12310100 0 1
12310101 5 4.647-3
12310102 1 4.742-3
675.76 627.34 604.66 601.99
1
1.1
1
1
11
1.
0.00.00.00.00.0
0.0
466.992
210.795
356.730
1064.091
466.991
210.795356.7301064.091
123
455
13
45
1
345
*LB1-1646*LBI-1647*LB1-1648*LB1-1649
*LB1-1650
*LB1-1651*LBI-1652
*LB1-1653
*LB1-1654*LB1-1655*LB1-1656
*LB1-1657*LBI-1658*LB1-1659
*LB1-1660*LB1-1661
*LB1-1662
LB1-1663LB1-1664LB1-1665
*LB1-1666
*LB1-1667
*LBI-1668*LBI-1669
*LBI-1670
*LB1-1671
S1-- ---- --1 I ----
-- I----1. .
0
0.0
0.0 2 1 32
13
149

12310103123102011231020212310203123103011231030212310400
12310401+
123104021
12310403+
12310404+
12310405+
12310406+
12310407+
12310408+
12310409+
12310410+
12310411+
12310412+
123104131
12310501
1231050212310503
12310504
1231050512310601
12310602
12310603
12310604
12310605
31-2-31.000.0
5.359-356959
*LB1-1672*LB1-1673*LB1-1674
*LB1-1675
*LB1-1676*LBI-1677*LB1-1678
638.30 628.13 *B1-1679*LBI-1680
651.52 639.56 *B1-1681
-1
1409.55 1374.54618.28 608.671558.69 1517.50
627.97 616.67
1712.45 1664.60631.03 617.901795.32 1743.88632.73 618.611858.01 1803.85634.00 619.131919.17 1862.36635.21 619.621939.65 1881.95
635.75 619.92
1909.71 1853.32635.48 620.00
1772.23 1721.85633.61 619.781562.27 1521.04630.54 619.22
1317.46 1286.89
626.68 618.29
1133.17 1110.62
623.49 617.30
1271.40 1108.34 908.92 707.74
1396.19 1204.39 969.83 733.20
1523.64 1300.79 1028.24 753.29 658.39
1592.34 1352.76 1059.76 764.17 662.15
1644.31 1392.07 1083.59 772.38 664.97
1695.00 1430.41 1106.82 780.37 667.70
1712.00 1443.30 1114.68 783.17 668.75
1687.23 1424.65 1103.51 779.54 667.72
1573.43 1338.79 1051.83 762.34 662.42
*LBI-1682
644.4 *BI-1683*LBI-1684
647.2ý *B1-1685*LBI-1686
649.2 *51-1687*LBI-1688
651.2 *B1-1689*LB1-1690
651.9 *B1-1691*LB1-1692
651.3 *BI-1693*LBI-1694
647".7 *BI-1695*LBI-1696
1399.60 1207.59
1196.85 1054.50
972.77 735.88 654.12 642.14 *B1-1697*LBI-1698
880.41 704.78 644.16 635.28 *B1-1699*LBI-1700
1044.18 939.15 810.70 681.11 636.38 629.83 *LB1-1701
931.94619.31
0
0
00
0
918.10 877.35 812.93615.51
0 0
0 00 0
0 00 0
734.14 654.65 627.22 623.20
1
1
1
1
1
I
1
I
1
I
30.5947• 1
58.035052 219.344287 829.017526 12
46.370817 13
30.5947 1
58.035052 2
19.344287 8
29.017526 12
46.370817 13
*LBI-1702*LBI-1703
*LBI-1704*LBI-1705
*LB1-1706*LB1-1707*LBI-1708
*LBI-1709
*LB1-1710
*LB1-1711
*LB1-1712
*LB1-1713*LBI-1714
231010000 0
231020000 0
231030000 10000
231090000 10000
231130000 0
11
I
1
1
150

12310701 900 1.74501-2 0.0
123107021231070312310704123107051231070612310707
1231070812310709
1231071012310711123107121231071312310901
900900900900900900
900900
9009009009000
3.7340-21.4071-2
1.4937-21.5587-21.6235-21.6452-2
1.6127-22.2017-21.8672-21.4612-21.1203-21.1675-20.013633
0.00.00.00.00.00.0
0.00.0
0.00.0
0.00.00.0
0.0
0.00.00.00.00.00.0
0.00.0
0.00.00.00.00.0
1
2345
67
89
1011121313
.... 1----------1....
* wall heat structures (core)
volume 200
12000000 1 5 2 0 0.508
12000100 0 112000101 4 0.7264
12000201 4 412000301 0.0 4
12000400 -1
12000401 555.79 555.82 555.86 555.89 555.92
12000501 200010000 0 1 1 .093810 112000601 0 0 0 1 .09381 112000701 0 0.0 0.0 0.0 1
12000801 0 0.1524 0.0 0.0 1
*LBI-1715*LB1-1716
*LB1-1717'*LBI-1718
*LB1-1719*LBI-1720*LB1-1721
*LB1-1722*LB1-1723
*LB1-1724*.LBI-1725*LBI-1726*LBI-1727*LBI-1728"
LB1-1729LBI-1730LBI-1731LBI-1732
LBI-1733.
LBI-1734*LB1-1735*LB1-1736
*LB1-1737
*LBI-1738*LBI-1739*LB1-1740
*LB1-1741*LB1-1742
.*LB1-1743
*LB1-1744.*LB1-1745
LB1-1746
LBI-1747LB1-1748
*LBI-1749•
*LB1-1750
*LBI-1751*LB1-1752*LB1-1753
*LB1-1754
*LB1-1755*LB1-1756
*LB1-1757
* ------- ---- -..--- 1- ----.----.-1--- ----- 1----* volume 202
12020000 1 5 2 0
12020100 0 1
12020101 4 0.7264
12020201 4 4
12020301 0.0 4
12020400 -1
12020401 555.86 555.88 555.89 555.91 555.92
12020501 202010000 0 1 1
12020601 0 0 0 1
0.508
.1426
.1426
11
151

12020701 0 0.0 0.0 0.0
12020801 0 0.1524 0.0 0.0* -...-. 1-.....1 -1 --- -..
* volume 210*------------1-.....1 ....- 1----------1----.
12100000 4 5 2 0
12100100 0 1
12100101 4 0.7264
12100201 1 4
12100301 0.0 4
12100400 -112100401 555.75 555.79 555.83 555.87 555.9212100402 555.74 555.79 555.83 555.88 555.9212100403 555.75 555.79 555.83 555.88 555.9212100404 555.75 555.79 555.84 555.88 555.9312100501 210010000 0 1 1
12100502 210020000 0 1 112100503 210030000 0 1 1
12100504 210040000 0 1 1
12i00601 0 0 0 1
12100602 0 0 0 1
12100603 0 0 0 1
12100604 0 0 0 1
12100701 0 0.0 0.0 0.0
12100801 0 0.1016 0.0 0.0
1
---- N1--------
0.47
0.1267
0.76030.63080.53960.1267
0.76030.6308
0.5396
44
1
3412
3
4
*LB1-1758*LBI-1759
LBI-1760LBI-1761LBI-1762
*LB1-1763*LB1-1764
*LBI-1765
*LB1-1766*LB1-1767*LBI-1768*LB1-1769*LB1-1770*LB1-1771*LB1-1772
*LB1-1773
*LB1-1774*LB1-1775*LB1-1776
*LB1-1777*LBI-1778
*LBI-1779
*LBI-1780*LB1-1781*LBI-1782
LBI-1783LB1-1784
LBI-1785*LB1-1786*LBI-1787*LBI-1788
*LBI-1789
*LB1-1790*LBI-1791
*LB1-1792
*LBI-1793*LBI-1794*LBI-1795
*LB1-1796
LB1-1797
LB1-1798
LB1-1799*LB1-1800
* -1---* volume 220
---- 1----------1----------1----------1----------1----
12200000 1 5 2 0 0.47
12200100 0 1
12200101 4 0.7264
12200201 4 4
12200301 0.0 4
12200400 -1
12200401 555.98 555.98 555.98 555.98 565.98
12200501 220010000 0 1 1 0.479
12200601 0 0 0 1 0.479
12200701 0 0.0 0.0 0.0 1
12200801 0 0.1016 0.0 0.0 1
---- 1----
11
* ----.---- 1 .---- 1--- I ---- ---- 1---- ----- 1----* volume 222
*12220000---1 -- - 2 0--1-......---1-...12220000 1 5 2 0
----. ---- ---- .----
0.47
152

12220100 0 1
12220101 4 0.7264
12220201 4 412220301 0.0 412220400 -1
12220401 555.96 555.96 555.97 555.97 555.98
12220501 222010000 0 1 1
12220601 0 0 0 1
12220701 0 0.0 0.0 0.012220801 0 0.1016 0.0 0.0* ----... . 1---- - --- 1- ---- ---- ------- ----* core support structure (v225)
12250000 1 5 2 0
12250100 0 112250101 4 0.3
12250201 4 4
12250301 0.0 4
12250400 -1
12250401 555.76 555.79 555.81 555.84 555.86
12250501 225010000 0 1 1
12250601 0 0 0 112250701 0 0.0 0.0 0.0
12250801 0 0.095 0.0 0.0* ------- ---- ------ ---- ------------ 1 ----* volume 270
12700000 1 5 2 0
12700100 0 1
12700101 4 0.7264
12700201 4 412700301 0.0 412700400 -1
12700401 555.79 555.82 555.85 555.88 555.92
12700501 270010000 0 1 1
12700601 0 0 0 1
12700701 0 0.0 0.0 0.0
12700801 0 0.1524 0.0 0.0* ------- ---- .---- 1-- ---- ---- 1 ----- ---- 1 ----
0.36
0.3611
0.282
11
-- 1--
---- 1--
0.4269792 10.4269792 11
1
0.508
0.09381 1
0.09381 1
11
S----1----------1-....
*LBI-1801*LBI-1802
*LBI-1803*LB1-1804*LB1-1805*LB1-1806*LBI-1807
*LBI-1808*LBI-1809*LBI-1810
LB1-1811LBI-1812LBI-1813
*LBI-1814*LBI-1815
*LB1-1816*LBI-1817*LB1-1818
*LBI-1819*LB1-1820*LBI-1821
*LB1-1822*LB1-1823*LB1-1824
LBl-1825LBI-1826
LB1-1827*LBi-1828
*LB1-1829
*LBI-1830*LB1-1831*LBI-1832*LBI-1833
*LBI-1834*LBI-1835
*LBI-1836
*LB1-1837*LBI-1838
LB1-1839
LB1-1840
LB1-1841*LB1-1842
*LBI-1843
* volume 272*-- ----------- 1 5 2---- -1 .- 1- --.. 1 -- 1-...12720000 1 5 2 0 0.508
12720100 0 1
153


* 900* -1-- .---- I ---
20290000 power20290001 -1.020290002 0.020290003 0.1
20290004 0.2
20290005 0.320290006 0.420290007 0.520290008 0.6
20290009 0.8
20290010 1.020290011 1.520290012 2.0
20290013 3.020290014 4.0
20290015 6.0
20290016 8.020290017 10.0
20290018 60.0
20290019 200.
reactor power vs time after scram
511 1.0 49.3+61.0 * lp-lb-1 (trac post-test)
1.00.9134890. 2781950. 1553470.1123960.0929270.084394
0. 0746000.066306
0.0645940.0613120.0586980.0565960.0534340.0510910. 0492370. 0326210. 024929
LB1-1887LB1-1888
LB1-1889*LB1-1890
LB1-1891*LB1-1892*LB1-1893*LB1-1894*LB1-1895*LB1-1896
*LB1-1897*LB1-1898
.*LB1-1899
*LB1-1900*LBI-1901
*LB1-1902
*LB1-1903*LB1-1904*LBI-1905*LB1-1906*.LB1-1907
*LB1-1908
*LB1-1909
LB1-1910
LB1-1911
LB1-1912LB1-1913
LB1-1914LB1-1915
LB1-1916LB1-1917
LB1-1918*LB1-1919
LB1-1920
LB1-1921LB1-1922LB1-1923
*LBI-1924
*LBI-1925
*LB1-1926*LB1-1927
*LB1-1928
*LB1-1929
* heat structure thermal property data* ------------ ------- 1 ---- ---- 1 ---- ---- I--1------ - 1---- ---- 1 ----
20100100 tbl/fctn 120100200 tbl/fctn 320100300 tbl/fctn 1
20100400 tbl/fctn 1
20100500 c-steel
20100600 tbl/fctn 1
111
1
1
* uo2* gap* zr
* s-steel
* inconel 600
* ..---- ---- I.---- 1---- ---.--- 1 ----.---- 1 ----.---- 1 ----.---- 1 ----* uo2 - thermal conductivity
20100101 2.7315e2 8.44
20100102 4.1667e2 6.46
20100103 5.3315e2 5.782385
20100104 6.99817e2 4.633177
20100105 8.66483e2 3.880307
20100106 1.03315e3 3.357625
155


2010030220100303
2010030420100305201003062010030720100308
20100309201003102010031120100312
2010031320100314
201003152010031620100317
469.3
577.6
685.9774.8872.0973.21073.2
1123.21152.31232.21331.2
1404.21576.21625.21755.22273.2
14.6
15.8
17.3
18.419.821.823.225.424.225.526.628.233.036.741.255.0
* -------------- ---- ---- 1 -------- 1----* zircaloy-4 - volumetric heat capac
20100351 300.0 1.841e620100352 400.0 1.978e620100353 640.0 2.168e6
20100354 1090.0 2.456e620100355 1093.0 3.288e620100356 1113.0 3.865e620100357 1133.0 4.028e620100358 1153.0 4.709e620100359 1173.0 5.345e6
20100360 1193.0 5.044e620100361 1213.0 4.054e620100362 1233.0 3.072e620100363 1243.0 2.332e6
20100364 1477.0 2.332e6* ------------- 1 -- ---- ----------------* s-steel - thermal conductivity
20100401 273.15 12.9820100402 1199.82 25.1* ----.----- 1 ----.---- 1 ----.---- 1 ----* s-steel - volumetric heat capacity
---- 1 ----.-----1--- ---- 1 ----ity from matpro---- 1----------1----------1----.
---- 1----------1------1--
*LB1-1973*LB1-1974
*LB1-1975*LB1-1976
ALB1-1977*LBI-1978*LB1-1979
*LB1-1980*LBI-1981*LBI-1982*LB1-1983*LBI-1984*LBI-1985*LBI-1986*LBI-1987*LBI-1988
LBI-1989LBI-1990
LB1-1991*LB1-1992
*LB1-1993
*LB1-1994*LB1-1995
*LB1-1996*LB1-1997
*LB1-1998*LB1-1999*LB1-2000
*LB1-2001*LB1-2002*LB1-2003
*LB1-2004*LB1-2005
LB1-2006
LB1-2007LB1-2008
*LB1-2009
*LB1-2010
LB1-2011
LBI-2012
LB1-2013*LB1-2014
*LB1-2015
---- 1--
--- 1------1 ..-.
20100451 273.15 3.83e6
20100452 366.5 3.83e6
157

20100453201004542010045520100456201004572010045820100459
20100460
477.59588.59
699.82810.93
922.041144.261366.5
1477.59
4.190e64.336e64.504e64.639e64.773e65.076e65.376e65.546e6
* --------- 1-- ----- 1 ----.---- 1 ----.---- 1 - ---- -- 1-- I----.----1----
* inconel-600 - thermal conductivity*---------------------1----------1----------1----------1------1--
20100601 366.5 13.8520100602 477.6 15.92
20100603 588.7 18.1720100604 700.0 20.4220100605 810.9 22.5020100606 922.0 24.9220100607 1033.2 26.8320100608 1144.3 29.4220100609 1477.6 36.06* ---------- 1-- -------I.------ ---- .------- ----.---- 1---- ---- ----* inconel-600 - volumetric heat capacity*------------1------1--------1----------1----------1.-----1--
20100651 366.5 3.908+620100652 477.6 4.084+6
20100653 588.7 4.260+620100654 700.0 4.436+6
20100656 810.9 4.665+6
20100657 922.0 4.929+620100658 1033.2 5.105+6
20100659 1477.6 5.727+6*------------1----------1----------1----------1----------1------1--
*LB1-2016*LBI-2017
*LB1-2018*LB1-2019
*LBI-2020
*LB1-2021
*LB1-2022
*LB1-2023
LB1-2024
LB1-2025
LB1-2026*LB1-2027
"*LB1-2028
*LB1-2029
*LB1-2030
*LB1-2031
*LB1-2032
*LBI-2033
*LBI-2034
*LBI-2035
LBI-2036
LBI-2037
LB1-2038
*LB1-2039
*LB1-2040
*LBI-2041
*LBI-2042
*LBi-2043
*LBI-2044
*LBi-2045
.*LB1-2046
LBI-2047
LBI-2048
LBI-2049
LB1-2050
LB1-2051
LBI-2052
LB1-2053
LB1-2054
LB1-2055
LBI-2056
LBI-2057
LB1-2058
*k
*# control variables
* 001-008 and 230-235 level calculators
158

* ----. -. --I -- --. . ... I ---- . .-- - I . .. .
* 001 steam generator level
20500100 sglvl sum20500101 0.0 0.4445 voidf
20500102 1.2131 voidf
20500103 0.6096 voidf
20500104 0.6096 voidf20500105 0.6096 voidf20500106 0.6096 voidf* ------ ---- I.----.-----1 ----.---- 1----* 002 pressurizer level
20500200 pzrlvl sum20500201 0.0 0.1815 voidf20500202 0.1524 voidf20500203 0.3967 voidf20500204 0.5289 voidf
20500205 0.3967 voidf
20500206 0.1943 voidf20500207 0.1029 voidf
20500208 0.1029 voidf* --------- I ---- ---- 1 --------1----
* 004 accumulator level
1. 3.5255795 0503010000
505010000508010000
510010000510020000
510030000
--- 1-------1--------1-..-.
1. 1.0409756 0
415010000415020000415030000415040000
415050000415060000420010000
420020000...-- 1----------1----------1-...
LB1-2059LB1-2060LB1-2061
*LBI-2062*LB1-2063*LB1-2064*LB1-2065
*LB1-2066
*LB1-2067*LB1-2068
LB1-2069LB1-2070LB1-2071
*LB1-2072*LBI-2073*LB1-2074
*LBI 2075*LB1-2076*LBI-2077*LBI-2078
-*LBI-2079
*LBI-2080
LBI-2081
LBI-2082
LB1-2083*LB1-2084*LBi-2085
LBI-2086
LBI-2087LBi-2088
*LBI-2089
*LBI-2090*LB1-2091*LB1-2092*LBI-2093
*LBI-2094*LBI-2095
*LB1-2096
*LB1-2097
LBI-2098
LBI-2099
LB1-2100*LB1-2101
-1 .---- 1-- ---- ---- ---- ---- 1 ----
integral -0.006348 0.5879979 020500400 accmlvl
20500401 velfj 620010000
* ----------- ---- ---- . ---- ---- 1----- ---- 1 ------ 1-- -------- 1 ----* 007 reactor vessel downcomer level intact side
*20500700.---- ....- 1 -------- 1--- .... . 5......31 3 5 1020500700 rvdclvl sum 1. 5.3137665 0
2050070120500702
20500703
2050070420500705
20500706
20500707
20500708
0.0 0.18761290.2851823
0.2525361
1.52005611.2616333
1.0792591
0.3533183
0.3741720
voidfvoidfvoidfvoidfvoidf
voidfvoidfvoidf
200010000
202010000210010000
210020000210030000
210040000
222010000
220010000
* ....---- ---- I.---- 1---- ---.---- 1---- ---- 1--- ---- 1 ----.---- 1 ----* 008 reactor vessel downcomer level broken side
20500800 rvdclvl sum 1. 5.3137665 0
159

20500801 0.0
20500802205008032050080420500805205008062050080720500808
0.18761290.28518230.25253611.52005611.26163331.07925910.35331830.3741720
voidfvoidfvoidf-voidfvoidfvoidfvoidfvoidf
270010000272010000280010000280020000280030000280040000222010000220010000
*------------1----------1----------1----------1----------1----------1----.
* 230 level average channel
20523000 "lvl avg" sum 1. 1.684638 020523001 0.0 .432 voidf20523002 .195 voidf20523003 .195 voidf20523004 .28833 voidf
20523005 .5744204 voidf* -- ----.---- 1 -------- 1 ----* 231 level hot channel
20523100 "lvl hot" sum
20523101 0.0 .1397017 voidf20523102 .. 265 voidf
20523103 .08833 voidf
20523104 .08833 voidf
20523105 .08833 voidf
20523106 .08833 voidf20523107 .08833 voidf
20523108 .08833 voidf
20523109 .1325 voidf
20523110 .1325 voidf20523111 .1325 voidf
20523112 .1325 voidf20523113 .2117387 voidf
* 235 level bypass channel
20523500 "lvl byps" sum
20523501 0.0 1.0 voidf
20523502 1.0 voidf
20523503 1.0 voidf
230010000230020000230030000230040000230050000
...--1----------1---------1-..-
1. 1.652154 0231010000
231020000231030000231040000231050000
231060000
231070000
231080000231090000231100000
231110000
2311209000231130000
----1----------1---- -1---- I
0.5588068 1.6764202 0
235010000,
235020000
235030000
*LBI-2102*LBI-2103*LBi-2104*LBI-2105*LBI-2106
*LB1-2107*LBI-2108*LBI-2109
LBi-2110LBI-2111LBI-2112
*LBI-2113*LBI-2114*LB1-2115*LBI-2116
*LBI-2117*LBI-2118
LBI-2119
LBI-2120LB1-2121
*LB1-2122
*LB1-2123*LB1-2124*LB1-2125*LB1-2126*LB1-2127
*LB1-2128*LB1-2129
*LB1-2130
*LB1-2131*LB1-2132*LB1-2133
*LB1-2134*LB1-2135
LB1-2136
LB1-2137
LB1-2138*LB1-2139*LB1-2140
*LB1-2141
*LB1-2142LB1-2143
LB1-2144* --------- 1 ----.---- 1 --1---- 1---- ---- -- ---------------- 1 ----* 240 average voidfraction coreliquid void fraction
160

* ....---- 1 - 1 --- 1 -- 1- ---- - 1 ---- I .----...
20524000 "void avg" sum 2.9926155 1.0014334 0
20524001 0.02052400220524003
.147513.0897-22.093-2
cntrlvar 230cntrlvar 231cntrlvar 235
* ........ 1---- ---- 1 --- ----------- --- 1- ---- -------- ---- 1----* 250 reactor vessel level
* 1--------1----.... 1---- ------ ---------------- 1 ---- ---- 1 ----20525000 rvlvl sum 1. 6.53420525001 0.0 0.7747094 voidf 260010000
20525002 0.6312304 voidf 25501000020525003 0.286958 voidf 25201000020525004 0.7850547 voidf 25001000020525005 0.4933248 voidf 24501000020525006 0.5867979 voidf 24001000020525007 0.74 cntrlvar 23020525008 0.155 cntrlvar 23120525009 0.105 cntrlvar 235
20525010 0.5709989 voidf 22501000020525011 0.3533183 voidf 22201000020525012 0.3741720 voidf 220010000* ------ ----- I - .----1 ----.-----1 ---.----- 1 --- ----- 1 ----* 075-076 mass loss calculator
:7176 0
LB1-2145*LB1-2146*LB1-2147*LB1-2148*LB1-2149
LB1-2150LB1-2151
LB1-2152*LB1-2153
*LB1-2154*LB1-2155*LB1-2156*LB1-2157*LB1-2158
*LBI-2159*LB1-2160*LB1-2161
*LB1-2162
*LB1-2163*LB1-2164
*LB1-2165
LB1-2166LB1-2167
LB1-2168*LB1-2169*LB1-2170
*LB1-2171
LB1-2172*LB1-2173*LBI-2174
LB1-2175LB1-2176
LB1-2177
LB1-2178
LB1-2179
LB1-2180
LB1-2181LB1-2182
*LBI-2183*LBI-2184
*LBI-2185
LBI-2186
LBI-2187
* .----.--- 1 ----.---- 1 ----20507500 losssum20507501 0.0 1.0
20507502 1.0* --------- 1 -- ---------1----
20507600 lossmass20507601 cntrlvar 75
sum
mf lowjmflowj
1. 0.
317000000
347000000
0
0integral 1. 0.
* 080-081 average values of pumps
* 080 average pump speed*------------1----------1-....
20508000 pmpspeed20508001 0.0
20508002
---- 1----------1--
sum 1.
pmpvel 135
pmpvel 165
-------------. 1 ----209.17993 0
0.5
0.5
* 081 average pump head
161

/
* --- - .. --- .. . . .-- - --- -.. I ----.. --- .. . . .--- ----. . 1 -- - - --I - -- - -.I- -
20508100 avgpmphd sum 1. 204090.5 0
20508101 0.0 0.5 pmphead 135
20508102 0.5 pmphead 165*--098 ...... t1o fluid ca1----------i----------1----------1---- --1----.
* 090-098 power to fluid calculation
* 090 power average channel
20509000 "power a" sum
20509001 0.0 1. q20509002 1. q
20509003 1. q
20509004 1. q20509005 1. q* ------------- 1-- ------------ ---- ----* 091 power hot channel
* ----- ---- .--1-- ---- 1 ----20509100 "power h"
20509101 0.0 1.
20509102 1.
20509103 1.
20509104 1.
20509105 1.
20509106 1.
20509107 1.
20509108 1.
20509109 1.20509110 1.20509111 1.
20509112 1.
20509113 1.
* 092 total power
20509200 power
20509201 0.0 1.
•----1-....
sum
q
q
q
qqq
q
q
q
q
q
1. 3.81403+7 0
230010000230020000230030000
230040000230050000
-.-. .. 1----------1-....
1. 1.11608+7 0231010000
231020000
231030000231040000231050000
231060000
231070000231080000
231090000
231100000231110000
231120000
231130000.... 1---------1----------1-....
LB1-2188*LB1-2189
*LB1-2190*LB1-2191
LB1-2192
LB1-2193
LB1-2194
LBI-2195LB1-2196LB1-2197LB1-2198LB1-2199
*LB1-2200*LB1-2201*LBI-2202*LBI-2203
*LB1-2204*LBI-2205
LB1-2206LB1-2207LB1-2208
*LB1-2209
*LB1-2210
*LB1-2211
*LB1-2212*LBI-2213*LBI-2214
*LBI-2215
*LBI-2216*LBI-2217
*LBI-2218
*LBI-2219
*LB1-2220*LBI-2221
*LBI-2222
LBI-2223
LBI-2224
LBI-2225*LB1-2226
*LB1-2227
*LBI-2228
LBI-2229
LBI-2230
sum 1. 4.93011+7 0
cntrlvar 90cntrlvar 9120509202 1.
* ........- 1------- .---1-.----- 1----- ---- 1 -----.--------- -- 1 ----* 093 heat sink (steam generator)
162

* ----.---- 1 .-- .---- I ----
20509300 "heatsink"
20509301 0.0 1.
20509302 1.
20509303 1.
20509304 1.
20509305 1.
20509306 1.20509307 1.20509308 1.* "----------1 ------ -- 1 ----
---- 1----------1----------1----------1-
sum -1. 4.93949+7 0
q 115010000q 115020000
q 115030000q 115040000
q 115050000
q 115060000q 115070000q 115080000
----1----------1------1--------1-
* 095 - 098 power of structure heat capacity
* 095 structures downcomer intact loop
* -------- -- ----.----.1 ----.----- 1 ----20509500 "hc intl" sum
20509501 0.0 1.0 q
20509502 1.0 q
20509503 1.0 q
20509504 1.0 q
20509505 1.0 q
20509506 1.0 q* --------- 1-- ------ 1 --------1----* 096 structures downcommer broken*---------1----------1----------1-....
20509600 "hc brkl" sum
20509601 0.0 1.0 q20509602 1.0 q
20509603 1.0 q
20509604 1.0 q
2050960E 1.0 q
20509606 1.0 q* --------- --1------ --1-- ---- 1----* 097 structures core barrel*--------------.-.-------.-.------1--
20509700 "hc core" sum
20509701 0.0 1.0 q
20509702 1.0 q
20509703 1.0 q
.... 1-----....-1--------1-1. 1941.8926 0200010000202010000210010000
210020000
210030000
210040000.... 1----------1-......--l--1
loop....- 1----------1----------1-
1. 2181.7812 0
270010000272010000
280010000280020000
280030000
280040000
1. 259.08643 0
220010000
222010000
225010000
.... LBI-2231*LBI-2232
*LB1-2233*LBi-2234*LB1-2235
*LBI-2236
*LB1-2237*LB1-2238*LBI-2239*LBI-2240
.... LB1-2241
LB1-2242
LB1-2243
LB1-2244LB1-224tLB1-2246
.... LB1-2247*LB1-2248*LB1-2249- LB1-2250
*LB1-2251
*LB1-2252*LB1-2253
*LB1-2254--- "LB1-2255
LB1-2256--- LB1-2257
*LB1-2258
*LB1-2259*LB1-2260
*LBI-2261
*LB1-22'62*LB1-2263
*LBi-2264LB1-2265
LBI-2266
LB1-2267*LB1-2268
*LB1-2269
*LB1-2270
*LB1-2271
- LB1-2272
LB1-2273*
163

* 098 structures total*20509800----1 ------ 1---------- -..-20509800 heat cap sum 1.
----1 ----.---- 1 ----4382.7578 0
205098012050980220509803
0.0 1.01.01.0
cntrlvar 95cntrlvar 96cntrlvar 97
*--------------1---------1---------1---------1---------1---------1----
*
*
510 - 520 trip-sets
* 510 blow-down valves
----I----
0. 020551000 blowdown20551001 510
* 511 power scram
20551100 powerscr
20551101 511
* 512 pump trip
20551200 pumptrip20551201 512*---------1------...-1---..
* 523 Ipis trip
20552300 lpistrip20552301 513
* 524 accumulator valve
20552400 accumulv20552401 682
* 514 eccs
20551400 eccs
20551401 0.0 .3
20551402 .7
tripunit- 1.
-..--1----------1-....---....1----------1-
---- I---- ---- I----tripunit 1. 0. 0
LBI-2274LBI-2275
*LB1-2276*LBI-2277*LBI-2278*LBI-2279
LB1-2280LBI-2281LBI-2282LBI-2283LB1-2284LB1-2285
LBl-2286
LBI-2287*LBI-2288*LBI-2289
LBl-2290LBI-2291LB1-2292
*LBI-2293
*LB1-2294
LBI-2295LBI-2296
LBI-2297*LBI-2298
*LB1-2299
LB1-2300LB1-2301
LB1-2302*LB1-2303
*LB1-2304
LB1-2305
LB1-2306
LB1-2307*LB1-2308
*LB1-2309
LB1-2310LB1-2311LB1-2312
*LBI-2313
*LBI-2314
*LB1-2315
LBI-2316
tripunit 1.
7---1- ..---- ----1
---- 17. .. . .-. .
tripunit 1.
---- 1------...-1....
tripunit 1.
---- 1----------1---..
sum 1.
cntrlvar 523cntrlvar 524
O.
--.- 1.--.
0
-.-. 1--.-
---- 1 -------- ----0. 0
---- ---- ---- ----
---- 1 ---------1----0. 0
0. 0
* .. .. 1----------.-.--------I-.......-1----------1---------1....
164

* 516 steam valveJ ----.-.-- I ----.. ----... I ----- --I-....
20552600 steamvop tripunit 1.
20552601 68520552700 steamvcl tripunit -1.
20552701 68620551600 steamvlv sum 1.
20551601 0.0 1.0 cntrlvar 52620551602 1.0 cntrlvar 527
0.
0.
0.
----1----
0
0
01
*--------------1----------1----------1----------1----------1----
*
*
*
* ------ ----- -------- 1 - -------- 1 -------- I ----* 400-454 calculation of fluid-momentum flux
404 momentum flux of junction 34001
---- ----
* ---. . ---- .--1-- I----- 1----I. ---- ---- . ---- ---- 1----20540000 "vf 340" stdfnctn 1. 4.13990-6 020540001 abs velfj 340010000
20540100 "vg 340" stdfnctn 1. 4.13990-6 020540101 abs velgj 340010000
LB1-2317
LB1-2318*LB1-2319*LB1-2320*LB1-2321
*LB1-2322*LB1-2323*LB1-2324*LB1-2325
LB1-2326LB1-2327LB1-2328LB1-2329
LB1-2330LB1-2331LBI-2332LB1-2333
LB1-2334*LB1-2335*LB1-2336
*LBI-2337
*LBI-2338
LBI-2339*LBI-2340
*LBI-2341*LBI-2342
*LBI-2343*LBI-2344*LB1-2345
LBI-2346*LBI-2347
*LBI-2348*LBI-2349
LBI-2350
LBI-2351LBI-2352LBI-2353
*LBI-2354
*LBI-2355
*LB1-2356
*LBI-2357
LBI-2358*LBI-2359
2054020020540201205402022054030020540301
20540302
"mfxl 340"voidfj 340010000velfj 340010000"mfx2 340"voidgj 340010000
velgj 340010000
multrhofjcntrlvarmultrhogj
cntrlvar
1.
3400100004001.
340010000
401
1.
cntrlvar
cntrlvar
-1.3007-8 0
0. 0
20540400 "mf 340"
20540401
205404020.0
sum
1.01.0
-1.3007-8 0402
403
* 414 momentum flux of junction 31001
20541000 "vf 310" stdfnctn 1. 4.52749-6 020541001 abs velfj 310010000
20541100 "vg 310" stdfnctn 1. 4.52749-6 020541101 abs velgj 310010000
20541200 "mfxl 310" mult 1. 1.55564-8 0
165

2054120120541202205413002054130120541302
voidfj 310010000velfj 310010000"mfx2 310"voidgj 310010000velgj 310010000
rhofjcntrlvarmultrhogjcntrlvar
310010000
4101.310010000411
0. 0
20541400 "mf 310" sum 1. 1.55564-8 020541401 0.0 1.0 cntrlvar 41220541402 1.0 cntrlvar 413
* 424 momentum flux of junction 18502
20542000 "vf 185" stdfnctn 1. 6.3238869 020542001 abs velfj 18502000020542100 "vg 185" stdfnctn 1. 6.3238869 020542101 abs velgj 185020000
205422002054220120542202205423002054230120542302
205424002054240120542402
"mfxl 185"voidfj 185020000velfj 185020000"mfx2 185"voidgjvelgj
185020000185020000
multrhofjcntrlvarmultrhogjcntrlvar
sum1.01.0
I.1850200004201.185020000421
1.cntrlvarcntrlvar
0.
30364.766 0
0
*LBI-2360*LB1-2361*LBI-2362*LBI-2363*LB1-2364
LBI-2365*LBI-2366*LBI-2367
*LBI-2368
LBl-2369LB1-2370LBI-2371LBl-2372
*LBI-2373*LBI-2374
*LB1-2375*LB1-2376
LBI-2377*LBI-2378
*LBI-2379*LBI-2380
*LBI-2381
*LBI-2382
*LBI-2383
LBI-2384*LBI-2385
*LBI-2386*LBI-2387
LBI-2388
LBI-2389
LB1-2390
LBI-2391*LBI-2392
*LB1-2393
*LB1-2394*LBI-2395
LB1-2396*LBI-2397
*LBI-2398
*LBI-2399
*LBI-2400
*LBI-2401
*LBI-2402
"mf 185"0.0
30364.766 0422423
* 434 momentum flux of junction 10002
20543000 "vf 100" stdfnctn 1. 6.8770447 020543001 abs velfj 10002000020543100 "vg 100" stdfnctn 1. 6.8802338 020543101 abs velgj 100020000
205432002054320120543202205433002054330120543302
"mfxl 100" mult 1.voidfj 100020000 rhofj 100020000velfj 100020000 cutrlvar 430"mfx2 100" mult 1.voidgj 100020000 rhogj 100020000velgj 100020000 cntrlvar 431
33010.531 0
0.0027149 0
166

20543400 "mf 100" sum 1. 3301(20543401 0.0 1.0 cntrlvar 43220543402 1.0 cntrlvar 433*-----------1----------1----------1----------1----------1----.
* 444 momentum flux of junction 22502
20544000 "vf 225" stdfnctn 1. 2.03!20544001 abs velfj 22502000020544100 "vg 225" stdfnctn 1. 2.44:20544101 abs velgj 225020000
0.531 0
51467 0
?1768 0
.6543 02054420020544201205442022054430020544301
20544302
3144,"xmfxl 225"voidfj 225020000velfj 225020000
"mfx2 225"voidgj 225020000
velgj 225020000
multrhofjcntrlvarmultrhogjcntrlvar
1.
2250200004401.225020000
441
0. 0
20544400 "mf 225" sum 1. 3144.6543 020544401 0.0 1.0 cntrlvar 44220544402 1.0 cntrlvar 443
* 454 momentum flux of junction 24002*-----------1----------1-------1----------1----------1--
20545000 "vf 240" stdfnctn 1. 2.4358578 020545001 abs velfj 24002000020545100 "vg 240" stdfnctn 1. 3.3036118 020545101 abs vel2i 240020000
LB1-2403*LB1-2404
*LB1-2405*LB1-2406
LB1-2407LB1-2408LB1-2409
LB1-2410*LB1-2411*LB1-2412*LBI1-2413*LBI-2414
.LBI1-2415*LB1-2416*LBI-2417
*LBI-2418*LBI-2419
*LBI-2420*LBI-2421
LB1-2422*LB1-2423
*LBI-2424*LB1_2425
LB1-2426
LBI-2427
LBI-2428
LB1-2429*LB1-2430
*LB1-2431*LB1-2432*LB1-2433
LB1-2434*.LBI-2435
*LB1-2436
*LB1-2437
*LB1-2438" *LB1-2439
*LB1-2440
* "LB1-2441*LBI-2442*. LBl-2443
*LB1-2444
"-- LB1-2445
2054520020545201
2054520220545300
20545301
20545302
"mfxl 240"
voidfj 240020000
velfj 240020000
"mfx2 240"
voidgj 240020000velgj 240020000
mult
rhofj
cntrlvar
mult
rhogjcntrlvar
1.240020000
450
1.240020000
451
3872.1816 0
26.596664 0
20545400 "mf 240" sum 1. 3898.7773 020545401 0.0 1.0 cntrlvar 45220545402 1.0 cntrlvar 453*------------1----------1----------1----------1-------1--------1--
167

460 - 464 pressure differences
*S---- ---- --------- 1--
2054600020546001
20546002
205461002054610120546102
205462002054620120546202
205463002054630120546302
2054640020546401
20546402
"pdeOO1"
"pdeO02"
0.0
0.0
"pdeO03"
0.0
sum
-1.01.0
sum-1.01.0
sum-1.0
1.0
sum-1.0
1.0
sum-1.0
1.0
1.
p
p
1.
pP
1.
PP
1.
PP
1.p
p
181976.5 0120010000
150010000
-92313.69 0112020000120010000
-11923.42100010000112020000
0
"pdeOO5"0.0
-1468.106 0150010000180010000
-76271.25 0180010000
100010000
"pdeO06"
LB1-2446LB1-2447LB1-2448
LB1-2449LB1-2450
*LBI-2451*LB1-2452
*LB1-2453
LBI-2454*LB1-2455*LBI-2456*LB1-2457
LBl-2458*LB1-2459*LB1-2460
*LB1-2461
LB1-2462*LB1-2463*LBI-2464*LBI-2465
LBI-2466*LBI-2467*LBI-2468
*LBi-2469
LB1-2470
LBl-2471LBI-2472
LB1-2473
LBl-2474
LB1-2475
LBI-2476*LBI-2477
*LBI-2478
LBI-2479
LBI-2480
LBI-2481
LBI-2482
LBI-2483LB1-2484
LBI-2485
LBI-2486LBI-2487
LBI-2488
0.0
*- .........1----------1-. ....- 1-......... 1- ....- 1---------1----
* 470 reactor-power
S1.........---1-------1----. ---- ---- ....-1---------1---
20547000 "reac pow"20547001
function 1. 4.93000+7 0900time 0
* pump data
*"""""""l pump 1
168

* . -....... I - -- --. . I - -I - 1 .----
* single phase head curves---- ---- ---- ----
---- I -------- I ----* head curve no. 1
1351100 11351101 0.O00000e+001351102 1.906100e-011351103 3.896300e-011351104 5.939600e-011351105 7.902000e-011351106 1.000000e+00
* head curve no. 2
1351200 1
1351201 0.000000e+001351202 2.0000OOe-011351203 4.0000OOe-01
1351204 5.755400e-011351205 7.443200e-01
1351206 7.734800e-01
1351207 8.631300e-01
1351208 1.000000e+00
* head curve no. 3
1351300 1
1351301 -1.000000e+001351302 -8.057400e-011351303 -6.069000e-01
1351304 -4.068300e-01
1351305 -2.001710e-01
1351306 0.O00000e+00* 1-------- ---- --------1----* head curve no. 4
1351400 11351401 -1.000000e+00
1351402 -8.229700e-01
1351403 -6.333200e-01
1351404 -4.553400e-01
1351405 -2.710900e-01
1
1.403600e+001.363600e+001.318600e+00
1.232800e+001.133600e+00
1.000000e+00---- 1 ----.----- 1 ---- ---- ---- ----. ----
2-6.700000e-01-5.0000OOe-01-2.5000OOe-010.000000e+002.583000e-01
3.778000e-016.326000e-01
1.000000e+00
LB1-2489LB1-2490LBI-2491
LB1-2492LB1-2493
*LB1-2494*LBI-2495
*LBI-2496*LBI-2497*LBI-2498*LBI-2499
*LBI-2500
LB1-2501LB1-2502LBI-2503
*LB1-2504*LBI-2505*LBI-2506
*LB1-2507*LBI-2508
*LBI-2509*LB1-2510*LBI-2511
*LB1-2512
LBI-2513LBI-2514
LB1-2515*LB1-2516
*LB1-2517*LBI-2518*LB1-2519*LB1-2520*LB1-2521
*LB1-2522
LB1-2523
LB1-2524LBi-2525
*LB1-2526
*LB1-2527
*LB1-2528
*LB1-2529*LB1-2530
*LB1-2531
--- 1- --------- 1--- ---- 1 --------- 1 ----
....-1----------1---------1-------1-....3
2.472200e+002.047400e+001.831000e00
1.624000e+001.470500e+00
1.403600e+00
---- 1 ---- -------- ---- 1 -------- 1 ----
4
2.472200e+00
1.996800e+00
1.589700e+00
1.327900e+00
1.194900e+00
169

1351406 -1.771600e-01
1351407 -9.073000e-021351408 0.O00000e+00
* head curve no. 5
1351500 1
1351501 0.O00000e+001351502 2.000000e-011351503 4.000000e-011351504 4.118000e-011351505 5.976300e-011351506 7.934670e-01
1351507 1.000000e+00* --------- 1 --- ---- 1 ----
* head curve no. 6
1351600 1
1351601 0.O00000e+001351602 9.109900e-021351603 1.865090e-011351604 2.717620e-01
1351605 4.558720e-01
1351606 5.744060e-01
1351607 7.405760e-01
1351608 7.666190e-011351609 8.714710e-01
1351610 1.000000e+00* ------------ 1--- ------1----* head curve no. 7
1351700 1
1351701 -1.000000e+00
1351702 -8.0000OOe-01
1351703 -6.0000OOe-01
1351704 -4.0000OOe-01
1351705 -2.0000OOe-011351706 0.000000e+00* -------- I .---- -----1 ----
* head curve no. 8
1.060500e+001.015600e+00
9.342790e-01---- 1----------1-.... ---- 1 -------------
5
2.500000e-012.800000e-013.400000e-01
2.768000e-014.584000e-01
6.992000e-01
1.000000e+00.... 1----------1----------1----------1....
6
9.342790e-01
9.229000e-01
8.963000e-01
8.750000e-01
8.433000e-01
8.355000e-01
8.466000e-01
8.469000e-01
8.838000e-01
1.000000e+00....- 1----------1..-.
*LB1-2532
*LB1-2533*LB1-2534
LB1-2535LB1-2536LB1-2537
*LB1-2538*LB1-2539
*LB1-2540*LB1-2541*LB1-2542*LB1-2543*LB1-2544*LB1-2545
LBI-2546LB1-2547LB1-2548
*LB1-2549*LB1-2550*LB1-2551*LB1-2552*LB1-2553
*LB1-2554
*LB1-2555
*LB1-2556
*LB1-2557*LB1-2558
*LB1-2559
LB1-2560LBI-2561
LB1-2562*LB1-2563
*LB1-2564
*LB1-2565
*LB1-2566
*LBI-2567
*LB1-2568*LBI-2569
LBI-2570
LBI-2571
LB1-2572*LB1-2573
*LB1-2574
---- 1 --------- 1 ----
7-1.000000e+00
-6.300000e-01
-3.0000OOe-01
-5.000000o-02
1.500000e-..012.5000OOe-01
---- 1 --------1---- ----1 ---------1----
1351800
1351801
1
-1 .000000e+008-1.000000e+00
170

1351802 -8.000000e-01 -9.700000e-01
1351803 -6.0000OOe-Ol -9.500000e-01
1351804 -4.0000OOe-O1 -8.8000OOe-01
1351805 -2.0000OOe-01 -8.0000OOe-01
1351806 0.O00000e+O0 -6.700000e-01
* single phase torque data...-- 1----------1--...
---- ----.---- ---- ---- 1----
* torque curve no. I
1351900 21351901 0.O00000e+00
1351902 1.930000e-01
1351903 3.930000e-011351904 5.955200e-01
1351905 7.978200e-011351906 1.000000e+00-------------- 1-.. -. -
* torque curve no. 2
1352000 2
1352001 0.O00000e+001352002 4.0000OOe-01
1352003 5.0000OOe-01
1352004 7.372550e-01
1352005 7.680490e-01
1352006 8.672300e-011352007 1.000000e+00
* torque curve no. 3
1352100 2
1352101 -1.000000e+00
1352102 -8.009600e-01
1352103 -6.063800e-01
1352104 -4.068600e-01
1352105 -1.992800e-01
1352106 0.000000e+00* .-------- I ----.---- 1 ----
* torque curve no. 4
---- 1----------1----------1----------1....1
6.032000e-016.325000e-017.369000e-01
8.331000e-019.229000e-01
1.000000e+00- -1 ---- ----1 ---- ---- 1----------1-...
2
-6.700000e-01
-2.500000e-01
1.500000e-01
5.265860e-016.065940e-017.436600e-011.000000e+00
*LBI-2575*LBI-2576*LBl-2577
*LB1-2578*LBI-2579
LBI-2580
LBI-2581
LBI-2582LBI-2583LBI-2584
*LBI-2585
*LB1-2586
.*LB1-2587*LB1-2588*LBI-2589
*LBI-2590*LBI-2591
LBI-2592
LBI-2593LBI-2594
*LB1-2595
*LBI-2596
*LB1-2597
*LB1-2598
*LB1-2599
*LBI-2600
*LBI-2601*LB1-2602
LBI-2603LBI-2604LB1-2605
*LBI-2606
*LBI-2607*LB1-2608
*LBI-2609
*LB1-2610*LBI-2611
*LB1-2612LB1-2613
LB1-2614
LB1-2615*LB1-2616
*LB1-2617
---- I---- ---- ---- .--1------1----
----1----------1------1 ...- 1-....
3
1.984300e+001.394000e+00
1.097500e+008.220000e-01
6.648000e-01
6.032000e-01
---- 1 -------- ---- ---- 1- -------- I ----
13522001352201
2-1.O000000e+00
---- 1 ---- ---- ---- ------------ 1 ----4
1.984300e+00
171

13522021352203
13522041352205135220613522071352208
-8.223400e-01-6.337100e-01
-4.585300e-01-2.670230e-01-1.761070e-01-8.931000e-020.000000e+00
1.830800e+001.682400e+00
1.557000e+001.436200e+00
1.387900e+001.348100e+001.233610e+00
* torque curve no. 5
1352300 21352301 0.000000e+00
1352302 4. 0000Oe-01
1352303 5.0000OOe-011352304 1.000000e+00
* torque curve no. 6*--------1--------1...-
1352400 2
1352401 0.O00000e+00
1352402 9.064300e-021352403 1.885690e-01
1352404 2.734700e-01
1352405 4.586690e-01
1352406 5.744800e-011352407 7.381600e-01
1352408 7.685200e-011352409 8.700570e-01
1352410 1.000000e+00* 1------ ------------ 1----* torque curve no. 7
---- 1 -------- 1----5-4.500000e-01
-2.500000e-010.000000e+00
3.569000e-01....-1----------1-...-
6
1.233610e+00
1.196500e+001.109600e+00
1.041600e+00
8.958000e-01
7.807000e-016.134000e-015.8490O0e-01
4.877000e-013.569000e-01
7
-1.000000e+00
-9.0000OOe-01-5.000oooe-o0
-4.5000OOe-01-- 1----------1----
8
-1.000000e+00-9.0000OOe-01
....-1----------1--
.... 1-----....-1....
*LB1-2618*LB1-2619*LB1-2620
*LB1-2621
*-LB1-2622*LBI-2623*LBI-2624
LB1-2625LB1-2626LB1-2627
*LB1-2628*LB1-2629
*LBI-2630*LB1-2631*LBI-2632
LBI-2633LB1-2634LB1-2635
*LBI-2636
*LB1-2637
*LB1-2638*LB1-2639
*LB1-2640
*LBI-2641
*LB1-2642*LB1-2643
*LB1-2644
*LB1-2645
*LB1-2646
LB1-2647
LB1-2648
LB1-2649*LB1-2650
*LB1-2651
*LB1-2652
*LB1-2653*LB1-2654
LB1-2655
LB1-2656
LB1-2657*LB1-2658
*LB1-2659
*LB1-2660
------ 1--------
1352500 2
1352501 -:
1352502 -:1352503 -:
1352504 0
1.000000e+003.000000e-011.000000e-01.000000e+00
* torque curve no. 8*-----------. ------ 1-- .... 1-----....-1-....
1352600 2
1352601 -:
1352602 -:
1.000000e+002.500000e-01
172

1352603 -8.0000OOe-02 -8.0000OOe-01
1352604 0.O00000e+O0 -6.700000e-01* ....---- --.---.---- 1 --------- I.-1--- ---- --1-- ----- ---- ---- 1 ----* two - phase multiplier data from 13-6 test data* ----------- 1---- ---- 1----* head curve
1353000 0
1353001 0.O00000e+001353002 1.000000e-01
1353003 2.0000OOe-011353004 3.0000OOe-011353005 3.500000e-0i
1353006 4.000000e-011353007 5.000000e-011353008 6.0000OOe-011353009 7.0000OOe-01
1353010 8.0000OOe-01
1353011 9.0000OOe-01
1353012 1.000000e+00
* torque curve
1353100 0
1353101 0.O00000e+00
1353102 1.0000OOe-011353103 2.000000e-011353104 3.0000OOe-01
1353105 3.500000e-011353106 4.0000OOe-01
1353107 5.0000OOe-01
1353108 6.0000OOe-01
1353109 7.0000OOe-01
1353110 8.0000OOe-01
1353111 9.0000OOe-011353112 1.000000e+00
* pump 2-phase difference
* head curve no. 1
1354100 1
1354101 0.O00000e+00
0.O00000e+00
0.O00000e+001.0000OOe-O0
2.0000OOe-013.0000OOe-01
6.0000OOe-016.000000e-.01
6.0000OOe-01
6.0000OOe-01
5.000000e-01
3.0000OOe-01
0.O00000e+00--1--------1-....
---- 1----------1----..
.... 1----------1-....
*LB1-2661*LB1-2662
LB1-2663LB1-2664LB1-2665LB1-2666LB1-2667
*LB1-2668*LB1-2669
*LB1-2670*LB1-2671*LB1-2672*LB1-2673
*LBI-2674*LBi-2675*LB1-2676*LB1-2677*LB1-2678
*LB1-2679*LB1-2680
LB1-2681
LB1-2682
LB1-2683*LB1-2684*LB1-2685*LB1-2686
*LB1-2687*LB1-2688
*LB1-2689*LB1-2690
*LB1-2691
*LB1-2692*LB1-2693
*LB1-2694
*LB1-2695
*LB1-2696
LB1-2697
LB1-2698
LB1-2699
LB1-2700
LB1-2701
*LB1-2702*LB1-2703
--- 1------ ---- 1-- ---------------- ----
0.000000e+00
0.O00000e+00
1.000000e-013.0000OOe-01
5.0000OOe-017.5000OOe-01
7.5000OOe-01
7.500000e-01
7.5000OOe-01
7.5000OOe.01
5.000000e-01
0.000000e+00
data---1--------1--..-
--- 1----------1----.
-..--1----------1....
11. O00000e+O0
173

1354102 1.000000e+00
* head curve no. 2
1354200 11354201 0.000000e+001354202 1.000000e+00
* head curve no. 3
1354300 11354301 -1.O00000e+00
1354302 -9.0000OOe-01
1354303 -8.000000e-011354304 -7.0000OOe-01
1354305 -6.0000OOe-011354306 -5.0000ooe-011354307 -4.0000OOe-01
1354308 -2.500000e-01
1354309 -1.000000e-01
1354310 0.O00000e+00*J .... ----- -- 1 ----* head curve no. 4
1354400 1
1354401 -1.000000e+00
1354402 -9.0000OOe-011354403 -8.0000OOe-01
1354404 -7.0000OOe-01
1354405 -6.000000e-01
1354406 -5.000000e-01
1354407 -3.500000e-01
1354408 -2.0000OOe-01
1354409 -1.000000e-01
1354410 0.O000000e+00* .-------- I ----.---- 1 ----* head curve no. 5
1354500 1
1354501 0.O00000e+00
1354502 2.0000OOe-01
1354503 4.0000OOe-01
1354504 6.0000OOe-01
1.000000e+00---- 1 --------. 1 ---- ----.---- ---- 1 ----
---- 1 ----.---- 1 .-------- -------- 1 ----2
1.000000e+001.000000e+00
3
-1.160000e+00
-1.240000e+00
-1.770000e+00-2.360000e+00-2.790000e+00-2.910000e+00-2.670000e+00-1.690000e+00-5.000000e-01
0.O00000e+00....- 1------1-
--- 1------1--
---- 1 --------- 1 ----
*LBI-2704LB1-2705
LB1-2706LB1-2707
*LB1-2708*LBI-2709*LBI-2710
LBI-2711LBI-2712
LBI-2713*LBI-2714*LBI-2715"*LB1-2716*LB1-2717*LBI-2718*LB1-2719
*LBI-2720*LBI-2721
*LBI-2722*LBI-2723
*LBI-2724
LBI-2725LB1-2726
LB1-2727*LB1-2728*LB1-2729
*LBI-2730*LB1-2731
*LBI-2732*LBI-2733
*LB1-2734*LBi-2735
*LB1-2736*LBI-2737
*LBI-2738
LB1-2739LBI-2740
LB1-2741*LBI-2742
*LBI-2743
*LBI-2744
*LB1-2745
*LBI-2746
..---- --- ------------ 1 -------- 1 ----
4
-1.160000e+00-7.800000e-01
-5.000000e-01
-3.1000OOe-01-1.700000e-01
-8.000000e-02
0.O00000e+00
5.000000e-02
8.0000OOe-02
1.100000e-01....- 1----------1.... ---- 1 --------- 1 ----
5
0.000000e+00
-3.400000e-01
-6.500000e-01
-9.300000e-01
174 '

1354505 8.0000OOe-O1
1354506 1.O00000e+O0
-1.190000e+00-1.470000e+00
* ----.---- I .---- 1--- I ---- ---- 1---- ----- 1----
* head curve no. 6----I -------- I ----
* ..---- -- 1-- I----.----1----
1354600 11354601 0.O00000e+00
1354602 1.0000OOe-011354603 2.5000OOe-01
1354604 4.000000e-011354605 5.0000OOe-011354606 6.000000e-01
1354607 7.0000OOe-01
1354608 8.0000OOe-011354609 9.0000OOe-011354610 1.000000e+00* .-------- I ----.---- 1 ----
* head curve no. 7
---- 1----------1------1-------1-....
6
1.100000e.01
1.300000e-01
1.5000OOe-01
1.300000e-017.000000e-02
-4.0000OOe-02-2.300000e-01
-5.1000OOe-01-9.100000e-01-1.470000e+00
1354700
1354701
1354702
1
-1.000000e+000.O00000e+00
* head curve no. 8
1354800 1
1354801 -1.000000e+00
1354802 0.O00000e+00
* torque curve no. 1
1354900 21354901 0.O00000e+00
1354906 1.000000e+00* .-------- I ----.---- 1 ----* torque curve no. 2*------------1----------1-....
7
0.000000e+000.O00000e+00
8
0.O00000e+000.O00000e+00
....- 1----------1-....
----1 --------- 1 ----
*LBI-2747*LBI-2748
LB1-2749LB1-2750LB1-2751
*LB1-2752*LB1-2753
*LBI-2754
*LBI-2755*LBI-2756
*LB1-2757*LBI-2758*LBI-2759
*LBI-2760*LB1-2761
*LBI-2762
LB1-2763
LB1-2764
LB1-2765*LB1-2766*LB1-2767*LBI-2768
LB1-2769LB1-2770LB1-2771
*LB1-2772
*LB1-2773
*LBI-2774
LBl-2775
LBI-2776LBI-2777
*LB1-2778
*LB1-2779
*LBI-2780
LBl-2781LBI-2782
LBI-2783*LB1-2784
*LB1-2785
*LB1-2786
LBI-2787LB1-2788
LBI-2789
----1 --------- 1 ----
---- 1--
---- 1-....
---- 1-....
---- 1-....
1
1. O00000e+001.000000e+00
....- 1----------1----------1------1-
1355000 21355001 0
1355007 1
.000000e+00
.000000e+00
2
1.000000e+00
i.000000e+00....-1------1-
---- 1---- ---- 1I----
* --------- I ---- ---- 1 ---- ---- 1 ---------1 ----* torque curve no. 3*------------1----------I----------1----------1------1--------1....
175

1355100 21355101 -:
1355102 -l1355103 -41355104 -'
1355105 -:
1355106 0
1.000000e+008.009600e-016.063800e-014.068600e-01
1.992800e-01.000000e+00
torque curve no. 4
1355200 2
1355201 -1.O00000e+001355202 -8.223400e-011355203 -6.337100e-011355204 -4.585300e-011355205 -2.670230e-01
1355206 -1.761070e-011355207 -8.931000e-02
1355208 0.O00000e+00
31.984300e+00
1.394000e+001.097500e+008.220000e-016.648000e-01
6.032000e-01
4
1.984300e-001.830800e+001.682400e+001.557000e+001.436200e+001.387900e+001.348100e+001.233610e+00
. 1----- ---- 1 ----
....- 1----------1--
....- 1----------1--
---- I---------1----* torque curve no. 5*--------1--------1----------1-....-....-1----------1------1-
*LB1-2790*LB1-2791*LB1-2792
*LB1-2793*LB1-2794*LB1-2795*LB1-2796
LB1-2797LB1-2798LBI-2799
*LB1-2800
*LBI-2801*LBI-2802*LBI-2803*LB1-2804*LBI-2805
*LB1-2806*LBI-2807*LBI-2808
LBI-2809
LBI-2810LBI-2811
*LBI-2812
*LBI-2813*LBI-2814
*LBI-2815
*LBI-2816
LB1-2817
LBI-2818LB1-2819
*LBI-2820*LBI-2821
*LBI-2822
*LBI-2823
*LB1-2824*LBI-2825
*LB1-2826*LB1-2827
*LBI-2828
*LBI-2829
*LBI-2830
LB1-2831
LBI-2832
1355300 2
1355301 0.O00000e+001355302 4.0000OOe-01
1355303 5.000000e-Ol
1355304 1.000000e+00
* torque curve no. 6
1355400 2
1355401 0.O00000e+00
1355402 9.064300e-02
1355403 1.885690e-01
1355404 2.734700e-01
1355405 4.586690e-01
1355406 5.744800e-01
1355407 7.381600e-01
1355408 7.685200e-01
1355409 8.700570e-01
1355410 1.000000e+00* --------- I --1------ 1----* torque curve no. 7
5-4.5oOOoe-ol-2.5000OOe-01
0.000000e+00
3.569000e-01....- 1----------1----------1-------
6
1.233610e+001. 196500e+00
1. 109600e+00
1. 041600e+00
8.958000e-01
7. 807000e-01
6.134000e-01
5.849000e-01
4. 877000e-013.569000e-01
....-1----------1-....
---1-------1--
---- 1 -------- 1 ----
176

* ---- - 1-- I ... ....---.----
1355500 2
1355501 -1.000000e+001355502 -3.0000OOe-011355503 -1.000000e-01
1355504 0.000000e+00
* torque curve no. 8
1355600 2
1355601 -1.000000e+00
1355602 -2.500000e-011355603 -8.0000OOe-02
1355604 0.O00000e+00*------------1----------1--
---- I ----.-- 1 ----.----1 .----.---- 1 ----7
-1.000000e+00-9.000000e-01
-5.0000OOe-01
-4.5000OOe-01
8-1.000000e+00
-9.000000e-01
-8.000000e-01
-6.700000e-01
1 ---------1 ----
...- 1-----....-1-....
....- 1----------1....
LBI-2833*LBI-2834
*LBI-2835*LB1-2836
*LBI-2837*LBI-2838
LBI-2839
LBI-2840LBl-2841
*LBI-2842*LB1-2843*LBI-2844*LBI-2845
*LB1-2846
LBI-2847
LBI-2848*LBI-2849
---- 1 ----.---- I ----
.RELAP5/Mod2 inputdeck (Mk. 6-00 C)
177


NRC FOAM 335 U.S. NUCLEAR REGULATORY COMMISSION I. REPORT NUMBER7249) IAueWAb• W NRC. A V.. A.. A .o
NACM 1102S W4 AdHEdEum Nymbe.. It smy.)3201.3202 BIBLIOGRAPHIC DATA SHEET
Is" mue r;tncto on th ~esjNUREGIIA-00892. TITLE AND SUBTITLE PSI-Bericht Nr. 91
Post-Test-Analysis and Nodalization Studies of OECD LOFT Experiment LP-LB-1 3. DATE REPORT PUBLISHED
RELAP5/MOD2 CY36-02 MONTH I 'EAROctober 1992
4. FIN OR GRANT NUMBER
A46825. AUTHOR ISI 6. TYPE OF REPORT
D. Lubbesmeyer Technical7. PERIOD COVERED tinct.uw Ooeet
S. PEFOIHRMINGJ ORG.ANIZAT ION -- NAME¢ AND ADDRES (11N.'..*MVl NRoP'W• "Ai. OffJC0Pi*F Rflft USq Nucle4' arfiPOfY Co~mL'oAao,%8•fl.f #ddn•,•.' i conrr~ctof.Vfcnvlcf
Paul Scherrer Institute (PSI)Wurenlingen and Villigen5232 Villigen PSISwitzerland
9. SPONSORING ORGANIZATION - NAME AND ADDRESS III NRC. tye 0"OJooo JfC0 I•O4ffe0,grmf NRC O•diVRti. OfJie. Rko'a. Lon. U..1 AcIe, euqatov Commiwoa,.
Office of Nuclear Regulatory ResearchU.S. Nuclear Regulatory CommissionWashington, D.C. 20555
10. SUPPLEMENTARY NOTES
1I. ABSTRACTIiW - m or i
This report presents the results and analysis often post-test calculations of the experiment LP-LB-1 by using theRELAP5/MOD2 CY36-02 computer code with different nodalizations. Starting with the "standard nodalization" wehave reduced the number of volumes and junctions as well as the number of radial zones in the fuel rods. Onlysmall discrepancies have been observed between the results of calculations using different nodalizations. Reducednumbers of volumes and junctions usually have decreased the running time of the problem. The time behaviors ofthe cladding temperatures have been significantly affected by the chosen nodalizations but surprisingly, the resultsfor the cases with a reduced number of volumes and junctions seem to be slightly closer to the experimental data.With respect to top-down rewetting, one of the key-events of Experiment LP-LB-1 during the blow-down phase,RELAP5/MOD2 was not at all able to predict this phenomenon.
12. KEY WORDSIDESCRIPTORS ILlat om. oftom OP, mw m~t eMuWv bae inft." .the mf . 13. AVAiLASILItY STATEMENT
RELAP5/MOD2, LP-LB-1 Unimited14. 3|CURITY CLASSIFICATION
IThs PupI
Unclassifiedirhk 01*0Ii
UnclassifiedIS. NUMBER OF PAGES
10. PRICE
NRC FOAM 335 12491

Federal Recycling Program

NUCLEAR UNITED STATES
REGULATORY COMMISSION
WASHINGTON, D.C. 20555-0001
OFFICIAL BUSINESS
PENALTY FOR PRIVATE
USE, $300
SPCALFURTh-CLAss RATEIPOSTAGE AND FEES PAIDUSNRCPERMIT NO. G.67
I120555063572
4 1ANiCI
US NRC-RESDIV OF SYSTEMS
RESEARCH
BRANCH CHIEF
REACTOR & PLANT
SYSTEMS BR
NL/N-353WASHINGTON
DC 20555
Related Documents