Research Article Numerical Simulation Modeling of Carbonate Reservoir Based on Rock Type Peiqing Lian, Cuiyu Ma, Bingyu Ji, Taizhong Duan, and Xuequn Tan Sinopec Petroleum Exploration and Production Research Institute, Beijing, China Correspondence should be addressed to Peiqing Lian; [email protected] Received 18 May 2017; Revised 26 July 2017; Accepted 3 August 2017; Published 1 November 2017 Academic Editor: Yingfang Zhou Copyright © 2017 Peiqing Lian et al. is is an open access article distributed under the Creative Commons Attribution License, which permits unrestricted use, distribution, and reproduction in any medium, provided the original work is properly cited. ere are many types of carbonate reservoir rock spaces with complex shapes, and their primary pore structure changes dramatically. In order to describe the heterogeneity of K carbonate reservoir, equations of porosity, permeability and pore throat radii under different mercury injection saturations are fitted, and it shows that 30% is the best percentile. 30 method is presented for rock typing, and six rock types are divided according to 30 value of plugs. e porosity-permeability relationship is established for each rock type, and their relevant flow characteristics of each rock type have been studied. Logs are utilized to predict rock types of noncored wells, and a three-dimensional (3D) rock type model has been established based on the well rock type curves and the sedimentary facies constraint. Based on the relationship between J function and water saturation, the formula of water saturation, porosity, permeability, and oil column height can be obtained by multiple regressions for each rock type. en, the water saturation is calculated for each grid, and a 3D water saturation model is established. e model can reflect the formation heterogeneity and the fluid distribution, and its accuracy is verified by the history matching. 1. Introduction K reservoir is a large carbonate reservoir, the storage space is dominated by secondary interstices and vugs, and there are few fractures. K reservoir buried depth is very deep and is affected by the strong diagnosis. Its primary pore structure changes dramatically, and the reservoir physical property distribution has strong heterogeneity. Rock typing is an essential step in the process of the carbonate reservoir char- acterization and geological modeling, and it is the method of classifying reservoir rocks which have the same fluid flow features into groups [1–6]. Rock typing is an effective way to obtain accurate permeability, and it enables us to get better understanding of the fluid movement and to enhance oil recovery [7–11]. ere are several well-known models for the rock type discrimination. Leverett introduced the famous J Function which could be used for rock typing [12, 13]. Winland [14] used the mercury injection-capillary pressure curves to develop an empirical relationship among porosity, perme- ability, and pore throat radii to different mercury saturations and found that the 35th percentile gave the best correlation. Amaefule et al. [15, 16] introduced a hydraulic flow unit concept and developed a method to predict the permeability of cored and uncored intervals; they grouped different rock samples based on their pore attributes similarity. In this paper, we focus on the high heterogeneity of K reservoir and study the rock typing method for carbonate reservoirs. e capillary pressure curves and the relative permeability curves are assigned to each rock type, and different flow units are generated. Based on geological model, the numerical simulation model has been established, and the accuracy of the model is verified by the history production matching. 2. Rock Typing Method Darcy’s law is an equation that describes the flow of a fluid through porous medium. It can be expressed as follows: = ⋅ Δ , (1) Hindawi Journal of Engineering Volume 2017, Article ID 6987265, 6 pages https://doi.org/10.1155/2017/6987265

Welcome message from author
This document is posted to help you gain knowledge. Please leave a comment to let me know what you think about it! Share it to your friends and learn new things together.
Transcript

Research ArticleNumerical Simulation Modeling of Carbonate ReservoirBased on Rock Type
Peiqing Lian, CuiyuMa, Bingyu Ji, Taizhong Duan, and Xuequn Tan
Sinopec Petroleum Exploration and Production Research Institute, Beijing, China
Correspondence should be addressed to Peiqing Lian; [email protected]
Received 18 May 2017; Revised 26 July 2017; Accepted 3 August 2017; Published 1 November 2017
Academic Editor: Yingfang Zhou
Copyright © 2017 Peiqing Lian et al. This is an open access article distributed under the Creative Commons Attribution License,which permits unrestricted use, distribution, and reproduction in any medium, provided the original work is properly cited.
There are many types of carbonate reservoir rock spaces with complex shapes, and their primary pore structure changesdramatically. In order to describe the heterogeneity of K carbonate reservoir, equations of porosity, permeability and pore throatradii under different mercury injection saturations are fitted, and it shows that 30% is the best percentile. 𝑅30 method is presentedfor rock typing, and six rock types are divided according to𝑅30 value of plugs. The porosity-permeability relationship is establishedfor each rock type, and their relevant flow characteristics of each rock type have been studied. Logs are utilized to predict rock typesof noncored wells, and a three-dimensional (3D) rock type model has been established based on the well rock type curves and thesedimentary facies constraint. Based on the relationship between J function and water saturation, the formula of water saturation,porosity, permeability, and oil column height can be obtained bymultiple regressions for each rock type.Then, the water saturationis calculated for each grid, and a 3D water saturation model is established. The model can reflect the formation heterogeneity andthe fluid distribution, and its accuracy is verified by the history matching.
1. Introduction
K reservoir is a large carbonate reservoir, the storage space isdominated by secondary interstices and vugs, and there arefew fractures. K reservoir buried depth is very deep and isaffected by the strong diagnosis. Its primary pore structurechanges dramatically, and the reservoir physical propertydistribution has strong heterogeneity. Rock typing is anessential step in the process of the carbonate reservoir char-acterization and geological modeling, and it is the methodof classifying reservoir rocks which have the same fluid flowfeatures into groups [1–6]. Rock typing is an effective way toobtain accurate permeability, and it enables us to get betterunderstanding of the fluid movement and to enhance oilrecovery [7–11].
There are several well-known models for the rock typediscrimination. Leverett introduced the famous J Functionwhich could be used for rock typing [12, 13]. Winland[14] used the mercury injection-capillary pressure curves todevelop an empirical relationship among porosity, perme-ability, and pore throat radii to different mercury saturationsand found that the 35th percentile gave the best correlation.
Amaefule et al. [15, 16] introduced a hydraulic flow unitconcept and developed a method to predict the permeabilityof cored and uncored intervals; they grouped different rocksamples based on their pore attributes similarity.
In this paper, we focus on the high heterogeneity of Kreservoir and study the rock typing method for carbonatereservoirs. The capillary pressure curves and the relativepermeability curves are assigned to each rock type, anddifferent flow units are generated. Based on geological model,the numerical simulationmodel has been established, and theaccuracy of the model is verified by the history productionmatching.
2. Rock Typing Method
Darcy’s law is an equation that describes the flow of a fluidthrough porous medium. It can be expressed as follows:
𝑞 = 𝐾𝐴𝑝𝜇 ⋅ Δ𝑃𝐿𝑝 , (1)
HindawiJournal of EngineeringVolume 2017, Article ID 6987265, 6 pageshttps://doi.org/10.1155/2017/6987265
2 Journal of Engineering
where 𝑞 is volumetric flow rate,𝐾 is permeability,𝐴𝑝 is cross-sectional area of plug, 𝜇 is viscosity, 𝐿𝑝 is length of plug, andΔ𝑃 is pressure drop.
Poiseuille’s equation can be used to determine the pres-sure drop of a constant viscosity fluid exhibiting laminar flowthrough a rigid pipe.
𝑞 = 𝑛𝜋𝑟4𝑖8𝜇 ⋅ Δ𝑃𝐿𝑎 , (2)
where 𝑛 is number of capillary tubes, 𝑟𝑖 is pore throat radiusof 𝑖th tube, and 𝐿𝑎 is apparent length of fluid flow path.
For homogenous plug samples, porosity can be calculatedby the following equation:
𝜑 = 𝑛𝜋𝑟2𝑖𝐴𝑝 ⋅𝐿𝑎𝐿𝑝 , (3)
where 𝜑 is effective porosity.By applying Darcy’s and Poiseuille’s Laws, a relationship
between porosity and permeability can be derived as thefollowing equation:
𝐾 = 𝑟2𝑖 𝜑8𝜏2 , (4)
where 𝜏 is tortuosity, 𝜏 = (𝐿𝑎/𝐿𝑝)2.Converting (4) into logarithmic form, we can derive the
following equation:
log 𝑟𝑖 = 𝐶 + 𝐴 log𝐾 − 𝐵 log𝜑, (5)
where 𝐴, 𝐵, and 𝐶 are constant parameters.For 𝐾 reservoir, porosity, permeability, and mercury
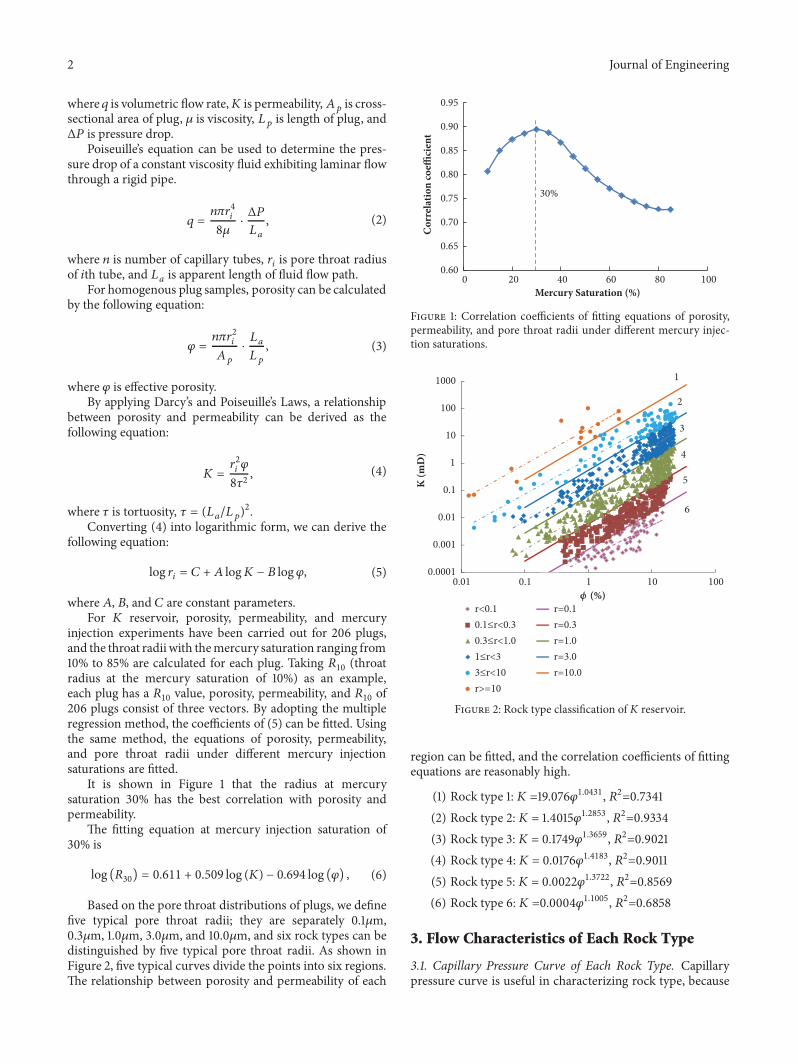
injection experiments have been carried out for 206 plugs,and the throat radii with themercury saturation ranging from10% to 85% are calculated for each plug. Taking 𝑅10 (throatradius at the mercury saturation of 10%) as an example,each plug has a 𝑅10 value, porosity, permeability, and 𝑅10 of206 plugs consist of three vectors. By adopting the multipleregression method, the coefficients of (5) can be fitted. Usingthe same method, the equations of porosity, permeability,and pore throat radii under different mercury injectionsaturations are fitted.
It is shown in Figure 1 that the radius at mercurysaturation 30% has the best correlation with porosity andpermeability.
The fitting equation at mercury injection saturation of30% is
log (𝑅30) = 0.611 + 0.509 log (𝐾) − 0.694 log (𝜑) , (6)
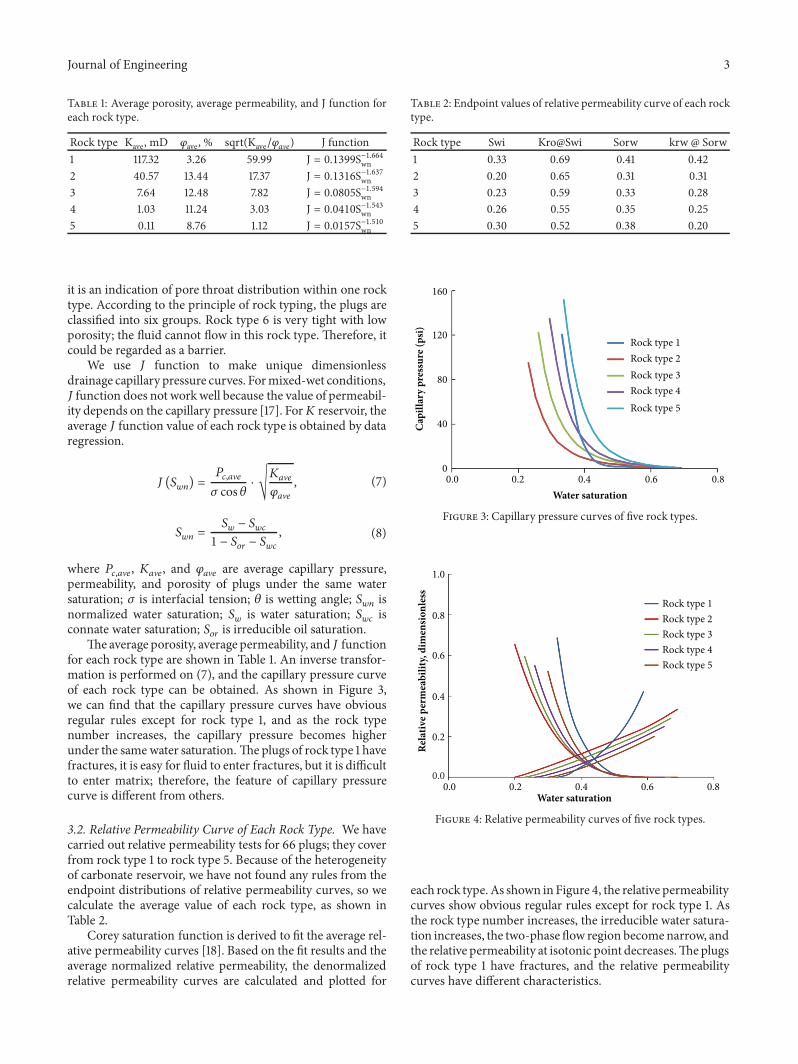
Based on the pore throat distributions of plugs, we definefive typical pore throat radii; they are separately 0.1𝜇m,0.3𝜇m, 1.0𝜇m, 3.0𝜇m, and 10.0𝜇m, and six rock types can bedistinguished by five typical pore throat radii. As shown inFigure 2, five typical curves divide the points into six regions.The relationship between porosity and permeability of each
0.60
0.65
0.70
0.75
0.80
0.85
0.90
0.95
0 20 40 60 80 100
Cor
rela
tion
coeffi
cien
t
Mercury Saturation (%)
30%
Figure 1: Correlation coefficients of fitting equations of porosity,permeability, and pore throat radii under different mercury injec-tion saturations.
0.0001
0.001
0.01
0.1
1
10
100
1000
0.01 0.1 1 10 100
K (m
D)
r<0.10.1≤r<0.30.3≤r<1.01≤r<33≤r<10r>=10
r=0.1r=0.3r=1.0r=3.0r=10.0
1
3
4
5
6
2
(%)
Figure 2: Rock type classification of K reservoir.
region can be fitted, and the correlation coefficients of fittingequations are reasonably high.
(1) Rock type 1: 𝐾 =19.076𝜑1.0431, 𝑅2=0.7341(2) Rock type 2: 𝐾 = 1.4015𝜑1.2853 , 𝑅2=0.9334(3) Rock type 3: 𝐾 = 0.1749𝜑1.3659, 𝑅2=0.9021(4) Rock type 4: 𝐾 = 0.0176𝜑1.4183, 𝑅2=0.9011(5) Rock type 5: 𝐾 = 0.0022𝜑1.3722, 𝑅2=0.8569(6) Rock type 6: 𝐾 =0.0004𝜑1.1005, 𝑅2=0.6858
3. Flow Characteristics of Each Rock Type
3.1. Capillary Pressure Curve of Each Rock Type. Capillarypressure curve is useful in characterizing rock type, because
Journal of Engineering 3
Table 1: Average porosity, average permeability, and J function foreach rock type.
Rock type Kave, mD 𝜑ave, % sqrt(Kave/𝜑𝑎V𝑒) J function1 117.32 3.26 59.99 J = 0.1399S−1.664wn2 40.57 13.44 17.37 J = 0.1316S−1.637wn3 7.64 12.48 7.82 J = 0.0805S−1.594wn4 1.03 11.24 3.03 J = 0.0410S−1.543wn5 0.11 8.76 1.12 J = 0.0157S−1.510wn
it is an indication of pore throat distribution within one rocktype. According to the principle of rock typing, the plugs areclassified into six groups. Rock type 6 is very tight with lowporosity; the fluid cannot flow in this rock type. Therefore, itcould be regarded as a barrier.
We use 𝐽 function to make unique dimensionlessdrainage capillary pressure curves. Formixed-wet conditions,𝐽 function does not workwell because the value of permeabil-ity depends on the capillary pressure [17]. For𝐾 reservoir, theaverage 𝐽 function value of each rock type is obtained by dataregression.
𝐽 (𝑆𝑤𝑛) = 𝑃𝑐,𝑎V𝑒𝜎 cos 𝜃 ⋅ √𝐾𝑎V𝑒𝜑𝑎V𝑒 , (7)
𝑆𝑤𝑛 = 𝑆𝑤 − 𝑆𝑤𝑐1 − 𝑆𝑜𝑟 − 𝑆𝑤𝑐 , (8)
where 𝑃𝑐,𝑎V𝑒, 𝐾𝑎V𝑒, and 𝜑𝑎V𝑒 are average capillary pressure,permeability, and porosity of plugs under the same watersaturation; 𝜎 is interfacial tension; 𝜃 is wetting angle; 𝑆𝑤𝑛 isnormalized water saturation; 𝑆𝑤 is water saturation; 𝑆𝑤𝑐 isconnate water saturation; 𝑆𝑜𝑟 is irreducible oil saturation.
The average porosity, average permeability, and 𝐽 functionfor each rock type are shown in Table 1. An inverse transfor-mation is performed on (7), and the capillary pressure curveof each rock type can be obtained. As shown in Figure 3,we can find that the capillary pressure curves have obviousregular rules except for rock type 1, and as the rock typenumber increases, the capillary pressure becomes higherunder the same water saturation. The plugs of rock type 1 havefractures, it is easy for fluid to enter fractures, but it is difficultto enter matrix; therefore, the feature of capillary pressurecurve is different from others.
3.2. Relative Permeability Curve of Each Rock Type. We havecarried out relative permeability tests for 66 plugs; they coverfrom rock type 1 to rock type 5. Because of the heterogeneityof carbonate reservoir, we have not found any rules from theendpoint distributions of relative permeability curves, so wecalculate the average value of each rock type, as shown inTable 2.
Corey saturation function is derived to fit the average rel-ative permeability curves [18]. Based on the fit results and theaverage normalized relative permeability, the denormalizedrelative permeability curves are calculated and plotted for
Table 2: Endpoint values of relative permeability curve of each rocktype.
Rock type Swi Kro@Swi Sorw krw @ Sorw1 0.33 0.69 0.41 0.422 0.20 0.65 0.31 0.313 0.23 0.59 0.33 0.284 0.26 0.55 0.35 0.255 0.30 0.52 0.38 0.20
Water saturation
160
120
80
40
00.0 0.2 0.4 0.6 0.8
Rock type 1Rock type 2Rock type 3Rock type 4Rock type 5Ca
pilla
ry p
ress
ure (
psi)
Figure 3: Capillary pressure curves of five rock types.
Water saturation0.80.40.0
0.0
0.2
0.4
0.6
0.8
1.0
0.2 0.6
Rela
tive p
erm
eabi
lity,
dim
ensio
nles
s
Rock type 1Rock type 2Rock type 3Rock type 4Rock type 5
Figure 4: Relative permeability curves of five rock types.
each rock type. As shown inFigure 4, the relative permeabilitycurves show obvious regular rules except for rock type 1. Asthe rock type number increases, the irreducible water satura-tion increases, the two-phase flow region becomenarrow, andthe relative permeability at isotonic point decreases.Theplugsof rock type 1 have fractures, and the relative permeabilitycurves have different characteristics.
4 Journal of Engineering
RRT1
RRT6
RRT2RRT3RRT4RRT5
Figure 5: 3D rock type model.
4. Numerical Simulation Based on Rock Type
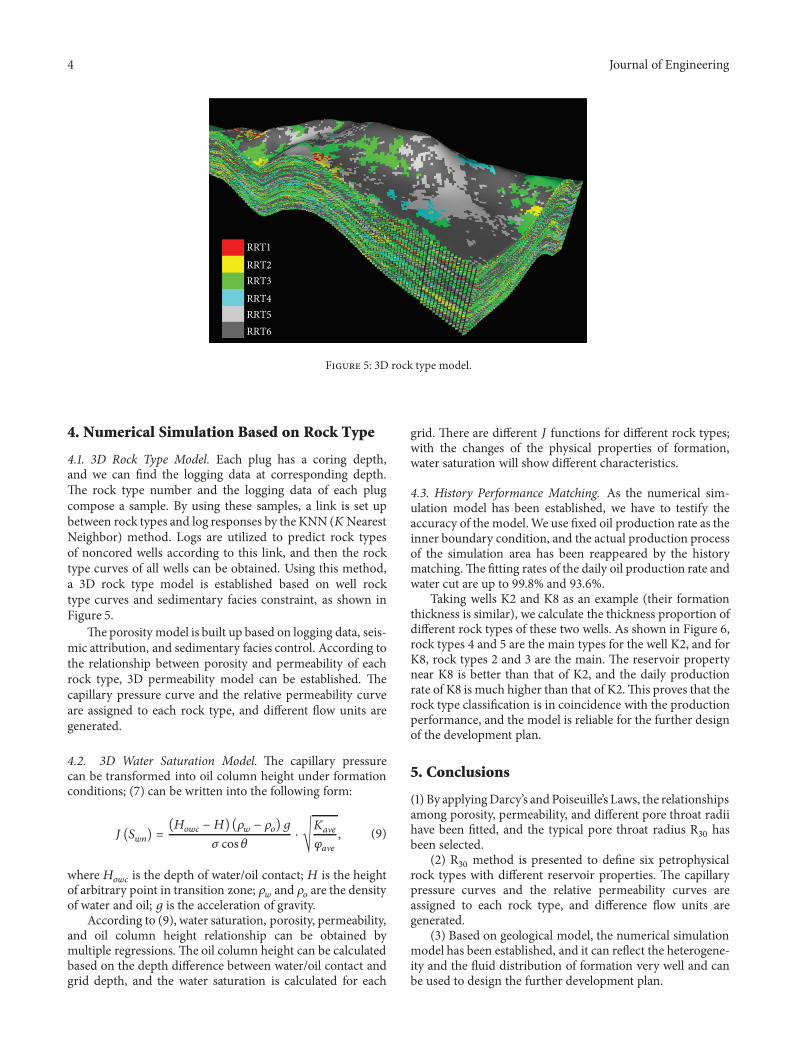
4.1. 3D Rock Type Model. Each plug has a coring depth,and we can find the logging data at corresponding depth.The rock type number and the logging data of each plugcompose a sample. By using these samples, a link is set upbetween rock types and log responses by the KNN (𝐾NearestNeighbor) method. Logs are utilized to predict rock typesof noncored wells according to this link, and then the rocktype curves of all wells can be obtained. Using this method,a 3D rock type model is established based on well rocktype curves and sedimentary facies constraint, as shown inFigure 5.
The porosity model is built up based on logging data, seis-mic attribution, and sedimentary facies control. According tothe relationship between porosity and permeability of eachrock type, 3D permeability model can be established. Thecapillary pressure curve and the relative permeability curveare assigned to each rock type, and different flow units aregenerated.
4.2. 3D Water Saturation Model. The capillary pressurecan be transformed into oil column height under formationconditions; (7) can be written into the following form:
𝐽 (𝑆𝑤𝑛) = (𝐻𝑜𝑤𝑐 − 𝐻) (𝜌𝑤 − 𝜌𝑜) 𝑔𝜎 cos 𝜃 ⋅ √𝐾𝑎V𝑒𝜑𝑎V𝑒 , (9)
where𝐻𝑜𝑤𝑐 is the depth of water/oil contact; 𝐻 is the heightof arbitrary point in transition zone; 𝜌𝑤 and 𝜌𝑜 are the densityof water and oil; 𝑔 is the acceleration of gravity.
According to (9), water saturation, porosity, permeability,and oil column height relationship can be obtained bymultiple regressions. The oil column height can be calculatedbased on the depth difference between water/oil contact andgrid depth, and the water saturation is calculated for each
grid. There are different 𝐽 functions for different rock types;with the changes of the physical properties of formation,water saturation will show different characteristics.
4.3. History Performance Matching. As the numerical sim-ulation model has been established, we have to testify theaccuracy of the model.We use fixed oil production rate as theinner boundary condition, and the actual production processof the simulation area has been reappeared by the historymatching.The fitting rates of the daily oil production rate andwater cut are up to 99.8% and 93.6%.
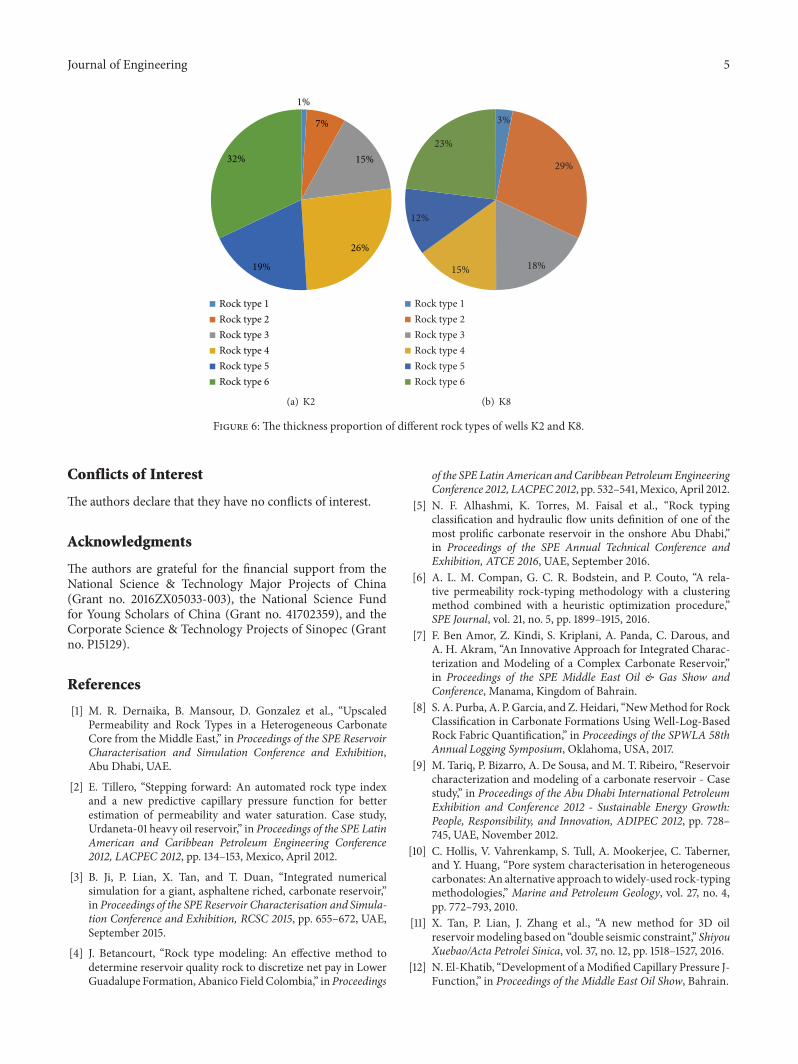
Taking wells K2 and K8 as an example (their formationthickness is similar), we calculate the thickness proportion ofdifferent rock types of these two wells. As shown in Figure 6,rock types 4 and 5 are the main types for the well K2, and forK8, rock types 2 and 3 are the main. The reservoir propertynear K8 is better than that of K2, and the daily productionrate of K8 is much higher than that of K2.This proves that therock type classification is in coincidence with the productionperformance, and the model is reliable for the further designof the development plan.
5. Conclusions
(1) By applyingDarcy’s andPoiseuille’s Laws, the relationshipsamong porosity, permeability, and different pore throat radiihave been fitted, and the typical pore throat radius R30 hasbeen selected.
(2) R30 method is presented to define six petrophysicalrock types with different reservoir properties. The capillarypressure curves and the relative permeability curves areassigned to each rock type, and difference flow units aregenerated.
(3) Based on geological model, the numerical simulationmodel has been established, and it can reflect the heterogene-ity and the fluid distribution of formation very well and canbe used to design the further development plan.
Journal of Engineering 5
1%
7%
15%
26%
19%
32%
Rock type 1Rock type 2Rock type 3Rock type 4Rock type 5Rock type 6
(a) K2
3%
29%
18%15%
12%
23%
Rock type 1Rock type 2Rock type 3Rock type 4Rock type 5Rock type 6
(b) K8
Figure 6: The thickness proportion of different rock types of wells K2 and K8.
Conflicts of Interest
The authors declare that they have no conflicts of interest.
Acknowledgments
The authors are grateful for the financial support from theNational Science & Technology Major Projects of China(Grant no. 2016ZX05033-003), the National Science Fundfor Young Scholars of China (Grant no. 41702359), and theCorporate Science & Technology Projects of Sinopec (Grantno. P15129).
References
[1] M. R. Dernaika, B. Mansour, D. Gonzalez et al., “UpscaledPermeability and Rock Types in a Heterogeneous CarbonateCore from the Middle East,” in Proceedings of the SPE ReservoirCharacterisation and Simulation Conference and Exhibition,Abu Dhabi, UAE.
[2] E. Tillero, “Stepping forward: An automated rock type indexand a new predictive capillary pressure function for betterestimation of permeability and water saturation. Case study,Urdaneta-01 heavy oil reservoir,” in Proceedings of the SPE LatinAmerican and Caribbean Petroleum Engineering Conference2012, LACPEC 2012, pp. 134–153, Mexico, April 2012.
[3] B. Ji, P. Lian, X. Tan, and T. Duan, “Integrated numericalsimulation for a giant, asphaltene riched, carbonate reservoir,”in Proceedings of the SPE Reservoir Characterisation and Simula-tion Conference and Exhibition, RCSC 2015, pp. 655–672, UAE,September 2015.
[4] J. Betancourt, “Rock type modeling: An effective method todetermine reservoir quality rock to discretize net pay in LowerGuadalupe Formation, Abanico FieldColombia,” inProceedings
of the SPE Latin American andCaribbean PetroleumEngineeringConference 2012, LACPEC2012, pp. 532–541,Mexico, April 2012.
[5] N. F. Alhashmi, K. Torres, M. Faisal et al., “Rock typingclassification and hydraulic flow units definition of one of themost prolific carbonate reservoir in the onshore Abu Dhabi,”in Proceedings of the SPE Annual Technical Conference andExhibition, ATCE 2016, UAE, September 2016.
[6] A. L. M. Compan, G. C. R. Bodstein, and P. Couto, “A rela-tive permeability rock-typing methodology with a clusteringmethod combined with a heuristic optimization procedure,”SPE Journal, vol. 21, no. 5, pp. 1899–1915, 2016.
[7] F. Ben Amor, Z. Kindi, S. Kriplani, A. Panda, C. Darous, andA. H. Akram, “An Innovative Approach for Integrated Charac-terization and Modeling of a Complex Carbonate Reservoir,”in Proceedings of the SPE Middle East Oil & Gas Show andConference, Manama, Kingdom of Bahrain.
[8] S. A. Purba, A. P. Garcia, and Z. Heidari, “NewMethod for RockClassification in Carbonate Formations Using Well-Log-BasedRock Fabric Quantification,” in Proceedings of the SPWLA 58thAnnual Logging Symposium, Oklahoma, USA, 2017.
[9] M. Tariq, P. Bizarro, A. De Sousa, andM. T. Ribeiro, “Reservoircharacterization and modeling of a carbonate reservoir - Casestudy,” in Proceedings of the Abu Dhabi International PetroleumExhibition and Conference 2012 - Sustainable Energy Growth:People, Responsibility, and Innovation, ADIPEC 2012, pp. 728–745, UAE, November 2012.
[10] C. Hollis, V. Vahrenkamp, S. Tull, A. Mookerjee, C. Taberner,and Y. Huang, “Pore system characterisation in heterogeneouscarbonates: An alternative approach towidely-used rock-typingmethodologies,” Marine and Petroleum Geology, vol. 27, no. 4,pp. 772–793, 2010.
[11] X. Tan, P. Lian, J. Zhang et al., “A new method for 3D oilreservoirmodeling based on “double seismic constraint,” ShiyouXuebao/Acta Petrolei Sinica, vol. 37, no. 12, pp. 1518–1527, 2016.
[12] N. El-Khatib, “Development of aModified Capillary Pressure J-Function,” in Proceedings of the Middle East Oil Show, Bahrain.

6 Journal of Engineering
[13] H. Saboorian Jooybari, G. H. Mowazi, and S. R. Jaberi, “A newappoach for rock typing used in one of the Iranian carbonatereservoir (a case study),” in Proceedings of the International OilandGas Conference and Exhibition in China 2010:Opportunitiesand Challenges in a Volatile Environment, IOGCEC, pp. 2626–2635, China, June 2010.
[14] S. Kolodzie, “Analysis of pore throat size and use of theWaxman-Smits equation to determine OOIP in Spindle field.Colorado,” Society of Petroleum Engineers of AIME, (Paper) SPE,2017.
[15] J. O. Amaefule, M. Altunbay, D. Tiab, D. G. Kersey, and D. K.Keelan, “Enhanced reservoir description: using core and logdata to identify hydraulic (flow) units and predict permeabilityin uncored intervals/wells,” in Proceedings of the SPE AnnualTechnical Conference and Exhibition. Part 2(of 5), pp. 205–220,October 1993.
[16] M. Abbaszadeh, H. Fujii, and F. Fujimoto, “Permeability pre-diction by hydraulic flow units - Theory and applications,” SPEFormation Evaluation, vol. 11, no. 4, pp. 263–271, 1996.
[17] D.G.Hatzignatiou, Y. Zhou, and J.O.Helland, “A dimensionlesscapillary pressure function for imbibition derived from pore-scale modeling in mixed-wet rock images,” in Proceedings of theSPE Improved Oil Recovery Symposium, Tulsa, Oklahoma, USA.
[18] O. Jin, I. Saeed, F. Mohammad, P. Tian, I. Mostafa, and M. A.Chughtai, “Dynamic rock typing study of a complex heteroge-neous carbonate reservoir in oil field, Iraq,” in Proceedings of theAbu Dhabi International Petroleum Exhibition and Conference,ADIPEC 2016, UAE, November 2016.

International Journal of
AerospaceEngineeringHindawiwww.hindawi.com Volume 2018
RoboticsJournal of
Hindawiwww.hindawi.com Volume 2018
Hindawiwww.hindawi.com Volume 2018
Active and Passive Electronic Components
VLSI Design
Hindawiwww.hindawi.com Volume 2018
Hindawiwww.hindawi.com Volume 2018
Shock and Vibration
Hindawiwww.hindawi.com Volume 2018
Civil EngineeringAdvances in
Acoustics and VibrationAdvances in
Hindawiwww.hindawi.com Volume 2018
Hindawiwww.hindawi.com Volume 2018
Electrical and Computer Engineering
Journal of
Advances inOptoElectronics
Hindawiwww.hindawi.com
Volume 2018
Hindawi Publishing Corporation http://www.hindawi.com Volume 2013Hindawiwww.hindawi.com
The Scientific World Journal
Volume 2018
Control Scienceand Engineering
Journal of
Hindawiwww.hindawi.com Volume 2018
Hindawiwww.hindawi.com
Journal ofEngineeringVolume 2018
SensorsJournal of
Hindawiwww.hindawi.com Volume 2018
International Journal of
RotatingMachinery
Hindawiwww.hindawi.com Volume 2018
Modelling &Simulationin EngineeringHindawiwww.hindawi.com Volume 2018
Hindawiwww.hindawi.com Volume 2018
Chemical EngineeringInternational Journal of Antennas and
Propagation
International Journal of
Hindawiwww.hindawi.com Volume 2018
Hindawiwww.hindawi.com Volume 2018
Navigation and Observation
International Journal of
Hindawi
www.hindawi.com Volume 2018
Advances in
Multimedia
Submit your manuscripts atwww.hindawi.com
Related Documents