NUMERICAL MODELLING OF BUBBLY FLOWS IN NANOFLUIDS WITH AND WITHOUT HEAT TRANSFER A thesis submitted in fulfilment of the requirements for the degree of Doctor of Philosophy Yang Yuan Bachelor of Engineering (North China Electric Power University) School of Engineering College of Science, Engineering and Health RMIT University June 2017

Welcome message from author
This document is posted to help you gain knowledge. Please leave a comment to let me know what you think about it! Share it to your friends and learn new things together.
Transcript

NUMERICAL MODELLING OF BUBBLY
FLOWS IN NANOFLUIDS WITH AND
WITHOUT HEAT TRANSFER
A thesis submitted in fulfilment of the requirements for the degree of Doctor of Philosophy
Yang Yuan
Bachelor of Engineering (North China Electric Power University)
School of Engineering
College of Science, Engineering and Health
RMIT University
June 2017

I
Declaration
I certify that except where due acknowledgement has been made, the work is that of the
author alone; the work has not been submitted previously, in whole or in part, to qualify
for any other academic award; the content of the thesis is the result of work which has
been carried out since the official commencement data of the approval research
program; and, any editorial work, paid or unpaid, carried out by a third party is
acknowledged; and, ethics procedures and guidelines have been followed.
Yang Yuan
School of Engineering, RMIT University
25th
June, 2017

II
Acknowledgements
First and foremost, I would like to express my deepest gratitude to my supervisor Prof
Jiyuan Tu for the continuous support of my PhD study and research, and for his
patience, motivation, enthusiasm, and immense knowledge. His guidance helped me in
all the time of research and writing of this thesis.
I would particularly thank my secondary supervisor Dr Xiangdong Li for his
patient guidance, encouragement and useful suggestions on CFD analysis and
FORTRAN coding. He has always supported me academically through the rough road
to finish this thesis.
I also appreciate the financial support of RMIT University for the scholarship to
provide me the provision of PhD study.
My sincere gratitude is also extended to all of my brilliant colleagues in the CFD-
Group. I would also like to acknowledge the company from my dear friends Lin, Nan,
Yidan, Yihuan, Jiawei, Xiang and Zhan. I will always remember all the joyful moments
and comfort in difficult times.
Last but not least, I would like to thank my parents for giving birth to me at the
first place and supporting me spiritually throughout my life.
III
Publication during Candidature
Peer Reviewed Journal Publications:
1. Li, X. D., Yuan, Y., and Tu, J. Y. (2015). A parameter study of the heat flux
partitioning model for nucleate boiling of nanofluids. International Journal of
Thermal Sciences, 98: 42-50, incorporated in Chapter 3.
DOI: 10.1016/j.ijthermalsci.2015.06.020, IF=3.615
2. Li, X. D., Yuan, Y., and Tu, J. Y. (2015). A theoretical model for nucleate
boiling of nanofluids considering the nanoparticle Brownian motion in the
liquid microlayer. International Journal of Heat and Mass Transfer, 91: 467-
476, incorporated in Chapter 3.
DOI: 10.1016/j.ijheatmasstransfer.2015.07.116, IF=3.458
3. Yuan, Y., Li, X. D., and Tu, J. Y. (2015). Numerical investigation of nucleate
boiling parameters in heat flux partitioning model for nanofluids. Journal of
Tsinghua University (science and technology), 55(7): 815-820, incorporated in
Chapter 3.
DOI: 10.16511/j.cnki.qhdxxb.2015.07.018
4. Li, X. D., Yuan, Y., and Tu, J. Y. (2016). Modelling and critical analysis of
bubbly flow of dilute nanofluids in a vertical tube. Nuclear Engineering and
Design, 300: 173-180, incorporated in Chapter 4.
DOI: 10.1016/j.nucengdes.2016.01.024, IF=1.142
5. Yuan, Y., Li, X. D., and Tu, J. Y. (2016). Numerical modelling of air-nanofluid
bubbly flows in a vertical tube using the Mutiple-Size-Group (MUSIG) model.
International Journal of Heat and Mass Transfer, 102: 856-866, incorporated in
Chapter 4.
DOI: 10.1016/j.ijheatmasstransfer.2016.06.021, IF=3.458

IV
6. Yuan, Y., Li, X. D., and Tu, J. Y. (2017). The effects of nanoparticles on the
lift force and drag force on bubbles in nanofluids: A two-fluid model study‘.
International Journal of Thermal Sciences, 119: 1-8, incorporated in Chapter 5.
DOI: 10.1016/j.ijthermalsci.2017.05.018, IF=3.615
7. Yuan, Y., Li, X. D., and Tu, J. Y. (2017). Effects of spontaneous nanoparticle
adsorption on the bubble-liquid and bubble-bubble interactions in multi-
dispersed bubbly systems – A review. International Journal of Heat and Mass
Transfer, (accepted), incorporated in Chapter 5.
Conference Publications:
1. Yuan, Y., Li, X. D., and Tu, J. Y. (2014). A Mechanistic Model for heat
transfer of nucleate boiling in nanofluids. The 2014 Conference of Chinese
Society of Engineering Thermophysics (Multiphase Flow), 25-28 Oct, Xi‘an,
China
2. Yuan, Y., Li, X. D., and Tu, J. Y. (2015). A new heat flux partitioning model
for nucleate boiling of dilute nanofluids. The 9th
International Conference on
Boiling and Condensation Heat Transfer, 26-30 April, Boulder, CO, USA
3. Yuan, Y., Li, X. D., and Tu, J. Y. (2015). A parameter study of the two-fluid
model for air-nanofluids bubbly flows. The 2015 Conference of Chinese Society
of Engineering Thermophysics (Multiphase Flow), 11-13 Nov, Nanjing, China
4. Li, X. D., Yuan, Y., and Tu, J. Y. (2016). Two-fluid modelling of bubbly flows
of nanofluids. 2016 International Conference on Mechatronics and Mechanical
Engineering, Shanghai, 21-23 Oct, Shanghai, China
5. Yuan, Y., Li, X. D., and Tu, J. Y. (2017). Towards a CFD model of air-
nanofluid multi-dispersed bubbly flow in a vertical tube, The 2nd
Thermal and
Fluid Engineering Conference, 2-5 April, Las Vegas, NV, USA

V
Abstract
Nanofluids are engineered colloidal dispersions of nano-scale particles (nanoparticles
hereafter) in water, or other base liquids. This thesis focuses on the bubbly flows in
nanofluids with and without heat transfer. For the former, the nucleate boiling of dilute
nanofluids (≤0.01 vol%) in cylindrical containers are investigated numerically. For the
latter, the two-phase flows of dilute nanofluids in vertical tubes are numerically studied.
Dilute nanofluids exhibits largely improved heat transfer performances during both
pool and flow boiling, whilst being compared with corresponding pure liquid, and these
properties make nanofluid suitable as a heat transfer medium in a stream of equipment
dealing with extremely high heat flux and needing high cooling efficiency. Despite the
many advantages, the use of nanofluid in industry is still limited. Two major research
gaps remain between the preliminary studies and industry applications. One is the
difficulty to accurately describe the boiling heat transfer and efficiently predict the
relevant heat transfer coefficient (HTC). Because of the inherent complexity, this
requires an in-depth understanding of the heated surface characteristics and bubble
hydrodynamics in the near-wall region, for both pool and flow boiling. Beyond that, for
flow boiling of nanofluids, the heat transfer is closely related to the two-phase flow
structures, which needs particular attention. However, to the best of the author‘s
knowledge, relevant numerical and mechanistic studies are still absent in the open
literature. The lack of studies in two-phase flow structures and dynamics is another gap
which makes the prospect of nanofluid‘s application in industry much gloomier.
Recently, with rapid development of computer technology and computational algorithm,
Computational Fluid Dynamics (CFD) provides a powerful numerical approach to
conduct simulation on gas-nanofluid bubbly flows, and further explore the underlying
mechanism behind.
The main body of this thesis is composed of four parts. In the first part (Chapter 2), a
comprehensive literature review, including fundamentals of pool and flow boiling,
experimental studies of dilute nanofluids and preliminary numerical modelling of two-
phase gas-liquid bubbly flows, was performed to identify the research gaps between
VI
previous studies and numerical modelling of dilute nanofluids. In the second part
(Chapter 3), a parametric study of the heat flux partitioning (HFP) model for nucleate
boiling of nanofluids was conducted with the consideration of the effects of
nanoparticle deposition on the heated surface characteristics and bubble behaviours in
the near-wall region. Moreover, a new HFP model was proposed, in which a new heat
flux component was incorporated to account for the heat transfer by the nanoparticle
Brownian motion in microlayer. In the third part (Chapter 4), the flow structures and
dynamics of two-phase flows of dilute nanofluids were investigated with the two-fluid
model and MUtiple-SIze-Group (MUSIG) model, respectively. In order to identify the
individual factors affecting the hydrodynamic behaviours, the heat transfer was not
considered. The simulation results showed that both of the above two models need
substantial improvement in order to achieve an effective modelling of nanofluids. In the
fourth part (Chapter 5), mechanistic studies on the role that nanoparticles have played
in affecting the bubble-liquid and bubble-bubble interactions were conducted to clarify
the theoretical frame which could be used to develop predictive models for two-phase
gas-liquid flows containing nanoparticles.
In summary, the effects of nanoparticles on boiling heat transfer and flow structures in
gas-nanofluid bubbly flows were investigated with and without heat transfer,
respectively, and the preliminary heat flux partitioning (HFP) model, two-fluid model
as well as the MUSIG model were further developed accordingly. Numerical results
were compared with experimental data, which validated the feasibility of new models
in simulating nanofluids.

VII
Contents
1 Introduction ................................................................................................................... 1
1.1 Background and Motivation ................................................................................... 1
1.1.1 Thermo-physical Properties ............................................................................. 2
1.1.2 Single-phase Convective Heat Transfer .......................................................... 3
1.1.3 Boiling Heat Transfer ...................................................................................... 4
1.2 Objectives ............................................................................................................... 6
1.3 Thesis Outline ........................................................................................................ 7
2 Literature Review ......................................................................................................... 9
2.1 Overview of Boiling Heat Transfer ........................................................................ 9
2.1.1 Pool Boiling ..................................................................................................... 9
2.1.2 Flow Boiling .................................................................................................. 12
2.2 Experimental Findings of Nucleate Boiling of Nanofluids .................................. 14
2.2.1 Pool Boiling Heat Transfer ............................................................................ 14
2.2.1.1 Enhancement ........................................................................................... 16
2.2.1.2 Deterioration ........................................................................................... 17
2.2.1.3 Both Enhancement/Deterioration ........................................................... 18
2.2.2 Influencing Factors ........................................................................................ 19
2.2.2.1 Thermo-physical Properties .................................................................... 20
2.2.2.2 Characteristics of the Heated Surface ..................................................... 22
2.2.2.3 Near Surface Hydrodynamics ................................................................. 28
2.2.2.4 Bulk Field Hydrodynamics ..................................................................... 34
2.3 Numerical Modelling of Gas-liquid Flows .......................................................... 37
2.3.1 Numerical Modelling of Boiling Heat Transfer ............................................ 37
2.3.1.1 Heat Flux Components ........................................................................... 37
2.3.1.2 Boiling Parameters .................................................................................. 38
2.3.2 Numerical Modelling of Bulk Flow .............................................................. 41
2.3.2.1 Two-fluid Model ..................................................................................... 41
VIII
2.3.2.2 MUtiple-SIze-Group (MUSIG) Model ................................................... 45
2.3.3 Main Challenges in Modelling Bubbly Systems of Nanofluids .................... 49
3 Numerical Modelling of Boiling Heat Transfer in Dilute Nanofluids ........................ 51
3.1 A Parametric Study of the Heat Flux Partitioning Model for Nucleate Boiling of
Nanofluids .................................................................................................................. 52
3.1.1 Introduction ................................................................................................... 52
3.1.2 The Heat Flux Partitioning (HFP) Model ...................................................... 54
3.1.2.1 The Active Site Density .......................................................................... 55
3.1.2.2 Other Nucleate Boiling Parameters ........................................................ 59
3.1.3 Numerical procedures .................................................................................... 61
3.1.4 Results and Discussion .................................................................................. 63
3.1.4.1 Comparison against experimental data ................................................... 63
3.1.4.2 Prediction of pool boiling experimental data of aqueous-oxide nanofluids
............................................................................................................................ 66
3.1.4.3 Further Discussion .................................................................................. 68
3.1.5 Conclusions ................................................................................................... 70
3.2 A Theoretical Model Considering the Nanoparticle Brownian Motion in Liquid
Microlayer .................................................................................................................. 72
3.2.1 Introduction ................................................................................................... 72
3.2.2 Heat Flux Partitioning in Nucleate Boiling of Nanofluids ............................ 75
3.2.2.1 Heat Flux Partitioning in Boiling Nanofluids ......................................... 75
3.2.2.2 Heat Transfer by Nanoparticle Brownian Motion in the Microlayer ..... 78
3.2.3 Results and Discussion .................................................................................. 84
3.2.3.1 Model Validation and Analysis of HFP Components ............................ 84
3.2.3.2 Analyses of the Influencing Parameters ................................................. 88
3.2.4 Conclusions ................................................................................................... 93
4 Numerical Modelling of Two-phase Flows of Dilute Nanofluids .............................. 94
4.1 Two-fluid Modelling of Air-nanofluid Bubbly Flows ......................................... 95
4.1.1 Introduction ................................................................................................... 95
4.1.2 Modelling of Bubbly Flow in a Vertical Tube .............................................. 98

IX
4.1.2.1 The Two-fluid Model .............................................................................. 98
4.1.2.2 Numerical Procedures ........................................................................... 100
4.1.3 Results and Discussion ................................................................................ 101
4.1.3.1 Model Applicability to Water and Nanofluid ....................................... 101
4.1.3.2 Model Improvement for Air-nanofluid Bubbly Flows ......................... 106
4.1.3.3 Effects of Nanoparticles on the Interfacial Behaviours ........................ 110
4.1.4 Conclusions ................................................................................................. 112
4.2 MUltiple-SIze-Group (MUSIG) Modelling of Air-nanofluid Bubbly Flows in a
Vertical Tube ............................................................................................................ 114
4.2.1 Introduction ................................................................................................. 114
4.2.2 The MUSIG Model ...................................................................................... 116
4.2.2.1 The Flow Equations .............................................................................. 116
4.2.2.2 Population Balance Method .................................................................. 118
4.2.3 Numerical Procedure ................................................................................... 121
4.2.4 Results and Discussion ................................................................................ 123
4.2.4.1 Comparison of simulation results against experimental data ............... 123
4.2.4.2 Model Improvement for the effects of nanoparticle self-assembly ...... 125
4.2.4.3 Effects of Nnaoparticle Self-assembly on Liquid Film Drainage ......... 133
4.2.5 Conclusions ................................................................................................. 137
5 Mechanistic Study of Bubble Hydrodynamics in Nanofluids .................................. 138
5.1 Mechanistic Analysis of the Effects of Nanoparticles on Interfacial Forces on
Bubbles in Nanofluids .............................................................................................. 139
5.1.1 Introduction ................................................................................................. 139
5.1.2 Theoretical Models ...................................................................................... 141
5.1.3 Results and Discussion ................................................................................ 145
5.1.3.1 Comparison of the Numerical Results against Experimental Data ....... 145
5.1.3.2 The adsorption of nanoparticles on air-water interface ........................ 146
5.1.3.3 Analysis of the Lift Force ..................................................................... 148
5.1.3.4 Analysis of the Drag Force ................................................................... 153
5.1.3.5 Summary and Key Research Points ...................................................... 155

X
5.1.4 Conclusions ................................................................................................. 157
5.2 Effects of Spontaneous Nanoparticle Adsorption on the Bubble-liquid and
Bubble-bubble Interaction ........................................................................................ 158
5.2.1 Introduction ................................................................................................. 158
5.2.2 Nanoparticle Adsorption at Phase Interfaces .............................................. 160
5.2.3 The Influences of Nanoparticles on Bubble-liquid Interactions .................. 162
5.2.3.1 Bubble-liquid Interaction ...................................................................... 162
5.2.3.2 The Lift Force ....................................................................................... 164
5.2.3.3 The Drag Force ..................................................................................... 171
5.2.4 The Influences of Nanoparticles on Bubble-bubble Interactions ................ 176
5.2.4.1 Bubble-bubble Interaction .................................................................... 176
5.2.4.2 Thinning Process ................................................................................... 179
5.2.4.3 Rupture Process .................................................................................... 186
5.2.5 Summary ...................................................................................................... 189
6 Conclusions ............................................................................................................... 190
Bibliography ................................................................................................................ 194
XI
List of Figures
Figure 2. 1: Electrical and thermal heating (Naterer, 2002) .......................................... 10
Figure 2. 2: Nukiyama‘s boiling curve (Nukiyama, 1966). ........................................... 10
Figure 2. 3: Bubble grow and departure on an active site (Li et al., 2014a). ................. 11
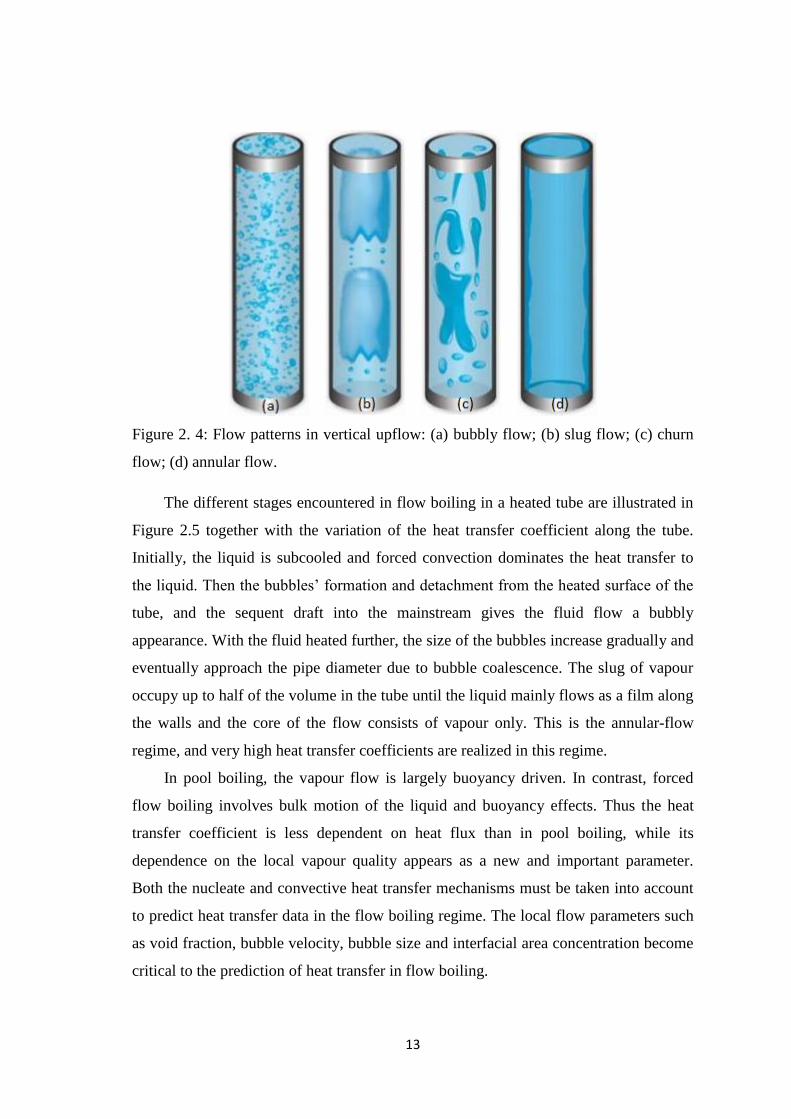
Figure 2. 4: Flow patterns in vertical upflow: (a) bubbly flow; (b) slug flow; (c) churn
flow; (d) annular flow. ................................................................................................... 13
Figure 2. 5: Two-phase flow regimes in vertical pipe flow (Naterer, 2002). ................ 14
Figure 2. 6: Boiling curve of nanofluids on: (a) smooth heater surface (Ra=0.4μm); (b)
roughened heater surface (Ra =1.15μm) (Das et al., 2003a). ......................................... 15
Figure 2. 7: Boiling curve of pure water and Al2O3/water nanofluids (0.001g/l to
0.05g/l) (You et al., 2003). ............................................................................................. 16
Figure 2. 8: Comparative boiling experiments on the smooth surface (Wen et al., 2011).
....................................................................................................................................... 17
Figure 2. 9: Thermal conductivity enhancement of nanofluids as a function of
temperature (Das et al., 2003a). ..................................................................................... 21
Figure 2. 10: Surface roughness of the smoother heater surface: (a) before boiling; (b)
after boiling with nanofluids (Das et al., 2003a). .......................................................... 22
Figure 2. 11: Surface roughness of: (a) clear heater (Ra=37.2 nm); (b) heater submerged
in 0.5 vol% alumina nanofluids (Ra=67.6 nm); (c) in 4 vol% alumina nanofluid
(Ra=227.7 nm) (Bang and Chang, 2005). ...................................................................... 23
Figure 2. 12: Nanoparticle-coated heaters generated by pool boiling experiments of
0.01 vol% nanofluids: (a) TiO2 nanoparticle-coated NiCr wire; (b) Al2O3 nanoparticle-
coated NiCr wire; (c) TiO2 nanoparticle-coated Ti wire (Kim et al., 2006a). ............... 24
Figure 2. 13: Scanning electron microscope images of stainless steel surface boiling in:
(a) pure water; (b) 0.01 vol% Al2O3 nanofluid; (c) 0.01vol% ZrO2 nanofluid; and (d)
0.01 vol% SiO2 nanofluid (Kim et al., 2006b). .............................................................. 24
Figure 2. 14: On surface boiled in pure water: (a) pure water droplet; (b) 0.01 vol%
Al2O3 nanofluid droplet; on surface boiled in 0.01 vol% Al2O3 nanofluid: (c) pure
water droplet; and (d) 0.01 vol% Al2O3 nanofluid droplet (Kim et al., 2006b). ........... 24
Figure 2. 15: Photograph of pool boiling of pure water at 1900 kW/m2 (CHF) on a TiO2
nanoparticle-coated wire with 0.01 vol% nanoparticle concentration (Kim and Kim,
2009). ............................................................................................................................. 25
Figure 2. 16: Dependency of the maximum capillary wicking height of TiO2
nanoparticle-coated wires on the particle concentration (Kim and Kim, 2009). ........... 26
Figure 2. 17: Boiling curves of pure water on nanoparticle-deposited surfaces (Ahmed
and Hamed, 2012). ......................................................................................................... 27
Figure 2. 18: Effect of surface roughness and particle size on boiling heat transfer
(Narayan et al., 2007). ................................................................................................... 27

XII
Figure 2. 19: Effects of the surface wettability on the heat transfer coefficient (Phan et
al., 2009). ....................................................................................................................... 28
Figure 2. 20: Nucleate boiling of pure water (left) and 0.01 vol% Al2O3 nanofluid (right)
at the same heat flux on an electrically heated 0.25 mm diameter stainless steel wire
(Kim et al., 2006b). ........................................................................................................ 29
Figure 2. 21: Active nucleation site density versus heat flux for contact angles from 18°
to 90° (Wang and Dhir, 1993). ...................................................................................... 29
Figure 2. 22: High speed camera images of a boiling bubble and corresponding liquid-
vapour phase boundary, temperature, and heat flux distribution at the boiling surface in
nanofluids (Jung and Kim, 2014). ................................................................................. 30
Figure 2. 23: Time evolution of the microlayer geometry beneath a growing bubble
(Jung and Kim, 2014). ................................................................................................... 31
Figure 2. 24: Bubble geometries including the microlayer and dry spot during the
bubble growth period (Jung and Kim, 2014). ................................................................ 31
Figure 2. 25: Evolution of grow time as a function of contact angle (Phan et al., 2009).
....................................................................................................................................... 32
Figure 2. 26: Bubbles departing from the wire heater immersed in: (a) pure water; (b)
Al2O3/water nanofluid (0.025 g/l) (You et al., 2003). ................................................... 33
Figure 2. 27: Bubble departure on heater surfaces with various wettability (Phan et al.,
2009). ............................................................................................................................. 33
Figure 2. 28: Bubble departure frequency versus contact angle (Phan et al., 2009). .... 33
Figure 2. 29: Average full-field velocity profile for pool boiling of: (a) pure water; (b)
Al2O3/water nanofluid (0.002 vol%) (Dominguez-Ontiveros et al., 2010). .................. 34
Figure 2. 30: Effect of (a) nanoparticle concentration; and (b) heat flux on void fraction
(Rana et al., 2014). ......................................................................................................... 35
Figure 2. 31: Comparisons of the flow pattern transitions among nitrogen-nanofluid,
nitrogen-water/SDBS mixture and nitrogen-water (Wang and Bao, 2009). .................. 36
Figure 2. 32: Comparison of the local two-phase flow parameters: (a) void fraction; (b)
bubble velocity; (d) IAC; and (d) mean bubble diameter in the bubbly flow regime
(Park and Chang, 2011). ................................................................................................ 36
Figure 3. 1: Comparison of the Ganapathy-Sajith correlation (Ganapathy and Sajith,
2013) against experimental data (Gerardi et al., 2011): (a) effect of the liquid contact
angle; (b) effect of nanoparticle size. ............................................................................. 58
Figure 3. 2: The computational domain. ........................................................................ 62
Figure 3. 3: Comparison of active site density prediction against experimental data
(Gerardi et al., 2011). ..................................................................................................... 63
Figure 3. 4: Bubble departure diameter as a function of the wall superheat. ................ 65
Figure 3. 5: Comparison of bubble departure correlations against experimental data
(Gerardi et al., 2011). ..................................................................................................... 65
XIII
Figure 3. 6: Predicted wall superheat vs. experimental data (Gerardi et al., 2011). ...... 66
Figure 3. 7: Comparison of predicted boiling curves against experimental data. ......... 67
Figure 3. 8: Effects of liquid contact angle, particle size and nanoparticle material on
bubble nucleation. .......................................................................................................... 70
Figure 3. 9: Nanoparticle concentrating in microlayer as bubble grows. ...................... 74
Figure 3. 10: Bubble departure diameter as a function of the wall superheat. .............. 77
Figure 3. 11: Evolution of the microlayer sizes as the bubble grows (Jung and Kim,
2014). ............................................................................................................................. 79
Figure 3. 12: Linear reduction of the microlayer thickness as bubble grows (Jung and
Kim, 2014): (a) movement of the microlayer surface; (b) reduction of the microlayer
thickness. ........................................................................................................................ 81
Figure 3. 13: Nanoparticle concentration in microlayer: (a) evolution of nanoparticle
concentration in the microlayer; (b) mean nanoparticle concentration in microlayer vs.
the bulk concentration. ................................................................................................... 83
Figure 3. 14: The equivalent thermal conductivity of nanoparticle Brownian motion. . 84
Figure 3. 15: Prediction of the active site density. ......................................................... 85
Figure 3. 16: Comparison of predicted pool boiling curves against the experimental
data (Gerardi et al., 2011). ............................................................................................. 86
Figure 3. 17: Comparison of heat flux components by the models: (a) classic HFP
model; (b) new HFP model. ........................................................................................... 87
Figure 3. 18: Microlayer parameters vs. heat flux. ........................................................ 88
Figure 3. 19: Effects of the bulk concentration. (Note: SiO2/water, nanoparticle size 34
nm, surface roughness 100 nm). .................................................................................... 90
Figure 3. 20: Effects of the nanoparticle size. (Note: 0.1 vol% SiO2/water, surface
roughness 100 nm). ........................................................................................................ 90
Figure 3. 21: Effects of the nanoparticle material. (Note: 0.1 vol% nanofluids,
nanoparticle size 34 nm, surface roughness 100 nm) .................................................... 91
Figure 3. 22: Effects of the nanoparticle material on the quenching and evaporation
heat flux components. .................................................................................................... 92
Figure 4. 1: The computational domain and boundary conditions. ............................. 101
Figure 4. 2: Comparison the classic two-fluid model against the experimental data of
water: (a) void fraction; (b) bubble velocity (Park and Chang, 2011). ........................ 103
Figure 4. 3: Comparison the classic two-fluid model against the experimental data of
nanofluid: (a) void fraction; (b) bubble velocity (Park and Chang, 2011). ................. 104
Figure 4. 4: Prediction of the void fraction development along the tube using the TFM.
Note: Due to the large length-to-diameter ratio of the computational domain, the void
fraction contours were not shown in actual proportion. .............................................. 105

XIV
Figure 4. 5: Comparison of the Ishii-Zuber model (Ishii and Zuber, 1979) and Grace
model (Grace and Weber, 1982) for drag force modelling. ......................................... 107
Figure 4. 6: The drag coefficient calculated by the Ishii-Zuber model (Ishii and Zuber,
1979). ........................................................................................................................... 107
Figure 4. 7: The lift coefficient changes as a function of bubble size. ........................ 108
Figure 4. 8: The two-fluid model with different values CL values for the air-nanofluid
bubbly flow: (a) void fraction; (b) bubble velocity. .................................................... 109
Figure 4. 9: Fluorescence confocal microscope image of water droplets dispersed in
toluence, covered with CdSe nanoparticles (Lin et al., 2005). .................................... 111
Figure 4. 10: The computational domain. .................................................................... 122
Figure 4. 11: Comparison of predicted flow parameters against experimental data of the
air-water bubbly flow: (a) void fraction; (b) gas velocity; (c) IAC; (d) Sauter mean
bubble diameter (Park and Chang, 2011). ................................................................... 124
Figure 4. 12: Comparison of predicted flow parameters against experimental data of the
air-nanofluid bubbly flow: (a) void fraction; (b) gas velocity; (c) IAC; (d) Sauter mean
bubble diameter (Park and Chang, 2011). ................................................................... 125
Figure 4. 13: Transmission Electron Microscopy (TEM) image of air bubbles
surrounded by MAGSILICA@ H8 nanoparticles (Cp=20 mg/mL) in ethanol/water
mixture (Rodrigues et al., 2011). ................................................................................. 126
Figure 4. 14: The effect of contaminants: (a) ultra-pure liquid with free-slip boundary
condition; (b) slightly contaminated liquid with a limited circulation inside the bubble;
(c) fully contaminated bubble with no-slip boundary condition (Dijkhuizen et al.,
2010a). ......................................................................................................................... 127
Figure 4. 15: Comparison of predicted drag coefficients (ζ=0.065 N/m, αg=0.1). ..... 128
Figure 4. 16: Comparison of predicted flow parameters against experimental data of the
air-nanofluid bubbly flow: (a) void fraction; (b) gas velocity (Park and Chang, 2011).
..................................................................................................................................... 128
Figure 4. 17: Predicted void fraction of the air-nanofluid bubbly flow with CL=-0.025.
..................................................................................................................................... 129
Figure 4. 18: Comparison of predicted lift coefficients with different correlations of
bubble aspect ratio. ...................................................................................................... 130
Figure 4. 19: Predicted film drainage time of equal size bubbles (ε=0.65 m2/s
3)........ 131
Figure 4. 20: Predicted collision efficiency of equal size bubbles (ε=0.65 m2/s
3). ..... 132
Figure 4. 21: Comparison of predicted void fraction against experimental data of the
air-nanofluid bubbly flow (Park and Chang, 2011). .................................................... 133
Figure 4. 22: Comparison of predicted bubble size fraction when kd take the value of kd
=1.0~2.0. ...................................................................................................................... 133
Figure 4. 23: The surface tension gradient along the radial dimension of the liquid film.
..................................................................................................................................... 135

XV
Figure 4. 24: The electrostatic double layer force between two negative-charged
bubbles. ........................................................................................................................ 136
Figure 5. 1: Comparison of predicted bubble velocity and void fraction profile against
experimental data: (a) air-water bubbly flow; (b) air-nanofluid bubbly flow (Park and
Chang, 2011). ............................................................................................................... 145
Figure 5. 2: TEM image of air bubbles with MAGSILICA@ H8 nanoparticles
(Cp=10mg/mL) in ethanol/water mixtures (Rodrigues et al., 2011). ........................... 147
Figure 5. 3: The effect of contaminants: (a) ultra-pure liquid with free-slip boundary
condition; (b) slightly contaminated liquid with a limited circulation inside the bubble;
(c) fully contaminated bubble with no-slip boundary condition (Dijkhuizen et al.,
2010a). ......................................................................................................................... 148
Figure 5. 4: Lift force on a spherical bubble in pure liquids. ...................................... 149
Figure 5. 5: Lift forces on a deformed bubble in pure liquids. .................................... 150
Figure 5. 6: Lift forces on a nanoparticle-covered spherical bubble in nanofluids. .... 150
Figure 5. 7: Bubble lift coefficient versus bubble diameter. ....................................... 151
Figure 5. 8: Predicted bubble velocity and void fraction profile of air-nanofluid bubbly
flows with CL= -0.025: (a) Void fraction; (b) Bubble velocity. .................................. 152
Figure 5. 9: Comparison of predicted bubble velocity profiles using different drag
correlations. .................................................................................................................. 154
Figure 5. 10: Bubble drag coefficient versus bubble Reynolds number. ..................... 155
Figure 5. 11: (a) TEM image of air bubbles with MAGSILICA® H8 nanoparticles in
ethanol/water mixture (Rodrigues et al., 2011); (b) Fluorescence confocal microscope
image of the adsorbed CdSe nanoparticles at toluene/water interface (Lin et al., 2005).
..................................................................................................................................... 160
Figure 5. 12: Series of TEM images of 6 nm nanoparticle adsorption to the
toluene/water interface in different adsorption steps: (a) step 1; (b) step 2; (c) step 3
(Böker et al., 2007). ..................................................................................................... 161
Figure 5. 13: Flow field surrounding the bubble: (a) spherical bubbles in pure liquid; (b)
distorted bubbles in pure liquid; (c) spherical bubbles in nanoparticle-containing system.
..................................................................................................................................... 164
Figure 5. 14: The lift force acing on: (a) spherical bubbles in pure liquid; (b) distorted
bubbles in pure liquid. ................................................................................................. 165
Figure 5. 15: The predicted lift coefficient as a function of bubble diameter (Yuan et al.,
2017). ........................................................................................................................... 165
Figure 5. 16: Comparison of predicted flow parameters against experimental data of
bubbly flows containing nanoparticles with: (a) Tomiyama model (Equation 5.21); (b)
CL= -0.025 (Yuan et al., 2017). .................................................................................... 167
XVI
Figure 5. 17: Contributions of pressure CL,p and viscous stress CL,v to the total lift
coefficient acting on: (a) a contaminated bubble (Fukuta, Takagi et al., 2008); (b) a
rigid sphere (Kurose and Komori, 1999). .................................................................... 168
Figure 5. 18: The lift force acting on spherical bubbles in nanoparticle-containing
system. ......................................................................................................................... 171
Figure 5. 19: The predicted drag coefficient as a function of bubble Reynolds number
with Ishii-Zuber model (Ishii and Zuber, 1979). ......................................................... 172
Figure 5. 20: The effect of contaminants: (a) ultra-pure liquid with free-slip boundary
condition; (b) slightly contaminated liquid with a limited circulation inside the bubble;
(c) fully contaminated bubble with no-slip boundary condition (Dijkhuizen et al.,
2010a). ......................................................................................................................... 173
Figure 5. 21: Comparison of predicted bubble velocity against experimental data of
bubbly flows containing nanoparticles with different drag models (Yuan et al., 2017).
..................................................................................................................................... 174
Figure 5. 22: The predicted drag coefficient as a function of bubble Reynolds number
with different drag models (Yuan et al., 2017). ........................................................... 176
Figure 5. 23: Schematic overview of the coalescence process of two bubbles. .......... 177
Figure 5. 24: Comparison of predicted void fraction against experimental data of the
bubbly flows containing nanoparticles (Yuan et al., 2016). ........................................ 179
Figure 5. 25: Comparison of predicted bubble size fraction when kd takes the value of
kd=1.0-2.0 (Yuan et al., 2016). ..................................................................................... 179
Figure 5. 26: Drainage of a liquid film under capillary pressure (Rio and Biance, 2014).
..................................................................................................................................... 180
Figure 5. 27: The velocity profile of the liquid in the film with: (a) fully mobile
interfaces; (b) partially mobile interface; (c) fully immobile interfaces (Liao and Lucas,
2010). ........................................................................................................................... 181
Figure 5. 28: The geometry of the liquid film: (a) deformable surfaces; (b) non-
deformable surfaces (Liao and Lucas, 2010). .............................................................. 183
Figure 5. 29: Schematic overview of the liquid film with particles residing in (Hunter et
al., 2008). ..................................................................................................................... 183
Figure 5. 30: Electrostatic double layer force between two nanoparticle-adsorbed
bubble interfaces. ......................................................................................................... 185
Figure 5. 31: Corrugations of bubble interfaces: (a) Without the adsorption of
nanoparticles; (b) With the adsorption of nanoparticles (Rio and Biance, 2014). ....... 187

XVII
List of Tables
Table 2. 1 Comparison of thermo-physical properties between water and dilute
nanofluids (Kim, 2009) .................................................................................................. 21
Table 2. 2 Static contact angle for water and nanofluids on clean and fouled surfaces
(Kim et al., 2007). .......................................................................................................... 25
Table 3. 1 Physical properties of the nanoparticle materials and water. ....................... 69
Table 3. 2 Liquid contact angle on heater surfaces boiled in different nanofluids (Kim
et al., 2007). ................................................................................................................... 69
Table 3. 3 Physical Properties of the nanoparticle materials and water
(webbook.nist.gov). ....................................................................................................... 91
Table 5. 1 Employed physical properties for mathematical modelling. ...................... 144

XVIII
Nomenclature
cA
Heater surface area fraction subjected to convection
lgA
Interfacial area per unit volume
qA
Heater surface area fraction subjected to quenching
B Body force
BB Birth rate of bubble number density due to breakage
CB Birth rate of bubble number density due to coalescence
DC Drag coefficient
LC Lift coefficient
TDC Turbulent dispersion coefficient
1WC , 2WC Lubrication coefficient
c Solute concentration
fc Increase coefficient of surface area
,p lc
Liquid specific heat
BD Death rate of bubble number density due to breakage
CD Death rate of bubble number density due to coalescence
bd Sauter mean bubble diameter
bwd
Bubble departure diameter
crd Critical diameter
Hd Maximum bubble horizontal dimension

XIX
id Bubble diameter of the it group
npd
Nanoparticle diameter
E Bubble aspect ratio
Eo Eötvös number
*Eo Modified Eötvös number
DF Drag force
glF , lgF Interfacial force
LF Lift force
TDF Turbulent dispersion force
WF Wall lubrication force
f
Bubble departure frequency
if MUSIG volume fraction of the ith
group bubbles, (dimensionless)
g Gravitational acceleration
h Liquid film thickness
ch
Convective heat transfer coefficient
0h Initial film thickness
fh Critical film thickness
fgh
Latent heat of vaporization
lgh
Inter-phase heat transfer coefficient
dk Empirical constant in the bubble drainage time calculation
sk Empirical constant in the drag coefficient calculation
XX
L Thickness of the polymer layer
cL Capillary wicking height
N
Potential nucleation site density
aN
Active nucleation site density
in Bubble number density of the ith
group
Wn Outward vector normal to the wall surface
p The system pressure
q Total heat flux
bmq Heat flux due to nanoparticle Brownian motion
cq
Heat flux due to convection
eq
Heat flux due to evaporation
maxq
Critical heat flux
qq Heat flux due to qunching
Ra Average surface roughness
bRe Bubble Reynolds number, (dimensionless)
'R Ideal gas constant
br Bubble radius
ir Bubble radius of the ith
group
ijr Equivalent bubble radius of the ith
group and jth group
iS jS Mass variation rate
'
iS '
jS
Bubble number density variation rate

XXI
s Mean distance between the attachment points
T Temperature
lT
Liquid temperature in the cell immediately next to the wall
satT
Liquid saturation temperature
WT
Wall temperature
subT
Liquid subcooling, sat lT T
supT
Wall superheat W satT T
ijt Bubble drainage time
wt Bubble waiting time
U Velocity
TU Terminal velocity
su Slip velocity
Tu Turbulent velocity
iv Mean volume of the ith
group bubbles
Wy Adjacent point normal to the wall surface
Greek symbols
Void fraction, (dimensionless)
iΓ Mass variation rate of the ith
group bubbles due to coalescence
Reduced surface potential
Separation between the surfaces
Turbulent kinetic energy dissipation
XXII
Bubble collision frequency
ζ
Surface contact angle
LS
ij Bubble coalescence frequency due to laminar shear
T
ij Bubble coalescence frequency due to turbulence
WE
ij Bubble coalescence frequency due to wake entrainment
Debye screening length
Bubble collision efficiency
Viscosity
c Capillary pressure
e Electrostatic double layer force
s Steric repulsion force
Density
Number density of ion in the bulk solution
Surface tension
ij Bubble contact time
Bubble coalescence rate
Ω
Bubble break-up rate
Size ratio between an eddy and a particle
Volumetric concentration of nanoparticles in nanofluid
Subscripts
bm Brownian motion
g Gas phase
XXIII
, ,i j k Bubble group number
l Liquid phase
lm Liquid microlayer
nf nanofluid
v Vapor phase

1
Chapter 1
Introduction
1.1 Background and Motivation
Nanofluids are engineered colloidal dispersions of nano-scale particles (nanoparticles
hereafter) in base fluids. Typical particle materials include oxides (Al2O3, CuO, TiO2,
Fe2O3, ZrO2 and SiO2, etc.), electrochemically noble metals (Cu and Ag, etc.) and some
other compounds (SiC, etc.). The base fluids usually include water, ethylene glycol,
propylene glycol, engine oil, etc. In recent years, the rapidly advanced nanotechnology
has spawned into many new engineering applications by implementing nanofluids, such
as nuclear reactors (Buongiorno and Hu, 2009), ultrafast cooling systems (Jha et al.,
2015), solar collectors (Mahian et al., 2013), microelectronics (Zhang et al., 2013) and
automotive industries (Peyghambarzadeh et al., 2013). Nanofluids have been treated as
perfect substitutions for pure liquids as energy transfer media, due to their merits in
heat transfer capabilities, such as thermo-physical properties, single-phase convective
heat transfer, and nucleate boiling heat transfer. Beyond that, the high surface to
volume ratio, low mass, and low inertia of nanoparticles enable nanofluids to be highly
colloidal stable and less erosional, which can bring synergies of higher mass/energy
transfer rate (Abdel-Fattah and El-Genk, 1998).

2
1.1.1 Thermo-physical Properties
The key thermo-physical property of fluids is thermal conductivity which has received
the most attention in the nanofluid research community over the past decade. Using
Hamilton-Crosser‘s effective thermal conductivity model, Choi and Eastman (1995)
firstly investigated the increased thermal conductivity of 20 vol% CuO/water
nanofluids. A factor of 3.5 over the base water value was predicted. Later in the
experiments conducted by Eastman et al. (1997), the thermal conductivity of 5 vol%
CuO/water nanofluids showed an incensement up to 60% compared with water.
Following the pioneering work of Choi and his fellows, a number of researchers joined
in exploring the anomalous enhancement of the thermal conductivity experimentally
and/or theoretically with various combinations of nanoparticles and base liquids
(Eastman et al., 2001; Xie et al., 2002; Das et al., 2003; Jang and Choi, 2004).
The basic understanding of the mechanism underlying thermal conductivity
enhancement is due to nanoparticles‘ high thermal conductivity. However,
experimental results indicated that new heat transport mechanisms exist in nanofluids.
Murshed et al. (2005) experimentally investigated the thermal conductivity of
TiO2/water nanofluids. The thermal conductivity of nanofluids was found to increase
remarkably with increasing volume concentration of nanoparticles. Besides the
influence of nanoparticle concentration, Chon et al.‘s study (2005) showed that
nanoparticle size and shape also has significant impact on the thermal conductivity
enhancement. In their study, an experimental correlation for the thermal conductivity of
Al2O3/water nanofluids was proposed as a function of nanoparticle size ranging from
11 nm to 150 nm over a wide range of temperature, from 21 to 71 °C. The thermal
conductivity of nanofluids exhibited strongly temperature- and size-dependent
characteristics. In order to explain the spectacular enhancement, various theories have
been proposed such as Brownian motion (Jang and Choi, 2004), the formation of an
interfacial nano-layer around particles (Yu and Choi, 2003), the percolation-like
behaviour (Foygel et al., 2005) and the micro-convection and lattice vibration of
nanoparticles (Gupta et al., 2006).
To predict the effective thermal conductivity, some models and/or empirical
correlations have been proposed. One of the most popular theoretical models is

3
developed by Hamilton and Crosser (1962). Their model was a function of the thermal
conductivity of both the base fluid and the particle volume fraction of the particles, and
the shape of the particles. Since temperature has a significant effect on the thermal
conductivity enhancement, recently, Khanafer and Vafai (2011) correlated the
experimental data of Al2O3/water nanofluid at various temperatures, nanoparticle size,
and volume fraction and proposed their own model, which has been validated in a few
experiments.
1.1.2 Single-phase Convective Heat Transfer
Single-phase convective heat transfer plays a significant role in various industry sectors.
Nanoparticles have been shown to enhance the convective heat transfer by an
increasing number of studies in the past decade. For example, the characteristics of the
fully developed convective heat transfer and flow for Cu/water nanofluids through a
straight tube with inner diameter of 10 mm was experimentally investigated by Xuan
and Li (2003). A constant heat flux condition along the tube wall was imposed using
DC heating. Results showed that the nanofluids gave substantial enhancement of heat
transfer rate compared to pure water. Enhancement was also found in Wen and Ding‘s
experiments (2004) where γ-Al2O3 nanoparticles and water flowed through a copper
tube in the laminar flow regime. The enhancement was found to be particularly
significant in the entrance region suggesting that the enhancement of the thermal
conductivity is not the only reason. The non-uniform distribution of thermal
conductivity and viscosity filed and the reduced thickness of thermal boundary layer
can also influence the convective heat transfer of nanofluids. The hypothesis is then
confirmed by Kim et al. (2009) who found the convective heat transfer coefficient for
the amporphous carbonic/water nanofluid, under laminar flow, increased by 8% even if
its thermal conductivity was similar to that of water. Daungthongsuk and Wongwises
(2007) further pointed out the other two plausible reasons for the forced convective
heat transfer enhancement of the nanofluids: the increased fluctuations induced by the
chaotic movement of nanoparticles and the accelerated energy exchange process due to
the extra turbulence. In 2006, Buonginorno developed a two-component four-equation
nonhomogeneous equilibrium model for mass, momentum, and heat transport in

4
nanofluids. They proposed that due to the effects of the temperature gradient and
thermophoresis, the viscosity of nanofluid may decrease significantly within the
boundary layer. This decrease can lead to the enhancement of convective heat transfer
of nanofluids.
Recently, the single-phase convective heat transfer of nanofluids with uniform
heat flux or temperature conditions on the wall has been simulated numerically by a
number of researchers. For example, Corcione et al. (2012) conducted the simulation
under the assumption that nanofluids behave more like single phase fluids than like
conventional solid-liquid mixture. Thus all the convective heat transfer correlations
available in the literature for single-phase flows were extended to nanoparticle
suspensions. In summary, this single phase assumption depends largely on the base
fluid, nanoparticle materials, concentration and size. When the particle is extremely
small and the volume concentration is very low, the nanofluids can be treated as pure
fluids. This hypothesis can be found in a number of other studies (Palm et al., 2006;
Demir et al., 2011).
1.1.3 Boiling Heat Transfer
Since You et al. (2003) firstly reported a considerable critical heat flux (CHF)
enhancement in Al2O3/water nanofluid pool boiling with particle concentration ranging
from 0 g/l to 0.05g/l, an increasing number of research groups around the world joined
in the investigation of heat transfer characteristics of nanofluids in boiling and
published in abundance. Nucleate boiling heat transfer and CHF are the main subjects
explored. Significant CHF enhancement has been reported consistently, but the
maximum achievable enhancement varies depending on the adopted nanoparticle
concentration, nanoparticle material, base liquid and heater size and material. Since the
enhanced CHF can afford a higher safety margin, nanofluids have been expected to be
ideally suited for practical thermal systems where high heat flux removal is needed,
such as nuclear reactors and high-power electronic devices.
However, the nucleate boiling heat transfer is controversial, with some studies
reporting no change of heat transfer in the nucleate boiling regime, some reporting heat
transfer deterioration, and others heat transfer enhancement. It has been revealed that

5
one of the influencing factors of the heat transfer coefficient (HTC) of nanofluid
boiling is the particle concentration. Kwark et al. (2010) found with increasing
nanoparticle concentration, the Al2O3/water nanofluids showed a noticeable
degradation in the boiling heat transfer coefficient but have exhibited an enhanced CHF
value (up to 80% when nanoparticle concentration reached 0.0007 vol%). Further
increase in the concentration produced no further CHF enhancement but degraded the
boiling heat transfer. Heris (2011) experimentally investigated the boiling heat transfer
of the CuO/ethylene glycol-water (60/40) nanofluid. The results indicated that a
considerable boiling heat transfer enhancement has been achieved, specifically that the
enhancement had increased with increasing nanoparticles concentration and reached 55%
at a nanoparticle concentration of 0.5 vol%. Similar trend of the dependence on
nanoparticle concentration of HTC has also been found in Krishna et al.‘s (2011) study
where Cu/water nanofluids were employed. Their results further showed that the
maximum enhancement, when the concentration of Cu nanoparticles increased from
0.01 to 0.1 vol%, was 50% and 20%, respectively on smooth and rough heaters. This
indicated that the surface roughness of heaters may be another influencing factor that
determines the heat transfer in nanofluids. The temperature of the bulk flow filed may
influence the HTC as well. This conclusion can be drawn in Taylor and Phelan‘s study
(2009) where the nucleate boiling heat transfer of Al2O3/water nanofluid was enhanced
by 25~40%, but subcooled boiling was deteriorated, compared with the pure-water
baseline.
In addition to the above experimental observations, nanofluids exhibit more
unique features. It was experimentally observed that during the boiling process of
nanofluids, suspending nanoparticles can deposit on the heater surface forming a
porous layer by Kim et al. (2006b) who conducted the experiments with several dilute
nanofluids (Al2O3/water, ZrO/water and SiO2/water with concentration of 0.01 vol%).
Their results also revealed that the porous layer of nanoparticles not only changed the
surface roughness (Das et al., 2003) but also had impact on surface wettability (Kim et
al., 2007). In addition, near-wall hydrodynamics such as bubble generation, growth and
detachment on heater surface were also found deferent in nanofluid boiling (Gerardi et
al., 2011). Not only in the near-wall region, the two-phase flow structures in bulk flow
6
field of have been found to be changed as well. For example, the void fraction in
horizontal flow boiling of ZnO/water nanofluids (0.001~0.01 vol%) measured by Rana
et al. (2014) showed a decrease up to 86% of that in water. With increasing
nanoparticle concentration and flow rate, the void fraction decreases, whereas it
increases in heat flux.
For all the addressed features, major knowledge gasps remain in the study of gas-
nanofluid bubbly flows. In particular, for nanofluid boiling, while numerous
experimental studies of boiling heat transfer have been conducted, numerical studies
have not. So far, the underlying mechanisms that how nanoparticles influence the
boiling heat transfer have not yet been fully understood. Mathematic models capable of
accurately describing the boiling process and effectively predicting the boiling heat
transfer in nanofluids are still absent from the open literature, which hinders
nanofluid‘s further application in industry. Even though a number of models, such as
heat flux partitioning (HFP) model, two-fluid model and MUltiple-SIze-Group
(MUSIG) model have been previously developed and widely employed in simulating
two-phase gas-liquid bubbly flows, without the in-depth study of the mechanism, their
applicability to nanofluids is still questioned. Therefore, a numerical study is needed to
reveal the role of nanoparticles, and further develop a mathematic model for gas-
nanofluid bubbly flows.
1.2 Objectives
The primary goal of this study is to develop a numerical model which is capable of
giving a full description and an accurate prediction of the boiling flows of nanofluids.
In order to achieve this goal, the following sequential activities have been conducted:
Review experimental findings in the literature to explore the characteristics of
boiling flows of dilute nanofluids and collect data of HTC with various
experimental conditions for heat flux, and type of nanofluids (materials and
concentrations).
Examine the feasibility of the existing models such as heat flux partitioning
(HFP) model, the two-fluid model, MUltiple-SIze-Group (MUSIG) model in
7
effective modelling of gas-nanofluid flows by comparing the experimental data
with numerical results.
Analyse the influencing factors in the CHF enhancement and HTC alteration in
nanofluid boiling flows and quantify their influences through numerical method.
Develop new correlations or models for gas-nanofluid flows with or without
heat transfer.
1.3 Thesis Outline
The aim of this chapter is to provide a brief description of the research work, started
with the background and motivation of the research in nanofluids. Then the objectives
are described and explained subsequently. An outline of the thesis based on each
chapter is included at the end of this chapter.
Chapter 2 firstly introduced the fundamentals of boiling. The characteristics of
heated surface, bubble dynamics in the near-wall region and two-phase flow structures
should be the main focuses for the study in pool and flow boiling, respectively.
Experimental studies of the unique features observed in gas-nanofluid bubbly flows are
then reviewed. The review begins with experimental findings of the boiling heat
transfer such as critical heat flux (CHF) and heat transfer coefficient (HTC). Potential
influencing factors are then analysed, including the thermo-physical properties,
characteristics of the heated surface, near surface hydrodynamics and bulk flow field
hydrodynamics. In the last section of this chapter, the preliminary mathematic models,
including the heat flux partitioning (HFP) model, the two-fluid model, and the MUSIG
model are introduced.
Chapter 3 covers the HFP modelling and analyses of the heat transfer in pool
boiling of dilute nanofluids. A study of the effects of nanoparticle deposition on boiling
parameters such as nucleation site density, bubble departure diameter and bubble
departure frequency are conducted. New correlations of these boiling parameters are
proposed. In addition to that, after analysing the process of nanoparticle deposition in
micro-scale, a new heat flux partitioning (HFP) model considering the heat transfer by
nanoparticle Brownian motion in the microlayer is also developed. Comparison of
numerical results against experimental data shows a good consistency.

8
Chapter 4 provides numerical approaches to investigate the two-phase flow
structures of isothermal gas-nanofluid bubbly flows with the two-fluid model and
MUSIG model, respectively. It is suggested that in a bubbly flow system, the existence
of interfaces allows the spontaneous formation of a thin layer of nanoparticle assembly
at the interfaces, which significantly changes the interfacial behaviours of the air
bubbles and the roles of the interfacial forces. Thus, one of the most important tasks
when modelling bubbly flows of gas-nanofluid using the two-fluid model is to
reformulate the interfacial transfer terms according to the interfacial behaviour
modifications induced by nanoparticles. Since assembled nanoparticles also have
effects on bubble coalescence process, it is also pointed out that modelling the
coalescence process in nanofluids is essential to the successful simulation of gas-
nanofluid bubbly flows using MUSIG model.
Chapter 5 focuses on mechanistic study of bubbly hydrodynamics in gas-
nanofluid bubbly flows. In particular, the underlying mechanism that how nanoparticles
affect the interfacial forces acting on bubbles such as the drag force and lift force and
what the role that nanoparticles have played in influencing bubble-bubble interaction
and further modifying the two-phase flow structures are discussed. Results show that
the adsorbed nanoparticles make a bubble behave somewhere between a clean bubble
and a solid particle. As a result, flow separation occurs and a slanted wake region forms
behind the nanoparticle-adsorbed bubble at a small Reynolds number. Both pressure
and viscous stress on the bubble interface become asymmetrically distributed due to the
nanoparticle surface concentration. In addition, the interactions between nanoparticles
such as electrostatic double layer force and steric repulsion force can not only resist the
approach of two bubbles, but also hinder the fluctuation of the liquid film.
Chapter 6 presents the conclusion of this thesis by summarizing the outcomes
from chapter 3 to chapter 5 and discusses further investigations required.

9
Chapter 2
Literature Review
2.1 Overview of Boiling Heat Transfer
Heat transfer process in gas-liquid two-phase flows is accompanied by the presence of
a moving and deforming phase interface. Specifically, during boiling process vapour
bubbles rapidly form at the solid-liquid interface, detach from the surface when they
reach a certain size, and attempt to rise to the free surface of the liquid. According to
the bulk fluid motion, boiling is classified as pool boiling, which is under quiescent
fluid conditions, or flow boiling, which is under forced-flow conditions.
2.1.1 Pool Boiling
Pool boiling refers to boiling along a heated surface submerged in a large volume of
quiescent liquid (Naterer, 2002). As shown in Figure 2.1, pool boiling arises under two
types of conditions: electrical heating and thermal heating. With electrical heating, the
heat flux can be calculated based on measurements of the applied current and voltage.
Thus the heat flux is an independent variable, whereas temperature is a dependent
variable. However, in thermal heating, the surface temperature can be set independently
of the heat flux. Figure 2.1 also illustrates that in pool boiling any liquid motion is due
to free convection and mixing induced by bubble growth and detachment from the
heated surface.

10
Figure 2. 1: Electrical and thermal heating (Naterer, 2002)
The study of pool boiling was pioneered by Nukiyama (1966) who used
electrically heated nichrome and platinum wires immersed in liquids in his experiments.
Nukiyama noticed that boiling takes different forms, depending on the value of the wall
superheat ΔTsup (=TW-Tsat), which is the temperature difference between the heater
surface and the saturation temperature of the liquid. Four distinct boiling regimes are
identified: natural convection boiling, nucleate boiling, transition boiling, and film
boiling. These regimes are illustrated on Nukiyama‘s boiling curve in Figure 2.2, which
is a plot of boiling of heat flux q versus the wall superheat ΔTsup.
Figure 2. 2: Nukiyama‘s boiling curve (Nukiyama, 1966).

11
Natural convection (up to A): Free single-phase natural convection occurs from
the heated surface to the saturation liquid without formation of bubbles.
Nucleate boiling (A-C): Bubbles nucleate, grow and depart from the heated
surface, and further coalesce, mix, and ascend as merged jets or columns of
vapour, as wall superheat increases.
Transition boiling (C-D): An unstable (partial) vapour film forms on the heating
surface, and conditions oscillate between nucleate and film boiling.
Film boiling (beyond D): A stable layer of vapour forms between the heated
surface and the liquid, and blocks the liquid from contacting the surface.
Among these four boiling regimes, nucleate boiling is the most desirable one in
practice because high heat transfer rates can be achieved in this regime with relatively
small values of ΔTsup, typically under 30 °C for water. During nucleate boiling, vapour
bubbles start forming at cavities along the heated surface where a gas or vapour phase
already exists. The liquid in microlayer, which is a thin layer underneath the bubble,
extract heat from the surface and evaporate. Due to the continuous heating and liquid
evaporation, the vapour bubbles keep growing and expanding until the buoyancy force
is large enough to lift the bubbles from the cavities. During this process, bubbles
ascend and carry away the latent heat of evaporation, while liquid between the bubbles
continues to absorb heat by natural convection from the surface (Figure 2.3).
Figure 2. 3: Bubble grow and departure on an active site (Li et al., 2014a).
At large values of ΔTsup, the rate of evaporation at the heater surface reaches such
high values that bubbles grow rapidly and eventually merge together. Consequently, a
12
large fraction of the heated surface will be covered by bubbles, making it difficult for
the liquid to reach the heated surface and wet it. Thus, the heat flux increases at a lower
rate with increasing ΔTsup, and reaches a maximum at point C in Figure 2.2. The heat
flux at this point is the critical heat flux (qmax, CHF). Nukiyama (1966) noticed that
when the power applied to the nichrome wire immersed in water exceeded qmax even
slightly, the wire temperature jumped suddenly to the melting point of the wire (1500 K)
and burnout occurred beyond his control. Therefore, point C on the boiling curve is
also called the burnout point. In the design of boiling heat transfer equipment, it is
extremely important for the designer to have a good knowledge of the critical heat flux
to avoid the danger of burnout.
2.1.2 Flow Boiling
Flow boiling is the boiling process where the fluid is forced to move in a heated pipe
(internal flow boiling) or over a surface (external flow boiling) by external means such
as a pump as it undergoes a phase-change process. Since there is no free surface for the
vapour to escape during internal flow boiling (two-phase flow), the consequent mixing
of the liquid and vapour phase make it more complicated in nature and strongly
influence the boiling heat transfer. Therefore, flow boiling heat transfer is closely
related to the two-phase flow structure of the evaporating fluid. And it exhibits
characteristics of both convection and pool boiling. Commonly observed flow
structures are defined as two-phase flow patterns. The flow patterns encountered in co-
current upflow of gas and liquid in a vertical tube are shown in Figure 2.4.
Bubbly flow: small discrete bubbles in the continuous liquid phase with various
shapes and sizes.
Slug flow: with increasing the gas fraction, larger bubbles formed due to
collision and coalescence.
Churn flow: with increasing the velocity, the flow becomes unstable and the
liquid travels up and down in an oscillatory fashion.
Annular flow: a thin film of liquid on the wall with the gas as the continuous
phase in the centre of the tube.
13
Figure 2. 4: Flow patterns in vertical upflow: (a) bubbly flow; (b) slug flow; (c) churn
flow; (d) annular flow.
The different stages encountered in flow boiling in a heated tube are illustrated in
Figure 2.5 together with the variation of the heat transfer coefficient along the tube.
Initially, the liquid is subcooled and forced convection dominates the heat transfer to
the liquid. Then the bubbles‘ formation and detachment from the heated surface of the
tube, and the sequent draft into the mainstream gives the fluid flow a bubbly
appearance. With the fluid heated further, the size of the bubbles increase gradually and
eventually approach the pipe diameter due to bubble coalescence. The slug of vapour
occupy up to half of the volume in the tube until the liquid mainly flows as a film along
the walls and the core of the flow consists of vapour only. This is the annular-flow
regime, and very high heat transfer coefficients are realized in this regime.
In pool boiling, the vapour flow is largely buoyancy driven. In contrast, forced
flow boiling involves bulk motion of the liquid and buoyancy effects. Thus the heat
transfer coefficient is less dependent on heat flux than in pool boiling, while its
dependence on the local vapour quality appears as a new and important parameter.
Both the nucleate and convective heat transfer mechanisms must be taken into account
to predict heat transfer data in the flow boiling regime. The local flow parameters such
as void fraction, bubble velocity, bubble size and interfacial area concentration become
critical to the prediction of heat transfer in flow boiling.

14
Figure 2. 5: Two-phase flow regimes in vertical pipe flow (Naterer, 2002).
How to improve the critical heat flux and the heat transfer coefficient has always
been a hot topic in the research of boiling heat transfer. For pool boiling, since the fluid
in bulk flow field is almost stationary, the focus is on the heated surface where
evaporation and convection mostly occur. Techniques such as sintering, brazing, and
flame spraying, which can modify the characteristics of the heated surface have been
developed rapidly and numerously to build porous structures on the heated surface and
enhance nucleation (Pais and Webb, 1991). Bubble coalescence and interactions
between the vapour columns can also affect total heat transfer by changing the
convective flow of liquid returning to the heating surface. For flow boiling, as
previously mentioned, the heat transfer is closely related to the two-phase flow
structure of the evaporating fluid. As the use of nanofluids instead of pure liquids can
significantly enhance the boiling heat transfer, a detailed and systematic literature
review of experimental findings of gas-nanofluid bubbly flows is needed, in order to
develop a comprehensive model.
2.2 Experimental Findings of Nucleate Boiling of Nanofluids
2.2.1 Pool Boiling Heat Transfer
The research in the boiling heat transfer of nanofluid dates back to the experimental
study conducted by Yang and Maa (1984). Even though the concept of nanofluid has
not been proposed at that time, Yang and Maa discovered an enhancement up to 400%
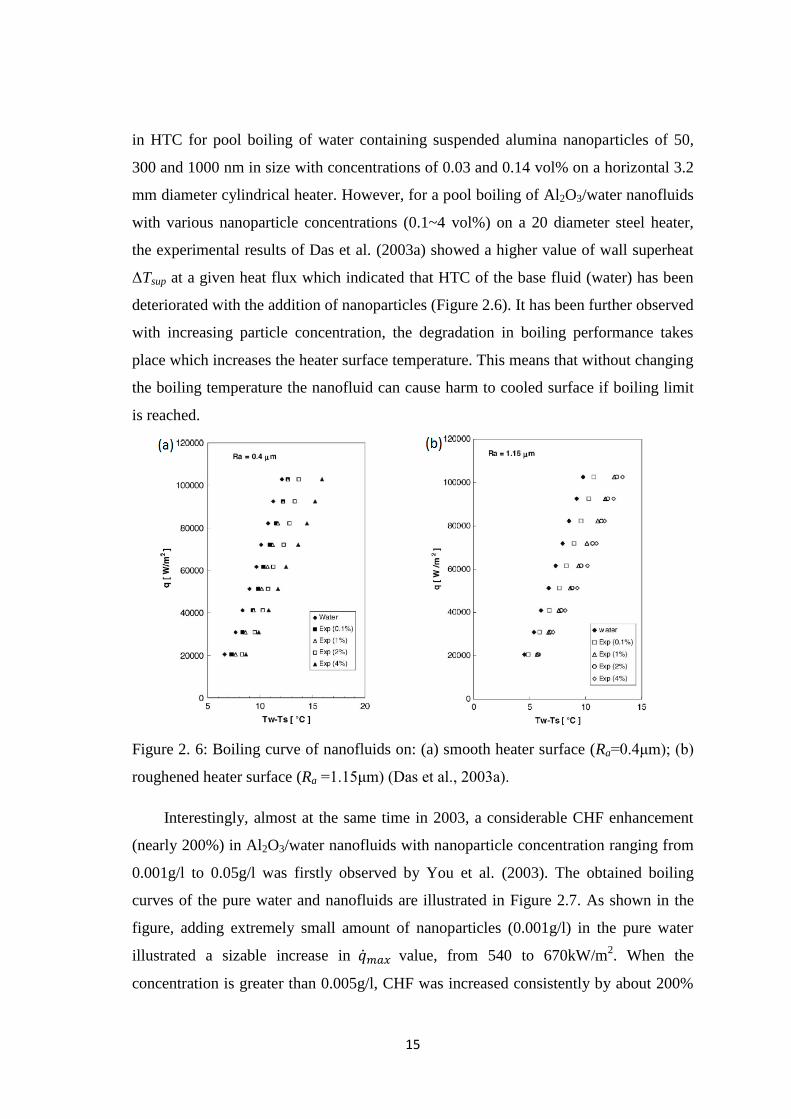
15
in HTC for pool boiling of water containing suspended alumina nanoparticles of 50,
300 and 1000 nm in size with concentrations of 0.03 and 0.14 vol% on a horizontal 3.2
mm diameter cylindrical heater. However, for a pool boiling of Al2O3/water nanofluids
with various nanoparticle concentrations (0.1~4 vol%) on a 20 diameter steel heater,
the experimental results of Das et al. (2003a) showed a higher value of wall superheat
ΔTsup at a given heat flux which indicated that HTC of the base fluid (water) has been
deteriorated with the addition of nanoparticles (Figure 2.6). It has been further observed
with increasing particle concentration, the degradation in boiling performance takes
place which increases the heater surface temperature. This means that without changing
the boiling temperature the nanofluid can cause harm to cooled surface if boiling limit
is reached.
Figure 2. 6: Boiling curve of nanofluids on: (a) smooth heater surface (Ra=0.4μm); (b)
roughened heater surface (Ra =1.15μm) (Das et al., 2003a).
Interestingly, almost at the same time in 2003, a considerable CHF enhancement
(nearly 200%) in Al2O3/water nanofluids with nanoparticle concentration ranging from
0.001g/l to 0.05g/l was firstly observed by You et al. (2003). The obtained boiling
curves of the pure water and nanofluids are illustrated in Figure 2.7. As shown in the
figure, adding extremely small amount of nanoparticles (0.001g/l) in the pure water
illustrated a sizable increase in value, from 540 to 670kW/m2. When the
concentration is greater than 0.005g/l, CHF was increased consistently by about 200%

16
compared to that of the pure water case. Despite the huge CHF enhancement, the
boiling heat transfer coefficient values of all concentrations including pure water
appeared to be the same.
Figure 2. 7: Boiling curve of pure water and Al2O3/water nanofluids (0.001g/l to
0.05g/l) (You et al., 2003).
Following the pioneering work of Yang and Maa (1984), Das et al. (2003) and
You et al. (2003), more than 200 papers focusing on nanofluid boiling have been
published in open literature. Most of these studies reported the increase of CHF up to
200% in nanofluids. However, there has been considerable disagreement over the value
of the boiling heat transfer coefficient (HTC) of gas-nanofluid flows. Nearly even
three-way split in experimental results have been found: enhancement, deterioration,
and little or both enhancement and deterioration.
2.2.1.1 Enhancement
Tu et al. (2004) tested Al2O3 nanofluids on a ‗nanoscopically smooth‘ vapor-deposited
heating surface. Results showed HTC enhancement (~64%) and a fourfold increase in
nucleation sites. Similar HTC enhancement was also found in Wen and Ding‘s
experiment (2005) where the pool boiling of Al2O3/water nanofluids on a stainless steel
disc inside a cylindrical vessel was investigated. The pool boiling HTC significantly
enhanced with the increasing particle concentration in nanofluids compared to water,

17
resulting in 40% enhancement for 1.25 wt%. Later in 2007, Liu et al. (2007) tested
CuO/water nanofluids on smooth micro-grooved surfaces at various pressures and
nanoparticle concentrations. They found significant enhancements (~25% at 100kPa
and 150% at 7.4kPa) until the mass concentration exceeded 1% – after which
enhancement decreased. Truong et al. (2007) also found very high enhancements (up to
68%) in heat transfer during pool boiling experiments with SiO2 and Al2O3/water
nanofluids. The largest enhancement of HTC was observed in the experimental study of
Wen et al (2011), where the pool boiling of 0.001 vol% Al2O3/water nanofluids on
smooth heater surfaces exhibited a two-fold increase in boiling heat transfer coefficient
under low heat flux conditions (Figure 2.8).
Figure 2. 8: Comparative boiling experiments on the smooth surface (Wen et al., 2011).
In summary, the studies (Tu et al., 2004; Wen and Ding, 2005; Liu et al., 2007;
Kathiravan et al., 2009; Soltani et al., 2009; Liu et al., 2010; Wen et al., 2011;Yang and
Liu, 2011; Kole and Dey, 2012; Mourgues et al., 2013; Raveshi et al., 2013) of dilute
nanofluids showed enhancement ranging from 15% to 200% in nucleate boiling heat
transfer. A wide variety of materials and geometries for nanoparticles and heaters were
used.
2.2.1.2 Deterioration
Bang and Chang (2005) investigated the pool boiling characteristics of Al2O3/water
nanofluids (0.5~4 vol%) on horizontal and vertical smooth heaters (Ra=37nm). Their
results showed 25-50% deterioration in HTC with the increase in nanoparticle
concentration. Milanova et al. (2006) tested several types of nanofluids: Al2O3, SiO2,

18
and CeO2 at 0.5 vol%. With changing PH in pool boiling experiments, the authors
observed a decrease in nucleate boiling heat transfer. They also noted that their
nichrome (NiCr) wires were oxidized and that there was significant particle deposition
during the boiling experiments. Jackson et al. (2006) tested Au nanofluids (0.003 vol%)
on a Cu block at various pressures. Overall, Jackson et al. found that the HTC was
reduced 25% while the CHF increased 2.5 times. Their results further revealed that the
surface roughness was increased by the nanofluids. In 2007, Kim et al. (2007) also
tested several nanofluids (Al2O3, ZrO2, SiO2, 0.001~0.1 vol%) on stainless steel wires
and plates. Even though due to the lack of exact data of the temperature curve for
stainless steel, degradation of the HTC was found. A similar phenomenon that a
significant amount of particles was deposited on the heated surface was also observed
by the authors using scanning electron microscope (SEM) analysis. They attributed the
HTC degradation in nanofluids to the deposited nanoparticles. A deterioration in the
HTC as a result of particle deposition was also discovered by Kwark et al. (2010) in
their pool boiling experiments with Al2O3/water nanofluids on a horizontal copper
block. They found that the HTC deteriorated with coating the boiling surface. For this
group of papers (Das et al., 2003a; Bang and Chang, 2005; Jackson, Borgmeyer et al.,
2006; Kim et al., 2007; Park et al., 2009; Trisaksri and Wongwises, 2009; Kathiravan et
al., 2010; Kwark et al., 2010; Phan et al., 2010; Jung et al., 2012; Sheikhbahai et al.,
2012; Shahmoradi et al., 2013; Mori et al., 2015), deterioration of 0–50% have been
found.
2.2.1.3 Both Enhancement/Deterioration
As previously mentioned, in a few papers both increased and decreased heat transfer
during the tests has been found. Witharana (2003) studied the heat transfer in Au/water
nanofluids (0.001 wt%) and SiO2/water-EG nanofluids boiled in a cylindrical vessel
under atmospheric pressure, respectively. 21% enhancement of the boiling HTC in
Au/water nanofluid was reported, while the SiO2/water-EG nanofluids showed a HTC
decrease compared to the base fluids. Narayan et al. (2007) tested Al2O3/water
nanofluids on vertical tubular heaters of various surface roughness (48, 98 and 524 nm).
It has been observed that with the rough heater (Ra=524 nm), heat transfer is

19
significantly enhanced (~70% at 0.5 wt%). With the smooth heater (Ra=48 nm), heat
transfer is significantly deteriorated (~45% at 2 wt%). In order to have an insight into
the impact of surface roughness on boiling heat transfer, a ‗surface interaction
parameter (SIP)‘ was defined, which was simply the surface roughness (Ra) divided by
the average particle diameter. Not only the surface roughness, the nanoparticle
concentration also plays an important role in the heat trasfer of nanofluid boiling.
Chopkar et al. (2008) investigated the nucleate pool boiling of ZrO2/water nanofluid on
a Cu plate in a borosilicate tube. Results found the HTC increased at low nanoparticle
concentrations, whereas when the concentration increased, it was observed decreasing
until becoming lower than that of pure water. The boiling time was also found
significant to the total heat transfer rate in nanofluids. Okawa et al. (2012) investigated
the boiling time effects with TiO2/water nanofluids (0.000094~0.047 vol%) on a copper
block. The experimental results showed that the heat transfer first decreased, then
increased, and finally reached an equilibrium situation. Besides the influence of boiling
time, the pressure may be another determined factor. Naphon and Thongjing (2014)
investigated the influence of TiO2 nanoparticles on the boiling heat transfer of
refrigerant R141-b and ethyl alcohol with a brass cylindrical heater. At high heat flux,
the boiling HTC was deteriorated with the addition of nanoparticles. However, under
high boiling pressure, the HTC increased.
This group of papers shows mixed or discrepant incongruent experimental results
about the characteristics of nanofluid boiling heat transfer. According to the literature,
the value of HTC is influenced by the nanoparticle concentration (Chopkar et al., 2008;
Shoghl and bahrami, 2013), material (Witharana, 2003) and size (Xu and Zhao, 2014)
in combination with the heater surface characteristics such as the surface roughness
(Narayan et al., 2007; Harish et al., 2011; Wen et al., 2011), and some external factor
including the flow pressures (Liu et al., 2007; Liu et al., 2010; Naphon and Thongjing,
2014) and boiling duration (Stutz et al., 2011; Okawa et al., 2012).
2.2.2 Influencing Factors
Vafaei and Borca-Tasciuc (2013) summarized that theoretically the boiling heat
transfer depends on factors related to the liquid and solid surface properties including:

20
(a) physical properties of the liquid such as surface tensions, viscosity, thermal
conductivity, specific heat, liquid and vapour densities, vapour and liquid enthalpies; (b)
characteristics of heated substrate such as roughness, homogeneity, structure, surface
chemistry, which affect the active nucleation site density, equilibrium, receding, and
advancing contact angles, and (c) near surface hydrodynamics such as departure bubble
volume, bubble frequency, and hot/dry spot dynamics.
2.2.2.1 Thermo-physical Properties
To evaluate the roles of the thermophysical properties of nanofluids in boiling
performance, two major properties were examined: the surface tension ζ and the
thermal conductivity k. The suspended nanoparticles in a base liquid decrease the
surface tension of the fluid significantly. Since the surface forces acting on the bubble,
including buoyancy, weight and surface tension at the nucleation site, are responsible
for the bubble‘s departure, such a reduction in surface tension decreases the radius of
bubble, and therefore, more active nucleation sites on the heating surface occur, which
enhances the boiling HTC (Kim and Kim, 2009; Yang and Liu, 2011; Raveshi et al.,
2013). Das et al. (2003a) measured the thermal conductivity with particle concentration
and temperature using the temperature oscillation technique. A substantial increase in
thermal conductivity of nanofluids is observed, as shown in Figure 2.9. With such a
substantial increase (~60% at saturation temperature), Das et al. (2003a) pointed out
that nanofluids are expected to enhance heat transfer during boiling, considering fluid
conduction in microlayer evaporation under the bubble as well as in reformation of
thermal boundary layer at the nucleation site plays a major role in heat transfer during
boiling.
Indeed, the conduction heat transfer is very important at the thin fluid layer on the
heating surface and, an increase in the thermal conductivity is one of the reasons for the
boiling HTC enhancement observed in other researches, as well as an increase in the
stability of nanofluid suspensions (Soltani et al., 2009). However, the thermal
conductivity is very dependent on the nanoparticle concentration. For dilute nanofluids
with low nanoparticle loadings (<0.1 vol%), the measured thermal conductivity of
nanofluid was found to be the same as that of water (Williams et al., 2008).

21
Comparisons of thermo-physical properties between water and Al2O3 and SiO2/water
dilute nanofluids (<0.1 vol%) are given in Table 2.1.
Figure 2. 9: Thermal conductivity enhancement of nanofluids as a function of
temperature (Das et al., 2003a).
Even though the thermalphysical properties differ negligibly from those of pure
water, as shown in Figure 2.8, the enhancement of the boiling HTC of 0.001 vol%
Al2O3/water nanofluids is as much as 200% from pure water. This indicates that the
change in boiling characteristics of nanofluids cannot be explained in terms of property
change alone.
Table 2. 1 Comparison of thermo-physical properties between water and dilute
nanofluids (Kim, 2009)
Fluids Thermal Conductivity
(W/m. K) at 378 K
Kinematic Viscosity
(mm2/s) at 413 K
Surface Tension
(mN/m) at 378 K
Water 0.60 0.0067 0.6577 0.0046 67.7 1.2
0.001 vol% Alumina 0.61 0.0067 0.6640 0.0003 67.0 0.2
0.01 vol% Alumina 0.62 0.0110 0.6681 0.0013 47.6 1.1
0.1 vol% Alumina 0.58 0.0133 0.6894 0.0003 40.9 0.3
Fluids Thermal Conductivity
(W/m. K) at 378 K
Kinematic Viscosity
(mm2/s) at 413 K
Surface Tension
(mN/m) at 378 K
Water 0.60 0.0067 0.8900 67.7 1.2
0.001 vol% Silica 0.61 0.0058 0.8846 0.0027 72.1 0.08
0.01 vol% Silica 0.62 0.0033 0.8857 0.0049 72.4 0.06
0.1 vol% Silica 0.58 0.0100 0.8929 0.0011 72.2 0.07

22
2.2.2.2 Characteristics of the Heated Surface
Surface roughness
In the experiments conducted by Das et al. (2003a), a considerable reduction in the
surface roughness takes place after boiling nanofluid (Figure 2.10). They attributed this
roughness change to nanoparticles sitting on the relatively uneven heater surface.
According to Das et al. (2003a), since the sizes of nanoparticles (20~50 nm) are one to
two orders of magnitude smaller than the roughness (0.2~1.2 μm) of the heating surface,
the trapped nanoparticles change the surface characteristics making it smoother. In
contrast to Das et al.‘s analysis, experimental observations in Bang and Chang‘s study
(2005) exhibited an increase of surface roughness in the boiling of Al2O3/water
nanofluids (0.5 and 4 vol%). The surface roughness of the heater surface increased with
the increasing nanoparticle concentration, as shown in Figure 2.11.
Figure 2. 10: Surface roughness of the smoother heater surface: (a) before boiling; (b)
after boiling with nanofluids (Das et al., 2003a).
After analysing their experimental results as well as Das et al.‘s findings, Bang
and Chang (2005) proposed that the decrease or increase depends on both original
surface condition and the size of nanoparticles. If the original surface roughness is
smaller than nanoparticles, it can be increased as Bang and Chang‘s results. Reversely,
if the original surface roughness is larger than nanoparticles, it can be decreased as Das
et al.‘s results. Both Das et al. (2003a) and Bang and Chang (2005) believed that the
nanoparticle‘s attachment, which can be considered as a kind of fouling, to the heated
surface is the main cause of the roughness change, and consequently the altered heat

23
transfer coefficient. However, either of them did not provide any direct and clear
evidence of deposited nanoparticles on the heater surface, or explanation how deposited
nanoparticles influence the boiling heat transfer.
Figure 2. 11: Surface roughness of: (a) clear heater (Ra=37.2 nm); (b) heater submerged
in 0.5 vol% alumina nanofluids (Ra=67.6 nm); (c) in 4 vol% alumina nanofluid
(Ra=227.7 nm) (Bang and Chang, 2005).
Surface wettability
The microstructure and topography of the heated surface modified by the deposition of
suspended nanoparticles during the boiling of nanofluids was firstly published by Kim
et al. (2006a), as shown in Figure 2.12. They found that there is almost no difference
between the upside and downside of the heating wire in the test pool in terms of the
deposition of nanoparticles. This means that the formation of nanoparticle surface
coating is mainly attributed to the nucleation of vapour bubbles on the cylindrical wire,
not to the gravitational sedimentation of nanoparticles. The deposition of nanoparticles
on the heater surface during the boiling process was also observed by Kim et al.
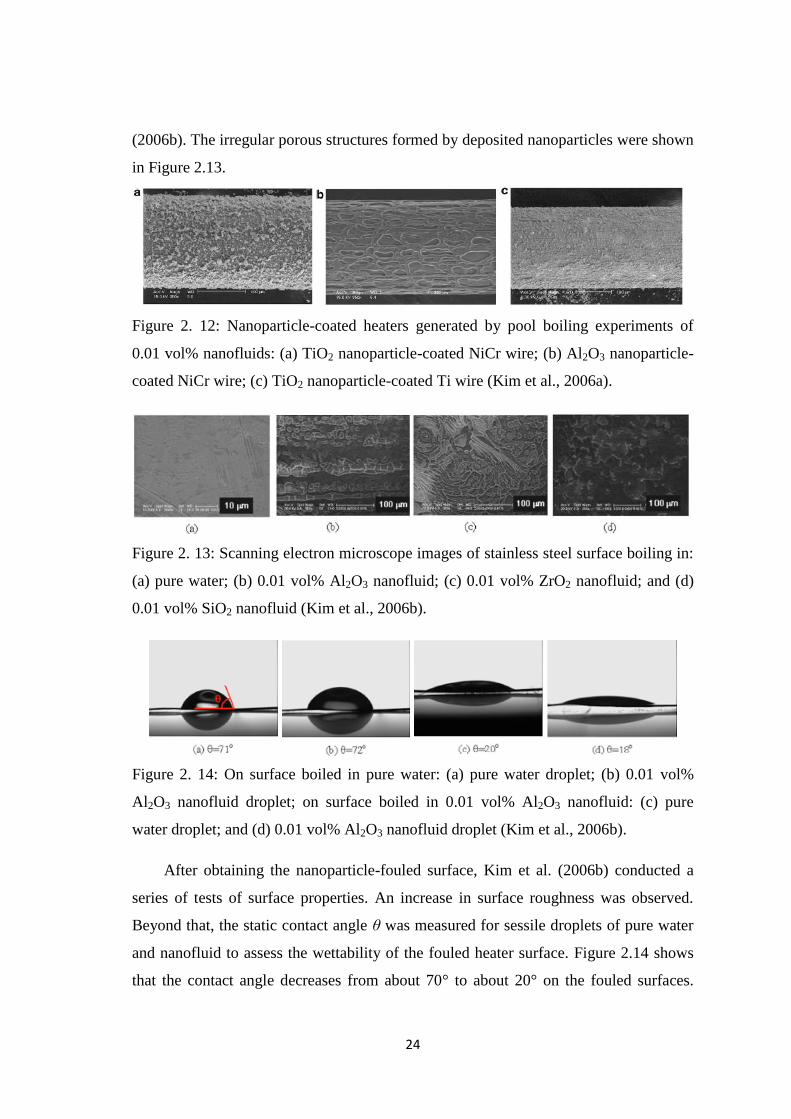
24
(2006b). The irregular porous structures formed by deposited nanoparticles were shown
in Figure 2.13.
Figure 2. 12: Nanoparticle-coated heaters generated by pool boiling experiments of
0.01 vol% nanofluids: (a) TiO2 nanoparticle-coated NiCr wire; (b) Al2O3 nanoparticle-
coated NiCr wire; (c) TiO2 nanoparticle-coated Ti wire (Kim et al., 2006a).
Figure 2. 13: Scanning electron microscope images of stainless steel surface boiling in:
(a) pure water; (b) 0.01 vol% Al2O3 nanofluid; (c) 0.01 vol% ZrO2 nanofluid; and (d)
0.01 vol% SiO2 nanofluid (Kim et al., 2006b).
Figure 2. 14: On surface boiled in pure water: (a) pure water droplet; (b) 0.01 vol%
Al2O3 nanofluid droplet; on surface boiled in 0.01 vol% Al2O3 nanofluid: (c) pure
water droplet; and (d) 0.01 vol% Al2O3 nanofluid droplet (Kim et al., 2006b).
After obtaining the nanoparticle-fouled surface, Kim et al. (2006b) conducted a
series of tests of surface properties. An increase in surface roughness was observed.
Beyond that, the static contact angle ζ was measured for sessile droplets of pure water
and nanofluid to assess the wettability of the fouled heater surface. Figure 2.14 shows
that the contact angle decreases from about 70° to about 20° on the fouled surfaces.
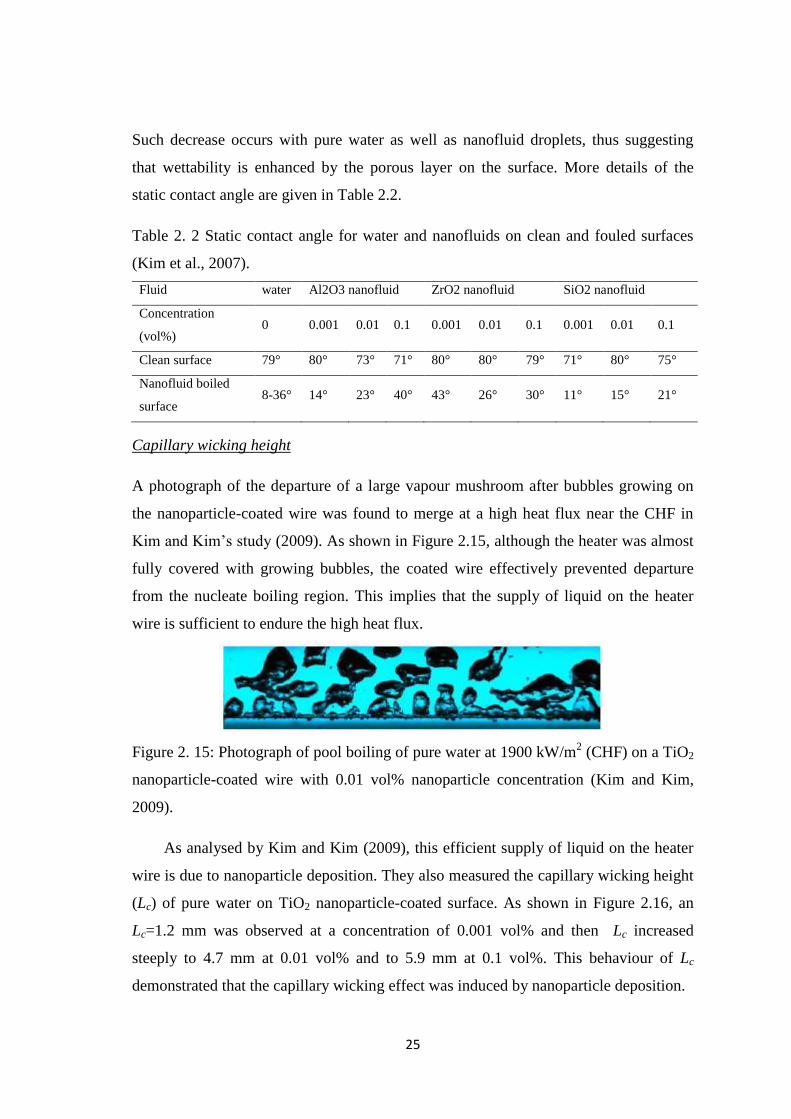
25
Such decrease occurs with pure water as well as nanofluid droplets, thus suggesting
that wettability is enhanced by the porous layer on the surface. More details of the
static contact angle are given in Table 2.2.
Table 2. 2 Static contact angle for water and nanofluids on clean and fouled surfaces
(Kim et al., 2007).
Fluid water Al2O3 nanofluid ZrO2 nanofluid SiO2 nanofluid
Concentration
(vol%) 0 0.001 0.01 0.1 0.001 0.01 0.1 0.001 0.01 0.1
Clean surface 79° 80° 73° 71° 80° 80° 79° 71° 80° 75°
Nanofluid boiled
surface 8-36° 14° 23° 40° 43° 26° 30° 11° 15° 21°
Capillary wicking height
A photograph of the departure of a large vapour mushroom after bubbles growing on
the nanoparticle-coated wire was found to merge at a high heat flux near the CHF in
Kim and Kim‘s study (2009). As shown in Figure 2.15, although the heater was almost
fully covered with growing bubbles, the coated wire effectively prevented departure
from the nucleate boiling region. This implies that the supply of liquid on the heater
wire is sufficient to endure the high heat flux.
Figure 2. 15: Photograph of pool boiling of pure water at 1900 kW/m2 (CHF) on a TiO2
nanoparticle-coated wire with 0.01 vol% nanoparticle concentration (Kim and Kim,
2009).
As analysed by Kim and Kim (2009), this efficient supply of liquid on the heater
wire is due to nanoparticle deposition. They also measured the capillary wicking height
(Lc) of pure water on TiO2 nanoparticle-coated surface. As shown in Figure 2.16, an
Lc=1.2 mm was observed at a concentration of 0.001 vol% and then Lc increased
steeply to 4.7 mm at 0.01 vol% and to 5.9 mm at 0.1 vol%. This behaviour of Lc
demonstrated that the capillary wicking effect was induced by nanoparticle deposition.

26
Figure 2. 16: Dependency of the maximum capillary wicking height of TiO2
nanoparticle-coated wires on the particle concentration (Kim and Kim, 2009).
Many researchers have tried to explain the deterioration or enhancement of boiling
heat transfer as due to the above changes in the characteristics of heated surface during
the boiling process. In order to validate this point, some research groups experimentally
studied the boiling behaviour of pure water on heated surfaces with nanoparticle
coatings. These surfaces are either created during nanofluid pool boiling (Kwark et al.,
2010;Ahmed and Hamed, 2012) or pre-fabricated. In Kwark et al.‘s experiments (2010),
various nanoparticle coatings were generated by submerging a 1cm×1cm heater in
saturated Al2O3 nanofluid (0.025 g/l). The pool boiling curves for two nanocoated
heaters tested in pure water showed that the nanocoatings enhance CHF by 50% and
70%, for the 15 min and 120 min nanocoatings, respectively. In addition, the coating
generated over a 120 min period is found to degrade HTC while the coating generated
over a shorter 15 min period is found to have minimal effect on HTC. Similar results
can be found in Ahmed and Hamed‘s study (2012), where pool boiling experiments of
pure water on Al2O3 nanoparticle-coated surface have been conducted. A significant
deterioration in the HTC compared with that of pure water on clean surface was noted
(Figure 2.17). All of the above experimental measurements demonstrate the significant
impact of nanoparticle deposition on boiling heat transfer.

27
Figure 2. 17: Boiling curves of pure water on nanoparticle-deposited surfaces (Ahmed
and Hamed, 2012).
In order to have an insight into the relationship of boiling heat transfer and
structures or properties of nanoparticle-coated surfaces, numerous experiments have
been conducted. Narayan et al. (2007) collected several groups of experimental data of
heat transfer enhancement in nanofluids and put them in Figure 2.18 versus their self-
defined ‗surface interaction parameter (SIP)‘ which is the surface roughness (Ra)
divided by the average particle diameter. A maximum deterioration of 20% in the HTC
was experienced at SIP of 1, whereas the HTC was enhanced by 80% at SIP=11.
Figure 2. 18: Effect of surface roughness and particle size on boiling heat transfer
(Narayan et al., 2007).

28
Figure 2. 19: Effects of the surface wettability on the heat transfer coefficient (Phan et
al., 2009).
Phan et al. (2009) compares the heat transfer performance of pool boiling on the
nanoparticle-coated surfaces. The tendency of the presented curves is relatively good
and shows a significant change of the HTC by the surface wettability change. Figure
2.19 highlights this observation and shows that the best HTC is obtained with the
surface that has a static contact angle close to either 0° or 90° (Phan et al., 2009).
2.2.2.3 Near Surface Hydrodynamics
As aforementioned, pool boiling includes such aspects as bubble nucleation, growth,
and departure from heated surface. The heat from the heated surface is transferred to
the liquid during series of bubble behaviours. Thus the change of bubble behaviours
can have significant impact on the boiling heat transfer.
Bubble nucleation
Kim et al. (2006b) analysed the influences of the decreased contact angle. They found a
decrease of the contact angle will tend to decrease the number of active cavities.
Plausibly this contributes to the decrease in bubble nucleation in nanofluids with
respect to pure water, as shown in Figure 2.20. A similar conclusion of the decreased
nucleation sties can be found in Wang and Dhir‘s experiments (1993), as shown in

29
Figure 2.21, where the density of active nucleation sites is plotted for contact angles of
90°, 35° and 18°.
Figure 2. 20: Nucleate boiling of pure water (left) and 0.01 vol% Al2O3 nanofluid (right)
at the same heat flux on an electrically heated 0.25 mm diameter stainless steel wire
(Kim et al., 2006b).
Figure 2. 21: Active nucleation site density versus heat flux for contact angles from 18°
to 90° (Wang and Dhir, 1993).
Narayan et al. (2007) revealed that the number of nucleation sites is also related to
the surface roughness and particle size. As aforementioned, they defined a surface
interaction parameter (SIP). When SIP is much greater than 1, deposited nanoparticles

30
will multiply nucleation sites by splitting a single nucleation site into multiple ones.
When the ratio is smaller than 1, the nucleation sites also can be increased by creating
new cavities due to the nanoparticle deposition. However, when SIP is near unity, the
deposited nanoparticles sit in nucleation sites and inhibit nucleation.
Bubble growth
Figure 2. 22: High speed camera images of a boiling bubble and corresponding liquid-
vapour phase boundary, temperature, and heat flux distribution at the boiling surface in
nanofluids (Jung and Kim, 2014).
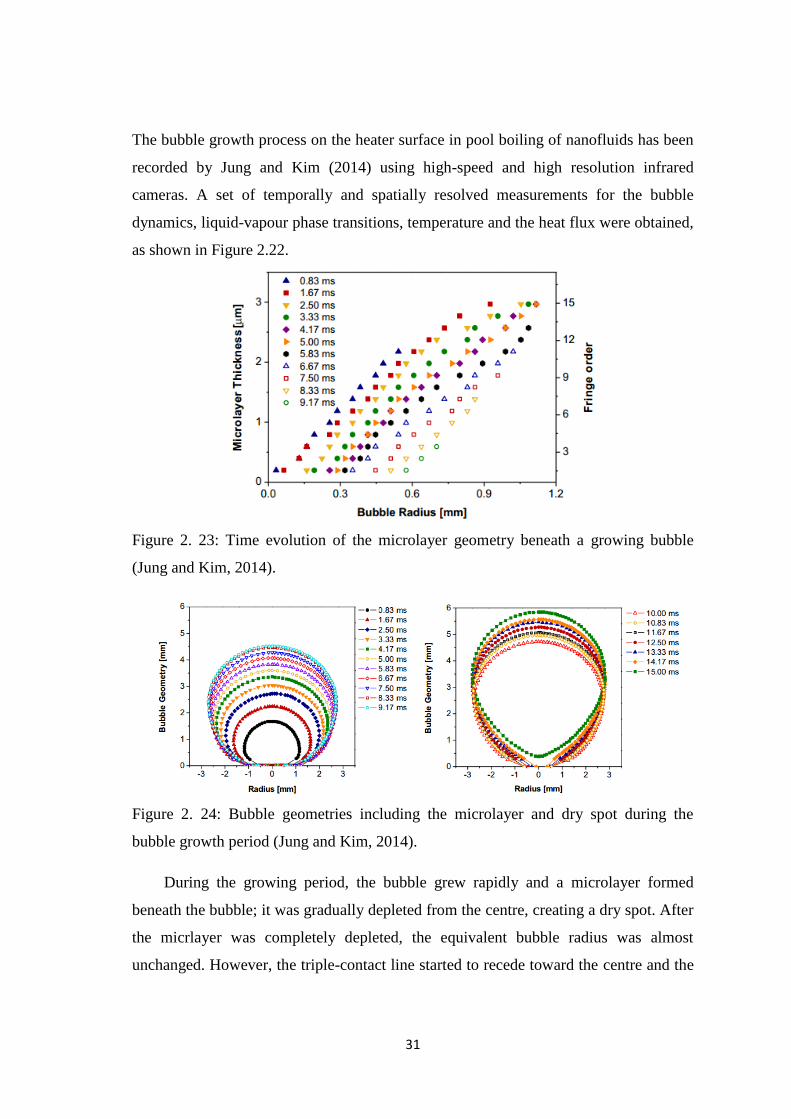
31
The bubble growth process on the heater surface in pool boiling of nanofluids has been
recorded by Jung and Kim (2014) using high-speed and high resolution infrared
cameras. A set of temporally and spatially resolved measurements for the bubble
dynamics, liquid-vapour phase transitions, temperature and the heat flux were obtained,
as shown in Figure 2.22.
Figure 2. 23: Time evolution of the microlayer geometry beneath a growing bubble
(Jung and Kim, 2014).
Figure 2. 24: Bubble geometries including the microlayer and dry spot during the
bubble growth period (Jung and Kim, 2014).
During the growing period, the bubble grew rapidly and a microlayer formed
beneath the bubble; it was gradually depleted from the centre, creating a dry spot. After
the micrlayer was completely depleted, the equivalent bubble radius was almost
unchanged. However, the triple-contact line started to recede toward the centre and the

32
bubble shape changed from spherical to ellipsoidal, being elongated in the vertical
direction. The microlayer thickness was measured, as shown in Figure 2.23. The
growth history of the boiling bubble was also given in Figure 2.24.
The growth time of a bubble on nanoparticle-coated surfaces (contact angle
22~85°) was measured by Phan et al. (2009) with a high speed camera. As shown in
Figure 2.25, the change of the heat flux from 220 to 300 kW/m2 results in 23% mean
decrease of the growth time. Moreover, the growth time increases with the rise of the
surface wettability.
Figure 2. 25: Evolution of grow time as a function of contact angle (Phan et al., 2009).
Bubble departure
When You et al. (2003) investigated the pool boiling of Al2O3/water nanofluids, bubble
departure sizes and frequencies were measured using a high-speed video camera at 240
frames per second. For the photographic measurements, a 390-μm-diameter platinum
wire heater was immersed in the pure water and nanofluid of 0.025 g/l concentration.
Obvious differences of bubbles departing from the wire heater at 300 kW/m2 can be
seen from Figure 2.26, where with the addition of nanoparticles the sizes of bubbles
increases while the bubble departure frequency decreases significantly compared to
those in pure water.

33
Figure 2. 26: Bubbles departing from the wire heater immersed in: (a) pure water; (b)
Al2O3/water nanofluid (0.025 g/l) (You et al., 2003).
The bubble departures on nanoparticle-coated surfaces with various wettability
were also investigated by Phan et al. (2009). They found the departure size and
frequency are closely related to the surface wettability. As shown in Figure 2.27, with
the increase of the surface wettability, larger bubbles were observed. Whereas, a
decreased bubble departure frequency can be found with decreasing the contact angle
(Figure 2.28).
Figure 2. 27: Bubble departure on heater surfaces with various wettability (Phan et al.,
2009).
Figure 2. 28: Bubble departure frequency versus contact angle (Phan et al., 2009).

34
2.2.2.4 Bulk Field Hydrodynamics
As aforementioned, the addition of nanoparticles in nanofluids has comprehensive
effects on the bubble growth and detachment from heater surface. Since liquid motion
arises from free convection and mixing due to bubble growth and detachment from the
heated surface in pool boiling, it is reasonable to extrapolate that those comprehensive
actions induced by nanoparticles can impact the flow filed and temperature distribution
of boiling flows. Recently, this extrapolation has been demonstrated by Dominguez-
Ontiveros et al. (2010). In the experiments, they measured the boiling point temperature
and full-filed velocity in pool boiling of pure water and Al2O3/water nanofluid (0.002
vol%), respectively. Through comparing the velocity profiles obtained by Dynamic
Particle Image Velocimetry (DPIV), the fluid velocity distributions were found to be
generally less uniform and decreased in magnitude for the nanofluid cases than for
those of the pure water case (Figure 2.29). Additionally, corresponding vorticity
distribution maps revealed an increase in magnitude and sign change with increasing
nanofluid concentration which indicated a possible increase in fluid circulation due to
nanoparticles (Dominguez-Ontiveros et al., 2010). This increased fluid circulation can
affect the convective flow of liquid returning to the heated surface which follows the
bubble departure. Since convection account for a significant proportion of the total heat
transfer, besides the above mentioned three influencing factors, the hydrodynamics in
bulk flow filed also play an important role in the boiling heat transfer.
Figure 2. 29: Average full-field velocity profile for pool boiling of: (a) pure water; (b)
Al2O3/water nanofluid (0.002 vol%) (Dominguez-Ontiveros et al., 2010).
The change of hydrodynamics in bulk flow field was also found in flow boiling.
Nayak et al. (2011) studied experimentally the transient and stability behaviours of
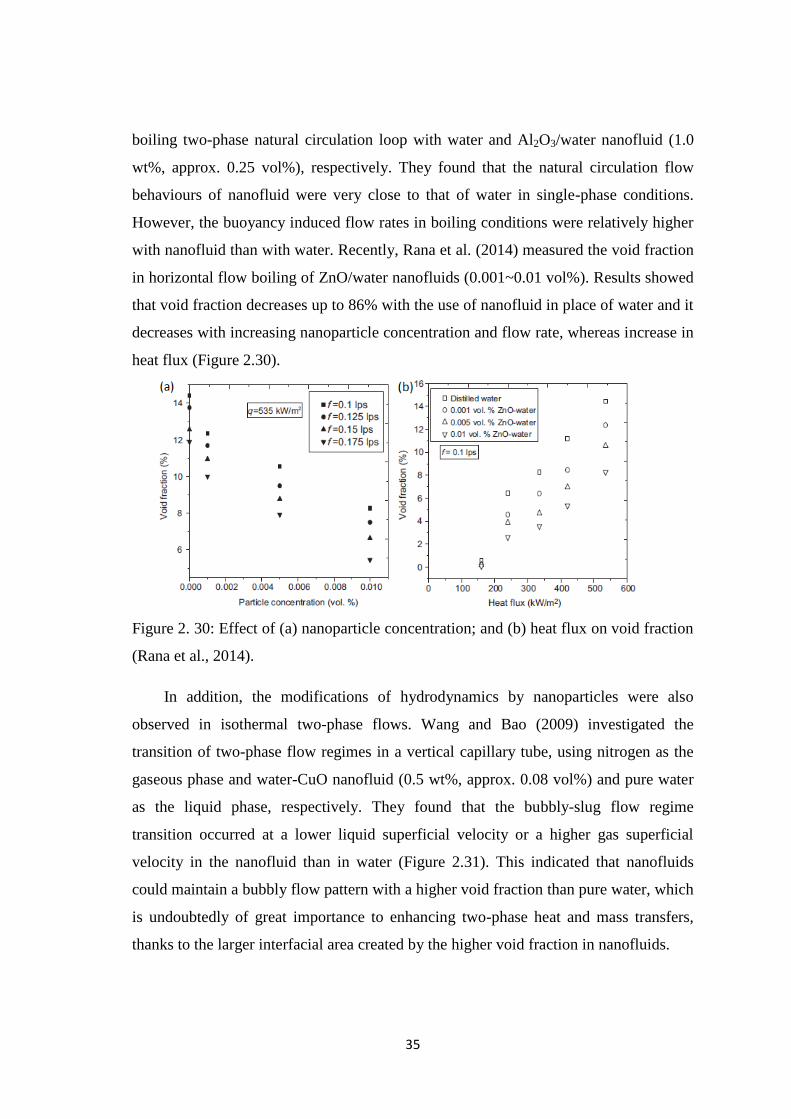
35
boiling two-phase natural circulation loop with water and Al2O3/water nanofluid (1.0
wt%, approx. 0.25 vol%), respectively. They found that the natural circulation flow
behaviours of nanofluid were very close to that of water in single-phase conditions.
However, the buoyancy induced flow rates in boiling conditions were relatively higher
with nanofluid than with water. Recently, Rana et al. (2014) measured the void fraction
in horizontal flow boiling of ZnO/water nanofluids (0.001~0.01 vol%). Results showed
that void fraction decreases up to 86% with the use of nanofluid in place of water and it
decreases with increasing nanoparticle concentration and flow rate, whereas increase in
heat flux (Figure 2.30).
Figure 2. 30: Effect of (a) nanoparticle concentration; and (b) heat flux on void fraction
(Rana et al., 2014).
In addition, the modifications of hydrodynamics by nanoparticles were also
observed in isothermal two-phase flows. Wang and Bao (2009) investigated the
transition of two-phase flow regimes in a vertical capillary tube, using nitrogen as the
gaseous phase and water-CuO nanofluid (0.5 wt%, approx. 0.08 vol%) and pure water
as the liquid phase, respectively. They found that the bubbly-slug flow regime
transition occurred at a lower liquid superficial velocity or a higher gas superficial
velocity in the nanofluid than in water (Figure 2.31). This indicated that nanofluids
could maintain a bubbly flow pattern with a higher void fraction than pure water, which
is undoubtedly of great importance to enhancing two-phase heat and mass transfers,
thanks to the larger interfacial area created by the higher void fraction in nanofluids.

36
Figure 2. 31: Comparisons of the flow pattern transitions among nitrogen-nanofluid,
nitrogen-water/SDBS mixture and nitrogen-water (Wang and Bao, 2009).
Figure 2. 32: Comparison of the local two-phase flow parameters: (a) void fraction; (b)
bubble velocity; (d) IAC; and (d) mean bubble diameter in the bubbly flow regime
(Park and Chang, 2011).

37
Park and Chang (2011) measured the local distributions of air-liquid bubbly flow
parameters in a vertical tube using a conductivity double-sensor probe. Both pure water
and Al2O3/water nanofluid (0.1 vol%) were used as the working liquids. The results
showed that when the operational conditions were exactly the same, the air-nanofluid
bubbly flow had a more flattened void fraction distribution, lower bubble velocity,
higher interfacial area concentration and small bubble size than those in the air-water
flow (Figure 2.32).
2.3 Numerical Modelling of Gas-liquid Flows
In principal, when modelling gas-liquid flows, two distinct considerations have to be
taken into account: (i) Heat transfer process during boiling on the heated surface and (ii)
Two-phase flow and bubble behaviours in the bulk flow. For category (i), the heat
transfer rate during boiling process can normally be calculated by appropriately
partitioning the wall heat flux. The heat flux partitioning (HFP) model (Kurul and
Podowski, 1990) is thus introduced. For category (ii), it has been demonstrated that the
use of two-fluid model (Ishii, 1975) can appropriately predict the local distribution of
flow parameters such as void fraction, bubble velocity, bubble size and interfacial area
concentration.
2.3.1 Numerical Modelling of Boiling Heat Transfer
A number of mechanistic models have been developed for the prediction of wall heat
flux and partitioning. Del Valle and Kenning (1985) concentrated on the formulation of
a mechanistic model for nucleate flow boiling by taking into consideration the bubbly
dynamics at the heated wall. This model employed some of the concepts developed by
Graham and Hentricks (1967) for wall heat flux partitioning during pool nucleate
boiling. The mechanistic model by Kurul and Podowski (1990), which is known as the
heat flux partitioning (HFP) model, is still the most widely employed in the numerical
simulation of boiling heat transfer.
2.3.1.1 Heat Flux Components
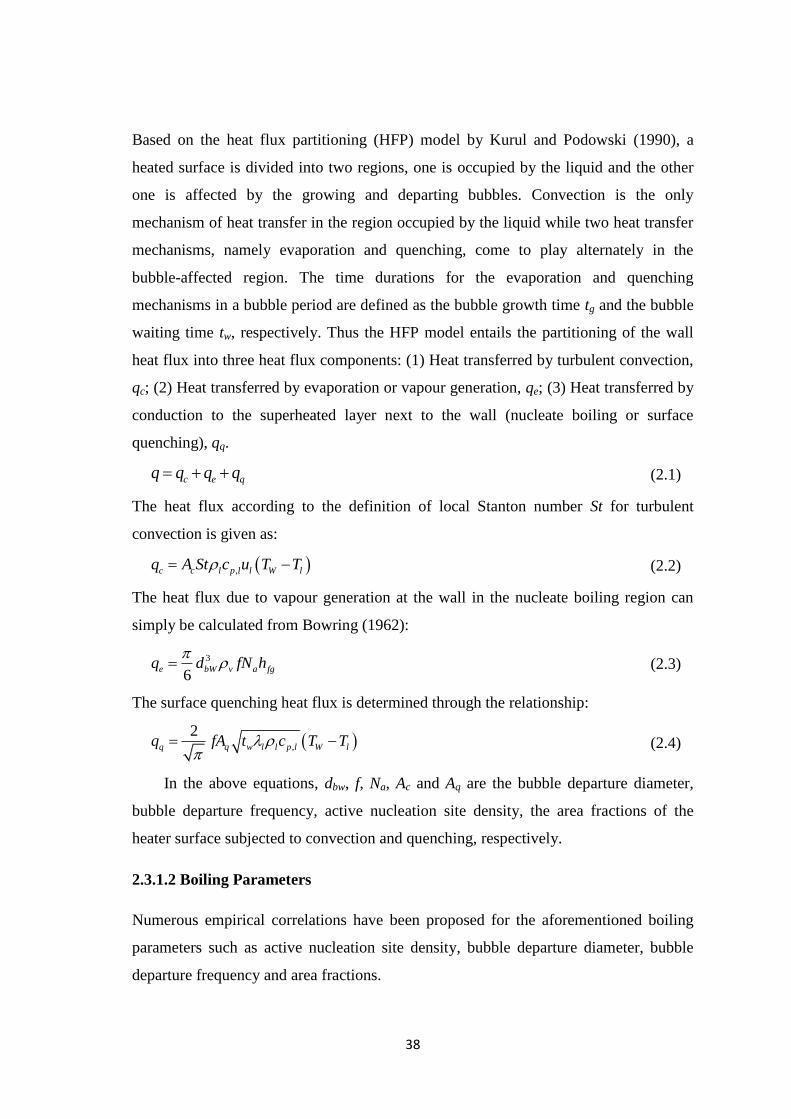
38
Based on the heat flux partitioning (HFP) model by Kurul and Podowski (1990), a
heated surface is divided into two regions, one is occupied by the liquid and the other
one is affected by the growing and departing bubbles. Convection is the only
mechanism of heat transfer in the region occupied by the liquid while two heat transfer
mechanisms, namely evaporation and quenching, come to play alternately in the
bubble-affected region. The time durations for the evaporation and quenching
mechanisms in a bubble period are defined as the bubble growth time tg and the bubble
waiting time tw, respectively. Thus the HFP model entails the partitioning of the wall
heat flux into three heat flux components: (1) Heat transferred by turbulent convection,
qc; (2) Heat transferred by evaporation or vapour generation, qe; (3) Heat transferred by
conduction to the superheated layer next to the wall (nucleate boiling or surface
quenching), qq.
c e qq q q q (2.1)
The heat flux according to the definition of local Stanton number St for turbulent
convection is given as:
,c c l p l l W lq A St c u T T (2.2)
The heat flux due to vapour generation at the wall in the nucleate boiling region can
simply be calculated from Bowring (1962):
3
6e bW v a fgq d fN h
(2.3)
The surface quenching heat flux is determined through the relationship:
,
2q q w l l p l W lq fA t c T T
(2.4)
In the above equations, dbw, f, Na, Ac and Aq are the bubble departure diameter,
bubble departure frequency, active nucleation site density, the area fractions of the
heater surface subjected to convection and quenching, respectively.
2.3.1.2 Boiling Parameters
Numerous empirical correlations have been proposed for the aforementioned boiling
parameters such as active nucleation site density, bubble departure diameter, bubble
departure frequency and area fractions.

39
Active nucleation site density
In a boiling flow, bubbles occur within small pits and cavities on the heated surface
where these nucleation sites are activated when the surface temperature exceeds the
saturation temperature. The number of active small pits and cavities per unit area is
called the active nucleation site density. In terms of the bubble nucleation mechanism
of Bankoff (1958), the availability of cavities on a heater surface for bubble nucleation
is strongly affected by the surface microstructures and wettability. Based on this
mechanism and a cone cavity assumption, Yang and Kim (1988) correlated the active
nucleation site density to the surface microstructures and liquid contact:
,max
,min
2
0
c
c
r
a c cr
N N f d f r dr
(2.5)
where, N is the total number of possible nucleation sites available on a unit heater
surface area, f (β) and f (rc) are the probability density functions for the cone angle and
cavity mouth size, respectively. Unfortunately, due to the diversity and inherent
complexity of realistic heater surfaces, it‘s not easy to formulate a universal active site
density correlation based on Equation 2.5.
As a simplification, the active nucleation site density has been widely correlated to
the wall superheat and some other parameters such as the liquid contact angle. Among
them, the correlations (Equation 2.6~2.9) proposed by Lemmert and Chwala (1977),
Wang and Dhir (1993), Basu et al. (2002) and Hibiki and ishii (2003) are highly
regarded in terms of accuracy for nucleate boiling of pure lqiuids.
1.805
210( )a sat wN T T (2.6)
6.0
29 27.81 10 1 cos sat
a n
g fg sup
TN C
h T
(2.7)
4 2.0
5.3
0.34 10 1 cos 15
0.34 1 cos 15
sup ONB sup
a
sup sup
T T T KN
T K T
(2.8)
25 64.72 10 1 exp( ) exp 2.5 10 ( ) 1
4.17 2
sup g fg
a
sat
T hN f
T
(2.9)
Bubble departure diameter

40
A number of studies examining bubble growth and detachment have resulted in a
number of different empirical correlations for bubble departure. Tolubinsky and
Kostanchuk (1970) proposed a simple relationship which evaluated the bubble
departure diameter as a function of the subcooling temperature as:
min 0.0006exp ,0.0001445
subbw
Td
(2.10)
On the basis of the balance between the buoyancy and surface tension forces at the
heater surface, Frize (1935) proposed a correlation which includes the contact angle of
the bubble:
0.0208bw
l g
dg
(2.11)
Bubble departure frequency
For the bubble departure frequency, most correlations have been derived from the
consideration of the bubble departure diameter. Cole‘s correlation (1960) which was
derived assuming a balance between buoyancy and drag (drag coefficient constant) for
pool nucleate boiling is a popular expression. It is in the form of:
4
3
l g
bw l
gf
d
(2.12)
Area fractions
The area fractions of the heater surface subjected to quenching Aq is usually given by:
2
4
bwq a
dA N K
(2.13)
where the empirical constant K is used to account for the area of the heater surface
influenced by the bubble. A value of K=4 is often recommended. However, Kenning
(1981) have found values ranging between 2 and 5. Judd and Hwang (1976) ascertained
that a lower value, K=1.8, best fitted their experimental data. Tu and Yeoh (2002)
incorporated a Jacob number (Jasub) based on liquid subcooling dependence:
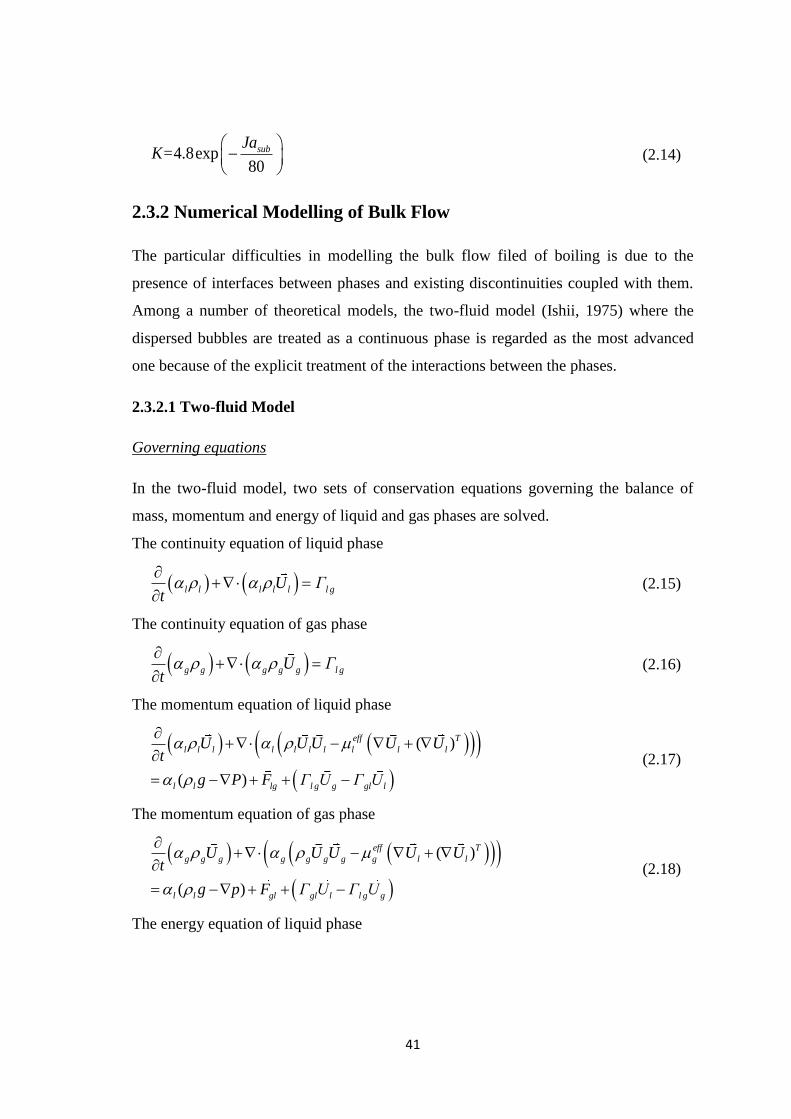
41
4.8exp80
subJaK=
(2.14)
2.3.2 Numerical Modelling of Bulk Flow
The particular difficulties in modelling the bulk flow filed of boiling is due to the
presence of interfaces between phases and existing discontinuities coupled with them.
Among a number of theoretical models, the two-fluid model (Ishii, 1975) where the
dispersed bubbles are treated as a continuous phase is regarded as the most advanced
one because of the explicit treatment of the interactions between the phases.
2.3.2.1 Two-fluid Model
Governing equations
In the two-fluid model, two sets of conservation equations governing the balance of
mass, momentum and energy of liquid and gas phases are solved.
The continuity equation of liquid phase
l l l l l l gU Γt
(2.15)
The continuity equation of gas phase
g g g g g l gU Γt
(2.16)
The momentum equation of liquid phase
( )
( )
eff T
l l l l l l l l l l
l l lg l g g gl l
U U U U Ut
g P F Γ U Γ U
(2.17)
The momentum equation of gas phase
( )
( )
eff T
g g g g g g g g l l
l l gl gl l l g g
U U U U Ut
g p F Γ U Γ U
(2.18)
The energy equation of liquid phase

42
l l l l l l l l l
lg lg g l lg g gl l
H U H Tt
h A T T Γ H Γ H
(2.19)
The energy equation of gas phase
g g g g g g g g g
lg lg l g gl l lg g
H U H Tt
h A T T Γ H Γ H
(2.20)
Inter-phase mass transfer
In subcooled boiling flow, the source term l gΓ in Equation 2.1 represents the mass
transfer rate due to condensation in the bulk subcooled liquid. It can be expressed by:
fg lg sat l
lg
fg
h A T TΓ
h
(2.21)
where Tsat and hfg represent the saturation temperature and the latent heat of
vaporization, respectively.
Inter-phase momentum transfer
The inter-phase momentum transfer is mainly the interfacial force which generally
includes the forces due to viscous drag , the lateral lift , the wall lubrication ,
and the turbulent dispersion , which are defined by the following equations:
lg gl D L TD WF F F F F F (2.22)
The drag force is one of the most important forces encountered in bubbly flows,
and it dominantly controls the relative motion of each phase. The inter-phase
momentum transfer between gas and liquid due to drag force is given by:
3
4
DD g l g l g l
b
CF U U U U
d (2.23)
The drag coefficient CD in Equation 2.23 is empirically correlated by Ishii and Zuber
(1979) to the bubble Reynolds number Reb and Eötvös number Eo:

43
0.5
0.75
0 0.2
0.2 1000
1000
24
24 1 0.1
2
3
b
D b
b
b
b
b
Re
C Re
Eo Re
Re
Re
Re
(2.24)
Reb and Eo are defined by:
g lg b
b
l
ReU U d
(2.25)
2
l g bEo
g d
(2.26)
The lift force generally acts in the direction normal to the relative motion of
fluid and bubbles, and largely controls the transverse motion of bubbles in a vertical
flow. It can be described according to Drew and Lahey (1987):
L L g l g l lF C U U U
(2.27)
The empirical Tomiyama correlation (1998) is generally used to calculate the lift
coefficient CL:
*3 *2
* *
* * *
*
min 0.288, tanh(0.121 , ( )) 4
( ) 0.00105 0.0159 0.0204 0.474 4 10
0.27 10
b
L
Re f Eo Eo
C f Eo Eo Eo Eo Eo
Eo
(2.28)
where Eo* is the modified Eötvös number based on the maximum bubble horizontal
dimension dH that can be computed by using the empirical correlation given by Wellek
et al. (1966).
2
*( )
l g Hg d
Eo
(2.29)
1 3
0.7571 0.163H b
d d Eo (2.30)
The wall lubrication force tends to push the bubbles away from the wall. It acts
normal to the wall and decays with distance. According to Antal et al. (1991), it is
usually given by:
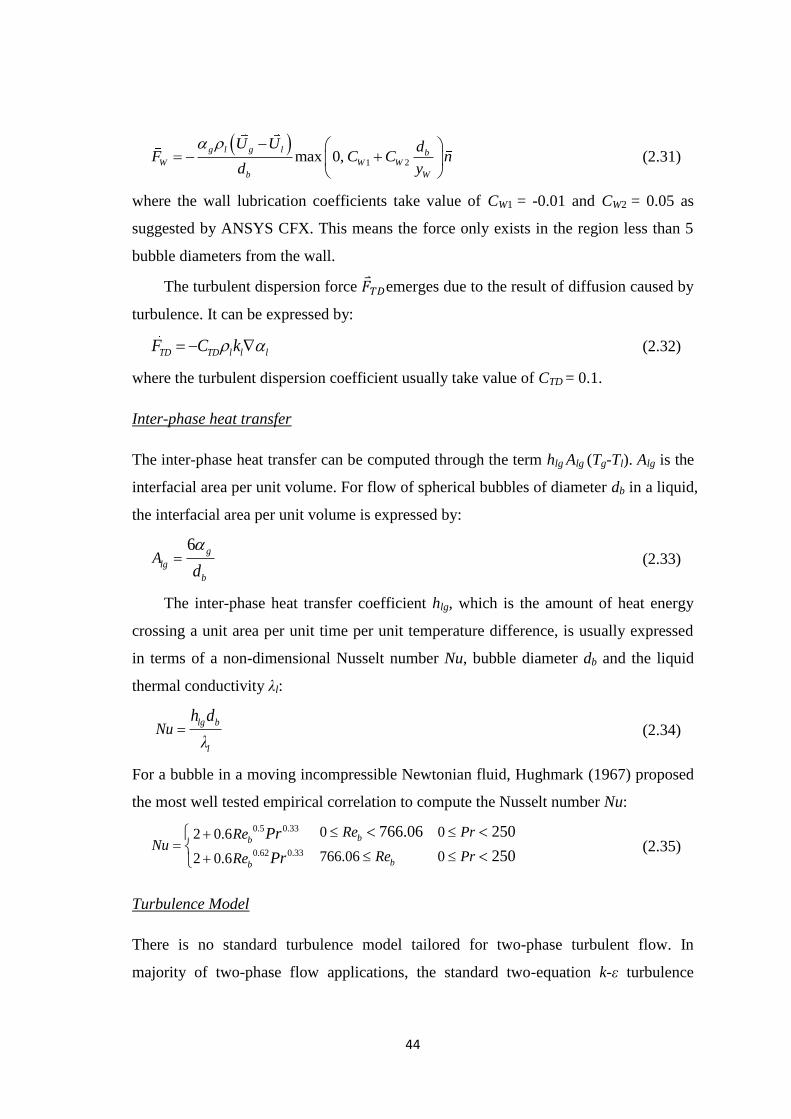
44
1 2max 0,
g l g l bW W W
b W
U U dF C C n
d y
(2.31)
where the wall lubrication coefficients take value of CW1 = -0.01 and CW2 = 0.05 as
suggested by ANSYS CFX. This means the force only exists in the region less than 5
bubble diameters from the wall.
The turbulent dispersion force emerges due to the result of diffusion caused by
turbulence. It can be expressed by:
TD TD l l lF C k
(2.32)
where the turbulent dispersion coefficient usually take value of CTD = 0.1.
Inter-phase heat transfer
The inter-phase heat transfer can be computed through the term hlg Alg (Tg-Tl). Alg is the
interfacial area per unit volume. For flow of spherical bubbles of diameter db in a liquid,
the interfacial area per unit volume is expressed by:
6 g
lg
b
Ad
(2.33)
The inter-phase heat transfer coefficient hlg, which is the amount of heat energy
crossing a unit area per unit time per unit temperature difference, is usually expressed
in terms of a non-dimensional Nusselt number Nu, bubble diameter db and the liquid
thermal conductivity λl:
lg b
l
Nuh d
λ (2.34)
For a bubble in a moving incompressible Newtonian fluid, Hughmark (1967) proposed
the most well tested empirical correlation to compute the Nusselt number Nu:
0.5 0.33
0.62 0.33
0 02 0.6
766.06 02 0.6
766.06 250
250
bb
bb
Re PrReNu
Re PrRe
Pr
Pr
(2.35)
Turbulence Model
There is no standard turbulence model tailored for two-phase turbulent flow. In
majority of two-phase flow applications, the standard two-equation k-ε turbulence

45
model is employed to resolve the turbulent flow associated with the continuous liquid
and dispersed gas phases, even though it has been found to predict relatively high gas
void fraction close to the wall (Frank et al., 2004). Considering the bubble-induced
turbulence, Sato and Sekoguchi (1981) proposed a new turbulent model where the
effective viscosity
of the continues phase in Equation 2.36 consists of the laminar
, liquid shear-induced turbulent
and bubble-induced turbulent viscosities.
eff lam Tl Tb
l l l l (2.36)
The liquid shear-induced turbulent viscosity is given by:
2Tl ll l
l
kC
(2.37)
and the bubble-induced turbulent viscosity is evaluated according to:
Tbg ll l b g bC d U U (2.38)
in which the constants Cμ and Cμb take on values of 0.09 and 1.2, respectively. Effective
viscosity in the gas phase can now be simply evaluated as:
geff eff
g l
l
(2.39)
2.3.2.2 MUtiple-SIze-Group (MUSIG) Model
In the two-fluid model, the gas phase is characterised by a single mean diameter db. The
bubbles are therefore assumed to have the same size and shape throughout the domain.
In reality bubbles in the liquid phase have a wide spectrum of bubble sizes and shapes,
particularly, when they break up and coalescence. In order to handle dispersed
multiphase flows in which the dispersed phase has a large variation in size, the
MUltiple-SIze-Group (MUSIG) model was developed by Lo (1996). It provides a
framework in which the population balance method together with the break-up and
coalescence models can be coupled together. In the model, the bubbles are divided into
N size groups and each of these size groups can be treated as a separate phase in a
multiphase flow calculation. This multiphase flow therefore has N sets of continuity
equations. For the ith group bubbles (ith=1~N), the continuity equation is as the
following:
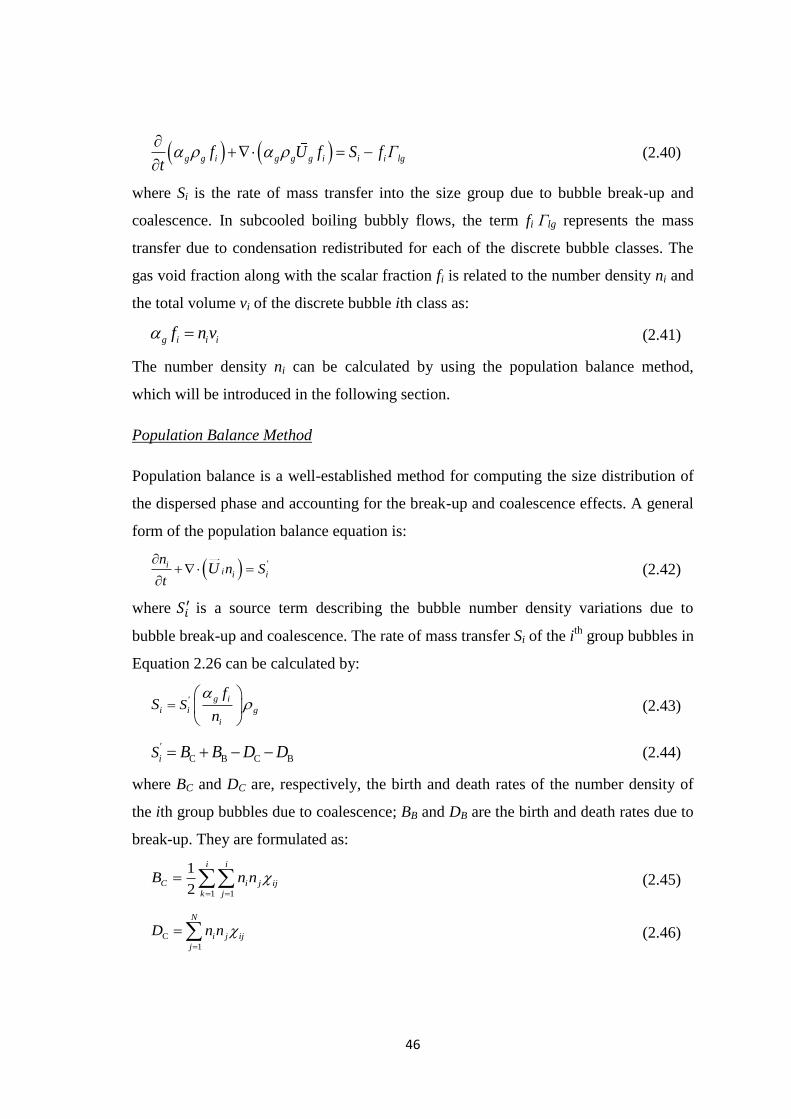
46
g g i g g g i i i lgf U f S f Γt
(2.40)
where Si is the rate of mass transfer into the size group due to bubble break-up and
coalescence. In subcooled boiling bubbly flows, the term fi Γlg represents the mass
transfer due to condensation redistributed for each of the discrete bubble classes. The
gas void fraction along with the scalar fraction fi is related to the number density ni and
the total volume vi of the discrete bubble ith class as:
g i i if n v (2.41)
The number density ni can be calculated by using the population balance method,
which will be introduced in the following section.
Population Balance Method
Population balance is a well-established method for computing the size distribution of
the dispersed phase and accounting for the break-up and coalescence effects. A general
form of the population balance equation is:
'ii i i
nn S
tU
(2.42)
where is a source term describing the bubble number density variations due to
bubble break-up and coalescence. The rate of mass transfer Si of the ith
group bubbles in
Equation 2.26 can be calculated by:
g i'
i i g
i
Sf
Sn
(2.43)
C B C B
'
iS B B D D (2.44)
where BC and DC are, respectively, the birth and death rates of the number density of
the ith group bubbles due to coalescence; BB and DB are the birth and death rates due to
break-up. They are formulated as:
1 1
1
2
i i
C i j ij
k j
B n n
(2.45)
C
1
N
i j ij
j
D n n
(2.46)
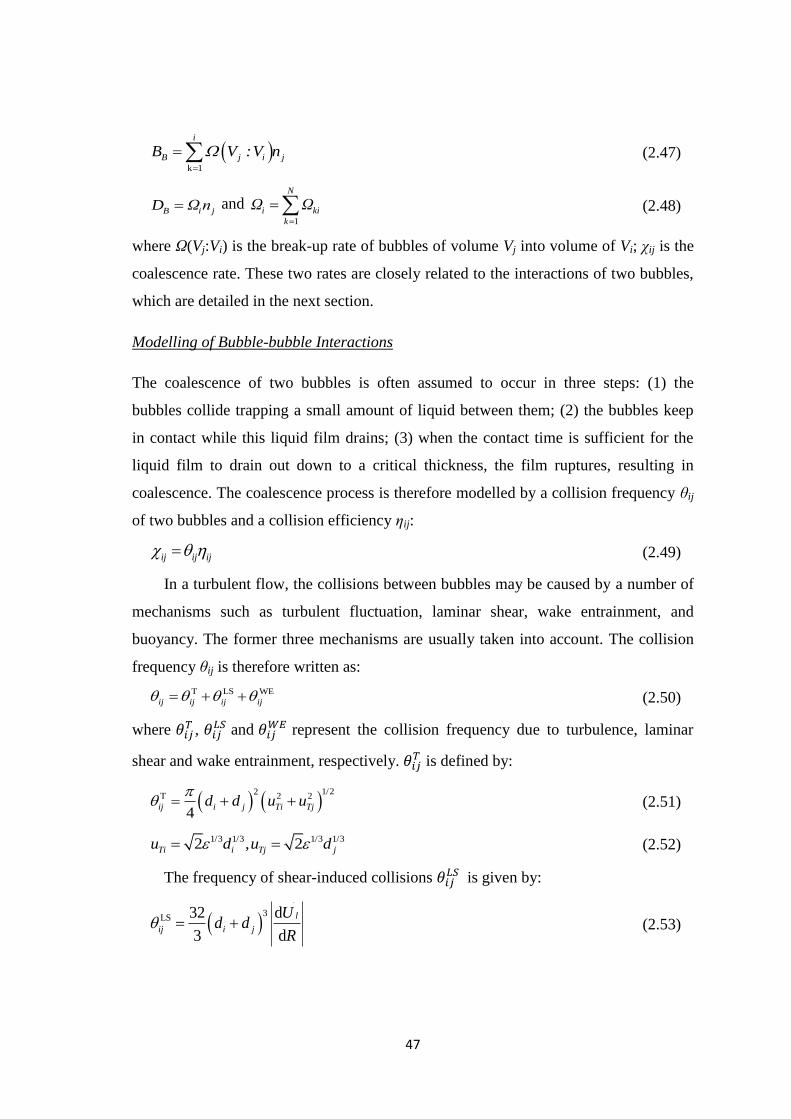
47
k 1
i
B j i jB V :V n
(2.47)
B i jD Ωn and 1
N
i ki
k
Ω Ω
(2.48)
where Ω(Vj:Vi) is the break-up rate of bubbles of volume Vj into volume of Vi; χij is the
coalescence rate. These two rates are closely related to the interactions of two bubbles,
which are detailed in the next section.
Modelling of Bubble-bubble Interactions
The coalescence of two bubbles is often assumed to occur in three steps: (1) the
bubbles collide trapping a small amount of liquid between them; (2) the bubbles keep
in contact while this liquid film drains; (3) when the contact time is sufficient for the
liquid film to drain out down to a critical thickness, the film ruptures, resulting in
coalescence. The coalescence process is therefore modelled by a collision frequency ζij
of two bubbles and a collision efficiency εij:
ij ij ij (2.49)
In a turbulent flow, the collisions between bubbles may be caused by a number of
mechanisms such as turbulent fluctuation, laminar shear, wake entrainment, and
buoyancy. The former three mechanisms are usually taken into account. The collision
frequency ζij is therefore written as:
T LS WE
ij ij ij ij (2.50)
where ,
and represent the collision frequency due to turbulence, laminar
shear and wake entrainment, respectively. is defined by:
1/22
T 2 2
4ij i j Ti Tjd d u u
(2.51)
1/3 1/3 1/3 1/32 , 2Ti i Tj ju d u d (2.52)
The frequency of shear-induced collisions is given by:
3
LS 32 d
3 d
l
ij i j
Ud d
R (2.53)

48
When bubbles enter the wake region of a leading bubble, they will accelerate and
may collide with the preceding one, resulting in bubble coalescence. This mechanism is
accounted using the model proposed by Wang et al. (2005):
WE 2
ij i siK d u (2.54)
where K is a constant ( K=15.4), usi is the slip velocity defined by:
0.71si iu gd (2.55)
The parameter Θ is introduced in consideration that only bubbles larger than dcr/2
have a wake region effect for bubble coalescence.
6
6 6
/ 2/ 2
/ 2 / 2
0 / 2
i cr
i cr
i cr cr
i cr
d dd d
= d d d
d d
(2.56)
4cr
l g
dg
(2.57)
According to Coulaloglou, the collision efficiency εij is determined by the actual
contact time ηij and the drainage time tij, which is the time required for the liquid film to
thin down to a critical thickness.
expij
ij
ij
t=
(2.58)
To estimate the bubble contact time ηij in a turbulent system, the correlation
developed by Levich et al. is widely used:
2/3
1/3
ij
ij
r
(2.59)
1
1 1 1
2ij
i j
rr r
(2.60)
The drainage time tij is calculated according to Prince and Blanch:
1/23
ln16
ij l 0ij
f
r ht
h
(2.61)
Luo and Svendsen (1996) developed a theoretical model for the break-up of
bubbles in turbulent dispersions. In this model, binary break-up of the bubbles is
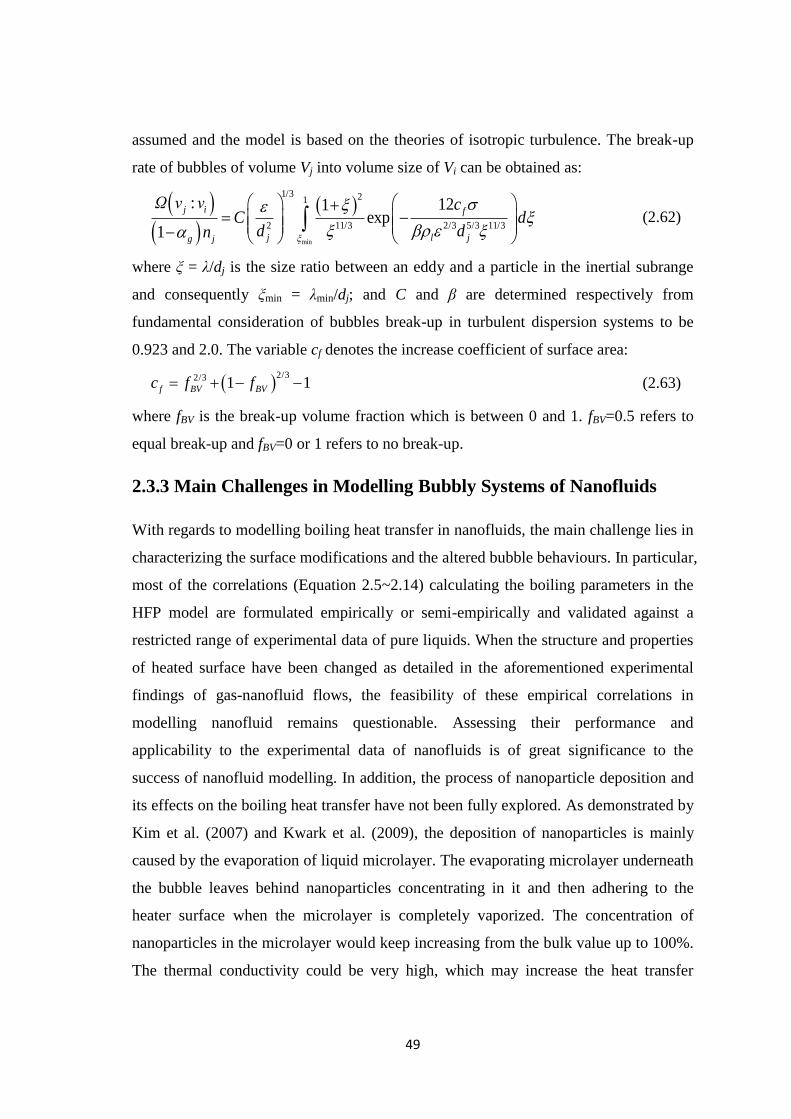
49
assumed and the model is based on the theories of isotropic turbulence. The break-up
rate of bubbles of volume Vj into volume size of Vi can be obtained as:
min
1/3 21
2 11/3 2/3 5/3 11/3
: 121exp
1
j i f
j l jg j
Ω v v cC d
d dn
(2.62)
where ξ = λ/dj is the size ratio between an eddy and a particle in the inertial subrange
and consequently ξmin = λmin/dj; and C and β are determined respectively from
fundamental consideration of bubbles break-up in turbulent dispersion systems to be
0.923 and 2.0. The variable cf denotes the increase coefficient of surface area:
2/32/3 1 1f BV BVc f f (2.63)
where fBV is the break-up volume fraction which is between 0 and 1. fBV=0.5 refers to
equal break-up and fBV=0 or 1 refers to no break-up.
2.3.3 Main Challenges in Modelling Bubbly Systems of Nanofluids
With regards to modelling boiling heat transfer in nanofluids, the main challenge lies in
characterizing the surface modifications and the altered bubble behaviours. In particular,
most of the correlations (Equation 2.5~2.14) calculating the boiling parameters in the
HFP model are formulated empirically or semi-empirically and validated against a
restricted range of experimental data of pure liquids. When the structure and properties
of heated surface have been changed as detailed in the aforementioned experimental
findings of gas-nanofluid flows, the feasibility of these empirical correlations in
modelling nanofluid remains questionable. Assessing their performance and
applicability to the experimental data of nanofluids is of great significance to the
success of nanofluid modelling. In addition, the process of nanoparticle deposition and
its effects on the boiling heat transfer have not been fully explored. As demonstrated by
Kim et al. (2007) and Kwark et al. (2009), the deposition of nanoparticles is mainly
caused by the evaporation of liquid microlayer. The evaporating microlayer underneath
the bubble leaves behind nanoparticles concentrating in it and then adhering to the
heater surface when the microlayer is completely vaporized. The concentration of
nanoparticles in the microlayer would keep increasing from the bulk value up to 100%.
The thermal conductivity could be very high, which may increase the heat transfer
50
between the wall and the nanofluid. Thus the partitioning of the wall heat flux in
boiling flow of nanofluid might entail more heat flux components.
Due to nanoparticle‘s small size, nanoparticles in a nanfluid are thought to be
mixed with the base liquid at near-molecular level. A dilute nanofluid thus can be
treated as a single liquid in spite of the presence of two distinct phases. This has
allowed in the literature developing thermal-fluid dynamic models for nanofluids based
on the classic Navier-Stoke equations. The numerical works by Palm et al. (2006), Fard
et al. (2010) and Demir et al. (2011) demonstrated that a single-phase CFD model in
which the liquid-nanoparticle suspension is treated as a single phase has an accuracy
comparable to that of a two-phase model in which the liquid phase and the particle
phase are treated separately, provided the suspension properties are properly formulated.
Therefore, it is reasonable to extrapolate that the two-fluid model is applicable to the
gas-nanofluid bubbly flows with and without heat transfer. However, as mentioned by
Ishii and Mishima (1984), the closure correlations describing the interfacial transports
are the weakest link in a two-fluid model due to the considerable difficulties in terms of
experimentation and modelling. Most of these closure equations are empirical or semi-
empirical. In order to achieve an effective modelling of gas-nanofluid bubbly flows,
these closure correlations have to be carefully reformulated or selected to account for
the specific features induced by nanoparticles. Moreover, as shown in Figure 2.32,
under exactly the same injecting conditions, most of the measured bubble diameters in
nanofluids were between 2mm to 5mm, which were much smaller than those ranging
from 3 mm to 10 mm in water. Since bubble coalescence and break-up dominates the
bubble sizes in two-phase flows, questions about the role that nanoparticles have played
in resisting coalescence or encouraging break-up arise from this interesting
phenomenon. Therefore, remodelling the bubble coalescence and break-up is another
challenge for modelling gas-nanofluid bubbly flows.

51
Chapter 3
Numerical Modelling of Boiling Heat
Transfer in Dilute Nanofluids
The main findings of this chapter have been included in:
Yuan, Y., Li, X. D., and Tu, J. Y. (2015). Numerical investigation of nucleate
boiling parameters in heat flux partitioning model for nanofluids. Journal of
Tsinghua University (Science and Technology), 55(7): 815-820.
Li, X. D., Yuan, Y., and Tu, J. Y. (2015). A parameter study of the heat flux
partitioning model for nucleate boiling of nanofluids. International Journal of
Thermal Science, 98: 42-50.
Li, X. D., Yuan, Y., and Tu, J. Y. (2015). A theoretical model for nucleate
boiling of nanofluids considering the nanoparticle Brownian motion in the
liquid microlayer. International Journal of Heat and Mass Transfer, 91: 467-
476.

52
3.1 A Parametric Study of the Heat Flux Partitioning Model
for Nucleate Boiling of Nanofluids
Abstract:
The dramatic boiling heat transfer performances of nanofluids have been widely
attributed to the nanoparticle deposition during the boiling process. The deposited
nanoparticles significantly change the microstructures and properties of the heater
surface, and hence alter the characteristics of bubble nucleation and departure.
Therefore, it is crucial to take into account the effects of nanoparticle deposition when
modeling nucleate boiling of nanofluids using the heat flux partitioning (HFP) model
(Kurul and Podowski, 1990). In this study, new closure correlations were incorporated
for the nucleate boiling parameters including the active site density, the bubble
departure diameter and frequency. Parametric studies were performed through 2-D
computations to analyze the effects of surface wettability enhancement, the
nanoparticle material and size, respectively. The results demonstrated that through
appropriate considering the modifications induced by nanoparticle deposition, the HFP
model achieved a satisfactory agreement with the experimental data available in the
literature, and provided a more feasible and mechanistic approach than the classic
Rohsenow correlation for predicting nucleate pool boiling of nanofluids.
3.1.1 Introduction
As a new type of engineered fluids, nanofluids have gained an increasing attention due
to their enhanced properties associated with heat transfer (Choi and Eastman, 1995).
Since 2003 when Das et al. (2003a) and You et al. (2003) pioneered the studies on
boiling of nanofluids, an exponentially increasing number of analogous investigations
have been conducted with the aim to reveal the mechanisms underlying the dramatic
heat transfer performances and novel phenomena observed in boiling nanofluids.
With a view to the practical feasibility, dilute nanofluids, typically with a
nanoparticle concentration lower than 0.1% by volume, are generally preferred due to
their improved colloidal stability and negligibly altered physical properties from those
of their pure base liquids. Kim et al. (2007) measured the properties of several dilute

53
aqueous nanofluids (Al2O3/water, ZrO/water and SiO2/water with concentrations of
0.001 vol%, 0.01 vol% and 0.1 vol%) and compared them with those of pure water.
The results demonstrated that the saturation temperature of these nanofluids was within
±1 ºC of that of pure water while their surface tension, thermal conductivity and
viscosity were negligibly changed. However, significant critical heat flux (CHF)
enhancement up to 60% was detected in these nanofluids. These specific features of
dilute nanofluids allow the minimum modification of existing heat removal systems
and have made them ideal working fluids for heat transfer enhancement in many
industrial equipments including nuclear reactors (Buongiorno et al., 2009) and high-
power electronic devices (Faulkner et al., 2003).
For the purpose of system design and performance assessment, a robust model
capable of predicting heat transfer by boiling nanofluids is in great demand. Due to the
near-molecular mixing (Wen et al., 2009) between the nanoparticles and the base liquid,
a dilute nanofluid behaves hydro-dynamically like its pure base liquid and can be
numerically treated as a single liquid phase despite the existence of two phases. This
has allowed in the literature developing thermal-fluid dynamic models (Palm, Roy et al.,
2006) for nanofluids based on computational fluid dynamics (CFD). For vapor-liquid
two-phase flows of nanofluids with heat and mass transfer, our recent study (Li et al.,
2014) demonstrated that the two-fluid model (Ishii, 1975) is still applicable. However,
due to the specific phenomena observed boiling nanofluids such as surface
modifications (Wen, Corr et al., 2011) and flow modifications (Dominguez-Ontiveros
et al., 2010) which are not presented in nucleate boiling of pure liquids, the closure
correlations/models of the two-fluid model have to be properly reformulated to account
for the specific features induced by the existence of nanoparticles.
A comprehensive literature survey (Vafaei and Borca-Tasciuc, 2013) revealed that
the forming of a porous layer of deposited nanoparticles on the heater surface, which is
believed to be caused by evaporation of the liquid microlayer, is one of the common
findings of most experimental studies on nucleate boiling of nanofluids. This porous
layer not only changes the surface morphology and properties, but also alters the
characteristics of bubble nucleation and departure, and is widely believed to be the
essential cause of the dramatic boiling heat transfer performance of nanofluids.

54
Therefore, as proven in our recent study (Li et al., 2014), the key issue when
formulating a theoretical model for nucleate boiling of dilute nanofluids is to
characterize the surface modifications and the altered bubble nucleation behaviors.
Therefore in this study, new closure correlations were incorporated into the heat
flux partitioning (HFP) model by Kurul and Podowski (1990) in order to capture the
characteristics of heat and mass transfer on nanoparticle-deposited heater surfaces.
Parametric studies were performed to analyze the effects of the improved surface
wettability and altered surface roughness on bubble nucleation and departure. The HFP
model was then incorporated as a boundary condition into the fully validated two-fluid
model for boiling flows (Tu and Yeoh, 2002; Li et al., 2007) and 2-D numerical
computations were conducted using the commercial CFD code CFX 4.4. The numerical
results were compared against both the experimental data available in the literature and
the classic Rohsenow pool boiling correlation.
3.1.2 The Heat Flux Partitioning (HFP) Model
Although the morphology and properties of the heater surface have been significantly
changed by the deposited nanoparticles, the boiling heat transfer mechanisms involved
on a nano-coated surface are believed to keep unchanged as those on a clean surface.
Therefore, the HFP model proposed by Kurul and Podowski (1990) is still
mechanistically applicable to nucleate boiling of nanofluids. According to the HFP
model, the heat flux from a heater surface is transferred into the fluids through three
mechanisms, namely the evaporation, quenching and convection mechanisms by
c e qq q q q (3.1)
where, qe, qq and qc represent the heat flux components transferred by evaporation,
quenching and convection, respectively.
3
6e bW v a fgq d fN h
(3.2)
,
2q q w l l p l W lq fA t c T T
(3.3)
,c c l p l l W lq A St c u T T (3.4)

55
where, dbW, f, Na, tw, Ac and Aq are the bubble departure diameter, bubble departure
frequency, active site density, bubble waiting time, the area fractions of the heater
surface subjected to convection and quenching, respectively. Due to the inherent
complexity of bubble nucleation and departure, these parameters are generally
formulated empirically or semi-empirically. Although a number of correlations are
available in the literature and some of them have been fully validated for boiling of
pure liquids, however, their applicability for nanofluids is still open to question. For the
purpose of effective modeling, the nucleate boiling parameters have to be carefully
formulated.
3.1.2.1 The Active Site Density
According to the classic Bankoff bubble nucleation mechanism, the availability of
cavities on a heater surface for bubble nucleation is strongly affected by the surface
microstructures and wettability. Based on this mechanism and a cone cavity assumption,
Yang and Kim (1988) correlated the active site density to the surface microstructures
and liquid contact
,max
,min
2
0
c
c
r
a c cr
N N f d f r dr
(3.5)
where, N is the total number of possible nucleation sites available on a unit heater
surface area, f (β) and f (rc) are the probability density functions for the cone angle (β)
and cavity mouth size (rc), respectively. The key issue when applying the Yang-Kim
correlation is to provide statistical parameters for the surface microstructures (f (β) and
f (rc)), which depends on the heater material and surface polishing and have to be
determined experimentally. Unfortunately, due to the diversity and inherent complexity
of realistic heater surfaces, it‘s anything but an easy job to formulate a universal active
site density correlation based on Equation 3.5.
As a simplification, the active site density has been widely correlated to the wall
superheat and some other parameters such as the liquid contact angle and the surface
roughness. Among them, the correlations proposed by Benjamin and Balakrishnan
(1997), Wang and Dhir (1993) and Basu et al. (2002) are highly regarded in terms of
accuracy for nucleate boiling of water (Hibiki and Ishii, 2003). However, a recent
comparison (Li et al., 2014) of these correlations against the experimental data of

56
aqueous nanofluids proved that they are actually not applicable to nanofluids. This is
perhaps due to the fact that they are empirical and limited to pure liquids. For
nanofluids, the active density needs to be reformulated so that the effects impacted by
the nanoparticles could be taken into account.
It is widely believed that the deposited nanoparticles affect bubble nucleation
through two ways (Kim et al., 2007). Firstly, they alter the total number of sites
available for bubble nucleation by changing the microstructures of the heater surface.
Secondly, the deposited nanoparticles largely improve the wettability of the heater
surface, which causes a part of the nucleation sites being flooded by the liquid and
cannot be activated. Therefore, it is crucial to take both the morphology and property
modifications into account when modelling the active site density of nanofluids.
In order to describe the effects of nanoparticle deposition on bubble nucleation,
Ganapathy and Sajith (2013) proposed a semi-analytic correlation for the active site
density based on the Benjamin-Balakrishnan correlation (Benjamin and Balakrishnan,
1997), in which both the wettability enhancement and the nanoparticle size relative to
the surface roughness were considered
0.40.52
1.63 3 31218.8 14.5 4.5 0.4a a a
a l sup
p
R P R P RN Pr T
d
(3.6)
where P, Ra and dp stand for the pressure, average surface roughness and
nanoparticle diameter, respectively. γ is the wall-liquid interaction parameter
determined by the surface and liquid materials and β is the surface wettability
improvement parameter defined by
*
1 cos
1 cos
(3.7)
where ζ and ζ* are the liquid contact angles on the nanocoated surface and clean
surface, respectively. Comparing Equation 3.6 with the Benjamin-Balakrishnan
correlation (Benjamin and Balakrishnan, 1997), it is clear that the term β-3
accounts for
the improved surface wettability and (Ra/dp)-0.5
describes the change of surface
roughness.
Equation 3.6 was plotted in Figure 3.1 and was compared against the experimental
data of nanofluids by Gerardi et al. (2011). Figure 3.1 indicated that the Ganapathy-
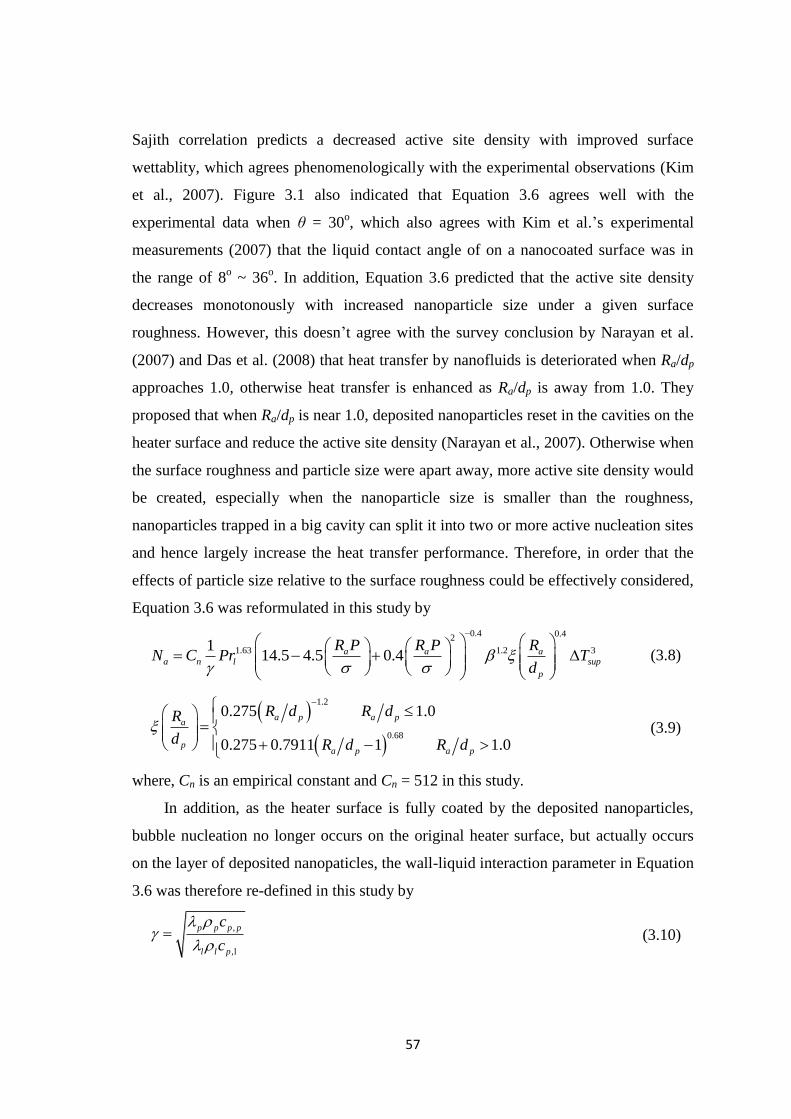
57
Sajith correlation predicts a decreased active site density with improved surface
wettablity, which agrees phenomenologically with the experimental observations (Kim
et al., 2007). Figure 3.1 also indicated that Equation 3.6 agrees well with the
experimental data when ζ = 30o, which also agrees with Kim et al.‘s experimental
measurements (2007) that the liquid contact angle of on a nanocoated surface was in
the range of 8o ~ 36
o. In addition, Equation 3.6 predicted that the active site density
decreases monotonously with increased nanoparticle size under a given surface
roughness. However, this doesn‘t agree with the survey conclusion by Narayan et al.
(2007) and Das et al. (2008) that heat transfer by nanofluids is deteriorated when Ra/dp
approaches 1.0, otherwise heat transfer is enhanced as Ra/dp is away from 1.0. They
proposed that when Ra/dp is near 1.0, deposited nanoparticles reset in the cavities on the
heater surface and reduce the active site density (Narayan et al., 2007). Otherwise when
the surface roughness and particle size were apart away, more active site density would
be created, especially when the nanoparticle size is smaller than the roughness,
nanoparticles trapped in a big cavity can split it into two or more active nucleation sites
and hence largely increase the heat transfer performance. Therefore, in order that the
effects of particle size relative to the surface roughness could be effectively considered,
Equation 3.6 was reformulated in this study by
0.4 0.42
1.63 1.2 3114.5 4.5 0.4a a a
a n l sup
p
R P R P RN C Pr T
d
(3.8)
1.2
0.68
0.275 1.0
0.275 0.7911 1 1.0
a p a pa
pa p a p
R d R dR
d R d R d
(3.9)
where, Cn is an empirical constant and Cn = 512 in this study.
In addition, as the heater surface is fully coated by the deposited nanoparticles,
bubble nucleation no longer occurs on the original heater surface, but actually occurs
on the layer of deposited nanopaticles, the wall-liquid interaction parameter in Equation
3.6 was therefore re-defined in this study by
,
,l
p p p p
l l p
c
c
(3.10)

58
0 10 20 30 400
100
200
300
400
500
Active s
ite
de
nsity (
site
s/c
m2)
Wall superheat (K)
water
aqueous nanofluids
P = 101325 Pa
Ra = 100 nm
dp = 20 nm
= 80
o
(a)
0 10 20 30 400
40
80
120
160
P = 101325 Pa
= 30o
= 80
o
Active s
ite
de
nsity (
site
s/c
m2)
Wall superheat (K)
Aqueous nanofluids
Ra/d
p = 50
Ra/d
p = 20
Ra/d
p = 10
Ra/d
p = 2
Ra/d
p = 1
Ra/d
p = 0.5
(b)
Figure 3. 1: Comparison of the Ganapathy-Sajith correlation (Ganapathy and Sajith,
2013) against experimental data (Gerardi et al., 2011): (a) effect of the liquid contact
angle; (b) effect of nanoparticle size.
For the purpose of comparison, the active site density correlations recently
proposed by Li et al. (2014b) and by Hibiki and Ishii (2003) were also included in this
study. The Li correlation (Equation 3.11) was fitted using the nanofluid experimental
data. The Hibiki-Ishii correlation (Equation 3.12) was based on Yang and Kim (1988)
(Equation 3.5) and was originally proposed for pure liquids. However, Equation 3.12
was still included in this study as it was stated to be applicable to a wide parametric

59
range (0.101 MPa ≤ P ≤ 19.8 MPa, 5° ≤ ζ ≤ 90°, and 1×10⁴ ≤ n ≤ 1.51×10
10 sites/m
2)
which actually covers most conditions in nucleate boiling of nanofluids.
4 2.061.206 10 1 cosa supN T (3.11)
2 '
21 exp exp 1
8a n
c
lN N f
R
(3.12)
Where
2 satc
v fg sup
TR
h T
(3.13)
2 30.01064 0.48246 0.22712 0.05468f (3.14)
log l v
v
(3.15)
Empirical constants in Equation 3.12 are 54.72 10nN sites/m2, δ = 0.772 rad and
' 62.50 10l m.
3.1.2.2 Other Nucleate Boiling Parameters
At first, the bubble departure diameter is another important nucleate boiling parameter
needing in-depth study and further formulation. Although a number of correlations
have been proposed since 1930s (e.g., the famous Fritz correlation), however, as proven
by Kolev (2012) who conducted a comprehensive comparison of various bubble
departure diameter correlations available in the literature against the experimental data
of water published by different investigators, a universal correlation which fits most
experimental data of pure liquids is still absent.
For nanofluids, the situation is even more challenging as quantitative studies on
the bubble departure diameter are very rare. Considering the improved surface
wettability in boiling nanofluids has a significant effect on the characteristics of bubble
departure, Phan et al. (2009) proposed a new bubble departure diameter correlation by
reformulating the Fritz correlation, in which the liquid contact angle is included.
32 3cos cos0.626977
4bW
l v
dg
(3.16)

60
Equation 3.16 predicts an increasing bubble departure diameter with improved
surface wettability, which phenomenologically agrees with most experiments of
nanofluids. However, it should be noted that for a given nanofluid, Equation 3.16 is
correlated only to the liquid contact angle while other factors are ignored.
It‘s still very challenging today to formulate a mechanistic correlation or model of
the bubble departure diameter even for pure liquid, without saying the so many novel
features in nanofluids. As a simplification, a polynomial correlation was obtained for
the bubble departure diameter in this study by fitting Gerardi et al.‘s data (2011).
3 4
5 2 7 3
1.91 10 4.21125 10
1.70945 10 2.03938 10
bW sup
sup sup
d T
T T
(3.17)
The bubble departure frequency has been widely observed in various experiments
to decrease with increasing bubble departure diameter, for both pure liquids (Situ et al.,
2008) and nanofluids (Gerardi et al., 2011). It‘s physically reasonable that a larger
bubble needs a longer time to grow, which leads to a prolonged bubble period and a
reduced bubble departure frequency. The bubble departure frequency is generally
correlated to the bubble departure diameter in the form of
1 k
bWf d (3.18)
However, the index k takes different values in various correlations. For example, k
= 1/2 in the Cole correlation (Cole, 1960) (Equation 3.19), k = 1.5 in the Stephan
correlation (Stephan, 1992) (Equation 3.20) and k = 2 in the Hatton-Hall correlation
(Hatton and Hall, 1966) (Equation 3.21). The applicability of these correlations to
nanofluids and determination of k will be discussed later.
4 ( )
3
l g
f
bW l
gf C
d
(3.19)
2
1 41
2 bW bW
gf
d d g
(3.20)
2
,
284.7 l
bW l p l
fd c
(3.21)
The remaining nucleate boiling parameters tw, Ac and Aq are defined in the same
way as that in our previous studies (Tu and Yeoh, 2002; Li et al., 2009).
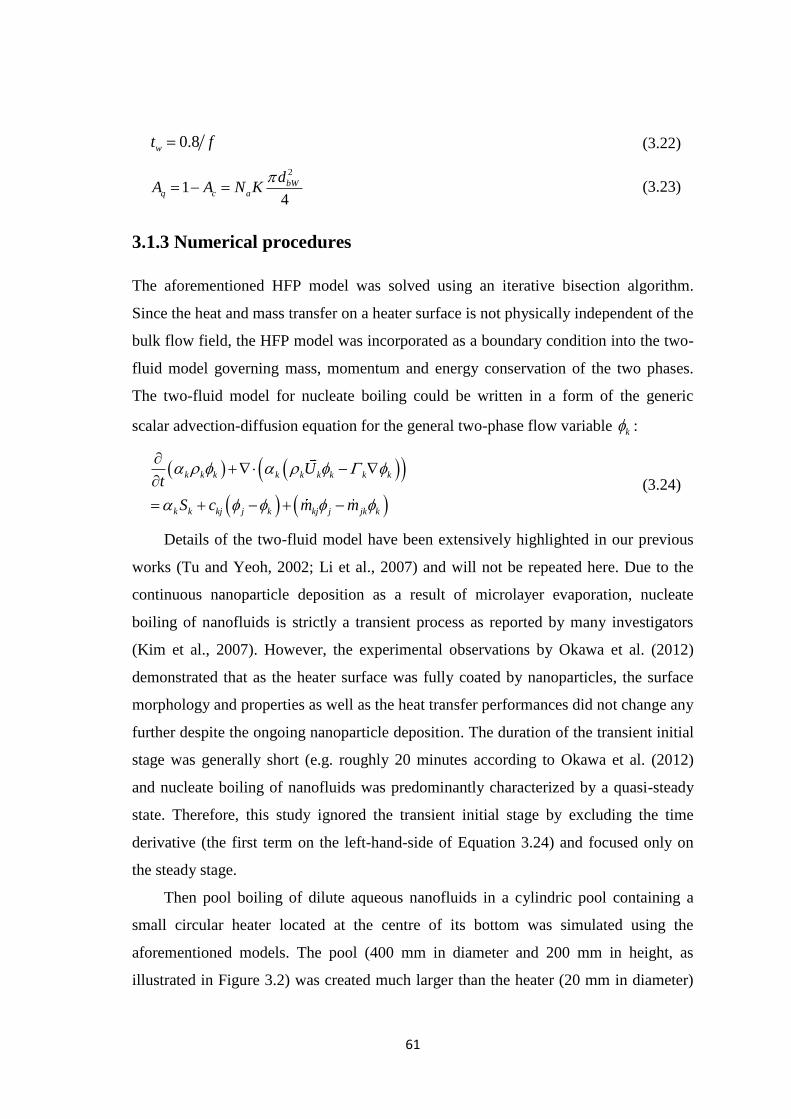
61
0.8wt f (3.22)
2
14
bWq c a
dA A N K
(3.23)
3.1.3 Numerical procedures
The aforementioned HFP model was solved using an iterative bisection algorithm.
Since the heat and mass transfer on a heater surface is not physically independent of the
bulk flow field, the HFP model was incorporated as a boundary condition into the two-
fluid model governing mass, momentum and energy conservation of the two phases.
The two-fluid model for nucleate boiling could be written in a form of the generic
scalar advection-diffusion equation for the general two-phase flow variable k :
k k k k k k k k k
k k kj j k kj j jk k
Ut
S c m m
(3.24)
Details of the two-fluid model have been extensively highlighted in our previous
works (Tu and Yeoh, 2002; Li et al., 2007) and will not be repeated here. Due to the
continuous nanoparticle deposition as a result of microlayer evaporation, nucleate
boiling of nanofluids is strictly a transient process as reported by many investigators
(Kim et al., 2007). However, the experimental observations by Okawa et al. (2012)
demonstrated that as the heater surface was fully coated by nanoparticles, the surface
morphology and properties as well as the heat transfer performances did not change any
further despite the ongoing nanoparticle deposition. The duration of the transient initial
stage was generally short (e.g. roughly 20 minutes according to Okawa et al. (2012)
and nucleate boiling of nanofluids was predominantly characterized by a quasi-steady
state. Therefore, this study ignored the transient initial stage by excluding the time
derivative (the first term on the left-hand-side of Equation 3.24) and focused only on
the steady stage.
Then pool boiling of dilute aqueous nanofluids in a cylindric pool containing a
small circular heater located at the centre of its bottom was simulated using the
aforementioned models. The pool (400 mm in diameter and 200 mm in height, as
illustrated in Figure 3.2) was created much larger than the heater (20 mm in diameter)
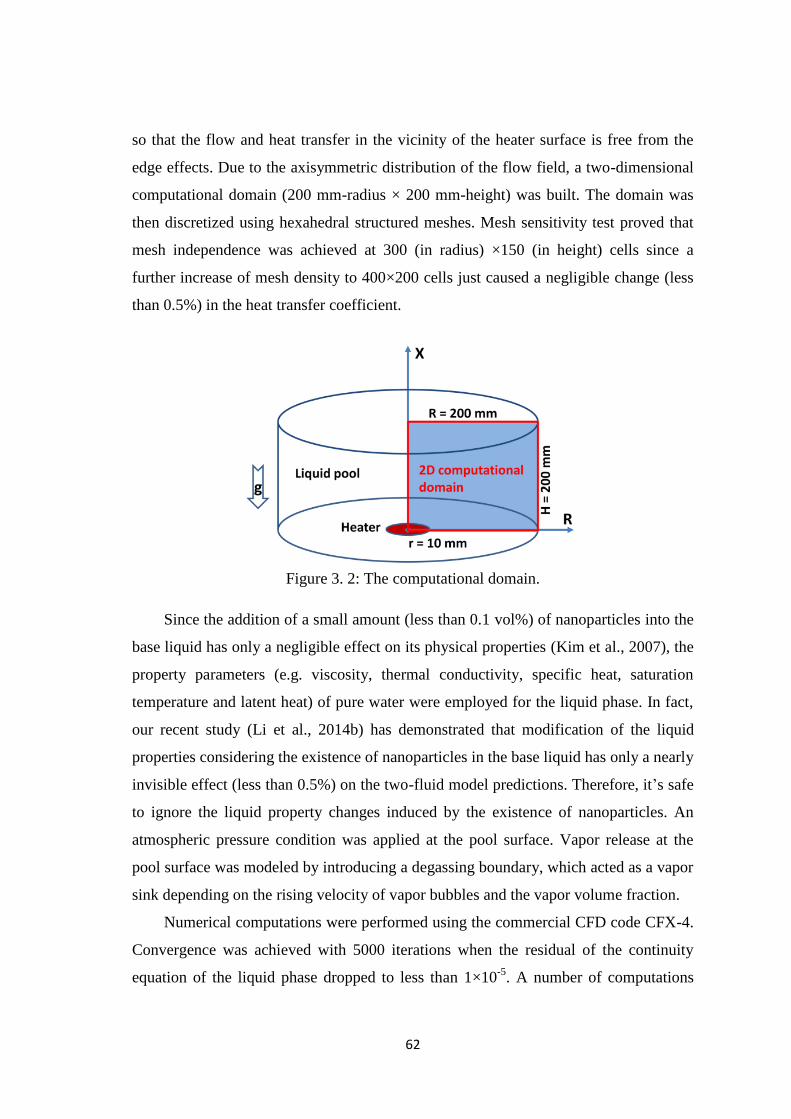
62
so that the flow and heat transfer in the vicinity of the heater surface is free from the
edge effects. Due to the axisymmetric distribution of the flow field, a two-dimensional
computational domain (200 mm-radius × 200 mm-height) was built. The domain was
then discretized using hexahedral structured meshes. Mesh sensitivity test proved that
mesh independence was achieved at 300 (in radius) ×150 (in height) cells since a
further increase of mesh density to 400×200 cells just caused a negligible change (less
than 0.5%) in the heat transfer coefficient.
Figure 3. 2: The computational domain.
Since the addition of a small amount (less than 0.1 vol%) of nanoparticles into the
base liquid has only a negligible effect on its physical properties (Kim et al., 2007), the
property parameters (e.g. viscosity, thermal conductivity, specific heat, saturation
temperature and latent heat) of pure water were employed for the liquid phase. In fact,
our recent study (Li et al., 2014b) has demonstrated that modification of the liquid
properties considering the existence of nanoparticles in the base liquid has only a nearly
invisible effect (less than 0.5%) on the two-fluid model predictions. Therefore, it‘s safe
to ignore the liquid property changes induced by the existence of nanoparticles. An
atmospheric pressure condition was applied at the pool surface. Vapor release at the
pool surface was modeled by introducing a degassing boundary, which acted as a vapor
sink depending on the rising velocity of vapor bubbles and the vapor volume fraction.
Numerical computations were performed using the commercial CFD code CFX-4.
Convergence was achieved with 5000 iterations when the residual of the continuity
equation of the liquid phase dropped to less than 1×10⁻⁵
. A number of computations

63
were performed to analyze the effects of surface wettability and nanoparticle material
and size on the heat transfer performance, as discussed in the following sections.
3.1.4 Results and Discussion
3.1.4.1 Comparison against experimental data
The HFP model incorporated with new closure correlations was compared against the
experimental data of dilute SiO2/water nanofluid (0.1 vol%) by Gerardi et al. (2011).
Based on the experimental measurements by Kim et al. (2007), ζ* = 79
o and ζ = 22
o
were selected for the liquid contact angles on the clean and nanoparticle-deposited
heater surfaces during the computations, respectively.
0 10 20 30 40 500
40
80
120
160
Active s
ite
de
nsity (
site
s/c
m2)
Wall superheat (K)
Exp. Gerardi et al., 2011
Eq. 3.8 This study,
Eq. 3.12 Hibiki and Ishii, 2003
Eq. 3.11 Li et al., 2014
Figure 3. 3: Comparison of active site density prediction against experimental data
(Gerardi et al., 2011).
As demonstrated in our previous study (Li et al., 2014b), the active site density
modeling has the most significant effect on the overall prediction using the HFP model.
Therefore, the active site density formulation was firstly tested in this study. The active
site density predicted by the HFP model incorporated with different active site density
correlations was compared against the experimental data in Figure 3.3. It revealed that
the Hibiki-Ishii correlation (Equation 3.12) largely under-predicted the active site
density in nanofluids, although it has been fully validated for nucleate boiling of pure
liquids. This was perhaps due to the fact that the empirical constants in Equation 3.12
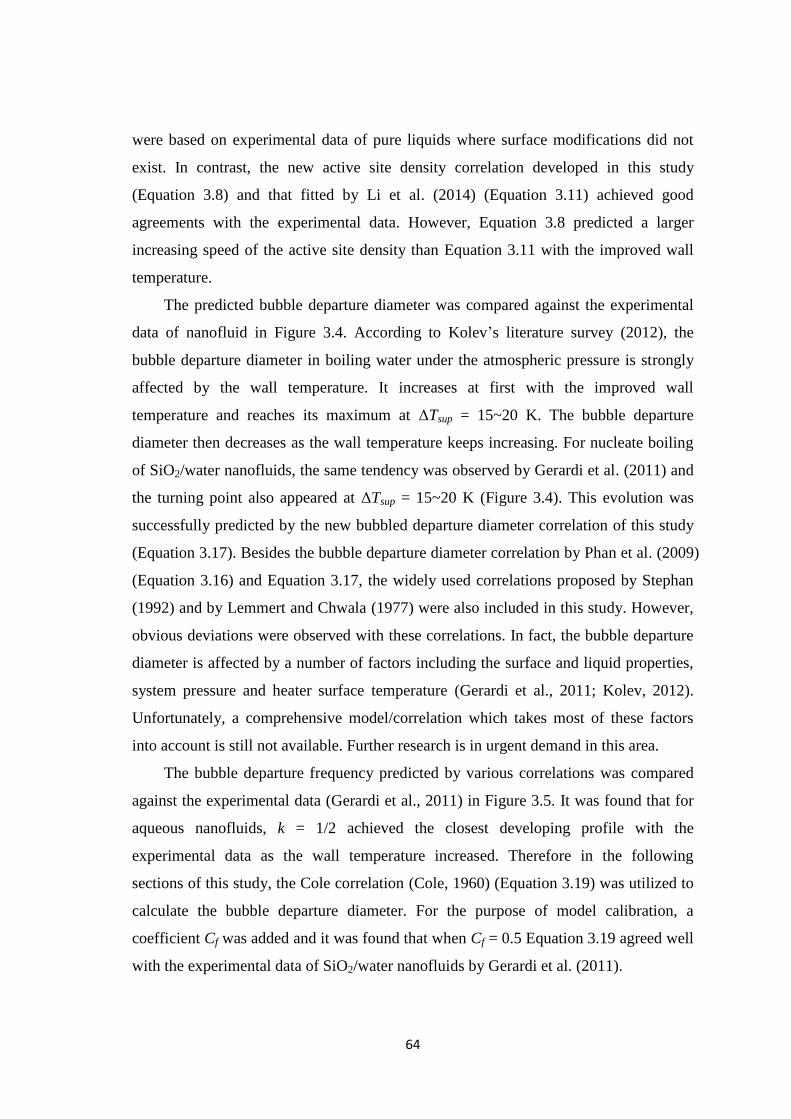
64
were based on experimental data of pure liquids where surface modifications did not
exist. In contrast, the new active site density correlation developed in this study
(Equation 3.8) and that fitted by Li et al. (2014) (Equation 3.11) achieved good
agreements with the experimental data. However, Equation 3.8 predicted a larger
increasing speed of the active site density than Equation 3.11 with the improved wall
temperature.
The predicted bubble departure diameter was compared against the experimental
data of nanofluid in Figure 3.4. According to Kolev‘s literature survey (2012), the
bubble departure diameter in boiling water under the atmospheric pressure is strongly
affected by the wall temperature. It increases at first with the improved wall
temperature and reaches its maximum at ΔTsup = 15~20 K. The bubble departure
diameter then decreases as the wall temperature keeps increasing. For nucleate boiling
of SiO2/water nanofluids, the same tendency was observed by Gerardi et al. (2011) and
the turning point also appeared at ΔTsup = 15~20 K (Figure 3.4). This evolution was
successfully predicted by the new bubbled departure diameter correlation of this study
(Equation 3.17). Besides the bubble departure diameter correlation by Phan et al. (2009)
(Equation 3.16) and Equation 3.17, the widely used correlations proposed by Stephan
(1992) and by Lemmert and Chwala (1977) were also included in this study. However,
obvious deviations were observed with these correlations. In fact, the bubble departure
diameter is affected by a number of factors including the surface and liquid properties,
system pressure and heater surface temperature (Gerardi et al., 2011; Kolev, 2012).
Unfortunately, a comprehensive model/correlation which takes most of these factors
into account is still not available. Further research is in urgent demand in this area.
The bubble departure frequency predicted by various correlations was compared
against the experimental data (Gerardi et al., 2011) in Figure 3.5. It was found that for
aqueous nanofluids, k = 1/2 achieved the closest developing profile with the
experimental data as the wall temperature increased. Therefore in the following
sections of this study, the Cole correlation (Cole, 1960) (Equation 3.19) was utilized to
calculate the bubble departure diameter. For the purpose of model calibration, a
coefficient Cf was added and it was found that when Cf = 0.5 Equation 3.19 agreed well
with the experimental data of SiO2/water nanofluids by Gerardi et al. (2011).
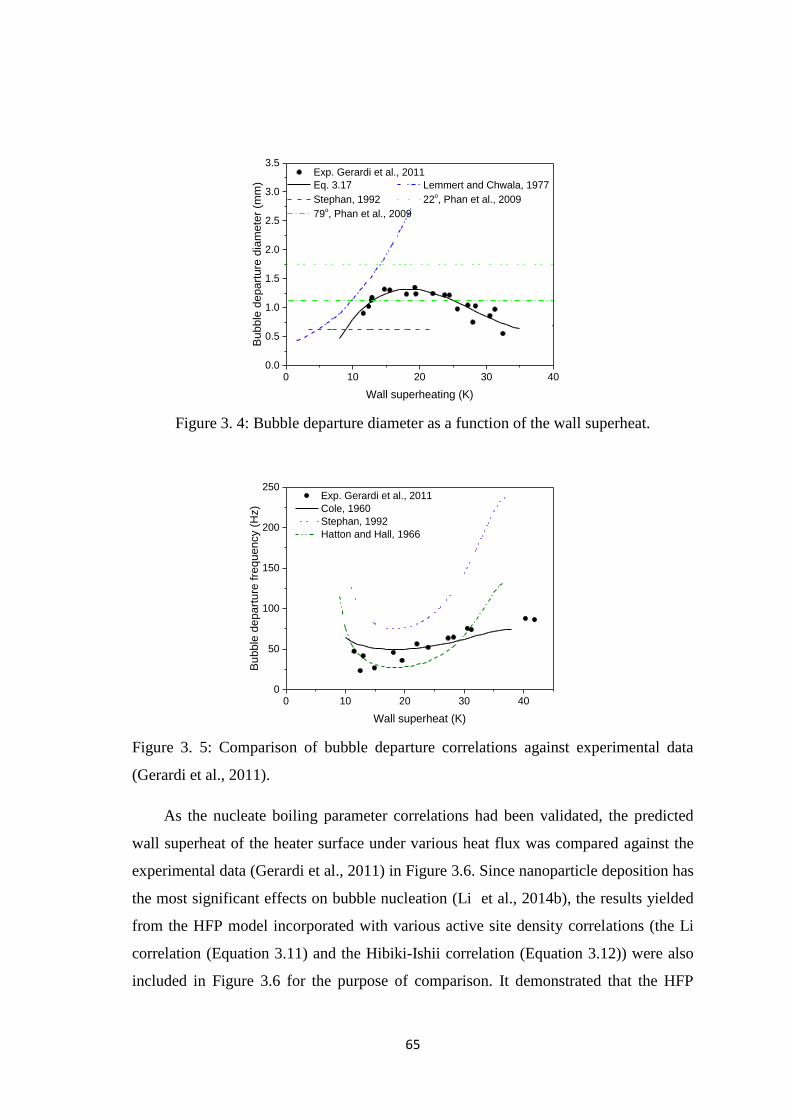
65
0 10 20 30 400.0
0.5
1.0
1.5
2.0
2.5
3.0
3.5
Bu
bb
le d
ep
art
ure
dia
me
ter
(mm
)
Wall superheating (K)
Exp. Gerardi et al., 2011
Eq. 3.17 Lemmert and Chwala, 1977
Stephan, 1992 22o, Phan et al., 2009
79o, Phan et al., 2009
Figure 3. 4: Bubble departure diameter as a function of the wall superheat.
0 10 20 30 400
50
100
150
200
250
Bu
bb
le d
ep
art
ure
fre
qu
en
cy (
Hz)
Wall superheat (K)
Exp. Gerardi et al., 2011
Cole, 1960
Stephan, 1992
Hatton and Hall, 1966
Figure 3. 5: Comparison of bubble departure correlations against experimental data
(Gerardi et al., 2011).
As the nucleate boiling parameter correlations had been validated, the predicted
wall superheat of the heater surface under various heat flux was compared against the
experimental data (Gerardi et al., 2011) in Figure 3.6. Since nanoparticle deposition has
the most significant effects on bubble nucleation (Li et al., 2014b), the results yielded
from the HFP model incorporated with various active site density correlations (the Li
correlation (Equation 3.11) and the Hibiki-Ishii correlation (Equation 3.12)) were also
included in Figure 3.6 for the purpose of comparison. It demonstrated that the HFP
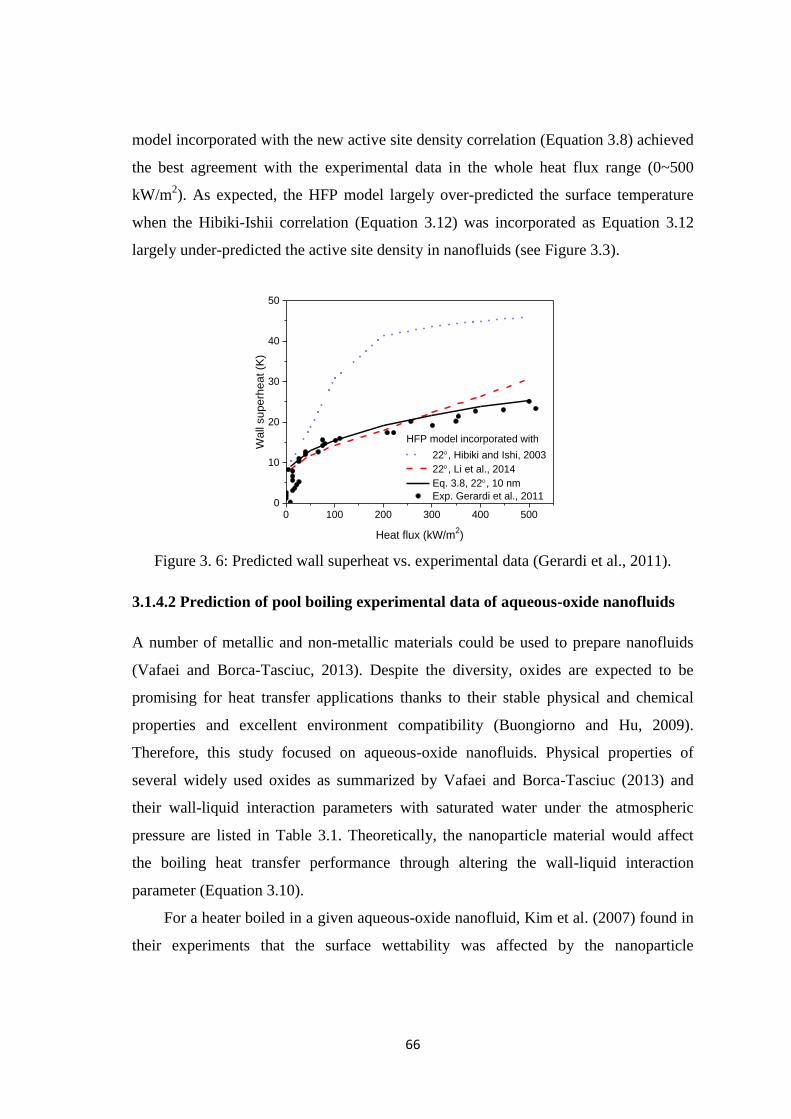
66
model incorporated with the new active site density correlation (Equation 3.8) achieved
the best agreement with the experimental data in the whole heat flux range (0~500
kW/m2). As expected, the HFP model largely over-predicted the surface temperature
when the Hibiki-Ishii correlation (Equation 3.12) was incorporated as Equation 3.12
largely under-predicted the active site density in nanofluids (see Figure 3.3).
0 100 200 300 400 5000
10
20
30
40
50
Wa
ll su
pe
rhe
at
(K)
Heat flux (kW/m2)
22, Hibiki and Ishi, 2003
22, Li et al., 2014
Eq. 3.8, 22, 10 nm
Exp. Gerardi et al., 2011
HFP model incorporated with
Figure 3. 6: Predicted wall superheat vs. experimental data (Gerardi et al., 2011).
3.1.4.2 Prediction of pool boiling experimental data of aqueous-oxide nanofluids
A number of metallic and non-metallic materials could be used to prepare nanofluids
(Vafaei and Borca-Tasciuc, 2013). Despite the diversity, oxides are expected to be
promising for heat transfer applications thanks to their stable physical and chemical
properties and excellent environment compatibility (Buongiorno and Hu, 2009).
Therefore, this study focused on aqueous-oxide nanofluids. Physical properties of
several widely used oxides as summarized by Vafaei and Borca-Tasciuc (2013) and
their wall-liquid interaction parameters with saturated water under the atmospheric
pressure are listed in Table 3.1. Theoretically, the nanoparticle material would affect
the boiling heat transfer performance through altering the wall-liquid interaction
parameter (Equation 3.10).
For a heater boiled in a given aqueous-oxide nanofluid, Kim et al. (2007) found in
their experiments that the surface wettability was affected by the nanoparticle

67
concentration, as shown in Table 3.2. Therefore, the effect of particle concentration
could be taken into account through the liquid contact angle.
In terms of Equation 3.8, the active site density increases with the decreased
surface wettability or decreased wall-liquid interaction parameter. This means that
within the parametric range specified in Table 3.1 and 3.2, the best heat transfer
performance appears at ζ = 43° andγ= 0.931 while the lowest heat transfer coefficient
happens at ζ = 11° and γ= 3.788. The predicted upper and lower limits of boiling curves
were compared against the experimental data available in the literature (Vassallo et al.,
2004; Bang and Chang, 2005; Chopkar et al., 2008; Coursey and Kim, 2008;
Suriyawong and Wongwises, 2010; Harish et al., 2011; Huang et al., 2011; Ahmed and
Hamed, 2012; Shahmoradi et al., 2013; Shoghl and bahrami, 2013) in Figure 3.7. The
experimental data selected for comparison were limited to pool boiling of dilute
aqueous-oxide nanofluids under the atmospheric pressure. Most nanofluids presented in
Figure 3.7 had a concentration lower than 0.1% by volume. Figure 3.7 demonstrated
that over 95% of these experimental data fell within the range defined by the upper and
lower boiling curves.
0 10 20 30 40 50 60
0
100
200
300
400
500
600
He
at
flux (
kW
/m2)
Wall superheat (K)
Taylor et al., 2009
Al2O3/water:
Ahmed et al., 2012
Shahmoradi et al., 2013
Harish et al., 2011
Wen et al., 2011
Das et al., 2003
Bang et al., 2005
Kim, Bang et al., 2007
Coursey & Kim, 2008
TiO2/water:
Huang et al., 2011
Suriyawong & Wongwises,
2010
SiO2/water:
Kim, Bang et al., 2007
Vassallo et al., 2004
ZrO2/water:
Kim, Bang et al., 2007
Chopkar et al., 2008
ZnO/water:
Shoghl & Bahrami, 2013
Rohsenow Csf = 0.018
Rohsenow Csf = 0.0065
Figure 3. 7: Comparison of predicted boiling curves against experimental data.

68
Taylor and Phelan (2009) once conducted a comprehensive comparison of pool
boililng experimental data of aqueous nanofluids available in the literature against the
classic Rohsenow correlation (Equation 3.25).
1 1
0.33 0.33
0.331
spl supl v
l fg l
sf fg
c Tgq h Pr
C h
(3.25)
They found that almost all the experimental data could be fitted to the Rohsenow
correlation with the surface constant Csf varying from 0.0065 to 0.018. This indicated
that the surface modifications induced by nanoparticle deposition is the major factor
responsible for the dramatic heat transfer performance since the surface constant Csf is
correlated only to the surface conditions. However, Taylor and Phelan‘s comparison
(2009) was conducted in a relatively narrow parametric range (wall superheat less than
15 K) and the Rohsenow correlation was not fully assessed. In this study, the
Rohsenow correlation was compared againt the HFP model and the experimental data
in a wider parametric range, as illustrated in Figure 3.7, which demonstrated that for a
wider wall superheat range (up to 45 K), the HFP model provided a better prediction
than the Rohsenow correlation. Furthermore, as pointed by Taylor and Phelan (2009), it
is not practical to predict nucleate boiling of nanofluids using the Rohsenow correlation
since the surface constant Csf needs to be determined experimentally. Comparatively,
the HFP model of this study provides a more feasible approach to predict the heat
transfer by boiling nanofluids and its applicable range is much wider.
3.1.4.3 Further Discussion
As the dramatically changed heat transfer performance of boiling nanofluids is due to
the surface modifications induced by nanoparticle deposition, it is expected that the
properties of a nanoparticle-deposited heater surfaces as well as the characteristics of
bubble nucleation may be different depending on the material, size and concentration of
the nanoparticles. The deposited nanoparticles affect nucleate boiling mainly through
three ways: At first, the nanoparticle material affects the wall-liquid interaction
parameter and the active site density through Equation 3.10 (see Table 3.1). Secondly,
the wettability of a nanoparticle-deposited surface is directly affected by the
nanoparticle material and concentration (see Table 3.2). Finally, as proven by Narayan

69
et al. (2007) and Das et al. (2008), the nanoparticle size is another important parameter
affecting the heat transfer performance on a nanoparticle-deposited heater surface,
since the deposited nanoparticles may increase or decrease the active site density
depending on their size relative to the roughness of the clean heater surface.
Table 3. 1 Physical properties of the nanoparticle materials and water.
Material Density
(kg/m3)
Thermal conductivity
(W/(m.K))
Specific heat
(J/(kg.K))
γ
( - )
Saturated water 958 0.679 4216 1.000
SiO2 2410 1.4 705 0.931
Al2O3 3490 25.0 451 3.788
ZrO2 5570 2.2 480 1.465
ZnO 5606 3.2 580 1.948
TiO2 4010 8.3 690 2.894
Table 3. 2 Liquid contact angle on heater surfaces boiled in different nanofluids (Kim
et al., 2007).
Nanofluids 0.001vol% 0.01vol% 0.1vol%
Al2O3/water 14o 23
o 40
o
ZrO2/water 43o 26
o 30
o
SiO2/water 11o 15
o 21
o
Computations were conducted to analyze the above factor individually, which
would certainly contribute to an in-depth understanding of the mechanisms associated
with nucleate boiling of nanofluids. During the computations of testing a certain factor
(e.g. ζ), the other two parameters (e.g. γ and Ra / dp) were kept constant. The
computations were conducted in the heat flux range of 10 – 500 kW/m2 and the
predicted active site density under various conditions was illustrated in Figure 3.8. The
results demonstrated that the liquid contact angle has the most significant effect on the
active site density as ζ increasing from 8° to 36° caused a threefold increase in the
active site density. The nanoparticle material also had a significant effect on the
characteristics of bubble nucleation. Comparatively, the nanoparticle size had the least
impact, although an increasing nanoparticle size firstly caused a decrease and then an
increase in the active site density, which was consistent with the summary by Narayan
et al. (2007) and Das et al. (2008).
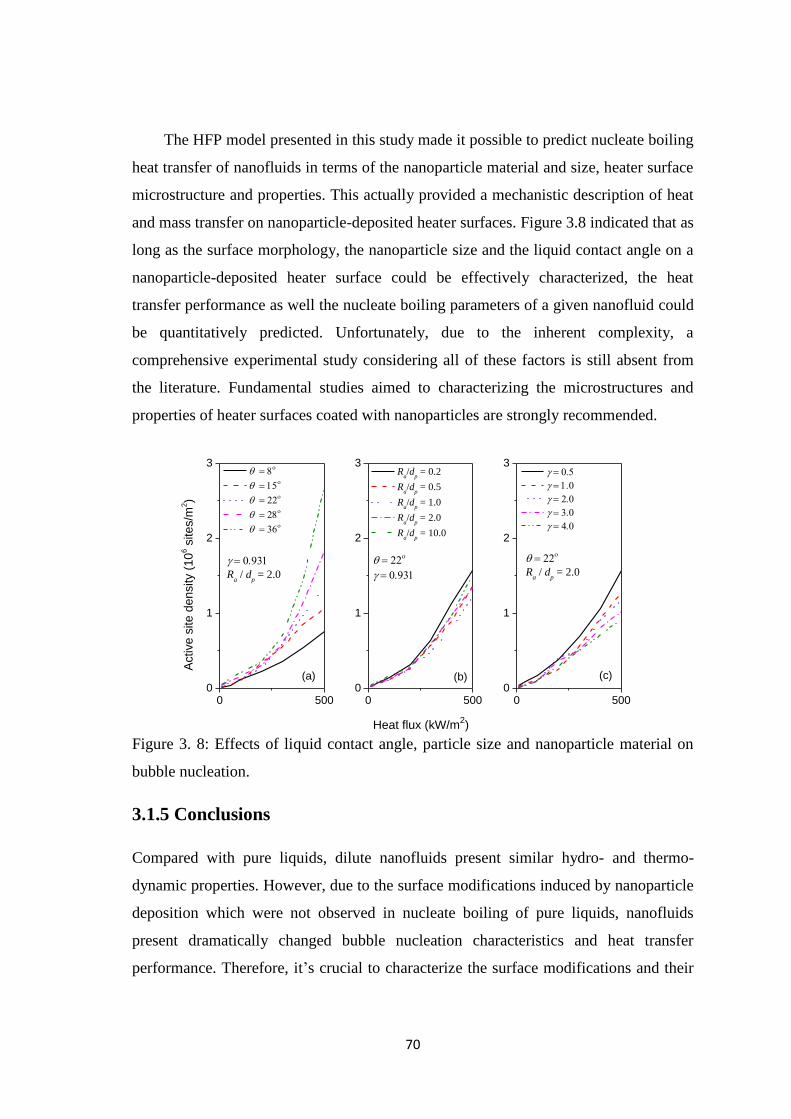
70
The HFP model presented in this study made it possible to predict nucleate boiling
heat transfer of nanofluids in terms of the nanoparticle material and size, heater surface
microstructure and properties. This actually provided a mechanistic description of heat
and mass transfer on nanoparticle-deposited heater surfaces. Figure 3.8 indicated that as
long as the surface morphology, the nanoparticle size and the liquid contact angle on a
nanoparticle-deposited heater surface could be effectively characterized, the heat
transfer performance as well the nucleate boiling parameters of a given nanofluid could
be quantitatively predicted. Unfortunately, due to the inherent complexity, a
comprehensive experimental study considering all of these factors is still absent from
the literature. Fundamental studies aimed to characterizing the microstructures and
properties of heater surfaces coated with nanoparticles are strongly recommended.
0 5000
1
2
3
0 5000
1
2
3
0 5000
1
2
3
Ra / d
p = 2.0
Active s
ite
de
nsity (
10
6 s
ite
s/m
2)
Heat flux (kW/m2)
(a) (b)
Ra/d
p = 0.2
Ra/d
p = 0.5
Ra/d
p = 1.0
Ra/d
p = 2.0
Ra/d
p = 10.0
(c)
Ra / d
p = 2.0
Figure 3. 8: Effects of liquid contact angle, particle size and nanoparticle material on
bubble nucleation.
3.1.5 Conclusions
Compared with pure liquids, dilute nanofluids present similar hydro- and thermo-
dynamic properties. However, due to the surface modifications induced by nanoparticle
deposition which were not observed in nucleate boiling of pure liquids, nanofluids
present dramatically changed bubble nucleation characteristics and heat transfer
performance. Therefore, it‘s crucial to characterize the surface modifications and their
71
effects on bubble nucleation when modeling nucleate boiling of nanofluids. In this
study, new correlations of the nucleate boiling parameters were incorporated into the
classic HFP model (Kurul and Podowski, 1990). Numerical computations and
parametric study were performed to analyze the effects of nanoparticle material, size
and concentration. Conclusions arising from this study are as follows:
(1) Through incorporating new closure correlations to account for the effects of surface
modifications on the characteristics of bubble nucleation and departure, the HFP
model achieved a satisfactory agreement with most experimental data of nucleate
boiling of aqueous-oxide nanofluids available in the literature. The improved HFP
model also provided a more feasible and mechanistic approach than the classic
Rohsenow correlation to predict nucleate boiling of nanofluids.
(2) The surface wettability enhancement induced by nanoparticle deposition, among
the other parameters (ζ, γ and Ra / dp) investigated in this study, had the most
significant effect on bubble nucleation on the nanoparticle-deposited heater surface.
72
3.2 A Theoretical Model Considering the Nanoparticle
Brownian Motion in Liquid Microlayer
Abstract:
The forming of a porous layer of deposited nanoparticles on the heater surface is
one of the unique phenomena in nucleate boiling of nanofluids. As the deposition of
nanoparticles is induced by the evaporation of liquid microlayer, the average
nanoparticle concentration in the microlayer is much higher than that in the bulk liquid.
Therefore, the Brownian motion of the nanoparticles in microlayer may play an
important role in dissipating heat from the heater surface. In this study, a new heat flux
partitioning (HFP) model was proposed, in which a new heat flux component was
incorporated to account for the heat transfer by the nanoparticle Brownian motion in
liquid microlayer. The new heat flux component was formulated based on the latest
experimental and theoretical research outcomes of microlayer evaporation. Comparison
of the numerical results against the experimental data available in the literature proved
that the new HFP model performs better than the classic HFP model. This study also
demonstrated that the importance of nanoparticle Brwonian motion is mainly controlled
by the applied heat flux as it directly affects the number density of active sites on the
heater surface. Finally, the effects of nanoparticle concentration, size and materials
were also analyzed.
3.2.1 Introduction
Nanofluids are colloidal dispersions of nano-sized particles in common base liquids.
Due to their enhanced properties associated with heat transfer and the promising
prospects of industrial applications, nanofluids have been attracting an increasing
number of investigations (Wen et al., 2009). Following the study pioneered by Das et al.
(2003a), heat transfer by nucleate boiling of nanofluids has been intensively studied,
mainly through experimental approaches. According to the literature surveys
(Jacqueline et al., 2011; Vafaei and Borca-Tasciuc, 2013), two common findings have
been thrown light on: (i) the significantly enhanced critical heat flux (CHF) and, (ii) the
forming of a porous layer of deposited nanoparticles on the heater surface. These
73
phenomena were observed in almost all the experiments, even in those using dilute
nanofluids with extremely low nanoparticle concentrations (Kim et al., 2007). For
dilute nanofluids, numerous measurements (Kim et al., 2007; Kwark, 2009) have
proven that their properties including the saturation temperature, surface tension,
thermal conductivity and viscosity are negligibly different from those of their pure base
liquids. Thus, the dramatically enhanced CHF is attributed not to the negligibly
changed liquid properties, but exclusively to the surface modifications induced by
nanoparticle deposition (Vafaei and Borca-Tasciuc, 2013).
In recent years, some efforts (Li et al., 2014a; Li et al., 2014b) have been devoted
to develop predictive models for nucleate boiling of dilute nanofluids (typically with
concentrations lower than 0.1 vol%) based on the heat flux partitioning (HFP) model
(Kurul and Podowski, 1990). The effects of nanoparticles on the liquid properties were
generally neglected in the models due to the aforementioned reasons, while focus was
put mainly on the surface modifications and their effects on bubble dynamics (Li et al.,
2014a; Li et al., 2014b). Through incorporating the active site density correlation of
Ganapathy and Sajith (2013) and the bubble departure diameter correlation of Phan et
al. (2009), the improved HFP model (Li et al., 2014a; Li et al., 2014b) achieved a better
agreement with the experimental data available in the literature than the classic HFP
model by Kurul and Podowsk (1990).
However, an important mechanism may have been ignored. As to the forming of
porous layers, Kim et al. (2007) and Kwark (2009) proved that the deposition of
nanoparticles is caused by the evaporation of liquid microlayer. As illustrated in Figure
3.9, they proposed that when a bubble grows, the evaporating microlayer underneath
the bubble leaves behind nanoparticles concentrating in it. The nanoparticles then
adhere to the heater surface when the microlayer is completely vaporized. This
indicates that within the bubble growth time, the concentration of nanoparticles in the
microlayer would keep increasing from the bulk value up to 100%. Therefore, the time-
averaged nanoparticle concentration in the microlayer would be much higher than the
bulk value. According to a literature survey by Wang and Mujumdar (2007), the
thermal conductivity enhancement of nanofluids at the atmospheric temperature could
be as high as 60% when the nanoparticle concentration increased up to 5 vol%. In
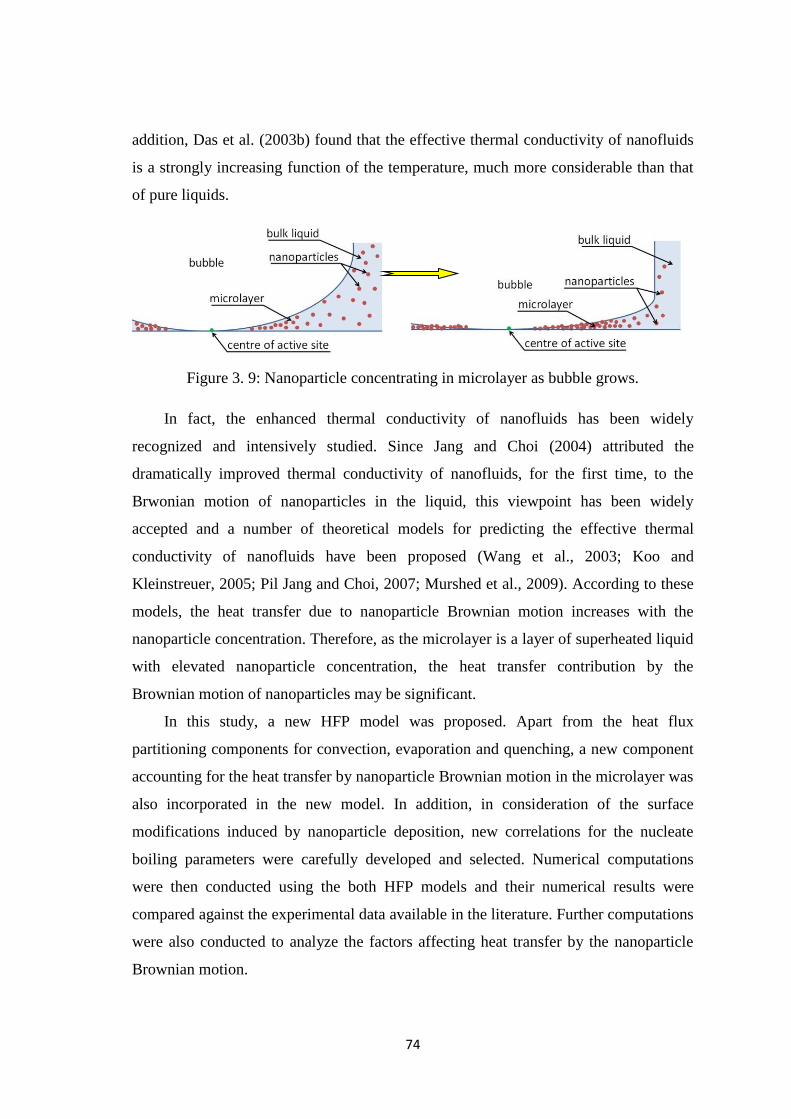
74
addition, Das et al. (2003b) found that the effective thermal conductivity of nanofluids
is a strongly increasing function of the temperature, much more considerable than that
of pure liquids.
Figure 3. 9: Nanoparticle concentrating in microlayer as bubble grows.
In fact, the enhanced thermal conductivity of nanofluids has been widely
recognized and intensively studied. Since Jang and Choi (2004) attributed the
dramatically improved thermal conductivity of nanofluids, for the first time, to the
Brwonian motion of nanoparticles in the liquid, this viewpoint has been widely
accepted and a number of theoretical models for predicting the effective thermal
conductivity of nanofluids have been proposed (Wang et al., 2003; Koo and
Kleinstreuer, 2005; Pil Jang and Choi, 2007; Murshed et al., 2009). According to these
models, the heat transfer due to nanoparticle Brownian motion increases with the
nanoparticle concentration. Therefore, as the microlayer is a layer of superheated liquid
with elevated nanoparticle concentration, the heat transfer contribution by the
Brownian motion of nanoparticles may be significant.
In this study, a new HFP model was proposed. Apart from the heat flux
partitioning components for convection, evaporation and quenching, a new component
accounting for the heat transfer by nanoparticle Brownian motion in the microlayer was
also incorporated in the new model. In addition, in consideration of the surface
modifications induced by nanoparticle deposition, new correlations for the nucleate
boiling parameters were carefully developed and selected. Numerical computations
were then conducted using the both HFP models and their numerical results were
compared against the experimental data available in the literature. Further computations
were also conducted to analyze the factors affecting heat transfer by the nanoparticle
Brownian motion.
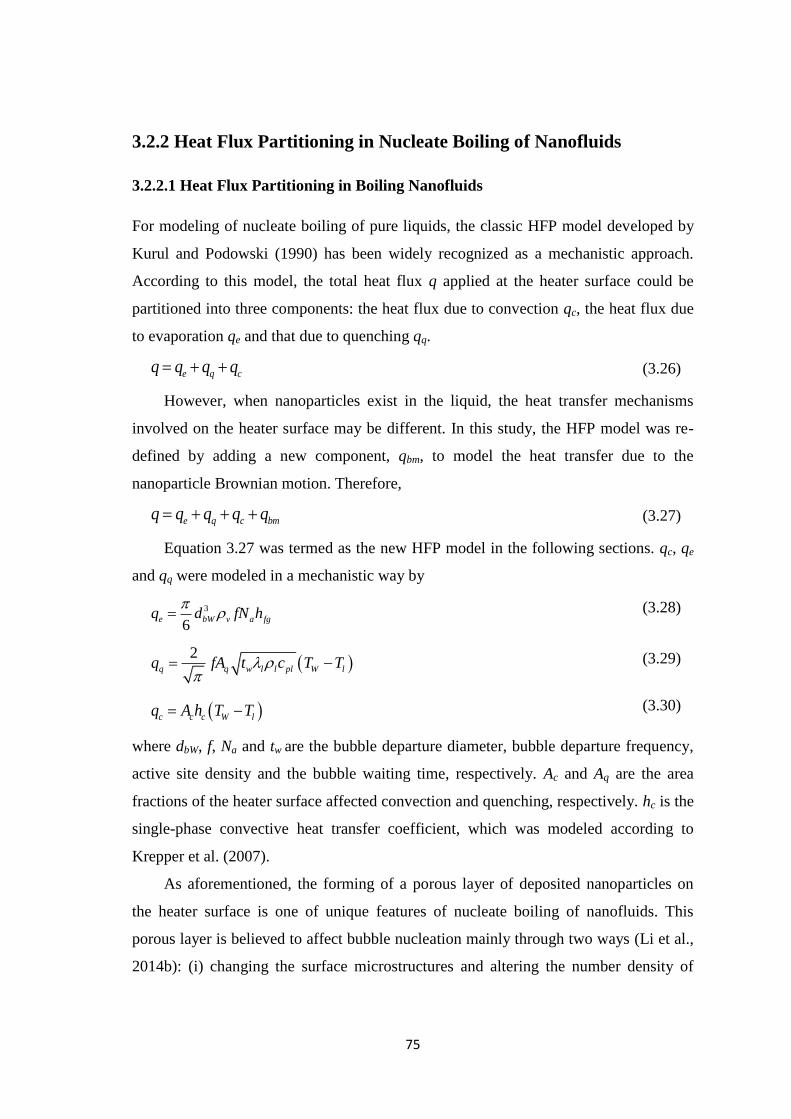
75
3.2.2 Heat Flux Partitioning in Nucleate Boiling of Nanofluids
3.2.2.1 Heat Flux Partitioning in Boiling Nanofluids
For modeling of nucleate boiling of pure liquids, the classic HFP model developed by
Kurul and Podowski (1990) has been widely recognized as a mechanistic approach.
According to this model, the total heat flux q applied at the heater surface could be
partitioned into three components: the heat flux due to convection qc, the heat flux due
to evaporation qe and that due to quenching qq.
e q cq q q q (3.26)
However, when nanoparticles exist in the liquid, the heat transfer mechanisms
involved on the heater surface may be different. In this study, the HFP model was re-
defined by adding a new component, qbm, to model the heat transfer due to the
nanoparticle Brownian motion. Therefore,
e q c bmq q q q q (3.27)
Equation 3.27 was termed as the new HFP model in the following sections. qc, qe
and qq were modeled in a mechanistic way by
3
6e bW v a fgq d fN h
(3.28)
2
q q w l l pl W lq fA t c T T
(3.29)
c c c W lq A h T T (3.30)
where dbW, f, Na and tw are the bubble departure diameter, bubble departure frequency,
active site density and the bubble waiting time, respectively. Ac and Aq are the area
fractions of the heater surface affected convection and quenching, respectively. hc is the
single-phase convective heat transfer coefficient, which was modeled according to
Krepper et al. (2007).
As aforementioned, the forming of a porous layer of deposited nanoparticles on
the heater surface is one of unique features of nucleate boiling of nanofluids. This
porous layer is believed to affect bubble nucleation mainly through two ways (Li et al.,
2014b): (i) changing the surface microstructures and altering the number density of

76
cavities available for bubble nucleation and, (ii) largely improving the surface
wettability which causes a portion of active sites being flooded. In consideration of the
both effects, Ganapathy and Sajith (2013) proposed a semi-analytic correlation for the
active site density in boiling nanofluids. In this study, their correlation (Ganapathy and
Sajith, 2013) was further improved (Equation 3.31) to take into account the fact that
heat transfer deterioration occurs when the ratio of surface roughness to nanoparticle
size is near 1.0, otherwise heat transfer is enhanced as Ra/dp is away from 1.0, as
reported by Narayan et al. (2007) and Das et al. (2008).
0.42 3
1.63
*
0.4
3
1 1 cos14.5 4.5 0.4
1 cos
a aa n l
asup
np
R P R PN C Pr
RT
d
(3.31)
where, γ is the liquid-wall interacting parameter. When the heater surface is fully
coated by deposited nanoparticles, bubble nucleation no longer occurs on the original
heater surface, but on the layer of deposited nanopaticles. Therefore, γ was defined by
,
,l
np np p np
l l p
c
c
(3.32)
The term ξ (Ra/dnp) was added to describe the effects of nanoparticle size relative
to the surface roughness
1.2
0.68
0.275 0 1.0
0.275 0.791 1 1.0
a np a np
a np
a np a np
R d R dR d
R d R d
(3.33)
In addition, the deposited nanoparticles were reported to change the force balance
on the tri-phase contact line (Sefiane et al., 2008), thus may have a significant effect on
the dynamic characteristics of bubble growth and departure. In fact, the bubble
departure diameter is subjected to a number of factors. Due to the inherent complexity,
a universal correlation for the bubble departure diameter is still absent even for pure
liquids, let alone the novel features induced by nanoparticles. Although a few empirical
or semi-empirical correlations have been proposed in recent years for the bubble
departure diameter in boiling nanofluids or pure liquids boiling on nano-coated surfaces
(e.g. the correlation of Phan et al., 2009), they are strictly limited to a certain applicable
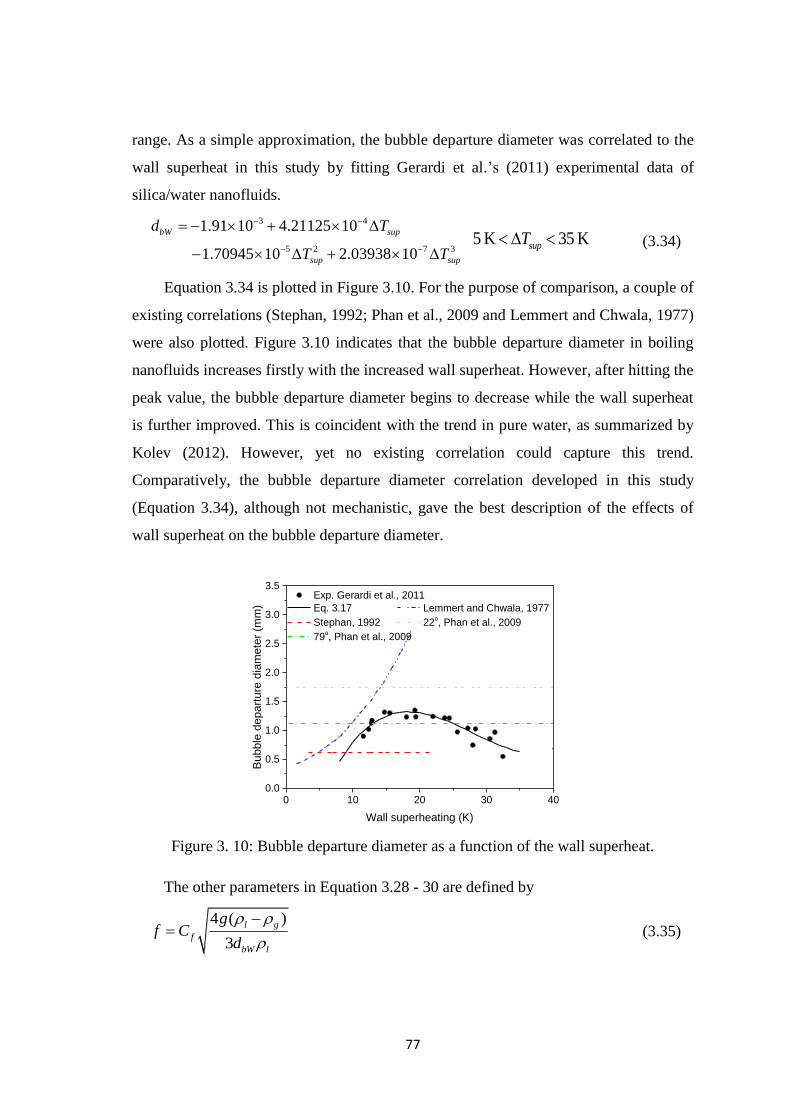
77
range. As a simple approximation, the bubble departure diameter was correlated to the
wall superheat in this study by fitting Gerardi et al.‘s (2011) experimental data of
silica/water nanofluids.
3 4
5 2 7 3
1.91 10 4.21125 10
1.70945 10 2.03938 10
bW sup
sup sup
d T
T T
5 K 35 KsupT (3.34)
Equation 3.34 is plotted in Figure 3.10. For the purpose of comparison, a couple of
existing correlations (Stephan, 1992; Phan et al., 2009 and Lemmert and Chwala, 1977)
were also plotted. Figure 3.10 indicates that the bubble departure diameter in boiling
nanofluids increases firstly with the increased wall superheat. However, after hitting the
peak value, the bubble departure diameter begins to decrease while the wall superheat
is further improved. This is coincident with the trend in pure water, as summarized by
Kolev (2012). However, yet no existing correlation could capture this trend.
Comparatively, the bubble departure diameter correlation developed in this study
(Equation 3.34), although not mechanistic, gave the best description of the effects of
wall superheat on the bubble departure diameter.
0 10 20 30 400.0
0.5
1.0
1.5
2.0
2.5
3.0
3.5
Bu
bb
le d
ep
art
ure
dia
me
ter
(mm
)
Wall superheating (K)
Exp. Gerardi et al., 2011
Eq. 3.17 Lemmert and Chwala, 1977
Stephan, 1992 22o, Phan et al., 2009
79o, Phan et al., 2009
Figure 3. 10: Bubble departure diameter as a function of the wall superheat.
The other parameters in Equation 3.28 - 30 are defined by
4 ( )
3
l g
f
bW l
gf C
d
(3.35)

78
0.8wt f (3.36)
2
14
bWq c a
dA A N K
(3.37)
3.2.2.2 Heat Transfer by Nanoparticle Brownian Motion in the Microlayer
This study focuses on dilute nanofluids in which the liquid properties are negligibly
changed by the existence of nanoparticles. Therefore, the heat transfer due to
nanoparticle Brownian motion was considered only in the microlayer. This heat
transfer process could be equivalently treated as a thermal conduction across the
microlayer. The heat transfer rate qbm is thus defined by
0
lmtW sat
bm a lm bm
lm
T Tq N f A dt
(3.38)
where, Alm and δlm are the area and thickness of the liquid microlayer, respectively. λbm
is the equivalent thermal conductivity of nanoparticle Brownian motion. The
microlayer acting time tlm appears in Equation 3.38 to account for the fact that heat
transfer by the nanoparticle Brownian motion acts only when the microlayer exists
underneath the bubble.
Fundamental knowledge about the geometrical parameters (Alm and δlm) of liquid
microlayer is vital to formulating an effective correlation of qbm. In fact, although it has
been widely accepted that the growth of bubble on an active site is attributed to the
evaporation of liquid microlayer, quantitative measurements and characterizations of
liquid microlayer are still very rare. In recent years, a couple of experimental
measurements were conducted by Gao et al. (2013), Jung and Kim (2014) and Utaka et
al. (2013) using various cutting-edge technologies, with the aim to characterize the
dynamic process of liquid microlayer evaporation. These experimental measurements,
although have not contributed to a theoretical model for the liquid microlayer, have
provided important experimental data to estimate Alm and δlm in Equation 3.38.
The experimental observations (Gao et al., 2013; Utaka et al., 2013; Jung and Kim,
2014; Utaka et al., 2014; Chen and Utaka, 2015) proved that the liquid microlayer
presents strong transient characteristics as the bubble grows. A typical evolving process
of the microlayer along with the increasing bubble size is shown in Figure 3.11 (Jung
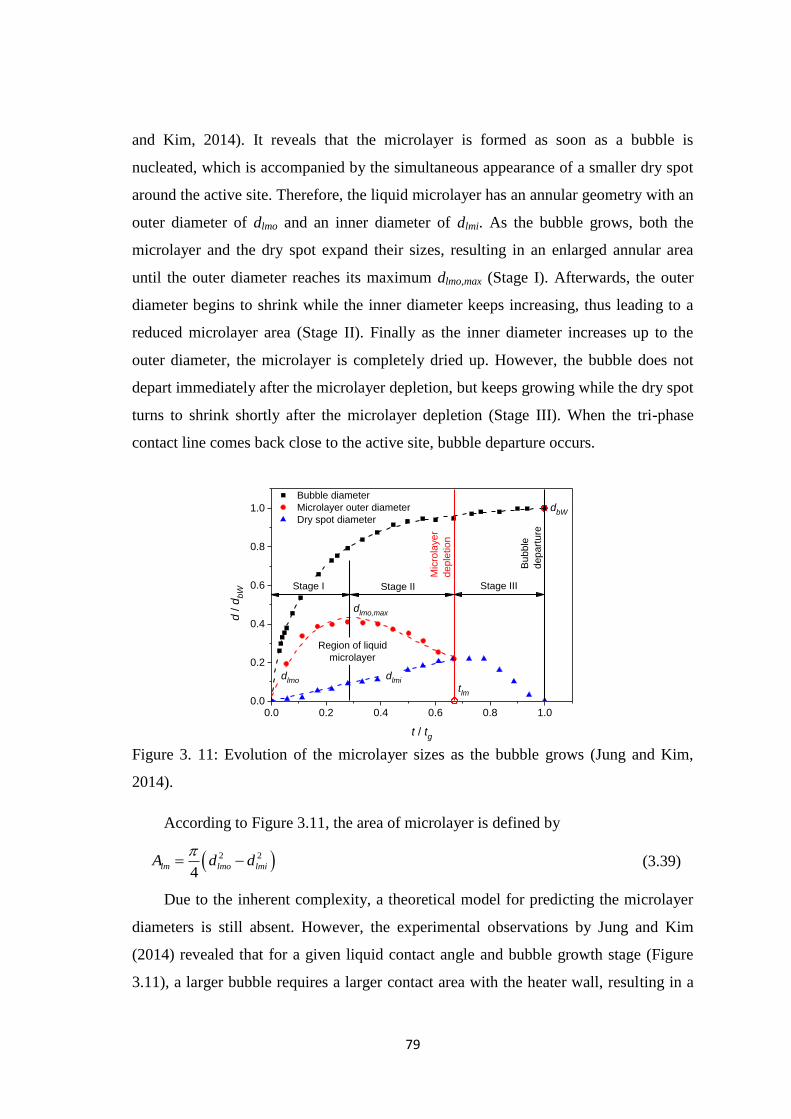
79
and Kim, 2014). It reveals that the microlayer is formed as soon as a bubble is
nucleated, which is accompanied by the simultaneous appearance of a smaller dry spot
around the active site. Therefore, the liquid microlayer has an annular geometry with an
outer diameter of dlmo and an inner diameter of dlmi. As the bubble grows, both the
microlayer and the dry spot expand their sizes, resulting in an enlarged annular area
until the outer diameter reaches its maximum dlmo,max (Stage I). Afterwards, the outer
diameter begins to shrink while the inner diameter keeps increasing, thus leading to a
reduced microlayer area (Stage II). Finally as the inner diameter increases up to the
outer diameter, the microlayer is completely dried up. However, the bubble does not
depart immediately after the microlayer depletion, but keeps growing while the dry spot
turns to shrink shortly after the microlayer depletion (Stage III). When the tri-phase
contact line comes back close to the active site, bubble departure occurs.
0.0 0.2 0.4 0.6 0.8 1.00.0
0.2
0.4
0.6
0.8
1.0
Bubble diameter
Microlayer outer diameter
Dry spot diameter
d /
db
W
t / tg
tlm
dlmi
dlmo
dbW
dlmo,max
Region of liquid
microlayer
Stage I Stage II
Mic
rola
yer
deple
tion
Stage III
Bubble
depart
ure
Figure 3. 11: Evolution of the microlayer sizes as the bubble grows (Jung and Kim,
2014).
According to Figure 3.11, the area of microlayer is defined by
2 2
4lm lmo lmiA d d
(3.39)
Due to the inherent complexity, a theoretical model for predicting the microlayer
diameters is still absent. However, the experimental observations by Jung and Kim
(2014) revealed that for a given liquid contact angle and bubble growth stage (Figure
3.11), a larger bubble requires a larger contact area with the heater wall, resulting in a

80
larger microlayer (Jung and Kim, 2014). Therefore, the microlayer sizes could be
simply correlated to the bubble diameter. As a further simplification in this study, both
dlmo and dlmi were correlated to dbW based on the experimental data given in Figure 3.11,
thus the mean microlayer area averaged over the microlayer acting time tlm was
estimated by
2 2 2
i0 0
0.08064
lm lmt t
lm lmo lm lm bWA d dt d dt t d
(3.40)
In addition, the experimental observations (Gao et al., 2013; Utaka et al., 2013;
Jung and Kim, 2014; Utaka et al., 2014; Chen and Utaka, 2015) found that the cross
section of the annular microlayer always takes a triangular shape, as shown in Figure
3.12. As the bubble grows, the angle between the microlayer-vapor interface and the
heater surface keeps constant (Figure 3.12(a)) when the interface was moving away
from the active site centre. By looking at a fixed radius location, a linear reduction of
the microlayer thickness is observed (Figure 3.12(b)).
Figure 3.12 indicates that the microlayer has an uneven thickness. However, this
uneven thickness in the order of microns could be safely ignored when compared with
the width of the microlayer annulus which is in the order of millimeters. Therefore, an
even microlayer thickness was assumed in this study, with the mean value estimated
based on the experimental data of Jung and Kim (2014).
0.0 0.2 0.4 0.6 0.8 1.00.0
0.8
1.6
2.4
3.2
t = 1.67 ms
t = 4.17 ms
t = 6.67 ms
t = 8.33 ms
t = 9.17 ms
Mic
rola
ye
r th
ickn
ess (
m)
Radial location, r/R ( - )

81
0 2 4 6 8 100
1
2
3
rlm
= 0.29 mm
rlm
= 0.35 mm
rlm
= 0.45 mm
rlm
= 0.54 mm
rlm
= 0.67 mm
Mic
rola
yer
thic
kn
ess (
m)
Time (ms)
Figure 3. 12: Linear reduction of the microlayer thickness as bubble grows (Jung and
Kim, 2014): (a) movement of the microlayer surface; (b) reduction of the microlayer
thickness.
The equivalent thermal conductivity of nanoparticle Brownian motion λbm in
Equation 3.38 is modeled according to Jang and Choi (2007) by
2
1 2 Prblbm np lm l l lm np
np
dC C Re
d (3.41)
where, C1 is the constant for considering the Kapitza resistance (Huxtable et al., 2003)
(C1 = 0.01) and C2 is a proportion constant (C2 = 18×106) (Jang and Choi, 2007). θlm is
the volumetric concentration of nanoparticles in the microlayer. dbf is the diameter of
base liquid molecules (dbl = 0.384 nm for water) and Rep is the nanoparticle Reynolds
number depending on the mean velocity of random Brownian motion.
p RM np lRe C d (3.42)
is the random motion velocity of nanoparticle. By assuming that a
nanoparticle moves freely over a distance of the mean free-path of the base liquid lbl,
could be calculated by
3
lmRM
l p bl
TC
d l
(3.43)

82
where, κ is the Boltzman constant and Tlm is the average temperature of the microlayer.
By assuming a linear temperature distribution across the micron-thick micolayer, the
average temperature is estimated by Tlm = ( TW + Tsat) / 2.
In addition, for a given nanoparticle concentration in the bulk liquid θ0, the
nanoparticle concentration in the microlayer could be modeled by
0
0 01 1lm
lm
tt t
(3.44)
and the mean nanoparticle concentration averaged over the microlayer acting time tlm is
0 0
0 0
1ln
1
lmt
m
lm
lm
t dt
t
(3.45)
Equation 3.44 and 45 are plotted in Figure 3.13(a) and (b), respectively. Figure
3.13(a) indicates that during the initial stage of microlayer evaporation, the nanoparticle
concentration increases very slowly. Then the concentrating process gradually speeds
up and finally a sharp increase of the concentration is observed close to the complete
evaporation. This indicates that the nanoparticle Brownian motion contributes to heat
transfer mainly in the later stage of a microlayer acting time. In addition, a strong
nonlinear relationship between the bulk concentration and the mean concentration in
the microlayer is observed (Figure 3.13(b)). When the bulk concentration is low (less
than 0.01 vol%), the average concentration in the microlayer is not sensitive to the bulk
value. However, with increasing bulk concentration (larger than 0.1 vol%), a small
increase in the bulk concentration would lead to a sharp increase of the mean
concentration.

83
0.0 0.2 0.4 0.6 0.8 1.00
20
40
60
80
100
Nan
opa
rtic
le c
on
ce
ntr
atio
n in m
icro
laye
r (v
ol %
)
t / tlm
1.0 v%
0.5 v%
0.1 v%
0.01 v%
0.001 v%
0.0001 v%Bu
lk c
once
ntr
atio
n
1E-4 1E-3 0.01 0.1 1
0
1
2
3
4
5
Me
an
co
nce
ntr
atio
n in
mic
rola
ye
r (v
ol %
)
Bulk concentration (v%)
Figure 3. 13: Nanoparticle concentration in microlayer: (a) evolution of nanoparticle
concentration in the microlayer; (b) mean nanoparticle concentration in microlayer vs.
the bulk concentration.
The equivalent thermal conductivity of nanoparticle Brownian motion λbm is
plotted versus the liquid temperature in Figure 3.14, which indicates that λbm increases
linearly with the microlayer temperature. In addition, when the bulk concentration is
low (<0.1 vol%), λbm is negligibly small (less than 0.02~0.03 W/(mK)) when compared
with that of the base liquid (0.68 W/(mK)). However, λbm increases significantly with
improved bulk concentration. As the bulk concentration reaches 0.1 vol%, λbm is larger
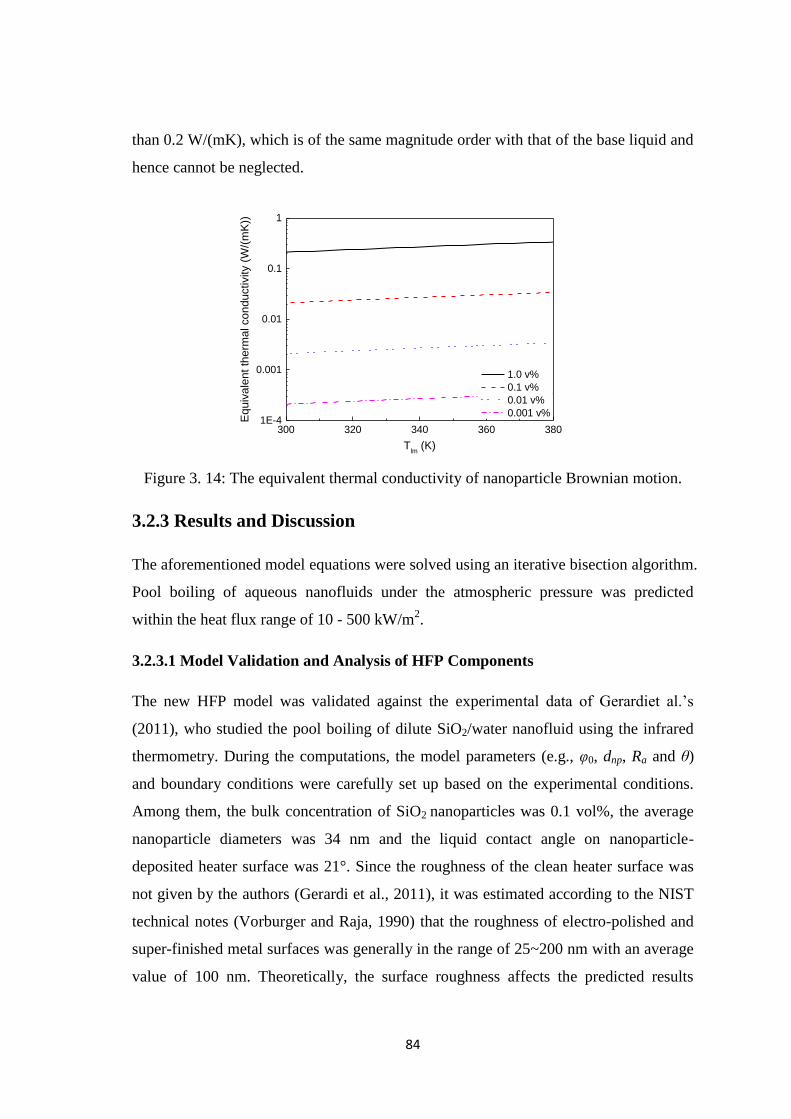
84
than 0.2 W/(mK), which is of the same magnitude order with that of the base liquid and
hence cannot be neglected.
300 320 340 360 3801E-4
0.001
0.01
0.1
1
Eq
uiv
ale
nt
the
rma
l co
ndu
ctivity (
W/(
mK
))
Tlm
(K)
1.0 v%
0.1 v%
0.01 v%
0.001 v%
Figure 3. 14: The equivalent thermal conductivity of nanoparticle Brownian motion.
3.2.3 Results and Discussion
The aforementioned model equations were solved using an iterative bisection algorithm.
Pool boiling of aqueous nanofluids under the atmospheric pressure was predicted
within the heat flux range of 10 - 500 kW/m2.
3.2.3.1 Model Validation and Analysis of HFP Components
The new HFP model was validated against the experimental data of Gerardiet al.‘s
(2011), who studied the pool boiling of dilute SiO2/water nanofluid using the infrared
thermometry. During the computations, the model parameters (e.g., θ0, dnp, Ra and ζ)
and boundary conditions were carefully set up based on the experimental conditions.
Among them, the bulk concentration of SiO2 nanoparticles was 0.1 vol%, the average
nanoparticle diameters was 34 nm and the liquid contact angle on nanoparticle-
deposited heater surface was 21°. Since the roughness of the clean heater surface was
not given by the authors (Gerardi et al., 2011), it was estimated according to the NIST
technical notes (Vorburger and Raja, 1990) that the roughness of electro-polished and
super-finished metal surfaces was generally in the range of 25~200 nm with an average
value of 100 nm. Theoretically, the surface roughness affects the predicted results

85
mainly through the parameter ξ(Ra/dnp) (Equation 3.33). For a given wall roughness,
different ratios of Ra/dnp could be realized by using various dnp values (Section 3.2).
More detailed investigation on the effects of wall roughness relative to nanoparticle
size on nucleate boiling of nanofluids is available in our recent study (Li et al., 2015).
For the purpose of comparison, computations were also conducted using the
classic HFP model. Firstly, the active site density predicted by the both HFP models
was compared against the experimental data (Gerardi et al., 2011), as shown in Figure
3.15. The both models give satisfactory predictions to the active site density, which
proves the validity of Equation 3.31 for nucleate boiling of nanofluids. However, for a
given heat flux, the new HFP model predicts a lower active site density, which is
caused by the lower prediction of the wall temperature, as will be explained in the
following sections.
0 10 20 30 400
100
200
300
0.1 vol.% SiO2/water
Avrg nanoparticle size 34 nm
Avrg surface roughness 100 nm
Active s
ite
de
nsity (
site
s /
cm
2)
Wall superheat (K)
Exp. Gerardi et al., 2011 Classic HFP model
New HFP model
Figure 3. 15: Prediction of the active site density.
The boiling curves yielded from the both HFP models were also compared against
the experimental data (Gerardi et al., 2011), as shown in Figure 3.16. Obviously, after
incorporating the component qbm, the new HFP model achieves a better agreement with
the experimental data than the classic HFP model. This is especially true when the
applied heat flux is elevated. For a given heat flux, the new HFP model predicts a lower
wall superheat, indicating a higher heat transfer coefficient. The lower wall superheat
predicted by the new HFP model gives a good interpretation to its lower prediction of
the active site density as shown in Figure 3.15.
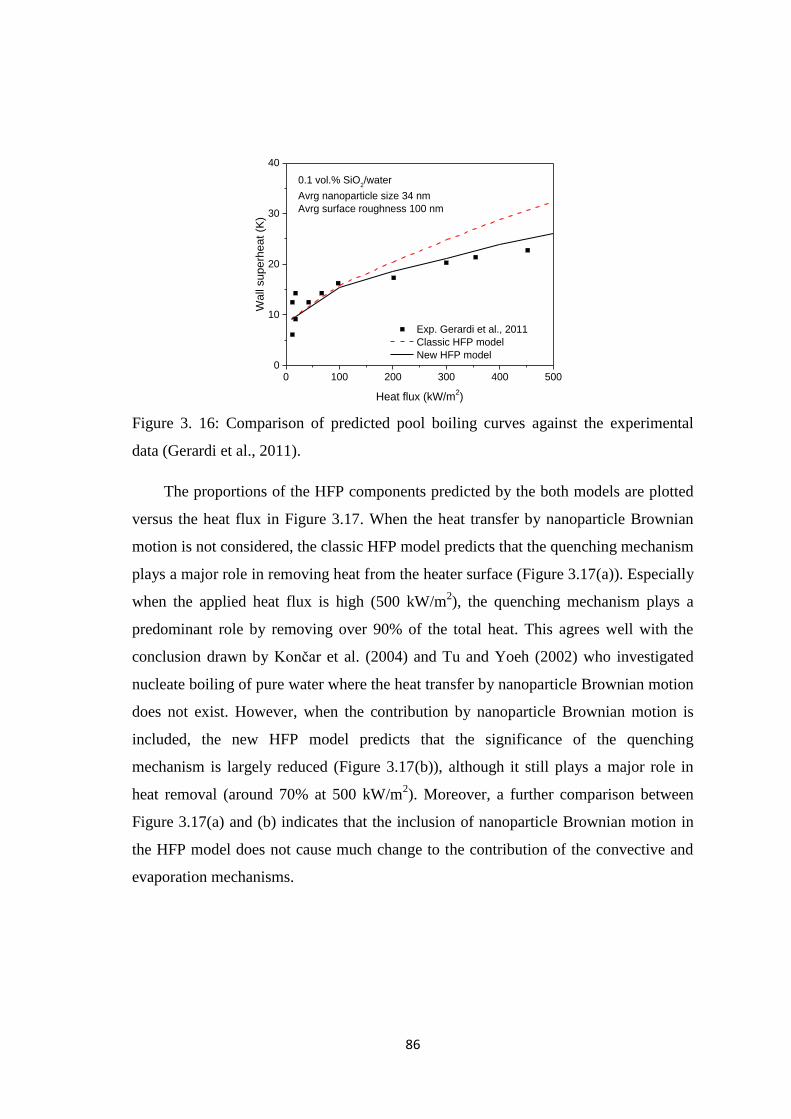
86
0 100 200 300 400 5000
10
20
30
40
0.1 vol.% SiO2/water
Avrg nanoparticle size 34 nm
Avrg surface roughness 100 nm
Wa
ll su
pe
rhe
at
(K)
Heat flux (kW/m2)
Exp. Gerardi et al., 2011
Classic HFP model
New HFP model
Figure 3. 16: Comparison of predicted pool boiling curves against the experimental
data (Gerardi et al., 2011).
The proportions of the HFP components predicted by the both models are plotted
versus the heat flux in Figure 3.17. When the heat transfer by nanoparticle Brownian
motion is not considered, the classic HFP model predicts that the quenching mechanism
plays a major role in removing heat from the heater surface (Figure 3.17(a)). Especially
when the applied heat flux is high (500 kW/m2), the quenching mechanism plays a
predominant role by removing over 90% of the total heat. This agrees well with the
conclusion drawn by Končar et al. (2004) and Tu and Yoeh (2002) who investigated
nucleate boiling of pure water where the heat transfer by nanoparticle Brownian motion
does not exist. However, when the contribution by nanoparticle Brownian motion is
included, the new HFP model predicts that the significance of the quenching
mechanism is largely reduced (Figure 3.17(b)), although it still plays a major role in
heat removal (around 70% at 500 kW/m2). Moreover, a further comparison between
Figure 3.17(a) and (b) indicates that the inclusion of nanoparticle Brownian motion in
the HFP model does not cause much change to the contribution of the convective and
evaporation mechanisms.

87
0 100 200 300 400 5000.0
0.2
0.4
0.6
0.8
1.0
0.1 vol.% SiO2/water
Avrg nanoparticle size 34 nm
Avrg surface roughness 100 nm
He
at
flu
x p
art
itio
nin
g p
rop
ort
ion
Heat flux (kW/m2)
qc / q
qe / q
qq / q
0 100 200 300 400 5000.0
0.2
0.4
0.6
0.8
1.0
0.1 vol.% SiO2/water
Avrg nanoparticle size 34 nm
Avrg surface roughness 100 nm
He
at
flu
x p
art
itio
nin
g p
rop
ort
ion
Heat flux (kW/m2)
qbm
/ q
qc / q
qe / q
qq / q
Figure 3. 17: Comparison of heat flux components by the models: (a) classic HFP
model; (b) new HFP model.
Figure 3.17(b) indicates that the proportion of the heat removal by nanoparticle
Brownian motion increases with the elevated heat flux and reaches up to 22% when the
applied heat flux is 500 kW/m2. According to Equation 3.38, the surface area of the
microalyer and the equivalent thermal conductivity are the key factors determining the
heat transfer rate by the nanoparticles in microlayer. In order to achieve a deeper
insight of the role of nanoparticle Brownian motion, the evolution of the parameters (n,
lmnA and λbm) with the heat flux is plotted in Figure 3.18. The new HFP model predicts
that the increasing heat flux improves the surface superheat, which creates more active

88
sites on the heater surface and leads to a larger area fraction of microalyers. The area
fraction is as high as 7% when the heat flux increases up to 500 kW/m2. In addition, the
elevated wall temperature intensifies the nanoparticles‘ Brownian motion in the
microlayer, which leads to an increased equivalent thermal conductivity. All these
factors working together make the nanoparticle Brownian motion play an increasingly
important role in removing heat from the heater surface.
0 100 200 300 400 5000
20
40
60
80
100
Active s
ite d
ensity (
sites/c
m2)
0.1 vol.% SiO2/water
Avrg nanoparticle size 34 nm
Avrg surface roughness 100 nm
Active site density, n (sites/cm2)
Equivalent thermal conductivity, lm
(W/(mK))
Microlayer area fraction, nAlm
( - )
Heat flux (kW/m2)
0.19
0.20
0.21
Equiv
ale
nt th
erm
al conductivity (
W/(
mK
))
0
2
4
6
8
Mic
rola
yer
are
a f
raction (
% )
Figure 3. 18: Microlayer parameters vs. heat flux.
Therefore, it is evident that the significance of nanoparticle Brwonian motion in
nucleate boiling of nanofluids is strongly affected by the applied heat flux. As the heat
flux is elevated, the heat transferred by nanoparticle Brwonian motion may take a
considerable proportion and thus cannot be ignored.
3.2.3.2 Analyses of the Influencing Parameters
As the dramatic heat transfer performances of nucleate boiling of nanofluids are
attributed to the deposition of nanoparticles, it is reasonable to expect that the material,
size and concentration of the nanoparticles may have significant effects on the
characteristics of nucleate boiling of nanofluids. In order to quantify the effects of each
factor individually, further computations were conducted. It should be noted that the
nanoparticles not just induce a new heat transfer mechanism in the microlayer
(Equation 3.38), more importantly, they alter the dynamics of bubble nucleation

89
through altering the surface morphology and properties. The both aspects working
together have contributed to the dramatic features of nucleate boiling of nanofluids.
Therefore in this study, the nanoparticle parameters (e.g., material, size and
concentration) were analyzed in terms of their simultaneous impacts on the Brownian
motion and bubble nucleation. During the computations, some necessary
approximations were made. For example, Kim et al. (2007) found in their experiments
that the liquid contact angle on a heater surface fouled with oxide nanoparticles, which
was in the range of 8~36 degrees, was subjected to a number of factors including the
nanoparticle material and concentration, and the applied heat flux. Since these factors
have not been fully characterized, a mean value of 21 degrees was employed for the
liquid contact angle in all the computational cases (Kim et al., 2007).
Computations were firstly conducted with different bulk concentrations
(0.001~0.1 vol%), while the rest conditions were kept consistent with those in Section
3.1. The predicted results are presented in Figure 3.19. The computations indicated that
the heat transfer is slightly enhanced (avrg. 6% in the heat transfer coefficient) as the
bulk concentration increases from 0.001 vol% to 0.1 vol% (Figure 3.19(a)). As the
active site density is significantly reduced (Figure 3.19(b)), it was believed that this
enhancement is not contributed by the evaporation mechanism. On the other hand, a
dramatic increase over 2 orders of magnitude is predicted with the equivalent thermal
conductivity λbm (Figure 3.19(c)), which causes a significant increase in the qbm
component (Figure 3.19(d)). As shown in Figure 3.19(d), when the bulk concentration
is low (0.001 vol%), the importance of nanoparticle Brownian motion is negligible.
However, as the bulk concentration increases up to 0.1 vol%, a considerable proportion
of the heat flux is removed by the nanoparticles. The elevated heat flux further
enhances this significance so that over 22% of heat is removed by the nanoparticles
when the applied heat flux reaches 500 kW/m2. Therefore, for nucleate boiling of dilute
nanofluids, increasing the nanoparticle concentration could largely improve the heat
transfer component through nanoparticle Brownian motion nonetheless it would reduce
the heat removal by evaporation.

90
0 250 5000
10
20
30
40
50
0 250 5000
40
80
120
160
200
0 250 5001E-3
0.01
0.1
1
0 250 5000.0
0.1
0.2
0.3
Wa
ll su
pe
rhe
at
(K)
Heat flux (kW/m2)
0.001 v%
0.01 v%
0.1 v%
Active s
ite
de
nsity (
site
s/c
m2)
Heat flux (kW/m2)
0.001 v%
0.01 v%
0.1 v%
(d)(c)
Equiv
ale
nt th
erm
al conductivity (
W/(
mK
))
Heat flux (kW/m2)
0.001 v%
0.01 v%
0.1 v%
(b)
qb /
q
Heat flux (kW/m2)
0.001 v%
0.01 v%
0.1 v%
(a)
Figure 3. 19: Effects of the bulk concentration. (Note: SiO2/water, nanoparticle size 34
nm, surface roughness 100 nm).
0 250 5000
10
20
30
40
50
0 250 5000
40
80
120
160
0 250 5001E-3
0.01
0.1
1
0 250 5000.0
0.1
0.2
0.3
Wa
ll su
pe
rhe
at
(K)
Heat flux (kW/m2)
34 nm
100 nm
300 nm
500 nm
Active s
ite
de
nsity (
site
s/c
m2)
Heat flux (kW/m2)
34 nm
100 nm
300 nm
500 nm
Equ
iva
len
t th
erm
al co
ndu
ctivity (
W/(
mK
))
Heat flux (kW/m2)
34 nm
100 nm
300 nm
500 nm
qb /
q
Heat flux (kW/m2)
34 nm
100 nm
300 nm
500 nm
(a) (b) (c) (d)
Figure 3. 20: Effects of the nanoparticle size. (Note: 0.1 vol% SiO2/water, surface
roughness 100 nm).
The computational results yielded from different nanoparticle sizes are shown in
Figure 3.20. Figure 3.20(a) illustrates that with the increasing nanoparticle size, the
heat transfer is deteriorated at first, but then enhanced after the nanoparticle size
exceeds the average surface roughness (100 nm). Narayan et al. (2007) and Das et al.
(2008) suggested that when the nanoparticles size equals roughly to the surface
roughness, the deposited nanoparticles could settle in the cavity and thus significantly
reduce the active site density. On the contrary, when the nanoparticles are obviously
larger or smaller than the surface roughness, the deposited nanoparticles could create
more active sites and thus enhance the heat transfer. This hypothesis was verified in

91
this study, as shown in Figure 3.20(b). However, the increased nanoparticle size
significantly reduces the intensity of Brownian motion, which leads to a decreased
equivalent thermal conductivity λbm and the proportion of qbm, as shown in Figure
3.20(c) and (d), respectively.
Lastly, the effects of nanopartilce material were analyzed. Although a large
number of materials could be used to prepare nanofluids, oxides, thanks to their
physically and chemically stable properties, are widely regarded as promising materials
for practical applications (Buongiorno et al., 2008). Therefore, several widely used
oxides (SiO2, Al2O3, TiO2, ZnO and ZrO2) as summarized by Vafaei and Borca-Tasciuc
(2013) were selected in this study and some of their property parameters are listed in
Table 3.3.
Table 3. 3 Physical Properties of the nanoparticle materials and water
(webbook.nist.gov).
Material Density
(kg/m3)
Thermal conductivity
(W/(m.K))
Specific heat
(J/(kg.K))
γ
( - )
Saturated water 958 0.679 4216 1.000
SiO2 2410 1.4 705 0.931
Al2O3 3490 25.0 451 3.788
TiO2 4010 8.3 690 2.894
ZnO 5606 3.2 580 1.948
ZrO2 5570 2.2 480 1.465
0 250 5000
10
20
30
40
50
0 250 5000
40
80
120
160
0 250 5000.001
0.01
0.1
1
0 250 5000.0
0.1
0.2
0.3
Wa
ll su
pe
rhe
at
(K)
Heat flux (kW/m2)
SiO2/water
Al2O
3/water
TiO2/water
ZnO/water
ZrO2/water
(a) (b) (c) (d)
SiO2/water
Al2O
3/water
TiO2/water
ZnO/water
ZrO2/water
Active s
ite
de
nsity (
site
s/c
m2)
Heat flux (kW/m2)
SiO2/water
Al2O
3/water
TiO2/water
ZnO/water
ZrO2/water
Equ
iva
len
t th
erm
al co
nd
uctivity (
W/(
mK
))
Heat flux (kW/m2)
SiO2/water
Al2O
3/water
TiO2/water
ZnO/water
ZrO2/water
qb /
q
Heat flux (kW/m2)
Figure 3. 21: Effects of the nanoparticle material. (Note: 0.1 vol% nanofluids,
nanoparticle size 34 nm, surface roughness 100 nm)

92
The numerical results are shown in Figure 3.21, which indicate that the heat
transfer performance is strongly affected by the nanoparticle material. The highest heat
transfer coefficient was predicted with the SiO2/water nanofluid while the lowest heat
transfer coefficient appeared with the Al2O3/water nanofluid (Figure 3.21(a)), despite
SiO2 has the lowest thermal conductivity while Al2O3 has the highest thermal
conductivity among the selected materials (Table 3.3). However, no explicit impact of
the nanoparticle material was predicted on the equivalent thermal conductivity λbm.
Meamwhile, the effects of nanoparticle material on the active site density and the
Brownian motion component qbm was not clearly presented.
0.0
0.2
0.4
0.6
0.8
1.0
0 100 200 300 400 5000.0
0.2
0.4
0.6
0.8
1.0
qe /
q
qe /
q
SiO2/water
Al2O
3/water
TiO2/water
ZnO2/water
ZrO2/water
qq /
q
qq /
q
Heat flux (kW/m2)
SiO2/water
Al2O
3/water
TiO2/water
ZnO2/water
ZrO2/water
Figure 3. 22: Effects of the nanoparticle material on the quenching and evaporation
heat flux components.
In order to achieve a deeper insight, the effects of nanoparticle materials on the
quenching and evaporation heat flux components were further analyzed, as shown in
Figure 3.22. The results demonstrate that the significances of the quenching and
evaporation mechanisms – both correlated to the active site density – decrease with the
increased wall-liquid interaction parameter γ, which actually improves the significance
of the convection and Brownian motion mechanisms. Considering the negligibly
changed λbm (Figure 3.21(c)), it could be suggested that the effects of nanoparticle
materials on nucleate boiling of nanofluids are implemented mainly through altering
the characteristics of bubble nucleation, which indirectly change the importance of the
qbm component through elevating or reducing the temperature difference for heat

93
transfer. Comparatively, the change in nanoparticle material alone does not
significantly change the intensity of nanoparticle Brownian motion and its equivalent
thermal conductivity.
3.2.4 Conclusions
In this study, a new HFP model was proposed for nucleate boiling of nanofluids.
Compared with the classic HFP model, the new model contains an additional HFP
component that accounts for the heat transfer by the nanoparticle Brownian motion in
the microlayer. Numerical computations were conducted using both the new and classic
HFP models. The numerical results were analyzed and compared against the
experimental data available in the literature. The conclusions arising from this study are
as follows:
(1) Due to the continuously increased nanopaprticle concentration in the microalyer,
heat transfer by the Brownian motion of nanoparticles in the microlayer becomes an
important mechanism of heat removal from the heater surfaces boiling in nanofluids.
(2) The new HFP model achieves a better agreement with the experimental data than
the classic HFP model, especially when the applied heat flux is high. This indicates
that the active site density available on the heater surface plays a crucial role in
determining the significance of nanoparticle Brownian motion.
(3) For dilute nanofluids, the heat transfer due to nanoparticle Brownian motion is
positively affected by the bulk concentration and negatively influenced by the
nanoparticle size. An increased bulk concentration or a decreased nanoparticle size
would enhance the significance of nanoparticle Brownian motion in heat removal.
Comparatively, the nanoparticle material does not have much impact on the heat
transfer due to the nanoparticle Brownian motion.

94
Chapter 4
Numerical Modelling of Two-phase Flows of
Dilute Nanofluids
The main findings of this chapter have been included in:
Yuan, Y., Li, X. D., and Tu, J. Y. (2016). Numerical modelling of air-nanofluid
bubbly flows in a vertical tube using the MUltiple-SIze-Group (MUSIG) model.
International Journal of Heat and Mass Transfer, 102: 856-866.
Li, X. D., Yuan, Y., and Tu, J. Y. (2016). Modelling and critical analysis of
bubbly flows of dilute nanofluids in a vertical tube. Nuclear Engineering and
Design, 300: 173-180.

95
4.1 Two-fluid Modelling of Air-nanofluid Bubbly Flows
Abstract:
The bubbly flows of air-nanofluid and air-water in a vertical tube were
numerically simulated using the two-fluid model. Comparison of the numerical results
against the experimental data of Park and Chang (2011) demonstrated that the classic
two-fluid model, although agreed well with the air-water data, was not applicable to the
air-nanofluid bubbly flow. It was suggested that in a bubbly flow system, the existence
of interfaces allows the spontaneous formation of a thin layer of nanoparticle assembly
at the interfaces, which significantly changes the interfacial behaviours of the air
bubbles and the roles of the interfacial forces. As the conservation equations of the
classic two-fluid model are still applicable to nanofluids, the mechanisms underlying
the modified interfacial behaviours need to be carefully taken into account when
modelling air-nanofluid bubbly flows. Thus, one of the key tasks when modelling
bubbly flows of air-nanofluid using the two-fluid model is to reformulate the interfacial
transfer terms according to the interfacial behaviour modifications induced by
nanoparticles.
4.1.1 Introduction
As a new type of engineered liquids for enhancing heat transfer, nanofluids have been
attracting an increasing attention since the novel concept ―nanofluid‖ was firstly
proposed by Choi and Eastman (1995). Nanofluids were initially investigated because
of their improved thermal conductivity brought out by the nanoparticles. During the
past years, numerous studies have been conducted on the convective transport
phenomena in nanofluids (Buongiorno, 2006). Up to today, agreements have been
reached on the mechanisms of heat transfer in single-phase nanofluids (Chandrasekar et
al., 2012; Yu et al., 2012). It is generally accepted that due to their small sizes,
nanoparticles are mixed with the base liquid at near-molecular level. A dilute nanofluid
behaves hydro-dynamically like its pure base liquid and could be treated theoretically
as a single-phase liquid. This has allowed developing predictive models for single-
phase flows of nanofluids based on the Navier-Stokes equations (Kamyar et al., 2012).

96
Existing studies (Akbari et al., 2011; Moraveji and Ardehali, 2013) have proven that
the single-phase computational fluid dynamics (CFD) model is capable of describing
the flow and heat transfer behaviours in nanofluids on condition that the
thermodynamic properties are properly formulated.
In recent years, the great potential of enhancing heat transfer using two-phase
flows of nanofluids, especially by nucleate boiling, has been gradually recognized
(Cheng et al., 2008). However, due to the relative novelty and inherent complexity,
agreements are far to be reached in this area and many opinions are still in controversy
(Barber et al., 2011). Nanofluids come with various concentrations, however, dilute
nanofluids with very low nanoparticle loads (typically less than 0.1 vol%) are generally
preferred for boiling applications (Buongiorno et al., 2009) when one considers the
practical feasibility. For nanofluids with such low concentrations, a number of
experimental measurements demonstrated that their physical properties (e.g. the
thermal conductivity, density, viscosity, specific heat and latent heat) are negligibly
different from those of their pure base liquids (Kim et al., 2007; Kwark, 2009). The
dramatically changed boiling heat transfer performances have been attributed to the
surface modifications induced by nanoparticle deposition during the boiling process
(Wen et al., 2011; Vafaei and Borca-Tasciuc, 2014). In recent years, CFD modellings
of nucleate boiling of nanofluids have been conducted (Li et al., 2014a; Li et al., 2014b;
Li et al., 2015) based on the two-fluid model of Ishii (Ishii, 1975). In these studies, the
effects of nanoparticle deposition on bubble nucleation on the heater surface were
properly considered. The model applicability and accuracy, although still not
satisfactory, have been largely improved. However, an important fact may have been
ignored – the nanoparticles suspended in the base liquid not only modify the heat
surface, but also change the two-phase flow structures and hydrodynamic features.
Nayak et al. (2011) studied experimentally the transient and stability behaviours of
boiling two-phase natural circulation loop with water and Al2O3/water nanofluid (1.0
wt%, approx. 0.25 vol%), respectively. They found that the natural circulation flow
behaviours of nanofluid were very close to that of water in single-phase conditions.
However, the buoyancy induced flow rates in boiling conditions were relatively higher
with nanofluid than with water. Dominguez-Ontiveros et al. (2010) observed the pool

97
boiling of Al2O3/water nanofluids (0.001 and 0.002 vol%) using dynamic particle
image velocimetry (DPIV). They found that the hydrodynamic behaviours of bubbles
were significantly changed when nanoparticles are introduced into water. Recently,
Rana et al. (2014) measured the void fraction in boiling flows of ZnO/water nanofluids
(0.001~0.01 vol%). The results revealed that the void fraction decreased down to 86%
with the use of nanofluid in place of water.
In addition, the modifications of two-phase flow characteristics by nanoparticles
were also observed in isothermal flows. Wang and Bao (2009) investigated the
transition of two-phase flow regimes in a vertical capillary tube, using nitrogen as the
gaseous phase and CuO/water nanofluid (0.5 wt%, approx. 0.08 vol%) and pure water
as the liquid phase, respectively. They found that the bubbly-slug flow regime
transition occurred at a lower liquid superficial velocity or a higher gas superficial
velocity in the nanofluid than in water. This indicated that nanofluids could maintain a
bubbly flow pattern with a higher void fraction than pure water, which is undoubtedly
of great importance to enhancing two-phase heat and mass transfers, thanks to the
larger interfacial area created by the higher void fraction in nanofluids. Wang and Bao
(2009) suggested that the changed flow-regime transition characteristics were mainly
due to the changed liquid surface tension. Park and Chang (2011) measured the local
distributions of air-liquid bubbly flow parameters in a vertical tube using a conductivity
double-sensor probe. Both pure water and Al2O3/water nanofluid (0.1 vol%) were used
as the working liquids. The results showed that when the operational conditions were
exactly the same, the air-nanofluid bubbly flow had a more flattened void fraction
distribution, lower bubble velocity, higher interfacial area concentration and small
bubble size than those in the air-water flow. They attributed these changes to the altered
interfacial drag and lift forces.
Although the physical mechanisms underlying the flow modifications are yet to be
discovered, it is evident that the existence of nanoparticles in the liquid has a significant
effect on the two-phase flow structures and features, even with extremely low
nanoparticle concentrations. As two-phase flows are coupled systems, an effective CFD
simulation of two-phase flows requires accurate description of the inter-phase transport
processes of mass, momentum and energy in the whole flow field. Therefore, in order

98
to achieve an effective modelling of two-phase flows of nanofluids using the two-fluid
model, the closure correlations, which are generally empirical or semi-empirical and
thus not universal, have to be carefully reformulated or selected in order to account for
the specific features induced by nanoparticles.
In order to identify the individual factors affecting the hydrodynamic behaviours
of nanofluid two-phase flows, isothermal bubbly flow of air-nanofluid in a vertical tube
was modelled in this study using the classic two-fluid model incorporated with various
inter-phase transfer terms. Two-phase flow parameters including the air velocity and
void fraction were predicted and compared against the experimental data of Park and
Chang (2011). Bubbly flow of air-water was also simulated for the purpose of
comparison. The results demonstrated that the classic two-fluid model had a
satisfactory accuracy for the air-water bubbly flow, but was inapplicable to the air-
nanofluid flow. Further analyses demonstrated that the suspended nanoparticles in the
liquid tend spontaneously to assembly at the interfaces, which significantly changes the
liquid-bubble interfacial behaviours and makes the existing empirical closure
correlation invalid to the air bubbles submerged in nanofluids. Suggestions were given
for future studies.
4.1.2 Modelling of Bubbly Flow in a Vertical Tube
4.1.2.1 The Two-fluid Model
The experimental data of Park and Chang (2011) were employed in this study for
model validation and comparison. In their experiments, dilute Al2O3/water nanofluid
with a concentration of 0.1 vol% was synthesized by dispersing γ-Al2O3 nanoparticles
(mean diameter 25 nm) into distilled water. Then, the nanofluid was supplied into a
vertical acrylic tube (15 mm in diameter and 2.5 m in height) from the bottom. Air
bubbles were also generated at the bottom using a bubble bed. The mixture was driven
by a pump to form an upward two-phase flow in the test section. The experiments were
conducted under the atmospheric pressure and the ambient temperature. By controlling
the superficial velocities at jl = 2.83 m/s for the liquid and ja = 0.19 m/s for the air,
respectively, a stable bubbly flow was achieved in the tube. Radial distributions of the
two-phase flow parameters including the void fraction, bubble velocity and diameter
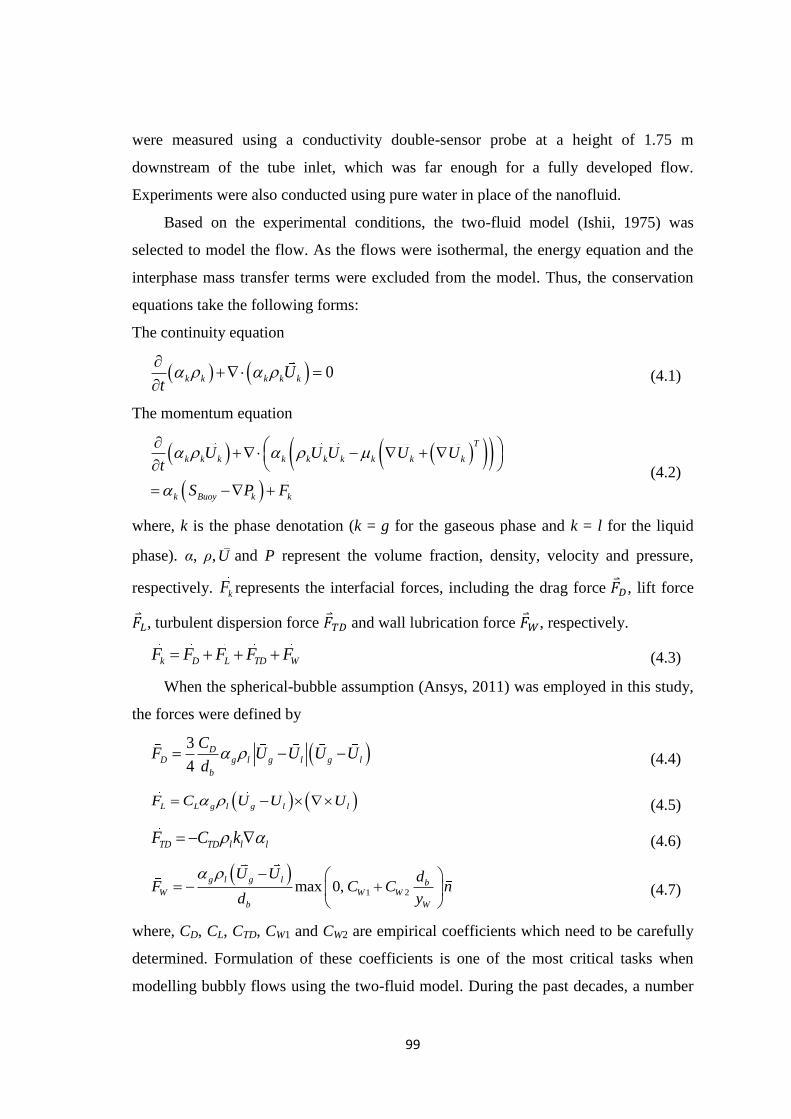
99
were measured using a conductivity double-sensor probe at a height of 1.75 m
downstream of the tube inlet, which was far enough for a fully developed flow.
Experiments were also conducted using pure water in place of the nanofluid.
Based on the experimental conditions, the two-fluid model (Ishii, 1975) was
selected to model the flow. As the flows were isothermal, the energy equation and the
interphase mass transfer terms were excluded from the model. Thus, the conservation
equations take the following forms:
The continuity equation
0k k k k kU
t
(4.1)
The momentum equation
T
k k k k k k k k k k
k Buoy k k
U U U U Ut
S P F
(4.2)
where, k is the phase denotation (k = g for the gaseous phase and k = l for the liquid
phase). α, ρ,U and P represent the volume fraction, density, velocity and pressure,
respectively. kF represents the interfacial forces, including the drag force , lift force
, turbulent dispersion force and wall lubrication force , respectively.
k D L TD WF F F F F
(4.3)
When the spherical-bubble assumption (Ansys, 2011) was employed in this study,
the forces were defined by
3
4
DD g l g l g l
b
CF U U U U
d
(4.4)
L L g l g l lF C U U U (4.5)
TD TD l l lF C k
(4.6)
1 2max 0,
g l g l bW W W
b W
U U dF C C n
d y
(4.7)
where, CD, CL, CTD, CW1 and CW2 are empirical coefficients which need to be carefully
determined. Formulation of these coefficients is one of the most critical tasks when
modelling bubbly flows using the two-fluid model. During the past decades, a number

100
of empirical or semi-empirical correlations, including the Ishii-Zuber (Ishii and Zuber,
1979) and Grace (Clift et al., 1978) models for CD and the Tomiyama correlation for CL
(Tomiyama, 1998), have been proposed. However, the applicability of these
correlations to bubbly flow of nanofluids is still open to question, as will be discussed
in the following sections.
4.1.2.2 Numerical Procedures
Due to the axis-symmetric distribution of the two-phase flow field in the tube, a quarter
of the test section (Park and Chang, 2011) was built as the computational domain, as
illustrated in Figure 4.1. The domain was then discretized using structured hexahedral
meshes with finer mesh close to the tube wall and coarser mesh at the tube centre. The
centre-to-wall mesh size ratio was 2.5. Uniform mesh size (4 mm) was employed in the
axial direction of the tube. Mesh sensitivity test proved that mesh independence was
achieved at 63,000 cells since a further increase of the cell number to 128,000 just
caused a small change less than 1% in the predicted air velocity at a randomly selected
monitoring point.
During the computations, uniformly distributed air and liquid flow rates were
applied at the inlet and a zero pressure boundary condition was applied at the outlet.
The flow of the gaseous phase was assumed to be laminar and turbulence was only
modelled for the liquid phase using the updated k-ε model by Sato and Sekoguchi
(1975), where a bubble-induced additional turbulent viscosity was considered when
estimating the liquid effective viscositye
l :
2e l
g ll l l b b g
l
kC C d U U
(4.8)
The items on the right-hand-side of Equation 4.8 represent the molecular viscosity,
turbulent viscosity and bubble-induced additional turbulent viscosity, respectively.
The aforementioned model equations were solved using the commercial CFD code
ANSYS-CFX 14.5. Convergence was achieved within 2,000 iterations when the
residual of the liquid continuity equation dropped down to lower than 1×10⁻⁵
.

101
Figure 4. 1: The computational domain and boundary conditions.
4.1.3 Results and Discussion
4.1.3.1 Model Applicability to Water and Nanofluid
Air-water bubbly flow was firstly computed using the two-fluid model. Bubble
coalescence and breakup were not considered. Instead, a uniform bubble diameter of db
= 6 mm was estimated based on the experimental data (Park and Chang, 2011). For the
calculation of interfacial forces, constants were selected for the turbulent dispersion
coefficient (CTD = 0.1) and wall lubrication coefficients (CW1 = -0.01 and CW2 = 0.05),
as recommended by CFX-14.5. The drag coefficient was calculated using the Ishii-
Zuber model (Ishii and Zuber, 1979) which is a function of the bubble Reynolds
number
0.75241 0.1 0 500 ~ 1000D b b
b
C Re ReRe
(4.9)
The lift coefficient was calculated using the Tomiyama correlation (Tomiyama,
1998) in order to account for the variable acting direction of the lift force depending on
the bubble size.

102
**
**
*
4.0min 0.288, tanh 0.121 ,
4.0 10.0
0.27 10.0
b
L
EoRe f Eo
EoC f Eo
Eo
(4.10)
where, f (Eo*) is an empirical correlation of the modified Eötvös number (Tomiyama,
1998).
* *3 *2 *0.00105 0.0159 0.0204 0.474f Eo Eo Eo Eo (4.11)
2
* l g Hg dEo
(4.12)
where, dH is the maximum bubble dimension in the flow direction and was estimated
using the Wellek correlation (Wellek et al., 1966).
The two-fluid model incorporated with the above closure correlations is termed in
this study as the classic two-fluid model (TFM). The predicted radial distributions of
void fraction and bubble velocity at Z = 1.75 m are shown in Figure 4.2. The
comparison demonstrated that the predicted local two-phase flow parameters agreed
well with the experimental data (Park and Chang, 2011), which proved the validity of
the classic two-fluid model to air-water bubbly flows.
0.0 0.2 0.4 0.6 0.8 1.00.0
0.1
0.2
0.3
0.4
0.5 Exp. - air/water (Park and Chang, 2011)
Classic TFM, db = 6 mm
Vo
id f
ract
ion
( -
)
r / R ( - )
(a)

103
0.0 0.2 0.4 0.6 0.8 1.00
1
2
3
4
5
Exp - air/water (Park and Chang, 2011)
Classic TFM, db = 6 mm
Bu
bb
le v
elo
city
(m
/s)
r / R ( - )
(b)
Figure 4. 2: Comparison the classic two-fluid model against the experimental data of
water: (a) void fraction; (b) bubble velocity (Park and Chang, 2011).
Then, the air-nanofluid bubbly flow (Park and Chang, 2011) was computed using
the classic two fluid model with the same correlations (Equation 4.9 and 4.10) for CD
and CL. For the air-nanofluid case, the average bubble size was estimated to db = 3 mm
according to the experimental data (Park and Chang, 2011). The liquid density and
viscosity were calculated using Equation 4.13 and 4.14 (Prasher et al., 2006),
respectively.
1nf w v np v (4.13)
1 2.5nf v w (4.14)
where, θv is the volumetric concentration of nanoparticles in the nanofluid, ρnp stands
for the nanoparticle density. For the dilute nanofluid of this study (θv = 0.1 vol%), the
effects of nanoparticle on its density and viscosity could be safely ignored, which is
consistent with most experimental measurements (Kim et al., 2007; Kwark, 2009).
However, the existence of nanoparticles in water was found to reduce the liquid surface
tension to a measurable extent. Esmaeilzadeh et al. (2014) used a series of advanced
techniques including dynamic light scattering, zeta potential measurement and
centrifugation to study the effects of nanoparticles on the air-water surface tension.
They found that the addition of ZrO2 nanoparticles into water could alter the liquid
surface activity and reduce the surface tension. The experiments by Kwark (2009)

104
further revealed that even the addition of an extremely small amount of Al2O3
nanoparticles (0.001 g/l, approx. 2.5×10⁻⁶
vol%) could cause a 2 % reduction in the
liquid surface tension. When the CuO nanoparticle concentration in pure water
increased up to 1.0 wt% (approx. 0.16 vol%), the liquid surface tension reduction could
be as large as 15% (Wang and Bao, 2009). For the 0.1 vol% Al2O3/water nanofluid of
Park and Chang (2011), the liquid surface tension was estimated based on Kwark‘s
measurements (2009) to be 95% of that of pure water.
0.0 0.2 0.4 0.6 0.8 1.00.0
0.1
0.2
0.3
0.4
0.5
Void
fra
ctio
n (
- )
r / R ( - )
Exp. - air/nanofluid (Park and Chang, 2011)
Classic TFM, db = 3.0 mm
(a)
0.0 0.2 0.4 0.6 0.8 1.00
1
2
3
4
5
Bubble
velo
city
(m
/s)
r / R ( - )
Exp. - air/nanofluid (Park and Chang, 2011)
Classic TFM, db = 3.0 mm
(b)
Figure 4. 3: Comparison the classic two-fluid model against the experimental data of
nanofluid: (a) void fraction; (b) bubble velocity (Park and Chang, 2011).

105
Figure 4. 4: Prediction of the void fraction development along the tube using the TFM.
Note: Due to the large length-to-diameter ratio of the computational domain, the void
fraction contours were not shown in actual proportion.
The predicted local bubbly flow parameters of air-nanofluid are shown in Figure
4.3. The two-fluid model predicted a near-wall-peaked distribution of the void fraction
(Figure 4.3(a)), which was totally different from the actual central-peaked distribution
as observed by Park and Chang (2011), despite the predicted bubble velocity was just
slightly larger than the experimental data (Figure 4.3(b)).
The computations using the classic two-fluid model returned totally different
bubble distributions in the tube. In order achieve a clear view of the bubble migration
prediction, the simulated void fraction profiles in a section plan along the tube axis
were shown in Figure 4.4, for air-water and air-nanofluid bubbly flows, respectively.
Figure 4.4 illustrates that for both air-water and air-nanofluid bubbly flows, the two-
phase flows only need a short distance to reach full-development. In the air-water
bubbly flow case, when bubbles were assumed to be uniformly injected from the
bottom of the tube, they quickly moved towards the tube centre. On the contrary, when
the bubbles are injected to nanofluid, they were falsely predicted to move towards the
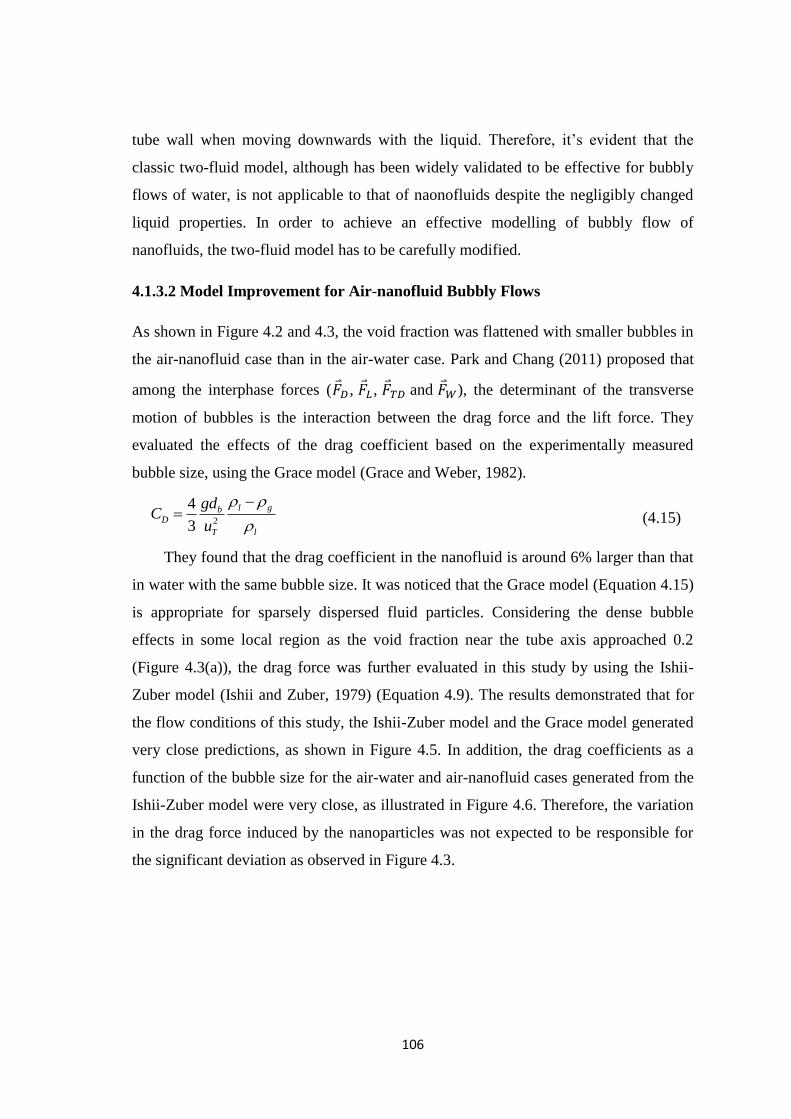
106
tube wall when moving downwards with the liquid. Therefore, it‘s evident that the
classic two-fluid model, although has been widely validated to be effective for bubbly
flows of water, is not applicable to that of naonofluids despite the negligibly changed
liquid properties. In order to achieve an effective modelling of bubbly flow of
nanofluids, the two-fluid model has to be carefully modified.
4.1.3.2 Model Improvement for Air-nanofluid Bubbly Flows
As shown in Figure 4.2 and 4.3, the void fraction was flattened with smaller bubbles in
the air-nanofluid case than in the air-water case. Park and Chang (2011) proposed that
among the interphase forces ( , , and ), the determinant of the transverse
motion of bubbles is the interaction between the drag force and the lift force. They
evaluated the effects of the drag coefficient based on the experimentally measured
bubble size, using the Grace model (Grace and Weber, 1982).
2
4
3
l gbD
T l
gdC
u
(4.15)
They found that the drag coefficient in the nanofluid is around 6% larger than that
in water with the same bubble size. It was noticed that the Grace model (Equation 4.15)
is appropriate for sparsely dispersed fluid particles. Considering the dense bubble
effects in some local region as the void fraction near the tube axis approached 0.2
(Figure 4.3(a)), the drag force was further evaluated in this study by using the Ishii-
Zuber model (Ishii and Zuber, 1979) (Equation 4.9). The results demonstrated that for
the flow conditions of this study, the Ishii-Zuber model and the Grace model generated
very close predictions, as shown in Figure 4.5. In addition, the drag coefficients as a
function of the bubble size for the air-water and air-nanofluid cases generated from the
Ishii-Zuber model were very close, as illustrated in Figure 4.6. Therefore, the variation
in the drag force induced by the nanoparticles was not expected to be responsible for
the significant deviation as observed in Figure 4.3.
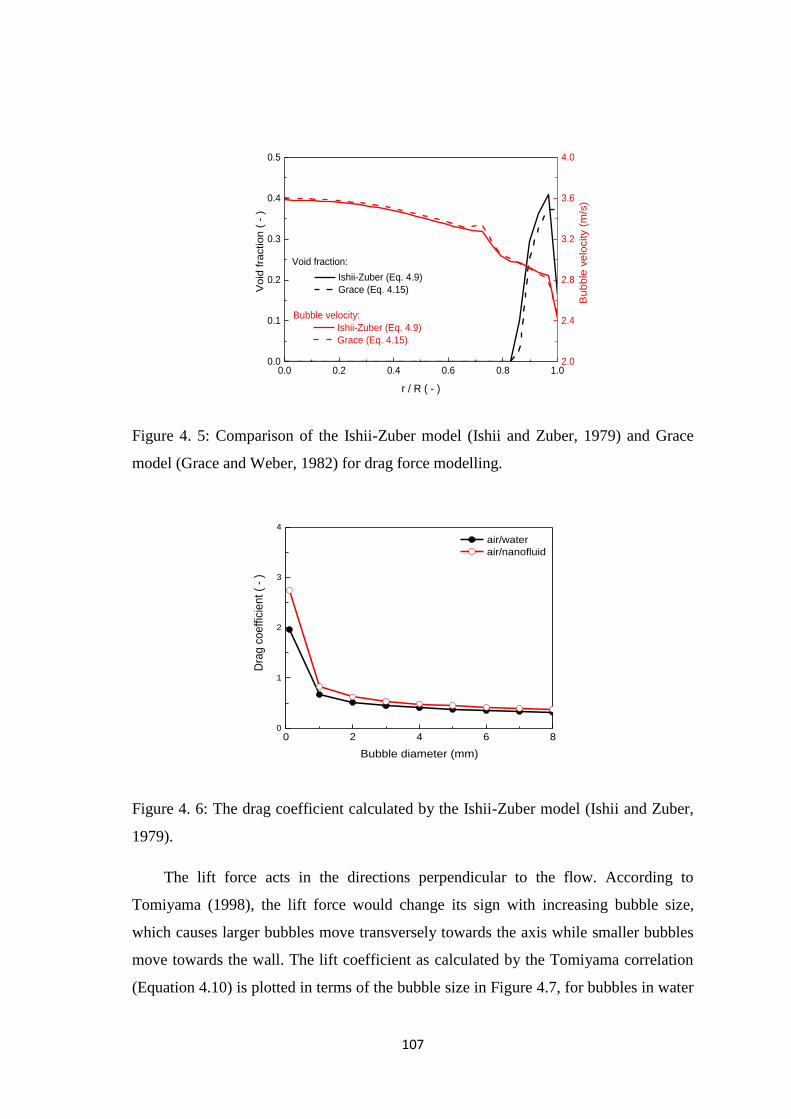
107
0.0 0.2 0.4 0.6 0.8 1.00.0
0.1
0.2
0.3
0.4
0.5
2.0
2.4
2.8
3.2
3.6
4.0
Vo
id f
ractio
n (
- )
r / R ( - )
Ishii-Zuber (Eq. 4.9)
Grace (Eq. 4.15)
Bubble velocity:
Bu
bb
le v
elo
city (
m/s
)
Ishii-Zuber (Eq. 4.9)
Grace (Eq. 4.15)
Void fraction:
Figure 4. 5: Comparison of the Ishii-Zuber model (Ishii and Zuber, 1979) and Grace
model (Grace and Weber, 1982) for drag force modelling.
0 2 4 6 80
1
2
3
4
Dra
g c
oe
ffic
ien
t (
- )
Bubble diameter (mm)
air/water
air/nanofluid
Figure 4. 6: The drag coefficient calculated by the Ishii-Zuber model (Ishii and Zuber,
1979).
The lift force acts in the directions perpendicular to the flow. According to
Tomiyama (1998), the lift force would change its sign with increasing bubble size,
which causes larger bubbles move transversely towards the axis while smaller bubbles
move towards the wall. The lift coefficient as calculated by the Tomiyama correlation
(Equation 4.10) is plotted in terms of the bubble size in Figure 4.7, for bubbles in water

108
and nanofluid, respectively. For the purpose of comparison, the Hibiki-Ishii correlation
(Hibiki and Ishii, 2007) (Equation 4.16), which also yields a negative lift coefficient for
larger bubbles, was plotted as well.
2 2
,low high
L L b s L bC C Re G C Re
(4.16)
where, and
are empirical piecewise functions of the bubble Reynolds number
Reb and the non-dimensional shear rate Gs
2
b ls
g l
d dUG
dxU U
(4.17)
Figure 4.7 illustrates that for the air-water case, a negative lift coefficient was
yielded from Equation 4.10 at db = 6 mm, which caused the lift force pointing towards
the axis. This agreed well with the experimental observations of the air-water bubbly
flow (Figure 4.2(a)) (Park and Chang, 2011). For the air-nanofluid case, however, the
Tomiyama correlation generated a positive lift coefficient (CL = 0.288) at db = 3 mm,
causing the lift force pointing towards the wall and a near-wall peaked void fraction
distribution was predicted (Figure 4.3(a)). For air-water bubbly flow, the Hibiki-Ishii
correlation achieved a very close prediction to that of the Tomiyama correlation.
0 2 4 6 8-0.5
0.0
0.5
1.0
1.5
2.0
Lift
co
eff
icie
nt
( -
)
Bubble diameter (mm)
air/water - Tomiyama 1998
air/nanofluid - Tomiyama 1998
air/water - Hibiki-Ishii 2007
Figure 4. 7: The lift coefficient changes as a function of bubble size.

109
0.0 0.2 0.4 0.6 0.8 1.00.0
0.1
0.2
0.3
0.4
Vo
id f
ractio
n (
- )
r / R ( - )
Exp. Park and Chang, 2011
CL = -0.10 C
L = -0.03
CL = -0.01 C
L = 0
CL = 0.01 C
L = 0.05
(a)
0.0 0.2 0.4 0.6 0.8 1.00
1
2
3
4
5
Exp. Park and Chang, 2011
CL = -0.10 C
L = -0.03
CL = -0.01 C
L = 0
CL = 0.01 C
L = 0.05
Bubb
le v
elo
city (
m/s
)
r / R ( - )
(b)
Figure 4. 8: The two-fluid model with different values CL values for the air-nanofluid
bubbly flow: (a) void fraction; (b) bubble velocity.
As the actual void fraction distribution was central-peaked in the air-nanofluid
bubbly flow with db = 3 mm (Figure 4.3(a)), it was expected that with the increasing
bubble size, the positive-to-negative transition in the lift coefficient appears at a smaller
bubble size in nanofluid than in water. Unfortunately, due to the insufficient
fundamental investigations on this issue, a quantitative correlation for estimating CL in
nanofluids is still absent. For the air-nanofluid bubbly flow of this study, a satisfactory
agreement was achieved between the numerical results and the experimental data when

110
the lift coefficient took the value CL = -0.03, as shown in Figure 4.8(a). A larger
negative lift coefficient led to a higher central peak of the void fraction distribution.
When a positive lift coefficient was applied, the peak of void fraction gradually moved
towards the wall. Therefore, the modelling of lift force has a significant effect on the
predicted distribution of void fraction. However, the air bubble velocity distribution
seemed to be insensitive to the lift coefficient (Figure 4.8(b)).
The calculation of lift force has long been a challenging task when modelling
bubbly flows. Hibiki and Ishii (2007) conducted a comprehensive survey of the lift
force correlations available in the literature. According to the survey, most lift force
correlations are empirical or, at least, semi-empirical. The existence of nanoparticles in
the liquid further intensifies the complexity and further fundamental studies are in
urgent demand in this area.
Currently, the transport and thermodynamic properties of nanofluids were mostly
measured and characterized under static conditions. However, according to the study by
Vermant and Solomon (2005), the application of flow could cause various novel
microstructure states in colloid suspension, which are strongly affected by the balance
among inter-particle forces, Brwonian motion and hydrodynamic interactions. The
resulting nonequilibrium microstructure is a principal determinant of the suspension
rheology and the force balance on bubbles. This was perhaps the major reason
responsible for the earlier-appearing positive-to-negative transition of the lift
coefficient. Unfortunately, the effects of nanoparticles on the inter-phase forces have
been rarely investigated and the mechanisms are still unknown.
4.1.3.3 Effects of Nanoparticles on the Interfacial Behaviours
As observed by Park and Chang (2011), one of the most distinct characteristic of the
air-nanofluid flow, when compared with the air-water flow, was the smaller bubble size.
For a spherical bubble submerged in quiescent liquid, its equilibrium size could be
estimated by the Young-Laplace equation
2
2b
Pd
(4.18)
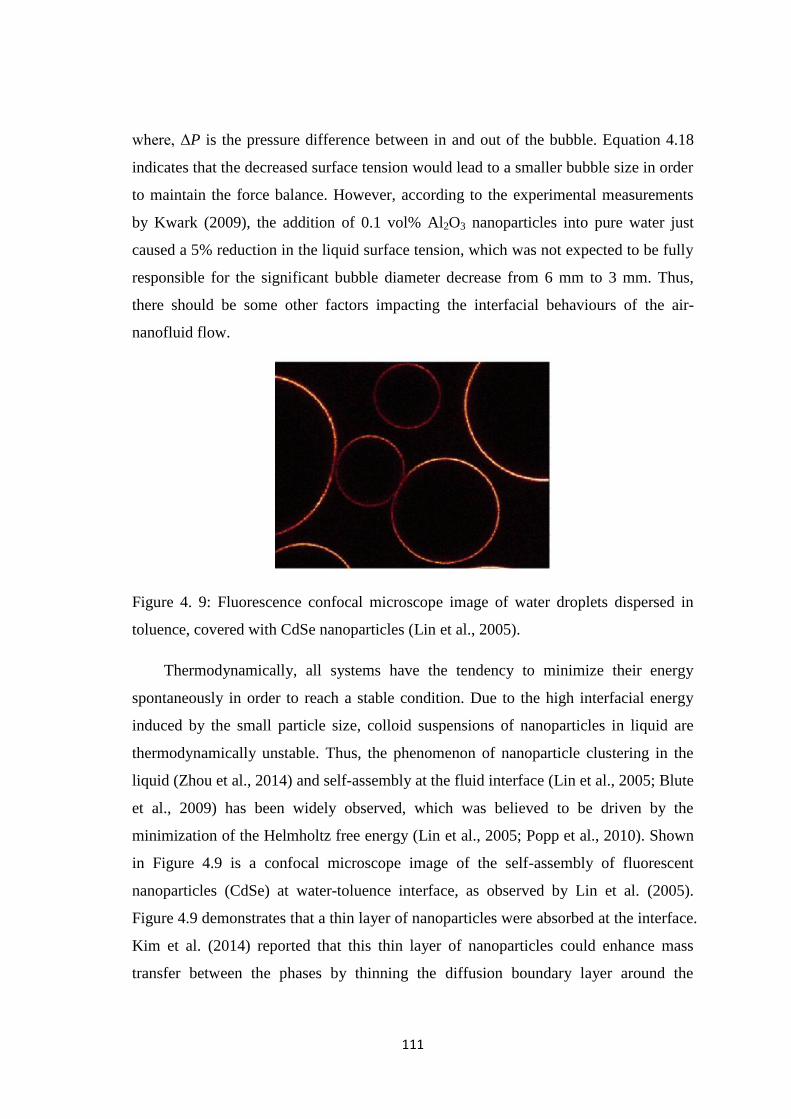
111
where, ΔP is the pressure difference between in and out of the bubble. Equation 4.18
indicates that the decreased surface tension would lead to a smaller bubble size in order
to maintain the force balance. However, according to the experimental measurements
by Kwark (2009), the addition of 0.1 vol% Al2O3 nanoparticles into pure water just
caused a 5% reduction in the liquid surface tension, which was not expected to be fully
responsible for the significant bubble diameter decrease from 6 mm to 3 mm. Thus,
there should be some other factors impacting the interfacial behaviours of the air-
nanofluid flow.
Figure 4. 9: Fluorescence confocal microscope image of water droplets dispersed in
toluence, covered with CdSe nanoparticles (Lin et al., 2005).
Thermodynamically, all systems have the tendency to minimize their energy
spontaneously in order to reach a stable condition. Due to the high interfacial energy
induced by the small particle size, colloid suspensions of nanoparticles in liquid are
thermodynamically unstable. Thus, the phenomenon of nanoparticle clustering in the
liquid (Zhou et al., 2014) and self-assembly at the fluid interface (Lin et al., 2005; Blute
et al., 2009) has been widely observed, which was believed to be driven by the
minimization of the Helmholtz free energy (Lin et al., 2005; Popp et al., 2010). Shown
in Figure 4.9 is a confocal microscope image of the self-assembly of fluorescent
nanoparticles (CdSe) at water-toluence interface, as observed by Lin et al. (2005).
Figure 4.9 demonstrates that a thin layer of nanoparticles were absorbed at the interface.
Kim et al. (2014) reported that this thin layer of nanoparticles could enhance mass
transfer between the phases by thinning the diffusion boundary layer around the

112
bubbles. Grzelczak et al. (2010) further pointed out that the macroscopic viscous flow
could enhance nanoparticle self-assembly at the interfaces, this is especially true for
particles from 100 nm to 1 μm in diameter. They suggested that the shear rate and shear
strain, nanoparticle volume fraction, particle interaction potentials and poly-dispersity
are the key factors that affect flow-induced nanoparticle self-assembly (Grzelczak et al.,
2010).
The absorbed nanoparticle assembly at the interface was found to be able to
stabilize the bubbles mechanistically and could effectively impede smaller bubbles
coalescing into larger bubbles. This was perhaps the reason responsible for the smaller
air bubble size in the Al2O3/water nanofluid than in pure water as observed by Park and
Chang (2011), as well as the bubbly flow with higher void fraction in CuO/water
nanofluid than in pure water as observed by Wang and Bao (2009). The stabilizing
function of nanoparticles on gas bubbles in liquid has been widely recognized and
utilized to fabricate liquid foams with fine textures (Worthen et al., 2013) and capsule
shells for high-efficiency drug delivery (Ariga et al., 2011). Unfortunately, the effects
of nanoparticle self-assembly on the interfacial behaviours in bubbly flows have not
been fully investigated. Substantial fundamental studies should be conducted on this
regard in the future.
4.1.4 Conclusions
Bubbly flows of air-water and air-nanolfuid were numerically investigated using the
two-fluid model. Comparison of the numerical results against the experimental data
available in the literature revealed that the classic two-fluid model agreed well with the
experimental data of air-water bubbly flows, but needed substantial improvement in
order to achieve an effective modelling of air-nanofluid bubbly flows. The effects of
nanoparticles on the interfacial behaviours and interphase transport mechanisms were
analysed based on the experimental observations in the literature. Conclusions arising
from this study are as follows:
(1) Although the addition of a small amount of nanoparticles into the base liquid does
not cause measurable changes in the liquid properties, the spontaneous
nanoparticle self-assembly at the interface could significantly change the

113
interfacial behaviours of the air bubbles. This was supposed to be the major
reason responsible for the distinctly changed two- phase flow characteristics (e.g.,
smaller bubble size) of air-nanofluid bubbly flows than those of air-water flows.
(2) As the governing equations are still applicable to nanofluids, the key job when
modelling air-nanofluid bubbly flows using the two-fluid model is to formulate
the interphase transport terms in order to take into account the specific features
induced by the existence of particles. This study demonstrates that the lift force
has different acting roles in nanofluid than in pure water, which causes the lift
force reverses its direction at a smaller bubble size.
114
4.2 MUltiple-SIze-Group (MUSIG) Modelling of Air-
nanofluid Bubbly Flows in a Vertical Tube
Abstract
The MUtiple-SIze-Group (MUSIG) model was used in this study to simulate
bubbly flows of air-water and air-nanofluid in a vertical tube. Flow parameters
including the void fraction, gas velocity, interfacial area concentration and Sauter mean
bubble diameter were predicted and compared against the experimental data available
in the literature. The model agreed well with the experimental data of air-water bubbly
flow, but exhibited notable discrepancies from the data of air-nanofluid bubbly flow.
With the aim to improve the MUSIG model for an effective modelling of air-nanofluid
bubbly flows, some latest experimental and theoretical research outcomes were
summarized and analysed. It was proposed that the key job when modelling bubbly
flows of nanofluids using the MUSIG model is to address the spontaneous assembly of
nanoparticles at bubble surfaces and its effects on the interfacial forces and bubble
coalescence process.
4.2.1 Introduction
Over the pass decades, great efforts have been devoted to the development of advanced
fluids offering better heat transfer performances for a variety of thermal management
systems. Among them, ―nanofluid‖ which was proposed by Choi (1995) is regarded
promising. Nanofluids are a new type of engineered fluids that consist of uniformly
dispersed nanometre-sized particles in common base liquids. Novel features of
nanofluids, such as enhanced thermophysical properties (Khanafer and Vafai, 2011),
single-phase convective (Kakaç and Pramuanjaroenkij, 2009) and boiling heat transfer
performances (Jacqueline et al., 2011), have been reported numerously. It has been
widely accepted that the addition of nanoparticles can significantly increase the forced
convective and boiling heat transfer of base liquids (Jo et al., 2009; Kim, 2009; Rana et
al., 2013). The existing studies mostly focused on the heat transfer characteristics of
nanofluids, while less attention has been paid to their basic hydraulic phenomena. In
fact, the heat transfer performance of nanofluids, particularly their two-phase flows, is

115
closely related to their flow structures (Atmane and Murray, 2005), since a large
proportion of the heat and mass are transferred through the liquid-bubble surfaces. An
in-depth understanding of the hydrodynamic behaviours of nanofluids is critical to the
further extension of their heat transfer applications.
Significant impact of the existence of nanoparticles on two-phase flow structures
has been revealed by numerous studies. Using the high-speed visualization and image
processing technique, Rana et al. (2014) measured the void fraction in the flow boiling
of water-ZnO nanofluids (0.001~0.01 vol%) and detected a significant void fraction
decrease (up to 86%) compared to pure water. Dominguez-Ontiveros et al. (2010)
measured the phase velocities in a boiling pool using the dynamic particle image
velocimetry (DPIV), and found that in Al2O3/water nanofluids (0.001 and 0.002 vol%)
the fluid velocities were generally depressed relative to the pure water case. Recently,
observations of modified two-phase flow regimes in isothermal flows were also
reported by Wang and Bao (2009) who investigated the two-phase flow patterns of
nitrogen bubbles in CuO/water nanofluids (0.5 wt%, approx. 0.08 vol%) in a vertical
capillary tube. They found that the bubbly-to-slug flow pattern transition in nitrogen-
nanofluid flows occurred at a lower liquid velocity compared to nitrogen-water flows,
which indicated that the nitrogen-nanofluid flow could stay bubbly with a higher void
fraction.
Bubbly flows are generally multi-dispersed systems where the bubbles have a
large spectrum of sizes and shapes in the liquid. How to model the dynamic evolution
of these dispersed bubbles has been the key concern of two-phase flow simulations.
When investigating such cases, the MUltiple-SIze-Group (MUSIG) model (Lo, 1996)
which provides an efficient method for solving the population balance theory within the
classic Eulerian-Eulerian framework has been widely employed. Alongside the
conservation equations and population balance equations, a number of closure
equations for interfacial transport of mass, momentum and energy as well as bubble
coalescence and break-up are incorporated in the MUSIG model. Appropriate
formulation of these closure equations is the key determination of the overall predictive
accuracy. Although a number of closure equations, including the Ishii-Zuber drag
model (Ishii and Zuber, 1979) and the Tomiyama lift model (Tomiyama, 1998), have

116
been fully validated for bubbly flows of pure liquids with or without heat transfer (Li et
al., 2006; Cheung et al., 2007), these closure equations are still the weakest link due to
their empirical nature (Ishii and Mishima, 1984). When modelling bubbly flows of
nanofluids, there naturally rises the question whether they are still applicable, in view
of the modified properties and two-phase flow structures.
In order to develop a predictive model for multi-dispersed bubbly flows of
nanofluids, the MUSIG model was employed in this study as a theoretical frame to
model the bubbly flows of air-nanofluid. Air-water bubbly flow was also simulated for
the purpose of comparison. Two-phase flow parameters including void fraction, gas
velocity, interfacial area concentration (IAC) and Sauter mean bubble diameter were
predicted and compared against the experimental data of Park and Chang (2011).
Through mechanistic analyses, the applicability of classic closure equations was
examined and the impact of nanoparticles on the flow parameters was discussed.
Finally, the numerical results were used to evaluate possible modifications to the
existing closure equations with the aim to improve the MUSIG model for nanofluid
bubbly flows.
4.2.2 The MUSIG Model
4.2.2.1 The Flow Equations
Our previous studies (Li et al., 2015) have proven that the Eulerian-Eulerian framework
is still applicable to air-nanofluid bubbly flows, given that nanoparticles and base fluid
are mixed at a near-molecular level. For an isothermal bubbly flow without interphase
mass and heat transfer, only mass and momentum conservations are considered. In the
MUSIG model, the air bubbles are firstly assumed to be spherical and then divided into
N size groups according to their diameter. Continuity equations of each size group are
solved to capture the size distribution. Then the model is further simplified by
assuming that all the bubbles are moving at the same velocity in a given control volume,
so that only one set of momentum equations are solved for all bubble groups. Therefore,
the MUSIG model of this study takes the following form:
The continuity equation of liquid phase

117
0l l l l lUt
(4.19)
The continuity equation of gas phase (for the ith
group bubbles, ith
=1~N)
4
1g g i g g g i j
j i
f U f Γt
(4.20)
The momentum equation of liquid phase
T
l l l l l l l l l l
l l l lg
U U U U Ut
g P F
(4.21)
The momentum equation of gas phase
T
g g g g g g g g g g
g g lg gl
U U U U Ut
g P F
(4.22)
where the subscripts l and g are phase denotations (l for the liquid phase and g for the
gas phase); α, ρ, U , fi, and lgF ( = - glF ) represent the local void fraction, density,
velocity, MUSIG volume fraction, and interfacial forces, respectively. The MUSIG
volume fraction fi is defined by the ratio of the total volume of the ith
group bubbles per
unit volume to the local volume fraction.
g i i if n v (4.23)
where ni is the number density of the ith
group bubbles and vi is their mean volume.The
interfacial force lgF generally includes the forces due to viscous dragDF , the lateral lift
LF , the wall lubricationWF , and the turbulent dispersion
TDF , which are defined by the
following equations:
lg gl D L W TDF F F F F F (4.24)
3
4
DD g l g l g l
b
CF U U U U
d (4.25)
L L g l g l lF C U U U
(4.26)
1 2max 0,
g l g l bW W W
b W
U U dF C C n
d y
(4.27)

118
TD TD l l lF C k
(4.28)
where db is the Sauter mean diameter of bubbles defined by:
1
1b N
i
i i
df
d
(4.29)
The drag coefficient CD in Equation 4.25 is usually calculated according to Ishii
and Zuber (1979). The lift coefficient CL in Equation 4.25 is estimated using the
Tomiyama model (Tomiyama, 1998). The wall lubrication coefficients and the
turbulent dispersion coefficient take value of CW1 = -0.01, CW2 = 0.05 and CTD = 0.1,
respectively.
0.75
0.5
240 0.2
24(1 0.1 ) 0.2 1000
21000
3
b
b
D b b
b
b
ReRe
C Re ReRe
Eo Re
(4.30)
g lg b
b
l
dRe
U U
(4.31)
*3 *2
* *
* * *
*
min 0.288, tanh(0.121 , ( )) 4
( ) 0.00105 0.0159 0.0204 0.474 4 10
0.27 10
b
L
Re f Eo Eo
C f Eo Eo Eo Eo Eo
Eo
(4.32)
2
*( )
l g Hg d
Eo
(4.33)
where Reb and Eo* represent bubble Reynolds number and modified Eötvös number,
respectively. In Equation 4.33, dH is the maximum bubble horizontal dimension which
is related to the bubble aspect ratio, E (Wellek et al., 1966).
1 3( )1
H bd d
E (4.34)
The empirical correlation of Wellek et al. (1966) is used to evaluate E :
0.757
1
1 0.163E
Eo
(4.35)
4.2.2.2 Population Balance Method
119
The bubble size distribution is modelled using the population balance equation:
4
1
il i j
j i
nU n S
t
(4.36)
where ∑
is a source term describing the bubble number density variations due
to coalescence and break-up. The mass variation of the ith
group bubbles in Equation
4.20 can be calculated by:
4 4
1 1
g i
j j gj j ii i
fΓ S
n
(4.37)
4
1
j
j i
C B C BB B D DS
(4.38)
where BB and DB are, respectively, the birth and death rates of the number density of
the ith
group bubbles due to break-up, BC and DC are the birth and death rates due to
coalescence. Experimental observation by Li et al. (2010) demonstrated that in the case
of upward bubbly flows in small-diameter vertical tubes, coalescence is predominant
while break-up is almost invisible. Therefore, only the coalescence mechanisms are
included in this study while bubble break-up is neglected.
1 1
1
2
i i
C i j ij
k j
B n n
(4.39)
C
1
N
i j ij
j
D n n
(4.40)
χij in above equations is the coalescence rate of two bubble groups. According to
the film drainage theory proposed by Shinnar and Church (1960), the coalescence of
two bubbles occurs in three steps: (1) two bubbles collide, trapping a liquid film
between them; (2) bubbles keep in contact while the liquid film drains; (3) when the
contact time is sufficient for the liquid film to drain out down to a critical thickness, the
film ruptures, resulting in coalescence. It is worth noting that not all collisions lead to
coalescence. The concept of collision efficiency λij is thus introduced to account for the
probability of bubble coalescence:
ij ij ij (4.41)
120
where ζij is the collision frequency. In a turbulent flow, the collisions between bubbles
may be caused by a number of mechanisms such as turbulent fluctuation, laminar shear,
wake entrainment, and buoyancy. In this study, the former three mechanisms are taken
into account. The collision frequency ζij is therefore written as:
T LS WE
ij ij ij ij (4.42)
where ,
and represent the collision frequency due to turbulence, laminar
shear and wake entrainment, respectively. is defined by (cited in (Li et al., 2010)):
T 2 2 2 1/2( ) ( )4
ij i j Ti Tjd d u u
(4.43)
1/3 1/3 1/3 1/32 , 2Ti i Tj ju d u d (4.44)
The frequency of shear-induced collisions is given by (cited in (Li et al., 2010)):
LS 332 d( )
3 d
l
ij i j
Ud d
R (4.45)
When bubbles enter the wake region of a leading bubble, they will accelerate and
may collide with the preceding one, resulting in bubble coalescence. This mechanism is
accounted using the model proposed by Wang et al. (cited in (Li et al., 2010)):
WE 2
ij i siK d u (4.46)
where K is a constant ( K=15.4), usi is the slip velocity defined by:
0.71si iu gd (4.47)
The parameter Θ is introduced in consideration that only bubbles larger than dcr/2
have a wake region effect for bubble coalescence.
6
6 6
( / 2)/ 2
( / 2) ( / 2)
0 / 2
i cri cr
i cr cr
i cr
d dd d
= d d d
d d
(4.48)
4( )
cr
l g
dg
(4.49)
According to Coulaloglou (cited in (Li et al., 2010)), the collision efficiency λij is
determined by the actual contact time ηij and the drainage time tij, which is the time
required for the liquid film to thin down to a critical thickness.
121
exp( )ij
ij
ij
t=
(4.50)
To estimate the bubble contact time ηij in a turbulent system, the correlation developed
by Levich et al. (cited in (Li et al., 2010)) is widely used:
2/3
1/3
ij
ij
r
(4.51)
11 1 1( ( ))2
ij
i j
rr r
(4.52)
The drainage time tij is calculated according to Prince and Blanch (1990):
3
1/2( ) ln16
ij l 0ij
f
r ht
h
(4.53)
4.2.3 Numerical Procedure
Park and Chang (2011) conducted isothermal bubbly flow experiments under the
atmospheric pressure and room temperature (25 ℃), using pure water and dilute
Al2O3/water nanofluid (0.1 vol%), respectively. The test section was a vertically
oriented acrylic pipe with an inner diameter of 15 mm and a length of 2.5 m. Liquid
and air bubbles were mixed at the bottom of the test section using a bubble formation
bed and driven by a pump to flow upward. A conductivity double-sensor void meter
was mounted at a height of 1.75 m downstream of the bubble formation bed. Local
two-phase flow parameters including the void fraction, the bubble diameter and the
bubble velocity were measured. These parameters were utilized in this study for model
validation.
Due to the axial-symmetry of the flow field, a sector-shaped column
computational domain which was a quarter of the pipe was built, as illustrated in Figure
4.10. The domain was then discretised using structured meshes. Mesh sensitivity test
provided that mesh independence was achieved at 63360 cells since a further increase
of mesh density to 144000 cells just caused a small change (less than 1%) in the
predicted air velocity. The inlet boundary condition was carefully set up according to
the experimental conditions: the superficial velocities of liquid and air were set to be
2.8294 m/s and 0.1886 m/s, respectively; the initial volume fraction of air at the inlet
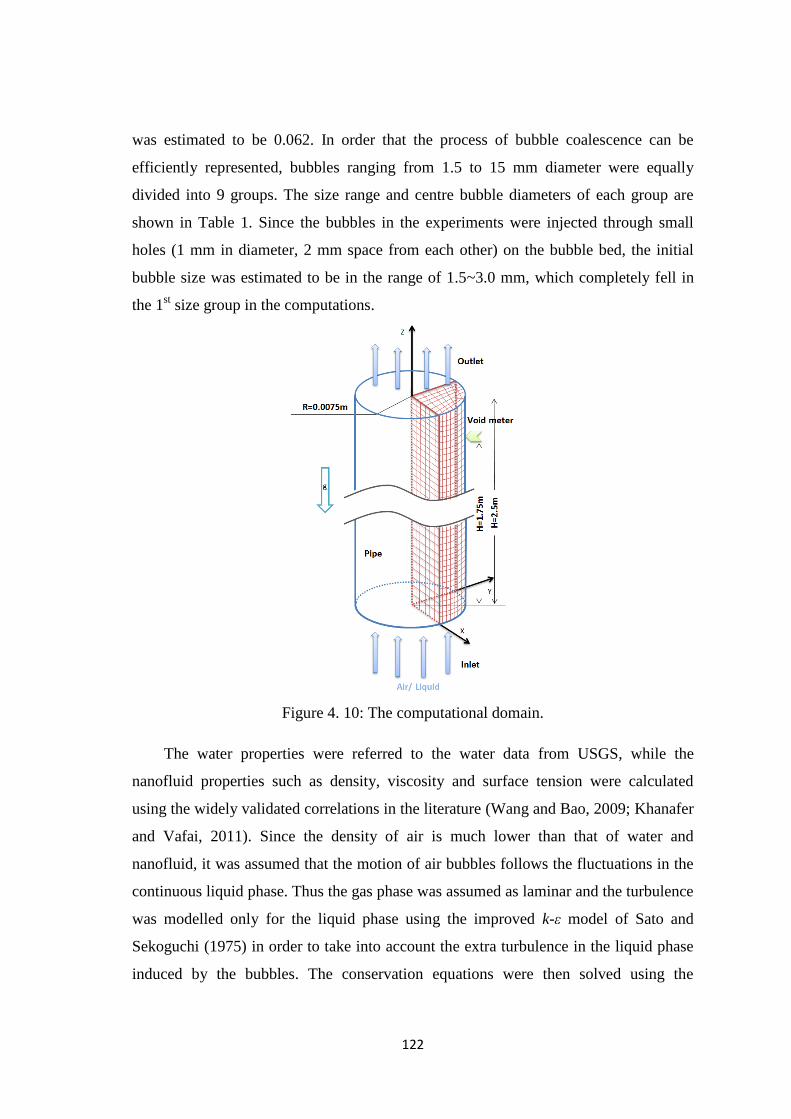
122
was estimated to be 0.062. In order that the process of bubble coalescence can be
efficiently represented, bubbles ranging from 1.5 to 15 mm diameter were equally
divided into 9 groups. The size range and centre bubble diameters of each group are
shown in Table 1. Since the bubbles in the experiments were injected through small
holes (1 mm in diameter, 2 mm space from each other) on the bubble bed, the initial
bubble size was estimated to be in the range of 1.5~3.0 mm, which completely fell in
the 1st size group in the computations.
Figure 4. 10: The computational domain.
The water properties were referred to the water data from USGS, while the
nanofluid properties such as density, viscosity and surface tension were calculated
using the widely validated correlations in the literature (Wang and Bao, 2009; Khanafer
and Vafai, 2011). Since the density of air is much lower than that of water and
nanofluid, it was assumed that the motion of air bubbles follows the fluctuations in the
continuous liquid phase. Thus the gas phase was assumed as laminar and the turbulence
was modelled only for the liquid phase using the improved k-ε model of Sato and
Sekoguchi (1975) in order to take into account the extra turbulence in the liquid phase
induced by the bubbles. The conservation equations were then solved using the
123
commercial CFD code CFX-14.5. Convergence was achieved within 4000 iterations
when the mass residual of the continuous phase dropped down to 1×10⁻⁴
.
4.2.4 Results and Discussion
4.2.4.1 Comparison of simulation results against experimental data
The measured and predicted radial profiles, at H = 1.75 m, of void fraction, gas velocity,
IAC and Sauter mean bubble diameter distribution in the air-water bubbly flow are
depicted in Figure 4.11. Different mechanisms of bubble collision are represented by
―T‖ ―LS‖ and ―WE‖, for turbulent fluctuation, laminar shear and weak entrainment,
respectively. As shown in Figure 4.11, when only the turbulent fluctuation induced
collision was considered, the predicted void fraction and IAC profiles exhibited a wall-
peaked shape which was totally different from the centrally distributed experimental
data. Meanwhile, the Sauter mean bubble diameter was considerably under-predicted.
When the laminar shear induced collision was added, although the model provided
closer predictions, but the void fraction and Sauter mean bubble diameter were still
underestimated. When all of the three mechanisms were taken into account, all the
model predictions were in satisfactory agreement with the experimental measurements,
which clearly demonstrated the importance of complete inclusion of collision
mechanisms in the MUSIG model.
The predicted local flow parameters in the air-nanofluid bubbly flow were also
compared against the experimental data, as shown in Figure 4.12. The experimental
observation proved the addition of nanoparticles into the liquid had the tendency to
flatten the radial distributions of void fraction, gas velocity and Sauter mean bubble
diameter, but to increase the IAC. Unfortunately, the MUSIG model failed to capture
these features. The void fraction, gas velocity and Sauter mean bubble diameter were
all grossly over-predicted, while the IAC was considerably underestimated. The classic
MUSIG model which has been successfully employed in air-water bubbly flows was
proven inapplicable to nanofluids.
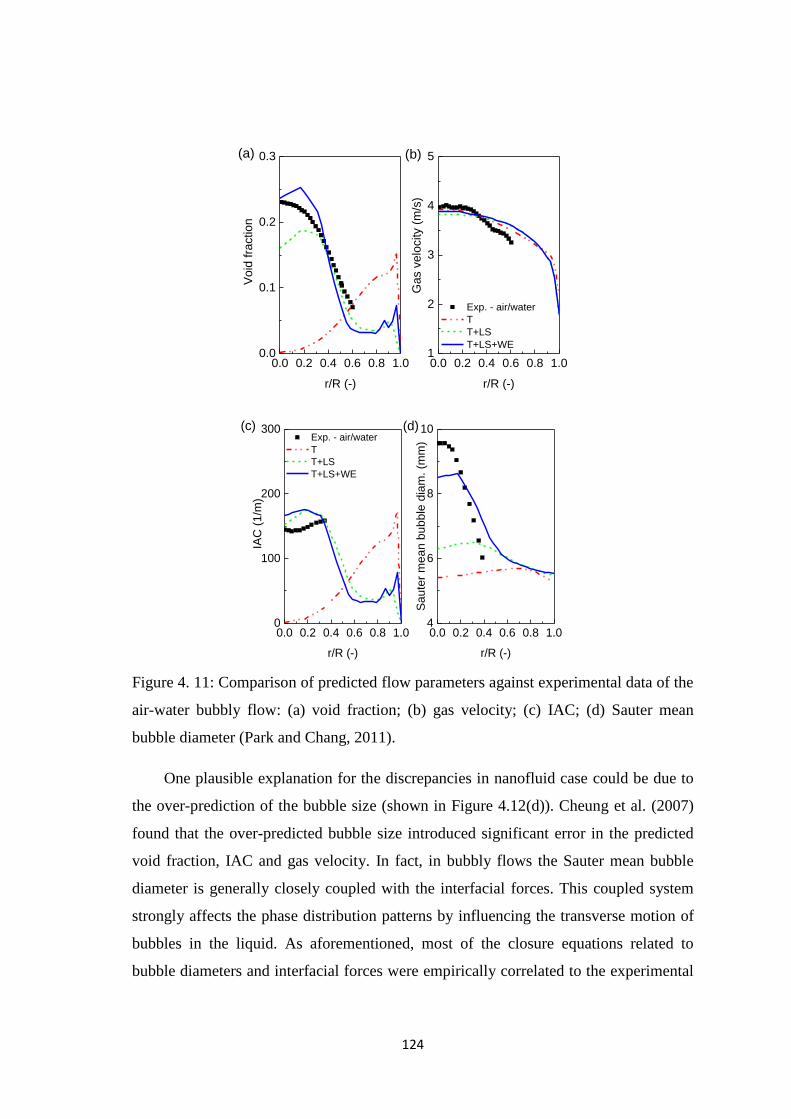
124
0.0 0.2 0.4 0.6 0.8 1.00.0
0.1
0.2
0.3
0.0 0.2 0.4 0.6 0.8 1.01
2
3
4
5
Void
fra
ction
r/R (-)
(b)
Exp. - air/water
T
T+LS
T+LS+WE
Gas v
elo
city (
m/s
)
r/R (-)
(a)
0.0 0.2 0.4 0.6 0.8 1.00
100
200
300
0.0 0.2 0.4 0.6 0.8 1.04
6
8
10 Exp. - air/water
T
T+LS
T+LS+WE
IAC
(1
/m)
r/R (-)
(d)(c)
S
au
ter
me
an
bu
bb
le d
iam
. (m
m)
r/R (-)
Figure 4. 11: Comparison of predicted flow parameters against experimental data of the
air-water bubbly flow: (a) void fraction; (b) gas velocity; (c) IAC; (d) Sauter mean
bubble diameter (Park and Chang, 2011).
One plausible explanation for the discrepancies in nanofluid case could be due to
the over-prediction of the bubble size (shown in Figure 4.12(d)). Cheung et al. (2007)
found that the over-predicted bubble size introduced significant error in the predicted
void fraction, IAC and gas velocity. In fact, in bubbly flows the Sauter mean bubble
diameter is generally closely coupled with the interfacial forces. This coupled system
strongly affects the phase distribution patterns by influencing the transverse motion of
bubbles in the liquid. As aforementioned, most of the closure equations related to
bubble diameters and interfacial forces were empirically correlated to the experimental
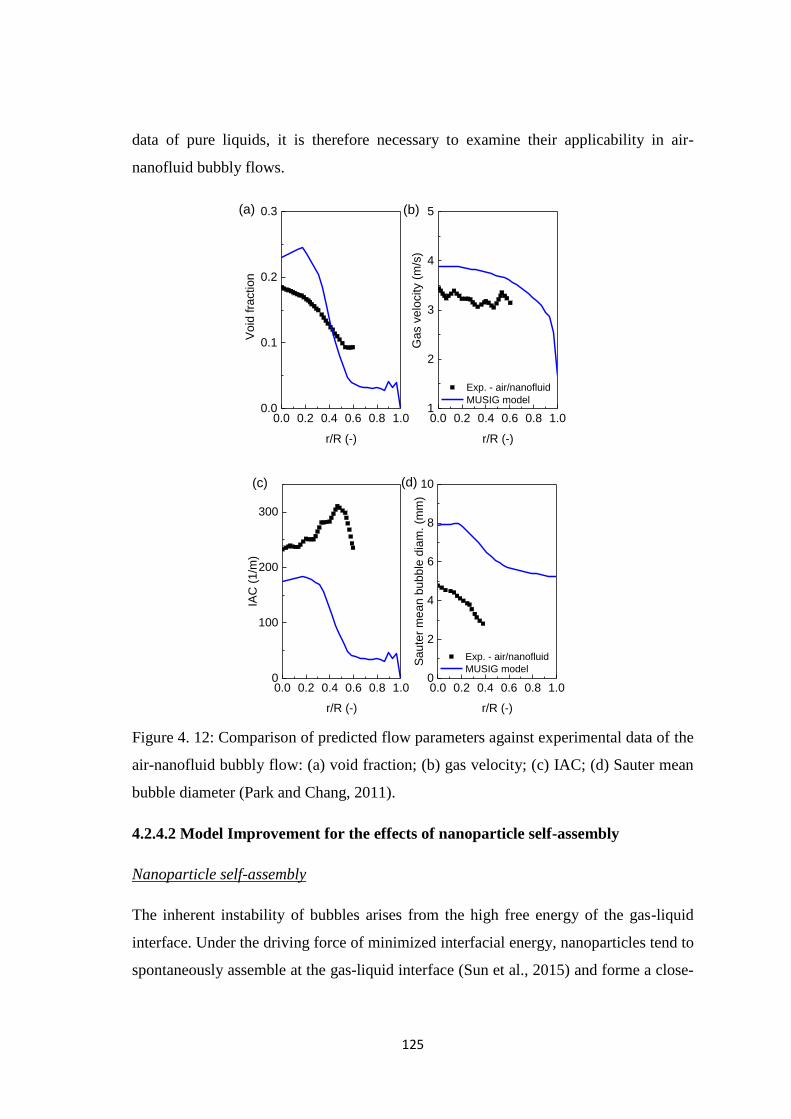
125
data of pure liquids, it is therefore necessary to examine their applicability in air-
nanofluid bubbly flows.
0.0 0.2 0.4 0.6 0.8 1.00.0
0.1
0.2
0.3
0.0 0.2 0.4 0.6 0.8 1.01
2
3
4
5
Void
fra
ction
r/R (-)
(b)
Exp. - air/nanofluid
MUSIG model
Gas v
elo
city (
m/s
)
r/R (-)
(a)
0.0 0.2 0.4 0.6 0.8 1.00
100
200
300
0.0 0.2 0.4 0.6 0.8 1.00
2
4
6
8
10(d)
IAC
(1
/m)
r/R (-)
(c)
Exp. - air/nanofluid
MUSIG model
Sa
ute
r m
ea
n b
ub
ble
dia
m.
(mm
)
r/R (-)
Figure 4. 12: Comparison of predicted flow parameters against experimental data of the
air-nanofluid bubbly flow: (a) void fraction; (b) gas velocity; (c) IAC; (d) Sauter mean
bubble diameter (Park and Chang, 2011).
4.2.4.2 Model Improvement for the effects of nanoparticle self-assembly
Nanoparticle self-assembly
The inherent instability of bubbles arises from the high free energy of the gas-liquid
interface. Under the driving force of minimized interfacial energy, nanoparticles tend to
spontaneously assemble at the gas-liquid interface (Sun et al., 2015) and forme a close-

126
packed particle layer. Shown in Figure 4.13 is a microscope image of the air bubbles
surrounded by a thin layer of nanoparticles in the nanofluid (MAGSILICA@
H8
nanoparticles at Cp=10 mg/mL in enthanol/water mixtures), as observed by Rodrigues
et al. (2011). This phenomenon has been widely found in numerous experimental
studies. Blute et al. (2009) even utilize this spontaneous nanoparticle assembly to
prepare Langmuir-Blodgett films (one or more monolayers of nanoparticles) at the air-
water interface. It is therefore reasonable to extrapolate this close-packed nanoparticle
layer at the gas-liquid interface generates a sort of ‗colloidal armour‘ which might
change the characteristics of bubble surface.
Figure 4. 13: Transmission Electron Microscopy (TEM) image of air bubbles
surrounded by MAGSILICA@ H8 nanoparticles (Cp=20 mg/mL) in ethanol/water
mixture (Rodrigues et al., 2011).
The drag force
For bubbles submerged in continuous liquid, Clift et al. (cited in (Dijkhuizen et al.,
2010a)) found that the assembly of contaminants would change the slip condition at the
interface from free-slip to no-slip, resulting in the increase of drag force (shown in
Figure 4.14).
This is consistent with the hypothesis proposed by McClure et al. (2014) who
experimentally proved when impurities were added to an air-water bubbly flow, the
overall holdup would be changed. Similarly, they attributed this unique phenomenon to
the increased drag force induced by the assembly of impurities at the air-water interface.
In order to capture the hydrodynamic behaviours of bubbly flows with surfactants,

127
McClure et al.‘s (2015) improved the classic Grace drag model by introducing an
empirical constant (ks = 1.6~2.2) to account for the effects of accumulated surfactants
on drag enhancement:
*( )
s D,graceD,graceC k C f (4.54)
where CD,grace is the drag coefficient calculated by the Grace drag model:
2
( )4
3D,grace
l gb
T g
Cgd
U
(4.55)
Figure 4. 14: The effect of contaminants: (a) ultra-pure liquid with free-slip boundary
condition; (b) slightly contaminated liquid with a limited circulation inside the bubble;
(c) fully contaminated bubble with no-slip boundary condition (Dijkhuizen et al.,
2010a).
As nanoparticles have comparable sizes with the micelles which are the aggregate
of surfactant molecules ranging from 2 nm to 20 nm (Hasko, 1980), and also assemble
at the interface in an analogous way, it is reasonable to hypothesize that the assembly
of nanoparticles may have similar impact on drag enhancement. Following the
modified Grace model by McClure et al. (2015), this study introduced the empirical
constant (ks = 1.6~2.2) to the Ishii-Zuber model (Ishii and Zuber, 1979) (Equation 4.30)
to account for the influence of nanoparticles.
s
*
D,ishiiD,ishiiC k C (4.56)
The drag coefficients calculated before and after the modification are shown in
Figure 4.15. The predicted void fraction and gas velocity with different ks values are
compared in Figure 4.16. It clearly shows flattened distributions for both void fraction
and gas velocity with the increasing drag force, which is consistent with experimental
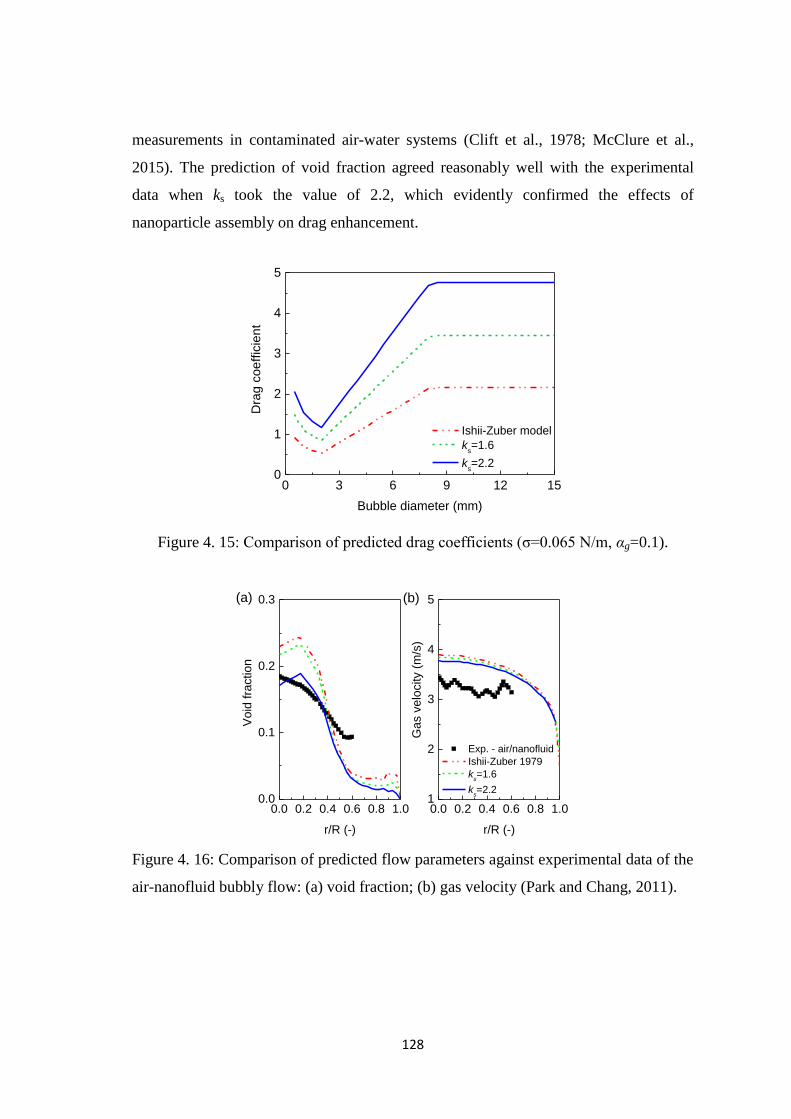
128
measurements in contaminated air-water systems (Clift et al., 1978; McClure et al.,
2015). The prediction of void fraction agreed reasonably well with the experimental
data when ks took the value of 2.2, which evidently confirmed the effects of
nanoparticle assembly on drag enhancement.
0 3 6 9 12 150
1
2
3
4
5
D
rag
coe
ffic
ien
t
Bubble diameter (mm)
Ishii-Zuber model
ks=1.6
ks=2.2
Figure 4. 15: Comparison of predicted drag coefficients (ζ=0.065 N/m, αg=0.1).
0.0 0.2 0.4 0.6 0.8 1.00.0
0.1
0.2
0.3
0.0 0.2 0.4 0.6 0.8 1.01
2
3
4
5
Exp. - air/nanofluid
Ishii-Zuber 1979
ks=1.6
ks=2.2
Void
fra
ction
r/R (-)
(b)
Gas v
elo
city (
m/s
)
r/R (-)
(a)
Figure 4. 16: Comparison of predicted flow parameters against experimental data of the
air-nanofluid bubbly flow: (a) void fraction; (b) gas velocity (Park and Chang, 2011).
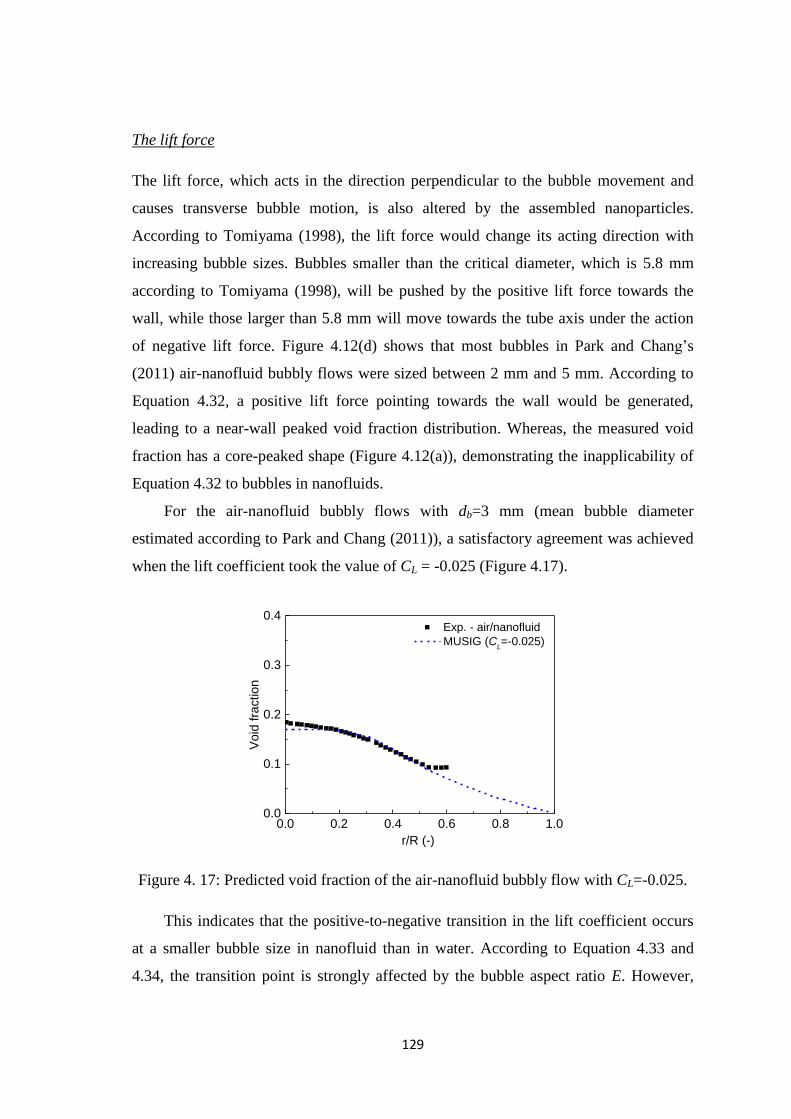
129
The lift force
The lift force, which acts in the direction perpendicular to the bubble movement and
causes transverse bubble motion, is also altered by the assembled nanoparticles.
According to Tomiyama (1998), the lift force would change its acting direction with
increasing bubble sizes. Bubbles smaller than the critical diameter, which is 5.8 mm
according to Tomiyama (1998), will be pushed by the positive lift force towards the
wall, while those larger than 5.8 mm will move towards the tube axis under the action
of negative lift force. Figure 4.12(d) shows that most bubbles in Park and Chang‘s
(2011) air-nanofluid bubbly flows were sized between 2 mm and 5 mm. According to
Equation 4.32, a positive lift force pointing towards the wall would be generated,
leading to a near-wall peaked void fraction distribution. Whereas, the measured void
fraction has a core-peaked shape (Figure 4.12(a)), demonstrating the inapplicability of
Equation 4.32 to bubbles in nanofluids.
For the air-nanofluid bubbly flows with db=3 mm (mean bubble diameter
estimated according to Park and Chang (2011)), a satisfactory agreement was achieved
when the lift coefficient took the value of CL = -0.025 (Figure 4.17).
0.0 0.2 0.4 0.6 0.8 1.00.0
0.1
0.2
0.3
0.4
Exp. - air/nanofluid
MUSIG (CL=-0.025)
Void
fra
ction
r/R (-)
Figure 4. 17: Predicted void fraction of the air-nanofluid bubbly flow with CL=-0.025.
This indicates that the positive-to-negative transition in the lift coefficient occurs
at a smaller bubble size in nanofluid than in water. According to Equation 4.33 and
4.34, the transition point is strongly affected by the bubble aspect ratio E. However,

130
due to the extreme complexity, E is generally estimated empirically, such as the Wellek
coerrelation (Wellek et al., 1966) (Equation 4.35) and the Okawa correlation (Okawa et
al., 2003) (Equation 4.57):
1.3
1
1 1.97E
Eo
(4.57)
For bubbles in nanofluids, the situation is even more complex because E could be
subject to many unknown mechanisms. Therefore, in this study, E was re-defined
according to Equation 4.58 in order to make the positive-to-negative transition of the
Tomiyama lift coefficient occur at db=2.9 mm, as shown in Figure 4.18.
1.3
1
1 6.099E
Eo
(4.58)
0 3 6 9 12 15-0.3
-0.2
-0.1
0.0
0.1
0.2
0.3
Lift co
eff
icie
nt
Bubble diameter (mm)
Eq. 4.35, Wellek 1966
Eq. 4.57, Okawa 2003
Eq. 4.58, Present study
reversal point
Figure 4. 18: Comparison of predicted lift coefficients with different correlations of
bubble aspect ratio.
Reduced bubble coalescence rate induced by prolonged bubble drainage time
It is interesting to note that the addition of nanoparticles leads to a decreased mean
bubble size. As shown in Figure 4.12(d), most of the measured bubble diameters in
nanofluids were between 2mm to 5mm, which were much smaller than those ranging
from 3 mm to 10 mm in water (shown in Figure 4.11(d)). Analogous phenomenon was
also reported by McClure et al. (2014) who observed a reduction in the mean bubble
size in solutions with surfactants. They suggested those surfactants at air-water
interface are effective in inhibiting bubble coalescence and thus responsible for the
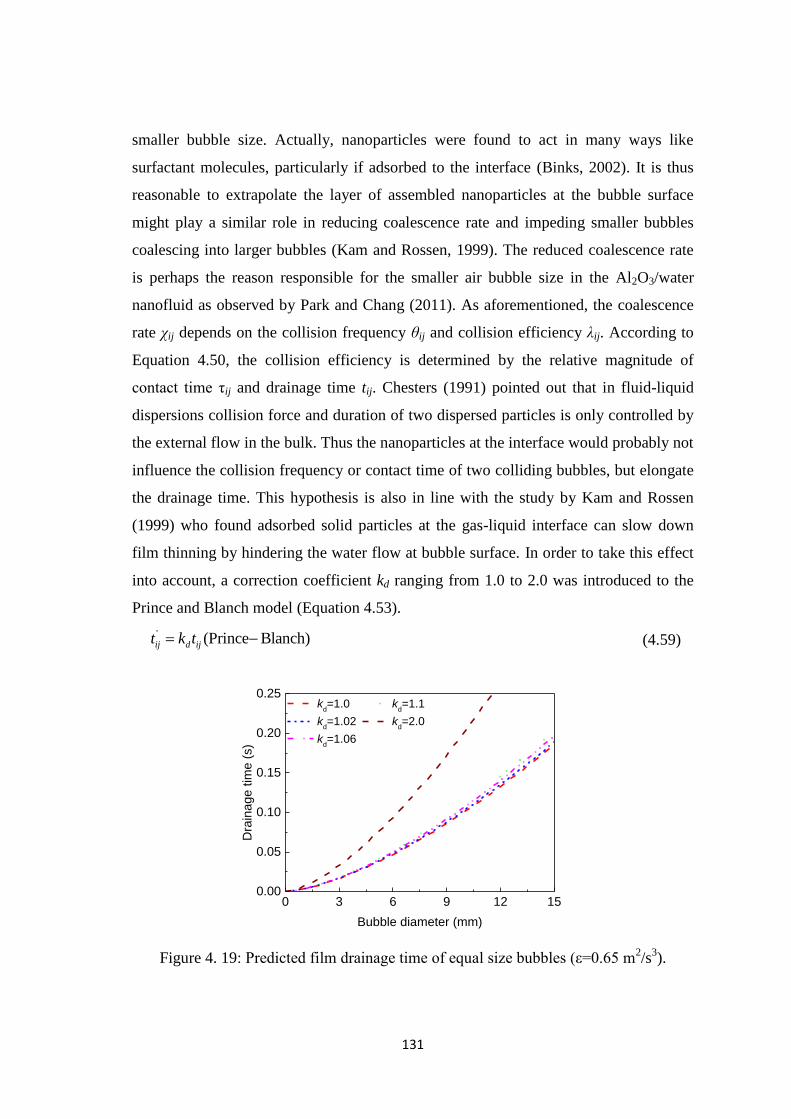
131
smaller bubble size. Actually, nanoparticles were found to act in many ways like
surfactant molecules, particularly if adsorbed to the interface (Binks, 2002). It is thus
reasonable to extrapolate the layer of assembled nanoparticles at the bubble surface
might play a similar role in reducing coalescence rate and impeding smaller bubbles
coalescing into larger bubbles (Kam and Rossen, 1999). The reduced coalescence rate
is perhaps the reason responsible for the smaller air bubble size in the Al2O3/water
nanofluid as observed by Park and Chang (2011). As aforementioned, the coalescence
rate χij depends on the collision frequency ζij and collision efficiency λij. According to
Equation 4.50, the collision efficiency is determined by the relative magnitude of
contact time ηij and drainage time tij. Chesters (1991) pointed out that in fluid-liquid
dispersions collision force and duration of two dispersed particles is only controlled by
the external flow in the bulk. Thus the nanoparticles at the interface would probably not
influence the collision frequency or contact time of two colliding bubbles, but elongate
the drainage time. This hypothesis is also in line with the study by Kam and Rossen
(1999) who found adsorbed solid particles at the gas-liquid interface can slow down
film thinning by hindering the water flow at bubble surface. In order to take this effect
into account, a correction coefficient kd ranging from 1.0 to 2.0 was introduced to the
Prince and Blanch model (Equation 4.53).
' (Prince Blanch)ij d ijt k t (4.59)
0 3 6 9 12 150.00
0.05
0.10
0.15
0.20
0.25
Dra
ina
ge
tim
e (
s)
Bubble diameter (mm)
kd=1.0 k
d=1.1
kd=1.02 k
d=2.0
kd=1.06
Figure 4. 19: Predicted film drainage time of equal size bubbles (ε=0.65 m2/s
3).

132
The predicted bubble drainage time and collision efficiency using Equation 4.59
are illustrated in Figure 4.19 and Figure 4.20, respectively.
0 3 6 9 12 150.0
0.4
0.8
1.2 k
d=1.0 k
d=1.1
kd=1.02 k
d=2.0
kd=1.06
Co
ale
sce
nce
effic
iency
Bubble diameter (mm)
Figure 4. 20: Predicted collision efficiency of equal size bubbles (ε=0.65 m2/s
3).
With the increasing of kd, the bubble drainage time increases gradually, while the
collision efficiency decreases dramatically. Incorporating Equation 4.59 into the
present MUSIG model with kd = 1.02, the model achieved close predictions of void
fraction with the experiment data, as shown in Figure 4.21. Moreover, from the
phenomenological point of view, the phase distribution patterns along the radial
direction of the pipe gradually changed from ―core peak‖ (kd = 1.0 and 1.02), to
―transition‖ (kd = 1.06), then to ―intermediate peak‖ (kd = 1.1), and finally to ―wall peak‖
(kd = 2.0) (Serizawa and Kataoka, 1988). Figure 4.22 depicts the predicted bubble size
distribution at H = 1.75 m. Most bubbles fell in group 4 (4.5~6 mm), when kd ranged
from 1.0 to 1.06. However, the largest proportion of bubbles moved to group 2 (1.5~3
mm) for kd = 2.0 corresponding to the wall peak in Figure 4.21.
The above numerical results demonstrate that the appropriately formulated bubble
drainage time is crucial to the prediction of Sauter mean bubble diameter and void
fraction. However kd is case sensitive and subject to a number of factors including the
nanoparticle material, size and concentration, as well as the flow conditions. In order to
achieve a mechanistic modelling of bubble coalescence in nanofluids, further in-depth
investigation is in urgent demand.
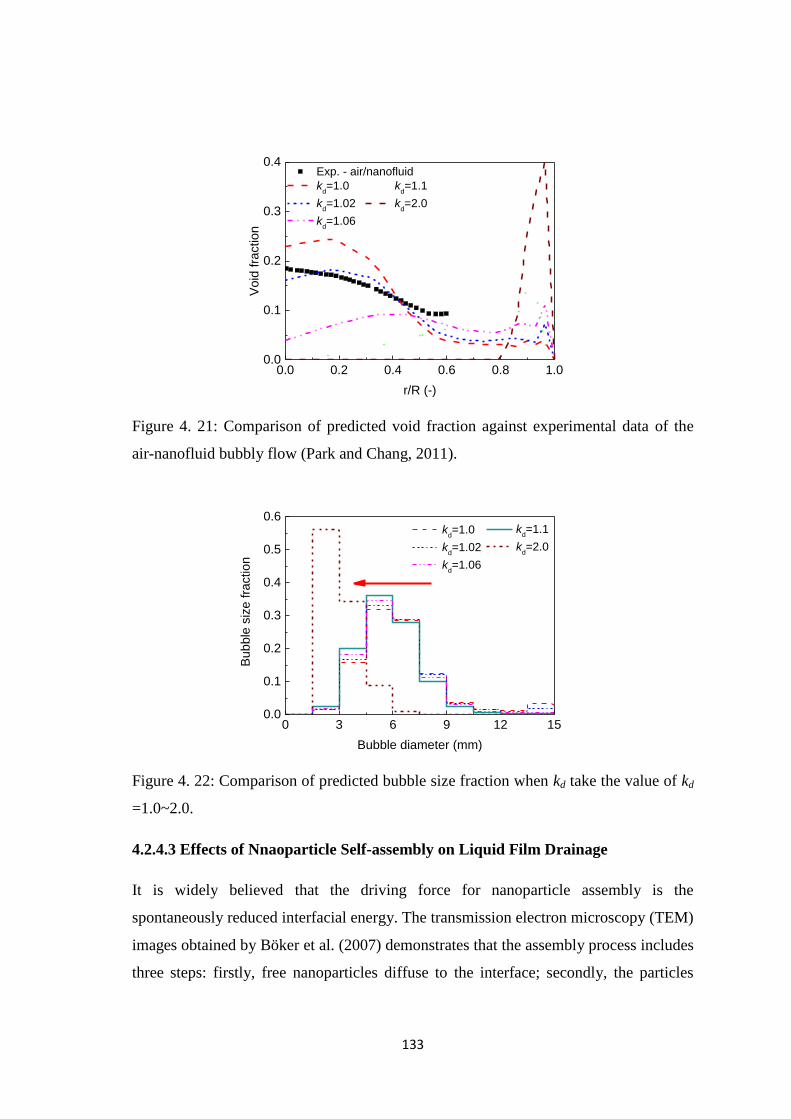
133
0.0 0.2 0.4 0.6 0.8 1.00.0
0.1
0.2
0.3
0.4
Exp. - air/nanofluid
kd=1.0 k
d=1.1
kd=1.02 k
d=2.0
kd=1.06
Void
fra
ction
r/R (-)
Figure 4. 21: Comparison of predicted void fraction against experimental data of the
air-nanofluid bubbly flow (Park and Chang, 2011).
0 3 6 9 12 150.0
0.1
0.2
0.3
0.4
0.5
0.6 k
d=1.0
kd=1.02
kd=1.06
Bub
ble
siz
e fra
ction
Bubble diameter (mm)
kd=1.1
kd=2.0
Figure 4. 22: Comparison of predicted bubble size fraction when kd take the value of kd
=1.0~2.0.
4.2.4.3 Effects of Nnaoparticle Self-assembly on Liquid Film Drainage
It is widely believed that the driving force for nanoparticle assembly is the
spontaneously reduced interfacial energy. The transmission electron microscopy (TEM)
images obtained by Böker et al. (2007) demonstrates that the assembly process includes
three steps: firstly, free nanoparticles diffuse to the interface; secondly, the particles

134
pack closer and form clusters which grow to form a closely packed particle array,
lowering the interfacial tension, and; finally, thermally activated exchange between
adsorbed and incoming particles is observed, leading to a tightly packed monolayer.
This layer of adsorbed particles at the interface was found to be able to stabilize gas
bubbles in liquid and has been widely employed to fabricate liquid foams with fine
textures (Worthen et al., 2013).
One of the possible reasons leading to the stabilization could be the altered bubble
surface properties. According to Lee and Hodgson (1968), the film drainage which
dominates the bubble coalescence process is strongly affected by the rigidity of bubble
surfaces (deformable and non-deformable) and the mobility of the contact interfaces
(immobile, partially mobile and fully mobile). Tomiyama et al. (1998) proposed that
the accumulation of impurities on a bubble surface will cause the interface to behave
like a rigid surface. Worthen et al. (2013) suggested the addition of nanoparticles could
increase the effective viscosity of the injected gas in the liquid and thereby reduce the
bubble mobility. When the mobility of the bubble surface is restricted, the thinning
process will be controlled by viscous effects and occur much slower, which will
effectively prevent small bubbles coalescing into larger bubbles. This was perhaps the
reason why Park and Chang (2011) observed smaller bubbles in the Al2O3/water
nanofluid.
According to Oolman and Blanch (1986), the thinning of the liquid film trapped
between two colliding bubbles is driven by the pressure forces. In the Prince and
Blanch (1990) model (Equation 4.53), only the capillary pressure, which is induced by
variations in the curvature of the gas-liquid interface, is included to account for the
bubble drainage time.
c
2
ijr
(4.60)
For pure liquids, it is true that the capillary pressure is the only force acting on the
liquid film. But when a second component exists in the liquid, other forces resisting the
film thinning can develop and elongate the bubble drainage time (Oolman and Blanch,
1986). Thus these disjoining forces induced by nanoparticles at the interface were
perhaps another reason for the smaller and more stable bubbles in nanofluids.

135
Oolman and Blanch (1986) proposed that the surface activity of the second
component can induce a surface tension force resisting the approach of two colliding
bubbles. When the liquid film thins, the surface area increases. As a result, the surface
concentration of adsorbed surfactants decreases. Since surface tension is an inverse
function of surfactant‘s concentration, a surface tension gradient along the thinning
film will develop (Figure 4.23), resulting in an additional surface tension force. As
proven by Böker et al. (2007), nanoparticles and surfactants have similar effects on
lowering surface tension. When nanoparticles exist at the interface, the surface tension
gradient and the surface tension force might be introduced to the bubbles as well. The
net surface tension force along the radial dimension of the film could be expressed as
follows (cited in (Oolman and Blanch, 1986)):
21 2( )( )
'
c
h R T c
(4.61)
where h, c, R’, and T represent film thickness, solute concentration, ideal gas constant,
and absolute temperature, respectively.
Figure 4. 23: The surface tension gradient along the radial dimension of the liquid film.
In addition, Wang and Yoon (2008) believed that the electrostatic double layer
force plays a significant role in preventing the thinning of liquid film. The surface of air
bubbles was found to acquire a negative charge in distilled water (Elmahdy et al., 2008)
over the most of the pH range. The electrostatic double layer would thus be established
in the bubbly flows. Due to their dielectric properties, non-metallic nanoparticles in
electrostatic double layers will be polarized and charged (Marek et al., 2010). In turn,
the charged nanoparticles will affect the surface charge density of the bubbles (Wu et
al., 2015), changing repulsive electrostatic double layer force between two negative-
charged bubbles (Figure 4.24). Consequently, the film thinning process would be
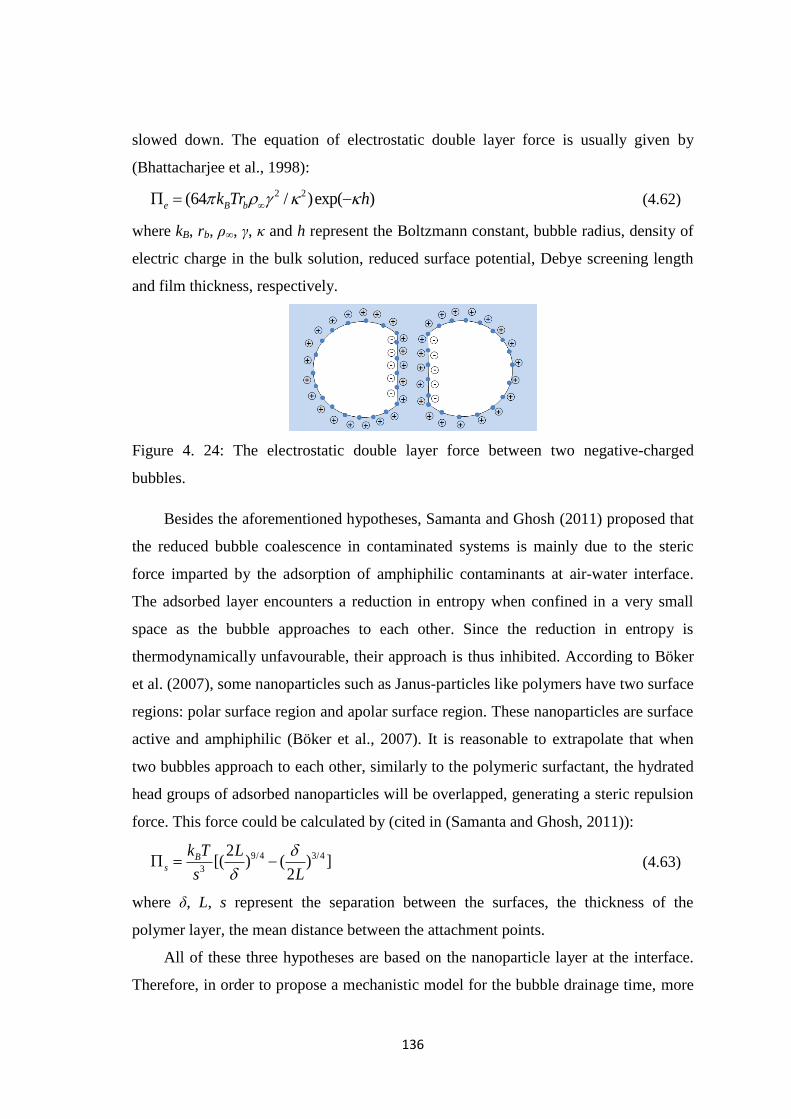
136
slowed down. The equation of electrostatic double layer force is usually given by
(Bhattacharjee et al., 1998):
2 2(64 / )exp( )e B bk Tr h (4.62)
where kB, rb, ρ∞, γ, κ and h represent the Boltzmann constant, bubble radius, density of
electric charge in the bulk solution, reduced surface potential, Debye screening length
and film thickness, respectively.
Figure 4. 24: The electrostatic double layer force between two negative-charged
bubbles.
Besides the aforementioned hypotheses, Samanta and Ghosh (2011) proposed that
the reduced bubble coalescence in contaminated systems is mainly due to the steric
force imparted by the adsorption of amphiphilic contaminants at air-water interface.
The adsorbed layer encounters a reduction in entropy when confined in a very small
space as the bubble approaches to each other. Since the reduction in entropy is
thermodynamically unfavourable, their approach is thus inhibited. According to Böker
et al. (2007), some nanoparticles such as Janus-particles like polymers have two surface
regions: polar surface region and apolar surface region. These nanoparticles are surface
active and amphiphilic (Böker et al., 2007). It is reasonable to extrapolate that when
two bubbles approach to each other, similarly to the polymeric surfactant, the hydrated
head groups of adsorbed nanoparticles will be overlapped, generating a steric repulsion
force. This force could be calculated by (cited in (Samanta and Ghosh, 2011)):
9/4 3/4
3
2[( ) ( ) ]
2
Bs
k T L
s L
(4.63)
where δ, L, s represent the separation between the surfaces, the thickness of the
polymer layer, the mean distance between the attachment points.
All of these three hypotheses are based on the nanoparticle layer at the interface.
Therefore, in order to propose a mechanistic model for the bubble drainage time, more

137
details of the structure of nanoparticles at the interface are needed. In recent years, a
few factors including the nanoparticle aspect ratio, surface properties, concentration
and solvent evaporation rates were revealed to affect the orientation and packing
structures of nanoparticles at the interface (Böker et al., 2007). Further studies showed
that temperature, pH, base liquid poarity and redox activity could all control the
interactions between particles and influence the structure of assembled nanoparticles
(Marek et al., 2010). Moreover, for nanoparticles ranging from 10 nm to 1 μm, their
assembly even could be directed by macroscopic viscous flows (Marek et al., 2010). In
view of these novel experimental findings, it is obvious that the more details are
uncovered, the more complex the problem will be. Due to the inherent complexity,
substantial fundamental studies still need to be conducted in the future.
4.2.5 Conclusions
The MUSIG model was employed in this study to simulate air-water and air-nanofluid
bubbly flows in a vertical tube under isothermal conditions. It was found that the
classic MUSIG model achieved satisfactory agreement with the experimental data of
air-water bubbly flow, whereas notable discrepancies were observed in the case of air-
nanofluid bubbly flow. Based on the analysis of the numerical results, some potential
mechanisms possibly responsible for the significantly changed two-phase flow
structures were discussed and recommendations for future work were given. The
conclusions arising from this study are as follows:
(1) The spontaneous assembly of nanoparticles at the bubble interface
significantly changes the interface rigidity and mobility. As a result, the interfacial drag
force is increased and the role of lift force with increasing bubble size is modified. It
was proven that the positive-to-negative reversal of the lift force occurs at a smaller
bubble size in nanofluids compared to that in pure water.
(2) The layer of nanoparticles at the bubble surface hinders bubble coalescence by
forming a physical barrier and restricting the mobility of the surface. The thinning
process of the liquid film trapped between two colliding bubbles slows down, resulting
in a longer bubble drainage time. However, the mechanisms responsible for the
elongated drainage time are still yet to be uncovered.

138
Chapter 5
Mechanistic Study of Bubble
Hydrodynamics in Nanofluids
The main findings of this chapter have been included in:
Yuan, Y., Li, X. D., and Tu, J. Y. (2017). The Effects of nanoparticles on the
lift force and drag force on bubbles in nanofluids: A two-fluid model study.
International Journal of Thermal Science, 119: 1-8.
Yuan, Y., Li, X. D., and Tu, J. Y. (2017). Effects of spontaneous nanoparticle
adsorption on the bubble-liquid and bubble-bubble Interaction in multi-
dispersed bubbly systems-A Review. International Journal of Heat and Mass
Transfer, (under review).

139
5.1 Mechanistic Analysis of the Effects of Nanoparticles on
Interfacial Forces on Bubbles in Nanofluids
Abstract
Bubbly flows of air-water and air-nanofluid were investigated numerically using
the two-fluid model. Through comparing the predicted bubble velocity and void
fraction profiles against the experimental data, the classic two-fluid model, which has
been widely validated for two-phase flows of pure liquids, was found to be inapplicable
to those of nanofluids because of the empirical nature of the interfacial force
formulation. The roles of interfacial forces were believed to be significantly altered in
nanofluids rather than in pure liquids due to the spontaneous phenomenon of
nanoparticle adsorption at bubble interfaces. Because of the nanoparticle layer, bubbles
submerged in nanofluids would partially behave like a rigid sphere and develop a
rotation movement. A slanted wake could be induced behind the bubble, generating a
lateral Magnus force pointing towards the pipe centre and consequently making the
positive-to-negative reversion of lift force occur at a smaller bubble diameter.
Meanwhile, the slanted wake would also make bubbles in the viscous regime
experience a drag force similar to that in the distorted regime, which makes the
viscous-to-distorted transition point occur at a smaller bubble Reynolds number. It was
recommended that the most important task when modelling bubbly flows of nanofluids
using the two-fluid model is to reformulate the interfacial forces accounting for the
effects of nanoparticle adsorption.
5.1.1 Introduction
Heat transfer enhancement has long been a hot research topic because of the
continuously increasing demands for heat removal in many industries. Thanks to the
development of nano-technology, a new type of engineered colloidal dispersions of
nanometre-sized particles in common base liquids, the so-called ―nanofluid‖, have been
regarded as a revolutionary heat transfer medium in view of its significant heat transfer
enhancements in nucleate boiling (Yang and Liu, 2011; Sheikhbahai et al., 2012;
Kamatchi and Venkatachalapathy, 2015). As the formation of a thin layer of deposited
140
nanoparticles on the heater surface was widely observed in most nucleate boiling
experiments using nanofluids, which does not exist in nucleate boiling of pure liquids,
the heat transfer enhancement of nanofluids has been generally attributed to the surface
modification induced by nanoparticle deposition during the boiling process (Ahmed
and Hamed, 2012). It is believed that the deposited nanoparticles play a dominant role
in altering the boiling heat transfer intensity through significantly changing the
microstructures and properties of the heater surface, as well as the characteristics of
bubble dynamics (Vafaei and Borca-Tasciuc, 2013). In the meantime, nanofluids for
heat transfer applications are generally dilute with every low nanoparticles loads (less
than 0.1 vol%). Under such low nanoparticle concentrations, the liquid thermophysic
properties are negligibly modified (Kim, 2009), which makes it safe to assume that
dilute nanofluids behave hydrodynamically identical to their pure base liquids. Some
numerical studies on boiling flows of nanofluids further assumed the two-phase
behaviours of nanofluids are also identical to those of base liquids (Li et al., 2014b),
and only focused on the effects of surface modifications induced by nanoparticle
deposition.
However, emerging evidence in recent year revealed that nanoparticles have
significant impact on the two-phase flow structures and dynamics. Using a high-speed
visualization and image processing technology, Rana et al. (2014) measured the void
fraction in boiling flows of water and ZnO/water nanofluids (0.001~0.01 vol%) in
horizontal annulus. They found that with the increasing nanoparticle concentration, the
void fraction in nanofluid decreased as much as 86% when compared to that in water,
which indicates that ZnO nanoparticles in fluid act as void-fraction-suppressing agent.
The hydrodynamic behaviours in the pool boiling of water and Al2O3/water nanofluids
(0.001 and 0.002 vol%) were also investigated by Dominguez-Ontiveros et al.
(Dominguez-Ontiveros et al., 2010). Through comparing the velocity profiles obtained
by Dynamic Particle Image Velocimetry (DPIV), the fluid velocity distributions were
found to be generally less uniform and lower in magnitude for the nanofluid cases than
for those of the pure water case. Recently, radial distributions of air-nanofluid (0.1 vol%
Al2O3/water) bubbly flow parameters in a vertical tube were measured by Park and
Chang (2011). The measurements showed that the air-nanofluid bubbly flow had a

141
more flattened void fraction distribution, lower bubble velocity, higher interfacial area
concentration and smaller bubble size than those in the air-water flow.
Considering the profound inter-coupling of two-phase flow structures and the
overall heat transfer performance (Atmane and Murray, 2005), it is crucial to achieve
an effective modelling of the two-phase flow dynamics in order to obtain
comprehensive predictions of nanofluid boiling flows in the future. Beyond that, as
nanoparticles are finding an increasing number of applications in various industries,
multi-dispersed bubbly systems containing nanoparticles are commonly encountered.
For example, nanoparticles are tested at the laboratory scale in bubble column reactors
(Abkarian et al., 2007) to enhance chemical reactions and interfacial mass transfer, and
they are also used as surfactants to stabilize emulsions (Dickinson, 2010) and foams
(Sun et al., 2015). An in-depth understanding of the effects of nanoparticles on bubble
behaviours in liquids is obviously beneficial to many emerging and traditional
industries.
Therefore, this study tries to reveal the mechanistic effects of nanoparticles on
two-phase flow dynamics, with the aim to improve the two-fluid model for effective
modelling of bubbly flows of nanofluids with and without heat and mass transfer.
5.1.2 Theoretical Models
Numerous studies (Palm et al., 2006) have demonstrated that due to their small sizes,
nanoparticles could be assumed to be mixed with the base fluid at a near-molecular
level and thus a nanofluid can be numerically treated as a pseudo-homogeneous single-
phase liquid. The framework of the two-fluid model (Ishii, 1975), which has been
regarded as the mechanistic macroscopic formulation of the thermal-hydraulic
dynamics of two-phase flow system, is theoretically applicable to bubbly flows of
nanofluids. In the model, two sets of conservation equations governing the balance of
mass, momentum and heat of gas and liquid are solved. For an isothermal air-nanofluid
flow, the two-fluid model takes the following form:
The continuity equation:
0k k k k kU
t
(5.1)

142
The momentum equation:
T
k k k k k k k k k k
k k k
U U U U Ut
B P F
(5.2)
where the subscripts k is the phase denotation (k=l for the liquid phase and k=g for the
gas phase); α, ρ, B, U and kF represent the volume fraction, density, body force, velocity
and interfacial forces, respectively.
For bubbles submerged in a continuous liquid, the interfacial force kF generally
includes the forces due to drag and the effects of lateral lift, wall lubrication and
turbulent dispersion.
k gl D L TD WF F F F F F
(5.3)
The drag force DF is calculated by:
3
4
DD g l g l g l
b
CF U U U U
d
(5.4)
The drag coefficient CD is empirically correlated by Ishii and Zuber (1979) to the
bubble Reynolds number Reb and Eötvös number Eo:
0.75
0.5
0 0.2
(1 0.1 ) / 0.2 1000
1000
24 /
24
2 / 3
b b
D b b b
b
Re Re
C Re Re Re
Eo Re
(5.5)
Reb and Eo are defined by:
g lg b
b
l
dRe
U U
(5.6)
2( )
l g bg d
Eo
(5.7)
When a bubble moves in a liquid, it experiences a transverse force which is
usually called the lift force LF . The general form of the lateral lift force is given by
Drew and Lahey (cited in (Kolev, 2012)):
L L g l g l lF C U U U (5.8)
143
The empirical Tomiyama correlation (Tomiyama et al., 2002) is generally used to
calculate the lift coefficient CL:
*3 *2
* *
* * *
*
min 0.288, tanh(0.121 , ( )) 4
( ) 0.00105 0.0159 0.0204 0.474 4 10
0.27 10
b
L
Re f Eo Eo
C f Eo Eo Eo Eo Eo
Eo
(5.9)
where Eo* is the modified Eötvös number based on the maximum bubble horizontal
dimension dH (Wellek et al., 1966).
The wall lubrication force WF and the turbulent dispersion force TDF were
calculated by Equation 5.10 and Equation 5.11, respectively (cited in (Kolev, 2012)).
The wall lubrication coefficients and the turbulent coefficient take value of CW1= -0.01,
CW2=0.05 and CTD= 0.1.
1 2max 0,
g l g l bW W W
b W
U U dF C C n
d y
(5.10)
TD TD l l lF C k
(5.11)
Due to the inherent complexity, the coefficients for interfacial forces are generally
formulated empirically, or at least semi-empirically. Among them, the formulation of
drag coefficient and lift coefficient has a significant effect on the overall modelling
because bubble movement in liquid was reported to be largely controlled by the
interaction between the drag force and the lift force. Although satisfactory predictions
have been achieved using the Ishii-Zuber drag correlation (Ishii and Zuber, 1979)
(Equation 5.5) and Tomiyama lift correlation (Tomiyama et al., 2002) (Equation 5.9) in
a number of studies dealing with bubbly flows of pure liquids (Li et al., 2006), their
applicability to nanofluids are still questionable due to the modifications induced by the
existence of nanoparticles in the liquid.
In order to assess the validity of current ―main-stream‖ interfacial force
coefficients, Park and Chang‘s (2011) experimental data of air-water and air-nanofluid
(0.1 vol% Al2O3/water) bubbly flows in a vertical tube were employed in this study for
model validation. The test section is a vertically oriented acrylic tube with an inner
diameter of 15 mm and a length of 2.5 m. Nanofluid (0.1 vol% Al2O3/water) and air
bubbles were mixed at the bottom of the test section through a bubble formation bed.
144
The mixture was then driven by a pump to flow upward. By controlling the superficial
velocities at jl=2.83 m/s for the liquid and jg=0.19 m/s for the air, respectively, a stable
bubbly flow was achieved. The two-phase flow parameters such as the void fraction,
the bubble diameter and the bubble velocity were measured using a conductivity
double-sensor two-phase void meter located 1.75 m downstream of the bubble
formation bed.
The aforementioned model equations are solved using the commercial CFD code
ANSYS CFX 16.0. In order to facilitate the comparison between numerical results and
experimental data, the boundary conditions of the computations were carefully set up
according to the experimental conditions. Details of the boundary conditions and
numerical procedures have been highlighted in our previous studies (Li et al., 2016)
and will not be repeated here. Uniform bubble diameters of db=6mm for the air-water
case and db=3mm for the air-nanofluid case were estimated, respectively, based on the
experimental data. The liquid properties of the Al2O3/water nanofluid were estimated
using the correlations listed in Table 1. During the computations, the flow of the
gaseous phase was assumed to be laminar as the air density is much lower than the
liquid density and the motion of air bubbles follows the fluctuations in the continuous
liquid phase. Turbulence was only modelled for the liquid phase using the improved k-ε
model by Sato and Sekoguchi (1975), which takes into account the effects of the
bubble-induced additional turbulence viscosity on the liquid effective viscosity.
Table 5. 1 Employed physical properties for mathematical modelling.
Properties Expression Remarks
Density nf f v p v(1 )ρ ρ ρ Based on the principle of the mixture rule; The validity
has been examined by Park and Cho with water-Al2O3
nanoflduis (0-5 vol% )(cited in (Khanafer and Vafai,
2011))
Viscosity nf v f(1 2.5 ) Proposed by Einstein based on the phenomenological
hydrodynamic equations; valid for low concentration
(0-2 vol% ) (cited in (Khanafer and Vafai, 2011))
Surface tension nf 0.065 2N/m
Based on the experiment of Wang and Bao (2009)

145
5.1.3 Results and Discussion
5.1.3.1 Comparison of the Numerical Results against Experimental Data
0.0 0.2 0.4 0.6 0.8 1.00.0
0.1
0.2
0.3
0.4
0.5
2
3
4
5Bubble velocity
Exp. - air/water
Classic TFM
vo
id fra
ction
r/R(-)
Void fraction
bub
be
l ve
locity (
m/s
)
Exp-air/water
Classic TFM
(a)
0.0
0.1
0.2
0.3
0.4
0.5
0.0 0.2 0.4 0.6 0.8 1.02
3
4
5
Exp. - air/nanofluid
Classic TFM
vo
id f
ractio
n
Bubble velocity
bubbel velo
city (
m/s
)
Exp. - air/nanofluid
Classic TFM
Void fraction(b)
Figure 5. 1: Comparison of predicted bubble velocity and void fraction profile against
experimental data: (a) air-water bubbly flow; (b) air-nanofluid bubbly flow (Park and
Chang, 2011).
The predicted bubble velocity and void fraction of the air-water and air-nanofluid
bubbly flows were compared against the experimental data of Park and Chang (2011)
in Figure 5.1, respectively. A well-developed core-peaking distribution of void fraction

146
was observed in the air-water bubbly flow, which was successfully captured by the
two-fluid model (Figure 5.1(a)). In the case of air-nanofluid bubbly flow, the bubble
velocity was suppressed and the overall shape of void fraction distribution was
flattened (Figure 5.1(b)) when compared to the air-water case. The two-fluid model,
however, overestimated the bubble velocity slightly and predicted a completely
incorrect wall-peaking void fraction distribution for the air-nanofluid bubbly flow,
indicating significant improvement is needed in order that a satisfactory prediction
could be achieved.
5.1.3.2 The adsorption of nanoparticles on air-water interface
The experimental observation by Park and Chang (2011), among many others
(Dominguez-Ontiveros et al., 2010; Rana et al., 2014), clearly demonstrated that the
addition of nanoparticles into the base liquid induced a significant alteration in the two-
phase flow structures and parameter profiles, even if the amount of added nanoparticle
was so small (0.1 vol%) that the liquid properties were only negligibly changed. They
attributed the modified flow dynamics of nanofluids to the altered interfacial drag and
lift forces, but did not provide further mechanistic explanations for the questions like
what role nanoparticles have played in altering the drag and lift forces, and how the
altered drag and lift forces affect the structure of air-nanofluid bubbly flow.
Experimental data from McClure et al.‘s recent study (McClure et al., 2017) showed a
similar effect of the surfactant addition on the hydrodynamics in a bubble column.
Significant reductions in the average hold-up (up to 30%) and the Oxygen Transfer
Rate (OTR, up to 75%) were observed with a small amount of surfactants (0.01 vol%).
Such reductions are commonly attributed to the accumulation of the surfactants at the
gas-liquid interface (McClure et al., 2017). Coincidently, as early as 2016 our previous
study (Li et al., 2016) proposed a similar hypothesis that the adsorbed nanoparticles at
the bubble interfaces seem to be a plausible cause responsible for the prominently
modified two-phase flow features. However, the underlying mechanisms are still yet to
be revealed.
In fact, the phenomenon of nanoparticle adsorption at phase interfaces has long
been recognized and vastly investigated. Under the driving force of minimized Gibbs

147
free energy, nanoparticles suspending in the liquid tend to spontaneously aggregate at
bubble interfaces (Sun et al., 2015). Shown in Figure 5.2 is an image of nanoparticle
adsorption (MAGSILICA@
H8 nanoparticles) at the interface of bubbles submerged in
ethanol/water mixture (Rodrigues et al., 2011). Using the Confocal Laser Scanning
Microscopy (CLSM) technology, Dickinson et al. (2004) observed a thin layer of silica
nanoparticles surrounding air bubbles in the nanofluid (1 wt% silica nanoparticles in
NaCl/water solutions) and further proved the existence of the close-packed particle
layer around the bubble (Binks and Horozov, 2005).
Figure 5. 2: TEM image of air bubbles with MAGSILICA@ H8 nanoparticles
(Cp=10mg/mL) in ethanol/water mixtures (Rodrigues et al., 2011).
Hunter et al. (2008) found that the detachment energy, which is related to the free
energy required to remove an adsorbed nanoparticle from the interface, can be up to
several thousand kBT (kB is the Boltzmann constant and T is the absolute temperature),
which is much higher than the detachment energy needed for surfactants. This means
once nanoparticles are adsorbed, it is almost impossible to force them out of the bubble
interface. Therefore, the layer of adsorbed nanoparticles at the gas-liquid interface
generates a sort of ―colloidal armour‖ that can inhibit, or even overwhelmingly stop
smaller bubbles coalescing into larger bubbles (Kam and Rossen, 1999; Du et al., 2003).
This was perhaps the reason why Park and Chang (2011) observed smaller bubbles in
the Al2O3/water nanofluid than in pure water. It is also speculated that with this
―colloidal armour‖, the gas-liquid interface would behave pretty much like a rigid
surface rather than a mobile one. Bubbles packed with a nanoparticle layer would be

148
consequently more like a rigid sphere than a deformable bubble. In addition, the slip
condition of the bubble surface is also believed to be changed from free-slip to no-slip,
as shown in Figure 5.3 (Dijkhuizen et al., 2010a), and consequently the inner
circulation flow in bubbles is also partially or completely suppressed depending on the
rigidity of the packed bubble. Therefore, the roles of interfacial forces, especially those
of the lift force and drag force, would be significantly altered due to the modified
bubble interface properties.
Figure 5. 3: The effect of contaminants: (a) ultra-pure liquid with free-slip boundary
condition; (b) slightly contaminated liquid with a limited circulation inside the bubble;
(c) fully contaminated bubble with no-slip boundary condition (Dijkhuizen et al.,
2010a).
5.1.3.3 Analysis of the Lift Force
The transverse motion of bubbles in a vertical flow is largely controlled by the lift force,
which acts perpendicularly to the bubble rising direction. For small spherical bubbles in
an upward flow, the lift force is mainly resulted from laminar shear and acts towards
the pipe wall (Figure 5.4). The lift coefficient CL is positive with a value ranging from
0.25 to 0.5 (Zun, 1980; Auton, 1987; Lance and de Bertodano, 1994) depending on the
liquid viscosity.
With increasing bubble size, bubbles tend to deform because of the free surface
mobility and induce a wake behind the bubble, as shown in Figure 5.5. The wake is
generally slanted due to the liquid velocity gradient. Through analysing the shape and
trajectories of air bubbles rising in glycerol/water solutions with a video camera,
Tomiyama et al. (1995) confirmed Serizawa and Kataoka‘s (1994) presumption that the

149
lateral migration of a deformed bubble is governed by the complex interactions
between the bubble wake and the liquid shear field. Based on their experimental
observations, Tomiyama et al. (1995) proposed that the slanted wake can cause a lift
force acting towards the pipe centre. When the wake becomes strong enough, the wake-
induced lift force is able to defeat the shear-induced lift force and causes a lift force
reversion. They also developed an empirical CL correlation (Equation 5.9) which has
allowed modelling the transverse migration of spherical and deformed bubbles
(Tomiyama et al., 2002).
Figure 5. 4: Lift force on a spherical bubble in pure liquids.

150
Figure 5. 5: Lift forces on a deformed bubble in pure liquids.
However, when bubbles are covered with nanoparticles, the situation may be
different. With the so-called ―colloidal armour‖, bubbles in nanofluids are partially
rigid and more resistant to deform. Under the action of liquid velocity gradient, a
nanoparticle-covered bubble tends to develop a rotating movement, which induces a
slanted wake behind the bubble and generates a lateral force pointing towards the pipe
centre, as illustrated in Figure 5.6. The lateral force induced by rotating spherical
objects is well known as the Magnus force (Bagchi and Balachandar, 2002), which is
essentially a wake-induced lateral lift force but expected to have a much stronger effect
on bubble transverse migration than the deformation effect.
Figure 5. 6: Lift forces on a nanoparticle-covered spherical bubble in nanofluids.

151
0 2 4 6 8 10 12-0.3
-0.2
-0.1
0.0
0.1
0.2
0.3
lift co
eff
icie
nt
bubble diameter /mm
Tomiyama, air/water
Tomiyama, air/nano
Expected model
reversal point
Figure 5. 7: Bubble lift coefficient versus bubble diameter.
0.0 0.2 0.4 0.6 0.8 1.00.0
0.1
0.2
0.3
Exp. - air/nanofluid
TFM with CL= -0.025
vo
id fra
ction
r/R(-)
(a)

152
0.0 0.2 0.4 0.6 0.8 1.01
2
3
4
5
Exp, air/nanofluid
TFM with CL=-0.025
bu
bb
le v
elo
city (
m/s
)
r/R(-)
(b)
Figure 5. 8: Predicted bubble velocity and void fraction profile of air-nanofluid bubbly
flows with CL= -0.025: (a) Void fraction; (b) Bubble velocity.
Therefore, the lift forces exerted on a deformed bubble in water and on a
nanoparticle-covered bubble in nanofluids are both expected to be a consequence of
two competing factors: shear- and wake-induced lift forces. In air-water bubbly flows,
the shear effect is dominant for small spherical bubble with low Eötvös number and the
lift coefficient is positive, as shown in Figure 5.7. As the bubble size increases, the
wake effect due to the bubble deformation becomes increasingly important and finally
reverses the sign of the lift coefficient at the critical bubble diameter, (dcr=5.8mm
according to Tomiyama correlation (Equation 5.9)). Therefore, the bubbles with an
average diameter db=6mm in the air-water case of this study had a negative lift force
and migrated towards the pipe centre, constituting the core peaking of the void fraction
distribution shown in Figure 5.1(a).
In air-nanofluid bubbly flows, the sign of the lift force is less controlled by the
Eötvös number because the bubbles are deformation-resistant, but is expected to be
controlled by the bubble Reynolds number. According to Moraga et al. (1999), no
wake-induced lift force is expected for Reynolds numbers below 300 where the lift
coefficient is positive. As the Reynolds number increases, the wake effect due to the
rotation becomes increasingly important and eventually reverses the sign of the lift
coefficient to negative. According to Park and Chang‘s experiment (2011), the bubble
Reynolds number in the air-nanofluid bubbly flow was estimated to be 1000. Obviously,
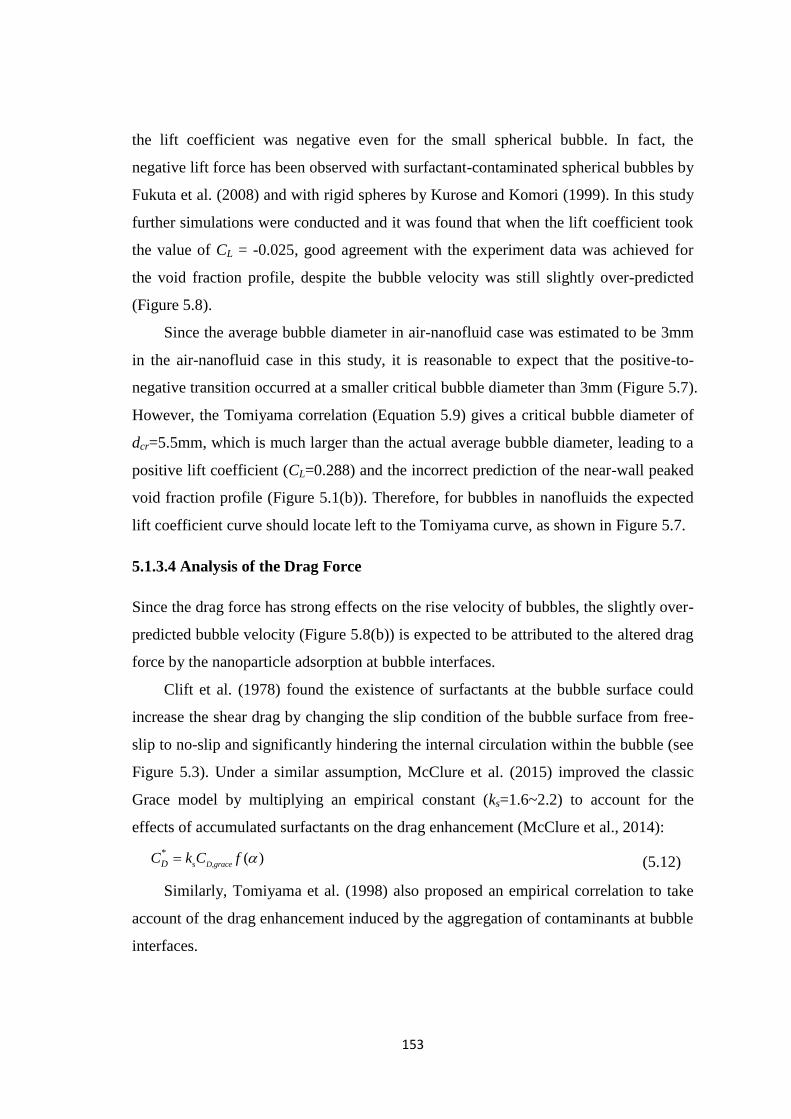
153
the lift coefficient was negative even for the small spherical bubble. In fact, the
negative lift force has been observed with surfactant-contaminated spherical bubbles by
Fukuta et al. (2008) and with rigid spheres by Kurose and Komori (1999). In this study
further simulations were conducted and it was found that when the lift coefficient took
the value of CL = -0.025, good agreement with the experiment data was achieved for
the void fraction profile, despite the bubble velocity was still slightly over-predicted
(Figure 5.8).
Since the average bubble diameter in air-nanofluid case was estimated to be 3mm
in the air-nanofluid case in this study, it is reasonable to expect that the positive-to-
negative transition occurred at a smaller critical bubble diameter than 3mm (Figure 5.7).
However, the Tomiyama correlation (Equation 5.9) gives a critical bubble diameter of
dcr=5.5mm, which is much larger than the actual average bubble diameter, leading to a
positive lift coefficient (CL=0.288) and the incorrect prediction of the near-wall peaked
void fraction profile (Figure 5.1(b)). Therefore, for bubbles in nanofluids the expected
lift coefficient curve should locate left to the Tomiyama curve, as shown in Figure 5.7.
5.1.3.4 Analysis of the Drag Force
Since the drag force has strong effects on the rise velocity of bubbles, the slightly over-
predicted bubble velocity (Figure 5.8(b)) is expected to be attributed to the altered drag
force by the nanoparticle adsorption at bubble interfaces.
Clift et al. (1978) found the existence of surfactants at the bubble surface could
increase the shear drag by changing the slip condition of the bubble surface from free-
slip to no-slip and significantly hindering the internal circulation within the bubble (see
Figure 5.3). Under a similar assumption, McClure et al. (2015) improved the classic
Grace model by multiplying an empirical constant (ks=1.6~2.2) to account for the
effects of accumulated surfactants on the drag enhancement (McClure et al., 2014):
s
*( )
D,graceDC k C f
(5.12)
Similarly, Tomiyama et al. (1998) also proposed an empirical correlation to take
account of the drag enhancement induced by the aggregation of contaminants at bubble
interfaces.
154
0.687max 24(1 0.15 ) / ,8 / 3( 4)D,Tomiyama b bC Re Re Eo Eo
(5.13)
As nanoparticles are found to behave like general surfactants in many ways like
adsorbing at the bubble interfaces and changing the slip condition (Binks, 2002), it is
extrapolated that adsorbed nanoparticles might play a similar role in increasing the
shear drag. Following the modified Grace model, this study introduced the empirical
constant (ks =1.6~2.2) to the Ishii-Zuber model (Ishii and Zuber, 1979) (Equation 5.5)
to account for the influence of nanoparticles:
*
s D,ishiiDC k C
(5.14)
0.0 0.2 0.4 0.6 0.8 1.01
2
3
4
5
Exp. air/nanofluid
Ishii-Zuber
Ishii-Zuber ks=1.6
Ishii-Zuber ks=2.2
Tomiyama
bu
bb
le v
elo
city
(m
/s)
r/R(-)
Figure 5. 9: Comparison of predicted bubble velocity profiles using different drag
correlations.
For the purpose of comparison, the Tomiyama drag correlation (Equation 5.13)
was also included in the computations. A comparison of numerical results against the
experimental data is shown in Figure 5.9. It demonstrates that accounting for the
influence of adsorbed nanoparticles on shear drag through a simple coefficient only has
very limited impact on the bubble velocity prediction. This indicates that the effects of
nanoparticles on bubble drag would be much stronger than surfactants.
The drag coefficients calculated by the above correlations versus bubble Reynolds
number Reb were plotted in Figure 5.10. As depicted in the figure, four different
regimes can be distinguished. The ―undistorted regimes‖ are the stokes (0< Reb <0.2)
and viscous (0.2< Reb <approx.1000) regimes where the drag, especially the shear drag,

155
is mainly determined by the liquid viscosity. When the shear stress and slip condition
of the bubble surface are modified by adsorbed nanoparticles, the shear drag would be
significantly enhanced. As the bubble diameter increases, the distortion and irregular
motion of the bubble become pronounced and dominant for the drag force. This is the
so-called ―distorted regime‖ (approx.1000<Re) where a large wake due to the vortex
departure is created behind the bubble. According to Ishii and Zuber (1979), in this
regime the drag coefficient does not depend on the viscosity, but becomes proportional
to the radius of the bubble.
101
102
103
104
0
5
10
15
20
distorted & cap
regime
Ishii-Zuber
Ishii-Zuber ks=1.6
Ishii-Zuber ks=2.2
Tomiyama
dra
g c
oe
ffic
ien
t
Reb
stokes & viscous
regime
Exp
ect
ed
tra
nsi
tion
po
int
Figure 5. 10: Bubble drag coefficient versus bubble Reynolds number.
Since the bubble covered with nanoparticles behaves more like a rigid sphere, the
rotation-induced wake region is likely to form when the bubble Reynolds number is
over 300 (Moraga et al., 1999). This means for a bubble Reynolds number 300< Reb
<1000, the bubbles may experience a drag enhancement similar to that in the distorted
regime. As a result, it is expected that the transition point from the viscous regime to
distorted regime may occur at a smaller Reynolds number in nanofluids, as shown in
Figure 5.10.
5.1.3.5 Summary and Key Research Points
In summary, due to the adsorption of nanoparticles at bubble interfaces, the slip
conditions and properties of the bubble interfaces are significantly changed. The
internal circulation is suppressed, leading to an increased shear drag. Moreover, when a
156
bubble is covered with nanoparticles, it would partially behave like a rigid sphere and
develop a rotation movement. A slanted wake could be formed behind the bubble even
under comparatively low bubble Reynolds number and low Eötvös number. This
slanted wake would generate a lateral Magnus force pointing towards the pipe centre
and consequently make the positive-to-negative reversion of the lift force occur at a
much smaller bubble diameter. Meanwhile, the slanted wake would also make bubbles
in the viscous regime experience a drag force similar to that in the distorted regime,
which causes the viscous-to-distorted transition point to occur at a smaller bubble
Reynolds number.
However, it should be noted that the effects of nanoparticle adsorption on the
interfacial forces are subject to a number of factors including the nanoparticle material,
size and concentration. For example, the concentration of contaminates (e.g.
nanoparticles and surfactants) can affect the progress of particle coverage considerably.
This conclusion can be drawn from previously-mentioned McClure et al.‘s study (2017)
where a critical concentration of surfactants was observed. At low surfactant
concentrations, the interface was partially covered and hence the reductions in the
overall hold-up and OTR were relatively small. As the concentration of surfactants
increased, the coverage of the interface also progressively increased resulting in a
significantly reduced OTR until the critical surfactant concentration was reached. At
this critical concentration, the gas-liquid interface was completely covered by a
monolayer of surfactants. Thus above this level, additional surfactants had minimal
impact. This critical concentration can be estimated as:
100w
monolayer
m A
caM
A N
(5.15)
where a is the interfacial area, Mw is the molecular weight of the antifoam, Am is the
molecular area of the surfactants, NA is Avogadro‘s number. However, McClure et al.
(2017) also pointed out that it is difficult to obtain exact values for the molecular
weight and area, since the surfactants are generally a blend of compounds and the exact
composition of which may be proprietary. When nanoparticles exist in the liquid, the
situation is more complicated and obtaining an accurate estimation of the critical
nanoparticle concentration seems more difficult at current stage. All these have made
formulating the interfacial forces for bubbles in nanofluids a very challenging task.

157
Although the adjustment to the lift coefficient and drag coefficient in this study have
contributed to better results, they are, however, case sensitive and only applicable to the
case of this study. In order to achieve an effective modelling and gain an in-depth
understanding of the complex mechanisms, the following major focuses are
recommended for the future studies:
(a) The effects of nanoparticle material, size and concentration on the structure of
nanoparticle adsorption layer.
(b) The effects of nanoparticle adsorption layer on the rigidity and mobility of the
bubble surface.
(c) Other possible factors like inter-particle electrostatic force, hydrophobic force
and steric repulsion force.
5.1.4 Conclusions
In this study, local two-phase flow parameters including the bubble velocity and void
fraction were investigated using the two-fluid model. By comparing the numerical
results with the experimental data, the effects of nanoparticle adsorption at bubble
interfaces on the two-phase flow behaviours were examined and the feasibility of
utilizing the two-fluid model to simulate air-nanofluid bubbly flows was evaluated.
Based on analyses of the numerical results, some potential mechanisms responsible for
the significantly changed two-phase flow structures were also discussed and some
recommendations for future work were given. The conclusions arising from this study
are as follows:
(1) The spontaneous nanoparticle adsorption at bubble interfaces significantly
modified the interface properties and slip conditions, which makes the bubble interface
partially rigid and suppresses the inner circulation in bubbles. The rigid surface also
makes the bubble develop a rotating movement and induces a wake behind a spherical
bubble.
(2) The wake significantly alters the role of lift force and drag force. It is crucial to
reformulate the interfacial forces when modelling nanofluid bubbly flows using the
two-fluid model.

158
5.2 Effects of Spontaneous Nanoparticle Adsorption on the
Bubble-liquid and Bubble-bubble Interaction
Abstract
Nanoparticles have been experimentally proven effective in stabilizing bubbles
and enlarging the interfacial area of multi-dispersed bubbly systems. However, unlike
the thorough understanding that how nanoparticles stabilize foams, the fundamental
studies of the role that nanoparticles play in modifying the flow structures of bubbly
flows are still very rare. This lack of mechanistic understanding and the absence of
predictive theoretical models have hindered the substitution of nanoparticles for
surfactants in industry. Therefore, in this study the common findings yielded from
experimental and numerical investigations available in literature were analysed and
summarized. It was demonstrated that the spontaneous adsorption of nanoparticles at
gas-liquid interfaces is the major cause of the dramatic modification of flow structures.
After analysing its influences on the bubble-liquid and bubble-bubble interactions, it
was suggested that the key task when mechanistically modelling bubbly flows
containing nanoparticles is to formulate the lift force, drag force, film drainage time
and rupture time affected by nanoparticle adsorption.
5.2.1 Introduction
Bubbly flows, where discrete small bubbles are dispersed or suspended in liquid
continuums, are widely encountered in various industries such as chemical, petroleum,
mining and food processes that require large interfacial areas for efficient mixing of
competing gas-liquid interactions. Maintaining the bubbly flow regime and enlarging
the interfacial area have always been interests of studies with the aim to improve gas-
liquid mixing during the past decades (Yao and Morel, 2004). In pursuing of larger
interface area concentrations (IACs), surfactants were commonly added into the two-
phase systems as they are efficient in increasing the gas-liquid interfacial area and
stabilizing bubbles (Loubière and Hébrard, 2004; Rubia et al., 2010; Jia et al., 2015). In
recent years, thanks to the fast advances of nanotechnology, nanoparticles have been

159
increasingly utilized as substitute for surfactants (Du et al., 2003) due to their
unparalleled merits such as the excellent physical and chemical stabilities.
It has long been aware that nanoparticles are capable of stabilizing bubbles in
quiescent liquid, such as those in foams where the volume fraction of air could be as
high as 99% (Hunter et al., 2008; Worthen et al., 2013). In recent years, nanoparticles
have also been found promising to stabilize dynamic multi-dispersed bubbly systems.
Wang and Bao (2009) found that the bubbly-to-slug flow regime transition in a vertical
tube occurred at a higher gas superficial velocity when CuO nanoparticles (0.5 wt%)
were added to the nitrogen-water two-phase flow. This indicated that nanoparticles
could help maintain a bubbly flow pattern with a higher void fraction than pure water.
Park and Chang (2011) also experimentally investigated the two-phase flow dynamics
of γ-Al2O3 nanoparticle-water mixture (0.1 vol%) and found bubbles generated through
injecting air into the mixture were between 2 mm to 5 mm in diameter, which were
much smaller than the bubbles in pure water (3 mm to 10 mm) injected under the same
experimental conditions. The experiments also revealed that the radial void fraction
distribution had a more flattened and uniform centre-peaked shape with the existence of
nanoparticles in the water. The interfacial area concentration (IAC) was up to 300 m-3
in the nanoparticle-water mixture, almost twice as high as that in pure water.
All of these novel experimental observations have stimulated basic research on
bubble hydrodynamics in nanoparticle-containing system and have called for a
mechanistic understanding of the effects of nanoparticles on flow structures, which is
indispensable to develop a predictive model for system design and optimization. Our
primary studies (Li et al., 2016; Yuan et al., 2016), for the first time, attributed the flow
structure modifications to adsorbed nanoparticles at the gas-liquid interface, which has
been vastly observed in experiments (Hunter et al., 2008). The adsorption of
nanoparticles was believed to affect the bubble-liquid and bubble-bubble interactions
by altering the interfacial forces and bubble coalescence. Although the changes in these
interactions were demonstrated to be the main cause of the smaller bubble size, uniform
void fraction distribution and larger IACs observed in Park and Change‘s experiments
(2011) in our previous study (Yuan et al., 2016), the underlying mechanisms that how
nanoparticles influence the interfacial forces and bubble coalescence process have not

160
been thoroughly understood. Moreover, the substitution of nanoparticles for surfactants
is a pretty new technology developed in recent years and the bubbly flow containing
nanoparticles is an extremely complicated physical phenomenon. A systematic review
of the effects of nanoparticle adsorption on bubble dynamics and flow structures is
urgently needed.
Therefore, this paper focuses on the phenomenon of nanoparticle adsorption at
gas-liquid interfaces and its effects on the bubble-liquid and bubble-bubble interactions.
This paper also aims to clarify the theoretical frame which in future could be used to
develop predictive models for bubbly flows containing nanoparticles.
5.2.2 Nanoparticle Adsorption at Phase Interfaces
The phenomenon of nanoparticle adsorption at gas-liquid interfaces has long been
recognized and vastly utilized to stabilize bubbles in liquid foams (Hunter et al., 2008).
Shown in Figure 5.11 are microscopic images of nanoparticles adsorbed at the
interfaces of bubbles or liquid drops submerged in another liquid. Figure 5.11(a)
illustrates that MAGSILICA® H8 nanoparticles (a single-domain iron oxide core with
a fully closed silica shell with a diameter of 16 ± 10 nm) suspended in liquid
assembled at the surface of air bubbles submerged in an ethanol/water mixture and
formed a thin layer covering the bubble (Rodrigues et al., 2011). This thin layer of
adsorbed nanoparticles was also clearly observed by Lin et al. (2005) in a CdSe
nanoparticle-toluene/water mixture using the Scanning Force Microscopy (SFM) in
Figure 5.11(b).
Figure 5. 11: (a) TEM image of air bubbles with MAGSILICA® H8 nanoparticles in
ethanol/water mixture (Rodrigues et al., 2011); (b) Fluorescence confocal microscope
image of the adsorbed CdSe nanoparticles at toluene/water interface (Lin et al., 2005).
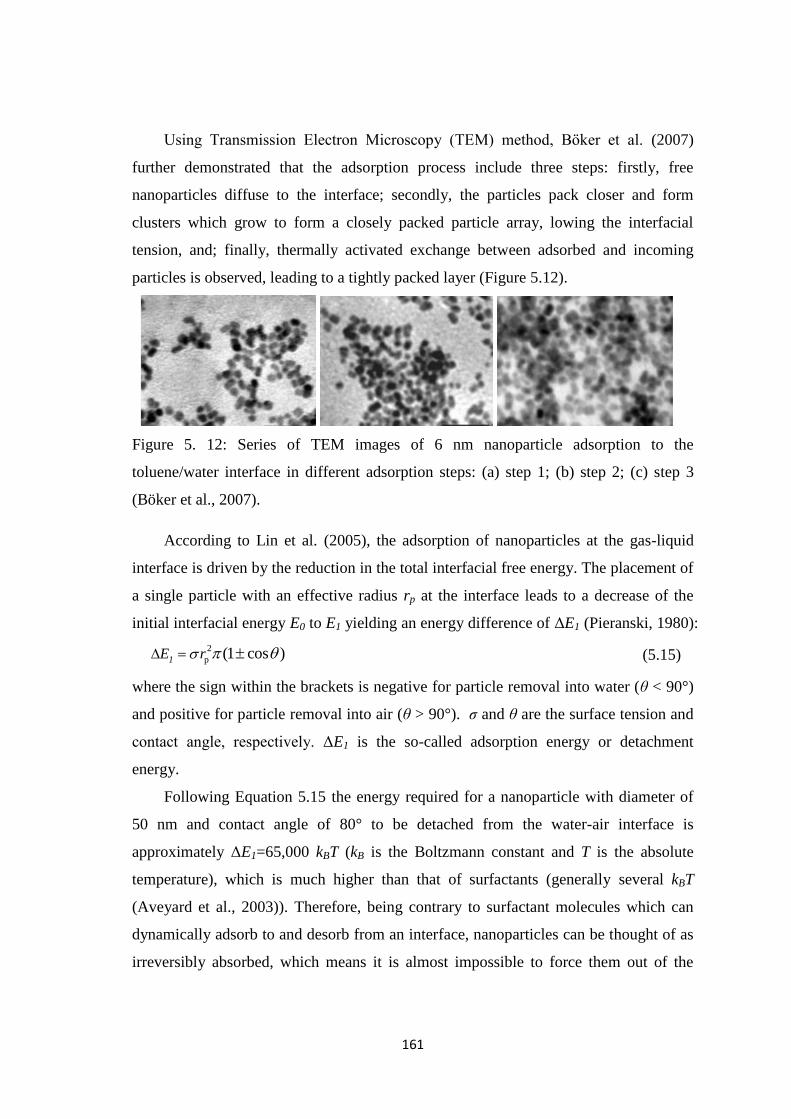
161
Using Transmission Electron Microscopy (TEM) method, Bӧker et al. (2007)
further demonstrated that the adsorption process include three steps: firstly, free
nanoparticles diffuse to the interface; secondly, the particles pack closer and form
clusters which grow to form a closely packed particle array, lowing the interfacial
tension, and; finally, thermally activated exchange between adsorbed and incoming
particles is observed, leading to a tightly packed layer (Figure 5.12).
Figure 5. 12: Series of TEM images of 6 nm nanoparticle adsorption to the
toluene/water interface in different adsorption steps: (a) step 1; (b) step 2; (c) step 3
(Böker et al., 2007).
According to Lin et al. (2005), the adsorption of nanoparticles at the gas-liquid
interface is driven by the reduction in the total interfacial free energy. The placement of
a single particle with an effective radius rp at the interface leads to a decrease of the
initial interfacial energy E0 to E1 yielding an energy difference of ΔE1 (Pieranski, 1980):
2
p (1 cos )1E r (5.15)
where the sign within the brackets is negative for particle removal into water (ζ < 90°)
and positive for particle removal into air (ζ > 90°). ζ and ζ are the surface tension and
contact angle, respectively. ΔE1 is the so-called adsorption energy or detachment
energy.
Following Equation 5.15 the energy required for a nanoparticle with diameter of
50 nm and contact angle of 80° to be detached from the water-air interface is
approximately ΔE1=65,000 kBT (kB is the Boltzmann constant and T is the absolute
temperature), which is much higher than that of surfactants (generally several kBT
(Aveyard et al., 2003)). Therefore, being contrary to surfactant molecules which can
dynamically adsorb to and desorb from an interface, nanoparticles can be thought of as
irreversibly absorbed, which means it is almost impossible to force them out of the
162
interface, either by shrinkage of the bubble or thermal agitation (Rodrigues et al., 2011).
As a result, this closely-packed layer of nanoparticles at the interface generates a sort of
―colloidal armour‖ (Dickinson, 2010). This ―colloidal armour‖, on one hand, is found
to create a steric barrier which is capable of stabilizing bubbles in liquid foams by
inhibiting or even overwhelmingly stopping bubble coalescence process (Kam and
Rossen, 1999; Du et al., 2003). On the other hand, the bubble surface properties and
slip conditions are speculated to be significantly changed due to the presence of this
―colloidal armour‖. Bubbles coated with a layer of nanoparticle would deform less and
be consequently more like a rigid sphere (Tomiyama et al., 1998). In addition, the part
of nanoparticles immersed in the gas phase can immobilize the bubble surface and
change the slip condition from free-slip to no-slip, resulting in the partially or
completely supressed inner circulation flow (Dijkhuizen et al., 2010a). Since bubble-
liquid and bubble-bubble interactions which control the bubble‘s movements,
distribution and size, are predominantly influenced by the bubble surface properties and
bubble coalescence process, it is crucial to clarify the mechanisms of the effects of
nanoparticles on these two interactions.
5.2.3 The Influences of Nanoparticles on Bubble-liquid Interactions
5.2.3.1 Bubble-liquid Interaction
Hydrodynamic interactions between the gas and liquid phases are responsible for the
complexity of gas-liquid flows. Interfacial forces are almost always the dominant
components of these interactions and their formulations are critical to the prediction of
gas-liquid flows. Forces exerted on a bubble moving in continuous liquid include drag
force , lateral lift force , wall lubrication force and turbulent dispersion force
. The total interfacial force on the bubble is:
k D L W TDF F F F F (5.16)
3
4
DD g l g l g l
b
CF U U U U
d (5.17)
L L g l g l lF C U U U
(5.18)

163
1 2max 0,
g l g l bW W W
b W
U U dF C C n
d y
(5.19)
TD TD l l lF C k
(5.20)
where CD, CL, CW1 and CW2, and CTD denote drag coefficient, lift coefficient, wall
lubrication coefficients and turbulent dispersion coefficient, respectively. The
formulation of these coefficients has been strongly empirical due to the extreme
complexity. Although dozens of correlations have been proposed for these coefficients,
considerable uncertainties and discrepancies remain being reported due to their
empirical nature. It is worth noting that these interfacial forces are all closely related to
liquid velocity filed surrounding the bubble (Kolev, 2012). An insight into the liquid
flow around a nanoparticle-covered bubble is thus needed.
When a spherical gas bubble having a clean interface, moves at a constant velocity
U through a continuous liquid phase, its streamlines are open, and in particular there
are no wakes behind (Figure 5.13(a)) (Brenner, 2013) because no shear exists on the
bubble interface. As the Weber number (We=ρU2rb/ζ) increases, the inertial distorts
the bubble from spherical to oblate-ellipsoidal and spherical cap shapes. When the
distortion is significant, flow separation and wake occur at the back end if the bubble
Reynolds number Reb is larger than 125 (Ryskin and Leal, 1984) (Figure 5.13(b)).
However, for solid spheres as long as the Reynolds number is larger than about 12,
flow separation and wake formation can always occur (Clift et al., 1978; Johnson and
Patel, 1999). This fact suggests that the reduction in a spherical bubble‘s interfacial
mobility can cause a wake to form at its back end (Fdhila and Duineveld, 1996;
Mclaughlin, 1996; Wang et al., 2002). When it comes to nanoparticle-containing
system, due to the so-called ―colloidal armour‖ of nanoparticles, bubbles will be
partially rigid and immobile, and become more resistant to deform (Sugiyama et al.,
2001). A wake region could probably form behind the nanoparticle-covered bubble
(Wang et al., 2002; Fukuta et al., 2008). Meanwhile, under the action of liquid velocity
gradient and fluid shear, the nanoparticle-covered bubble tends to develop a rotating
movement (Kurose and Komori, 1999). This rotating movement has been demonstrated
to induce wake asymmetries, as illustrated in Figure 5.13(c) (Taneda, 1957).

164
Wake
Wake
Figure 5. 13: Flow field surrounding the bubble: (a) spherical bubbles in pure liquid; (b)
distorted bubbles in pure liquid; (c) spherical bubbles in nanoparticle-containing system.
5.2.3.2 The Lift Force
Lift force generally acts in the direction normal to the relative motion of fluid and
bubbles, and largely controls the transverse motion of bubbles in a vertical flow. For
small spherical bubbles in pure liquid shear flow, a lateral force is caused by the
pressure difference due to a liquid velocity gradient (Figure 5.14(a)). This lateral force
is the so-called shear-induced lift force, which acts towards the descending liquid
velocity gradient, or in another word, towards the pipe wall for a spherical bubble
rising in an upward liquid flow (Ug>Ul). The lift coefficient CL is thus positive with a
value ranging from 0.25 to 0.5 depending on the bubble Reynolds number and liquid
viscosity (Zun, 1980; Auton, 1987; Lance and de Bertodano, 1994). For distorted
bubbles in pure liquid, besides the shear-induced lift force, another lateral force arises
due to the complex interactions between the bubble wake and the liquid shear filed

165
(Serizawa and Kataoka, 1994). According to Tomiyama et al. (1995) this wake-induced
lift force acts in an opposite direction of the shear-induced lift force and causes a
direction reversal when the wake becomes strong enough (Figure 5.14(b)).
Shear-induced lift force
Liquid velocity distribution
Wake
Shear-induced lift force
Wake-induced lift force
Liquid velocity distribution
Figure 5. 14: The lift force acing on: (a) spherical bubbles in pure liquid; (b) distorted
bubbles in pure liquid.
0 2 4 6 8 10 12-0.3
-0.2
-0.1
0.0
0.1
0.2
0.3
lift co
eff
icie
nt
bubble diameter (mm)
Eq. 5.21, air/water
Eq. 5.21, air/water
with nanoparticles
Expected model
reversal point
Figure 5. 15: The predicted lift coefficient as a function of bubble diameter (Yuan et al.,
2017).
Tomiyama et al. (2002) developed an empirical CL correlation which has allowed
modelling the transverse migration of spherical and distorted bubbles in pure liquid:
*3 *2
* *
* * *
*
min 0.288, tanh(0.121 , ( )) 4
( ) 0.00105 0.0159 0.0204 0.474 4 10
0.27 10
b
L
Re f Eo Eo
C f Eo Eo Eo Eo Eo
Eo
(5.21)
166
where Eo* is the modified Eötvös number based on the maximum bubble horizontal
dimension dH. The Tomiyama lift coefficient is plotted against the bubble size in Figure
5.15. For air bubbles rising in pure water, the negative-to-positive transition occurs at a
critical bubble diameter of dcr=5.8 mm (Liu, 1993; Grossetete, 1995; Sakaguchi et al.,
1996).
When bubbles are coated with nanoparticles, they are more likely to behave like
rigid spheres rather than deformable bubbles due to the increased rigidity and restricted
mobility. As for the rigid sphere, both Kurose and Komori (1999) and Bagchi and
Balachandar (2002) showed that the lift coefficient CL decreases with increasing bubble
Reynolds number and takes near-zero value at Reb=100. Beyond this value, CL keeps
slightly decreasing and it takes the small negative value, indicating that the lift force on
a rigid sphere acts in the opposite direction of that on a free-slipping bubble. In fact,
similar findings have been obtained in studies of bubbles contaminated with surfactants
(Fukuta et al., 2008; Dijkhuizen et al., 2010b). Our previous studies (Li et al., 2016;
Yuan et al., 2016) also revealed that CL can be negative for small spherical
nanoparticle-coated bubbles.
The Tomiyama correlation (Equation 5.21) (Tomiyama et al., 2002) was
incorporated in the two-fluid model employed in our previous study (Li et al., 2016) to
simulate air-water bubbly flows with nanoparticles. The numerical results were then
compared against the experimental data from Park and Chang (2011). In the
computations a wall-peaked void fraction distribution was yielded despite the factual
centre-peaked distribution observed in the experiments (Figure 5.16(a)). The reason
that led to this difference was found to be the positive lift coefficient with a value of
0.288 obtained by Equation 5.21 where the employed bubble diameter was 3 mm on
average according to the experimental measurements. When a negative value CL= -
0.025 was used in the simulation, a good agreement with the experimental data was
achieved (Figure 5.16(b)).

167
0.0 0.2 0.4 0.6 0.8 1.00.0
0.1
0.2
0.3
0.4
0.5
2
3
4
5
Exp. - air/water
with nanoparticles
TFM, Eq. 5.21
vo
id f
ractio
n
r/R(-)
bubble velocity
bu
bb
el ve
locity (
m/s
)
Exp. - air/water
with nanoparticles
TFM, Eq. 5.21
void fraction(a)
0.0
0.1
0.2
0.3
0.4
0.5
0.0 0.2 0.4 0.6 0.8 1.02
3
4
5
Exp. -air/water
with nanoparticles
TFM, CL= -0.025
vo
id f
ractio
n
bubble velocityvoid fraction
bu
bb
el ve
locity (
m/s
)
Exp. -air/nanofluid
with nanoparticles
TFM, CL=-0.025
(b)
Figure 5. 16: Comparison of predicted flow parameters against experimental data of
bubbly flows containing nanoparticles with: (a) Tomiyama model (Equation 5.21); (b)
CL= -0.025 (Yuan et al., 2017).
Since the void fraction distribution reflects the bubble distribution, this result
indicates that the lift coefficient for small spherical bubbles in nanoparticle-containing
system can be negative and under the action of which these bubbles migrated towards
the pipe centre. The widely accepted Tomiyama correlation (Equation 5.21) is thus not
feasible to nanoparticle-covered bubbles. The positive-to-negative transition of the lift
coefficient occurs at a much smaller critical bubble diameter, as shown in Figure 5.15.
In order to develop a model appropriate for the lift force in nanoparticle-containing
system, two plausible mechanisms that how nanoparticles reverse the direction of the
lift force are analysed in this study.

168
0.04 0.08 0.12 0.16 0.20
-0.1
0.0
0.1
0.2
0.3
0.4
0.5
(CL=0)
lift co
effic
ient
La
CL
CL,p
CL,v
100
101
102
103
-0.2
0.0
0.2
0.4
0.6
0.8
(CL=0)
lift co
effic
ient
Rep
CL
CL,p
CL,v
Figure 5. 17: Contributions of pressure CL,p and viscous stress CL,v to the total lift
coefficient acting on: (a) a contaminated bubble (Fukuta, Takagi et al., 2008); (b) a
rigid sphere (Kurose and Komori, 1999).
Marangoni effect
The lift force acting on a surfactant-contaminated bubble in a linear shear flow was
numerically studied by Fukuta et al. (2008). They found the lift force decreased from
the positive value of a clean bubble to a negative value, when the bubble gradually
became fully contaminated. For the first time, they related this reduction to a
nonaxisymmetric distribution of pressure on the bubble surface which was caused by
the Marangoni effect. As explained by Fukuta et al. (2008), a surface concentration

169
distribution exists along the bubble surface because the surfactant is swept off the from
part and accumulates in the rear part as the bubble rises. Due to this surfactant
accumulation in the rear part, a variation of surface tension along the surface is
developed and this causes a tangential shear stress on the bubble surface. This is known
as Marangoni effect and the tangential shear stress is the so-called Marangoni stress.
Since nanoparticles act in many ways like surfactants (Binks, 2002) and tend to
accumulate in the rear part of a rising bubble, it is reasonable to extrapolate this
Marangoni effect may affect the lift force acting on a nanoparticle-coated bubble in a
similar way. Due to this Marangoni stress, both pressure and viscous stress on the
bubble surface can become asymmetrically distributed. The lift coefficients due to
pressure CL,p and due to viscous stress CL,v (CL= CL,p+CL,v) are thus inevitably changed.
Figure 5.17(a) illustrates that with more surfactants adsorbed on bubble surface
(corresponding to an increase of Langmuir number), the pressure contribution CL,p
decreases dramatically to a negative value. When the bubble is fully coated (maximum
Langmuir number), the viscous stress contribution CL,v becomes dominant, giving the
negative value of the total lift coefficient CL.
In fact, when a bubble is fully covered with nanoparticles and behaves like a rigid
sphere, the lift force acting on this bubble is also influenced by the Reynolds number
Reb (Kurose and Komori, 1999). Shown in Figure 5.17(b) are the contributions of
pressure CL,p and viscous stress CL,v acting on a rigid sphere in a homogeneous linear
shear flow for fluid shear rate α*= 0.2. Both coefficients CL,p and CL,v change their signs
from positive to negative in the range 1≤ Reb ≤100. According to Park and Chang‘s
experiment (2011), the bubble Reynolds number in the bubbly flow was estimated to be
1000. Obviously, the lift coefficient will be negative even for small spherical
nanoparticle-coated bubbles.
Wake effect
As shown in Figure 5.13(c), a slanted wake region induced by the immobile surface
and rotating movement can be found behind the nanoparticle-coated bubble. Since the
size of the wake is generally of the same order as that of the bubble itself, its effect on
body forces cannot be neglected. In the wake region, when a vortex is shed, the space it

170
occupied behind the bubble is replenished by liquid moving more slowly than the
rotational velocity of the vortex (Moraga et al., 1999). A significant velocity reduction
occurs due to the sharp turn made by the incoming fluid to occupy the volume
immediately after the body. As a result, an increase in pressure will be generated by the
decrease in the velocity of the fluid. Therefore, when a vortex is shed, a transient lateral
force on the bubble will arise (Jordan and Fromm, 1972; Alajbegović et al., 1998;
Moraga et al., 1999). Sakamoto and Haniu (1995) discovered that vortices at the higher
relative velocity side always grow faster and larger than those at the lower relative
velocity side. Then the smaller vortices will be engulfed by the larger ones before they
form a separate vortex and detach. In the absence of shedding, the lateral force is thus
always toward the lower relative velocity side, which is opposite to the direction of the
shear-induced lift for a rising bubble in an upward flow. The total lift force on a
nanoparticle-coated bubble is thus expected to be a consequence of two competing
factors: shear and wake effects. The total lift coefficient CL is given by the sum of
shear-induced lift coefficient CLS and wake-induced lift coefficient CLW:
LWL LSC CC (5.22)
Combining the experimental data with numerical data, the total lift coefficient in
turbulent shear flows was correlated by Moraga et al. (1999) in terms of both bubble
Reynolds number Reb and vorticity Reynolds number Reω:
70.17 exp( )
4.2 10
bL
Re ReC
(5.23)
According to Equation 5.23, no wake-induced lift force is expected for Reynolds
numbers below 300 and consequently shear effect should be dominant. As the
Reynolds number increases, wake effect becomes increasingly important and
eventually reverses the sign of the lift coefficient to negative (Figure 5.18).
Actually, no matter Equation 5.21 or Equation 5.23 are both empirical correlations.
As pointed out by Moraga et al. (1999), an accurate determination of the magnitude of
the lift force induced by the wake effect is still very difficult, the main problems being
the complexity of the wake structure and its elusiveness to an analytical treatment.
Therefore, more fundamental and analytical studies are still urgently needed in future.

171
Shear-induced lift force
Wake-inducedlift force
Wake
Liquid velocity distribution
Figure 5. 18: The lift force acting on spherical bubbles in nanoparticle-containing
system.
5.2.3.3 The Drag Force
The drag force is one of the most important forces encountered in bubbly flows, and it
dominantly controls the rise velocity of the bubbles in a vertical flow. It is a result of
the shear and form drag, which are due to viscous surface shear stress and pressure
distribution around the bubble, respectively. According to Ishii and Zuber (1979), when
calculating the drag coefficient CD in Equation 5.17, the bubbly flow behaviours of
pure liquid were categorized into four different regimes: stokes, viscous, distorted and
churn. The stokes (0< Reb <0.2) and viscous (0.2< Reb <1000) regimes are
characterized by the ―undistorted particles‖ where the distortions of the bubbles are
negligible and the drag coefficient CD mainly depends on the bubble velocity and liquid
viscosity. As the bubble diameter increases, the shape of the bubble is gradually
changed from spherical to oblate-ellipsoidal and then spherical cap. A vortex system
will develop behind the bubble, where the vortex departure creates a large wake region.
This process happens in the distorted and churn regimes which are known in literature
as ―distorted particle‖ regimes (1000 < Reb). In these two regimes, the distortion and
irregular motions become pronounced and the drag coefficient CD becomes
proportional to the bubble radius and Reynolds number. Thus a mixture viscosity
model was developed by Ishii and Zuber (1979) to obtain each drag coefficient
correlations for the individual flow regimes. The drag coefficient as calculated is
plotted in terms of the bubble Reynolds number in Figure 5.19.

172
0.75
0.5
240 0.2
24(1 0.1 ) 0.2 1000
21000
3
b
b
D,ishii b b
b
b
ReRe
C Re ReRe
Eo Re
(5.24)
101
102
103
104
0
5
10
15
20
distorted & cap
regime
Ishii-Zuber
dra
g c
oe
ffic
ien
t
Reb
stokes & viscous
regime
Figure 5. 19: The predicted drag coefficient as a function of bubble Reynolds number
with Ishii-Zuber model (Ishii and Zuber, 1979).
Besides the influences of aforementioned bubble‘s radius and Reynolds number,
the surface properties and slip condition also play important roles. It has been well
known the drag coefficient of a solid particle can be almost three times large of the
corresponding drag coefficient of the bubble with the same radius and Reynolds
number. When a clean bubble is contaminated with impurities, these impurities such as
surfactants and nanoparticles can bridge the gap existing between the behaviour of a
clean bubble and a solid particle by immobilizing (at least partly) the bubble surface
(Harper, 1972; Clift et al., 1978; McClure et al., 2014). As a result, the drag force on a
contaminated bubble increases from that of a clean bubble to that of a rigid sphere
(Cuenot et al., 1997). In addition, Tomiyama et al. (1998) believed the aggregation of
impurities can also increase the shear drag by inducing the no-slip condition and
hindering the internal circulation within the bubble (Figure 5.20). With the

173
consideration of this effect, an empirical correlation was proposed to account for the
drag enhancement (Equation 5.25).
0.687max 24(1 0.15 ) / ,8 / 3( 4)D,Tomiyama b bC Re Re Eo Eo (5.25)
Figure 5. 20: The effect of contaminants: (a) ultra-pure liquid with free-slip boundary
condition; (b) slightly contaminated liquid with a limited circulation inside the bubble;
(c) fully contaminated bubble with no-slip boundary condition (Dijkhuizen et al.,
2010a).
Recently, McClure et al. (2015) improved the classic Grace model by multiplying
an empirical constant (ks=1.6~2.2) to include the effects of adsorbed surfactants on the
drag enhancement (McClure et al., 2014):
s
*( )
D,graceDC k C f (5.26)
As nanoparticles are found to behave like general surfactants in many ways such
as adsorbing at the bubble interfaces and changing the slip condition (Binks, 2002), it is
extrapolated that adsorbed nanoparticles might play a similar role in increasing the
shear drag. Following the modified Grace model, our previous study (Yuan et al., 2016)
introduced the same empirical constant ks to the Ishii-Zuber model (Ishii and Zuber,
1979) (Equation 5.24) to account for the influence of nanoparticles and further
expanded its range to ks=1.6~3.0:
s
*
D,ishiiDC k C (5.27)
The numerical results of bubble velocity obtained with the above-mentioned
models showed that accounting for the influence of adsorbed nanoparticles on shear
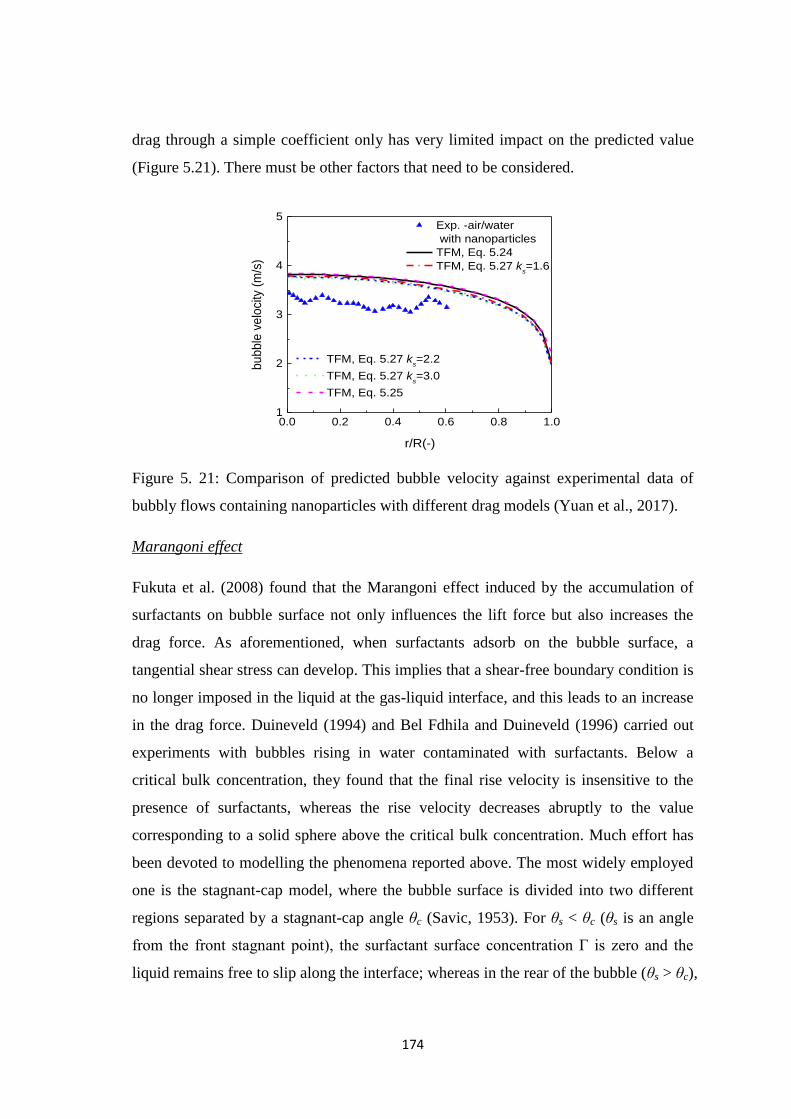
174
drag through a simple coefficient only has very limited impact on the predicted value
(Figure 5.21). There must be other factors that need to be considered.
0.0 0.2 0.4 0.6 0.8 1.01
2
3
4
5
TFM, Eq. 5.27 ks=2.2
TFM, Eq. 5.27 ks=3.0
TFM, Eq. 5.25
r/R(-)
bu
bb
le v
elo
city
(m
/s)
Exp. -air/water
with nanoparticles
TFM, Eq. 5.24
TFM, Eq. 5.27 ks=1.6
Figure 5. 21: Comparison of predicted bubble velocity against experimental data of
bubbly flows containing nanoparticles with different drag models (Yuan et al., 2017).
Marangoni effect
Fukuta et al. (2008) found that the Marangoni effect induced by the accumulation of
surfactants on bubble surface not only influences the lift force but also increases the
drag force. As aforementioned, when surfactants adsorb on the bubble surface, a
tangential shear stress can develop. This implies that a shear-free boundary condition is
no longer imposed in the liquid at the gas-liquid interface, and this leads to an increase
in the drag force. Duineveld (1994) and Bel Fdhila and Duineveld (1996) carried out
experiments with bubbles rising in water contaminated with surfactants. Below a
critical bulk concentration, they found that the final rise velocity is insensitive to the
presence of surfactants, whereas the rise velocity decreases abruptly to the value
corresponding to a solid sphere above the critical bulk concentration. Much effort has
been devoted to modelling the phenomena reported above. The most widely employed
one is the stagnant-cap model, where the bubble surface is divided into two different
regions separated by a stagnant-cap angle ζc (Savic, 1953). For ζs < ζc (ζs is an angle
from the front stagnant point), the surfactant surface concentration Γ is zero and the
liquid remains free to slip along the interface; whereas in the rear of the bubble (ζs > ζc),
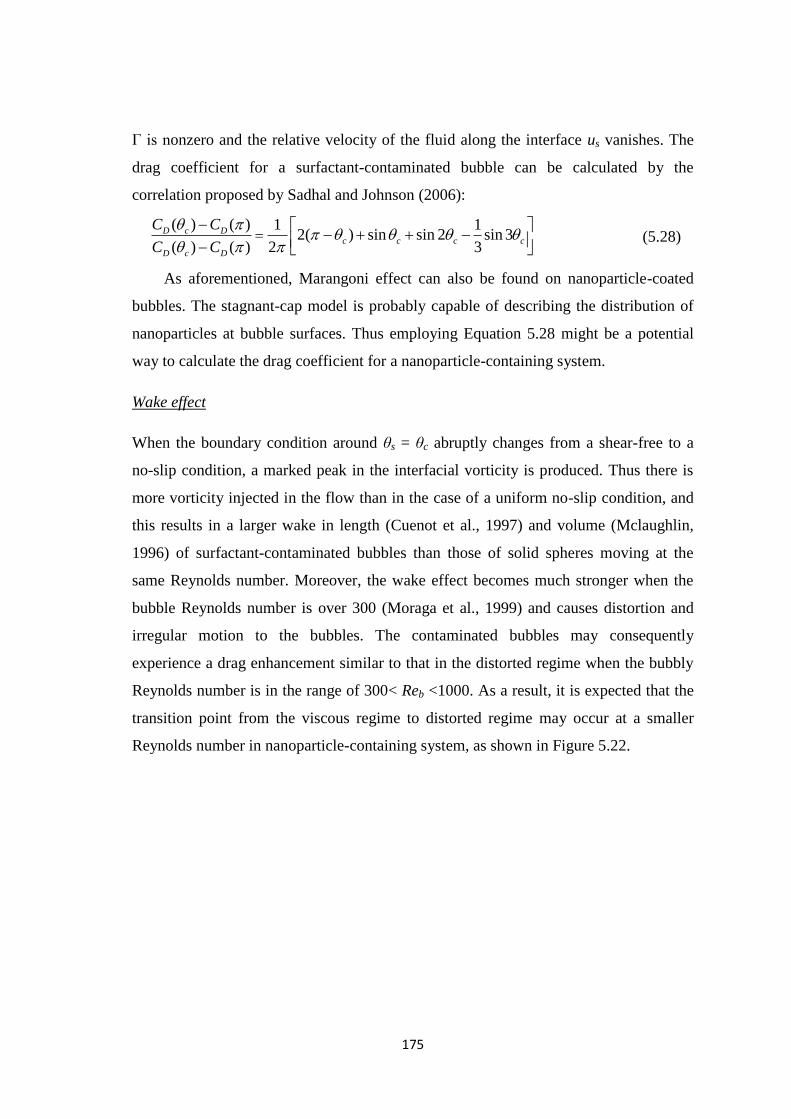
175
Γ is nonzero and the relative velocity of the fluid along the interface us vanishes. The
drag coefficient for a surfactant-contaminated bubble can be calculated by the
correlation proposed by Sadhal and Johnson (2006):
( ) ( ) 1 12( ) sin sin 2 sin 3
( ) ( ) 2 3
D c Dc c c c
D c D
C C
C C
(5.28)
As aforementioned, Marangoni effect can also be found on nanoparticle-coated
bubbles. The stagnant-cap model is probably capable of describing the distribution of
nanoparticles at bubble surfaces. Thus employing Equation 5.28 might be a potential
way to calculate the drag coefficient for a nanoparticle-containing system.
Wake effect
When the boundary condition around ζs = ζc abruptly changes from a shear-free to a
no-slip condition, a marked peak in the interfacial vorticity is produced. Thus there is
more vorticity injected in the flow than in the case of a uniform no-slip condition, and
this results in a larger wake in length (Cuenot et al., 1997) and volume (Mclaughlin,
1996) of surfactant-contaminated bubbles than those of solid spheres moving at the
same Reynolds number. Moreover, the wake effect becomes much stronger when the
bubble Reynolds number is over 300 (Moraga et al., 1999) and causes distortion and
irregular motion to the bubbles. The contaminated bubbles may consequently
experience a drag enhancement similar to that in the distorted regime when the bubbly
Reynolds number is in the range of 300< Reb <1000. As a result, it is expected that the
transition point from the viscous regime to distorted regime may occur at a smaller
Reynolds number in nanoparticle-containing system, as shown in Figure 5.22.

176
101
102
103
104
0
5
10
15
20
Eq. 5.27 ks=3.0
Eq. 5.25
Eq. 5.24
Eq. 5.27 ks=1.6
Eq. 5.27 ks=2.2
distorted & cap
regimed
rag
co
effic
ien
t
Reb
stokes & viscous
regime
Exp
ect
ed tra
nsi
tion p
oin
t
Figure 5. 22: The predicted drag coefficient as a function of bubble Reynolds number
with different drag models (Yuan et al., 2017).
However, due to the lack of experimental data, taking the Marangoni and wake
effects into account to model the drag force is still a challenge. For the stagnant-cap
model, the major difficulty is the determination of the cap angle ζc as a function of
ambient nanoparticle surface concentration. Since the nanoparticles are irreversibly
absorbed, which is contrary to surfactant molecules that can dynamically adsorb to and
desorb from the surface, how to emphasize this difference and substitute a suitable cap
angle still remains a difficult problem.
5.2.4 The Influences of Nanoparticles on Bubble-bubble Interactions
5.2.4.1 Bubble-bubble Interaction
In gas-liquid flows, the effects of coalescence and break-up through the interactions
among bubbles have attracted considerable attention, since they largely influence the
temporal and spatial evolution of the two-phase structure by deciding the bubble size.
Compared to break-up, coalescence was demonstrated dominant in the case of upward
bubbly flows in small-diameter vertical tubes (Li et al., 2010). In view of this, only
bubble coalescence is considered in this study. According to the film drainage model
proposed by Shinnar and Church (1960), bubble coalescence occurs within three steps:
contact, thinning and rupture. Firstly, two bubbles come into contact with each other in

177
the liquid phase, flattening the bubble surfaces against each other and trapping a thin
liquid film between them. The initial thickness h0 of this film is typically 10-4
m
(Kirkpatrick and Lockett, 1974). The first step is controlled by the hydrodynamics of
the bulk liquid phase. Secondly, this intervening liquid film thins to a critical thickness
hf (usually estimated as 10-8
m (Kim and Lee, 1987)) before it ruptures. If this thinning
process takes longer than the bubble contact time, coalescence will not occur. The
second step is controlled by the hydrodynamics of the liquid film. Thirdly, once the
film is sufficiently thin it will rupture via an instability mechanism. This step is very
rapid in comparison to the first two and it is usually not counted in the coalescence time.
Figure 5. 23: Schematic overview of the coalescence process of two bubbles.
According to the film drainage model, not all collisions lead to coalescence. The
concept of collision efficiency λ is introduced to account for the probability of bubble
coalescence:
exp( )drt=
(5.29)
A larger collision efficiency leads to a larger mean bubble diameter and vice versa.
In Park and Chang‘s experiment (2011), the measured bubble diameters were between
2 mm to 5 mm in air-water bubbly flows with nanoparticles, which were much smaller
than those (3 mm to 10 mm) without nanoparticles under the exactly same bubble
injection condition. Since only coalescence mechanism is considered in this study, it is
reasonable to extrapolate the decrease of bubble size in nanoparticle-containing system
is probably due to a reduced coalescence efficiency.
According to Equation 5.29, the coalescence efficiency is determined by the
contact time η and the drainage time tdr (Coulaloglou, 1975). The contact time η is

178
controlled by the external liquid flow and turbulence in the bulk (Chesters, 1991). Since
the concentration of nanoparticles in the bulk flow filed is as low as 0.1 vol% in the
Park and Chang‘s experiments, the nanoparticle-water mixture could be assumed at
near-molecular level and treated as a pseudo-homogenous liquid. Therefore, the
nanoparticles would probably not influence the contact time. The drainage time tdr,
which is the time required for the thinning process, is determined by the internal liquid
flow in the intervening film between the bubbles. Du et al. (2003) experimentally
investigated the stability of bubbles coated with silica particles (primary diameter of 20
nm) and concluded that the adsorbed nanoparticles hindered the water flow at bubble
surface and slowed down film thinning process. Thus the drainage time of the liquid
film in nanoparticle-containing systems might be elongated. Actually this hypothesis is
consistent with the simulation results in our previous parametric study (Yuan et al.,
2016). In this study a correction coefficient kd ranging from 1.0 to 2.0 was added to the
widely used Prince and Blanch (1990) model to calculate the drainage time.
'
dr d drt k t (5.30)
31/2( ) ln
16
b l 0dr
f
r ht
h
(5.31)
When the correction coefficient took the value of kd = 1.02, the model achieved
closer predictions of void fraction with the experiment data, as shown in Figure 5.24.
This indicates that the drainage time is indeed elongated by nanoparticles. With the
purpose of further comparison, the predicted bubble size distribution was depicted in
Figure 5.25. When the coefficient kd increased from 1.0 to 2.0, the largest proportion of
bubbles moved from group 4 (4.5~6 mm) to group 2 (1.5~3.0 mm), which
demonstrated the inverse relationship between the drainage time and bubble diameters.
Although better agreement has been achieved by employing Equation 5.30 in our
previous study, the correction coefficient kd is case sensitive and subject to a number of
factors. In order to develop a mechanistic model, the underlying mechanisms that how
nanoparticles elongate the drainage time have to be thoroughly understood.

179
0.0 0.2 0.4 0.6 0.8 1.00.0
0.1
0.2
0.3
0.4
Exp. air/water with nanoparticles
kd=1.0 k
d=1.1
kd=1.02 k
d=2.0
kd=1.06
vo
id fra
ction
r/R(-)
Figure 5. 24: Comparison of predicted void fraction against experimental data of the
bubbly flows containing nanoparticles (Yuan et al., 2016).
0 3 6 9 12 150.0
0.1
0.2
0.3
0.4
0.5
0.6 k
d=1.0
kd=1.02
kd=1.06
Bu
bb
le s
ize
fra
ctio
n
bubble diameter (mm)
kd=1.1
kd=2.0
Figure 5. 25: Comparison of predicted bubble size fraction when kd takes the value of
kd=1.0-2.0 (Yuan et al., 2016).
5.2.4.2 Thinning Process
As aforementioned the drainage time is determined by the thinning of the liquid film.
According to Oolman and Blanch (1986), this thinning process of a clean liquid film in
pure liquid is predominantly driven by the capillary pressure induced by the variations
in the curvature of gas-liquid interface. The interface is very close to flat at the centre
of the film and the pressure at that point equals to the pressure inside the bubble.
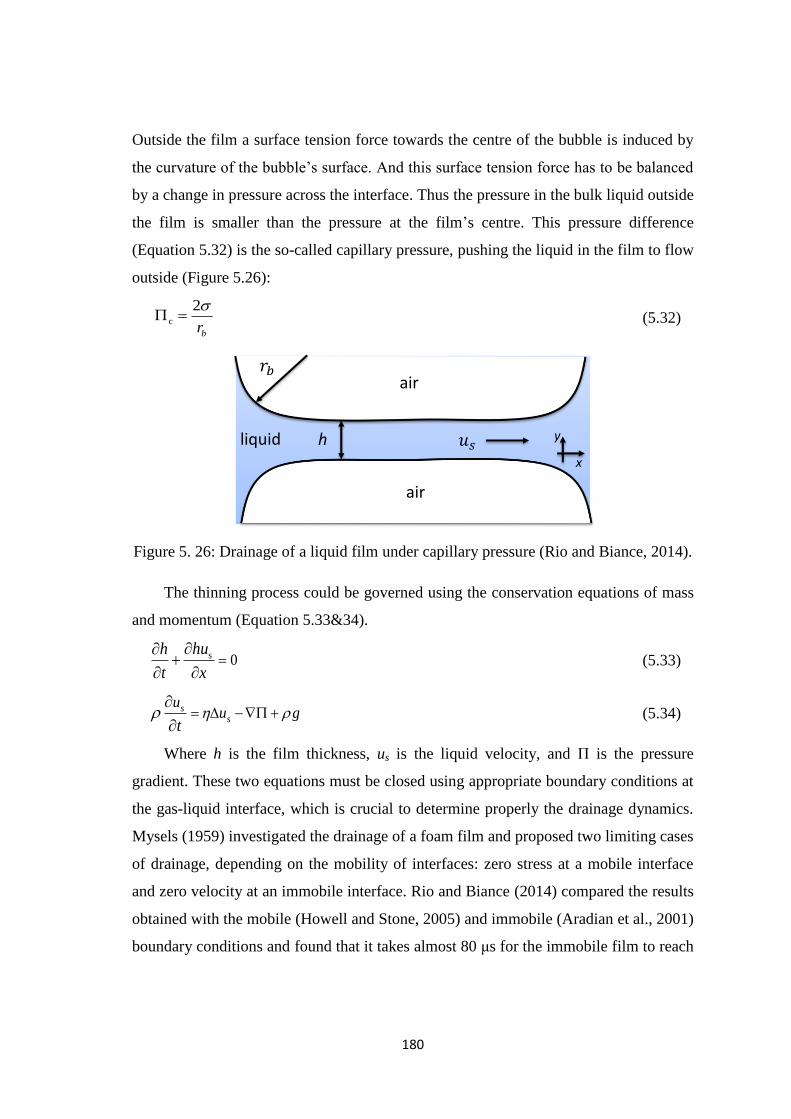
180
Outside the film a surface tension force towards the centre of the bubble is induced by
the curvature of the bubble‘s surface. And this surface tension force has to be balanced
by a change in pressure across the interface. Thus the pressure in the bulk liquid outside
the film is smaller than the pressure at the film‘s centre. This pressure difference
(Equation 5.32) is the so-called capillary pressure, pushing the liquid in the film to flow
outside (Figure 5.26):
c
2
br
(5.32)
h
air
air
liquidx
y
Figure 5. 26: Drainage of a liquid film under capillary pressure (Rio and Biance, 2014).
The thinning process could be governed using the conservation equations of mass
and momentum (Equation 5.33&34).
s 0huh
t x
(5.33)
ss
uu g
t
(5.34)
Where h is the film thickness, us is the liquid velocity, and Π is the pressure
gradient. These two equations must be closed using appropriate boundary conditions at
the gas-liquid interface, which is crucial to determine properly the drainage dynamics.
Mysels (1959) investigated the drainage of a foam film and proposed two limiting cases
of drainage, depending on the mobility of interfaces: zero stress at a mobile interface
and zero velocity at an immobile interface. Rio and Biance (2014) compared the results
obtained with the mobile (Howell and Stone, 2005) and immobile (Aradian et al., 2001)
boundary conditions and found that it takes almost 80 μs for the immobile film to reach

181
10-8
m from 10-6
m, whereas it needs only 0.7 μs in the mobile case. This indicates that
the immobility of the interface can significantly increase the film drainage time.
Surface mobility and rigidity
A number of experimental and numerical studies have demonstrated the adsorbed
nanoparticles can restrict the mobility of bubble interface. Lin and Slattery (1982)
developed a theoretical model for the thinning of the liquid film which forms as a
bubble approaches an interface. They found that very small surface tension gradients
are sufficient to immobilize the interface. Worthen et al. (2013) further suggested the
addition of nanoparticles could increase the effective viscosity of the injected gas in the
liquid and thereby reduce the bubble mobility. It is thus reasonable to extrapolate that
restricting the mobility of the bubble surface through nanoparticle adsorption might be
one of the possible mechanisms responsible for the elongated drainage time.
With the consideration of this effect, the Equation 5.31, which was proposed by
Prince and Blanch under the assumption that the bubble surface is fully mobile and
zero-stress (Figure 5.27(a)), is no longer feasible in nanoparticle-containing system.
When nanoparticles gradually assemble at the interface and partially cover the bubble
(Figure 5.27(b)), the liquid flow becomes quasi-steady creeping. Chesters (1991)
defined the drainage time for partially mobile interfaces:
1/2
3/2
1 1( )
2(2 / )
g
dr
b f 0
Ft
r h h
(5.35)
Figure 5. 27: The velocity profile of the liquid in the film with: (a) fully mobile
interfaces; (b) partially mobile interface; (c) fully immobile interfaces (Liao and Lucas,
2010).

182
When bubbles are fully covered with nanoparticles, their surfaces become fully
immobile. According to Marrucci (1969), the viscous effects, instead of the inertial
effects, dominantly controlled the film thinning process. The liquid is expelled from
between these immobile surfaces by a laminar flow. As illustrated in Figure 5.27(c), the
velocity profile in the film becomes parabolic with no slip at the surface. Considering
the fully restricted mobility, Chesters (1991) derived the drainage time:
2
2 2 2
3 1 1( )
16
ldr b
f 0
Ft r
h h
(5.36)
Since the total film drainage time is predicted to be tens and even hundreds times
longer for immobile surfaces than mobiles surfaces, prediction of the transition from
very rapid to very slow coalescence becomes an important issue. Marrucci (1969)
related this transition to the particle concentration c and proposed a model for the
critical concentration:
' 2 1/3 2
H0.084 ( A / ) ( / )t bc RT r c (5.37)
where AH is the Hamaker constant and R’ is the ideal gas constant. The above analysis
is based on the parallel model which assumes that the surfaces of coalescing bubbles
deform into two parallel discs (Figure 5.28(a)). Actually, when nanoparticles fully
cover the bubble, their surfaces can be slightly deformed and behave as nearly rigid
spherical particles (Figure 5.28(b)). For two non-deformable spheres, the drainage time
is defined as (Chesters, 1991):
23ln
2
l 0dr b
f
ht r
F h
(5.38)
However, it should be noted that the assumption of a non-deformable figure is
only reasonable for small bubbles. In most applications where large bubbles exist, the
deformation of bubble surface during the collision has to be considered even with
contaminants like nanoparticles. Therefore, the aforementioned parallel model is still
feasible for nanoparticle-coated bubbles.

183
Figure 5. 28: The geometry of the liquid film: (a) deformable surfaces; (b) non-
deformable surfaces (Liao and Lucas, 2010).
Pressures
Another factor influencing the thinning process is the pressing force that brings two
bubbles to coalescence. This pressing force is usually described as the capillary
pressure between the bubbles and the inter-film fluid. When nanoparticles with a zero
contact angle that are completely resting in the liquid film, lie between the two bubbles
(Figure 5.29), the capillary pressure is changed.
air
liquidh
air
Figure 5. 29: Schematic overview of the liquid film with particles residing in (Hunter et
al., 2008).
As drainage occurs, the bubbles form a meniscus around the particle. The
curvature of the meniscus induces a net surface tension force towards the centre of the
bubble which has to be balanced by a change in pressure. The pressure at the centre of
the film with nanoparticles is no longer equal to the pressure inside the bubble but
becomes much smaller. As a result, the capillary pressure for bubbles with

184
nanoparticles is much smaller than the capillary pressure for bubbles without
nanoparticles. can be expressed as:
* 2(1 )b
c
b m
r
r r
(5.39)
where rm is the curvature radius of the meniscus. With a smaller capillary pressure, a
slower thinning process will happen, which leads to a longer drainage time. As shown
in Equation 5.39, not only the curvature of the meniscus can affect the capillary
pressure, but the surface tension ζ plays an important role. In a number of studies,
nanoparticles have been demonstrated to be effective in lowering the surface tension of
interfaces (Böker et al., 2007). During the thinning process, the surface area increases
whereas the surface concentration of adsorbed nanoparticles decreases. Since surface
tension is an inverse function of nanoparticles‘ concentration, a surface tension gradient
can develop along the bubble surface. According to Oolman and Blanch (1986), the
change of surface tension ζ due to the existence of impurities like nanoparticles can be
expressed as:
21 2( )( )
'
c
h R T c
(5.40)
It is thus important to take the change of surface tension into account when
calculating the capillary pressure in nanoparticle-containing system.
For pure liquid, it is true that the capillary pressure is the only pressure acting on
the liquid film. But Oolman and Blanch (1986) found that when a second component
exists in the liquid, other pressures resisting the film thinning can develop. These
pressures include the electrostatic double layer force and steric repulsion force.
Langevin (2015) pointed out that these disjoining pressures are mainly responsible for
stabilizing foams after conducting a mechanistic analysis.
In fact, for nanoparticles with ionisable surface groups (e.g. latex or silica), the
part of the particle immersed in the aqueous phase will become charged (Figure 5.30).
Thus an electrostatic double layer can be established. Sagert and Quinn (1978)
investigated the effect of electrostatic forces on thinning process and they believed that
this repulsive force can balance the capillary pressure and cause the film thinning to

185
stop at an equilibrium film thickness. The equation of electrostatic double layer force is
given by (Bhattacharjee et al., 1998):
2 2(64 / )exp( )e B bk Tr h (5.41)
where ρ∞, γ, and κ represent the density of electric charge in the bulk solution, reduced
surface potential and Debye screening length, respectively.
air
Electrostatic double layer force
air
++++
++
++++ ++
++
++
++++++
++++
++
++++
++++
+- +-
+-+-
+-+-
+-
+-+-
+-+-
+-+-
+-
++++
++
++++ ++
++
++
++++++
++++ ++
++++
++++
+- +-
+-+-
+-+-
+-
+-+-
+-+-
+-+-
+-
Figure 5. 30: Electrostatic double layer force between two nanoparticle-adsorbed
bubble interfaces.
In addition to electrostatic force, Samanta and Ghosh (2011) believed that the
reduced bubble coalescence in contaminated systems is mainly due to the steric force
imparted by the adsorption of amphiphilic contaminants at gas-liquid interfaces. The
adsorbed layer encounters a reduction in entropy when confined in a very small space
as the bubble approaches to each other. Since the reduction in entropy is
thermodynamically unfavourable, their approach is thus inhibited. According to Böker
et al. (2007), some nanoparticles such as Janus-particles like polymers have two surface
regions: polar surface region and apolar surface region. These nanoparticles are surface
active and amphiphilic (Böker et al., 2007). It is reasonable to extrapolate that when
two bubbles approach to each other, similarly to the polymeric surfactant, the hydrated
head groups of adsorbed nanoparticles will be overlapped, generating a steric repulsion
force. This force could be calculated by (Samanta and Ghosh, 2011):
9/4 3/4
3
2[( ) ( ) ]
2
Bs
k T L
s L
(5.42)
where δ, L and s represent the separation between the surfaces, the thickness of the
polymer layer, the mean distance between the attachment points. As the drainage
occurs, the above-mentioned disjoining pressures withstand the capillary pressure. The

186
pressure gradient Π in Equation 5.34 thus decreases, slowing down the liquid flow in
the film and elongating the drainage time.
Langevin (2015) further found that with the thinning of the liquid film, the
disjoining pressures can also affect the equilibrium thickness of the liquid film. In the
absence of nanoparticles and the induced disjoining pressures, the capillary pressure
drains the liquid film to the critical thickness hf and film surface waves rupture the film
rapidly. Therefore, in pure liquid the film rupture time is much smaller than the
drainage time and usually not counted in the coalescence time. With the existence of
nanoparticles, the disjoining pressure can equilibrate the capillary pressure at a
thickness larger than the critical thickness hf. When this happens, the rupture of the film
might become not that rapid and the rupture time even can be comparable to the
drainage time. If the coalescence time, which includes the drainage time and rupture
time, is longer than the bubble contact time, coalescence will still not occur. Therefore,
the effects of nanoparticles on the rupture process have to be fully understood as well.
5.2.4.3 Rupture Process
It has been proposed in the literature that the growth of thermodynamic instability of
the liquid film is the main factor that leads to the film rupture (Vrij, 1964). These
instabilities are caused by the thermal fluctuations which can corrugate a deformable
interface. Initial amplitude of surface wave at a single interface is very small,
approximately 10-10
~5×10⁻¹⁰
m (Valkovska et al., 2002). While thinning, the amplitude
of the surface waves keeps growing. Once the wave amplitude reaches to the critical
film thickness hf, the film will rupture and the two bubbles start to coalesce.
Thermal corrugations of the interface of thin liquid films were first observed
through light-scattering experiments (Figure 5.31(a)) (Vrij, 1964). These fluctuations
are inhibited by surface tension but enhanced by Van der Waals attractive interactions
between both sides of the film. Then taking into account both effects, Vrij and
Overbeek (1968) determined the critical wavelength Λc of the thermal fluctuations that
are amplified by the follow expression:
4
H
2A
c
h (5.43)

187
The rupture time, which is the time required for a surface wave to develop to the
critical film thickness hf, is calculated as:
2 2 5
H10 96 Arp l ft h (5.44)
where trp is estimated to be 330 ms for hf=10-8
m when the Hamaker constant AH is 10-
20 J. This rupture time increases with the film thickness h. As aforementioned, when the
equilibrium thickness is larger than 10-8
m due to the nanoparticle-induced disjoining
pressures, the rupture time will be elongated and possibly become comparable to the
drainage time. In addition to the influences of disjoining pressures, Rio and Biance
(2014) proposed that the presence of impurities can also limit the film rupture by the
following two mechanisms: damping the fluctuations and providing an energy barrier.
Fluctuation damping
h
h
Figure 5. 31: Corrugations of bubble interfaces: (a) Without the adsorption of
nanoparticles; (b) With the adsorption of nanoparticles (Rio and Biance, 2014).
Bergeron (1997) experimentally investigated the influences of surfactants on the liquid
film stability via the Wilhelmy method using a rectangular ―open-frame‖ probe and the
porous plate technique. He found the energetic cost associated with thermal fluctuation
is increased by the elasticity of the surfactant layer at the gas-liquid interface. This
effect tends to decrease the probability of spatial fluctuations. Blute et al. (2007) found
silica nanoparticles (5~40 nm) and surfactants have similar effects on increasing the
surface elasticity. When the interface is gradually adsorbed by nanoparticles and
become rigid, the surface elasticity can exceed the surface tension and reduce the
probability of expansion of a fluctuation (Figure 5.31(b)). According to Rio and Biance
188
(Rio and Biance, 2014), this effect, which is named Gibbs-Maragoni effect, is the
common mechanism describing how the presence of impurities can reduce the rupture
and increase the stability of the liquid film.
Energy barrier
Through a theoretical analysis of the nucleation a of a hole in the thin liquid film,
Wennerström et al. (1997) found the large curvature energy (a part of surface free
energy) of interfaces covered by surfactants also helps stabilizing the thin liquid films.
The nucleation of a hole in a thin film is associated with a large curvature, which has an
energetic cost that increases the energetic barrier to overcome for rupture (Rio and
Biance, 2014). This energy is larger when the surfactants are attached to the interface.
Similar explanations could also be found in Timothy et al.‘s study (Hunter et al., 2008)
where the role of particles in stabilising foams was investigated. It was presented that in
the rupture stage an energy barrier must be overcome to form a critical sized hole in the
liquid film. Thus the stability of the film can be considered in line with the energy
required for the hole formation. Because of the high free energies involved with
strongly adsorbed particles, they are far more likely to be laterally moved along the
contact interface, rather than expulsed into the open liquid. Thus the hole formation and
expansion with the existence of nanoparticles can be much more difficult, which
consequently elongates the film rupture time.
When the film rupture time in nanoparticle-containing system is sufficiently long
and becomes comparable to the film drainage time, it should be incorporated in
Equation 5.29 to calculate the coalescence efficiency. However, the real situation is
very complicated. As pointed out by Rio and Biance (2014), the film rupture even can
be stochastic, if the drainage time is smaller than the time necessary to develop an
instability. In view of the fact that all of the above-mentioned mechanisms are closely
related to the nanoparticle layer at the bubble interface, more details of the structure of
this layer are needed. In recent years, it was found that different orientation and
packing structures of nanoparticles can be generated by controlling the nanoparticle
aspect ratio, surface properties, concentration and solvent evaporation rates (Böker, He
et al., 2007). Moreover, for nonspherical particles, their shape also plays an important

189
role. For instance, rodlike particles achieve an end-to-end registry of particle faces
(Lewandowski et al., 2009), whereas charged ellipsoids can assemble into complex
triangular lattices (Madivala et al., 2009). All of these influencing factors may
indirectly but profoundly affect the interactions of bubble-liquid and bubble-bubble by
creating various structures of nanoparticle layer at bubble interfaces. Further studies are
still urgently needed in this area.
5.2.5 Summary
A comprehensive literature review was conducted, which demonstrated that the
modification of flow structures is closely related to the changes of bubble-liquid and
bubble-bubble interactions induced by the spontaneous nanoparticle adsorption on the
bubble surface. The adsorbed nanoparticles make a bubble behave somewhere between
a clean bubble and a solid particle. As a result, flow separation occurs and a slanted
wake region forms behind the nanoparticle-adsorbed bubble at a small Reynolds
number. Both pressure and viscous stress on the bubble interface become
asymmetrically distributed due to the nanoparticle surface concentration. In addition,
the interactions between nanoparticles such as electrostatic double layer force and steric
repulsion force can not only resist the approach of two bubbles, but also hinder the
fluctuation of the liquid film. With all of the above changes, the following four results
are obtained:
(1) The lift force acting on a nanoparticle-coated bubble reverses its direction at a
smaller bubble diameter.
(2) The drag force increases and enters the distorted regime at a smaller bubble
Reynolds number.
(3) The thinning process of the liquid film slows down and consequently the film
drainage time is elongated.
(4) The liquid film is less likely to rupture and the rupture time becomes
comparable to the drainage time.
It was, therefore, concluded that the key task when modelling the bubbly flows
containing nanoparticles is to formulate the lift force, drag force and film drainage time
and rupture time.

190
Chapter 6
Conclusions
Since nanofluids were proposed and named for the first time by Choi and Eastman
(1995), an increasing number of experiments on nanofluids‘ properties and
performances have been conducted. Compared with those of pure liquids, dilute
nanofluids present similar thermo-physical properties but their bubbly flows exhibit
dramatically changed bubble characteristics and significantly improved heat transfer
performances. However, there remain two major gaps which hinder the further industry
application of nanofluids. Because of the inherent complexity, accurate description of
the boiling heat transfer and efficient prediction of the heat transfer coefficient (HTC)
are still difficult. An in-depth understanding of the heated surface characteristics and
bubble hydrodynamics in the near-wall region for both pool and flow boiling of
nanofluids is urgently needed. Besides the lack of insight into the heat transfer in
nanofluids, the absence of study in two-phase flow structures of their bubbly flows is
another gap that needs to be filled, especially for flow boiling. Recently, with the
development of computer technology and computation algorithm, Computational Fluid
Dynamics (CFD) provides an alternative method to bridge these two gaps.
With the help of CFD, a parametric study of the heat flux partitioning (HFP)
model for nucleate boiling of nanofluids was conducted in this study. It was found the
surface modifications induced by nanoparticle deposition which were not observed in
nucleate boiling of pure liquids is the main cause of the dramatic change of bubble
191
nucleation characteristics and heat transfer performance. The surface wettability
enhancement induced by nanoparticle deposition, among the other parameters had the
most significant effect on bubble nucleation on the nanoparticle-deposited heater
surface. Therefore, in this thesis new closure correlations were incorporated to
characterize the surface modifications and their effects on bubble nucleation and
departure when modeling nucleate boiling of nanofluids. A more feasible and
mechanistic approach than the classic Rohsenow correlation to predict nucleate boiling
of nanofluids was also provided. The HFP model was further improved by containing
an additional HFP component that accounts for the heat transfer by the nanoparticle
Brownian motion in the microlayer. Due to the continuously increased nanopaprticle
concentration in the microalyer, heat transfer by the Brownian motion of nanoparticles
in the microlayer becomes an important mechanism of heat removal from the heater
surfaces boiling in nanofluids. Numerical computations were then conducted using both
the new and classic HFP models. The numerical results were analyzed and compared
against the experimental data available in the literature. The new HFP model achieved
a better agreement with the experimental data than the classic HFP model, especially
when the applied heat flux is high. This indicates that the active site density available
on the heater surface plays a crucial role in determining the significance of nanoparticle
Brownian motion. For dilute nanofluids, the heat transfer due to nanoparticle Brownian
motion is positively affected by the bulk concentration and negatively influenced by the
nanoparticle size. An increased bulk concentration or a decreased nanoparticle size
would enhance the significance of nanoparticle Brownian motion in heat removal.
Comparatively, the nanoparticle material does not have much impact on the heat
transfer due to the nanoparticle Brownian motion.
In this thesis, the flow structures of bubbly flows of air-water and air-nanolfuid
were also numerically investigated using the two-fluid model and the MUSIG model,
respectively. Comparison of the numerical results against the experimental data
available in the literature revealed that the both the above two models agreed well with
the experimental data of air-water bubbly flows, but needed substantial improvement in
order to achieve an effective modelling of air-nanofluid bubbly flows. The effects of
nanoparticles on the interfacial behaviours and interphase transport mechanisms were

192
analysed based on the experimental observations in the literature. Although the addition
of a small amount of nanoparticles into the base liquid does not cause measurable
changes in the liquid properties, the spontaneous nanoparticle adsorption at the
interface could significantly change the interfacial behaviours of the air bubbles. This
was supposed to be the major reason responsible for the distinctly changed two-phase
flow characteristics (e.g., smaller bubble size) of air-nanofluid bubbly flows than those
of air-water flows. The spontaneous assembly of nanoparticles at the bubble interface
significantly changes the interface rigidity and mobility. As a result, the interfacial drag
force is increased and the role of lift force with increasing bubble size is modified. It
was proven that the positive-to-negative reversal of the lift force occurs at a smaller
bubble size in nanofluids compared to that in pure water. The layer of nanoparticles at
the bubble surface hinders bubble coalescence by forming a physical barrier and
restricting the mobility of the surface. The thinning process of the liquid film trapped
between two colliding bubbles slows down, resulting in a longer bubble drainage time.
However, the mechanisms responsible for the elongated drainage time are still yet to be
uncovered. As the governing equations are still applicable to nanofluids, the most
important task when modelling air-nanofluid bubbly flows using the two-fluid model is
to formulate the interphase transport terms in order to take into account the specific
features induced by the existence of particles.
In the last section of this thesis, the effects of nanoparticle adsorption at bubble
interfaces on the two-phase flow behaviours were analysed mechanistically. Due to the
adsorption of nanoparticles at bubble interfaces, the slip conditions and properties of
the bubble interfaces are significantly changed. The internal circulation is suppressed,
leading to an increased shear drag. Moreover, when a bubble is covered with
nanoparticles, it would partially behave like a rigid sphere and develop a rotation
movement. As a result, flow separation occurs and a slanted wake region forms behind
the nanoparticle-adsorbed bubble at a small Reynolds number. This slanted wake
would generate a lateral force pointing towards the pipe centre and consequently make
the positive-to-negative reversion of the lift force occur at a much smaller bubble
diameter. The slanted wake would also make bubbles in the viscous regime experience
a drag force similar to that in the distorted regime, which causes the viscous-to-

193
distorted transition point to occur at a smaller bubble Reynolds number. Meanwhile,
both pressure and viscous stress on the bubble interface become asymmetrically
distributed due to the nanoparticle surface concentration. In addition, the interactions
between nanoparticles such as electrostatic double layer force and steric repulsion force
can not only resist the approach of two bubbles, but also hinder the fluctuation of the
liquid film. The wake significantly alters the role of lift force and drag force. It is
crucial to reformulate the interfacial forces when modelling nanofluid bubbly flows
using the two-fluid model. The thinning process of the liquid film slows down and
consequently the film drainage time is elongated. The liquid film is less likely to
rupture and the rupture time becomes comparable to the drainage time.
However, theoretical modelling of bubbly systems of nanoparticle-liquid mixtures
remains very challenging due to the difficulties in formulating the modified bubble
behaviours induced by the adsorbed nanoparticles. Traditional two-phase flow theories
seem to have encountered a bottleneck. Alternatively, particle-based methods such as
molecular dynamics, Brownian dynamics, dissipative particle dynamics and Mente
Carlo simulations may be capable of achieving an insight into the embedded physics
and generating promising closure models for the two-phase flow models.

194
Bibliography
Abdel-Fattah, A. I. and El-Genk, M. S. (1998). Sorption of hydrophobic, negatively charged
microspheres onto a stagnant air water interface. Journal of Colloid Interface Science, 202(2):
417-429.
Abkarian, M., Subramaniam, A. B., Kim, S. H., Larsen, R. J., Yang, S. M. and Stone, H. A.
(2007). Dissolution arrest and stability of particle-covered bubbles. Physical Review Letters,
99(18): 188301.
Ahmed, O. and Hamed, M. S. (2012). Experimental investigation of the effect of particle
deposition on pool boiling of nanofluids. International Journal of Heat and Mass Transfer,
55(13-14): 3423-3436.
Akbari, M., Galanis, N. and Behzadmehr, A. (2011). Comparative analysis of single and two-
phase models for CFD studies of nanofluid heat transfer. International Journal of Thermal
Sciences, 50(8): 1343-1354.
Alajbegović, A., Basara, B., Moraga, F. J. and Bonetto, F. J. (1998). The lift force on a cylinder
in a high Reynolds number shear flow. International Conference of Multiphase Flow. Lyon,
France: Paper No. 304.
Ansys, I. (2011). ANSYS CFX-Solver Theory Guide. Canonsburg, PA 15317, Southpointe.
Antal, S. P., JR, R. T. L. and Flaherty, J. E. (1991). Analysis of phase distribution in fully
developed laminar bubbly two-phase flow. International Journal of Multiphase Flow, 17(5):
635-652.
Aradian, A., Raphael, E. and De Gennes, P.-G. (2001). ―Marginal pinching‖ in soap films. EPL
(Europhysics Letters), 55(6): 834.
Ariga, K., Lvov, Y. M., Kawakami, K., Ji, Q. M. and Hill, J. P. (2011). Layer-by-layer self-
assembled shells for drug delivery. Advanced Drug Delivery Reviews, 63(9): 762-771.
Atmane, M. A. and Murray, D. B. (2005). The effect of the liquid motion induced by air and
vapor bubbles on heat transfer around a cylinder. International Journal of Heat and Mass
Transfer, 48(6): 1084-1095.
Auton, T. (1987). The lift force on a spherical body in a rotational flow. Journal of fluid
Mechanics, 183: 199-218.
Aveyard, R., Binks, B. P. and Clint, J. H. (2003). Emulsions stabilised solely by colloidal
particles. Advances in Colloid and Interface Science, 100-102: 503-546.
Bagchi, P. and Balachandar, S. (2002). Effect of free rotation on the motion of a solid sphere in
linear shear flow at moderate Re. Physics of Fluids, 14(8): 2719.
Bang, I. C. and Heung Chang, S. (2005). Boiling heat transfer performance and phenomena of
Al2O3–water nano-fluids from a plain surface in a pool. International Journal of Heat and
Mass Transfer, 48(12): 2407-2419.

195
Bankoff, S. (1958). Entrapment of gas in the spreading of a liquid over a rough surface. AIChE
journal, 4(1): 24-26.
Barber, J., Brutin, D. and Tadrist, L. (2011). A review on boiling heat transfer enhancement
with nanofluids. Nanoscale Research Letters, 6(1): 280.
Basu, N., Warrier, G. R. and Dhir, V. K. (2002). Onset of nucleate boiling and active
nucleation site density during subcooled flow boiling. Journal of heat transfer, 124(4): 717-
728.
Bel Fdhila, R. and Duineveld, P. C. (1996). The effect of surfactant on the rise of a spherical
bubble at high Reynolds and Peclet numbers. Physics of Fluids, 8(2): 310.
Benjamin, R. and Balakrishnan, A. Nucleation Site Density in Pool Boiling of Saturated Pure
Liquids Effect of surface Microroughness and Surface and liquid Physical Properties.
Bergeron, V. (1997). Disjoining pressures and film stability of alkyltrimethylammonium
bromide foam films. Langmuir, 13(13): 3474-3482.
Bhattacharjee, S., Elimelech, M. and Borkovec, M. (1998). DLVO interaction between
colloidal particles: Beyond Derjaguin‘s approximation. Croatica Chemica Acta, 71(4): 883-
903.
Binks, B. P. (2002). Particles as surfactants – similarities and differences. Current Opinion in
Colloid & Interface Science, 7: 21-41.
Binks, B. P. and Horozov, T. S. (2005). Aqueous Foams Stabilized Solely by Silica
Nanoparticles. Angewandte Chemie, 117(24): 3788-3791.
Blute, I., Pugh, R. J., van de Pas, J. and Callaghan, I. (2007). Silica nanoparticle sols 1. Surface
chemical characterization and evaluation of the foam generation (foamability). Journal of
Colloid Interface Science, 313(2): 645-655.
Blute, I., Pugh, R. J., van de Pas, J. and Callaghan, I. (2009). Silica nanoparticle sols. Part 3:
Monitoring the state of agglomeration at the air/water interface using the Langmuir-Blodgett
technique. Journal of Colloid Interface Science, 336(2): 584-591.
Böker, A., He, J., Emrick, T. and Russell, T. P. (2007). Self-assembly of nanoparticles at
interfaces. Soft Matter, 3(10): 1231.
Bowring, R. (1962). Physical model, based on bubble detachment, and calculation of steam
voidage in the subcooled region of a heated channel, Norway. Institutt for Atomenergi. OECD
Halden Reaktor Prosjekt.
Brenner, H. (2013). Interfacial transport processes and rheology, Elsevier.
Buongiorno, J. (2006). Convective transport in nanofluids. Journal of Heat Transfer-
Transactions of the Asme, 128(3): 240-250.
Buongiorno, J. and Hu, L.-w. (2009). Nanofluid Heat Transfer Enhancement for Nuclear
Reactor Applications. 517-522.

196
Buongiorno, J., Hu, L.-W., Kim, S. J., Hannink, R., Truong, B. and Forrest, E. (2008).
Nanofluids for enhanced economics and safety of nuclear reactors: an evaluation of the
potential features, issues, and research gaps. Nuclear Technology, 162(1): 80-91.
Buongiorno, J., Hu, L. W., Apostolakis, G., Hannink, R., Lucas, T. and Chupin, A. (2009). A
feasibility assessment of the use of nanofluids to enhance the in-vessel retention capability in
light-water reactors. Nuclear Engineering and Design, 239(5): 941-948.
Wang, C. H. and Dhir, V. K. (1993). Effect of Surface Wettability on Active Nucleation Site
Density During Pool Boiling of Water on a Vertical Surface. Jornal of Heat Transfer.
Chandrasekar, M., Suresh, S. and Senthilkumar, T. (2012). Mechanisms proposed through
experimental investigations on thermophysical properties and forced convective heat transfer
characteristics of various nanofluids – A review. Renewable and Sustainable Energy Reviews,
16(6): 3917-3938.
Chen, Z. and Utaka, Y. (2015). On heat transfer and evaporation characteristics in the growth
process of a bubble with microlayer structure during nucleate boiling. International Journal of
Heat and Mass Transfer, 81: 750-759.
Cheng, L. X., Bandarra, E. P. and Thome, J. R. (2008). Nanofluid Two-Phase Flow and
Thermal Physics: A New Research Frontier of Nanotechnology and Its Challenges. Journal of
Nanoscience and Nanotechnology, 8(7): 3315-3332.
Chesters, A. K. (1991). The modelling of coalescence processes in fluid-liquid dispersions: a
review of current understanding. Chemical engineering research & design, 69(A4): 259-270.
Cheung, S. C. P., Yeoh, G. H. and Tu, J. Y. (2007). On the numerical study of isothermal
vertical bubbly flow using two population balance approaches. Chemical Engineering Science,
62(17): 4659-4674.
Choi, S. U. S. and Eastman, J. A. (1995). Enhancing thermal conductivity of fluids with
nanoparticles. ASME, Fluid Engineering Division, 231: 99-105.
Chon, C. H., Kihm, K. D., Lee, S. P. and Choi, S. U. (2005). Empirical correlation finding the
role of temperature and particle size for nanofluid (Al 2 O 3) thermal conductivity enhancement.
Applied Physics Letters, 87(15): 153107.
Chopkar, M., Das, A. K., Manna, I. and Das, P. K. (2008). Pool boiling heat transfer
characteristics of ZrO2-water nanofluids from a flat surface in a pool. Heat and Mass Transfer,
44(8): 999-1004.
Clift, R., Grace, J. R. and Weber, M. E. (1978). Bubbles, Drops and Particles. New York,
U.S.A., Academic Press.
Cole, R. (1960). A photographic study of pool boiling in the region of the critical heat flux.
AIChE Journal, 6(4): 533-538.
Corcione, M., Cianfrini, M. and Quintino, A. (2012). Heat transfer of nanofluids in turbulent
pipe flow. International Journal of Thermal Sciences, 56: 58-69.
Coulaloglou, C. A. (1975). Dispersed phase interactions in an agitated flow vessel. PhD thesis,
Illinois Insititute of Technology.
197
Coursey, J. S. and Kim, J. (2008). Nanofluid boiling: The effect of surface wettability.
International Journal of Heat and Fluid Flow, 29(6): 1577-1585.
Cuenot, B., Magnaudet, J. and Spennato, B. (1997). The effects of slightly soluble surfactants
on the flow around a spherical bubble. Journal of Fluid Mechanics, 339: 25-53.
Das, S. K., Prakash Narayan, G. and Baby, A. K. (2008). Survey on nucleate pool boiling of
nanofluids: the effect of particle size relative to roughness. Journal of Nanoparticle Research,
10(7): 1099-1108.
Das, S. K., Putra, N. and Roetzel, W. (2003a). Pool boiling characteristics of nano-fluids.
International Journal of Heat and Mass Transfer, 46(5): 851-862.
Das, S. K., Putra, N., Thiesen, P. and Roetzel, W. (2003b). Temperature dependence of thermal
conductivity enhancement for nanofluids. Journal of Heat Transfer, 125(4): 567-574.
Daungthongsuk, W. and Wongwises, S. (2007). A critical review of convective heat transfer of
nanofluids. Renewable and Sustainable Energy Reviews, 11(5): 797-817.
Del Valle, V. H. and Kenning, D. (1985). Subcooled flow boiling at high heat flux.
International Journal of Heat and Mass Transfer, 28(10): 1907-1920.
Demir, H., Dalkilic, A. S., Kürekci, N. A., Duangthongsuk, W. and Wongwises, S. (2011).
Numerical investigation on the single phase forced convection heat transfer characteristics of
TiO2 nanofluids in a double-tube counter flow heat exchanger. International Communications
in Heat and Mass Transfer, 38(2): 218-228.
Dickinson, E. (2010). Food emulsions and foams: Stabilization by particles. Current Opinion in
Colloid & Interface Science, 15(1-2): 40-49.
Dickinson, E., Ettelaie, R., Kostakis, T. and Murray, B. S. (2004). Factors controlling the
formation and stability of air bubbles stabilized by partially hydrophobic silica nanoparticles.
Langmuir, 20: 8517-8525.
Dijkhuizen, W., Roghair, I., Van Sint Annaland, M. and Kuipers, J. A. M. (2010a). DNS of gas
bubbles behaviour using an improved 3D front tracking model—Drag force on isolated bubbles
and comparison with experiments. Chemical Engineering Science, 65(4): 1415-1426.
Dijkhuizen, W., van Sint Annaland, M. and Kuipers, J. A. M. (2010b). Numerical and
experimental investigation of the lift force on single bubbles. Chemical Engineering Science,
65(3): 1274-1287.
Dominguez-Ontiveros, E., Fortenberry, S. and Hassan, Y. A. (2010). Experimental
observations of flow modifications in nanofluid boiling utilizing particle image velocimetry.
Nuclear Engineering and Design, 240(2): 299-304.
Drew, D. A. and Lahey, R. T. (1987). The virtual mass and lift force on a sphere in rotating and
straining inviscid flow. International Journal of Multiphase Flow, 13(1): 113-121.
Du, Z., Bilbao-Montoya, M. P., Binks, B. P., Dickinson, E., Ettelaie, R. and Murray, B. S.
(2003). Outstanding stability of particle-stabilized bubbles. Langmuir, 19: 3106-3108.

198
Duineveld, P. C. (1994). Bouncing and coalescence of two bubbles in water. PhD thesis,
Twente University.
Eastman, J. A., Choi, S., Li, S., Yu, W. and Thompson, L. (2001). Anomalously increased
effective thermal conductivities of ethylene glycol-based nanofluids containing copper
nanoparticles. Applied physics letters, 78(6): 718-720.
Eastman, J. A., Choi, U. S., Li, S., Tompson, L. J. and Lee, S. (1997). Enhanced thermal
conductivity through the development of nanofluids.pdf. Marerials Research Society
Symposium - Proceedings, 457: 3-11.
Elmahdy, A. M., Mirnezami, M. and Finch, J. A. (2008). Zeta potential of air bubbles in
presence of frothers. International Journal of Mineral Processing, 89(1-4): 40-43.
Esmaeilzadeh, P., Hosseinpour, N., Bahramian, A., Fakhroueian, Z. and Arya, S. (2014). Effect
of ZrO2 nanoparticles on the interfacial behavior of surfactant solutions at air-water and n-
heptane-water interfaces. Fluid Phase Equilibria, 361: 289-295.
Fard, M. H., Esfahany, M. N. and Talaie, M. (2010). Numerical study of convective heat
transfer of nanofluids in a circular tube two-phase model versus single-phase model.
International Communications in Heat and Mass Transfer, 37(1): 91-97.
Faulkner, D., Khotan, M. and Shekarriz, R. (2003). Practical design of a 1000 W/cm/sup
2/cooling system [high power electronics]. Semiconductor Thermal Measurement and
Management Symposium, 2003. Ninteenth Annual IEEE, IEEE.
Fdhila, R. B. and Duineveld, P. (1996). The effect of surfactant on the rise of a spherical bubble
at high Reynolds and Peclet numbers. Physics of Fluids (1994-present), 8(2): 310-321.
Foygel, M., Morris, R., Anez, D., French, S. and Sobolev, V. (2005). Theoretical and
computational studies of carbon nanotube composites and suspensions: Electrical and thermal
conductivity. Physical Review B, 71(10): 104201.
Frank, T., Shi, J. and Bruns, A. D. (2004). Validation of Eulerian multiphase flow models for
nuclear safety application. the Third International Symposium on Two-Phase Modelling and
Experimentation, Pisa, Italy.
Fritz, W. (1935). Berechnung des maximalvolume von dampfblasen. Phys. Z., 36: 379-388.
Fukuta, M., Takagi, S. and Matsumoto, Y. (2008). Numerical study on the shear-induced lift
force acting on a spherical bubble in aqueous surfactant solutions. Physics of Fluids, 20(4):
040704.
Ganapathy, H. and Sajith, V. (2013). Semi-analytical model for pool boiling of nanofluids.
International Journal of Heat and Mass Transfer, 57(1): 32-47.
Gao, M., Zhang, L., Cheng, P. and Quan, X. (2013). An investigation of microlayer beneath
nucleation bubble by laser interferometric method. International Journal of Heat and Mass
Transfer, 57(1): 183-189.
Gerardi, C., Buongiorno, J., Hu, L.-w. and McKrell, T. (2011). Infrared thermometry study of
nanofluid pool boiling phenomena. Nanoscale research letters, 6(1): 1-17.
199
Grace, J. R. and Weber, M. E. (1982). Hydrodynamics of drops and bubbles. Handbook of
Multiphase Systems. G. Hetsroni. New York, McGraw-Hill: 1.204-201.246.
Graham, R. W. and Hendricks, R. C. (1967). Assessment of convection, conduction, and
evaporation in nucleate boiling.
Grossetete, C. (1995). Experimental investigation of void profile development in a vertical
cylindrical pipe. Advances in Multiphase Flow, 333-346.
Grzelczak, M., Vermant, J., Furst, E. M. and Liz-Marzan, L. M. (2010). Directed Self-
Assembly of Nanoparticles. Acs Nano, 4(7): 3591-3605.
Gupta, A., Wu, X. and Kumar, R. (2006). Possible mechanisms for thermal conductivity
enhancement in nanofluids. ASME 4th International Conference on Nanochannels,
Microchannels, and Minichannels, American Society of Mechanical Engineers.
Hasko, H. P. (1980). Shape and size of nonionic surfactant micelle triton x-100 in aqueous
solution. Journal of Physical Chemistry, 84(6): 599-607.
Hamilton, R. and Crosser, O. (1962). Thermal conductivity of heterogeneous two-component
systems. Industrial & Engineering chemistry fundamentals, 1(3): 187-191.
Harish, G., Emlin, V. and Sajith, V. (2011). Effect of surface particle interactions during pool
boiling of nanofluids. International Journal of Thermal Sciences, 50(12): 2318-2327.
Harper, J. (1972). The motion of bubbles and drops through liquids. Advances in Applied
Mechanics, 12: 59-129.
Hatton, A. and Hall, I. (1966). Photographic study of boiling on prepared surfaces. Chemical
Engineering Progress, New York, NY 10017.
Hibiki, T. and Ishii, M. (2003). Active nucleation site density in boiling systems. International
Journal of Heat and Mass Transfer, 46(14): 2587-2601.
Hibiki, T. and Ishii, M. (2007). Lift force in bubbly flow systems. Chemical Engineering
Science, 62(22): 6457-6474.
Howell, P. and Stone, H. (2005). On the absence of marginal pinching in thin free films.
European Journal of Applied Mathematics, 16(05): 569-582.
Huang, C.-K., Lee, C.-W. and Wang, C.-K. (2011). Boiling enhancement by TiO2 nanoparticle
deposition. International Journal of Heat and Mass Transfer, 54(23): 4895-4903.
Hughmark, G. (1967). Mass and heat transfer from rigid spheres. AIChE Journal, 13(6): 1219-
1221.
Hunter, T. N., Pugh, R. J., Franks, G. V. and Jameson, G. J. (2008). The role of particles in
stabilising foams and emulsions. Adv Colloid Interface Sci, 137(2): 57-81.
Huxtable, S. T., Cahill, D. G., Shenogin, S., Xue, L., Ozisik, R., Barone, P., Usrey, M., Strano,
M. S., Siddons, G. and Shim, M. (2003). Interfacial heat flow in carbon nanotube suspensions.
Nature materials, 2(11): 731-734.
Ishii, M. (1975). Thermo-fluid dynamic theory of two-phase flow. Paris, Eyrolles.

200
Ishii, M. and Mishima, K. (1984). Two-fluid model and hydrodynamic constitutive relations.
Nuclear Engineering and Design, 82(2-3): 107-126.
Ishii, M. and Zuber, N. (1979). Drag coefficient and relative velocity in bubble, droplet or
particlulate flows. AIChE journal, 25: 843-855.
J.C., l. and T.D., H. (1968). Film flow and coalescence-I Basic relations, film shape and criteria
for interface mobility. Chemical Engineering Science, 23(11): 1375-1397.
Jackson, J. E., Borgmeyer, B. V., Wilson, C. A., Chen, P. and Bryan, J. E. (2006).
Characteristics of nucleate boiling with gold nanoparticles in water. ASME 2006 International
Mechanical Engineering Congress and Exposition, American Society of Mechanical Engineers.
Jacqueline, B., David, B. and Tadrist, L. (2011). A review on boiling heat transfer enhancement
with nanofluids. Nanoscale research letters, 6: 280.
Jang, S. P. and Choi, S. U. S. (2004). Role of Brownian motion in the enhanced thermal
conductivity of nanofluids. Applied Physics Letters, 84(21): 4316.
Jha, J. M., Ravikumar, S. V., Tiara, A., Sarkar, I., Pal, S. K. and Chakraborty, S. (2015).
Ultrafast cooling of a hot moving steel plate by using alumina nanofluid based air atomized
spray impingement. Applied Thermal Engineering, 75: 738-747.
Jia, X., Hu, W., Yuan, X. and Yu, K. (2015). Effect of surfactant type on interfacial area and
liquid mass transfer for CO2 absorption in a bubble column. Chinese Journal of Chemical
Engineering, 23(3): 476-481.
Jo, B., Jeon, P. S., Yoo, J. and Kim, H. J. (2009). Wide range parametric study for the pool
boiling of nano-fluids with a circular plate heater. Journal of Visualization, 12(1): 37-46.
Johnson, T. and Patel, V. (1999). Flow past a sphere up to a Reynolds number of 300. Journal
of Fluid Mechanics, 378: 19-70.
Jordan, S. K. and Fromm, J. E. (1972). Laminar flow past a circle in a shear flow. Physics of
Fluids (1958-1988), 15(6): 972-976.
Judd, R. L. and Hwang, K. S. (1976). A Comprehensive Model for Nucleate pool boiling heat
transfer including evaporation. Jornal of Heat Transfer.
Jung, J.-Y., Kim, E. S. and Kang, Y. T. (2012). Stabilizer effect on CHF and boiling heat
transfer coefficient of alumina/water nanofluids. International Journal of Heat and Mass
Transfer, 55(7): 1941-1946.
Jung, S. and Kim, H. (2014). An experimental method to simultaneously measure the dynamics
and heat transfer associated with a single bubble during nucleate boiling on a horizontal surface.
International Journal of Heat and Mass Transfer, 73: 365-375.
Kakaç, S. and Pramuanjaroenkij, A. (2009). Review of convective heat transfer enhancement
with nanofluids. International Journal of Heat and Mass Transfer, 52(13-14): 3187-3196.
Kam, S. I. and Rossen, W. R. (1999). Anomalous capillary pressure, stress, and stability of
solids-coated bubbles. Journal of Colloid Interface Science, 213: 329-339.

201
Kamatchi, R. and Venkatachalapathy, S. (2015). Parametric study of pool boiling heat transfer
with nanofluids for the enhancement of critical heat flux: A review. International Journal of
Thermal Sciences, 87: 228-240.
Kamyar, A., Saidur, R. and Hasanuzzaman, M. (2012). Application of Computational Fluid
Dynamics (CFD) for nanofluids. International Journal of Heat and Mass Transfer, 55(15-16):
4104-4115.
Kathiravan, R., Kumar, R., Gupta, A. and Chandra, R. (2009). Characterization and pool
boiling heat transfer studies of nanofluids. Journal of Heat Transfer, 131(8): 081902.
Kathiravan, R., Kumar, R., Gupta, A. and Chandra, R. (2010). Preparation and pool boiling
characteristics of copper nanofluids over a flat plate heater. International Journal of Heat and
Mass Transfer, 53(9-10): 1673-1681.
Kenning, D. (1981). Fully-developed nucleate boiling: overlap of areas of influence and
interference between bubble sites. International Journal of Heat and Mass Transfer, 24(6):
1025-1032.
Khanafer, K. and Vafai, K. (2011). A critical synthesis of thermophysical characteristics of
nanofluids. International Journal of Heat and Mass Transfer, 54(19): 4410-4428.
Kim, D., Kwon, Y., Cho, Y., Li, C., Cheong, S., Hwang, Y., Lee, J., Hong, D. and Moon, S.
(2009). Convective heat transfer characteristics of nanofluids under laminar and turbulent flow
conditions. Current Applied Physics, 9(2): e119-e123.
Kim, H., Kim, J. and Kim, M. H. (2006a). Effect of nanoparticles on CHF enhancement in pool
boiling of nano-fluids. International Journal of Heat and Mass Transfer, 49(25-26): 5070-
5074.
Kim, H. and Kim, M. (2009). Experimental study of the characteristics and mechanism of pool
boiling CHF enhancement using nanofluids. Heat and Mass Transfer, 45(7): 991-998.
Kim, J. H., Jung, C. W. and Kang, Y. T. (2014). Mass transfer enhancement during CO2
absorption process in methanol/Al2O3 nanofluids. International Journal of Heat and Mass
Transfer, 76: 484-491.
Kim, J. W. and Lee, W. K. (1987). Coalescence behavior of two bubbles in stagnant liquids.
Journal of Chemical Engineering of Japan, 20(5): 448-453.
Kim, S. J. (2009). Subcooled flow boiling heat transfer and critical heat flux in water based
nanofluids at low pressure. PhD thesis, Massachusetts Institute of Technology.
Kim, S. J., Bang, I. C., Buongiorno, J. and Hu, L. W. (2006b). Effects of nanoparticle
deposition on surface wettability influencing boiling heat transfer in nanofluids. Applied
Physics Letters, 89(15): 153107.
Kim, S. J., Bang, I. C., Buongiorno, J. and Hu, L. W. (2007). Surface wettability change during
pool boiling of nanofluids and its effect on critical heat flux. International Journal of Heat and
Mass Transfer, 50(19-20): 4105-4116.
Kirkpatrick, R. and Lockett, M. (1974). The influence of approach velocity on bubble
coalescence. Chemical Engineering Science, 29(12): 2363-2373.

202
Kole, M. and Dey, T. (2012). Thermophysical and pool boiling characteristics of ZnO-ethylene
glycol nanofluids. International Journal of Thermal Sciences, 62: 61-70.
Kolev, N. I. (2012). Multiphase flow dynamics 2-Mechanical Interactions, Springer-Verlag
Berline, Heidelberg.
Kolev, N. I. (2012). Multiphase Flow Dynamics 3-Thermal interactions, Springer-
Verlag.Berlin, Heidelberg.
Končar, B., Kljenak, I. and Mavko, B. (2004). Modelling of local two-phase flow parameters in
upward subcooled flow boiling at low pressure. International Journal of Heat and Mass
Transfer, 47(6): 1499-1513.
Koo, J. and Kleinstreuer, C. (2005). Impact analysis of nanoparticle motion mechanisms on the
thermal conductivity of nanofluids. International Communications in Heat and Mass Transfer,
32(9): 1111-1118.
Krepper, E., Končar, B. and Egorov, Y. (2007). CFD modelling of subcooled boiling—concept,
validation and application to fuel assembly design. Nuclear Engineering and Design, 237(7):
716-731.
Krishna, K. H., Ganapathy, H., Sateesh, G. and Das, S. K. (2011). Pool boiling characteristics
of metallic nanofluids. Journal of Heat Transfer, 133(11): 111501.
Kurose, R. and Komori, S. (1999). Drag and lift foces on a rotating shpere in a linear shear
flow. Journal of Fluid Mechanics, 384: 183-206.
Kurul, N. and Podowski, M. Z. (1990). Multidimensional effects in forced convection
subcooled boiling. Proceedings of the Ninth International Heat Transfer Conference,
Hemisphere Publishing New York.
Kwark, S. M. (2009). Pool boiling heat transfer characteristics of nanofluids and nanocoatings.
PhD thesis, The University of Texas at Arlington.
Kwark, S. M., Moreno, G., Kumar, R., Moon, H. and You, S. M. (2010). Nanocoating
characterization in pool boiling heat transfer of pure water. International Journal of Heat and
Mass Transfer, 53(21-22): 4579-4587.
Lance, M. and de Bertodano, M. L. (1994). Phase distribution phenomena and wall effects in
bubbly two-phase flows. Multiphase science and technology, 8(1-4).
Langevin, D. (2015). Bubble coalescence in pure liquids and in surfactant solutions. Current
Opinion in Colloid & Interface Science, 20(2): 92-97.
Lemmert, M. and Chwala, J. M. (1977). Heat transfer in boiling. Academic Press and
Hemisphere, New York and Washington.
Lewandowski, E. P., Bernate, J. A., Tseng, A., Searson, P. C. and Stebe, K. J. (2009). Oriented
assembly of anisotropic particles by capillary interactions. Soft Matter, 5(4): 886-890.
Li, K., Li, X. D., Tu, J. Y. and Wang, H. G. (2015). A mathematic model considering the effect
of Brownian motion for subcooled nucleate pool boiling of dilute nanofluids. International
Journal of Heat and Mass Transfer, 84(0): 46-53.
203
Li, X. D., Pok Cheung, S. C. and Tu, J. (2014a). Nucleate boiling of dilute nanofluids –
Mechanism exploring and modeling. International Journal of Thermal Sciences, 84(0): 323-
334.
Li, X. D., Wang, R., Huang, R. and Shi, Y. (2006). Numerical investigation of boiling flow of
nitrogen in a vertical tube using the two-fluid model. Applied Thermal Engineering, 26(17-18):
2425-2432.
Li, X. D., Wang, R., Huang, R. and Shi, Y. (2007). Numerical and experimental investigation
of pressure drop characteristics during upward boiling two-phase flow of nitrogen.
International Journal of Heat and Mass Transfer, 50(9-10): 1971-1981.
Li, X. D., Wei, W., Wang, R. and Shi, Y. (2009). Numerical and experimental investigation of
heat transfer on heating surface during subcooled boiling flow of liquid nitrogen. International
Journal of Heat and Mass Transfer, 52(5): 1510-1516.
Li, X. D., Yuan, Y. and Tu, J. Y. (2015). A parametric study of the heat flux partitioning model
for nucleate boiling of nanofluids. International Journal of Thermal Sciences, 98: 42-50.
Li, X. D., Yuan, Y. and Tu, J. Y. (2016). Modelling and critical analysis of bubbly flows of
dilute nanofluids in a vertical tube. Nuclear Engineering and Design, 300: 173-180.
Li, X. D., Zhang, H., Wang, R. and Wang, J. (2010). MUSIG modeling and evaluation of
nitrogen bubble coalescence in a bottom-closed vertical tube. Aerospace Science and
Technology, 14(3): 203-212.
Li, X. D., Li, K., Tu, J. Y. and Buongiorno, J. (2014b). On two-fluid modeling of nucleate
boiling of dilute nanofluids. International Journal of Heat and Mass Transfer, 69: 443-450.
Liao, Y. and Lucas, D. (2010). A literature review on mechanisms and models for the
coalescence process of fluid particles. Chemical Engineering Science, 65(10): 2851-2864.
Lin, C. Y. and Slattery, J. (1982). Thinning of a liquid film as a small drop or bubble
approaches a fluid–fluid interface. AIChE Journal, 28(5): 786-792.
Lin, Y., Böker, A., Skaff, H., Cookson, D., Dinsmore, A. D., Emrick, T. and Russell, T. P.
(2005). Nanoparticle assembly at fluid interfaces Structure and dynamics. Langmuir, 21(1):
191-194.
Liu, T. J. (1993). Bubble size and entrance length effects on void development in a vertical
channel. International Journal of Multiphase Flow, 19(1): 99-113.
Liu, Z.-h., Xiong, J.-g. and Bao, R. (2007). Boiling heat transfer characteristics of nanofluids in
a flat heat pipe evaporator with micro-grooved heating surface. International Journal of
Multiphase Flow, 33(12): 1284-1295.
Liu, Z.-H., Yang, X.-F. and Xiong, J.-G. (2010). Boiling characteristics of carbon nanotube
suspensions under sub-atmospheric pressures. International Journal of Thermal Sciences,
49(7): 1156-1164.
Lo, S. (1996). Application of Population Balance to CFD Modelling of Bubbly Flow via the
MUSIG Model, AEA Technology. AEAT-1096.

204
Loubière, K. and Hébrard, G. (2004). Influence of liquid surface tension (surfactants) on bubble
formation at rigid and flexible orifices. Chemical Engineering and Processing: Process
Intensification, 43(11): 1361-1369.
Luo, H. and Svendsen, H. F. (1996). Theoretical model for drop and bubble breakup in
turbulent dispersions. AIChE Journal, 42(5): 1225-1233.
Madivala, B., Fransaer, J. and Vermant, J. (2009). Self-assembly and rheology of ellipsoidal
particles at interfaces. Langmuir, 25: 2718-2728.
Mahian, O., Kianifar, A., Kalogirou, S. A., Pop, I. and Wongwises, S. (2013). A review of the
applications of nanofluids in solar energy. International Journal of Heat and Mass Transfer,
57(2): 582-594.
Marek, G., Jan, V., M., F. E. and M., L.-M. L. (2010). Directed self-assembly of nanoparticles.
ACS Nano, 4(7): 3591-3605.
Marrucci, G. (1969). A theory of coalescence. Chemical engineering science, 24(6): 975-985.
McClure, D. D., Deligny, J., Kavanagh, J. M., Fletcher, D. F. and Barton, G. W. (2014). Impact
of Surfactant Chemistry on Bubble Column Systems. Chemical Engineering & Technology,
37(4): 652-658.
McClure, D. D., Lamy, M., Black, L., Kavanagh, J. M. and Barton, G. W. (2017). An
experimental investigation into the behaviour of antifoaming agents. Chemical Engineering
Science, 160: 269-274.
McClure, D. D., Norris, H., Kavanagh, J. M., Fletcher, D. F. and Barton, G. W. (2015).
Towards a CFD model of bubble columns containing significant surfactant levels. Chemical
Engineering Science, 127: 189-201.
Mclaughlin, J. B. (1996). Numerical simulation of bubble motion in water. Journal of colloid
and interface science, 184(2): 614-625.
Milanova, D., Kumar, R., Kuchibhatla, S. and Seal, S. (2006). Heat transfer behavior of oxide
nanoparticles in pool boiling experiment. ASME 4th International Conference on
Nanochannels, Microchannels, and Minichannels, American Society of Mechanical Engineers.
Moraga, F. J., Bonetto, F. J. and Lahey, R. T. (1999). Lateral forces on spheres in turbulent
uniform shear flow. International Journal of Multiphase Flow, 25: 1321-1372.
Moraveji, M. K. and Ardehali, R. M. (2013). CFD modeling (comparing single and two-phase
approaches) on thermal performance of Al2o3/water nanofluid in mini-channel heat sink.
International Communications in Heat and Mass Transfer, 44(0): 157-164.
Mori, S., Aznam, S. M. and Okuyama, K. (2015). Enhancement of the critical heat flux in
saturated pool boiling of water by nanoparticle-coating and a honeycomb porous plate.
International Journal of Heat and Mass Transfer, 80: 1-6.
Mourgues, A., Hourtané, V., Muller, T. and Caron-Charles, M. (2013). Boiling behaviors and
critical heat flux on a horizontal and vertical plate in saturated pool boiling with and without
ZnO nanofluid. International Journal of Heat and Mass Transfer, 57(2): 595-607.

205
Murshed, S., Leong, K. and Yang, C. (2005). Enhanced thermal conductivity of TiO2—water
based nanofluids. International Journal of thermal sciences, 44(4): 367-373.
Murshed, S., Leong, K. and Yang, C. (2009). A combined model for the effective thermal
conductivity of nanofluids. Applied Thermal Engineering, 29(11): 2477-2483.
Mysels, K. J. (1959). Soap films: studies of their thinning and a bibliography, Pergamon Press.
Naphon, P. and Thongjing, C. (2014). Pool boiling heat transfer characteristics of refrigerant-
nanoparticle mixtures. International Communications in Heat and Mass Transfer, 52: 84-89.
Narayan, G. P., Anoop, K. B. and Das, S. K. (2007). Mechanism of enhancement/deterioration
of boiling heat transfer using stable nanoparticle suspensions over vertical tubes. Journal of
Applied Physics, 102(7): 074317.
Naterer, G. F. (2002). Heat transfer in single and multiphase systems, CRC Press.
Nayak, A. K., Kulkarni, P. P. and Vijayan, P. K. (2011). Study on the transient and stability
behaviour of a boiling two-phase natural circulation loop with Al2O3 nanofluids. Applied
Thermal Engineering, 31(10): 1673-1681.
Nukiyama, S. (1966). The maximum and minimum values of the heat Q transmitted from metal
to boiling water under atmospheric pressure. International Journal of Heat and Mass Transfer,
9(12): 1419-1433.
Okawa, T., Takamura, M. and Kamiya, T. (2012). Boiling time effect on CHF enhancement in
pool boiling of nanofluids. International Journal of Heat and Mass Transfer, 55(9): 2719-2725.
Okawa, T., Tanaka, T., Kataoka, I. and Mori, M. (2003). Temperature effect on single bubble
rise characteristics in stagnant distilled water. International journal of heat and mass transfer,
46(5): 903-913.
Oolman, T. O. and Blanch, H. W. (1986). Bubble coalescence in stagnant liquids. Chemical
Engineering Communications, 43(4-6): 237-261.
Pais, C. and Webb, R. (1991). Literature survey of pool boiling on enhanced surfaces. ASHRAE
Transactions, 97(1): 79-89.
Palm, S. J., Roy, G. and Nguyen, C. T. (2006). Heat transfer enhancement with the use of
nanofluids in radial flow cooling systems considering temperature-dependent properties.
Applied Thermal Engineering, 26(17-18): 2209-2218.
Park, K.-J., Jung, D. and Shim, S. E. (2009). Nucleate boiling heat transfer in aqueous solutions
with carbon nanotubes up to critical heat fluxes. International Journal of Multiphase Flow,
35(6): 525-532.
Park, Y. S. and Chang, S. H. (2011). Measurement of local two-phase flow parameters of
nanofluids using conductivity double-sensor probe. Nanoscale research letters, 6(284): 1-8.
Peyghambarzadeh, S., Hashemabadi, S., Naraki, M. and Vermahmoudi, Y. (2013).
Experimental study of overall heat transfer coefficient in the application of dilute nanofluids in
the car radiator. Applied Thermal Engineering, 52(1): 8-16.

206
Phan, H. T., Caney, N., Marty, P., Colasson, S. and Gavillet, J. (2009). Surface wettability
control by nanocoating: The effects on pool boiling heat transfer and nucleation mechanism.
International Journal of Heat and Mass Transfer, 52(23): 5459-5471.
Phan, H. T., Caney, N., Marty, P., Colasson, S. and Gavillet, J. (2010). Surface coating with
nanofluids: the effects on pool boiling heat transfer. Nanoscale and Microscale Thermophysical
Engineering, 14(4): 229-244.
Pieranski, P. (1980). Two-dimensional interfacial colloidal crystals. Physical Review Letters,
45(7): 569.
Pil Jang, S. and Choi, S. U. S. (2007). Effects of various parameters on nanofluid thermal
conductivity. Journal of Heat Transfer, 129(5): 617.
Popp, N., Kutuzov, S. and Böker, A. (2010). Various aspects of the interfacial self-assembly of
nanoparticles. Complex Macromolecular Systems Ii, 228: 39-58.
Prasher, R., Song, D., Wang, J. and Phelan, P. E. (2006). Measurements of nanofluid viscosity
and its implications for thermal applications. Applied Physics Letters, 89: 133108.
Prince, M. J. and Blanch, H. W. (1990). Bubble coalesence and break-up in air-sparged bubble
columns. AIChE journal, 36(10): 14.
Rana, K., Rajvanshi, A. and Agrawal, G. (2013). A visualization study of flow boiling heat
transfer with nanofluids. Journal of visualization, 16(2): 133-143.
Rana, K. B., Agrawal, G. D., Mathur, J. and Puli, U. (2014). Measurement of void fraction in
flow boiling of ZnO-water nanofluids using image processing technique. Nuclear Engineering
and Design, 270: 217-226.
Raveshi, M. R., Keshavarz, A., Mojarrad, M. S. and Amiri, S. (2013). Experimental
investigation of pool boiling heat transfer enhancement of alumina–water–ethylene glycol
nanofluids. Experimental Thermal and Fluid Science, 44: 805-814.
Rio, E. and Biance, A. L. (2014). Thermodynamic and mechanical timescales involved in foam
film rupture and liquid foam coalescence. ChemPhysChem, 15(17): 3692-3707.
Rodrigues, J. A., Rio, E., Bobroff, J., Langevin, D. and Drenckhan, W. (2011). Generation and
manipulation of bubbles and foams stabilised by magnetic nanoparticles. Colloids and Surfaces
A: Physicochemical and Engineering Aspects, 384(1-3): 408-416.
Rubia, M. D. L., García-Abuín, A., Gómez-Díaz, D. and Navaza, J. M. (2010). Interfacial area
and mass transfer in carbon dioxide absorption in TEA aqueous solutions in a bubble column
reactor. Chemical Engineering and Processing: Process Intensification, 49(8): 852-858.
Ryskin, G. and Leal, L. (1984). Numerical solution of free-boundary problems in fluid
mechanics. Part 1. The finite-difference technique. Journal of Fluid Mechanics, 148: 1-17.
Sadhal, S. S. and Johnson, R. E. (2006). Stokes flow past bubbles and drops partially coated
with thin films. Part 1. Stagnant cap of surfactant film – exact solution. Journal of Fluid
Mechanics, 126(-1): 237.

207
Sagert, N. and Quinn, M. (1978). The coalescence of gas bubbles in dilute aqueous solutions.
Chemical Engineering Science, 33(8): 1087-1095.
Sakaguchi, T., Ijiri, H., Tabasaki, M. and Shakutsui, H. (1996). Radial distribution of volume
fraction of gas phase in gas-liquid two-phase bubbly flow in a vertical pipe. Japanese Journal
of Multiphase Flow, 10(4).
Sakamoto, H. and Haniu, H. (1995). The formation mechanism and shedding frequency of
vortices from a sphere in uniform shear flow. Journal of Fluid Mechanics, 287: 151-171.
Samanta, S. and Ghosh, P. (2011). Coalescence of air bubbles in aqueous solutions of alcohols
and nonionic surfactants. Chemical Engineering Science, 66(20): 4824-4837.
Sato, Y., Sadatomi, M. and Sekoguchi, K. (1981). Momentum and heat transfer in two-phase
bubble flow—I. Theory. International Journal of Multiphase Flow, 7(2): 167-177.
Sato, Y. and Sekoguchi, K. (1975). Liquid velocity distribution in two-phase bubble flow.
International Journal of Multiphase Flow, 2(1): 79-95.
Savic, P. (1953). Circulation and distortion of liquid drops falling through a viscous medium,
National Research Council Canada.
Sefiane, K., Skilling, J. and MacGillivray, J. (2008). Contact line motion and dynamic wetting
of nanofluid solutions. Advances in colloid and interface science, 138(2): 101-120.
Serizawa, A. and Kataoka, I. (1988). Phase Distribution in Two-Phase Flow. Transient
Phenomena in Multiphase Flow. New York, Hemisphere Pub. Corp.
Serizawa, A. and Kataoka, I. (1994). Dispersed flow-I. Multiphase science and technology,
8(1-4).
Shahmoradi, Z., Etesami, N. and Nasr Esfahany, M. (2013). Pool boiling characteristics of
nanofluid on flat plate based on heater surface analysis. International Communications in Heat
and Mass Transfer, 47: 113-120.
Sheikhbahai, M., Nasr Esfahany, M. and Etesami, N. (2012). Experimental investigation of
pool boiling of Fe3O4/ethylene glycol–water nanofluid in electric field. International Journal
of Thermal Sciences, 62: 149-153.
Shinnar, R. and Church, J. M. (1960). Predicting particle size in agitated dispersions. Industrial
and Engineering Chemistry, 52: 13.
Shoghl, S. N. and bahrami, M. (2013). Experimental investigation on pool boiling heat transfer
of ZnO, and CuO water-based nanofluids and effect of surfactant on heat transfer coefficient.
International Communications in Heat and Mass Transfer, 45: 122-129.
Situ, R., Ishii, M., Hibiki, T., Tu, J., Yeoh, G. H. and Mori, M. (2008). Bubble departure
frequency in forced convective subcooled boiling flow. International Journal of Heat and Mass
Transfer, 51(25): 6268-6282.
Soltani, S., Etemad, S. G. and Thibault, J. (2009). Pool boiling heat transfer performance of
Newtonian nanofluids. Heat and mass transfer, 45(12): 1555-1560.
208
Stephan, K. (1992). Heat Transfer in condensation and boiling, Springer-Verlag Berlin,
Heidelberge.
Stutz, B., Morceli, C. H. S., da Silva, M. d. F., Cioulachtjian, S. and Bonjour, J. (2011).
Influence of nanoparticle surface coating on pool boiling. Experimental Thermal and Fluid
Science, 35(7): 1239-1249.
Sugiyama, K., Takagi, S. and Matsumoto, Y. (2001). Multi-scale analysis of bubbly flows.
Computer methods in applied Mechanics and Engineering, 191(6): 689-704.
Sun, Q., Li, Z., Wang, J., Li, S., Li, B., Jiang, L., Wang, H., Lü, Q., Zhang, C. and Liu, W.
(2015). Aqueous foam stabilized by partially hydrophobic nanoparticles in the presence of
surfactant. Colloids and Surfaces A: Physicochemical and Engineering Aspects, 471: 54-64.
Suriyawong, A. and Wongwises, S. (2010). Nucleate pool boiling heat transfer characteristics
of TiO2–water nanofluids at very low concentrations. Experimental Thermal and Fluid Science,
34(8): 992-999.
Taneda, S. (1957). Negative magnus effect. Reports of Research Institute for Applied
Mechanics, (20).
Taylor, R. A. and Phelan, P. E. (2009). Pool boiling of nanofluids: Comprehensive review of
existing data and limited new data. International Journal of Heat and Mass Transfer, 52(23-
24): 5339-5347.
Tolubinsky, V. and Kostanchuk, D. (1970). Vapour bubbles growth rate and heat transfer
intensity at subcooled water boiling. Proceedings of the 4th International Heat Transfer
Conference.
Tomiyama, A. (1998). Struggle with computational bubble dynamics. Multiphase Science and
Technology, Vol 10 Issue 4 1998: 369-405.
Tomiyama, A., Kataoka, I., Zun, I. and Sakaguchi, T. (1998). Drag coefficients of single
bubbles under normal and micro gravity conditions. JSME internation Journal Series B, 41(2):
472-479.
Tomiyama, A., Sou, A., Zun, I., Kanami, N. and Sakaguchi, T. (1995). Effects of Eotvos
number and dimensionless liquid volumetric flux on lateral motion of a bubble in a laminar
duct flow. Advances in Multiphase Flow: 3-15.
Tomiyama, A., Tamai, H., Zun, I. and Hosokawa, S. (2002). Transverse migration of single
bubbles in simple shear flows. Chemical Engineering Science, 57: 1849-1858.
Trisaksri, V. and Wongwises, S. (2009). Nucleate pool boiling heat transfer of TiO2–R141b
nanofluids. International Journal of Heat and Mass Transfer, 52(5): 1582-1588.
Truong, B. H. (2007). Determination of pool boiling critical heat flux enhancement in
nanofluids. B.S. thesis Massachusetts Institute of Technology.
Tu, J. Y., Dinh, N. and Theofanous, T. (2004). An experimental study of nanofluid boiling heat
transfer. Proceedings of 6th international symposium on heat transfer, Beijing, China.
209
Tu, J. Y. and Yeoh, G. (2002). On numerical modelling of low-pressure subcooled boiling
flows. International Journal of Heat and Mass Transfer, 45(6): 1197-1209.
Utaka, Y., Kashiwabara, Y. and Ozaki, M. (2013). Microlayer structure in nucleate boiling of
water and ethanol at atmospheric pressure. International Journal of Heat and Mass Transfer,
57(1): 222-230.
Utaka, Y., Kashiwabara, Y., Ozaki, M. and Chen, Z. (2014). Heat transfer characteristics based
on microlayer structure in nucleate pool boiling for water and ethanol. International Journal of
Heat and Mass Transfer, 68: 479-488.
Vafaei, S. and Borca-Tasciuc, T. (2013). Role of nanoparticles on nanofluid boiling
phenomenon: Nanoparticle deposition. Chemical Engineering Research and Design, 92(5):
842-856.
Vafaei, S. and Borca-Tasciuc, T. (2014). Role of nanoparticles on nanofluid boiling
phenomenon: Nanoparticle deposition. Chemical Engineering Research & Design, 92(5): 842-
856.
Valkovska, D. S., Danov, K. D. and Ivanov, I. B. (2002). Stability of draining plane-parallel
films containing surfactants. Advances in colloid and interface science, 96(1): 101-129.
Vassallo, P., Kumar, R. and D‘Amico, S. (2004). Pool boiling heat transfer experiments in
silica–water nano-fluids. International Journal of Heat and Mass Transfer, 47(2): 407-411.
Vermant, J. and Solomon, M. J. (2005). Flow-induced structure in colloidal suspensions.
Journal of Physics-Condensed Matter, 17(4): 187-216.
Vorburger, T. and Raja, J. (1990). Surface finish metrology tutorial, National Inst. of Standards
and Technology.
Vrij, A. (1964). Light scattering by soap films. Journal of Colloid Science, 19(1): 1-27.
Vrij, A. and Overbeek, J. T. G. (1968). Rupture of thin liquid films due to spontaneous
fluctuations in thickness. Journal of the American Chemical Society, 90(12): 3074-3078.
Wang, B.-X., Zhou, L.-P. and Peng, X.-F. (2003). A fractal model for predicting the effective
thermal conductivity of liquid with suspension of nanoparticles. International Journal of Heat
and Mass Transfer, 46(14): 2665-2672.
Wang, C. and Dhir, V. (1993). Effect of surface wettability on active nucleation site density
during pool boiling of water on a vertical surface. Journal of Heat Transfer, 115(3): 659-669.
Wang, G.-S. and Bao, R. (2009). Two-phase flow patterns of nitrogen and nanofluids in a
vertically capillary tube. International Journal of Thermal Sciences, 48(11): 2074-2079.
Wang, L. and Yoon, R.-H. (2008). Effects of surface forces and film elasticity on foam stability.
International Journal of Mineral Processing, 85(4): 101-110.
Wang, T., Wang, J. and Jin, Y. (2005). Theoretical prediction of flow regime transition in
bubble columns by the population balance model. Chemical Engineering Science, 60(22):
6199-6209.
210
Wang, X. Q. and Mujumdar, A. S. (2007). Heat transfer characteristics of nanofluids: a review.
International Journal of Thermal Sciences, 46(1): 1-19.
Wang, Y., Papageorgiou, D. T. and Maldarelli, C. (2002). Using surfactants to control the
formation and size of wakes behind moving bubbles at order-one Reynolds numbers. Journal of
Fluid Mechanics, 453: 1-19.
Wellek, R. M., Agrawal, A. K. and Skelland, A. H. P. (1966). Shape of liquid drops moving in
liquid media. AIChE Journal, 12: 854-862.
Wen, D., Corr, M., Hu, X. and Lin, G. (2011). Boiling heat transfer of nanofluids: the effect of
heating surface modification. International Journal of Thermal Sciences, 50(4): 480-485.
Wen, D. and Ding, Y. (2004). Experimental investigation into convective heat transfer of
nanofluids at the entrance region under laminar flow conditions. International journal of heat
and mass transfer, 47(24): 5181-5188.
Wen, D. and Ding, Y. (2005). Experimental investigation into the pool boiling heat transfer of
aqueous based γ-alumina nanofluids. Journal of Nanoparticle Research, 7(2-3): 265-274.
Wen, D., Lin, G., Vafaei, S. and Zhang, K. (2009). Review of nanofluids for heat transfer
applications. Particuology, 7(2): 141-150.
Wennerström, H., Morris, J. and Olsson, U. (1997). Homogeneous nucleation in an
emulsion/droplet microemulsion system. Langmuir, 13(26): 6972-6979.
Williams, W., Buongiorno, J. and Hu, L.-W. (2008). Experimental Investigation of Turbulent
Convective Heat Transfer and Pressure Loss of Alumina/Water and Zirconia/Water
Nanoparticle Colloids (Nanofluids) in Horizontal Tubes. Journal of Heat Transfer, 130(4):
042412.
Witharana, S. (2003). Boiling of refrigerants on enhanced surfaces and boiling of nanofluids.
Sweden: Royal Institute of Technology, Stockholm.
Worthen, A. J., Bagaria, H. G., Chen, Y., Bryant, S. L., Huh, C. and Johnston, K. P. (2013).
Nanoparticle-stabilized carbon dioxide-in-water foams with fine texture. J Colloid Interface Sci,
391: 142-151.
Wu, C., Wang, L., Harbottle, D., Masliyah, J. and Xu, Z. (2015). Studying bubble-particle
interactions by zeta potential distribution analysis. J Colloid Interface Sci, 449: 399-408.
Xie, H., Wang, J., Xi, T., Liu, Y., Ai, F. and Wu, Q. (2002). Thermal conductivity
enhancement of suspensions containing nanosized alumina particles. Journal of Applied
Physics, 91(7): 4568-4572.
Xu, Z. and Zhao, C. (2014). Influences of nanoparticles on pool boiling heat transfer in porous
metals. Applied Thermal Engineering, 65(1): 34-41.
Xuan, Y. and Li, Q. (2003). Investigation on Convective Heat Transfer and Flow Features of
Nanofluids. Journal of Heat Transfer, 125(1): 151.

211
Yang, S. and Kim, R. (1988). A mathematical model of the pool boiling nucleation site density
in terms of the surface characteristics. International journal of heat and mass transfer, 31(6):
1127-1135.
Yang, X. F. and Liu, Z. H. (2011). Pool boiling heat transfer of functionalized nanofluid under
sub-atmospheric pressures. International Journal of Thermal Sciences, 50(12): 2402-2412.
Yang, Y. M. and Maa, J. R. (1984). Boiling of suspension of solid particles in water.
International journal of heat and mass transfer, 27(1): 145-147.
Yao, W. and Morel, C. (2004). Volumetric interfacial area prediction in upward bubbly two-
phase flow. International Journal of Heat and Mass Transfer, 47(2): 307-328.
You, S. M., Kim, J. H. and Kim, K. H. (2003). Effect of nanoparticles on critical heat flux of
water in pool boiling heat transfer. Applied Physics Letters, 83(16): 3374.
Yu, W. and Choi, S. (2003). The role of interfacial layers in the enhanced thermal conductivity
of nanofluids: a renovated Maxwell model. Journal of Nanoparticle Research, 5(1-2): 167-171.
Yu, W., France, D. M., Timofeeva, E. V., Singh, D. and Routbort, J. L. (2012). Comparative
review of turbulent heat transfer of nanofluids. International Journal of Heat and Mass
Transfer, 55(21–22): 5380-5396.
Yuan, Y., Li, X. D. and Tu, J. Y. (2016). Numerical modelling of air–nanofluid bubbly flows in
a vertical tube using the MUltiple-SIze-Group (MUSIG) model. International Journal of Heat
and Mass Transfer, 102: 856-866.
Yuan, Y., Li, X. D. and Tu, J. Y. (2017). The effects of nanoparticles on the lift force and drag
force on bubbles in nanofluids: A two-fluid model study. International Journal of Thermal
Sciences, 119: 1-8.
Zeinali Heris, S. (2011). Experimental investigation of pool boiling characteristics of low-
concentrated CuO/ethylene glycol–water nanofluids. International Communications in Heat
and Mass Transfer, 38(10): 1470-1473.
Zhang, H., Shao, S., Xu, H. and Tian, C. (2013). Heat transfer and flow features of Al2O3–
water nanofluids flowing through a circular microchannel–Experimental results and
correlations. Applied Thermal Engineering, 61(2): 86-92.
Zhou, L. P., Wei, L. T., Du, X. Z., Yang, Y. P., Jiang, P. X. and Wang, B. X. (2014). Effects of
nanoparticle behaviors and interfacial characteristics on subcooled nucleate pool boiling over
microwire. Experimental Thermal and Fluid Science, 57: 310-316.
Zun, I. (1980). The transverse migration of bubbles influenced by walls in vertical bubbly flow.
International Journal of Multiphase Flow, 6(6): 583-588.
Related Documents


