TRITA - KRV- 2002-02 ISSN - 1100/7990 ISRN KTH-KRV-R-02-2-SE ISBN 91-7283-358-0 Numerical Investigation of the Aerodynamic Vibration Excitation of High-Pressure Turbine Rotors Markus Jöcker Doctoral Thesis 2002 Department of Energy Technology Division of Heat and Power Technology Royal Institute of Technology

Welcome message from author
This document is posted to help you gain knowledge. Please leave a comment to let me know what you think about it! Share it to your friends and learn new things together.
Transcript

TRITA - KRV- 2002-02ISSN - 1100/7990ISRN KTH-KRV-R-02-2-SEISBN 91-7283-358-0
Numerical Investigation of the AerodynamicVibration Excitation of High-Pressure
Turbine Rotors
Markus Jöcker
Doctoral Thesis2002
Department of Energy TechnologyDivision of Heat and Power Technology
Royal Institute of Technology

Akademisk avhandling som med tillstånd av Kungliga Tekniska Högskolan (Royal Institute ofTechnology) i Stockholm framlägges till offentlig granskning för avläggande av tekniskdoktorexamen i energiteknik, måndagen den 14 oktober 2002, kl 10.00 i föreläsningssalen M2,Brinellvägen 64, Kungliga Tekniska Högskolan, Stockholm. Avhandlingen försvaras påengelska.
Doctoral Thesis Markus Jöcker Page I
ABSTRACT
The design parameters axial gap and stator count of high pressure turbine stages areevaluated numerically towards their influence on the unsteady aerodynamic excitation ofrotor blades. Of particular interest is if and how unsteady aerodynamic considerations inthe design could reduce the risk of high cycle fatigue (HCF) failures of the turbine rotor.
A well-documented 2D/Q3D non-linear unsteady code (UNSFLO) is chosen to perform thestage flow analyses. The evaluated results are interpreted as aerodynamic excitationmechanisms on stream sheets neglecting 3D effects. Mesh studies and validations againstmeasurements and 3D computations provide confidence in the unsteady results.
Three test cases are analysed. First, a typical aero-engine high pressure turbine stage isstudied at subsonic and transonic flow conditions, with four axial gaps (37% - 52% ofcax,rotor) and two stator configurations (43 and 70 NGV). Operating conditions are accordingto the resonant conditions of the blades used in accompanied experiments. Second, asubsonic high pressure turbine intended to drive the turbopump of a rocket engine isinvestigated. Four axial gap variations (10% - 29% of cax,rotor) and three stator geometryvariations are analysed to extend and generalise the findings made on the first study.Third, a transonic low pressure turbine rotor, known as the International StandardConfiguration 11, has been modelled to compute the unsteady flow due to blade vibrationand compared to available experimental data.
Excitation mechanisms due to shock, potential waves and wakes are described andrelated to the work found in the open literature. The strength of shock excitation leads toincreased pressure excitation levels by a factor 2 to 3 compared to subsonic cases.Potential excitations are of a typical wave type in all cases, differences in the propagationdirection of the waves and the wave reflection pattern in the rotor passage lead tomodifications in the time and space resolved unsteady pressures on the blade surface.The significant influence of operating conditions, axial gap and stator size on the wavepropagation is discussed on chosen cases. The wake influence on the rotor bladeunsteady pressure is small in the present evaluations, which is explicitly demonstrated onthe turbopump turbine by a parametric study of wake and potential excitations. A reductionin stator size (towards R≈1) reduces the potential excitation part so that wake and potentialexcitation approach in their magnitude.
Potentials to reduce the risk of HCF excitation in transonic flow are the decrease of statorexit Mach number and the modification of temporal relations between shock and potentialexcitation events. A similar temporal tuning of wake excitation to shock excitation appearsnot efficient because of the small wake excitation contribution. The increase of axial gapdoes not necessarily decrease the shock excitation strength neither does the decrease ofvane size because the shock excitation may remain strong even behind a smaller stator.The evaluation of the aerodynamic excitation towards a HCF risk reduction should only bedone with regard to the excited mode shape, as demonstrated with parametric studies ofthe mode shape influence on excitability.
Keywords: Aeroelasticity, Aerodynamics, Stator-Rotor Interaction, Excitation Mechanism,Unsteady Flow Computation, Forced Response, High Cycle Fatigue, Turbomachinery,Gas-Turbine, High-Pressure Turbine, Turbopump, CFD, Design

Page II Doctoral Thesis Markus Jöcker

Doctoral Thesis Markus Jöcker Page III
PREFACE
This thesis is mainly based on the publications listed below, which are also enclosed in theAppendix.
I. Fransson, T.H., Jöcker, M., Bölcs, A., Ott, P.; 1999“Viscous and Inviscid Linear/Nonlinear Calculations Versus Quasi 3D ExperimentalCascade Data For a New Aeroelastic Turbine Standard Configuration”, Journal ofTurbomachinery, Vol. 121, No. 4, Oct. 1999, pp. 717ff.
II. Freudenreich, K., Jöcker, M., Rheder, H.-J., Höhn, W., Fransson, T.H.; 1999“Aerodynamic Performance of Two Isolated Stators in Transonic Annular CascadeFlow”, Proceedings of the 3rd Euopean Conference on Turbomachinery – FluidDynamics and Thermodynamics, London, UK, March 2-5, 1999, ProfessionalEngineering Publishing, ISBN: 1 86058 196 X
III. Jöcker, M.; Freudenreich, K.; Rehder, H.-J.; Fransson, T.H.; 2000b“Parametric Studies of the Aerodynamic Excitation in High Pressure Turbines.”,Proceedings of 9th International Symposium on Unsteady Aerodynamics,Aeroacoustics and Aeroelasticity of Turbomachines, Lyon, France, 2000, ISBN: 27061 1052 X
IV. Freudenreich, K.; Jöcker, M., Fransson, T.H.; 2001a“Gust and Forcing Function in a Transonic Turbine” Conference Proceedings of the4th European Conference on Turbomachinery - Fluid Dynamics and ThermodynamicsFirenze, 20th-23rd March, 2001, S.G.E., ISBN: 88-86281-57-9
V. Jöcker, M.; Hillion, F.X.; Fransson, T.H.; Wåhlén, U.; 2001“Numerical Unsteady Flow Analysis of a Turbine Stage with Extremely Large BladeLoads”, 46th ASME TURBO EXPO 2001, paper No. 2001-GT-0260 and J. ofTurbomachinery, Vol. 124, No. 3, July 2002
VI. Jöcker, M.; Fransson, T.H.; 2002b"Modeshape Sensitivity of the High Pressure Turbine Rotor Excitation Due toUpstream Stators", presented at the 47th ASME TURBO EXPO 2002, paper No. GT-2002-30452
Not included in the Appendix is
VII. Moyroud, F.; Cosme, N.; Jöcker, M.; Fransson, T.H.; Lornagex, D.; Jacquet-Richardet, G.; 2000“A Fluid-Structure Interfacing Technique for Computational Aeroelastic Simulations”;Proceedings of 9th International Symposium on Unsteady Aerodynamics,Aeroacoustics and Aeroelasticity of Turbomachines, Lyon, France, 2000, ISBN: 27061 1052 X
Professor Torsten H. Fransson has supervised all publications. The experimental work inpublication 1 was performed by the research team at the Swiss Federal Institute ofTechnology (EPFL) in Lausanne, Switzerland in 1991. The main part of the experimental
Page IV Doctoral Thesis Markus Jöcker
work in publications 2, 3 and 4 was conducted and evaluated by Dr. Kai Freudenreichduring our collaboration 1997 –2001, and minor parts by Mr. Hans-Jürgen Rheder at theGerman Aerospace Centre (DLR). A few numerical studies presented in the thesis and thepublications were supported by colleagues, in particular to name Mr. Jerome Jeanpierre(UNSFLO installation and some early numerical studies), Mr. Francois Xavier Hillion(some studies with UNSFLO for Publication 5) and Dr. Wolfgang Höhn (Inst and Volsolcomputations in publications 1 and 2). Dr. Francois Moyroud, who is the main contributorto publication 7, maintained the post-processor, which was partly used and extended bythe author. A large part of the work was conducted in the frame of a European researchproject (ADTurB, 1996 -2000) and a research collaboration between Volvo AeroCorporation in Sweden and the Royal Institute of Technology (KTH) in Stockholm (1997-2000) so that many details of the results are documented in confidential reports. These arelisted below but not included in the Appendix.
Jeanpierre, J.; Fransson, T.; 1997Brite EuRam ADTurB: “Task 2 Forced Response Analysis, Subtask A2.1.1: Prediction ofthe excitation level on the blades – 43 NGV”, Report ADTB-KTH-2005, Internal report No.97/26, November 1997, ConfidentialJöcker, M., Fransson, T.; 1998aBrite EuRam ADTurB: “Task 2 Forced Response Analysis, Subtask A2.2.1: Prediction ofthe Blade Excitation Pressure Level - 70 NGV”, Report ADTB-KTH-2010, Internal reportNo. 98/29 November 1998, ConfidentialJöcker, M., Fransson, T.; 1998bKTH Study Part 2: Report on Unsflo Calculations: Numerical Parameter Study of the AxialGap and Stator Pitch on the Forced Response, Internal Report No. KTH-HPT-30/98,ConfidentialJöcker, M.; Hillion, F.X.; Fransson, T.; 2000“Final Report, Design and Analysis of a Turbine with Extremely Large Blade Loads, Phase2”; Internal Report No. 00/07, March 2000, ConfidentialJöcker, M., Fransson, T.; 2002a"Brite EuRam ADTurB: “Task 2 DLR Rig – Validation of Excitation PressureComputations", Report No. ADTB-KTH-2020, Internal Report No. KTH-HPT-25/02,Confidential
Some results have been achieved during the following student works, which weresupervised by the author:
Riewaldt, H.; 1999“Numerical Study of the Forces Due to Blade Excitation and Rotor Blade Vibration toEstimate the Rotor Forced Response of a Stator-Rotor Turbine Stage Configuration”, KTHStockholm, Avdelningen för Kraft- och Värme Teknologi, 12th March 99, Report No. 548Khalifa, A.; 1999“Detailed Numerical Study of the Flutter Behaviour of a Turbine Blade (StandardConfiguration 11) at Design and Off-Design Conditions with H-type Mesh using ICEMCFD”KTH Stockholm, Avdelningen för Kraft- och Värme Teknologi, 17th Aug. 99, Rep. No. 552Limoa, A., 2001“Test and Application of the unsteady aerodynamic code SLiQ at HPT”, 4 months practicein the frame of the MSc. Curriculum at the University of Karlsruhe, April 2001, InternalReport No. 01/13
Doctoral Thesis Markus Jöcker Page V
ACKNOWLEDGEMENT
This work was initiated and supported by the European Community, Brite Euram Project“Aeromechanical Design of Turbine Blades”, (ADTurB), contract number BEPR-CT95-0124.
The opportunity to use the codes UNSFLO and SliQ provided by Rolls Royce and the codeVOLSOL provided by Volvo Aero Corporation is gratefully acknowledged.
The work was supported with computing resources provided by the Centre of ParallelComputers (PDC) at KTH Stockholm and distributed by the Swedish National AllocationsCommittee (SNAC).
I would like to express my gratitude to Professor Dr. Torsten H. Fransson at the Chair ofHeat and Power Technology, the Royal Institute of Technology (KTH) Stockholm, formaking this work possible.
I also want to thank all colleagues at KTH Stockholm for the pleasant and stimulating timethey shared with me. The contributions to the work by Mr. Jerome Jeanpierre and Mr.Francois Xavier Hillion are highly appreciated. Thanks also for the encouragingdiscussions on the aeroelastic subject to Mr. Andreas Krainer, Dr. Francois Moyroud, Dr.Wolfgang Höhn, Ms. Olga Tchernycheva and Mr. Björn Laumert. I gratefully enjoyedcollaborating with Mr. Holger Riewaldt and Mr. Arif Khalifa, who contributed with their MScthesis works and with Mr. Alvin Limoa, who did an internship.
Special thanks go to all the experimentalists, to name Dr. Kai Freudenreich (former KTH),Mr. Hans-Jürgen Rheder (DLR) and Dr. Holger Hennings (DLR), who provided the realdata!
Many thanks to all fellows joining me running through the forests when sitting in the officewas not to bear anymore, especially to Andreas, Thomas S., Samuel and Thomas B.
Last but not least I want to thank my family for supporting me performing this work. Greatthanks to Eva, who had to withstand all the ups and downs and still gave birth to and isrising our son Ludvig, who has the great ability to distract all attention from everything elsebut him.

Page VI Doctoral Thesis Markus Jöcker
LIST OF CONTENTS
ABSTRACT ......................................................................................................................... I
PREFACE.......................................................................................................................... III
ACKNOWLEDGEMENT..................................................................................................... V
LIST OF CONTENTS......................................................................................................... VI
LIST OF FIGURES .......................................................................................................... VIII
LIST OF TABLES............................................................................................................... X
NOMENCLATURE ............................................................................................................ XI
1 INTRODUCTION ......................................................................................................... 1
1.1 GENERAL BACKGROUND.......................................................................................... 11.1.1 “The driving forces for new developments”.................................................... 11.1.2 Gas turbine engine vibration problems .......................................................... 21.1.3 What controls blade vibrations of turbomachinery blades? ........................... 71.1.4 Why is the high-pressure turbine stage of interest?..................................... 13
1.2 PROBLEM FORMULATION ....................................................................................... 131.3 STRUCTURE OF THE PRESENT WORK....................................................................... 14
2 STATE-OF-THE-ART ................................................................................................ 15
2.1 SKETCH OF THE GENERAL TURBINE DESIGN PROCESS............................................... 152.2 PREDICTIVE METHODS TO ASSESS THE VIBRATION RISK WITH FOCUS ON THE UNSTEADYAERODYNAMICS ............................................................................................................... 16
3 OBJECTIVES AND APPROACH OF PRESENT WORK.......................................... 27
3.1 OBJECTIVE ........................................................................................................... 273.2 APPROACH ........................................................................................................... 27
4 EVALUATION TECHNIQUES APPLIED IN THIS WORK......................................... 29
4.1 BLADE VIBRATION, CONCEPT OF IBPA AND AERODYNAMIC DAMPING.......................... 294.2 POTENTIAL AND VORTICAL INTERACTIONS................................................................ 32
4.2.1 Vortical velocity perturbation........................................................................ 334.2.2 Potential velocity perturbation...................................................................... 344.2.3 Combined vortical and potential velocity perturbation ................................. 354.2.4 Potential pressure perturbation.................................................................... 35
4.3 FLOW FIELD EVALUATIONS...................................................................................... 354.4 THE FORCING FUNCTION ........................................................................................ 36
4.4.1 Fourier decomposition ................................................................................. 364.4.2 Time –space presentation ........................................................................... 374.4.3 Forces ......................................................................................................... 374.4.4 Mode shape consideration: Definition of generalised forces ....................... 37
5 TEST CASES ............................................................................................................ 39
5.1 AERO-ENGINE TURBINE STAGES (ADTURB)............................................................. 39

Doctoral Thesis Markus Jöcker Page VII
5.2 TURBOPUMP TURBINE STAGES................................................................................ 425.3 STCF 11 – BLADE VIBRATION TEST CASE ............................................................... 43
6 RESULTS AND DISCUSSIONS................................................................................ 45
6.1 VALIDATIONS ........................................................................................................ 456.1.1 Mesh sensitivity (UNSFLO) ......................................................................... 456.1.2 Stator exit flow prediction quality ................................................................. 486.1.3 Gust specification ........................................................................................ 496.1.4 Excitation prediction .................................................................................... 526.1.5 Off-Design computations and the role of the available turbulence models inUNSFLO .................................................................................................................... 556.1.6 Blade vibration computations....................................................................... 55
6.2 EXCITATION MECHANISMS ...................................................................................... 586.2.1 Excitation due to stator trailing edge shock ................................................. 586.2.2 Potential excitation ...................................................................................... 606.2.3 Wake excitation ........................................................................................... 626.2.4 Summary of excitation mechanisms ............................................................ 63
6.3 PARAMETRIC STUDIES ........................................................................................... 636.3.1 Operating point and rotational speed........................................................... 636.3.2 Axial gap...................................................................................................... 676.3.3 Stator blade count and size ......................................................................... 73
6.4 POTENTIAL FOR UNSTEADY DESIGN IMPROVEMENTS ................................................. 766.4.1 Modification and interaction of excitation sources ....................................... 766.4.2 Mode shape sensitivity ................................................................................ 78
7 CONCLUSIONS ........................................................................................................ 83
8 FUTURE WORK........................................................................................................ 85
9 REFERENCES .......................................................................................................... 87
APPENDIX A: RESULTS MATRIX
APPENDIX B: DESCRIPTION OF APPLIED NUMERICAL TOOLS
APPENDIX C: PUBLICATIONS 1 – 6

Page VIII Doctoral Thesis Markus Jöcker
LIST OF FIGURES
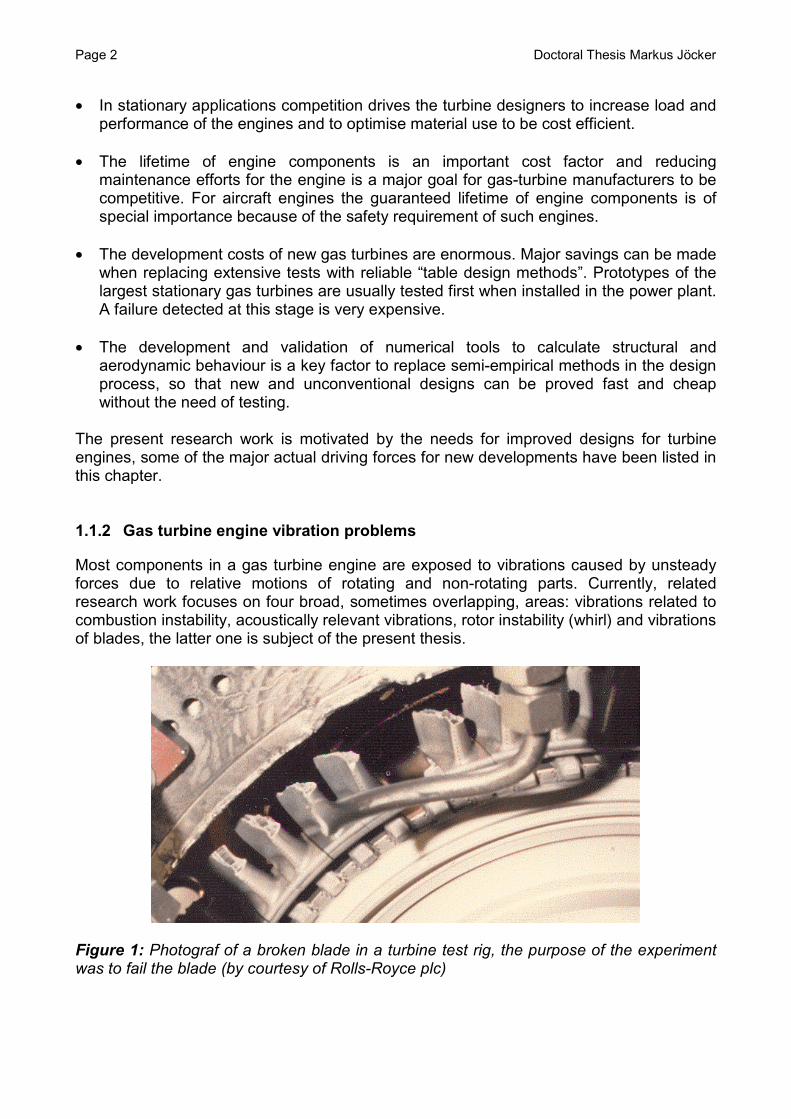
Figure 1: Photograf of a broken blade in a turbine test rig, the purpose of the experiment
was to fail the blade (by courtesy of Rolls-Royce plc).................................................. 2
Figure 2: Example of a Goodman Diagram for a turbine blade [Abell et al. 1977] ............. 3
Figure 3: Displacement contours of typical blade mode shapes [Green, 2001] ................. 4
Figure 4: Illustration of unsteadiness in a turbine stage [Giles 1991] ................................. 4
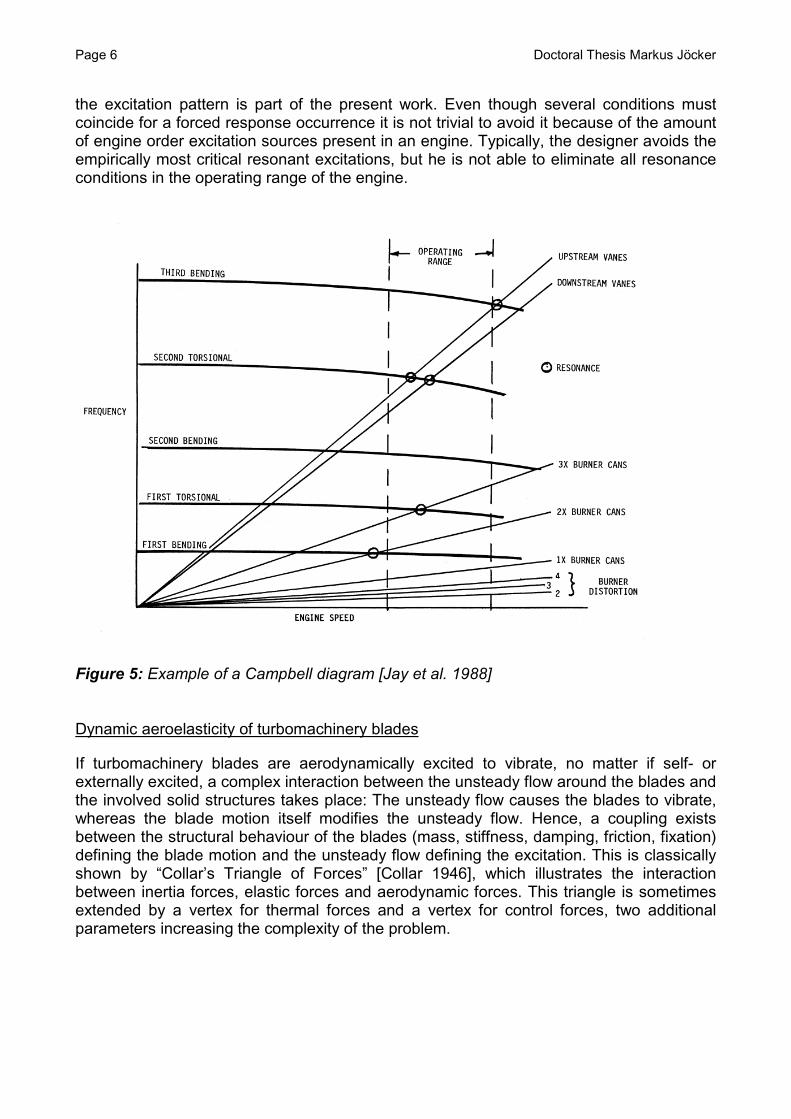
Figure 5: Example of a Campbell diagram [Jay et al. 1988]............................................... 6
Figure 6: Illustration of potential and wake excitation sources and constructive parameters
in a turbine stage [Korakianitis 1992a] ......................................................................... 7
Figure 7: Schlieren picture of turbine cascade measured by Kapteijn, see Colantuoni et
al. [1995], at M2is=1.05, illustrating the shock structure at the stator trailing edge, also
shown are the evaluation positions of present stator only investigations................... 10
Figure 8: Secondary flow phenomena in a turbine blade cascade [Takeshi et al. 1989].. 11
Figure 9: Principle design steps for turbomachinery blades............................................. 15
Figure 10: Cascade design parameters [Wilson and Korakianitis 1998] .......................... 16
Figure 11: Schematic of forced response prediction system [Hilbert et al. 1997]............. 17
Figure 12: Flutter time history of a single blade predicted by an integrated nonlinear
aeroelasticity method, Marshall and Imregun [1996] ................................................. 19
Figure 13: Meridional view of annular test section (taken from Green [2001]) ................. 40
Figure 14: Stages at 50% span large gap (taken from [Jöcker et al. 2000b], publication 3
in the Appendix) ......................................................................................................... 40
Figure 15: Principle sketch of Campbell diagram of the investigated turbine stages, taken
from Freudenreich [2001b]......................................................................................... 41
Figure 16: Midspan view of investigated turbopump turbine and flow boundary conditions,
taken from [Jöcker et al. 2001], publication 5 in the Appendix ................................... 42
Figure 17: STCF11: Schematic view of the test facility at LTT/EPFL, taken from Fransson
et al. [1999], publication 1 in the Appendix ................................................................ 44
Figure 18: Rotor meshes for stage calculations, UNSFLO, ADTurB stage ...................... 46
Figure 19: Rotor mesh sensitivity of unsteady flow field and blade surface computations
with UNSFLO, ADTurB stage (OP10, large axial gap)............................................... 47
Figure 20: 3D stator only calculation (stator 1, 43 NGV) with VOLSOL for gust definition50
Figure 21: Comparison of predicted and measured Mach number and predicted pressure
behind stator 1 (43 NGV) at three axial positions, stator only data ............................ 51
Doctoral Thesis Markus Jöcker Page IX
Figure 22: 1st and 2nd harmonic pressure amplitude on rotor blade in subsonic and
transonic flow, comparisons to experiments .............................................................. 53
Figure 23: STCF 11, transonic case, comparison to experiments and volfap .................. 57
Figure 24: Time-space plots of computed unsteady blade surface pressures, subsonic
and transonic ADTurB case (OP1 and OP2), large axial gap .................................... 59
Figure 25: Snap shot of unsteady flow field and blade surface pressure at t/Trotor =0.41 . 59
Figure 26: Potential wave reflection in the turbopump turbine rotor passage, contours of
perturbation pressures and perturbation velocity vectors at two successive times,
scale on pressure magnified with factor 5 compared to Figure 24............................. 61
Figure 27: Calculated operating conditions (OP) of ADTurB configuration and variation of
computed 1st harmonic rotor blade force (Campbell Diagram, see Figure 15), s: small
axial gap .................................................................................................................... 64
Figure 28: Comparison of operating conditions and unsteady rotor blade pressure,
transonic cases with small axial gap.......................................................................... 65
Figure 29: Time space plot of computed unsteady blade surface pressures, 70 NGV
excitation, transonic cases with small axial gap at different rotor speeds .................. 66
Figure 30: Snap shot of unsteady flow field and blade surface pressure, case OP10s.... 66
Figure 31: 1st harmonic amplitude and phase of unsteady blade surface pressures,
ADTurB case OP2 (transonic), varying axial gap, taken from [Jöcker et al. 2002b],
publication 6 in the Appendix ..................................................................................... 68
Figure 33: Computed perturbation pressures on blade and in flow field, transonic case
(OP2), smallest axial gap, scales as in Figure 24 ...................................................... 70
Figure 34: 1st harmonic amplitude and phase of unsteady blade surface pressures,
ADTurB case OP1 (subsonic), varying axial gap, taken from [Jöcker et al. 2002b],
publication 6 in the Appendix ..................................................................................... 72
Figure 35: 1st harmonic amplitude and phase of unsteady blade surface pressures,
turbopump turbine with varying axial gap, taken from [Jöcker et al. 2002b], publication
6 in the Appendix ....................................................................................................... 72
Figure 36: Computed steady and unsteady 1st harmonic blade surface pressures on rotor
due to stator variation, turbopump turbine ................................................................. 74
Figure 37: Splitting into vortical and potential parts of the unsteady aerodynamic force
amplitudes ................................................................................................................. 77
Figure 38: Excitability of ADTurB cases due to different axial gaps, transonic cases ...... 79

Page X Doctoral Thesis Markus Jöcker
LIST OF TABLES
Table 1: Overview of design and flow parameter ranges of the investigated turbines at
midspan ..................................................................................................................... 39
Table 2: Basic operation conditions at theoretical resonance (taken from [Jöcker et al.
2000b], publication 3 in the Appendix) ....................................................................... 41
Table 3: Turbopump investigated cases overview, taken from [Jöcker et al. 2001],
publication 5 in the Appendix ..................................................................................... 43
Doctoral Thesis Markus Jöcker Page XI
NOMENCLATURE
A Potential amplitude [%]A Non-dimensional vibration amplitude (h/c for bending, α [rad] for torsion) [-]c Chord length [m]cp Blade surface pressure coefficient [-]d Damping [Ns/m]D Damping ratio, damping/critical damping [-]D Wake velocity deficit (wmax-wmean)*100/wmean [%]f Perturbation force [N]gax Axial gap in percent of rotor axial chord [-]H Blade height [m]h Bending amplitude [m]k Stiffness [N/m]k Tangential wave number [1/m]k Reduced frequency [-]K Mean kinetik energyn Traveling waver number, positive for backward (opposite rotational
direction) traveling waves[-]
nr
Normal blade surface vector [m]N Number of vanes / bladesM Mach number [-]m Perturbation blade moment [Nm]m Mass [kg]p Pressure [Pa]phi/phi0 Stator relative angular position/ stator pitch angle [-]P Pressure wave amplitude (pmax-pmean)*100/pt2/rotor [%]R Pitch ratio Sstator/Srotor [-]R, r Radius [m]S, s Normalized curvilinear distance on blade,
∫=x
x
dssmin
, 222 dzdydxds ++=
[-]
S Pitch [m]t Time [s]T Temperature [K]T Time of period (Trotor = vane passing period) [-]ur
Local airfoil vibration velocity [m/s]wr
Relative flow velocity [m/s]W Aerodynamic work [Nm]W Wake width normalized with Ss [-]x, y, z Carthesian co-ordinates [m]α Torsion vibration amplitude [rad]α Flow angle [º]β Relative flow angle [º]γ Stagger angle [º]
δr
Airfoil vibration displacement vector (mode shape) [m](..)∂ Spatial disturbance, derivative [-]
ε Phase shift between excitation and blade motion [rad]

Page XII Doctoral Thesis Markus Jöcker
σ Interblade phase angle [rad]λ Axial wave number [1/m]ρ Density [kg/m3]Φ Velocity potential (= w
r∇ ) [m2/s]Λ Logarithmic decrement [-]Ξ Aerodynamic damping [-]Ω Excitation frequency, rotational speed [rad/s]ω Circular frequency, eigenfrequency [rad/s]
Subscripts0 Reference value1 Stage inlet2 Between stator and rotor3 Stage outletax Axialc Chordwisee Excitationg Generalisedh Harmoniciso Isentropicm MotionF Flux averaged valuemin, max ,mean Minimum, maximum, averagep Potentialr, rotor Rotort Total flow values, stator StatorW Wake frame of referencew Vorticalx Axial directiony Tangential direction
Superscripts~ Unsteady (perturbation) value
Abbreviations1F, 2F,..1E, 2E,..1T, 2T, ..
Mode shapes: orders of flap (F), edgewise (E) andtorsion (T) modes
2D,Q3D, 3D Two-, quasi three- and three dimensionalCFD Computational fluid DynamicsCS Cebeci Smith turbulence modelCSD Computational Structural DynamicsEO Excitation orderIBPA Interblade phase angleLE, TE Leading edge, trailing edgeNGV Nozzle guide vaneOP Operating pointRPM Rotations per minutes small axial gap cases
Doctoral Thesis Markus Jöcker Page 1
1 INTRODUCTION
1.1 General Background
1.1.1 “The driving forces for new developments”
“Today’s aero gas turbine continues to have a promising future and is expected to capturean estimated market of $ 1 trillion over the next twenty years, spread across the fourmarket sectors of civil and defence aerospace, marine and energy. However, advances intechnology will be at the heart of its success in the future as in the past” [Ruffles 2001].
In the beginning of the 21st century gas-turbine technology is widely used both inpropulsion engines and for stationary energy conversion in power plants. In the propulsionsector gas-turbines are commonly used in military and civil aircraft engines and also inmarine propulsion and space propulsion engines. The future developments might also leadto vehicular-gas-turbine drives. On the energy market the gas turbine technology had arevival during the 1990s with the successful implementation of combined cycle powerplants, which effectively rose the efficiency of energy conversion compared to singlesteam- or gas-turbine plants. Future power plants might use gas-turbine technology in newpower-cycle developments as for example water or steam injected cycles, the air-bottoming cycle or the use of fuel cell technology. Another trend is the development ofmicro gas turbines reducing the engine to button size, which could be used as power unitsfor a wide range of applications.
Because the energy retrieved from gas turbine engines usually requires fuel combustionthe increase of engine efficiency is directly related to the decrease of air pollution and thedecrease of driving costs, both major parameters for the competition with alternativeenergy and propulsion systems. Hence, a major research effort is put on the efficiencyimprovement and reduction of specific fuel consumption of gas-turbine engines byimproving design and performance by means of reduced aerodynamic, thermal andmechanical losses, increased turbine inlet pressure and temperature, improvedcombustion efficiency, cooling performance and materials use.
However, component efficiencies of gas turbine engines nowadays offer only smallmargins for improvement because of the high technical standard achieved so far.Therefore, other parameters to reduce the costs of gas turbine engines become important:
• In aircraft propulsion the weight to thrust ratio of the engine is an important parameterwith direct influence on the specific fuel consumption and air pollution, which enforcesthe design of lighter and more compact engines. This involves both the use of newmaterials and composite structures and the minimisation of the structural integritymargins of the components. For example a necessary thickening of rotor trailing edgesby 0.1 mm (to ensure an endurance limit) leads to 0.1 % specific fuel consumptionpenalty [ADTurB 2, 2000]. Other constructive measures to reduce weight are thedecrease of the number of stages and the number of blades in a blade row, leading toincreased loads of the individual blades. Also axial distances between enginecomponents are minimised, which on the other hand leads to increased levels ofdangerous aerodynamic interactions.
Page 2 Doctoral Thesis Markus Jöcker
• In stationary applications competition drives the turbine designers to increase load andperformance of the engines and to optimise material use to be cost efficient.
• The lifetime of engine components is an important cost factor and reducingmaintenance efforts for the engine is a major goal for gas-turbine manufacturers to becompetitive. For aircraft engines the guaranteed lifetime of engine components is ofspecial importance because of the safety requirement of such engines.
• The development costs of new gas turbines are enormous. Major savings can be madewhen replacing extensive tests with reliable “table design methods”. Prototypes of thelargest stationary gas turbines are usually tested first when installed in the power plant.A failure detected at this stage is very expensive.
• The development and validation of numerical tools to calculate structural andaerodynamic behaviour is a key factor to replace semi-empirical methods in the designprocess, so that new and unconventional designs can be proved fast and cheapwithout the need of testing.
The present research work is motivated by the needs for improved designs for turbineengines, some of the major actual driving forces for new developments have been listed inthis chapter.
1.1.2 Gas turbine engine vibration problems
Most components in a gas turbine engine are exposed to vibrations caused by unsteadyforces due to relative motions of rotating and non-rotating parts. Currently, relatedresearch work focuses on four broad, sometimes overlapping, areas: vibrations related tocombustion instability, acoustically relevant vibrations, rotor instability (whirl) and vibrationsof blades, the latter one is subject of the present thesis.
Figure 1: Photograf of a broken blade in a turbine test rig, the purpose of the experimentwas to fail the blade (by courtesy of Rolls-Royce plc)

Doctoral Thesis Markus Jöcker Page 3
Beside other impacts the vibrations of gas-turbine-engine parts can cause High-CycleFatigue (HCF) failures, which are characterised by fractures due to large numbers ofalternating stress cycles. Such failures are sudden events, because the cracks caused byHCF usually propagate very rapidly and can in extreme cases lead to blade release. Aphotograph of a HCF damaged blade is shown in Figure 1. In difference to Low-CycleFatigue (LCF) the stress level is so small that no plastic deformation of the part occurs. Atypical number of cycles until a HCF failure is of the order 10’000 – 1’000’000. In [Wisler1998a] one can read that “HCF problems account for between 10 and 40 percent of thetotal development problems in gas turbine engines … The average developmentalprogram has about 2.5 serious HCF problems to resolve”. These problems tend not todiminish in future having in mind the developmental trends towards higher performanceand optimised material use, which will lead to more vibration sensitive structures.
The HCF risk of a vibrating machinery part is usually assessed with help of a “GoodmanDiagram”, an example of such a diagram is given in Figure 2. For a certain guaranteedlifetime of a material expressed as a number of vibration cycles (107 in the example)before failure an experimentally obtained line can be drawn indicating the maximumallowable steady and alternating stresses. Obviously, the allowable alternating stress level,also named endurance limit, decreases with increasing steady stresses. When the steadystress in the blade is known the allowable alternating stress, which still ensures thespecified material lifetime can be read from the diagram. The steady load of the blade,which is the steady aerodynamic load and the centrifugal force in rotating parts, causes astatic displacement and the steady stress whereas the unsteady load can lead to bladevibrations and thereby cause the alternating stress. In the present example the steady andalternating stresses are given at various locations on the sketched blade surface, theconnection of these points describes the stress envelope. It shows that various parts of ablade experience different loads, with the critical load in the present example in point C.
Figure 2: Example of a Goodman Diagram for a turbine blade [Abell et al. 1977]

Page 4 Doctoral Thesis Markus Jöcker
The vibration behaviour of a blade is described by the blade mode shapes, which are aresult of a modal analysis of the vibrating system. These are flexing (bending) modes,torsion modes, edgewise bending modes and plate modes and describe the deformationof the structure under free vibration. Typical mode shape figures are illustrated in Figure 3showing a fist torsion mode (1T), a second flex mode (2F) and the second edge mode(2E). Under the assumption of cyclic symmetry (i.e. a tuned blade row) thecircumferentially periodic vibration pattern along the annulus of a bladed disk is describedwith the “Nodal Diameter” (ND) of the mode or the “Interblade Phase Angle” (IBPA). This isdescribed in more detail in Chapter 4.1.
1T/43 2F/70 2E/70
Figure 3: Displacement contours of typical blade mode shapes [Green, 2001]
Various mechanisms are commonly defined describing the vibrations of turbomachineryblades, usually classified according to the origin of the excitation. These can be ofmechanical thermal or aerodynamic nature. Mechanical excitations include blade tipcasing contact or foreign object damage; aerodynamic excitations include blade rowinteraction (forced response), self excitation (flutter), impact of cooling jets, compressorsurge and rotating stall as well as turbulence [Murthy et al. 1993]. Figure 4 exemplifies themain unsteady flow effects present in a turbine stage, the blade row interaction is split intowake/rotor interaction and potential interaction (detailed definitions follow in Chapter 1.1.3,“Flow Defects”).
Figure 4: Illustration of unsteadiness in a turbine stage [Giles 1991]

Doctoral Thesis Markus Jöcker Page 5
Self excited vibrations
When the vibrations are self excited (flutter) the vibration motion of the blade itself causesan unsteady pressure field around the blade sustaining the vibration. Such behaviour isusually started by small aerodynamic or mechanical disturbances above a critical flowspeed. It can lead to drastically increasing blade vibration amplitudes and rapid bladefailure, if the mechanical damping is too low to dissipate the aerodynamic energy put onthe blade. Long and slender structures are more prone to flutter, i.e. the fan blades and 1st
stage compressor blades, but also low pressure turbine blades. Flutter is not a problem inthe high pressure turbine.
Forced Vibrations
Forced vibrations (forced response) are characterised by aerodynamic excitation sources,which are flow disturbances acting periodically on the blades and originate from upstreamand/or downstream obstacles. The most common forced vibrations are due to inletdistortions originating at the air intake (inlet struts, cross winds), blade row interactions andhot streaks originating from the burners. Also the burner cans themselves causecircumferential variations in the burner exit flow. The time-periodic excitation is in all casescaused by the relative rotational motion of excitation source and the excited structure,which leads to excitation frequencies multiples of the rotation frequency. A common way toillustrate forced response regions of a blade row is the “Campbell Diagram”, an exampleshown in Figure 5, which is a key plot in the unsteady design process. It shows theeigenfrequencies of the structure as it varies with its rotational speed, in the figure varioustorsion and bending mode frequencies are shown. Furthermore, excitation frequency linesfor various numbers of excitations per revolution (usually called the excitation order, EO)are plotted with constant slope versus rotational speed, in the example excitation ordersdue to burner cans as well as due to upstream and downstream vanes are shown. Whenan eigenfrequency line crosses an excitation line, the risk of resonant excitation of thestructure exists. Practically, in high pressure turbines vane passing does not excite the 1st
flex mode because of its low eigenfrequency (typical frequencies correspond to 8 to 10excitations per revolution in the operating range, compare also Figure 5). Modes at suchlow frequency may vibrate due to low engine order excitation, which can be caused bynon-uniformities due to manufacturing variations and wear (for example vane erosion,burnout). Only the higher blade modes (1T, 2F, 2E, …) are prone to vane passingexcitation, where the majority of problems occur at the 1st harmonic vane passingfrequency.
But not only the excitation frequency must coincide with the blade eigenfrequency, also theexcited mode shape of the structure must fall together with the circumferential and localblade excitation pattern to result in a dangerous excitation. The circumferential consistencyrequirement is expressed in Equation 4-2, with which the interblade phase angle due tothe excitation order can be estimated. If only the blades participate in the vibration, whichis the case at high frequency with relatively stiff disks, this requirement will give theinterblade phase angle of the blade vibration. If the disk is involved in the vibration thenodal diameter of the disk mode must meet the excitation order to be receptive for theexcitation (see further [Ewins, 1988]). Therefore, not all crossings in the Campbell Diagramare marked as resonance conditions. The receptiveness of the local blade mode shape to
Page 6 Doctoral Thesis Markus Jöcker
the excitation pattern is part of the present work. Even though several conditions mustcoincide for a forced response occurrence it is not trivial to avoid it because of the amountof engine order excitation sources present in an engine. Typically, the designer avoids theempirically most critical resonant excitations, but he is not able to eliminate all resonanceconditions in the operating range of the engine.
Figure 5: Example of a Campbell diagram [Jay et al. 1988]
Dynamic aeroelasticity of turbomachinery blades
If turbomachinery blades are aerodynamically excited to vibrate, no matter if self- orexternally excited, a complex interaction between the unsteady flow around the blades andthe involved solid structures takes place: The unsteady flow causes the blades to vibrate,whereas the blade motion itself modifies the unsteady flow. Hence, a coupling existsbetween the structural behaviour of the blades (mass, stiffness, damping, friction, fixation)defining the blade motion and the unsteady flow defining the excitation. This is classicallyshown by “Collar’s Triangle of Forces” [Collar 1946], which illustrates the interactionbetween inertia forces, elastic forces and aerodynamic forces. This triangle is sometimesextended by a vertex for thermal forces and a vertex for control forces, two additionalparameters increasing the complexity of the problem.

Doctoral Thesis Markus Jöcker Page 7
1.1.3 What controls blade vibrations of turbomachinery blades?
As vibrations in turbo engines have been a problem since the early beginning of theirdevelopment, there exist numerous empirical and semi-empirical methods to suppressvibrations. These are usually devices to modify the mechanical behaviour of the structureto avoid resonance. Also the adaptation and control of aerodynamic parameters hasbecome a possibility to optimise the vibration behaviour of engine components, which inturn requires the knowledge of the unsteady flow phenomena in the machine. Thefollowing section will summarise the most important measures to control the bladevibration behaviour with help of constructive measures, mechanical and dampingmeasures, mistuning and unsteady aerodynamic measures.
Constructive measures
Figure 6 shows a 2D blade section of a turbine stage and some main constructivemeasures influencing the aerodynamic excitation explained below. Also the wake and thepressure wave emanating from the stator are illustrated in the figure.
Figure 6: Illustration of potential and wake excitation sources and constructive parametersin a turbine stage [Korakianitis 1992a]
• Axial distances between blade rows (“d” in Figure 6) have a direct impact on theunsteady aerodynamic interaction, the potential excitation decreases exponentially with

Page 8 Doctoral Thesis Markus Jöcker
axial distance, whereas the wake excitation diminishes only slowly with axial distance.Changing the axial gap means also changing the length of the whole engine, which hasimplications on the complete engine design. Smaller axial gaps would reduce theweight of the engine, which is to consider in aero engines.
• The pitches of the blade rows (Ssb and Srb in Figure 6) do not only change theexcitation frequency in stator-rotor interactions but also the strength of pressure waveinteractions (potential excitations). The solidity (pitch to chord ratio) has also anoptimum regarding the stage losses. Furthermore, a reduction of vanes or bladeswould give weight savings without impact on other part designs (as a change in axialgap would have), which is to consider for aero engines.
• The stagger angle influences both the steady and the unsteady load and is thereforenot straightforward to modify to reduce the aerodynamic excitation.
• Low aspect ratio blades are more exposed to resonance [Murthy et al.1993].• When disk and blades are manufactured from one piece (“blisks”) reduced mechanical
damping is present compared to conventional bladed disks [Murthy et al. 1993]because of the lack of friction contacts between blades and disk.
• The circumferential alignment of stator blade rows or rotor blade rows in a multistageengine, known as “clocking” or “indexing”, can be beneficial for reducing losses andmaybe also to reduce excitation impact. Determination of the optimum clockingpositions is a presently very active research area (e.g. [Arnone et al. 2001]).
Mechanical modifications and damping devices
The classical method to tackle vibration problems of turbomachine blades, once they aredetected, is to change the vibration characteristics of the structure by modification ofdamping and stiffness of the system. Damping is inherent to the aeroelastic system in formof friction damping, material inherent damping (usually small) and aerodynamic damping. Itdecreases the vibration amplitude whereas a stiffness modification shifts the resonancefrequency. However, stiffness modification may not be sufficient for engines with varyingoperating conditions, i.e. aero-engines. One straightforward and classical approach ofmechanical modification is to connect the blades within a blade row with wires or laces.Beside the added weight another drawback of this method is the weakening of the bladesdue to the necessary holes to fasten the wire or lace. More advanced is the use of partspan shrouds, which is common practice to stabilise fan blades and long compressorblades. Part span shrouds establish a friction contact between the blades at a certainblade height. Also this measure adds weight to the engine and can be problematic as itdisturbs the main flow introducing increased risk of flow separation. The design of theshrouds is an active research area (see for example [Sextro 2000]). In turbine designs theuse of tip shrouds is possible.
The vibration characteristics of turbine blades can be modified with “under platformdampers”. These dampers do not disturb the flow, but modify the vibration characteristic ofthe blades by changing the friction contact between neighbouring blades. Currently,considerable research work is done regarding the design of these dampers [Jareland et al.2000], [Panning et al. 2000]. Future developments of damping devices include magneto-mechanical blade surface coatings [Yen et al. 2000] or the inclusion of friction material inhollow blades [Griffin et al. 1996]. These methods are interesting for “blisks”, where noblade to blade damping can be established.

Doctoral Thesis Markus Jöcker Page 9
Mistuning
Recent research work (for example [Silkowski et al. 2001]) points out that the beneficialeffect of mistuning on flutter can be applied to suppress self-excited blade vibrations ofcompressor blades or low pressure turbine blades (high pressure turbine blades do notflutter). There are approaches towards using intended mistuning for optimising thevibration behaviour of blade rows in turbomachines. However, in the case of forcedresponse blade vibrations mistuning effects can cause mode localisation leading toamplified vibrations of singular blades in a blade row. Such effects are obviously in conflictwith the beneficial one of mistuning to suppress flutter. Mistuning as a possibility ofpassive forced response control is proposed in [Chiang et al. 1992], where incompressibleoperating turbine rotors were detuned both structurally and aerodynamically bycircumferentially varying rotor spacing. Also the distortion of the excitation periodicity canbe regarded as an aerodynamic mistuning, for example the excitation due to an upstreamstator can be mistuned by introducing vane to vane geometry differences in the stator.Clark et al. [2002] have demonstrated the potential to reduce vibratory response of a high-pressure turbine rotor by such a modification of the upstream stator.
Unsteady aerodynamics
The flow in turbomachines is highly unsteady, and indeed without unsteadiness it wouldnot be possible to convert aerodynamic work to mechanical work and vice versa. Besidethis unsteadiness brings several benefits and drawbacks regarding the performance (timeaveraged flow aspects), flow stability (surge and stall in compressors) and blademechanical integrity (time resolved flow aspects). The following part will give a shortintroduction to the unsteady aerodynamics present in turbine stages (and partly also incompressor stages) with focus on the impact on blade vibration risks.
Flow DefectsIn case of forced response blade vibrations the aerodynamic excitation mechanism is dueto flow defects, which are spatial non-uniformities in the flow field upstream or downstreamof the observed blade row. These flow defects are usually regarded as steady in thereference frame of the generating obstacles. They become unsteady when moving relativeto the observed blade row. Flow defects can be related to different physical phenomena,the most relevant are listed below [Kielb et al. 1992].
• Wakes are generated due to the development of a boundary layer on the bladesurfaces, which separate from the blade at its trailing edge. The wakes arecharacterised by a velocity deficit of a certain magnitude, a spatial width and a(negligible) small static pressure deficit. The low momentum fluid inside the wake hasincreased vorticity and entropy and is convected with the local flow velocity. It is clearthat the wake is a completely viscous phenomenon. Many empirical and semi-empiricalmodels exist to describe the wakes behind turbomachine blades.
• Vortex shedding behind a vane or blade (see Figure 4) is another flow defect related tothe detachment of the boundary layer at the trailing edge. In case of occurrence leftand right rotating vortices are shed at a Reynolds number dependent frequency, which
Page 10 Doctoral Thesis Markus Jöcker
is usually much higher than typical wake passing frequencies. The related disturbanceon the downstream rotor is hence a superposition of wake passing and vortexshedding. Due to the high frequency and small velocity variations (see also [Hummel2001] the vortex shedding related excitation is usually not regarded in forced responseproblems. However, it has a significant impact on performance.
• The static pressure field upstream and downstream of a blade row is varyingcircumferentially (and radially) due to the blade load. This causes a flow defect, whichis felt as unsteady pressure waves by the relative moving blade rows. It is an inviscidphenomenon commonly modelled with potential flow theory. A simplified analysis of theproblem (i.e., [Hodson 1998]) expresses that the upstream and downstream potential
field is proportional to a term of type S
dM
e212 −⋅⋅− π
. Here, d is the distance from the blade,S is the pitch. The potential wave induces also a relatively small velocity deficit, whichcan be assessed with help of linear potential flow theory (Chapter 4.2).
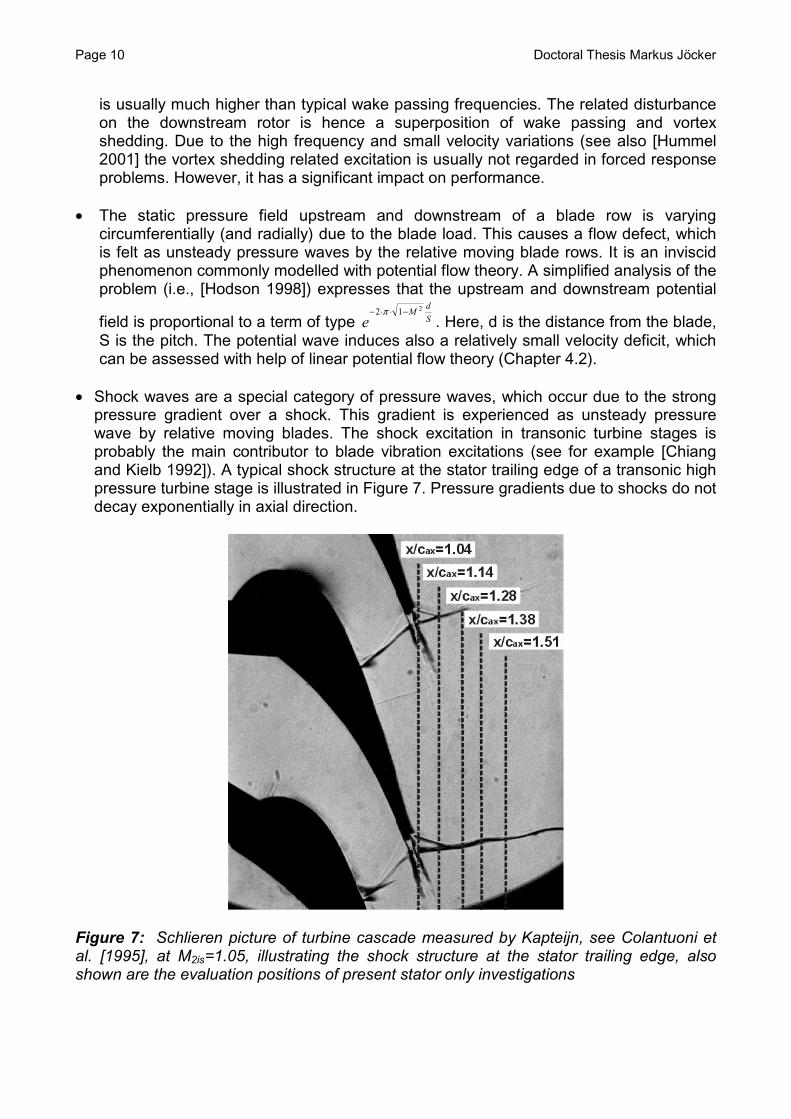
• Shock waves are a special category of pressure waves, which occur due to the strongpressure gradient over a shock. This gradient is experienced as unsteady pressurewave by relative moving blades. The shock excitation in transonic turbine stages isprobably the main contributor to blade vibration excitations (see for example [Chiangand Kielb 1992]). A typical shock structure at the stator trailing edge of a transonic highpressure turbine stage is illustrated in Figure 7. Pressure gradients due to shocks do notdecay exponentially in axial direction.
Figure 7: Schlieren picture of turbine cascade measured by Kapteijn, see Colantuoni etal. [1995], at M2is=1.05, illustrating the shock structure at the stator trailing edge, alsoshown are the evaluation positions of present stator only investigations

Doctoral Thesis Markus Jöcker Page 11
• Inlet distortions are related to all effects at the machine’s inlet, which cause a deviationof axisymmetry of the inlet flow, such as the inlet support structure itself, crosswindsduring ground running and severe manoeuvres during flight for aero-engines, partialadmission for steam turbines. Partial admission is a method to control steam turbinepower output by blocking one or several circumferential inlet segments to reduce themass flow. This causes large circumferential pressure distortions (see for example [He2001]).
• Hot streaks are caused by variations in combustor outlet temperature, which can lead tosevere unsteady temperature loads in the first high pressure turbine stage.
• Several passage vortices are present in the blade rows of turbines and compressors,which are summarised as secondary flow effects (see Figure 8). These are inherentlythree-dimensional and are generated by the local pressure gradients in the passages.(tip clearance leakage, end wall boundary layer induced vortices at hub and tip). Recentthree dimensional investigations (e.g., [Fan and Lakshimanarayana 1996]) have pointedout that these can significantly influence the unsteady blade surface pressures, even ifthe steady flow can be considered as two-dimensional.
Figure 8: Secondary flow phenomena in a turbine blade cascade [Takeshi et al. 1989]
• The gust is defined as “... rapid increase in wind speed relative to the mean strength ata time ...” [AGARD 1980]. The gust is a common way to describe flow defects at theinlet or outlet of a blade row in terms of the flow velocity defect. The gust due topressure non-uniformity is called potential gust, the gust due to the wake is calledvortical gust and an entropy gust related to entropy variations is used additionally intransonic flow descriptions. This distinction of gust types originates from the linear flowanalysis based on the Euler equations (see also Chapter 4.2).
Page 12 Doctoral Thesis Markus Jöcker
It is obvious that the control of the flow defect has the potential to control the bladeexcitation and hence the blade vibration. In particular, the various flow defects can interactwith each other (i.e. wakes and pressure waves, shock – wake interaction) and by thateither amplify or diminish blade excitation. The present work is aimed at identifying therelative influence of flow defects and of their interaction on high pressure turbine bladeexcitation with regard to constructive measures. The active aerodynamic modification offlow defects is a further way to aerodynamically control blade vibration. This is for examplethe wake modification by blowing air out of the wake generating trailing edge of blades[Ubaldi et al. 2001]. Such measures are not subject of the present work.
Aerodynamic dampingThe unsteady aerodynamic damping is a beneficial unsteady flow effect regarding theblade vibration in turbomachines as long as it is positive. If it is negative flutter occurs,which by all means must be avoided in the operating range of the engine. The beneficialpositive aerodynamic damping to the forced response of blades is mostly neglected indesign considerations, because it is regarded low compared to mechanical damping. Thisdisregard of aerodynamic damping gives an additional (unknown) safety margin towardsHCF failure. Recent work by Kielb et al. [2001] came to the conclusion that theaerodynamic damping can be a significant distributor relative to typical structural dampingin turbine blades. The central parameters controlling the aerodynamic damping are listedbelow. These parameters are mainly evaluated regarding their influence on flutter stabilitybecause of its historical importance.
• The reduced frequency expresses physically the ratio of flow velocity to blade vibrationvelocity. Empirical limiting values state that flutter occurs mainly at low frequencies i.e1st flap mode k<0.2, 1st torsion mode: k<0.6 [He 2001]. At very low frequencies thevibration is regarded as quasi steady, i.e. at each instant of time the steady flowcondition corresponding to the current blade positions establishes.
• The interblade phase angle measures the circumferential wave length, which is fixed tothe flow defect periodicity for forced response (see Equation 4-2). In the flutter caseblade vibrations do mostly not have to follow a certain circumferential periodicity,instead a worst case interblade phase angle is often applied to judge the flutter risk.However, the interblade phase angle has a significant influence on the aerodynamicdamping, for example He [2001] shows its influence on the shock oscillation on acompressor profile.
• The influence coefficients describe physically the influence of a vibrating blade on theaerodynamic damping on itself and on each other in a blade row. This concept iscompletely consistent with the concept of interblade phase angles [Bölcs 1989] butgives a different physical approach to the problem. Understanding the dampinginfluence of vibrating blades on each other can give insight to stabilise blades orincrease the damping.
• Shocks and all other large flow gradients (i.e. separations) can contribute significantlyto vibration excitation once they are oscillating due to the blade motion.
• Recent research has pointed out the significant dependency of the aerodynamicstability on the blade mode shape ([Panovsky and Kielb 1998], [Tchernycheva et al.
Doctoral Thesis Markus Jöcker Page 13
2001]. Stability maps showed very similar trends of stability in dependence of thetorsion axis location for several subsonic low-pressure turbine vanes and blades.
The control of these parameters beyond the avoidance of flutter could enhance thestability of forced vibrations.
1.1.4 Why is the high-pressure turbine stage of interest?
The present work focuses on the aerodynamic excitation mechanisms due to the unsteadyflow in the high-pressure turbine part of axial gas-turbine engines with respect to thedesign of the turbine vanes and blades. The unsteady flow in the high-pressure turbineattracts large attention presently because
- The high-pressure turbine stage performance has a large impact on the overall engineefficiency (e.g. [Michelassi et al. 1998]).
- It operates in an extremely hostile environment, which puts extreme requirements onmaterial and cooling technique to ensure structural integrity. Friedrichs [2001] statesillustrative these conditions: “…a gas temperature of 1600°C, which is 200 °C abovethe melting point of the blade material, 10000 rpm result in a steady load equivalent toa lorry hanging at each blade, the energy transfer is about 750 horse powers perblade…”.
- High cycle fatigue problems are likely to occur due to the large steady and unsteadymechanical and thermal loads.
1.2 Problem Formulation
“The basic problem in the aerodynamic design of an axial flow turbine is obtaining themaximum overall efficiency within the limitations imposed by stress, turbine matching, andother considerations, such as efficiency trade-off versus the number of stages”, [Fielding2000].
The designer of future gas turbine engines is asked to develop reliable, safe and costefficient engines and must at the same time meet the aggravated constraints due toperformance, structural integrity and maintenance requirements as well as environmentalrestrictions. In particular, one difficult problem to solve is to ensure a guaranteed lifetime ofthe components, which is strongly related to the vibration behaviour of the structure.Performance improvements implicate often higher vibration risks of the turbomachineblades. The high-pressure turbine is in a key position both regarding the influence on theengine efficiency and the thermal and aerodynamic load, so the blades are prone to highcycle fatigue due to forced response. In order to incorporate vibration risk assessment ofthe blades in an early design phase, which in turn reduces design iterations anddevelopment costs, the designer needs suitable tools, which are as simple as possible andas accurate as necessary. The knowledge of fundamental design rules based on theunderstanding of the physics to avoid blade vibration problems would be very beneficial.As the primary cause of blade vibrations must be found in the unsteady aerodynamics thepresent work concentrates on the unsteady flow in turbines to assess and understand therelevant unsteady aerodynamic excitation mechanisms.
Page 14 Doctoral Thesis Markus Jöcker
1.3 Structure of the present work
Chapter 2 gives a state-of-the-art review regarding unsteady numerical tools andperformed design studies in the open literature. Chapter 3 states the objectives of thepresent work and the approach to achieve them. Chapter 4 provides the theoreticalbackground to the performed evaluations and Chapter 5 introduces the two turbine stagesand the vibrating blade cascade on which the computations were performed. In Chapter 6the results are summarised and discussed with reference to the publications 1-6 in theAppendix. That part of the thesis comprises rather a critical completion of the publishedwork than a pure repetition of the results in the publications. It is split into the sections“Validations”, “Excitation Mechanisms”, “Parametric Studies” and finally “Potential forUnsteady Design Improvements”, and each of these aspects is discussed based on themain findings in the investigated turbines. The thesis is completed with a conclusionssection and statements on the future work from the author’s perspective. Some aspects ofthe applied numerical tools are given in the Appendix with reference to the originaldevelopmental work published in the open literature.
Doctoral Thesis Markus Jöcker Page 15
2 STATE-OF-THE-ART
The present review of the state-of-the-art focuses on the design process of gas turbinestages with emphasis on the available unsteady aerodynamic methods and genericunsteady flow design studies. Prefacing the general design process is described as iscommon practice in industry to the knowledge of the author.
2.1 Sketch of the general turbine design process
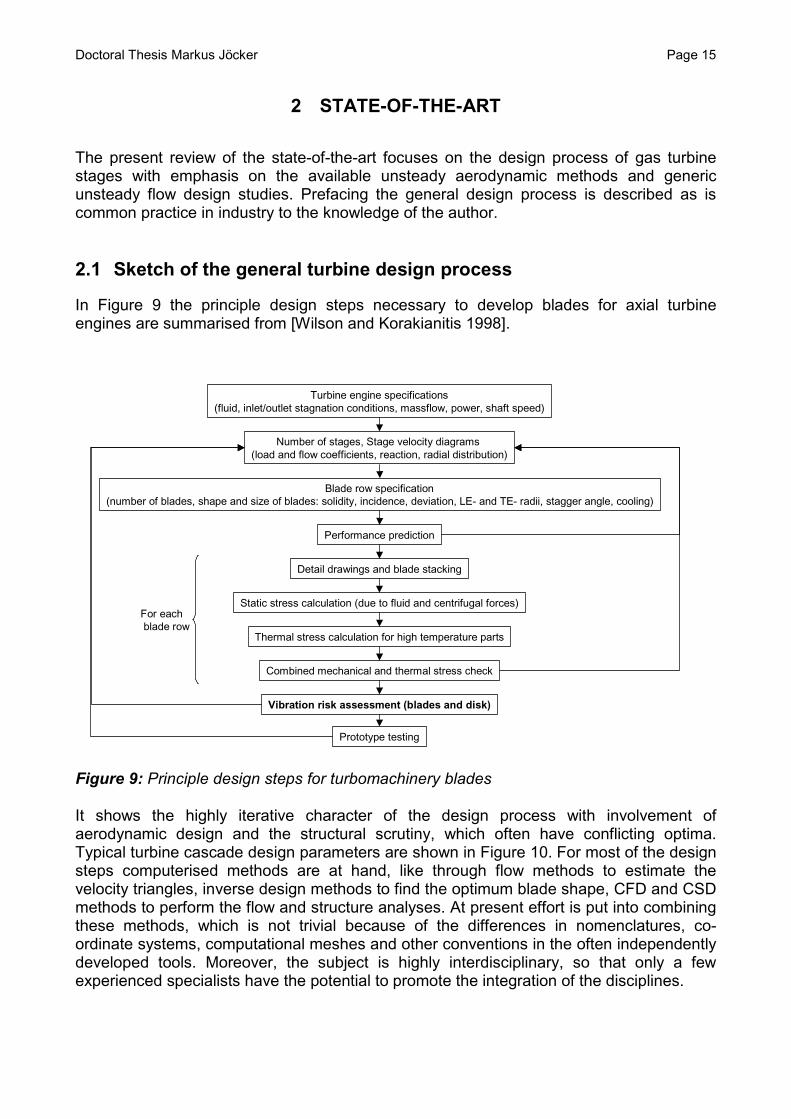
In Figure 9 the principle design steps necessary to develop blades for axial turbineengines are summarised from [Wilson and Korakianitis 1998].
Turbine engine specifications(fluid, inlet/outlet stagnation conditions, massflow, power, shaft speed)
Number of stages, Stage velocity diagrams(load and flow coefficients, reaction, radial distribution)
Blade row specification(number of blades, shape and size of blades: solidity, incidence, deviation, LE- and TE- radii, stagger angle, cooling)
Performance prediction
Detail drawings and blade stacking
Static stress calculation (due to fluid and centrifugal forces)
Thermal stress calculation for high temperature parts
Combined mechanical and thermal stress check
Vibration risk assessment (blades and disk)
For eachblade row
Prototype testing
Figure 9: Principle design steps for turbomachinery blades
It shows the highly iterative character of the design process with involvement ofaerodynamic design and the structural scrutiny, which often have conflicting optima.Typical turbine cascade design parameters are shown in Figure 10. For most of the designsteps computerised methods are at hand, like through flow methods to estimate thevelocity triangles, inverse design methods to find the optimum blade shape, CFD and CSDmethods to perform the flow and structure analyses. At present effort is put into combiningthese methods, which is not trivial because of the differences in nomenclatures, co-ordinate systems, computational meshes and other conventions in the often independentlydeveloped tools. Moreover, the subject is highly interdisciplinary, so that only a fewexperienced specialists have the potential to promote the integration of the disciplines.

Page 16 Doctoral Thesis Markus Jöcker
Figure 10: Cascade design parameters [Wilson and Korakianitis 1998]
Industrial design practice is to perform the aerodynamic throughflow and blading designfirst on 2D stream sheets before the 3D flow behaviour is investigated. Present designsystem improvements aim to invoke fully 3D flow predictions into design routines with helpof correlation, databases, artificial neural networks and 3D inverse methods (see forexample [Shahpar 2001] and [Van den Braembussche 2001]). Promising is thedevelopment of “adjoint methods” for unsteady design parameters allowing the search foroptimum design regarding unsteady performance parameters [Campobasso et al. 2001],[Florea and Hall 2001]).
Figure 9 also points out that vibration assessment is very late in the process and canrequire the re-design of the stages. To enhance the design process it is aimed at findingdesign criteria which can be applied in an earlier design phase as well as accelerating thevibration assessment approaches. The following section will give the state-of-the-art ofprediction methods to assess the vibration risk of turbomachinery blades with focus on theunsteady aerodynamics.
2.2 Predictive methods to assess the vibration risk with focus on theunsteady aerodynamics
The assessment of vibration risk of turbine blades consists of the proof that the design isflutter free and that the vibration levels at unavoidable crossings in the Campbell diagram(Figure 5) are acceptable so that maximum stresses fall well below the endurance limit. Toachieve that numerical tools and prediction systems of varying complexity exist. Wisler[1998a] stated concerning the state-of-the-art in forced response predictions: “The currentstate-of-the-art shows a comparison of analysis and measurement ranging from goodagreement to more than a factor of ten difference. A typical absolute prediction is within afactor of three. Relative predictions are used regularly to compare designs for differentengine conditions.”
Doctoral Thesis Markus Jöcker Page 17
Forced response prediction is obviously a difficult task, because several parameters areinvolved, which are hard to assess:
• The exact geometry under operating conditions, which is dependent on the rotationalspeed and influences the steady aerodynamics
• The excitation itself due to the complex unsteady aerodynamics (details see below)• The coupling between aerodynamic excitation and blade vibration (see below)• The mode shapes of the blades, because stiffness and mechanical damping values
change during engine operation• The vibration modes of the bladed disk, where single blade modes can be coupled
through the disk or the fluid• The non-linear mechanical damping, which might be introduced by dampers and
shrouds or simply is present due to friction in the blade fixations• Circumferential variations of mass, stiffness, damping, frequency, mode shape or
geometry parameters due to manufacturing tolerances introduce mistuning andcomplicate the problem even more having a significant influence on the forcedresponse behaviour
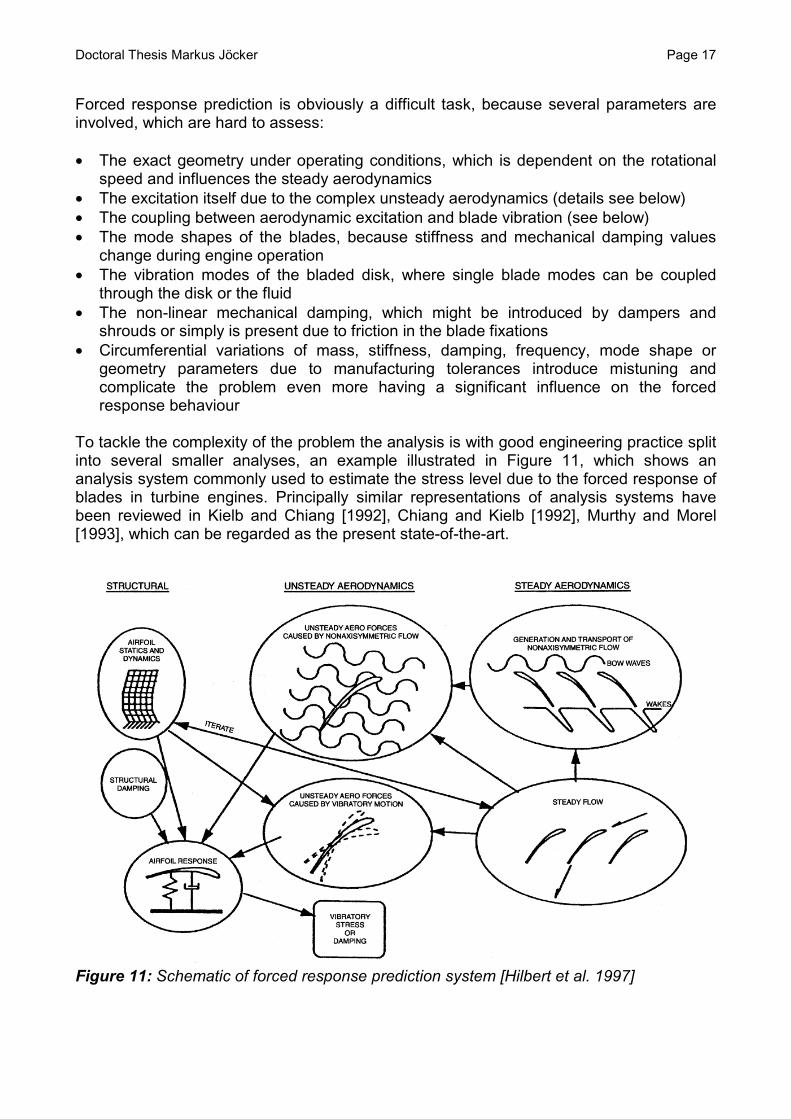
To tackle the complexity of the problem the analysis is with good engineering practice splitinto several smaller analyses, an example illustrated in Figure 11, which shows ananalysis system commonly used to estimate the stress level due to the forced response ofblades in turbine engines. Principally similar representations of analysis systems havebeen reviewed in Kielb and Chiang [1992], Chiang and Kielb [1992], Murthy and Morel[1993], which can be regarded as the present state-of-the-art.
Figure 11: Schematic of forced response prediction system [Hilbert et al. 1997]

Page 18 Doctoral Thesis Markus Jöcker
A structural analysis provides the mode shapes and eigenfrequencies of the blades. Initeration with the steady aerodynamic analysis, which gives the steady blade load, it alsoprovides the static displacement at operating conditions. Once the steady conditions andgeometry are established flow disturbances might be estimated, which are all non-axis-symmetric flow structures causing unsteady flows in relative moving blade rows. With helpof these or by performing unsteady stage analyses the forcing function, i.e. the unsteadyblade forces due to flow disturbances can be calculated. The steady flow solution is alsobasis for the estimation of the unsteady blade forces and aerodynamic damping due toblade vibration, where the blade motion is obtained from the structural analysis. Having theforcing function and the aerodynamic damping the blade response can be calculated.Structural damping is often regarded by empirical damping models.
Applied design systems differ in the tools used for the various analyses as well as in thedegree of interaction allowed between them. Tools for structural analyses are wellestablished and commercial software packages are routinely used. On the CFD side thesteady flow analysis seems to be sufficiently developed for engineering purposes, eventhough many flow aspects like boundary layer details and transition as well as turbulenceprediction are only weakly captured by state-of-the-art methods. For the sake ofcomputational efficiency simple models are still regularly applied (algebraic turbulencemodels and transition prescription are mainly used in industry, for research purpose two-equation turbulence models are often applied) even though boundary layer and turbulenceprediction might have significant impact on the unsteady flow prediction, especially in theinteraction with shocks [Kielb and Chiang 1992].
In the field of unsteady aerodynamics numerous code developments and computationalresults have been presented. The main development trends in computational methodswere to switch from 2D approaches to 3D approaches, improvements of farfield boundaryconditions as well as periodicity treatment, development of linearised methods includinglinearisation of the viscous flow equations. As the main subject of this work is theprediction of unsteady flows a more detailed review will be given below regarding bothmethods development and applications.
Another research field is the study and implementation of integrating the structural andunsteady aerodynamic solutions. The application of an integrated method to solve a fluid-structure coupled problem means that a tight interaction between the aerodynamic fieldand the structure field is allowed in the solution process, i.e. the fluid can modify thestructural motion and vice versa. Integrated methods get increased attention also inindustry due to the recognised need to permit coupling and the possibility to performcoupled analyses with increased computational resources. However, they are not yetintroduced into common practice of unsteady design. Some reasons for that might be 1.The analysis is more complex and needs interdisciplinary knowledge of the user and 2.Many problems can be solved sufficiently with a de-coupled approach. Severalapproaches are documented in the open literature and Marshall and Imregun [1996]published a review recently. They distinguish between “Classical Methods” (uncoupled),“Partially Integrated Methods” and “Fully Integrated Methods”, the latter ones using thesame equation solver for both the structural and aerodynamic equations. The approachesare usually documented for flutter analyses but apply as well for forced response analyses.This is due to the practice of forced response analyses as described above, where aseparate calculation gives the aerodynamic damping due to the blade vibration. Suchforced response analyses do not allow for interactions between the forcing effects and
Doctoral Thesis Markus Jöcker Page 19
vibration effects on the flow. Only recent research ([Vahdati et al. 1998], [Breard et al.2000], [Schmitt et al. 2001]) has investigated the effect of these interactions on the forcedresponse using a coupled analysis approach.
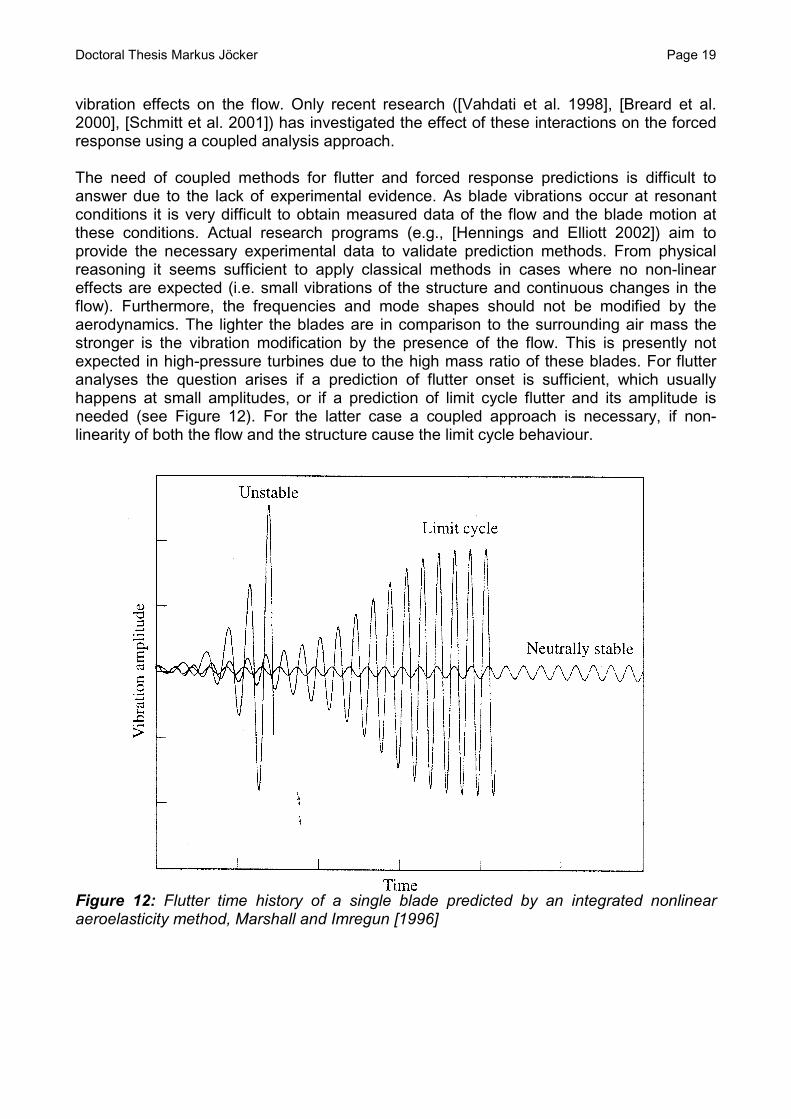
The need of coupled methods for flutter and forced response predictions is difficult toanswer due to the lack of experimental evidence. As blade vibrations occur at resonantconditions it is very difficult to obtain measured data of the flow and the blade motion atthese conditions. Actual research programs (e.g., [Hennings and Elliott 2002]) aim toprovide the necessary experimental data to validate prediction methods. From physicalreasoning it seems sufficient to apply classical methods in cases where no non-lineareffects are expected (i.e. small vibrations of the structure and continuous changes in theflow). Furthermore, the frequencies and mode shapes should not be modified by theaerodynamics. The lighter the blades are in comparison to the surrounding air mass thestronger is the vibration modification by the presence of the flow. This is presently notexpected in high-pressure turbines due to the high mass ratio of these blades. For flutteranalyses the question arises if a prediction of flutter onset is sufficient, which usuallyhappens at small amplitudes, or if a prediction of limit cycle flutter and its amplitude isneeded (see Figure 12). For the latter case a coupled approach is necessary, if non-linearity of both the flow and the structure cause the limit cycle behaviour.
Figure 12: Flutter time history of a single blade predicted by an integrated nonlinearaeroelasticity method, Marshall and Imregun [1996]

Page 20 Doctoral Thesis Markus Jöcker
Unsteady Aerodynamics – Methods
Great progress has been achieved in the development of numerical tools suited for theinvestigation of the unsteady aerodynamic effects due to blade row interaction and bladevibration. The following summary is not complete but covers the main milestones achievedduring the last two decades.
Single blade row models:An important step from analytical analyses of unsteady cascade flows on flat plate models(LINSUB [Smith 1972; Whitehead 1987] was the development of unsteady time-linearisedpotential flow solvers, mainly to name FINSUP [Whitehead et al. 1985, 1987, 1990] andsubsequent modifications for gust response by [Suddhoo and Stow 1990] and by Verdonand his colleagues (LINFLO [Verdon and Caspar 1984]). These models were two-dimensional (2D) on blade to blade planes considering radial effects with source terms inthe 2D flow equations (quasi-three-dimensional (Q3D) approach). Their advantage overthe analytic methods was that they consider the influence of the non-uniform steady bladeload on the unsteady pressure response. The limitation of these methods to irrotationaland isentropic flows was most relevant for transonic and supersonic flows, for whichdifficulties in the shock prediction enforced the development of time-linearised Eulersolvers (for example [Hall and Crawley 1987], [Kahl and Klose 1991]). These were laterextended to three-dimensional models (e.g., [Hall and Lorence 1992], [Marshall and Giles1997], [Kahl 1997] [Montgomery and Verdon 1997]). Recently, also time-linearised NavierStokes solvers were presented (e.g., [Holmes et al 1997]). All linearised methods werebased on the assumption that the unsteady flow is a small disturbance to the steady flow.For most flutter cases this assumption is justified because the prediction of flutter onset atsmall blade vibration amplitudes inducing small flow perturbations is the desired result.The validity of linearity of forced response predictions is not so clear, but severalvalidations demonstrated a good agreement of the results by linearised methods and bynon-linear time marching methods even for transonic flows ([Marshall and Giles 1997],[Sudhoo and Stow 1990]). In the vicinity of shocks or for large blade vibration amplitudesor in case of flow separations the validity of the linearised methods is not clear today.
Also non-linear time marching methods were developed and applied to solve both flutterand forced response aerodynamics. The solution of the Euler equations (for example by[Pandolfi 1980], [Hodson 1985], [Fransson and Pandolfi 1986], [Carstens 1993]) wasextended to also regard viscous effects. Either the efficient hybrid invscid/viscousapproach were used, where the Reynolds averaged Navier-Stokes equations are onlysolved in thin layers around the blades (e.g., [Giles 1991], [Hwang and Liu 1993]) or fullyviscous approaches were applied (for example [Siden 1991]). Subsequent 3D methodswere developed (beside others by [Gerolymos 1993], [Groth 1996], [Grüber and Carstens1996]). The non-linear methods came along with complications to treat the far-fieldboundaries of the steady and unsteady computations: inlet and outlet boundary conditionsshould be non-reflecting for waves leaving the computational domain, but incoming waves(gust) as specified for blade excitation calculations must be allowed. A two dimensionaltreatment was introduced for turbomachinery applications by [Giles 1988, 1989], a steadyquasi three dimensional approach by Saxer and Giles [1993] and also an unsteady threedimensional approach was presented [Fan and Lakshminarayana 1996]. An importantextension of the inlet/outlet boundary conditions treatment was given by Sillkowski and
Doctoral Thesis Markus Jöcker Page 21
Hall [1997], who demonstrated the importance of partly reflecting boundary conditions tomodel wave reflections from upstream and downstream blade rows on blade flutterstability.
The described single blade row approaches differ for blade vibration and blade excitationapplications mainly in the specification of the boundary conditions. Whereas the first kindof simulation needs a treatment of moving blades in the computational domain, bladeexcitation calculations need, as named above, a specification of (empirical, semi-empiricalor computed) unsteady inlet and outlet boundary conditions, which requires assumptionson the relative flow distortion at these boundaries. On the other hand single blade rowmethods to calculate the forcing function allow the isolated study for different distortiontypes, which are described as potential, vortical and entropical type. A comprehensivecomparison of state-of-the-art gust method results to experimentally obtained unsteadyblade surface pressures has been shown by Manwaring and Wisler [1993]. By comparinglinear to non-linear method results they concluded that for the investigated subsonicturbine and compressor cases non-linear effects were not significant. They also pointedout the importance to correctly specify the gust to obtain a good agreement tomeasurements, especially the potential gust specification for the turbine computation isessential. Chen [1994] compared his frequency domain potential method using empiricalwake models to predict unsteady blade pressures to experimental data and viscouspredictions. Good agreement was found for the investigated low speed turbine both on thestator and on the rotor.
Multi-blade row models:To account for the details of complex blade row interactions, as they can occur whenshocks interact between the blade rows or when the axial gap is so narrow that potentialwaves interact bi-directionally, computations on single blade rows were coupled to multi-blade row computations. These time accurate computations work with relative movinggrids fixed to the respective stator model and rotor model. Time accurate transfer of theflow variables between the relatively moving grids accounts for the interaction of the twoflow fields. Also time averaged transfer of these variables is documented (“mixing planeapproach”, a comprehensive review is provided in [Adamczyk, 1999]) but this has moreimportance for the performance computations and is less applicable to predict the forcingfunction [von Hoyningen-Huehne et al 1999a]. Early works of unsteady full stage turbinestator-rotor computations appearing in open literature are by Koya and Kotake [1985](inviscid 3D), Fourmaux [1986] (inviscid 2D), Lewis et al. [1987] and by Rai [1989] (3Dviscous). The introduction of time inclination for stage calculations by Giles [1988b, 1990]was an important development step and removed blade count restrictions, which otherwisehave been treated by scaling of blade rows to handle the circumferential periodicity withphase lagged boundary conditions (see below). Clark et al. [2000] demonstrated recentlythat the scaling of blade rows can significantly change the unsteady flow simulation resultcompared to the correct (non-scaled geometry) result. An implementation of the timeinclined method to a 3D-Navier-Stokes solver was reported by Jung et al. [1996], Laumertet al. [2002] included time inclination in a 3D Euler method. Comparisons of full stagecomputations to single blade row computations by Barter et al. [2000] suggest that evenfor transonic flows with shock interaction in a high pressure turbine stage the single bladerow approach captures the primary rotor excitation effects. But the vane excitation due tothe passing downstream rotor needs a stage computation approach to capture the

Page 22 Doctoral Thesis Markus Jöcker
important excitation features. Recent code developments are presented among others byDawes [1993], Liamis [1994], Michelassi et al. [1998], Eulitz et al. [1998] and He [1999].
Note on 3D methods:Either 3D methods or Q3D methods applied on stream sheets at several radii can providethe complete forcing function and aerodynamic damping for a blade. Hilditch [1998]demonstrated the importance to correctly specify the stream height evolution in Q3Dmethods to match the blocking effects, which is crucial for an acceptable steady andunsteady flow prediction, especially in transonic flows. As the required stream heightevolution is often not the geometrical one its specification needs an a-priori steady 3Dcalculation or empirical data. Investigation of the flow at several stream sheets may givethe complete forcing function, but mixing processes between stream sheets are present atleast in low aspect ratio turbines. Furthermore, hub and tip casing as well as tip leakageflow do induce secondary flows, which may influence the 3D blade excitation. Fan andLakshminarayana [1996] studied a subsonic turbine stage with a 3D inviscid single bladerow approach, specifying the secondary flow and wake at the rotor inlet with 3D non-reflecting boundary conditions. It has been stressed that the 3D secondary flow field hassignificant influence on the unsteady blade pressure, even at midspan where the steadyflow can be regarded as two dimensional. Busby et al. [1999] and Vanable et al. [1999],Weaver et al. [2000] and Haldeman et al. [2000] compared numerical results obtained withvarious models to experimental data. The first two publications evaluated the results atmidspan of a transonic turbine stage and concluded good agreement between 2D and 3Dmethods. The latter two publications investigated a counter-rotating transonic turbinestage. The comparisons suggested that both 2D and 3D codes are capable to predict theunsteady flow features of the investigated turbines at midspan, but at other blade heights3D effects are significant for the unsteady flow features. The above named complicationsin using 2D methods and the today non-significantly larger effort to perform 3D analysessuggest 3D methods for use in design applications (see also [Kielb 2000]), whereas 2Dmethods have their main justification in phenomenological and parametric studies.
Note on periodicity treatment:To treat circumferential periodicity the direct store method by Erdos [1977] was regularlyapplied both for linearised and non-linear solvers. It stores the solution history of acomplete computational period on the periodic boundaries in order to apply the correctlyphase lagged boundary conditions according to the interblade phase angle of the problem.Thus the computation can be limited to one blade passage for arbitrary interblade phaseangles for flutter predictions. Also for forced response predictions this method is applied,but then it requires that the circumferential extensions of the excitation domain (i.e. theinlet boundary condition, or in full stage simulations the exciting blade row domain) and theexcited blade domain are equal. For unequal counts of excitations and excited blades onthe circumference this was achieved by modelling several passages in combination with ageometric scaling of one of the domains. Giles [1988b, 1990] introduced the concept of the“Time Inclined Method”, which circumvent Erdos’ storage procedure by introduction of atime inclination in the computational space. The grade of inclination is physically limitedand cannot be applied for large interblade phase angles but is very useful to take intoaccount unequal counts of wakes and blades in the computation model without scaling ofblades. The method is however generally limited to two blade rows moving relative to eachother. He [1992] developed another approach to treat the periodic boundaries named
Doctoral Thesis Markus Jöcker Page 23
“Shape Correction Method”, which has the advantage to allow multiple disturbances in theflow (e.g., blade vibrations and gust excitation).
Note on turbulence modelling:Even though turbulence modelling itself is presently an important and active research areathe application of turbulence models to turbomachinery flows is limited. The simplestalgebraic closures of the Reynolds averaged Navier Stokes equations [Cebeci and Smith1974] [Baldwin and Lomax 1978] are still mostly used in all applications. Other modelsbased on the eddy viscosity hypothesis [Boussinesq 1877] are realised with one-equationtransport models (e.g. [Birch, 1987] [Spallart and Allmaras 1992]) and two-equationtransport models [e.g., the k-e models by [Launder and Spalding 1974], [Chien 1982]). Theapplication of non-linear eddy viscosity models is rarely found for predictingturbomachinery flows, mainly due to computational costs of these methods and often forengineering purposes satisfactory results by the simpler models.
Unsteady Aerodynamics – Applications to forced response predictions
A large amount of applied research work has been published during the last two decadesand the following summary will focus on the main achievements of phenomenologicalstudies of unsteady aerodynamic flow predictions in turbine stages and blade rows. Itappears that phenomena are significantly different in subsonic and transonic flows andtherefore the following review is accordingly split.
Subsonic investigations:The numerical investigations in [Hodson 1985] and [Giles 1988b] focused on the detailedanalysis of the unsteady wake effect in a low pressure turbine stage. The incoming wakewas prescribed at the rotor inlet boundary. The “negative jet” effect of the wake was wellpredicted and also the successive cutting roll up and shearing of the wake when passingthrough the rotor passage. However, these works did not investigate the effect of the wakeon the unsteady blade surface pressure, but focused on its influence on boundary layerstatus and related heat transfer characteristics.
Korakianitis [1991, 1992a, b, and 1993a, b] also used a single blade row approach toinvestigate in detail the influences of axial gap and stator blade count and blade size onthe excitations of a rotor blade row in a subsonic turbine stage. He found an optimum axialgap, where vortical and potential excitation effects cancel out partly. Furthermore, hedemonstrated the increased potential and decreased wake influence on the bladeexcitation level with enlarged stator-rotor pitch ratios: high ratios (>3) resulted in mainlypotential excitation and very low ratios (<1) resulted in mainly vortical excitations. He alsofound that an optimum axial gap exists at which vortical and potential excitationmechanisms partly cancel so that the forcing function showed a minimum.
Singh and Hall [1996] investigated axial gap and rotational speed influence on theunsteady blade forces in a test turbine, where the stator was rotating to obtain more easilytest data on the stationary rotor blades. Viscous and inviscid 2D predictions gavesignificantly different excitation forces. The experiments showed a rapid increase of
Page 24 Doctoral Thesis Markus Jöcker
excitation for the smallest axial gap. An analysis of the flow related to the unsteady bladeforces is however not given.
Lakshminarayana et al. [2000] and Chernobrovkin et al. [2000] studied in their two partpaper a subsonic turbine stage describing the influence of numerical parameters,turbulence model and operating conditions on the blade excitation in comparison toexperimental data. Potential excitation was found to be very weak and only present nearthe leading edge of the rotor blade, whereas the other parts of the blade excitation weredue to the wake. The counter rotating vortices generated by the wake choppingmechanism were comparable in predictions and flow field measurements. The wakecaused a high pressure region upstream of the wake centre and a low pressure regiondownstream of the wake centre on suction side, which was directly related to the wakeinduced velocity variations. The influence of the wake on the rotor pressure side wassignificantly weaker.
Von Hoyningen-Huene et al. [1999b] studied the influence of axial gap on a subsonic high-pressure turbine stage using a commercial 2D method and succeeded to derive ageometrical design rule for the axial gap with regard to rotor incidence angle variation.Potential and wake excitations were of same order of magnitude, the excitation decreasedsignificantly with increased axial gap, mainly due to the declination of potential interaction.
Transonic investigations:Several studies, numerically as well as experimentally, document the dominant excitationinfluence of vane trailing edge shocks on the downstream blade row in transonic turbinestages with up to 53% in lift variation (e.g., Koya and Kotake [1985], Doorly and Oldfield[1985], Sharma et al. [1992] Rao et al. [1994], Saxer and Giles [1994]).
Experiments in the Oxford Turbomachinery Group on a linear cascade with unsteadyshock and wake passing induced by rotating bars is well documented by Johnson et al.[1989]. These fundamental experiments in subsonic and transonic flow described in detailthe unsteady phenomena, which would be expected in real turbine stages. The work givesexperimental evidence in both the wake induced unsteady pressures on the rotor as wellas the complex sequence of refraction, reflection and re-reflection of the moving shockwaves.
Giles [1990] presented the capability of his Q3D method UNSFLO to predict stator-rotorinteraction in a transonic turbine stage with a dominant shock excitation. The unsteadyshock movement was described in detail giving a comprehensive understanding of theexcitation mechanism. The unsteady lift variation has been estimated to 40% and itssignificance for both vibration excitation and loss production has been pointed out.
Rangwalla [1992] showed a two-dimensional investigation of three axial gap configurationsto study a new turbine design. The importance of time accurate stage calculations toobtain a shock in the flow solution is pointed out as well as the strong impact of the shockat close stator rotor spacing. Increasing the axial gap resulted in a shock free stage.
Abhari [1992] analysed the temporal development of the shock system in a transonicturbine stage with help of a Q3D method (UNSFLO) and validated the results againstexperimental heat transfer data. The importance of correct prediction of shock strength
Doctoral Thesis Markus Jöcker Page 25
was stressed. Hwang and Liu [1993] demonstrated the importance of shock –boundarylayer interaction for the prediction of a low-pressure turbine forcing function due to anincoming wake. Moss [1997] and Hilditch [1998] used UNSFLO to analyse the bladeexcitation and heat transfer in transonic turbine stages in comparison to experiments. Indetailed space and time resolved comparisons they tracked various excitationmechanisms, i.e. shock excitation and wake excitation. Especially, the shock sweepingover the rotor blade leading edge has been demonstrated causing an “upstream travelling“pressure fluctuation. Busby et al. [1999] and Vanable et al. [1999] presented a verycomprehensive experimental and numerical study of the shock blade interaction in aturbine stage with varying axial gap. Beside the assessment of prediction capability ofvarious computational tools conclusions were mainly related to the influence of axial gapand the analysed unsteady flow features on performance. Also the forcing functionvariation with changed axial gap is shown.
In the second part of a two part paper by Von Hoyningen Huehne et al. [2000a, b] theauthors analysed in detail the 3D computed time resolved vane and blade unsteadypressures in a highly subsonic and in a transonic turbine stage. Conclusions are drawn onthe excitation mechanisms present in the stages, which were identified by analysis of thepropagation characteristics of disturbances. Wake induced unsteady pressures are foundon suction side whereas the leading edge region and the pressure side are mainlyexposed to potential excitations. Also radial variations are discussed.
Denos et al. [1999, 2000] presented a comprehensive study in the VKI turbine stageoperated at subsonic and transonic flow conditions with variations of rotational speed andaxial gap. The work pointed out the relatively small wake influence on the unsteadypressure and the non-significant influence of cooling flow blown into the wake at the vanetrailing edge. The often in transonic turbines observed temporal double peak of pressureexcitation at the rotor leading edge was related to local shock or pressure wave reflections.
The same turbine was investigated by Laumert et al. [2000, 2001a and b] regarding thethree dimensional aspects of the blade forcing. Detailed descriptions of the excitationmechanisms were given. The identification of the excitation mechanisms was enhanced bycomparison of the original transonic case to a subsonic and a highly transonic case, whichpointed out the dominant excitation due to the shock and a minor wake influence on theunsteady pressure, only clearly identified in the subsonic case. Significant radial variationsof the unsteady pressures were found. The translation of the excitation mechanisms intoexcitation forces on chosen mode shapes has been analysed.
Summary:Many investigations have studied the excitation mechanisms present in subsonic andtransonic turbine stages. With varying detail the effects of wake, potential field and statortrailing edge shock on the unsteady rotor blade pressure have been described. Atranslation of the detailed flow phenomena in unsteady blade forces was discussed in[Laumert et al. 2001a, b]. Other studies have focused on the effect of design parameters,mainly the axial gap, on the unsteady pressure magnitude. To the knowledge of the authoronly the work by Korakianitis [1991, 1992a, b, and 1993a, b] related variations of thedesign parameters axial gap and stator count to the magnitude of unsteady blade forceswith valuable conclusions on the choice of these parameters to minimise excitation forces.His work is however limited to subsonic turbine flow and the stator-rotor interaction is

Page 26 Doctoral Thesis Markus Jöcker
assessed with a simplified gust model not taking into account the possible complex flowinteractions in the stator rotor gap. The method did not allow a clear relation of thepropagation characteristics of wake-, potential- and shock effects to the changedparameters, which would give additional insight in their physical impact.

Doctoral Thesis Markus Jöcker Page 27
3 OBJECTIVES AND APPROACH OF PRESENT WORK
3.1 Objective
The objective of the present work is to evaluate the design parameters axial gap and statorcount of high pressure turbine stages towards their influence on the unsteady aerodynamicexcitation of the rotor with help of numerical flow solvers. Of particular interest is if andhow unsteady aerodynamic considerations in the design can reduce the risk of high cyclefatigue failures of the turbine rotor. This objective has been split into the following tasks:
• Evaluate the limits of the applied state-of-the-art numerical flow solvers and validatethe method to be used for further calculations.
• Determine the aerodynamic mechanisms causing the perturbation pressures on theturbine rotor blade with regard to operating conditions.
• Quantify the influence of the chosen design parameters axial gap and stator count onthe aerodynamic excitation and rotor blade vibration risk with consideration of theexcitation mechanisms.
• Investigate the potentiality to improve the high pressure turbine stage design in order toreduce the high cycle fatigue risk of the rotor by unsteady aerodynamic means.
3.2 Approach
When this work was initiated the available computer power and the state-of-the-artnumerical tools to calculate unsteady flows in turbines suggested to use a two-dimensional(2D) approach towards the above objectives. The validated and well documented 2D/Q3Dcode UNSFLO [Giles 1991] is chosen to perform the core of the studies. Some reasons forthis choice are the code’s capability to treat arbitrary stator-rotor pitch ratios, the efficientconstruction of the hybrid inviscid/viscous numerical method, the flexibility to solve bothflutter and forced response problems and the included mesh generation tools. However,during the course of this work development has not stood still and efficient 3D numericaltools have been developed, which deliver results in reasonable times on high-endsupercomputers with up-to-date acceleration techniques (parallel computing,vectorisation). Therefore, the present work includes comparisons to results obtained withvarious tools and approaches, both for aerodynamic damping and forcing functioncalculations, in order to prove the validity and the limitations of the applied methodUNSFLO compared to other methods. The results are validated against experimental data.The perturbation pressure on the rotor blade surfaces is the measure of highest interest inthe present study of blade excitations and is therefore the main validation parameter. Thesensitivity to some chosen boundary conditions (stream tube definition, back-pressure,rotational speed, axial gap) are also studied to quantify their influence on the solutionaccuracy. All two-dimensional results are interpreted as aerodynamic excitationmechanisms on stream sheets neglecting all three-dimensional effects.
Literature suggests the forcing function of the rotor blades to be strongly influenced by thedesign parameters stator count and axial gap. Previous studies on these design

Page 28 Doctoral Thesis Markus Jöcker
parameters by Korakianitis [1991, 1992a,b and 1993a,b] have been pursued in order togain physical understanding of the parameter influence on the forcing function for theinvestigated high pressure turbine stages. The turbine stage configurations investigated inthis thesis are taken from two different applications:
• First, a typical aero-engine high pressure turbine stage is studied at subsonic andtransonic flow conditions, with two axial gaps and two stator configurations. This ischosen because it is subject of an extensive research study including valuablemeasurements [Freudenreich 2001a, b], [Hennings et al. 2002] to validate thenumerical results. Operating conditions (rotor speed) are according to the resonantconditions of the blades used in the experiments.
• Secondly, a subsonic high pressure turbine intended to drive the turbopump of a rocketengine is investigated in the frame of a design pre-study including four axial gapvariations, and three stator geometry variations. This configuration is chosen because itallows independently of any experimental program the systematic study of theparameters in order to extend and generalise the findings made on the first study.
Beside the different turbine geometry the major difference to the investigations byKorakianitis [1992a, b, 1993a, b] is that in the present study transonic flows are includedand smaller axial gaps are regarded. Furthermore, a full stage analysis is mainly usedinstead of a gust approach to capture more complete the bi-directional stator-rotorinteraction as well as shock excitations. This extended computational effort seemsespecially justified to respect the more complex stator-rotor interaction mechanisms intransonic flow and at very small axial gaps.
To enhance the physical understanding of the aerodynamic excitation mechanisms aparametric analysis of the vortical and potential excitation effects and their interaction isperformed. Therefore, the turbopump turbine stage is chosen offering a highly loadedturbine stage still operating in the subsonic flow range, so that the effects are notsuperposed by shock excitations.
To complete the studies towards a vibration risk assessment the results are extended by ablade mode shape consideration. Therefore, mode shape sensitivity analyses in two-dimensional planes assuming bending and torsion rigid body motions of a blade sectionare performed to assess the excitation risk in a stream sheet fashion.
Out of the results obtained in the various studies conclusions have been drawn towardsthe incorporation of unsteady aerodynamic considerations in the design of high-pressureturbine stages.
Doctoral Thesis Markus Jöcker Page 29
4 EVALUATION TECHNIQUES APPLIED IN THIS WORK
The numerical solution provided from an unsteady flow solver gives a large amount of dataand its physical interpretation needs intensive post-processing. The present section willdescribe the applied physical models and underlying theory to analyse the unsteadyresults obtained in this work.
4.1 Blade vibration, concept of IBPA and aerodynamic damping
In order to consider the aerodynamic damping in forced response analyses separate bladevibration computations are performed as outlined in the state-of-the-art section. Due tocircumferential periodicity of the tuned rotor blade row (which is an assumption) the bladesvibrate with discrete phase angles to each other, the interblade phase angle σ, asintroduced by Lane [1956].
2,...
2-,
2 rotorrotor
rotor
NNn
N
n =⋅⋅= πσ Eq. 4-1
Whereas in flutter cases all interblade phase angles may have to be checked for flutterstability, tuned forced response vibrations can only take certain interblade phase anglesdue to periodicity conditions of both the vibration mode and the excitation. The excitationdue to a stator with Nstator vanes would cause excitation orders of statore Nhn ⋅= , the rotor
can respond to periodic excitations of the orders nNkn rotore ±⋅= , which leads to thefollowing formula for the possible travelling wave orders n:
nNkNh rotorstator ±⋅=⋅ Eq. 4-2
The factors h and k are arbitrary integers. The frequency of vibration is the frequency ofexcitation in the case of resonance. For turbine blades the vibration frequency is usuallyexpressed as reduced frequency k defined herein by:
||2 exitw
ck r⋅
⋅= ωEq. 4-3
Blade vibration computations are performed with prescribed amplitude, frequency andinterblade phase angle of blade motion. The resulting unsteady pressures on the bladesurface are evaluated in terms of a pressure coefficient, the aerodynamic work and theaerodynamic damping.
The pressure coefficient is defined as
)(
),(~),(~
11 ppA
txptxc
tp −⋅
= Eq. 4-4
where A is the non-dimensional amplitude of vibration.
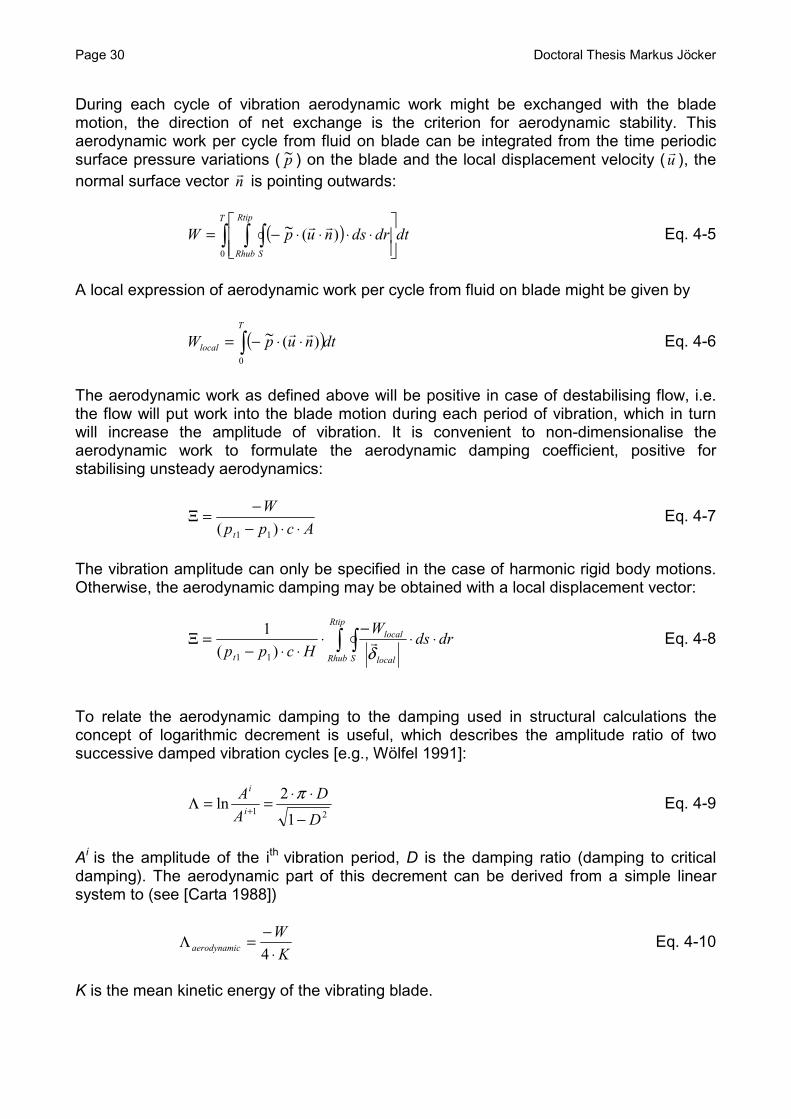
Page 30 Doctoral Thesis Markus Jöcker
During each cycle of vibration aerodynamic work might be exchanged with the blademotion, the direction of net exchange is the criterion for aerodynamic stability. Thisaerodynamic work per cycle from fluid on blade can be integrated from the time periodicsurface pressure variations ( p~ ) on the blade and the local displacement velocity (u
r), the
normal surface vector nr
is pointing outwards:
( ) dtdrdsnupWT Rtip
Rhub S∫ ∫ ∫
⋅⋅⋅⋅−=
0
)(~ rrEq. 4-5
A local expression of aerodynamic work per cycle from fluid on blade might be given by
( )dtnupWT
local ∫ ⋅⋅−=0
)(~ rrEq. 4-6
The aerodynamic work as defined above will be positive in case of destabilising flow, i.e.the flow will put work into the blade motion during each period of vibration, which in turnwill increase the amplitude of vibration. It is convenient to non-dimensionalise theaerodynamic work to formulate the aerodynamic damping coefficient, positive forstabilising unsteady aerodynamics:
Acpp
W
t ⋅⋅−−=Ξ
)( 11
Eq. 4-7
The vibration amplitude can only be specified in the case of harmonic rigid body motions.Otherwise, the aerodynamic damping may be obtained with a local displacement vector:
∫ ∫ ⋅⋅−
⋅⋅⋅−
=ΞRtip
Rhub S local
local
t
drdsW
Hcpp δr
)(1
11
Eq. 4-8
To relate the aerodynamic damping to the damping used in structural calculations theconcept of logarithmic decrement is useful, which describes the amplitude ratio of twosuccessive damped vibration cycles [e.g., Wölfel 1991]:
211
2ln
D
D
A
Ai
i
−
⋅⋅==Λ +
πEq. 4-9
Ai is the amplitude of the ith vibration period, D is the damping ratio (damping to criticaldamping). The aerodynamic part of this decrement can be derived from a simple linearsystem to (see [Carta 1988])
K
Wcaerodynami ⋅
−=Λ4
Eq. 4-10
K is the mean kinetic energy of the vibrating blade.
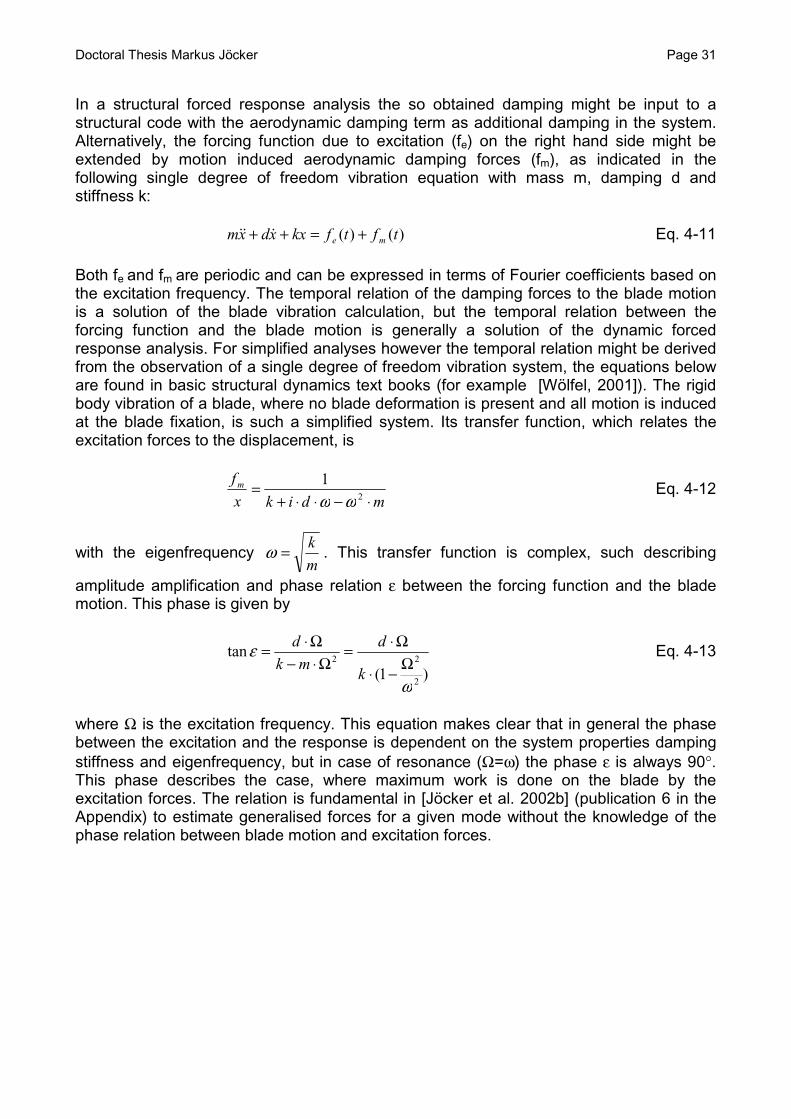
Doctoral Thesis Markus Jöcker Page 31
In a structural forced response analysis the so obtained damping might be input to astructural code with the aerodynamic damping term as additional damping in the system.Alternatively, the forcing function due to excitation (fe) on the right hand side might beextended by motion induced aerodynamic damping forces (fm), as indicated in thefollowing single degree of freedom vibration equation with mass m, damping d andstiffness k:
)()( tftfkxxdxm me +=++ &&& Eq. 4-11
Both fe and fm are periodic and can be expressed in terms of Fourier coefficients based onthe excitation frequency. The temporal relation of the damping forces to the blade motionis a solution of the blade vibration calculation, but the temporal relation between theforcing function and the blade motion is generally a solution of the dynamic forcedresponse analysis. For simplified analyses however the temporal relation might be derivedfrom the observation of a single degree of freedom vibration system, the equations beloware found in basic structural dynamics text books (for example [Wölfel, 2001]). The rigidbody vibration of a blade, where no blade deformation is present and all motion is inducedat the blade fixation, is such a simplified system. Its transfer function, which relates theexcitation forces to the displacement, is
mdikx
fm
⋅−⋅⋅+=
2
1
ωωEq. 4-12
with the eigenfrequencym
k=ω . This transfer function is complex, such describing
amplitude amplification and phase relation ε between the forcing function and the blademotion. This phase is given by
)1(
tan
2
22
ω
εΩ−⋅
Ω⋅=Ω⋅−
Ω⋅=k
d
mk
dEq. 4-13
where Ω is the excitation frequency. This equation makes clear that in general the phasebetween the excitation and the response is dependent on the system properties dampingstiffness and eigenfrequency, but in case of resonance (Ω=ω) the phase ε is always 90°.This phase describes the case, where maximum work is done on the blade by theexcitation forces. The relation is fundamental in [Jöcker et al. 2002b] (publication 6 in theAppendix) to estimate generalised forces for a given mode without the knowledge of thephase relation between blade motion and excitation forces.

Page 32 Doctoral Thesis Markus Jöcker
4.2 Potential and vortical interactions
Flow disturbances can be split in 4 parts based on a mathematical analysis of theboundary conditions upstream and downstream of the blade row assuming the validity ofthe linearized Euler equations. Thus, the disturbances can be separated in:
1. Potential disturbances propagating downstream;2. Potential disturbances propagating upstream;3. Vortical disturbances propagating downstream;4. Entropical disturbances propagating downstream.
This approach of separating the disturbances is completely documented in the openliterature and is here summarised for convenience. The principle concept was used byGiles [1988a] to formulate 2D non-reflecting boundary conditions for the Euler equationsand thereafter used by many researchers in the field to describe the unsteady boundaryconditions of a turbomachinery blade row (e.g., [Henderson and Fleeter 1993a, b],[Manwaring and Wisler 1993], [Feiereisen et al. 1993], [Johnston et al. 1998]. The aim inthese publications was always to separate measured data at the inlet and/or outlet of aturbomachine blade row into these different contributions, mostly limited to the potentialand vortical contributions. In [Chung and Wo 1997] this approach was applied to a Navier-Stokes solution in order to separate the numerically obtained disturbance into a vorticaland potential part. In the present work a similar splitting is performed to study the vorticaland potential excitation sources in the subsonic turbopump turbine stage.
Splitting into vortical and potential effects builds on the following fundamental splittingtheorem by Goldstein [1978] which states that the velocity disturbance is composed of avortical part and a potential part, each related to different physical phenomena.
pw wwwrrr ∂+∂=∂ Eq. 4-14
where wv
∂ is the velocity perturbation vector in the wake frame of reference. The vorticalperturbation (rotational velocity) results from the wake of the upstream blade row and thepotential perturbation (irrotational velocity) results from the pressure field of the upstreamand downstream blade rows.
The assumptions on these perturbation parts are:
a) vortical perturbation:
0=∂⋅∇ wwr
(divergence free (solenoidal), incompressible) Eq. 4-15
0)(
=∂Dt
wD w
r
(convective, non-dissipative) Eq. 4-16
with a convection velocity Fwwr
of the mean flow field.

Doctoral Thesis Markus Jöcker Page 33
b) potential perturbation:
ppw Φ∇=∂ v Eq. 4-17
0=∂×∇ pwr
(rotational free) Eq. 4-18
It follows a description of the vortical and potential wave model as used in UNSFLO andfor the analysis in this work. The details of the UNSFLO code specific nomenclature aregiven in the Appendix, to which the reader is referred to for an illustration of the describingparameters.
4.2.1 Vortical velocity perturbation
The vortical perturbation velocity field is transported only by convection, which can beexpressed in a complex wave equation of n harmonics of type:
...,,neww xkinwnw
n 321,, =⋅∆=∂ ⋅⋅− vvvvEq. 4-19
nkr
is the wave propagation vector. Periodicity dictates the tangential component of thisvector:
Syn P
nk
⋅⋅= π2Eq. 4-20
With a gust propagation vector perpendicular to the convection vector,
0=⋅ Fwwkvr
Eq. 4- 21
the axial component follows to
wynFw
Fwynxn k
u
vkk αtan⋅−=⋅−= Eq. 4- 22
In common nomenclature the negative of the gust propagation vector is called the wavenumber vector [Feiereisen 1998].
The application of the condition of divergence free vortical perturbations onto equation 4-19 shows that also the perturbation amplitude is perpendicular to the wave propagationvector and hence that mean and vortical perturbation vectors are parallel. Theproportionality of these vectors is expressed as
xkiFwnnw
newDwrrrr ⋅⋅−⋅=∂ , Eq. 4- 23

Page 34 Doctoral Thesis Markus Jöcker
where Dn is the proportionality constant of the nth harmonic. This is identical to thedefinition of the vortical sinusoidal perturbation used in UNSFLO, if only the first harmonicof the real part is regarded.
4.2.2 Potential velocity perturbation
Solutions to the potential disturbance equation [Liepmann and Roshko 1957] of the form
( ) ( ) 02112
2
22
2
22 =
∂⋅∂
∂⋅⋅⋅−∂∂⋅−+
∂∂⋅−
xyMM
yM
xM yxyx
φφφEq. 4-24
are given by a wave equation with exponentially decaying amplitude in axial direction:
( ) ( )xykinn
nyneAyx ⋅+⋅⋅−⋅=Φ λ, Eq. 4-25
The axial wave number λn can be calculated to
2
2
1
1
x
ynyxyn
n M
MkMMki
−
−⋅±⋅⋅⋅−=λ Eq. 4-26
which is sometimes represented as
2
2
1
1,
x
yx
ynn M
MMMki
−
−±⋅=⋅⋅−= χχλ Eq. 4-27
where χ is the axial decay factor. This factor characterises the wave:
- For M<1 the axial wave number λ is complex and the wave is decaying in positive ornegative x direction, depending on the sign of the root. These waves are called sub-resonant.
- For M>1 the axial wave number λ has a real part and hence the waves travel non-attenuated in spatial direction. These waves are called super-resonant.
The application to the present work is limited to the case of sub-resonant waves decayingin positive axial direction. Hence, the potential perturbation velocity vector is
( ) ( )( )( )
( )xykiynn
xyki
ynn
nn
xykinnnp
nyn
nyn
nyn
ekiA
ekiA
A
eAyxw
⋅+⋅⋅−
⋅+⋅⋅−
⋅+⋅⋅−
⋅−⋅⋅⋅
=
⋅
⋅⋅−
⋅=
⋅⋅∇=Φ⋅∇=∂
λ
λ
λ
χ
λ
)(1
,,
r
Eq. 4-28
This equation is also basis for the specification of the potential disturbance in UNSFLO.The input parameter for the code is based only on the first harmonic and instead of the
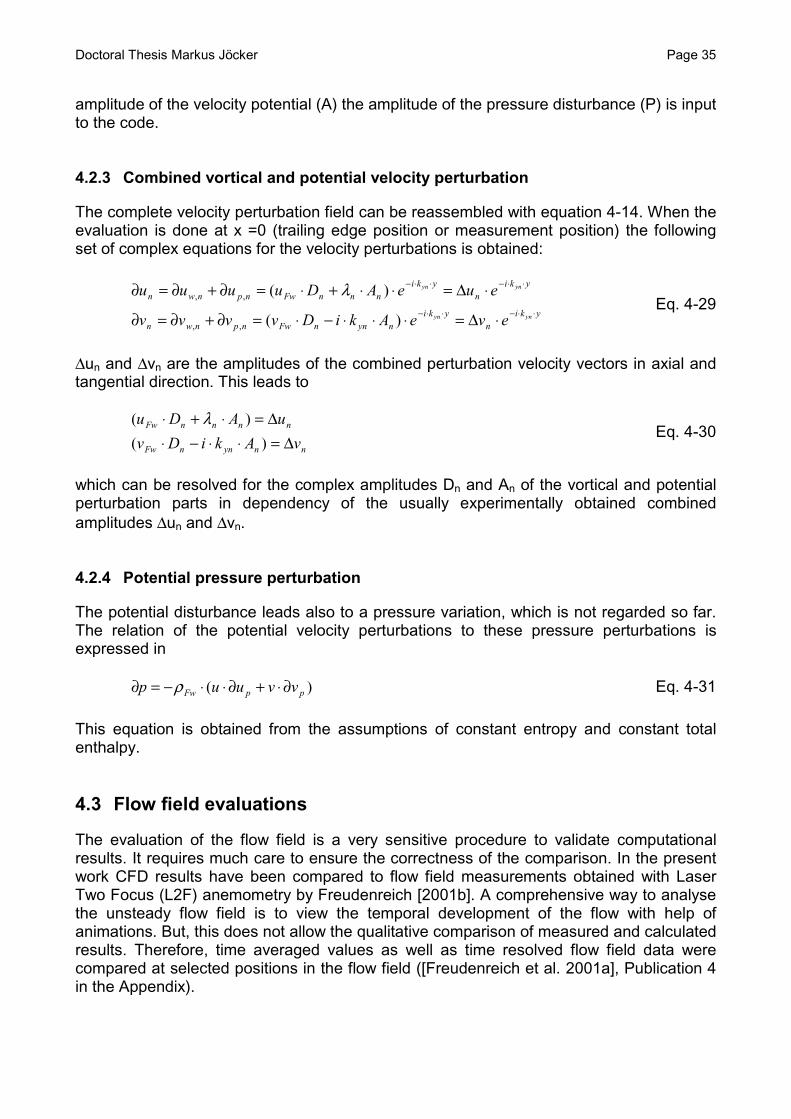
Doctoral Thesis Markus Jöcker Page 35
amplitude of the velocity potential (A) the amplitude of the pressure disturbance (P) is inputto the code.
4.2.3 Combined vortical and potential velocity perturbation
The complete velocity perturbation field can be reassembled with equation 4-14. When theevaluation is done at x =0 (trailing edge position or measurement position) the followingset of complex equations for the velocity perturbations is obtained:
ykin
ykinynnFwnpnwn
ykin
ykinnnFwnpnwn
ynyn
ynyn
eveAkiDvvvv
eueADuuuu⋅⋅−⋅⋅−
⋅⋅−⋅⋅−
⋅∆=⋅⋅⋅−⋅=∂+∂=∂
⋅∆=⋅⋅+⋅=∂+∂=∂
)(
)(
,,
,, λEq. 4-29
∆un and ∆vn are the amplitudes of the combined perturbation velocity vectors in axial andtangential direction. This leads to
nnynnFw
nnnnFw
vAkiDv
uADu
∆=⋅⋅−⋅∆=⋅+⋅
)(
)( λEq. 4-30
which can be resolved for the complex amplitudes Dn and An of the vortical and potentialperturbation parts in dependency of the usually experimentally obtained combinedamplitudes ∆un and ∆vn.
4.2.4 Potential pressure perturbation
The potential disturbance leads also to a pressure variation, which is not regarded so far.The relation of the potential velocity perturbations to these pressure perturbations isexpressed in
)( ppFw vvuup ∂⋅+∂⋅⋅−=∂ ρ Eq. 4-31
This equation is obtained from the assumptions of constant entropy and constant totalenthalpy.
4.3 Flow field evaluations
The evaluation of the flow field is a very sensitive procedure to validate computationalresults. It requires much care to ensure the correctness of the comparison. In the presentwork CFD results have been compared to flow field measurements obtained with LaserTwo Focus (L2F) anemometry by Freudenreich [2001b]. A comprehensive way to analysethe unsteady flow field is to view the temporal development of the flow with help ofanimations. But, this does not allow the qualitative comparison of measured and calculatedresults. Therefore, time averaged values as well as time resolved flow field data werecompared at selected positions in the flow field ([Freudenreich et al. 2001a], Publication 4in the Appendix).
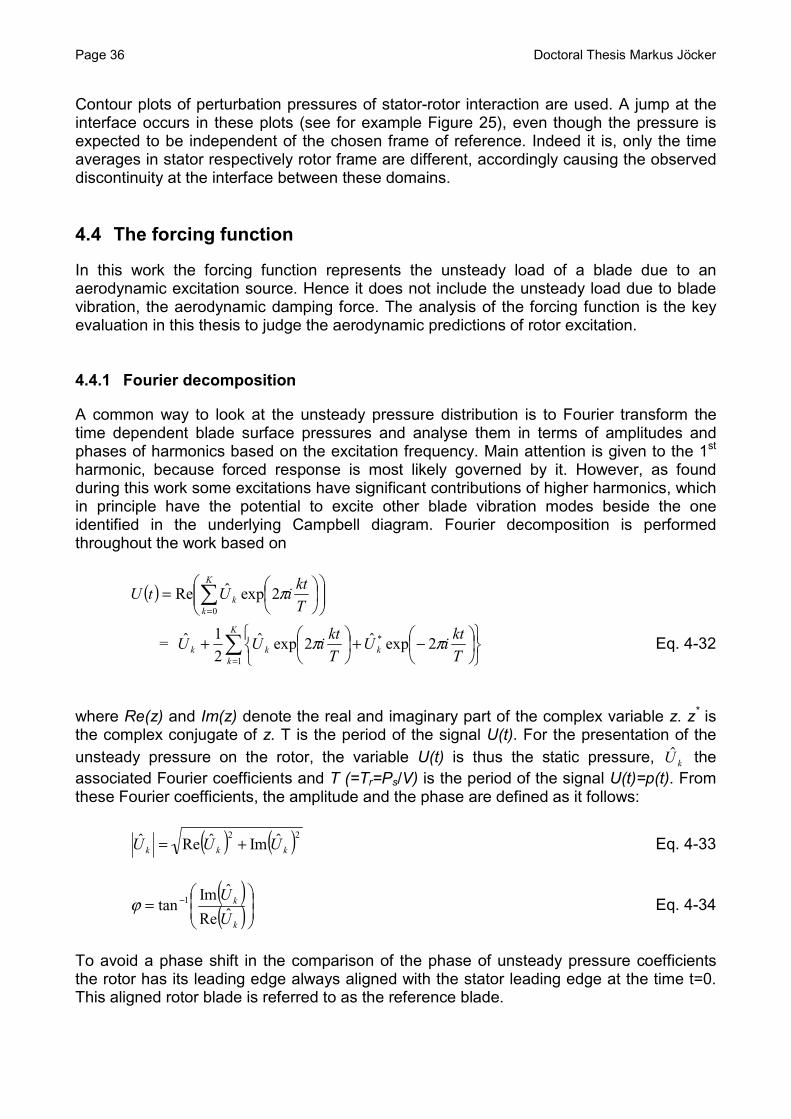
Page 36 Doctoral Thesis Markus Jöcker
Contour plots of perturbation pressures of stator-rotor interaction are used. A jump at theinterface occurs in these plots (see for example Figure 25), even though the pressure isexpected to be independent of the chosen frame of reference. Indeed it is, only the timeaverages in stator respectively rotor frame are different, accordingly causing the observeddiscontinuity at the interface between these domains.
4.4 The forcing function
In this work the forcing function represents the unsteady load of a blade due to anaerodynamic excitation source. Hence it does not include the unsteady load due to bladevibration, the aerodynamic damping force. The analysis of the forcing function is the keyevaluation in this thesis to judge the aerodynamic predictions of rotor excitation.
4.4.1 Fourier decomposition
A common way to look at the unsteady pressure distribution is to Fourier transform thetime dependent blade surface pressures and analyse them in terms of amplitudes andphases of harmonics based on the excitation frequency. Main attention is given to the 1st
harmonic, because forced response is most likely governed by it. However, as foundduring this work some excitations have significant contributions of higher harmonics, whichin principle have the potential to excite other blade vibration modes beside the oneidentified in the underlying Campbell diagram. Fourier decomposition is performedthroughout the work based on
( )
2expˆ2expˆ21ˆ=
2expˆRe
1
*
0
∑
∑
=
=
−+
+
=
K
kkkk
K
kk
T
ktiU
T
ktiUU
T
ktiUtU
ππ
π
Eq. 4-32
where Re(z) and Im(z) denote the real and imaginary part of the complex variable z. z* isthe complex conjugate of z. T is the period of the signal U(t). For the presentation of theunsteady pressure on the rotor, the variable U(t) is thus the static pressure, $U k theassociated Fourier coefficients and T (=Tr=Ps/V) is the period of the signal U(t)=p(t). Fromthese Fourier coefficients, the amplitude and the phase are defined as it follows:
( ) ( )22 ˆImˆReˆkkk UUU += Eq. 4-33
( )( )
= −
k
k
U
UˆRe
ˆImtan 1ϕ Eq. 4-34
To avoid a phase shift in the comparison of the phase of unsteady pressure coefficientsthe rotor has its leading edge always aligned with the stator leading edge at the time t=0.This aligned rotor blade is referred to as the reference blade.
Doctoral Thesis Markus Jöcker Page 37
4.4.2 Time –space presentation
Fourier decomposition of the forcing function is useful to judge the magnitude of anexcitation but gives very limited insight in the flow physics causing the excitations. Besidethe analysis of the unsteady flow field (Chapter 4.3) the time resolved presentation of theunsteady blade pressure is very useful to study aerodynamic excitation mechanisms. Twoways of presentation have been established in the open literature, either the timedevelopment of the blade surface pressure is presented at selected points of the bladesurface for one excitation period, or contour plots of the perturbation pressures are shownas function of time and space. In the latter one the time axis comprises one excitationperiod, the space axis spans one surface line around the blade, in the presentinvestigations at the blade midspan. These plots are very informative as they contain thecomplete time and space resolved forcing function at one particular blade section and ispreferably used in the present work.
4.4.3 Forces
Integrating the 2D blade surface pressure of the blade surface leads to the blade force andmoment. In the time domain this is expressed as follows:
Force vector: ∫ ⋅⋅−=S
dsntptfrr
)()( Eq. 4-35
Out of plane moment: ∫ ⋅
∆∆−
⋅⋅−=S
dsx
yntptmr
)()( Eq. 4-36
∆x and ∆y are the axial and tangential distances of the pressure location on the blade fromthe axis location about which the moment is computed.
The forces might also be expressed as Fourier components, to be obtained from the timesignal as outlined in Chapter 4.4.1. The amplitudes of up to four harmonics of the Fouriertransformed forces and the moment about a fixed point are used and compared in thework (for example in [Jöcker et al. 2000b], Publication 3 in the Appendix).
4.4.4 Mode shape consideration: Definition of generalised forces
In order to evaluate how relevant a certain forcing function is to excite a blade mode shapethe concept of generalised forces as a measure of excitability of a mode shape is applied.The generalised force of harmonic h is the blade surface integrated scalar product of thelocal excitation force vector with the local blade displacement vector:
∑=
⋅=N
iihithg fqf
1,,, )(
vrEq. 4-37
Index t indicates a torsion mode shape pointing out that in the presented approach bladedisplacements are defined in terms of a torsion axis location in the 2D plane of the blade
Page 38 Doctoral Thesis Markus Jöcker
section. Only the part of excitation force acting in direction of the blade displacement willcontribute to the generalized force so that the integral of the scalar product over the bladesurface will give a value of the mode excitation risk. The applied local displacementvectors are real valued assuming a rigid body motion without phase shift. However, theunsteady force harmonics include an imaginary part. The relative phase of the force orpressure harmonic defines the time shift relative to the excitation period, at which therelated excitation events (amplitudes) on the blade surface take place. The start and endof an excitation period is given by the relative position of stator to rotor at the beginning ofthe CFD computation. Eq. 4-37 shows that the local phase differences between excitationand blade motion is regarded by using the complex force vector, but the overall phase shiftbetween blade motion and excitation is not specified. Instead, by evaluating the amplitudeof the complex sum of scalar products the worst case phase between blade motion andblade excitation is chosen, so that the phase lag is resulting in the maximum generalisedforce (which is equivalent to the maximum work). For the presented simplified approach,where rigid body motion is prescribed, the worst case phase assumption as applied isjustified. This becomes clear when recalling the forced vibration of a single degree offreedom system, to which the rigid body motion is reduced. The phase lag betweendisplacement and excitation force of such a system at resonance is always 90°,independent of the damping. This corresponds to the worst case phase lag of such asystem, at which the work of the blade is maximal (see further Chapter 4.1, Eq. 4-13).Hence, independent of the damping in the system the proposed worst case phase lagdescribes well the work done by the forcing function under the considered rigid blademotion.
The complete approach is documented in [Jöcker et al. 2002b] (publication 6 in theAppendix), where generalised forces are non-dimenionalised and plotted against a torsionaxis location to describe the mode shape.

Doctoral Thesis Markus Jöcker Page 39
5 TEST CASES
Three different turbines have been investigated in this thesis. Table 1 presents somegeometric and aerodynamic key parameters of these test cases. The ADTurB turbine is atransonic turbine applied in a European research project, the turbopump turbine is asubsonic high pressure turbine investigated at Volvo Aero Corporation in a pre-designstudy. The International Standard Configuration 11 (STCF 11) is a low pressure turbinerotor investigated experimentally towards flutter stability at the Swiss Federal Institute ofTechnology (EPFL). Details of each test case will be presented in the subsequentChapters.
Blade/Vanecount
N
Approx.Solidity
c/S
Approx.aspectratioH/cax
Approx.staggerangleγ [°]
Axialgap
gax/Ss
Approx.stator exit
Mach numberMexit,design
Reducedfrequency*
kADTurBstator1
43 1.3 1.2 52 0.280.39
0.85 (subs)1.05 (trans)
-
ADTurBstator 2
70 1.6 1.7 54 0.450.63
0.85 (subs)1.05 (trans)
-
ADTurBrotor
64 1.3 1.3 -33 - 0.6 (subs)1.0 (trans)
1.86 (OP2)5.11 (OP9)
Turbopumpstators
12,16, 32
1.61.2
0.8 48 0.05–0.3
0.73 -
Turbopumprotor
33 1.8 1.2 -34 - 0.83 1.2 – 3.2**
STCF 11 20 1.4 0.7 -41 - 0.690.99
0.2130.155
* based on experimental exit velocity** based on computed exit flow velocityTable 1: Overview of design and flow parameter ranges of the investigated turbines atmidspan
5.1 Aero-engine turbine stages (ADTurB)
The investigated ADTurB turbine stages were designed within the course of twosuccessive European community programs [Santoriello et al. 1993] [Colantuoni et al.1995] and [Colella and Solazzo 1996]. They comprise state-of-the-art, full size, transonicaero-engine high pressure turbine stages. A 64 blades rotor was run with two differentsized but aerodynamically similar stators, 43 nozzle guide vanes (NGV) for stator 1 and 70NGVs for stator 2. The rotor speed was varied as well, around the design speedndesign = 7894 RPM. Both stators have the same design exit Mach number M2 Stator = 1.05and exit flow angle α2 Stator = 73°. The rotor blades have slight 3D shape, while both statorsare of similar cylindrical vane shape. Figure 13 shows a meridional view of the test rig withthe 43NGV stator mounted. A view of the midspan geometry of the stage with both statorssuperposed is given in Figure 14.

Page 40 Doctoral Thesis Markus Jöcker
Figure 13: Meridional view of annular test section (taken from Green [2001])
Figure 14: Stages at 50% span large gap (taken from [Jöcker et al. 2000b], publication 3in the Appendix)
The tests comprised measurements of inlet and outlet flow conditions with wedge typeprobes at three radii including midspan. Extensive flow field measurements wereperformed with laser two focus anemometry (L2F), which allows the time resolvedmeasurement of velocities, flow angles and turbulence levels without introducing a flowdisturbance [Freudenreich et al. 2001a, 2001b]. During transient operation conditions theunsteady pressures on the rotor were measured with fast response pressure transducers.Simultaneously, the rotor blade vibration amplitude was logged with help of strain gaugesmounted on various blades. More details on the vibration experiments are found in[Hennings et al. 2002]. It should be noted that for the latter experiments the rotor bladeswere designed such that resonance conditions fell into the testing range of rotationalspeed, a sketch of the Campbell diagram is shown in Figure 15.
0 20 40 60 mm
stator 1
stator 2
measurementpositions
velocity gust
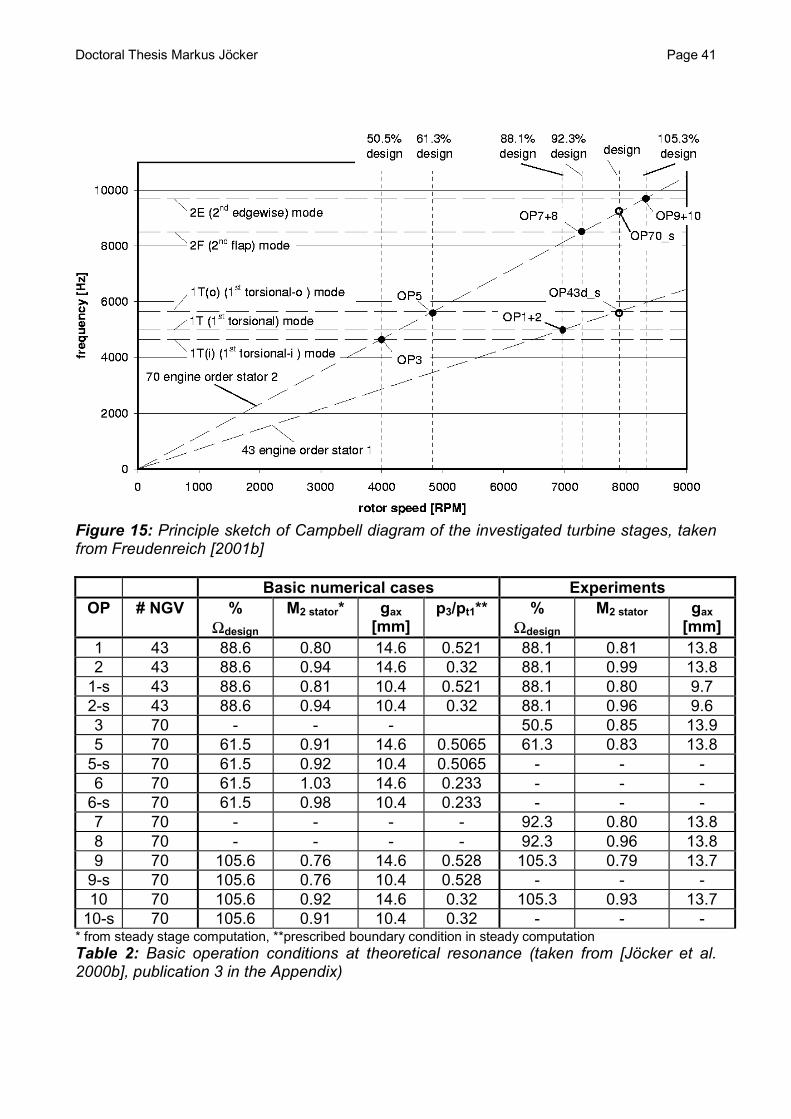
Doctoral Thesis Markus Jöcker Page 41
Figure 15: Principle sketch of Campbell diagram of the investigated turbine stages, takenfrom Freudenreich [2001b]
Basic numerical cases ExperimentsOP # NGV %
Ωdesign
M2 stator* gax
[mm]p3/pt1** %
Ωdesign
M2 stator gax
[mm]1 43 88.6 0.80 14.6 0.521 88.1 0.81 13.82 43 88.6 0.94 14.6 0.32 88.1 0.99 13.8
1-s 43 88.6 0.81 10.4 0.521 88.1 0.80 9.72-s 43 88.6 0.94 10.4 0.32 88.1 0.96 9.63 70 - - - 50.5 0.85 13.95 70 61.5 0.91 14.6 0.5065 61.3 0.83 13.8
5-s 70 61.5 0.92 10.4 0.5065 - - -6 70 61.5 1.03 14.6 0.233 - - -
6-s 70 61.5 0.98 10.4 0.233 - - -7 70 - - - - 92.3 0.80 13.88 70 - - - - 92.3 0.96 13.89 70 105.6 0.76 14.6 0.528 105.3 0.79 13.7
9-s 70 105.6 0.76 10.4 0.528 - - -10 70 105.6 0.92 14.6 0.32 105.3 0.93 13.7
10-s 70 105.6 0.91 10.4 0.32 - - -* from steady stage computation, **prescribed boundary condition in steady computationTable 2: Basic operation conditions at theoretical resonance (taken from [Jöcker et al.2000b], publication 3 in the Appendix)
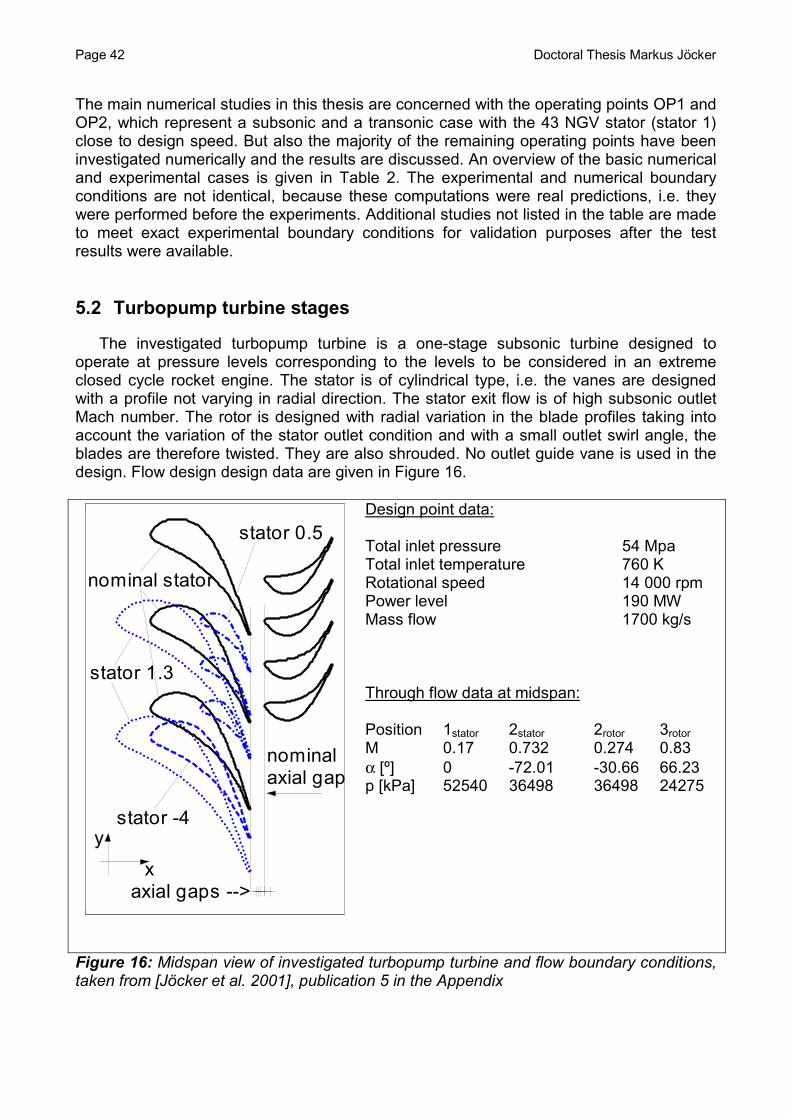
Page 42 Doctoral Thesis Markus Jöcker
The main numerical studies in this thesis are concerned with the operating points OP1 andOP2, which represent a subsonic and a transonic case with the 43 NGV stator (stator 1)close to design speed. But also the majority of the remaining operating points have beeninvestigated numerically and the results are discussed. An overview of the basic numericaland experimental cases is given in Table 2. The experimental and numerical boundaryconditions are not identical, because these computations were real predictions, i.e. theywere performed before the experiments. Additional studies not listed in the table are madeto meet exact experimental boundary conditions for validation purposes after the testresults were available.
5.2 Turbopump turbine stages
The investigated turbopump turbine is a one-stage subsonic turbine designed tooperate at pressure levels corresponding to the levels to be considered in an extremeclosed cycle rocket engine. The stator is of cylindrical type, i.e. the vanes are designedwith a profile not varying in radial direction. The stator exit flow is of high subsonic outletMach number. The rotor is designed with radial variation in the blade profiles taking intoaccount the variation of the stator outlet condition and with a small outlet swirl angle, theblades are therefore twisted. They are also shrouded. No outlet guide vane is used in thedesign. Flow design design data are given in Figure 16.
-50
axial gaps -->
nominal stator
stator 1.3
stator -4
stator 0.5
nominalaxial gap
x
y
Design point data:
Total inlet pressure 54 MpaTotal inlet temperature 760 KRotational speed 14 000 rpmPower level 190 MWMass flow 1700 kg/s
Through flow data at midspan:
Position 1stator 2stator 2rotor 3rotor
M 0.17 0.732 0.274 0.83α [º] 0 -72.01 -30.66 66.23p [kPa] 52540 36498 36498 24275
Figure 16: Midspan view of investigated turbopump turbine and flow boundary conditions,taken from [Jöcker et al. 2001], publication 5 in the Appendix

Doctoral Thesis Markus Jöcker Page 43
Starting from nominal design parameter studies have been performed investigating theaxial gap influence and the stator influence on the unsteady rotor excitation level. Figure16 shows the stage configuration with the nominal axial gap, the range of investigatedaxial gaps and the various stator-rotor configurations investigated. Table 3 gives anoverview of the presented cases. The axial gap was varied between 8% and 29% of rotoraxial chord. The stator count was varied such that the pitch ratio R is between 1 and 3. Toachieve a pitch ratio of 2.75 two methods of modification were applied: in case (–4), thestator pitch was increased by removing 4 vanes from the annulus, in case (1.3) the statorwas additionally scaled by a factor 1.3 to maintain the steady aerodynamics (see Figure16).
Name gax [%] # vanes # blades R gax/SNominal 21.4 16 33 2.063 0.1513
Axial gap study:8 8.0 16 33 2.063 0.05610 9.9 16 33 2.063 0.07012 11.8 16 33 2.063 0.08416 15.6 16 33 2.063 0.11129 28.6 16 33 2.063 0.203
Stator study:0.5 21.4 32 33 1.0313 0.3031.3 21.4 12 33 2.75 0.114-4 21.4 12 33 2.75 0.114
Table 3: Turbopump investigated cases overview, taken from [Jöcker et al. 2001],publication 5 in the Appendix
5.3 STCF 11 – blade vibration test case
In Fransson et al. [1999] (publication 1 in the Appendix) a new International StandardConfiguration has been added to the already existing set of 10 Standard Configurations[Fransson and Verdon, 1991, 1992]. It is called the International Standard Configuration 11(STCF 11). The experimental data has been obtained in the annular test cascade at theSwiss Federal Institute of Technology (EPFL) in Lausanne, Switzerland, which isschematically drawn in Figure 17.
The test facility was supplied with air by a four stage radial compressor with a maximummass flow rate of 10 kg/s and a maximum pressure ratio of 3.5. An additional compressorwas used to suck off the wall boundary layers. In order to simulate unsteady flowconditions in the test cascade, all 20 blades were electromagnetically excited andcontrolled to vibrate in travelling wave mode. This included the control of vibrationamplitude, vibration frequency and the interblade phase angle. The suspensions of theblades were designed to reproduce the eigenfrequency and bending direction of the firstbending mode of the blade performing a solid blade motion. Measurements of static andtotal pressures as well as the flow angles were done in the planes e1 and e2 before andbehind the cascade. The blade surface distributions of steady and unsteady pressureswere measured with pressure taps for the steady state and miniaturized piezo-resistivepressure transducers for the time dependent data measurements, all embedded at
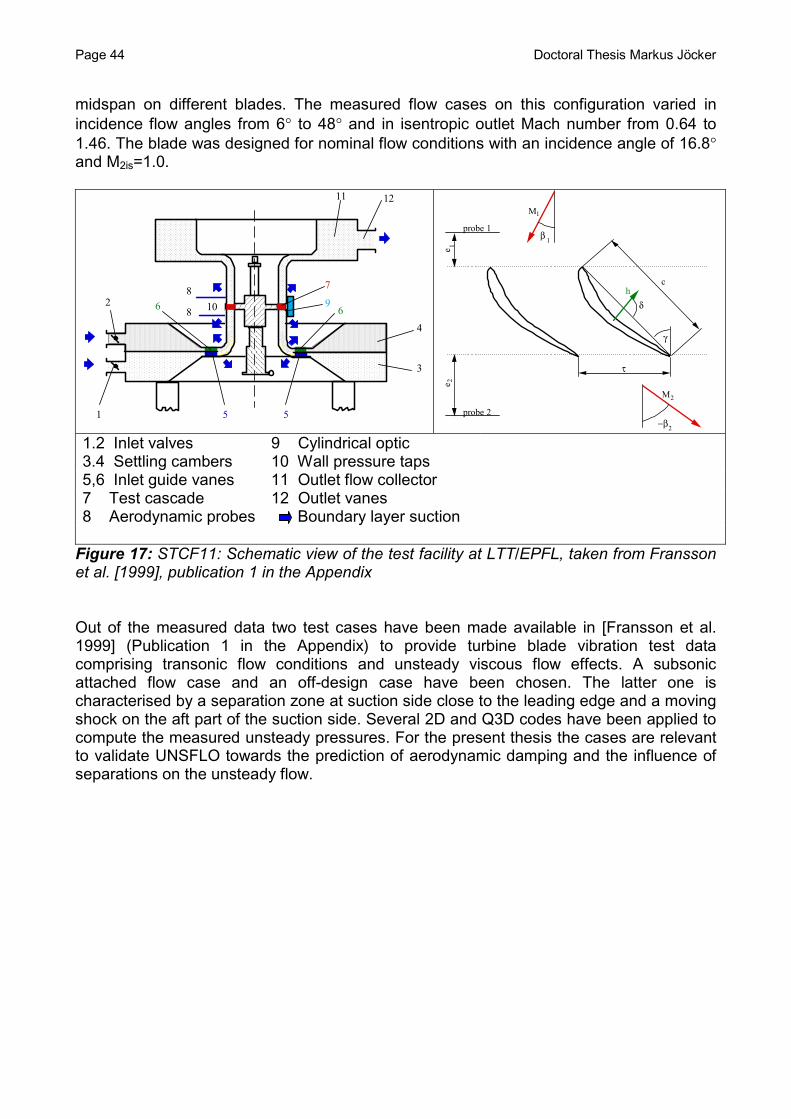
Page 44 Doctoral Thesis Markus Jöcker
midspan on different blades. The measured flow cases on this configuration varied inincidence flow angles from 6° to 48° and in isentropic outlet Mach number from 0.64 to1.46. The blade was designed for nominal flow conditions with an incidence angle of 16.8°and M2is=1.0.
8
8 10
12
2
1
6
7
96
5 5
4
3
11
β1
M1
−β2
M2
c
τ
e 1
probe 1
e 2
probe 2
δh
γ
1.2 Inlet valves 9 Cylindrical optic3.4 Settling cambers 10 Wall pressure taps5,6 Inlet guide vanes 11 Outlet flow collector7 Test cascade 12 Outlet vanes8 Aerodynamic probes Boundary layer suction
Figure 17: STCF11: Schematic view of the test facility at LTT/EPFL, taken from Franssonet al. [1999], publication 1 in the Appendix
Out of the measured data two test cases have been made available in [Fransson et al.1999] (Publication 1 in the Appendix) to provide turbine blade vibration test datacomprising transonic flow conditions and unsteady viscous flow effects. A subsonicattached flow case and an off-design case have been chosen. The latter one ischaracterised by a separation zone at suction side close to the leading edge and a movingshock on the aft part of the suction side. Several 2D and Q3D codes have been applied tocompute the measured unsteady pressures. For the present thesis the cases are relevantto validate UNSFLO towards the prediction of aerodynamic damping and the influence ofseparations on the unsteady flow.
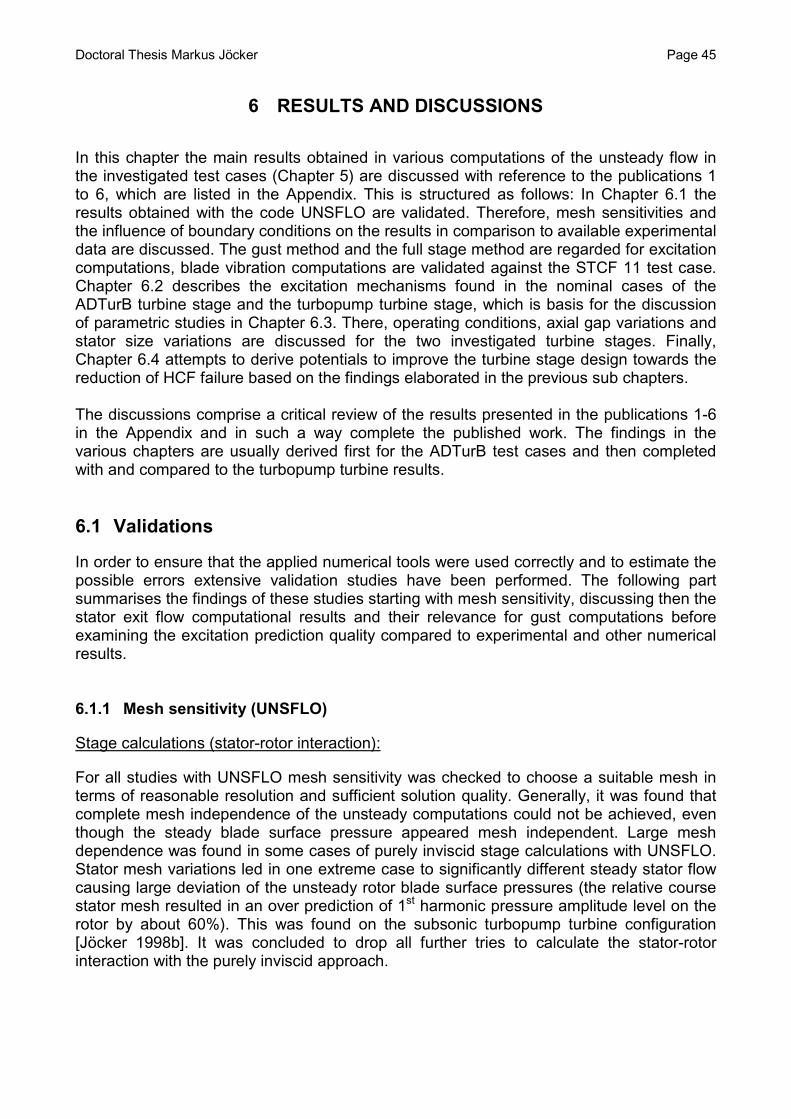
Doctoral Thesis Markus Jöcker Page 45
6 RESULTS AND DISCUSSIONS
In this chapter the main results obtained in various computations of the unsteady flow inthe investigated test cases (Chapter 5) are discussed with reference to the publications 1to 6, which are listed in the Appendix. This is structured as follows: In Chapter 6.1 theresults obtained with the code UNSFLO are validated. Therefore, mesh sensitivities andthe influence of boundary conditions on the results in comparison to available experimentaldata are discussed. The gust method and the full stage method are regarded for excitationcomputations, blade vibration computations are validated against the STCF 11 test case.Chapter 6.2 describes the excitation mechanisms found in the nominal cases of theADTurB turbine stage and the turbopump turbine stage, which is basis for the discussionof parametric studies in Chapter 6.3. There, operating conditions, axial gap variations andstator size variations are discussed for the two investigated turbine stages. Finally,Chapter 6.4 attempts to derive potentials to improve the turbine stage design towards thereduction of HCF failure based on the findings elaborated in the previous sub chapters.
The discussions comprise a critical review of the results presented in the publications 1-6in the Appendix and in such a way complete the published work. The findings in thevarious chapters are usually derived first for the ADTurB test cases and then completedwith and compared to the turbopump turbine results.
6.1 Validations
In order to ensure that the applied numerical tools were used correctly and to estimate thepossible errors extensive validation studies have been performed. The following partsummarises the findings of these studies starting with mesh sensitivity, discussing then thestator exit flow computational results and their relevance for gust computations beforeexamining the excitation prediction quality compared to experimental and other numericalresults.
6.1.1 Mesh sensitivity (UNSFLO)
Stage calculations (stator-rotor interaction):
For all studies with UNSFLO mesh sensitivity was checked to choose a suitable mesh interms of reasonable resolution and sufficient solution quality. Generally, it was found thatcomplete mesh independence of the unsteady computations could not be achieved, eventhough the steady blade surface pressure appeared mesh independent. Large meshdependence was found in some cases of purely inviscid stage calculations with UNSFLO.Stator mesh variations led in one extreme case to significantly different steady stator flowcausing large deviation of the unsteady rotor blade surface pressures (the relative coursestator mesh resulted in an over prediction of 1st harmonic pressure amplitude level on therotor by about 60%). This was found on the subsonic turbopump turbine configuration[Jöcker 1998b]. It was concluded to drop all further tries to calculate the stator-rotorinteraction with the purely inviscid approach.
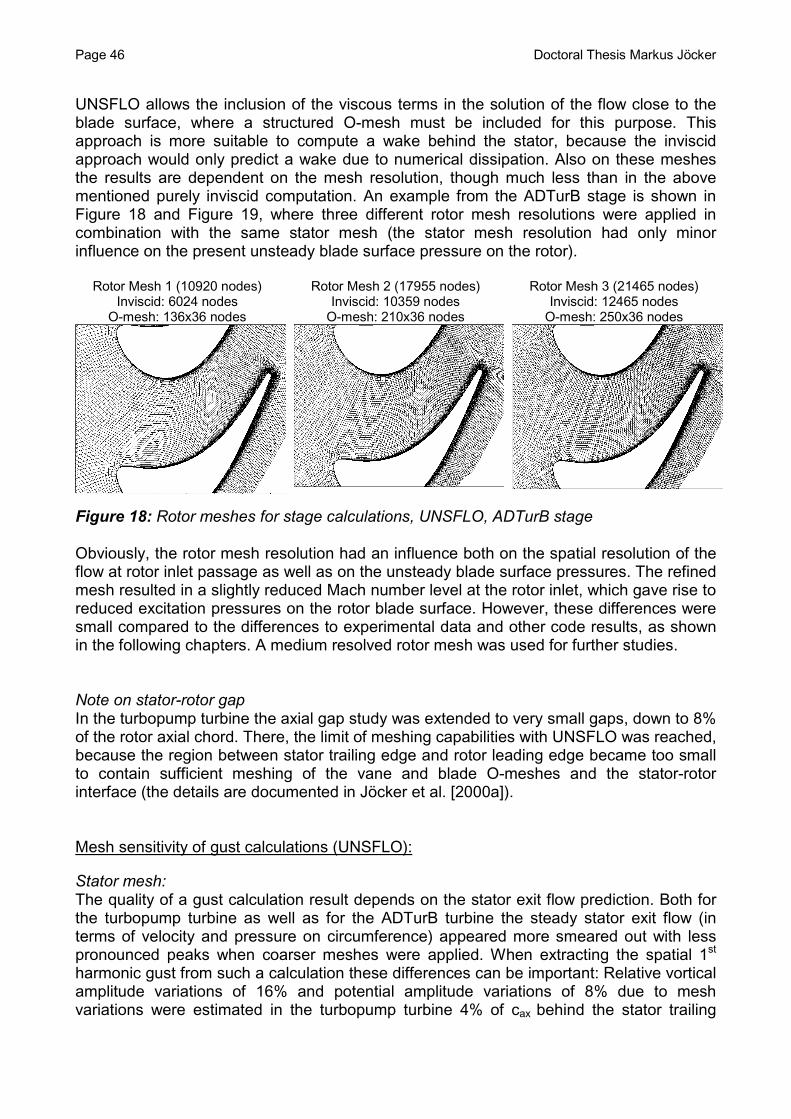
Page 46 Doctoral Thesis Markus Jöcker
UNSFLO allows the inclusion of the viscous terms in the solution of the flow close to theblade surface, where a structured O-mesh must be included for this purpose. Thisapproach is more suitable to compute a wake behind the stator, because the inviscidapproach would only predict a wake due to numerical dissipation. Also on these meshesthe results are dependent on the mesh resolution, though much less than in the abovementioned purely inviscid computation. An example from the ADTurB stage is shown inFigure 18 and Figure 19, where three different rotor mesh resolutions were applied incombination with the same stator mesh (the stator mesh resolution had only minorinfluence on the present unsteady blade surface pressure on the rotor).
Rotor Mesh 1 (10920 nodes)Inviscid: 6024 nodes
O-mesh: 136x36 nodes
Rotor Mesh 2 (17955 nodes)Inviscid: 10359 nodes
O-mesh: 210x36 nodes
Rotor Mesh 3 (21465 nodes)Inviscid: 12465 nodes
O-mesh: 250x36 nodes
Figure 18: Rotor meshes for stage calculations, UNSFLO, ADTurB stage
Obviously, the rotor mesh resolution had an influence both on the spatial resolution of theflow at rotor inlet passage as well as on the unsteady blade surface pressures. The refinedmesh resulted in a slightly reduced Mach number level at the rotor inlet, which gave rise toreduced excitation pressures on the rotor blade surface. However, these differences weresmall compared to the differences to experimental data and other code results, as shownin the following chapters. A medium resolved rotor mesh was used for further studies.
Note on stator-rotor gapIn the turbopump turbine the axial gap study was extended to very small gaps, down to 8%of the rotor axial chord. There, the limit of meshing capabilities with UNSFLO was reached,because the region between stator trailing edge and rotor leading edge became too smallto contain sufficient meshing of the vane and blade O-meshes and the stator-rotorinterface (the details are documented in Jöcker et al. [2000a]).
Mesh sensitivity of gust calculations (UNSFLO):
Stator mesh:The quality of a gust calculation result depends on the stator exit flow prediction. Both forthe turbopump turbine as well as for the ADTurB turbine the steady stator exit flow (interms of velocity and pressure on circumference) appeared more smeared out with lesspronounced peaks when coarser meshes were applied. When extracting the spatial 1st
harmonic gust from such a calculation these differences can be important: Relative vorticalamplitude variations of 16% and potential amplitude variations of 8% due to meshvariations were estimated in the turbopump turbine 4% of cax behind the stator trailing

Doctoral Thesis Markus Jöcker Page 47
edge. For comparison, around the same axial position the vortical amplitude variedrelatively with 7.6% per mm axial position and the potential amplitude with about 6.2% permm axial position. More discussions on the stator exit-flow quality follow in Chapter 6.1.2in comparison to measured data.
x/cax=1.21 x/cax=1.40 x/cax=1.54Time averaged effective Mach number in stator frame at various axial locations in the gap
Amplitude of 1st harmonic blade surface pressure Phase of 1st harmonic blade surface pressureFigure 19: Rotor mesh sensitivity of unsteady flow field and blade surface computationswith UNSFLO, ADTurB stage (OP10, large axial gap)
Rotor mesh:For gust calculations it can be computationally beneficial to model the rotor flow inviscidwithout computing the blade boundary layer and ensure that the prescribed flow
LegendUNSFLO, coarse rotor mesh , 136 blade surface pointsUNSFLO, fine rotor mesh , 210 blade surface pointsUNSFLO, very fine rotor mesh , 250 blade surface points
70NGV Rotor
Mesh Interface
Suctionside
Pressureside
Pressureside
Suctionside
Suctionside
Pressureside
Pressureside
Suctionside

Page 48 Doctoral Thesis Markus Jöcker
disturbances at the inlet boundary to the computational domain are sufficient to describethe interactions with the neighbouring stator. For the subsonic turbopump turbine, bothinviscid and viscous rotor meshes with varying resolution had only small influence on theblade surface unsteady pressure due to an incoming gust. The variation in 1st harmonicblade pressure due to the viscous or inviscid model of the rotor flow was comparable tothe one found in the ADTurB stage computations shown above (Figure 19). So the rotorboundary layer had no significant influence on this result. On the other hand theapplication of adaptation of the inviscid mesh, i.e. the local rotor mesh refinementaccording to the local density gradient, resulted in the 1st harmonic pressure amplitudes onthe blade surface to be reduced by about 20%. No explanation for this was found and thenon-adapted mesh results seemed more reliable, so that this option was not further used.The details of the study on the stator and rotor mesh influence on the turbopump turbineare documented in [Jöcker et al. 2000a].
6.1.2 Stator exit flow prediction quality
It is obvious that the quality of the stator exit flow prediction is important for the gustspecification, and it is also the main source for unsteadiness in the stage computed stator-rotor interaction. Validations of predictions against steady probe and laser measurementdata in the ADTurB stage were published in [Freudenreich et al. 1999] (publication 2 in theAppendix). The results towards methods validations are summarised below and a fewadditional aspects are discussed.
Stator exit flows predicted by UNSFLO (Q3D at mid span) and a 3D fully viscous solver(VOLSOL) were compared with L2F traverse measurements at 5 axial mid span positionsin terms of effective Mach number. Focus was laid on the cases with transonic flowconditions with a typical trailing edge shock system similar to the one shown in Figure 7.The measurements were performed behind the isolated stator row with the rotor removed,boundary conditions for the computations were specified according to thesemeasurements. The velocity profile in circumferential direction was characterised by twodeficits, one due to the wake propagating in approximate exit flow direction (about 73°from axial) and one due to a shock propagating in approximately axial direction from thestator trailing edge. Similar results have been obtained downstream of the 43 NGV stator,which are shown in Figure 21. Depending on the axial distance behind the trailing edgethese two velocity deficits were merging into one large deficit or two separate deficitsappeared. The locations of the deficits were computed correctly by the codes but thenumerical results showed also some differences to the measured data. None of thenumerical methods reflected the measured diminution of the wake deficit with axialdistance. UNSFLO gave a too small Mach number deficit in the wake shortly behind thevane (x/cax=1.04), which then did not decay in axial direction as fast as the measured one.VOLSOL predicted the deficit too large close to the stator trailing edge (at x/cax=1.04), butended up with a similar wake decay as UNSFLO further downstream (x/cax=1.74). Themain difference in mid span flow between the two predictions was the shock strength(VOLSOL gave a larger change in Mach number over the shock), even though thecomputations were driven by the same blade pressure ratio (p2/pt1). This was alsoindicated by the comparison of blade surface pressure distribution at midspan. On theother hand the Mach number deficit due to the wake was less pronounced in the VOLSOLresult than in the measurements and the UNSFLO results.

Doctoral Thesis Markus Jöcker Page 49
Discussion:Shock strength and position prediction are very sensitive not only to the blade pressureratio but also to the area relation of throat area to flow exit area. The specification of thestream tube expansion in the Q3D method is controlling this area relation, whereas 3Dmethods have the advantage that these area relations are included in the model. Thedifficulty to specify a correct stream tube evolution in Q3D methods to match the 3D flow isa known weakness of these methods. But not only shock strength, also wake deficit waspredicted differently by the methods. The deviation in the computed wake Mach numberdeficits could be due to the different turbulence models. UNSFLO was applied with a one-equation turbulence model in the near blade region only whereas VOLSOL was appliedwith a Baldwin-Lomax type turbulence model in the complete flow field. Also 3D effectsmay have caused the differences between the predictions. Radial velocity components atmid span were significant in the wake flow but not in the core flow, which could havemodified the appearance of the compared 2D Mach number.
The main conclusion from this study with regard to unsteady stator-rotor predictions wasthat the boundary conditions for a steady stator computation to estimate the gust weredifficult to specify correctly in the applied Q3D method. For a stator exit flow of goodquality the blade pressure ratio and the stream tube definition are sensitive parameters,especially in the studied transonic flow. The observed difference between 3D computationand experiment was probably caused by an unknown mismatch of such boundaryconditions. The results from the presented steady stator only computations showed alsothat the agreement to the measured gust is furthermore dependent on the axial position atwhich the gust is extracted. At some “intermediate” axial positions the agreement is betterthan very close to or far downstream of the stator trailing edge. This might not be general.
6.1.3 Gust specification
An assessment of the relevance of the observed differences in stator exit flow computationfor the rotor blade excitation prediction could only be made with knowledge of the separateinfluence of wake, pressure wave and shock excitation. The generic study of potential andvortical excitation of the turbopump turbine ([Jöcker et al. 2001], publication 5 in theAppendix) indicated that in the type of investigated turbines the wake influence on theexcitation is rather small compared to the potential excitation. This suggested that thedifferences in wake prediction are not so relevant, but that the differences in potential andshock strength prediction had a large influence on the excitation pressure. The excitationmechanisms are discussed further in Chapter 6.2. The same investigation demonstratedalso the difficulty to define the UNSFLO input parameters for a gust computation (adescription of these parameters is given in the Appendix). Neither the application of avelocity splitting according to the documentation in Wisler et al. [1993] (see Chapter 4.2)nor the extraction of the pressure amplitude from the steady computation revealed the gustinput parameters, especially the potential disturbance amplitude, which gave the bestagreement to the full stage computation. However, this best agreement solution, whichwas obtained by variation of the inlet gust amplitudes, showed the relevant rotor bladeexcitation pressure in the 1st harmonic (no higher harmonics could be resolved with themethod without knowing the higher harmonics of the excitation). The gust method wasjudged to give a good result of the investigated case, when the gust boundary conditionswere well specified. Possibilities to obtain the unsteady gust boundary conditions are given

Page 50 Doctoral Thesis Markus Jöcker
by good quality through flow computations, steady stage computations or experiments. Forthe 3D gust computation on the ADTurB stage shown in Chapter 6.1.4 a 3D viscoussteady stator computation was performed with VOLSOL according to experimentalboundary conditions measured in the stage, a comparison of blade surface pressure toexperiments is shown in Figure 20. For reference also the Q3D stator only UNSFLO resultis included. The 3D computation agrees very well with the experimental data, even thoughthe stator test data was obtained without the rotor, whereas the computation was madewith boundary conditions from a full stage measurement. The main differences of theseboundary conditions to the stator only boundary conditions used for the UNSFLOcomputation are a slightly modified hub contour and the blade pressure ratio was by 4.2 %larger, which gave a weaker shock with better agreement to experiments.
0 0.2 0.4 0.6 0.8 10.2
0.4
0.6
0.8
1
x/cax
p/p t1
UNSFLOVolsol 20% spanVolsol 50% spanVolsol 90% spanexperiments 20% spanexperiments 50% spanexperiments 90% span
Figure 20: 3D stator only calculation (stator 1, 43 NGV) with VOLSOL for gust definition
A comparison of the computed gust in terms of Mach number and pressure at midspanbehind the stator is shown in Figure 21. The circumferential distribution of Mach number issimilar to the one discussed for the 70NGV stator (publication 2 in the Appendix[Freudenreich et al. 1999]), which were also described in the above discussion of statorexit flow predictions (Chapter 6.1.2). Two deficits, one due to the wake and one due to theshock are seen, which merge at some axial distances behind the stator, because theypropagate in different directions (see also Figure 32). In the pressure distribution only theflow compression over the shock is seen, the wake deficit is as expected not accompaniedby a pressure deficit. Due to the modified boundary conditions the VOLSOL exit flow isnow at a lower Mach number level compared to the UNSFLO result leading to a smallerpressure change over the shock. Both VOLSOL and UNSFLO give a fairly good predictionof the stator downstream Mach number distribution. A clear difference between VOLSOLand UNSFLO is seen in the pressure at about the middle of the passage exit flow, where a

Doctoral Thesis Markus Jöcker Page 51
pocket of increased pressure appears in the VOLSOL computation. The reason for this isnot clear. Both the differences between 2D and 3D flow but also differences in the“reflectivity” of the computational exit boundaries to pressure waves could cause thedeviation.
0.5 1 1.5 2 2.50.2
0.4
0.6
0.8
1
1.2
1.4
phi/phi0
Mac
hn
umb
er(-
)
UNSFLOVolsol, 50% spanexperiments, 50% span
0.5 1 1.5 2 2.50.3
0.35
0.4
0.45
0.5
0.55
0.6
phi/phi0
Pre
ssur
ep/
p t1
UNSFLOVolsol, 50% span
3% of cax,stator behind stator TE
0.5 1 1.5 2 2.50.2
0.4
0.6
0.8
1
1.2
1.4
phi/phi0
Mac
hn
umb
er(-
)
UNSFLOVolsol, 50% spanexperiments, 50% span
wake position
Shock position
0.5 1 1.5 2 2.50.3
0.35
0.4
0.45
0.5
0.55
0.6
phi/phi0
Pre
ssur
ep/
p t1
UNSFLOVolsol, 50% span
pressure side
suction side
Compressionby shock
14 % of cax,stator behind stator TE
0.5 1 1.5 2 2.50.2
0.4
0.6
0.8
1
1.2
1.4
phi/phi0
Ma
chnu
mbe
r(-)
UNSFLOVolsol, 50% spanexperiments, 50% span
0.5 1 1.5 2 2.50.3
0.35
0.4
0.45
0.5
0.55
0.6
phi/phi0
Pre
ssur
ep/
p t1
UNSFLOVolsol, 50% span
28 % of cax,stator behind stator TE
Figure 21: Comparison of predicted and measured Mach number and predicted pressurebehind stator 1 (43 NGV) at three axial positions, stator only data

Page 52 Doctoral Thesis Markus Jöcker
6.1.4 Excitation prediction
In this chapter various results of excitation computations in terms of blade surfacepressure harmonics are discussed and compared to experimental data. Validations of thiskind were published in [Jöcker et al. 2000b] (publication 3 in the Appendix), where theexcitation pressures were computed with UNSFLO on a test case similar to the ADTurBcase. At that time no experimental data was available for validation on the ADTurB caseitself. This test case was measured at the “Von Karman Institute for Fluid Dynamics” (VKI)in Bruessels, Belgium. The test case is named here VKI test case and is described indetail by Denos et al. [1999, 2000] including numerical analyses of the unsteady flow. Itdiffers from the ADTurB case by a geometric scaling and slightly different boundaryconditions (rotational speed and blade pressure ratio). Laumert et al. [2000, 2001a, b]provided additional 3D unsteady numerical studies on the VKI case. Taking the scalingand modified boundary conditions into account the present UNSFLO stage calculationresults could be compared to the published experimental and numerical work. It was foundthat UNSFLO predicted the unsteady flow at midspan comparably well. Similar to thenumerical results by Denos and Laumert an under-prediction of the shock sweepingexcitation at front part suction side was found. This was visible both in the time resolvedsurface pressure in this region as well as in the 1st harmonic of the blade surface pressureon the complete suction side. The second harmonic amplitude agreed better to theexperimental data, also the phases of both 1st and 2nd harmonic compared well. From thisstudy it could already be concluded that the applied UNSFLO method gave acceptableresults at midspan. Especially the unsteady pressure on the rotor was reasonably wellpredicted in comparison to published 3D computations and the overall pattern of theunsteady blade pressure was also in agreement to the measured ones. It was proven thatthe simplification of the stream tube thickness was not the reason for the under-predictionof shock strength. Also small variations of the stage back pressure (by 0.9 %) androtational speed (by 0.5%) did not change the predicted rotor excitation.
Later, experimental data of the unsteady blade pressure of the ADTurB rotor became alsoavailable both for subsonic and transonic flow conditions. A comparison of the predictedand measured pressure amplitudes is presented in Figure 22. UNSFLO is in goodagreement with the subsonic data but over-predicts the 1st harmonic pressure in thetransonic case with up to 75% in the leading edge peak. For the transonic case the rotorexcitation pressure was also computed with SliQ, a 3D linearised gust computationmethod, for which the incoming gust boundary condition was specified from the 3D viscousVOLSOL computation discussed above (Chapter 6.1.3). This gust computation gave afairly good agreement in both 1st and 2nd harmonic of excitation pressure.
Discussion:The found level of agreement between measurement and prediction of unsteady bladesurface pressures is not unusual for such computations. The present comparison showsthat the Q3D method UNSFLO did a fairly good job in predicting the unsteady pressuresfor subsonic flow, in transonic flow the observed over-prediction is probably caused by thetoo high Mach number computation already in the stator-rotor gap (see Figure 4 in [Jöckeret al. 2000b], publication 3 in the Appendix). The reason for this difference between theUNSFLO computation and experiments could be a mismatch in boundary conditions
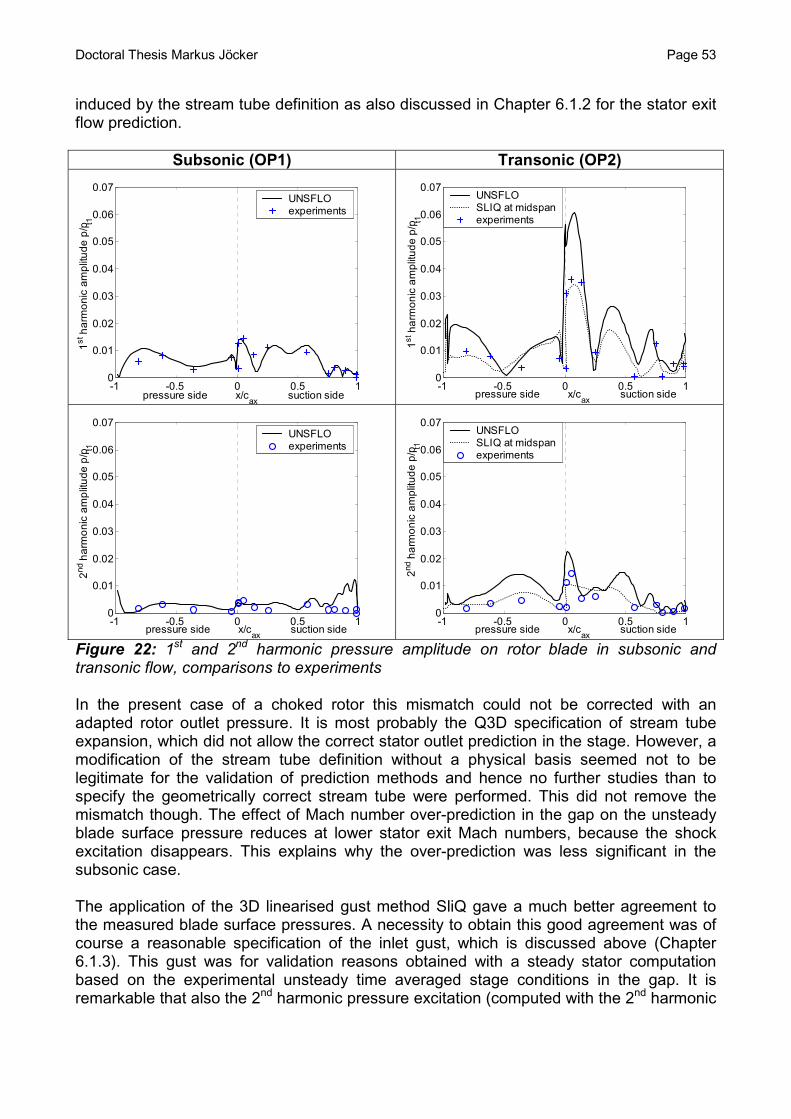
Doctoral Thesis Markus Jöcker Page 53
induced by the stream tube definition as also discussed in Chapter 6.1.2 for the stator exitflow prediction.
Subsonic (OP1) Transonic (OP2)
-1 -0.5 0 0.5 10
0.01
0.02
0.03
0.04
0.05
0.06
0.07
pressure side x/cax
suction side
1st
har
mo
nic
amp
litu
dep
/p t1
UNSFLOexperiments
-1 -0.5 0 0.5 10
0.01
0.02
0.03
0.04
0.05
0.06
0.07
pressure side x/cax
suction side
1stha
rmon
ica
mpl
itud
ep/
p t1
UNSFLOSLIQ at midspanexperiments
-1 -0.5 0 0.5 10
0.01
0.02
0.03
0.04
0.05
0.06
0.07
pressure side x/cax
suction side
2nd
har
mo
nic
amp
litu
dep
/p t1
UNSFLOexperiments
-1 -0.5 0 0.5 10
0.01
0.02
0.03
0.04
0.05
0.06
0.07
pressure side x/cax
suction side
2ndha
rmon
ica
mpl
itud
ep/
p t1
UNSFLOSLIQ at midspanexperiments
Figure 22: 1st and 2nd harmonic pressure amplitude on rotor blade in subsonic andtransonic flow, comparisons to experiments
In the present case of a choked rotor this mismatch could not be corrected with anadapted rotor outlet pressure. It is most probably the Q3D specification of stream tubeexpansion, which did not allow the correct stator outlet prediction in the stage. However, amodification of the stream tube definition without a physical basis seemed not to belegitimate for the validation of prediction methods and hence no further studies than tospecify the geometrically correct stream tube were performed. This did not remove themismatch though. The effect of Mach number over-prediction in the gap on the unsteadyblade surface pressure reduces at lower stator exit Mach numbers, because the shockexcitation disappears. This explains why the over-prediction was less significant in thesubsonic case.
The application of the 3D linearised gust method SliQ gave a much better agreement tothe measured blade surface pressures. A necessity to obtain this good agreement was ofcourse a reasonable specification of the inlet gust, which is discussed above (Chapter6.1.3). This gust was for validation reasons obtained with a steady stator computationbased on the experimental unsteady time averaged stage conditions in the gap. It isremarkable that also the 2nd harmonic pressure excitation (computed with the 2nd harmonic

Page 54 Doctoral Thesis Markus Jöcker
of the inlet gust) was predicted well in magnitude, even though the gust computation couldnot regard any pressure wave reflected back from the stator row. It is concluded that thepresent 3D linearised gust method can give a good representation of the blade excitationpressure at least at midspan. This depends strongly on the quality of the gust specification,which is assumed to be close to the test conditions, because the boundary conditions wereextracted from the unsteady test result itself.
The difference between UNSFLO and SliQ at midspan can not be explained with thepresence of 3D flow effects like secondary flows and strong radial flow components. If 3Deffects would cause the over-prediction by UNSFLO it could hardly be explained that in thevalidation against the VKI turbine this code as well as other Q3D and 3D codes under-predicted the rotor excitation. Also here a mismatch in boundary conditions is more likely.
A critical assessment of the above comparison must also point out eventual mismatches inexperimental boundary conditions.
• It is possible, even though not experimentally confirmed, that leakage flows in thetest rig modified slightly the boundary conditions, especially the Mach number in thestator-rotor gap.
• It has also been found that the axial gap varied during test rig operation due tothermal stresses in the hardware. Even though this was detected early andcompensated for in the presented comparisons it introduces a small uncertainty.
• Blade vibrations could have modified the unsteady pressures on the rotor, howeverthe presented unsteady pressure data were measured at computed resonanceconditions, which differed from the real resonance conditions and it is confirmedthat the blades did not vibrate during the measurement of the data in Figure 22[Hennings 2002b].
• To model the flow in the turbine stage needs usually some degree of idealisation ofthe geometry. In the present computations all stator vanes are assumed to beidentical as well as all rotor blades, which is normally not the case in reality. It hasbeen found during the ADTurB measurement campaign that the vanes are notperfectly identical, which introduced vane to vane variations in the gust. These canintroduce low engine order excitations, which can modify the excitation pressureson individual rotor blades, especially lower harmonics of excitation due to the lowengine order might be present. The appearance of lower harmonics in the excitationmight reduce the vane passing frequency excitation compared to a perfectlyperiodic vane excitation. The existence of low engine order excitations during thetest is illustrated and discussed in [Hennings et al. 2002].
For the remainder of the present study the above results are most important to show thatthe Q3D method UNSFLO predicted the excitation effects in terms of blade surfacepressure harmonics both compared to experiments and to the 3D calculation with SliQ.The UNSFLO over-prediction of the excitation will not be relevant for the further study,where the effects will be compared relatively due to parameter variations.

Doctoral Thesis Markus Jöcker Page 55
6.1.5 Off-Design computations and the role of the available turbulence models inUNSFLO
Low speed case OP5 and OP6:Some resonance conditions investigated in the ADTurB stage were at off-design withrelatively low rotational speeds (see Campbell diagram, Figure 15). As discussed in[Jöcker et al. 2000b] (publication 3 in the Appendix) these cases showed separationspredicted with UNSFLO, which were triggered by the unsteady flow on the rotor suctionside. Furthermore, they only appeared when the herein usually applied one-equationturbulence model [Birch 1987] was used. The separations were suppressed when thealgebraic turbulence model [Cebeci and Smith 1974] was used. Even though separationsare likely to occur in these cases due to the high flow incidence, it is doubtful that thepredicted unsteady pressures are correct regarding the capability of the numerical method.Viscous terms are only regarded within the O-mesh layer around the blade and theseparations partly extend this region. The induced pressure unsteadiness on the bladesurface was very large both in magnitude and in harmonic content. If such conditions werelikely to occur in engines it would be important to assess the predictive possibilities of suchphenomena and validate it against experimental data. That was beyond the frame of thiswork, mainly because of the lack of experimental evidence.
Subsonic cases OP1, OP5, OP9:All subsonic cases showed separations on the blade surface, which were triggered by theunsteady flow. In difference to the low speed cases OP5 and OP6, where theseseparations extended over the major part of the blades with relatively large separationbubbles, they were local and small at the higher rotational speeds. Furthermore, both theone-equation turbulence model and the algebraic turbulence model, predicted theseparations on the subsonic cases. These subsonic cases were included in thediscussions in this thesis where useful, because the influence of the separations on themain excitation of the rotor blade was regarded as small and the numerical solution aspartly useful. However, the separation influenced the time averaged flow field and theseresults are regarded with care.
6.1.6 Blade vibration computations
From the work published in Fransson et al. [1999] (publication 1 in the Appendix) it wasconcluded that the quality of the presented 2D and Q3D predictions had to be improved,especially for viscous investigations. The applied codes ranging from potential, via inviscidlinear and non-linear codes to non-linear fully viscous codes could at the most predict thetrends of unsteady blade pressures in the case of transonic off design flow. The separationbubble in the off-design case and its influence on the unsteady blade pressure were onlyindicated by the fully viscous method. For the aerodynamic damping however theseparation had a negligible influence, because the pressure phase induced by theseparation bubble disturbance is nearly 180° so that no work is done by the flow on thevibrating blade.
The test case has been used to verify the prediction quality by UNSFLO. The blade motionduring a computation is realised in UNSFLO by deformation of the mesh in the O-meshsurrounding the blade. This required that the motion amplitude was small enough and the
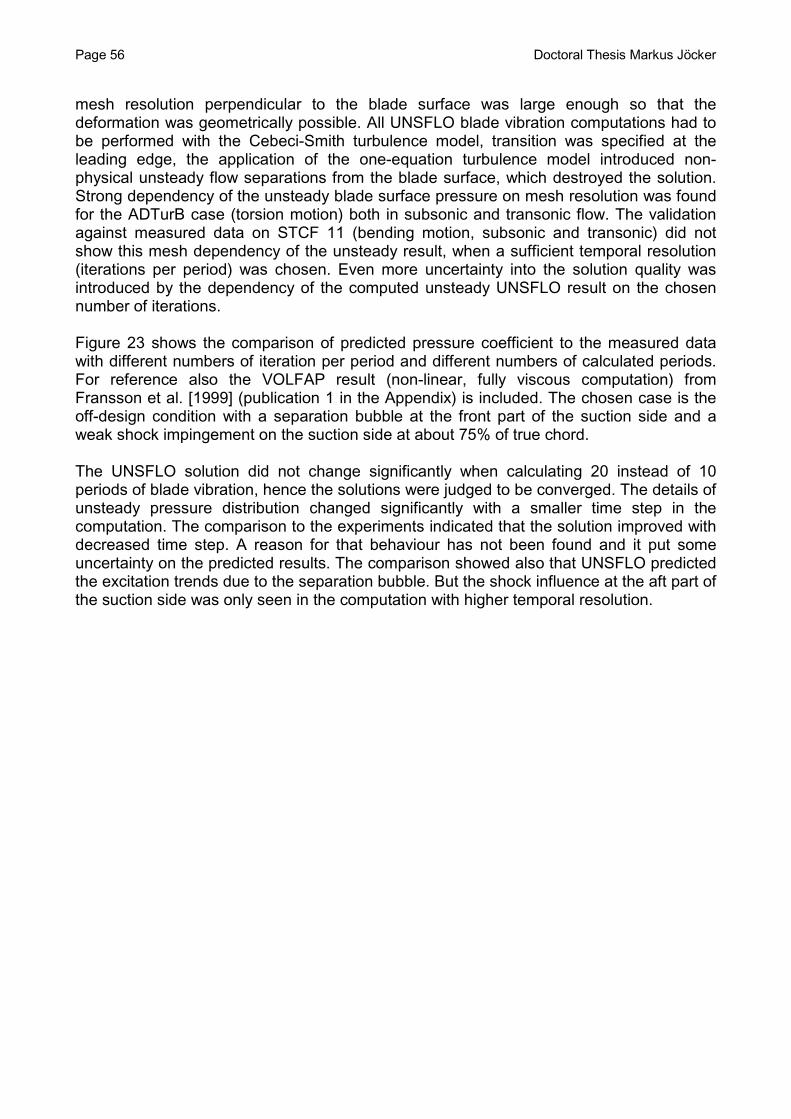
Page 56 Doctoral Thesis Markus Jöcker
mesh resolution perpendicular to the blade surface was large enough so that thedeformation was geometrically possible. All UNSFLO blade vibration computations had tobe performed with the Cebeci-Smith turbulence model, transition was specified at theleading edge, the application of the one-equation turbulence model introduced non-physical unsteady flow separations from the blade surface, which destroyed the solution.Strong dependency of the unsteady blade surface pressure on mesh resolution was foundfor the ADTurB case (torsion motion) both in subsonic and transonic flow. The validationagainst measured data on STCF 11 (bending motion, subsonic and transonic) did notshow this mesh dependency of the unsteady result, when a sufficient temporal resolution(iterations per period) was chosen. Even more uncertainty into the solution quality wasintroduced by the dependency of the computed unsteady UNSFLO result on the chosennumber of iterations.
Figure 23 shows the comparison of predicted pressure coefficient to the measured datawith different numbers of iteration per period and different numbers of calculated periods.For reference also the VOLFAP result (non-linear, fully viscous computation) fromFransson et al. [1999] (publication 1 in the Appendix) is included. The chosen case is theoff-design condition with a separation bubble at the front part of the suction side and aweak shock impingement on the suction side at about 75% of true chord.
The UNSFLO solution did not change significantly when calculating 20 instead of 10periods of blade vibration, hence the solutions were judged to be converged. The details ofunsteady pressure distribution changed significantly with a smaller time step in thecomputation. The comparison to the experiments indicated that the solution improved withdecreased time step. A reason for that behaviour has not been found and it put someuncertainty on the predicted results. The comparison showed also that UNSFLO predictedthe excitation trends due to the separation bubble. But the shock influence at the aft part ofthe suction side was only seen in the computation with higher temporal resolution.
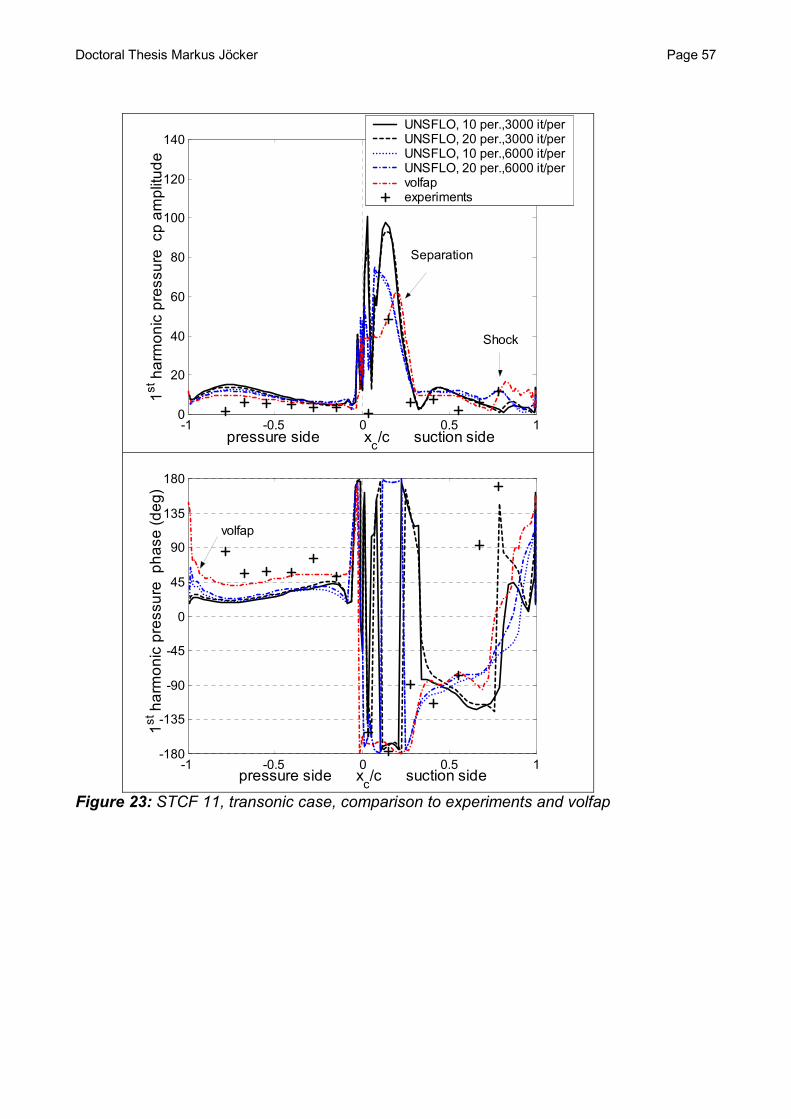
Doctoral Thesis Markus Jöcker Page 57
-1 -0.5 0 0.5 10
20
40
60
80
100
120
140
pressure side xc/c suction side
1stha
rmon
icpr
essu
recp
ampl
itude
UNSFLO, 10 per.,3000 it/perUNSFLO, 20 per.,3000 it/perUNSFLO, 10 per.,6000 it/perUNSFLO, 20 per.,6000 it/pervolfapexperiments
Separation
Shock
-1 -0.5 0 0.5 1-180
-135
-90
-45
0
45
90
135
180
pressure side xc/c suction side
1stha
rmon
icpr
essu
reph
ase
(deg
)
volfap
Figure 23: STCF 11, transonic case, comparison to experiments and volfap

Page 58 Doctoral Thesis Markus Jöcker
6.2 Excitation mechanisms
To understand the aerodynamic excitation mechanisms of the rotor blades in theinvestigated turbine stages the time-resolved study of the flow field and the blade surfacepressure is necessary. The main questions are: What are the principle mechanismsobserved in the turbines? Can any of the observations be generalised? How relevant areoperating conditions and (2D) geometry? The latter question will be more deeplyconsidered in Chapter 6.3, where the parameter studies are discussed. The presentchapter focuses on the description of the principally known excitation mechanisms in ahigh pressure turbine stage, which are due to wake excitation, potential excitation andshock excitation. This is partly supported by the thorough analysis of the unsteady flow ina high pressure turbine stage presented in the work by Laumert et al. [2001a] and theexperimental analysis of shock propagation in a linear cascade by Johnson et al. [1989].
In [Freudenreich et al. 2001a], publication 4 in the Appendix, the 1st harmonic excitationpeaks of the ADTurB transonic case OP2 (see Figure 22) are discussed by comparison tothe time-space presentation of the unsteady blade surface pressures. An attempt hasbeen made to relate the computed blade surface pressure variations to measured Machnumber variations in the gust and rotor passage flow field, even though the experimentsand the UNSFLO computations were performed at slightly different operating conditions asdiscussed in the validation part of this thesis (Chapter 6.1.4). This difference caused astronger stator trailing edge shock in the computations, which enforced the shock andpotential excitation effects. A comparison of measured and computed time resolvedvelocity at distinct positions close to the rotor blade surface demonstrated main differencesclose to the rotor leading edge, where the stator trailing edge shock has its main influence.The measured flow perturbations in terms of Mach number have been shown to relate inspace and time to computed pressure perturbations on the rotor blade surface, so that apositive Mach number perturbation is accompanied with a negative perturbation pressureand vice versa (see also Figure 25). This indicates that the measured and computedunsteady flow field are still comparable in their development. The Mach number howeverdoes not allow a conclusion on the excitation mechanism, as both wakes, pressure wavesand shocks induce Mach number variations, an identification of the excitation mechanismsneeds to track pressure variations regarding their origin and propagation as discussed inthe following subchapters.
The study of the turbopump turbine (Chapter 5.2) supported the analysis of excitationmechanisms, as it provided a test case with different geometry and without a shockexcitation source. Detailed discussion of this case is published in [Jöcker et al. 2001](publication 5 in the Appendix) and the findings on excitation mechanisms are included inthe descriptions below (Chapters 6.2.2 and 6.2.3).
6.2.1 Excitation due to stator trailing edge shock
The rotor excitation in the ADTurB transonic case (OP2) is characterised by the dominantshock influence. Figure 24 shows to the right the time space representation of the surfaceperturbation pressure. The shock, which is emanating from the stator trailing edgeimpinges on the rotor crown at a time t/Trotor =0.8, which is accompanied with a steep

Doctoral Thesis Markus Jöcker Page 59
perturbation pressure gradient due to the flow compression over the shock (see arrow inFigure 25 to the right, where the shock is impinging on blade 3).
-0.1
-0.05
0
0.05
0.1
0.2 0.4 0.6 0.8 1
-0.8
-0.6
-0.4
-0.2
0
0.2
0.4
0.6
0.8
t/Trotor
pres
sure
side
x/c ax
suct
ion
side
Snap shot in Figure 25, blade 2 1/~tpp
-0.1
-0.05
0
0.05
0.1
0.2 0.4 0.6 0.8 1
-0.8
-0.6
-0.4
-0.2
0
0.2
0.4
0.6
0.8
t/Trotor
pre
ssur
esi
dex/
c axsu
ctio
nsi
de
OP1 (subsonic) OP2 (transonic)Figure 24: Time-space plots of computed unsteady blade surface pressures, subsonicand transonic ADTurB case (OP1 and OP2), large axial gap
blade
0t/TRotor=0.75
100 m/s
∆Mrel
0.080.060.050.030.020.00
-0.02-0.03-0.05-0.06-0.08 blade 1
blade 2
blade 3
OP1 (subsonic)Perturbation pressure
field, computedContours are magnified by afactor 2.5 compared to OP2
OP2 (transonic)Mach number variation andvelocity arrows, measured
[Freudenreich et al. 2001a]
OP2 (transonic)Perturbation pressure
field, computed
(scale see Figure 24)Figure 25: Snap shot of unsteady flow field and blade surface pressure at t/Trotor =0.41
This attachment of the shock wave to the blade is usually followed by a shock wavereflection towards the pressure side of the neighbouring blade. This reflection results in thepeak P2 on the aft part of the pressure side. The peak P2 is also caused by the potentialexcitation due to the passing stator (discussed below with potential excitations), therefore,two events are marked with the label P2 in Figure 24, the earlier event related to the shockwave reflection. The pressure gradient induced by the shock sweeps over the bladesurface towards the leading edge of the blade and passing it, where it then detaches fromthe surface. This detachment is, in accordance to published shock wave analyses,
12
312
shock
P1
P2
P3
P1
P2
w
separations
w
Bl. 2
Bl. 3
Bl. 1
1
3
P1
2
Bl. 3
Bl. 2
Bl. 1
P1
1
3b
2b2b
2b

Page 60 Doctoral Thesis Markus Jöcker
accompanied with a bowed wave reflection travelling upstream towards the stator and theshock end towards the pressure surface of the blade below, where it causes a peak inexcitation, labelled P3 in Figure 24. The comparison to literature suggests that theprinciple mechanism is that both the attachment and the detachment of the shock triggerspressure waves to emanate from these locations, which then travel while being distorted,reflected and diminishing. The strength of these waves and their live time must depend onthe strength of the shock. The blade geometry and the mean rotor flow field control theattachment and detachment points and the wave propagation. The pressure gradient ofthe shock itself causes a strong perturbation while sweeping over the leading edge region,its strength directly related to the pressure gradient over the shock.
6.2.2 Potential excitation
A comparison of the perturbation pressures of the transonic case (M2,stator=0.94) to thesubsonic case (M2,stator=0.81), in Figure 24 to the left, illustrates the large difference inexcitation magnitude induced by the shock. Searching for common excitations in bothcases possible wake and potential excitations become evident. In the subsonic case theexcitation of the rotor leading edge region is also observed but much smaller than theshock induced excitation of the transonic case. Whereas shock induced unsteady pressurepeaks in the magnitude ±10% of total inlet pressure were found potentially inducedpressure maxima in the leading edge region were typically about ± 3% of total inletpressure pt1, exceptions are the extremely small gap cases in the turbopump turbine,where a pressure amplitude of about ±9% of pt1 were observed. Both the subsonic andtransonic case shows the peaks 1,2 and 3 on suction side and the peaks P1 and P2 onpressure side induced by the potential field of the stator, which is cut through by the rotor.The peaks P1, 1 and 3 can be seen in the flow field snap shot of Figure 25, right side(transonic case) on the surface of blade 2. At this time the passage between blade 1 and 2is approximately between two vanes and the potential stator field has a strong negativepressure influence on the leading edge region of blade 1, which is reflected to also affectthe whole pressure side of blade 2. But the rotor has already moved so far that the positivepressure disturbance associated with stator trailing edge of the NGV below reached therotor blade 2 on suction side initiating peak 1. The very local peak 3 seems to beassociated with variations in the rotor passage shock in the throat emanating from theneighbouring blade’s trailing edge. This variation is not present in the subsonic case asthere is no rotor passage shock.
When the rotor is turning further the positive peak 1 will change to the negative peaks 2band then 2. On the blade crown, the negative pressure wave 2b appears (see also onFigure 25, blade 3). It diminishes after the shock has attached to the blade and growsagain to form peak 2, slightly downstream of the peak 2b location. This is similar in thesubsonic case. Whereas the peak 2b is still related to the negative pressure wavesweeping over the same blade’s suction side the peak 2 is already induced by theappearance of the negative pressure field of the following NGV. The appearance of thispattern is important because it will have an influence when the axial gap is varied(discussed in Chapter 6.3.2).
On pressure side peak P1 attaches to the blade surface when the positive potential wavepasses into the passage. This excitation peak is then travelling downstream while thepotential wave approaches the blade above (blade 3 in Figure 25). This excitation is much
Doctoral Thesis Markus Jöcker Page 61
weaker in the subsonic case, but still visible. Hence, this is not a purely shock inducedphenomenon but also formed by potential wave propagation. The formation of peak P2 onpressure side is different in the subsonic and transonic case due to the involvement of theshocks in the latter one. As explained above this peak is partly due to a pressure wavetriggered by the attachment of the stator shock to the rotor blade, which is of course notpresent in the subsonic case. Furthermore, the passage shock in the rotor seems tomodify a wave reflection pattern seen in the subsonic case, where the peak P2 is relatedto a pressure wave reflection originating from peak 3b on the above suction side. Thispositive pressure region is also seen in the transonic case just in front of the passageshock and may also participate in the formation of peak P2 on pressure side. In this area itis not possible to make more clear statements on the excitation mechanisms based on thepresent results, because too many different effects are involved. For further analysis it willbe important to see the relative differences in the observed mechanisms related to theparametric variations.
The analysis of the potential excitation mechanisms in the turbopump turbine ([Jöcker etal. 2001], publication 5 in the Appendix) has shown a partly comparable behaviour asobserved in the ADTurB stage. Also the excitation level at nominal gap is comparable tothe subsonic ADTurB case. The main excitation is associated with the rotor leading edgepassing the trailing edges of the stator inducing the large pressure variations on theleading edge region. Also other peaks of excitation distribute similar to the presentedADTurB cases above when relating the time-space resolution of the blade surfaceunsteady pressures (shown in [Jöcker et al. 2001], publication 5 in the Appendix). Whencomparing the timely propagation of the unsteady pressure waves it seems that in theturbopump turbine waves are more reflected between pressure and suction side than itappears in the ADTurB cases. This might be due to the relative higher solidity and thespecific camber of the blades so that the pressure waves do reflect more often betweenpressure and suction side before leaving the passage. Figure 26 shows instantaneousplots of the unsteady perturbation pressures at two successive time steps illustrating sucha reflection (see arrows).
t/Trotor=0.47 t/Trotor=0.57Figure 26: Potential wave reflection in the turbopump turbine rotor passage, contours ofperturbation pressures and perturbation velocity vectors at two successive times, scale onpressure magnified with factor 5 compared to Figure 24

Page 62 Doctoral Thesis Markus Jöcker
The difference in behaviour has the major influence on the exact timing when the pressurepeaks appear on the blade surface. It is also obvious from the comparison of the twoturbines that the areas affected by the pressure waves are different. The turbopumpturbine rotor excitation is characterised by the reflected pressure wave hitting nearly thecomplete pressure side as indicated in Figure 26 on the right side, whereas the ADTurBturbine shows a more local excitation wave (P1) on pressure side directly induced by thepassing stator trailing edge. Reasons for that might be the steady pressure distribution onthe rotor blade and the incidence angle of the rotor inlet flow. As discussed in Chapter6.3.1, where differences due to the operating point are pointed out, these parameters havea significant influence on the wave propagation in the rotor passage.
6.2.3 Wake excitation
The unsteadiness introduced by the wake has generally a large influence on the velocityfield, as for example measured in the ADTurB stage by Freudenreich [2001b]. The twocounter rotating vortices, which are built due to the cutting of the low momentum flow inthe wake by the rotor leading edge is clearly present in measurements and computations.The relative changes in Mach number are also partly seen in variations of static pressurein the flow field. However, the influence of the wake on the unsteady pressure on the rotorblade surface is relative small in the investigated cases, especially when the flow istransonic. The snapshot in Figure 25 is taken at a time, when the wake is expected tohave a strong influence on the rotor unsteady pressure, this is when the left turningvortices are attached to the rotor suction side shortly downstream the crown. It is related toa relative strong local velocity deficit, which has been measured and also predicted. Boththe wake and the potential field, which induces a relative pressure peak at this time andplace, cause this deficit. The peak is seen in the perturbation pressure plot and anindication that it is not due to the wake is given by its short and local appearance, asviewed in the time-space plot (Figure 24). A comparison to the subsonic case OP1 on theleft side of Figure 24 shows more clearly the wake influence, its convective characterindicated by two arrows (one for the positive pressure change upstream of the wake and anegative pressure change downstream of the wake, see [Chernobrovkin et al. 1999] forthe exact description of the mechanism). This is still overlaid by the potential pressurewave indicated here with 1. More confidence in this interpretation of the unsteadypressures was obtained in the study of the turbopump turbine, which demonstrated asimilar phenomenon that the wake and potential excitation at the blade suction side crownappear simultaneously. A parametric variation of potential and vortical disturbancestrength at the rotor inlet (defined according to Chapter 4.2) led to the same conclusionthat the wake influence on the unsteady pressure is very small and local even in thatturbine (see also Figure 37). This is discussed in detail in [Jöcker et al. 2001], publication 5in the Appendix. Figure 26 shows on the left side the situation at which the potentialexcitation due to the stator overlays the wake excitation influence (middle rotor blade).
A phenomenon seen in the subsonic case OP1 is the appearance of separations onsuction side in the trailing edge region (see Figure 24, left side). Due to the larger rotoroutlet pressure compared to the transonic case the flow is more sensitive to separations,which are in this case triggered by the unsteady flow, they do not appear in the steady flowsolution. The predicted separations induce unsteady pressure variations on the rotorsurface of relatively high amplitude and frequency. Due to the lack of confidence theseperturbations cannot be further discussed. As pointed out in the validation part it is
Doctoral Thesis Markus Jöcker Page 63
doubtful that the numerical methods applied can resolve such phenomena, neither existexperimental evidence of these separations presently. But they are such local and smallthat in the present case the unsteady pressures solution on other parts on the blades areregarded as useful.
6.2.4 Summary of excitation mechanisms
The excitation mechanisms due to shock, potential waves and wakes have been describedat the nominal operating conditions of the investigated turbines. The differences betweensubsonic and transonic cases pointed out the strength of shock excitation. The shockexcitation mechanism was shown to be comparable to other published analyses. Potentialexcitations have been shown for the two investigated turbines and it was elaborated thatthe typical wave type excitation is similar, but that differences in the propagation directionof the waves and the wave reflection pattern in the rotor passage lead to differences in thetime and space resolved unsteady pressures on the blade surface. The wake influence onthe unsteady pressure on the rotor blade was small in the investigated cases. This wasexplicitly demonstrated on the turbopump turbine, for which wake and potential excitationswere varied separately to study their relative excitation influence.
6.3 Parametric studies
6.3.1 Operating point and rotational speed
Figure 27 gives an overview of the computed cases corresponding to theoreticalresonance conditions of the ADTurB turbine stages (see Table 2) and additionalcomputations. The calculated unsteady 1st harmonic force magnitude f is shown versusrotational speed. This magnitude gives a first glance of the variation of the forcing functionwith operating condition. But due to the disregard of phase differences between axial andtangential forces it does not fully reflect the forcing function magnitude. It rather overlaysthe forcing functions of two special mode shape excitations, a tangential mode and anaxial mode excitation. Before the discussion of the changes in excitation mechanism withrotational speed variation, some characteristics of the operating points are presentedbased on the work in Jöcker et al. [2000b], publication 3 in the Appendix.
Low speed casesThe low rotational speed cases (50% and 61% of rotational speed, 1T crossings due to the70 NGV stator) gave predicted separations on the rotor suction side due to the largeincidence flow. The strong flow acceleration around the leading edge gave also very highlocal Mach numbers in the rotor passage. A comparison of blade surface isentropic Machnumber is shown in Figure 28, where OP6s is characteristic for the low speed cases. Thepredicted separations are triggered by the unsteady flow (they are not present in steadyflow solutions) and induce pressure fluctuations on the rotor suction surface of highamplitude and frequency, but with only little influence on the 1st harmonic force magnitudeas seen in Figure 27. As discussed in the validation part the prediction of separations atthese operating conditions may be physically sound, but the result of unsteady bladepressures given by the code are questionable and not validated. These operatingconditions are not further discussed here.
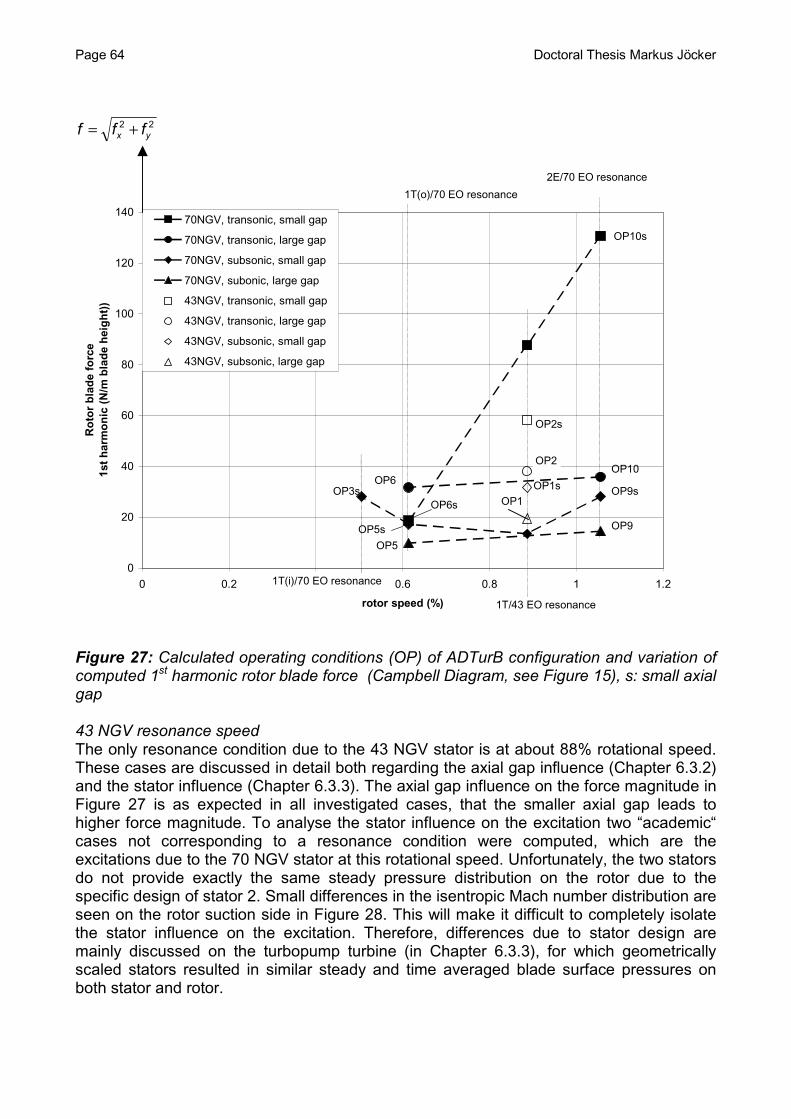
Page 64 Doctoral Thesis Markus Jöcker
22yx fff +=
0
20
40
60
80
100
120
140
0 0.2 0.4 0.6 0.8 1 1.2
rotor speed (%)
Ro
tor
bla
de
forc
e1s
th
arm
on
ic(N
/mb
lad
eh
eig
ht)
)
70NGV, transonic, small gap
70NGV, transonic, large gap
70NGV, subsonic, small gap
70NGV, subonic, large gap
43NGV, transonic, small gap
43NGV, transonic, large gap
43NGV, subsonic, small gap
43NGV, subsonic, large gap
1T/43 EO resonance
1T(o)/70 EO resonance
2E/70 EO resonance
1T(i)/70 EO resonance
OP2s
OP2
OP1sOP1
OP10s
OP10
OP9s
OP9
OP5
OP6
OP5s
OP6sOP3s
Figure 27: Calculated operating conditions (OP) of ADTurB configuration and variation ofcomputed 1st harmonic rotor blade force (Campbell Diagram, see Figure 15), s: small axialgap
43 NGV resonance speedThe only resonance condition due to the 43 NGV stator is at about 88% rotational speed.These cases are discussed in detail both regarding the axial gap influence (Chapter 6.3.2)and the stator influence (Chapter 6.3.3). The axial gap influence on the force magnitude inFigure 27 is as expected in all investigated cases, that the smaller axial gap leads tohigher force magnitude. To analyse the stator influence on the excitation two “academic“cases not corresponding to a resonance condition were computed, which are theexcitations due to the 70 NGV stator at this rotational speed. Unfortunately, the two statorsdo not provide exactly the same steady pressure distribution on the rotor due to thespecific design of stator 2. Small differences in the isentropic Mach number distribution areseen on the rotor suction side in Figure 28. This will make it difficult to completely isolatethe stator influence on the excitation. Therefore, differences due to stator design aremainly discussed on the turbopump turbine (in Chapter 6.3.3), for which geometricallyscaled stators resulted in similar steady and time averaged blade surface pressures onboth stator and rotor.

Doctoral Thesis Markus Jöcker Page 65
-1 -0.5 0 0.5 10
0.2
0.4
0.6
0.8
1
1.2
1.4
1.6
1.8
pressure side x/cax
suction side
Mis
o
OP6sOP2s with 70NGV statorOP10sOP2s (43NGV stator)
-1 -0.5 0 0.5 10
0.01
0.02
0.03
0.04
0.05
0.06
0.07
pressure side s[%] suction side
1sth
arm
onic
ampl
itude
p/pt
1
OP6sOP2s with 70NGV statorOP10sOP2s (43 NGV stator)
Steady rotor blade isentropic Mach number Unsteady rotor blade pressureFigure 28: Comparison of operating conditions and unsteady rotor blade pressure,transonic cases with small axial gap
High speed casesAt the high rotational speed of about 105% of design speed the incidence is significantlyreduced (the relative flow angle is more axial) leading to a different steady load on therotor, mainly the suction side leading edge region is affected (see Figure 28, where OP10srepresents the high speed cases OP9 and OP10). Obviously, this has a large impact onthe excitation forces, most dramatically for the small gap transonic case, and themodification of excitation mechanism due to the high rotational speed is discussed below.
DiscussionIt follows a discussion of the influence of the rotational speed on the excitation mechanismby direct comparison of the case OP10 (105% rotor speed, transonic) to the correspondingtransonic (academic) case at 88% rotational speed (OP2s-70NGV). Time space plots ofthe unsteady rotor surface pressures of these cases are compared in Figure 29. The leftside shows the OP2 case, which has the same stage pressure ratio and rotor speed as theoriginal OP2, but with the 70 NGV stator instead of the 43 NGV stator. The excitationpeaks due to the 70 NGV stator are related to the excitation peaks observed in the studyof the 43 NGV excitation in Chapter 6.3.3, where the influence of stator count is discussed.
At high rotational speed the excitation pattern changes drastically. Obviously, the rotorexperiences at the higher rotational speed (right side of Figure 29) a strong excitation dueto potential excitation, which is emerging further into the rotor passage than at lowerrotational speed. The identified peaks 1 and 2 on suction side are not as distinguishedfrom the shock excitation anymore. Instead, potential excitation and shock excitationappear as a continuous process in the time space plot. The situation when the potentialexcitation hits the rotor suction side is indicated in the snap shot in Figure 30 with anarrow. Also in the subsonic case at high rotational speed (OP9, 105% rotor speed) it hasbeen observed that the potential excitation reaches longer into the rotor passage than atlower rotational speed, but of course the excitation level is much lower according to thediscussion of excitation mechanisms above (Chapter 6.2).
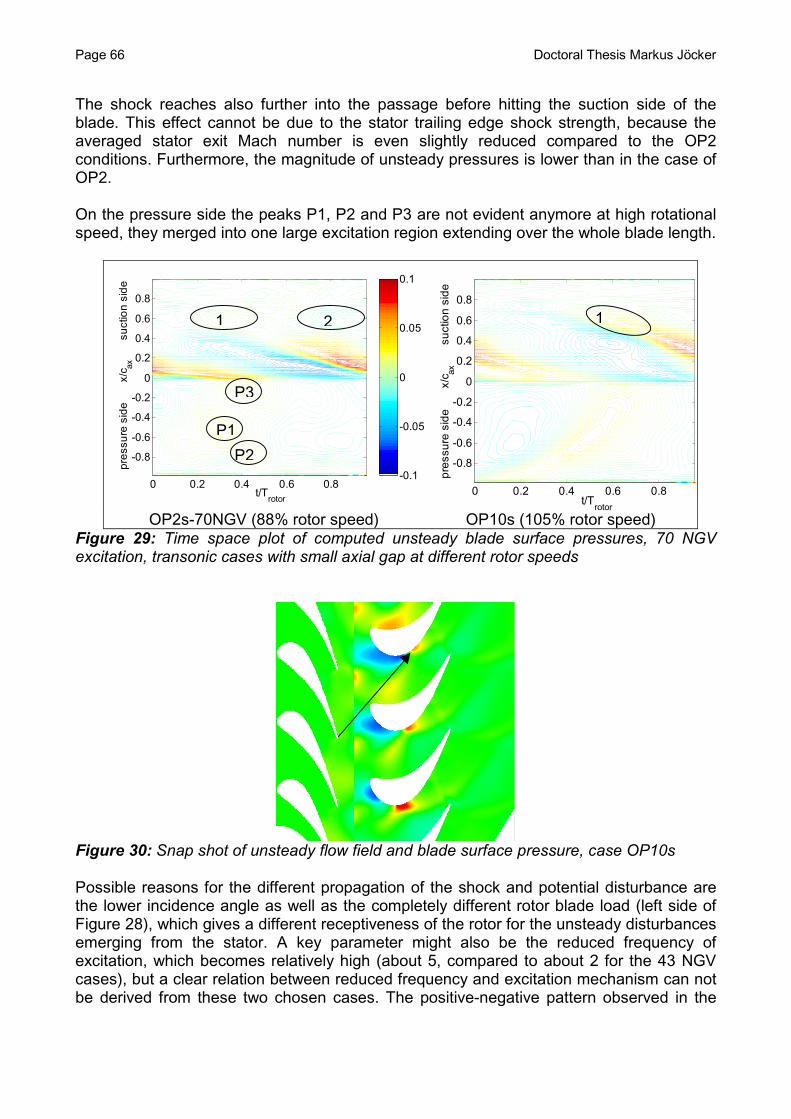
Page 66 Doctoral Thesis Markus Jöcker
The shock reaches also further into the passage before hitting the suction side of theblade. This effect cannot be due to the stator trailing edge shock strength, because theaveraged stator exit Mach number is even slightly reduced compared to the OP2conditions. Furthermore, the magnitude of unsteady pressures is lower than in the case ofOP2.
On the pressure side the peaks P1, P2 and P3 are not evident anymore at high rotationalspeed, they merged into one large excitation region extending over the whole blade length.
-0.1
-0.05
0
0.05
0.1
0 0.2 0.4 0.6 0.8
-0.8
-0.6
-0.4
-0.2
0
0.2
0.4
0.6
0.8
t/Trotor
pres
sure
side
x/c ax
suct
ion
side
-0.1
-0.05
0
0.05
0.1
0 0.2 0.4 0.6 0.8
-0.8
-0.6
-0.4
-0.2
0
0.2
0.4
0.6
0.8
t/Trotor
pres
sure
side
x/c ax
suct
ion
side
OP2s-70NGV (88% rotor speed) OP10s (105% rotor speed)Figure 29: Time space plot of computed unsteady blade surface pressures, 70 NGVexcitation, transonic cases with small axial gap at different rotor speeds
Figure 30: Snap shot of unsteady flow field and blade surface pressure, case OP10s
Possible reasons for the different propagation of the shock and potential disturbance arethe lower incidence angle as well as the completely different rotor blade load (left side ofFigure 28), which gives a different receptiveness of the rotor for the unsteady disturbancesemerging from the stator. A key parameter might also be the reduced frequency ofexcitation, which becomes relatively high (about 5, compared to about 2 for the 43 NGVcases), but a clear relation between reduced frequency and excitation mechanism can notbe derived from these two chosen cases. The positive-negative pattern observed in the
21
P1
P2
P3
1

Doctoral Thesis Markus Jöcker Page 67
temporal appearance of pressure peaks on the blades promotes the excitation by the 1st
harmonic. Furthermore, the impact of the pressure waves on the major part of the blade athigh rotational speed leads to pronounced 1st harmonic axial and tangential forces asshown and discussed in publication 3 in the Appendix ([Jöcker et al. 2000b]). These forcesbecome also strong because the pressure variations on pressure and suction side are inopposite phase, i.e. a positive pressure perturbation on suction side is accompanied by anegative one in pressure side and vice versa. It explains the large level of 1st harmonicforce magnitude of these cases (OP9, OP10) in Figure 27, which is obviously not due to ahigher excitation pressure level but only due to the large content of excitation energy in the1st harmonic over major parts of the blade surface and the specific phase relations ofsuction and pressure side excitations.
From the operating point analysis it is concluded that excitation mechanisms changedrastically with change of operating conditions. Main reasons could be the changed timeaveraged pressure on the rotor blade surface, which leads to a different receptiveness forthe shock and potential excitation waves, and the changes in flow incidence, which couldalso modify the propagation of these waves. At low speed the unsteady flow is dominatedby flow separations from the rotor bade surface. The study demonstrated also howvariations in the time and space distribution of the pressure disturbances on the blademodify the harmonic content of blade forces, such that the blade force analysis and bladepressure analysis may not indicate the same trends regarding the level of excitation.
6.3.2 Axial gap
The following effects were observed with variation of axial gap, which contradicted theexpected trend that the excitation decreases with increased axial gap:
ADTurB stage:In the transonic ADTurB case all 1st harmonic pressure peaks inclusive the leading edgeexcitation peak do not follow the trend to decrease with increased axial gap. Still, axial andtangential forces behave as expected and decrease with increased axial gap (Figure 27).This is outlined in [Jöcker et al. 2000b], publication 3 in the Appendix. The study has beenextended with intermediate gap cases, the 1st harmonic unsteady blade surface pressureamplitudes of these cases are compared in Figure 31. A critical discussion follows below.
Turbopump stage:The high interaction at small gaps in the turbopump turbine led to decreased 1st harmonicforce excitations compared to the larger axial gap cases. The decrease is caused by theincreased unsteadiness in the gap due to enforcement of the potential excitation, whichgives more contributions to higher harmonics and reduces the 1st harmonic content. This isdiscussed in Jöcker et al. [2001], publication 5 in the Appendix.
Discussion:It follows a discussion on the influence of the axial gap on the blade surface perturbationpressures on the rotor with regard to the unsteady pressure flow field. The time averagedflow field did not change with axial gap in the investigated cases. First, the ADTurB stageis examined with focus on the transonic case. Then, similarities and differences to theturbopump stage are pointed out.
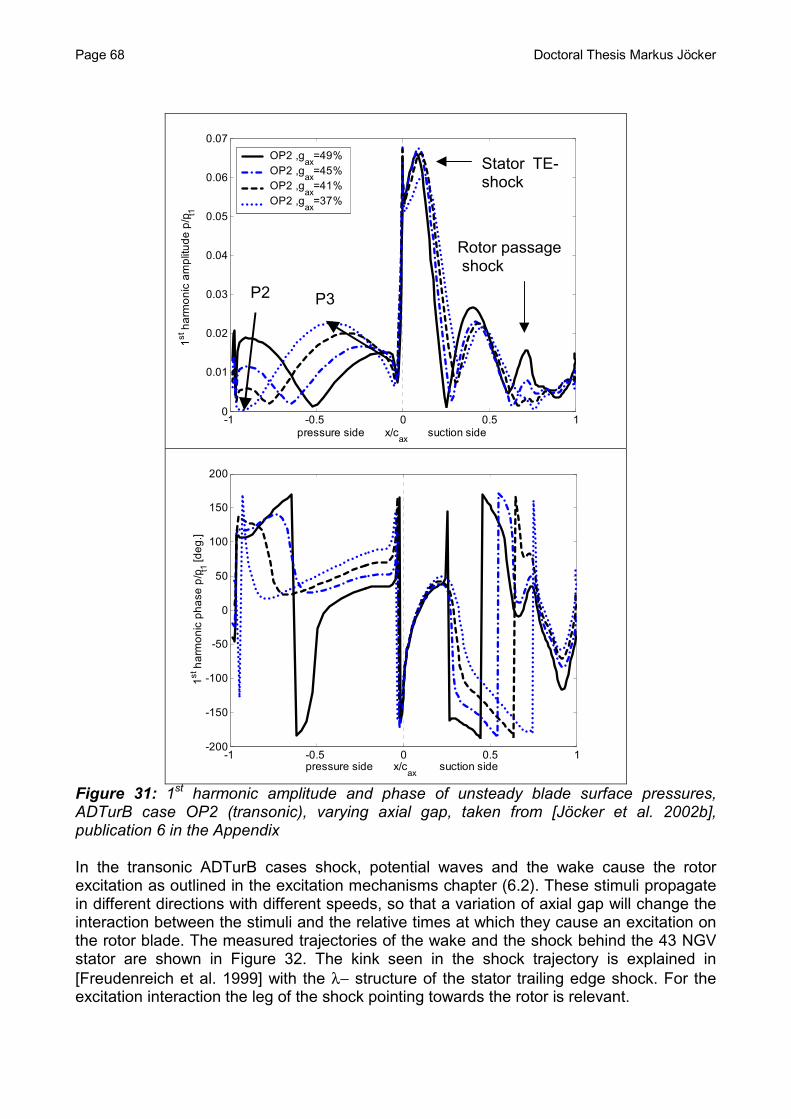
Page 68 Doctoral Thesis Markus Jöcker
-1 -0.5 0 0.5 10
0.01
0.02
0.03
0.04
0.05
0.06
0.07
pressure side x/cax
suction side
1stha
rmon
icam
plitu
dep/
p t1
OP2 ,gax
=49%OP2 ,g
ax=45%
OP2 ,gax
=41%OP2 ,g
ax=37%
-1 -0.5 0 0.5 1-200
-150
-100
-50
0
50
100
150
200
pressure side x/cax
suction side
1sth
arm
onic
phas
ep
/p t1[d
eg.]
Figure 31: 1st harmonic amplitude and phase of unsteady blade surface pressures,ADTurB case OP2 (transonic), varying axial gap, taken from [Jöcker et al. 2002b],publication 6 in the Appendix
In the transonic ADTurB cases shock, potential waves and the wake cause the rotorexcitation as outlined in the excitation mechanisms chapter (6.2). These stimuli propagatein different directions with different speeds, so that a variation of axial gap will change theinteraction between the stimuli and the relative times at which they cause an excitation onthe rotor blade. The measured trajectories of the wake and the shock behind the 43 NGVstator are shown in Figure 32. The kink seen in the shock trajectory is explained in[Freudenreich et al. 1999] with the λ− structure of the stator trailing edge shock. For theexcitation interaction the leg of the shock pointing towards the rotor is relevant.
P3P2
Stator TE-shock
Rotor passageshock

Doctoral Thesis Markus Jöcker Page 69
In [Jöcker et al. 2000b] (publication 3 in theAppendix) it has been discussed that unexpectedlarge excitations occurred in the cases, when thewake trajectory crossed the shock trajectory just infront of the rotor leading edge. These are the OP2large gap case and the OP10 small gap case, forwhich at these crossing positions also increasedgust amplitudes were measured. It is also clearthat the crossings are on different axial locationsfor the 43NGV stator (stator 1) and the 70NGVstator (stator 2) due to the different stator pitches.At other axial positions behind the stator the wakeand the shock appear as two distinct events (seealso Figure 21), which cause significant secondharmonics in the circumferential velocitydistributions. It is tempting to conclude that in thisspecial case (OP2) the small axial gap leads to arelative small 1st harmonic excitation compared tothe large axial gap because wake and shockexcitation have alternating impact on the rotorleading edge during a stator passing period andhence give a stronger 2nd harmonic and a weaker1st harmonic. However, regarding the discussionson excitation mechanisms above this conclusionshould be revised. As it has been identified thatthe wake has a local (around the blade crown) andrelative weak excitation influence in the transoniccase it is unlikely that its phase shift to the shockexcitation is the main reason for the unexpected small 1st harmonic leading edge excitationof the small gap case. Also small differences in stator exit flow and operation conditionmay cause the lacking decrease of 1st harmonic excitation by the shock with increasedaxial gap, which can be due to the uncertainty in the computational model. It follows adiscussion: The stream tube definition in the Q3D method (UNSFLO) is a computationalparameter with strong influence, especially on the stator trailing edge shock strength, aspointed out in the validation part (Chapter 6.1.4). When varying the axial gap it is optionalto keep the stream tube expansion location relative to the stator or relative to the rotor. Inthe first axial gap study (as documented in [Jöcker et al. 2000b]) the stream tubeexpansion was located in the same axial position relative to the stator for both axial gapcases. Hence, the stator flow should not see different expansion ratios downstream, whichcould otherwise modify the strength of the stator trailing edge shock. Still, the time-averaged data in the gap indicates a slightly higher Mach number in the large gap case(0.999) than in the small gap case (0.981) at the same distance behind the stator trailingedge, even though the static to total stage pressure ratio is the same for both cases. Alsothe average mass flow is by 4% higher than for the small axial gap case result. In theextended study (as shown in Figure 31) the stream tube expansion is fixed axially to therotor geometry. This is closer to the real geometry, where the hub contour is byconstruction fixed to the rotor blade geometry (see Figure 13 for a meridional view of thestage). But by decreasing the axial gap the stream tube expansion moves axially closer tothe stator, which leads to higher excitation levels on the rotor (the leading edge peak is
Trajectorycrossing
Figure 32: Measured wake andshock trajectory behind isolatedstator 1 [Freudenreich 1999]
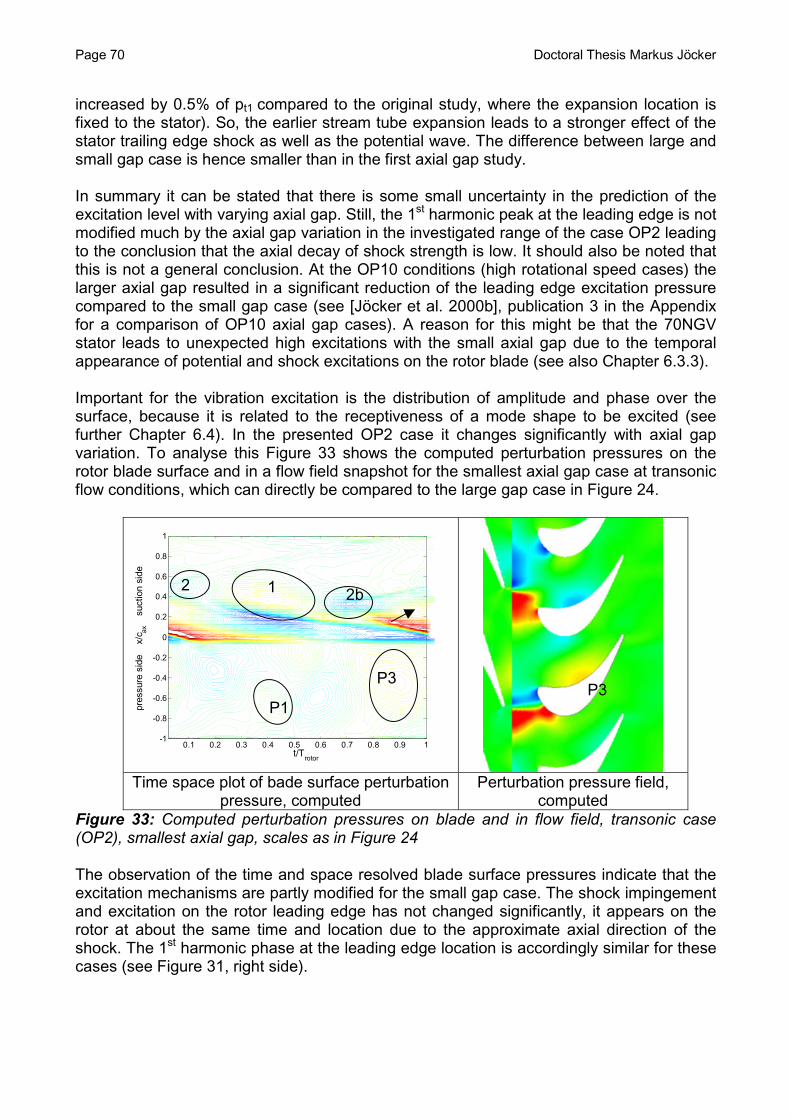
Page 70 Doctoral Thesis Markus Jöcker
increased by 0.5% of pt1 compared to the original study, where the expansion location isfixed to the stator). So, the earlier stream tube expansion leads to a stronger effect of thestator trailing edge shock as well as the potential wave. The difference between large andsmall gap case is hence smaller than in the first axial gap study.
In summary it can be stated that there is some small uncertainty in the prediction of theexcitation level with varying axial gap. Still, the 1st harmonic peak at the leading edge is notmodified much by the axial gap variation in the investigated range of the case OP2 leadingto the conclusion that the axial decay of shock strength is low. It should also be noted thatthis is not a general conclusion. At the OP10 conditions (high rotational speed cases) thelarger axial gap resulted in a significant reduction of the leading edge excitation pressurecompared to the small gap case (see [Jöcker et al. 2000b], publication 3 in the Appendixfor a comparison of OP10 axial gap cases). A reason for this might be that the 70NGVstator leads to unexpected high excitations with the small axial gap due to the temporalappearance of potential and shock excitations on the rotor blade (see also Chapter 6.3.3).
Important for the vibration excitation is the distribution of amplitude and phase over thesurface, because it is related to the receptiveness of a mode shape to be excited (seefurther Chapter 6.4). In the presented OP2 case it changes significantly with axial gapvariation. To analyse this Figure 33 shows the computed perturbation pressures on therotor blade surface and in a flow field snapshot for the smallest axial gap case at transonicflow conditions, which can directly be compared to the large gap case in Figure 24.
0.1 0.2 0.3 0.4 0.5 0.6 0.7 0.8 0.9 1-1
-0.8
-0.6
-0.4
-0.2
0
0.2
0.4
0.6
0.8
1
t/Trotor
pres
sure
side
x/c ax
suct
ion
side
Time space plot of bade surface perturbationpressure, computed
Perturbation pressure field,computed
Figure 33: Computed perturbation pressures on blade and in flow field, transonic case(OP2), smallest axial gap, scales as in Figure 24
The observation of the time and space resolved blade surface pressures indicate that theexcitation mechanisms are partly modified for the small gap case. The shock impingementand excitation on the rotor leading edge has not changed significantly, it appears on therotor at about the same time and location due to the approximate axial direction of theshock. The 1st harmonic phase at the leading edge location is accordingly similar for thesecases (see Figure 31, right side).
2
P3
P1
2b1
P3
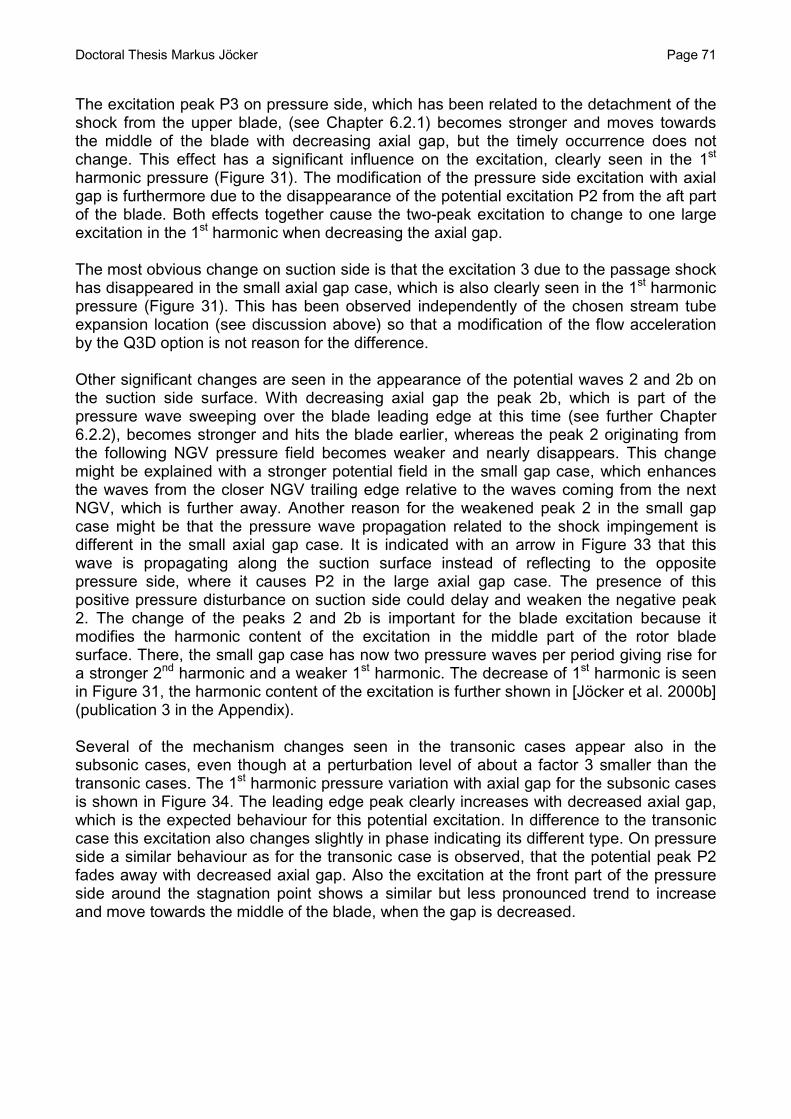
Doctoral Thesis Markus Jöcker Page 71
The excitation peak P3 on pressure side, which has been related to the detachment of theshock from the upper blade, (see Chapter 6.2.1) becomes stronger and moves towardsthe middle of the blade with decreasing axial gap, but the timely occurrence does notchange. This effect has a significant influence on the excitation, clearly seen in the 1st
harmonic pressure (Figure 31). The modification of the pressure side excitation with axialgap is furthermore due to the disappearance of the potential excitation P2 from the aft partof the blade. Both effects together cause the two-peak excitation to change to one largeexcitation in the 1st harmonic when decreasing the axial gap.
The most obvious change on suction side is that the excitation 3 due to the passage shockhas disappeared in the small axial gap case, which is also clearly seen in the 1st harmonicpressure (Figure 31). This has been observed independently of the chosen stream tubeexpansion location (see discussion above) so that a modification of the flow accelerationby the Q3D option is not reason for the difference.
Other significant changes are seen in the appearance of the potential waves 2 and 2b onthe suction side surface. With decreasing axial gap the peak 2b, which is part of thepressure wave sweeping over the blade leading edge at this time (see further Chapter6.2.2), becomes stronger and hits the blade earlier, whereas the peak 2 originating fromthe following NGV pressure field becomes weaker and nearly disappears. This changemight be explained with a stronger potential field in the small gap case, which enhancesthe waves from the closer NGV trailing edge relative to the waves coming from the nextNGV, which is further away. Another reason for the weakened peak 2 in the small gapcase might be that the pressure wave propagation related to the shock impingement isdifferent in the small axial gap case. It is indicated with an arrow in Figure 33 that thiswave is propagating along the suction surface instead of reflecting to the oppositepressure side, where it causes P2 in the large axial gap case. The presence of thispositive pressure disturbance on suction side could delay and weaken the negative peak2. The change of the peaks 2 and 2b is important for the blade excitation because itmodifies the harmonic content of the excitation in the middle part of the rotor bladesurface. There, the small gap case has now two pressure waves per period giving rise fora stronger 2nd harmonic and a weaker 1st harmonic. The decrease of 1st harmonic is seenin Figure 31, the harmonic content of the excitation is further shown in [Jöcker et al. 2000b](publication 3 in the Appendix).
Several of the mechanism changes seen in the transonic cases appear also in thesubsonic cases, even though at a perturbation level of about a factor 3 smaller than thetransonic cases. The 1st harmonic pressure variation with axial gap for the subsonic casesis shown in Figure 34. The leading edge peak clearly increases with decreased axial gap,which is the expected behaviour for this potential excitation. In difference to the transoniccase this excitation also changes slightly in phase indicating its different type. On pressureside a similar behaviour as for the transonic case is observed, that the potential peak P2fades away with decreased axial gap. Also the excitation at the front part of the pressureside around the stagnation point shows a similar but less pronounced trend to increaseand move towards the middle of the blade, when the gap is decreased.
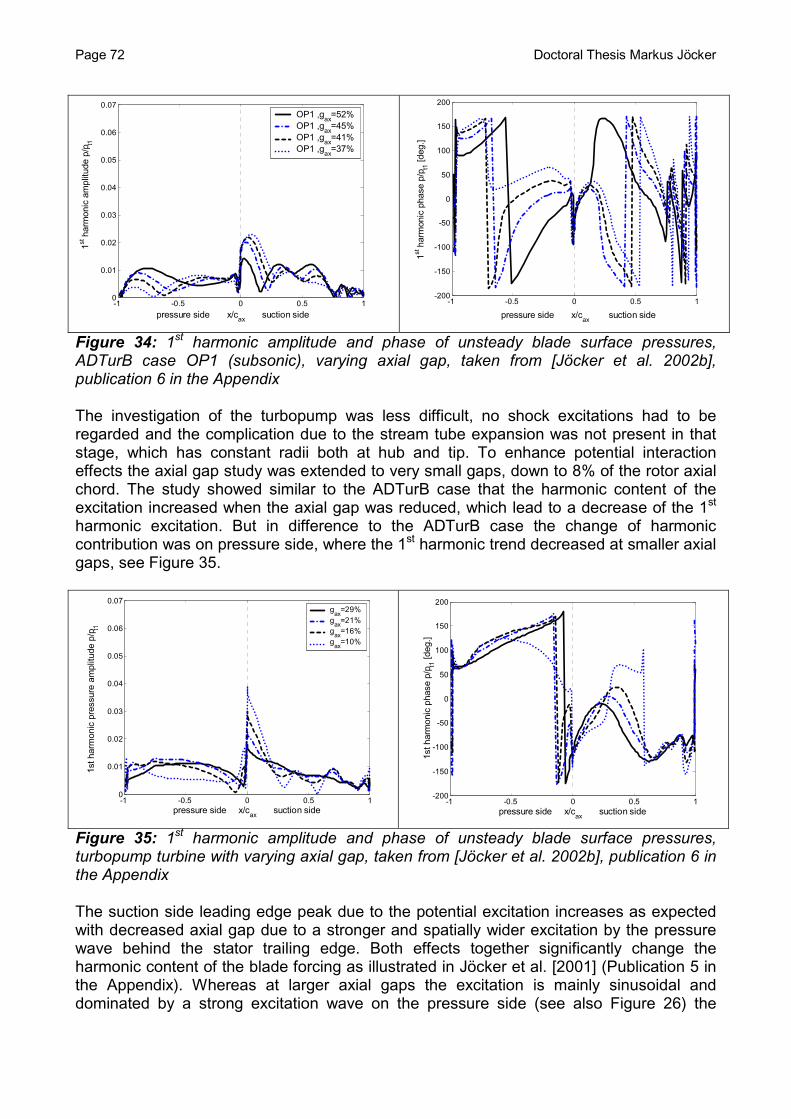
Page 72 Doctoral Thesis Markus Jöcker
-1 -0.5 0 0.5 10
0.01
0.02
0.03
0.04
0.05
0.06
0.07
pressure side x/cax suction side
1stha
rmon
icam
plitu
dep/
p t1
OP1 ,gax
=52%OP1 ,g
ax=45%
OP1 ,gax
=41%OP1 ,g
ax=37%
-1 -0.5 0 0.5 1-200
-150
-100
-50
0
50
100
150
200
pressure side x/cax
suction side
1stha
rmon
icph
ase
p/p t1
[deg
.]
Figure 34: 1st harmonic amplitude and phase of unsteady blade surface pressures,ADTurB case OP1 (subsonic), varying axial gap, taken from [Jöcker et al. 2002b],publication 6 in the Appendix
The investigation of the turbopump was less difficult, no shock excitations had to beregarded and the complication due to the stream tube expansion was not present in thatstage, which has constant radii both at hub and tip. To enhance potential interactioneffects the axial gap study was extended to very small gaps, down to 8% of the rotor axialchord. The study showed similar to the ADTurB case that the harmonic content of theexcitation increased when the axial gap was reduced, which lead to a decrease of the 1st
harmonic excitation. But in difference to the ADTurB case the change of harmoniccontribution was on pressure side, where the 1st harmonic trend decreased at smaller axialgaps, see Figure 35.
-1 -0.5 0 0.5 10
0.01
0.02
0.03
0.04
0.05
0.06
0.07
pressure side x/cax
suction side
1sth
arm
onic
pres
sure
ampl
itude
p/p t1
gax
=29%g
ax=21%
gax
=16%g
ax=10%
-1 -0.5 0 0.5 1-200
-150
-100
-50
0
50
100
150
200
pressure side x/cax
suction side
1sth
arm
onic
phas
ep/
p t1[d
eg.]
Figure 35: 1st harmonic amplitude and phase of unsteady blade surface pressures,turbopump turbine with varying axial gap, taken from [Jöcker et al. 2002b], publication 6 inthe Appendix
The suction side leading edge peak due to the potential excitation increases as expectedwith decreased axial gap due to a stronger and spatially wider excitation by the pressurewave behind the stator trailing edge. Both effects together significantly change theharmonic content of the blade forcing as illustrated in Jöcker et al. [2001] (Publication 5 inthe Appendix). Whereas at larger axial gaps the excitation is mainly sinusoidal anddominated by a strong excitation wave on the pressure side (see also Figure 26) the
Doctoral Thesis Markus Jöcker Page 73
leading edge excitation and successive reflections become dominant at small axial gapsgiving rise to higher harmonic excitation. The changes in the leading edge peak and thepressure side excitation are the main variations in the 1st harmonic pressure distributionwith axial gap. The phase of excitation events does not change as much as in the ADTurBcase (compare Figure 34), especially on pressure side. This is a significant difference tothe ADTurB case, where both pressure distribution and phases change significantly withvariation of axial gap. The influence of these differences on the excitability is discussed inChapter 6.4.2. A reason for the differences between the ADTurB subsonic case and theturbopump case might be that the excitation in the latter one is primarily dominated by onepressure wave, which is reflected several times in the rotor passage, whereas the ADTurBstage is characterised at this operating condition by interacting potential waves from twostators. The related excitation mechanisms were outlined in Chapter 6.2.2, the changewith axial gap in the ADTurB case was discussed above.
It is concluded from the axial gap study that the increase of this parameter does notnecessarily lead to a decrease of aerodynamic excitation. The investigated transonic caseOP2 showed that the shock excitation does not change significantly with increased axialgap. The small uncertainty in the study due to the difficulty to compute exactly the sameoperating conditions in all axial gap configurations with the Q3D method does not changethis conclusion. The potential wave excitations could modify due to different axial gap,because the wave propagation and their relative strength could change. In the ADTurBcase it was demonstrated that this led to a redistribution of excitation energy from the 1st tohigher harmonics with decreased axial gaps. It is also concluded that the excitationmodification due to axial gap change might be very different for different turbines oroperating conditions. This was demonstrated by a comparison between the subsonicADTurB case and the turbopump turbine case.
6.3.3 Stator blade count and size
The results presented by Korakianitis [1992a, b, 1993a, b] suggested that the stator torotor pitch ratio R had a major influence on the rotor excitation. A detailed study of statorvane size and count was included in the pre-design investigation of the turbopump turbineby Jöcker et al. [2001] (publication 5 in the Appendix). The studied variations of statorgeometry are described in Chapter 5.2. The findings are summarized below.
As expected, the scaling of the vanes left the mean rotor flow conditions non-affectedwhereas the reduction of the vane number without scaling increased the mean stator vaneload and rotor blade load (Figure 36 left side). This affected accordingly the bladeexcitation.
The vane scale had a significant influence on the 1st harmonic blade excitation. A half sizestator (scaled by 0.5) led to a reduction of the excitation level by more than 50% at almostall blade locations. The enlargement of the stator (scaled by 1.3) as well as the removal ofstator vanes (-4 vanes) gave a significant increase of excitation level (Figure 36, rightside). The removal of 4 vanes led to even higher excitation levels than the levels reacheddue to the enlargement of the stator vanes.
Changes of vane count modifies obviously the excitation frequency because the rotor willpass more stator vanes per revolution. This is an important factor concerning the design

Page 74 Doctoral Thesis Markus Jöcker
because it shifts the resonance condition, which is obvious from a Campbell diagram(Figure 15). Moreover, the change of vane pitch changes the relative time between theshock effects (not present in the turbopump study), the potential effects and the wakeeffects, because they usually spread in different directions. For example, in Figure 32 thepropagation of the wake and the shock behind the ADTurB stator is illustrated. Amodification of the pitch would change the relative paths of these trajectories leading todifferent interactions of these at any location downstream of the stator. Hence the statorpitch is a tool to tune the phase between shock-, potential- and wake effects on theexcitation, which is further discussed in Chapter 6.4.1.
-1 -0.5 0 0.5 10
0.1
0.2
0.3
0.4
0.5
0.6
0.7
0.8
pressure side x/cax suction side
p/p t1
nominalscaled by 1.3scaled by 0.5-4 blades
-1 -0.5 0 0.5 10
0.005
0.01
0.015
0.02
0.025
0.03
0.035
0.04
0.045
0.05
pressure side x/cax suction side
1sth
arm
onic
pres
sure
ampl
itude
p/p t1
nominalscaled by 1.3scaled by 0.5-4 blades
Figure 36: Computed steady and unsteady 1st harmonic blade surface pressures on rotordue to stator variation, turbopump turbine
Larger vanes are accompanied by stronger potential fields and stronger wake defects. Inthe present study it was found that especially the 1st harmonic pressure peak on thepressure side aft part was increased in the cases with stronger potential effects (cases 1.3and –4, R=2.75). Smaller vanes (case 0.5, R=1.03) gave significantly reduced potentialexcitation. This case is characterized by the wake influence on most parts on the blade.The potential influence is mainly limited to the leading edge region and comparably weak.If the vane is small enough two (or more) consecutive wakes can influence the flow in onerotor passage at the same time, which can result in a 2nd (or higher) harmonic dominancein the excitation. This has been observed in the present turbopump study.
In [Jöcker et al. 2001] (publication 5 in the Appendix) the results from the stator pitch studyhave been compared directly to the computations by Korakianitis [1992b] in terms of 1st
harmonic axial force. It shows comparable trends even though of different magnitude. Theoverall conclusion from Korakianitis [1993a] that the excitation is characterised by wakeeffects at low pitch ratios (R≈1) is also found here, but already at intermediate pitch ratios(R≈2, nominal turbopump case) the wake effects become very small compared to potentialeffects. Korakianitis [1993a] classified excitations to be dominated by potential effects forpitch ratios R ≥ 3.
For the ADTurB turbine stage it has already been noted in the discussion of operatingpoints (Chapter 6.3.1) that the steady aerodynamics of the two different stators are notidentical, which leads also to differences in the steady rotor flow, a comparison of theisentropic surface Mach number is included in Figure 28. The detailed comparison of the

Doctoral Thesis Markus Jöcker Page 75
two stators is presented in [Freudenreich et al., 1999] (publication 2 in the Appendix). Dueto the small differences in steady load the differences between the 43 NGV and 70 NGVexcitations can not be clearly isolated from blade load effects, which may have aninfluence on excitation.
From a comparison of the 43 NGV case (Figure 24, right side) and the 70 NGV case at88% rotational speed (OP2s-70NGV, Figure 29, left side) it is seen that the peaks 1, 2 and3 on suction side are not as observable with 70 NGV excitation as in the case of 43 NGVexcitation. Around x/cax =0.6 on suction side pressure peaks are seen which are related topotential excitations and are accordingly marked with 1 and 2. The peak 3 due to the rotorpassage shock is not present, because there is no passage shock in the case with 70NGVs. With regard to the harmonic excitation of the rotor the shift of peaks 1 and 2towards the rear of the blade is important because this allows the first harmonic pattern ofthe excitation on the rotor suction side to be more dominant. This can be observed byregarding the distribution of excitations during one period of excitation in the time spaceplots (Figure 29): In the 70 NGV cases the positive-negative pattern is much less disturbedthan in the 43 NGV cases, which leads to a strong 1st harmonic excitation and lesspronounced higher harmonics. On pressure side the P1, P2 and P3 peaks can be foundagain, even though at different times relative to each other and relative to the peaks onsuction side. Hence, the different stator size has a significant influence on the timelyappearance of excitation peaks.
It is striking that the leading edge excitation due to 70 NGVs is of the same level as theexcitation due to 43 NGVs at the nominal rotational speed (compare Figure 24, right side,Figure 29, left side) whereas the turbopump study above indicates a significant reductionof excitation with smaller vanes. The analyses of the ADTurB stator gusts in [Jöcker et al.2000b] did indicate much larger velocity deficits behind the 43 NGV stator than behind the70 NGV stator. This was expected, as smaller stators should lead to smaller wakes andreduced potential waves behind their trailing edges. But the main excitation in thistransonic case is due to the trailing edge shock, which is present behind both the 43 andthe 70 NGV stator. The excitation strength is obviously not much affected by the statorsize in this case. This might be due to remaining excitation strength of the shock behind asmaller vane but also due to the superposition of potential and shock excitation in thesmall gap cases with 70 NGVs.
It is concluded from this study that the reduction of the vanes can significantly reduce thepotential excitation in subsonic cases, but may lead to higher harmonics in the excitation.In transonic cases this seems not necessarily an effective measure to reduce theexcitation due to the remaining stator trailing edge shock. Furthermore, it has been pointedout that the modification of vane count does not only change the excitation frequency, it isalso a possibility to actively change the temporal relations of excitation mechanisms, whichcould be used to cancel excitations from different sources. Its potential is discussed inChapter 6.4.1.
A different aspect of these results concerns the application of blade and vane numberadjustment in state-of-the-art CFD codes to enforce periodic boundaries on a relative smallsector of the annulus. In the presented turbopump turbine study the scaling had asignificant influence on the unsteady blade pressures and it is concluded that scaling ofvanes or blades for computational reasons should be avoided.
Page 76 Doctoral Thesis Markus Jöcker
6.4 Potential for unsteady design improvements
The previous chapter discussed the aerodynamic excitation mechanisms present in theinvestigated turbine stages and their variation with operation conditions, axial gap andstator design. The analysis of the unsteady aerodynamics concerning the blade vibrationexcitation is completed in this chapter with the discussion how the found mechanisms andvariations with the investigated parameters may be used to improve the high pressurestage design towards the reduction of HCF risk. It is divided in two parts. The first regardsthe potentiality to modify the excitation sources to generally reduce the stimulus of bladevibration; the second involves the mechanical system in terms of the blade mode shape inthe judgement of excitation stimuli.
6.4.1 Modification and interaction of excitation sources
The analysis of the excitation mechanisms indicated several possibilities to reduce theunsteady pressure perturbations on the rotor blade surface, but it also showed that it isdifficult to find general rules towards that goal. It follows a critical discussion.
In subsonic cases the increase of the axial gap was usually followed by a reduction in rotorexcitation in terms of the 1st harmonic unsteady pressure. Still, exceptions have also beenrecognized, where local peaks of excitations increased with larger axial gaps. This wasrelated to an energy transfer from the 1st to higher harmonics of excitation at lower axialgaps. When regarding the unsteady blade force harmonics, the trend could be adverse tothe 1st harmonic pressure distribution. This was found in the turbopump turbine indicatingthat the 1st harmonic axial and tangential forces reduced with decreased axial gapwhereas higher force harmonics increased. This points out the necessity to relate thechanges in excitation due to a design parameter also to the excited mode, which is done inChapter 6.4.2. The increase of axial gap does not necessarily reduce HCF risk.
Another effective method to reduce excitation stimuli was found to be the increase of vanenumber (reduction of vane pitch and size) in potential wave excited cases. This has beenshown on the turbopump turbine. But this measure is not always efficient in transoniccases, where the excitation by the stator trailing edge shock may not change significantlywith stator size. The ADTurB turbine (OP2) demonstrated this. Furthermore, it has beenseen that a change in wave reflection pattern due to a different stator count can modify theharmonic content of the excitation. This led to an enforcement of the 1st harmonicexcitation pressure with increased vane number in the ADTurB case.
It has been found that the excitation by the stator trailing edge shock is the strongestexcitation source in the transonic cases. Hence, the most obvious measure to reduce thestimulus is the Mach number reduction in the gap. The code validations have shown thesensitivity of the excitation level to the stator exit Mach number and the difficulty to providethe correct boundary conditions to capture this excitation source accurately in thecomputations. This measure seems also to be the most effective in transonic cases,especially with regard to the limitations to reduce the excitation level by axial gap or statorcount (see discussion above).
It has been discussed in the open literature [Korakianitis 1992 a, b] that excitations due towake (vortical) and potential origin can cancel out, if they are counteracting. As these
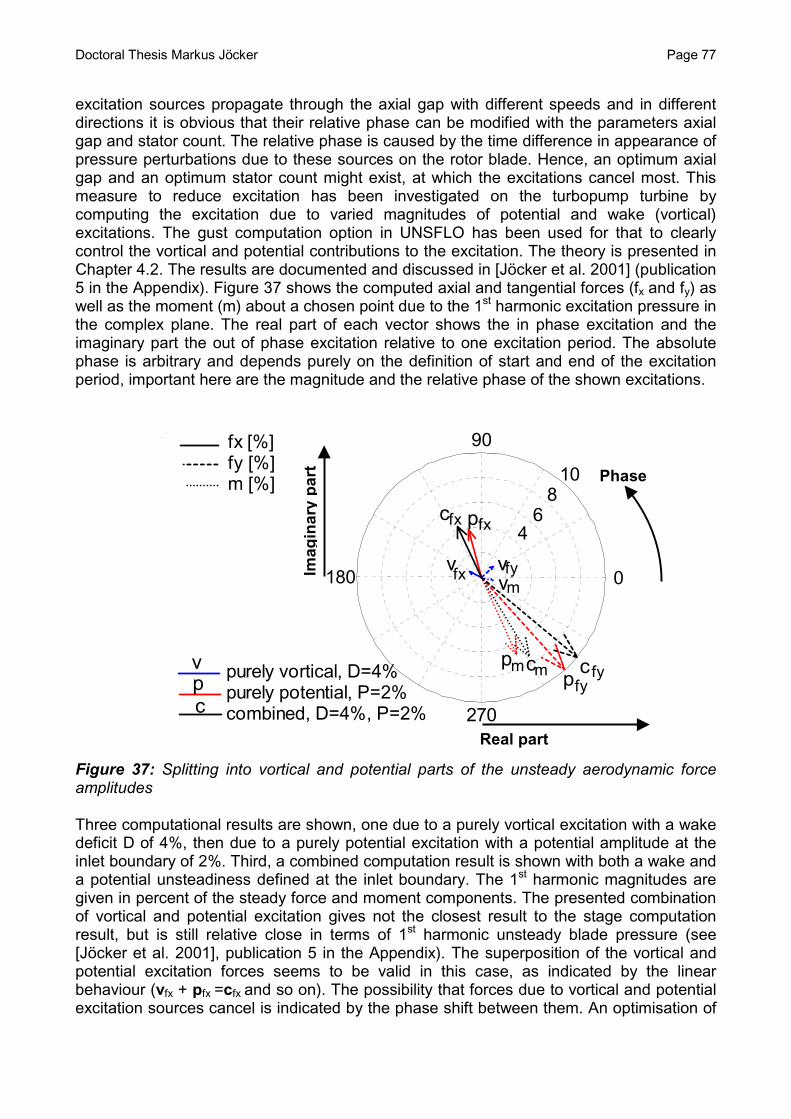
Doctoral Thesis Markus Jöcker Page 77
excitation sources propagate through the axial gap with different speeds and in differentdirections it is obvious that their relative phase can be modified with the parameters axialgap and stator count. The relative phase is caused by the time difference in appearance ofpressure perturbations due to these sources on the rotor blade. Hence, an optimum axialgap and an optimum stator count might exist, at which the excitations cancel most. Thismeasure to reduce excitation has been investigated on the turbopump turbine bycomputing the excitation due to varied magnitudes of potential and wake (vortical)excitations. The gust computation option in UNSFLO has been used for that to clearlycontrol the vortical and potential contributions to the excitation. The theory is presented inChapter 4.2. The results are documented and discussed in [Jöcker et al. 2001] (publication5 in the Appendix). Figure 37 shows the computed axial and tangential forces (fx and fy) aswell as the moment (m) about a chosen point due to the 1st harmonic excitation pressure inthe complex plane. The real part of each vector shows the in phase excitation and theimaginary part the out of phase excitation relative to one excitation period. The absolutephase is arbitrary and depends purely on the definition of start and end of the excitationperiod, important here are the magnitude and the relative phase of the shown excitations.
46
810
90
270
180 0
purely vortical, D=4%purely potential, P=2%combined, D=4%, P=2%
fx [%]fy [%]m [%]
Imag
inar
ypa
rtof
1st
harm
onic
forc
e
Real part of 1st harmonic force
c
c
c
cv
v vv
pp
p
p
fx fy
m
fxfx
fyfy
m
m
Figure 37: Splitting into vortical and potential parts of the unsteady aerodynamic forceamplitudes
Three computational results are shown, one due to a purely vortical excitation with a wakedeficit D of 4%, then due to a purely potential excitation with a potential amplitude at theinlet boundary of 2%. Third, a combined computation result is shown with both a wake anda potential unsteadiness defined at the inlet boundary. The 1st harmonic magnitudes aregiven in percent of the steady force and moment components. The presented combinationof vortical and potential excitation gives not the closest result to the stage computationresult, but is still relative close in terms of 1st harmonic unsteady blade pressure (see[Jöcker et al. 2001], publication 5 in the Appendix). The superposition of the vortical andpotential excitation forces seems to be valid in this case, as indicated by the linearbehaviour (vfx + pfx =cfx and so on). The possibility that forces due to vortical and potentialexcitation sources cancel is indicated by the phase shift between them. An optimisation of
Real part
Imag
inar
yp
art
Phase
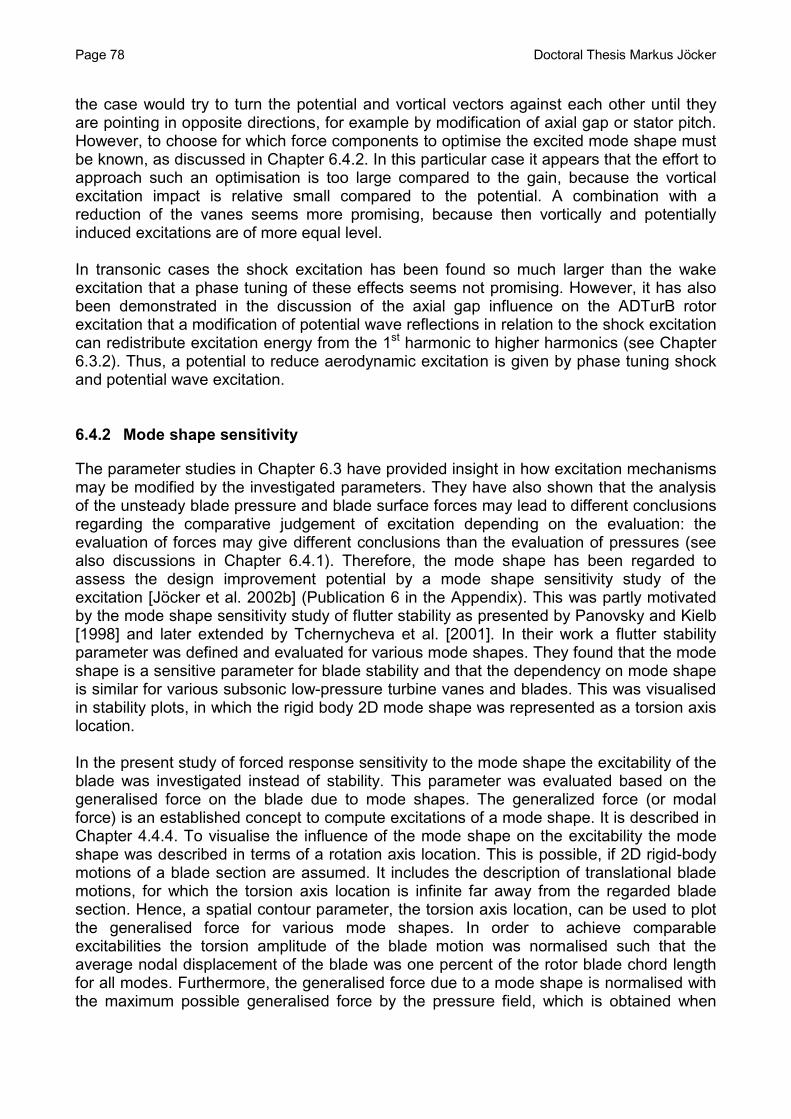
Page 78 Doctoral Thesis Markus Jöcker
the case would try to turn the potential and vortical vectors against each other until theyare pointing in opposite directions, for example by modification of axial gap or stator pitch.However, to choose for which force components to optimise the excited mode shape mustbe known, as discussed in Chapter 6.4.2. In this particular case it appears that the effort toapproach such an optimisation is too large compared to the gain, because the vorticalexcitation impact is relative small compared to the potential. A combination with areduction of the vanes seems more promising, because then vortically and potentiallyinduced excitations are of more equal level.
In transonic cases the shock excitation has been found so much larger than the wakeexcitation that a phase tuning of these effects seems not promising. However, it has alsobeen demonstrated in the discussion of the axial gap influence on the ADTurB rotorexcitation that a modification of potential wave reflections in relation to the shock excitationcan redistribute excitation energy from the 1st harmonic to higher harmonics (see Chapter6.3.2). Thus, a potential to reduce aerodynamic excitation is given by phase tuning shockand potential wave excitation.
6.4.2 Mode shape sensitivity
The parameter studies in Chapter 6.3 have provided insight in how excitation mechanismsmay be modified by the investigated parameters. They have also shown that the analysisof the unsteady blade pressure and blade surface forces may lead to different conclusionsregarding the comparative judgement of excitation depending on the evaluation: theevaluation of forces may give different conclusions than the evaluation of pressures (seealso discussions in Chapter 6.4.1). Therefore, the mode shape has been regarded toassess the design improvement potential by a mode shape sensitivity study of theexcitation [Jöcker et al. 2002b] (Publication 6 in the Appendix). This was partly motivatedby the mode shape sensitivity study of flutter stability as presented by Panovsky and Kielb[1998] and later extended by Tchernycheva et al. [2001]. In their work a flutter stabilityparameter was defined and evaluated for various mode shapes. They found that the modeshape is a sensitive parameter for blade stability and that the dependency on mode shapeis similar for various subsonic low-pressure turbine vanes and blades. This was visualisedin stability plots, in which the rigid body 2D mode shape was represented as a torsion axislocation.
In the present study of forced response sensitivity to the mode shape the excitability of theblade was investigated instead of stability. This parameter was evaluated based on thegeneralised force on the blade due to mode shapes. The generalized force (or modalforce) is an established concept to compute excitations of a mode shape. It is described inChapter 4.4.4. To visualise the influence of the mode shape on the excitability the modeshape was described in terms of a rotation axis location. This is possible, if 2D rigid-bodymotions of a blade section are assumed. It includes the description of translational blademotions, for which the torsion axis location is infinite far away from the regarded bladesection. Hence, a spatial contour parameter, the torsion axis location, can be used to plotthe generalised force for various mode shapes. In order to achieve comparableexcitabilities the torsion amplitude of the blade motion was normalised such that theaverage nodal displacement of the blade was one percent of the rotor blade chord lengthfor all modes. Furthermore, the generalised force due to a mode shape is normalised withthe maximum possible generalised force by the pressure field, which is obtained when
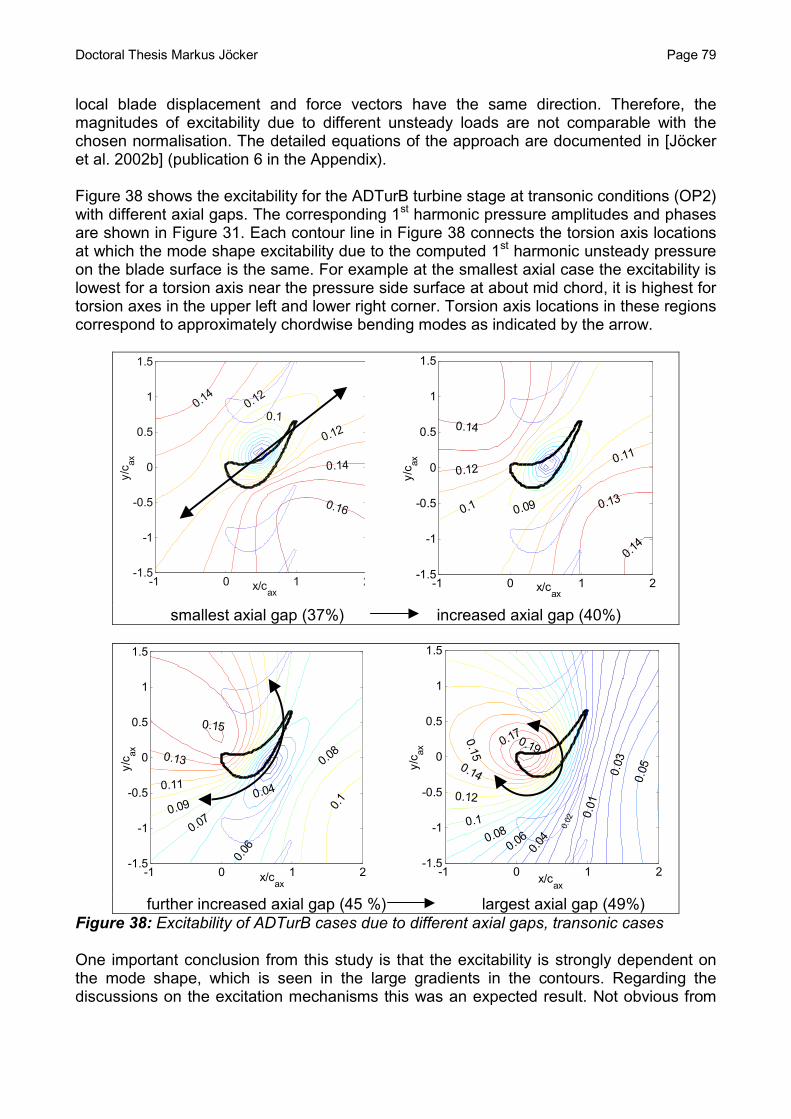
Doctoral Thesis Markus Jöcker Page 79
local blade displacement and force vectors have the same direction. Therefore, themagnitudes of excitability due to different unsteady loads are not comparable with thechosen normalisation. The detailed equations of the approach are documented in [Jöckeret al. 2002b] (publication 6 in the Appendix).
Figure 38 shows the excitability for the ADTurB turbine stage at transonic conditions (OP2)with different axial gaps. The corresponding 1st harmonic pressure amplitudes and phasesare shown in Figure 31. Each contour line in Figure 38 connects the torsion axis locationsat which the mode shape excitability due to the computed 1st harmonic unsteady pressureon the blade surface is the same. For example at the smallest axial case the excitability islowest for a torsion axis near the pressure side surface at about mid chord, it is highest fortorsion axes in the upper left and lower right corner. Torsion axis locations in these regionscorrespond to approximately chordwise bending modes as indicated by the arrow.
-1 0 1 2-1.5
-1
-0.5
0
0.5
1
1.5
x/cax
y/c ax
0.16
0.14
0.120.1
0.120.14
-1 0 1 2-1.5
-1
-0.5
0
0.5
1
1.5
x/cax
y/c ax
0.14
0.13
0.11
0.090.1
0.12
0.14
smallest axial gap (37%) increased axial gap (40%)
-1 0 1 2-1.5
-1
-0.5
0
0.5
1
1.5
x/cax
y/c ax
0.1
0.08
0.06
0.04
0.070.09
0.11
0.13
0.15
-1 0 1 2-1.5
-1
-0.5
0
0.5
1
1.5
x/cax
y/c ax
0.050.
03
0.01
0.02
0.040.060.08
0.1
0.12
0.14
0.15
0.170.19
further increased axial gap (45 %) largest axial gap (49%)Figure 38: Excitability of ADTurB cases due to different axial gaps, transonic cases
One important conclusion from this study is that the excitability is strongly dependent onthe mode shape, which is seen in the large gradients in the contours. Regarding thediscussions on the excitation mechanisms this was an expected result. Not obvious from
Page 80 Doctoral Thesis Markus Jöcker
the purely aerodynamic consideration of the excitations was the significant change ofstrongest excited mode with axial gap variation in the ADTurB case, as seen whencomparing the cases in Figure 38.
When the axial gap is increased the most excited mode shape shifts from a chord wisebending mode to a torsion mode with a torsion axis location close to the leading edge.Arrows in the figures indicate this. From a design perspective the least excited modeshould be searched. It changes also, when the axial gap is increased. The torsion axis ofthis mode moves from the pressure side of the blade over the blade thickness and beyondthe suction side. Even though the least excited mode shape does not modify as much asthe strongest excited mode it should be noted that in the present case the least excitedmode shape of the small gap case modifies to a relative strong excited mode in the largegap case. As this mode is close to the 1T mode of the original experimental program (seeCampbell diagram, Figure 15), the blade response at this resonance condition couldincrease with increased axial gap. Still, the 3D mode shape, the 3D excitation and thevibration dependent aerodynamic damping also determine the real blade vibrationamplitude.
The main reason for the observed change in excitability with axial gap is the modificationof the pressure side excitation, which is discussed in detail in Chapter 6.3.2. Theturbopump turbine did not show the same change with axial gap, instead the excitability issimilar for all investigated cases. The 1st harmonic pressure amplitude does mainly changein magnitude but not in its distribution on the blade surface and also the phase is notmodified significantly by the change of axial gap (Chapter 6.3.2). Therefore, it is always thesame mode, which is excited most, an approximately perpendicular to chord bendingmode [Jöcker et al. 2002b] (publication 6 in the Appendix).
Excitability variation due to different stators was not investigated, because theaerodynamic variations of these cases were too large resulting in completely differentexcitability maps. This did not allow conclusions on the excitability variation with change ofthe stator.
No general trends of the mode shape sensitivity have been found based on theinvestigated cases. Obviously, both the unsteady pressure distribution on the bladesurface and the local surface curvature of a specific blade are parameters with stronginfluence on excitability so that a common trend for different turbine blades is unlikely.
The observation of excitability plots of larger spatial extension, i.e. with torsion axislocations further away from the blade as shown here, does not change the conclusions. Inall cases the contours continue as expected from the figures shown.
The above findings have several implications towards the turbine rotor design with regardto HCF risk reduction:
As the excitability is strongly dependent on the excited mode shape the unsteadyaerodynamic blade pressure should only be evaluated with regard to the excited modeshape.
As the most and least excited mode shapes can change significantly with a changeddesign parameter, as demonstrated above with the axial gap variation in the transonic

Doctoral Thesis Markus Jöcker Page 81
ADTurB case, even such relative and small modifications must be evaluated with regard tothe excited mode shape in order to ensure that a re-design leads to a HCF risk reduction.
If the mode shape is a parameter, which could be modified in the design process, thisoffers an effective possibility to reduce the HCF risk due to forced response. From amanufacturing point of view mode shape control is possible by the control of crystal growthduring the casting process [Green 1999]. A design recommendation would suggest placingthe torsion axis in a region of low excitability and with good margin to the higher gradient.

Page 82 Doctoral Thesis Markus Jöcker
Doctoral Thesis Markus Jöcker Page 83
7 CONCLUSIONS
The validation studies show that the computational results by UNSFLO can be expected togive the trends of unsteady rotor surface pressure due to stator-rotor interaction. It wasensured that the solutions are sufficiently independent from the computational mesh. Thecomparison of various modelling options of the computational tool lead to the conclusionthat most reliable results are obtained with full stage computations combined with theoption to account for viscous effects close to the blade surfaces. The difficulty to specifythe unsteady inlet gust to the rotor for gust computations has been pointed out. Thecomputed 1st and 2nd harmonics of excitation pressures reflect the measured excitationpatterns. Furthermore, confidence in the results is given by comparison to computationspublished in the open literature. These comparisons suggest that the observed differencesat rotor midspan are not due to 3D flow effects. Comparisons to experiments show alsothat the Q3D predictions give higher Mach number levels in the stator-rotor gap, which hasa strong effect on the excitation level at transonic flow conditions but without changing thegeneral pattern. This is explained with the uncertainty of the Q3D method regarding thecorrect consideration of radial expansion and stream sheet variation. It is also shown thatthe 3D linearised gust computations with SliQ can predict the measured 1st and 2nd
harmonic blade pressure very well even in transonic flow. The requirement of an inlet gustspecification according to the experiments to achieve this agreement is stressed. Acomparison of numerical results to the vibrating turbine test case STCF11 indicates thatUNSFLO computes the main trends of the unsteady flow in a transonic off design case,but this is very sensitive to the choice of time step in the computation.
At the nominal operating conditions of the investigated turbines the excitation mechanismsdue to shock, potential waves and wakes are described and related to the work found inthe open literature. The differences between subsonic and transonic cases point out thestrength of shock excitation leading to pressure excitation levels to be increased by afactor 2 to 3. Potential excitations are discussed on two investigated turbines and it iselaborated that the typical wave type excitation is similar, but that differences in thepropagation direction of the waves and the wave reflection pattern in the rotor passagelead to differences in the time and space resolved unsteady pressures on the bladesurface. The wake influence on the unsteady pressure on the rotor blade is small in theinvestigated cases. This is explicitly demonstrated on the turbopump turbine, for whichwake and potential excitations are varied separately to study their relative excitationinfluence.
From the parametric studies the following conclusions were drawn:
• The operating conditions have a significant influence on the excitation mechanism. Atlow rotational speed separations dominate the unsteady flow behaviour on the rotorsuction side with a probably large influence on the unsteady pressure distribution.Limits of the computational method do not allow for further conclusions on these cases.At high rotational speeds the potential excitation is found to reach further into the rotorpassage before reflected from the suction side. The change in time averaged pressureon the rotor blade surface and the changes in flow incidence could cause the observedmodification of shock and wave propagation. This has a tremendous impact on the 1st
harmonic excitation because pressure and suction side are covered by large pressurewave impacts instead of more local impacts at lower rotational speeds. Furthermore,

Page 84 Doctoral Thesis Markus Jöcker
the time and space distribution of the pressure disturbances on the blade modifies theharmonic content of blade forces, such that the blade force analysis and bladepressure analysis may not indicate the same trends regarding the relative level ofexcitation.
• The axial gap study shows that the increase of this parameter does not necessarilylead to a decrease of aerodynamic excitation, which is observed in the transonic caseOP2. The potential wave excitations are modified due to different axial gap, becausethe wave propagation and their relative strength change. This can lead to aredistribution of excitation energy from the 1st to higher harmonics with decreased axialgaps. It is also concluded that the excitation modification due to axial gap change mightbe very different for different turbines or operating conditions. This is demonstrated bya comparison between the subsonic ADTurB case and the turbopump turbine case.
• The reduction of the vane size can significantly reduce the potential excitation insubsonic cases, but can also lead to higher harmonics in the excitation. In transoniccases it appears not necessarily to be an effective measure to reduce the excitationdue to the remaining stator trailing edge shock. It has been pointed out that themodification of vane count does not only change the excitation frequency, it is also aparameter to actively change the temporal relations of excitation mechanisms, whichcould be used to cancel excitations from different sources.
From the assessment of the potential to improve the design of high pressure turbinestowards a reduction of HCF failure the following conclusions were drawn:
• In transonic cases the most efficient measure to decrease the excitation level is thedecrease of stator exit Mach number to reduce the shock strength. The increase ofaxial gap and the reduction of vane size show limited potential to decrease theexcitation due to the remaining shock excitation strength.
• Axial gap and stator design can be modified to change the interaction between theexcitation mechanisms present in the stage. Phase relations between shock andpotential wave excitation may be utilised to shift excitation energy to higherharmonics. The wake influence was found to be small in the investigated cases sothat a phase tuning of wake excitation to potential and shock excitation seems notefficient, unless it is in subsonic cases combined with a reduction of vane sizetowards R≈1 to achieve potential and wake excitations of comparable magnitude.
• The excitability of a blade due to the unsteady pressure is strongly dependent onthe mode shape. This is an expected result but it is not obvious from the purelyaerodynamic consideration of the blade surface pressures that the most and leastexcited mode shapes of the ADTurB cases change significantly with axial gapvariation. Therefore, it was concluded that the assessment of the aerodynamicexcitation should only be made with regard to the excited mode shape. Evenrelative changes in the aerodynamic excitation due to a modification of a designparameter such as the axial gap should be judged with regard to the excited modeshape. If the mode shape itself is a parameter, which can be modified in the designprocess, a design recommendation with regard to mode shape excitability suggestsplacing the torsion axis in a region of low excitability and with good margin to thehigh gradient regions of excitability.

Doctoral Thesis Markus Jöcker Page 85
8 FUTURE WORK
The validation part of the work demonstrated the capability of a 3D linearised gust methodto predict the 1st and 2nd harmonic unsteady blade pressure on the rotor of a particularcase including shock excitation effects. As such a method is computationally very efficientit would be of interest to examine its limits in terms of allowable shock strength, vane exitMach number and axial gap to provide a reasonable solution in the harmonics of interest.
The investigation of various operating conditions indicated that at off-design, especially atlower rotational speeds, separations might have a significant impact on the unsteadypressure on the rotor blade. This could be even larger and more dangerous than theexcitations investigated in the present work. If new engine designs would need to allow forresonance conditions at such operating points it would be valuable to investigate these off-design conditions experimentally to get a validation basis for computations.
Low engine order excitations are usually present in all real engines. Due to tolerances inthe manufacturing process of vanes these are not equal and so is not the excitation fromthe various vanes assembled in the stator ring. This annular non-uniformity introducesexcitations of lower frequency and might also change the excitation content of the vanepassing frequency. A generic study to assess the magnitude of these influences would bevaluable. Especially, experimental results would be very useful to validate methods topredict such effects.
From the analysis of excitation mechanisms for different turbine stage configurations andat various investigated operating conditions it was seen that excitation mechanisms followsimilar patterns mainly governed by pressure and shock wave propagation and reflectionsin the stage. An ambitious goal for future work would be to generate simple modelsrelating basic design parameters like stator exit flow Mach number, rotor incidence, rotorstagger angle, stator pitch/axial gap ratio or blade curvature to wave propagationbehaviour. This should then allow conclusions on the excitation patterns on the rotor bladesurface. Such models could then be used very early in the design process to regardpossible excitations of the blade mode shape.
The potentiality in the option to stabilize forced response with help of aerodynamicdamping was not discussed in this thesis. A generic study would be interesting to sketchthe magnitude of aerodynamic damping for different turbine configurations, operatingconditions and blade mode shapes in comparison to structural damping. The trends shouldthen be compared to findings regarding the excitation of blades in order to find conclusionson optimum designs to reduce the HCF risk. The consideration of the aerodynamicdamping sensitivity to the mode shape should be included.
The demonstrated sensitivity of the excitability of a blade to the mode shape must beproven also on real mode shapes to generalise the findings. Thus, the study should beextended to 3D mode shapes of flexible blades. This could be achieved by computing thegeneralised forces due to such real mode shapes. As 3D modes cannot be related to asingle parameter such as a torsion axis location such a study would be limited to somechosen characteristic or typical mode shapes.

Page 86 Doctoral Thesis Markus Jöcker

Doctoral Thesis Markus Jöcker Page 87
9 REFERENCES
Abell, E. E.; Kielb, R. E.; Henderson, P. J.; 1977”Structural Analysis of a Cooled Directionally Solidified Turbine Blade”; Journal of Aircraft,Vol. 14, No. 2; February 1977Abhari, R. S.; Guenette, G. R.; Epstein, A. H.; Giles, M. B.; 1992“Comparison of Time-Resolved Turbine Rotor Blade Heat Transfer Measurements andNumerical Calculations.”; J. of Turbomachinery, Vol. 114, pp. 818-827, 1992ADTurB 2, 2000“Aerolastic Design of Turbine Blades II, Project Web Site”; Official web site of the EUResearch Project No. GRD1-1999-10258; Web address: www.egi.kth.se/ekv/adturb2AGARD; 1980“Multilingual Aeronautical Dictionary”; AGARD, ISBN 92-835-01666-7, p. 213, 1980Adamczyk, John J.; 1999“Aerodynamic Analysis of Multistage Turbomachinery Flows in Support of AerodynamicDesign”; ASME paper 99-GT-80Arnone, A.; Marconcini, M.; Pacciani, M.; Schipani, C.; Spano, E.; 2001“Numerical Investigation of Airfoil Clocking in a Three-Stage Low Pressure Turbine”;ASME paper 2001-GT-0303Baldwin, B.; Lomax, L.; 1978“Thin Layer Approximation and Algebraic Model for Separated Turbulent Flow”; AIAAPaper 78-257; 197883Barter, J.W.; Vitt, P.H.; Chen, J.P.; 2000“Interaction Effects in a Transonic Stage”; ASME paper 2000-GT-0376Beam, R.M.; Warming, R.F.; 1977“An Implicit Factored Scheme for the Compressible Navier Stokes Equations”;Proceedings of the 3rd Computational Fluid Dynamics Conference, Albuquerque, NewMexico, and AIAA Journal, 16:393-403, 1978Billonnet, G.; Fourmaux, A; Touissant, C.; 2001“Evaluation of Two Competitive Approaches For Simulating the Time-periodic Flow in anAxial Turbine Stage”; Conference Proceedings of the 4th European Conference onTurbomachinery – Fluid Dynamics and Thermodynamics Firenze, 20th-23rd March, 2001,S.G.E., ISBN: 88-86281-57-9Birch, T.; 1987“Navier-Stokes Predictions of Transition, Loss and Heat Transfer in a Turbine Cascade”;ASME paper 87-GT-22Bölcs, A.; Fransson, T.H.;Schläfli, D.; 1989“Aerodynamic Superposition Principle in Vibrating Turbine Cascades”; AGARD, 74th
Specialist’s Meeting of the Propulsion and Energetics Panel on Unsteady AerodynamicPhenomena in Turbomachines, Luxembourg, Aug. 28 –Sept. 1, 1989Bréard, C. ; Vahdati, M. ; Imregun, M. ; Green; J.S.; 2000“A Resonance Tracking Algorithm for the Prediction of Turbine Forced Response withFriction Dampers”, ASME paper 2000-GT-0372Busby, J. A.; Davis, R. L.; Dorney, D. J.; Dunn, M. G.; Haldeman, C. W.; Abhari, R. S.;Venable, B. L.; Delaney, R. A.; 1999“Influence of Vane-Blade Spacing on Transonic Turbine Stage Aerodynamics Part II:Time-Resolved Data and Analysis.”, Journal of Turbomachinery, Vol. 121, pp. 673-682,1999 and ASME Paper No. 98-GT-482

Page 88 Doctoral Thesis Markus Jöcker
Boussinesq, T.V.; 1877“Mém. Pres Acad. Sci.”; 3rd Ed.; Paris XXIII, p. 46, 1877Campobasso, M. S.; Duta, M. C.; Giles, M. B.; 2001Adjoint Methods for Turbomachinery Design”; ISABE-2001-1055Carstens, V.; Bölcs, A; Körbächer, H.; 1993“Comparison of Experimental and Theoretical Results for Unsteady Transonic CascadeFlow at Design and Off-Design Conditions”; ASME Paper 93-GT-100Carta, F. O.; 1988”Aeroelastic Coupling – An Elementary Approach”; AGARD Manual on Aeroelasticity inAxial Flow Turbomachines, AGARD-AG-298, ISBN 92-835-0467-4, edited by Max F.Platzer and Franklin O. Carta, 1988Carta F. O.; 1982“An Experimental Investigation of Gapwise Periodicity and Unsteady AerodynamicResponse in an Oscillating Cascade (Part 1 of 3)”; Nasa-CR 3513, 1982.Cebeci, T.; Smith, A.M.O.; 1974“Analysis of Turbulent Boundary Layers”, Academic Press, 1974Chen, S. H.; Eastland, A. H., Jackson, E. D.; 1994“Efficient Method for Predicting Rotor/Stator Interaction.”; AIAA Journal of Propulsion andPower, Vol. 10, No. 3, pp. 337-342Clark, J. P.; Aggarwala, A. S. ; Velonis, M. A.; Gacek, R. E.; Magge, S. S.; Price, F.R.; 2002“Using CFD to Reduce Resonant Stresses on a Single-Stage, High-Pressure
Turbine Blade” ASME paper GT-2002-30320Colantuoni, S.; Colella, A.; Santoriello, S.; Kapteijn, C.; 1995“Aerodesign and Performance Analysis of a Transonic Turbine Inlet Guide Vane withTrailing Edge Coolant Flow Ejection.”, VDI Berichte Nr. 1185, 1995Colella, A.; Solazzo, M. A.; 1996”DLR-Rig Aero Design of Second Stator”; ADTurB Project Report No. ADTB-ARA-4003,1996, ConfidentialCollar, A. R.; 1946“The Expanding Domain of Aeroelasticity”, The Royal Aeronautical Society, pp. 613-636Chernobrovkin, A.;Lakshminarayana, B.; 2000“Unsteady Viscous Flow Causing Rotor-Stator Interaction in Turbines, Part 2:Simulation, Integrated Flowfield, and Interpretation”, Journal of Propulsion andPower, Vol. 16, No. 5, 2000Chiang, H. D.; Fleeter, S.;1992“Analysis of Forced Resonse of Detuned Blade Rows”; Journal de Physique III,France 2, pp. 527-544, April 1992Chiang, H. D.; Kielb, R. E.; 1993“An Analysis System for Blade Forced Response”; ASME Paper No. 92-GT-172 andJournal of Turbomachinery, Vol. 115, pp. 762-770, 1993Chien, K.Y.; 1982“Predictions of Channel and Boundary Layer Flows With a Low Reynolds NumberTurbulence Model”; AIAA Journal, Vol. 20, No. 1; pp. 33-38Chung, M.-H.; Wo, A. M., 1997“Navier Stokes and Potential Calculations of Axial Spacing Effect on Vortical and PotentialDisturbances and Gust Response in an Axial Compressor”; ASME Journal ofTurbomachinery, Vol. 119, pp. 472 – 481, July 1997
Doctoral Thesis Markus Jöcker Page 89
Clark, J.P.; Stetson, G.M.; Magge, S.S.; Ni, R.H.; Haldeman, C.W.; Dunn, M.G.; 2000“The Effect of Airfoil Scaling on the Predicted Unsteady Loading on the Blade of a 1 and1/2 Stage Transonic Turbine and a Comparison with Experimental Results”; ASME paperNo. 2000-GT-0446Dawes, W. N.; 1993“Simulating Unsteady Turbomachinery Flows on Unstructured Meshes Which Adapt Bothin Time and Space”; ASME paper no 93-GT-104Dénos, R.; Arts, T.; Paniagua, G.; Michelassi, V.; Martelli, F.; 2000“Investigation of the Unsteady Rotor Aerodynamics in a Transonic Turbine Stage”, ASMEpaper No 2000-GT-0435Dénos, R.; Sieverding, C.H.; Arts, T.; Brouckhaert, J.F.; Paniagua, G.; 1999“Experimental Investigation of the Rotor Aerodynamics of a Transonic Turbine Stage”;Proceedings of the 3rd Euopean Conference on Turbomachinery – Fluid Dynamics andThermodynamics, London, UK, March 2-5, 1999, Professional Engineering Publishing,ISBN: 1 86058 196 XDoorly, D. J.; Oldfield, M. J.; 1985“Simulation of the Effects of Shock Wave Passing on a Turbine Rotor Blade.” Journal forGas Turbines and Power, Vol. 107, Oct. 1985, p. 998-1006Eulitz, F.; Engel, K.; Nürnberger, D.; Schmitt, S.; Yamamoto, K.; 1998”On Recent Advances of a Parallel Time-Accurate Navier-Stokes Solver for UnsteadyTurbomachinery Flow”, Computational Fluid Dynamics 1998, proc. 4. ECCOMAS, Ed.Papailiou et a., Vol.1, Part 1, pp. 252-258, John Wiley & SonsErdos, J.I., Alzner, F., MCNelly, W.; 1977“Numerical Solution of Periodic Transonic Flow through a Fan Stage”, AIAA Journal,Vol.15, pp 1559-1568, 1977Eriksson, L.-E., 1990“A Third Order Accurate Upwind-biased Finite Volume Scheme for UnsteadyCompressible Flow”, VFA report 9370-154, Volvo Aero Corporation, Trollhättan, SwedenEriksson, L. E.; 1995“Development and Validation of Highly Modular Flow Solver Versions in G2DFLOW andG3DFLOW Series for Compressible Viscous Reacting Flow.”, Technical Report 9970-1162Volvo Aero Corporation, Sweden, 1995Fan, S.; Lakshminarayana, B.; 1996“Time-Accurate EulerSimulation of Interaction of Nozzle Wake and Secondary Flow withRotor Bladein an Axial Turbine Stage Using Nonreflecting Boundary Conditions.”; ASMEJournal of Turbomachinery, Vol. 118, pp. 663-678, 1996 and ASME Paper No. 95-GT-230Feiereisen. J. M.; Fleeter, S.; 1998“Unsteady Potential Effects on Rotor Wake and Stator Unsteady Aerodynamic Response”;AIAA Paper No. 98-3432, 1998Feiereisen, J. M.; Montgomery, M. D.; Fleeter, S.; 1993“Unsteady Aerodynamic Forcing Functions – A Comparison Between Linear Theory andExperiment.”; ASME Paper No. 93-GT-141, 1993Fielding, Leslie; 2000“Turbine Design”; ASME Press, New York, 2000 ISBN: 0-7918-0086-5Florea, R.; Hall, K. C.; 2001“Sensitivity Analysis of Unsteady Inviscid Flow Through Turbomachinery Cascades”; AIAAJournal, Vol. 39, No. 6; June 2001Fourmaux, A.; 1986“Unsteady Flow Calculation in Cascades”; ASME paper No. 86-GT-178; 1986
Page 90 Doctoral Thesis Markus Jöcker
Fransson, T.H.; Jöcker, M.; Bölcs, A.; Ott, P.; 1998“Viscous and Inviscid Linear/Nonlinear Calculations Versus Quasi 3D ExperimentalCascade Data For a New Aeroelastic Turbine Standard Configuration”, Journal ofTurbomachinery, Vol. 121, No. 4, Oct. 1999, pp. 717ff.;Fransson, T.H.; Verdon, J.M.; 1992“Updated Report on Standard Configurations for Unsteady Flow Through Vibrating Axial-Flow Turbomachine Cascades”; Report No TRITA/KRV/92-009,, Royal Institute ofTechnology, Stockholm, Sweden, available on internet via http://www.egi.kth.se/ekv/stcfFransson, T.H., Verdon, J.M.; 1991“Standard Configurations for Unsteady Flow Through Vibrating Axial-Flow TurbomachineCascades”, Unsteady Aerodynamics, Aeroacoustics and Aeroelasticity of Turbomachinesand Propellers, H.M. Atassi (ed.), Springer Verlag, New York, pp. 859-889, 1993Fransson, T.H.; Bölcs, A.; Platzer, M.F.; 1989“Numerical Simulation of Inviscid Transonic Flow Through Nozzels With Fluctuating BackPressure”, Journal of Turbomachinery, Vol. 111, pp. 169-180, 1989Fransson, T.H.; Pandolfi, M.; 1986“Numerical Investigation of Unsteady Subsonic Compressible Flows Through anOscillating Cascade”; ASME Paper 86–GT-304Freudenreich, K.; Jöcker, M.; Fransson, T. H.; 2001a“Gust and Forcing Function in a Transonic Turbine” Conference Proceedings of the 4th
European Conference on Turbomachinery – Fluid Dynamics and ThermodynamicsFirenze, 20th-23rd March, 2001, S.G.E., ISBN: 88-86281-57-9Freudenreich, Kai; 2001b“Experimental Investigation of Velocity Gust in High Pressure Turbines”; Doctoral Thesis atthe Department of Energy Technology, Division of Heat and Power Technology, KTHStockholm, 2001, ISSN 110-7990, TRITA-KRV-2001-1Freudenreich, Kai,; 1999“Velocity and Turbulence Intensity Measurements in Two Annular Stator ConfigurationsUsing a Three-Dimensional Laser-Two-Focus Anemometer”; Teknologi Licetiat Thesis atthe Department of Energy Technology, Division of Heat and Power Technology, KTHStockholm, 1999, ISSN 110-7990, TRITA-KRV-1999-1, ISBN 91-7170-376-4Freudenreich, K.; Jöcker, M.; Rheder, H.-J.; Höhn, W.; Fransson, T.H.; 1999“Aerodynamic Performance of Two Isolated Stators in Transonic Annular Cascade Flow”,Proceedings of the 3rd Euopean Conference on Turbomachinery – Fluid Dynamics andThermodynamics, London, UK, March 2-5, 1999, Professional Engineering Publishing,ISBN: 1 86058 196 XFriedrichs, S.; 2001“Unsteady Flow and Aeroelasticity in Turbomachines”; Cambridge TurbomachineryCourse, Whittle Laboratory, June 2001Gerolymos, G.A.;1993“Advances in the Numerical Integration of the Three-Dimensional Euler Equations inVibrating Cascades”; Journal of Turbomachinery, Vol. 115, pp. 781, 1993Giles M.; Heimes, R.; 1993“Validation of a Numerical Method for Unsteady Flow Calculations”; Journal ofTurbomachinery, Vol. 115(1), pp 110-117, 1993Giles, M.; 1992“An Approach for Multi-Stage Calculations Incorporating Unsteadiness”; ASME paper No.92-GT-282
Doctoral Thesis Markus Jöcker Page 91
Giles, M.; 1991“UNSFLO: A Numerical Method For The Calculation Of Unsteady Flow InTurbomachinery”, GTL Report #205Giles, M. B.; 1990“Stator/Rotor Interaction in Transonic Turbine”; Journal of Propulsion and Power, Vol. 6,No. 5, Sept. – Oct. 1990Giles, M. B.; 1989“Non-Reflecting Boundary Conditions For Euler Equation Calculations”, AIAA Journal, Vol.28, No. 12, pp 2050-2058Giles, M. B.; 1988a“Non-Reflecting Boundary Conditions for the Euler Equations”,Report No. CFDL-TR-88-1, February 1988Giles, M. B.; 1988b“Calculation of Unsteady Wake-Rotor Interaction”; AIAA J. of Propulsion, Vol. 4, No. 4;pp.356-362; 1988Goldstein, M. E.; 1978“Unsteady vortical and entropic distortions of potential flows round arbitrary obstacles”,Journal of Fluid Mechanics, 1978, Vol. 89, part 3, pp. 433-468Green, J.S.; 1999“Forced Response Predictions: Applications within the Design Process (Dealing withOrientation Scatter in Single Crystal Blades)”; 4th National Turbine Engine HCFConference, Monteray, CA, USA. 9-11 Feb 1999.Green, J.S.; 2001“AdturB Project Synthesis Report”; Report No ADTB-RR-0011Groth, J.P.; Mårtensson, H.; Eriksson, L.E.; 1996“Validation of a 4D Finite Volume Method for Blade Flutter”; ASME paper 96-GT-429Grüber, B.; Carstens, V.; 1996“Computation of the Unsteady Transonic Flow in Harmonically Oscillating TurbineCascades Taking Into Account Viscous Effects”; ASME Paper 96-GT-338Haldeman, C.W.; Dunn, M.G.; Abhari, R.S.; Johnson, P.D.; Montesdeoca, X.A.; 2000“Experimental and Computational Investigation of the Time-Averaged and Time-ResolvedPressure Loading on a Vaneless Counter-Rotating Turbine”, ASME paper No. 2000-GT-0445Hall, K. C.; Lorence, C. B.; 1992“Calculation of Three-Dimensional Unsteady Flows in Turbomachinery Using theLinearized Harmonic Euler Equations”, ASME Paper 92-GT-136Hall, K. C.; Crawley, E. F.; 1987“Calculation of Unsteady Flows in Turbomachinery Using the Linearized EulerEquations”, Proceedings of the 4th international symposium on “UnsteadyAerodynamics and Aeroelasticity of Turbomachines and Propellers”, pp. 15-38,Aachen, Germany, September 6-10, 1987.He, L; 1992“Method of Simulating Unsteady Turbomachinery Flows with Multiple Perturbations”; AIAAJournal, Vol. 30, No. 11, pp. 2730-2735, 1992He, L.; 1999“Three-Dimensional Unsteady Navier-Stokes Analysis of Stator-Rotor Interaction in Axial-flow Turbines”;IMECHE 99 paper C557/049/99, Proceedings of the 3rd EuopeanConference on Turbomachinery – Fluid Dynamics and Thermodynamics, London, UK,March 2-5, 1999, Professional Engineering Publishing, ISBN: 1 86058 196 X
Page 92 Doctoral Thesis Markus Jöcker
He, L.; 2001“Unsteady Flow and Aeroelasticity in Turbomachines”; Cambridge TurbomachineryCourse, Whittle Laboratory, June 2001Henderson, G. H.; Fleeter, S.; 1993a“Forcing Function Effects on Unsteady Aerodynamic Gust Response. Part 1: ForcingFunctions.”; Journal of Turbomachinery, Vol. 115, pp. 741-750, 1993Henderson, G. H.; Fleeter, S.; 1993b“Forcing Function Effects on Unsteady Aerodynamic Gust Response. Part 2: Low SolidityAirfoil Row Response.”; Journal of Turbomachinery, Vol. 115, pp. 751-761, 1993Hennings, H. , Elliott, R.; 2002”Forced Response Experiments in a High Pressure Turbine Stage”, ASME paper GT-2002-30453Hennings, H.; 2002b”Private Communications”Hilbert, G.R.; Ni Ron Ho; Takahashi, R. K.; 1997“Forced Response Prediction of Gas Turbine Rotor Blades”, paper presented at the 1997ASME Winter Annual MeetingHilditch, M. A.; Smith, G. C.; Singh, U. K.; 1998“Unsteady Flow in a Single Stage Turbine.”; ASME Paper No. 98-GT-531Hodson, H.P; 1985“An Inviscid Blade to Blade Prediction of a Wake-Generated Unsteady Flow”; ASME paper84-GT-43 and J. of Turbomachinery, Vol. 107, pp 337- 344Hodson, H. P.; 1998“Bladerow Interactions in Low Pressure Turbines”; VKI Lecture Series 1998-02; Blade RowInterference Effects in Axial Turbomachinery Stages, 1998Holmes, D. G.; Mitchell, B. E.; Lorence, C. B.; 1997“Three Dimensional Linearized Navier-Stokes Calculations for Flutter and ForcedResponse”; Proceedings of the 8th International Symposium on Unsteady Aerodynamics,Aeroacoustics and Aeroelasticity of Turbomachines, Stockholm, Sweden, KluwerAcademic Publishers, ISBN0-7923-5040-5Hummel, F.; 2001“Wake Wake Interactions and its Potential for Clocking in a Transonic High PressureTurbine”; ASME paper 2001-GT-0302Hwang, C. J.; Liu, J .L.; 1993”Analysis of Steady and Unsteady Turbine Cascade Flows by a Locally Implicit HybridAlgorithm”; J. of Turbomachinery, Vol. 115, Oct. 1993Jameson, A.; 1986”Current Status and Future Directions of Computational Transonics”; ComputationalMechanics-Advances and Trends, pp.329-367, ASME Ed. A.K. Noor, 1986Jareland, H.M.; Csaba, G.; 2000“Friction Damper Mistuning of a Bladed Disk and Optimization With Respect to Wear”;ASME paper 2000-GT-0363Jay, R. L.; Fleeter, S.; 1988“Unsteady Aerodynamic Measurements in Forced Vibration Research”; AGARD Manualon Aeroelasticity in Axial Flow Turbomachines, AGARD-AG-298, ISBN 92-835-0467-4,edited by Max F. Platzer and Franklin O. Carta, 1988Jeanpierre, J.; Fransson, T.; 1997“Task 2, Forced Response Analysis, Subtask A2.1.1, Prediction of the Excitation PressureLevel on the Blades – 43 NGV”, Report No ADTB-KTH-2005, Internal report No. 97/26November 1997, Confidential

Doctoral Thesis Markus Jöcker Page 93
Johnson, A. B.; Rigby, M. J.; Oldfield, M. L. G.; 1989“Unsteady Aerodynamic Phenomena in a Simulated Wake and Shock Wave PassingExperiment”, AGARD Conference Proceedings No. 468, “Unsteady AerodynamicPhenomena in Turbomachines”, pp. 9.1-9.13, Luxembourg, August 28-30, 1989.Johnston, R.T.; Feiereisen, J. M.; Fleeter, S.; 1998“Measured Rotor Wake and Potential Forcing Functions, Including Blade RowInteractions”; AIAA Journal of Propulsion and Power, Vol. 14 No. 2, pp. 191-198, 1998Jöcker, M.; Fransson, T.; 2002a“Brite EuRam ADTurB: “Task 2 DLR Rig – Validation of Excitation PressureComputations”, Report No. ADTB-KTH-2020, Internal Report No. KTH-HPT 25/02,February 2002, ConfidentialJöcker, M.; Fransson, T.H.; 2002b“Modeshape Sensitivity of the High Pressure Turbine Rotor Excitation Due to UpstreamStators”, presented at the 47th ASME TURBO EXPO 2002, paper No. GT-2002-30452Jöcker, M.; Hillion, F.X.; Fransson, T.;Wåhlén, U.; 2001“Numerical Unsteady Flow Analysis of a turbine Stage with Extremely Large Blade Loads”,46th ASME Int. Gas Turbine and Aeroengine Congress, Exposition and User Symposium,paper No. 2001-GT-0260 and J. of Turbomachinery, Vol. 124, No. 3, pp.429ff, July 2002Jöcker, M.; Hillion, F.X.; Fransson, T.; 2000a“Final Report, Design and Analysis of a Turbine with Extremely Large Blade Loads, Phase2”, Report KTH-HPT-00/07, March 20700, ConfidentialJöcker, M.; Freudenreich, K.; Rehder, H.-J.; Fransson, T. H.; 2000b“Parametric Studies of the Aerodynamic Excitation in High Pressure Turbines.”,Proceedings of 9th International Symposium on Unsteady Aerodynamics, Aeroacousticsand Aeroelasticity of Turbomachines, Lyon, France, 2000, ISBN: 2 7061 1052 XJöcker, M.; Fransson, T.; 1998aBrite Euram ADTurB: Task 2: “Forced Response Analysis, Prediction of the ExcitationPressure Level on the Blades, 70 NGV”, Internal Report KTH-HPT-98/29, KTH/HPT,Stockholm, 1998, ConfidentialJöcker, M.; Fransson, T.; 1998b“Report on UNSFLO Calculations”, Project “Design and Analysis of a Turbine Blade withExtremely Large Blade Loads”, KTH Study Part 2: Numerical Parameter Study of the AxialGap and the Stator Pitch on the Forced Response”, Report No. KTH-HPT-30/98, Nov. 98,ConfidentialJöcker, M.; 1994“Validation of Unsteady Aerodynamic Prediction Models on the Turbine Configuration TCTIII”, Project Study, KTH Stockholm, 1994, ConfidentialJung, A. R.; Mayer, J. F.; Stetter, H.; 1996“Simulation of 3D-Unsteady Stator/Rotor Interaction in Turbomachinery Stages of ArbitraryPitch Ratio”,ASME paper 96-GT-69Kahl, G.; 1997“Structural Mistuning and Aerodynamic Coupling in Turbomachinery Blades”; Proceedingsof the 8th International Symposium on Unsteady Aerodynamics, Aeroacoustics andAeroelasticity of Turbomachines, Stockholm, Sweden, Kluwer Academic Publishers,ISBN0-7923-5040-5Kahl, G.; Klose, A.; 1991“Time Linearized Euler Calculations for Unsteady Quasi-3D Cascade Flows”; UnsteadyAerodynamics, Aeroacoustics and Aeroelasticity of Turbomachines and Propellers, H.M.Atassi (ed.), Springer Verlag, New York, pp.109–126, 1993

Page 94 Doctoral Thesis Markus Jöcker
Kielb, J. J.; Abhari, R. S.; 2001Experimental Study of Aerodynamic and Structural Damping in a Full-Scale RotatingTurbine”; ASME paper No 2001-GT-0262Kielb, R.E.; 2000”CFD for Turbomachine Unsteady Flows – An Aeroelastic Design Perspective”;Proceedings of 9th International Symposium on Unsteady Aerodynamics, Aeroacousticsand Aeroelasticity of Turbomachines, Lyon, France, 2000, ISBN: 2 7061 1052 XKielb, R. E.; Chiang, H. D.; 1992“Recent Advancements in Turbomachinery Forced Response Analyses”; AIAA 92-0012,January 6-9, 1992, Reno, NVKorakianitis, T.; 1991“Axial Gap Effects on the Propagation of Unsteady Flow in Cascades”; proceedings of the6th International Symposium on Unsteady Aerodynamics, Aerocoustics and Aeroelasticityof Turbomachines and Propellers, University of Notre Dame, September 15-19. 1991Korakianitis, T.; 1992a“On the Prediction of Unsteady Forces on gas Turbine Blades: Part 1 – Description of theApproach”, Journal of Turbomachinery, 114, pp. 114-122, 1992Korakianitis, T.; 1992b“On the Prediction of Unsteady Forces on gas Turbine Blades: Part 2 –Analysis of theResults”, Journal of Turbomachinery, 114, pp. 123-131, 1992Korakianitis, T.; 1993a“On the Propagation of Viscous Wakes and Potential Flow in Axial-Turbine Cascades”,Journal of Turbomachinery, 115, pp. 118-127, 1993Korakianitis, T.; 1993b“Influence of Stator-Rotor Gap on Axial-Turbine Unsteady Forcing Functions”; AIAAJournal, Vol. 31, No. 7, July 1993Koya, M.; Kotake, S.; 1985”Numerical Analysis of Fully Three-Dimensional Periodic Flows Through a Turbine Stage”;J. of Engineering for Gas Turbines and Power, Vol. 107, pp. 945-952; 1985Lakshminarayana, B.; Chernobrovkin, A.; Ristic, D.; 2000“ Unsteady Viscous Flow Causing Rotor-Stator Interaction in Turbines, Part 1: Data,Code, Pressure “, Journal of Propulsion and Power, Vol. 16, No. 5, 2000Laumert, B.; Mårtensson, H.; Fransson, T.F.; 2002“Simulation of Rotor/Stator Interaction With a 4D Finite Volume Method”; ASME paper No.GT-2002-30601Laumert, B.; Mårtensson, H.; Fransson, T.F.; 2001a“Investigation of Unsteady Aerodynamic Blade Excitation Mechanisms in a TransonicTurbine Stage, Part 1: Phenomenological Identification and Classification”; ASME paper2001-GT-0258Laumert, B.; Mårtensson, H.; Fransson, T.F.; 2001b“Investigation of Unsteady Aerodynamic Blade Excitation Mechanisms in a TransonicTurbine Stage, Part 2:Analytical Description and Quantification”; ASME paper 2001-GT-0259Laumert, B.; Mårtensson, H.; Fransson, T.H.; 2000“Investigation of the Flowfield in the Transonic VKI BRITE EURAM Turbine Stage with 3DSteady and Unsteady N-S Computations ”; ASME paper No. 2000-GT-0433Launder, B.E.; Spalding, D.B.; 1974“The Numerical Computation of Turbulent Flow”; Computational Methods in AppliedMechanics and Engineering, Vol. 103, pp.269-289, 1974
Doctoral Thesis Markus Jöcker Page 95
Lewis, J.P.; Delaney, R. A.; Hall, E.J.; 1987“Numerical Prediction of Turbine Vane-Blade Interaction”; AIAA 87-2149; 1987Liamis, N.; Couaillier, V.; 1994“Unsteady Euler and Navier-Stokes Flow Simulations With an Implicit Runge-KuttaMethod”, Proceedings of the 2nd ECCOMAS Computational Fluid Dynamics Conference,5-8 September 1994, Stuttgart, Germany, John Wiley & Sons 1994Liepman, H. W.; Roshko, A.;1957“Elements of Gas Dynamics”; Wiley, New YorkManwaring, S. R.; Rabe, D. C.* Lorence, C. B.; Wadia, A. R.; 1997“Inlet Distortion Generated Forced Response of a Low-Aspect-Ratio Transonic Fan.”Journal of Turbomachinery, Vol. 115, pp. 724-740, 1997 ASME Paper 96-GT-376Manwaring, S. R.; Wisler, D. C.; 1993“Unsteady Aerodynamics and Gust Response in Compressors and Turbines.”;Journal of Turbomachinery, Vol. 115, pp. 724-740, 1993Marshall, J.G.; Giles, M.B.; 1997“Some Applications of a Time-Linearized Euler Method to Flutter and Forced Response inTurbomachinery”, Proceedings of the 8th International Symposium on UnsteadyAerodynamics, Aeroacoustics and Aeroelasticity of Turbomachines, Stockholm, Sweden,Kluwer Academic Publishers, ISBN0-7923-5040-5Marshall, J.G.; Imregun, M.; 1996“A Review of Aeroelasticity Methods With Emphasis on Turbomachinery Applications”;Journal of Fliuds and Structures (1996) 10, 237-267Michelassi, V.; Martelli, F.; 1998“Numerical Simulation of Unsteady Stator-Rotor Interaction in Brite-Turbine Stage”; VKILecture Series 1998-02; Blade Row Interference Effects in Axial Turbomachinery Stages,1998Montgomery, M.D.; Verdon, J. M.; 1997“A 3D Linearized Euler Analysis for Blade Rows, Part 1: Aerodynamic and NumericalFormulations”; Proceedings of the 8th International Symposium on UnsteadyAerodynamics, Aeroacoustics and Aeroelasticity of Turbomachines, Stockholm, Sweden,Kluwer Academic Publishers, ISBN0-7923-5040-5Moss, R. W.; Ainsworth, A. W.; Sheldrake, C. D.; Miller, R.; 1997“The Unsteady Pressure Field Over a Turbine Blade Surface: Visualisation andInterpretation of Experimental Data”, ASME paper 97-GT-474Moyroud, F.; Cosme, N.; Jöcker, M.; Fransson, T.H.; Lornagex, D.; Jacquet-Richardet, G.; 2000“A Fluid-Structure Interfacing Technique for Computational Aeroelastic Simulations”;Proceedings of 9th International Symposium on Unsteady Aerodynamics, Aeroacousticsand Aeroelasticity of Turbomachines, Lyon, France, 2000, ISBN: 2 7061 1052 XMurthy, D. V.; Morel, M. R.; 1993“Turbine Blades Forced Response Prediction using Freps”, Presented at the 1993 SAEAerospace Atlantic Conference and Exposition in Dayton, Ohio, USA, April 20-23, 1993Pandolfi, M.; 1980“Numerical Experiments on Unsteady Flows Through Vibrating Cascades “; Proceedingsof the 2nd International Symposium on Unsteady Aerodynamics and Aeroelasticity inTurbomachines, Sept. 1980, Lausanne, SwitzerlandPanning, L.; Sextro, W.; Popp, K.; 2000“Optimization of Interblade Friction Damper Design”; ASME paper 2000-GT-0541Panovsky, J.; Kielb, R.E.; 1998; “A Design Method to Prevent Low Pressure TurbineBlade Flutter”; ASME paper 98-GT-575
Page 96 Doctoral Thesis Markus Jöcker
Rai, M.M.; 1989“Three Dimensional Navier Stokes Simulations of Turbine Rotor-Stator Interaction”; J. ofPropulsion and Power, Vol. 5, No. 3, 1989, pp. 305-319Rangwalla, A. A.; Madavan, N. K.; Johnson, P. D.; 1992“Application of an Unsteady Navier-Stokes Solver to Transonic Turbine Design.”AIAA Journal of Propulsion and Power, Vol. 8, No. 5, pp. 1079-1086Rao, K. V.; Delaney, R. A.; Dunn, M. G.; 1994“Vane Blade Interaction in a Transonic Turbine: Part I: Aerodynamics.”; Journal ofPropulsion and Power, Vol. 10, No. 3, pp. 305-311, 1994Roe, P.; 1986“Characteristic Based Schemes for the Euler Equations”; Ann. Rev. Fluid Mech., 18:337-65, 1896Ruffles, P.C.; 2001“Expanding the Horizons of Gas Turbine in Global Markets”; ISABE 2001-1010Santoriello, G.; Colella, A.; Colantuoni, S.; 1993”Rotor Blade Aerodynamic Design”; Internal Project Report Alfa Romeo Avio, IMT Area 3Turbine Project (AER2-CT-92-0044), ConfidentialSaxer, A. P.; Giles, M. B.; 1994“Predictions of Three-Dimensional Steady and Unsteady Inviscid Transonic Stator/RotorInteraction with Inlet Radial Temperature Nonuniformity.”; Journal of Turbomachinery, Vol.116, pp. 347-357, 1994Saxer, A. P.; Giles, M. B.; 1993”Quasi-Three-Dimensional Nonreflecting Boundary Conditions for Euler EquationCalculations”; J. of Propulsion and Power, Vol. 9, No. 2, 1993, pp. 263-271Schmitt, S.; Eulitz, F.; Nürnberger, D.; Carstens, V.; Belz, J.; 2001“Simulation of Propfan Forced Response Using a Direct Fluid-Structure Coupling Method”;Proceedings of the 4th European Conference on Turbomachinery – Fluid Dynamics andThermodynamics Firenze, 20th-23rd March, 2001, S.G.E., ISBN: 88-86281-57-9Sextro, W.; 2000“The Calculation of the Forced Response of Shrouded Blades with Friction Contacts andIts Experimental Verification”; ASME paper 2000-GT-540Shahpar, S.; 2001“Three-Dimensional Design and Optimisation of Turbomachinery Blades using the NavierStokes Equations”; ISABE-2001-1053Sharma, O. P.; Pickett, G. F.; Ni, R. H.; 1992“Assessment of Unsteady Flows in Turbines” J. Turbomachinery, Vol. 114, pp. 79-90, andASME Paper No. 90-GT-150Sidén, G.; 1991“Numerical Solution of Viscous Compressible Flows Applied to Turbomachinery BladeFlutter”; Ph. D. Thesis, Chalmers University of Technology, Göteborg 1991Silkowski, P.D.; Rhie, C.M.; Copeland, G.S.; Eley, J.A.; Bleeg, J.M.; 2001“CFD Investigation of Aeromechanics”; ASME paper 2001-GT-0267Silkowski, P.D.; Hall, K.C.; 1997“A Coupled Mode Analysis of Unsteady Multistage Flows in Turbomachinery”, ASMEpaper 97-GT-186Singh, G.; Hall, D.M.; 1996”Validation of Unsteady Methods Against Turbine Data”; ImechE, 1996, No. S461/003/96,1996
Doctoral Thesis Markus Jöcker Page 97
Smith, S.N.; 1972“Discrete Frequency Sound Generation in Axial Flow Turbomachines”; Reports andMemoranda No. 3709, Cambridge 1972Spallart, P.R.; Allmaras, S.R.; 1992”A One-Equation Turbulence Model for Aerodynamic Flows”; AIAA paper 92-0439Suddhoo, A,; Stow, P.; 1990“Simulation of Inviscid Blade Row Interaction Using a Linearized Potential Code”; AIAApaper 90-1916, 1990Takeishi, K.; Matsuura, M.; Aoki, S.; Sato, T.; 1989“An Experimental Study of Heat Transfer and Film Cooling on Low Aspect Ratio TurbineNozzles”, ASME Paper No. 89-GT-187, ASME Journal of Turbomachinery, Vol.112, pp.488-496Tchernycheva, O.; Kielb, R.E.; Barter, J.; Fransson, T.; 2001; “Comperative Analysis ofBlade Mode Shape Influence on Flutter of Two Dimensional Turbine Blades”; 15th ISOABE2001, Bangalore, IndiaUbaldi, M.; Zunino, P.; Cattanei, A.; Campora, U.; 2001“Effect of Trailing Edge Cooling Flow on Turbine Wake Unsteady Flow Characteristics”;Conference Proceedings of the 4th European Conference on Turbomachinery – FluidDynamics and Thermodynamics Firenze, 20th-23rd March, 2001, S.G.E., ISBN: 88-86281-57-9Vahdati, M.; Sayma, A.; Imregun, M.; 1998“Prediction of High and Low Engine Order Forced Responses for an LP Turbine Blade”;AIAA paper no AIAA-98-3719, 1998Venable, B. L.; Delaney, R. A.; Busby, J. A.; Davis, R. L.; Dorney, D. J.; Dunn, M. G.;Haldeman, C. W.; Abhari, R. S.; 1999“Influence of Vane-Blade Spacing on Transonic Turbine Stage Aerodynamics Part I: Time-Averaged Data and Analysis.”, Journal of Turbomachinery, Vol. 121, pp. 663-672, 1999and ASME Paper No. 98-GT-481Van den Braembussche, R. A.; 2001“Design and Optimisation of Turbomachinery Components”; Conference Proceedings ofthe 4th European Conference on Turbomachinery – Fluid Dynamics and Thermodynamics,Firenze, 20th-23rd March, 2001, S.G.E., ISBN: 88-86281-57-9Verdon J. M.; Caspar J. R.; 1984“A linearized unsteady aerodynamic analysis for transonic cascades.”; J. Fluid Mech.,Vol. 149, pp. 403-429,1984.Von Hoyningen-Huene, M.; Hermeler, J., 1999a“Comparison of Three Approaches to Model Stator-Rotor Interaction in the Turbine FrontStage of an Industrial Gas Turbine”, Proceedings of the 3rd Euopean Conference onTurbomachinery – Fluid Dynamics and Thermodynamics, London, UK, March 2-5, 1999,Professional Engineering Publishing, ISBN: 1 86058 196 XVon Hoyningen-Huene, M.; Hermeler, J., 1999b“Time-Resolved Numerical Analysis of the 2-D Aerodynamics in the First Stage of anIndustrial Gas Turbine for Different Vane-Blade Spacings”; ASME paper 99-GT-102Von Hoynigen-Huene, M.; Jung, A.R.; 1999c“Comparison of Different Acceleration Techniques and Methods for Periodic BoundaryTreatment in Unsteady Turbine Stage Flow Simulations”, ASME paper 99-GT-155Von Hoyningen-Huene, M.; Frank, W.; Jung, A.R.; 2000a“Three-Dimensional Time-Resolved Flow Field in the First and Last Turbine Stage of aHeavy Duty Gas Turbine, Part I: Secondary Flow Field”, ASME paper 2000-GT-0438

Page 98 Doctoral Thesis Markus Jöcker
Von Hoyningen-Huene, M.; Frank, W.; Jung, A.R.; 2000b“Three-Dimensional Time-Resolved Flow Field in the First and Last Turbine Stage of aHeavy Duty Gas Turbine, Part II: Interpretation of Blade Pressure Fluctuations”, ASMEpaper 2000-GT-0439Weaver, M.M.; Abhari, R.S.; Dunn, M.G.; Manwaring, S.R.; Salay, M.J.; Frey, K.K.;Heidegger, N.; 2000“Forcing Function Measurements and Predictions of a Transonic Vaneless CounterRotating Turbine”; ASME paper 2000-GT-0375Whitehead, D.S.; Newton, S.G.; 1985“A Finite Element Solution of Unsteady Two-Dimensional Transonic Flows in Cascades”;International Journal of Numerical Methods in Fluids, Vol. 5, pp. 115-132, 1985Whitehead, D.S.; 1987“Flutter of Turbine Blades”, Proceedings of the 4th International Symposium on UnsteadyAerodynamics and Aeroelasticity of Turbomachines and Propellers, pp. 437-452, Aachen,Germany, September 6-10, 1987.Whitehead, D. S.; 1990“A Finite-Element Solution of Unsteady Two-Dimensional Flow in Cascades”, InternationalJournal for Numerical Methods in Fluids, Vol. 10, pp. 13-34, 1990.Wilson, D. G.; Korakianitis, T.; 1998“The Design of High-Efficiency Turbomachinery and Gas Turbines”; ISBN 0-13-312000-7,Upper Saddle River, N.J.: Prentice Hall, 2nd ed.; 1998Wisler, D. C.; 1998a“Blade Row Interaction and Unsteady Effects in Axial Flow Compressors and Fans”; VKILecture Series 1998-02; Blade Row Interference Effects in Axial Turbomachinery Stages,1998Wisler, D. C.; 1998b“The Technical and Economic Relevance of Understanding Blade Row Interaction Effectsin Turbomachinery”; VKI Lecture Series 1998-02; Blade Row Interference Effects in AxialTurbomachinery Stages, 1998Wölfel, H.P.; 2001”Umdruck zur Vorlesung Maschinendynamik”; TU Darmstadt, WS 91/92Yen, H.-Y.; Herman Shen, M.-H.; 2000“Development of a Passive Turbine Blade Damper Using Magnetomechanical Coating”;ASME paper 2000-GT-36
Related Documents


