Numerical and Experimental Study on Spray Cooling System Design for Cooling Performance Enhancement of Natural Draft Dry Cooling Towers Yubiao Sun Master of Chemical Engineering A thesis submitted for the degree of Doctor of Philosophy at The University of Queensland in 2018 School of Mechanical and Mining Engineering

Welcome message from author
This document is posted to help you gain knowledge. Please leave a comment to let me know what you think about it! Share it to your friends and learn new things together.
Transcript
Numerical and Experimental Study on Spray Cooling System Design
for Cooling Performance Enhancement of Natural Draft Dry Cooling
Towers
Yubiao Sun
Master of Chemical Engineering
A thesis submitted for the degree of Doctor of Philosophy at
The University of Queensland in 2018
School of Mechanical and Mining Engineering
Abstract
The depletion of total fossil fuels and the concern about the pollution caused by the combustion
process motivate people to find clean, and sustainable energy sources. The inexhaustible solar energy
offers a clean and climate-friendly energy source. Concentrating solar power (CSP) is the main
technology to transform solar energy into electricity. Since most CSP plants are built in arid regions
with abundant solar irradiation but limited water resources due to the dry climate, natural draft dry
cooling tower (NDDCT) is a good choice to remove waste heat from the power generation process.
The small water consumption and easy operation make NDDCT quite attractive in CSP plants.
However, power plants experience a significant reduction in power generation in summers due to the
deteriorated performance of NDDCT during high ambient temperature periods. To overcome this
problem, spray cooling technology is developed to precool the inlet air for thermal performance
enhancement of NDDCT under hot weather conditions.
With the advantage of simplicity, low capital cost, ease of operation and maintenance, spray cooling
system has been developed for NDDCT to improve its cooling efficiency by utilizing the evaporative
cooling effect of sprayed water droplets. Although some preliminary studies have been made on spray
cooling, most of them are focusing on conceptual design. the design and test of spray cooling system
on real cooling. The scarcity of open literature necessitates a detailed and insightful investigation of
the spray cooling application on natural draft dry cooling towers. The aim of the current study is to
design and test a cost-effective spray cooling system to cool the inlet hot air of natural draft dry
cooling towers and evaluate the thermal performance results. A 20m high experimental tower built at
Gatton campus in the University of Queensland (UQ) is used as the research subject for model
development and experimental tests. A spray cooling system is designed and optimized for this tower
and the collected experimental data from installed sensors of temperature and humidity measurements
are used for design evaluation.
The main research work and produced outcomes are summarized as follows:
(1) Develop a three-dimensional numerical model to represent a realistic pressure-swirl atomizer
and validate this model against experimental data from wind tunnel tests. The model can
predict the macroscopic structure and characteristics of polydisperse sprays generated by the
pressure-swirl nozzle. The simulation employs Eulerian-Lagrangian scheme to account for
the multiphase flow and the linearized instability sheet atomization model to predict film
formation, sheet breakup and atomization. The study reveals that the entrainment effect and
intense central-region atomization cause small droplets to concentrate on the spray axis and
large droplets to dominate in the peripheral region of the spray. This finding is consistent with
the observation that turbulence kinetic energy of air is maximum near the nozzle exit, where

atomization is intense and momentum exchange is strong, and gradually decreases in both
radial and axial directions. Moreover, the drops inside the full cone are relatively small, and
evaporate more easily than their large counterparts in the peripheral region, hence removing
substantial sensible heat from surrounding air and creating low-temperature region in the
central of the spray. The model predictions show great consistency with the experimental
measurements of the spatial variation of the droplet size and velocity obtained from Phase
Doppler Particle Analyser (PDPA). The robustness of this model makes it useful to predict
the structures and characteristics of co-flow sprays produced by pressure-swirl atomizers.
(2) Develop a 3D CFD model based on the 20m high experimental tower at UQ, refine and
validate this model with the measured data from experimental work. This model can be used
for tower performance prediction. Information like temperature, pressure and velocity
distribution inside the cooling tower be obtained from this model to evaluate the performance
of cooling tower and more importantly, to design a cooling system.
(3) Study the influence of injection angle on the evaporation results of droplets in an isolated
spray. The results show that spray evaporations are susceptible to the nozzle locations and
injection directions. It is found that the injection angle alters the momentum exchange
between ambient air and sprayed water droplets. Varying injection direction changes the
relative strength of the vertical and horizontal components of droplet velocity. Increasing
injection angle can enlarge the water-cooled area of radiator, and a larger injection angle leads
to a sensible pre-cooling of air at the central part of NDDCT.
(4) Investigate the impact of nozzle placement on the temperature distributions of induced air
above the heat exchange. It shows that lower nozzle placement can cool the central part of the
radiator while a higher one cools the middle part. The upward and co-flow injections have
poorer cooling performance than the downward and counter-flow injections. Furthermore, a
wall cover has been introduced into the tower to change the flow field and realize precooling
for hot air at the edge of radiator, which was difficult to be cooled without the addition of wall
cover. The rationale behind the addition of wall cover is that it reduces the blockage caused
by the near-wall vortex and enable the precooled air to move outwardly and reach a more
uniform distribution at the heat exchanger level.
(5) Design a spray cooling system consisting of five commercial available nozzles (LNN1.5),
which are characterized experimentally in wind tunnels. The spray nozzles have been placed
at proper locations to make sure complete evaporation of all injected water droplets before
they collide with the radiator because the unevaporated drops would cause corrosions of
radiator. An optimal distance between two spray nozzles was identified to enhance the
evaporation processing of neighbouring sprays. Dimensionless analysis shows that the

achieved cooling efficiency is influenced by the heat and mass transfer between water droplets
and air flows, ambient air conditions as well as nozzle arrangement configurations.
(6) Evaluate the performance enhancement effect of the proposed spray cooling system on the
full-scale experimental tower. The cooling system consisting high-pressure pump, water
delivery pipelines, spray nozzles and a simple and versatile scaffold with for clamps for nozzle
mounting has been installed at the air inlet part of the 20 m high experimental NDDCT, which
is equipped with the sophisticated measurement system. Five different nozzle arrangements
have been proposed and tested. To our knowledge, this is the world’s first attempt to practice
spray cooling on a full-scale small natural draft dry cooling tower. The experimental results
prove that the introduced spray is a feasible and effective way of improving the cooling
performance of the cooling tower. The optimal spray cooling system consists of 3 upward
injections at the low level, 2 counterflow injections at the middle level and 3 counterflow
injections at the high level. This arrangement helps to fully utilize the latent heat of injected
water to precool the inlet hot air and consequently improve tower’s deteriorated performance.
These research outcomes lay the foundation for future work of designing and construction of spray
cooling system for performance enhancement of NDDCT used in CSP plants. This spray-assisted dry
cooling technology is critically important and proved to be useful in tackling the challenges of energy
shortage in regions bestowed by abundant solar irradiation but limited by severe water scarcity.

Declaration by author
This thesis is composed of my original work, and contains no material previously published or written
by another person except where due reference has been made in the text. I have clearly stated the
contribution by others to jointly-authored works that I have included in my thesis.
I have clearly stated the contribution of others to my thesis as a whole, including statistical assistance,
survey design, data analysis, significant technical procedures, professional editorial advice, and any
other original research work used or reported in my thesis. The content of my thesis is the result of
work I have carried out since the commencement of my research higher degree candidature and does
not include a substantial part of work that has been submitted to qualify for the award of any other
degree or diploma in any university or other tertiary institution. I have clearly stated which parts of
my thesis, if any, have been submitted to qualify for another award.
I acknowledge that an electronic copy of my thesis must be lodged with the University Library and,
subject to the policy and procedures of The University of Queensland, the thesis be made available
for research and study in accordance with the Copyright Act 1968 unless a period of embargo has
been approved by the Dean of the Graduate School.
I acknowledge that copyright of all material contained in my thesis resides with the copyright holder(s)
of that material. Where appropriate I have obtained copyright permission from the copyright holder
to reproduce material in this thesis.
Publications during candidature
First author peer-reviewed journal papers:
1. Yubiao Sun, Abdullah M. Alkhedhair, Zhiqiang Guan, Kamel Hooman, Numerical and
experimental study on the spray characteristics of hollow-cone pressure swirl atomizers,
Energy, 160 (2018) 678-692
2. Yubiao Sun, Zhiqiang Guan, Hal Gurgenci, Kamel Hooman, Xiaoxiao Li, Investigations on
the influence of nozzle arrangement on the pre-cooling effect for the natural draft dry cooling
tower. Applied Thermal Engineering, 130 (2018) 979-996
3. Yubiao Sun, Zhiqiang Guan, Hal Gurgenci, Kamel Hooman, Xiaoxiao Li, Lin Xia,
Investigation on the influence of injection direction on the spray cooling performance in
natural draft dry cooling tower. International Journal of Heat and Mass Transfer, 110 (2017)
113-131
4. Yubiao Sun, Zhiqiang Guan, Kamel Hooman, A review on the performance evaluation of
natural draft dry cooling towers and possible improvements via inlet air spray cooling.
Renewable and Sustainable Energy Reviews, 79 (2017) 618-637
5. Yubiao Sun, Zhiqiang Guan, Hal Gurgenci, Xiaoxiao Li, Kamel Hooman, A study on multi-
nozzle arrangement for spray cooling system in natural draft dry cooling tower. Applied
Thermal Engineering, 124 (2017) 795-814
6. Yubiao Sun, Zhiqiang Guan, Hal Gurgenci, Jianyong Wang, Kamel Hooman, Spray cooling
system design and optimization for thermal performance enhancement of natural draft dry
cooling tower, Energy, 168 (2019) 273-284
Co-authored peer-reviewed journal papers:
1. Jianyong Wang, Zhiqiang Guan, Hal Gurgenci, Anand Veeraragavan, Xin Kang, Yubiao Sun,
Kamel Hooman, Numerical study on cooling heat transfer of turbulent supercritical CO2 in
large horizontal tubes, International Journal of Heat and Mass Transfer, 126 (2018), 1002-
1019
2. Xiaoxiao Li, Hal Gurgenci, Zhiqiang Guan, Yubiao Sun, Experimental study of cold inflow
effect on a small natural draft dry cooling tower. Applied Thermal Engineering, 128 (2017)
762-771
Conference Papers/Abstracts/Presentations
1. Yubiao Sun, Zhiqiang Guan, Hal Gurgenci, Kamel Hooman (2017). Numerical study on
atomization of pressure-swirl atomizer for spray assisted dry cooling towers, 18th IAHR
International Conference on Cooling Tower and Air Cooled Heat Exchanger, Lyon, October
16-20
2. Yubiao Sun, Zhiqiang Guan, Kamel Hooman (2016) Single Nozzle Arrangement
Optimization for Pre-cooling of Inlet Air in Natural Draft Dry Cooling Towers, International
Symposium on Industrial Chimneys and Cooling Towers, Rotterdam, October 5-8
3. Yubiao Sun, Kamel Hooman, Zhiqiang Guan and Hal Gurgenci (2016). Nozzle arrangement
optimization for pre-cooling of inlet air in natural draft dry cooling towers, 10th Australasian
Heat and Mass Transfer Conference, Brisbane, July 14-15
4. Yubiao Sun, Zhiqiang Guan, Hal Gurgenci, Kamel Hooman (2015). Optimized nozzle
configuration for inlet air pre-cooling for natural draft dry cooling towers, 9th Australian
Natural Convection Workshop, Melbourne, December 14-15
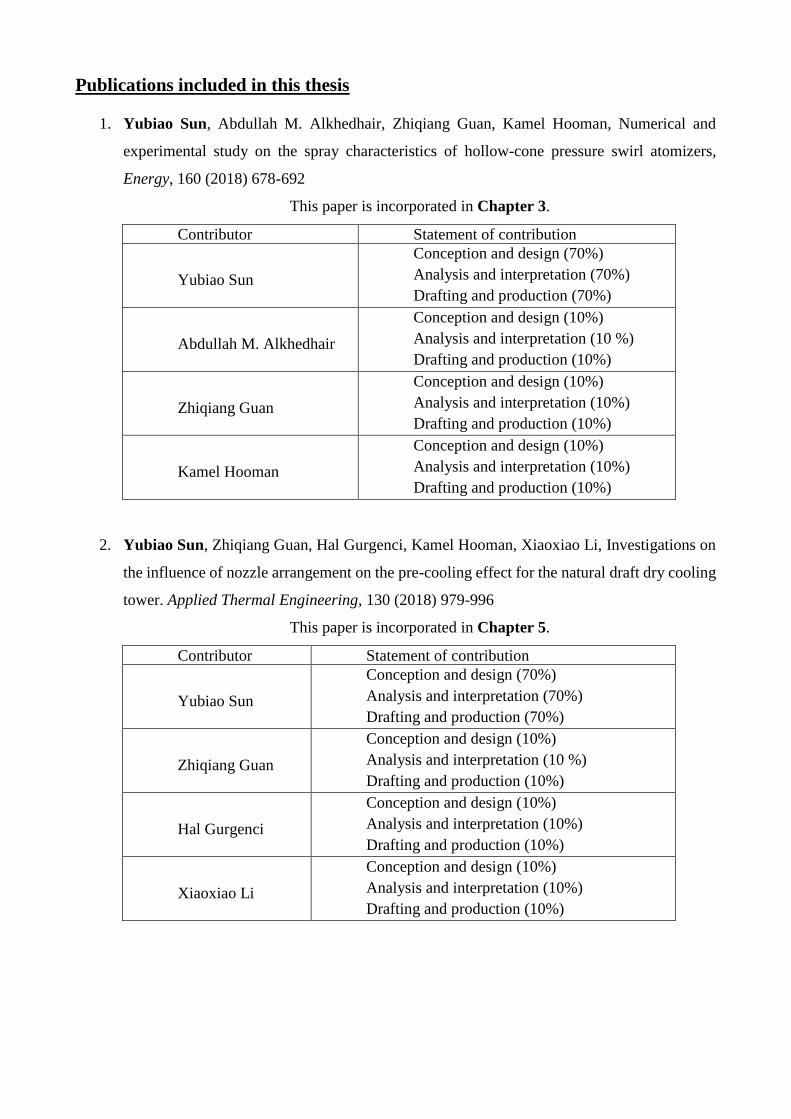
Publications included in this thesis
1. Yubiao Sun, Abdullah M. Alkhedhair, Zhiqiang Guan, Kamel Hooman, Numerical and
experimental study on the spray characteristics of hollow-cone pressure swirl atomizers,
Energy, 160 (2018) 678-692
This paper is incorporated in Chapter 3.
Contributor Statement of contribution
Yubiao Sun
Conception and design (70%)
Analysis and interpretation (70%)
Drafting and production (70%)
Abdullah M. Alkhedhair
Conception and design (10%)
Analysis and interpretation (10 %)
Drafting and production (10%)
Zhiqiang Guan
Conception and design (10%)
Analysis and interpretation (10%)
Drafting and production (10%)
Kamel Hooman
Conception and design (10%)
Analysis and interpretation (10%)
Drafting and production (10%)
2. Yubiao Sun, Zhiqiang Guan, Hal Gurgenci, Kamel Hooman, Xiaoxiao Li, Investigations on
the influence of nozzle arrangement on the pre-cooling effect for the natural draft dry cooling
tower. Applied Thermal Engineering, 130 (2018) 979-996
This paper is incorporated in Chapter 5.
Contributor Statement of contribution
Yubiao Sun
Conception and design (70%)
Analysis and interpretation (70%)
Drafting and production (70%)
Zhiqiang Guan
Conception and design (10%)
Analysis and interpretation (10 %)
Drafting and production (10%)
Hal Gurgenci
Conception and design (10%)
Analysis and interpretation (10%)
Drafting and production (10%)
Xiaoxiao Li
Conception and design (10%)
Analysis and interpretation (10%)
Drafting and production (10%)
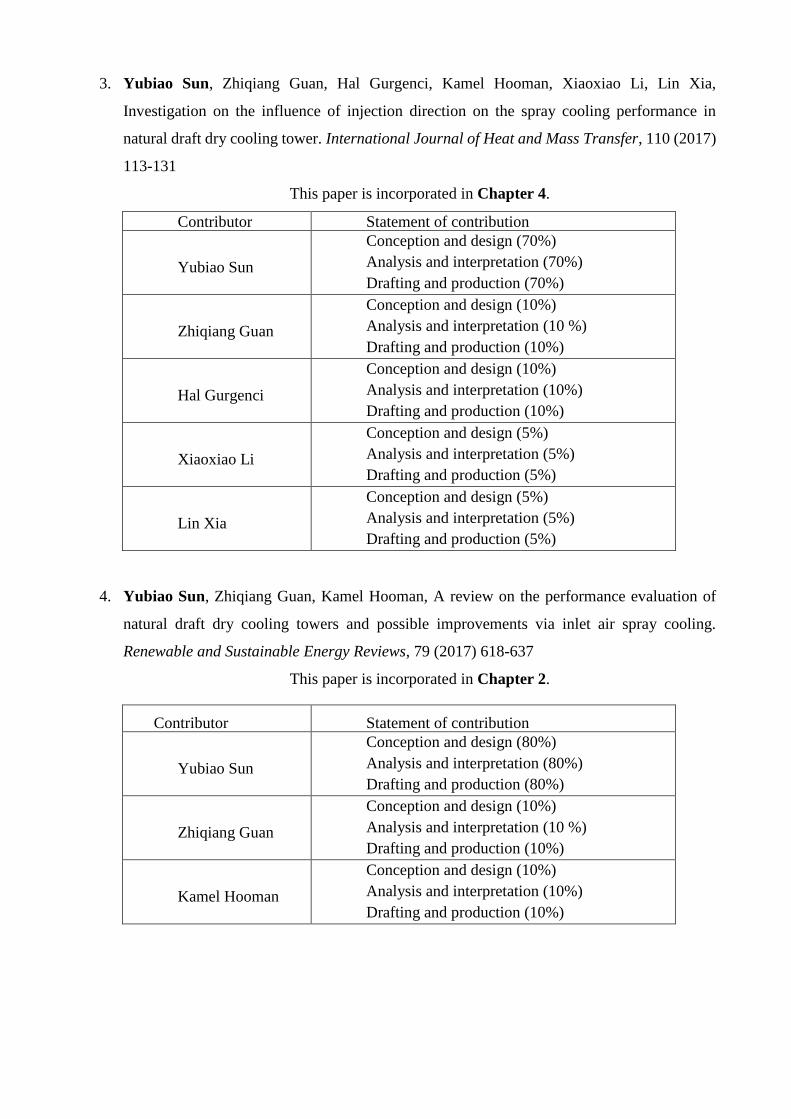
3. Yubiao Sun, Zhiqiang Guan, Hal Gurgenci, Kamel Hooman, Xiaoxiao Li, Lin Xia,
Investigation on the influence of injection direction on the spray cooling performance in
natural draft dry cooling tower. International Journal of Heat and Mass Transfer, 110 (2017)
113-131
This paper is incorporated in Chapter 4.
Contributor Statement of contribution
Yubiao Sun
Conception and design (70%)
Analysis and interpretation (70%)
Drafting and production (70%)
Zhiqiang Guan
Conception and design (10%)
Analysis and interpretation (10 %)
Drafting and production (10%)
Hal Gurgenci
Conception and design (10%)
Analysis and interpretation (10%)
Drafting and production (10%)
Xiaoxiao Li
Conception and design (5%)
Analysis and interpretation (5%)
Drafting and production (5%)
Lin Xia
Conception and design (5%)
Analysis and interpretation (5%)
Drafting and production (5%)
4. Yubiao Sun, Zhiqiang Guan, Kamel Hooman, A review on the performance evaluation of
natural draft dry cooling towers and possible improvements via inlet air spray cooling.
Renewable and Sustainable Energy Reviews, 79 (2017) 618-637
This paper is incorporated in Chapter 2.
Contributor Statement of contribution
Yubiao Sun
Conception and design (80%)
Analysis and interpretation (80%)
Drafting and production (80%)
Zhiqiang Guan
Conception and design (10%)
Analysis and interpretation (10 %)
Drafting and production (10%)
Kamel Hooman
Conception and design (10%)
Analysis and interpretation (10%)
Drafting and production (10%)
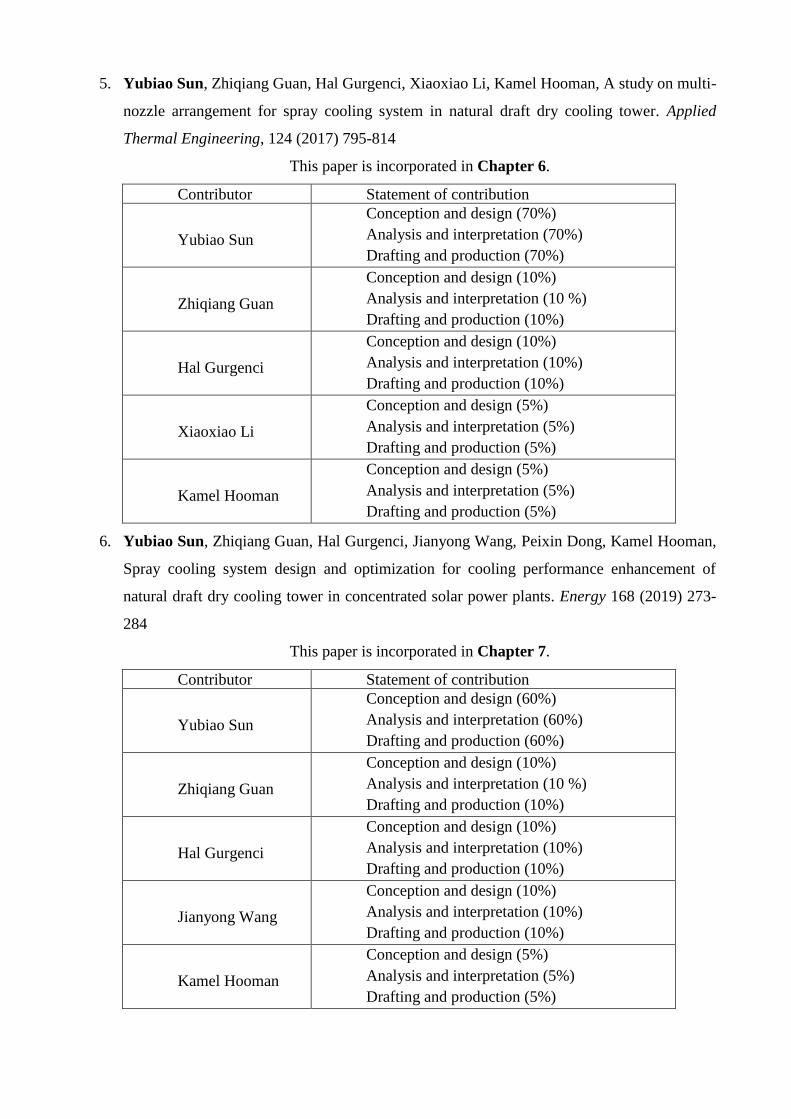
5. Yubiao Sun, Zhiqiang Guan, Hal Gurgenci, Xiaoxiao Li, Kamel Hooman, A study on multi-
nozzle arrangement for spray cooling system in natural draft dry cooling tower. Applied
Thermal Engineering, 124 (2017) 795-814
This paper is incorporated in Chapter 6.
Contributor Statement of contribution
Yubiao Sun
Conception and design (70%)
Analysis and interpretation (70%)
Drafting and production (70%)
Zhiqiang Guan
Conception and design (10%)
Analysis and interpretation (10 %)
Drafting and production (10%)
Hal Gurgenci
Conception and design (10%)
Analysis and interpretation (10%)
Drafting and production (10%)
Xiaoxiao Li
Conception and design (5%)
Analysis and interpretation (5%)
Drafting and production (5%)
Kamel Hooman
Conception and design (5%)
Analysis and interpretation (5%)
Drafting and production (5%)
6. Yubiao Sun, Zhiqiang Guan, Hal Gurgenci, Jianyong Wang, Peixin Dong, Kamel Hooman,
Spray cooling system design and optimization for cooling performance enhancement of
natural draft dry cooling tower in concentrated solar power plants. Energy 168 (2019) 273-
284
This paper is incorporated in Chapter 7.
Contributor Statement of contribution
Yubiao Sun
Conception and design (60%)
Analysis and interpretation (60%)
Drafting and production (60%)
Zhiqiang Guan
Conception and design (10%)
Analysis and interpretation (10 %)
Drafting and production (10%)
Hal Gurgenci
Conception and design (10%)
Analysis and interpretation (10%)
Drafting and production (10%)
Jianyong Wang
Conception and design (10%)
Analysis and interpretation (10%)
Drafting and production (10%)
Kamel Hooman
Conception and design (5%)
Analysis and interpretation (5%)
Drafting and production (5%)

Contributions by others to the thesis
No contribution by others.
Statement of parts of thesis submitted to qualify for award of another degree
None
Research Involving Human or Animal Subjects
“No animal or human participants were involved in this research”.

Acknowledgements
I am deeply indebted to my principle supervisor Kamel Hooman and associate supervisor Zhiqiang
Guan and Hal Gurgenci, for their fundamental role in my doctoral work. I could not have imagined
having a better advisory team for my PhD study. They provided me with every bit of guidance,
assistance and expertise that I need and helped me, both consciously and unconsciously, to become a
mature researcher. I appreciate all their contributions of time, ideas, and funding to make my PhD
experience productive and stimulating. The joy and enthusiasm they have for our research program
are contagious and motivational for me, especially during tough times in the PhD pursuit. I have
greatly benefited from the freedom they gave to me when ventured into research on my own and their
valuable feedback, advice, and encouragement. Without their guidance and constant feedback, this
PhD would not have been achievable.
The members of the QGECE group have contributed immensely to my personal and professional time
at UQ. The group has been a source of friendships as well as good advice and collaboration. Special
thanks to Dr. Alexander Klimenko, the chair of my thesis review committee, for his invaluable help
and support in this project. Meanwhile, I would like to express my solicit gratitude to Hugh Russel,
Berto Di Pasquale and Peter Bleakley for their technical support during my experimental tests.
I want personally to express my warmest appreciation to my landlords--Bob Brock and Julie Brock
for the pleasant stay from 2016. Their house is very cosy and spacious and I really like the swimming
pool and veranda decorated with sweeting-smelling flowers. The verdant green hills of Mount Coot-
tha and the quiet and peaceful neighbourhood is the most perfect refreshment. I greatly value the
close personal rapport that we have forged over the years and want to let them know how gratifying
it is to receive their kind note of support and encouragement.
Lastly, I would like to thank my family for all their love and encouragement. Undertaking this PhD
has been a truly life-changing experience for me and it would not have been possible to do without
the support, sacrifices and guidance that I received from my mother, brother and grandparents. And
most of all for my loving, supportive, encouraging, and patient mother whose faithful support during
the whole stage of this PhD. Thank you.
I gratefully acknowledge the funding received towards my PhD from the International Postgraduate
Research Scholarship and UQ Centennial scholarship. I was funded by the Australia Department of
Education and the University of Queensland for the past 3.5 years. My work has also been supported
by the Australian Renewable Energy Agency (ARENA). Thanks for their financial support.
Yubiao Sun
The University of Queensland
October 25, 2018

Financial Support
This research is part of the Australian Solar Thermal Research Initiative (ASTRI), a project supported
by Australian Government, through the Australian Renewable Energy Agency (ARENA).
The author of this thesis, Yubiao Sun, would also like to thank Australia government and the
University of Queensland for their financial support--International Postgraduate Research
Scholarship and UQ Centennial scholarship.

Keywords
Solar energy, natural draft dry cooling tower, heat and mass transfer, droplet dynamics, water
evaporation, spray cooling, nozzle arrangement, pressure-swirl atomizer
Australian and New Zealand Standard Research Classifications (ANZSRC)
ANZSRC code: 091505, Heat and Mass transfer Operations, 50%
ANZSRC code: 091305, Energy Generation, Conversion and Storage Engineering, 50%
Fields of Research (FoR) Classification
FoR code: 0913, Mechanical Engineering, 50%
FoR code: 0915, Interdisciplinary Engineering, 50%
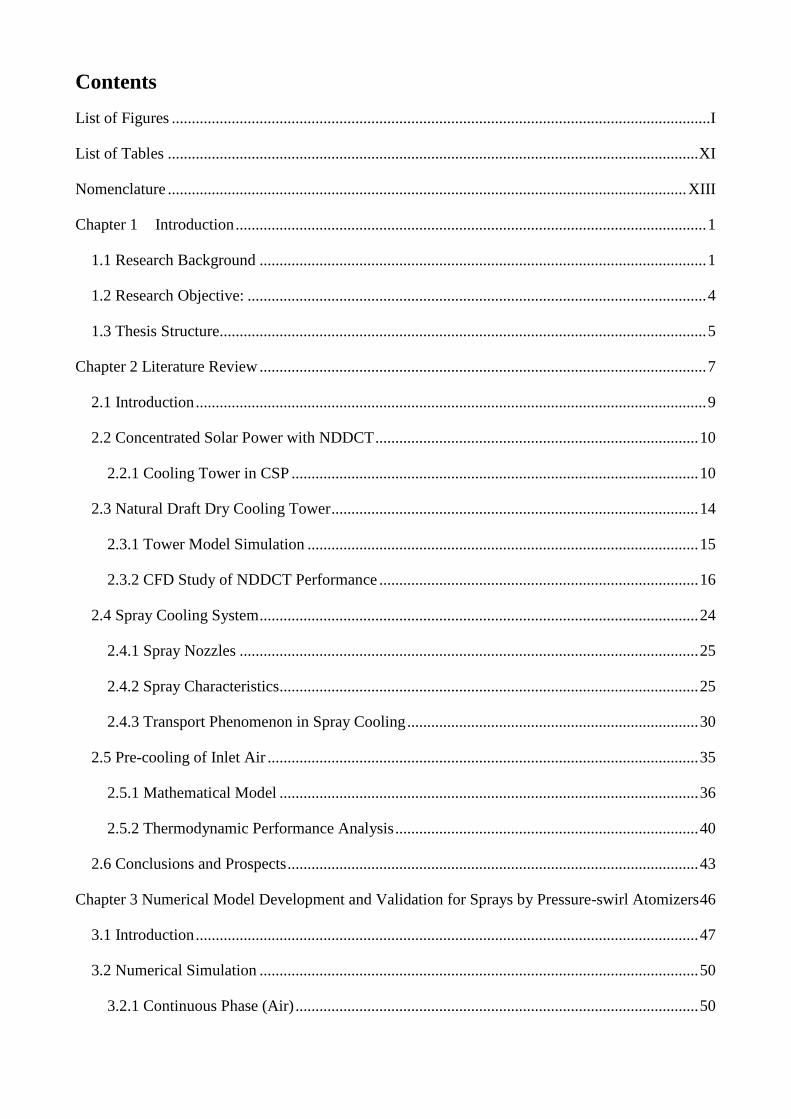
Contents
List of Figures ....................................................................................................................................... I
List of Tables ..................................................................................................................................... XI
Nomenclature .................................................................................................................................. XIII
Chapter 1 Introduction ...................................................................................................................... 1
1.1 Research Background ................................................................................................................ 1
1.2 Research Objective: ................................................................................................................... 4
1.3 Thesis Structure.......................................................................................................................... 5
Chapter 2 Literature Review ................................................................................................................ 7
2.1 Introduction ................................................................................................................................ 9
2.2 Concentrated Solar Power with NDDCT ................................................................................. 10
2.2.1 Cooling Tower in CSP ...................................................................................................... 10
2.3 Natural Draft Dry Cooling Tower ............................................................................................ 14
2.3.1 Tower Model Simulation .................................................................................................. 15
2.3.2 CFD Study of NDDCT Performance ................................................................................ 16
2.4 Spray Cooling System .............................................................................................................. 24
2.4.1 Spray Nozzles ................................................................................................................... 25
2.4.2 Spray Characteristics ......................................................................................................... 25
2.4.3 Transport Phenomenon in Spray Cooling ......................................................................... 30
2.5 Pre-cooling of Inlet Air ............................................................................................................ 35
2.5.1 Mathematical Model ......................................................................................................... 36
2.5.2 Thermodynamic Performance Analysis ............................................................................ 40
2.6 Conclusions and Prospects ....................................................................................................... 43
Chapter 3 Numerical Model Development and Validation for Sprays by Pressure-swirl Atomizers 46
3.1 Introduction .............................................................................................................................. 47
3.2 Numerical Simulation .............................................................................................................. 50
3.2.1 Continuous Phase (Air) ..................................................................................................... 50
3.2.2 Discrete Phase (Water)...................................................................................................... 52
3.2.3 Atomization and Breakup ................................................................................................. 53
3.2.4 Computational Model ....................................................................................................... 56
3.3. Experimental Method .............................................................................................................. 60
3.4. Model Validation and Physical Insights ................................................................................. 62
3.5 Results and Discussions ........................................................................................................... 67
3.6 Conclusions .............................................................................................................................. 77
Chapter 4 Impacts of Injection Direction on Spray Evaporation ....................................................... 79
4.1 Introduction .............................................................................................................................. 80
4.2 Numerical Method ................................................................................................................... 84
4.2.1 Governing Equations......................................................................................................... 85
4.2.2 Computational Model ....................................................................................................... 91
4.3 Results and Discussions ........................................................................................................... 98
4.3.1 Inlet Air Velocity .............................................................................................................. 98
4.3.2 Nozzle Arrangement for Pre-cooling .............................................................................. 100
4.3.3 Cooling Performance ...................................................................................................... 101
4.3.4 Droplet Trajectories ........................................................................................................ 106
4.3.5 Optimized Nozzle Injection ............................................................................................ 107
4.4 Conclusion ............................................................................................................................. 112
Chapter 5 Cooling Performance Evaluation with Polydisperse Sprays ........................................... 114
5.1 Introduction ............................................................................................................................ 115
5.2 Numerical Method ................................................................................................................. 118
5.2.1 Governing Equations....................................................................................................... 119
5.2.2 Computational Model ..................................................................................................... 122
5.3 Results and Discussions ......................................................................................................... 128
5.3.1 Inlet Air Velocity ............................................................................................................ 128
5.3.2 Nozzle Representation and Cooling Performance .......................................................... 131
5.3.3 Nozzle Arrangement Investigation ................................................................................. 134
5.4 Conclusions ............................................................................................................................ 145
Chapter 6 Multiple Nozzle Arrangement for the Spray Cooling System ........................................ 147
6.1 Introduction ............................................................................................................................ 148
6.2 Numerical Method ................................................................................................................. 152
6.2.1 Governing Equations....................................................................................................... 153
6.2.2 Computational Model ..................................................................................................... 157
6.2.3 Nozzle Representation and Cooling Performance .......................................................... 168
6.3 Results and Discussions ......................................................................................................... 172
6.3.1 Inlet Air Velocity ............................................................................................................ 172
6.3.2 Nozzle Distance Investigation ........................................................................................ 174
6.3.3 Multi-nozzle Arrangements ............................................................................................ 177
6.4 Conclusions ............................................................................................................................ 183
Chapter 7 Spray Cooling Tests with Full-scale Natural Draft Dry Cooling Towers ....................... 184
7.1 Introduction ............................................................................................................................ 186
7.2.3 Spray Cooling System ..................................................................................................... 193
7.3 Result and Discussion ............................................................................................................ 198
7.3.1 Overview of Cooling Tower Performance ...................................................................... 198
7.3.2 Spray Cooling System Optimization............................................................................... 203
7.3.3 Insights into the Precooling Zone ................................................................................... 210
7.4 Conclusions ............................................................................................................................ 212
Chapter 8 Summary and Future Work ............................................................................................. 214
8.1 Summary ................................................................................................................................ 214
8.2 Main Contributions ................................................................................................................ 216
8.3 Recommendations for Future Work ....................................................................................... 217
Reference ......................................................................................................................................... 219
I
List of Figures
Figure 2-1 Schematic of a CSP plant with a thermal storage system ................................................ 10
Figure 2-2 The global distribution of direct normal irradiation. ........................................................ 12
Figure 2-3 Relationship between power plant power output, turbine back pressure and ambient air
temperature for a 20 MW air-cooled power plant. ............................................................................. 13
Figure 2-4 Water spray used for inlet air spray-cooling. ................................................................... 15
Figure 2-5 Power generation increment by inlet air cooling in gas turbine. ...................................... 15
Figure 2-6 Pressure drop at different place of the NDDCT ............................................................... 16
Figure 2-7 Schematic of dry-cooling tower incorporating horizontal air-cooled heat exchanger. (a)
Dry-cooling tower with heat exchanger A-frames in the radial pattern, (b) Dry-cooling tower with
heat exchanger A-frames in the rectangular pattern, (c) Heat exchanger A-frames in the radial pattern,
(d) Heat exchanger A-frames in the rectangular pattern, (e) Sector and wind specification for radial
configuration, (f) Sector and wind specification for rectangular configuration. ............................... 20
Figure 2-8 Variable contour plots at the inlet cross section of heat exchanger in the radial (left) and
rectangular (right) pattern at wind speed of 4 m/s and in wind direction of 0°. (11a, 13a) Velocity in
unit of m/s. (11b, 13b) Pressure in unit of Pa. (11c, 13c) Temperature in unit of K. ........................ 21
Figure 2-9 Velocity vector distribution in the middle section of the heat exchangers when Uwind = 10
m/s. (a) No wind-break walls, (b) 9-m-wide wind- break walls, (c) 27-m-wide wind-break walls. . 21
Figure 2-10 Cooling tower geometries, (a) side-view, (b) top-view, (left) usual with wind breakers,
(middle) usual, and (right) present proposal. ..................................................................................... 22
Figure 2-11 Velocity, pressure and temperature fields at the vertical cross section of towers with
height/diameter=1.54 (left) and height/diameter=1.05 (right) in the absence of winds. (a) velocity (b)
pressure, (c) temperature. ................................................................................................................... 22
Figure 2-12 Sketches of scale 1/200 model (a), 1/800 model (b) and 1/400 model (c). .................... 23
Figure 2-13 (a) The dimensions of the scaled cooling tower model with the round heater, (b) The
schematic diagram of experiment system and the layouts of the sensors. ......................................... 24
Figure 2-14 Different pray patterns for hydraulic nozzles. ................................................................ 26
Figure 2-15 Accuracy of mean droplet diameter as a function of sample size [66]. ......................... 29
II
Figure 2-16 Transient time for a 100 µm droplet to approach wet-bulb temperature (Tdb=15 ℃,
Twb=10.9 ℃) [78]. .............................................................................................................................. 32
Figure 2-17 Psychometric chart of air. ............................................................................................... 35
Figure 2-18 Wind-tunnel measurement setup with measurement positions in the outlet plane and data
acquisition system, dimensions in meter [130]. ................................................................................. 40
Figure 2-19 CFD simulation of evaporative cooling by evaporative cooling [132]. ......................... 41
Figure 2-20 Air temperature distributions in (℃) in the outlet plane, 4.6m downstream of the injection
point for different velocity (1, 2, 3 m/s) for the nozzle type A300. In all cases, Dv90 is in the range
116-160 μm [133]. ............................................................................................................................. 41
Figure 2-21 Droplets trajectory and outlet plane spray coverage area in different air velocity. ....... 42
Figure 2-22 a) Nozzle arrangements in the cooling tower, b) temperature contours in a perpendicular
plane 3 m from the nozzles. ............................................................................................................... 43
Figure 3-1 The Eulerian-Lagrangian approach for multiphase spray simulation .............................. 58
Figure 3-2 (a) Isometric view of the geometry of the cubic simulation model. (b) Front view of the
simulation model to show the boundary conditions........................................................................... 58
Figure 3-3 Hexahedral grid used for computational domain. (A) Isometric view of the whole domain
(B) Front view. ................................................................................................................................... 59
Figure 3-4 Schematic diagram of the wind tunnel with employed spray nozzle and PDPA for
measurement ...................................................................................................................................... 63
Figure 3-5 The picture and illustration of PDPA setting-up in the tunnel ......................................... 64
Figure 3-6 Geometric nozzle configuration used for the experiment test. ......................................... 65
Figure 3-7 Cone angle measurement ................................................................................................. 65
Figure 3-8 Computer model validation with experimental spray data (a) Sauter mean diameter
distribution along radial direction, (b) Different characteristic diameters for the cross section at 0.3m
downstream the injection. .................................................................................................................. 66
Figure 3-9 Droplet size distribution for the whole domain (a) and its statistic representation in
histogram (b). ..................................................................................................................................... 69
Figure 3-10 Droplet size distribution in terms of diameter count (a) and volume percentage (b), based
on experimental measurement results. ............................................................................................... 70
III
Figure 3-11 Velocity distribution of injected droplets inside the computational domain ................. 71
Figure 3-12 The distribution of Sauter mean diameter on the cross section at various axial locations
downstream the nozzle. ...................................................................................................................... 71
Figure 3-13 The distribution of droplet velocity on the cross section at various axial locations
downstream the nozzle. ...................................................................................................................... 71
Figure 3-14 The experimental results showing the relationship between velocity and size for droplets
at the cross section located 0.3m downstream nozzle tip. ................................................................. 72
Figure 3-15 Velocity distribution of the surround air in contour form (a) and enlarged vector
presentation near the nozzle exit (b). ................................................................................................. 72
Figure 3-16 Mass concentration of injected droplets (a) and the turbulence kinetic energy of the
surrounding air (b). ............................................................................................................................ 75
Figure 3-17 Droplet mass distribution (a) and its corresponding Reynolds number (b) inside the
computational domain ........................................................................................................................ 76
Figure 3-18 Temperature contour at the tunnel outlet ....................................................................... 76
Figure 3-19 Cooled air temperature distribution at the midplane of the tunnel caused by droplet
evaporation. ........................................................................................................................................ 77
Figure 4-1 The experimental tower built at UQ and the specifications used for simulation (a and b).
A schematic diagram of inlet air pre-cooling for NDDCT. ............................................................... 83
Figure 4-2 Coupled between continuous and discrete phase calculations flowchart ......................... 85
Figure 4-3 Forces acting on the droplet ............................................................................................. 90
Figure 4-4 The dimensions of geometric model and boundary conditions utilized for air velocity
distribution calculation (a) and for water spray calculation (c). The mesh generated at the vertical
middle cross plane of the cooling tower for air velocity distribution (b) and for spray calculation (d).
............................................................................................................................................................ 92
Figure 4-5 Hollow-cone spray pattern ............................................................................................... 93
Figure 4-6 Comparisons of CFD predictions and experimental test data for (a) the temperature of hot
air heated by the radiator, (b) the temperature of cool water exiting from the radiator, and (c) the
velocity of induced draft across the radiator. ..................................................................................... 95
IV
Figure 4-7 Predictions of evaporation of three free-falling droplets. The diameters of these three
droplets are 67.92 µm, 101.14 µm and 157.26 µm, respectively. The comparisons are based on our
numerical simulations and the experimental measurements conducted by Sartor and Abbott [211].97
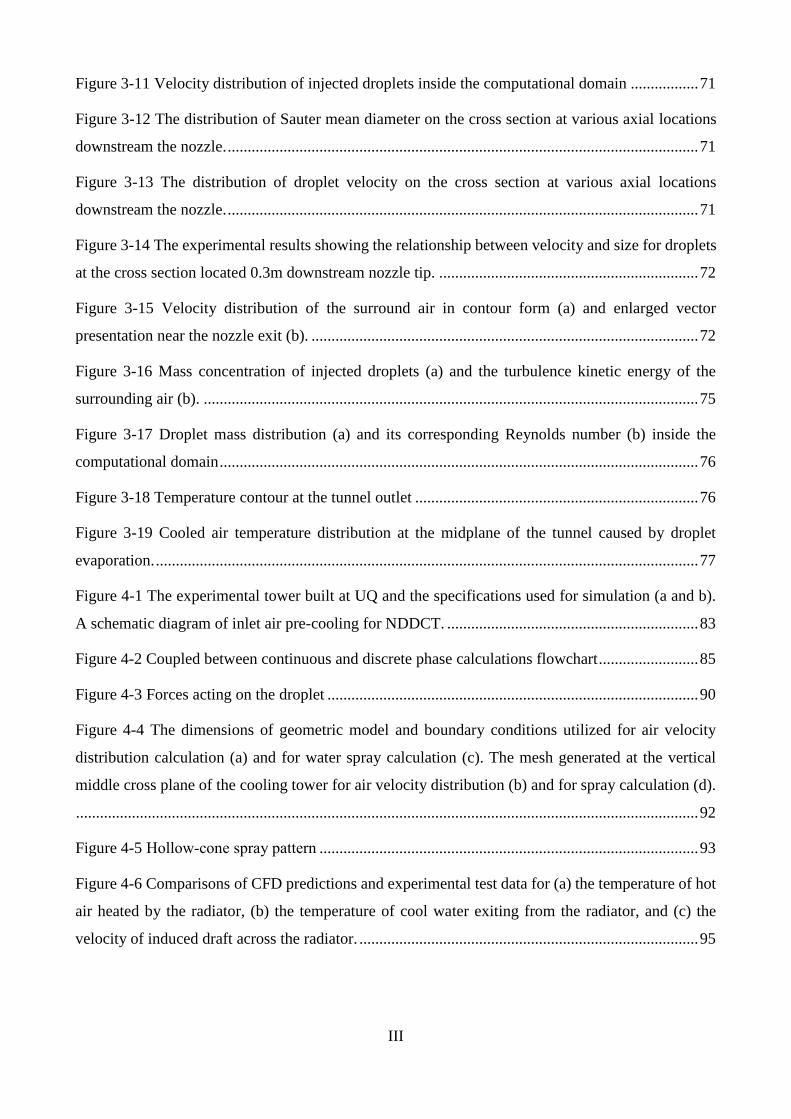
Figure 4-8 The temperature contour of vertical middle cross section of 30-degree NDDCT (a); the air
streamline and gauge pressure distribution of vertical middle cross section of tower (b); velocity
vector distribution of the vertical middle cross section of NDDCT (c); the consistency of the velocity
across the radiator between the calculated results from tower simulation and the interpolated results
for spray cooling modelling (d); the green square denotes the results calculated by whole tower
simulation, and the red asterisk denotes the results obtained from the interpolated velocity profile
used for spray simulation. The consistency of the velocity at the tower inlet part between the
calculated results from tower simulation and the interpolated results for spray cooling modelling (e).
............................................................................................................................................................ 98
Figure 4-9 The consistent distributions of velocity components at tower inlet part. (a), (b) and (c)
show the velocity components Vx, Vy and Vz, respectively. The green square denotes the results
calculated by whole tower simulation, and the red asterisk denotes the results obtained from the
interpolated velocity profile used for spray simulation. The magnitude of the total velocity is shown
in Figure 4-5(e). ............................................................................................................................... 100
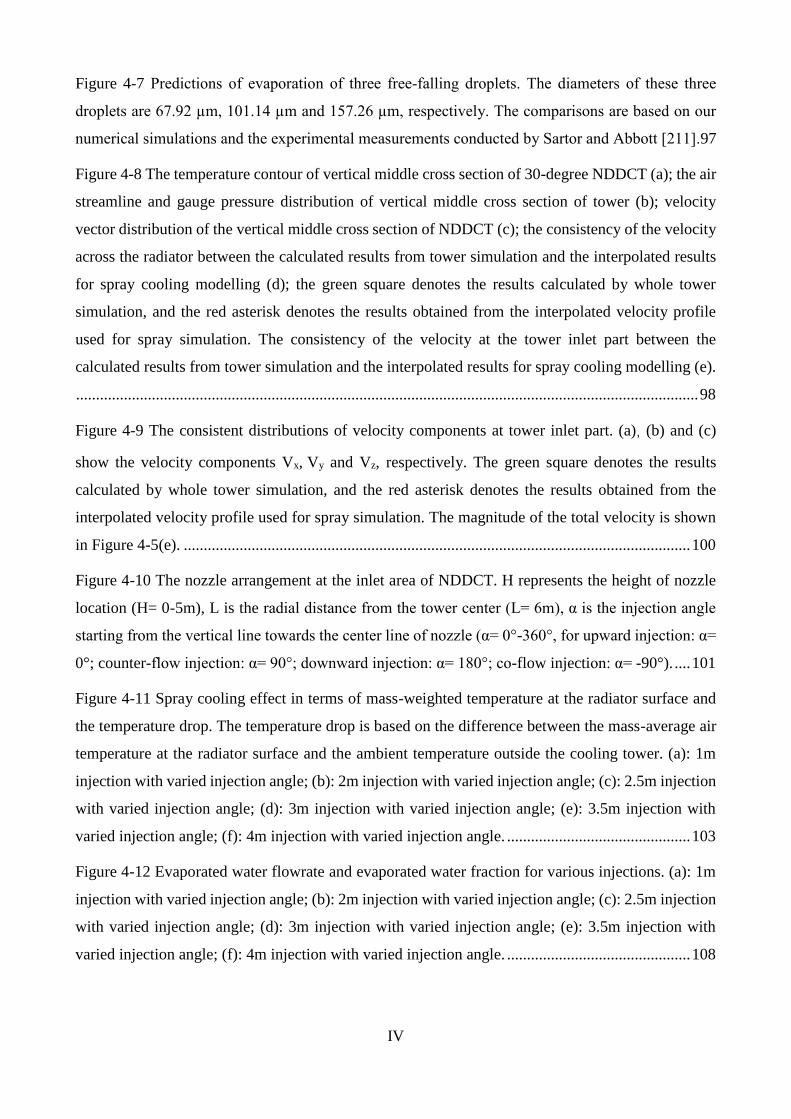
Figure 4-10 The nozzle arrangement at the inlet area of NDDCT. H represents the height of nozzle
location (H= 0-5m), L is the radial distance from the tower center (L= 6m), α is the injection angle
starting from the vertical line towards the center line of nozzle (α= 0°-360°, for upward injection: α=
0°; counter-flow injection: α= 90°; downward injection: α= 180°; co-flow injection: α= -90°). .... 101
Figure 4-11 Spray cooling effect in terms of mass-weighted temperature at the radiator surface and
the temperature drop. The temperature drop is based on the difference between the mass-average air
temperature at the radiator surface and the ambient temperature outside the cooling tower. (a): 1m
injection with varied injection angle; (b): 2m injection with varied injection angle; (c): 2.5m injection
with varied injection angle; (d): 3m injection with varied injection angle; (e): 3.5m injection with
varied injection angle; (f): 4m injection with varied injection angle. .............................................. 103
Figure 4-12 Evaporated water flowrate and evaporated water fraction for various injections. (a): 1m
injection with varied injection angle; (b): 2m injection with varied injection angle; (c): 2.5m injection
with varied injection angle; (d): 3m injection with varied injection angle; (e): 3.5m injection with
varied injection angle; (f): 4m injection with varied injection angle. .............................................. 108
V
Figure 4-13 Droplet trajectories om terms of the residence time (unit: second) for three different
injections. (a): Injection with a height of 2m and angle of 20°; (b): Injection with a height of 3m and
angle of 60°; (c) Injection with a height of 4m and angle of 90°. .................................................... 109
Figure 4-14 Full evaporation areas at different heights for a hollow cone nozzle. .......................... 110
Figure 4-15 Temperature distribution at the vertically middle plane and heat exchanger surface for
different injections. (a) Full-evaporation cases of varied injection angles at H= 2m; (b) full-
evaporation cases of varied injection angles at H= 2.5m, 3m and 4m; (c) full-evaporation cases of
varied injection angles at H= 3.5m. ................................................................................................. 111
Figure 5-1 The experimental tower built at UQ and the specifications used for simulation (a). A
schematic diagram of inlet air pre-cooling for NDDCT (b). ........................................................... 117
Figure 5-2 The dimensions of geometric model and boundary conditions utilized for air velocity
distribution calculation (a) and for water spray calculation (c). The mesh generated at the vertical
middle cross plane of the cooling tower for air velocity distribution (b) and for spray calculation (d).
.......................................................................................................................................................... 123
Figure 5-3 A comparisons of results from CFD predictions and experimental work. (a) The
temperature of ambient air at the radiator surface; (b) the temperature of cool water exiting from the
radiator; (c) the velocity of induced draft across the radiator. ......................................................... 127
Figure 5-4 Simulation results of evaporation of free-falling droplets compared with experimental
results. The diameters of these three droplets are 67.92 µm, 101.14 µm and 157.26 µm, respectively.
The comparisons are based on our numerical simulations and the experimental measurements
conducted by Sartor and Abbott [29]. .............................................................................................. 127
Figure 5-5 The temperature contour of vertical middle cross section of 30-degree NDDCT (a); the air
streamline and gauge pressure distribution of vertical middle cross section of tower (b); velocity
vector distribution of the vertical middle cross section of NDDCT (c); the comparison between the
velocity from tower calculation and the interpolated velocity for spray cooling calculation (d). ... 129
Figure 5-6 The comparison of velocity directions at tower inlet part. (a),(b) and (c) show the velocity
components Vx, Vy and Vz, respectively. The green square represents the results calculated by whole
tower simulation, and the red asterisk represents the results obtained from the interpolated velocity
profile used for spray simulation. The magnitude of the total velocity is shown in Figure 5-5(d). 130
Figure 5-7 The structural information of LNN1.5 ........................................................................... 131
Figure 5-8 The diameter distribution and Rosin–Rammler distribution fitting for LNN1.5. .......... 133
VI
Figure 5-9 (a): The nozzle arrangement at the inlet area of NDDCT. H represents the height of nozzle
location (H= 0-5m), L is the extend length from the tower periphery (L=0-3m). (b): The enlarged
diagram of the inlet part of cooling tower. The heat exchanger surface is divided into three parts:
central part (A1), middle part (A2) and outer part (A3). ................................................................. 133
Figure 5-10 Temperature distribution at heat exchanger surface and the vertically middle plane for
upward injections with the same extend length L=2m but different nozzle height H. The green
triangular represents the employed spray nozzle. (a) Injection case with H= 3m; (b) Injection case
with H= 4m; (c) Injection case with H= 4.5m; (d) Injection case with H= 4.8m. ........................... 136
Figure 5-11 (a): Spray cooling effect in terms of mass-weighted temperature at the heat exchanger
surface and the temperature drop relative to the ambient temperature. (b): Evaporated water flowrate
and evaporated water fraction for various injections. ...................................................................... 136
Figure 5-12 Temperature distribution at heat exchanger surface and the vertically middle plane for
upward injections with the same nozzle height H=4.5m but different extend length L. (a) Injection
case with L= 0.5m; (b) Injection case with L= 1m; (c) Injection case with L= 1.5m; (d) Injection case
with L= 2m. ...................................................................................................................................... 137
Figure 5-13 (a): Spray cooling effect in terms of mass-weighted temperature at the heat exchanger
surface and the temperature drop relative to the ambient temperature. (b): Evaporated water flowrate
and evaporated water fraction for various injections. ...................................................................... 138
Figure 5-14 Temperature distribution at heat exchanger surface and the vertically middle plane for
various injections with the same nozzle height H=4.8m, extended length L=1m but different injection
directions. (a) Upward injection; (b) Downward injection; (c) Co-flow injection; (d) Counter-flow
injection. ........................................................................................................................................... 139
Figure 5-15 (a): Spray cooling effect in terms of mass-weighted temperature at the heat exchanger
surface and the temperature drop relative to the ambient temperature. (b): Evaporated water flowrate
and evaporated water fraction for various injections. ...................................................................... 140
Figure 5-16 The influence of spray wall cover on the temperature distribution at heat exchanger
surface. The nozzle was placed at same radial distance with L= 2m with counter-flow injection.
Temperature distributions of injections without wall cover at H= 3m (A), H=4m (B), H=4.5m (C) and
H=4.8m (D). Temperature distributions of injections with wall cover at H= 3m (a), H=4m (b),
H=4.5m (c) and H=4.8m (d). ........................................................................................................... 142
VII
Figure 5-17 (a): Spray cooling effect in terms of mass-weighted temperature at the heat exchanger
surface and the temperature drop relative to the ambient temperature. (b): Evaporated water flowrate
and evaporated water fraction for various injections. ...................................................................... 142
Figure 5-18 Velocity distribution of the vertically middle plane for the cooling tower without wall
cover (A), and with wall cover (C). The enlarged velocity field (inside the blue rectangle) for the
tower without wall cover (B) and with tower wall (D). ................................................................... 144
Figure 6-1 The experimental tower built at UQ and the specifications used for simulation (a and b).
A schematic diagram of inlet air pre-cooling for NDDCT (c). ........................................................ 151
Figure 6-2 Coupled calculation between continuous and discrete phase calculations flowchart .... 153
Figure 6-3 Forces acting on the droplet ........................................................................................... 157
Figure 6-4 The dimensions of geometric model and boundary conditions utilized for air velocity
distribution calculation (a) and for water spray calculation (c). The mesh generated at the vertical
middle cross plane of the cooling tower for air velocity distribution (b) and for spray calculation (d).
.......................................................................................................................................................... 159
Figure 6-5 Velocity distribution of the vertically middle plane for the cooling tower without wall
cover (A), and with wall cover (C). The enlarged velocity field (inside the blue rectangle) for the
tower without cover wall (B) and with tower wall (D). ................................................................... 161
Figure 6-6 Hollow-cone spray pattern ............................................................................................. 162
Figure 6-7 Hot water control system................................................................................................ 164
Figure 6-8 Test sensors distribution ................................................................................................. 165
Figure 6-9 Comparisons of CFD predictions and experimental test data for (a) the temperature of hot
air heated by the radiator, (b) the temperature of cool water exiting from the radiator, and (c) the
velocity of induced draft across the radiator . .................................................................................. 167
Figure 6-10 Predictions of evaporation of three free-falling droplets. The diameters of these three
droplets are 67.92 µm, 101.14 µm and 157.26 µm, respectively. The comparisons are based on our
numerical simulations and the experimental measurements conducted by Sartor and Abbott [211].
.......................................................................................................................................................... 168
Figure 6-11 The diameter distribution and Rosin–Rammler distribution fitting for LNN1.5. ........ 169
VIII
Figure 6-12 The nozzle arrangement at the inlet area of NDDCT. H represents the height of nozzle
location (H= 0-5m), R is the radial distance between nozzle location and the tower center. Ds is the
distance between two nozzles in the X direction. ............................................................................ 170
Figure 6-13 The temperature contour of vertical middle cross section of 30-degree NDDCT (a); the
air streamline and gauge pressure distribution of vertical middle cross section of tower (b); velocity
vector distribution of the vertical middle cross section of NDDCT (c); the consistency of the velocity
across the radiator between the calculated results from tower simulation and the interpolated results
for spray cooling modelling (d); the green square denotes the results calculated by whole tower
simulation, and the red asterisk denotes the results obtained from the interpolated velocity profile
used for spray simulation. The consistency of the velocity at the tower inlet part between the
calculated results from tower simulation and the interpolated results for spray cooling modelling (e).
.......................................................................................................................................................... 173
Figure 6-14 The consistent distributions of velocity components at tower inlet part. (a), (b) and (c)
show the velocity components Vx, Vy and Vz, respectively. The green square denotes the results
calculated by whole tower simulation, and the red asterisk denotes the results obtained from the
interpolated velocity profile used for spray simulation. The magnitude of the total velocity is shown
in Figure 6-13(e). ............................................................................................................................. 174
Figure 6-15 Temperature distributions for injections generated by two LNN1.5 with different
separation distances (Ds=0.4m, 1m, 1.6m, 2.4m, 3m and 3.6m). The top figures show the temperature
profiles at heat exchanger surface and the bottom figures show the temperature profile of vertically
cut plane aligned with the nozzle of positive X position. Both nozzles were placed at the height of
4.6m and the radius of 8.5m, sharing the positive Z-axis injection direction. The plane with teal color
represents the middle section plane for the whole geometry. .......................................................... 176
Figure 6-16 The mass-weighted average temperatures at the surface of heat exchanger and the
corresponding temperature drops relative to the ambient air for two LNN1.5 injections with various
separation distances. (b) The evaporated water flowrates produced by two LNN1.5 with various
separation distances and the corresponding evaporated water fractions. ......................................... 176
Figure 6-17 Temperature distributions generated by different spray cooling systems consisted of
multi-nozzles (N1: one LNN1.5; N2: two LNN1.5; N3: three LNN1.5; N4: four LNN1.5; N5: five
LNN1.5). The top figures show the temperature profiles at the surface of heat exchanger. The bottom
figures show the temperature profiles at the vertically cut plane aligned with nozzles arranged at
varied X positions. The transparent plane is the middle cross-section plane of the geometry, helping
to identify the relative locations of the other planes with temperature distribution. ....................... 179
IX
Figure 6-18 The arrangement of spray nozzles for the case N5. (a) is the overview of the nozzle
arrangement; (b) is the front view (in X direction); (c) is the top view (in Y direction). ................ 180
Figure 6-19 (a) The temperature drops relative to the ambient air at the surface of heat and the cooling
efficiency for spray cooling system consisted of multi-nozzles. (b) The evaporated water flowrates
and the corresponding evaporated water fractions for spray cooling system consisted of multi-nozzles.
.......................................................................................................................................................... 181
Figure 6-20 The positive influences of flowrate ratio (me/ma) on the cooling efficiency and spray
cover ratio. The flowrate ratio is calculated using the evaporated water flowrate divided by the air
flow. ................................................................................................................................................. 181
Figure 6-21 Cooling efficiency comparison by the CFD simulation and correlation prediction. ... 182
Figure 7-1 Parabolic trough solar plant with two-tank molten salt storage system [233]. .............. 188
Figure 7-2 Configuration of NDDCT for experimental tests. The dimension is millimetre. .......... 189
Figure 7-3 The layout (a) and numbering (b) of 18 heat exchanger bundles, the dimension unit is
millimetre. ........................................................................................................................................ 191
Figure 7-4 Heat exchanger bundle configuration (a) and details of counter flow circuitry (b). ..... 191
Figure 7-5 Hot water supply and control system ............................................................................. 193
Figure 7-6 Schematic diagram of the spray cooling system for NDDCT ........................................ 194
Figure 7-7 Water supply system for spray nozzles .......................................................................... 195
Figure 7-8 Spray section at the inlet part of cooling tower (a), the detailed arrangement of spray
nozzles (b) and the image of spray in operation (c). ........................................................................ 196
Figure 7-9 The placement of spray nozzles. The front view (a) and the top view (b). .................... 197
Figure 7-10 The overview of the spray cooling zone at the tower inlet and the front view of the
installed temperature and humidity sensors. .................................................................................... 198
Figure 7-11 Top view of installed temperature and humidity sensors. (a) The location of installed
sensors, the unit is meter. (b) The label of each sensor, where T represents pre-installed sensors for
measurements at three different heights in the tower, and S represents the newly installed sensors for
measurements in the spray cooling region only. .............................................................................. 199
Figure 7-12 The start-up process of the experimental cooling tower .............................................. 200
Figure 7-13 Cooling tower performance under various ambient conditions. .................................. 200
X
Figure 7-14 Temperature measurements at different levels of cooling tower (A1,B1,C1) and its
instantaneous distributions (A2,B2,C2) at the specified time, as indicated by the dashed bold line in
figures A1, B1 and C1. The contour was constructed based on the same extrapolation method in [235].
.......................................................................................................................................................... 202
Figure 7-15 Schematic illustration of the existence of vortex. ........................................................ 203
Figure 7-16 Cooling tower performances for case 1- case 5. The left figures show the nozzle
configuration for each case. ............................................................................................................. 207
Figure 7-17 Cooling capacity recovery for spray-assisted cooling tower ....................................... 208
Figure 7-18 Grashof number for different injection cases ............................................................... 208
Figure 7-19 Temperature and humidity measurement at the spray zone. ........................................ 211
Figure 7-20 Temperature distribution at the tower inlet level for the case without spray cooling (A)
and spray-assisted case (B). ............................................................................................................. 211

XI
List of Tables
Table 2-1 Summary of operating CSP plants using dry cooling technology ..................................... 12
Table 2-2 Different models for cooling tower simulation ................................................................. 18
Table 2-3 Studies on the influence of crosswind on NDDCT and improvement proposals .............. 19
Table 2-4 The comparison of different spray patterns ....................................................................... 27
Table 2-5 Influencing parameters of droplet size for hydraulic nozzle ............................................. 28
Table 2-6 Mean droplet diameters for specific applications [65]. ..................................................... 28
Table 2-7 The progress on the improvement of Merkel model. ........................................................ 39
Table 3-1 Grid sensitivity analysis ..................................................................................................... 58
Table 3-2 Operating conditions for the discrete and continuous phases ............................................ 61
Table 3-3 Boundary conditions for simulation model ....................................................................... 61
Table 3-4 Optical setup and run settings of the PDPA system .......................................................... 64
Table 3-5 Various mean diameters and their potential applications [183]. The values of p and q are
defined in Equation (3-34). ................................................................................................................ 68
Table 4-1 Continuous phase turbulence model constants .................................................................. 87
Table 4-2 Morsi and Alexander drag coefficient correlation constants ............................................. 91
Table 4-3 Grid independence test for velocity of NDDCT ................................................................ 93
Table 4-4 Grid independence test for spray cooling .......................................................................... 93
Table 4-5 Operating conditions of the air and the water droplets ...................................................... 96
Table 4-6 Test conditions used for data input for model validation .................................................. 97
Table 5-1 Grid independence test for velocity of NDDCT .............................................................. 124
Table 5-2 Grid independence test for spray cooling ........................................................................ 124
Table 5-3 Operating conditions of the air and the water sprays ...................................................... 126
Table 5-4 Test conditions used for data input in model validation .................................................. 126
Table 5-5 Nozzle specifications for LNN1.5 ................................................................................... 132
Table 6-1 Morsi and Alexander drag coefficient correlation constants ........................................... 158
Table 6-2 Grid independence test for velocity of NDDCT .............................................................. 160
XII
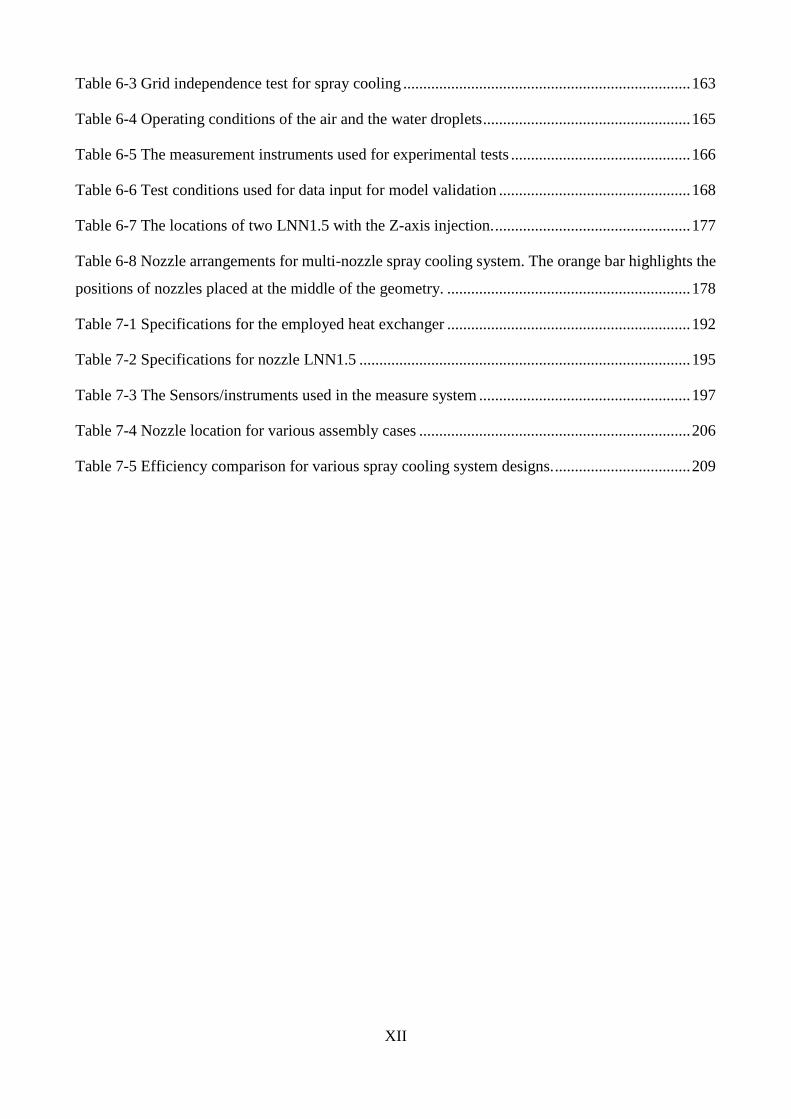
Table 6-3 Grid independence test for spray cooling ........................................................................ 163
Table 6-4 Operating conditions of the air and the water droplets .................................................... 165
Table 6-5 The measurement instruments used for experimental tests ............................................. 166
Table 6-6 Test conditions used for data input for model validation ................................................ 168
Table 6-7 The locations of two LNN1.5 with the Z-axis injection. ................................................. 177
Table 6-8 Nozzle arrangements for multi-nozzle spray cooling system. The orange bar highlights the
positions of nozzles placed at the middle of the geometry. ............................................................. 178
Table 7-1 Specifications for the employed heat exchanger ............................................................. 192
Table 7-2 Specifications for nozzle LNN1.5 ................................................................................... 195
Table 7-3 The Sensors/instruments used in the measure system ..................................................... 197
Table 7-4 Nozzle location for various assembly cases .................................................................... 206
Table 7-5 Efficiency comparison for various spray cooling system designs. .................................. 209
XIII
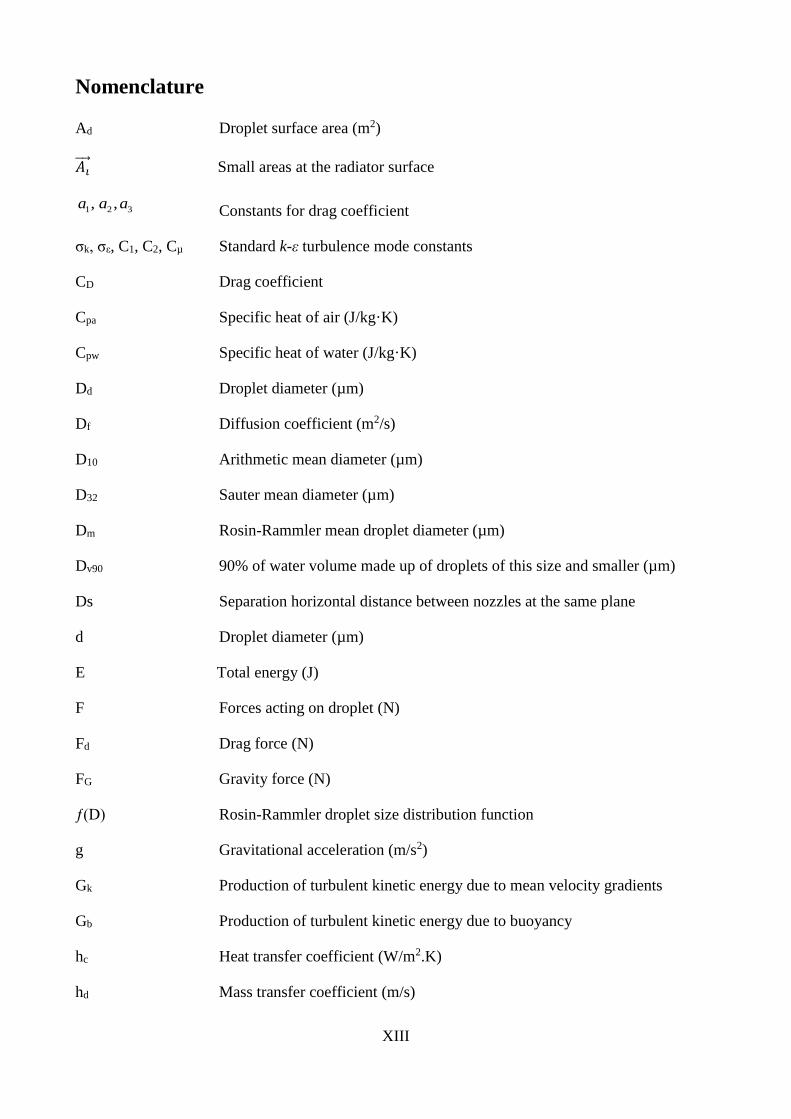
Nomenclature
Ad Droplet surface area (m2)
𝐴𝑖 Small areas at the radiator surface
1 2 3, ,a a a Constants for drag coefficient
σk, σε, C1, C2, Cµ Standard k-ε turbulence mode constants
CD Drag coefficient
Cpa Specific heat of air (J/kg·K)
Cpw Specific heat of water (J/kg·K)
Dd Droplet diameter (µm)
Df Diffusion coefficient (m2/s)
D10 Arithmetic mean diameter (µm)
D32 Sauter mean diameter (µm)
Dm Rosin-Rammler mean droplet diameter (µm)
Dv90 90% of water volume made up of droplets of this size and smaller (µm)
Ds Separation horizontal distance between nozzles at the same plane
d Droplet diameter (µm)
E Total energy (J)
F Forces acting on droplet (N)
Fd Drag force (N)
FG Gravity force (N)
ƒ(D) Rosin-Rammler droplet size distribution function
g Gravitational acceleration (m/s2)
Gk Production of turbulent kinetic energy due to mean velocity gradients
Gb Production of turbulent kinetic energy due to buoyancy
hc Heat transfer coefficient (W/m2.K)
hd Mass transfer coefficient (m/s)
XIV
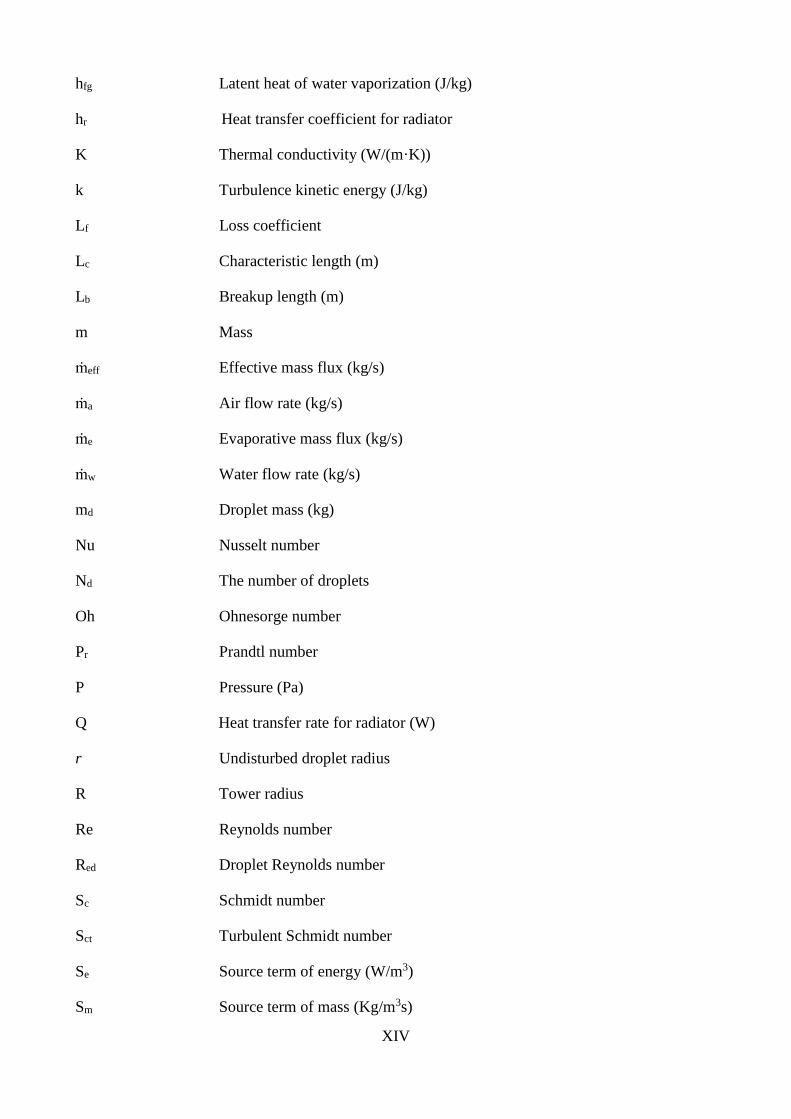
hfg Latent heat of water vaporization (J/kg)
hr Heat transfer coefficient for radiator
K Thermal conductivity (W/(m·K))
k Turbulence kinetic energy (J/kg)
Lf Loss coefficient
Lc Characteristic length (m)
Lb Breakup length (m)
m Mass
ṁeff Effective mass flux (kg/s)
ṁa Air flow rate (kg/s)
ṁe Evaporative mass flux (kg/s)
ṁw Water flow rate (kg/s)
md Droplet mass (kg)
Nu Nusselt number
Nd The number of droplets
Oh Ohnesorge number
Pr Prandtl number
P Pressure (Pa)
Q Heat transfer rate for radiator (W)
r Undisturbed droplet radius
R Tower radius
Re Reynolds number
Red Droplet Reynolds number
Sc Schmidt number
Sct Turbulent Schmidt number
Se Source term of energy (W/m3)
Sm Source term of mass (Kg/m3s)
XV
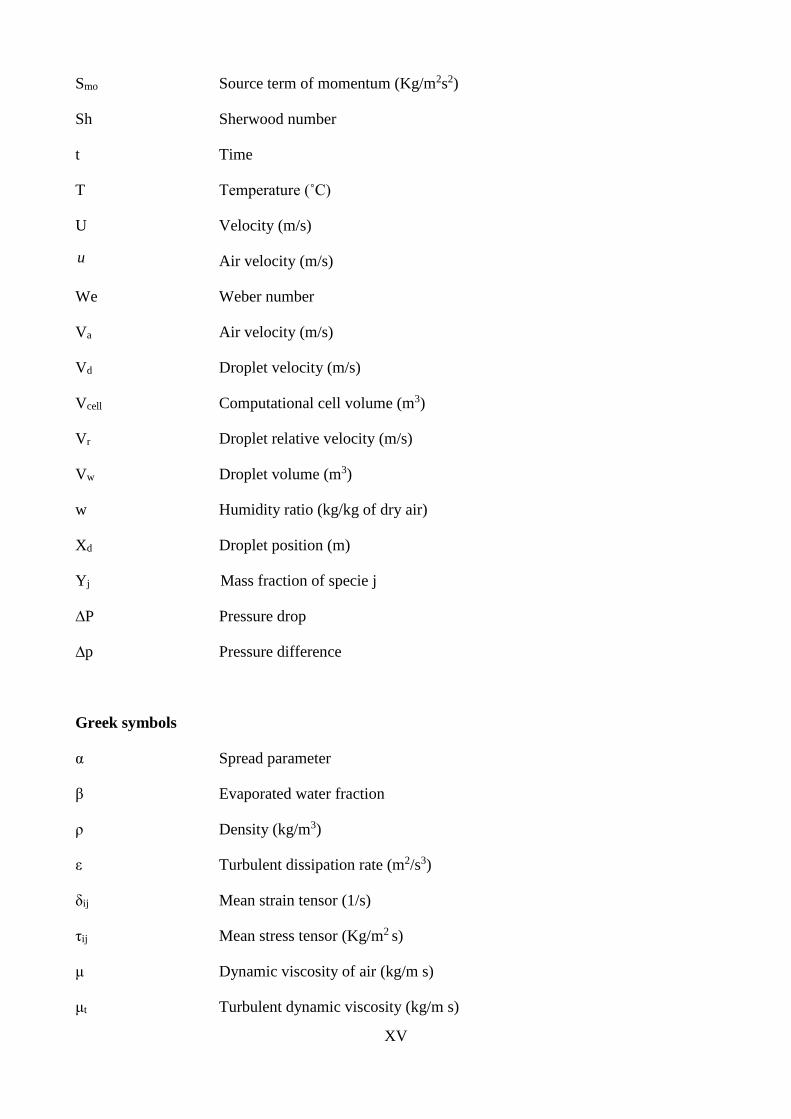
Smo Source term of momentum (Kg/m2s2)
Sh Sherwood number
t Time
T Temperature (˚C)
U Velocity (m/s)
u Air velocity (m/s)
We Weber number
Va Air velocity (m/s)
Vd Droplet velocity (m/s)
Vcell Computational cell volume (m3)
Vr Droplet relative velocity (m/s)
Vw Droplet volume (m3)
w Humidity ratio (kg/kg of dry air)
Xd Droplet position (m)
Yj Mass fraction of specie j
∆P Pressure drop
∆p Pressure difference
Greek symbols
α Spread parameter
β Evaporated water fraction
ρ Density (kg/m3)
ε Turbulent dissipation rate (m2/s3)
δij Mean strain tensor (1/s)
τij Mean stress tensor (Kg/m2 s)
μ Dynamic viscosity of air (kg/m s)
μt Turbulent dynamic viscosity (kg/m s)

XVI
υ Kinetic viscosity (m2/ s)
λ Wave number
Ω Maximum growth rate
𝜎 Droplet surface tension (N/m)
𝜂0 Initial wave amplitude
𝜂𝑏 Arbitrary surface displacement
Φ Viscous dissipation (W/m3)
τc Droplet relaxation time (s)
ηc Cooling efficiency
ψ Spray cover percentage
Λ Air temperature decreasing factor
Subscripts
a Air
ab Absorption
amb Ambient
bot Bottom measurement level
d Droplet
ctc Heat exchanger compact
cte Heat exchanger expansion
cto Tower outlet
e Evaporation
eff Effective
int Droplet-air interface
i,j,k Cartesian coordinate Directions
l Local value
md Middle
XVII
ns Non-spray
re Release
rd Radiator
s Spray
sat Saturation
t Time
T Tower
ts Tower support
top Top
u Over all
v Vapor
w Water
wb Wet-bulb
0 Reference value
1,2,3,4,5 Different location of cooling tower
Abbreviations
CFD Computational Fluid Dynamics
CSP Concentrating/Concentrated Solar Power
IECM Integrated Environmental Control Model
NDDCT Natural Draft Dry Cooling Tower
UQ University of Queensland
PDPA Phase Doppler Particle Analyzer
RH Relative humidity
VFD Variable frequency drive
3D 3 Dimensional

1
Chapter 1 Introduction
1.1 Research Background
Energy is the cornerstone for economic development and prosperity of any country. It has large
demand proportional to the population and economic growth of a country and becomes the primary
concern of all countries as it influences the economic development relates social challenges like
poverty alleviation, global environmental change and food security [1]. A country’s growth and way
of life is underpinned by access to affordable and sustainable energy sources. The power sector led
by the fossil fuels causes serious concerns such as the impacts on regional climatic conditions,
environmental degradation, depletion of fuel resources and the energy security.
In recent decades, the global power supply undergoes a major transition, moving away from a
century-old model of fossil fuels due to their fast depletion and detrimental environmental problems.
Luckily, wind and solar are on track to become promising alternative energy sources, providing new
opportunities for decarbonisation. Despite of the growing green renewables, the power sector still
accounts for 40% of energy-related greenhouse gas emissions. Hence it is imperative to decarbonise
the power sector by shifting to renewable energy.
The abundant and inexhaustible solar energy offers a clean and climate-friendly energy source to
mankind. Australia has the highest average solar radiation per square metre than the rest of the world.
Its annual solar radiation is approximately 58 million petajoules (PJ), approximately 10 000 times
Australia’s annual energy consumption. Solar energy use in Australia is projected to increase by 5.9
per cent per year to 24 PJ in 2030. The Australian Government has established a Solar Flagships
Program by investing $1.5 billion to support the construction and demonstration of solar power
stations in Australia [2]. A major technology for electricity generation is concentrating solar power
(CSP). The incident solar irradiation is concentrated by mirrors and lenses onto a small area to heat
the working fluid. Then the electric power is generated through an efficient utilization of
thermodynamic cycle [3]. When compared with other solar power technologies like solar photovoltaic,
this technology has the advantage of providing electricity even in the absence of the Sun.
In thermal power plants, cooling towers are built as the heat rejection device to discharge the waste
in the power generation process and their performance have great impact on the efficiency of
electricity generation [4]. The cooling system or the circulating water system continuously supply
cooling water to the main condenser for the purpose of removing waste heat rejected by the turbine
and other auxiliary components used for power generation. This thermal energy is rejected to the
atmosphere via cooling towers. As a special type of heat exchanger, cooling towers facilitate the
2
contact between water and air, lowering the temperature of the hot water that’s being circulated
throughout the cooling tower.
Generally, wet and dry cooling towers are commonly used in most power plants. Wet cooling towers
operate on the principle of evaporative cooling, where hot water is distributed into the air flow by a
spray nozzles and exchange heat with the ambient air. The energy needed for hot water evaporation
is taken from the remaining mass of water, thus reducing water temperature. and becomes vapor into
air, which causes a lowering of the temperature of the air and the water too. The evaporation of water
leads to substantial water loss so the fresh water has to supplemented to maintain the cooling capacity.
However, in areas with strong solar irradiations, the typical dry weather climate means that water
resources are quite limited, so wet cooling towers is not a good choice as the cost is extremely high
by transporting water from other area.
Dry cooling towers unties heat exchangers to for convective heat transfer and separate the working
fluid from ambient air, such as in a tube to air heat exchanger. Since water evaporation is not involved,
minimal makeup water is required. Natural draught cooling towers produce buoyancy effect via a
tall hyperboloid chimney. Natural draught cooling towers are normally built in hyperbolic shape not
only because of its structural strength and because this hyperboloid shape also aids in accelerating
the upward convective air flow, improving cooling efficiency. In this cooling tower the hot cooling
water (e.g. 50°C) from the condenser is pumped to circulate through the employed heat exchangers.
Hot water (e.g. 50°C) gives up its heat to the air and gets cooled (e.g. 28°C). Warm, moist air naturally
rises due to the density differential compared to the dry, cooler outside air. Warm moist air is less
dense than drier air at the same pressure. This moist air buoyancy produces an upwards current of air
through the hyperboloid tower.
Most CSP plants proposed for Australian regional community have smaller capacities and are likely
to be located in areas with strong direct normal irradiance (DNI), but short of fresh water supplies.
For such plants, natural draft dry cooling tower (NDDCT) technology which features no water losses
and virtually no parasitic power consumption offers a cost effective option [5]. The appeal of dry
cooling technology lies in a small water consumption, flexible plant site location and no health issues
caused by plumes. The heat discharge process in the dry cooling towers is by the aid of the air-cooled
heat exchanger or air cooler. The extended surfaces or finned tubes offer a large contact area between
the ambient air and the hot water. Moreover, this drying cooling technology is quite attractive for a
promising future CSP plants using supercritical CO2 (sCO2) Brayton cycle for power generation.
As a working fluid, the abundant, inexpensive, non-combustible and non-toxic carbon dioxide
exhibits favourite thermo-dynamic properties and can withstand very high temperatures [6]. The
3
temperature and pressure of CO2 at the critical point are relatively moderate compared to other
working fluids [6]. The power cycles has higher system efficiency than other energy conversion
technologies when at operating temperatures above 450°C [7]. More importantly, supercritical CO2
is ideally suited for establishing natural circulation flow as large density variations can be achieved
for only small elevation in temperature. This allows natural circulation to occur earlier in the
emergency transient, provide increased flow throughout. sCO2 can be well matched with air cooling
in terms of the similar tower costs between dry-cooled sCO2 and the wet-cooled steam.
Furthermore, the large density of sCO2 power cycles reduces turbomachinery size, enabling more
compact arrangements than other technologies. The integration of CSP with sCO2 closed Brayton
cycle (sCO2-CBC) shows enormous advantages over the traditional steam Rankine cycle (SRC),
organic Rankine cycle (ORC), or gas turbine systems for high turbine inlet temperature (TIT)
operation (>600 °C) [8]. For example, at a TIT of 600 °C and 20 MP maximum pressure under wet
cooling conditions, the thermal efficiency of sCO2-CBC exceeds that of the combined Brayton-ORC
(31–38% depending on the working fluid of bottoming cycle) and also the conventional SRC (46%).
In NDDCT, the driving force for induced air flows is the air density difference between the inside
and outside of the tower. The “stack effect” forms a stable airflow through the heat exchangers located
inside the tower, resulting in the removal of heat from the heat exchangers. Natural circulation is
driven by gravitational head resulting from elevation and density differences in a closed loop. Since
air density highly depends on its temperature, so air temperature is the key parameter to determine
the performance of cooling towers. High ambient temperature decreases the cooling efficiency of
NDDCT and is regarded as detrimental to cooling tower performance. This is particularly true in the
hot seasons like summer, when power demands are high but power supply is low because the reduced
performance of dry cooling towers negatively affects the whole power generation cycle, causing
power loss as much as 25% [9].
The substantial loss of efficiency by cooling tower in hot summer days has limited the development
and application of NDDCT. In order to build a dry cooling tower for CSP plants to reduce the cost of
solar energy, the deteriorated performance of cooling towers need to be solved in a cost-effective way.
Here we proposed a solution by introducing a spray cooling system to boost the performance of
NDDCT in hot seasons. The spray-assisted technology uses a small quantity of water to cool the inlet
air. With the virtue of simplicity, low capital cost, and ease for operation and maintenance, it is
expected to be a promising solution that deserves systematic investigations. This thesis mainly
focuses on the design and optimization of spray cooling system to improve the cooling performance
of NDDCT using both numerical and experimental approaches. Fundamental understanding of the
4
spray cooling process and the evaluation of the effect of spray characteristics parameters on spray
cooling performance are revealed during the spray cooling system design and optimisation process.
1.2 Research Objective:
The ultimate goal of this PhD research is to enhance the performance of NDDCT during high ambient
temperature periods by exploiting the spray cooling system. To reach this goal, detailed studies on
droplet evaporation, droplet transport and cooling effectiveness are made to provide foundations for
spray cooling system design. This research area has not been explored in the past, in particular,
concerning the multiple nozzle arrangement and experimental realization of spray cooling system on
real cooling towers. The aim of the current work is the design, optimisation and evaluation of spray
cooling systems consisting of multiple spray nozzles for inlet air pre-cooling in natural draft dry
cooling towers during high ambient temperature periods. The outcomes will deepen our
understandings of the spray cooling process and the interaction between polydisperse sprays and
turbulent air flows at various conditions. Research issues are the prevention of incomplete
evaporation of droplets while preserving the efficiency of the system and using small amount of water.
The primary objectives of this research include:
1) Deepen the understanding of the physics and engineering aspects of the spray cooling process.
Conduct both numerical and experimental studies to explore the complex heat, momentum
and mass transfer occurred between inlet air characteristics (temperature, velocity and relative
humidity) and spray characteristics (droplet size and velocity).
2) Build a three-dimensional numerical model that can represent the structure and characteristic
of spray produced by pressure-swirl atomizers. The model, validated against experimental
measurements, is expected to be able to predict the evaporation and transport behaviours of
the droplets injected from spray nozzles.
3) Identify important factors of single nozzle placement (injection location, direction and angle)
that can influence the cooling results caused by spray evaporations.
4) Explore the arrangement of multiple nozzles in spray cooling system design and optimization
to enhance the heat removal capacity of NDDCT.
5) Conduct experimental tests on full-scale towers with installed spray cooling system. The
collected measurement data can be used to prove the effectiveness of the proposed spray
cooling system and evaluate the performance of different design strategies.
6) Establish experimental database for spray system evaluation and engineering design.
5
1.3 Thesis Structure
• Chapter 1 presents research background, research objective and structures of this thesis;
• Chapter 2 is the literature review on the existing research related to this thesis. In this chapter,
basic introduction of the solar thermal power plants, the summary of numerical study and
experimental investigations of natural draft cooling tower, the descriptions of spray nozzle
selection, spray characterization as well as the heat and mass transfer in spray evaporation
process are summarized. More recent studies on the evaporative cooling used in the hot
ambient conditions are reviewed. This chapter is based on a peer-reviewed journal paper
published in Renewable and Sustainable Energy Review.
• Chapter 3 includes both the numerical and experimental studies on the macroscopic structure
and characteristics of sprays generated by a pressure swirl atomizer. The main contribution is
a 3D model based on the Eulerian-Lagrangian scheme that are capable of predicting the
droplet dynamics within the spray. The model predictions are consistent with the spatial
variation of the droplet size and velocity recorded by the Phase Doppler Particle Analyser
(PDPA) from wind tunnel tests. The robust model is quite useful in predicting the structures
and characteristics of co-flow sprays produced by pressure-swirl atomizers. This chapter is
based on a peer-reviewed journal paper published in Energy.
• Chapter 4 uses CFD tools to identify the influence of injection direction on the cooling effect
based on a single spray. It has been shown that adjusting injection direction can accelerate
evaporation process and achieve an optimal cooling. This is attributed to the influence of
injection angle on the momentum exchange between ambient air and sprayed water droplets.
Since the pre-cooling performance heavily depends on the injection direction of nozzle, this
study can be used as guidelines to arrange spray nozzles. This chapter is based on the journal
paper published in International Journal of Heat and Mass Transfer.
• Chapter 5 explores various real-case sprays with wide droplet size distributions to evaluate
the resultant cooling effect. A series of sprays from nozzle placed at different vertical height,
radial distance and injection direction have been numerically studied. Wall cover is proposed
to change the flow field inside the tower and allows the hot air neighboring the tower wall to
be cooled successfully. As to injection direction influence, the upward and co-flow injections
have poorer performance than the downward and counter-flow injections. Furthermore, sprays
from nozzles with large extended length enjoy better evaporation performance due to the
6
longer residence time. This chapter is based on a peer-reviewed journal paper published in
Applied Thermal Engineering.
• Chapter 6 studies a spray cooling system consists of five real nozzle LNN1.5. With careful
design, most of the injected water evaporates into vapor, leading to a pre-cooled airflow. The
employed numerical study is dedicated to optimizing the arrangement of spray nozzles and
the realization of the maximum cooling outcome with minimum water usage. Meanwhile, a
dimensionless analysis is presented to correlate cooling efficiency with influencing factors
such as: the ratio of evaporated water mass flowrate to air mass flowrate, the ratio between
wet bulb temperature and ambient temperature and nozzle separation distance. This chapter
is based on a peer-reviewed journal paper published in Applied Thermal Engineering.
• Chapter 7 describes the experimental work of the spray cooling tests conducted on the
experimental cooling tower. Detailed information about tower construction and configuration,
spray cooling system, design parameters of air-cooled heat exchangers, diesel-based water
heating system and the control and measurement system as well as the arrangement of spray
nozzle and measuring sensors are provided. Experimental data of the performance of this
cooling tower have been collected from field tests and used prove the effectiveness of spray
cooling system and evaluate its performance enhancement effect. This chapter is based on the
paper published in Energy.
• Chapter 8 is the summary and the recommendation of future work based on this study.
7
Chapter 2 Literature Review
This Chapter is based on the journal paper published in Renewable and Sustainable Energy Reviews.
This Chapter presents the promising use of spray-assisted natural draft dry cooling towers in
concentrated solar power plants. First of all, a brief introduction of the concentrated solar power plants
is made. Particular attentions were paid to the use of dry cooling towers in concentrated solar power
plants. Then a detailed description of the natural draft dry cooling towers is presented, including both
the numerical study and experimental investigations on the cross-wind effects. A more fundamental
work on spray nozzle selection, spray characterization as well as the heat and mass transfer caused
by spray evaporation are summarized. More recent studies on the evaporative cooling used to cool
hot air flows are contained in the last part of this review paper. Finally the main points were reiterated
and prospects were made as a clue for future studies.
8
A review on the performance evaluation of natural draft dry cooling towers and
possible improvements via inlet air spray-cooling
Yubiao Sun, Zhiqiang Guan, Kamel Hooman
Queensland Geothermal Energy Centre of Excellence,
School of Mechanical and Mining Engineering,
The University of Queensland, Brisbane 4072, Australia
Renewable and Sustainable Energy Reviews 79 (2017) 618-637
ABSTRACT: Concentrating solar power (CSP) plants make use of the renewable and inexhaustible
solar energy to produce electricity. Limited by the scarce water resources, CSP plants built in arid
areas choose Natural Draft Dry Cooling Tower (NDDCT) to remove waste heat. However, NDDCT
suffers from low efficiency in hot summer days. To resolve this problem, inlet air spray-cooling is
introduced to improve the performance of NDDCT. In the first part of this paper, the research progress
focused on both the theoretical and experimental studies on NDDCT are summarized. Then, in the
second part, the spray cooling system consisting of various kinds of spray nozzles are described.
Various nozzles produce different spray patterns such as flat-fan, hollow cone, full cone and solid jet.
These spray patterns are characterized by flow rate, pressure, mean droplet size and droplet size
distribution. Furthermore, the mathematical models correlating the cooling tower performance with
the droplet evaporation process are used to predict the spray cooling performance and are summarized
here. Finally, predictive results are presented to evaluate the performance of the pre-cooling system.
The results illustrate that the inlet air pre-cooling would improve the efficiency of NDDCT and thus
reduce power generation loss under high-ambient air temperature conditions. More research should
be conducted to develop a practical NDDCT-based spray cooling system for industrial applications.
Keyword: Concentrating solar power, Spray cooling, Evaporation, Nozzle, Droplet, Natural draft dry
cooling tower
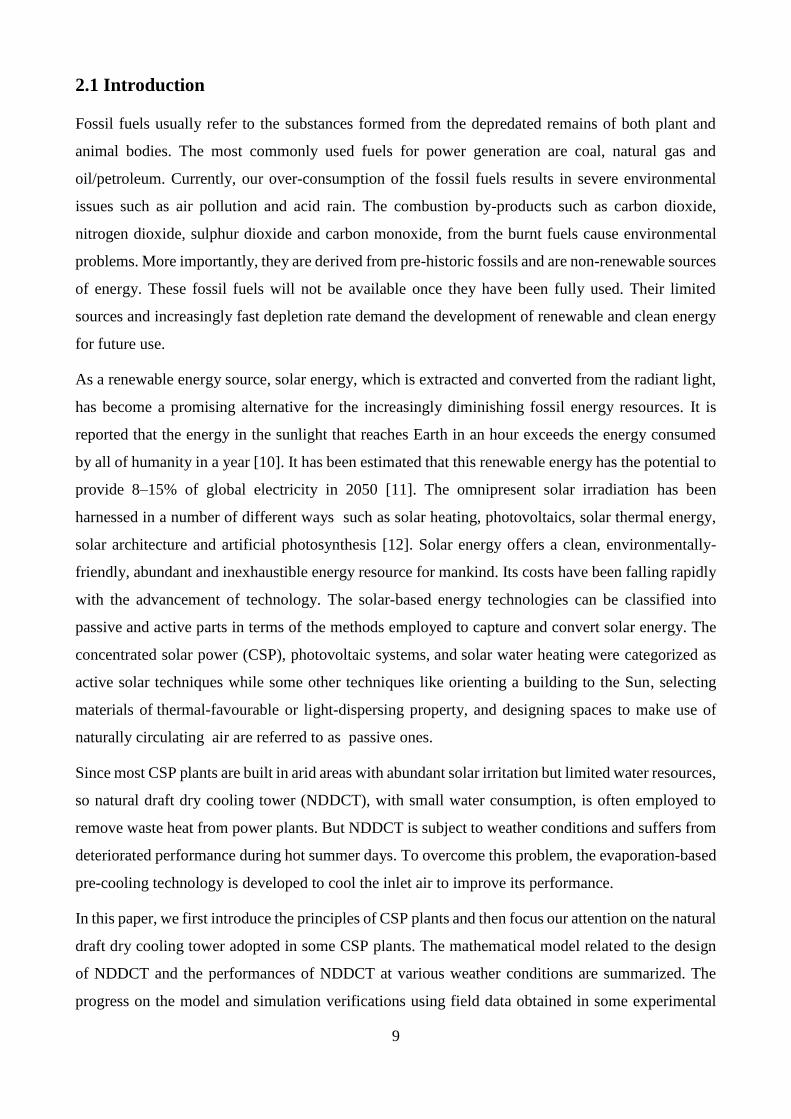
9
2.1 Introduction
Fossil fuels usually refer to the substances formed from the depredated remains of both plant and
animal bodies. The most commonly used fuels for power generation are coal, natural gas and
oil/petroleum. Currently, our over-consumption of the fossil fuels results in severe environmental
issues such as air pollution and acid rain. The combustion by-products such as carbon dioxide,
nitrogen dioxide, sulphur dioxide and carbon monoxide, from the burnt fuels cause environmental
problems. More importantly, they are derived from pre-historic fossils and are non-renewable sources
of energy. These fossil fuels will not be available once they have been fully used. Their limited
sources and increasingly fast depletion rate demand the development of renewable and clean energy
for future use.
As a renewable energy source, solar energy, which is extracted and converted from the radiant light,
has become a promising alternative for the increasingly diminishing fossil energy resources. It is
reported that the energy in the sunlight that reaches Earth in an hour exceeds the energy consumed
by all of humanity in a year [10]. It has been estimated that this renewable energy has the potential to
provide 8–15% of global electricity in 2050 [11]. The omnipresent solar irradiation has been
harnessed in a number of different ways such as solar heating, photovoltaics, solar thermal energy,
solar architecture and artificial photosynthesis [12]. Solar energy offers a clean, environmentally-
friendly, abundant and inexhaustible energy resource for mankind. Its costs have been falling rapidly
with the advancement of technology. The solar-based energy technologies can be classified into
passive and active parts in terms of the methods employed to capture and convert solar energy. The
concentrated solar power (CSP), photovoltaic systems, and solar water heating were categorized as
active solar techniques while some other techniques like orienting a building to the Sun, selecting
materials of thermal-favourable or light-dispersing property, and designing spaces to make use of
naturally circulating air are referred to as passive ones.
Since most CSP plants are built in arid areas with abundant solar irritation but limited water resources,
so natural draft dry cooling tower (NDDCT), with small water consumption, is often employed to
remove waste heat from power plants. But NDDCT is subject to weather conditions and suffers from
deteriorated performance during hot summer days. To overcome this problem, the evaporation-based
pre-cooling technology is developed to cool the inlet air to improve its performance.
In this paper, we first introduce the principles of CSP plants and then focus our attention on the natural
draft dry cooling tower adopted in some CSP plants. The mathematical model related to the design
of NDDCT and the performances of NDDCT at various weather conditions are summarized. The
progress on the model and simulation verifications using field data obtained in some experimental
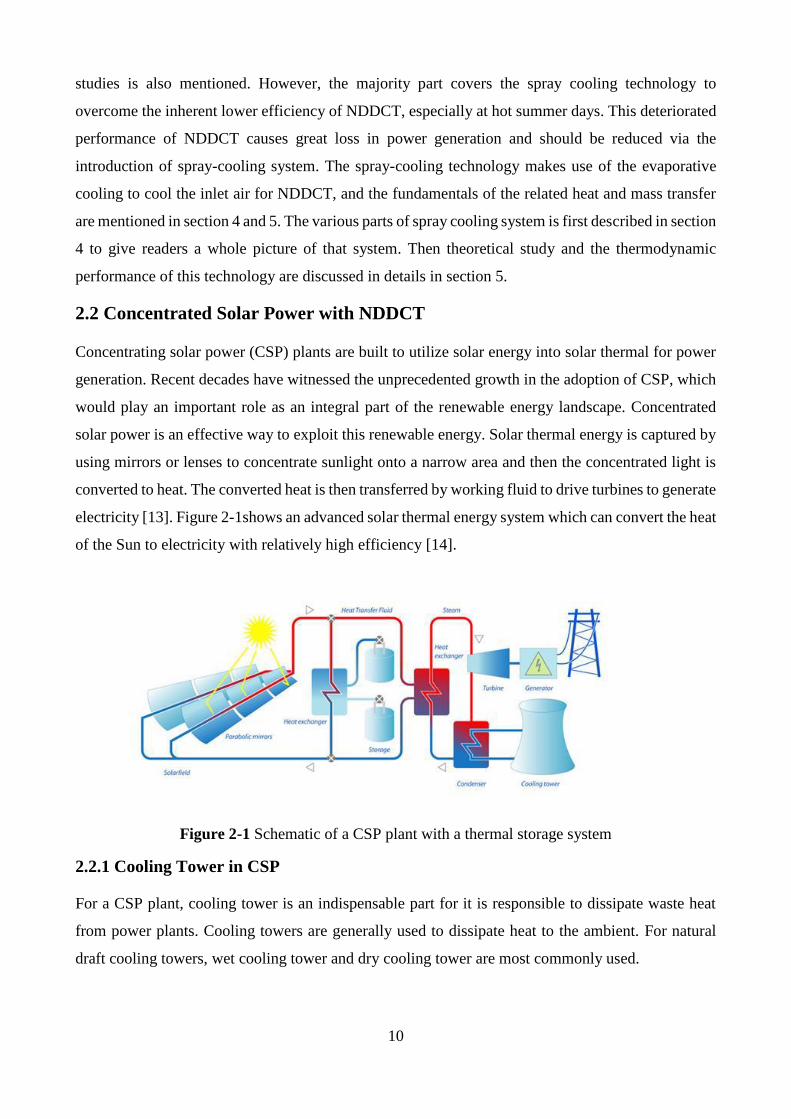
10
studies is also mentioned. However, the majority part covers the spray cooling technology to
overcome the inherent lower efficiency of NDDCT, especially at hot summer days. This deteriorated
performance of NDDCT causes great loss in power generation and should be reduced via the
introduction of spray-cooling system. The spray-cooling technology makes use of the evaporative
cooling to cool the inlet air for NDDCT, and the fundamentals of the related heat and mass transfer
are mentioned in section 4 and 5. The various parts of spray cooling system is first described in section
4 to give readers a whole picture of that system. Then theoretical study and the thermodynamic
performance of this technology are discussed in details in section 5.
2.2 Concentrated Solar Power with NDDCT
Concentrating solar power (CSP) plants are built to utilize solar energy into solar thermal for power
generation. Recent decades have witnessed the unprecedented growth in the adoption of CSP, which
would play an important role as an integral part of the renewable energy landscape. Concentrated
solar power is an effective way to exploit this renewable energy. Solar thermal energy is captured by
using mirrors or lenses to concentrate sunlight onto a narrow area and then the concentrated light is
converted to heat. The converted heat is then transferred by working fluid to drive turbines to generate
electricity [13]. Figure 2-1shows an advanced solar thermal energy system which can convert the heat
of the Sun to electricity with relatively high efficiency [14].
Figure 2-1 Schematic of a CSP plant with a thermal storage system
2.2.1 Cooling Tower in CSP
For a CSP plant, cooling tower is an indispensable part for it is responsible to dissipate waste heat
from power plants. Cooling towers are generally used to dissipate heat to the ambient. For natural
draft cooling towers, wet cooling tower and dry cooling tower are most commonly used.

11
In wet cooling towers, water evaporation is enhanced by its distribution in the tower using spray
nozzles, splash bars or film fill. Large amount of heat is removed by water evaporation. Consequently,
the water temperature drops, theoretically, to the wet-bulb temperature of the surrounding air. Inside
the tower, heat transfer is more often characterized by the decrease in the water temperature and a
corresponding water-vapour increase in the moist air passing through the cooling tower. There also
may be a change in the dry-bulb temperature, but this change contributes little to the heat transfer
process and is seldom considered in wet cooling tower design [15]. To achieve the better performance,
wet cooling towers often include a wetted medium called "fill" to promote evaporation. The major
function of these “fills” is to enlarge the contact surface area between water drops and passing air.
For dry cooling towers, the cooling air does not come into direct contact with the working fluid and
heat exchangers are used. For a typical natural draft dry cooling tower (NDDCT), the heat exchanger
bundles are placed either horizontally inside or vertically around the skirt of the tower. Such
placement allows hot working fluid or water to flow through the heat exchanger in the tube side and
cooling air will flow across the bundle. The density of the heated air inside the tower will decrease
and the high-density ambient air will be sucked into the tower. Resulting from the density difference
and the consequent pressure difference, the induced air flow passing through the cooling tower is
called natural draft. The extended surface or finned tubes of heat exchanger offers enlarged contact
area to reduce the thermal resistance. The application of heat exchanger prevents water loss due to
evaporation. In this sense, NDDCT offers a number of inherent advantages, such as low water
consumption and reduced risk in water source pollution specially in arid areas.
2.2.1.1 CSP with NDDCT
The CSP technology is more likely to be practiced in the areas with high solar irradiation. Figure 2-2
shows the distribution of direct normal irradiation throughout the world, which indicates that
Australia, North America and Africa have abundant solar resources. Despite of the abundant solar
energy, water resources in these regions are quite limited, if not unavailable. Therefore, NDDCT
becomes a cost-effective option for power plant construction in those areas because it can effectively
discharge heat with no water consumption [16]. Table 2-1 lists some operational CSP power plants
with dry cooling technology.
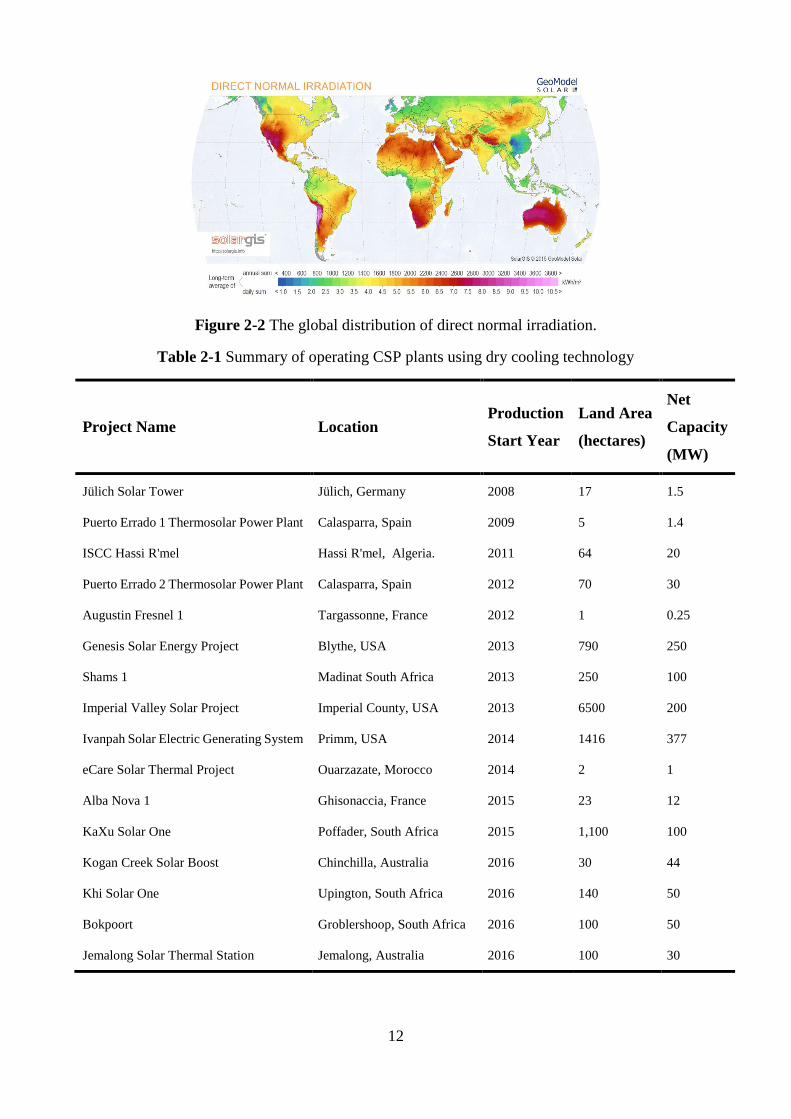
12
Figure 2-2 The global distribution of direct normal irradiation.
Table 2-1 Summary of operating CSP plants using dry cooling technology
Project Name Location Production
Start Year
Land Area
(hectares)
Net
Capacity
(MW)
Jülich Solar Tower Jülich, Germany 2008 17 1.5
Puerto Errado 1 Thermosolar Power Plant Calasparra, Spain 2009 5 1.4
ISCC Hassi R'mel Hassi R'mel, Algeria. 2011 64 20
Puerto Errado 2 Thermosolar Power Plant Calasparra, Spain 2012 70 30
Augustin Fresnel 1 Targassonne, France 2012 1 0.25
Genesis Solar Energy Project Blythe, USA 2013 790 250
Shams 1 Madinat South Africa 2013 250 100
Imperial Valley Solar Project Imperial County, USA 2013 6500 200
Ivanpah Solar Electric Generating System Primm, USA 2014 1416 377
eCare Solar Thermal Project Ouarzazate, Morocco 2014 2 1
Alba Nova 1 Ghisonaccia, France 2015 23 12
KaXu Solar One Poffader, South Africa 2015 1,100 100
Kogan Creek Solar Boost Chinchilla, Australia 2016 30 44
Khi Solar One Upington, South Africa 2016 140 50
Bokpoort Groblershoop, South Africa 2016 100 50
Jemalong Solar Thermal Station Jemalong, Australia 2016 100 30
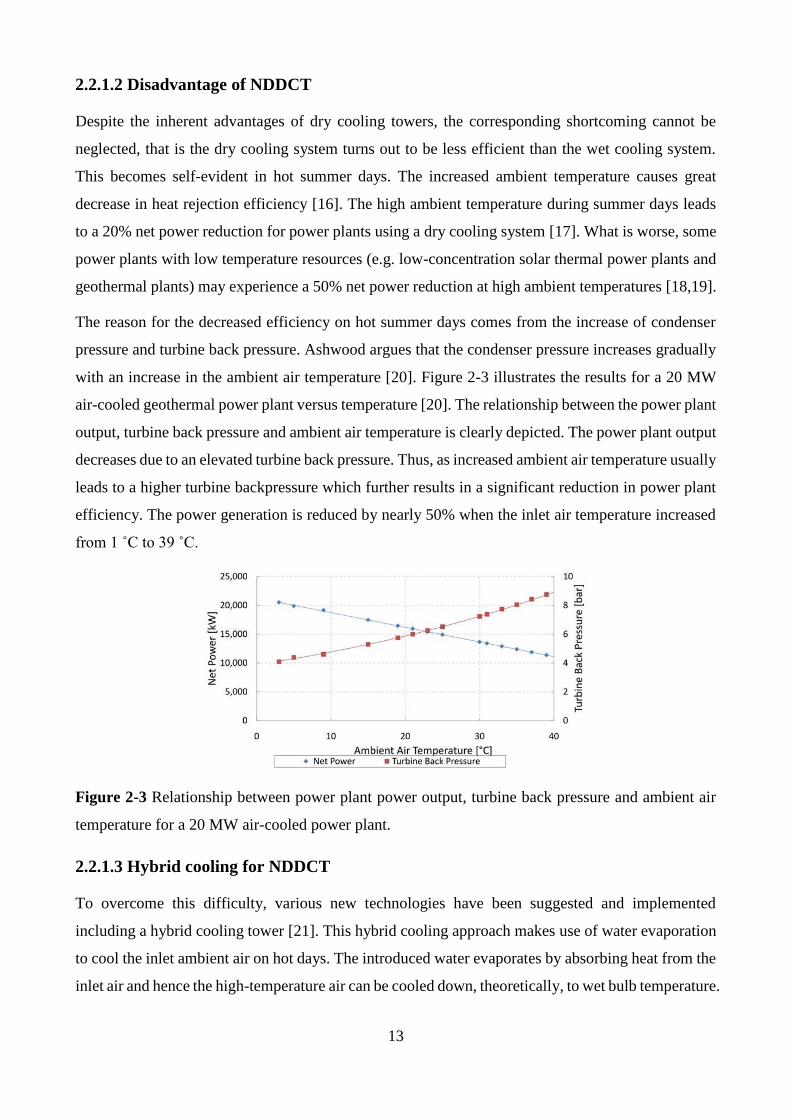
13
2.2.1.2 Disadvantage of NDDCT
Despite the inherent advantages of dry cooling towers, the corresponding shortcoming cannot be
neglected, that is the dry cooling system turns out to be less efficient than the wet cooling system.
This becomes self-evident in hot summer days. The increased ambient temperature causes great
decrease in heat rejection efficiency [16]. The high ambient temperature during summer days leads
to a 20% net power reduction for power plants using a dry cooling system [17]. What is worse, some
power plants with low temperature resources (e.g. low-concentration solar thermal power plants and
geothermal plants) may experience a 50% net power reduction at high ambient temperatures [18,19].
The reason for the decreased efficiency on hot summer days comes from the increase of condenser
pressure and turbine back pressure. Ashwood argues that the condenser pressure increases gradually
with an increase in the ambient air temperature [20]. Figure 2-3 illustrates the results for a 20 MW
air-cooled geothermal power plant versus temperature [20]. The relationship between the power plant
output, turbine back pressure and ambient air temperature is clearly depicted. The power plant output
decreases due to an elevated turbine back pressure. Thus, as increased ambient air temperature usually
leads to a higher turbine backpressure which further results in a significant reduction in power plant
efficiency. The power generation is reduced by nearly 50% when the inlet air temperature increased
from 1 ˚C to 39 ˚C.
Figure 2-3 Relationship between power plant power output, turbine back pressure and ambient air
temperature for a 20 MW air-cooled power plant.
2.2.1.3 Hybrid cooling for NDDCT
To overcome this difficulty, various new technologies have been suggested and implemented
including a hybrid cooling tower [21]. This hybrid cooling approach makes use of water evaporation
to cool the inlet ambient air on hot days. The introduced water evaporates by absorbing heat from the
inlet air and hence the high-temperature air can be cooled down, theoretically, to wet bulb temperature.
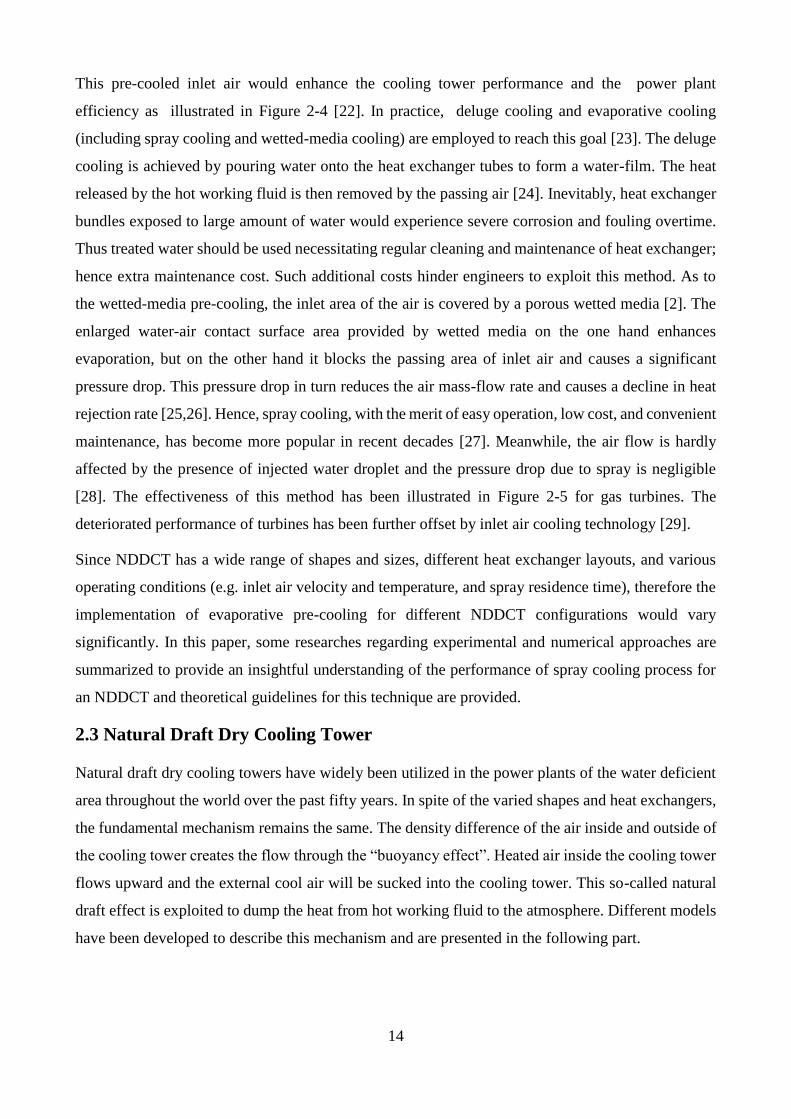
14
This pre-cooled inlet air would enhance the cooling tower performance and the power plant
efficiency as illustrated in Figure 2-4 [22]. In practice, deluge cooling and evaporative cooling
(including spray cooling and wetted-media cooling) are employed to reach this goal [23]. The deluge
cooling is achieved by pouring water onto the heat exchanger tubes to form a water-film. The heat
released by the hot working fluid is then removed by the passing air [24]. Inevitably, heat exchanger
bundles exposed to large amount of water would experience severe corrosion and fouling overtime.
Thus treated water should be used necessitating regular cleaning and maintenance of heat exchanger;
hence extra maintenance cost. Such additional costs hinder engineers to exploit this method. As to
the wetted-media pre-cooling, the inlet area of the air is covered by a porous wetted media [2]. The
enlarged water-air contact surface area provided by wetted media on the one hand enhances
evaporation, but on the other hand it blocks the passing area of inlet air and causes a significant
pressure drop. This pressure drop in turn reduces the air mass-flow rate and causes a decline in heat
rejection rate [25,26]. Hence, spray cooling, with the merit of easy operation, low cost, and convenient
maintenance, has become more popular in recent decades [27]. Meanwhile, the air flow is hardly
affected by the presence of injected water droplet and the pressure drop due to spray is negligible
[28]. The effectiveness of this method has been illustrated in Figure 2-5 for gas turbines. The
deteriorated performance of turbines has been further offset by inlet air cooling technology [29].
Since NDDCT has a wide range of shapes and sizes, different heat exchanger layouts, and various
operating conditions (e.g. inlet air velocity and temperature, and spray residence time), therefore the
implementation of evaporative pre-cooling for different NDDCT configurations would vary
significantly. In this paper, some researches regarding experimental and numerical approaches are
summarized to provide an insightful understanding of the performance of spray cooling process for
an NDDCT and theoretical guidelines for this technique are provided.
2.3 Natural Draft Dry Cooling Tower
Natural draft dry cooling towers have widely been utilized in the power plants of the water deficient
area throughout the world over the past fifty years. In spite of the varied shapes and heat exchangers,
the fundamental mechanism remains the same. The density difference of the air inside and outside of
the cooling tower creates the flow through the “buoyancy effect”. Heated air inside the cooling tower
flows upward and the external cool air will be sucked into the cooling tower. This so-called natural
draft effect is exploited to dump the heat from hot working fluid to the atmosphere. Different models
have been developed to describe this mechanism and are presented in the following part.
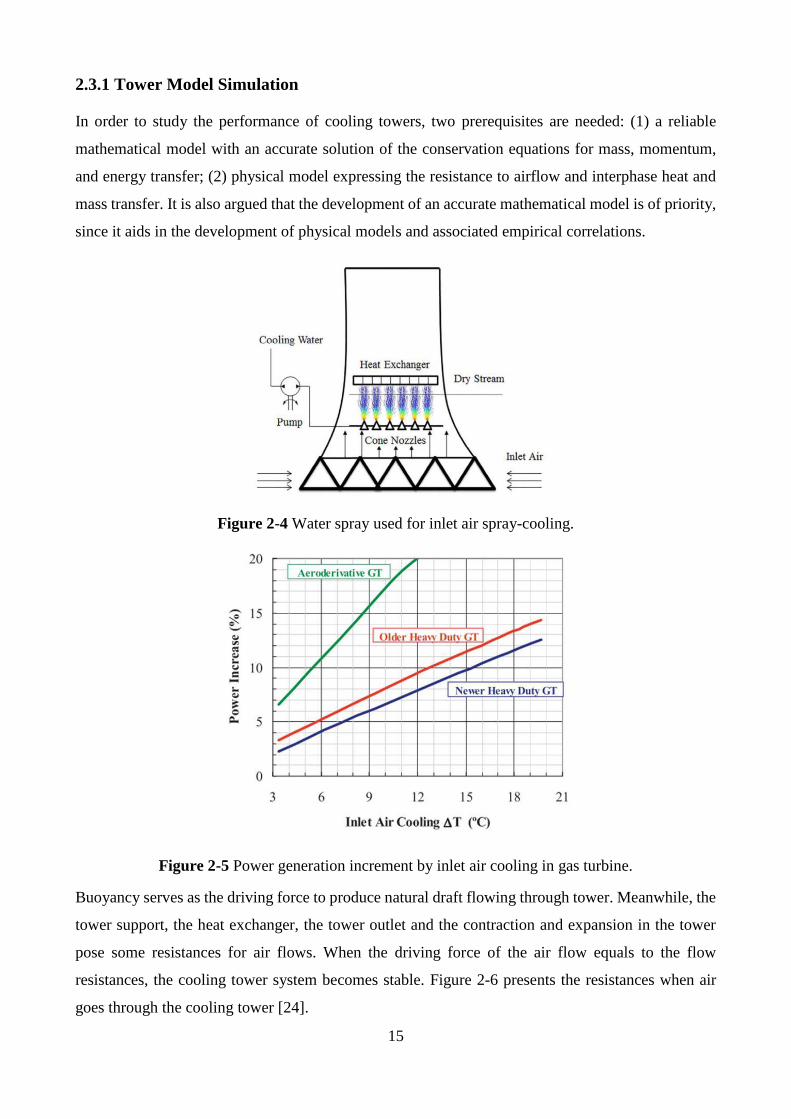
15
2.3.1 Tower Model Simulation
In order to study the performance of cooling towers, two prerequisites are needed: (1) a reliable
mathematical model with an accurate solution of the conservation equations for mass, momentum,
and energy transfer; (2) physical model expressing the resistance to airflow and interphase heat and
mass transfer. It is also argued that the development of an accurate mathematical model is of priority,
since it aids in the development of physical models and associated empirical correlations.
Figure 2-4 Water spray used for inlet air spray-cooling.
Figure 2-5 Power generation increment by inlet air cooling in gas turbine.
Buoyancy serves as the driving force to produce natural draft flowing through tower. Meanwhile, the
tower support, the heat exchanger, the tower outlet and the contraction and expansion in the tower
pose some resistances for air flows. When the driving force of the air flow equals to the flow
resistances, the cooling tower system becomes stable. Figure 2-6 presents the resistances when air
goes through the cooling tower [24].
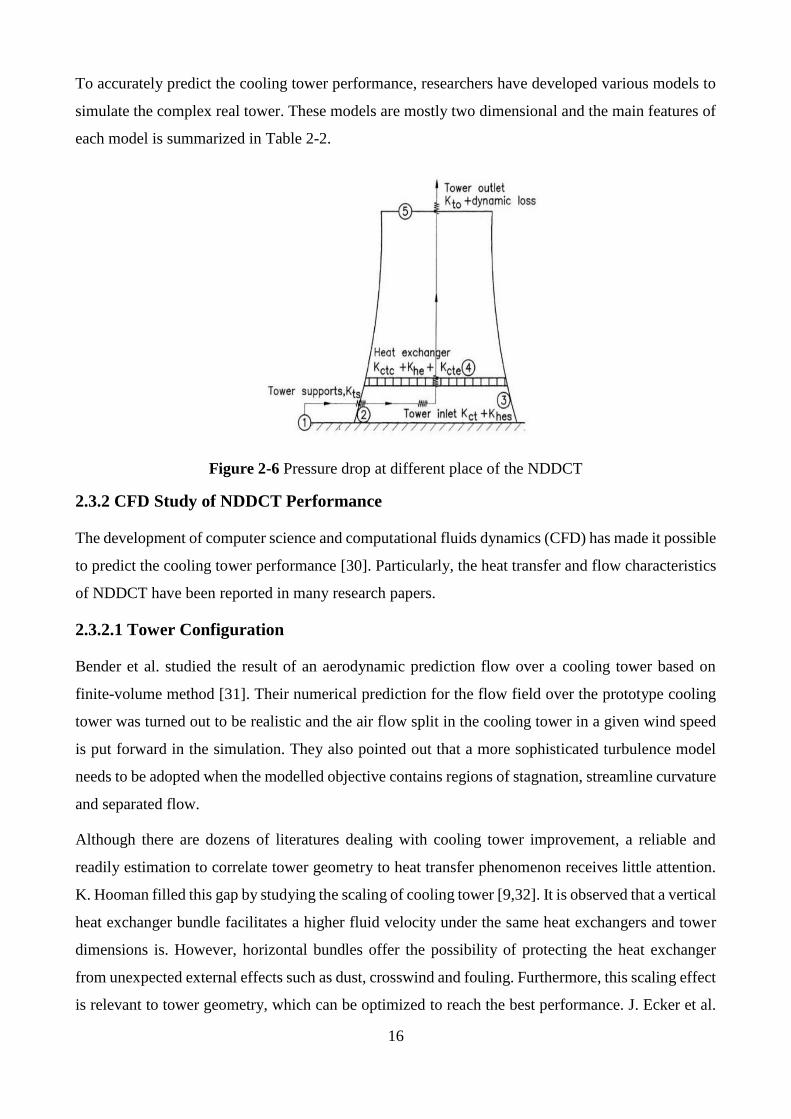
16
To accurately predict the cooling tower performance, researchers have developed various models to
simulate the complex real tower. These models are mostly two dimensional and the main features of
each model is summarized in Table 2-2.
Figure 2-6 Pressure drop at different place of the NDDCT
2.3.2 CFD Study of NDDCT Performance
The development of computer science and computational fluids dynamics (CFD) has made it possible
to predict the cooling tower performance [30]. Particularly, the heat transfer and flow characteristics
of NDDCT have been reported in many research papers.
2.3.2.1 Tower Configuration
Bender et al. studied the result of an aerodynamic prediction flow over a cooling tower based on
finite-volume method [31]. Their numerical prediction for the flow field over the prototype cooling
tower was turned out to be realistic and the air flow split in the cooling tower in a given wind speed
is put forward in the simulation. They also pointed out that a more sophisticated turbulence model
needs to be adopted when the modelled objective contains regions of stagnation, streamline curvature
and separated flow.
Although there are dozens of literatures dealing with cooling tower improvement, a reliable and
readily estimation to correlate tower geometry to heat transfer phenomenon receives little attention.
K. Hooman filled this gap by studying the scaling of cooling tower [9,32]. It is observed that a vertical
heat exchanger bundle facilitates a higher fluid velocity under the same heat exchangers and tower
dimensions is. However, horizontal bundles offer the possibility of protecting the heat exchanger
from unexpected external effects such as dust, crosswind and fouling. Furthermore, this scaling effect
is relevant to tower geometry, which can be optimized to reach the best performance. J. Ecker et al.
17
presented an optimization model for dry-type natural-draft cooling tower. The replacement of
polynomial equations by inequalities made this approach more applicable [33].
Most recently, some studies on the influences of height/diameter ratios of dry-cooling tower upon
thermo-flow characteristics of indirect dry cooling towers were reported [34]. Towers with different
heights (115, 104.5 and 96.6m) and base diameters (74.6, 80.38 and 92m) were investigated and
found that tower performance was mainly determined by buoyancy force and ambient winds.
Although the three towers have different height to diameter ratios (1.54, 1,3 and 1.05), at low wind
speed or windless condition, the effect of height to diameter ratio can be neglected (As shown in
Figure 2-11). But at high wind speeds low height/diameter ratio is better than its counterparts with
high height/diameter ratio.
2.3.2.2 Crosswind Effect
Crosswind, as one of the most commonly seen natural phenomenon, can affect the tower in a number
of ways. On top of the structural consideration, the thermos-hydraulic performance of NDDCT under
crosswind conditions have sparked lots of interest in academic world. This is because the direct air-
cooled units in NDDCT are seriously influenced by ambient factors. It was reported that on June 22,
2005, when the wind blew from turbine house to cooling tower at the speed of 15~16m/s, the back
pressure of turbine increased rapidly, and the unit broke off for the sake of protection. To make sure
that the power station can run normally at crosswind conditions, the detailed information about how
the cooling tower can be influenced by crosswinds should be explored and identified.
Table 2-3 listed some important publications covering the influence of crosswind on the performance
on NDDCT and some solutions to reduce the adverse effects.
2.3.3 Experimental Study of NDDCT
Simulation serves as a powerful tool for engineers to design and predict the performance cooling
tower. Insightful and accurate analyses of cooling towers are desirable to ensure a precise
determination of cooling tower performance. Naturally, numerical modelling is then validated by
experiments and field test data plays a key role in cooling tower research and design. Therefore,
experimental researches concerned with the cooling performance of NDDCT have received a great
deal of attention.
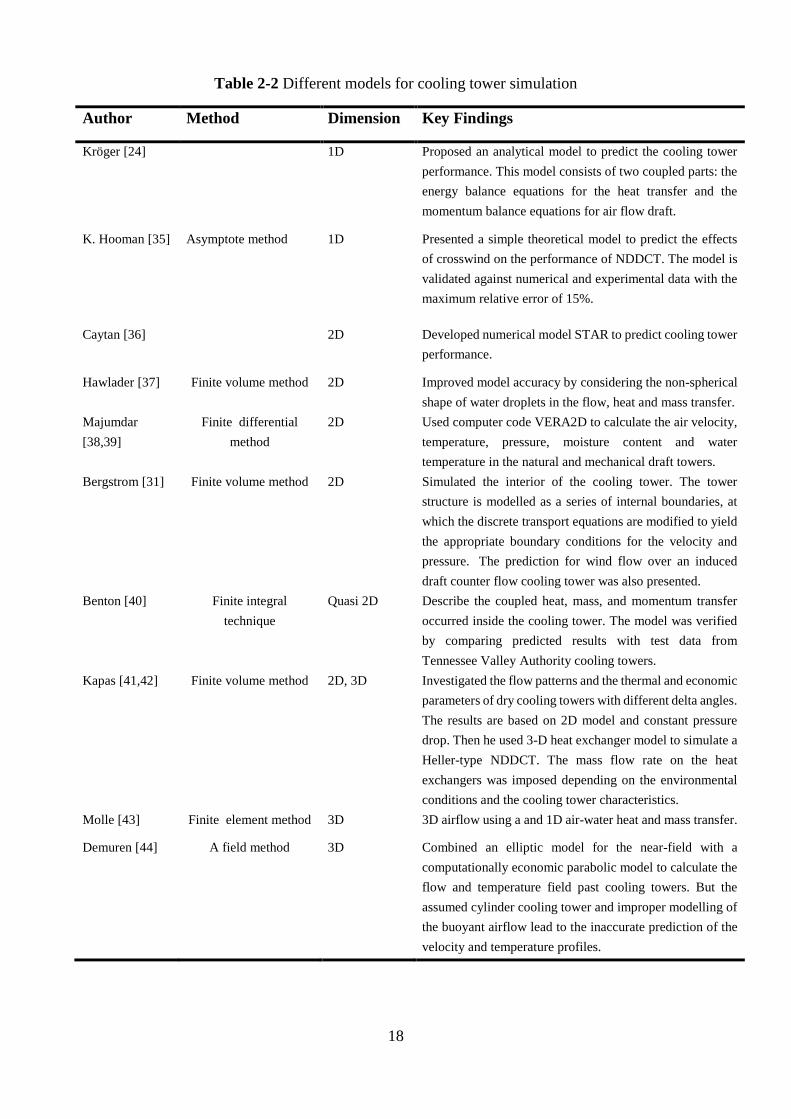
18
Table 2-2 Different models for cooling tower simulation
Author Method Dimension Key Findings
Kröger [24] 1D Proposed an analytical model to predict the cooling tower
performance. This model consists of two coupled parts: the
energy balance equations for the heat transfer and the
momentum balance equations for air flow draft.
K. Hooman [35] Asymptote method 1D Presented a simple theoretical model to predict the effects
of crosswind on the performance of NDDCT. The model is
validated against numerical and experimental data with the
maximum relative error of 15%.
Caytan [36] 2D Developed numerical model STAR to predict cooling tower
performance.
Hawlader [37] Finite volume method 2D Improved model accuracy by considering the non-spherical
shape of water droplets in the flow, heat and mass transfer.
Majumdar
[38,39]
Finite differential
method
2D Used computer code VERA2D to calculate the air velocity,
temperature, pressure, moisture content and water
temperature in the natural and mechanical draft towers.
Bergstrom [31] Finite volume method 2D Simulated the interior of the cooling tower. The tower
structure is modelled as a series of internal boundaries, at
which the discrete transport equations are modified to yield
the appropriate boundary conditions for the velocity and
pressure. The prediction for wind flow over an induced
draft counter flow cooling tower was also presented.
Benton [40] Finite integral
technique
Quasi 2D Describe the coupled heat, mass, and momentum transfer
occurred inside the cooling tower. The model was verified
by comparing predicted results with test data from
Tennessee Valley Authority cooling towers.
Kapas [41,42] Finite volume method 2D, 3D Investigated the flow patterns and the thermal and economic
parameters of dry cooling towers with different delta angles.
The results are based on 2D model and constant pressure
drop. Then he used 3-D heat exchanger model to simulate a
Heller-type NDDCT. The mass flow rate on the heat
exchangers was imposed depending on the environmental
conditions and the cooling tower characteristics.
Molle [43] Finite element method 3D 3D airflow using a and 1D air-water heat and mass transfer.
Demuren [44] A field method 3D Combined an elliptic model for the near-field with a
computationally economic parabolic model to calculate the
flow and temperature field past cooling towers. But the
assumed cylinder cooling tower and improper modelling of
the buoyant airflow lead to the inaccurate prediction of the
velocity and temperature profiles.
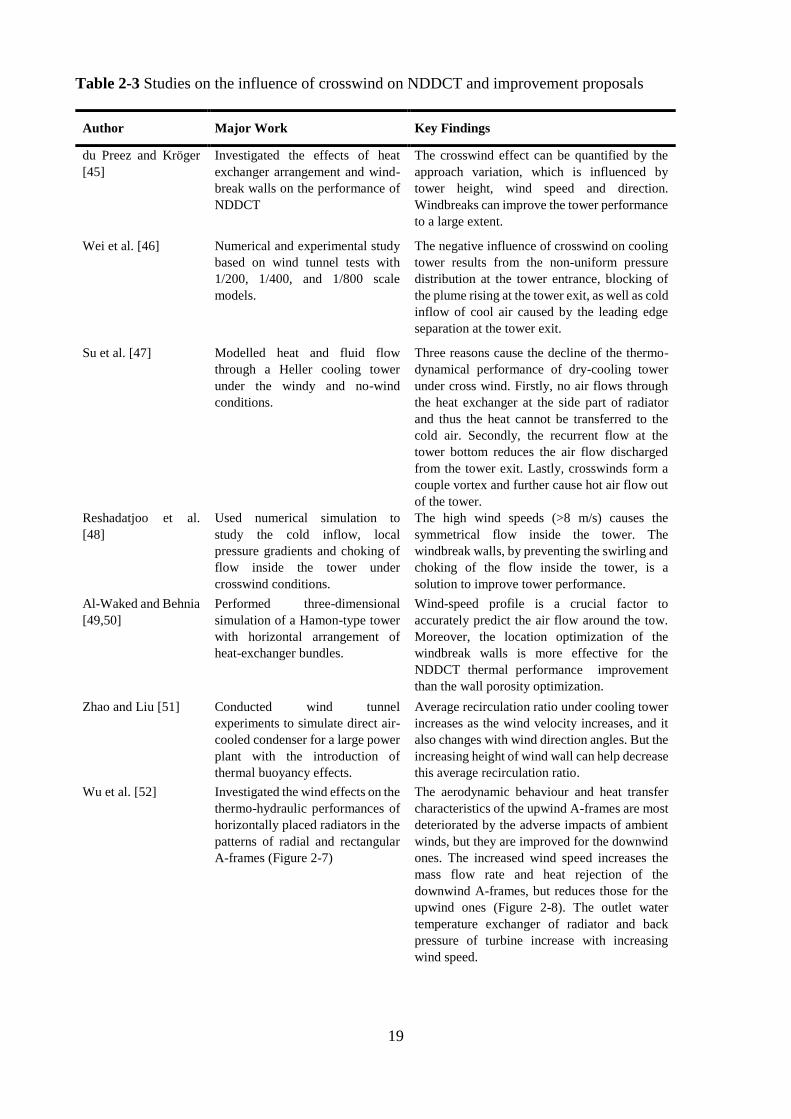
19
Table 2-3 Studies on the influence of crosswind on NDDCT and improvement proposals
Author Major Work Key Findings
du Preez and Kröger
[45]
Investigated the effects of heat
exchanger arrangement and wind-
break walls on the performance of
NDDCT
The crosswind effect can be quantified by the
approach variation, which is influenced by
tower height, wind speed and direction.
Windbreaks can improve the tower performance
to a large extent.
Wei et al. [46] Numerical and experimental study
based on wind tunnel tests with
1/200, 1/400, and 1/800 scale
models.
The negative influence of crosswind on cooling
tower results from the non-uniform pressure
distribution at the tower entrance, blocking of
the plume rising at the tower exit, as well as cold
inflow of cool air caused by the leading edge
separation at the tower exit.
Su et al. [47] Modelled heat and fluid flow
through a Heller cooling tower
under the windy and no-wind
conditions.
Three reasons cause the decline of the thermo-
dynamical performance of dry-cooling tower
under cross wind. Firstly, no air flows through
the heat exchanger at the side part of radiator
and thus the heat cannot be transferred to the
cold air. Secondly, the recurrent flow at the
tower bottom reduces the air flow discharged
from the tower exit. Lastly, crosswinds form a
couple vortex and further cause hot air flow out
of the tower.
Reshadatjoo et al.
[48]
Used numerical simulation to
study the cold inflow, local
pressure gradients and choking of
flow inside the tower under
crosswind conditions.
The high wind speeds (>8 m/s) causes the
symmetrical flow inside the tower. The
windbreak walls, by preventing the swirling and
choking of the flow inside the tower, is a
solution to improve tower performance.
Al-Waked and Behnia
[49,50]
Performed three-dimensional
simulation of a Hamon-type tower
with horizontal arrangement of
heat-exchanger bundles.
Wind-speed profile is a crucial factor to
accurately predict the air flow around the tow.
Moreover, the location optimization of the
windbreak walls is more effective for the
NDDCT thermal performance improvement
than the wall porosity optimization.
Zhao and Liu [51] Conducted wind tunnel
experiments to simulate direct air-
cooled condenser for a large power
plant with the introduction of
thermal buoyancy effects.
Average recirculation ratio under cooling tower
increases as the wind velocity increases, and it
also changes with wind direction angles. But the
increasing height of wind wall can help decrease
this average recirculation ratio.
Wu et al. [52] Investigated the wind effects on the
thermo-hydraulic performances of
horizontally placed radiators in the
patterns of radial and rectangular
A-frames (Figure 2-7)
The aerodynamic behaviour and heat transfer
characteristics of the upwind A-frames are most
deteriorated by the adverse impacts of ambient
winds, but they are improved for the downwind
ones. The increased wind speed increases the
mass flow rate and heat rejection of the
downwind A-frames, but reduces those for the
upwind ones (Figure 2-8). The outlet water
temperature exchanger of radiator and back
pressure of turbine increase with increasing
wind speed.
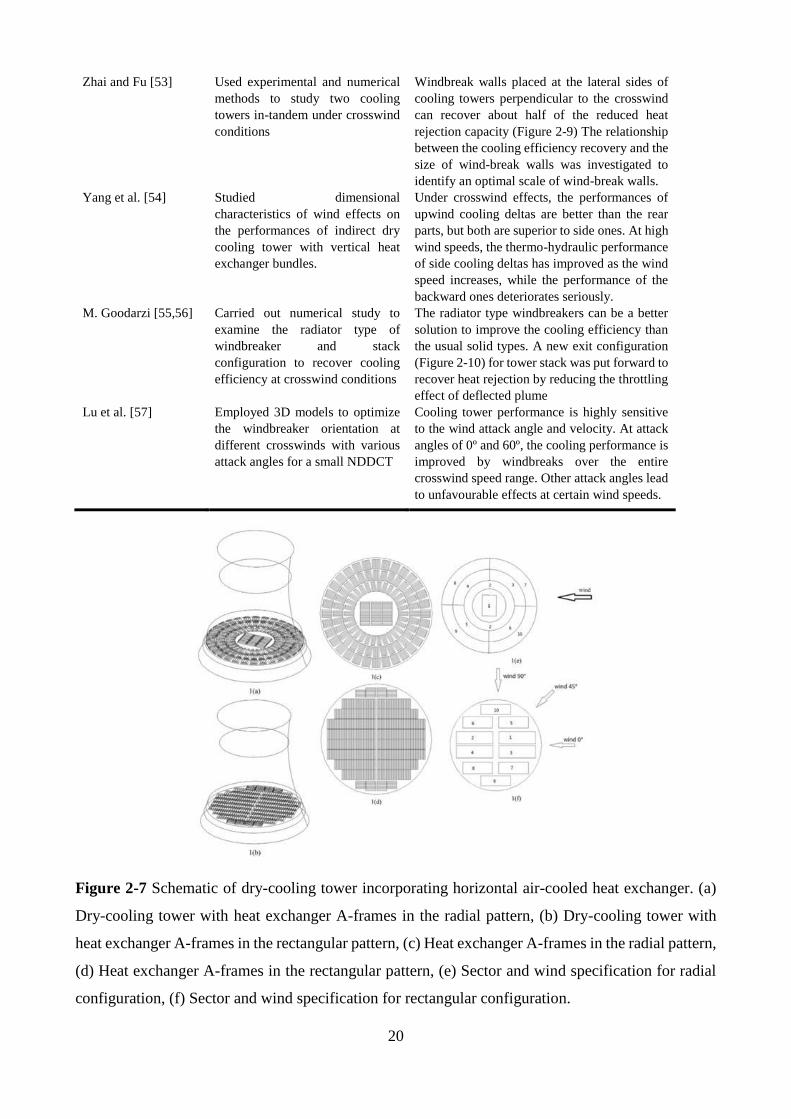
20
Zhai and Fu [53] Used experimental and numerical
methods to study two cooling
towers in-tandem under crosswind
conditions
Windbreak walls placed at the lateral sides of
cooling towers perpendicular to the crosswind
can recover about half of the reduced heat
rejection capacity (Figure 2-9) The relationship
between the cooling efficiency recovery and the
size of wind-break walls was investigated to
identify an optimal scale of wind-break walls.
Yang et al. [54] Studied dimensional
characteristics of wind effects on
the performances of indirect dry
cooling tower with vertical heat
exchanger bundles.
Under crosswind effects, the performances of
upwind cooling deltas are better than the rear
parts, but both are superior to side ones. At high
wind speeds, the thermo-hydraulic performance
of side cooling deltas has improved as the wind
speed increases, while the performance of the
backward ones deteriorates seriously.
M. Goodarzi [55,56] Carried out numerical study to
examine the radiator type of
windbreaker and stack
configuration to recover cooling
efficiency at crosswind conditions
The radiator type windbreakers can be a better
solution to improve the cooling efficiency than
the usual solid types. A new exit configuration
(Figure 2-10) for tower stack was put forward to
recover heat rejection by reducing the throttling
effect of deflected plume
Lu et al. [57] Employed 3D models to optimize
the windbreaker orientation at
different crosswinds with various
attack angles for a small NDDCT
Cooling tower performance is highly sensitive
to the wind attack angle and velocity. At attack
angles of 0º and 60º, the cooling performance is
improved by windbreaks over the entire
crosswind speed range. Other attack angles lead
to unfavourable effects at certain wind speeds.
Figure 2-7 Schematic of dry-cooling tower incorporating horizontal air-cooled heat exchanger. (a)
Dry-cooling tower with heat exchanger A-frames in the radial pattern, (b) Dry-cooling tower with
heat exchanger A-frames in the rectangular pattern, (c) Heat exchanger A-frames in the radial pattern,
(d) Heat exchanger A-frames in the rectangular pattern, (e) Sector and wind specification for radial
configuration, (f) Sector and wind specification for rectangular configuration.
21
Figure 2-8 Variable contour plots at the inlet cross section of heat exchanger in the radial (left) and
rectangular (right) pattern at wind speed of 4 m/s and in wind direction of 0°. (11a, 13a) Velocity in
unit of m/s. (11b, 13b) Pressure in unit of Pa. (11c, 13c) Temperature in unit of K.
Figure 2-9 Velocity vector distribution in the middle section of the heat exchangers when Uwind =
10 m/s. (a) No wind-break walls, (b) 9-m-wide wind- break walls, (c) 27-m-wide wind-break walls.
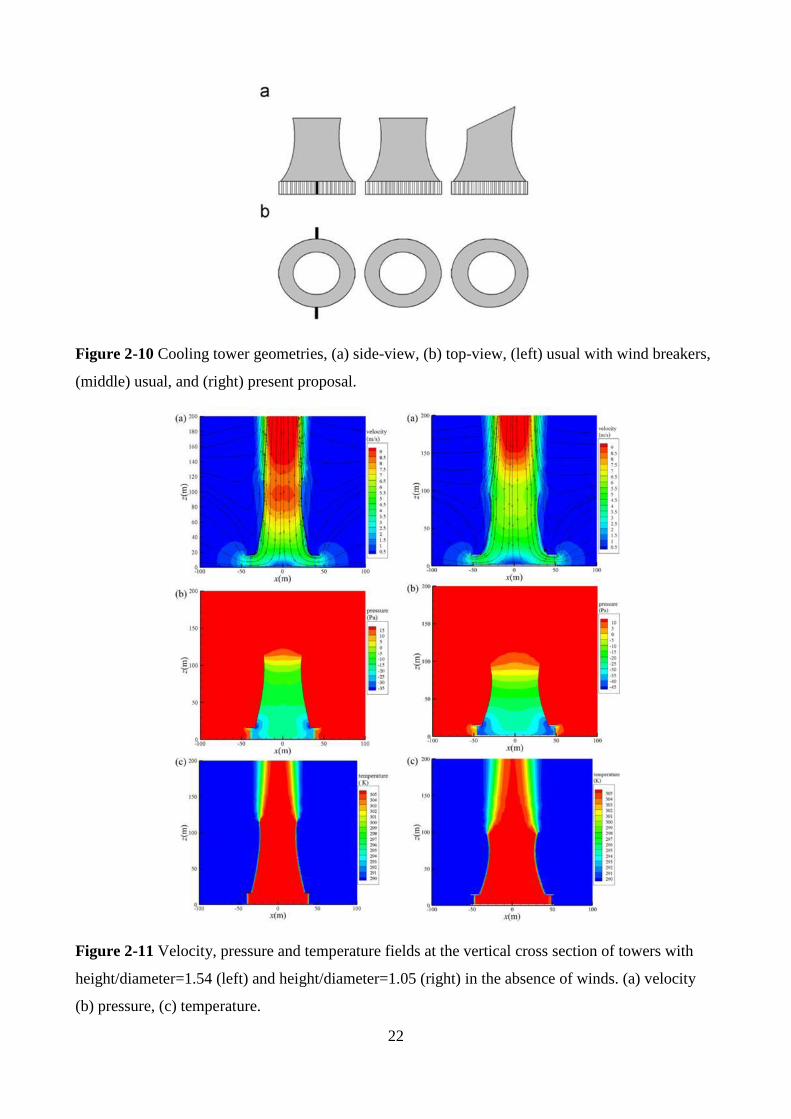
22
Figure 2-10 Cooling tower geometries, (a) side-view, (b) top-view, (left) usual with wind breakers,
(middle) usual, and (right) present proposal.
Figure 2-11 Velocity, pressure and temperature fields at the vertical cross section of towers with
height/diameter=1.54 (left) and height/diameter=1.05 (right) in the absence of winds. (a) velocity
(b) pressure, (c) temperature.
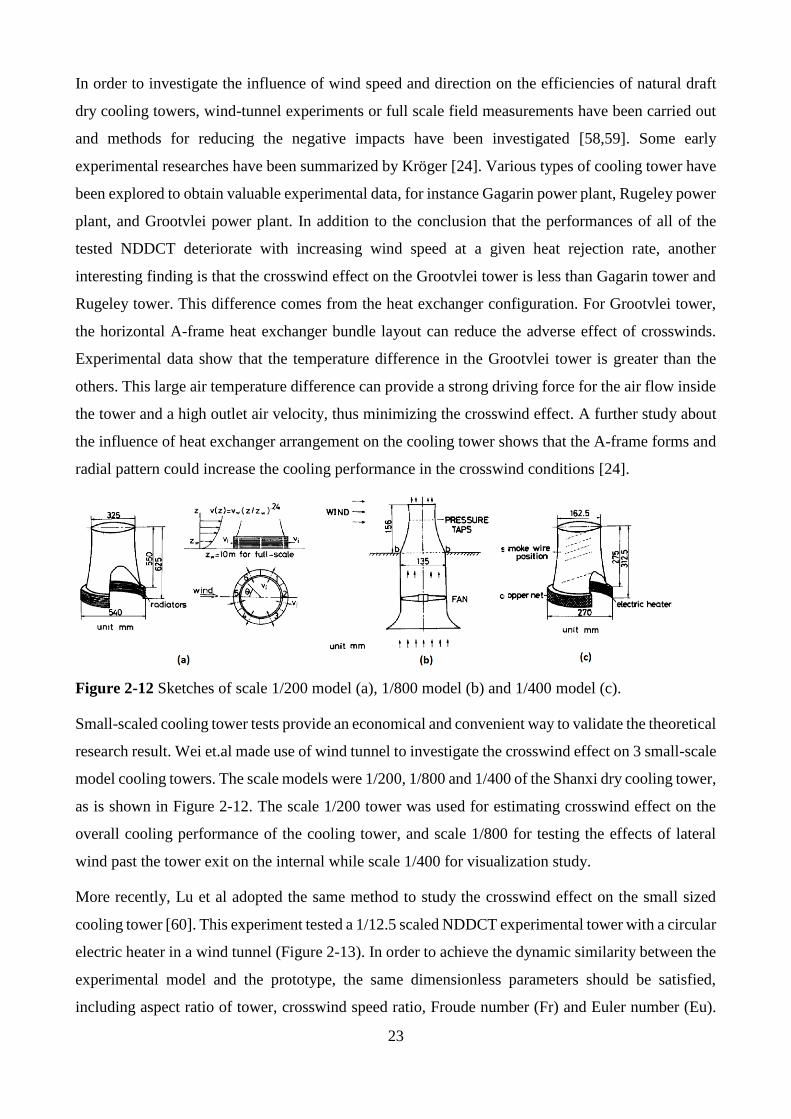
23
In order to investigate the influence of wind speed and direction on the efficiencies of natural draft
dry cooling towers, wind-tunnel experiments or full scale field measurements have been carried out
and methods for reducing the negative impacts have been investigated [58,59]. Some early
experimental researches have been summarized by Kröger [24]. Various types of cooling tower have
been explored to obtain valuable experimental data, for instance Gagarin power plant, Rugeley power
plant, and Grootvlei power plant. In addition to the conclusion that the performances of all of the
tested NDDCT deteriorate with increasing wind speed at a given heat rejection rate, another
interesting finding is that the crosswind effect on the Grootvlei tower is less than Gagarin tower and
Rugeley tower. This difference comes from the heat exchanger configuration. For Grootvlei tower,
the horizontal A-frame heat exchanger bundle layout can reduce the adverse effect of crosswinds.
Experimental data show that the temperature difference in the Grootvlei tower is greater than the
others. This large air temperature difference can provide a strong driving force for the air flow inside
the tower and a high outlet air velocity, thus minimizing the crosswind effect. A further study about
the influence of heat exchanger arrangement on the cooling tower shows that the A-frame forms and
radial pattern could increase the cooling performance in the crosswind conditions [24].
Figure 2-12 Sketches of scale 1/200 model (a), 1/800 model (b) and 1/400 model (c).
Small-scaled cooling tower tests provide an economical and convenient way to validate the theoretical
research result. Wei et.al made use of wind tunnel to investigate the crosswind effect on 3 small-scale
model cooling towers. The scale models were 1/200, 1/800 and 1/400 of the Shanxi dry cooling tower,
as is shown in Figure 2-12. The scale 1/200 tower was used for estimating crosswind effect on the
overall cooling performance of the cooling tower, and scale 1/800 for testing the effects of lateral
wind past the tower exit on the internal while scale 1/400 for visualization study.
More recently, Lu et al adopted the same method to study the crosswind effect on the small sized
cooling tower [60]. This experiment tested a 1/12.5 scaled NDDCT experimental tower with a circular
electric heater in a wind tunnel (Figure 2-13). In order to achieve the dynamic similarity between the
experimental model and the prototype, the same dimensionless parameters should be satisfied,
including aspect ratio of tower, crosswind speed ratio, Froude number (Fr) and Euler number (Eu).
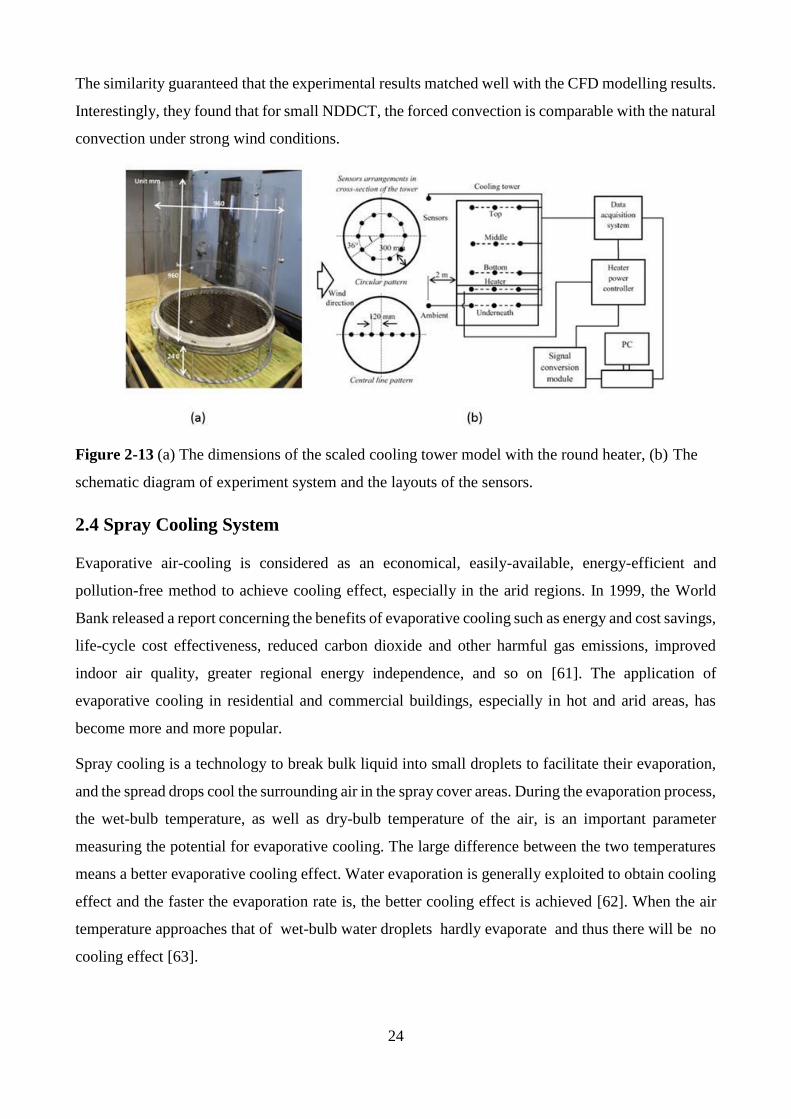
24
The similarity guaranteed that the experimental results matched well with the CFD modelling results.
Interestingly, they found that for small NDDCT, the forced convection is comparable with the natural
convection under strong wind conditions.
Figure 2-13 (a) The dimensions of the scaled cooling tower model with the round heater, (b) The
schematic diagram of experiment system and the layouts of the sensors.
2.4 Spray Cooling System
Evaporative air-cooling is considered as an economical, easily-available, energy-efficient and
pollution-free method to achieve cooling effect, especially in the arid regions. In 1999, the World
Bank released a report concerning the benefits of evaporative cooling such as energy and cost savings,
life-cycle cost effectiveness, reduced carbon dioxide and other harmful gas emissions, improved
indoor air quality, greater regional energy independence, and so on [61]. The application of
evaporative cooling in residential and commercial buildings, especially in hot and arid areas, has
become more and more popular.
Spray cooling is a technology to break bulk liquid into small droplets to facilitate their evaporation,
and the spread drops cool the surrounding air in the spray cover areas. During the evaporation process,
the wet-bulb temperature, as well as dry-bulb temperature of the air, is an important parameter
measuring the potential for evaporative cooling. The large difference between the two temperatures
means a better evaporative cooling effect. Water evaporation is generally exploited to obtain cooling
effect and the faster the evaporation rate is, the better cooling effect is achieved [62]. When the air
temperature approaches that of wet-bulb water droplets hardly evaporate and thus there will be no
cooling effect [63].
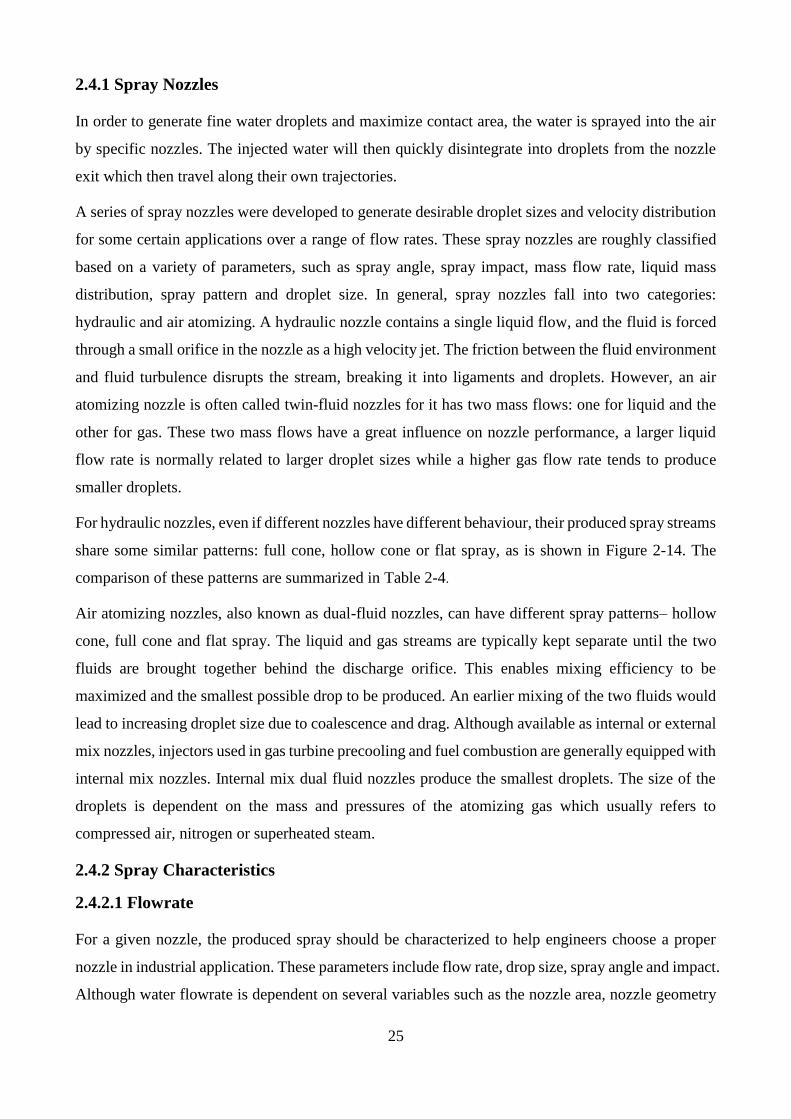
25
2.4.1 Spray Nozzles
In order to generate fine water droplets and maximize contact area, the water is sprayed into the air
by specific nozzles. The injected water will then quickly disintegrate into droplets from the nozzle
exit which then travel along their own trajectories.
A series of spray nozzles were developed to generate desirable droplet sizes and velocity distribution
for some certain applications over a range of flow rates. These spray nozzles are roughly classified
based on a variety of parameters, such as spray angle, spray impact, mass flow rate, liquid mass
distribution, spray pattern and droplet size. In general, spray nozzles fall into two categories:
hydraulic and air atomizing. A hydraulic nozzle contains a single liquid flow, and the fluid is forced
through a small orifice in the nozzle as a high velocity jet. The friction between the fluid environment
and fluid turbulence disrupts the stream, breaking it into ligaments and droplets. However, an air
atomizing nozzle is often called twin-fluid nozzles for it has two mass flows: one for liquid and the
other for gas. These two mass flows have a great influence on nozzle performance, a larger liquid
flow rate is normally related to larger droplet sizes while a higher gas flow rate tends to produce
smaller droplets.
For hydraulic nozzles, even if different nozzles have different behaviour, their produced spray streams
share some similar patterns: full cone, hollow cone or flat spray, as is shown in Figure 2-14. The
comparison of these patterns are summarized in Table 2-4.
Air atomizing nozzles, also known as dual-fluid nozzles, can have different spray patterns– hollow
cone, full cone and flat spray. The liquid and gas streams are typically kept separate until the two
fluids are brought together behind the discharge orifice. This enables mixing efficiency to be
maximized and the smallest possible drop to be produced. An earlier mixing of the two fluids would
lead to increasing droplet size due to coalescence and drag. Although available as internal or external
mix nozzles, injectors used in gas turbine precooling and fuel combustion are generally equipped with
internal mix nozzles. Internal mix dual fluid nozzles produce the smallest droplets. The size of the
droplets is dependent on the mass and pressures of the atomizing gas which usually refers to
compressed air, nitrogen or superheated steam.
2.4.2 Spray Characteristics
2.4.2.1 Flowrate
For a given nozzle, the produced spray should be characterized to help engineers choose a proper
nozzle in industrial application. These parameters include flow rate, drop size, spray angle and impact.
Although water flowrate is dependent on several variables such as the nozzle area, nozzle geometry
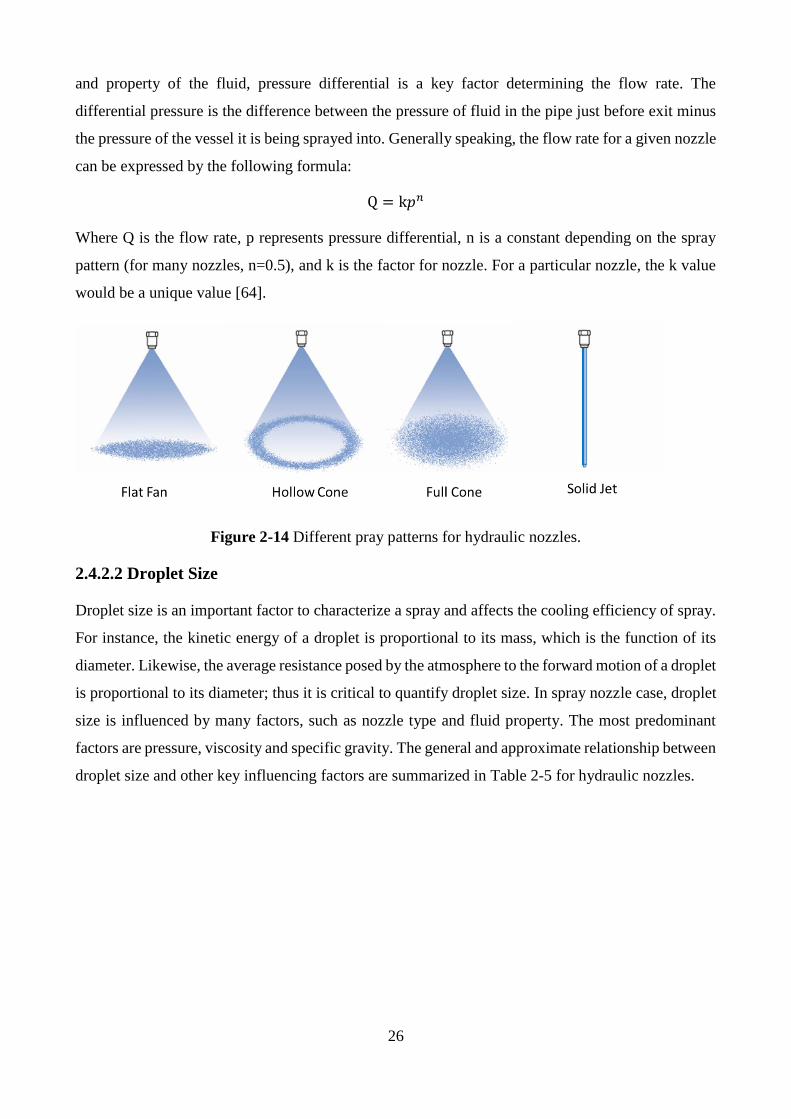
26
and property of the fluid, pressure differential is a key factor determining the flow rate. The
differential pressure is the difference between the pressure of fluid in the pipe just before exit minus
the pressure of the vessel it is being sprayed into. Generally speaking, the flow rate for a given nozzle
can be expressed by the following formula:
Q = k𝑝𝑛
Where Q is the flow rate, p represents pressure differential, n is a constant depending on the spray
pattern (for many nozzles, n=0.5), and k is the factor for nozzle. For a particular nozzle, the k value
would be a unique value [64].
Figure 2-14 Different pray patterns for hydraulic nozzles.
2.4.2.2 Droplet Size
Droplet size is an important factor to characterize a spray and affects the cooling efficiency of spray.
For instance, the kinetic energy of a droplet is proportional to its mass, which is the function of its
diameter. Likewise, the average resistance posed by the atmosphere to the forward motion of a droplet
is proportional to its diameter; thus it is critical to quantify droplet size. In spray nozzle case, droplet
size is influenced by many factors, such as nozzle type and fluid property. The most predominant
factors are pressure, viscosity and specific gravity. The general and approximate relationship between
droplet size and other key influencing factors are summarized in Table 2-5 for hydraulic nozzles.
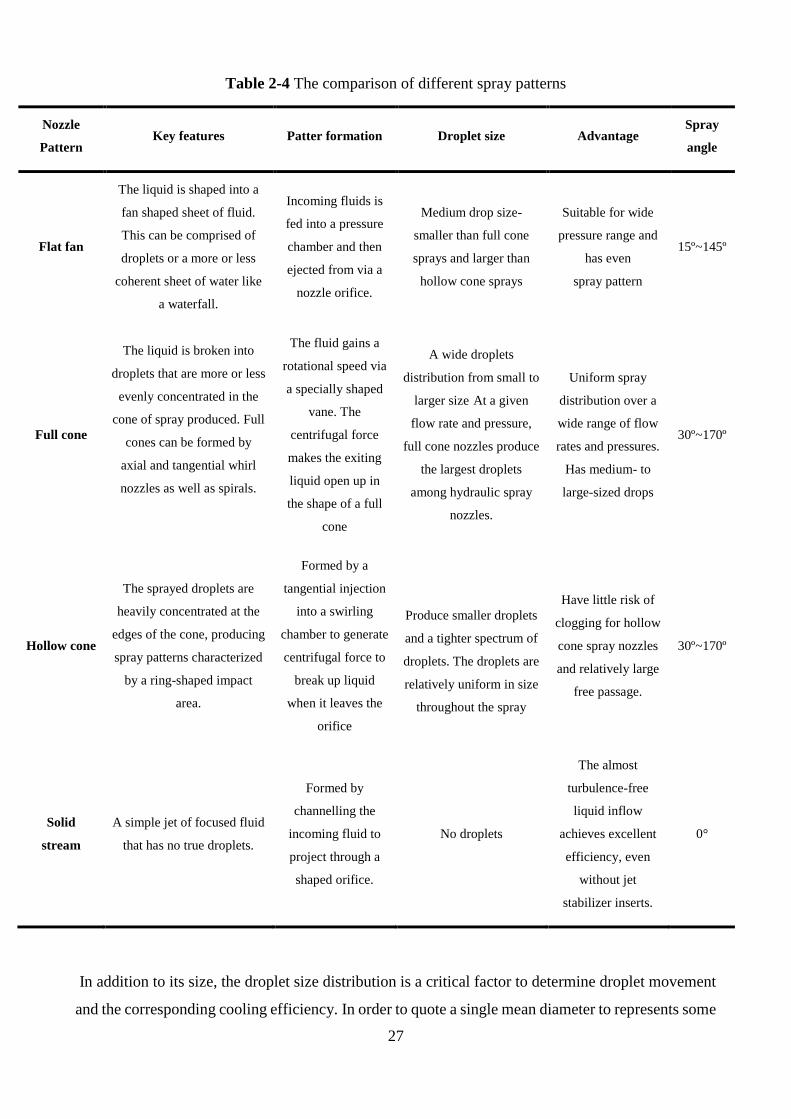
27
Table 2-4 The comparison of different spray patterns
Nozzle
Pattern Key features Patter formation Droplet size Advantage
Spray
angle
Flat fan
The liquid is shaped into a
fan shaped sheet of fluid.
This can be comprised of
droplets or a more or less
coherent sheet of water like
a waterfall.
Incoming fluids is
fed into a pressure
chamber and then
ejected from via a
nozzle orifice.
Medium drop size-
smaller than full cone
sprays and larger than
hollow cone sprays
Suitable for wide
pressure range and
has even
spray pattern
15º~145º
Full cone
The liquid is broken into
droplets that are more or less
evenly concentrated in the
cone of spray produced. Full
cones can be formed by
axial and tangential whirl
nozzles as well as spirals.
The fluid gains a
rotational speed via
a specially shaped
vane. The
centrifugal force
makes the exiting
liquid open up in
the shape of a full
cone
A wide droplets
distribution from small to
larger size At a given
flow rate and pressure,
full cone nozzles produce
the largest droplets
among hydraulic spray
nozzles.
Uniform spray
distribution over a
wide range of flow
rates and pressures.
Has medium- to
large-sized drops
30º~170º
Hollow cone
The sprayed droplets are
heavily concentrated at the
edges of the cone, producing
spray patterns characterized
by a ring-shaped impact
area.
Formed by a
tangential injection
into a swirling
chamber to generate
centrifugal force to
break up liquid
when it leaves the
orifice
Produce smaller droplets
and a tighter spectrum of
droplets. The droplets are
relatively uniform in size
throughout the spray
Have little risk of
clogging for hollow
cone spray nozzles
and relatively large
free passage.
30º~170º
Solid
stream
A simple jet of focused fluid
that has no true droplets.
Formed by
channelling the
incoming fluid to
project through a
shaped orifice.
No droplets
The almost
turbulence-free
liquid inflow
achieves excellent
efficiency, even
without jet
stabilizer inserts.
0°
In addition to its size, the droplet size distribution is a critical factor to determine droplet movement
and the corresponding cooling efficiency. In order to quote a single mean diameter to represents some
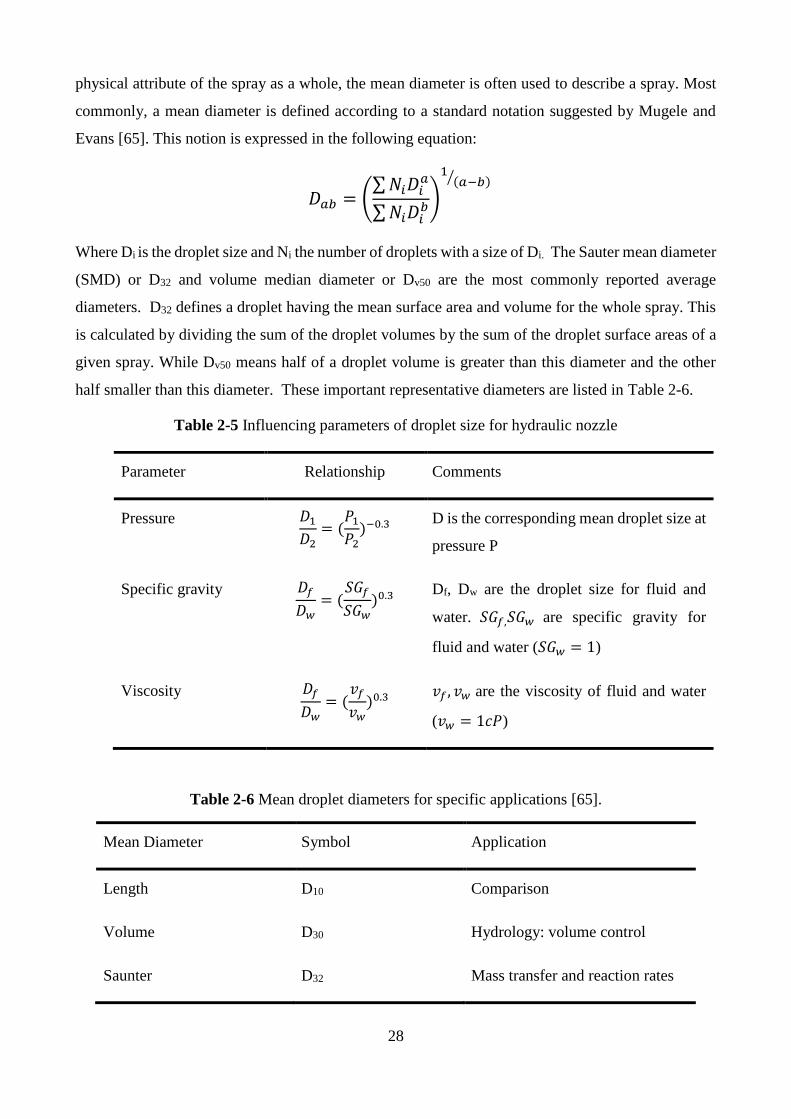
28
physical attribute of the spray as a whole, the mean diameter is often used to describe a spray. Most
commonly, a mean diameter is defined according to a standard notation suggested by Mugele and
Evans [65]. This notion is expressed in the following equation:
𝐷𝑎𝑏 = (∑𝑁𝑖𝐷𝑖
𝑎
∑𝑁𝑖𝐷𝑖𝑏)
1(𝑎−𝑏)⁄
Where Di is the droplet size and Ni the number of droplets with a size of Di. The Sauter mean diameter
(SMD) or D32 and volume median diameter or Dv50 are the most commonly reported average
diameters. D32 defines a droplet having the mean surface area and volume for the whole spray. This
is calculated by dividing the sum of the droplet volumes by the sum of the droplet surface areas of a
given spray. While Dv50 means half of a droplet volume is greater than this diameter and the other
half smaller than this diameter. These important representative diameters are listed in Table 2-6.
Table 2-5 Influencing parameters of droplet size for hydraulic nozzle
Parameter Relationship Comments
Pressure 𝐷1
𝐷2= (
𝑃1
𝑃2)−0.3
D is the corresponding mean droplet size at
pressure P
Specific gravity 𝐷𝑓
𝐷𝑤= (
𝑆𝐺𝑓
𝑆𝐺𝑤)0.3
Df, Dw are the droplet size for fluid and
water. 𝑆𝐺𝑓,𝑆𝐺𝑤 are specific gravity for
fluid and water (𝑆𝐺𝑤 = 1)
Viscosity 𝐷𝑓
𝐷𝑤= (
𝑣𝑓
𝑣𝑤)0.3
𝑣𝑓 , 𝑣𝑤 are the viscosity of fluid and water
(𝑣𝑤 = 1𝑐𝑃)
Table 2-6 Mean droplet diameters for specific applications [65].
Mean Diameter Symbol Application
Length D10 Comparison
Volume D30 Hydrology: volume control
Saunter D32 Mass transfer and reaction rates
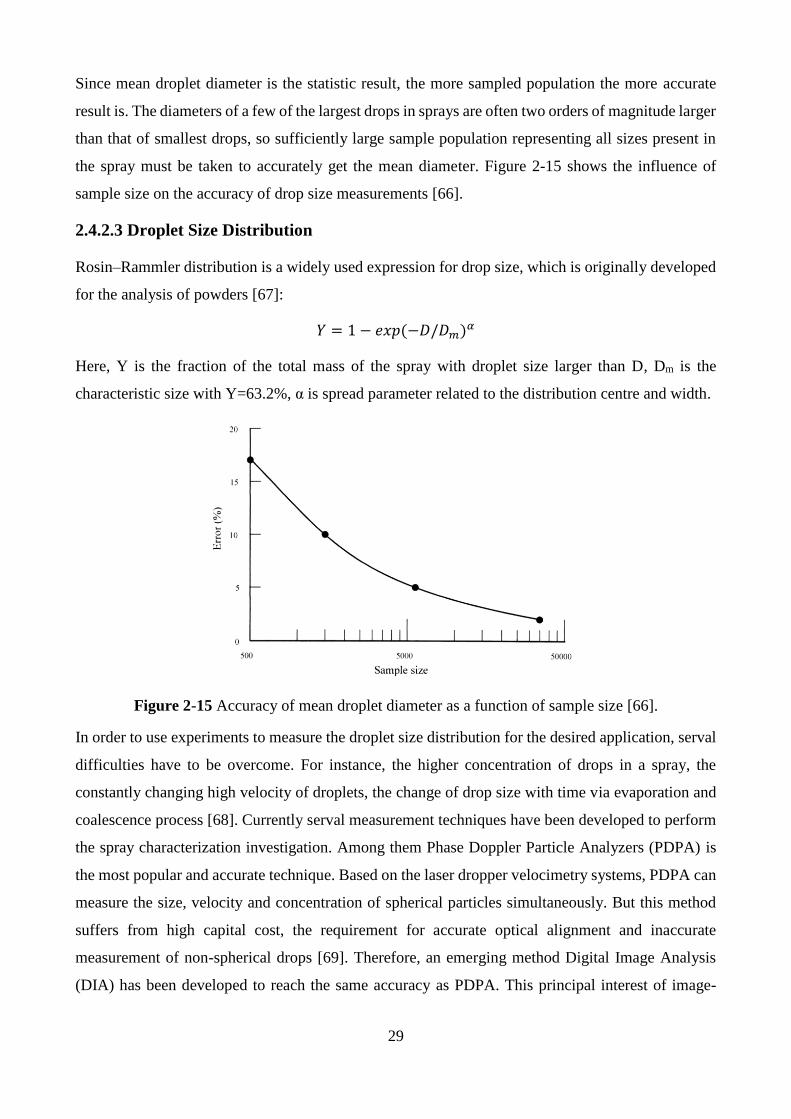
29
Since mean droplet diameter is the statistic result, the more sampled population the more accurate
result is. The diameters of a few of the largest drops in sprays are often two orders of magnitude larger
than that of smallest drops, so sufficiently large sample population representing all sizes present in
the spray must be taken to accurately get the mean diameter. Figure 2-15 shows the influence of
sample size on the accuracy of drop size measurements [66].
2.4.2.3 Droplet Size Distribution
Rosin–Rammler distribution is a widely used expression for drop size, which is originally developed
for the analysis of powders [67]:
𝑌 = 1 − 𝑒𝑥𝑝(−𝐷/𝐷𝑚)𝛼
Here, Y is the fraction of the total mass of the spray with droplet size larger than D, Dm is the
characteristic size with Y=63.2%, α is spread parameter related to the distribution centre and width.
Figure 2-15 Accuracy of mean droplet diameter as a function of sample size [66].
In order to use experiments to measure the droplet size distribution for the desired application, serval
difficulties have to be overcome. For instance, the higher concentration of drops in a spray, the
constantly changing high velocity of droplets, the change of drop size with time via evaporation and
coalescence process [68]. Currently serval measurement techniques have been developed to perform
the spray characterization investigation. Among them Phase Doppler Particle Analyzers (PDPA) is
the most popular and accurate technique. Based on the laser dropper velocimetry systems, PDPA can
measure the size, velocity and concentration of spherical particles simultaneously. But this method
suffers from high capital cost, the requirement for accurate optical alignment and inaccurate
measurement of non-spherical drops [69]. Therefore, an emerging method Digital Image Analysis
(DIA) has been developed to reach the same accuracy as PDPA. This principal interest of image-
30
based granulometry technique lies in its ability to quantitatively analyse the liquid element
morphology [70]. This DIA system has a good repeatability on sizing droplets and excellent capability
to determine fine-sized and fast-moving droplets [71].
2.4.2.4 Spray Angle
The spray angle of nozzle is determined by the feed pressure and the fluid characteristics. Higher feed
pressures usually mean larger spray angle. The appropriate spray angle of a nozzle has a great impact
on the area covered by the spray. Spray impact refers to the impingement of a spray upon its target.
It depends on a series of factors including droplet size, the gas velocity, the feed pressure as well as
the flow rate. The following formula is usually adopted to quantify spray impact:
I = KQ√𝑃
Where I is the theoretical spray impact, K is a nozzle-based constant, Q is the flow rate and P is the
liquid pressure.
From the aforementioned formula, it is obvious that larger flow rate and higher pressure would lead
to greater impact/momentum of the spray. Increasing the fluid pressure increases the overall internal
energy of the fluid. But how much of energy increase is used to atomise the spray and how much is
used to increase momentum and impact will depend on the nozzle design. A rule of thumb is that
solid stream nozzles are the most efficient at transferring energy into momentum, followed by flat
fans, then hollow cones finally thefull cone nozzles. It should be noted that energy-efficient nozzles
have high efficiency in using internal fluid energy to atomise the fluid though inefficient at energy
transfer. Hence, increasing pressure sometimes turns out to be less effective in certain nozzles to
obtain larger impact. For instance, for the nozzle efficient at atomising the spray, the increased high
pressure will result in finer droplets. These smaller drops inherently have less momentum and thus
the overall impact and projection of the spray will hardly be improved.
2.4.3 Transport Phenomenon in Spray Cooling
2.4.3.1 Heat and Mass Transfer
Spray cooling is a two-phase flow phenomenon including several simultaneous heat, mass and
momentum effects that are closely coupled. Specifically speaking, mass transfer results in vapour
concentration change and droplet diameter reduction, which in turn affects the aerodynamic drag
coefficient. Heat transfer would change droplet temperature, and the temperature change further
affects the evaporation rate. Momentum transfer determines the trajectory and velocity of droplet but
the resultant relative velocity between air and droplets controls the heat and mass transfer [72,73].
The heat, mass and momentum transfer are often interplaying thus frequently changing spray
31
parameters such as droplet size, heat transfer coefficient, mass transfer coefficient, relative velocity
and drag coefficient. Hence, a rigorous mathematical approach is required to analyse the coupled
transport phenomena. In order to investigate droplets thermodynamics, a simplified method is to study
the mass, energy and momentum conservations of a single droplet then generalize it to account for
spray parameters.
Spray cooling involves heat and mass transfer when a droplet is in direct contact with unsaturated air.
For a water drop floating in air or falling through air, the sensible heat of air would transfer to the
latent heat of droplets and will cause a decrease in drop size. In a quite short transient time, the droplet
evaporates and cools down to air ‘wet-bulb’ temperature. Meanwhile, a thin layer of saturated vapour
surrounds the droplet. Since the ambient air temperature is higher than that of the drop, heat flow
from the relatively hot air towards the drop ‘feeds’ the evaporation process. Generally, energy
exchange in this process is accomplished by three ways--the convective and radiative heat transfer,
and latent heat transfer caused by evaporated droplets. Since the temperature difference between
droplets and air is usually very small, the radiation term is often ignored [74]. The fact that the
temperature of sprayed water is generally higher than the wet-bulb temperature of air would make
water drops experience a temperature decrease to provide energy for droplet evaporation. The reduced
temperature of water leads to some sensible heat transferred between air and drops. In parallel, the
gradient in vapour pressure at the droplet surface introduces some water evaporation, removing some
heat from both droplet and air. When the water temperature drops to the air wet-bulb temperature, a
steady state evaporation will be observed. The latent heat of vaporization is compensated by the
unsaturated air, which results in a decline of the air dry-bulb temperature as well as an increase in
water vapour content. Theoretically, the air wet-bulb temperature is the lower limit for evaporative
cooling [75]. Once the rate of evaporation equals to the heat transferred from the air towards the
droplet, a thermostatic state is reached, which means droplets internal energy would remain constant.
2.4.3.2 Theoretical and Experimental Study
Kincaid and Longley developed a model to predict evaporation and temperature in water drops and
compared with laboratory data [76]. Both the sensible heat transfer and diffusion were considered in
the energy balance to simultaneously calculate evaporation as droplet temperature approaches wet
bulb temperature of the air. The experiment design was based on a volumetric method to measure
evaporation loss from 0.5 to 2 mm diameter drops after the droplet reached wet bulb temperature.
The predicted droplet temperatures agreed quite well with experimentally measured ones. Their study
showed that droplet size poses a great influence on the rate of droplet temperature change and the
time required to reach air wet-bulb temperature. For instance, droplets of 500 µm and Td =30 ℃ will
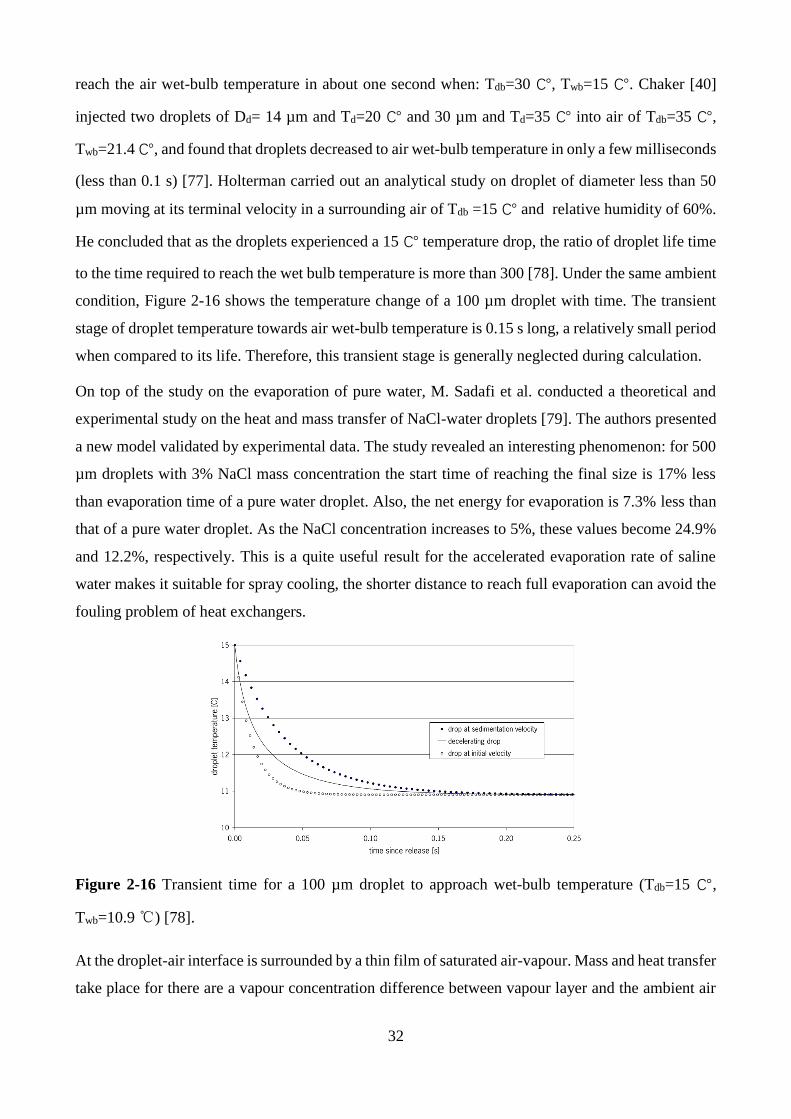
32
reach the air wet-bulb temperature in about one second when: Tdb=30 ℃, Twb=15 ℃. Chaker [40]
injected two droplets of Dd= 14 µm and Td=20 ℃ and 30 µm and Td=35 ℃ into air of Tdb=35 ℃,
Twb=21.4 ℃, and found that droplets decreased to air wet-bulb temperature in only a few milliseconds
(less than 0.1 s) [77]. Holterman carried out an analytical study on droplet of diameter less than 50
µm moving at its terminal velocity in a surrounding air of Tdb =15 ℃ and relative humidity of 60%.
He concluded that as the droplets experienced a 15 ℃ temperature drop, the ratio of droplet life time
to the time required to reach the wet bulb temperature is more than 300 [78]. Under the same ambient
condition, Figure 2-16 shows the temperature change of a 100 µm droplet with time. The transient
stage of droplet temperature towards air wet-bulb temperature is 0.15 s long, a relatively small period
when compared to its life. Therefore, this transient stage is generally neglected during calculation.
On top of the study on the evaporation of pure water, M. Sadafi et al. conducted a theoretical and
experimental study on the heat and mass transfer of NaCl-water droplets [79]. The authors presented
a new model validated by experimental data. The study revealed an interesting phenomenon: for 500
µm droplets with 3% NaCl mass concentration the start time of reaching the final size is 17% less
than evaporation time of a pure water droplet. Also, the net energy for evaporation is 7.3% less than
that of a pure water droplet. As the NaCl concentration increases to 5%, these values become 24.9%
and 12.2%, respectively. This is a quite useful result for the accelerated evaporation rate of saline
water makes it suitable for spray cooling, the shorter distance to reach full evaporation can avoid the
fouling problem of heat exchangers.
Figure 2-16 Transient time for a 100 µm droplet to approach wet-bulb temperature (Tdb=15 ℃,
Twb=10.9 ℃) [78].
At the droplet-air interface is surrounded by a thin film of saturated air-vapour. Mass and heat transfer
take place for there are a vapour concentration difference between vapour layer and the ambient air
33
and a temperature gradient between the surface and the air dry-bulb temperature. In order to simplify
the problem, temperature gradient within the droplet is neglected and spherical shape for the droplets
is widely accepted. The first assumption of the uniform temperature distribution within the droplet is
called “lumped capacitance”, which is characterized by the Biot number. Biot number comes from
the ratio of heat transfer coefficient on the droplet surface to heat conduction inside the droplet. For
small droplet sizes with Biot number smaller than 0.1, the lumped capacitance assumption is satisfied
[80]. Okaruma used a photographic technique to verify that the assumption of an average spherical
shape is reliable for fine droplets [81]. A further study performed by Hughes and Licht showed that
for a small-size droplet floating in air, it usually adopts spherical shape and droplet deformation is
closely related to its size [82,83].
Regardless of natural and forced convections, it is very difficult to analytically determine the
convective heat and mass transfer coefficients for a droplet flowing into air because the flow
characteristics are coupled with droplet Reynolds number [84]. A practical way to get these
coefficients is to use experimental data to derive some empirical correlations capable of describing
the heat and mass transfer developments. In spray cooling, droplets injected into a moving airflow
would experience a mass and heat transfer through forced convection and the relative velocity
between the droplets and the airflow depends on droplet Reynolds number [84]. In forced convection,
two dimensionless number--the Nusselt and Sherwood numbers are calculated to account for the
relative velocity influence on the mass and heat transfer for a droplet in motion.
Numerous studies have been focusing on the mass and heat transfer rate of a droplet moving into air.
Clift made a comprehensive review of these studies [85]. Different empirical correlations of Nusselt
and Sherwood numbers have been put forward in recent years [84,86,87]. Among them, Ranz and
Marshall correlation is frequently used and well validated for in the range of Reynolds number (Red
< 800) and air temperature (Ta < 220 ℃) [88].
The evaporation rate of droplets and the air temperature can be calculated based on heat and mass
transfer, but the droplet trajectory (velocity and position) is derived from the momentum conservation
equations between the droplet and the airflow. In spray cooling calculation, the heat, mass and
momentum transfer are interactively coupled and a realistic model must consider the constantly
changing droplet diameter and temperature as well as air properties. To be specific, mass transfer will
influence droplet diameter and then impacts the droplet drag coefficient. However, droplet
acceleration is proportional to the drag coefficient and negatively proportional to the droplet size
[89,90]. Similarly, Reynolds number impacts the heat and mass transfer and ought to be computed at
34
each time step. Consequently, momentum equations solved with heat and mass transfer conservation
equations must take into account their influences as well.
Newton’s second low of motion is used to calculate the trajectory of an evaporating spherical droplet
moving in a continuous airflow. The forces influencing the movement of a single droplet in airflow
include internal and external forces such as drag, gravity, buoyancy, and forces caused by pressure
gradient, thermophoresis and Basset effect [90,91]. Nevertheless, assuming that all droplets are
isolated and share spherical shapes, the droplet speed and direction are mainly determined by drag
and gravity. Previous studies demonstrated that other forces have a negligible effect in the evaporative
pre-cooling process. Buoyancy force, gradient and Basset forces can be neglected when compared
with drag and gravitational forces because the air to water density ratio is too small (ρa /ρw =10-3)
[92,93].
The drag coefficient is an important dimensionless number to calculate the drag force. It depends on
droplet Reynolds number as well as the shape of droplet [94]. Under the assumption of spherical
droplet, the drag coefficient solely depends on droplet Reynolds number. The theoretical prediction
of drag coefficient in the whole speed range is practically impossible, but for droplets moving in
Stokes flow (Red < 0.1), drag coefficient is given by 24
D
ed
CR
= and the term 24
D edC R is equal to 1
[78]. The increased Reynolds number will change the correlation between drag coefficient and droplet
Reynolds number changes and thus the empirical correlation is only valid for a small ranges of
Reynolds number.
The change of correlation in terms of Reynold number results from the flow separation around the
droplet. At high Reynold number range, drag force become significant and dominates the airflow
around the droplet, leading to some deviations from Stokes’ law [95]. Dozens of empirical
correlations were proposed to calculate drag coefficients for a spherical moving droplet. For instance,
Morsi and Alexander summarized spherical drag coefficient for Reynolds numbers ranging from 0.1
up to 5 x 10⁴ [96]. This general form for correlation between drag coefficient and Reynolds is
expressed as:
321 2D
ed ed
aaC a
R R= + +
where a1, a2, and a3 are constants for different range of Reynolds numbers.
Evaporative cooling efficiency depends mainly on the contact surface area between water and air, the
humidity of the surrounding air and particle residence time. Generally, extreme dry air has the
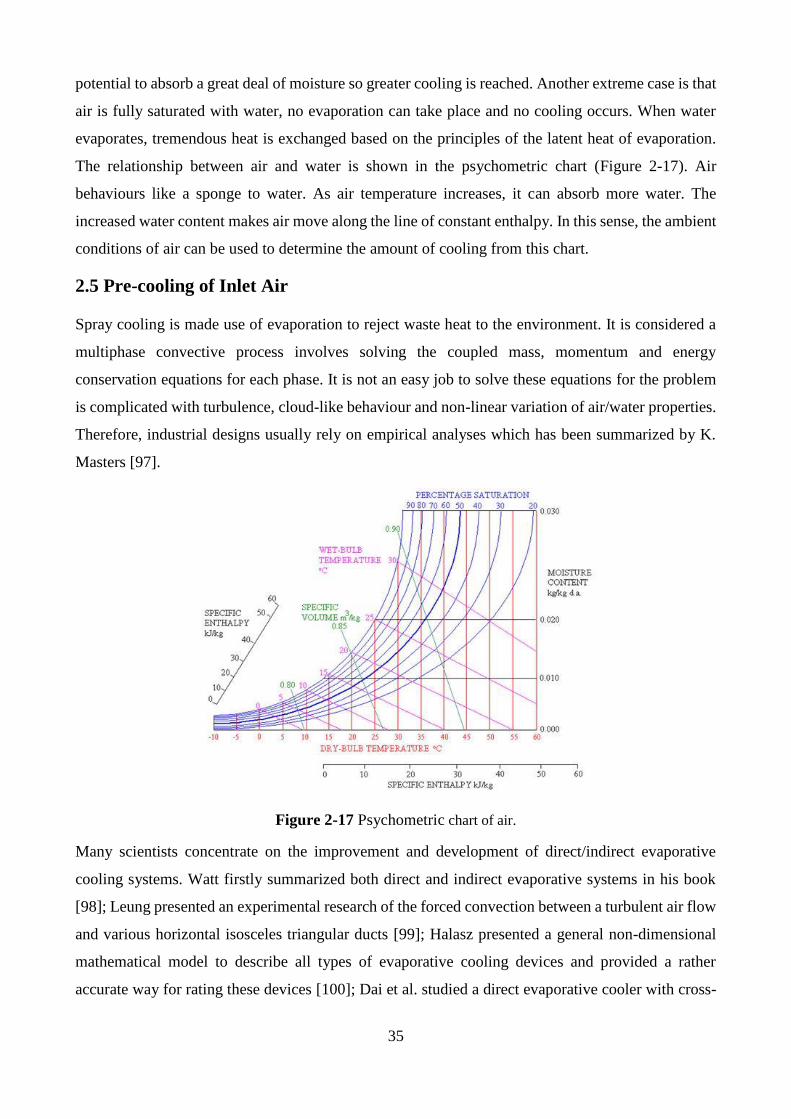
35
potential to absorb a great deal of moisture so greater cooling is reached. Another extreme case is that
air is fully saturated with water, no evaporation can take place and no cooling occurs. When water
evaporates, tremendous heat is exchanged based on the principles of the latent heat of evaporation.
The relationship between air and water is shown in the psychometric chart (Figure 2-17). Air
behaviours like a sponge to water. As air temperature increases, it can absorb more water. The
increased water content makes air move along the line of constant enthalpy. In this sense, the ambient
conditions of air can be used to determine the amount of cooling from this chart.
2.5 Pre-cooling of Inlet Air
Spray cooling is made use of evaporation to reject waste heat to the environment. It is considered a
multiphase convective process involves solving the coupled mass, momentum and energy
conservation equations for each phase. It is not an easy job to solve these equations for the problem
is complicated with turbulence, cloud-like behaviour and non-linear variation of air/water properties.
Therefore, industrial designs usually rely on empirical analyses which has been summarized by K.
Masters [97].
Figure 2-17 Psychometric chart of air.
Many scientists concentrate on the improvement and development of direct/indirect evaporative
cooling systems. Watt firstly summarized both direct and indirect evaporative systems in his book
[98]; Leung presented an experimental research of the forced convection between a turbulent air flow
and various horizontal isosceles triangular ducts [99]; Halasz presented a general non-dimensional
mathematical model to describe all types of evaporative cooling devices and provided a rather
accurate way for rating these devices [100]; Dai et al. studied a direct evaporative cooler with cross-
36
flow, a mathematical model has been developed and the analysis indicate that the optimized system
performance was reached by adjusting the operation parameters, such as the mass flow rates of feed
water and process air [101]; The performances of two evaporative cooled heat exchangers operating
under similar operating conditions were investigated by Hasan and Sirén. The study showed that wet-
finned surfaces suffer from lower fin efficiency when compared with the dry surfaces [102].
The abundance of research works on spray cooling system reflects the popularity of this technology.
Spray cooling system are widely used in warehouse cooling, nursery cooling, and greenhouse cooling
as well as the storage of meat, vegetables and fruits [62]. In addition to these generally civic
applications, spray cooling system plays a highly significant role in engineering world. It is widely
employed to cool the inlet air for dry coolers, gas turbines and dry cooling towers [27]. Here we just
narrow down the following topic to its application on dry cooling towers. In the following context, a
spray cooling system specifically designed to cool the inlet air of NDDCT is referred to as pre-cooling
of inlet air system. The mathematical descriptions and thermodynamic performance of this pre-
cooling system of inlet air are discussed in detail.
2.5.1 Mathematical Model
Simultaneous heat and mass transfer process is dominated by a group of complex differential
equations. Although the equations are easy to build, the most difficult part lies in obtaining the
solution of the equations. Previously, some assumptions are made to simplify the solution to obtain a
preliminary result. The first attempt was made by Fredrick Merkel in 1925.
Merkel developed a theory relating evaporation and sensible heat transfer for the counterflow contact
of water and air in cooling towers [103]. The core of that theory is to express the number of transfer
units (NTU) as a function of the integral of the temperature difference divided by the enthalpy
gradient in a cooling tower. In order to obtain a single separable ordinary differential equation
governing the heat and mass transfer for a counterflow cooling tower, Merkel made the following
simplifying assumptions:
1. The saturated air film has the same temperature with that of the bulk water.
2. The saturated air film has little resistance to heat transfer.
3. The vapor content of the air is proportional to the partial pressure of the water vapor.
4. The heat flux from the air to the film by convection is proportional to the heat flux from the film
to the ambient air by evaporation.
5. The constant specific heat of the air-water vapor mixture and constant heat of vaporization.
37
6. The loss of water by evaporation is negligible.
7. The force driving for heat transfer is the enthalpy difference between saturated and bulk air.
Using the four-point Tchebycheff method and the known boundary conditions, the differential
equations can be integrated and solved. In the past century, numerous studies were made to improve
the accuracy of Merkel model. These works are listed in Table 2-7.
In 1970s, Poppe and Rögener reported a more complicated and reliable model without most of the
simplifying assumptions of the Merkel method [104]. This assumption-free method is more accurate
than Merkel model and known as the exact model. Even though Poppe model neglects the liquid film
heat transfer resistance, it allows moist air to be supersaturated in the heat and mass transfer processes.
In 1989, Jaber and Webb exploited the effectiveness-number of transfer units (ɛ-NTU) method of
heat exchanger design and applied that to cooling towers, especially cross flow cooling towers [105].
The method assumed Lewis factor to be unity and a linear relationship between moist air saturation
enthalpy and temperature. Just like Merkel model, ɛ-NTU does not consider the effect of water film
heat transfer resistance and the effect of water loss by evaporation on the air process states along the
vertical length of the tower. But it divided the cooling range into two or more increments and then
used ɛ-NTU for each calculation of the increments. Calculations are performed to define the error
associated with different numbers of increments and that definition determines the number of
increments required to attain a desired degree of precision. Braun et al. improved ɛ-NTU method by
considering the effect of water evaporation on the air process states along the vertical length of the
tower [106]. But they only had results with the Lewis factor equal to unity. Dessouky came up a
modified ɛ-NTU model with the Lewis factor included, a multiplication factor to the enthalpy driving
potential [107]. Calculated from non-unity Lewis factors, this modified model gave appreciably
different results from that of an accurate simulation [108]. Fujita and Tezuka’s model used the
enthalpy potential theory to calculate the thermal performance of counter-flow and cross-flow [109].
The method recommends the calculation of NTU (number of transfer units) for counter-flow towers
by the Cooling Tower Institute method. Then the NTU for the crossflow tower can be calculated
using a correction factor.
Kloppers and Kröger made a comparative study of the Merkel, Poppe, and ɛ-NTU methods in 2005
[110]. The Merkel method underestimates Merkel number for the neglect of water loss by evaporation.
Both Merkel and Poppe analyses show little difference on the predicted outlet air temperatures when
the actual outlet air is supersaturated with water vapor. But the discrepancy in air temperature
predicted by these two models is obvious when the ambient air is relatively hot and dry, the outlet air
may be unsaturated. also says that the Poppe method predicts the water content of the exiting air
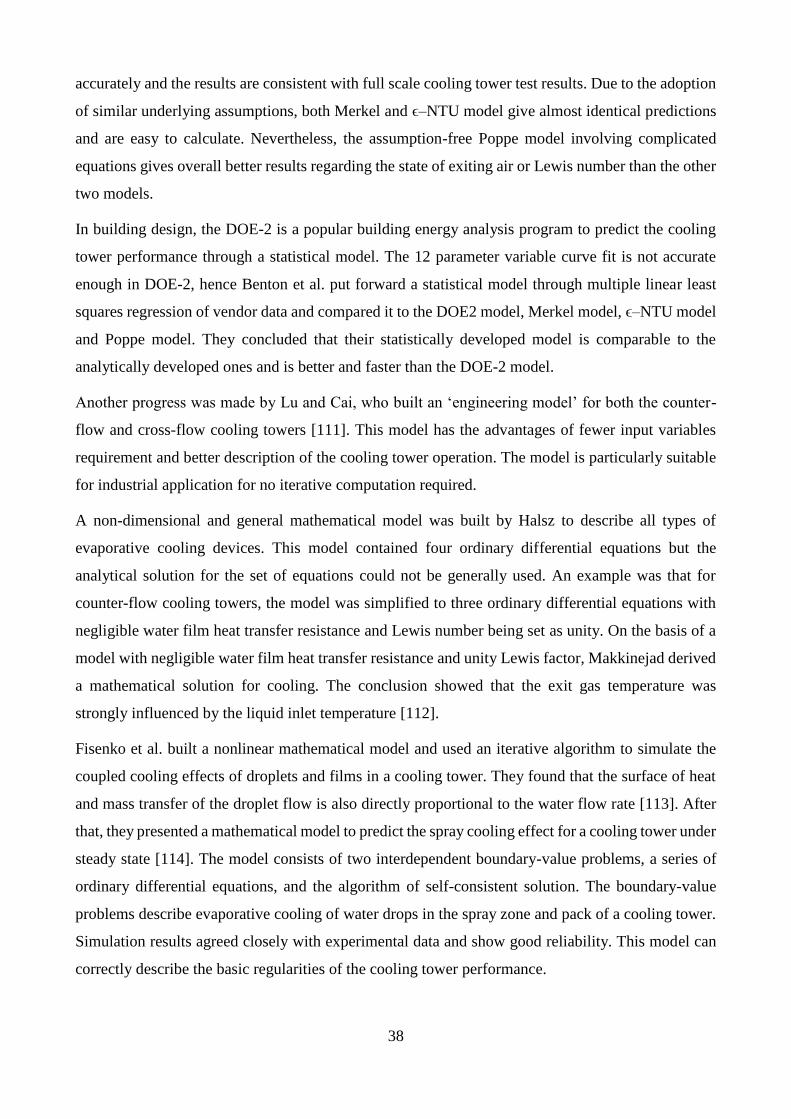
38
accurately and the results are consistent with full scale cooling tower test results. Due to the adoption
of similar underlying assumptions, both Merkel and ϵ–NTU model give almost identical predictions
and are easy to calculate. Nevertheless, the assumption-free Poppe model involving complicated
equations gives overall better results regarding the state of exiting air or Lewis number than the other
two models.
In building design, the DOE-2 is a popular building energy analysis program to predict the cooling
tower performance through a statistical model. The 12 parameter variable curve fit is not accurate
enough in DOE-2, hence Benton et al. put forward a statistical model through multiple linear least
squares regression of vendor data and compared it to the DOE2 model, Merkel model, ϵ–NTU model
and Poppe model. They concluded that their statistically developed model is comparable to the
analytically developed ones and is better and faster than the DOE-2 model.
Another progress was made by Lu and Cai, who built an ‘engineering model’ for both the counter-
flow and cross-flow cooling towers [111]. This model has the advantages of fewer input variables
requirement and better description of the cooling tower operation. The model is particularly suitable
for industrial application for no iterative computation required.
A non-dimensional and general mathematical model was built by Halsz to describe all types of
evaporative cooling devices. This model contained four ordinary differential equations but the
analytical solution for the set of equations could not be generally used. An example was that for
counter-flow cooling towers, the model was simplified to three ordinary differential equations with
negligible water film heat transfer resistance and Lewis number being set as unity. On the basis of a
model with negligible water film heat transfer resistance and unity Lewis factor, Makkinejad derived
a mathematical solution for cooling. The conclusion showed that the exit gas temperature was
strongly influenced by the liquid inlet temperature [112].
Fisenko et al. built a nonlinear mathematical model and used an iterative algorithm to simulate the
coupled cooling effects of droplets and films in a cooling tower. They found that the surface of heat
and mass transfer of the droplet flow is also directly proportional to the water flow rate [113]. After
that, they presented a mathematical model to predict the spray cooling effect for a cooling tower under
steady state [114]. The model consists of two interdependent boundary-value problems, a series of
ordinary differential equations, and the algorithm of self-consistent solution. The boundary-value
problems describe evaporative cooling of water drops in the spray zone and pack of a cooling tower.
Simulation results agreed closely with experimental data and show good reliability. This model can
correctly describe the basic regularities of the cooling tower performance.
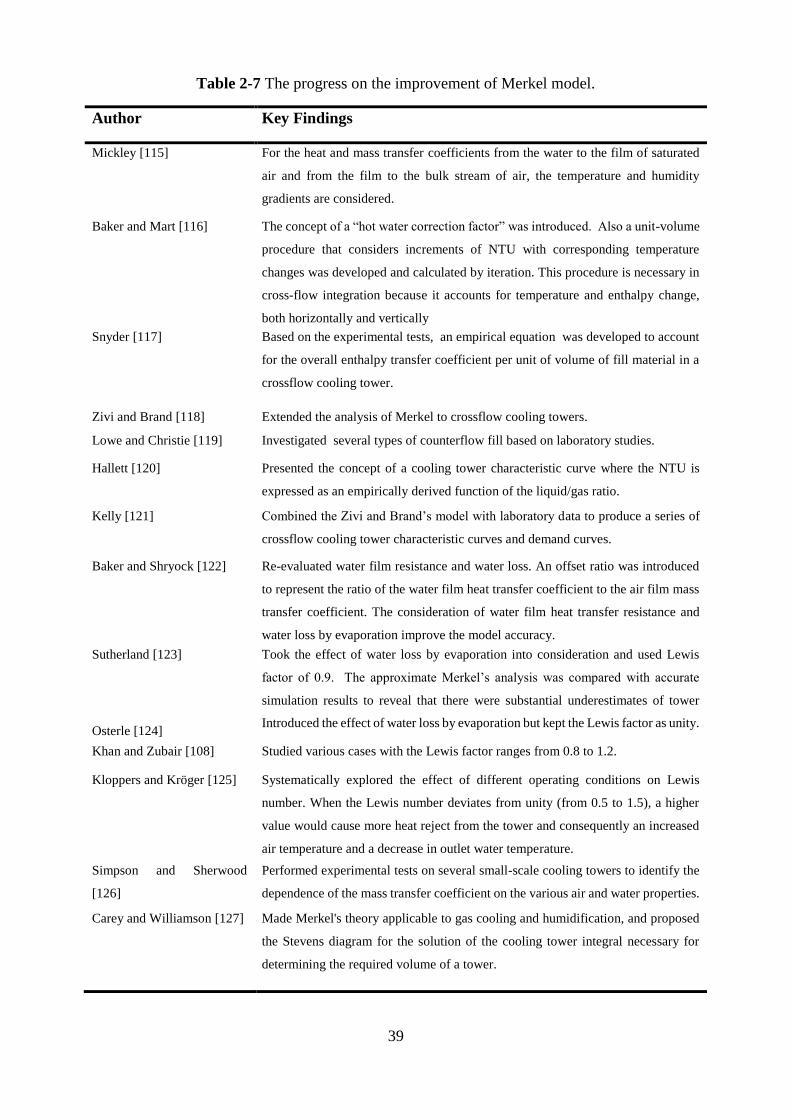
39
Table 2-7 The progress on the improvement of Merkel model.
Author Key Findings
Mickley [115] For the heat and mass transfer coefficients from the water to the film of saturated
air and from the film to the bulk stream of air, the temperature and humidity
gradients are considered.
Baker and Mart [116] The concept of a “hot water correction factor” was introduced. Also a unit-volume
procedure that considers increments of NTU with corresponding temperature
changes was developed and calculated by iteration. This procedure is necessary in
cross-flow integration because it accounts for temperature and enthalpy change,
both horizontally and vertically
Snyder [117] Based on the experimental tests, an empirical equation was developed to account
for the overall enthalpy transfer coefficient per unit of volume of fill material in a
crossflow cooling tower.
Zivi and Brand [118] Extended the analysis of Merkel to crossflow cooling towers.
Lowe and Christie [119] Investigated several types of counterflow fill based on laboratory studies.
Hallett [120] Presented the concept of a cooling tower characteristic curve where the NTU is
expressed as an empirically derived function of the liquid/gas ratio.
Kelly [121] Combined the Zivi and Brand’s model with laboratory data to produce a series of
crossflow cooling tower characteristic curves and demand curves.
Baker and Shryock [122] Re-evaluated water film resistance and water loss. An offset ratio was introduced
to represent the ratio of the water film heat transfer coefficient to the air film mass
transfer coefficient. The consideration of water film heat transfer resistance and
water loss by evaporation improve the model accuracy.
Sutherland [123] Took the effect of water loss by evaporation into consideration and used Lewis
factor of 0.9. The approximate Merkel’s analysis was compared with accurate
simulation results to reveal that there were substantial underestimates of tower
volume of from 5% to 15%. Osterle [124]
Introduced the effect of water loss by evaporation but kept the Lewis factor as unity.
Khan and Zubair [108] Studied various cases with the Lewis factor ranges from 0.8 to 1.2.
Kloppers and Kröger [125] Systematically explored the effect of different operating conditions on Lewis
number. When the Lewis number deviates from unity (from 0.5 to 1.5), a higher
value would cause more heat reject from the tower and consequently an increased
air temperature and a decrease in outlet water temperature.
Simpson and Sherwood
[126]
Performed experimental tests on several small-scale cooling towers to identify the
dependence of the mass transfer coefficient on the various air and water properties.
Carey and Williamson [127] Made Merkel's theory applicable to gas cooling and humidification, and proposed
the Stevens diagram for the solution of the cooling tower integral necessary for
determining the required volume of a tower.
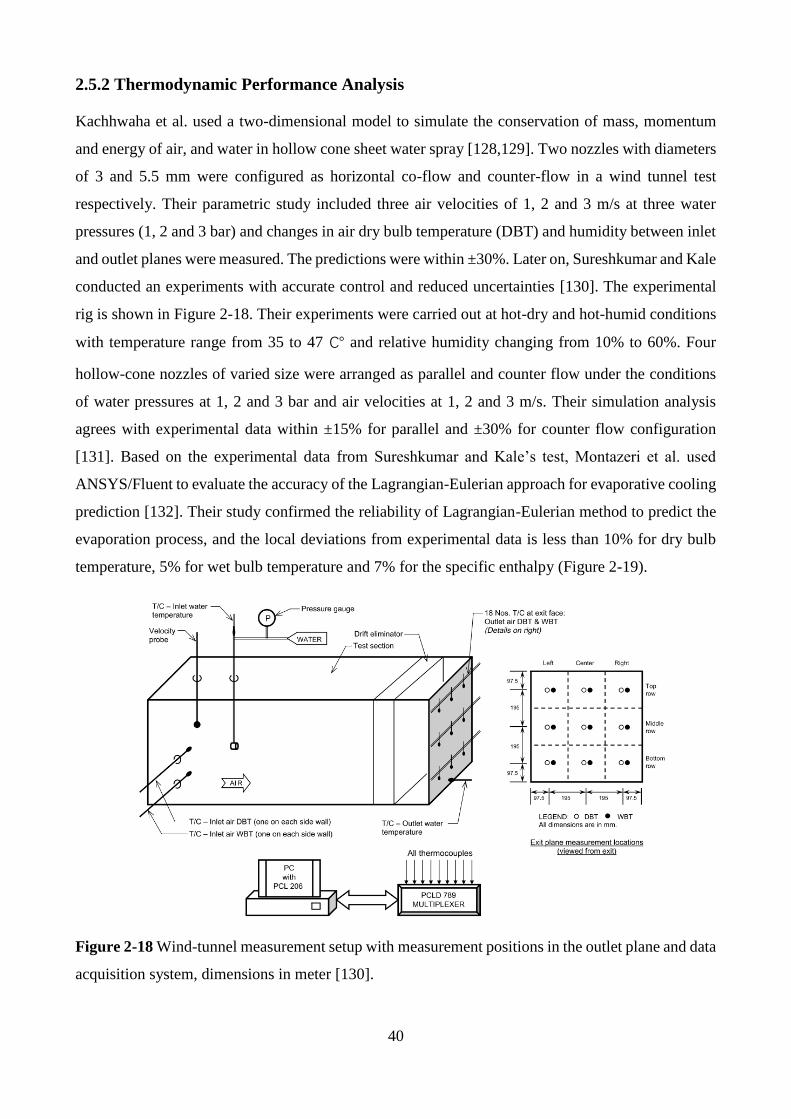
40
2.5.2 Thermodynamic Performance Analysis
Kachhwaha et al. used a two-dimensional model to simulate the conservation of mass, momentum
and energy of air, and water in hollow cone sheet water spray [128,129]. Two nozzles with diameters
of 3 and 5.5 mm were configured as horizontal co-flow and counter-flow in a wind tunnel test
respectively. Their parametric study included three air velocities of 1, 2 and 3 m/s at three water
pressures (1, 2 and 3 bar) and changes in air dry bulb temperature (DBT) and humidity between inlet
and outlet planes were measured. The predictions were within ±30%. Later on, Sureshkumar and Kale
conducted an experiments with accurate control and reduced uncertainties [130]. The experimental
rig is shown in Figure 2-18. Their experiments were carried out at hot-dry and hot-humid conditions
with temperature range from 35 to 47 ℃ and relative humidity changing from 10% to 60%. Four
hollow-cone nozzles of varied size were arranged as parallel and counter flow under the conditions
of water pressures at 1, 2 and 3 bar and air velocities at 1, 2 and 3 m/s. Their simulation analysis
agrees with experimental data within ±15% for parallel and ±30% for counter flow configuration
[131]. Based on the experimental data from Sureshkumar and Kale’s test, Montazeri et al. used
ANSYS/Fluent to evaluate the accuracy of the Lagrangian-Eulerian approach for evaporative cooling
prediction [132]. Their study confirmed the reliability of Lagrangian-Eulerian method to predict the
evaporation process, and the local deviations from experimental data is less than 10% for dry bulb
temperature, 5% for wet bulb temperature and 7% for the specific enthalpy (Figure 2-19).
Figure 2-18 Wind-tunnel measurement setup with measurement positions in the outlet plane and data
acquisition system, dimensions in meter [130].
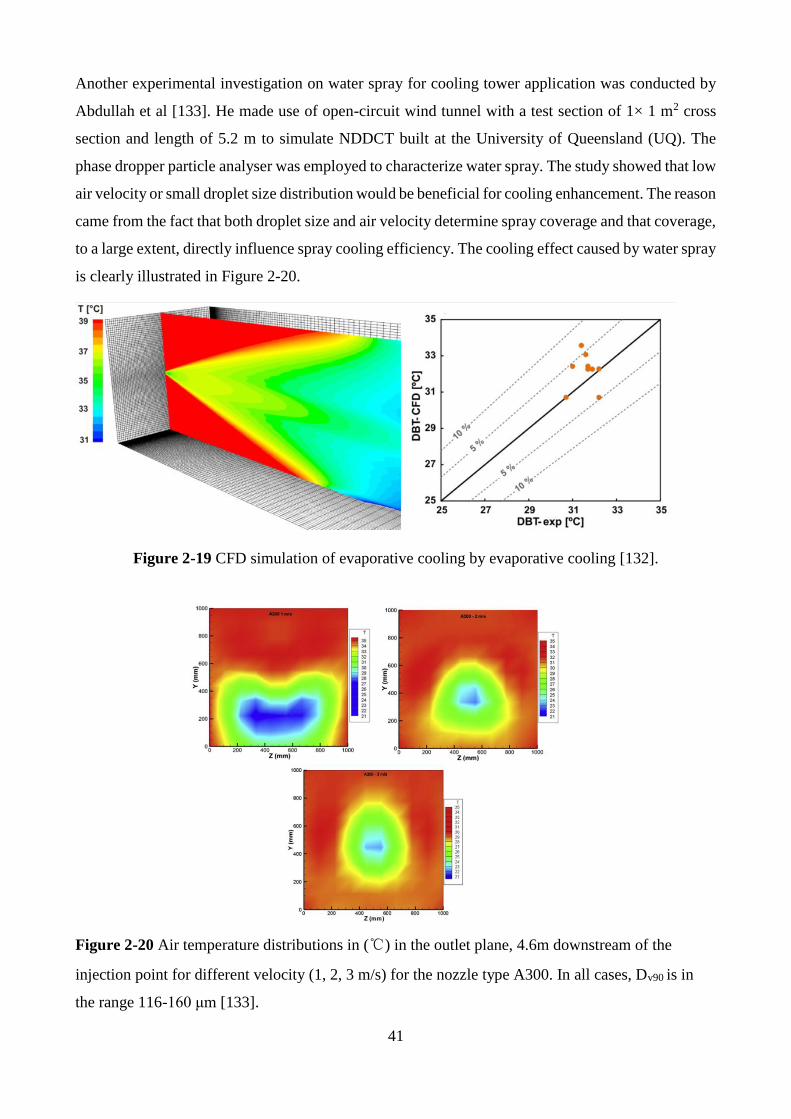
41
Another experimental investigation on water spray for cooling tower application was conducted by
Abdullah et al [133]. He made use of open-circuit wind tunnel with a test section of 1× 1 m2 cross
section and length of 5.2 m to simulate NDDCT built at the University of Queensland (UQ). The
phase dropper particle analyser was employed to characterize water spray. The study showed that low
air velocity or small droplet size distribution would be beneficial for cooling enhancement. The reason
came from the fact that both droplet size and air velocity determine spray coverage and that coverage,
to a large extent, directly influence spray cooling efficiency. The cooling effect caused by water spray
is clearly illustrated in Figure 2-20.
Figure 2-19 CFD simulation of evaporative cooling by evaporative cooling [132].
Figure 2-20 Air temperature distributions in (℃) in the outlet plane, 4.6m downstream of the
injection point for different velocity (1, 2, 3 m/s) for the nozzle type A300. In all cases, Dv90 is in
the range 116-160 μm [133].
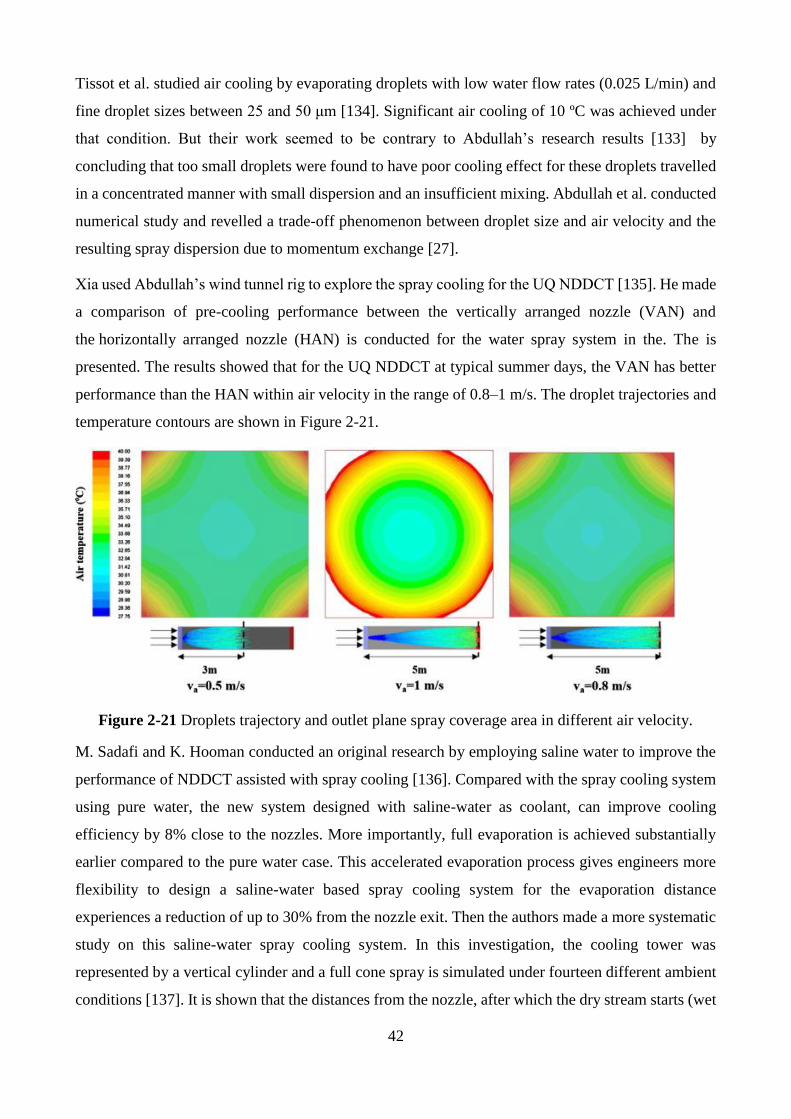
42
Tissot et al. studied air cooling by evaporating droplets with low water flow rates (0.025 L/min) and
fine droplet sizes between 25 and 50 μm [134]. Significant air cooling of 10 ºC was achieved under
that condition. But their work seemed to be contrary to Abdullah’s research results [133] by
concluding that too small droplets were found to have poor cooling effect for these droplets travelled
in a concentrated manner with small dispersion and an insufficient mixing. Abdullah et al. conducted
numerical study and revelled a trade-off phenomenon between droplet size and air velocity and the
resulting spray dispersion due to momentum exchange [27].
Xia used Abdullah’s wind tunnel rig to explore the spray cooling for the UQ NDDCT [135]. He made
a comparison of pre-cooling performance between the vertically arranged nozzle (VAN) and
the horizontally arranged nozzle (HAN) is conducted for the water spray system in the. The is
presented. The results showed that for the UQ NDDCT at typical summer days, the VAN has better
performance than the HAN within air velocity in the range of 0.8–1 m/s. The droplet trajectories and
temperature contours are shown in Figure 2-21.
Figure 2-21 Droplets trajectory and outlet plane spray coverage area in different air velocity.
M. Sadafi and K. Hooman conducted an original research by employing saline water to improve the
performance of NDDCT assisted with spray cooling [136]. Compared with the spray cooling system
using pure water, the new system designed with saline-water as coolant, can improve cooling
efficiency by 8% close to the nozzles. More importantly, full evaporation is achieved substantially
earlier compared to the pure water case. This accelerated evaporation process gives engineers more
flexibility to design a saline-water based spray cooling system for the evaporation distance
experiences a reduction of up to 30% from the nozzle exit. Then the authors made a more systematic
study on this saline-water spray cooling system. In this investigation, the cooling tower was
represented by a vertical cylinder and a full cone spray is simulated under fourteen different ambient
conditions [137]. It is shown that the distances from the nozzle, after which the dry stream starts (wet
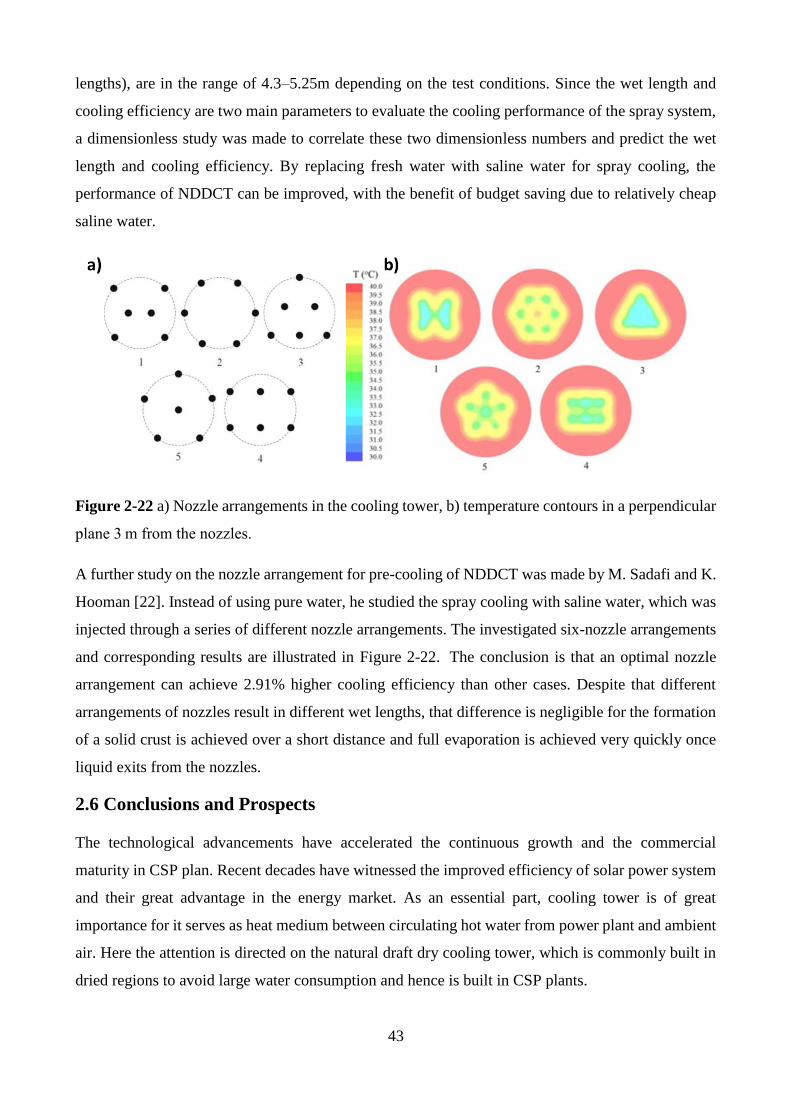
43
lengths), are in the range of 4.3–5.25m depending on the test conditions. Since the wet length and
cooling efficiency are two main parameters to evaluate the cooling performance of the spray system,
a dimensionless study was made to correlate these two dimensionless numbers and predict the wet
length and cooling efficiency. By replacing fresh water with saline water for spray cooling, the
performance of NDDCT can be improved, with the benefit of budget saving due to relatively cheap
saline water.
Figure 2-22 a) Nozzle arrangements in the cooling tower, b) temperature contours in a perpendicular
plane 3 m from the nozzles.
A further study on the nozzle arrangement for pre-cooling of NDDCT was made by M. Sadafi and K.
Hooman [22]. Instead of using pure water, he studied the spray cooling with saline water, which was
injected through a series of different nozzle arrangements. The investigated six-nozzle arrangements
and corresponding results are illustrated in Figure 2-22. The conclusion is that an optimal nozzle
arrangement can achieve 2.91% higher cooling efficiency than other cases. Despite that different
arrangements of nozzles result in different wet lengths, that difference is negligible for the formation
of a solid crust is achieved over a short distance and full evaporation is achieved very quickly once
liquid exits from the nozzles.
2.6 Conclusions and Prospects
The technological advancements have accelerated the continuous growth and the commercial
maturity in CSP plan. Recent decades have witnessed the improved efficiency of solar power system
and their great advantage in the energy market. As an essential part, cooling tower is of great
importance for it serves as heat medium between circulating hot water from power plant and ambient
air. Here the attention is directed on the natural draft dry cooling tower, which is commonly built in
dried regions to avoid large water consumption and hence is built in CSP plants.
44
In this paper, the research progress regarding mathematical models, CFD and experimental studies
on NDDCT are summarized in details. Then the spray cooling system is introduced and described in
the following part. The system consists of a number of spray nozzles. Different nozzles produce
different spray patterns such as flat-fan, hollow cone, full cone and solid jet. To characterize these
varied spray patterns, the corresponding flow rate, pressure, mean droplet size and droplet size
distribution should be quantified. The influencing parameters are stated to determine a specific spray
pattern. Furthermore, the governing equations controlling the droplet evaporation process are also
compared based on their assumptions and conclusions. Lastly the evaporative cooling involved in the
pre-cooling system is firstly described mathematically. Then some literatures are presented to
evaluate the performance of the pre-cooling system. Their results illustrate that the inlet air pre-
cooling would improve the efficiency of NDDCT and thus reduce power generation loss under high-
ambient conditions.
In contrast to the wide application of pre-cooling the gas turbine fogging, the reports on the adoption
of spray cooling for NDDCT is not satisfactory. A lot of problems should be resolved before the wide
industrial applications of pre-cooling for NDDCT. To achieve best cooling performance, several
nozzles should be used simultaneously to cool the hot air to the maximal extent possible. By
integrating a plurality of nozzles, pre-cooling system based on multiple nozzles, is supposed to be
used. Therefore, further study should be made to explore effects of the uniformity of flow rate and
droplet flux on cooling results. Efforts should be made to adjust nozzle position and orientation to
achieve best mixing between drops and air and thus optimize droplet distribution and avoid droplet
collision.
As the key component of a pre-cooling system, spray nozzle has a determinative effect on spray
characteristics and heat transfer performance. Instead of just focusing on single nozzle study, nozzle
array by putting a series of single nozzles together to cool large volume of air should be used. It
provides some advantages like uniform spray cones and free combinations. Therefore, both
experimental and theoretical study are expected to provide some guidance for efficient nozzle array
design. More significantly, it is a worthwhile topic to investigate the combination and arrangement
of different types of nozzle for the sake of enhanced cooling capacity.
Another consideration essential for pre-cooling system design is the influence of turbulent dispersion
on droplet transport, which has a significant impacts on the cooling achievement. Since the spray
flow is subject to the turbulent airflow, it will be greatly influenced by the turbulent intensity of
ambient air. This is particular true when wind effect is taken into consideration. More studies are
needed as to what happens to droplets inside a spray when a group of droplets is released at a location

45
of a variable wind velocity profile. The coupling between air flow and water spray inherent in this
phenomenon ought to be clearly stated.
The last concern for the future application of pre-cooling system on NDDCT is related to
meteorological conditions such as wind direction, air temperature and relative humidity. Since most
cooling towers are built in the wild, so the operation and performance of pre-cooling system is
undoubtedly be susceptible to the meteorological conditions. The continuously changing natural
conditions pose high requirement for pre-cooling system to maintain its stability and efficiency. To
what extent this cooling system is influenced by meteorological conditions and how to mitigate the
adverse influence needs careful investigations.
Briefly speaking, there is a long way to go and more insightful and integrated researches on pre-
cooling technology are expected to put it into engineering practice. It is only when we can solve all
the related problems can we use it to improve the efficiency of NDDCT and produce more energy
with lower cost.
46
Chapter 3 Numerical Model Development and Validation for Sprays
by Pressure-swirl Atomizers
This Chapter is based on my paper published in Energy. This chapter presents both the numerical and
experimental studies on the macroscopic spray structure and spray characteristics of sprays generated
by a pressure swirl atomizer. A 3D model based on the Eulerian-Lagrangian scheme has been
developed to predict the droplet dynamics within the spray. The model predictions are consistent with
the spatial variation of the droplet size and velocity recorded by the Phase Doppler Particle Analyser
(PDPA) from the wind tunnel tests. The robust model is quite useful in predicting the structures and
characteristics of co-flow sprays produced by pressure-swirl atomizers. The study reveals an
interesting phenomenon, i.e., the entrainment effect and intense central-region atomization cause
small droplets to concentrate on the spray axis and large droplets to dominate in the peripheral region
of the spray.
47
Numerical and experimental study on the spray characteristics of hollow-cone
pressure swirl atomizers
Yubiao Sun1, Abdullah M. Alkhedhair2, Zhiqiang Guan1, Kamel Hooman1
1 School of Mechanical and Mining Engineering, The University of Queensland, Brisbane 4072, Australia
2 King Abdulaziz City for Science and Technology, Riyadh 12371, Saudi Arabia
Energy 160 (2018) 678-692
Abstract: Numerical and experimental studies have been performed to investigate the macroscopic
spray structure and spray characteristics of sprays generated by a hollow-cone pressure swirl atomizer.
The simulation employs Eulerian-Lagrangian scheme to account for the multiphase flow and the
linearized instability sheet atomization model to predict film formation, sheet breakup and
atomization. Reynolds-Averaged Navier–Stokes (RANS) equations are solved for turbulent gas flow.
The model predictions show great consistency with the experimental measurements of the spatial
variation of the droplet size and velocity obtained from Phase Doppler Particle Analyser (PDPA).
The robustness of this model makes it useful to predict the structures and characteristics of co-flow
sprays produced by pressure-swirl atomizers. This particular spray is quite important in spray cooling
application but is not extensively studied. The study reveals that the entrainment effect and intense
central-region atomization cause small droplets to concentrate on the spray axis and large droplets to
dominate in the peripheral region of the spray. This finding is consistent with the observation that
turbulence kinetic energy of air is maximum near the nozzle exit, where atomization is intense and
momentum exchange is strong, and gradually decreases in both radial and axial directions. Moreover,
the drops inside the hollow cone are relatively small, and evaporate more easily than their large
counterparts in the peripheral region, hence removing substantial sensible heat from surrounding air
and creating low-temperature region in the central of the spray.
Keywords: Atomization and spray, Sauter mean diameter, pressure swirl atomizers, hollow cone,
evaporation
3.1 Introduction
Liquid spray is widely used in many industrial processes, such as inlet air cooling for gas turbines
and cooling towers [5,133,138], building comfort [139], electronic chip cooling [140], firefighting
[141], fuel injection for burners [142], food processing [143], internal combustion [144], etc. To
improve the performance of the injector nozzles, a profound understanding of the liquid spray is
necessary. Atomization, the process of disintegrating bulk fluid into a multitude of individual droplets,
is found to be the key process influencing the behaviour of spray.
48
Pressure swirl atomizers refer to low-speed spray devices designed to convert bulk liquid into fine
drops. These drops then travel in gaseous media and result in spray formation. Obtaining energy from
the pressure, the injection drops can attain a high velocity relative to the surrounding gas [67].
Introduction of the swirl atomizer helps to form a centrifugal force, facilitating a swirling motion and
spreading liquids as a conical sheet after it leaves the orifice [145]. The pressure atomizers can be
divided into two categories [146]: the hollow-cone and the solid-cone. Droplets generated through
the former nozzles mainly concentrate at the outer edge of a conical spray pattern, while those
produced by the latter always show a uniformly distribution over its impact area.
Compared to the solid-cone, hollow-cone nozzles can generate a much finer and atomized liquid flow,
producing spray patterns resemble a ring-shaped impact area. Entering a hollow cone pressure-swirl
atomizer, the liquid will be forced to a swirl chamber via some tangential ports to obtain a high
angular momentum, and thus create an air-cored vortex. During this process, the air-core blocks a
part of the nozzle outlet orifice. The rotating liquid, under both axial and radial forces, emerges from
the final orifice of the atomizer and spread into the shape of conical sheets. The sheet’s thickness
decreases as it expands with wave instability. Then the unstable sheet will disintegrate into ligaments
and drops in the form of a well-defined hollow-cone spray. Disintegration of the sheet is mainly
determined by the liquid discharge velocity and thus by the liquid injection pressure. The relative
magnitude of the tangential and axial components of exit velocity influence the actual cone angle of
the discharging nozzle [67]. The fine drops produced by hollow cone nozzles create sprays with a
larger exposed total surface or contact area than other hydraulic nozzles. The increased contact area
of the sprayed fluid with the exposing airflow makes them ideal for certain applications.
Chaker et al [147,148] highlighted three key influential variables to determine drop size: air velocity,
injection pressure and measurement location downstream of nozzle tip. Besides, the temperature and
air humidity only exert a limited impact on the spray formation and the drop size. Durdina et al.
applied Phase-Doppler Particle Analyzer (PDPA) and Particle Image velocimetry (PIV) to explore
the spray characteristics created through a pressure-swirl atomizer [149]. When the gauge pressure
remains low, liquid mass would concentrate on the spray axis. When the injection pressure gets higher,
however, mass flow maxima and local velocity in the spray periphery would become dominant,
creating a hollow-cone spray. Chen et al. adopted experimental method to explore atomization and
spray of both diesel fuels and some renewable alternatives [150]. They suggested that spray tip
penetration is directly proportionate to the injection pressure, time duration, but inversely related to
the ambient pressure. And the spray cone angle will become larger as the ambient pressure grows.
Jain et al. experimentally investigate the impact of Reynolds number on the characteristics of a
pressure swirl nozzle [151]. Based on the inviscid theory, they found that coefficient of discharge is
49
independent of the Reynolds number. Both the spray cone angle and Sauter mean diameter decrease
with the growth of Reynolds number. Hong et al. collected numerous experimental data related to a
pressure-swirl atomizers with low nozzle opening coefficient and finally proposed a novel empirical
model to accurately predict its discharge coefficient [152]. Dorfner et al. found that mean drop sizes
in the spray grow with the surface tension of the liquid against the ambient medium, a result caused
by a shift of the entire drop size spectrum towards larger diameters [153]. Moreover, the selective
increase of numbers of large drops explains the larger mean drop sizes due to an increase of the liquid
dynamic viscosity. Azami et al. came up with their modelling results of evaporation and spray
penetration for alternative fuels [154]. They revealed that high initial temperature and velocity, on
the one hand, accelerate evaporation rate. While on the other hand, it can lead to a shorter penetration
and the high initial velocity produces a greater penetration.
Water spray used for evaporative cooling is commonly employed in building design to enhance
thermal comfort in indoor environments. With validations against the wind tunnel experimental
measurements, Montazeri et al. [132] demonstrated that the Lagrangian–Eulerian (3D steady RANS)
approach can accurately predict the evaporative cooling by water spray. Their calculations show that
the average deviations for dry and wet bulb temperature, the specific enthalpy are less than 3% in
absolute values. They also furthered spray cooling study by conducting detailed analysis of hollow-
cone nozzle produced spray under different physical conditions [155]. An interesting finding is that
even if injecting water droplets with lower temperatures have better cooling performance than those
with higher temperatures, the high-temperature water above the dry-bulb temperature of the air, can
still provide sensible cooling. It is also shown that wider drop-size distributions can enhance sprays
cooling performance.
Santolaya et al. [156] used PDPA to characterize the hollow-cone spray structure near field for
different sheet disintegration regimes: perforations and surface wave instabilities. They concluded
that a notably finer spray with a higher radial dispersion was obtained from wavy-sheet disintegration
than that from perforated-sheet disintegration. Shim et al. [157] proposed a hybrid breakup model to
predict hollow-cone fuel spray from a high-pressure swirl injector. The primary breakup was
accounted for by the Linearized Instability Sheet Atomization (LISA) model while the secondary
breakup process was modelled by the Aerodynamically Progressed Taylor Analogy Breakup
(APTAB) model, which also accounts for the droplet deformation under aerodynamic external force.
The predicted results agree well with experimental data obtained from Laser Induced Exciplex
Fluorescence (LIEF) technique and the Phase Doppler Anemometry (PDA) system. Chang et al. [158]
investigated the two-phase turbulent structure in an isothermal hollow-cone spray theoretically and
experimentally. Turbulent dispersion effects were numerically simulated using a Monte Carlo method.
50
They even employed turbulence modulation model but found it has negligibly small influences on
the continuous-phase predictions. Theoretical calculations based on the Eulerian-Lagrangian
formulism turn out to match well with the experimental results from PDPA measurements. Asheim
et al. [159] developed a model to simulate droplets stochastically and accounts for "drop-drop" effects
by permitting droplet collisions that result in coalescence or breakup. Their collision model predicted
droplet velocities very well but overpredicted droplet trajectory angles and underpredicted droplet
sizes, regardless of whether collisions were neglected or included.
According to existing literature, most researchers prefer to use experimental approach to investigate
both the atomization and cross-flow or counter-flow spray of the pressure-swirl nozzles. Even some
simulation work has been done previously [160–162], their primary focus was on the flow conditions
inside the atomizers, which is critical to nozzle design. Nevertheless, the details of the structures and
characteristics of co-flow sprays produced by pressure-swirl atomizers are not so readily available.
Henceforth, the aim of the present study is to close this gap by providing a reliable spray model to
capture the aerodynamic features of the hollow-cone spray produced by the pressure-swirl atomizer.
Hollow cone pressure swirl atomizers are frequently applied to produce a spray comprising a large
number of droplets, typically the order of 10–1000 μm in diameter. The most challenging part of this
work is the implementation of numerical simulations of droplet dynamics and heat and mass transfer
process in a turbulent, two-phase flow. Specifically, the complex phenomena such as primary and
secondary atomization, turbulent dispersion, droplet evaporation, droplet collisions and splashing in
two-phase flow field need to be carefully treated to accurately represent the physical phenomenon.
The paper is organized as follows: Section 2 presents necessary theoretical knowledge used in
atomization and spray simulation, Section 3 gives a brief description about experimental approach
carried out for the drop size and velocity measurements in sprays from pressure-swirl atomizers.
Section 4 compares the simulation results with experimental data for model validation. Section 5
discusses both simulation and experimental findings in great depth. Finally Section 6 summarizes all
the findings in this study.
3.2 Numerical Simulation
3.2.1 Continuous Phase (Air)
The continuous gas flow is described by the Reynolds-Averaged Navier-Stokes (RANS) conservation
equations. The conservation, momentum and energy equations are shown below [163]:
( ) Sj m
j
ut x
+ =
(3-1)
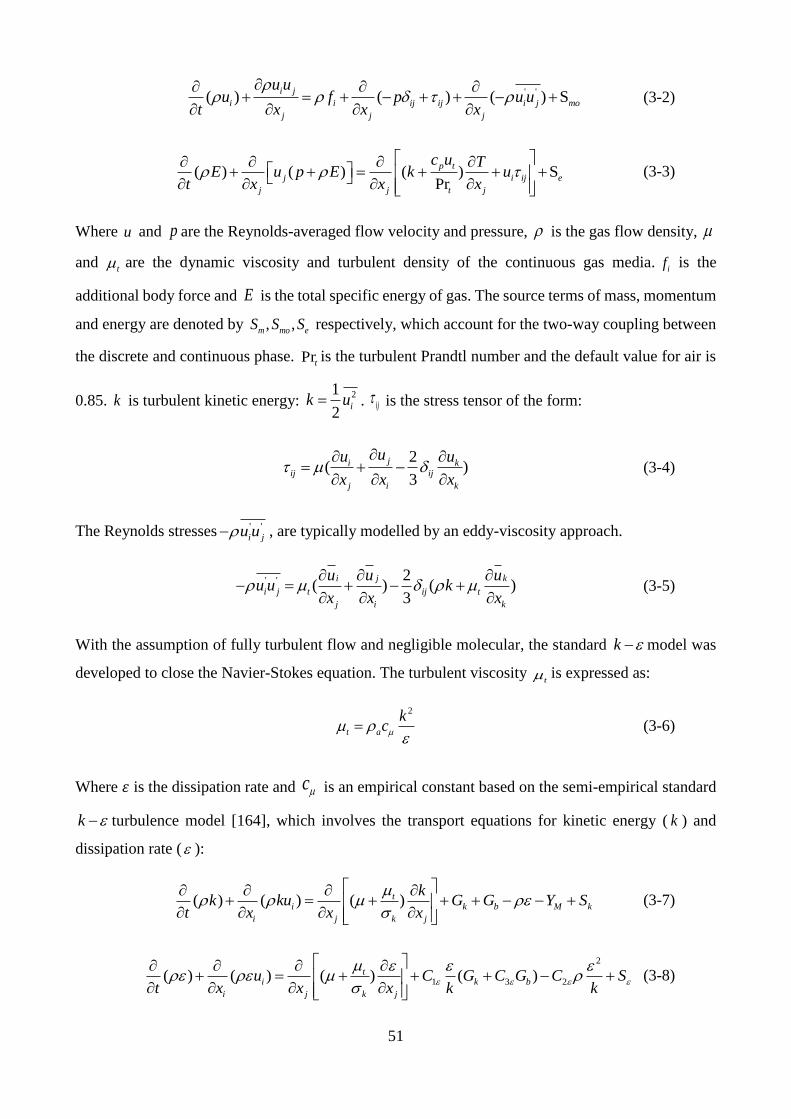
51
' '( ) ( ) ( ) S
i j
i i ij ij i j mo
j j j
u uu f p u u
t x x x
+ = + − + + − +
(3-2)
( ) ( ) ( ) SPr
p t
j i ij e
j j t j
c u TE u p E k u
t x x x
+ + = + + +
(3-3)
Where u and p are the Reynolds-averaged flow velocity and pressure, is the gas flow density,
and t are the dynamic viscosity and turbulent density of the continuous gas media.
if is the
additional body force and E is the total specific energy of gas. The source terms of mass, momentum
and energy are denoted by , ,m mo eS S S respectively, which account for the two-way coupling between
the discrete and continuous phase. Prtis the turbulent Prandtl number and the default value for air is
0.85. k is turbulent kinetic energy: 21
2ik u= . ij
is the stress tensor of the form:
2
( )3
ji kij ij
j i k
uu u
x x x
= + −
(3-4)
The Reynolds stresses ' '
i ju u− , are typically modelled by an eddy-viscosity approach.
' ' 2
( ) ( )3
i j k
i j t ij t
j i k
u u uu u k
x x x
− = + − +
(3-5)
With the assumption of fully turbulent flow and negligible molecular, the standard k − model was
developed to close the Navier-Stokes equation. The turbulent viscosity t is expressed as:
2
t a
kc
= (3-6)
Where 𝜀 is the dissipation rate and c is an empirical constant based on the semi-empirical standard
k − turbulence model [164], which involves the transport equations for kinetic energy ( k ) and
dissipation rate ( ):
( ) ( ) ( )ti k b M k
i j k j
kk ku G G Y S
t x x x
+ = + + + − − +
(3-7)
2
1 3 2( ) ( ) ( ) ( )ti k b
i j k j
u C G C G C St x x x k k
+ = + + + − +
(3-8)
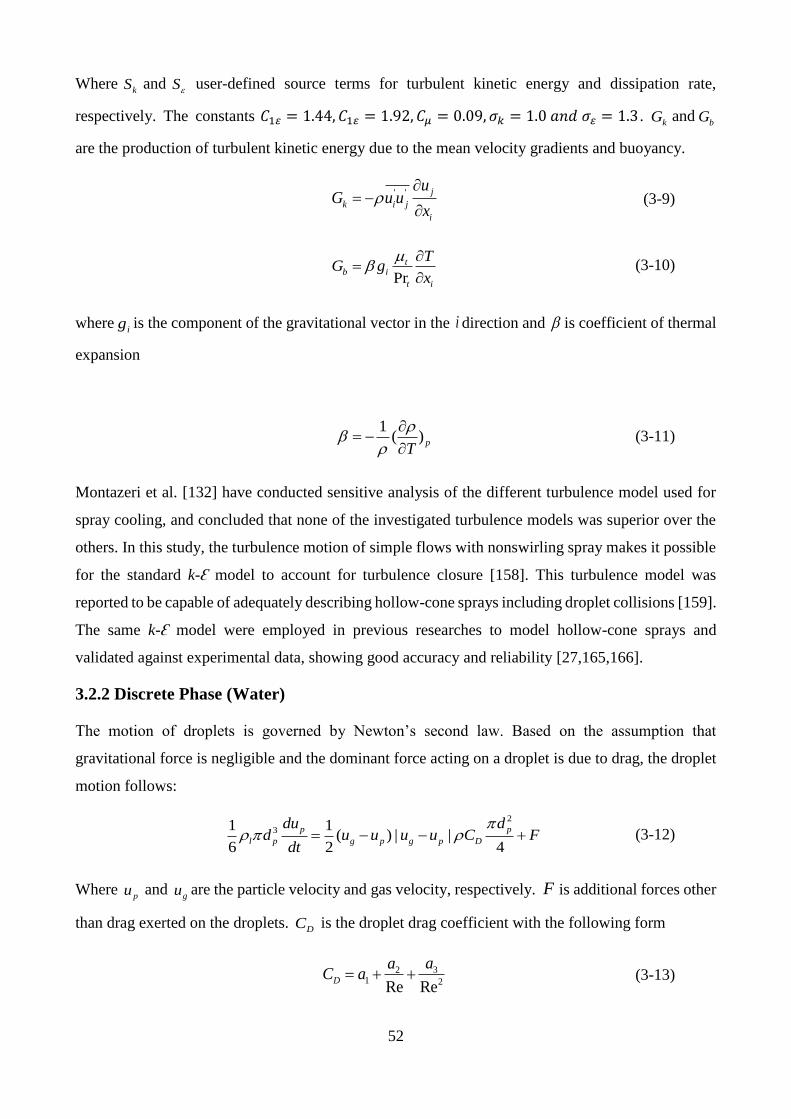
52
WherekS and S
user-defined source terms for turbulent kinetic energy and dissipation rate,
respectively. The constants 𝐶1𝜀 = 1.44, 𝐶1𝜀 = 1.92, 𝐶𝜇 = 0.09, 𝜎𝑘 = 1.0 𝑎𝑛𝑑 𝜎𝜀 = 1.3 . kG and
bG
are the production of turbulent kinetic energy due to the mean velocity gradients and buoyancy.
' ' j
k i j
i
uG u u
x
= −
(3-9)
Pr
tb i
t i
TG g
x
=
(3-10)
whereig is the component of the gravitational vector in the i direction and is coefficient of thermal
expansion
1
( ) pT
= −
(3-11)
Montazeri et al. [132] have conducted sensitive analysis of the different turbulence model used for
spray cooling, and concluded that none of the investigated turbulence models was superior over the
others. In this study, the turbulence motion of simple flows with nonswirling spray makes it possible
for the standard k-Ɛ model to account for turbulence closure [158]. This turbulence model was
reported to be capable of adequately describing hollow-cone sprays including droplet collisions [159].
The same k-Ɛ model were employed in previous researches to model hollow-cone sprays and
validated against experimental data, showing good accuracy and reliability [27,165,166].
3.2.2 Discrete Phase (Water)
The motion of droplets is governed by Newton’s second law. Based on the assumption that
gravitational force is negligible and the dominant force acting on a droplet is due to drag, the droplet
motion follows:
2
31 1( ) | |
6 2 4
p p
l p g p g p D
du dd u u u u C F
dt
= − − + (3-12)
Where pu and
gu are the particle velocity and gas velocity, respectively. F is additional forces other
than drag exerted on the droplets. DC is the droplet drag coefficient with the following form
321 2Re Re
D
aaC a= + + (3-13)
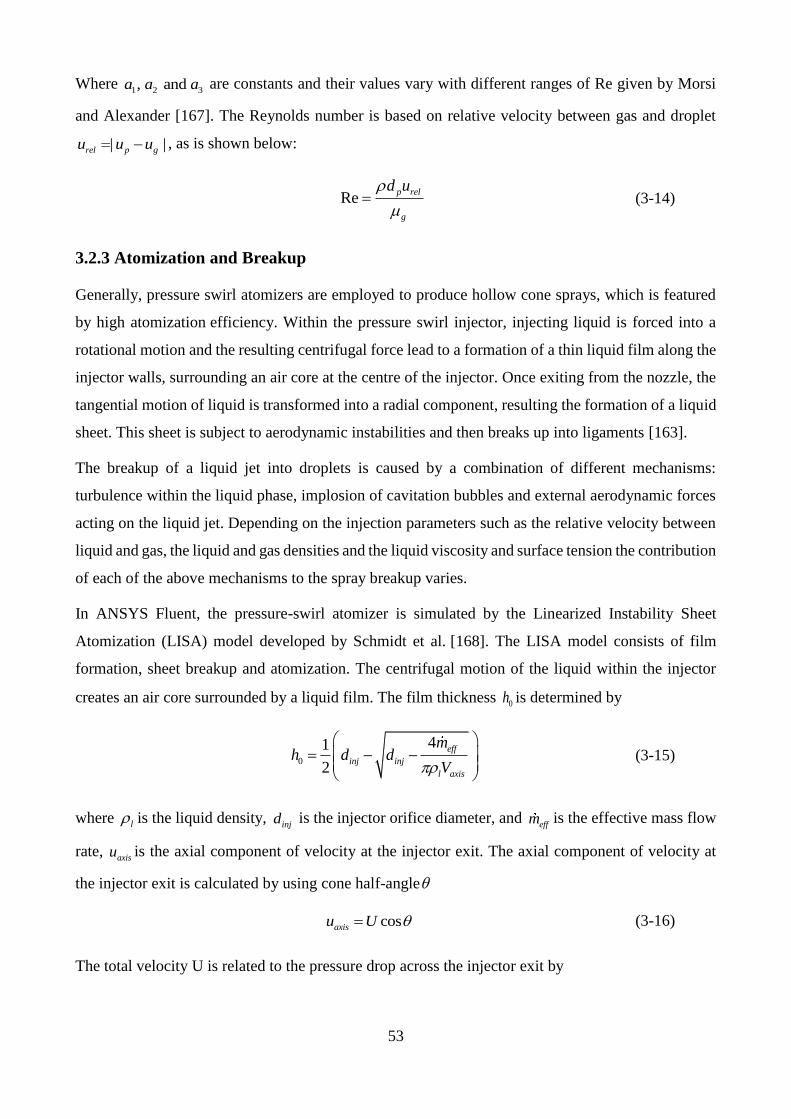
53
Where 1 2 3, and a a a are constants and their values vary with different ranges of Re given by Morsi
and Alexander [167]. The Reynolds number is based on relative velocity between gas and droplet
| |rel p gu u u= − , as is shown below:
Rep rel
g
d u
= (3-14)
3.2.3 Atomization and Breakup
Generally, pressure swirl atomizers are employed to produce hollow cone sprays, which is featured
by high atomization efficiency. Within the pressure swirl injector, injecting liquid is forced into a
rotational motion and the resulting centrifugal force lead to a formation of a thin liquid film along the
injector walls, surrounding an air core at the centre of the injector. Once exiting from the nozzle, the
tangential motion of liquid is transformed into a radial component, resulting the formation of a liquid
sheet. This sheet is subject to aerodynamic instabilities and then breaks up into ligaments [163].
The breakup of a liquid jet into droplets is caused by a combination of different mechanisms:
turbulence within the liquid phase, implosion of cavitation bubbles and external aerodynamic forces
acting on the liquid jet. Depending on the injection parameters such as the relative velocity between
liquid and gas, the liquid and gas densities and the liquid viscosity and surface tension the contribution
of each of the above mechanisms to the spray breakup varies.
In ANSYS Fluent, the pressure-swirl atomizer is simulated by the Linearized Instability Sheet
Atomization (LISA) model developed by Schmidt et al. [168]. The LISA model consists of film
formation, sheet breakup and atomization. The centrifugal motion of the liquid within the injector
creates an air core surrounded by a liquid film. The film thickness 0h is determined by
0
41
2
eff
inj inj
l axis
mh d d
V
= − −
(3-15)
where l is the liquid density, injd is the injector orifice diameter, and
effm is the effective mass flow
rate, axisu is the axial component of velocity at the injector exit. The axial component of velocity at
the injector exit is calculated by using cone half-angle
cosaxisu U = (3-16)
The total velocity U is related to the pressure drop across the injector exit by
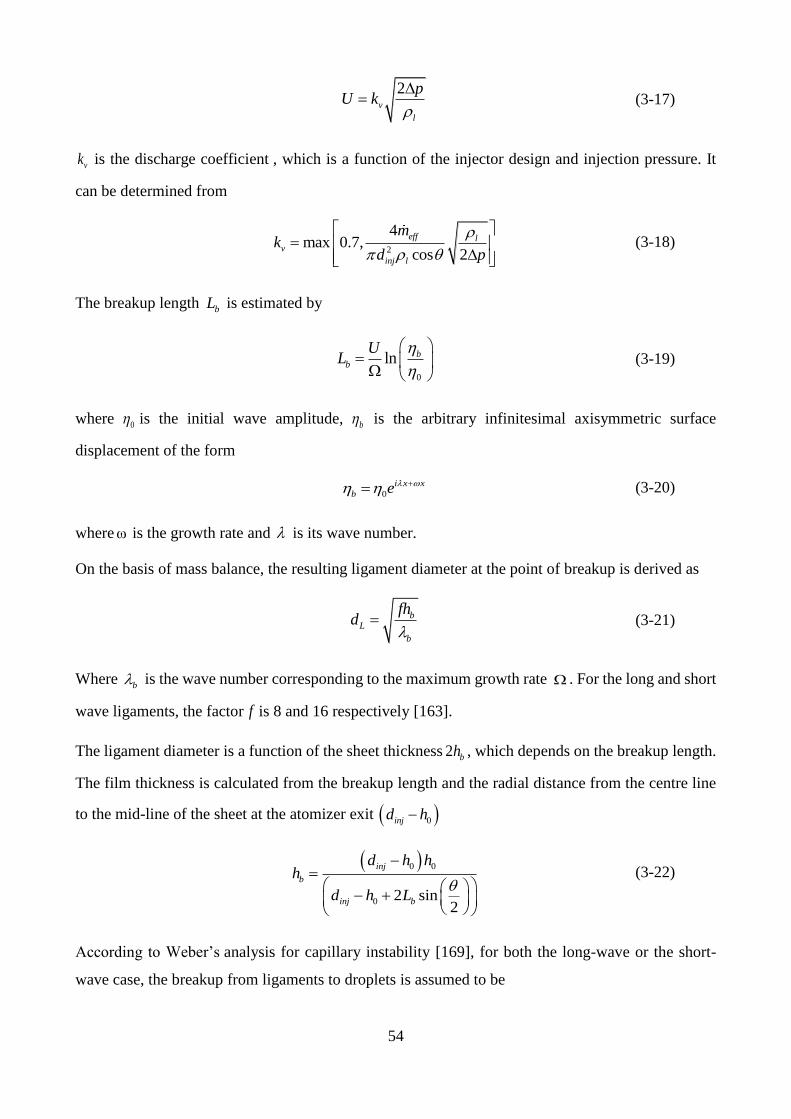
54
2
v
l
pU k
= (3-17)
vk is the discharge coefficient , which is a function of the injector design and injection pressure. It
can be determined from
2
4max 0.7,
cos 2
eff lv
inj l
mk
d p
=
(3-18)
The breakup length bL is estimated by
0
ln bb
UL
=
(3-19)
where 0 is the initial wave amplitude, b is the arbitrary infinitesimal axisymmetric surface
displacement of the form
0
i x x
b e += (3-20)
whereω is the growth rate and is its wave number.
On the basis of mass balance, the resulting ligament diameter at the point of breakup is derived as
bL
b
fhd
= (3-21)
Where b is the wave number corresponding to the maximum growth rate . For the long and short
wave ligaments, the factor f is 8 and 16 respectively [163].
The ligament diameter is a function of the sheet thickness 2 bh , which depends on the breakup length.
The film thickness is calculated from the breakup length and the radial distance from the centre line
to the mid-line of the sheet at the atomizer exit ( )0injd h−
( )0 0
0 2 sin2
inj
b
inj b
d h hh
d h L
−=
− +
(3-22)
According to Weber’s analysis for capillary instability [169], for both the long-wave or the short-
wave case, the breakup from ligaments to droplets is assumed to be
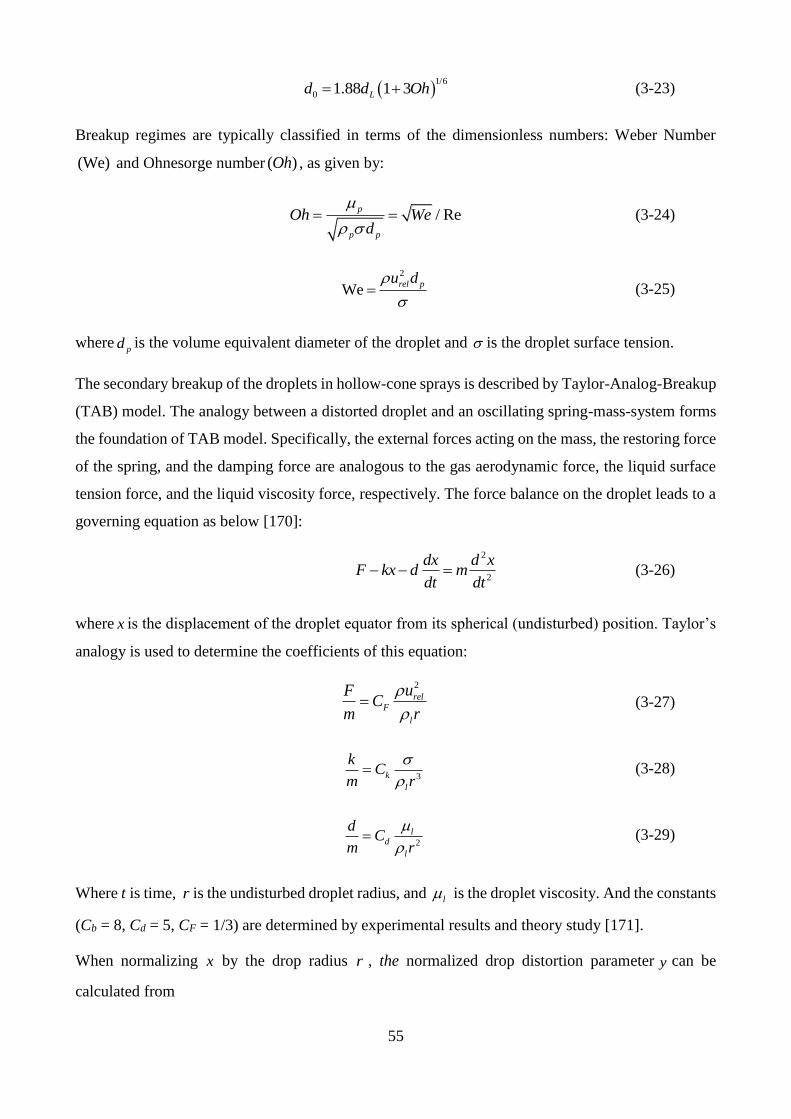
55
( )1/6
0 1.88 1 3Ld d Oh= + (3-23)
Breakup regimes are typically classified in terms of the dimensionless numbers: Weber Number
(We) and Ohnesorge number ( )Oh , as given by:
/ Rep
p p
Oh Wed
= = (3-24)
2
Werel pu d
= (3-25)
wherepd is the volume equivalent diameter of the droplet and is the droplet surface tension.
The secondary breakup of the droplets in hollow-cone sprays is described by Taylor-Analog-Breakup
(TAB) model. The analogy between a distorted droplet and an oscillating spring-mass-system forms
the foundation of TAB model. Specifically, the external forces acting on the mass, the restoring force
of the spring, and the damping force are analogous to the gas aerodynamic force, the liquid surface
tension force, and the liquid viscosity force, respectively. The force balance on the droplet leads to a
governing equation as below [170]:
2
2
dx d xF kx d m
dt dt− − = (3-26)
where x is the displacement of the droplet equator from its spherical (undisturbed) position. Taylor’s
analogy is used to determine the coefficients of this equation:
2
relF
l
uFC
m r
= (3-27)
3k
l
kC
m r
= (3-28)
2
ld
l
dC
m r
= (3-29)
Where t is time, r is the undisturbed droplet radius, and l is the droplet viscosity. And the constants
(Cb = 8, Cd = 5, CF = 1/3) are determined by experimental results and theory study [171].
When normalizing x by the drop radius r , the normalized drop distortion parameter y can be
calculated from
56
( )/ by x C r= (3-30)
Where Cb is a constant equal to 0.5, and droplet breakup occurs when the distortion is equal to half
the droplet radius [172]. Then a normalized equation can be obtained
22
2 2 3
5 8 20
3
l rel
l l l
ud y dyy
dt r dt r r
+ + − = (3-31)
It is assumed that breakup only occurs under the condition of y > 1 [170] . When y exceeds unity, the
droplet breaks up into smaller children droplets. The relationship between the size of children drop
(r2) and the parent drop (r1) is shown below:
23
11
2
7
3 8
lrr dy
r dt
= +
(3-32)
3.2.4 Computational Model
Spray formation and development is a complex process because it involves highly transient and
coupled phenomena. Since the process involves both discrete phase and continuous phase, the
intuitive approach Eulerian-Lagrangian formulation is adopted to account for this multiphase
phenomenon. The continuous gas medium flowing through stationary mesh-volumes is described by
Eulerian formulation, while the discrete droplets are tracked by the Lagrangian approach. A general
schematic overview of the Eulerian-Lagrangian scheme for the spray modelling is shown in Figure
3-1. Despite that discrete and continuous phases are modelled separately, their coupling is realized
by introducing mass, momentum and energy source to account for the exchange of mass, momentum
and energy. To obtain a more realistic representation of the drop fragmentation effect on the spray
behaviour, two-way coupling of gas-droplets is considered. Specifically, in the computation of droplet
trajectories, both the impacts of the continuous phase on the discrete phase and the effect of the
discrete phase trajectories on the continuum are incorporated. This two-way coupling is accomplished
by alternately solving the discrete and continuous phase equations until the solutions in both phases
have stopped changing.
The Reynolds-Averaged Navier–Stokes (RANS) equations are solved for turbulent gas flow to
account for the time-varying, fluctuating velocity components. Species transport equations are solved
for all gas species involved. The stochastic model is employed to model the effects of turbulence on
the particles. According to the Newton’s law of motion, the droplet trajectory can be determined by
integrating gravitational, drag and other additional forces experienced by travelling droplets. The
57
continuous and discrete phases are communicated through drag forces, lift forces, heat transfer, mass
transfer, and species transfer.
To simulate the primary and secondary breakup of liquid jets, a 3D numerical model was developed
based on a witond tunnel size with the length of 1m and the cross section of 1×1 m2. The geometrical
and boundary conditions are shown in Figure 3-2. The geometry was discretised into mesh grids using
ICEM CFD 18.0. The discretization involves dividing the computational domain into millions of
small control volumes and it is always preferable to use hexahedral (HEX) control volumes or
polyhedral meshes due to their advantages concerning better convergence, and higher accuracy [173].
Even if it is much easier to generate tetrahedral grid for complicated geometry, to get a reasonable
accuracy in boundary layers, long channels or small gaps, this grid generally requires larger number
of elements when compared with structured HEX mesh. Moreover the four neighbours of tetrahedral
make it problematic in computing gradients due to spatial position of neighbour nodes. The numerical
diffusion in tetrahedral mesh is much larger than HEX mesh, and worse still, low quality tetrahedral
meshes result in convergence errors and reduce the computational accuracy [174]. In view of the rigid
rectangular geometry of the modelled wind tunnel, hexahedral cells (Figure 3-3) were generated to
discretise the computation domain for better accuracy and faster convergence.
In modelling the inter‐phase momentum coupling for particle flows, the adopted mesh size depends
on the selected method. Su et al. reported that mesh size should be much smaller than the size of the
smallest particle in direct numerical simulation (DNS), and much larger than the typical particle size
in point source method [175]. In this study, most particles had size in the range of 40-80 μm, hence
the point source method was adopted. Mesh independence tests were performed and the results are
shown in Table 3-1. The grid sensitivity analysis shows that the optimal cell number of generated
mesh is 1,680,000, increasing mesh to 2,320,000 has negligible effects on calculated results.
Reducing cell number gives a large deviation from experimental results. A hollow cone spray nozzle
22N (H. Ikeuchi & Co. Ltd.) was used to generate fine droplets. The nozzle was located at the air
inlet plane of the tunnel, sitting at centre of the cross section. The simulated operating conditions for
discrete and continuous phases are shown in Table 2. Detailed information about boundary setup is
listed in Table 3.
The numerical solutions of the continuity, momentum and energy equations, the turbulence model,
droplet breakup and tracking equations were obtained using the finite-volume-based popular CFD
software ANSYS FLUENT 18.0. The simulation was treated as steady-state and the pressure-based
solver, is employed. The SIMPLE algorithm was used to correct velocity field based on corrected
pressure field. The second-order upwind scheme was chosen for spatial discretization of the
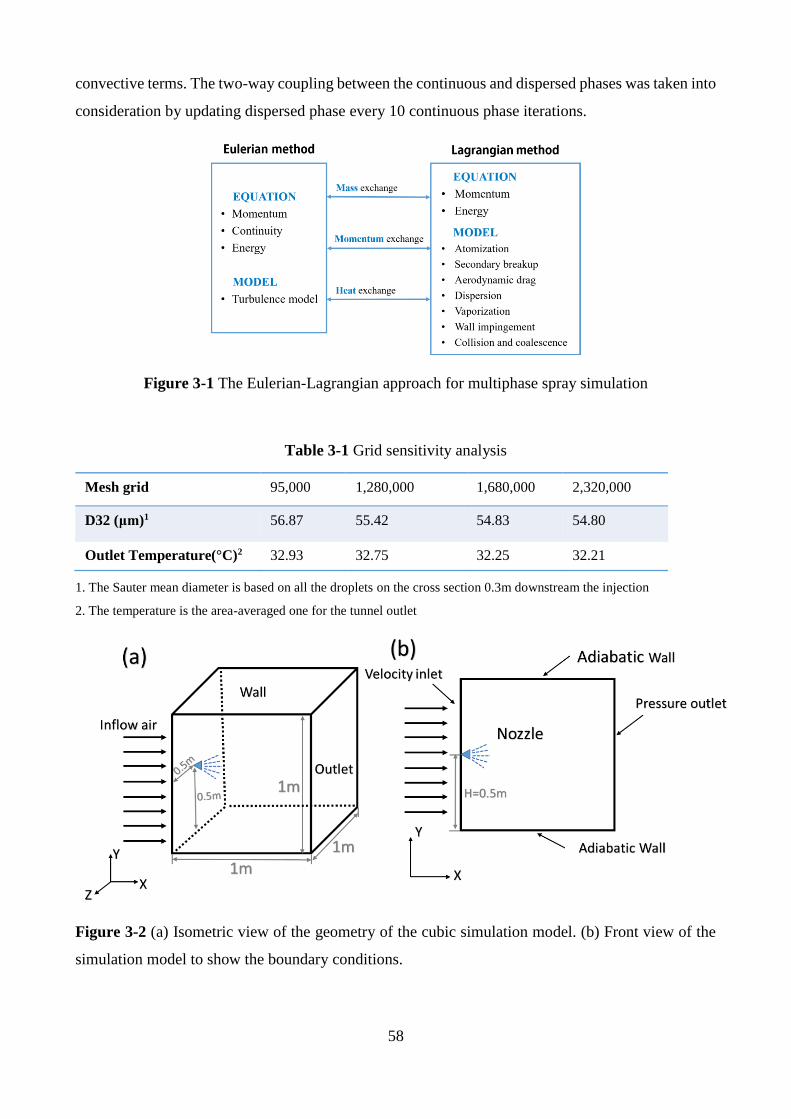
58
convective terms. The two-way coupling between the continuous and dispersed phases was taken into
consideration by updating dispersed phase every 10 continuous phase iterations.
Figure 3-1 The Eulerian-Lagrangian approach for multiphase spray simulation
Table 3-1 Grid sensitivity analysis
Mesh grid 95,000 1,280,000 1,680,000 2,320,000
D32 (μm)1 56.87 55.42 54.83 54.80
Outlet Temperature(°C)2 32.93 32.75 32.25 32.21
1. The Sauter mean diameter is based on all the droplets on the cross section 0.3m downstream the injection
2. The temperature is the area-averaged one for the tunnel outlet
Figure 3-2 (a) Isometric view of the geometry of the cubic simulation model. (b) Front view of the
simulation model to show the boundary conditions.
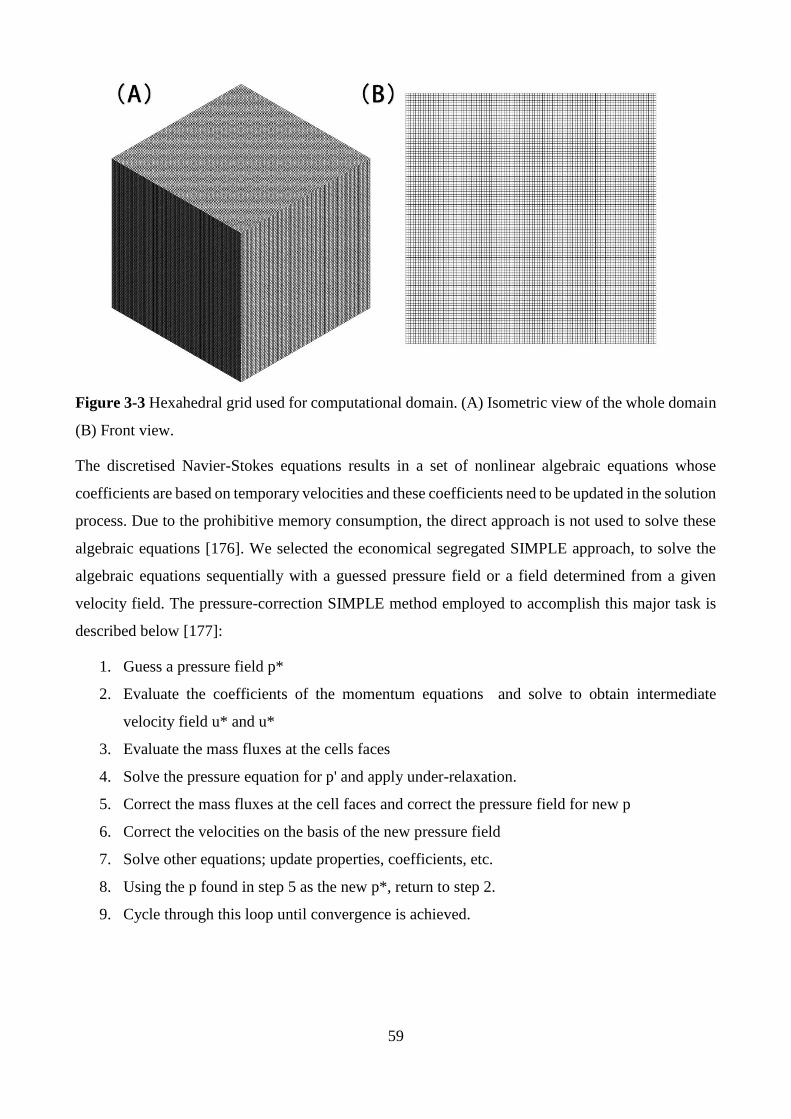
59
Figure 3-3 Hexahedral grid used for computational domain. (A) Isometric view of the whole domain
(B) Front view.
The discretised Navier-Stokes equations results in a set of nonlinear algebraic equations whose
coefficients are based on temporary velocities and these coefficients need to be updated in the solution
process. Due to the prohibitive memory consumption, the direct approach is not used to solve these
algebraic equations [176]. We selected the economical segregated SIMPLE approach, to solve the
algebraic equations sequentially with a guessed pressure field or a field determined from a given
velocity field. The pressure-correction SIMPLE method employed to accomplish this major task is
described below [177]:
1. Guess a pressure field p*
2. Evaluate the coefficients of the momentum equations and solve to obtain intermediate
velocity field u* and u*
3. Evaluate the mass fluxes at the cells faces
4. Solve the pressure equation for p' and apply under-relaxation.
5. Correct the mass fluxes at the cell faces and correct the pressure field for new p
6. Correct the velocities on the basis of the new pressure field
7. Solve other equations; update properties, coefficients, etc.
8. Using the p found in step 5 as the new p*, return to step 2.
9. Cycle through this loop until convergence is achieved.
60
3.3. Experimental Method
To ensure the validation of numerical modelling and investigate the physical phenomenon related, an
experimental test was conducted to obtain raw data indicating the spray properties of theselected
nozzle.
This experiment was carried out at the University of Queensland (Gatton Campus), using an open-
circuit wind tunnel test rig to determine the spray characteristics. Figure 3-4 shows the detailed
structure of the test rig. The full length of the tunnel is 10 m with a 1-meter-high, 1-meter-wide and
5.6-meter-long test section. The spray nozzle was fixed within the rig to display its behaviour in
operation horizontally. During the experiment, flowing air pumped into the tunnel by a variable speed
centrifugal blower fan passes through a diffuser with 4 perforated metal plate screens. Before entering
the working section, a honeycomb (50mm width and 19mm diameter) plus four woven nylon screens
were applied to minimize flow eddies to avoid non-uniform airflow. Besides, the spray nozzle was
fixed and directed horizontally, 0.55m downstream from the contraction cone at a height of 0.5m,
making the water and air move within the same direction to give a uniform air velocity profile.
Discharged by a fan, the wetted air then passed through an exhaust section and air scrubber. Two
sumps located at the middle and end of the working section respectively were used to collect the
fallen water. The transparent acrylic walls of the test section enabled the real-time visualization and
photography of the spray and provide access to the Phase Doppler Particle Analyser (PDPA) system.
The PDPA system was introduced to determine the velocity and size of the droplet sample within the
control volume generated through the intersection of the two beams. The interference fringe pattern
developed by light scatted by different sample droplets were recorded by the optical detectors. The
size distribution of the spray could be determined by the size of droplet passing through the control
volume, which is proportional to the phase difference between the signals captured by the detectors.
Table 4 shows the main parameters of the PDPA, an aerometric 2-dimensioanl laser system
established by TSI, Inc. Major components include an optical receiver, a 3D-traverse system, 600mW
argon-ion laser (561, 531 wavelength) transmitter probes, a flow size electronic signal processor, and
the FLOWSIZER software installed to collect and process data. Focal lengths of the receiver and the
laser transmitter are 1000 and 750 mm, respectively. The beam separation distance of the laser beams
is 50mm, and its fringe spacing is 8.55 µm. 40 MHz has been set as the frequency shifting by the
Bragg cell. The PDPA setup during the experiment and its schematic illustration are listed in Figure
3-5.
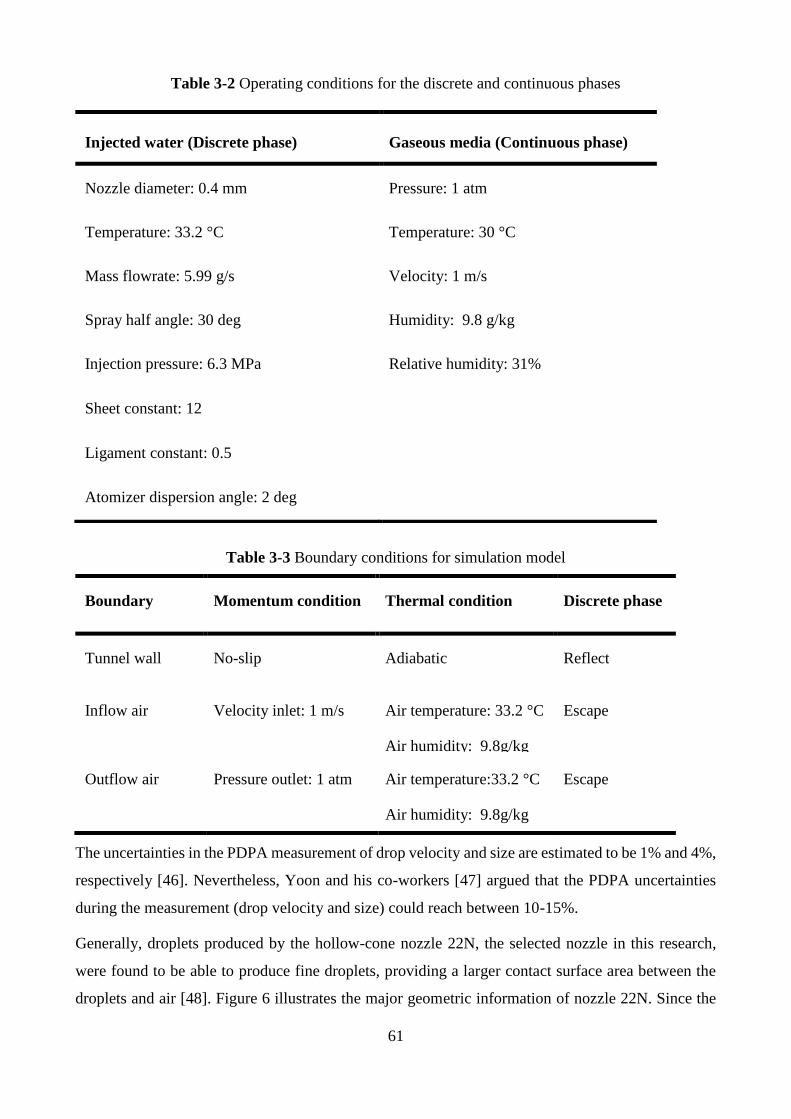
61
Table 3-2 Operating conditions for the discrete and continuous phases
Table 3-3 Boundary conditions for simulation model
Boundary Momentum condition Thermal condition Discrete phase
Tunnel wall No-slip Adiabatic Reflect
Inflow air Velocity inlet: 1 m/s Air temperature: 33.2 °C
Air humidity: 9.8g/kg
Escape
Outflow air Pressure outlet: 1 atm Air temperature:33.2 °C
Air humidity: 9.8g/kg
Escape
The uncertainties in the PDPA measurement of drop velocity and size are estimated to be 1% and 4%,
respectively [46]. Nevertheless, Yoon and his co-workers [47] argued that the PDPA uncertainties
during the measurement (drop velocity and size) could reach between 10-15%.
Generally, droplets produced by the hollow-cone nozzle 22N, the selected nozzle in this research,
were found to be able to produce fine droplets, providing a larger contact surface area between the
droplets and air [48]. Figure 6 illustrates the major geometric information of nozzle 22N. Since the
Injected water (Discrete phase) Gaseous media (Continuous phase)
Nozzle diameter: 0.4 mm Pressure: 1 atm
Temperature: 33.2 °C Temperature: 30 °C
Mass flowrate: 5.99 g/s Velocity: 1 m/s
Spray half angle: 30 deg Humidity: 9.8 g/kg
Injection pressure: 6.3 MPa Relative humidity: 31%
Sheet constant: 12
Ligament constant: 0.5
Atomizer dispersion angle: 2 deg
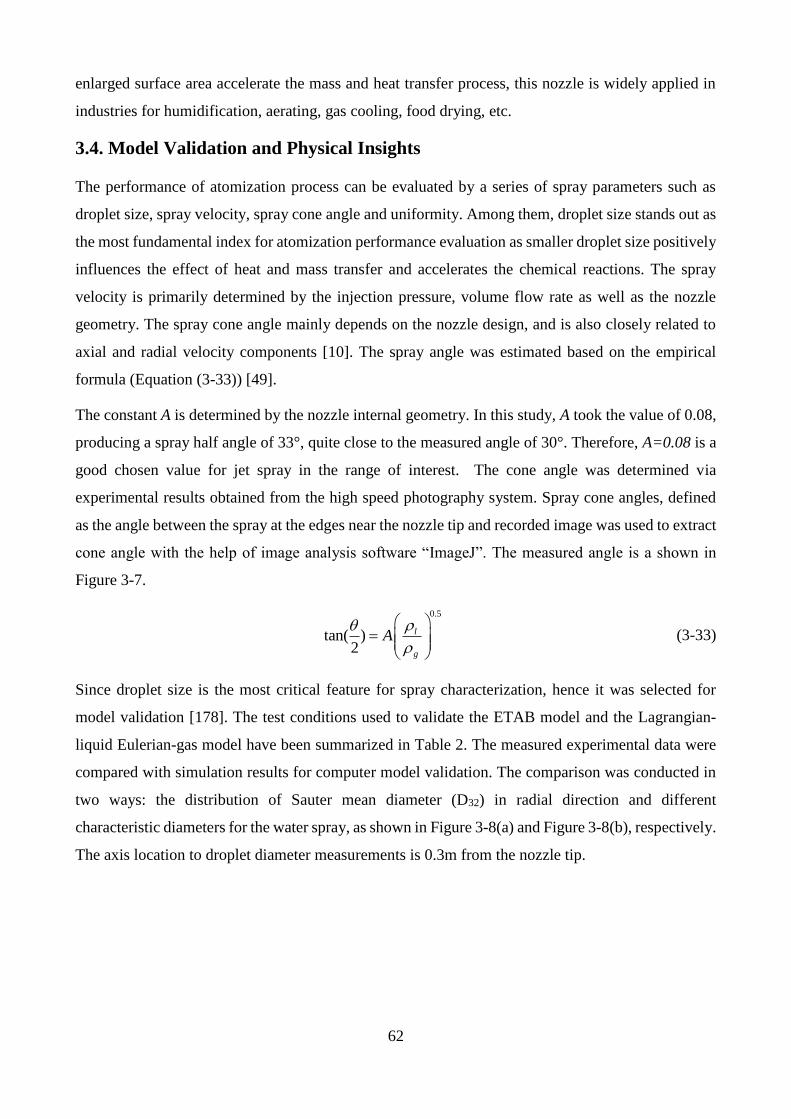
62
enlarged surface area accelerate the mass and heat transfer process, this nozzle is widely applied in
industries for humidification, aerating, gas cooling, food drying, etc.
3.4. Model Validation and Physical Insights
The performance of atomization process can be evaluated by a series of spray parameters such as
droplet size, spray velocity, spray cone angle and uniformity. Among them, droplet size stands out as
the most fundamental index for atomization performance evaluation as smaller droplet size positively
influences the effect of heat and mass transfer and accelerates the chemical reactions. The spray
velocity is primarily determined by the injection pressure, volume flow rate as well as the nozzle
geometry. The spray cone angle mainly depends on the nozzle design, and is also closely related to
axial and radial velocity components [10]. The spray angle was estimated based on the empirical
formula (Equation (3-33)) [49].
The constant A is determined by the nozzle internal geometry. In this study, A took the value of 0.08,
producing a spray half angle of 33°, quite close to the measured angle of 30°. Therefore, A=0.08 is a
good chosen value for jet spray in the range of interest. The cone angle was determined via
experimental results obtained from the high speed photography system. Spray cone angles, defined
as the angle between the spray at the edges near the nozzle tip and recorded image was used to extract
cone angle with the help of image analysis software “ImageJ”. The measured angle is a shown in
Figure 3-7.
0.5
tan( )2
l
g
A
=
(3-33)
Since droplet size is the most critical feature for spray characterization, hence it was selected for
model validation [178]. The test conditions used to validate the ETAB model and the Lagrangian-
liquid Eulerian-gas model have been summarized in Table 2. The measured experimental data were
compared with simulation results for computer model validation. The comparison was conducted in
two ways: the distribution of Sauter mean diameter (D32) in radial direction and different
characteristic diameters for the water spray, as shown in Figure 3-8(a) and Figure 3-8(b), respectively.
The axis location to droplet diameter measurements is 0.3m from the nozzle tip.
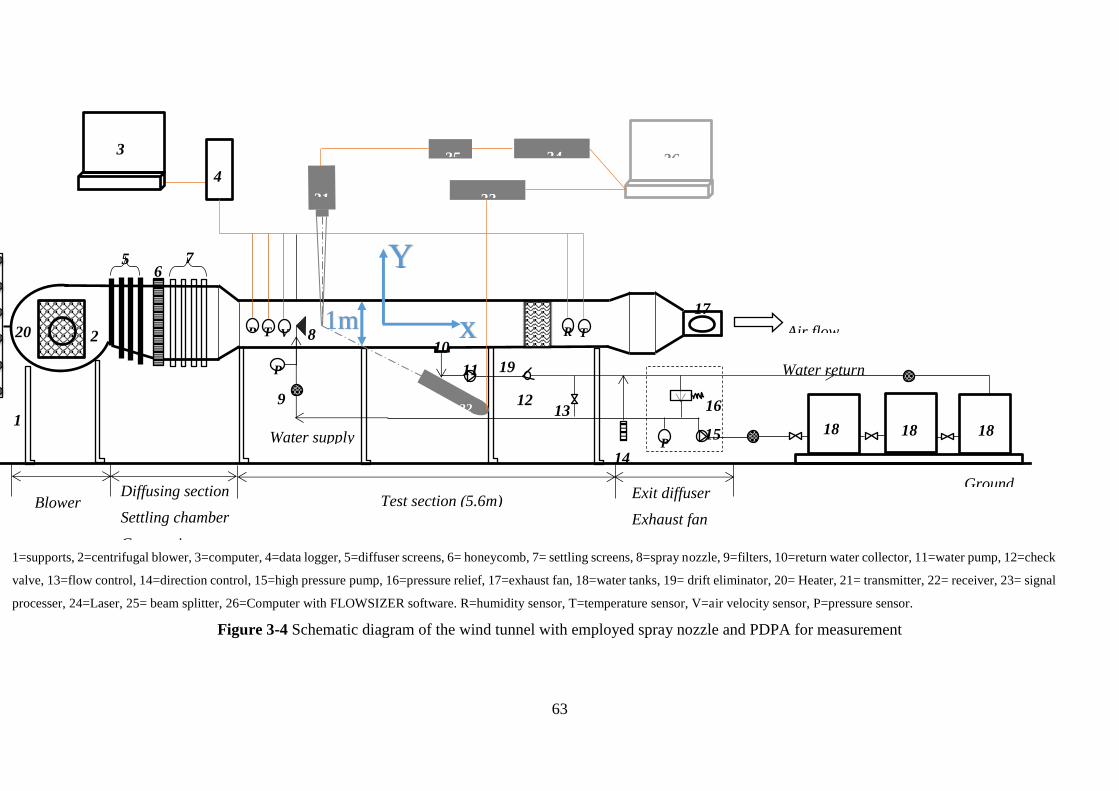
63
Figure 3-4 Schematic diagram of the wind tunnel with employed spray nozzle and PDPA for measurement
Air flow
1
2
3
4
6 7
Diffusing section
Settling chamber
Contraction
Blower Test section (5.6m) Exit diffuser
Exhaust fan
5
Ground
10
Water supply
Water return
P
P
T V R T R 8
9
11
13 12
15
14
17
18 18
16
18
21 23
25 24 26
22
19
20
1=supports, 2=centrifugal blower, 3=computer, 4=data logger, 5=diffuser screens, 6= honeycomb, 7= settling screens, 8=spray nozzle, 9=filters, 10=return water collector, 11=water pump, 12=check
valve, 13=flow control, 14=direction control, 15=high pressure pump, 16=pressure relief, 17=exhaust fan, 18=water tanks, 19= drift eliminator, 20= Heater, 21= transmitter, 22= receiver, 23= signal
processer, 24=Laser, 25= beam splitter, 26=Computer with FLOWSIZER software. R=humidity sensor, T=temperature sensor, V=air velocity sensor, P=pressure sensor.
x
Y
1m
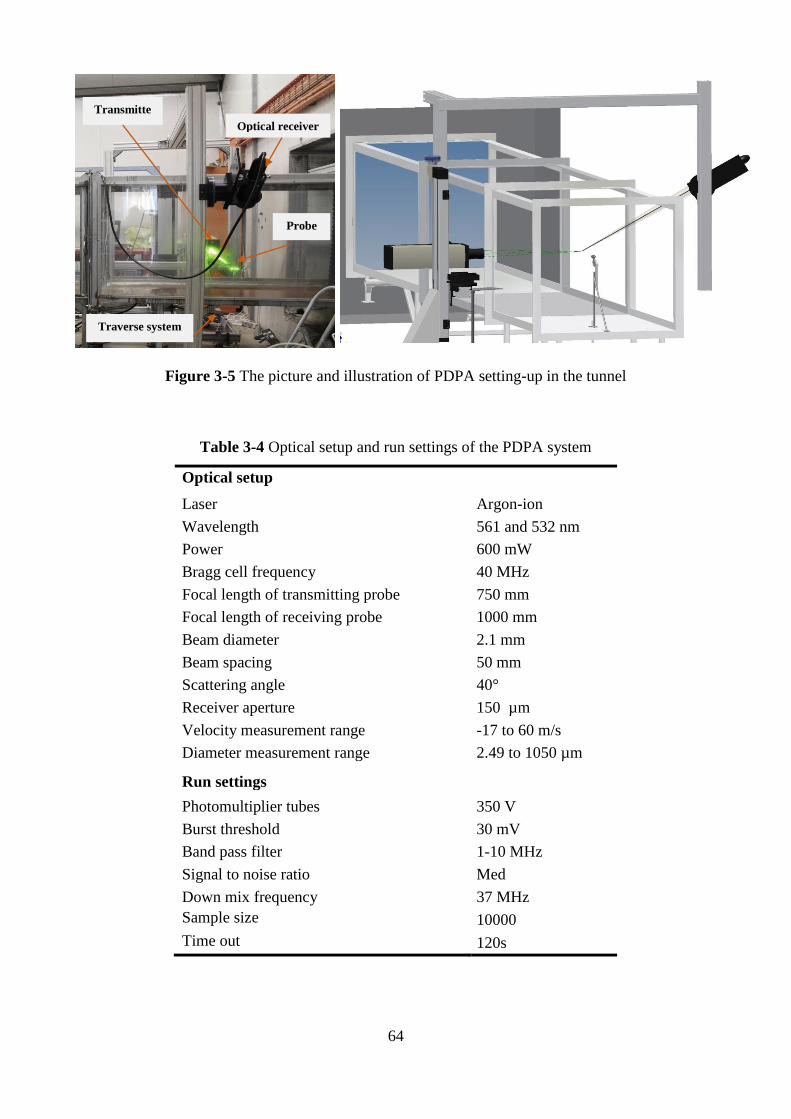
64
Figure 3-5 The picture and illustration of PDPA setting-up in the tunnel
Table 3-4 Optical setup and run settings of the PDPA system
Optical setup
Laser Argon-ion
Wavelength 561 and 532 nm
Power 600 mW
Bragg cell frequency 40 MHz
Focal length of transmitting probe 750 mm
Focal length of receiving probe 1000 mm
Beam diameter 2.1 mm
Beam spacing 50 mm
Scattering angle 40°
Receiver aperture 150 µm
Velocity measurement range -17 to 60 m/s
Diameter measurement range 2.49 to 1050 µm
Run settings
Run settings Photomultiplier tubes 350 V
Burst threshold 30 mV
Band pass filter 1-10 MHz
Signal to noise ratio Med
Down mix frequency 37 MHz
Sample size 10000
Time out 120s
Transmitte
r
Traverse system
Probe
volume
Optical receiver
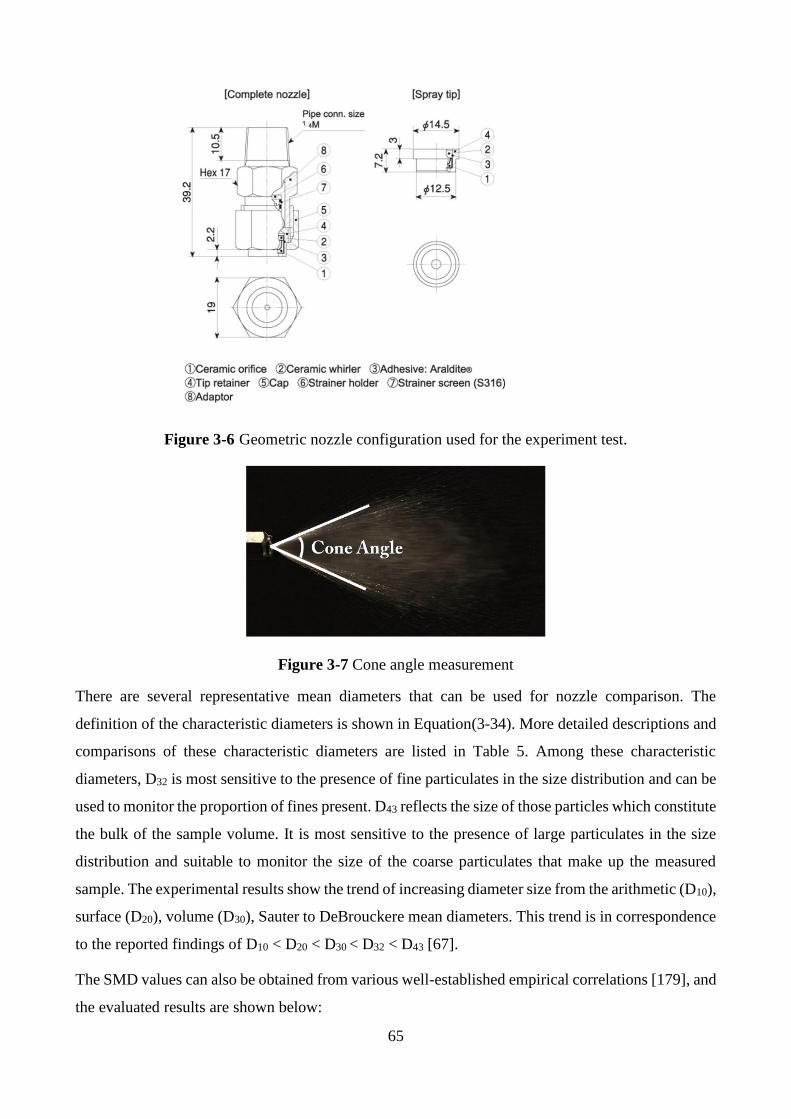
65
Figure 3-6 Geometric nozzle configuration used for the experiment test.
Figure 3-7 Cone angle measurement
There are several representative mean diameters that can be used for nozzle comparison. The
definition of the characteristic diameters is shown in Equation(3-34). More detailed descriptions and
comparisons of these characteristic diameters are listed in Table 5. Among these characteristic
diameters, D32 is most sensitive to the presence of fine particulates in the size distribution and can be
used to monitor the proportion of fines present. D43 reflects the size of those particles which constitute
the bulk of the sample volume. It is most sensitive to the presence of large particulates in the size
distribution and suitable to monitor the size of the coarse particulates that make up the measured
sample. The experimental results show the trend of increasing diameter size from the arithmetic (D10),
surface (D20), volume (D30), Sauter to DeBrouckere mean diameters. This trend is in correspondence
to the reported findings of D10 < D20 < D30 < D32 < D43 [67].
The SMD values can also be obtained from various well-established empirical correlations [179], and
the evaluated results are shown below:
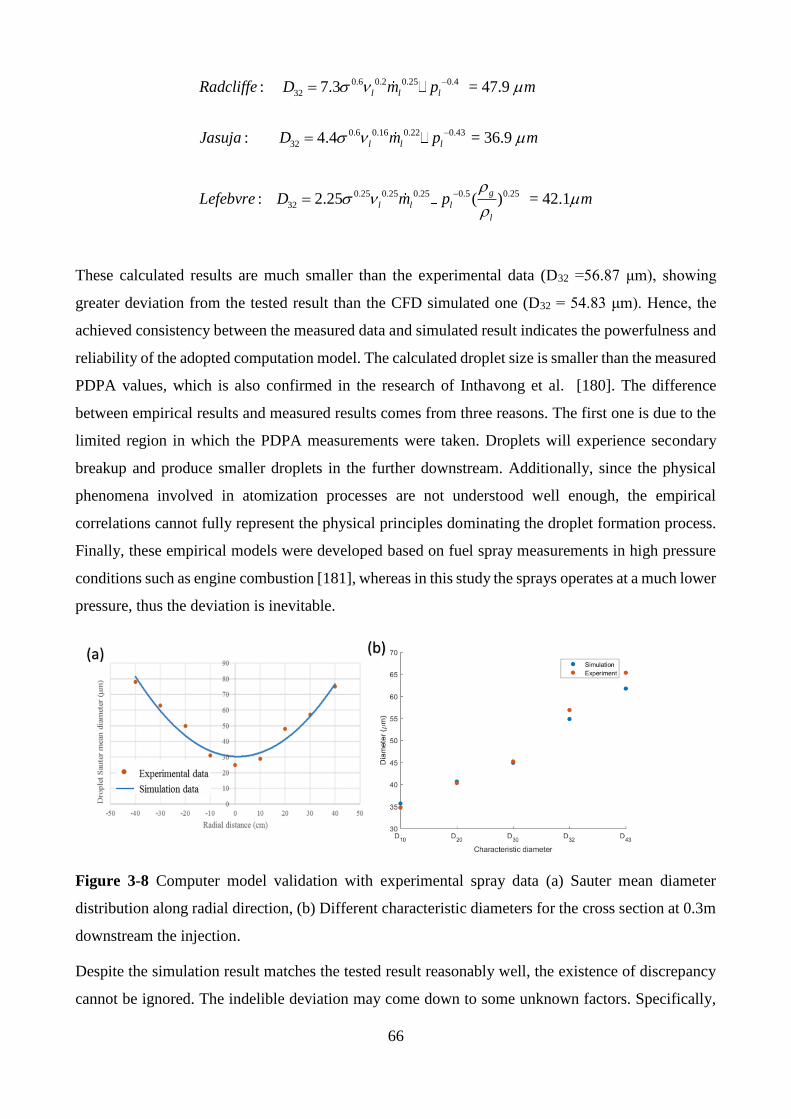
66
0.6 0.2 0.25 0.4
32
0.6 0.16 0.22 0.43
32
0.25 0.25 0.25
32
: 7.3 = 47.9
: 4.4 = 36.9
: 2.25
l l l
l l l
l l
Radcliffe D m p m
Jasuja D m p m
Lefebvre D m
−
−
=
=
= 0.5 0.25( ) = 42.1
g
l
l
p m
−
These calculated results are much smaller than the experimental data (D32 =56.87 μm), showing
greater deviation from the tested result than the CFD simulated one (D32 = 54.83 μm). Hence, the
achieved consistency between the measured data and simulated result indicates the powerfulness and
reliability of the adopted computation model. The calculated droplet size is smaller than the measured
PDPA values, which is also confirmed in the research of Inthavong et al. [180]. The difference
between empirical results and measured results comes from three reasons. The first one is due to the
limited region in which the PDPA measurements were taken. Droplets will experience secondary
breakup and produce smaller droplets in the further downstream. Additionally, since the physical
phenomena involved in atomization processes are not understood well enough, the empirical
correlations cannot fully represent the physical principles dominating the droplet formation process.
Finally, these empirical models were developed based on fuel spray measurements in high pressure
conditions such as engine combustion [181], whereas in this study the sprays operates at a much lower
pressure, thus the deviation is inevitable.
Figure 3-8 Computer model validation with experimental spray data (a) Sauter mean diameter
distribution along radial direction, (b) Different characteristic diameters for the cross section at 0.3m
downstream the injection.
Despite the simulation result matches the tested result reasonably well, the existence of discrepancy
cannot be ignored. The indelible deviation may come down to some unknown factors. Specifically,
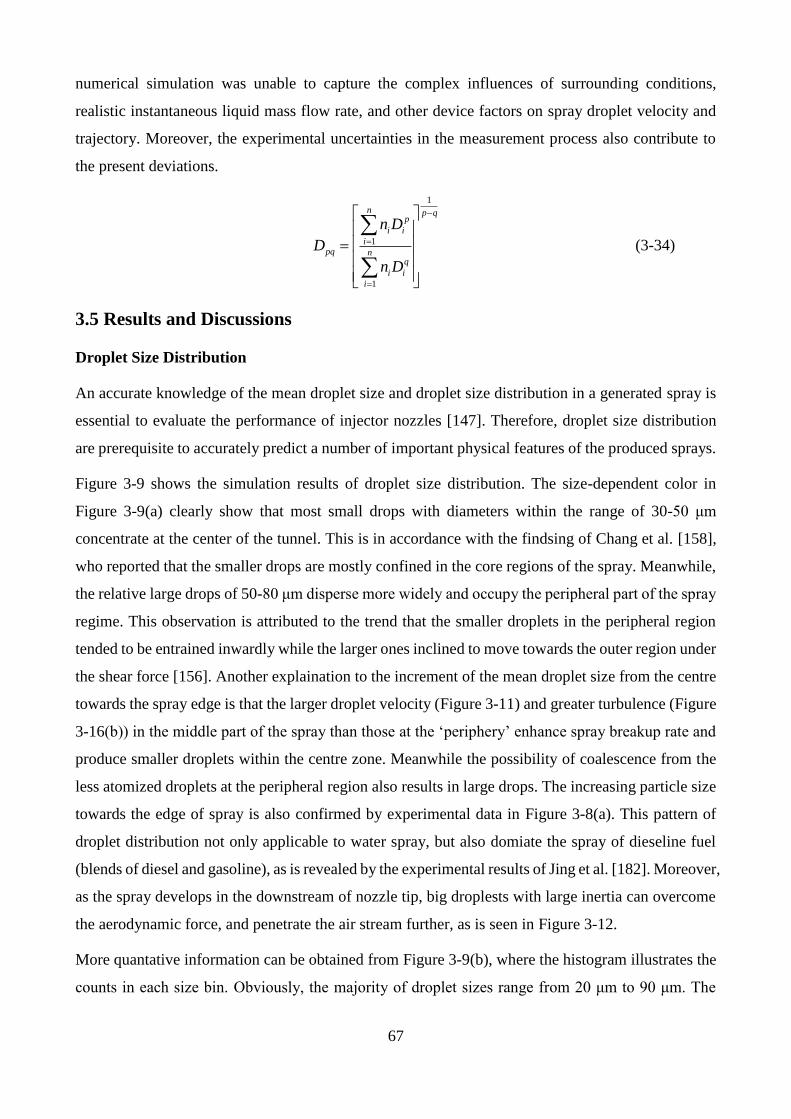
67
numerical simulation was unable to capture the complex influences of surrounding conditions,
realistic instantaneous liquid mass flow rate, and other device factors on spray droplet velocity and
trajectory. Moreover, the experimental uncertainties in the measurement process also contribute to
the present deviations.
1
1
1
n p qp
i i
ipq n
q
i i
i
n D
D
n D
−
=
=
=
(3-34)
3.5 Results and Discussions
Droplet Size Distribution
An accurate knowledge of the mean droplet size and droplet size distribution in a generated spray is
essential to evaluate the performance of injector nozzles [147]. Therefore, droplet size distribution
are prerequisite to accurately predict a number of important physical features of the produced sprays.
Figure 3-9 shows the simulation results of droplet size distribution. The size-dependent color in
Figure 3-9(a) clearly show that most small drops with diameters within the range of 30-50 μm
concentrate at the center of the tunnel. This is in accordance with the findsing of Chang et al. [158],
who reported that the smaller drops are mostly confined in the core regions of the spray. Meanwhile,
the relative large drops of 50-80 μm disperse more widely and occupy the peripheral part of the spray
regime. This observation is attributed to the trend that the smaller droplets in the peripheral region
tended to be entrained inwardly while the larger ones inclined to move towards the outer region under
the shear force [156]. Another explaination to the increment of the mean droplet size from the centre
towards the spray edge is that the larger droplet velocity (Figure 3-11) and greater turbulence (Figure
3-16(b)) in the middle part of the spray than those at the ‘periphery’ enhance spray breakup rate and
produce smaller droplets within the centre zone. Meanwhile the possibility of coalescence from the
less atomized droplets at the peripheral region also results in large drops. The increasing particle size
towards the edge of spray is also confirmed by experimental data in Figure 3-8(a). This pattern of
droplet distribution not only applicable to water spray, but also domiate the spray of dieseline fuel
(blends of diesel and gasoline), as is revealed by the experimental results of Jing et al. [182]. Moreover,
as the spray develops in the downstream of nozzle tip, big droplests with large inertia can overcome
the aerodynamic force, and penetrate the air stream further, as is seen in Figure 3-12.
More quantative information can be obtained from Figure 3-9(b), where the histogram illustrates the
counts in each size bin. Obviously, the majority of droplet sizes range from 20 μm to 90 μm. The
68
Sauter mean diameter (SMD) based on this simulated spray is 54.83 μm, pretty close to the
experimental result of 56.87 μm. The experimental results for droplet size distribution are shown in
Figure 3-10. Compared with the experimentally-obtained size distribution, the numerical method
shows a small deviation by predicting more small drops. This explains why the simulated SMD is
smaller than its experimental counterpart. A further examination of Figure 3-10(a) and Figure 3-10(b)
reveals the trend that large drops have greater weights in the volumne distribution spectrum than the
small ones. Hence it is natural to get a larger volumne mean diameter (D30) than the surface mean(D20)
and arithmetic mean (D10) diameter. Furthermore, SMD, based on the ratio of volume (D3 ) to surface
area (D2 ), is biased to the large-sized droplets, so that the difference between the SMD and other
mean diameters increases when the droplet size shows a widely dispersed distribution.
Table 3-5 Various mean diameters and their potential applications [183]. The values of p and q are
defined in Equation (3-34).
Characteristic
Diameter p q Physical Meaning Potential Applications
Arithmetic Mean
Diameter (D10) 1 0
Averaged diameter based on the number density
function of the sample Comparison, Evaporation
Surface Mean Diameter
(D20) 2 0
The diameter of a hypothetical particle having the
same averaged surface area as that of the given
sample
Surface area controlling
processes such as
absorption and desorption
Volume Mean
Diameter (D30) 3 0
The diameter of a hypothetical particle having the
same averaged volume as that of the given sample
Volume controlling
process such as solids
holdup in a fluidized bed or
buoyancy force
calculations for particles
Sauter Mean Diameter
(D32) 3 2
The diameter of a hypothetical particle having the
same averaged specific surface area per unit
volume as that of the given sample
Evaporation, mass transfer
and reaction
DeBrouckere
Mean Diameter (D43) 4 3
The averaged diameter based on the mass density
function of the ample Combustion equilibrium
69
When combining Figure 3-9(a) with Figure 3-11, it is worthwhile to note the existence of small
droplets with low velocity in the peripheral region of the spray cone. The presence of these small
drops is due to the stochastic secondary breakup of large drops. Since large droplets in the peripheral
part of spray experience greater gas-droplet slip velocity than their counterparts in the spray core
where significant entrainment gas velocities exist, the drag forces exerted on these large peripheral
droplets exceeds the surface tension, leading to the droplet deceleration and break up. The newly
formed child droplets are generally small as well as slow-moving because they inherit only a very
small fraction of the substance and momentum of the parent droplet. This rationale is backed by
another study reported by Shi and Kleinstreuer [184].
Droplet Velocity
Another important parameter for spray characterization is the velocity of droplets. Figure 3-11 shows
the evolution of droplet velocity in the axial direction. It is clear that at the very immediate neighbour
of nozzle exit, the initially injected droplets have high velocity and travel along the edges of the
underdeveloped spray. Gradually the hollow cone shaped is formed and the droplets in the leading
edge are decelerated under the influence of drag, which is governed by the relative magnitude of the
kinetic energy and the aerodynamic resistance of the surrounding gaseous medium. As a result, more
slow-moving drops come to concentrate in the middle of the spray region. As is shown in Figure 3-13,
droplet velocity decreases with axial distance, and finally follows the airflow velocity when the
droplet momentum is lost. This conclusion was also confirmed by the experimental results obtained
by Shi and Kleinstreuer [184].
Figure 3-9 Droplet size distribution for the whole domain (a) and its statistic representation in
histogram (b).
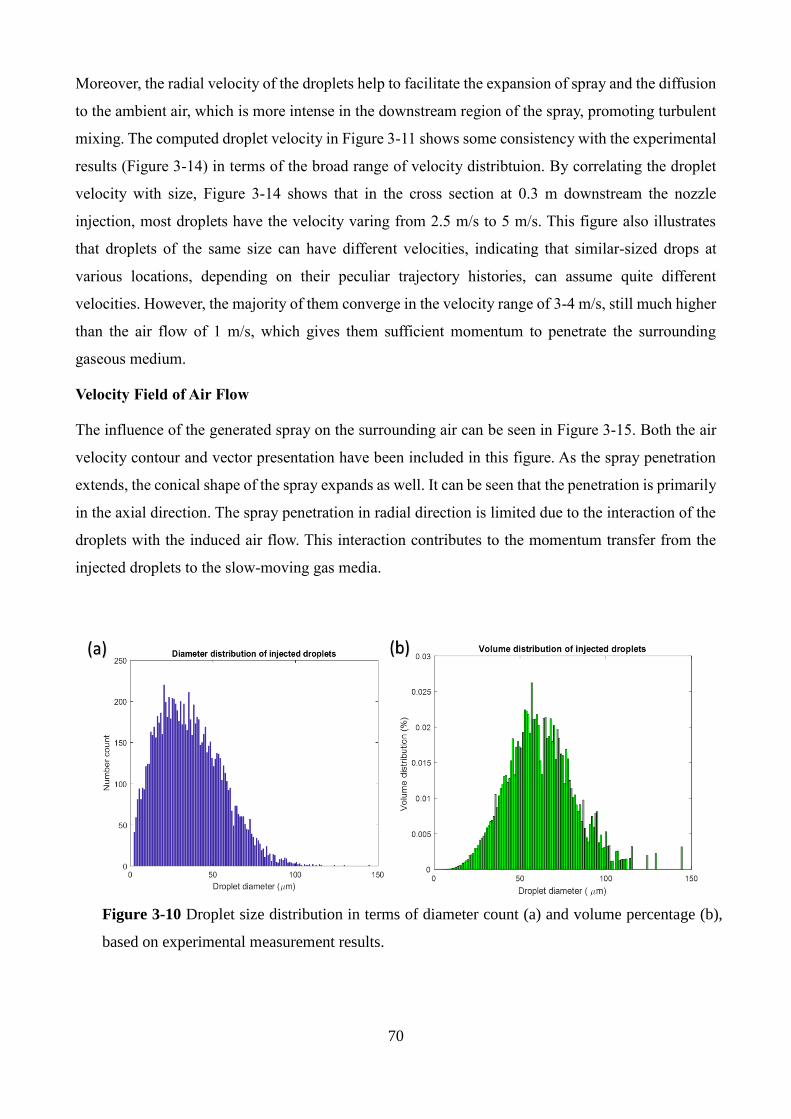
70
Moreover, the radial velocity of the droplets help to facilitate the expansion of spray and the diffusion
to the ambient air, which is more intense in the downstream region of the spray, promoting turbulent
mixing. The computed droplet velocity in Figure 3-11 shows some consistency with the experimental
results (Figure 3-14) in terms of the broad range of velocity distribtuion. By correlating the droplet
velocity with size, Figure 3-14 shows that in the cross section at 0.3 m downstream the nozzle
injection, most droplets have the velocity varing from 2.5 m/s to 5 m/s. This figure also illustrates
that droplets of the same size can have different velocities, indicating that similar-sized drops at
various locations, depending on their peculiar trajectory histories, can assume quite different
velocities. However, the majority of them converge in the velocity range of 3-4 m/s, still much higher
than the air flow of 1 m/s, which gives them sufficient momentum to penetrate the surrounding
gaseous medium.
Velocity Field of Air Flow
The influence of the generated spray on the surrounding air can be seen in Figure 3-15. Both the air
velocity contour and vector presentation have been included in this figure. As the spray penetration
extends, the conical shape of the spray expands as well. It can be seen that the penetration is primarily
in the axial direction. The spray penetration in radial direction is limited due to the interaction of the
droplets with the induced air flow. This interaction contributes to the momentum transfer from the
injected droplets to the slow-moving gas media.
Figure 3-10 Droplet size distribution in terms of diameter count (a) and volume percentage (b),
based on experimental measurement results.
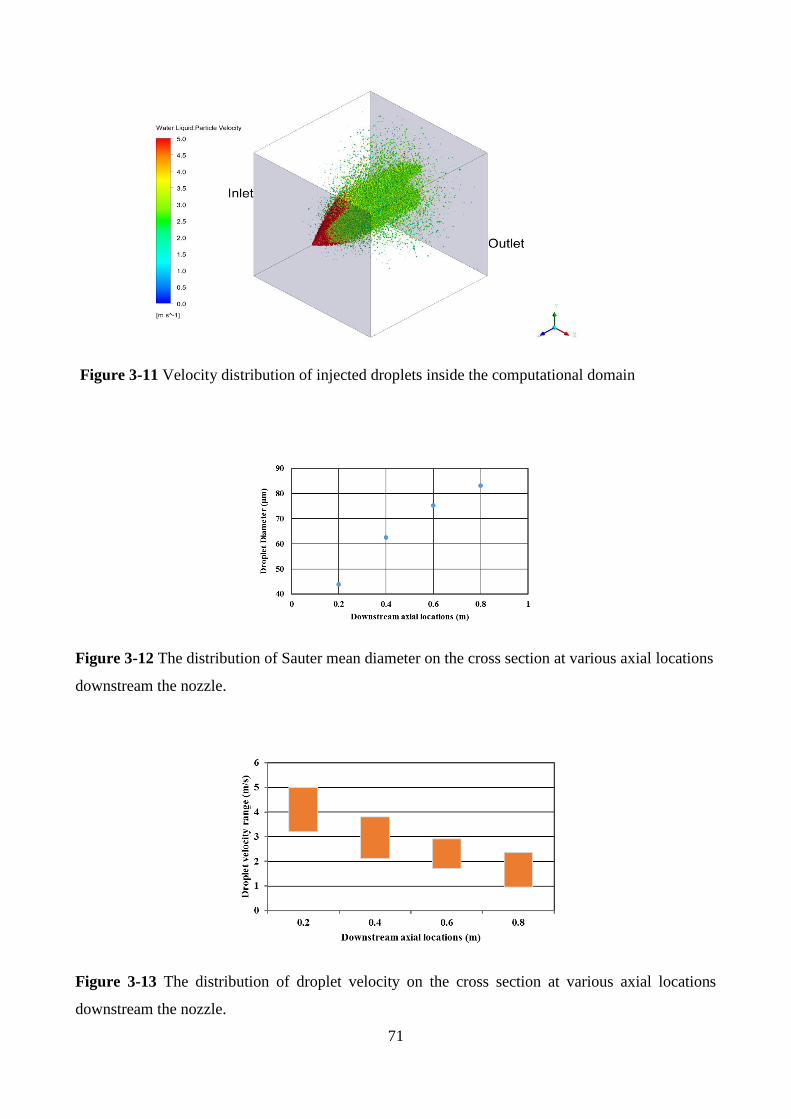
71
Figure 3-12 The distribution of Sauter mean diameter on the cross section at various axial locations
downstream the nozzle.
Figure 3-13 The distribution of droplet velocity on the cross section at various axial locations
downstream the nozzle.
Figure 3-11 Velocity distribution of injected droplets inside the computational domain
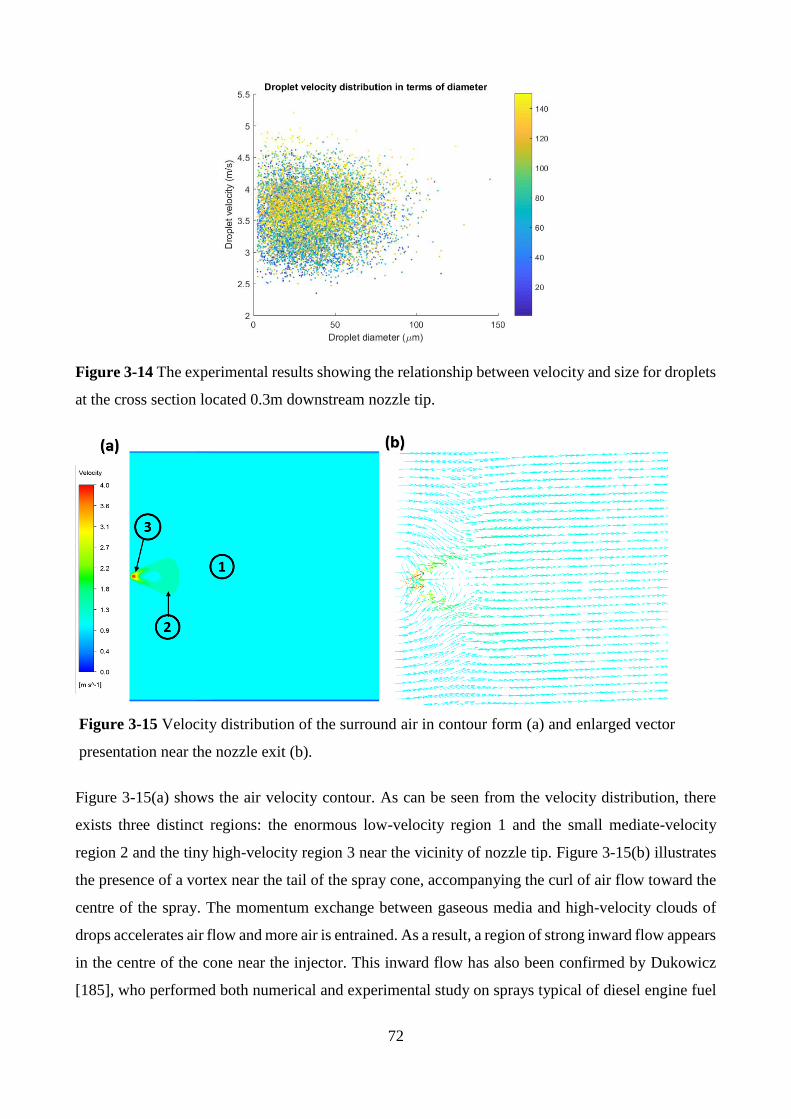
72
Figure 3-14 The experimental results showing the relationship between velocity and size for droplets
at the cross section located 0.3m downstream nozzle tip.
Figure 3-15(a) shows the air velocity contour. As can be seen from the velocity distribution, there
exists three distinct regions: the enormous low-velocity region 1 and the small mediate-velocity
region 2 and the tiny high-velocity region 3 near the vicinity of nozzle tip. Figure 3-15(b) illustrates
the presence of a vortex near the tail of the spray cone, accompanying the curl of air flow toward the
centre of the spray. The momentum exchange between gaseous media and high-velocity clouds of
drops accelerates air flow and more air is entrained. As a result, a region of strong inward flow appears
in the centre of the cone near the injector. This inward flow has also been confirmed by Dukowicz
[185], who performed both numerical and experimental study on sprays typical of diesel engine fuel
Figure 3-15 Velocity distribution of the surround air in contour form (a) and enlarged vector
presentation near the nozzle exit (b).
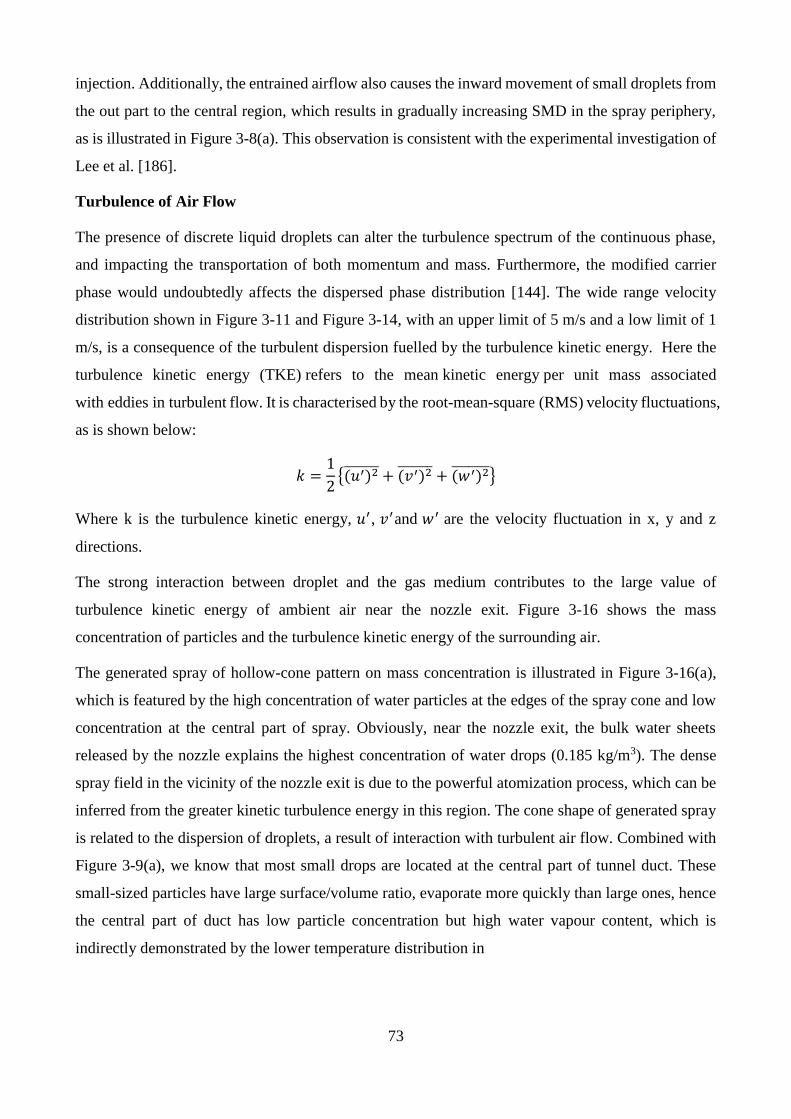
73
injection. Additionally, the entrained airflow also causes the inward movement of small droplets from
the out part to the central region, which results in gradually increasing SMD in the spray periphery,
as is illustrated in Figure 3-8(a). This observation is consistent with the experimental investigation of
Lee et al. [186].
Turbulence of Air Flow
The presence of discrete liquid droplets can alter the turbulence spectrum of the continuous phase,
and impacting the transportation of both momentum and mass. Furthermore, the modified carrier
phase would undoubtedly affects the dispersed phase distribution [144]. The wide range velocity
distribution shown in Figure 3-11 and Figure 3-14, with an upper limit of 5 m/s and a low limit of 1
m/s, is a consequence of the turbulent dispersion fuelled by the turbulence kinetic energy. Here the
turbulence kinetic energy (TKE) refers to the mean kinetic energy per unit mass associated
with eddies in turbulent flow. It is characterised by the root-mean-square (RMS) velocity fluctuations,
as is shown below:
𝑘 =1
2{(𝑢′)2 + (𝑣′)2 + (𝑤′)2 }
Where k is the turbulence kinetic energy, 𝑢′, 𝑣′and 𝑤′ are the velocity fluctuation in x, y and z
directions.
The strong interaction between droplet and the gas medium contributes to the large value of
turbulence kinetic energy of ambient air near the nozzle exit. Figure 3-16 shows the mass
concentration of particles and the turbulence kinetic energy of the surrounding air.
The generated spray of hollow-cone pattern on mass concentration is illustrated in Figure 3-16(a),
which is featured by the high concentration of water particles at the edges of the spray cone and low
concentration at the central part of spray. Obviously, near the nozzle exit, the bulk water sheets
released by the nozzle explains the highest concentration of water drops (0.185 kg/m3). The dense
spray field in the vicinity of the nozzle exit is due to the powerful atomization process, which can be
inferred from the greater kinetic turbulence energy in this region. The cone shape of generated spray
is related to the dispersion of droplets, a result of interaction with turbulent air flow. Combined with
Figure 3-9(a), we know that most small drops are located at the central part of tunnel duct. These
small-sized particles have large surface/volume ratio, evaporate more quickly than large ones, hence
the central part of duct has low particle concentration but high water vapour content, which is
indirectly demonstrated by the lower temperature distribution in
74
Figure 3-18. Meanwhile, the high momentum of large droplets show a greater tendency to maintain
its trajectory, penetrating the air flow in greater distance. It is relatively difficult for large drops to
evaporate, and hence the residual mass is larger than their small counterparts (Figure 3-17(a)). The
continuous injection makes large drops accumulate at the edge of spray, producing high-concentrated
area of particles as shown in the figure.
Near the nozzle exit, the turbulence kinetic energy achieve the maximal value in the whole spray
region. The maximum turbulence kinetic energy is correlated with the high gas entrainment velocity,
which can be as high as the injected droplets and decreases as the spray region expands. The
mechanism behind this high kinetic energy comes down to the fact that the initially injected droplets,
with large momentum and Reynolds number, experience a significant drag force during its
penetration in the slow-moving gas medium, and this aerodynamic force promotes the droplet
breakup as well as momentum exchange. Hence the gas surrounding nozzle exit gains substantial
momentum from the continuously discharged liquid. This turbulence augmentation is attributed to
the vortex shedding occurred in the droplet wake, which is more pronounced in the case of large-
sized particles [187]. Zaichik et al. reported that the wakes can greatly enhance the turbulence of
continuous phase [188]. As more droplets further their ways in the large air domain, droplets are no
longer limited in the confined central region, they disperse in the large air medium. Along with the
evolution and expansion of produced spray, more and more ambient gas attains an entrainment
velocity and hence the momentum gain in terms of the per unit mass of air will decrease until the gas
entrainment velocity decreases to a value attaining a momentum equilibrium with the appearing
droplets.
In brief, the shear stress derived from the momentum exchange between gas and liquid is the primary
contributor to the production and transportation of gas turbulence kinetic energy. In the
neighbourhood of nozzle exit, the strong interaction of the densely concentrated injected droplets (as
shown in Figure 3-16(a)) with surrounding air intensely exchange momentum in a great scale, leading
to much larger turbulent effects on the gas phase. Therefore, the gas turbulence energy is more intense
closer to the nozzle.
Droplet Evaporation
Modelling droplet dynamics with vaporization in a turbulent, two-phase flow is necessary to promote
droplet evaporation expected in some industrial applications such as inlet air fogging and spray
cooling [189][190]. The evaporation of travelling droplets in sprays can be indirectly seen in Figure
3-17(a). The gradually decreasing droplet mass along the main air flow clearly indicate that more and
more droplet evaporate as the spray expands. The figure evidently show that large drops with greater
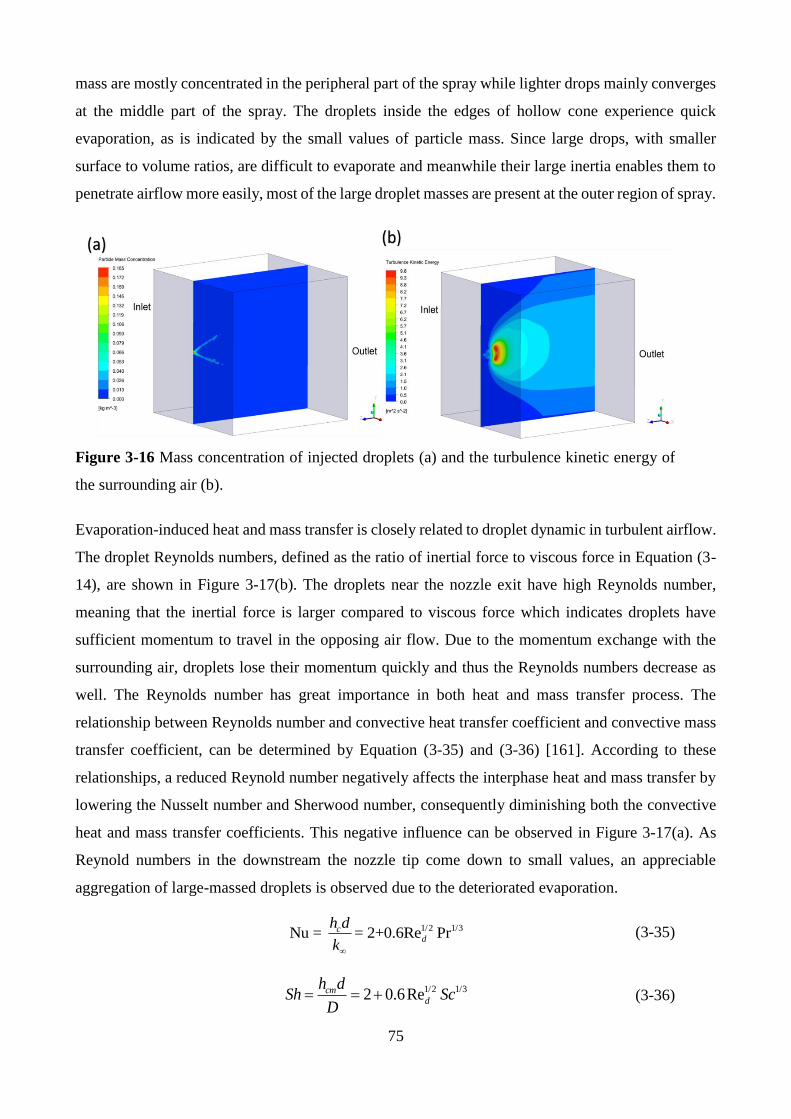
75
mass are mostly concentrated in the peripheral part of the spray while lighter drops mainly converges
at the middle part of the spray. The droplets inside the edges of hollow cone experience quick
evaporation, as is indicated by the small values of particle mass. Since large drops, with smaller
surface to volume ratios, are difficult to evaporate and meanwhile their large inertia enables them to
penetrate airflow more easily, most of the large droplet masses are present at the outer region of spray.
Evaporation-induced heat and mass transfer is closely related to droplet dynamic in turbulent airflow.
The droplet Reynolds numbers, defined as the ratio of inertial force to viscous force in Equation (3-
14), are shown in Figure 3-17(b). The droplets near the nozzle exit have high Reynolds number,
meaning that the inertial force is larger compared to viscous force which indicates droplets have
sufficient momentum to travel in the opposing air flow. Due to the momentum exchange with the
surrounding air, droplets lose their momentum quickly and thus the Reynolds numbers decrease as
well. The Reynolds number has great importance in both heat and mass transfer process. The
relationship between Reynolds number and convective heat transfer coefficient and convective mass
transfer coefficient, can be determined by Equation (3-35) and (3-36) [161]. According to these
relationships, a reduced Reynold number negatively affects the interphase heat and mass transfer by
lowering the Nusselt number and Sherwood number, consequently diminishing both the convective
heat and mass transfer coefficients. This negative influence can be observed in Figure 3-17(a). As
Reynold numbers in the downstream the nozzle tip come down to small values, an appreciable
aggregation of large-massed droplets is observed due to the deteriorated evaporation.
1/2 1/3Nu = = 2+0.6Re Prcd
h d
k (3-35)
1/2 1/32 0.6Recmd
h dSh Sc
D= = + (3-36)
Figure 3-16 Mass concentration of injected droplets (a) and the turbulence kinetic energy of
the surrounding air (b).
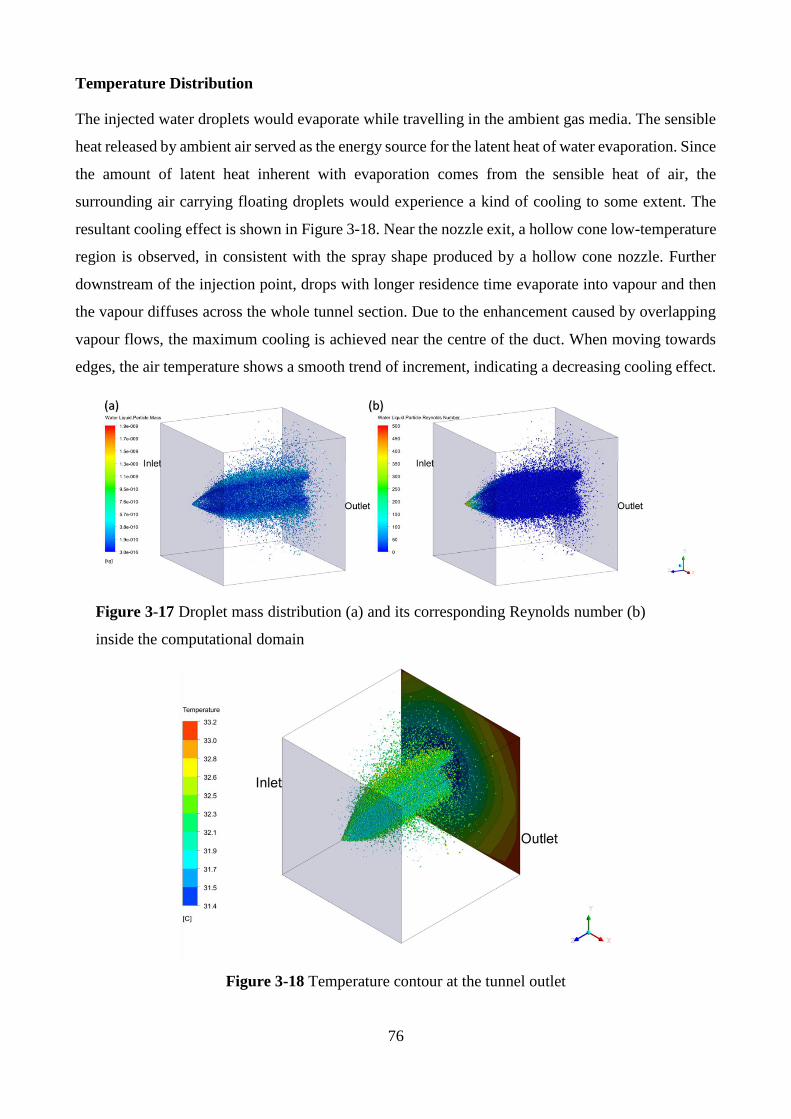
76
Temperature Distribution
The injected water droplets would evaporate while travelling in the ambient gas media. The sensible
heat released by ambient air served as the energy source for the latent heat of water evaporation. Since
the amount of latent heat inherent with evaporation comes from the sensible heat of air, the
surrounding air carrying floating droplets would experience a kind of cooling to some extent. The
resultant cooling effect is shown in Figure 3-18. Near the nozzle exit, a hollow cone low-temperature
region is observed, in consistent with the spray shape produced by a hollow cone nozzle. Further
downstream of the injection point, drops with longer residence time evaporate into vapour and then
the vapour diffuses across the whole tunnel section. Due to the enhancement caused by overlapping
vapour flows, the maximum cooling is achieved near the centre of the duct. When moving towards
edges, the air temperature shows a smooth trend of increment, indicating a decreasing cooling effect.
Figure 3-18 Temperature contour at the tunnel outlet
Figure 3-17 Droplet mass distribution (a) and its corresponding Reynolds number (b)
inside the computational domain
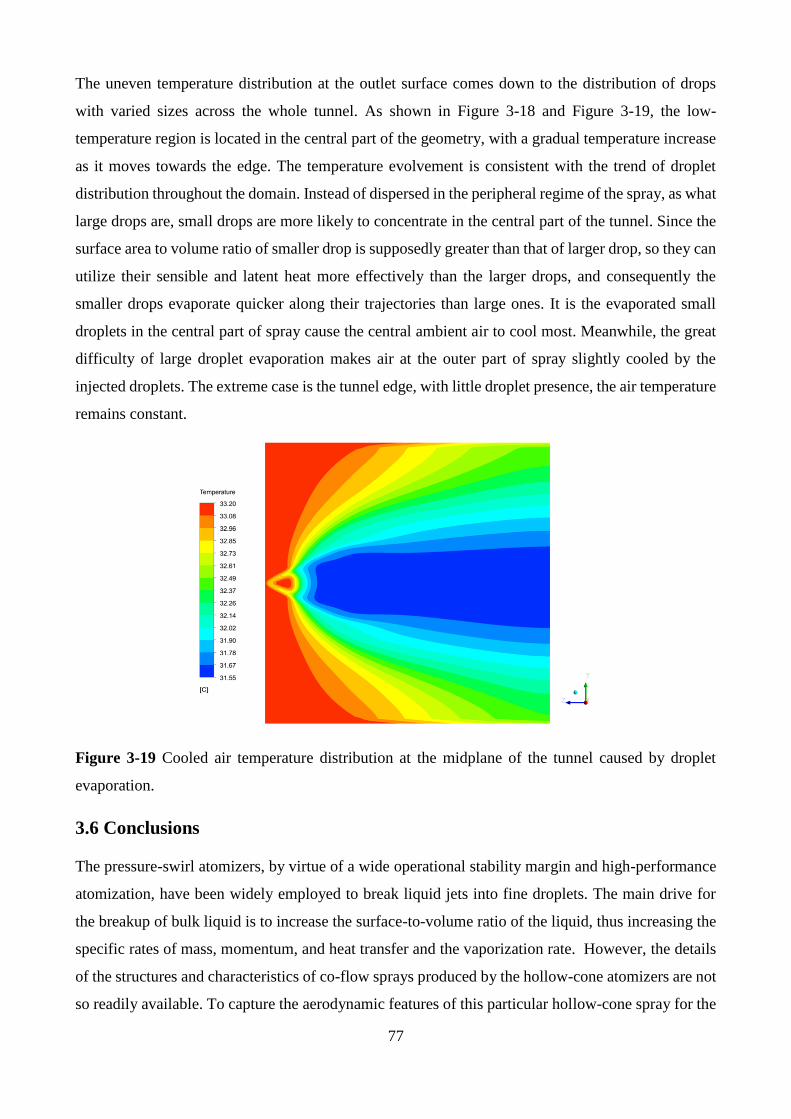
77
The uneven temperature distribution at the outlet surface comes down to the distribution of drops
with varied sizes across the whole tunnel. As shown in Figure 3-18 and Figure 3-19, the low-
temperature region is located in the central part of the geometry, with a gradual temperature increase
as it moves towards the edge. The temperature evolvement is consistent with the trend of droplet
distribution throughout the domain. Instead of dispersed in the peripheral regime of the spray, as what
large drops are, small drops are more likely to concentrate in the central part of the tunnel. Since the
surface area to volume ratio of smaller drop is supposedly greater than that of larger drop, so they can
utilize their sensible and latent heat more effectively than the larger drops, and consequently the
smaller drops evaporate quicker along their trajectories than large ones. It is the evaporated small
droplets in the central part of spray cause the central ambient air to cool most. Meanwhile, the great
difficulty of large droplet evaporation makes air at the outer part of spray slightly cooled by the
injected droplets. The extreme case is the tunnel edge, with little droplet presence, the air temperature
remains constant.
Figure 3-19 Cooled air temperature distribution at the midplane of the tunnel caused by droplet
evaporation.
3.6 Conclusions
The pressure-swirl atomizers, by virtue of a wide operational stability margin and high-performance
atomization, have been widely employed to break liquid jets into fine droplets. The main drive for
the breakup of bulk liquid is to increase the surface-to-volume ratio of the liquid, thus increasing the
specific rates of mass, momentum, and heat transfer and the vaporization rate. However, the details
of the structures and characteristics of co-flow sprays produced by the hollow-cone atomizers are not
so readily available. To capture the aerodynamic features of this particular hollow-cone spray for the
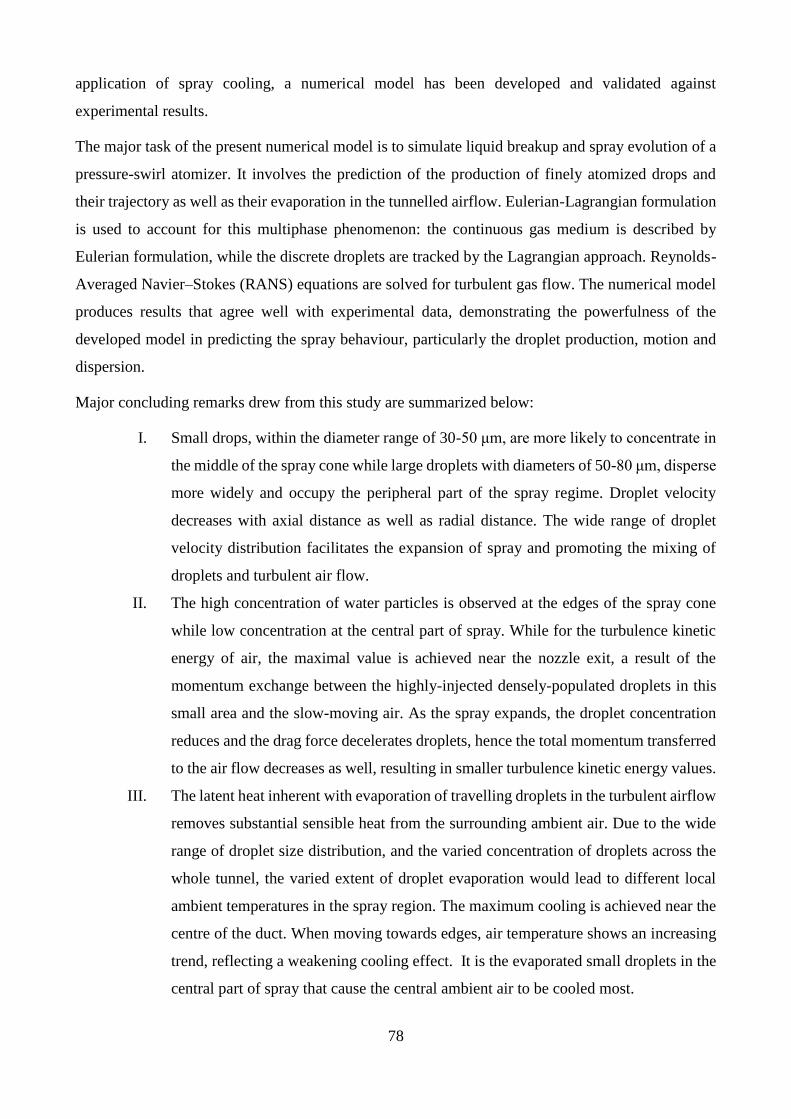
78
application of spray cooling, a numerical model has been developed and validated against
experimental results.
The major task of the present numerical model is to simulate liquid breakup and spray evolution of a
pressure-swirl atomizer. It involves the prediction of the production of finely atomized drops and
their trajectory as well as their evaporation in the tunnelled airflow. Eulerian-Lagrangian formulation
is used to account for this multiphase phenomenon: the continuous gas medium is described by
Eulerian formulation, while the discrete droplets are tracked by the Lagrangian approach. Reynolds-
Averaged Navier–Stokes (RANS) equations are solved for turbulent gas flow. The numerical model
produces results that agree well with experimental data, demonstrating the powerfulness of the
developed model in predicting the spray behaviour, particularly the droplet production, motion and
dispersion.
Major concluding remarks drew from this study are summarized below:
I. Small drops, within the diameter range of 30-50 μm, are more likely to concentrate in
the middle of the spray cone while large droplets with diameters of 50-80 μm, disperse
more widely and occupy the peripheral part of the spray regime. Droplet velocity
decreases with axial distance as well as radial distance. The wide range of droplet
velocity distribution facilitates the expansion of spray and promoting the mixing of
droplets and turbulent air flow.
II. The high concentration of water particles is observed at the edges of the spray cone
while low concentration at the central part of spray. While for the turbulence kinetic
energy of air, the maximal value is achieved near the nozzle exit, a result of the
momentum exchange between the highly-injected densely-populated droplets in this
small area and the slow-moving air. As the spray expands, the droplet concentration
reduces and the drag force decelerates droplets, hence the total momentum transferred
to the air flow decreases as well, resulting in smaller turbulence kinetic energy values.
III. The latent heat inherent with evaporation of travelling droplets in the turbulent airflow
removes substantial sensible heat from the surrounding ambient air. Due to the wide
range of droplet size distribution, and the varied concentration of droplets across the
whole tunnel, the varied extent of droplet evaporation would lead to different local
ambient temperatures in the spray region. The maximum cooling is achieved near the
centre of the duct. When moving towards edges, air temperature shows an increasing
trend, reflecting a weakening cooling effect. It is the evaporated small droplets in the
central part of spray that cause the central ambient air to be cooled most.

79
Chapter 4 Impacts of Injection Direction on Spray Evaporation
This chapter is based on the paper published in International Journal of Heat and Mass Transfer.
This chapter presents the influence of injection direction on the cooling effect of single spray. CFD
study shows that optimized cooling results can be achieved by adjusting injection direction due to the
accelerated evaporation process. This is attributed to the influence of injection angle on the
momentum exchange between ambient air and sprayed water droplets. The varied injection direction
changes the relative strength of the vertical and horizontal components of droplet velocity. Since the
pre-cooling performance heavily depends on the injection direction of nozzle, this study can be used
as guidelines for the selection and arrangement of spray nozzles.
80
Investigation on the influence of injection direction on the spray cooling
performance in natural draft dry cooling tower
Yubiao Sun, Zhiqiang Guan, Hal Gurgenci, Kamel Hooman, Xiaoxiao Li, Lin Xia
Queensland Geothermal Energy Centre of Excellence,
School of Mechanical and Mining Engineering,
The University of Queensland, Brisbane 4072, Australia
International Journal of Heat and Mass Transfer 110(2017) 113-131
Abstract:
In arid areas, natural draft dry cooling tower (NDDCT) has become the primary choice in
concentrating solar thermal power plants due to its advantages of low water consumption, low
maintenance cost and little parasite loss. However, NDDCT suffers from deteriorated cooling
performance in hot summer days, causing net power loss for power plants. To solve this problem, we
propose a pre-cooling technology by introducing a spray of controlled and small quantity of fine water
droplets to cool the inlet air and thus improve the cooling tower performance when ambient
temperature is high. The effective pre-cooling requires the careful arrangement of spray nozzles. Here
the optimal injection for a hollow cone nozzle has been identified based on CFD study. This study
shows that pre-cooling performance heavily depends on the injection direction of nozzle. For a single
nozzle with the water flowrate of 5 g/s, the largest temperature drop is 1.27 °C, corresponding to the
radiator temperature of 38.73°C. It is found that the injection angle varies with the height of nozzle
location to achieve full evaporation.
Keywords:
Natural draft dry cooling tower; full evaporation; spray cooling; injection direction
4.1 Introduction
Thermal power plants, from a thermodynamic point of view, exhaust substantial waste heat to the
surrounding environment and need a low-temperature reservoir for cooling purpose. In this sense, the
performance of cooling system is significant for the power plant operations and have an important
impact on the performance of the entire power cycle. A defective cooling system, failing to provide
adequate cooling for the power generation process, would lead to decreased electricity production as
well as serious economic consequences. An approximate 0.3 GWh annual electrical generation loss
in the U.S. was caused by the cooling towers’ operating at their off-design points. Economically
81
speaking, this power loss corresponds to a reduced benefit of US$20 million per year [191]. In order
to avoid such disadvantage, an efficient cooling system becomes a necessary part for power plants.
In practice, mechanical draft and natural draft cooling towers are most commonly used. Mechanical
draught cooling towers use motor-driven fan to force or draw air through the towers and the energy
consumption by the fans increases the running costs, therefore many power plants prefer to build the
more economical natural draft cooling towers. Broadly speaking, both natural and mechanical-draft
draft cooling towers can be categorized into two types: wet and dry cooling towers. Wet cooling
towers use water as the heat transfer medium and rely on the latent heat of water to provide significant
cooling to the process. Theoretically, wet cooling enables the hot water to be cooled to the
atmospheric wet bulb temperature and is more efficient than dry cooling. However, they consume
large quantities of freshwater due to evaporation, drift and draining losses. Therefore, supplemented
water should be continuously supplied to guarantee the normal operation of towers. The large water
consumption as well as the environmental concerns such as thermal pollution, which would result in
the degradation of water quality, visible plume and entrainment and impingement issues makes them
unsuitable for the regions suffering from water shortage [192].
In arid areas, dry cooling towers with the advantages of low water consumption, low maintenance
cost and little parasitic loss, become the primary choice for some thermal power plants to release the
waste heat to the atmosphere by cooling down hot fluid to a lower temperature. Despite these
advantages, dry cooling towers suffer from low performance relative to wet cooling towers as they
rely mainly on convective heat transfer into the air to dissipate heat rather than evaporation of water
[27]. The cooling efficiency loss becomes remarkable during high ambient temperature periods and/or
under strong crosswind conditions [16].
As to the tower performance loss caused by the crosswind, numerous results have been published.
Wei et al. [46] conducted full scale measurements and wind tunnel modeling to study the crosswind
effects on dry cooling tower. They found that the unfavorable pressure distribution around tower
entrance, the affected tower hot plume and the leading edge separation induced cool air contributed
to reduce the tower cooling performance. Su et al. [47] used finite volume method to simulate the
thermal performance of dry cooling tower under crosswind conditions, and confirmed the declining
thermo-dynamical effect of crosswind. Zhao et al. furthered the crosswind study by considering the
delta layout form of column radiators. They used a three-dimensional (3D) numerical model to
explore the cooling performance of a natural draft dry cooling tower with vertical two-pass column
radiators (NDDCTV) under crosswind [193]. They concluded that the poor cooling performance of
NDDCTV caused by crosswind would lead to an increased water exit temperature. Specifically, the
82
worst scenario occurs at the 12 m/s crosswind condition, rising the water temperature by 6 °C when
compared with the no-crosswind counterpart. More recently, Zhao et al. updated their research by
coupling the ambient air temperature impacts with the crosswind influence on the performance of
NDDCTV [194]. By setting a constant heat load and a uniform entry water temperature, they focused
on analyzing the cooling performance of each sector under crosswinds. The deteriorating performance
under crosswinds shows two patterns: for low cross wind velocity, the cooling performance of
NDDCTV deteriorates sharply, while for high cross wind conditions, it experiences a slight variance.
In addition to the susceptibility to the crosswind, another reason for the low acceptance for NDDCT
is the substantial loss of heat rejection rate in summer days [16]. As a result, power plants utilizing
dry cooling technologies can experience a significant 20% net power reduction during high ambient
temperature periods [17]. This is a catastrophe for plants based on low temperature resources (e.g.
geothermal plants) where the power output reduction can be as high as 50% in hot summer days
[18,19]. What is worse, this issue is compounded since the reduction goes along with the peak power
demand which means a greater loss for power plant owners with flexible electricity pricing.
To overcome the low efficiency problem related to dry cooling during high ambient conditions, spray
cooling system has been developed to cool the inlet air by introducing a controlled, small quantity,
and fine water droplets. This method, famed for its simplicity, low capital cost, and ease for operation
and maintenance, has been reported to be a potential solution that deserves a further investigation
[195]. In this system, spray nozzles are used to break bulk water into small water droplets and
distribute these droplets into the inlet air (Figure 4-1). These fine droplets, with large water-air contact
surface area, can accelerate the evaporation process. The air stream motion is barely affected by the
introduction of droplets. The pressure drop caused by the sprays is insignificant [27]. The latent heat
of the evaporated water droplets is provided by the hot ambient air, so the water evaporation
contributes to the cooling of the inlet air. The pre-cooled inlet air reduces the condenser temperature
and consequently increases the thermal efficiency of a power plant. As a result, compared to their
dry-cooling counterparts, the power plants assisted by sprays can generate more power.
Inlet air spray cooling technology has been successfully applied in many industrial practices, such as
food refrigeration [196] and gas turbine fogging [90,197]. More than 1000 gas turbine stations have
adopted this technology [198]. Chaker et al. [148,199,200] made a comprehensive study about the
physics and engineering applications of the fogging process in gas turbines, including droplet
measurement methods, droplet kinetics, and the duct behavior of droplets. Montazeri et al. [132]
studied the Lagrangian–Eulerian approach for spray cooling produced by a hollow-cone. The results
show that CFD simulation of evaporation is capable to accurately predict evaporation process.
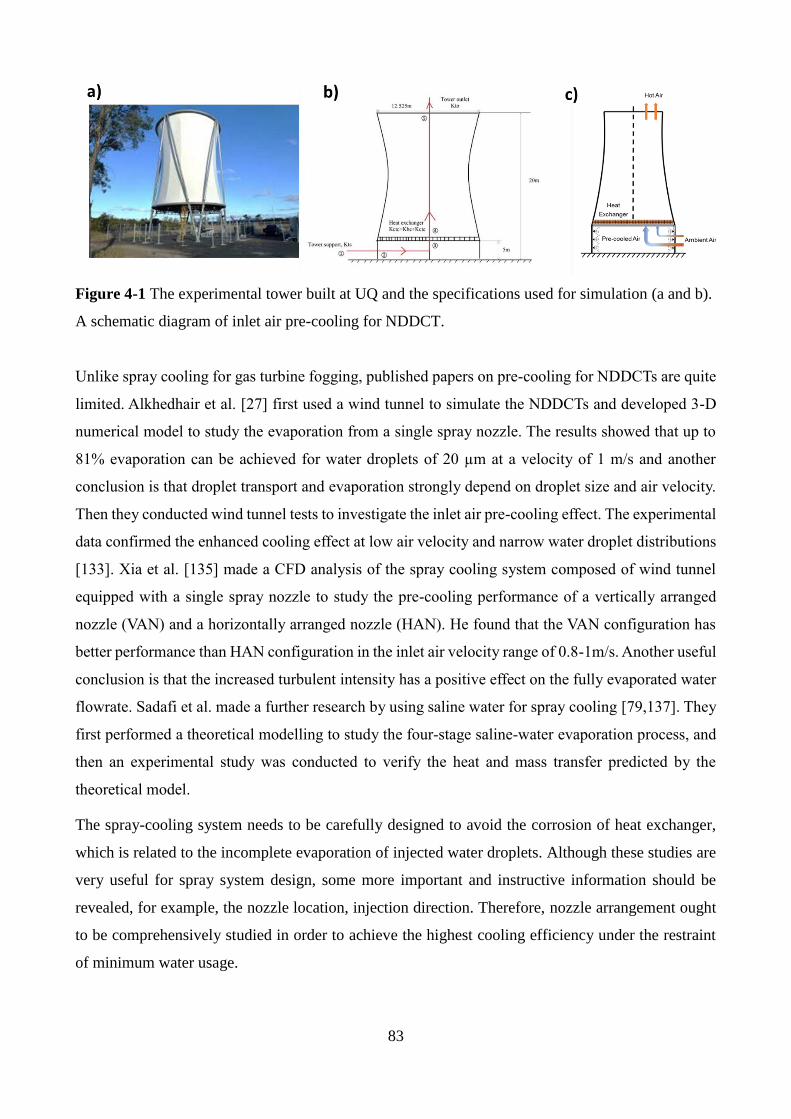
83
Figure 4-1 The experimental tower built at UQ and the specifications used for simulation (a and b).
A schematic diagram of inlet air pre-cooling for NDDCT.
Unlike spray cooling for gas turbine fogging, published papers on pre-cooling for NDDCTs are quite
limited. Alkhedhair et al. [27] first used a wind tunnel to simulate the NDDCTs and developed 3-D
numerical model to study the evaporation from a single spray nozzle. The results showed that up to
81% evaporation can be achieved for water droplets of 20 µm at a velocity of 1 m/s and another
conclusion is that droplet transport and evaporation strongly depend on droplet size and air velocity.
Then they conducted wind tunnel tests to investigate the inlet air pre-cooling effect. The experimental
data confirmed the enhanced cooling effect at low air velocity and narrow water droplet distributions
[133]. Xia et al. [135] made a CFD analysis of the spray cooling system composed of wind tunnel
equipped with a single spray nozzle to study the pre-cooling performance of a vertically arranged
nozzle (VAN) and a horizontally arranged nozzle (HAN). He found that the VAN configuration has
better performance than HAN configuration in the inlet air velocity range of 0.8-1m/s. Another useful
conclusion is that the increased turbulent intensity has a positive effect on the fully evaporated water
flowrate. Sadafi et al. made a further research by using saline water for spray cooling [79,137]. They
first performed a theoretical modelling to study the four-stage saline-water evaporation process, and
then an experimental study was conducted to verify the heat and mass transfer predicted by the
theoretical model.
The spray-cooling system needs to be carefully designed to avoid the corrosion of heat exchanger,
which is related to the incomplete evaporation of injected water droplets. Although these studies are
very useful for spray system design, some more important and instructive information should be
revealed, for example, the nozzle location, injection direction. Therefore, nozzle arrangement ought
to be comprehensively studied in order to achieve the highest cooling efficiency under the restraint
of minimum water usage.

84
In this paper, a 3D CFD model was first developed to simulate the NDDCT to get the velocity field.
The NDDCT specifications was based on the experimental tower built in the University of
Queensland (UQ). Then this velocity field was used for spray cooling calculations. The influences of
nozzle location and injection direction on the pre-cooling performance of a single hollow-cone nozzle.
Then the results are analysed to optimize nozzle arrangement and enhance cooling efficiency.
4.2 Numerical Method
In this study, a CFD investigation of spray cooling for the inlet air passing NDDCT has been carried
out. The numerical analysis has been performed with the commercial software ANSYS FLUENT
(Version 16.2). Understanding the interaction level between the droplets (discrete phase) and the
continuous phase (air) is essential. According to Elgobashi [201], there are two regimes in which the
transport of water droplets flow in a turbulent air flow can be numerically predicted with regards to
the interaction level between the two phases in Eulerian-Lagrangian simulations. The first regime is
the “one way coupling” where the influence of the droplets on the airflow characteristics is negligible.
That means, air properties are not impacted by the existence of droplets. The second regime is the
“two-way coupling” where the influence of the droplets on the airflow characteristics is large enough
to affect the airflow. Therefore, modification to the airflow field governing equations is necessary to
take into account the two-phase coupling. In addition to these situations, droplet/droplet interaction
may occur, so another regime takes place called “four way coupling” where droplets exchange
momentum with nearby droplets [91]. Identifying the type of coupling between the two phases is
related to the volume fraction of discrete phase on the carrier phase. The volume fraction is an
indication of whether the spray is dilute or dense. For very dilute regions, one-way coupling can be
considered and for dilute region, the two-way coupling can be considered. The four-way coupling,
on the other hand, is used in addition to the two-way coupling for dense regions [91]. In this study,
the volume fraction of spray is low compared to air (less than 10%), the influence of droplets on the
airflow was taken into account by using the two-way coupling regime [163].
There are several techniques to take the droplet influence on the airflow into account in dilute spray
regions when the Eulerian-Lagrangian approach is used. These include the discrete droplet model,
the particle-source-in-cell (PSI-cell) model, population models and techniques of moments [202]. A
widely used method is the PSI-cell model developed by Crowe [203,204]. In this model, the
governing equations of the two phases are connected by introducing source terms of mass, energy
and momentum into the air phase governing equations. Droplet vaporization results in heat and mass
transfer, and sources of mass and energy need to be incorporated into the mass and energy equations

85
of air. Acceleration or deceleration of droplets results in a momentum exchange which is also
incorporated into the air momentum equation.
The incorporation of the coupling influence of the two phases on each other is achieved by means of
an iterative process as illustrated in the flow chart (Figure 4-2), following the concept of Crowe [203].
Firstly, the entire airflow phase is resolved using the Eulerian framework neglecting the existence of
droplets. Second, the droplets trajectories including size, velocity, position and temperature histories
are calculated utilizing the Lagrangian framework based on the computed airflow field. At this stage,
the mass, energy and momentum transfer exchanges are calculated and then added as source terms
into airflow field computation. Next, the airflow field is recalculated incorporating the source terms
provided from the discrete phase computation. These steps are repeated iteratively until a balance is
attained. Thus, the effect of droplets on the airflow characteristics can be evaluated.
4.2.1 Governing Equations
4.2.1.1 Continuous Phase
The airflow was modelled as a steady, incompressible, turbulent and continuous flow. The air flow
field was described by the Reynolds-time averaged Navier-Stokes conservation equations combined
with the standard k-ε model to account for the turbulence effects [164]. The governing equations of
the airflow are given in the Eulerian modelling as [205]:
Figure 4-2 Coupled between continuous and discrete phase calculations flowchart
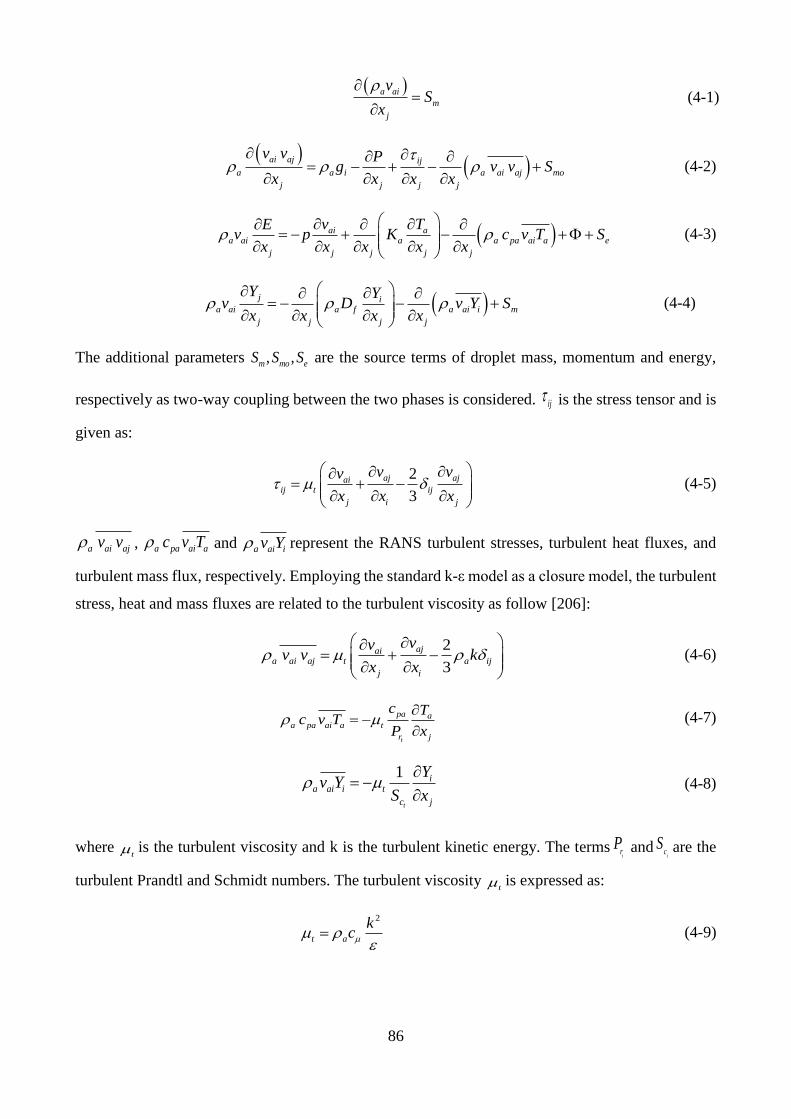
86
( )a ai
m
j
vS
x
=
(4-1)
( )
( )ai aj ij
a a i a ai aj mo
j j j j
v v Pg v v S
x x x x
= − + − +
(4-2)
( )ai aa ai a a pa ai a e
j j j j j
v TEv p K c v T S
x x x x x
= − + − ++
(4-3)
( )j ia ai a a ai i m
j j
f
j j
Y Yv v Y S
x x xD
x
= − − +
(4-4)
The additional parameters , ,m mo eS S S are the source terms of droplet mass, momentum and energy,
respectively as two-way coupling between the two phases is considered. ij is the stress tensor and is
given as:
2
3
aj ajaiij t ij
j i j
v vv
x x x
= + −
(4-5)
a ai ajv v , a pa ai ac v T and a ai iv Y represent the RANS turbulent stresses, turbulent heat fluxes, and
turbulent mass flux, respectively. Employing the standard k-ε model as a closure model, the turbulent
stress, heat and mass fluxes are related to the turbulent viscosity as follow [206]:
2
3
ajaia ai aj t a ij
j i
vvv v k
x x
= + −
(4-6)
t
pa aa pa ai a t
r j
c Tc v T
P x
= −
(4-7)
1
t
ia ai i t
c j
Yv Y
S x
= −
(4-8)
where t is the turbulent viscosity and k is the turbulent kinetic energy. The terms
tr
P andt
cS are the
turbulent Prandtl and Schmidt numbers. The turbulent viscosity t is expressed as:
2
t a
kc
= (4-9)
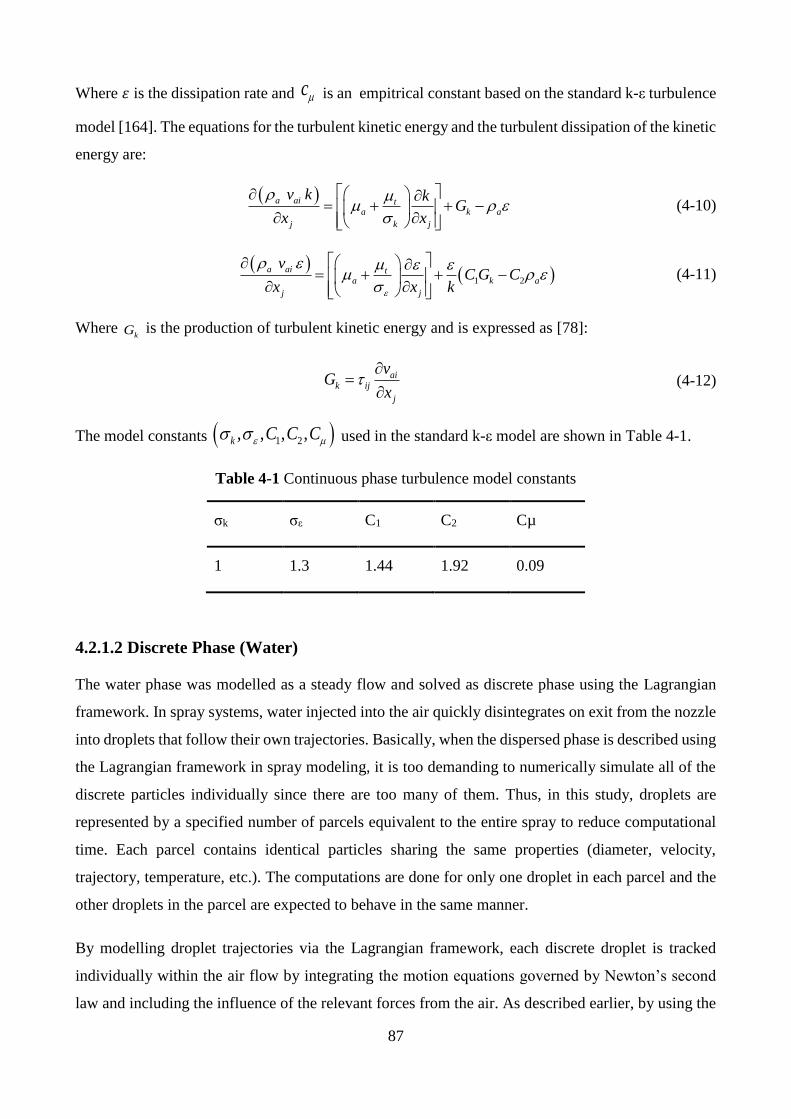
87
Where 𝜀 is the dissipation rate and c is an empitrical constant based on the standard k-ε turbulence
model [164]. The equations for the turbulent kinetic energy and the turbulent dissipation of the kinetic
energy are:
( )a ai ta k a
j k j
v k kG
x x
= + + −
(4-10)
( )( )1 2
a ai ta k a
j j
vC G C
x x k
= + + −
(4-11)
Where kG is the production of turbulent kinetic energy and is expressed as [78]:
aik ij
j
vG
x
=
(4-12)
The model constants ( )1 2, , , ,k C C C used in the standard k-ε model are shown in Table 4-1.
Table 4-1 Continuous phase turbulence model constants
σk σε C1 C2 Cµ
1 1.3 1.44 1.92 0.09
4.2.1.2 Discrete Phase (Water)
The water phase was modelled as a steady flow and solved as discrete phase using the Lagrangian
framework. In spray systems, water injected into the air quickly disintegrates on exit from the nozzle
into droplets that follow their own trajectories. Basically, when the dispersed phase is described using
the Lagrangian framework in spray modeling, it is too demanding to numerically simulate all of the
discrete particles individually since there are too many of them. Thus, in this study, droplets are
represented by a specified number of parcels equivalent to the entire spray to reduce computational
time. Each parcel contains identical particles sharing the same properties (diameter, velocity,
trajectory, temperature, etc.). The computations are done for only one droplet in each parcel and the
other droplets in the parcel are expected to behave in the same manner.
By modelling droplet trajectories via the Lagrangian framework, each discrete droplet is tracked
individually within the air flow by integrating the motion equations governed by Newton’s second
law and including the influence of the relevant forces from the air. As described earlier, by using the
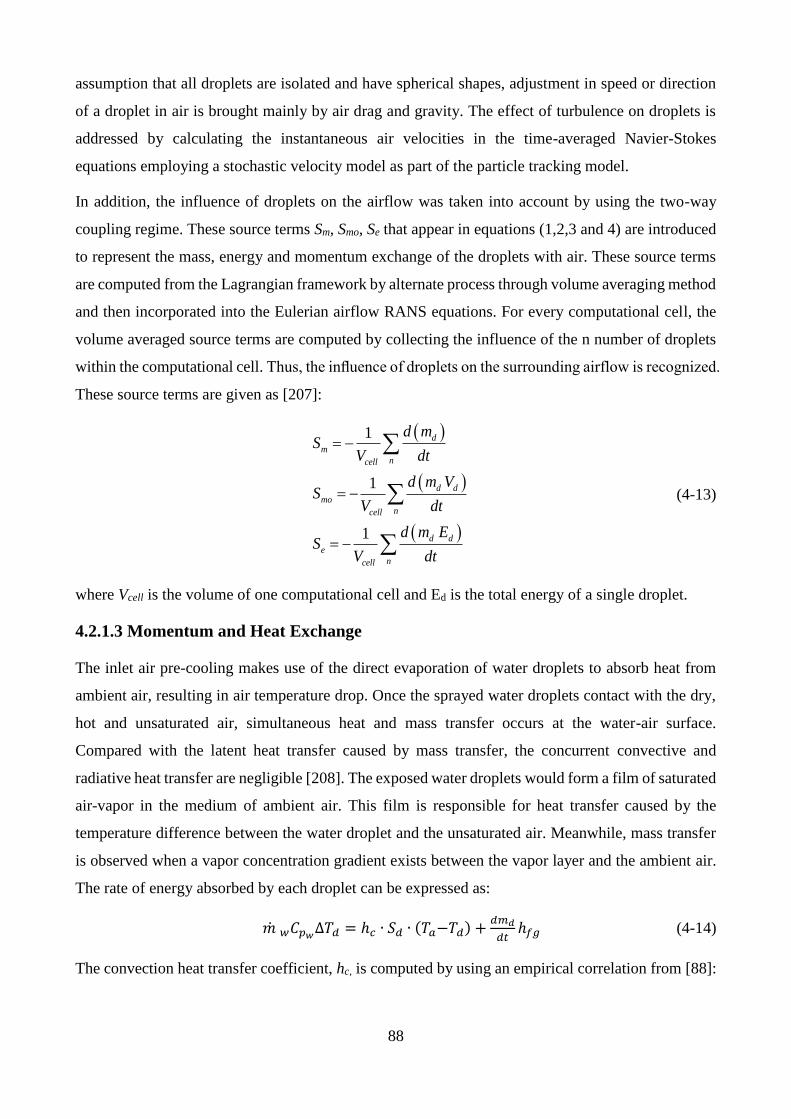
88
assumption that all droplets are isolated and have spherical shapes, adjustment in speed or direction
of a droplet in air is brought mainly by air drag and gravity. The effect of turbulence on droplets is
addressed by calculating the instantaneous air velocities in the time-averaged Navier-Stokes
equations employing a stochastic velocity model as part of the particle tracking model.
In addition, the influence of droplets on the airflow was taken into account by using the two-way
coupling regime. These source terms Sm, Smo, Se that appear in equations (1,2,3 and 4) are introduced
to represent the mass, energy and momentum exchange of the droplets with air. These source terms
are computed from the Lagrangian framework by alternate process through volume averaging method
and then incorporated into the Eulerian airflow RANS equations. For every computational cell, the
volume averaged source terms are computed by collecting the influence of the n number of droplets
within the computational cell. Thus, the influence of droplets on the surrounding airflow is recognized.
These source terms are given as [207]:
( )
( )
( )
1
1
1
m
ncell
d
mo
ncell
e
ncell
d
d
d d
d m
dt
d m
dt
d m E
d
SV
V
SV t
SV
= −
= −
= −
(4-13)
where Vcell is the volume of one computational cell and Ed is the total energy of a single droplet.
4.2.1.3 Momentum and Heat Exchange
The inlet air pre-cooling makes use of the direct evaporation of water droplets to absorb heat from
ambient air, resulting in air temperature drop. Once the sprayed water droplets contact with the dry,
hot and unsaturated air, simultaneous heat and mass transfer occurs at the water-air surface.
Compared with the latent heat transfer caused by mass transfer, the concurrent convective and
radiative heat transfer are negligible [208]. The exposed water droplets would form a film of saturated
air-vapor in the medium of ambient air. This film is responsible for heat transfer caused by the
temperature difference between the water droplet and the unsaturated air. Meanwhile, mass transfer
is observed when a vapor concentration gradient exists between the vapor layer and the ambient air.
The rate of energy absorbed by each droplet can be expressed as:
�� 𝑤𝐶𝑝𝑤∆𝑇𝑑 = ℎ𝑐 ∙ 𝑆𝑑 ∙ (𝑇𝑎−𝑇𝑑) +
𝑑𝑚𝑑
𝑑𝑡ℎ𝑓𝑔 (4-14)
The convection heat transfer coefficient, hc, is computed by using an empirical correlation from [88]:
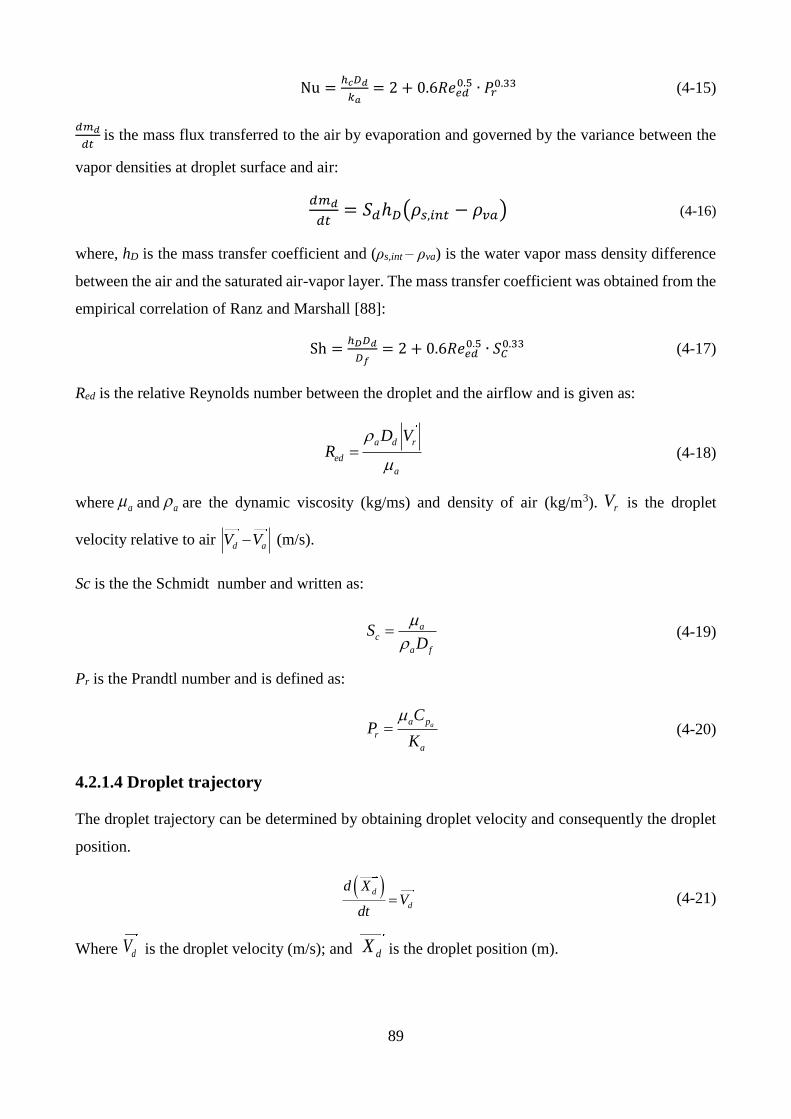
89
Nu =ℎ𝑐𝐷𝑑
𝑘𝑎= 2 + 0.6𝑅𝑒𝑒𝑑
0.5 ∙ 𝑃𝑟0.33 (4-15)
𝑑𝑚𝑑
𝑑𝑡 is the mass flux transferred to the air by evaporation and governed by the variance between the
vapor densities at droplet surface and air:
𝑑𝑚𝑑
𝑑𝑡= 𝑆𝑑ℎ𝐷(𝜌𝑠,𝑖𝑛𝑡 − 𝜌𝑣𝑎) (4-16)
where, hD is the mass transfer coefficient and (ρs,int – ρva) is the water vapor mass density difference
between the air and the saturated air-vapor layer. The mass transfer coefficient was obtained from the
empirical correlation of Ranz and Marshall [88]:
Sh =ℎ𝐷𝐷𝑑
𝐷𝑓= 2 + 0.6𝑅𝑒𝑒𝑑
0.5 ∙ 𝑆𝐶0.33 (4-17)
Red is the relative Reynolds number between the droplet and the airflow and is given as:
a d r
ed
a
D VR
= (4-18)
where a and a are the dynamic viscosity (kg/ms) and density of air (kg/m3). rV is the droplet
velocity relative to air d aV V− (m/s).
Sc is the the Schmidt number and written as:
ac
a f
SD
= (4-19)
Pr is the Prandtl number and is defined as:
aa p
r
a
CP
K
= (4-20)
4.2.1.4 Droplet trajectory
The droplet trajectory can be determined by obtaining droplet velocity and consequently the droplet
position.
( )d
d
d XV
dt= (4-21)
Where dV is the droplet velocity (m/s); and dX is the droplet position (m).
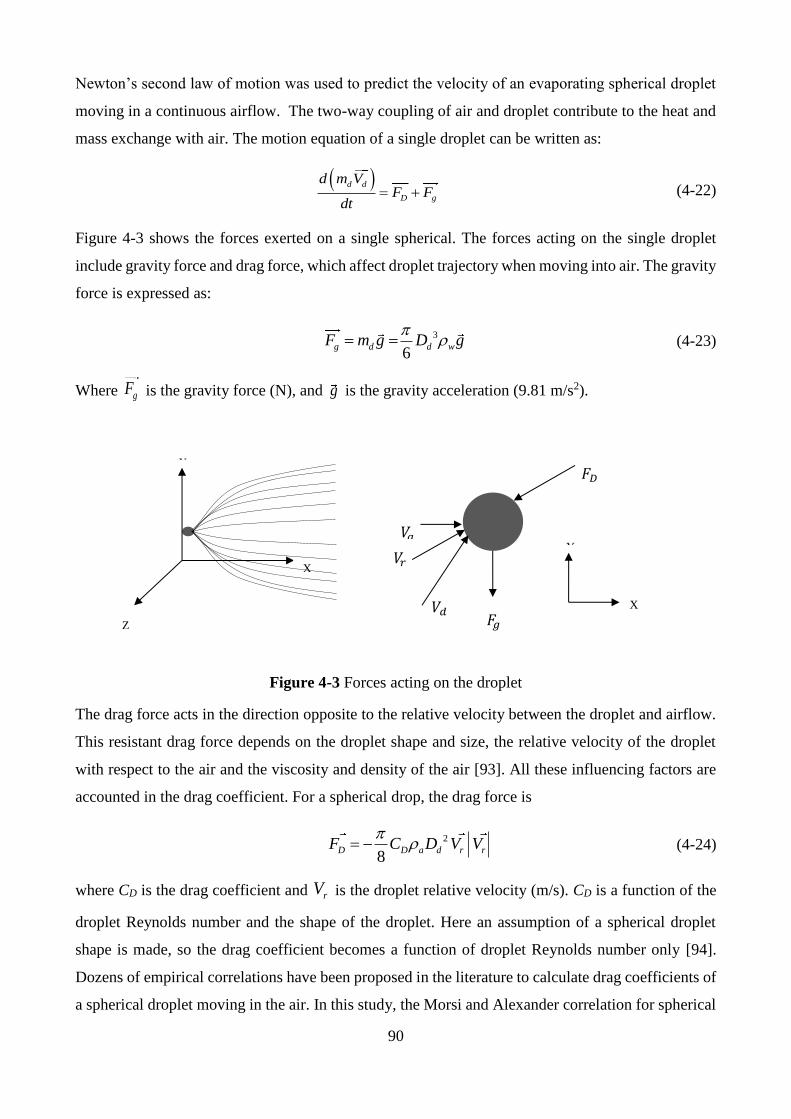
90
Newton’s second law of motion was used to predict the velocity of an evaporating spherical droplet
moving in a continuous airflow. The two-way coupling of air and droplet contribute to the heat and
mass exchange with air. The motion equation of a single droplet can be written as:
( )d d
D g
d m VF F
dt= + (4-22)
Figure 4-3 shows the forces exerted on a single spherical. The forces acting on the single droplet
include gravity force and drag force, which affect droplet trajectory when moving into air. The gravity
force is expressed as:
3 6
g d d wF m g D g
= = (4-23)
Where gF is the gravity force (N), and g is the gravity acceleration (9.81 m/s2).
Figure 4-3 Forces acting on the droplet
The drag force acts in the direction opposite to the relative velocity between the droplet and airflow.
This resistant drag force depends on the droplet shape and size, the relative velocity of the droplet
with respect to the air and the viscosity and density of the air [93]. All these influencing factors are
accounted in the drag coefficient. For a spherical drop, the drag force is
2
8D D a d r rF C D V V
= − (4-24)
where CD is the drag coefficient and rV is the droplet relative velocity (m/s). CD is a function of the
droplet Reynolds number and the shape of the droplet. Here an assumption of a spherical droplet
shape is made, so the drag coefficient becomes a function of droplet Reynolds number only [94].
Dozens of empirical correlations have been proposed in the literature to calculate drag coefficients of
a spherical droplet moving in the air. In this study, the Morsi and Alexander correlation for spherical
𝑉𝑑 𝐹𝑔
𝐹𝐷
𝑉𝑎 Y
X
Z
X
Y
𝑉𝑟
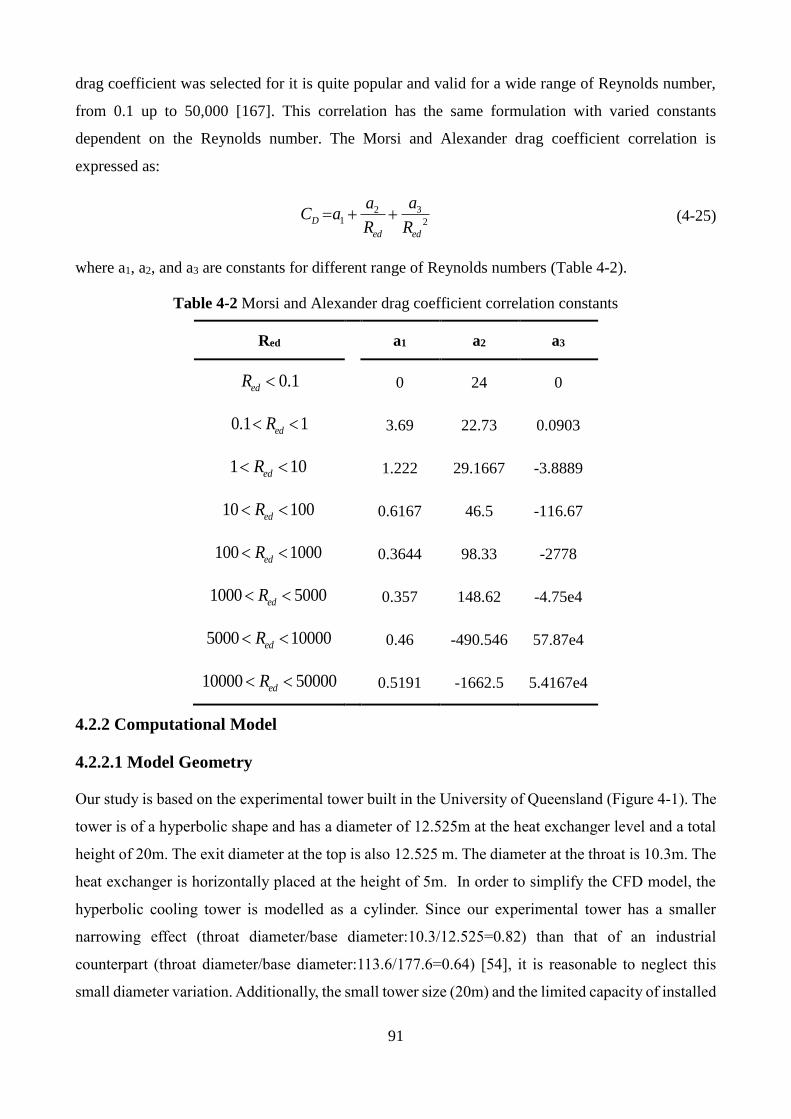
91
drag coefficient was selected for it is quite popular and valid for a wide range of Reynolds number,
from 0.1 up to 50,000 [167]. This correlation has the same formulation with varied constants
dependent on the Reynolds number. The Morsi and Alexander drag coefficient correlation is
expressed as:
321 2D
ed ed
aaC a
R R= + + (4-25)
where a1, a2, and a3 are constants for different range of Reynolds numbers (Table 4-2).
Table 4-2 Morsi and Alexander drag coefficient correlation constants
Red a1 a2 a3
.10edR
0 24 0
0.1 1edR
3.69 22.73 0.0903
1 10edR
1.222 29.1667 -3.8889
10 100edR
0.6167 46.5 -116.67
100 1000edR
0.3644 98.33 -2778
1000 5000edR
0.357 148.62 -4.75e4
5000 10000edR
0.46 -490.546 57.87e4
10000 50000edR
0.5191 -1662.5 5.4167e4
4.2.2 Computational Model
4.2.2.1 Model Geometry
Our study is based on the experimental tower built in the University of Queensland (Figure 4-1). The
tower is of a hyperbolic shape and has a diameter of 12.525m at the heat exchanger level and a total
height of 20m. The exit diameter at the top is also 12.525 m. The diameter at the throat is 10.3m. The
heat exchanger is horizontally placed at the height of 5m. In order to simplify the CFD model, the
hyperbolic cooling tower is modelled as a cylinder. Since our experimental tower has a smaller
narrowing effect (throat diameter/base diameter:10.3/12.525=0.82) than that of an industrial
counterpart (throat diameter/base diameter:113.6/177.6=0.64) [54], it is reasonable to neglect this
small diameter variation. Additionally, the small tower size (20m) and the limited capacity of installed
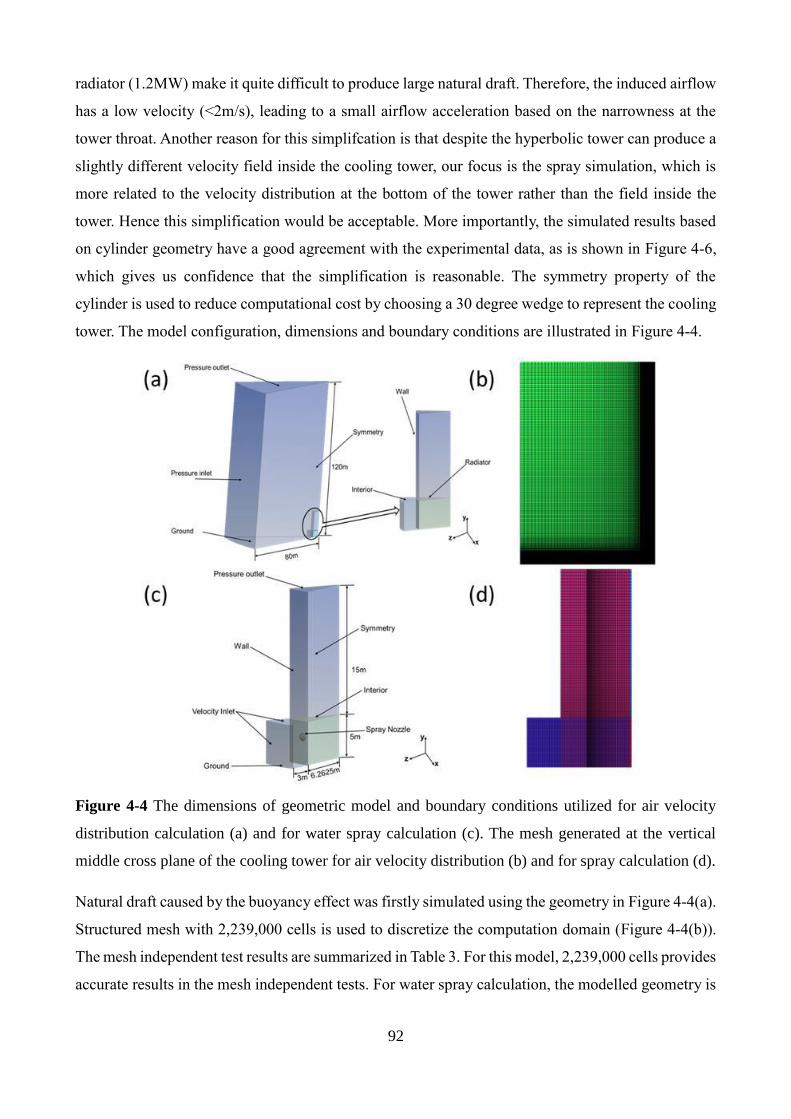
92
radiator (1.2MW) make it quite difficult to produce large natural draft. Therefore, the induced airflow
has a low velocity (<2m/s), leading to a small airflow acceleration based on the narrowness at the
tower throat. Another reason for this simplifcation is that despite the hyperbolic tower can produce a
slightly different velocity field inside the cooling tower, our focus is the spray simulation, which is
more related to the velocity distribution at the bottom of the tower rather than the field inside the
tower. Hence this simplification would be acceptable. More importantly, the simulated results based
on cylinder geometry have a good agreement with the experimental data, as is shown in Figure 4-6,
which gives us confidence that the simplification is reasonable. The symmetry property of the
cylinder is used to reduce computational cost by choosing a 30 degree wedge to represent the cooling
tower. The model configuration, dimensions and boundary conditions are illustrated in Figure 4-4.
Figure 4-4 The dimensions of geometric model and boundary conditions utilized for air velocity
distribution calculation (a) and for water spray calculation (c). The mesh generated at the vertical
middle cross plane of the cooling tower for air velocity distribution (b) and for spray calculation (d).
Natural draft caused by the buoyancy effect was firstly simulated using the geometry in Figure 4-4(a).
Structured mesh with 2,239,000 cells is used to discretize the computation domain (Figure 4-4(b)).
The mesh independent test results are summarized in Table 3. For this model, 2,239,000 cells provides
accurate results in the mesh independent tests. For water spray calculation, the modelled geometry is
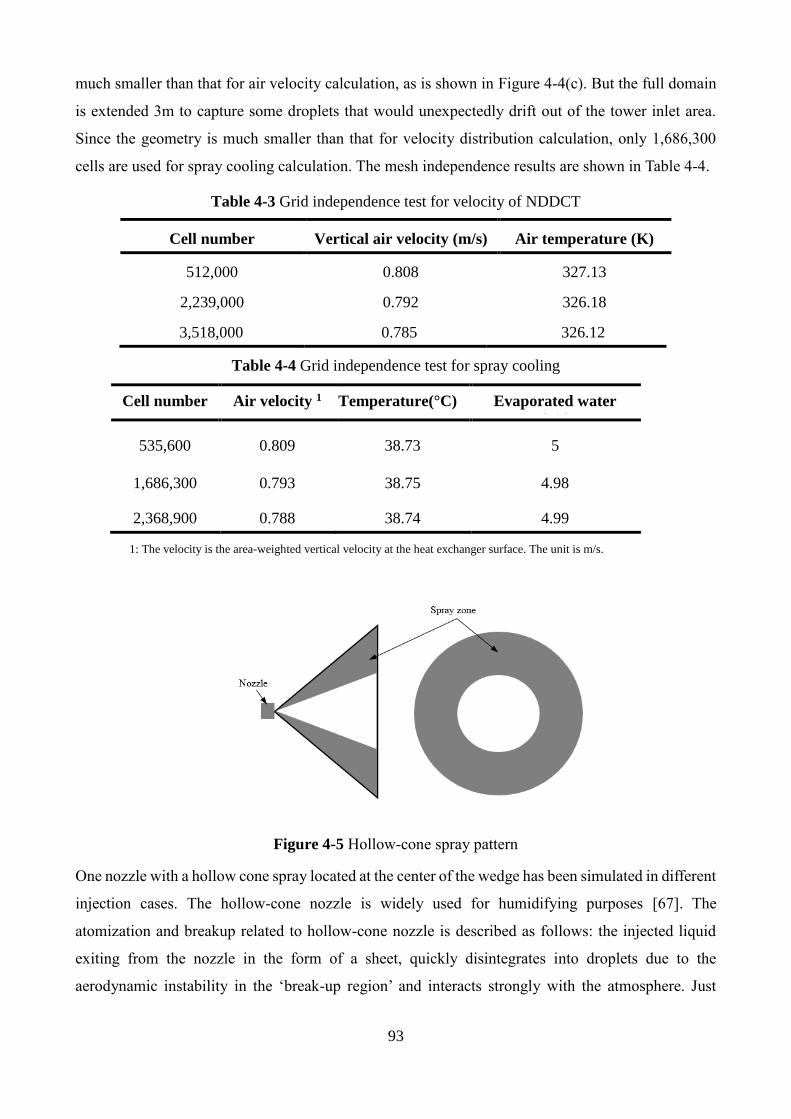
93
much smaller than that for air velocity calculation, as is shown in Figure 4-4(c). But the full domain
is extended 3m to capture some droplets that would unexpectedly drift out of the tower inlet area.
Since the geometry is much smaller than that for velocity distribution calculation, only 1,686,300
cells are used for spray cooling calculation. The mesh independence results are shown in Table 4-4.
Table 4-3 Grid independence test for velocity of NDDCT
Cell number Vertical air velocity (m/s) Air temperature (K)
512,000 0.808 327.13
2,239,000 0.792 326.18
3,518,000 0.785 326.12
Table 4-4 Grid independence test for spray cooling
Cell number Air velocity 1 Temperature(°C) Evaporated water
(g/s)
535,600 0.809 38.73 5
1,686,300 0.793 38.75 4.98
2,368,900 0.788 38.74 4.99
1: The velocity is the area-weighted vertical velocity at the heat exchanger surface. The unit is m/s.
Figure 4-5 Hollow-cone spray pattern
One nozzle with a hollow cone spray located at the center of the wedge has been simulated in different
injection cases. The hollow-cone nozzle is widely used for humidifying purposes [67]. The
atomization and breakup related to hollow-cone nozzle is described as follows: the injected liquid
exiting from the nozzle in the form of a sheet, quickly disintegrates into droplets due to the
aerodynamic instability in the ‘break-up region’ and interacts strongly with the atmosphere. Just
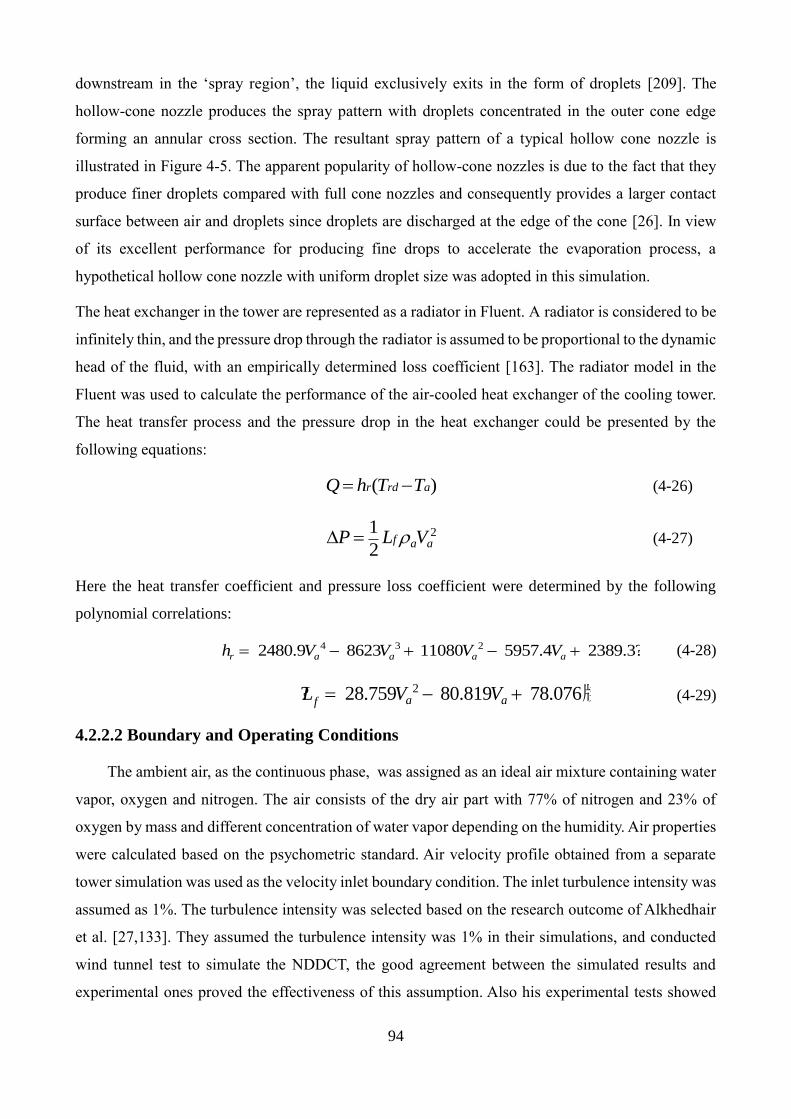
94
downstream in the ‘spray region’, the liquid exclusively exits in the form of droplets [209]. The
hollow-cone nozzle produces the spray pattern with droplets concentrated in the outer cone edge
forming an annular cross section. The resultant spray pattern of a typical hollow cone nozzle is
illustrated in Figure 4-5. The apparent popularity of hollow-cone nozzles is due to the fact that they
produce finer droplets compared with full cone nozzles and consequently provides a larger contact
surface between air and droplets since droplets are discharged at the edge of the cone [26]. In view
of its excellent performance for producing fine drops to accelerate the evaporation process, a
hypothetical hollow cone nozzle with uniform droplet size was adopted in this simulation.
The heat exchanger in the tower are represented as a radiator in Fluent. A radiator is considered to be
infinitely thin, and the pressure drop through the radiator is assumed to be proportional to the dynamic
head of the fluid, with an empirically determined loss coefficient [163]. The radiator model in the
Fluent was used to calculate the performance of the air-cooled heat exchanger of the cooling tower.
The heat transfer process and the pressure drop in the heat exchanger could be presented by the
following equations:
( )r rd aQ h T T= − (4-26)
21
2f a aP L V = (4-27)
Here the heat transfer coefficient and pressure loss coefficient were determined by the following
polynomial correlations:
4 3 2 2480.9 8623 11080 5957.4 2389.3?r a a a ah V V V V= − + − + (4-28)
2? 28.759 80.819 78.076牋a afL V V= − + (4-29)
4.2.2.2 Boundary and Operating Conditions
The ambient air, as the continuous phase, was assigned as an ideal air mixture containing water
vapor, oxygen and nitrogen. The air consists of the dry air part with 77% of nitrogen and 23% of
oxygen by mass and different concentration of water vapor depending on the humidity. Air properties
were calculated based on the psychometric standard. Air velocity profile obtained from a separate
tower simulation was used as the velocity inlet boundary condition. The inlet turbulence intensity was
assumed as 1%. The turbulence intensity was selected based on the research outcome of Alkhedhair
et al. [27,133]. They assumed the turbulence intensity was 1% in their simulations, and conducted
wind tunnel test to simulate the NDDCT, the good agreement between the simulated results and
experimental ones proved the effectiveness of this assumption. Also his experimental tests showed
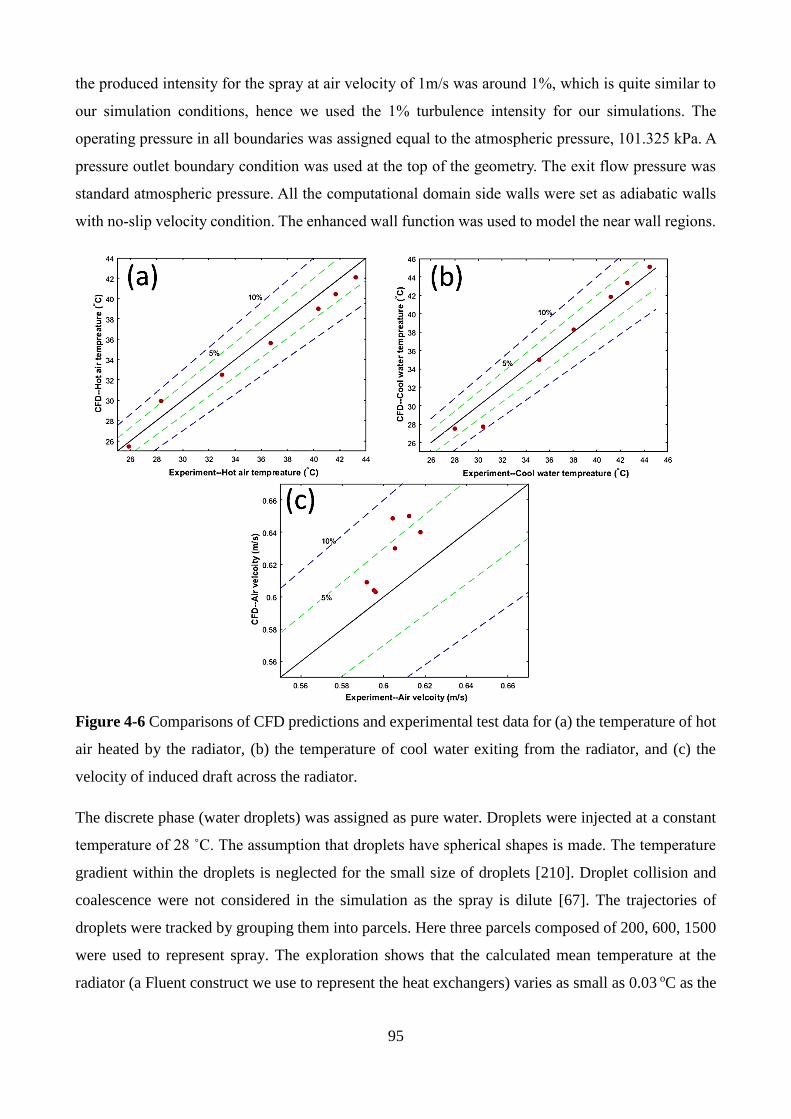
95
the produced intensity for the spray at air velocity of 1m/s was around 1%, which is quite similar to
our simulation conditions, hence we used the 1% turbulence intensity for our simulations. The
operating pressure in all boundaries was assigned equal to the atmospheric pressure, 101.325 kPa. A
pressure outlet boundary condition was used at the top of the geometry. The exit flow pressure was
standard atmospheric pressure. All the computational domain side walls were set as adiabatic walls
with no-slip velocity condition. The enhanced wall function was used to model the near wall regions.
Figure 4-6 Comparisons of CFD predictions and experimental test data for (a) the temperature of hot
air heated by the radiator, (b) the temperature of cool water exiting from the radiator, and (c) the
velocity of induced draft across the radiator.
The discrete phase (water droplets) was assigned as pure water. Droplets were injected at a constant
temperature of 28 ˚C. The assumption that droplets have spherical shapes is made. The temperature
gradient within the droplets is neglected for the small size of droplets [210]. Droplet collision and
coalescence were not considered in the simulation as the spray is dilute [67]. The trajectories of
droplets were tracked by grouping them into parcels. Here three parcels composed of 200, 600, 1500
were used to represent spray. The exploration shows that the calculated mean temperature at the
radiator (a Fluent construct we use to represent the heat exchangers) varies as small as 0.03 oC as the
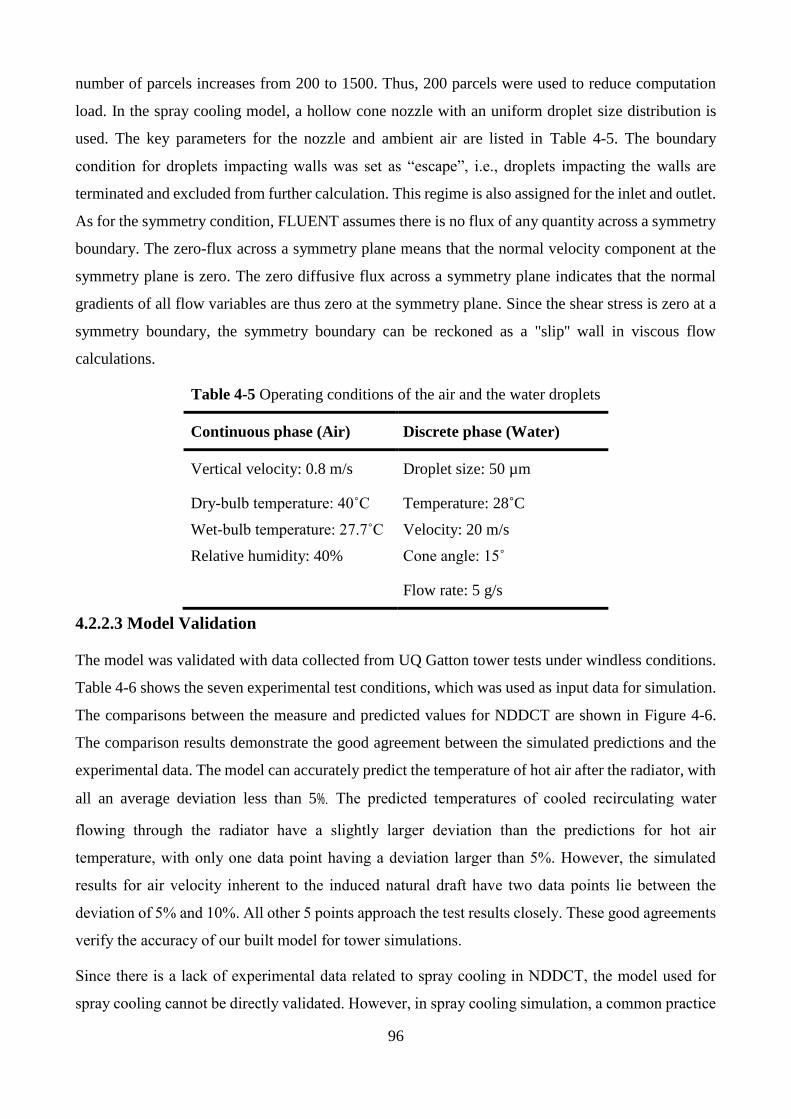
96
number of parcels increases from 200 to 1500. Thus, 200 parcels were used to reduce computation
load. In the spray cooling model, a hollow cone nozzle with an uniform droplet size distribution is
used. The key parameters for the nozzle and ambient air are listed in Table 4-5. The boundary
condition for droplets impacting walls was set as “escape”, i.e., droplets impacting the walls are
terminated and excluded from further calculation. This regime is also assigned for the inlet and outlet.
As for the symmetry condition, FLUENT assumes there is no flux of any quantity across a symmetry
boundary. The zero-flux across a symmetry plane means that the normal velocity component at the
symmetry plane is zero. The zero diffusive flux across a symmetry plane indicates that the normal
gradients of all flow variables are thus zero at the symmetry plane. Since the shear stress is zero at a
symmetry boundary, the symmetry boundary can be reckoned as a "slip'' wall in viscous flow
calculations.
Table 4-5 Operating conditions of the air and the water droplets
Continuous phase (Air) Discrete phase (Water)
Vertical velocity: 0.8 m/s Droplet size: 50 µm
Dry-bulb temperature: 40˚C
Wet-bulb temperature: 27.7˚C
Relative humidity: 40%
Temperature: 28˚C
Velocity: 20 m/s
Cone angle: 15˚
Flow rate: 5 g/s
4.2.2.3 Model Validation
The model was validated with data collected from UQ Gatton tower tests under windless conditions.
Table 4-6 shows the seven experimental test conditions, which was used as input data for simulation.
The comparisons between the measure and predicted values for NDDCT are shown in Figure 4-6.
The comparison results demonstrate the good agreement between the simulated predictions and the
experimental data. The model can accurately predict the temperature of hot air after the radiator, with
all an average deviation less than 5%. The predicted temperatures of cooled recirculating water
flowing through the radiator have a slightly larger deviation than the predictions for hot air
temperature, with only one data point having a deviation larger than 5%. However, the simulated
results for air velocity inherent to the induced natural draft have two data points lie between the
deviation of 5% and 10%. All other 5 points approach the test results closely. These good agreements
verify the accuracy of our built model for tower simulations.
Since there is a lack of experimental data related to spray cooling in NDDCT, the model used for
spray cooling cannot be directly validated. However, in spray cooling simulation, a common practice
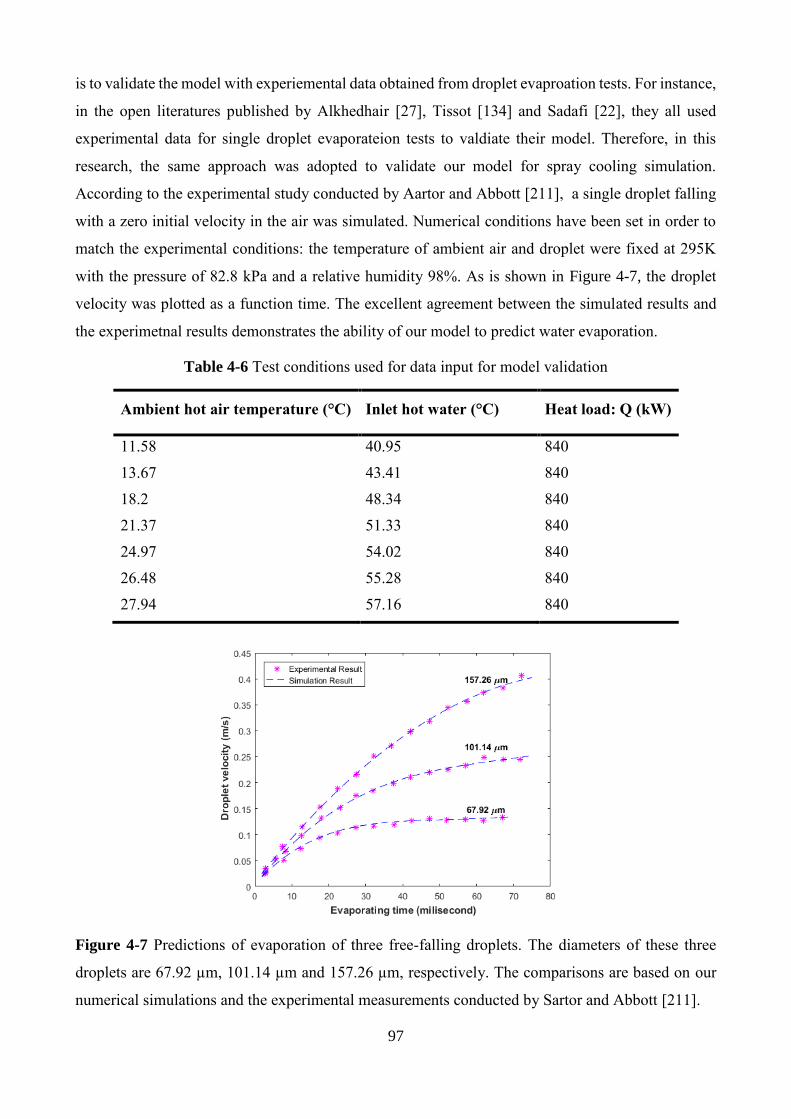
97
is to validate the model with experiemental data obtained from droplet evaproation tests. For instance,
in the open literatures published by Alkhedhair [27], Tissot [134] and Sadafi [22], they all used
experimental data for single droplet evaporateion tests to valdiate their model. Therefore, in this
research, the same approach was adopted to validate our model for spray cooling simulation.
According to the experimental study conducted by Aartor and Abbott [211], a single droplet falling
with a zero initial velocity in the air was simulated. Numerical conditions have been set in order to
match the experimental conditions: the temperature of ambient air and droplet were fixed at 295K
with the pressure of 82.8 kPa and a relative humidity 98%. As is shown in Figure 4-7, the droplet
velocity was plotted as a function time. The excellent agreement between the simulated results and
the experimetnal results demonstrates the ability of our model to predict water evaporation.
Table 4-6 Test conditions used for data input for model validation
Ambient hot air temperature (°C) Inlet hot water (°C) Heat load: Q (kW)
11.58 40.95 840
13.67 43.41 840
18.2 48.34 840
21.37 51.33 840
24.97 54.02 840
26.48 55.28 840
27.94 57.16 840
Figure 4-7 Predictions of evaporation of three free-falling droplets. The diameters of these three
droplets are 67.92 µm, 101.14 µm and 157.26 µm, respectively. The comparisons are based on our
numerical simulations and the experimental measurements conducted by Sartor and Abbott [211].
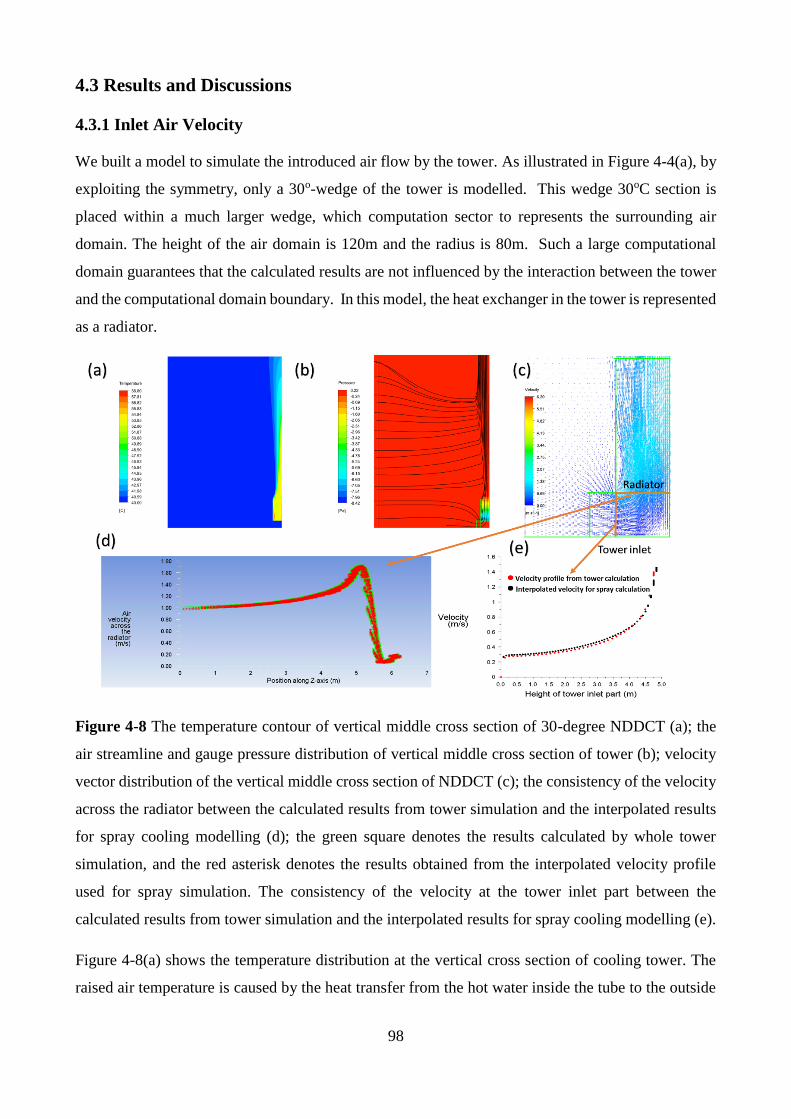
98
4.3 Results and Discussions
4.3.1 Inlet Air Velocity
We built a model to simulate the introduced air flow by the tower. As illustrated in Figure 4-4(a), by
exploiting the symmetry, only a 30o-wedge of the tower is modelled. This wedge 30oC section is
placed within a much larger wedge, which computation sector to represents the surrounding air
domain. The height of the air domain is 120m and the radius is 80m. Such a large computational
domain guarantees that the calculated results are not influenced by the interaction between the tower
and the computational domain boundary. In this model, the heat exchanger in the tower is represented
as a radiator.
Figure 4-8 The temperature contour of vertical middle cross section of 30-degree NDDCT (a); the
air streamline and gauge pressure distribution of vertical middle cross section of tower (b); velocity
vector distribution of the vertical middle cross section of NDDCT (c); the consistency of the velocity
across the radiator between the calculated results from tower simulation and the interpolated results
for spray cooling modelling (d); the green square denotes the results calculated by whole tower
simulation, and the red asterisk denotes the results obtained from the interpolated velocity profile
used for spray simulation. The consistency of the velocity at the tower inlet part between the
calculated results from tower simulation and the interpolated results for spray cooling modelling (e).
Figure 4-8(a) shows the temperature distribution at the vertical cross section of cooling tower. The
raised air temperature is caused by the heat transfer from the hot water inside the tube to the outside
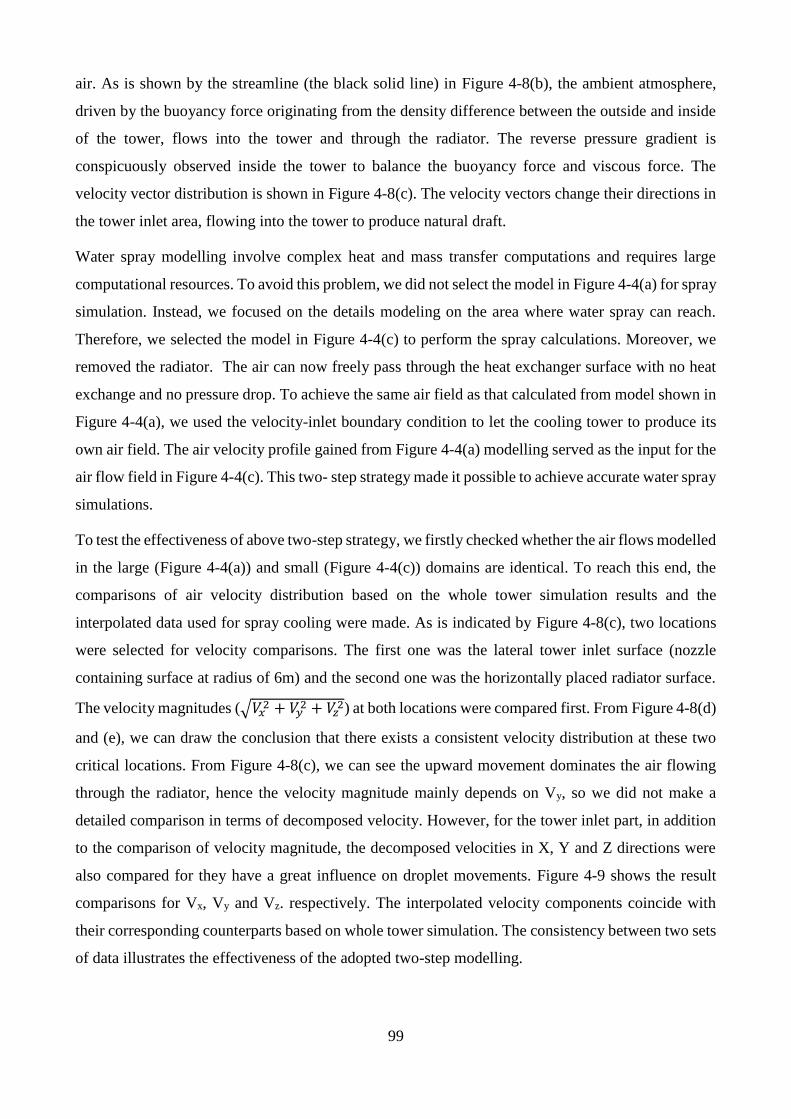
99
air. As is shown by the streamline (the black solid line) in Figure 4-8(b), the ambient atmosphere,
driven by the buoyancy force originating from the density difference between the outside and inside
of the tower, flows into the tower and through the radiator. The reverse pressure gradient is
conspicuously observed inside the tower to balance the buoyancy force and viscous force. The
velocity vector distribution is shown in Figure 4-8(c). The velocity vectors change their directions in
the tower inlet area, flowing into the tower to produce natural draft.
Water spray modelling involve complex heat and mass transfer computations and requires large
computational resources. To avoid this problem, we did not select the model in Figure 4-4(a) for spray
simulation. Instead, we focused on the details modeling on the area where water spray can reach.
Therefore, we selected the model in Figure 4-4(c) to perform the spray calculations. Moreover, we
removed the radiator. The air can now freely pass through the heat exchanger surface with no heat
exchange and no pressure drop. To achieve the same air field as that calculated from model shown in
Figure 4-4(a), we used the velocity-inlet boundary condition to let the cooling tower to produce its
own air field. The air velocity profile gained from Figure 4-4(a) modelling served as the input for the
air flow field in Figure 4-4(c). This two- step strategy made it possible to achieve accurate water spray
simulations.
To test the effectiveness of above two-step strategy, we firstly checked whether the air flows modelled
in the large (Figure 4-4(a)) and small (Figure 4-4(c)) domains are identical. To reach this end, the
comparisons of air velocity distribution based on the whole tower simulation results and the
interpolated data used for spray cooling were made. As is indicated by Figure 4-8(c), two locations
were selected for velocity comparisons. The first one was the lateral tower inlet surface (nozzle
containing surface at radius of 6m) and the second one was the horizontally placed radiator surface.
The velocity magnitudes (√𝑉𝑥2 + 𝑉𝑦2 + 𝑉𝑧2) at both locations were compared first. From Figure 4-8(d)
and (e), we can draw the conclusion that there exists a consistent velocity distribution at these two
critical locations. From Figure 4-8(c), we can see the upward movement dominates the air flowing
through the radiator, hence the velocity magnitude mainly depends on Vy, so we did not make a
detailed comparison in terms of decomposed velocity. However, for the tower inlet part, in addition
to the comparison of velocity magnitude, the decomposed velocities in X, Y and Z directions were
also compared for they have a great influence on droplet movements. Figure 4-9 shows the result
comparisons for Vx, Vy and Vz. respectively. The interpolated velocity components coincide with
their corresponding counterparts based on whole tower simulation. The consistency between two sets
of data illustrates the effectiveness of the adopted two-step modelling.
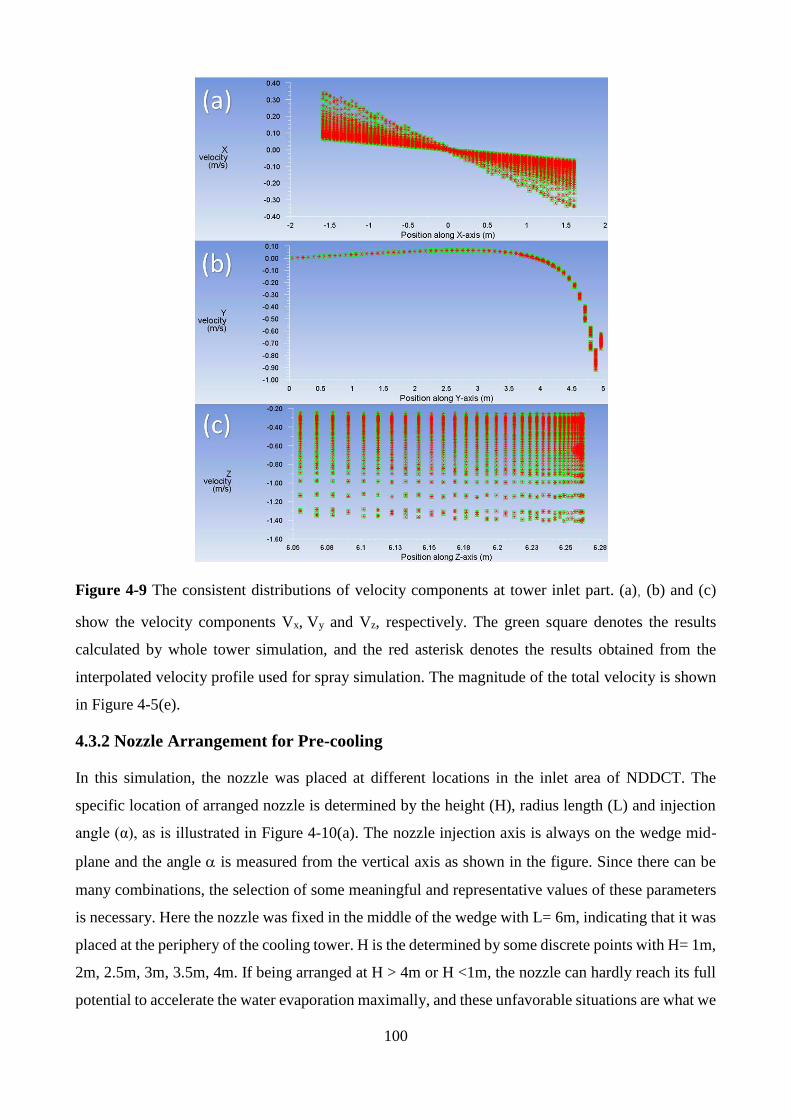
100
Figure 4-9 The consistent distributions of velocity components at tower inlet part. (a), (b) and (c)
show the velocity components Vx, Vy and Vz, respectively. The green square denotes the results
calculated by whole tower simulation, and the red asterisk denotes the results obtained from the
interpolated velocity profile used for spray simulation. The magnitude of the total velocity is shown
in Figure 4-5(e).
4.3.2 Nozzle Arrangement for Pre-cooling
In this simulation, the nozzle was placed at different locations in the inlet area of NDDCT. The
specific location of arranged nozzle is determined by the height (H), radius length (L) and injection
angle (α), as is illustrated in Figure 4-10(a). The nozzle injection axis is always on the wedge mid-
plane and the angle is measured from the vertical axis as shown in the figure. Since there can be
many combinations, the selection of some meaningful and representative values of these parameters
is necessary. Here the nozzle was fixed in the middle of the wedge with L= 6m, indicating that it was
placed at the periphery of the cooling tower. H is the determined by some discrete points with H= 1m,
2m, 2.5m, 3m, 3.5m, 4m. If being arranged at H > 4m or H <1m, the nozzle can hardly reach its full
potential to accelerate the water evaporation maximally, and these unfavorable situations are what we
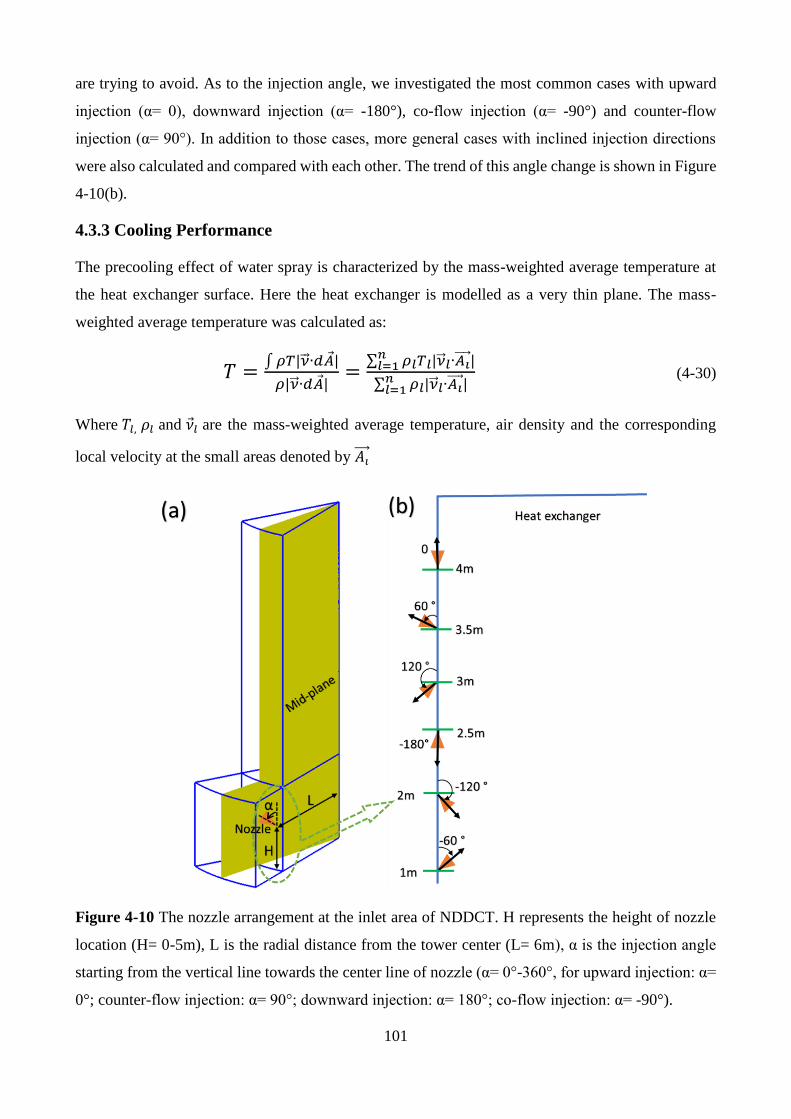
101
are trying to avoid. As to the injection angle, we investigated the most common cases with upward
injection (α= 0), downward injection (α= -180°), co-flow injection (α= -90°) and counter-flow
injection (α= 90°). In addition to those cases, more general cases with inclined injection directions
were also calculated and compared with each other. The trend of this angle change is shown in Figure
4-10(b).
4.3.3 Cooling Performance
The precooling effect of water spray is characterized by the mass-weighted average temperature at
the heat exchanger surface. Here the heat exchanger is modelled as a very thin plane. The mass-
weighted average temperature was calculated as:
𝑇 =∫𝜌𝑇|�� ∙𝑑𝐴 |
𝜌|�� ∙𝑑𝐴 |=
∑ 𝜌𝑙𝑇𝑙|�� 𝑙∙𝐴𝑖 |𝑛𝑙=1
∑ 𝜌𝑙|�� 𝑙∙𝐴𝑖 |𝑛𝑙=1
(4-30)
Where 𝑇𝑙, 𝜌𝑙 and 𝜈 𝑙 are the mass-weighted average temperature, air density and the corresponding
local velocity at the small areas denoted by 𝐴𝑖
Figure 4-10 The nozzle arrangement at the inlet area of NDDCT. H represents the height of nozzle
location (H= 0-5m), L is the radial distance from the tower center (L= 6m), α is the injection angle
starting from the vertical line towards the center line of nozzle (α= 0°-360°, for upward injection: α=
0°; counter-flow injection: α= 90°; downward injection: α= 180°; co-flow injection: α= -90°).
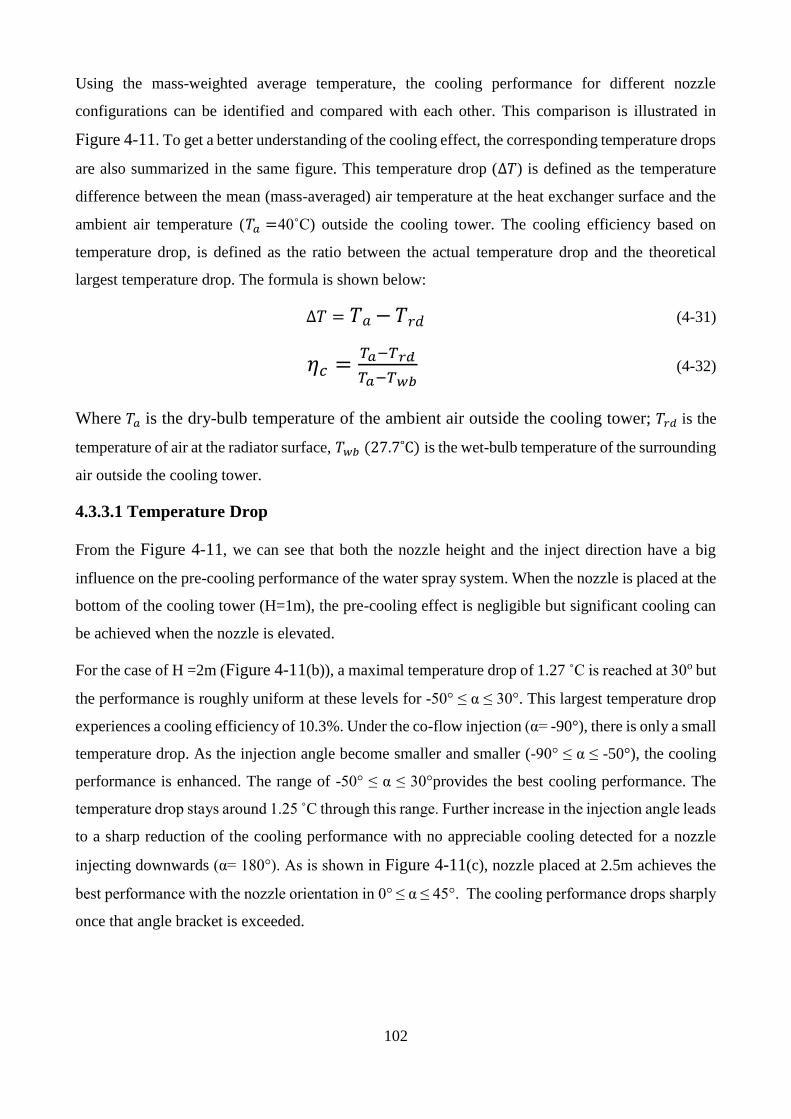
102
Using the mass-weighted average temperature, the cooling performance for different nozzle
configurations can be identified and compared with each other. This comparison is illustrated in
Figure 4-11. To get a better understanding of the cooling effect, the corresponding temperature drops
are also summarized in the same figure. This temperature drop (∆𝑇) is defined as the temperature
difference between the mean (mass-averaged) air temperature at the heat exchanger surface and the
ambient air temperature (𝑇𝑎 =40˚C) outside the cooling tower. The cooling efficiency based on
temperature drop, is defined as the ratio between the actual temperature drop and the theoretical
largest temperature drop. The formula is shown below:
∆𝑇 = 𝑇𝑎 − 𝑇𝑟𝑑 (4-31)
𝜂𝑐 =𝑇𝑎−𝑇𝑟𝑑
𝑇𝑎−𝑇𝑤𝑏 (4-32)
Where 𝑇𝑎 is the dry-bulb temperature of the ambient air outside the cooling tower; 𝑇𝑟𝑑 is the
temperature of air at the radiator surface, 𝑇𝑤𝑏 (27.7˚C) is the wet-bulb temperature of the surrounding
air outside the cooling tower.
4.3.3.1 Temperature Drop
From the Figure 4-11, we can see that both the nozzle height and the inject direction have a big
influence on the pre-cooling performance of the water spray system. When the nozzle is placed at the
bottom of the cooling tower (H=1m), the pre-cooling effect is negligible but significant cooling can
be achieved when the nozzle is elevated.
For the case of H =2m (Figure 4-11(b)), a maximal temperature drop of 1.27 ˚C is reached at 30o but
the performance is roughly uniform at these levels for -50° ≤ α ≤ 30°. This largest temperature drop
experiences a cooling efficiency of 10.3%. Under the co-flow injection (α= -90°), there is only a small
temperature drop. As the injection angle become smaller and smaller (-90° ≤ α ≤ -50°), the cooling
performance is enhanced. The range of -50° ≤ α ≤ 30°provides the best cooling performance. The
temperature drop stays around 1.25 C through this range. Further increase in the injection angle leads
to a sharp reduction of the cooling performance with no appreciable cooling detected for a nozzle
injecting downwards (α= 180°). As is shown in Figure 4-11(c), nozzle placed at 2.5m achieves the
best performance with the nozzle orientation in 0° ≤ α ≤ 45°. The cooling performance drops sharply
once that angle bracket is exceeded.
103
a)
b)
c)
d)
e)
f)
Figure 4-11 Spray cooling effect in terms of mass-weighted temperature at the radiator
surface and the temperature drop. The temperature drop is based on the difference between
the mass-average air temperature at the radiator surface and the ambient temperature outside
the cooling tower. (a): 1m injection with varied injection angle; (b): 2m injection with varied
injection angle; (c): 2.5m injection with varied injection angle; (d): 3m injection with varied
injection angle; (e): 3.5m injection with varied injection angle; (f): 4m injection with varied
injection angle.
0
0.2
0.4
0.6
0.8
1
1.2
1.4
-90 0 90
38.5
38.8
39.1
39.4
39.7
40
Tem
pera
ture d
ro
p (
°C)
Injection angle
Ma
ss-a
vera
ge
tem
pera
ture (
°C)
1m Injection
0
0.2
0.4
0.6
0.8
1
1.2
1.4
38.5
38.8
39.1
39.4
39.7
40
-70
-60
-55
-50
-40
-30
-20
-10 0
10
20
30
35
45
90
18
0
Tem
pera
ture d
ro
p (
°C)
Ma
ss-a
vera
ge
tem
pera
ture (
°C)
Injection angle
2m Injection
0
0.2
0.4
0.6
0.8
1
1.2
1.4
38.5
38.8
39.1
39.4
39.7
40
0 20 25 30 40 45 50 60 70 80
Tem
pera
ture d
ro
p (
°C)
Ma
ss-a
vera
ge
tem
pera
ture (
°C)
Injection angle
2.5m Injection
0
0.2
0.4
0.6
0.8
1
1.2
1.4
38.5
38.8
39.1
39.4
39.7
40
-180
-135
-90
-45 0
30
45
50
52
60
70
75
80
90
13
5
Tem
pera
ture d
ro
p (
°C)
Ma
ss-a
vera
ge
tem
pera
ture (
°C)
Injection angle
3m Injection
38.5
38.6
38.7
38.8
38.9
39
39.1
50 60 65 70 75 80 90 100 110 115 120
0
0.2
0.4
0.6
0.8
1
1.2
1.4
Ma
ss-a
vera
ge
tem
pera
ture (
°C)
Injection angle
Tem
pera
ture d
ro
p (
°C)
3.5m Injection
38.5
38.8
39.1
39.4
39.7
40
-180 -135 -90 70 80 85 90 95 100 135
0
0.2
0.4
0.6
0.8
1
1.2
1.4
Ma
ss-a
vera
ge
tem
pera
ture (
°C)
Injection angle
Tem
pera
ture d
ro
p (
°C)
4m Injection
104
A more complicated phenomenon is observed when the nozzle is placed in 3m (Figure
4-11(d)). The first attempt is made with the nozzle injecting downward (α= -180°), and then
the injection angle is increased toward the co-flow situation (α= -90°), a moderate
performance enhancement is observed. This trend promotes us to continue increase the
injection angle to test the upward injection (α= 0) and some more progressive arrangements
(0 ≤ α ≤ 50°). Once the angle is larger than 50°, a level period in both mean temperature and
the temperature drop is shown. These configurations share similar cooling performance,
having a temperature drop around 1.25 ˚C, corresponding to a cooling efficiency of 10.2%.
This trend stops when the injection angle exceeds 70°. The continuing increment of α would
deteriorate the cooling performance, having a decreasing temperature drop when the angle
increases from 70° to 135°.
For the case of nozzle located at height of 3.5m, the performances for varied injection angles
are shown in (Figure 4-11(e)). The initial angle is set as 50° and then rise the angle towards
counter-flow injection (α= 90°), a steady reduction in the mean temperature for heat
exchanger is seen and then this mean temperature almost remain unchanged until the angle is
larger than 115°. The best rejection angles for the nozzle located at 4m is α = 90°. Other
injections cannot achieve the same cooling performance as this counter flow injection.
4.3.3.2 Evaporated Water Flowrate
In addition to the temperature of the radiator and the corresponding temperature drop, the evaporation
rate is another important performance parameter. The spray system should be carefully designed to
make sure all the water will fully evaporate. Failure to reach full evaporation of introduced water
would cause evaporation on the heat exchanger surface with possible fouling and corrosion problems.
As protection against heat exchanger corrosion, the few inlet air precooling systems in existence today
choose to use demineralized water. The downside is that demineralized water is expensive and
operation of such systems are feasible only at high electricity sale prices.
Our design work for the NDDCT cooling system aims finding the optimal injection lay-out with full
evaporation obtained at the bottom of tower, i.e., the 5m inlet area. The latent heat for water
evaporation is provided by the sensible heat from hot ambient air, thus the larger fraction of
evaporated water, the lower the inlet air temperature will be and the better pre-cooling performance
is achieved. To quantitatively compare the cooling performance in terms of the evaporated water
amount, an evaporated water fraction β is defined as below:
105
𝛽 =𝐸𝑣𝑎𝑝𝑜𝑟𝑎𝑡𝑒𝑑 𝑤𝑎𝑡𝑒𝑟 𝑓𝑙𝑜𝑤𝑟𝑎𝑡𝑒
𝐼𝑛𝑗𝑒𝑐𝑡𝑒𝑑 𝑤𝑎𝑡𝑒𝑟 𝑓𝑙𝑜𝑤𝑟𝑎𝑡𝑒 (5 𝑔/𝑠) (4-33)
The injected flow rate is constant at 5 g/s. This is a flow rate representative of nozzles that produce
droplets in the size range considered in this study. A larger value for β corresponds to the larger
flowrate of evaporated water. The full evaporation range is defined as 0.98 ≤ β ≤ 1.
Figure 4-12 shows the evaporated water flowrate and the corresponding evaporated water fraction for
different nozzle arrangements. For the 1m-arrangement case, water droplets exiting from spray nozzle
have quite a small evaporative fraction, thus the corresponding temperature drop is very limited. At
this elevation, adjusting the injection angle has no effect. Due to the low air velocity near the ground,
droplets fall to the ground. This position is not a good place to locate spray nozzle.
If the injection height is raised to 2m, the cooling performance is enhanced dramatically. As expected,
the injection angles that deliver the maximum evaporation rate in Figure 4-12(b) are the angles that
are shown as delivering the maximum temperature drop in Figure 4-11(b). As injection angle rises
from -90° to -50°, the evaporated water flowrate increased significantly, reaching the largest value at
α= -50°. Then a plateau stage is followed, which is identified by -50° ≤ α ≤ 30° with an evaporated
water fraction of 1. Further increase of the angle leads to worsening situations for water evaporation,
because higher angles reduce the vertical component of droplet velocity and many droplets fall to the
ground under the influence of gravitational force.
For the 2.5m injection case, the upward injection (α =0) have a good cooling performance (β=0.82)
but not reach the full evaporation. So the angle is increased to find the injection case with full
evaporation. It turns out that when the injections are made in the range of 30° ≤ α ≤ 45°, the maximum
value of β is achieved. However, a slight increase of the injection angle causes a sharp decrease in
the evaporated water flowrate, indicating the predominant influence of the gravity. Therefore, the
largest cooling effect for this position is obtained when 30° ≤ α ≤ 45°, in accordance with temperature
drop in Figure 4-11(c).
When the nozzle height is set at 3m, a smooth and slow increment in β is observed. Here the
downward, co-flow, upward and counter-flow injection are proved to be imperfect for pre-cooling
application. But an interesting phenomenon is noted. The cooling performance characterized by β
improves gradually as the injection angle change counter clockwise. The peak value is obtained in
the variation of α from 50° to 70°.
An outstanding situation is encountered at H= 3.5m, where the different injection directions have
small influence on the evaporated water flowrate. Even if the full evaporation occurs at the 70° ≤ α ≤
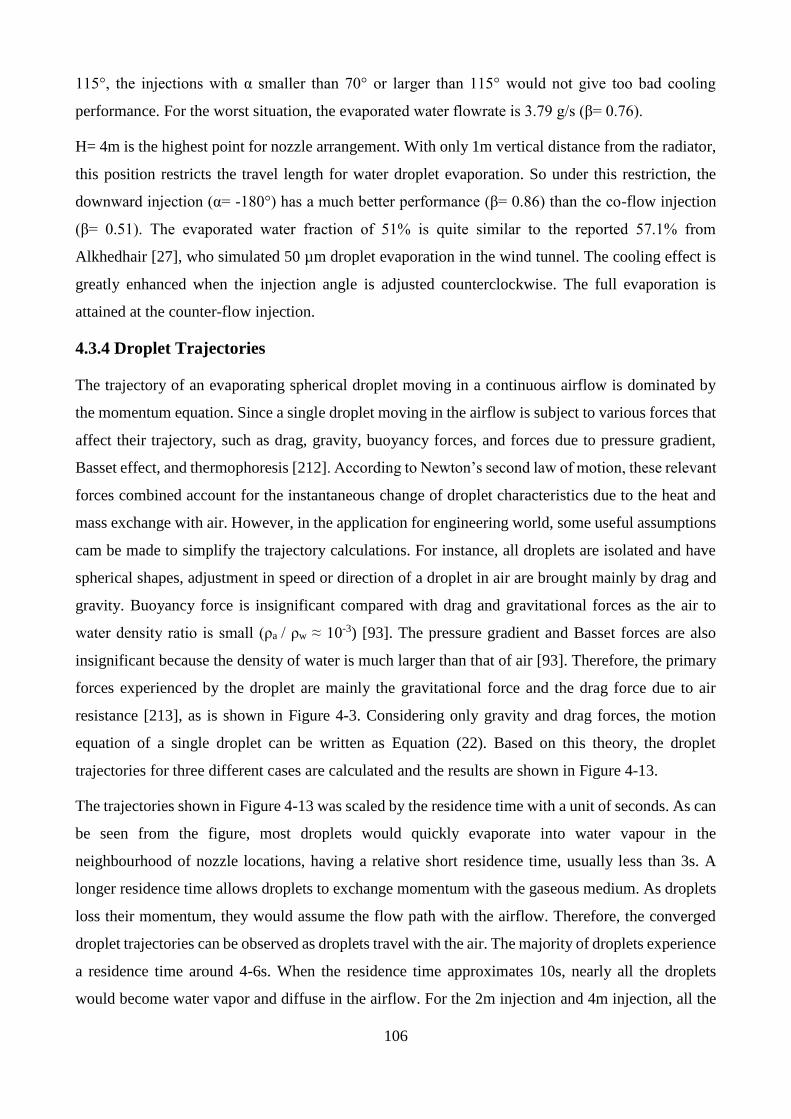
106
115°, the injections with α smaller than 70° or larger than 115° would not give too bad cooling
performance. For the worst situation, the evaporated water flowrate is 3.79 g/s (β= 0.76).
H= 4m is the highest point for nozzle arrangement. With only 1m vertical distance from the radiator,
this position restricts the travel length for water droplet evaporation. So under this restriction, the
downward injection (α= -180°) has a much better performance (β= 0.86) than the co-flow injection
(β= 0.51). The evaporated water fraction of 51% is quite similar to the reported 57.1% from
Alkhedhair [27], who simulated 50 µm droplet evaporation in the wind tunnel. The cooling effect is
greatly enhanced when the injection angle is adjusted counterclockwise. The full evaporation is
attained at the counter-flow injection.
4.3.4 Droplet Trajectories
The trajectory of an evaporating spherical droplet moving in a continuous airflow is dominated by
the momentum equation. Since a single droplet moving in the airflow is subject to various forces that
affect their trajectory, such as drag, gravity, buoyancy forces, and forces due to pressure gradient,
Basset effect, and thermophoresis [212]. According to Newton’s second law of motion, these relevant
forces combined account for the instantaneous change of droplet characteristics due to the heat and
mass exchange with air. However, in the application for engineering world, some useful assumptions
cam be made to simplify the trajectory calculations. For instance, all droplets are isolated and have
spherical shapes, adjustment in speed or direction of a droplet in air are brought mainly by drag and
gravity. Buoyancy force is insignificant compared with drag and gravitational forces as the air to
water density ratio is small (ρa / ρw ≈ 10-3) [93]. The pressure gradient and Basset forces are also
insignificant because the density of water is much larger than that of air [93]. Therefore, the primary
forces experienced by the droplet are mainly the gravitational force and the drag force due to air
resistance [213], as is shown in Figure 4-3. Considering only gravity and drag forces, the motion
equation of a single droplet can be written as Equation (22). Based on this theory, the droplet
trajectories for three different cases are calculated and the results are shown in Figure 4-13.
The trajectories shown in Figure 4-13 was scaled by the residence time with a unit of seconds. As can
be seen from the figure, most droplets would quickly evaporate into water vapour in the
neighbourhood of nozzle locations, having a relative short residence time, usually less than 3s. A
longer residence time allows droplets to exchange momentum with the gaseous medium. As droplets
loss their momentum, they would assume the flow path with the airflow. Therefore, the converged
droplet trajectories can be observed as droplets travel with the air. The majority of droplets experience
a residence time around 4-6s. When the residence time approximates 10s, nearly all the droplets
would become water vapor and diffuse in the airflow. For the 2m injection and 4m injection, all the
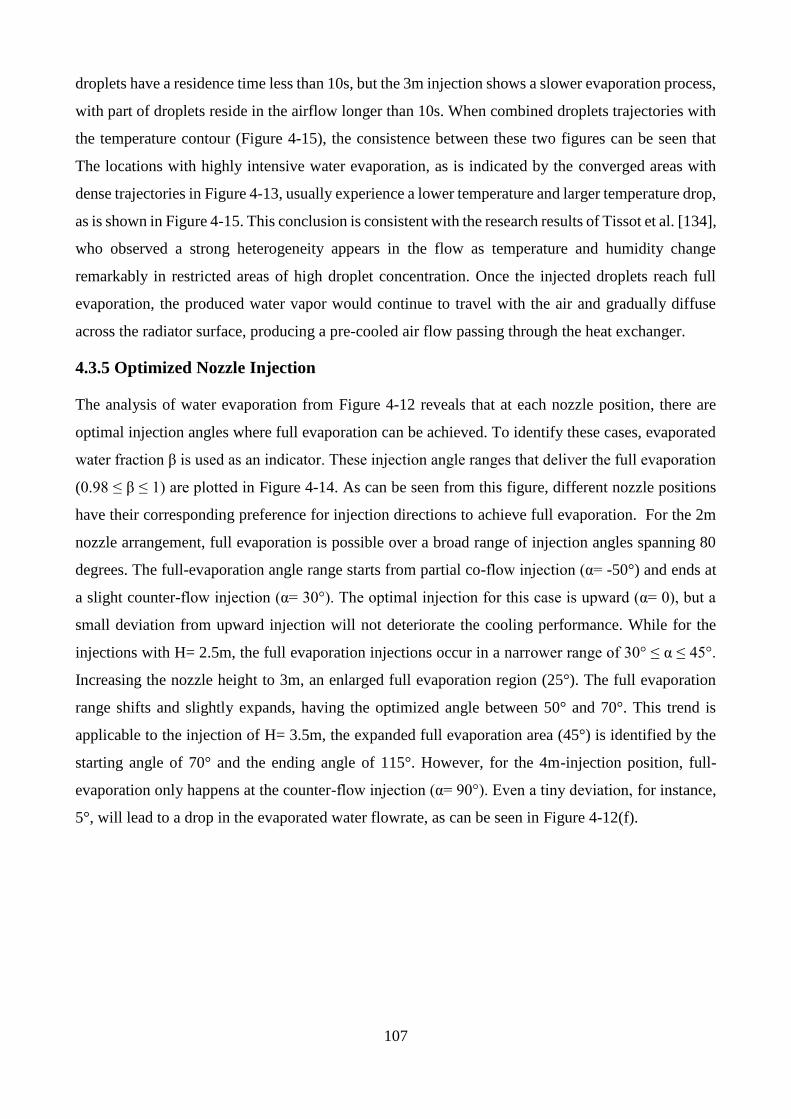
107
droplets have a residence time less than 10s, but the 3m injection shows a slower evaporation process,
with part of droplets reside in the airflow longer than 10s. When combined droplets trajectories with
the temperature contour (Figure 4-15), the consistence between these two figures can be seen that
The locations with highly intensive water evaporation, as is indicated by the converged areas with
dense trajectories in Figure 4-13, usually experience a lower temperature and larger temperature drop,
as is shown in Figure 4-15. This conclusion is consistent with the research results of Tissot et al. [134],
who observed a strong heterogeneity appears in the flow as temperature and humidity change
remarkably in restricted areas of high droplet concentration. Once the injected droplets reach full
evaporation, the produced water vapor would continue to travel with the air and gradually diffuse
across the radiator surface, producing a pre-cooled air flow passing through the heat exchanger.
4.3.5 Optimized Nozzle Injection
The analysis of water evaporation from Figure 4-12 reveals that at each nozzle position, there are
optimal injection angles where full evaporation can be achieved. To identify these cases, evaporated
water fraction β is used as an indicator. These injection angle ranges that deliver the full evaporation
(0.98 ≤ β ≤ 1) are plotted in Figure 4-14. As can be seen from this figure, different nozzle positions
have their corresponding preference for injection directions to achieve full evaporation. For the 2m
nozzle arrangement, full evaporation is possible over a broad range of injection angles spanning 80
degrees. The full-evaporation angle range starts from partial co-flow injection (α= -50°) and ends at
a slight counter-flow injection (α= 30°). The optimal injection for this case is upward (α= 0), but a
small deviation from upward injection will not deteriorate the cooling performance. While for the
injections with H= 2.5m, the full evaporation injections occur in a narrower range of 30° ≤ α ≤ 45°.
Increasing the nozzle height to 3m, an enlarged full evaporation region (25°). The full evaporation
range shifts and slightly expands, having the optimized angle between 50° and 70°. This trend is
applicable to the injection of H= 3.5m, the expanded full evaporation area (45°) is identified by the
starting angle of 70° and the ending angle of 115°. However, for the 4m-injection position, full-
evaporation only happens at the counter-flow injection (α= 90°). Even a tiny deviation, for instance,
5°, will lead to a drop in the evaporated water flowrate, as can be seen in Figure 4-12(f).
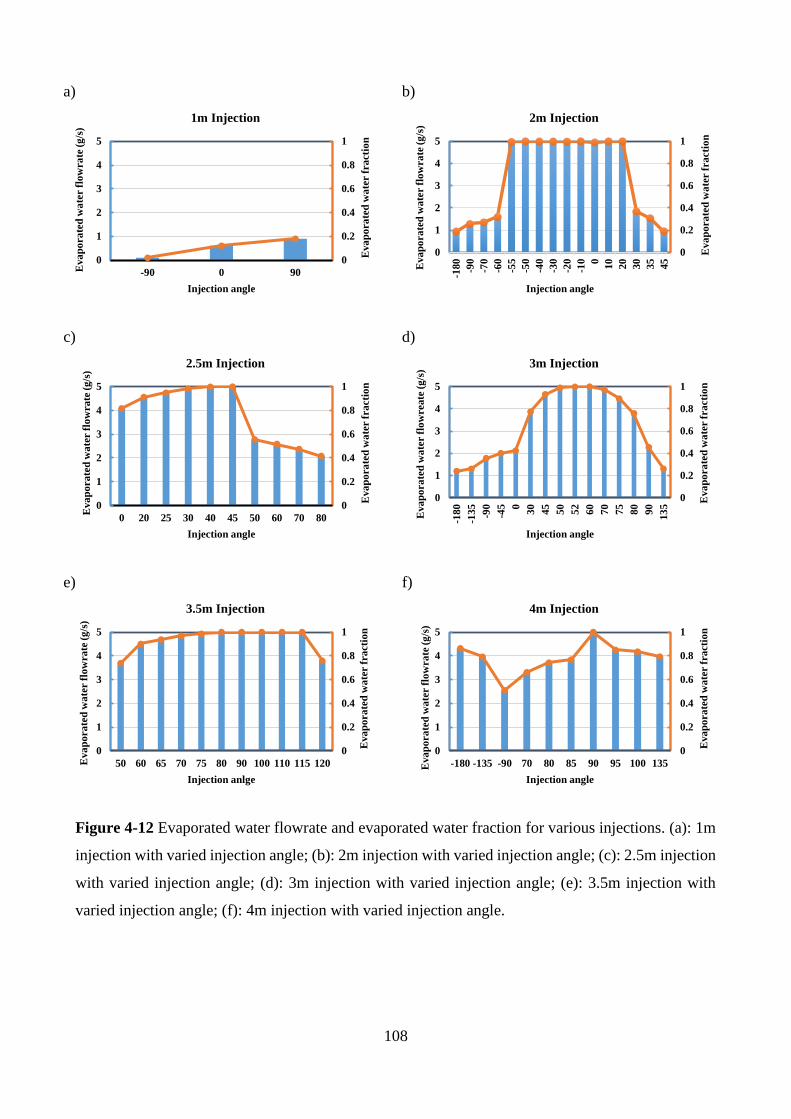
108
a)
b)
c)
d)
e)
f)
Figure 4-12 Evaporated water flowrate and evaporated water fraction for various injections. (a): 1m
injection with varied injection angle; (b): 2m injection with varied injection angle; (c): 2.5m injection
with varied injection angle; (d): 3m injection with varied injection angle; (e): 3.5m injection with
varied injection angle; (f): 4m injection with varied injection angle.
0
0.2
0.4
0.6
0.8
1
0
1
2
3
4
5
-90 0 90
Eva
po
ra
ted
wa
ter f
ra
cti
on
Eva
po
ra
ted
wa
ter f
low
ra
te (
g/s
)
Injection angle
1m Injection
0
1
2
3
4
5
-180
-90
-70
-60
-55
-50
-40
-30
-20
-10 0
10
20
30
35
45
0
0.2
0.4
0.6
0.8
1
Eva
po
ra
ted
wa
ter f
low
ra
te (
g/s
)
Injection angle
Eva
po
ra
ted
wa
ter f
ra
cti
on
2m Injection
0
0.2
0.4
0.6
0.8
1
0 20 25 30 40 45 50 60 70 80
0
1
2
3
4
5
Eva
po
ra
ted
wa
ter f
ra
cti
on
Injection angle
Eva
po
ra
ted
wa
ter f
low
ra
te (
g/s
)
2.5m Injection
0
0.2
0.4
0.6
0.8
1
0
1
2
3
4
5
-180
-135
-90
-45 0
30
45
50
52
60
70
75
80
90
13
5
Eva
po
ra
ted
wa
ter f
ra
cti
on
Eva
po
ra
ted
wa
ter f
low
reate
(g
/s)
Injection angle
3m Injection
0
0.2
0.4
0.6
0.8
1
0
1
2
3
4
5
50 60 65 70 75 80 90 100 110 115 120
Eva
po
ra
ted
wa
ter f
ra
cti
on
Eva
po
ra
ted
wa
ter f
low
ra
te (
g/s
)
Injection anlge
3.5m Injection
0
0.2
0.4
0.6
0.8
1
0
1
2
3
4
5
-180 -135 -90 70 80 85 90 95 100 135
Eva
po
ra
ted
wa
ter f
ra
cti
on
Eva
po
ra
ted
wa
ter f
low
ra
te (
g/s
)
Injection angle
4m Injection
109
Figure 4-13 Droplet trajectories om terms of the residence time (unit: second) for three different
injections. (a): Injection with a height of 2m and angle of 20°; (b): Injection with a height of 3m and
angle of 60°; (c) Injection with a height of 4m and angle of 90°.
An interesting phenomenon worth mentioning is that the starting angle of full evaporation for
different nozzle locations are partially linearly related as indicated in Figure 4-14. As is illustrated by
the solid blue line, for the injections at H=2.5m, 3m, 3.5m and 4m, their starting angle has a linear
relationship. This linear correlation is very useful to predict the fully-evaporated injections at other
more general heights other than these four points. Another interesting phenomenon is the connection
between the ending angle of the lower nozzle and the starting angle of the nozzle above. Figure 4-14(b)
shows that the full evaporation region for the 2m case ends at α= 30° but that angle is the angle that
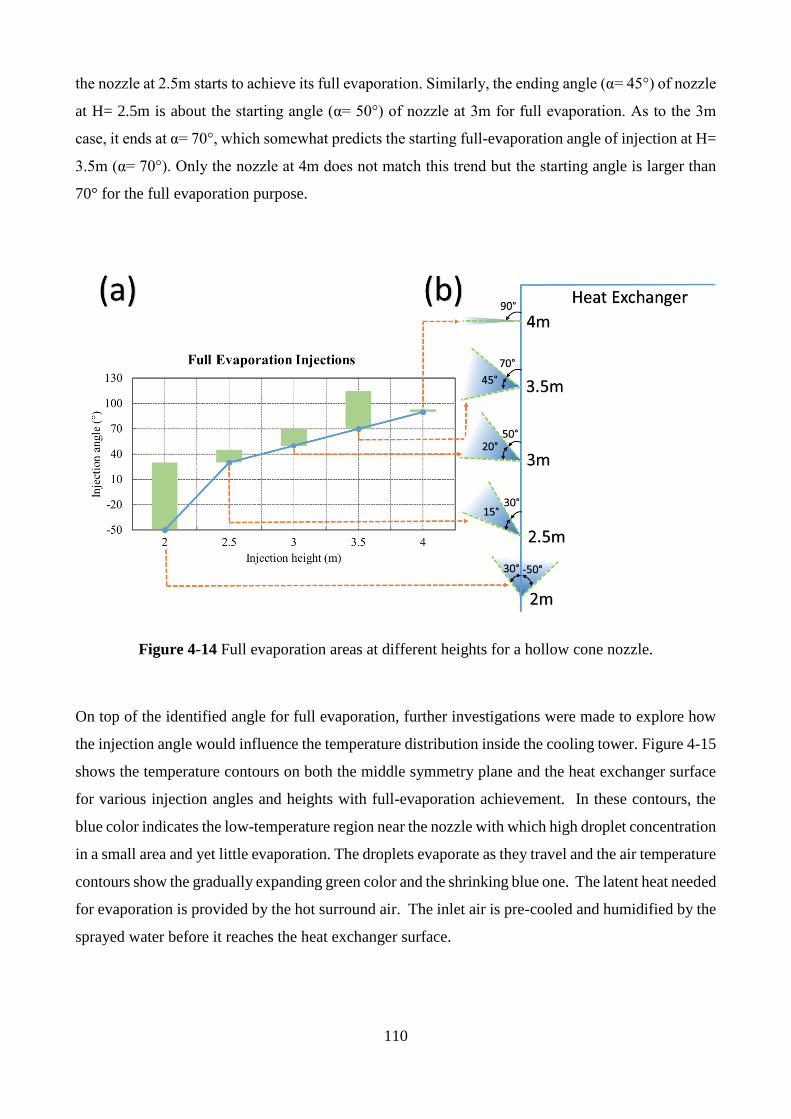
110
the nozzle at 2.5m starts to achieve its full evaporation. Similarly, the ending angle (α= 45°) of nozzle
at H= 2.5m is about the starting angle (α= 50°) of nozzle at 3m for full evaporation. As to the 3m
case, it ends at α= 70°, which somewhat predicts the starting full-evaporation angle of injection at H=
3.5m (α= 70°). Only the nozzle at 4m does not match this trend but the starting angle is larger than
70° for the full evaporation purpose.
Figure 4-14 Full evaporation areas at different heights for a hollow cone nozzle.
On top of the identified angle for full evaporation, further investigations were made to explore how
the injection angle would influence the temperature distribution inside the cooling tower. Figure 4-15
shows the temperature contours on both the middle symmetry plane and the heat exchanger surface
for various injection angles and heights with full-evaporation achievement. In these contours, the
blue color indicates the low-temperature region near the nozzle with which high droplet concentration
in a small area and yet little evaporation. The droplets evaporate as they travel and the air temperature
contours show the gradually expanding green color and the shrinking blue one. The latent heat needed
for evaporation is provided by the hot surround air. The inlet air is pre-cooled and humidified by the
sprayed water before it reaches the heat exchanger surface.
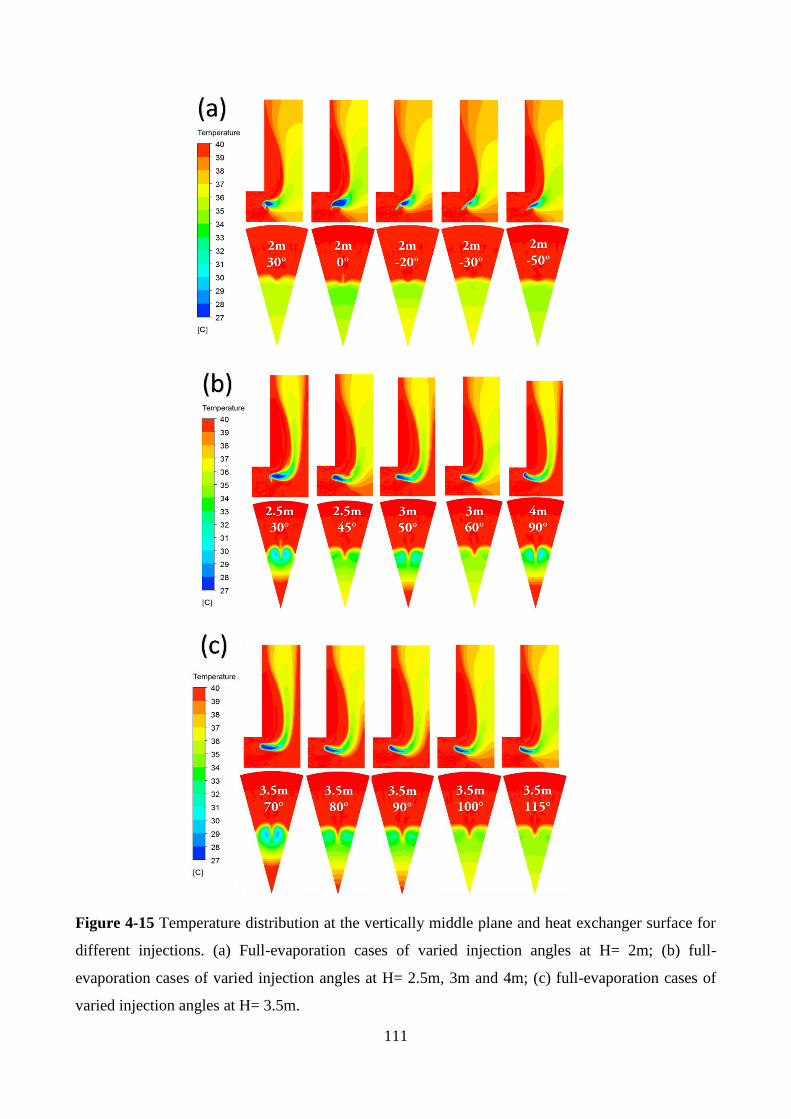
111
Figure 4-15 Temperature distribution at the vertically middle plane and heat exchanger surface for
different injections. (a) Full-evaporation cases of varied injection angles at H= 2m; (b) full-
evaporation cases of varied injection angles at H= 2.5m, 3m and 4m; (c) full-evaporation cases of
varied injection angles at H= 3.5m.
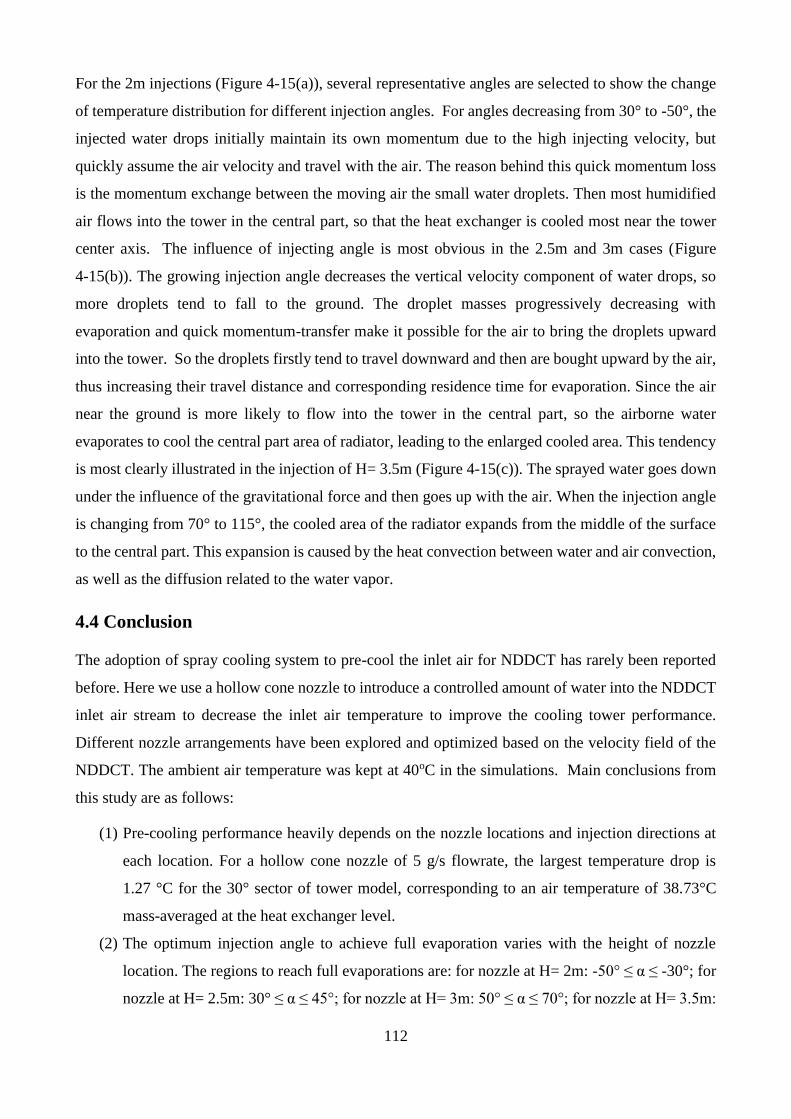
112
For the 2m injections (Figure 4-15(a)), several representative angles are selected to show the change
of temperature distribution for different injection angles. For angles decreasing from 30° to -50°, the
injected water drops initially maintain its own momentum due to the high injecting velocity, but
quickly assume the air velocity and travel with the air. The reason behind this quick momentum loss
is the momentum exchange between the moving air the small water droplets. Then most humidified
air flows into the tower in the central part, so that the heat exchanger is cooled most near the tower
center axis. The influence of injecting angle is most obvious in the 2.5m and 3m cases (Figure
4-15(b)). The growing injection angle decreases the vertical velocity component of water drops, so
more droplets tend to fall to the ground. The droplet masses progressively decreasing with
evaporation and quick momentum-transfer make it possible for the air to bring the droplets upward
into the tower. So the droplets firstly tend to travel downward and then are bought upward by the air,
thus increasing their travel distance and corresponding residence time for evaporation. Since the air
near the ground is more likely to flow into the tower in the central part, so the airborne water
evaporates to cool the central part area of radiator, leading to the enlarged cooled area. This tendency
is most clearly illustrated in the injection of H= 3.5m (Figure 4-15(c)). The sprayed water goes down
under the influence of the gravitational force and then goes up with the air. When the injection angle
is changing from 70° to 115°, the cooled area of the radiator expands from the middle of the surface
to the central part. This expansion is caused by the heat convection between water and air convection,
as well as the diffusion related to the water vapor.
4.4 Conclusion
The adoption of spray cooling system to pre-cool the inlet air for NDDCT has rarely been reported
before. Here we use a hollow cone nozzle to introduce a controlled amount of water into the NDDCT
inlet air stream to decrease the inlet air temperature to improve the cooling tower performance.
Different nozzle arrangements have been explored and optimized based on the velocity field of the
NDDCT. The ambient air temperature was kept at 40oC in the simulations. Main conclusions from
this study are as follows:
(1) Pre-cooling performance heavily depends on the nozzle locations and injection directions at
each location. For a hollow cone nozzle of 5 g/s flowrate, the largest temperature drop is
1.27 °C for the 30° sector of tower model, corresponding to an air temperature of 38.73°C
mass-averaged at the heat exchanger level.
(2) The optimum injection angle to achieve full evaporation varies with the height of nozzle
location. The regions to reach full evaporations are: for nozzle at H= 2m: -50° ≤ α ≤ -30°; for
nozzle at H= 2.5m: 30° ≤ α ≤ 45°; for nozzle at H= 3m: 50° ≤ α ≤ 70°; for nozzle at H= 3.5m:

113
70° ≤ α ≤ 115°; for nozzle at H= 4m: α = 90°. Simply put, a high nozzle placement prefers
counter-flow injection while a low arrangement prefers upward injection.
(3) For nozzle placed at H= 2.5m- 4m, the starting angle for full evaporation range has a linear
relationship with elevation. Specifically, the nozzle at 2.5m starts to achieve full evaporation
at α = 30°, while for nozzle at 3m, 3.5m and 4m, these starting angles are 50°, 70° and 90°.
This trend can be used to predict the optimal injection angle to reach full evaporation when
nozzle is placed at other heights in the range of 2.5m- 4m.
(4) Injection direction has a great influence on the evaporation of the injected water droplets. This
is attributed to the influence of injection angle on the momentum exchange between ambient
air and sprayed water droplets. The varied injection direction changes the relative strength of
the vertical and horizontal components of droplet velocity.
(5) The increment of injection angle can enlarge the water-cooled area of radiator, and a larger
injection angle predicts the enhanced pre-cooling effect at the central part of NDDCT.
114
Chapter 5 Cooling Performance Evaluation with Polydisperse Sprays
This chapter is based on the paper published in Applied Thermal Engineering. The primary goal of
this chapter is to explore various real-case sprays with wide droplet size distributions to evaluate the
resultant cooling effect. The commercially available real nozzle LNN1.5 that can produce
polydisperse spray has been selected for spray generation. In order to precool the inlet hot air flowing
through different parts of radiators, sprays from nozzle placed at different vertical height, radial
distance and injection direction have been numerically studied. Since air parcels near the tower edge
are blocked by the formed vortex and difficult to be cooled, wall cover is proposed to change the flow
field inside the tower. The addition of wall cover reduces the undesirable blockage caused by the
near-wall vortex and allows the hot air neighbouring the tower wall to be cooled successfully. The
study also confirms that sprays generated by nozzle at lower position can cool the central part of air
through the radiator while sprays from higher nozzle injections cool the middle part. For injection
direction influence, the upward and co-flow injections have poorer performance than the downward
and counter-flow injections. Furthermore, sprays from nozzles with large extended length enjoy better
evaporation performance due to the longer residence time.
115
Investigations on the influence of nozzle arrangement on the pre-cooling effect for
the natural draft dry cooling tower
Yubiao Sun, Zhiqiang Guan, Hal Gurgenci, Kamel Hooman, Xiaoxiao Li, Lin Xia
Queensland Geothermal Energy Centre of Excellence,
School of Mechanical and Mining Engineering,
The University of Queensland, Brisbane 4072, Australia
Applied Thermal Engineering 130 (2018) 979-996
Abstract:
Natural draft dry cooling tower (NDDCT), with little water usage, is a primary choice for power
plants in dried regions. However, the increased ambient temperature during summer days decreases
the cooling performance of NDDCT. Inlet air pre-cooling is used to alleviate the tower deterioration
by making use of water evaporation to remove excess heat from inlet air. To achieve the maximal
cooling effect, the injection heights, radial distances and injection directions of employed nozzle
LNN1.5 were studied based on the CFD results. The study shows that lower nozzle placement can
cool the central part of the radiator while the higher one cools the middle part. Additionally, the
increasing extended length can boost the evaporation process of generated spray. Moreover, the
upward and co-flow injections have poorer performance than the downward and counter-flow
injections. Furthermore, an introduction of wall cover changes the flow field and drives the pre-cooled
air flow through the edge of radiator. Since the wall cover reduces the blockage caused by the near-
wall vortex the resultant low-temperature region move outwardly.
Keywords:
Natural draft dry cooling tower; spray cooling; wall cover
5.1 Introduction
For thermal power plants, the cooling purpose is reached by using cooling tower as the essential part
to dump substantial waste heat to the surrounding environment. In this sense, the performance of
cooling system is significant for the power plant operations and have an important impact on the

116
performance of the entire power cycle. A defective cooling system, failing to provide adequate
cooling for the power generation process, would lead to decreased electricity production as well as
tremendous economic loss. In order to avoid such economic punishment, an efficient cooling system
becomes a necessary part for power plants.
In most power plants, mechanical and natural draft cooling towers are commonly used. The popularity
of mechanical draft cooling towers is related to its low-capital investment. But their energy-
consumptive motor-driven fans incur high running costs for power plants. Therefore, natural draft
cooling towers, with the advantage of less operational cost, become a good alternative for cost-
effective energy producers. Briefly, natural draft cooling towers have two types: wet and dry cooling
towers. In wet cooling towers, water serves as the heat transfer medium and their latent heat provides
significantly contribute to the cooling effect. However, the evaporative wet cooling towers consume
large quantity of water due to water loss caused by evaporation. In addition to drift loss related to
water vapor, wet cooling towers also suffer from thermal pollution, leading to the degradation of
water quality, visible plume and entrainment and impingement issues. The environmental concerns
and huge water consumption make wet cooling tower less attractive in regions with limited water
resource [192]. In arid areas, dry cooling towers with the advantages of low water consumption, low
maintenance cost and little parasitic loss, become the primary choice. The convective heat transfer
mechanism of dry cooling towers gives them poor cooling performance when compared with the
evaporative wet cooling towers [27]. More importantly, the cooling efficiency loss becomes
remarkable during high ambient temperature periods due to the rising inlet air temperature [16].
A solution to overcome the low efficiency during hot days is the installation of spray cooling system.
This technology makes use of a small quantity of water to cool the inlet air. This method, known as
its simplicity, low capital cost, and ease for operation and maintenance, has been reported to be a
potential solution that deserves a further investigation [195]. The core part of the spray system is the
nozzle used to break bulk water into small water droplets and distribute these droplets into the inlet
air (Figure 5-1). The large water-air contact surface area of fine droplets accelerates the evaporation
process. Since the water flowrate is quite small, the air stream motion is barely affected and the
pressure drop caused by the spray is insignificant [6]. The latent heat of the evaporated water droplets
comes from the hot ambient air, and thus causing the temperature drop of the hot air. The pre-cooled
inlet air improves the cooling tower performance and consequently increases the thermal efficiency
of a power plant. As a result, compared with power plants with pure dry-cooling system, the power
plants assisted by sprays can generate more power.
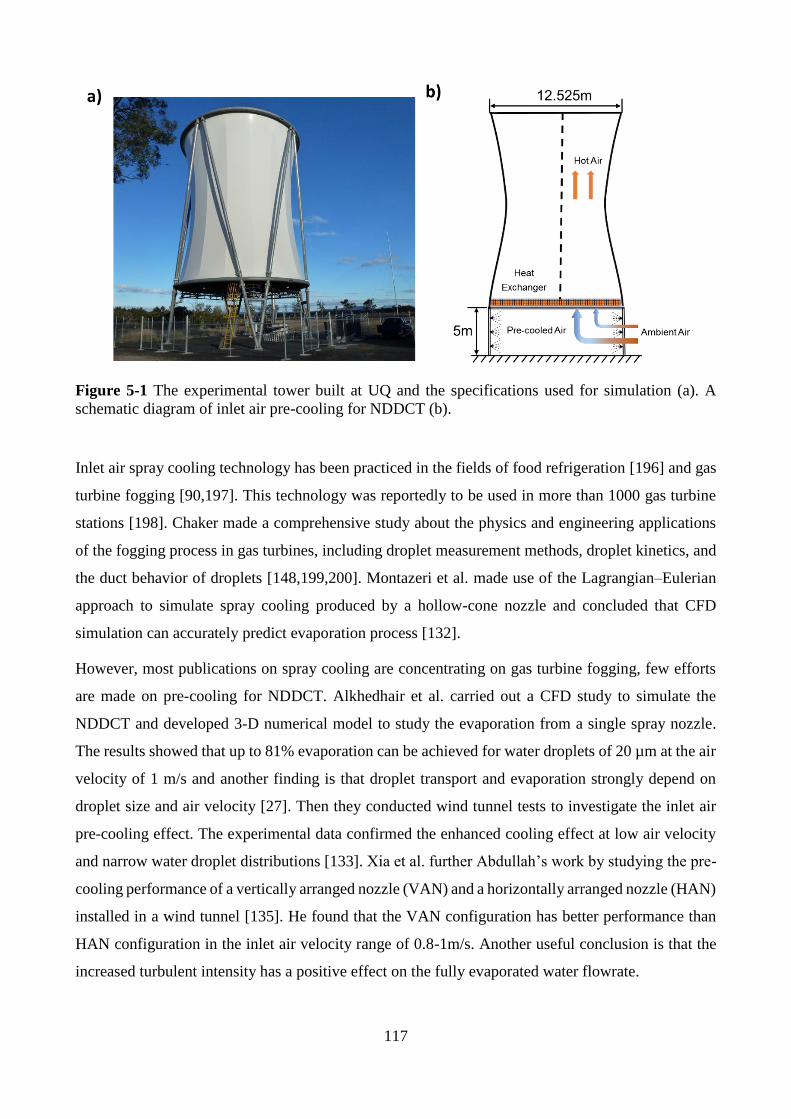
117
Figure 5-1 The experimental tower built at UQ and the specifications used for simulation (a). A
schematic diagram of inlet air pre-cooling for NDDCT (b).
Inlet air spray cooling technology has been practiced in the fields of food refrigeration [196] and gas
turbine fogging [90,197]. This technology was reportedly to be used in more than 1000 gas turbine
stations [198]. Chaker made a comprehensive study about the physics and engineering applications
of the fogging process in gas turbines, including droplet measurement methods, droplet kinetics, and
the duct behavior of droplets [148,199,200]. Montazeri et al. made use of the Lagrangian–Eulerian
approach to simulate spray cooling produced by a hollow-cone nozzle and concluded that CFD
simulation can accurately predict evaporation process [132].
However, most publications on spray cooling are concentrating on gas turbine fogging, few efforts
are made on pre-cooling for NDDCT. Alkhedhair et al. carried out a CFD study to simulate the
NDDCT and developed 3-D numerical model to study the evaporation from a single spray nozzle.
The results showed that up to 81% evaporation can be achieved for water droplets of 20 µm at the air
velocity of 1 m/s and another finding is that droplet transport and evaporation strongly depend on
droplet size and air velocity [27]. Then they conducted wind tunnel tests to investigate the inlet air
pre-cooling effect. The experimental data confirmed the enhanced cooling effect at low air velocity
and narrow water droplet distributions [133]. Xia et al. further Abdullah’s work by studying the pre-
cooling performance of a vertically arranged nozzle (VAN) and a horizontally arranged nozzle (HAN)
installed in a wind tunnel [135]. He found that the VAN configuration has better performance than
HAN configuration in the inlet air velocity range of 0.8-1m/s. Another useful conclusion is that the
increased turbulent intensity has a positive effect on the fully evaporated water flowrate.
118
Vallet et al. reported that nozzle orientation has little effect on droplet size distribution. For
horizontally-placed nozzle, some droplets may fall down or coalesce with larger droplets, resulting
in a size distribution slightly shifted towards larger droplets [214]. Nozzle orientation affects more
significantly droplet axial velocity distribution. In horizontal injection, gravity and axial velocity are
not collinear, droplet velocity moves towards lower axial velocity.
Bade et al. carried out both experimental work and CFD simulation to study the effect of various
incident angle cross-flows on the characteristics of a spray distribution [215]. They found that the
droplet trajectory and spray plume characteristics change over a range of spray angles. M.A. Chaker
reported that the droplet distribution to a large extent, depends on the nozzle arrangement and the
uniformly distributed nozzle arrangement is always preferred [197].
Although spray cooling was studied for application in NDDCT, few research was focusing on the
exploration between nozzle arrangement and the produced cooling effect. There is no clear
information about how to place nozzles to cool the hot air flowing through different parts of radiators.
To close this gap, this paper would identify nozzle locations so that different parts of radiators would
experience a spray cooling. Therefore, nozzle arrangement ought to be comprehensively studied in
order to get an excellent cooling performance under the restraint of limited water usage. In our study,
a 3D CFD model was first developed to simulate the NDDCT to get the velocity field. The NDDCT
specifications was based on the experimental tower built in the University of Queensland (UQ). Then
this velocity field was used for spray cooling calculations. The influences of nozzle location and
injection direction on the pre-cooling performance of a hollow-cone nozzle LNN1.5 were explored.
Different injection cases were simulated to identify the relationship between the nozzle arrangement
and the corresponding impact area experiencing a temperature drop. Finally, a wall cover was
introduced to make sure the outer part of heat exchanger bundles could access pre-cooled air.
5.2 Numerical Method
In this study, ANSYS FLUENT (version 16.2) was selected as the CFD tool to investigate spray
cooling for the inlet air flowing through NDDCT. Eulerian-Lagrangian method are generally used to
explore the interaction level between the droplets (discrete phase) and the continuous phase (air).
According to Elgobashi [201], there are two methods in which the transport of water droplets flow in
a turbulent air flow can be numerically predicted. The first one is the “one way coupling” where only
the influence of air on the droplets is considered while the air properties are rarely influenced by the
existence of droplets. The second regime is the “two-way coupling” where the influence of the
droplets on the airflow characteristics is large enough to affect the airflow. Therefore, modification
to the airflow field governing equations is necessary to take into account the two-phase coupling. A
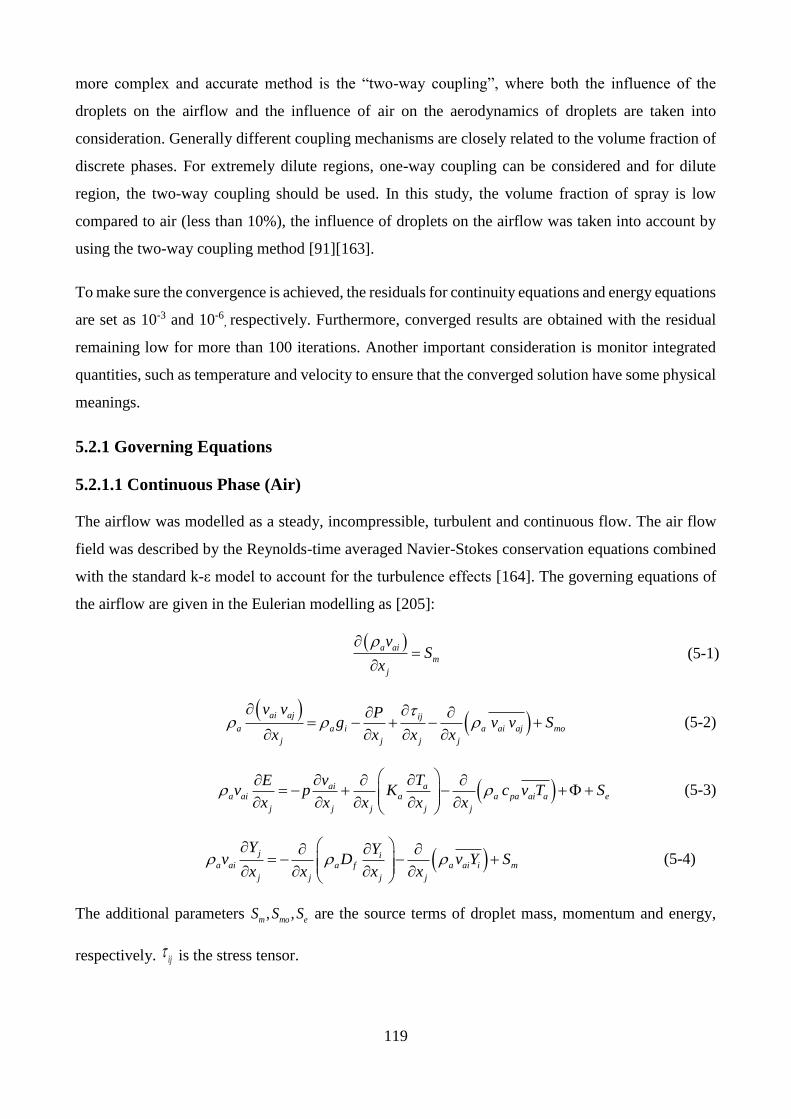
119
more complex and accurate method is the “two-way coupling”, where both the influence of the
droplets on the airflow and the influence of air on the aerodynamics of droplets are taken into
consideration. Generally different coupling mechanisms are closely related to the volume fraction of
discrete phases. For extremely dilute regions, one-way coupling can be considered and for dilute
region, the two-way coupling should be used. In this study, the volume fraction of spray is low
compared to air (less than 10%), the influence of droplets on the airflow was taken into account by
using the two-way coupling method [91][163].
To make sure the convergence is achieved, the residuals for continuity equations and energy equations
are set as 10-3 and 10-6, respectively. Furthermore, converged results are obtained with the residual
remaining low for more than 100 iterations. Another important consideration is monitor integrated
quantities, such as temperature and velocity to ensure that the converged solution have some physical
meanings.
5.2.1 Governing Equations
5.2.1.1 Continuous Phase (Air)
The airflow was modelled as a steady, incompressible, turbulent and continuous flow. The air flow
field was described by the Reynolds-time averaged Navier-Stokes conservation equations combined
with the standard k-ε model to account for the turbulence effects [164]. The governing equations of
the airflow are given in the Eulerian modelling as [205]:
( )a ai
m
j
vS
x
=
(5-1)
( )
( )ai aj ij
a a i a ai aj mo
j j j j
v v Pg v v S
x x x x
= − + − +
(5-2)
( )ai aa ai a a pa ai a e
j j j j j
v TEv p K c v T S
x x x x x
= − + − ++
(5-3)
( )j ia ai a a ai i m
j j
f
j j
Y Yv v Y S
x x xD
x
= − − +
(5-4)
The additional parameters , ,m mo eS S S are the source terms of droplet mass, momentum and energy,
respectively. ij is the stress tensor.

120
5.2.1.2 Discrete Phase (Water)
The water droplet is modelled as a discrete phase using the Lagrangian framework. In spray systems,
water injected into the air quickly disintegrates on exit from the nozzle into droplets that follow their
own trajectories. Basically, since there are too many droplets, using the Lagrangian framework to
simulate all these particles individually needs tremendous computational resource. In order to avoid
this disadvantage, droplets are represented by a specified number of parcels equivalent to the entire
spray to reduce computational time. Each parcel contains identical particles sharing the same
properties (diameter, velocity, trajectory, temperature, etc.). In this computation, only one droplet is
calculated to represent the whole parcel, assuming that all other droplets in the parcel are expected to
behave in the same manner.
By modelling droplet trajectories via the Lagrangian framework, each discrete droplet is tracked
individually within the air flow by integrating the motion equations governed by Newton’s second
law and including the influence of the relevant forces from the air. As described earlier, by using the
assumption that all droplets are isolated and have spherical shapes, adjustment in speed or direction
of a droplet in air is brought mainly by air drag and gravity. The effect of turbulence on droplets is
addressed by calculating the instantaneous air velocities in the time-averaged Navier-Stokes
equations employing a stochastic velocity model as part of the particle tracking model.
In addition, the influence of droplets on the airflow was taken into account by using the two-way
coupling regime. These source terms Sm, Smo, Se that appear in equations (5-1, 5-2, 5-3 and 5-4) are
introduced to represent the mass, energy and momentum exchange between droplets and air flow.
5.2.1.3 Mass and Heat Transfer
The inlet air pre-cooling makes use of the latent corresponding to the evaporation of water droplets
to take away the thermal energy from ambient air, resulting in the cooled air flow. Once the sprayed
water droplets contact with the dry, hot and unsaturated air, simultaneous heat and mass transfer
occurs at the water-air surface. Compared with the latent heat transfer caused by mass transfer, the
concurrent convective and radiative heat transfer are negligible [208]. Simply speaking, convection
is the principle mechanism driving the heat transfer process of evaporating droplets, which is also
accompanied by the latent heat transfer caused by evaporation. The exposed water droplets would
form a film of saturated air-vapor in the medium of ambient air. This film is responsible for heat
transfer caused by the temperature difference between the water droplet and the unsaturated air.
Meanwhile, mass transfer is observed when a vapor concentration gradient exists between the vapor
layer and the ambient air. The rate of energy absorbed by each droplet can be expressed as:
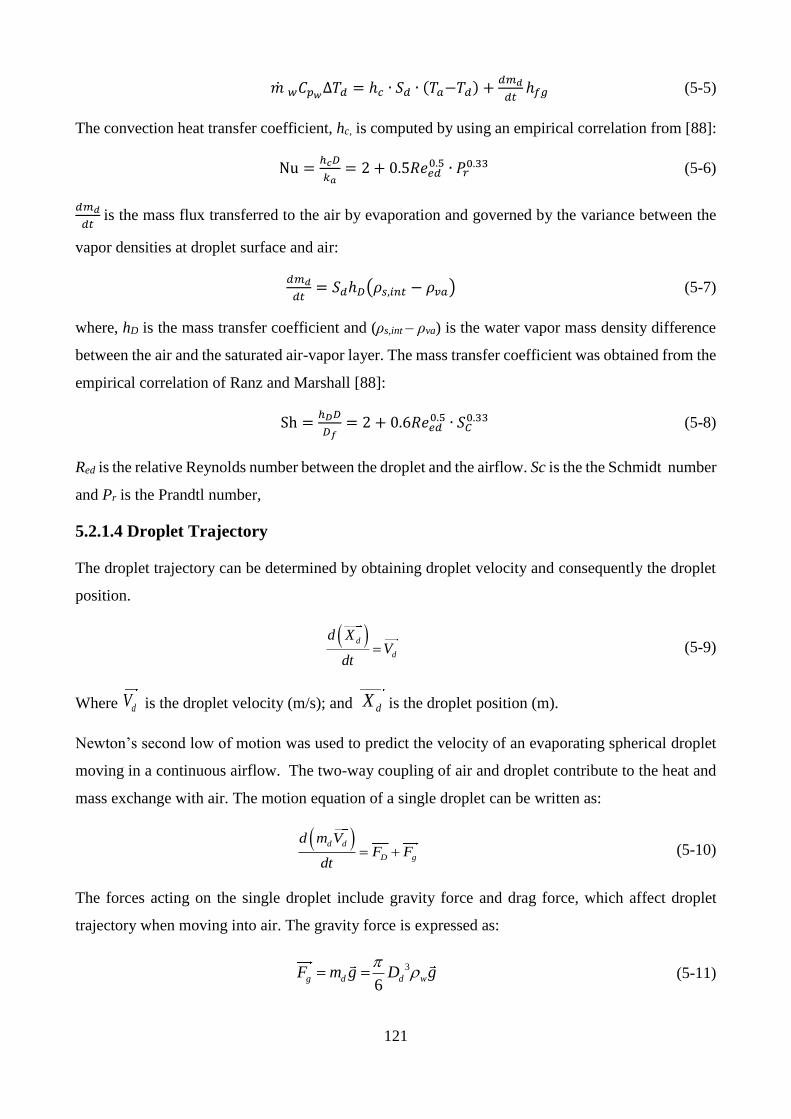
121
�� 𝑤𝐶𝑝𝑤∆𝑇𝑑 = ℎ𝑐 ∙ 𝑆𝑑 ∙ (𝑇𝑎−𝑇𝑑) +
𝑑𝑚𝑑
𝑑𝑡ℎ𝑓𝑔 (5-5)
The convection heat transfer coefficient, hc, is computed by using an empirical correlation from [88]:
Nu =ℎ𝑐𝐷
𝑘𝑎= 2 + 0.5𝑅𝑒𝑒𝑑
0.5 ∙ 𝑃𝑟0.33 (5-6)
𝑑𝑚𝑑
𝑑𝑡 is the mass flux transferred to the air by evaporation and governed by the variance between the
vapor densities at droplet surface and air:
𝑑𝑚𝑑
𝑑𝑡= 𝑆𝑑ℎ𝐷(𝜌𝑠,𝑖𝑛𝑡 − 𝜌𝑣𝑎) (5-7)
where, hD is the mass transfer coefficient and (ρs,int – ρva) is the water vapor mass density difference
between the air and the saturated air-vapor layer. The mass transfer coefficient was obtained from the
empirical correlation of Ranz and Marshall [88]:
Sh =ℎ𝐷𝐷
𝐷𝑓= 2 + 0.6𝑅𝑒𝑒𝑑
0.5 ∙ 𝑆𝐶0.33 (5-8)
Red is the relative Reynolds number between the droplet and the airflow. Sc is the the Schmidt number
and Pr is the Prandtl number,
5.2.1.4 Droplet Trajectory
The droplet trajectory can be determined by obtaining droplet velocity and consequently the droplet
position.
( )d
d
d XV
dt= (5-9)
Where dV is the droplet velocity (m/s); and dX is the droplet position (m).
Newton’s second low of motion was used to predict the velocity of an evaporating spherical droplet
moving in a continuous airflow. The two-way coupling of air and droplet contribute to the heat and
mass exchange with air. The motion equation of a single droplet can be written as:
( )d d
D g
d m VF F
dt= + (5-10)
The forces acting on the single droplet include gravity force and drag force, which affect droplet
trajectory when moving into air. The gravity force is expressed as:
3 6
g d d wF m g D g
= = (5-11)
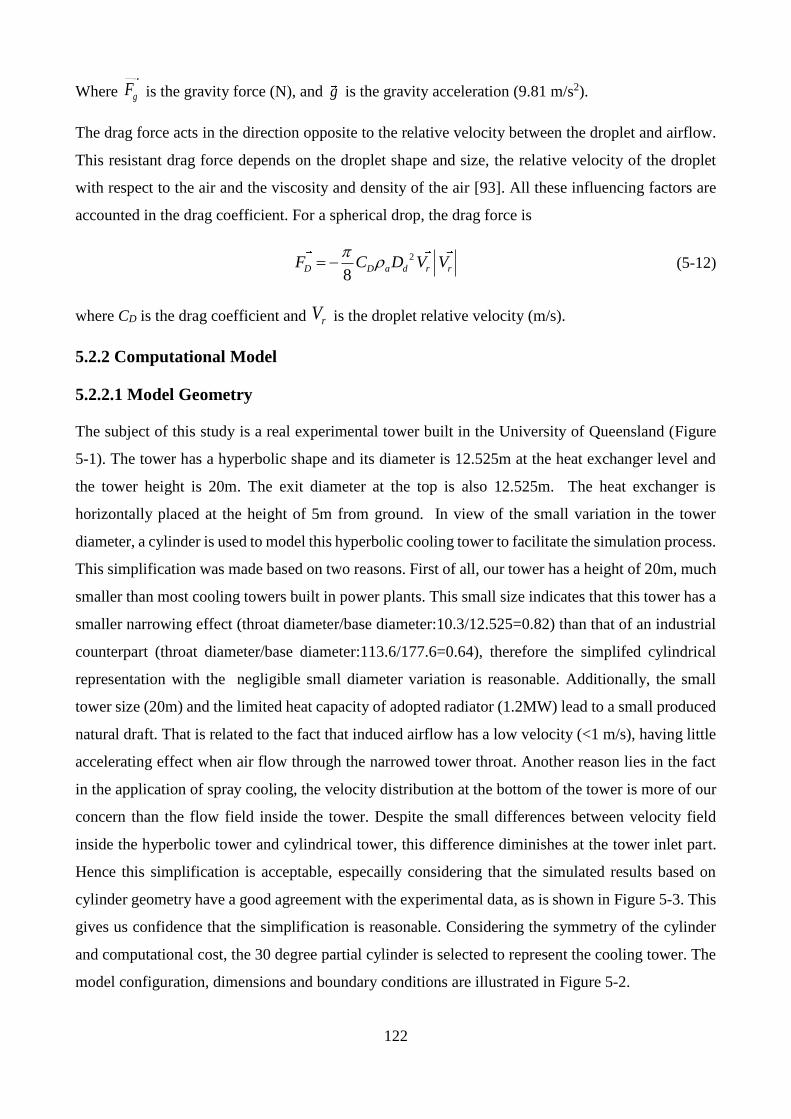
122
Where gF is the gravity force (N), and g is the gravity acceleration (9.81 m/s2).
The drag force acts in the direction opposite to the relative velocity between the droplet and airflow.
This resistant drag force depends on the droplet shape and size, the relative velocity of the droplet
with respect to the air and the viscosity and density of the air [93]. All these influencing factors are
accounted in the drag coefficient. For a spherical drop, the drag force is
2
8D D a d r rF C D V V
= − (5-12)
where CD is the drag coefficient and rV is the droplet relative velocity (m/s).
5.2.2 Computational Model
5.2.2.1 Model Geometry
The subject of this study is a real experimental tower built in the University of Queensland (Figure
5-1). The tower has a hyperbolic shape and its diameter is 12.525m at the heat exchanger level and
the tower height is 20m. The exit diameter at the top is also 12.525m. The heat exchanger is
horizontally placed at the height of 5m from ground. In view of the small variation in the tower
diameter, a cylinder is used to model this hyperbolic cooling tower to facilitate the simulation process.
This simplification was made based on two reasons. First of all, our tower has a height of 20m, much
smaller than most cooling towers built in power plants. This small size indicates that this tower has a
smaller narrowing effect (throat diameter/base diameter:10.3/12.525=0.82) than that of an industrial
counterpart (throat diameter/base diameter:113.6/177.6=0.64), therefore the simplifed cylindrical
representation with the negligible small diameter variation is reasonable. Additionally, the small
tower size (20m) and the limited heat capacity of adopted radiator (1.2MW) lead to a small produced
natural draft. That is related to the fact that induced airflow has a low velocity (<1 m/s), having little
accelerating effect when air flow through the narrowed tower throat. Another reason lies in the fact
in the application of spray cooling, the velocity distribution at the bottom of the tower is more of our
concern than the flow field inside the tower. Despite the small differences between velocity field
inside the hyperbolic tower and cylindrical tower, this difference diminishes at the tower inlet part.
Hence this simplification is acceptable, especailly considering that the simulated results based on
cylinder geometry have a good agreement with the experimental data, as is shown in Figure 5-3. This
gives us confidence that the simplification is reasonable. Considering the symmetry of the cylinder
and computational cost, the 30 degree partial cylinder is selected to represent the cooling tower. The
model configuration, dimensions and boundary conditions are illustrated in Figure 5-2.
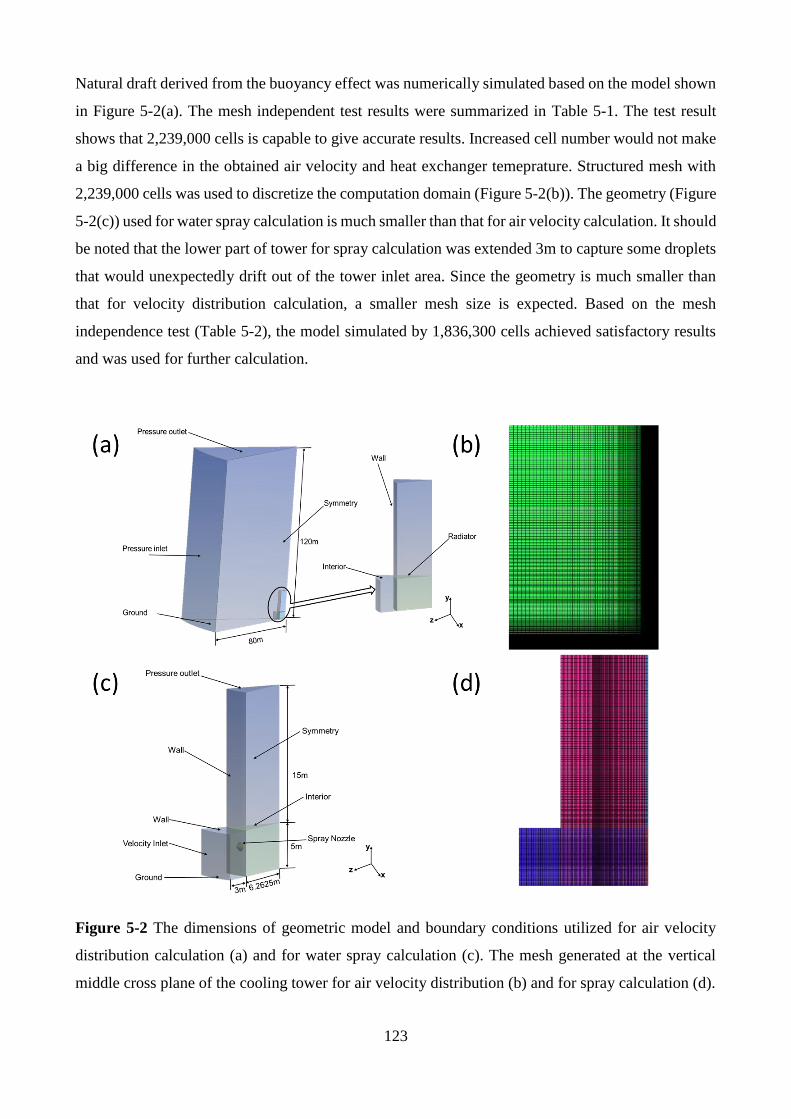
123
Natural draft derived from the buoyancy effect was numerically simulated based on the model shown
in Figure 5-2(a). The mesh independent test results were summarized in Table 5-1. The test result
shows that 2,239,000 cells is capable to give accurate results. Increased cell number would not make
a big difference in the obtained air velocity and heat exchanger temeprature. Structured mesh with
2,239,000 cells was used to discretize the computation domain (Figure 5-2(b)). The geometry (Figure
5-2(c)) used for water spray calculation is much smaller than that for air velocity calculation. It should
be noted that the lower part of tower for spray calculation was extended 3m to capture some droplets
that would unexpectedly drift out of the tower inlet area. Since the geometry is much smaller than
that for velocity distribution calculation, a smaller mesh size is expected. Based on the mesh
independence test (Table 5-2), the model simulated by 1,836,300 cells achieved satisfactory results
and was used for further calculation.
Figure 5-2 The dimensions of geometric model and boundary conditions utilized for air velocity
distribution calculation (a) and for water spray calculation (c). The mesh generated at the vertical
middle cross plane of the cooling tower for air velocity distribution (b) and for spray calculation (d).
124
Table 5-1 Grid independence test for velocity of NDDCT
Cell number Vertical air velocity (m/s) Air temperature (K)
512,000 0.808 327.13
2,239,000 0.792 326.18
3,518,000 0.785 326.12
Table 5-2 Grid independence test for spray cooling
Cell number Air velocity 1 Temperature(°C) Evaporated water (g/s)
455,600 0.811 38.82 5
1,836,300 0.795 38.76 4.95
2,632,500 0.789 38.72 4.92
1: The velocity is the area-weighted vertical velocity at the heat exchanger surface. The unit is m/s.
The heat exchanger in the tower is simulated as a radiator in FLUENT. A radiator is considered to be
infinitely thin, and the pressure drop through the radiator is assumed to be proportional to the dynamic
head of the fluid, with an empirically determined loss coefficient [163]. The radiator model in the
Fluent was used to calculate the performance of the air-cooled heat exchanger of the cooling tower.
The heat transfer process and the pressure drop in the heat exchanger could be presented by the
following equations:
Q = ℎ𝑟(𝑇𝑟 − 𝑇𝑎) (5-13)
∆P = 𝐿𝑓1
2𝜌𝑎𝑣𝑎
2 (5-14)
5.2.2.2 Boundary and Operating Conditions
The ambient air flow through the tower was considered as an ideal air mixture containing water vapor,
oxygen and nitrogen. The air consists of the dry air part with 77% of nitrogen and 23% of oxygen by
mass and different concentration of water vapor depending on the humidity. Air velocity profile
obtained from a separate tower simulation was used as the velocity inlet boundary condition. The
inlet turbulence intensity was assumed as 1% for all cases [27]. The operating pressure was assumed
to be the atmospheric pressure, 101.325 kPa. At the top of the large domain, the pressure outlet
boundary condition was used. The wall of tower was set as adiabatic walls with no-slip condition.
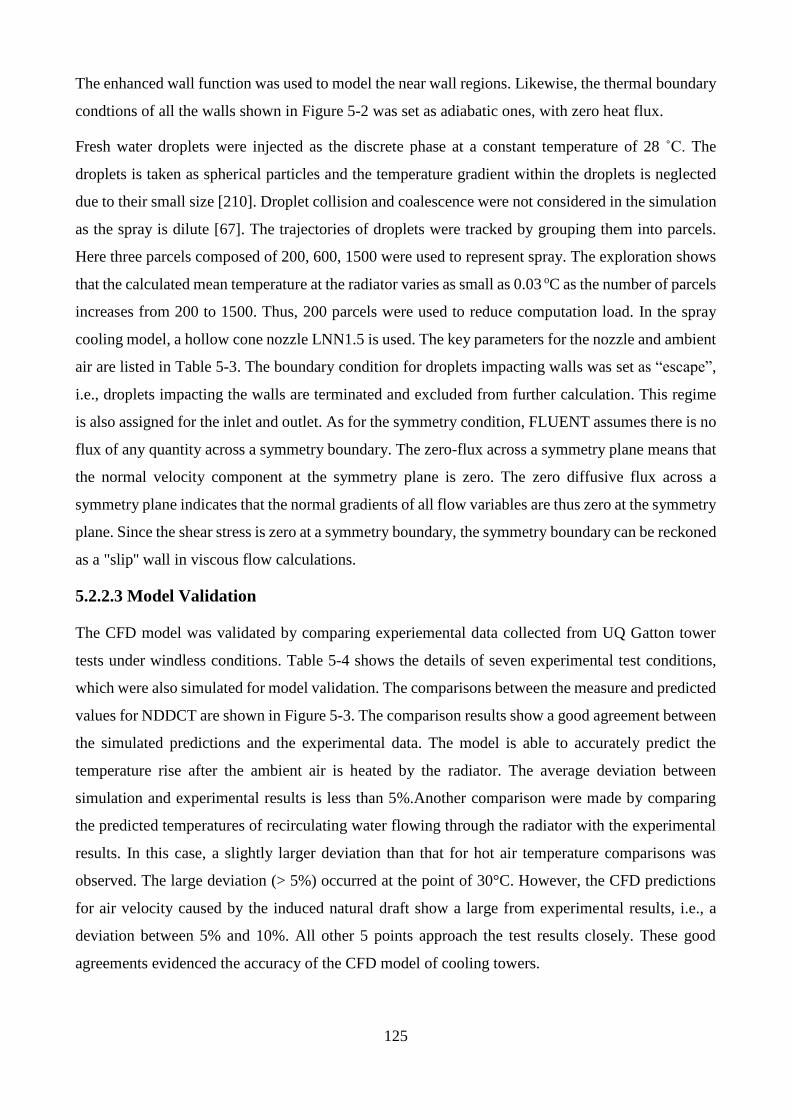
125
The enhanced wall function was used to model the near wall regions. Likewise, the thermal boundary
condtions of all the walls shown in Figure 5-2 was set as adiabatic ones, with zero heat flux.
Fresh water droplets were injected as the discrete phase at a constant temperature of 28 ˚C. The
droplets is taken as spherical particles and the temperature gradient within the droplets is neglected
due to their small size [210]. Droplet collision and coalescence were not considered in the simulation
as the spray is dilute [67]. The trajectories of droplets were tracked by grouping them into parcels.
Here three parcels composed of 200, 600, 1500 were used to represent spray. The exploration shows
that the calculated mean temperature at the radiator varies as small as 0.03 oC as the number of parcels
increases from 200 to 1500. Thus, 200 parcels were used to reduce computation load. In the spray
cooling model, a hollow cone nozzle LNN1.5 is used. The key parameters for the nozzle and ambient
air are listed in Table 5-3. The boundary condition for droplets impacting walls was set as “escape”,
i.e., droplets impacting the walls are terminated and excluded from further calculation. This regime
is also assigned for the inlet and outlet. As for the symmetry condition, FLUENT assumes there is no
flux of any quantity across a symmetry boundary. The zero-flux across a symmetry plane means that
the normal velocity component at the symmetry plane is zero. The zero diffusive flux across a
symmetry plane indicates that the normal gradients of all flow variables are thus zero at the symmetry
plane. Since the shear stress is zero at a symmetry boundary, the symmetry boundary can be reckoned
as a "slip'' wall in viscous flow calculations.
5.2.2.3 Model Validation
The CFD model was validated by comparing experiemental data collected from UQ Gatton tower
tests under windless conditions. Table 5-4 shows the details of seven experimental test conditions,
which were also simulated for model validation. The comparisons between the measure and predicted
values for NDDCT are shown in Figure 5-3. The comparison results show a good agreement between
the simulated predictions and the experimental data. The model is able to accurately predict the
temperature rise after the ambient air is heated by the radiator. The average deviation between
simulation and experimental results is less than 5%.Another comparison were made by comparing
the predicted temperatures of recirculating water flowing through the radiator with the experimental
results. In this case, a slightly larger deviation than that for hot air temperature comparisons was
observed. The large deviation (> 5%) occurred at the point of 30°C. However, the CFD predictions
for air velocity caused by the induced natural draft show a large from experimental results, i.e., a
deviation between 5% and 10%. All other 5 points approach the test results closely. These good
agreements evidenced the accuracy of the CFD model of cooling towers.
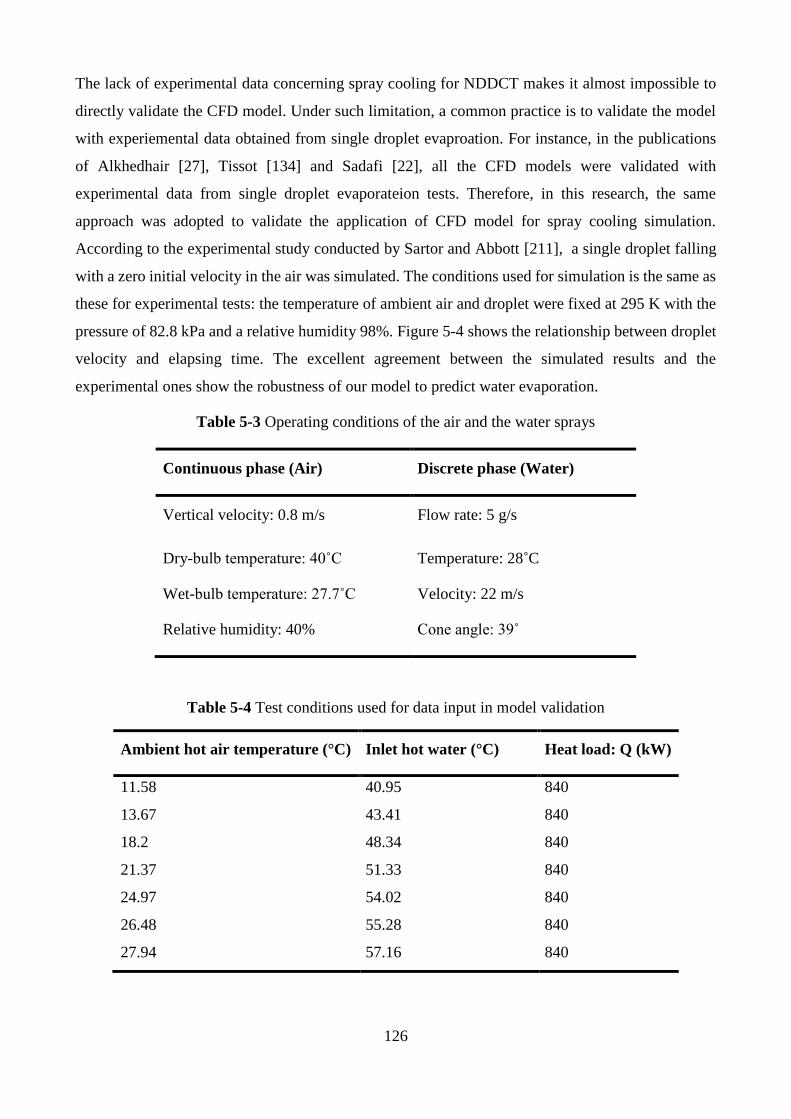
126
The lack of experimental data concerning spray cooling for NDDCT makes it almost impossible to
directly validate the CFD model. Under such limitation, a common practice is to validate the model
with experiemental data obtained from single droplet evaproation. For instance, in the publications
of Alkhedhair [27], Tissot [134] and Sadafi [22], all the CFD models were validated with
experimental data from single droplet evaporateion tests. Therefore, in this research, the same
approach was adopted to validate the application of CFD model for spray cooling simulation.
According to the experimental study conducted by Sartor and Abbott [211], a single droplet falling
with a zero initial velocity in the air was simulated. The conditions used for simulation is the same as
these for experimental tests: the temperature of ambient air and droplet were fixed at 295 K with the
pressure of 82.8 kPa and a relative humidity 98%. Figure 5-4 shows the relationship between droplet
velocity and elapsing time. The excellent agreement between the simulated results and the
experimental ones show the robustness of our model to predict water evaporation.
Table 5-3 Operating conditions of the air and the water sprays
Continuous phase (Air) Discrete phase (Water)
Vertical velocity: 0.8 m/s Flow rate: 5 g/s
Dry-bulb temperature: 40˚C
Wet-bulb temperature: 27.7˚C
Relative humidity: 40%
Temperature: 28˚C
Velocity: 22 m/s
Cone angle: 39˚
Table 5-4 Test conditions used for data input in model validation
Ambient hot air temperature (°C) Inlet hot water (°C) Heat load: Q (kW)
11.58 40.95 840
13.67 43.41 840
18.2 48.34 840
21.37 51.33 840
24.97 54.02 840
26.48 55.28 840
27.94 57.16 840
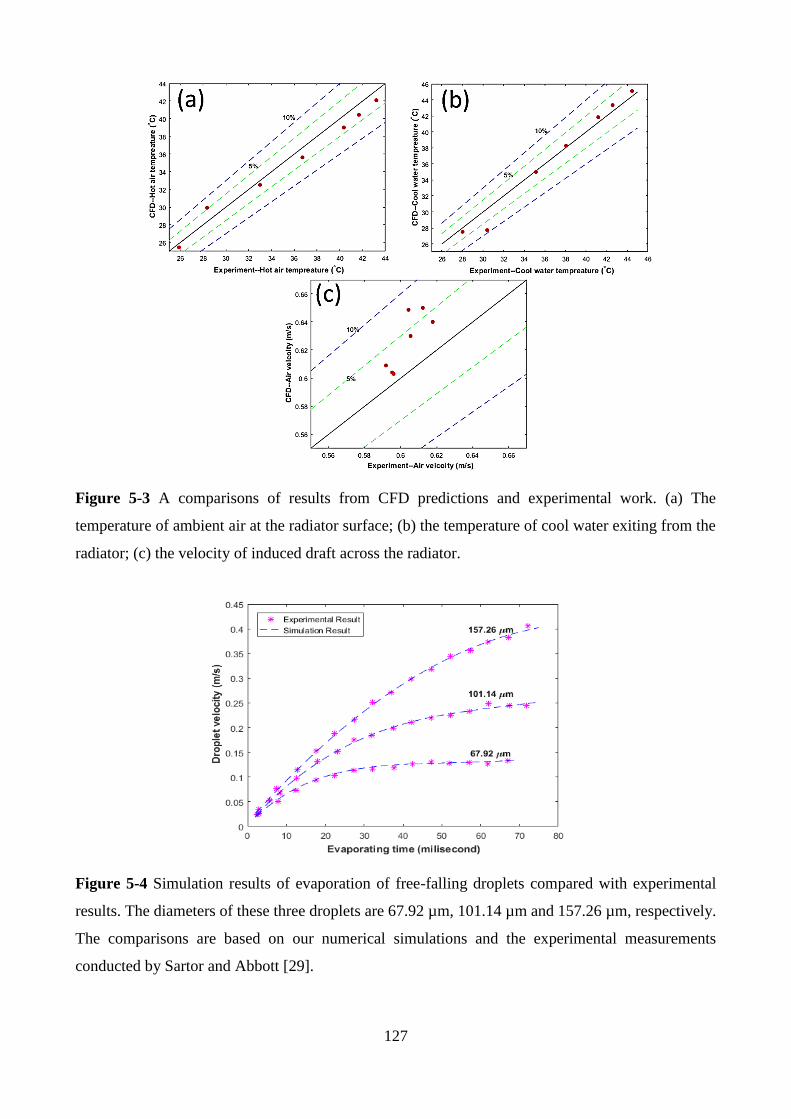
127
Figure 5-3 A comparisons of results from CFD predictions and experimental work. (a) The
temperature of ambient air at the radiator surface; (b) the temperature of cool water exiting from the
radiator; (c) the velocity of induced draft across the radiator.
Figure 5-4 Simulation results of evaporation of free-falling droplets compared with experimental
results. The diameters of these three droplets are 67.92 µm, 101.14 µm and 157.26 µm, respectively.
The comparisons are based on our numerical simulations and the experimental measurements
conducted by Sartor and Abbott [29].
128
5.3 Results and Discussions
5.3.1 Inlet Air Velocity
The model used for CFD simulation is shown in Figure 5-2(a). The symmetry of cylinder allows us
to simulate only a 30o partial cylinder to obtain the air velocity distribution inside the tower. The
smaller 30o partial cylinder representing cooling tower is placed within a much larger cylinder section,
which represents the large surrounding air domain. The height of the air domain is 120m and the
radius 80m. Such a large computational domain guarantees that the air flow would reach fully
developed within the geometry.
Figure 5-5(a) shows the temperature distribution at the vertical cross section of cooling tower. The
raised air temperature is caused by the heat transfer from the hot water inside the tube to the outside
air. As is shown by the streamline (the black solid line) in Figure 5-5(b), the ambient atmosphere,
driven by the buoyancy force originating from the density difference between the outside and inside
of the tower, flows into the tower and through the radiator. The reverse pressure gradient is
conspicuously observed inside the tower to balance the buoyancy force and viscous force. The
velocity vector distribution is shown in Figure 5-5(c). The velocity vectors change their directions in
the tower inlet area, flowing into the tower to produce natural draft.
Water spray modelling involve complex heat and mass transfer computations and requires large
computational resources. To address this problem, we did not select the model in Figure 5-2(a) for
spray simulation, which would couple heat exchanger with spray cooling. Instead, we turned off the
heat exchanger and concentrated the limited computational resources on the water sprays simulations
under various nozzle arrangements. Once the radiator is turned off, the large air domain responsible
for buoyance-driven air flow is unnecessary. Therefore, a smaller model (Figure 5-2(c)) was selected
to effectively capture the detailed information of spray flows. Even if the combined calculations of
radiator and water spray is desirable, this combination will add substantial burden on our simulation.
Ideally speaking, when water spray is coupled with radiator, the calculation of induced natural draft
caused by the radiator requires a geometric domain at least 72 times larger than the adopted small
model. This large domain is much too big and the acceptable mesh size leads to an approximate 132.3
million cells, far beyond the calculation capacity (5 million) of our super computer. On the other hand,
although we can use different mesh size for various sections of the geometry to decrease the cell
number, the mesh size in the tower inlet part will remain much larger than the two-step separate
model. This coarse mesh would make it difficult to achieve accurate results related to water
evaporation. On the other hand, if fine mesh is employed for the sake of accuracy on spray calculation,
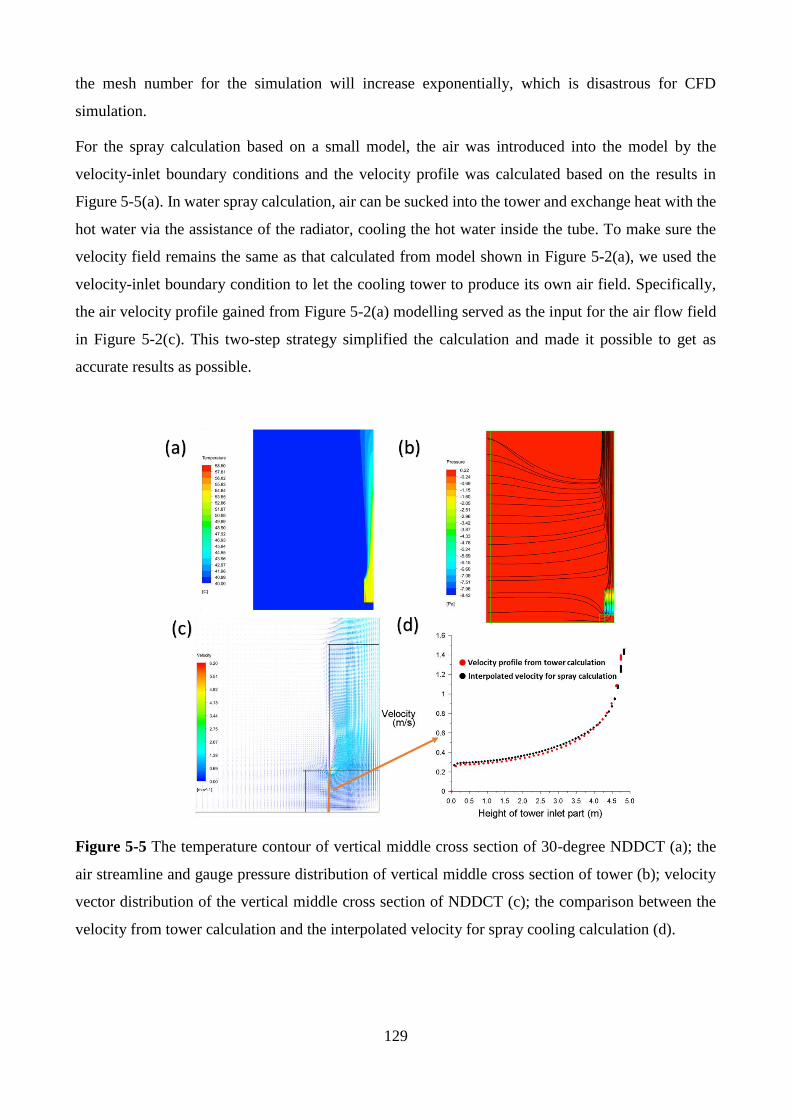
129
the mesh number for the simulation will increase exponentially, which is disastrous for CFD
simulation.
For the spray calculation based on a small model, the air was introduced into the model by the
velocity-inlet boundary conditions and the velocity profile was calculated based on the results in
Figure 5-5(a). In water spray calculation, air can be sucked into the tower and exchange heat with the
hot water via the assistance of the radiator, cooling the hot water inside the tube. To make sure the
velocity field remains the same as that calculated from model shown in Figure 5-2(a), we used the
velocity-inlet boundary condition to let the cooling tower to produce its own air field. Specifically,
the air velocity profile gained from Figure 5-2(a) modelling served as the input for the air flow field
in Figure 5-2(c). This two-step strategy simplified the calculation and made it possible to get as
accurate results as possible.
Figure 5-5 The temperature contour of vertical middle cross section of 30-degree NDDCT (a); the
air streamline and gauge pressure distribution of vertical middle cross section of tower (b); velocity
vector distribution of the vertical middle cross section of NDDCT (c); the comparison between the
velocity from tower calculation and the interpolated velocity for spray cooling calculation (d).
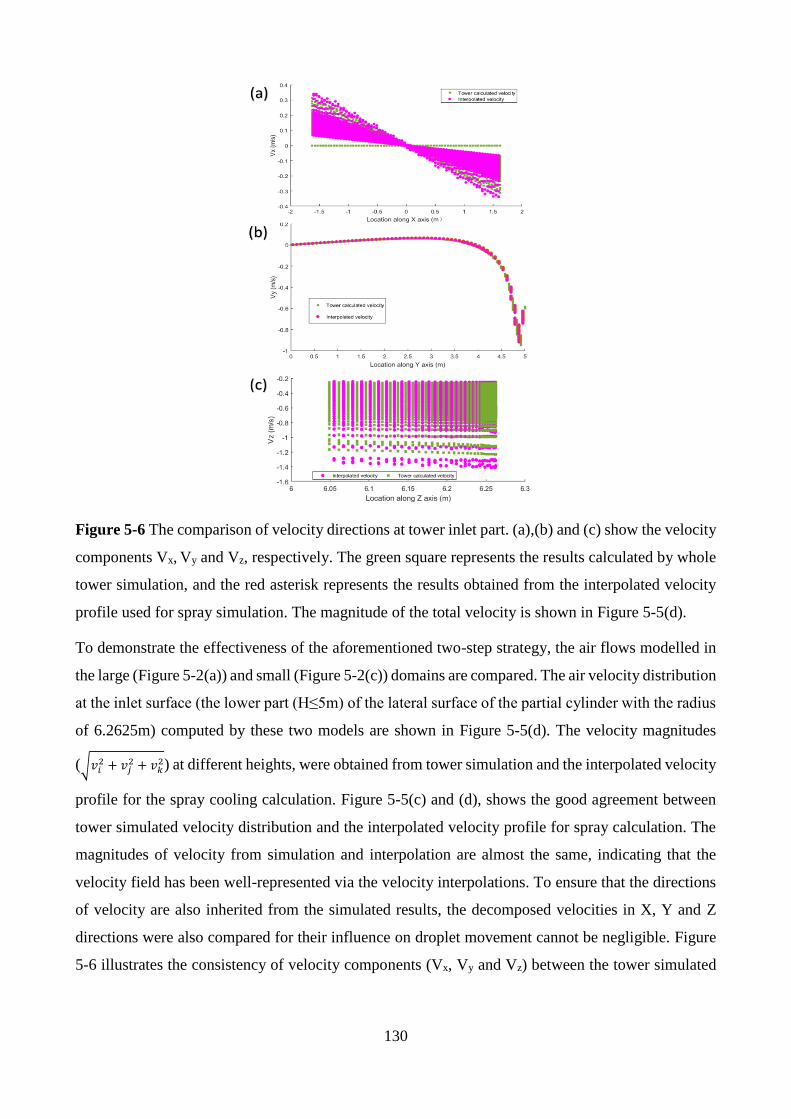
130
Figure 5-6 The comparison of velocity directions at tower inlet part. (a),(b) and (c) show the velocity
components Vx, Vy and Vz, respectively. The green square represents the results calculated by whole
tower simulation, and the red asterisk represents the results obtained from the interpolated velocity
profile used for spray simulation. The magnitude of the total velocity is shown in Figure 5-5(d).
To demonstrate the effectiveness of the aforementioned two-step strategy, the air flows modelled in
the large (Figure 5-2(a)) and small (Figure 5-2(c)) domains are compared. The air velocity distribution
at the inlet surface (the lower part (H≤5m) of the lateral surface of the partial cylinder with the radius
of 6.2625m) computed by these two models are shown in Figure 5-5(d). The velocity magnitudes
(√𝑣𝑖2 + 𝑣𝑗
2 + 𝑣𝑘2) at different heights, were obtained from tower simulation and the interpolated velocity
profile for the spray cooling calculation. Figure 5-5(c) and (d), shows the good agreement between
tower simulated velocity distribution and the interpolated velocity profile for spray calculation. The
magnitudes of velocity from simulation and interpolation are almost the same, indicating that the
velocity field has been well-represented via the velocity interpolations. To ensure that the directions
of velocity are also inherited from the simulated results, the decomposed velocities in X, Y and Z
directions were also compared for their influence on droplet movement cannot be negligible. Figure
5-6 illustrates the consistency of velocity components (Vx, Vy and Vz) between the tower simulated
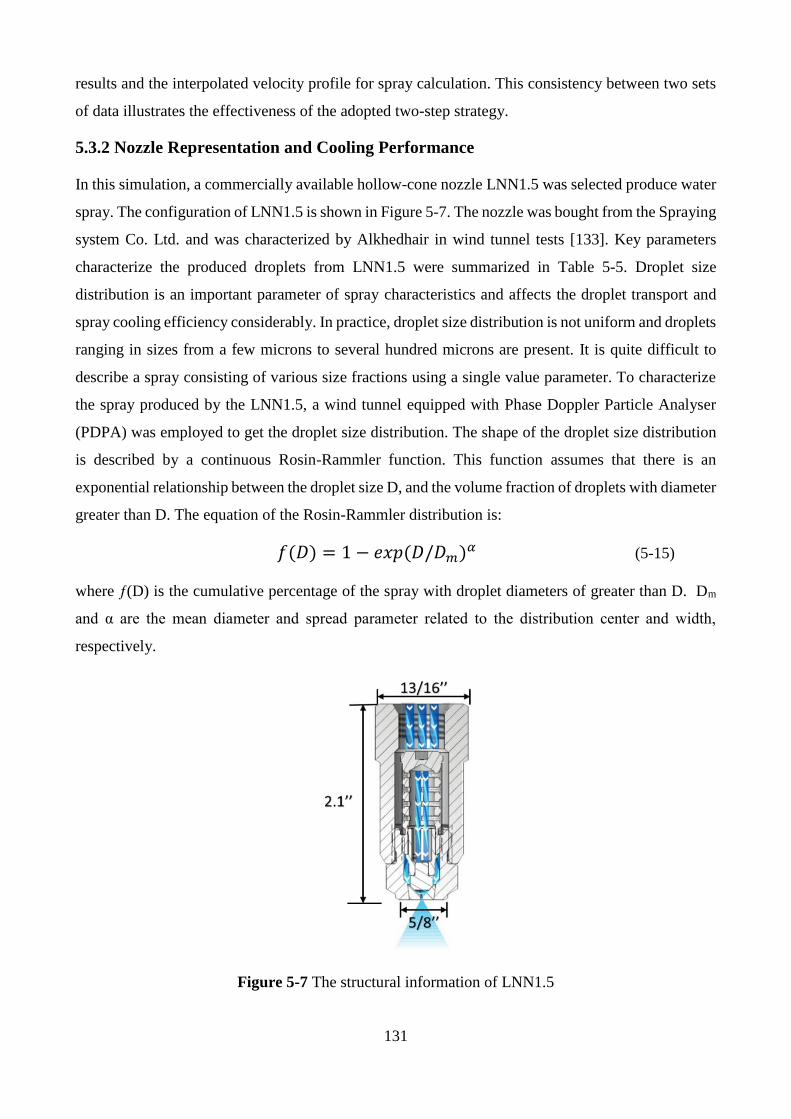
131
results and the interpolated velocity profile for spray calculation. This consistency between two sets
of data illustrates the effectiveness of the adopted two-step strategy.
5.3.2 Nozzle Representation and Cooling Performance
In this simulation, a commercially available hollow-cone nozzle LNN1.5 was selected produce water
spray. The configuration of LNN1.5 is shown in Figure 5-7. The nozzle was bought from the Spraying
system Co. Ltd. and was characterized by Alkhedhair in wind tunnel tests [133]. Key parameters
characterize the produced droplets from LNN1.5 were summarized in Table 5-5. Droplet size
distribution is an important parameter of spray characteristics and affects the droplet transport and
spray cooling efficiency considerably. In practice, droplet size distribution is not uniform and droplets
ranging in sizes from a few microns to several hundred microns are present. It is quite difficult to
describe a spray consisting of various size fractions using a single value parameter. To characterize
the spray produced by the LNN1.5, a wind tunnel equipped with Phase Doppler Particle Analyser
(PDPA) was employed to get the droplet size distribution. The shape of the droplet size distribution
is described by a continuous Rosin-Rammler function. This function assumes that there is an
exponential relationship between the droplet size D, and the volume fraction of droplets with diameter
greater than D. The equation of the Rosin-Rammler distribution is:
𝑓(𝐷) = 1 − 𝑒𝑥𝑝(𝐷/𝐷𝑚)𝛼 (5-15)
where ƒ(D) is the cumulative percentage of the spray with droplet diameters of greater than D. Dm
and α are the mean diameter and spread parameter related to the distribution center and width,
respectively.
Figure 5-7 The structural information of LNN1.5
132
Table 5-5 Nozzle specifications for LNN1.5
Nozzle Manufacturer Orifice
diameter
Max pressure
Max flow
rate
D32
Dv90
LNN1.5 Spraying system Co. Ltd. 0.508 mm 7 MPa 0.0086 kg/s 35 µm 90 µm
The experimental results and the fitting curve are shown in Figure 5-8. This figure indicates a good
agreement between the measured droplet distribution and the fitting curve predicted by Rosin–
Rammler function. This consistence gives us the confidence to use this function in the FLUENT
simulation. In the CFD simulation, Dm= 63.5µm and α=3.14 were chosen based on the experimental
data. As is illustrated in Figure 5-9, the nozzle LNN1.5 was placed at the middle part of the partial
tower. The specific location of arranged nozzle is determined by the height (H), extend length (L)
and injection direction. The extend length is the horizontal distance measured from the tower
periphery to the location of nozzle. The heat exchanger surface is divided into A1, A2 and A3 parts
in order to make it easier to identify the impact area of nozzle. Thus we can use A1, A2 and A3 to
represent the central, middle and outer part of the radiator surface, making it easier to identify the
impact area of spray nozzle. The surface areas of these three parts have a relationship of A1: A2:
A3=1: 4: 9.
The cooling effect of the spray system is characterized by the mass-weighted average temperature at
the heat exchanger surface. Here the heat exchanger is modelled as a very thin plane. The mass-
weighted average temperature is expressed as:
∫𝜌∅|�� ∙𝑑𝐴 |
𝜌|�� ∙𝑑𝐴 |=
∑ 𝜌𝑙∅𝑙|�� 𝑙∙𝐴𝑖 |𝑛𝑙=1
∑ 𝜌𝑙|�� 𝑙∙𝐴𝑖 |𝑛𝑙=1
(5-16)
Where ∅, 𝜌𝑙 and 𝜈 𝑙 are the averaged quantity, air density and the corresponding local velocity at the
small areas denoted by 𝐴𝑖 .
In addition to the average temperature of the radiator and the corresponding temperature drop, the
evaporation rate is another important parameter to evaluate spray cooling. The more and faster water
evaporation, better cooling performance will be achieved. Hence the careful design of the NDDCT
cooling system should be done to reach full evaporation of water droplets at the bottom of tower, i.e.,
the lower 5m inlet area. The latent heat for water evaporation is provided by the sensible heat from
hot ambient air, thus the larger fraction of evaporated water, the lower the inlet air temperature will
be and the better pre-cooling performance is achieved.
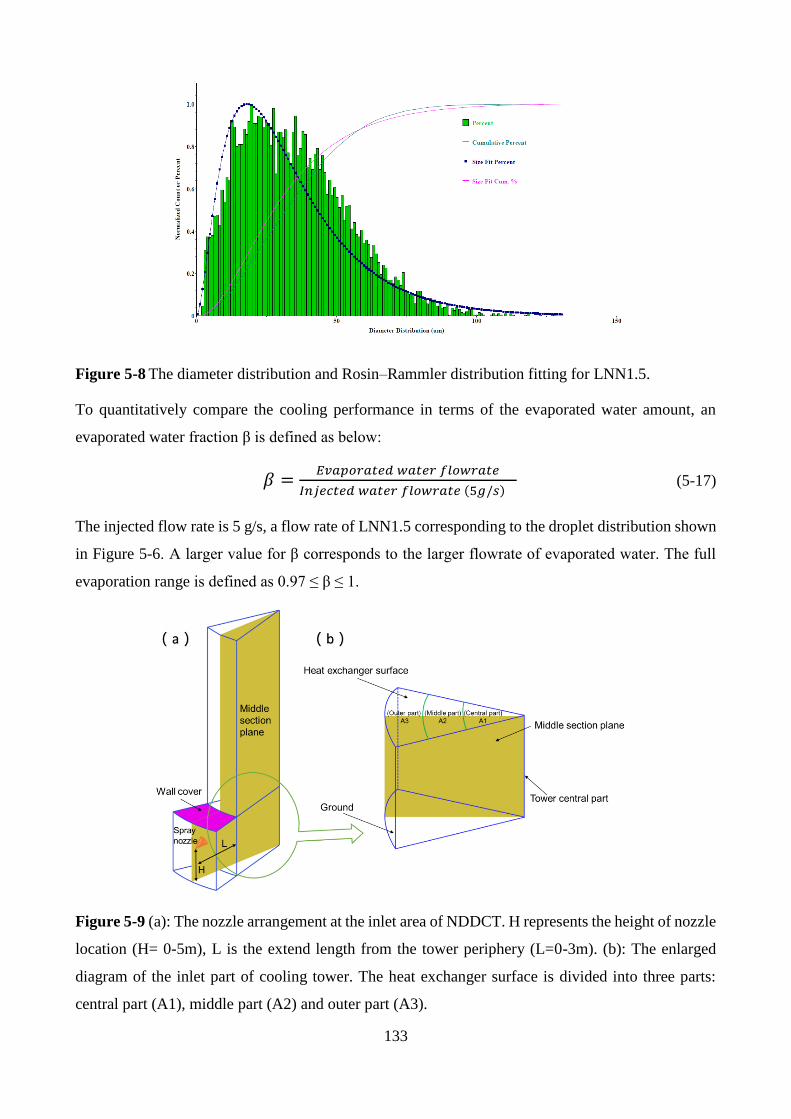
133
Figure 5-8 The diameter distribution and Rosin–Rammler distribution fitting for LNN1.5.
To quantitatively compare the cooling performance in terms of the evaporated water amount, an
evaporated water fraction β is defined as below:
𝛽 =𝐸𝑣𝑎𝑝𝑜𝑟𝑎𝑡𝑒𝑑 𝑤𝑎𝑡𝑒𝑟 𝑓𝑙𝑜𝑤𝑟𝑎𝑡𝑒
𝐼𝑛𝑗𝑒𝑐𝑡𝑒𝑑 𝑤𝑎𝑡𝑒𝑟 𝑓𝑙𝑜𝑤𝑟𝑎𝑡𝑒 (5𝑔/𝑠) (5-17)
The injected flow rate is 5 g/s, a flow rate of LNN1.5 corresponding to the droplet distribution shown
in Figure 5-6. A larger value for β corresponds to the larger flowrate of evaporated water. The full
evaporation range is defined as 0.97 ≤ β ≤ 1.
Figure 5-9 (a): The nozzle arrangement at the inlet area of NDDCT. H represents the height of nozzle
location (H= 0-5m), L is the extend length from the tower periphery (L=0-3m). (b): The enlarged
diagram of the inlet part of cooling tower. The heat exchanger surface is divided into three parts:
central part (A1), middle part (A2) and outer part (A3).
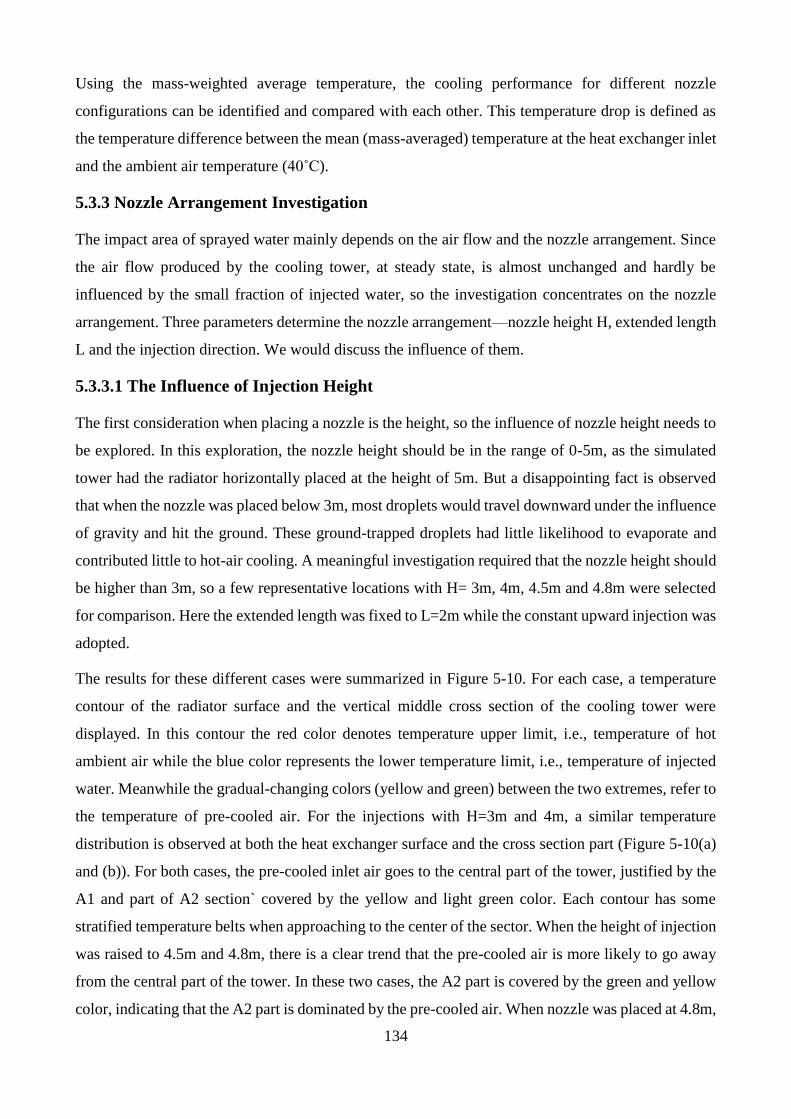
134
Using the mass-weighted average temperature, the cooling performance for different nozzle
configurations can be identified and compared with each other. This temperature drop is defined as
the temperature difference between the mean (mass-averaged) temperature at the heat exchanger inlet
and the ambient air temperature (40˚C).
5.3.3 Nozzle Arrangement Investigation
The impact area of sprayed water mainly depends on the air flow and the nozzle arrangement. Since
the air flow produced by the cooling tower, at steady state, is almost unchanged and hardly be
influenced by the small fraction of injected water, so the investigation concentrates on the nozzle
arrangement. Three parameters determine the nozzle arrangement—nozzle height H, extended length
L and the injection direction. We would discuss the influence of them.
5.3.3.1 The Influence of Injection Height
The first consideration when placing a nozzle is the height, so the influence of nozzle height needs to
be explored. In this exploration, the nozzle height should be in the range of 0-5m, as the simulated
tower had the radiator horizontally placed at the height of 5m. But a disappointing fact is observed
that when the nozzle was placed below 3m, most droplets would travel downward under the influence
of gravity and hit the ground. These ground-trapped droplets had little likelihood to evaporate and
contributed little to hot-air cooling. A meaningful investigation required that the nozzle height should
be higher than 3m, so a few representative locations with H= 3m, 4m, 4.5m and 4.8m were selected
for comparison. Here the extended length was fixed to L=2m while the constant upward injection was
adopted.
The results for these different cases were summarized in Figure 5-10. For each case, a temperature
contour of the radiator surface and the vertical middle cross section of the cooling tower were
displayed. In this contour the red color denotes temperature upper limit, i.e., temperature of hot
ambient air while the blue color represents the lower temperature limit, i.e., temperature of injected
water. Meanwhile the gradual-changing colors (yellow and green) between the two extremes, refer to
the temperature of pre-cooled air. For the injections with H=3m and 4m, a similar temperature
distribution is observed at both the heat exchanger surface and the cross section part (Figure 5-10(a)
and (b)). For both cases, the pre-cooled inlet air goes to the central part of the tower, justified by the
A1 and part of A2 section` covered by the yellow and light green color. Each contour has some
stratified temperature belts when approaching to the center of the sector. When the height of injection
was raised to 4.5m and 4.8m, there is a clear trend that the pre-cooled air is more likely to go away
from the central part of the tower. In these two cases, the A2 part is covered by the green and yellow
color, indicating that the A2 part is dominated by the pre-cooled air. When nozzle was placed at 4.8m,
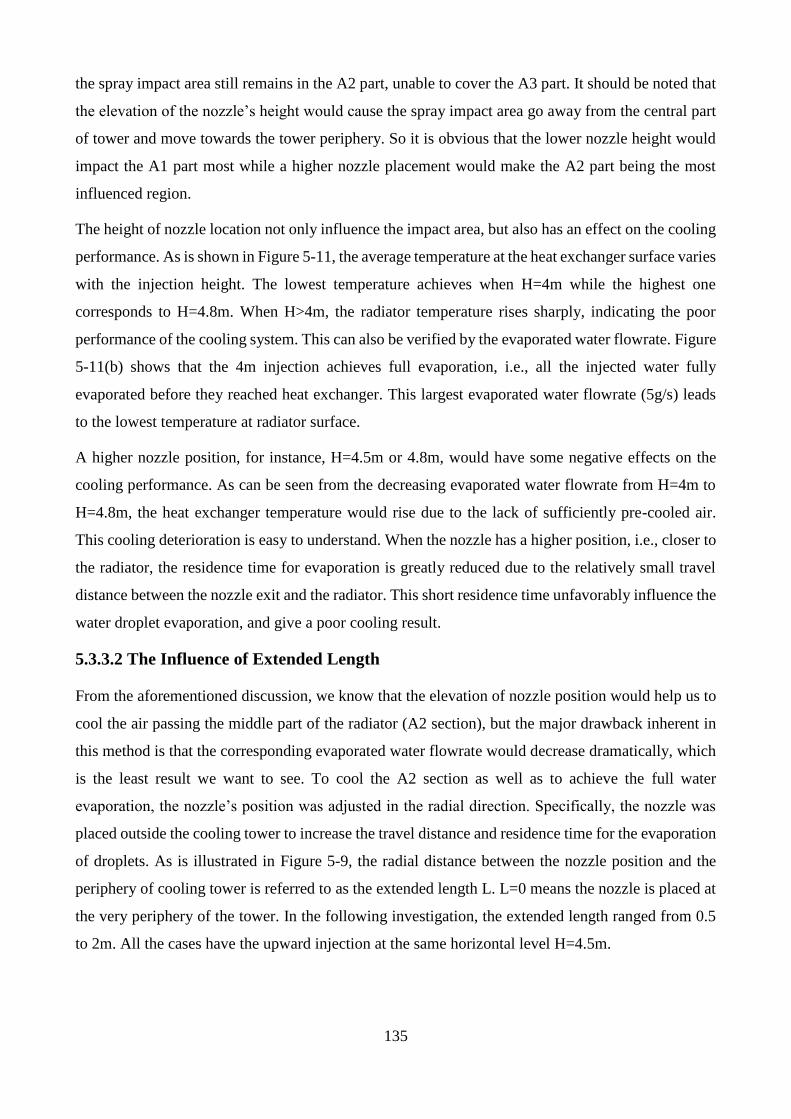
135
the spray impact area still remains in the A2 part, unable to cover the A3 part. It should be noted that
the elevation of the nozzle’s height would cause the spray impact area go away from the central part
of tower and move towards the tower periphery. So it is obvious that the lower nozzle height would
impact the A1 part most while a higher nozzle placement would make the A2 part being the most
influenced region.
The height of nozzle location not only influence the impact area, but also has an effect on the cooling
performance. As is shown in Figure 5-11, the average temperature at the heat exchanger surface varies
with the injection height. The lowest temperature achieves when H=4m while the highest one
corresponds to H=4.8m. When H>4m, the radiator temperature rises sharply, indicating the poor
performance of the cooling system. This can also be verified by the evaporated water flowrate. Figure
5-11(b) shows that the 4m injection achieves full evaporation, i.e., all the injected water fully
evaporated before they reached heat exchanger. This largest evaporated water flowrate (5g/s) leads
to the lowest temperature at radiator surface.
A higher nozzle position, for instance, H=4.5m or 4.8m, would have some negative effects on the
cooling performance. As can be seen from the decreasing evaporated water flowrate from H=4m to
H=4.8m, the heat exchanger temperature would rise due to the lack of sufficiently pre-cooled air.
This cooling deterioration is easy to understand. When the nozzle has a higher position, i.e., closer to
the radiator, the residence time for evaporation is greatly reduced due to the relatively small travel
distance between the nozzle exit and the radiator. This short residence time unfavorably influence the
water droplet evaporation, and give a poor cooling result.
5.3.3.2 The Influence of Extended Length
From the aforementioned discussion, we know that the elevation of nozzle position would help us to
cool the air passing the middle part of the radiator (A2 section), but the major drawback inherent in
this method is that the corresponding evaporated water flowrate would decrease dramatically, which
is the least result we want to see. To cool the A2 section as well as to achieve the full water
evaporation, the nozzle’s position was adjusted in the radial direction. Specifically, the nozzle was
placed outside the cooling tower to increase the travel distance and residence time for the evaporation
of droplets. As is illustrated in Figure 5-9, the radial distance between the nozzle position and the
periphery of cooling tower is referred to as the extended length L. L=0 means the nozzle is placed at
the very periphery of the tower. In the following investigation, the extended length ranged from 0.5
to 2m. All the cases have the upward injection at the same horizontal level H=4.5m.
136
Figure 5-10 Temperature distribution at heat exchanger surface and the vertically middle plane for
upward injections with the same extend length L=2m but different nozzle height H. The green
triangular represents the employed spray nozzle. (a) Injection case with H= 3m; (b) Injection case
with H= 4m; (c) Injection case with H= 4.5m; (d) Injection case with H= 4.8m.
(a)
(b)
Figure 5-11 (a): Spray cooling effect in terms of mass-weighted temperature at the heat exchanger
surface and the temperature drop relative to the ambient temperature. (b): Evaporated water flowrate
and evaporated water fraction for various injections.
The cooling results, as indicated by the temperature distribution, were shown in the Figure 5-12. The
figure shows that the pre-cooled air, under the influence of injected water from the outside-placed
nozzles, mainly impact the A2 section of heat exchanger. The green-dominated circle, an indicator of
0
0.3
0.6
0.9
1.2
1.5
38.5
38.8
39.1
39.4
39.7
40
3m 4m 4.5m 4.8m
Tem
per
atu
re d
rop
(°C
)
Aver
age
tem
per
atu
re (
°C)
Injection Height
0.8
0.84
0.88
0.92
0.96
1
4
4.2
4.4
4.6
4.8
5
3m 4m 4.5m 4.8m
Evap
ora
ted
wat
er f
ract
ion
Evap
ora
ted
wat
er f
low
rate
(g/s
)
Injection Height
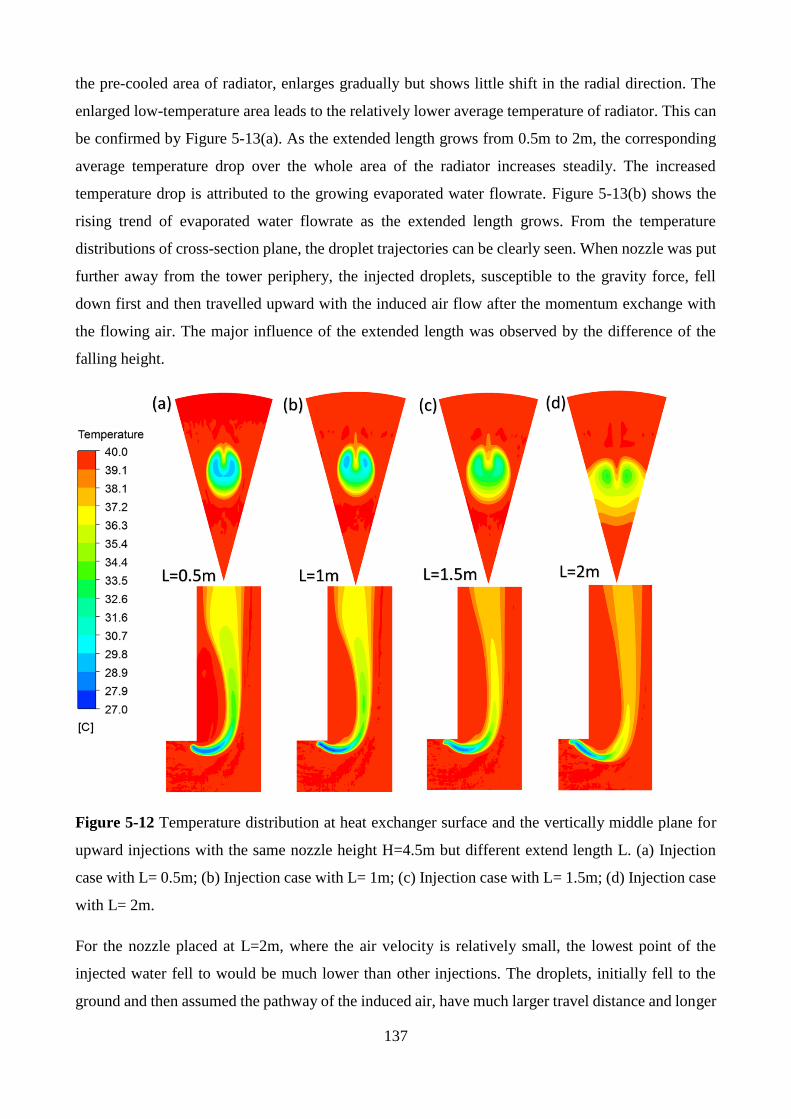
137
the pre-cooled area of radiator, enlarges gradually but shows little shift in the radial direction. The
enlarged low-temperature area leads to the relatively lower average temperature of radiator. This can
be confirmed by Figure 5-13(a). As the extended length grows from 0.5m to 2m, the corresponding
average temperature drop over the whole area of the radiator increases steadily. The increased
temperature drop is attributed to the growing evaporated water flowrate. Figure 5-13(b) shows the
rising trend of evaporated water flowrate as the extended length grows. From the temperature
distributions of cross-section plane, the droplet trajectories can be clearly seen. When nozzle was put
further away from the tower periphery, the injected droplets, susceptible to the gravity force, fell
down first and then travelled upward with the induced air flow after the momentum exchange with
the flowing air. The major influence of the extended length was observed by the difference of the
falling height.
Figure 5-12 Temperature distribution at heat exchanger surface and the vertically middle plane for
upward injections with the same nozzle height H=4.5m but different extend length L. (a) Injection
case with L= 0.5m; (b) Injection case with L= 1m; (c) Injection case with L= 1.5m; (d) Injection case
with L= 2m.
For the nozzle placed at L=2m, where the air velocity is relatively small, the lowest point of the
injected water fell to would be much lower than other injections. The droplets, initially fell to the
ground and then assumed the pathway of the induced air, have much larger travel distance and longer
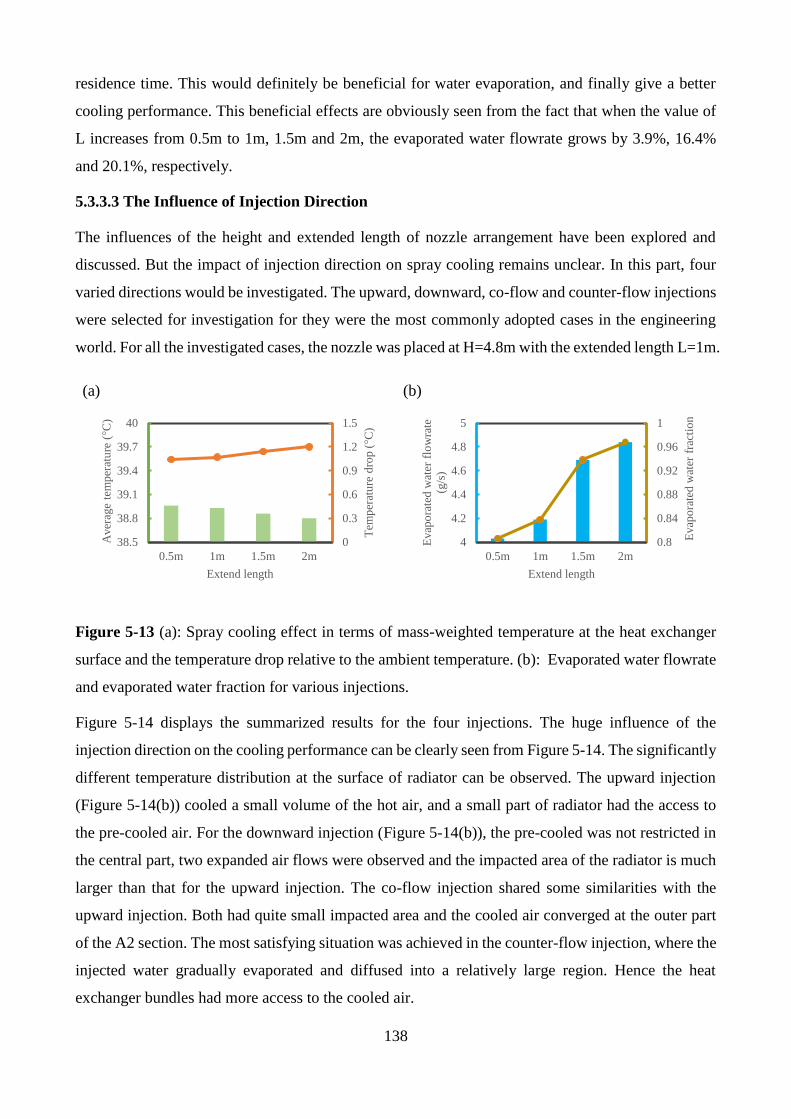
138
residence time. This would definitely be beneficial for water evaporation, and finally give a better
cooling performance. This beneficial effects are obviously seen from the fact that when the value of
L increases from 0.5m to 1m, 1.5m and 2m, the evaporated water flowrate grows by 3.9%, 16.4%
and 20.1%, respectively.
5.3.3.3 The Influence of Injection Direction
The influences of the height and extended length of nozzle arrangement have been explored and
discussed. But the impact of injection direction on spray cooling remains unclear. In this part, four
varied directions would be investigated. The upward, downward, co-flow and counter-flow injections
were selected for investigation for they were the most commonly adopted cases in the engineering
world. For all the investigated cases, the nozzle was placed at H=4.8m with the extended length L=1m.
(a)
(b)
Figure 5-13 (a): Spray cooling effect in terms of mass-weighted temperature at the heat exchanger
surface and the temperature drop relative to the ambient temperature. (b): Evaporated water flowrate
and evaporated water fraction for various injections.
Figure 5-14 displays the summarized results for the four injections. The huge influence of the
injection direction on the cooling performance can be clearly seen from Figure 5-14. The significantly
different temperature distribution at the surface of radiator can be observed. The upward injection
(Figure 5-14(b)) cooled a small volume of the hot air, and a small part of radiator had the access to
the pre-cooled air. For the downward injection (Figure 5-14(b)), the pre-cooled was not restricted in
the central part, two expanded air flows were observed and the impacted area of the radiator is much
larger than that for the upward injection. The co-flow injection shared some similarities with the
upward injection. Both had quite small impacted area and the cooled air converged at the outer part
of the A2 section. The most satisfying situation was achieved in the counter-flow injection, where the
injected water gradually evaporated and diffused into a relatively large region. Hence the heat
exchanger bundles had more access to the cooled air.
0
0.3
0.6
0.9
1.2
1.5
38.5
38.8
39.1
39.4
39.7
40
0.5m 1m 1.5m 2m
Tem
per
atu
re d
rop
(°C
)
Aver
age
tem
per
atu
re (
°C)
Extend length
0.8
0.84
0.88
0.92
0.96
1
4
4.2
4.4
4.6
4.8
5
0.5m 1m 1.5m 2m
Evap
ora
ted
wat
er f
ract
ion
Evap
ora
ted
wat
er f
low
rate
(g/s
)
Extend length
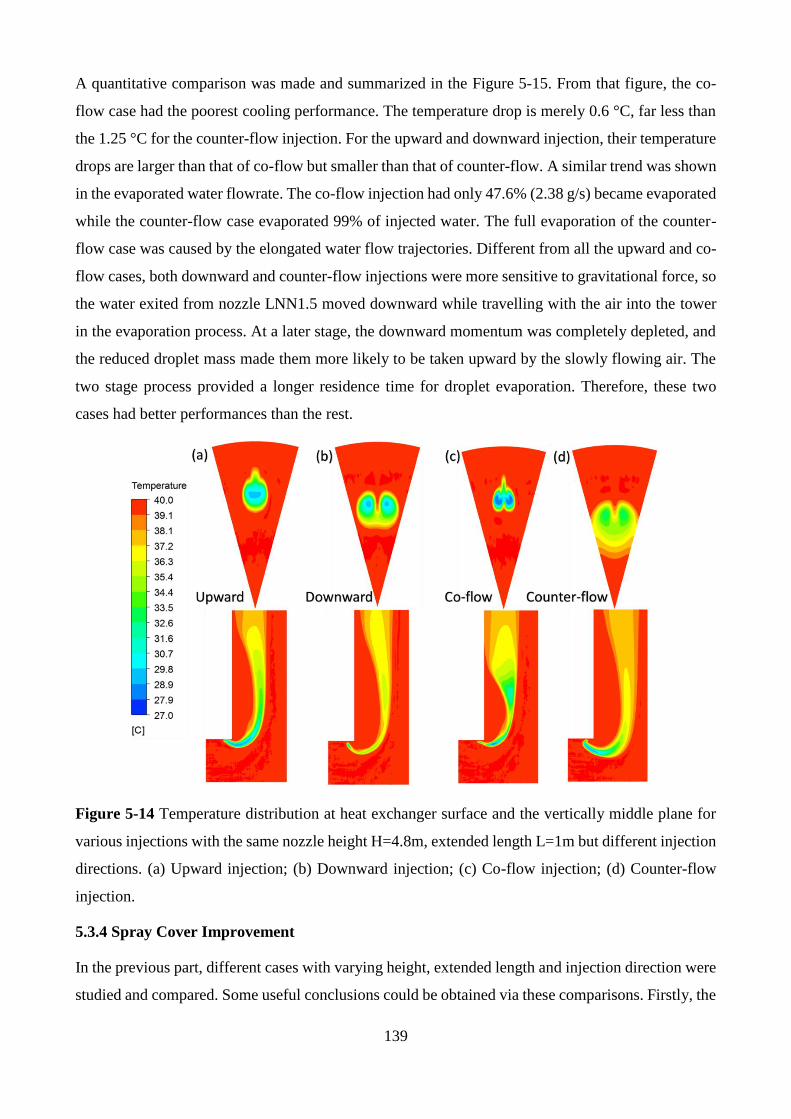
139
A quantitative comparison was made and summarized in the Figure 5-15. From that figure, the co-
flow case had the poorest cooling performance. The temperature drop is merely 0.6 °C, far less than
the 1.25 °C for the counter-flow injection. For the upward and downward injection, their temperature
drops are larger than that of co-flow but smaller than that of counter-flow. A similar trend was shown
in the evaporated water flowrate. The co-flow injection had only 47.6% (2.38 g/s) became evaporated
while the counter-flow case evaporated 99% of injected water. The full evaporation of the counter-
flow case was caused by the elongated water flow trajectories. Different from all the upward and co-
flow cases, both downward and counter-flow injections were more sensitive to gravitational force, so
the water exited from nozzle LNN1.5 moved downward while travelling with the air into the tower
in the evaporation process. At a later stage, the downward momentum was completely depleted, and
the reduced droplet mass made them more likely to be taken upward by the slowly flowing air. The
two stage process provided a longer residence time for droplet evaporation. Therefore, these two
cases had better performances than the rest.
Figure 5-14 Temperature distribution at heat exchanger surface and the vertically middle plane for
various injections with the same nozzle height H=4.8m, extended length L=1m but different injection
directions. (a) Upward injection; (b) Downward injection; (c) Co-flow injection; (d) Counter-flow
injection.
5.3.4 Spray Cover Improvement
In the previous part, different cases with varying height, extended length and injection direction were
studied and compared. Some useful conclusions could be obtained via these comparisons. Firstly, the
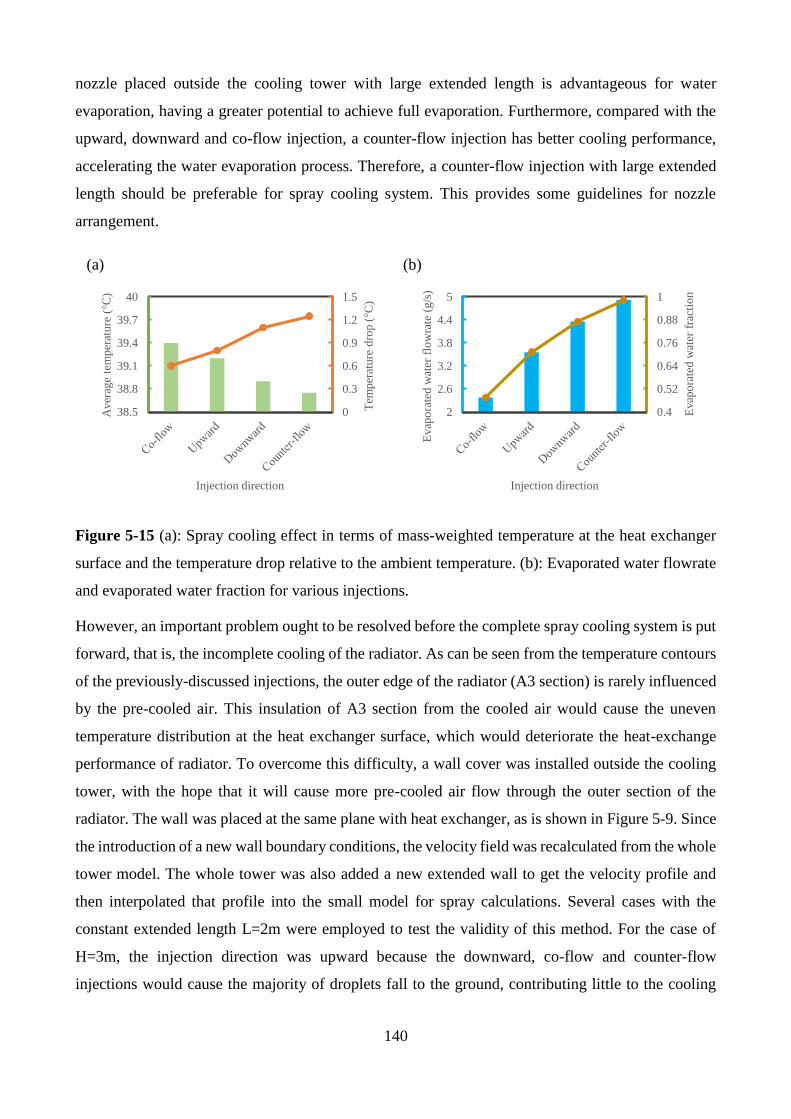
140
nozzle placed outside the cooling tower with large extended length is advantageous for water
evaporation, having a greater potential to achieve full evaporation. Furthermore, compared with the
upward, downward and co-flow injection, a counter-flow injection has better cooling performance,
accelerating the water evaporation process. Therefore, a counter-flow injection with large extended
length should be preferable for spray cooling system. This provides some guidelines for nozzle
arrangement.
(a)
(b)
Figure 5-15 (a): Spray cooling effect in terms of mass-weighted temperature at the heat exchanger
surface and the temperature drop relative to the ambient temperature. (b): Evaporated water flowrate
and evaporated water fraction for various injections.
However, an important problem ought to be resolved before the complete spray cooling system is put
forward, that is, the incomplete cooling of the radiator. As can be seen from the temperature contours
of the previously-discussed injections, the outer edge of the radiator (A3 section) is rarely influenced
by the pre-cooled air. This insulation of A3 section from the cooled air would cause the uneven
temperature distribution at the heat exchanger surface, which would deteriorate the heat-exchange
performance of radiator. To overcome this difficulty, a wall cover was installed outside the cooling
tower, with the hope that it will cause more pre-cooled air flow through the outer section of the
radiator. The wall was placed at the same plane with heat exchanger, as is shown in Figure 5-9. Since
the introduction of a new wall boundary conditions, the velocity field was recalculated from the whole
tower model. The whole tower was also added a new extended wall to get the velocity profile and
then interpolated that profile into the small model for spray calculations. Several cases with the
constant extended length L=2m were employed to test the validity of this method. For the case of
H=3m, the injection direction was upward because the downward, co-flow and counter-flow
injections would cause the majority of droplets fall to the ground, contributing little to the cooling
0
0.3
0.6
0.9
1.2
1.5
38.5
38.8
39.1
39.4
39.7
40
Tem
per
atu
re d
rop
(°C
)
Aver
age
tem
per
atu
re (
°C)
Injection direction
0.4
0.52
0.64
0.76
0.88
1
2
2.6
3.2
3.8
4.4
5
Evap
ora
ted
wat
er f
ract
ion
Evap
ora
ted
wat
er f
low
rate
(g/s
)
Injection direction
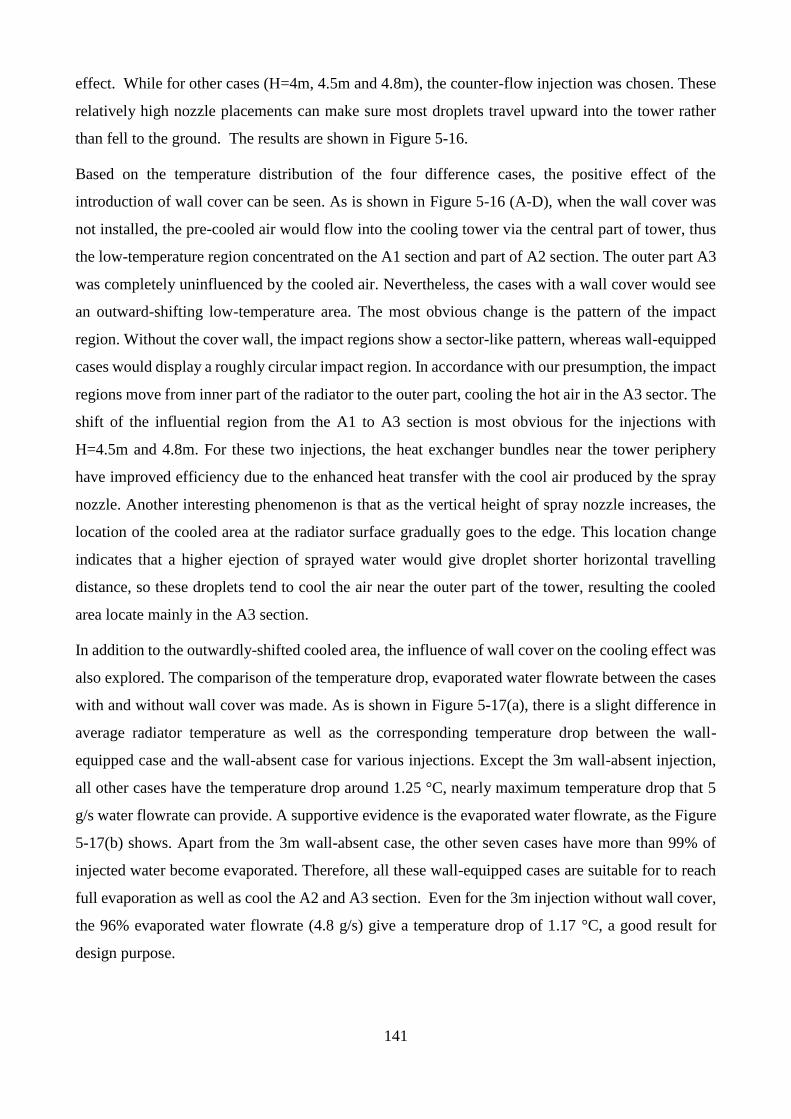
141
effect. While for other cases (H=4m, 4.5m and 4.8m), the counter-flow injection was chosen. These
relatively high nozzle placements can make sure most droplets travel upward into the tower rather
than fell to the ground. The results are shown in Figure 5-16.
Based on the temperature distribution of the four difference cases, the positive effect of the
introduction of wall cover can be seen. As is shown in Figure 5-16 (A-D), when the wall cover was
not installed, the pre-cooled air would flow into the cooling tower via the central part of tower, thus
the low-temperature region concentrated on the A1 section and part of A2 section. The outer part A3
was completely uninfluenced by the cooled air. Nevertheless, the cases with a wall cover would see
an outward-shifting low-temperature area. The most obvious change is the pattern of the impact
region. Without the cover wall, the impact regions show a sector-like pattern, whereas wall-equipped
cases would display a roughly circular impact region. In accordance with our presumption, the impact
regions move from inner part of the radiator to the outer part, cooling the hot air in the A3 sector. The
shift of the influential region from the A1 to A3 section is most obvious for the injections with
H=4.5m and 4.8m. For these two injections, the heat exchanger bundles near the tower periphery
have improved efficiency due to the enhanced heat transfer with the cool air produced by the spray
nozzle. Another interesting phenomenon is that as the vertical height of spray nozzle increases, the
location of the cooled area at the radiator surface gradually goes to the edge. This location change
indicates that a higher ejection of sprayed water would give droplet shorter horizontal travelling
distance, so these droplets tend to cool the air near the outer part of the tower, resulting the cooled
area locate mainly in the A3 section.
In addition to the outwardly-shifted cooled area, the influence of wall cover on the cooling effect was
also explored. The comparison of the temperature drop, evaporated water flowrate between the cases
with and without wall cover was made. As is shown in Figure 5-17(a), there is a slight difference in
average radiator temperature as well as the corresponding temperature drop between the wall-
equipped case and the wall-absent case for various injections. Except the 3m wall-absent injection,
all other cases have the temperature drop around 1.25 °C, nearly maximum temperature drop that 5
g/s water flowrate can provide. A supportive evidence is the evaporated water flowrate, as the Figure
5-17(b) shows. Apart from the 3m wall-absent case, the other seven cases have more than 99% of
injected water become evaporated. Therefore, all these wall-equipped cases are suitable for to reach
full evaporation as well as cool the A2 and A3 section. Even for the 3m injection without wall cover,
the 96% evaporated water flowrate (4.8 g/s) give a temperature drop of 1.17 °C, a good result for
design purpose.
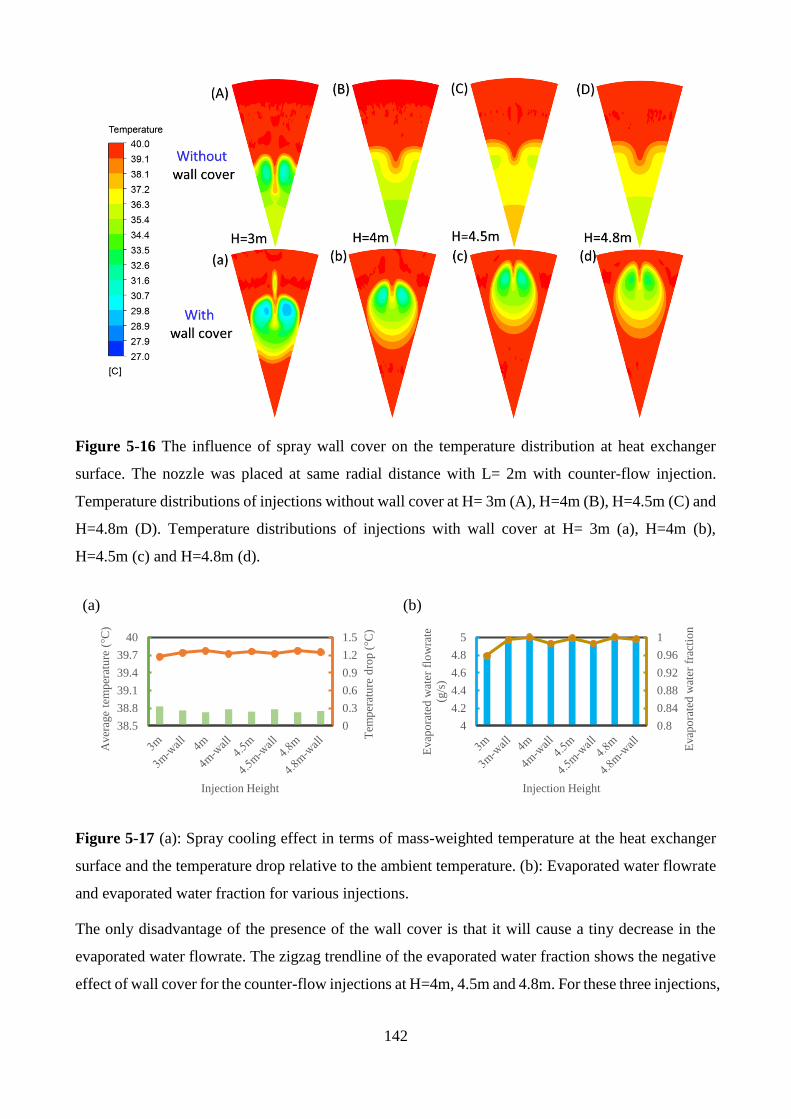
142
Figure 5-16 The influence of spray wall cover on the temperature distribution at heat exchanger
surface. The nozzle was placed at same radial distance with L= 2m with counter-flow injection.
Temperature distributions of injections without wall cover at H= 3m (A), H=4m (B), H=4.5m (C) and
H=4.8m (D). Temperature distributions of injections with wall cover at H= 3m (a), H=4m (b),
H=4.5m (c) and H=4.8m (d).
(a)
(b)
Figure 5-17 (a): Spray cooling effect in terms of mass-weighted temperature at the heat exchanger
surface and the temperature drop relative to the ambient temperature. (b): Evaporated water flowrate
and evaporated water fraction for various injections.
The only disadvantage of the presence of the wall cover is that it will cause a tiny decrease in the
evaporated water flowrate. The zigzag trendline of the evaporated water fraction shows the negative
effect of wall cover for the counter-flow injections at H=4m, 4.5m and 4.8m. For these three injections,
0
0.3
0.6
0.9
1.2
1.5
38.5
38.8
39.1
39.4
39.7
40
Tem
per
atu
re d
rop
(°C
)
Aver
age
tem
per
atu
re (
°C)
Injection Height
0.8
0.84
0.88
0.92
0.96
1
4
4.2
4.4
4.6
4.8
5
Evap
ora
ted
wat
er f
ract
ion
Evap
ora
ted
wat
er f
low
rate
(g/s
)
Injection Height
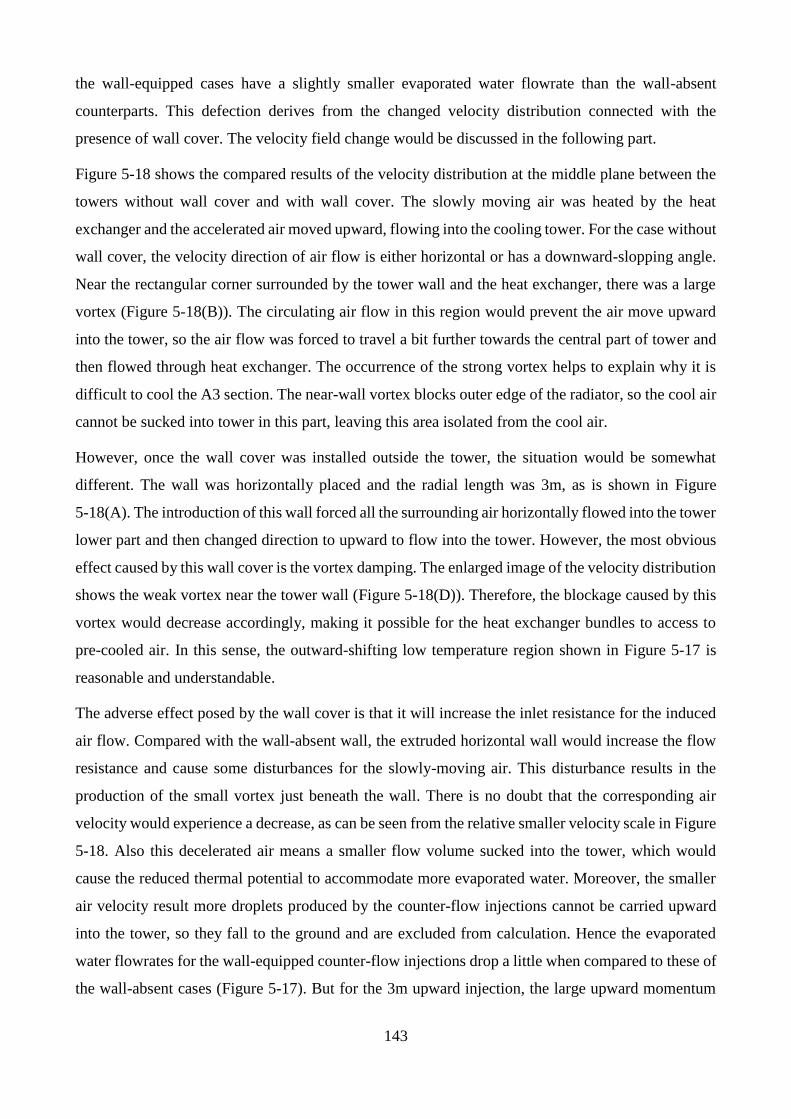
143
the wall-equipped cases have a slightly smaller evaporated water flowrate than the wall-absent
counterparts. This defection derives from the changed velocity distribution connected with the
presence of wall cover. The velocity field change would be discussed in the following part.
Figure 5-18 shows the compared results of the velocity distribution at the middle plane between the
towers without wall cover and with wall cover. The slowly moving air was heated by the heat
exchanger and the accelerated air moved upward, flowing into the cooling tower. For the case without
wall cover, the velocity direction of air flow is either horizontal or has a downward-slopping angle.
Near the rectangular corner surrounded by the tower wall and the heat exchanger, there was a large
vortex (Figure 5-18(B)). The circulating air flow in this region would prevent the air move upward
into the tower, so the air flow was forced to travel a bit further towards the central part of tower and
then flowed through heat exchanger. The occurrence of the strong vortex helps to explain why it is
difficult to cool the A3 section. The near-wall vortex blocks outer edge of the radiator, so the cool air
cannot be sucked into tower in this part, leaving this area isolated from the cool air.
However, once the wall cover was installed outside the tower, the situation would be somewhat
different. The wall was horizontally placed and the radial length was 3m, as is shown in Figure
5-18(A). The introduction of this wall forced all the surrounding air horizontally flowed into the tower
lower part and then changed direction to upward to flow into the tower. However, the most obvious
effect caused by this wall cover is the vortex damping. The enlarged image of the velocity distribution
shows the weak vortex near the tower wall (Figure 5-18(D)). Therefore, the blockage caused by this
vortex would decrease accordingly, making it possible for the heat exchanger bundles to access to
pre-cooled air. In this sense, the outward-shifting low temperature region shown in Figure 5-17 is
reasonable and understandable.
The adverse effect posed by the wall cover is that it will increase the inlet resistance for the induced
air flow. Compared with the wall-absent wall, the extruded horizontal wall would increase the flow
resistance and cause some disturbances for the slowly-moving air. This disturbance results in the
production of the small vortex just beneath the wall. There is no doubt that the corresponding air
velocity would experience a decrease, as can be seen from the relative smaller velocity scale in Figure
5-18. Also this decelerated air means a smaller flow volume sucked into the tower, which would
cause the reduced thermal potential to accommodate more evaporated water. Moreover, the smaller
air velocity result more droplets produced by the counter-flow injections cannot be carried upward
into the tower, so they fall to the ground and are excluded from calculation. Hence the evaporated
water flowrates for the wall-equipped counter-flow injections drop a little when compared to these of
the wall-absent cases (Figure 5-17). But for the 3m upward injection, the large upward momentum
144
can help to mitigate the downward-falling phenomenon, and the smaller air velocity provides longer
residence time for droplet evaporation, therefore the injection with wall shows better performance
than the wall-absent one.
Figure 5-18 Velocity distribution of the vertically middle plane for the cooling tower without wall
cover (A), and with wall cover (C). The enlarged velocity field (inside the blue rectangle) for the
tower without wall cover (B) and with tower wall (D).
145
5.4 Conclusions
In this study, a spray cooling system was put forward to address the problem of deteriorated cooling
performance of natural draft dry cooling tower caused by the hot ambient conditions. The system
introduced a small amount of water to cool the inlet air in the lower part of the tower, i.e., precooled
the hot air before it contacts with the heat exchanger. It has been demonstrated that this pre-cooled
air can improve the performance of NDDCT, increasing the overall efficiency for the whole power
plant. A commercial nozzle LNN1.5 was used in this spray cooling design. The droplet size
distribution, obtained from a wind tunnel test of LNN1.5, was described by the Rosin-Rammler
function in the following calculations. However, the location of the LNN1.5 needed to be carefully
designed to make sure all the injected water reach evaporation before it reached the radiator.
Furthermore, since the radiators consisted of a number of bundles, each of these bundles, ideally,
ought to have the access to the pre-cooled air. Therefore, the necessary to make sure all the parts of
the radiator experience a temperature drop becomes necessary. With these two goals, the nozzle
position was explored at various heights and radial distances as well as varied injection directions.
The final conclusions are:
(1) The injections produced by the lower nozzle placement (H=3m and 4m) tend to cool the air in the
central part of the radiator, i.e., the A1 section and the inner part of A2 section. While injections from
higher nozzle arrangements (H=4.5m and 4.8m) are able to cool the air in the middle part of the
radiator (A2 section). Therefore, a lower nozzle position is responsible for cooling of the central part
of the radiator and a higher nozzle positon for the middle part. But a higher nozzle position (H=4.5m,
4.8m) have negative effects on the evaporated water flowrate.
(2) Nozzles placed outside the cooling tower are capable to cool the middle part of the radiator (A2
section). With the increment of the extended length, the location of low-temperature region at the
radiator has little change. However, the increasing extended length can significantly accelerate the
evaporation process, as indicated by the growing evaporated water flowrate.
(3) The injection direction of a fixed nozzle has a great effect on the cooling performance. The upward
and co-flow injections, only evaporate a small quantity of water due to the limitation of shorter
residence time for evaporation. But for the downward and counter-flow injections, the cooling
performances are much better. Particularly, the counter-flow injection is the optimal choice in terms
of the evaporated water flowrate.
(4) The cooling of the peripheral part of radiator (A3 section) is quite difficult for injections without
wall cover. Fortunately, the introduction of wall cover can resolve this problem, making the pre-
cooled air flow through the A3 section and the low-temperature regions shift outwardly.

146
(5) Despite that the presence of wall cover reduces the air velocity due to the increased resistance, it,
on the other hand, damps the production of vortex caused by the disturbances related to the tower
wall. Meanwhile, the injections with the cover wall all share excellent cooling effect, leading to 99%
of evaporated water become evaporated.
These results demonstrate that the cooling performance of the spray system can be tremendously
enhanced with proper nozzle arrangement. The optimal injections can not only improve the cooling
tower performance but also limit the water usage to a tolerable degree. The general conclusions from
this study provide some guidelines for the spray system design in the engineering world.
147
Chapter 6 Multiple Nozzle Arrangement for the Spray Cooling
System
This chapter is based on the paper published in Applied Thermal Engineering. This chapter presents
a spray cooling system consists of five real nozzle LNN1.5. The advantage of this carefully-designed
system lies in the efficient water usage: more than 96% of the injected water evaporates and this
evaporation extracts substantial heat from hot air, leading to a pre-cooled airflow. Numerical study
has been used to explore the arrangement of spray nozzles to realize the goal of the maximum cooling
outcome with minimum water usage. Furthermore, a dimensionless analysis is presented to correlate
cooling efficiency with influencing factors such as: the ratio of evaporated water mass flowrate to air
mass flowrate, the ratio between wet bulb temperature and ambient temperature and nozzle separation
distance.
148
A study on multi-nozzle arrangement for spray cooling system in natural draft
dry cooling tower
Yubiao Sun, Zhiqiang Guan, Hal Gurgenci, Xiaoxiao Li , Kamel Hooman
Queensland Geothermal Energy Centre of Excellence,
School of Mechanical and Mining Engineering,
The University of Queensland, Brisbane 4072, Australia
Applied Thermal Engineering 124 (2017) 795-814
Abstract:
Natural draft dry cooling tower (NDDCT) technology is especially attractive to power plants built in
arid regions with limited water resource. However, high ambient temperature in summer deteriorates
the performance of built NDDCT. To address this problem, evaporative pre-cooling technology has
been developed by using nozzles to disintegrate water into fine droplets to achieve quick evaporation.
The pre-cooled air flowing through radiator, has an enhanced heat exchange with the hot working
fluid in the tube side. This paper reports a spray cooling system for the experimental tower built in
UQ by combining several nozzle LNN1.5 to cool the inlet air and consequently improve the cooling
efficiency of the NDDCT. To minimize water usage, a careful arrangement of spray nozzles should
be investigated to achieve the maximum cooling outcome. With five nozzles installment, the inlet air
is cooled by 6.3 ºC, corresponding to 51.2% cooling efficiency. A dimensionless analysis is presented
to correlate cooling efficiency with influencing factors. The advantage of this pre-cooling system lies
in the efficient water usage: more than 96% of the injected water extracts substantial heat from hot
air and evaporates into vapor, leading to a pre-cooled airflow.
Keywords:
Natural draft dry cooling tower; full evaporation; spray cooling; multi-nozzle arrangement
6.1 Introduction
For both thermal power plants and air conditioning industry, cooling towers are widely used to cool
circulating water, which serve as a medium to transfer substantial waste heat to the surrounding
environment. The cooling tower performance has a significant impact on the operation and efficiency
149
of the whole power generation system. A defective cooling tower design, failing to provide adequate
cooling for the power generation process, would lead to decreased electricity production and induce
tremendous economic loss. In order to avoid such economic punishment, an effective cooling system
is necessary for power plant normal operations.
In most power plants, mechanical and natural draft cooling towers are commonly used. However, the
high running costs caused by the energy-consumptive motor-driven fans makes mechanical draught
less attractive for many power plants, even though the capital costs are generally higher for natural
draft towers. The wet and dry cooling towers are the two commonly seen natural draft cooling towers.
In wet ones, hot water, in direct contact with air, cools by releasing some heat into the surrounding
air. Theoretically, wet cooling can cool hot water down to atmospheric wet bulb temperature and is
considered as more effective than dry cooling. However, the large quantity of water consumption due
to evaporation, drift and draining losses, requires a continuous water supplement. This huge water
consumption as well as the environmental concerns such as the visible plume and entrainment and
impingement issues make wet cooling tower unsuitable for the regions suffering from water shortage
[192].
In arid areas, dry cooling towers, with the advantages of low water consumption, low maintenance
cost and little parasitic loss, become a good choice for some thermal power plants to release the waste
heat to the atmosphere by cooling down hot fluid to a lower temperature. Unfortunately, the
convective heat transfer mechanism of dry cooling towers makes them inferior to the evaporative wet
cooling towers [27]. More importantly, the performance loss becomes remarkable during high
ambient temperature periods and under strong crosswind conditions [16].
Some researchers had conducted pioneering work to explore the tower performance loss caused by
the crosswind. Wei et al. [46] used both experimental and theoretical methods to study the crosswind
effects on the performance of dry cooling towers. They found that the unfavorable pressure
distribution around tower entrance, the affected tower hot plume and the leading edge separation
induced cool air contributed to reduce the tower cooling performance. Su et al. [47] simulated the
thermal performance of dry tower affected crosswinds, and confirmed the declining thermo-
dynamical effect of crosswinds. Zhao et al. furthered this study by considering the delta layout form
of column radiators. They developed a three-dimensional (3D) numerical model to explore the
cooling performance of a natural draft dry cooling tower with vertical two-pass column radiators
(NDDCTV) [193]. Their conclusion was that the poor cooling performance of NDDCTV caused by
crosswind would lead to a raised water exit temperature. Specifically, the worst scenario occurs at
the 12 m/s crosswind condition, rising the water temperature by 6 °C when compared with the no-
150
crosswind situation. More recently, Zhao et al. updated their research by coupling the ambient air
temperature impacts with the crosswind influence on the performance of NDDCTV [194].
Simplifying the model with an assumption of constant heat load and uniform entry water temperature,
they focused on analyzing the cooling performance of each sector under crosswinds. The deteriorating
performance under crosswinds shows two patterns: for low cross wind velocity, the cooling
performance of NDDCTV deteriorates sharply, while for high cross wind conditions, it experiences
a slight variance.
The decreased heat rejection rate in summer days, as well as the susceptibility to the crosswind,
contributes to the low acceptance of NDDCT [16]. Generally, power plants utilizing dry cooling
technologies can experience a significant 20% net power reduction during high ambient temperature
periods [17]. This is catastrophic for plants based on low temperature resources (e.g. geothermal
plants) where the power output reduction can be as high as 50% in hot summer days [18,19]. What is
worse, this issue is compounded since the reduction goes along with the peak power demand which
means a greater loss for power plant owners with flexible electricity pricing.
Spray cooling provides a solution to overcome the poor tower performance caused by hot ambient
conditions. This technology makes use of a controlled, small quantity of water to cool the inlet air on
hot days. The method, known for its simplicity, low capital cost, and easy operation and maintenance,
has been previously reported and used in other industries [195]. Nozzle, as the core part of the spray
system, is used to break bulk water into fine water droplets and distribute these droplets into the inlet
air (Figure 6-1). The large water-air contact surface area of fine droplets accelerates the evaporation
process. Since the water flowrate is quite small, the air stream motion is barely affected and the
pressure drop caused by the spray can be neglected [6]. The sensible heat of the hot ambient air feeds
the evaporation of water droplets, and then a temperature drop follows. The pre-cooled inlet air
improves the cooling tower performance and consequently increases the thermal efficiency of a power
plant. Consequently, dry cooling towers assisted by the spray cooling contribute to higher power
generation for power plants than that of pure dry-cooling towers.
Inlet air spray cooling technology has been practiced in the fields of food refrigeration [196] and gas
turbine fogging [90,197]. This technology is reportedly in use in more than 1000 gas turbine stations
[198]. Chaker et al. [148,199,200] made a series of studies on the physics and engineering
applications of the fogging process in gas turbines, including droplet measurement methods, droplet
kinetics, and the duct behavior of droplets. Montazeri et al. [132] made use of the Lagrangian–
Eulerian approach to simulate spray cooling produced by a hollow-cone nozzle and concluded that

151
CFD simulation can accurately predict evaporation process.
Figure 6-1 The experimental tower built at UQ and the specifications used for simulation (a and b).
A schematic diagram of inlet air pre-cooling for NDDCT (c).
However, most publications on spray cooling deal with gas turbine fogging application, few efforts
are made on pre-cooling for NDDCT. Since the cooling towers have such a huge difference from gas
turbine in both physical geometry and working principles, the conclusions from previous researches
cannot be applied directly to the cooling system design for cooling tower. To design a proper cooling
system for NDDCT, the investigation of tower-directed spray cooling design ought to be conducted.
Alkhedhair et al. [27] carried out a CFD study to simulate the NDDCT and developed a 3D numerical
model to study the evaporation from a single spray nozzle. The results showed that up to 81%
evaporation can be achieved for water droplets of 20 µm at the air velocity of 1 m/s and droplet
transport and evaporation strongly depend on droplet size and air velocity. Wind tunnel test data
confirmed the enhanced cooling effect at low air velocity and narrow water droplet distributions [133].
Xia et al. [135] furthered Abdullah’s work by studying the pre-cooling performance of a vertically
arranged nozzle (VAN) and a horizontally arranged nozzle (HAN) installed in a wind tunnel. He
found that the VAN configuration has better performance than HAN configuration in the inlet air
velocity range of 0.8-1m/s. Another useful conclusion is that the increased turbulent intensity has a
positive effect on the fully evaporated water flowrate. Sadafi et al. [79,137] used saline water rather
than fresh water for spray cooling. They first performed a theoretical modelling to study the four-
stage saline-water evaporation process, and verified their simulated results against experimental data.
Previously reported studies focused on the arrangement of a single nozzle. But in real situation,
multiple nozzles are generally needed to cool tower inlet air. As far as we know, there are no reports
on configurations of several nozzles for a cooling tower inlet air spray cooling systems. Filling this
gap by studying nozzle arrangement to achieve the maximum cooling effect is necessary and
important. In this study, the numerical study was conducted to get the optimum nozzle locations and
injection directions for multi-nozzle arrangements to provide cooling for the University of
152
Queensland Gatton test tower. A 3D CFD model was first developed to simulate this NDDCT to get
the velocity field. Then this velocity field was used for spray cooling calculations. The relationship
between the number of hollow-cone nozzle LNN1.5 and the pre-cooling effect were unveiled. The
temperature distributions at the heat exchanger surface corresponding to various nozzle
configurations were also displayed.
6.2 Numerical Method
A water spray involves two-phase flow interaction and experiences heat, mass and momentum
transfer when injected into air. This complex two-phase phenomenon makes experimental analysis
costly and challenging. Fortunately, CFD provides a simple way to analyse spray cooling. For
instance, it allows researchers to control the boundary conditions and physical parameters of the two-
phase flow independently, which is almost impossible for experimental investigation. In our study,
ANSYS FLUENT (version 16.2) was selected as the CFD tool to explore spray cooling options for
the inlet air flowing through an NDDCT. Eulerian-Lagrangian methods are generally used to explore
the interaction between the droplets (discrete phase) and the continuous phase (air). According to
Elgobashi [201], there are two approaches to model the transport of water droplets in a turbulent air
flow. The first one is the “one way coupling” where the influence of air on the droplets is considered
while the air properties are not impacted by the existence of droplets. The second one is the “two-
way coupling” where the influence of the droplets on the airflow characteristics is large enough to
affect the airflow. Therefore, modification to the airflow field governing equations is necessary to
take into account the two-phase coupling. A more complicated case emerges when the droplet-droplet
interaction has to be considered, i.e. “four way coupling” to include the momentum exchange of
droplets [91]. The different coupling mechanisms are closely related to the volume fraction of discrete
phase. The volume fraction is an indication of whether the spray is dilute or dense. For extremely
dilute mixtures, one-way coupling can be considered and for dilute ones, the two-way coupling should
be used. The four-way coupling, generally speaking, is only used together with the two-way coupling
for dense ones [91]. In this study, the volume fraction of spray is low (less than 10%) and the influence
of droplets on the airflow was taken into account by using the two-way coupling approach [163]. The
coupling influence is quantified by means of an iterative process as illustrated in the flow chart (),
based on the concept of Crowe [203].
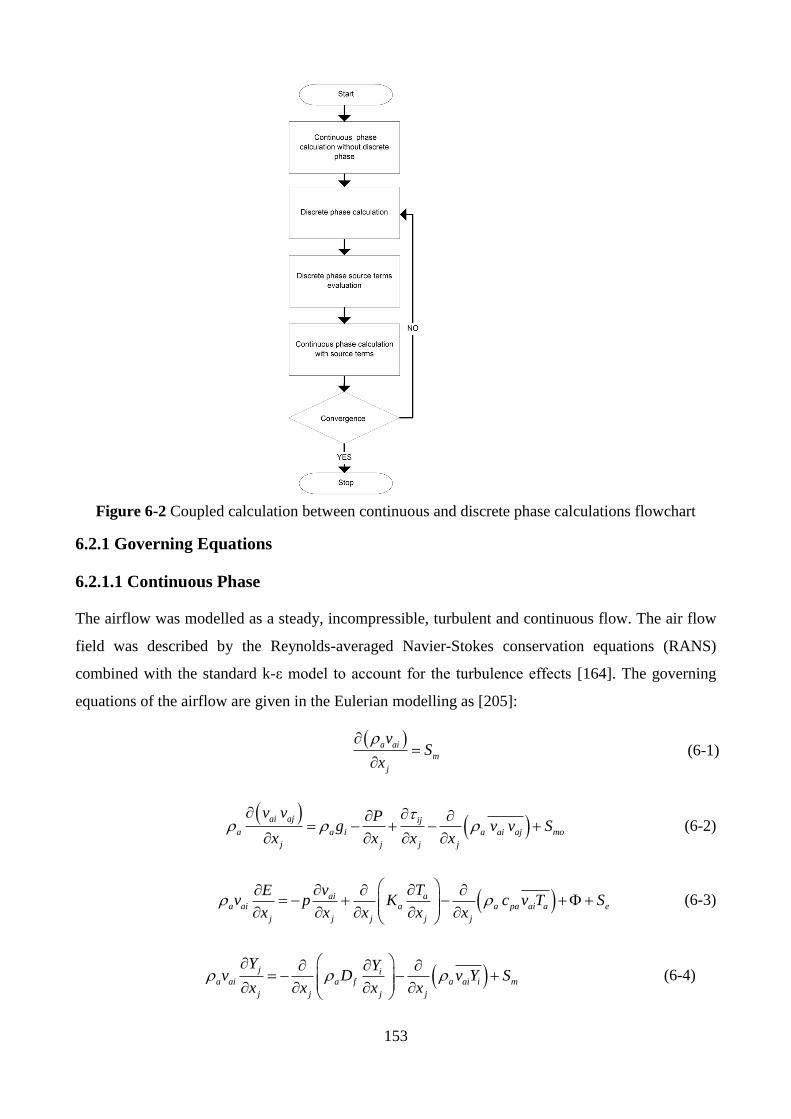
153
Figure 6-2 Coupled calculation between continuous and discrete phase calculations flowchart
6.2.1 Governing Equations
6.2.1.1 Continuous Phase
The airflow was modelled as a steady, incompressible, turbulent and continuous flow. The air flow
field was described by the Reynolds-averaged Navier-Stokes conservation equations (RANS)
combined with the standard k-ε model to account for the turbulence effects [164]. The governing
equations of the airflow are given in the Eulerian modelling as [205]:
( )a ai
m
j
vS
x
=
(6-1)
( )
( )ai aj ij
a a i a ai aj mo
j j j j
v v Pg v v S
x x x x
= − + − +
(6-2)
( )ai aa ai a a pa ai a e
j j j j j
v TEv p K c v T S
x x x x x
= − + − ++
(6-3)
( )j ia ai a a ai i m
j j
f
j j
Y Yv v Y S
x x xD
x
= − − +
(6-4)
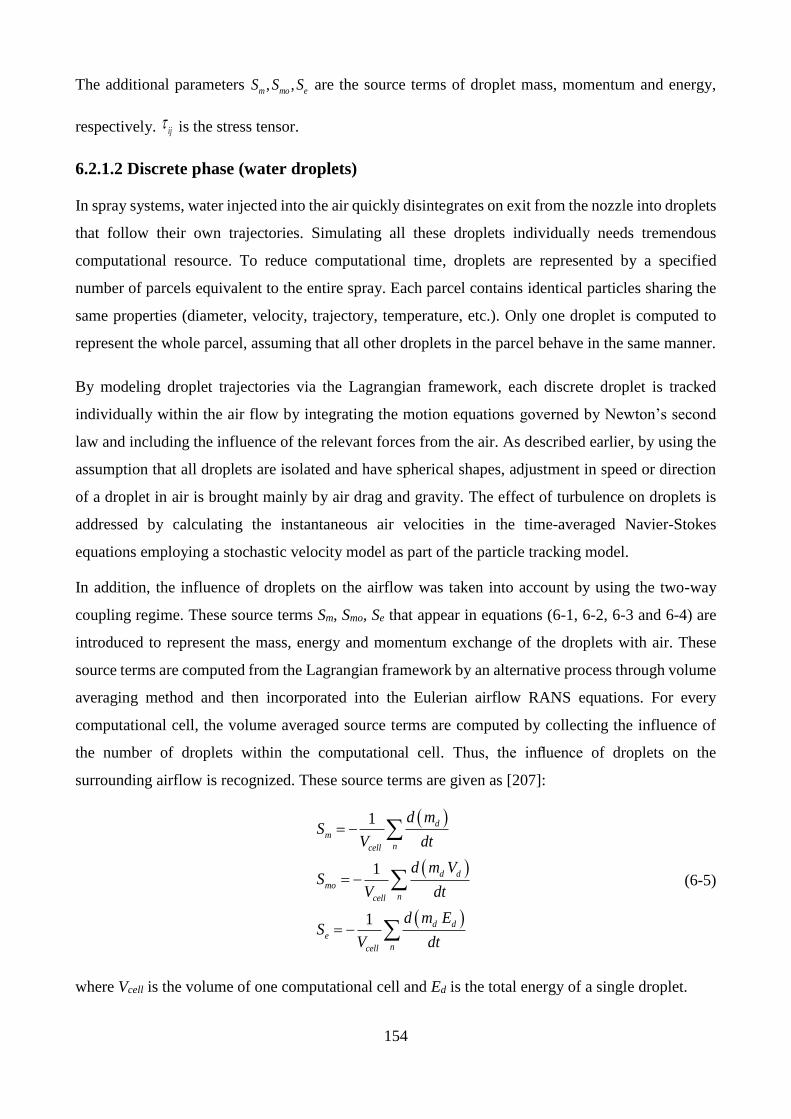
154
The additional parameters , ,m mo eS S S are the source terms of droplet mass, momentum and energy,
respectively. ij is the stress tensor.
6.2.1.2 Discrete phase (water droplets)
In spray systems, water injected into the air quickly disintegrates on exit from the nozzle into droplets
that follow their own trajectories. Simulating all these droplets individually needs tremendous
computational resource. To reduce computational time, droplets are represented by a specified
number of parcels equivalent to the entire spray. Each parcel contains identical particles sharing the
same properties (diameter, velocity, trajectory, temperature, etc.). Only one droplet is computed to
represent the whole parcel, assuming that all other droplets in the parcel behave in the same manner.
By modeling droplet trajectories via the Lagrangian framework, each discrete droplet is tracked
individually within the air flow by integrating the motion equations governed by Newton’s second
law and including the influence of the relevant forces from the air. As described earlier, by using the
assumption that all droplets are isolated and have spherical shapes, adjustment in speed or direction
of a droplet in air is brought mainly by air drag and gravity. The effect of turbulence on droplets is
addressed by calculating the instantaneous air velocities in the time-averaged Navier-Stokes
equations employing a stochastic velocity model as part of the particle tracking model.
In addition, the influence of droplets on the airflow was taken into account by using the two-way
coupling regime. These source terms Sm, Smo, Se that appear in equations (6-1, 6-2, 6-3 and 6-4) are
introduced to represent the mass, energy and momentum exchange of the droplets with air. These
source terms are computed from the Lagrangian framework by an alternative process through volume
averaging method and then incorporated into the Eulerian airflow RANS equations. For every
computational cell, the volume averaged source terms are computed by collecting the influence of
the number of droplets within the computational cell. Thus, the influence of droplets on the
surrounding airflow is recognized. These source terms are given as [207]:
( )
( )
( )
1
1
1
m
ncell
d
mo
ncell
e
ncell
d
d
d d
d m
dt
d m
dt
d m E
d
SV
V
SV t
SV
= −
= −
= −
(6-5)
where Vcell is the volume of one computational cell and Ed is the total energy of a single droplet.
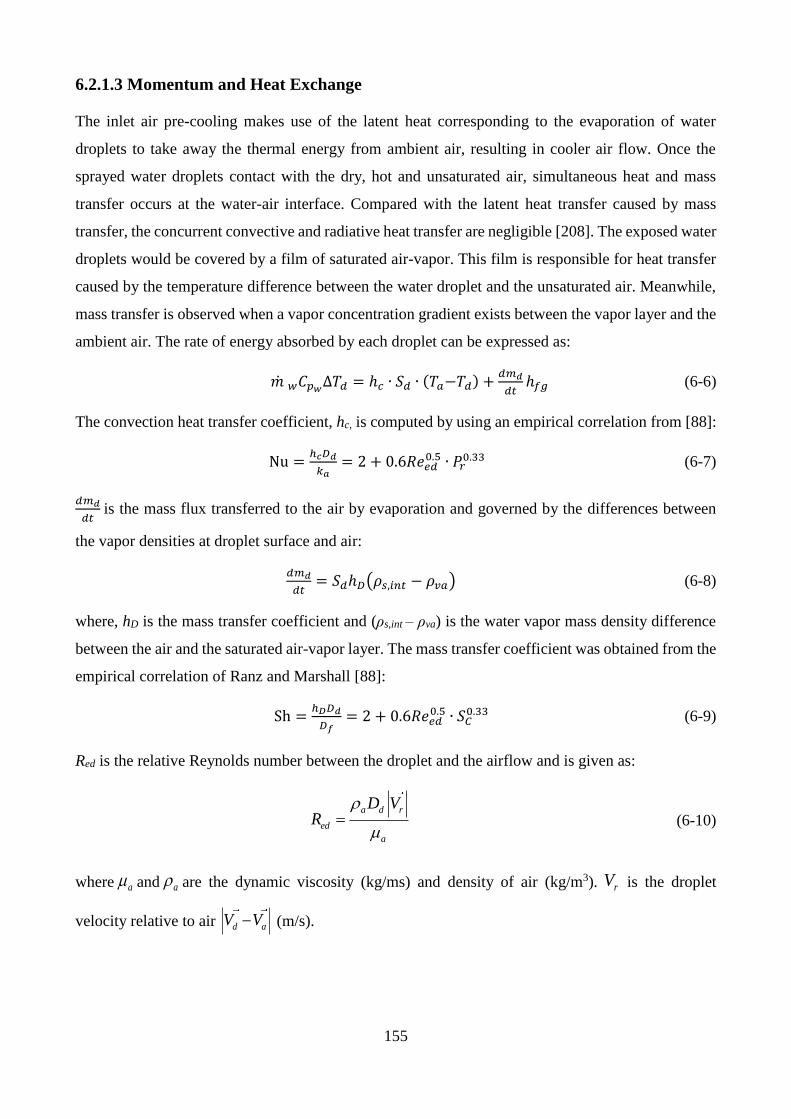
155
6.2.1.3 Momentum and Heat Exchange
The inlet air pre-cooling makes use of the latent heat corresponding to the evaporation of water
droplets to take away the thermal energy from ambient air, resulting in cooler air flow. Once the
sprayed water droplets contact with the dry, hot and unsaturated air, simultaneous heat and mass
transfer occurs at the water-air interface. Compared with the latent heat transfer caused by mass
transfer, the concurrent convective and radiative heat transfer are negligible [208]. The exposed water
droplets would be covered by a film of saturated air-vapor. This film is responsible for heat transfer
caused by the temperature difference between the water droplet and the unsaturated air. Meanwhile,
mass transfer is observed when a vapor concentration gradient exists between the vapor layer and the
ambient air. The rate of energy absorbed by each droplet can be expressed as:
�� 𝑤𝐶𝑝𝑤∆𝑇𝑑 = ℎ𝑐 ∙ 𝑆𝑑 ∙ (𝑇𝑎−𝑇𝑑) +
𝑑𝑚𝑑
𝑑𝑡ℎ𝑓𝑔 (6-6)
The convection heat transfer coefficient, hc, is computed by using an empirical correlation from [88]:
Nu =ℎ𝑐𝐷𝑑
𝑘𝑎= 2 + 0.6𝑅𝑒𝑒𝑑
0.5 ∙ 𝑃𝑟0.33 (6-7)
𝑑𝑚𝑑
𝑑𝑡 is the mass flux transferred to the air by evaporation and governed by the differences between
the vapor densities at droplet surface and air:
𝑑𝑚𝑑
𝑑𝑡= 𝑆𝑑ℎ𝐷(𝜌𝑠,𝑖𝑛𝑡 − 𝜌𝑣𝑎) (6-8)
where, hD is the mass transfer coefficient and (ρs,int – ρva) is the water vapor mass density difference
between the air and the saturated air-vapor layer. The mass transfer coefficient was obtained from the
empirical correlation of Ranz and Marshall [88]:
Sh =ℎ𝐷𝐷𝑑
𝐷𝑓= 2 + 0.6𝑅𝑒𝑒𝑑
0.5 ∙ 𝑆𝐶0.33 (6-9)
Red is the relative Reynolds number between the droplet and the airflow and is given as:
a d r
ed
a
D VR
= (6-10)
where a and a are the dynamic viscosity (kg/ms) and density of air (kg/m3). rV is the droplet
velocity relative to air d aV V− (m/s).
156
Sc is the the Schmidt number and written as:
ac
a f
SD
= (6-11)
Pr is the Prandtl number and is defined as:
aa p
r
a
CP
K
= (6-12)
6.2.1.4 Droplet trajectory
The droplet trajectory can be determined by obtaining droplet velocity and consequently the droplet
position.
( )d
d
d XV
dt= (6-13)
where dV is the droplet velocity (m/s); and dX is the droplet position (m).
Newton’s second law of motion was used to predict the velocity of an evaporating spherical droplet
moving in a continuous airflow. The two-way coupling of air and droplet contribute to the heat and
mass exchange with air. The motion equation of a single droplet can be written as:
( )d d
D g
d m VF F
dt= + (6-14)
Figure 6-3 shows the forces exerted on a single spherical droplet. The forces acting on the single
droplet include gravity force and drag force, which affect droplet trajectory when moving into air.
The gravity force is expressed as:
3 6
g d d wF m g D g
= = (6-15)
Where gF is the gravity force (N), and g is the gravitational acceleration (9.81 m/s2).
The drag force acts in the direction opposite to the relative velocity between the droplet and airflow.
This resistant drag force depends on the droplet shape and size, the relative velocity of the droplet
with respect to the air and the viscosity and density of the air [93]. All these influencing factors are
accounted for in the drag coefficient. For a spherical drop, the drag force is
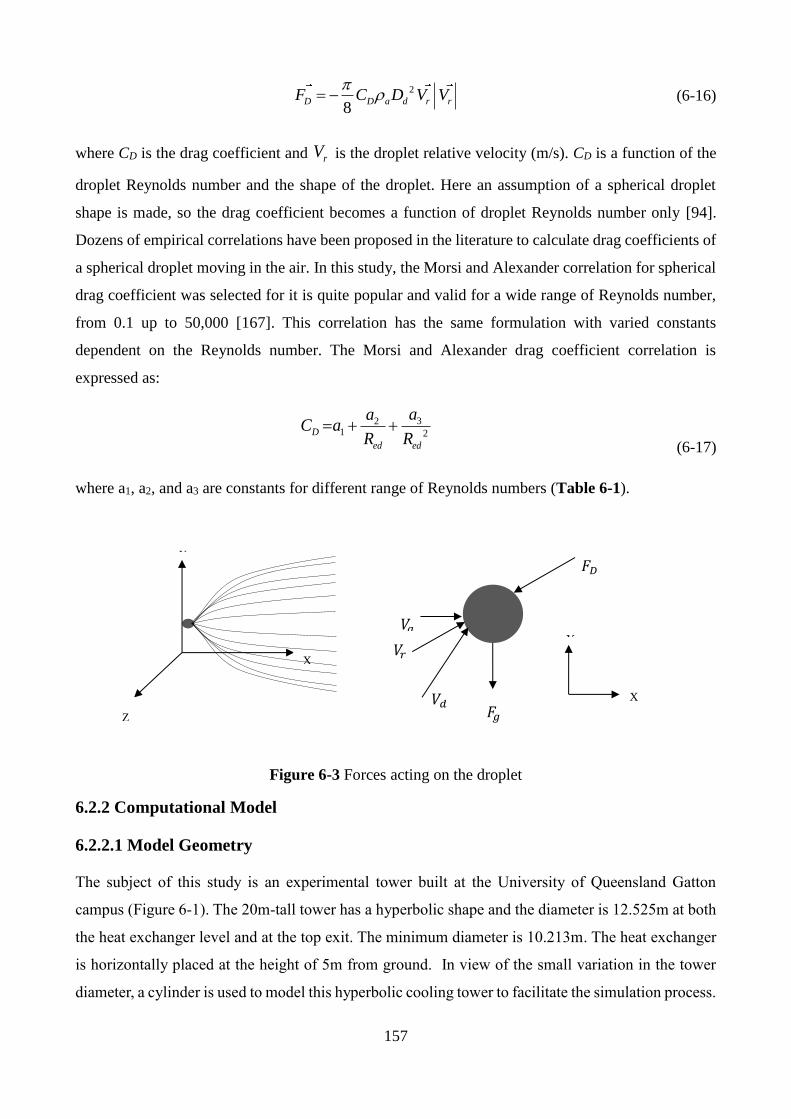
157
2
8D D a d r rF C D V V
= − (6-16)
where CD is the drag coefficient and rV is the droplet relative velocity (m/s). CD is a function of the
droplet Reynolds number and the shape of the droplet. Here an assumption of a spherical droplet
shape is made, so the drag coefficient becomes a function of droplet Reynolds number only [94].
Dozens of empirical correlations have been proposed in the literature to calculate drag coefficients of
a spherical droplet moving in the air. In this study, the Morsi and Alexander correlation for spherical
drag coefficient was selected for it is quite popular and valid for a wide range of Reynolds number,
from 0.1 up to 50,000 [167]. This correlation has the same formulation with varied constants
dependent on the Reynolds number. The Morsi and Alexander drag coefficient correlation is
expressed as:
321 2D
ed ed
aaC a
R R= + +
(6-17)
where a1, a2, and a3 are constants for different range of Reynolds numbers (Table 6-1).
Figure 6-3 Forces acting on the droplet
6.2.2 Computational Model
6.2.2.1 Model Geometry
The subject of this study is an experimental tower built at the University of Queensland Gatton
campus (Figure 6-1). The 20m-tall tower has a hyperbolic shape and the diameter is 12.525m at both
the heat exchanger level and at the top exit. The minimum diameter is 10.213m. The heat exchanger
is horizontally placed at the height of 5m from ground. In view of the small variation in the tower
diameter, a cylinder is used to model this hyperbolic cooling tower to facilitate the simulation process.
𝑉𝑑 𝐹𝑔
𝐹𝐷
𝑉𝑎 Y
X
Z
X
Y
𝑉𝑟
158
Since our experimental tower has a smaller narrowing effect (throat diameter/base
diameter:10.3/12.525=0.82) than that of an industrial counterpart (throat diameter/base
diameter:113.6/177.6=0.64) [54], it is reasonable to neglect this small diameter variation.
Additionally, the small tower size (20m) and the limited capacity of installed radiator (1.2MW) make
it quite difficult to produce large natural draft. Therefore, the induced airflow has a low velocity,
leading to a small airflow acceleration based on the narrowness at the tower throat. Another reason
for this simplification is that despite the hyperbolic tower can produce a slightly different velocity
field inside the cooling tower, our focus is the spray simulation, which is more related to the velocity
distribution at the bottom of the tower rather than the field inside the tower. Hence this simplification
would be acceptable. More importantly, the simulated results based on cylinder geometry have a good
agreement with the experimental data, which gives us confidence that the simplification is reasonable.
Table 6-1 Morsi and Alexander drag coefficient correlation constants
Red a1 a2 a3
.10edR
0 24 0
0.1 1edR
3.69 22.73 0.0903
1 10edR
1.222 29.1667 -3.8889
10 100edR
0.6167 46.5 -116.67
100 1000edR
0.3644 98.33 -2778
1000 5000edR
0.357 148.62 -4.75e4
5000 10000edR
0.46 -490.546 57.87e4
10000 50000edR
0.5191 -1662.5 5.4167e4
The model configuration, dimensions and boundary conditions are illustrated in Figure 6-4.
Considering the symmetry of the cylinder and computational cost, a 30 degree wedge is used to to
represent the cooling tower. The smaller 30o partial cylinder representing cooling tower is placed
within a much larger cylinder section, which represents the large surrounding air domain. The height
of the air domain is 120m and the radius 80m. Such a large computational domain guarantees that
the air flow inside the cooling tower was fully developed so all the necessary features of the velocity
field can be captured and used for further calculations.
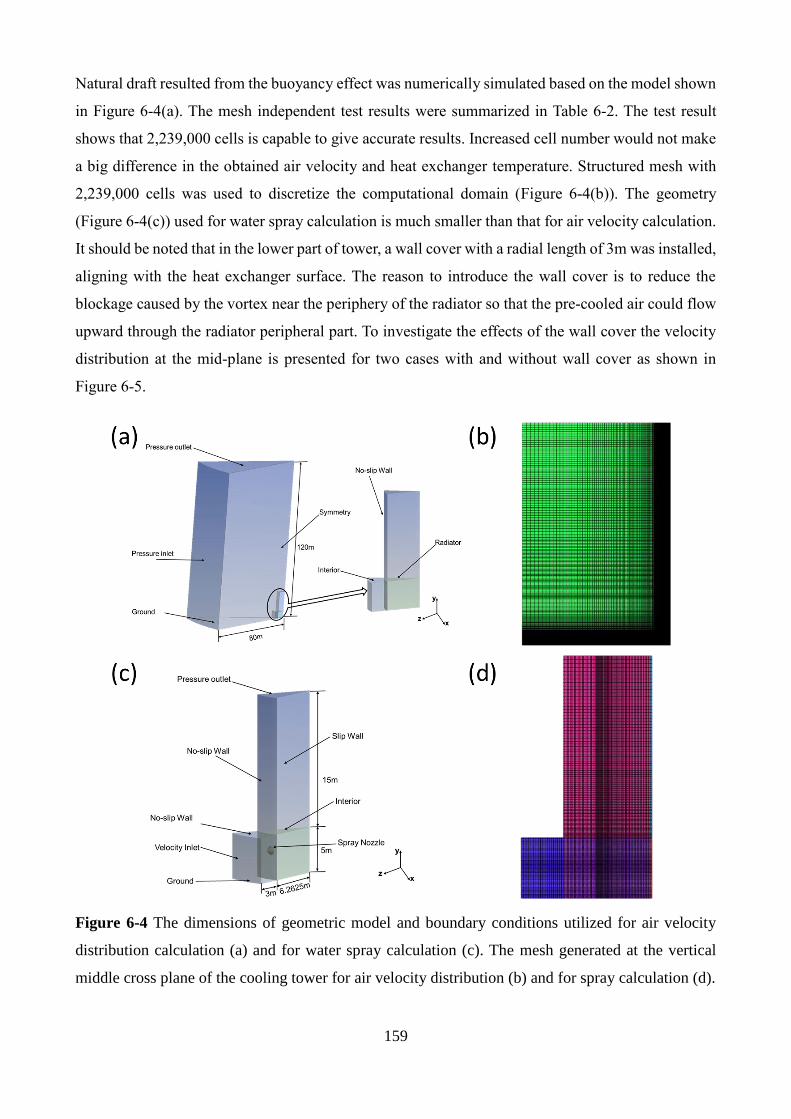
159
Natural draft resulted from the buoyancy effect was numerically simulated based on the model shown
in Figure 6-4(a). The mesh independent test results were summarized in Table 6-2. The test result
shows that 2,239,000 cells is capable to give accurate results. Increased cell number would not make
a big difference in the obtained air velocity and heat exchanger temperature. Structured mesh with
2,239,000 cells was used to discretize the computational domain (Figure 6-4(b)). The geometry
(Figure 6-4(c)) used for water spray calculation is much smaller than that for air velocity calculation.
It should be noted that in the lower part of tower, a wall cover with a radial length of 3m was installed,
aligning with the heat exchanger surface. The reason to introduce the wall cover is to reduce the
blockage caused by the vortex near the periphery of the radiator so that the pre-cooled air could flow
upward through the radiator peripheral part. To investigate the effects of the wall cover the velocity
distribution at the mid-plane is presented for two cases with and without wall cover as shown in
Figure 6-5.
Figure 6-4 The dimensions of geometric model and boundary conditions utilized for air velocity
distribution calculation (a) and for water spray calculation (c). The mesh generated at the vertical
middle cross plane of the cooling tower for air velocity distribution (b) and for spray calculation (d).
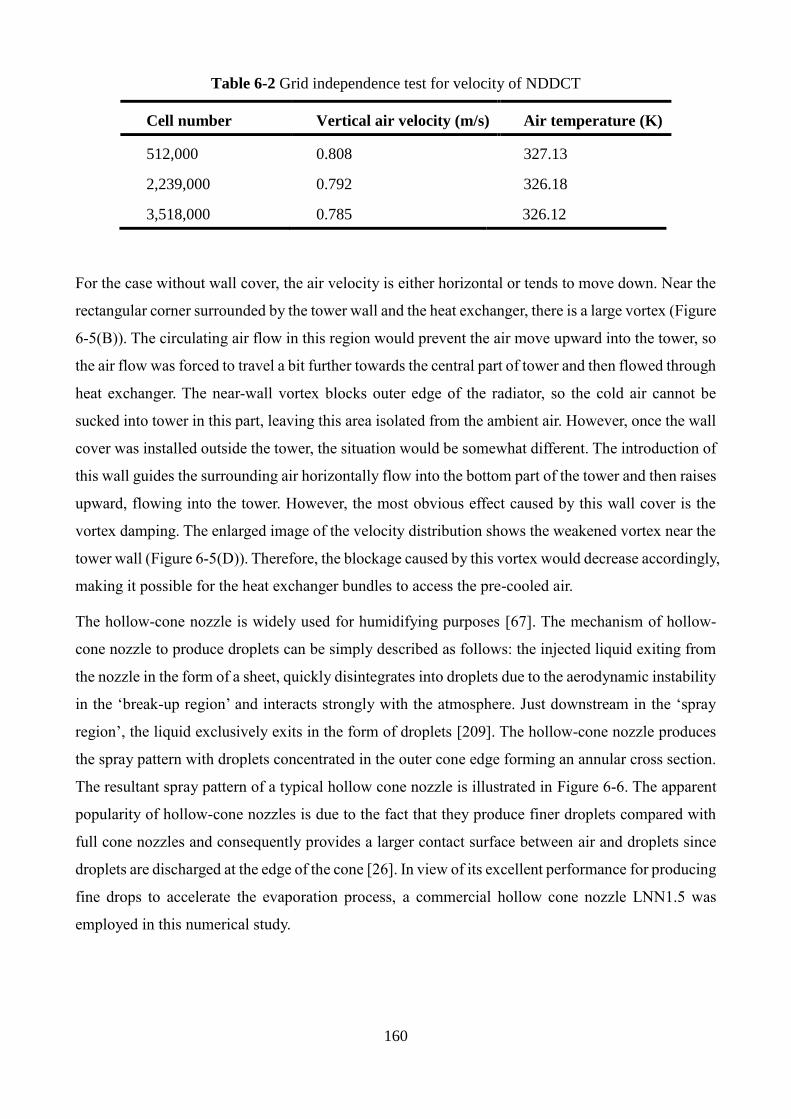
160
Table 6-2 Grid independence test for velocity of NDDCT
Cell number Vertical air velocity (m/s) Air temperature (K)
512,000 0.808 327.13
2,239,000 0.792 326.18
3,518,000 0.785 326.12
For the case without wall cover, the air velocity is either horizontal or tends to move down. Near the
rectangular corner surrounded by the tower wall and the heat exchanger, there is a large vortex (Figure
6-5(B)). The circulating air flow in this region would prevent the air move upward into the tower, so
the air flow was forced to travel a bit further towards the central part of tower and then flowed through
heat exchanger. The near-wall vortex blocks outer edge of the radiator, so the cold air cannot be
sucked into tower in this part, leaving this area isolated from the ambient air. However, once the wall
cover was installed outside the tower, the situation would be somewhat different. The introduction of
this wall guides the surrounding air horizontally flow into the bottom part of the tower and then raises
upward, flowing into the tower. However, the most obvious effect caused by this wall cover is the
vortex damping. The enlarged image of the velocity distribution shows the weakened vortex near the
tower wall (Figure 6-5(D)). Therefore, the blockage caused by this vortex would decrease accordingly,
making it possible for the heat exchanger bundles to access the pre-cooled air.
The hollow-cone nozzle is widely used for humidifying purposes [67]. The mechanism of hollow-
cone nozzle to produce droplets can be simply described as follows: the injected liquid exiting from
the nozzle in the form of a sheet, quickly disintegrates into droplets due to the aerodynamic instability
in the ‘break-up region’ and interacts strongly with the atmosphere. Just downstream in the ‘spray
region’, the liquid exclusively exits in the form of droplets [209]. The hollow-cone nozzle produces
the spray pattern with droplets concentrated in the outer cone edge forming an annular cross section.
The resultant spray pattern of a typical hollow cone nozzle is illustrated in Figure 6-6. The apparent
popularity of hollow-cone nozzles is due to the fact that they produce finer droplets compared with
full cone nozzles and consequently provides a larger contact surface between air and droplets since
droplets are discharged at the edge of the cone [26]. In view of its excellent performance for producing
fine drops to accelerate the evaporation process, a commercial hollow cone nozzle LNN1.5 was
employed in this numerical study.
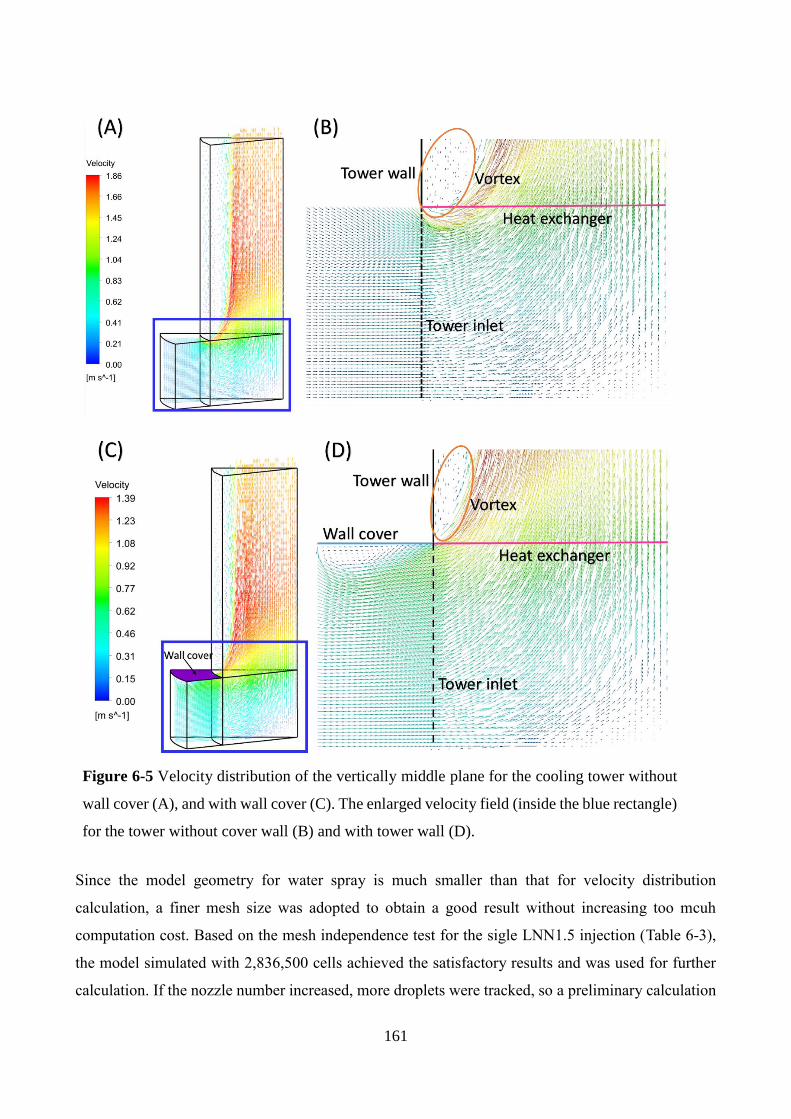
161
Figure 6-5 Velocity distribution of the vertically middle plane for the cooling tower without
wall cover (A), and with wall cover (C). The enlarged velocity field (inside the blue rectangle)
for the tower without cover wall (B) and with tower wall (D).
Since the model geometry for water spray is much smaller than that for velocity distribution
calculation, a finer mesh size was adopted to obtain a good result without increasing too mcuh
computation cost. Based on the mesh independence test for the sigle LNN1.5 injection (Table 6-3),
the model simulated with 2,836,500 cells achieved the satisfactory results and was used for further
calculation. If the nozzle number increased, more droplets were tracked, so a preliminary calculation
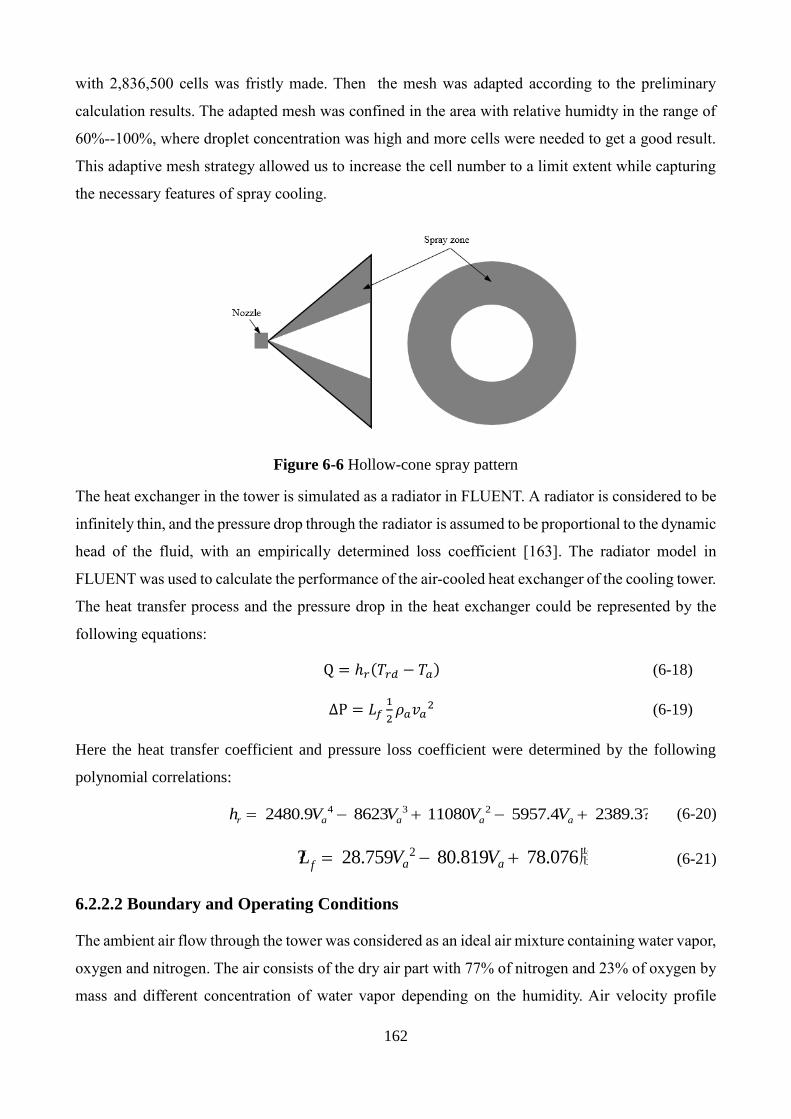
162
with 2,836,500 cells was fristly made. Then the mesh was adapted according to the preliminary
calculation results. The adapted mesh was confined in the area with relative humidty in the range of
60%--100%, where droplet concentration was high and more cells were needed to get a good result.
This adaptive mesh strategy allowed us to increase the cell number to a limit extent while capturing
the necessary features of spray cooling.
Figure 6-6 Hollow-cone spray pattern
The heat exchanger in the tower is simulated as a radiator in FLUENT. A radiator is considered to be
infinitely thin, and the pressure drop through the radiator is assumed to be proportional to the dynamic
head of the fluid, with an empirically determined loss coefficient [163]. The radiator model in
FLUENT was used to calculate the performance of the air-cooled heat exchanger of the cooling tower.
The heat transfer process and the pressure drop in the heat exchanger could be represented by the
following equations:
Q = ℎ𝑟(𝑇𝑟𝑑 − 𝑇𝑎) (6-18)
∆P = 𝐿𝑓1
2𝜌𝑎𝑣𝑎
2 (6-19)
Here the heat transfer coefficient and pressure loss coefficient were determined by the following
polynomial correlations:
4 3 2 2480.9 8623 11080 5957.4 2389.3?r a a a ah V V V V= − + − + (6-20)
2? 28.759 80.819 78.076牋a afL V V= − + (6-21)
6.2.2.2 Boundary and Operating Conditions
The ambient air flow through the tower was considered as an ideal air mixture containing water vapor,
oxygen and nitrogen. The air consists of the dry air part with 77% of nitrogen and 23% of oxygen by
mass and different concentration of water vapor depending on the humidity. Air velocity profile

163
obtained from a separate tower simulation was used as the velocity inlet boundary condition. The
inlet turbulence intensity was assumed as 1% for all cases [27]. The turbulence intensity was selected
based on the research outcome of Alkhedhair et al. [27,133]. They assumed the turbulence intensity
was 1% in their simulations, and conducted wind tunnel test to simulate the NDDCT, the good
agreement between the simulated results and experiental ones proved the effectiveness of this
assumption. Also his experimental tests showed the produced intensity for the spray at air velocity of
1m/s was around 1%, which is quite similar to our simulation conditions, hence we used the 1%
turbulence intensity for our simulations. The operating pressure was assumed to be the atmospheric
pressure, 101.325 kPa. At the top of the large domain, the pressure outlet boundary condition was
used. The wall of tower was set as adiabatic walls with no-slip condition. The enhanced wall function
was used to model the near wall regions.
Table 6-3 Grid independence test for spray cooling
Cell number Air velocity 1 Temperature(°C) Evaporated water
(g/s)
1,475,200 0.821 38.95 5
2,836,500 0.789 38.82 4.9
3,675,200 0.786 38.78 4.86
1: The velocity is the area-weighted vertical velocity at the heat exchanger surface. The unit is m/s.
Fresh water droplets were injected as the discrete phase at a constant temperature of 28 ˚C. The
droplets are assumed to be perfect spheres and the temperature gradient within the droplets is
neglected due to their small size [210]. Droplet collision and coalescence were not considered in the
simulation as the spray is dilute [67]. The trajectories of droplets were tracked by grouping them into
parcels. Three parcel sizes of 200, 600, 1500 droplets were trialled. The calculated mean temperature
at the radiator varied as small as 0.03 oC as the number of parcels increased from 200 to 1500. Thus,
200 parcels were used to reduce computation load. In the spray cooling model, a hollow cone nozzle
LNN1.5 is used. The key parameters for the nozzle and ambient air are listed in Table 6-4. The
boundary condition for droplets impacting the no-slip walls was set as “escape”, i.e., droplets
impacting the walls are terminated and excluded from further calculation. This regime is also assigned
for the inlet and outlet. In the tower velocity simulation, the two cutting plane was set as symmetry
boundary due to the geometric consideration and the aim to avoid introducing additional resistance.
However, as to the situation of spray cooling, this symmetry condition is not appropriate, so the slip
wall is assigned to the cutting planes. According to the manual of FLUENT, the symmetry condition
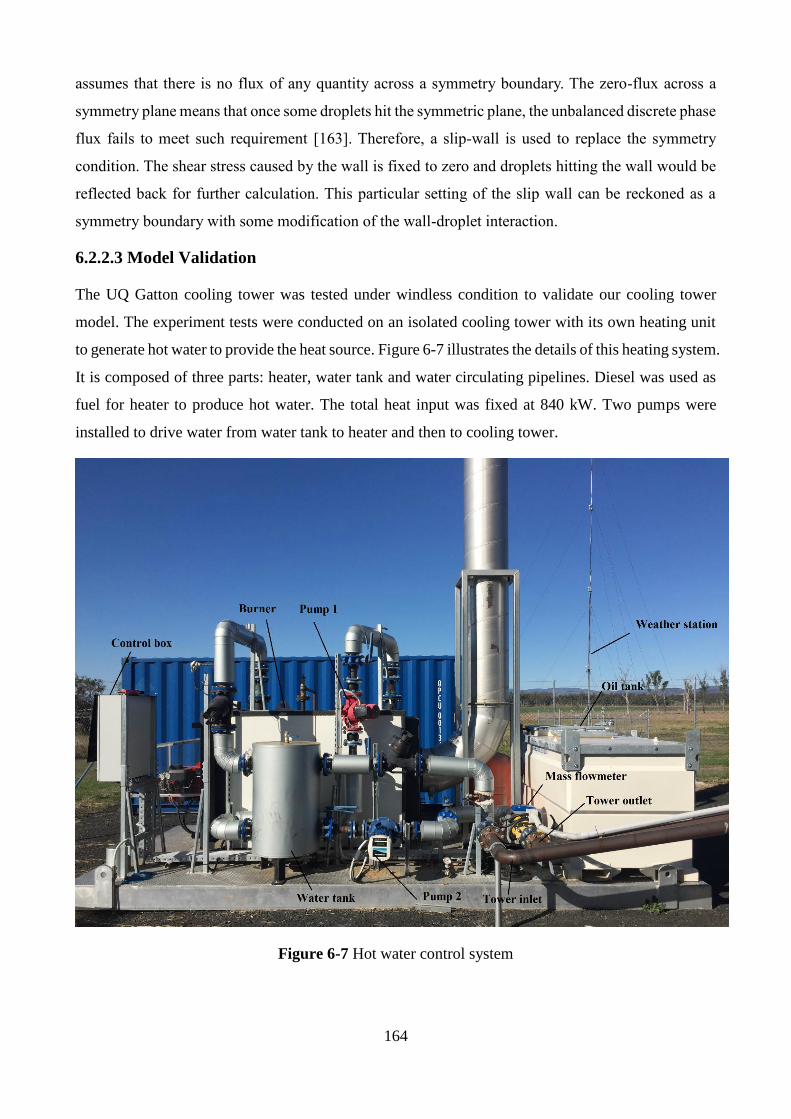
164
assumes that there is no flux of any quantity across a symmetry boundary. The zero-flux across a
symmetry plane means that once some droplets hit the symmetric plane, the unbalanced discrete phase
flux fails to meet such requirement [163]. Therefore, a slip-wall is used to replace the symmetry
condition. The shear stress caused by the wall is fixed to zero and droplets hitting the wall would be
reflected back for further calculation. This particular setting of the slip wall can be reckoned as a
symmetry boundary with some modification of the wall-droplet interaction.
6.2.2.3 Model Validation
The UQ Gatton cooling tower was tested under windless condition to validate our cooling tower
model. The experiment tests were conducted on an isolated cooling tower with its own heating unit
to generate hot water to provide the heat source. Figure 6-7 illustrates the details of this heating system.
It is composed of three parts: heater, water tank and water circulating pipelines. Diesel was used as
fuel for heater to produce hot water. The total heat input was fixed at 840 kW. Two pumps were
installed to drive water from water tank to heater and then to cooling tower.
Figure 6-7 Hot water control system
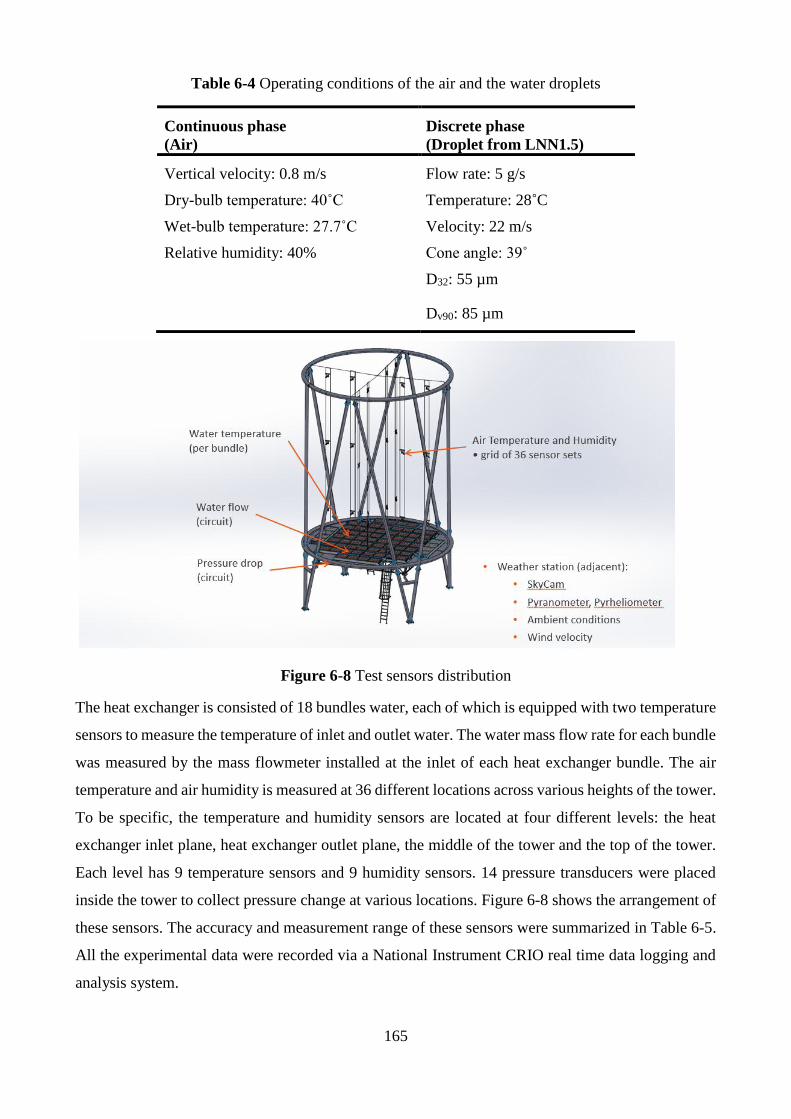
165
Table 6-4 Operating conditions of the air and the water droplets
Continuous phase
(Air)
Discrete phase
(Droplet from LNN1.5)
Vertical velocity: 0.8 m/s Flow rate: 5 g/s
Dry-bulb temperature: 40˚C
Wet-bulb temperature: 27.7˚C
Relative humidity: 40%
Temperature: 28˚C
Velocity: 22 m/s
Cone angle: 39˚
D32: 55 µm
Dv90: 85 µm
Figure 6-8 Test sensors distribution
The heat exchanger is consisted of 18 bundles water, each of which is equipped with two temperature
sensors to measure the temperature of inlet and outlet water. The water mass flow rate for each bundle
was measured by the mass flowmeter installed at the inlet of each heat exchanger bundle. The air
temperature and air humidity is measured at 36 different locations across various heights of the tower.
To be specific, the temperature and humidity sensors are located at four different levels: the heat
exchanger inlet plane, heat exchanger outlet plane, the middle of the tower and the top of the tower.
Each level has 9 temperature sensors and 9 humidity sensors. 14 pressure transducers were placed
inside the tower to collect pressure change at various locations. Figure 6-8 shows the arrangement of
these sensors. The accuracy and measurement range of these sensors were summarized in Table 6-5.
All the experimental data were recorded via a National Instrument CRIO real time data logging and
analysis system.
166
Table 6-5 The measurement instruments used for experimental tests
Sensors/instruments Supplier Measuring range Uncertainty/
accuracy
Quantities of
the sensor
Air temperature Thermistor 0 ~150°C ±0.2°C 36
Air humidity Vaisala 0 ~ 100% RH ±3% ~ ±5% 36
Water temperature TC Direct 0~90°C 0.5°C 38
Water pressure Thermo Fisher 0~100 kPa 0.2% FS 14
Water mass flow Krohne 0~20 kg/s 0.50% 1
Crosswind velocity Vaisala 0-60 m/s ±3% 2
Wind direction Vaisala - ±3% 2
Table 6-6 shows the seven experimental test conditions, which served as input data for numerical
simulation. The comparisons between the measured and predicted values for NDDCT are shown in
Figure 6-9. The comparison results demonstrate the good agreement between the CFD predictions
and the experimental data. The model can accurately predict the temperature of hot air after the
radiator, with all an average deviation less than 5%. The predicted temperatures of cooled
recirculating water flowing through the radiator have a slightly larger deviation than the predictions
for hot air temperature, with only one data point having a deviation larger than 5%. However, the
simulated results for air velocity inherent to the induced natural draft have two data points lie between
the deviation of 5% and 10%. All other 5 points approach the test results closely. These good
agreements verify the accuracy of the built model for tower simulations. It is worth noting that the
simulated air velocity is slightly higher than the experimental result. The possible reason is that the
small crosswinds under the field tests would pose negative effect on the heat transfer process. The
presence of winds disturb air flow inside the tower, leading to the uneven distribution of the induced
air flow. In the windward part of the heat exchanger, air flow decreases and becomes smaller than
that in the leeward part. With the increased unequal distribution of air flow, vortices are formed in
the tower, which redistribute the hot air and further impair the heat transfer. The depressed heat
transfer would cause the decreasing velocity during the test. Since the crosswind is not strong, we
neglect this effect in our simulation model. The negligence of this detrimental factor results in the
slight overestimated air velocity from CFD calculations.
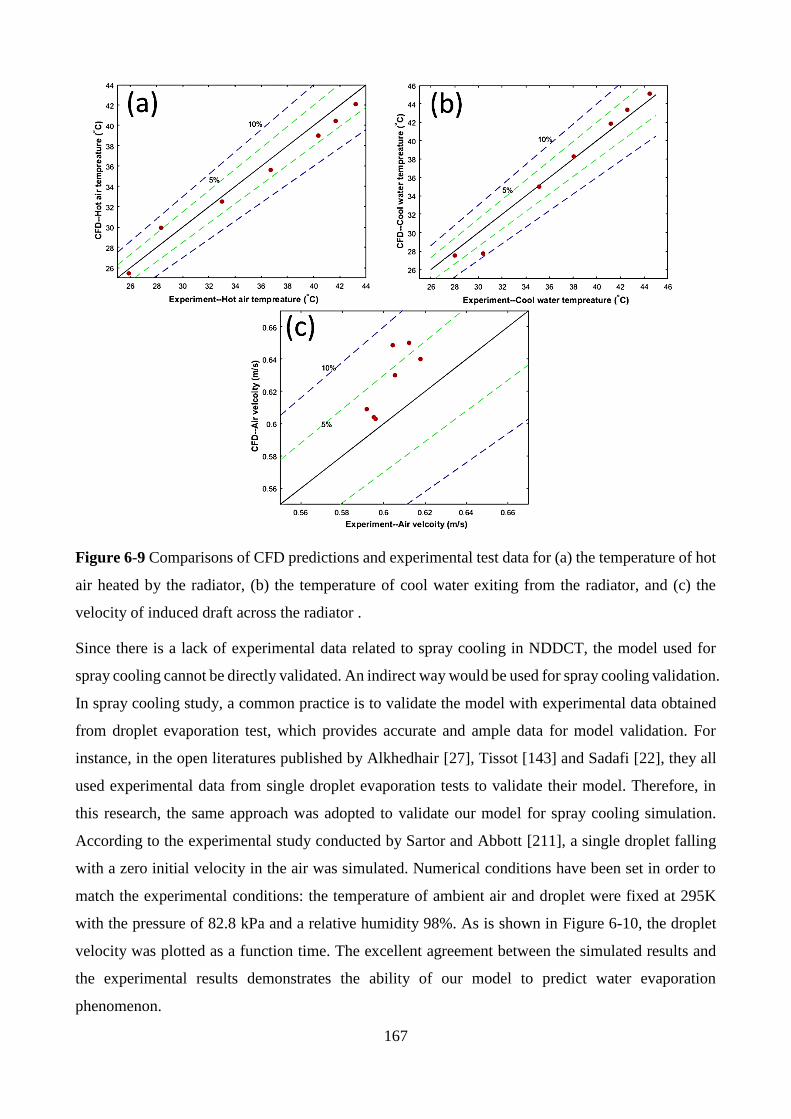
167
Figure 6-9 Comparisons of CFD predictions and experimental test data for (a) the temperature of hot
air heated by the radiator, (b) the temperature of cool water exiting from the radiator, and (c) the
velocity of induced draft across the radiator .
Since there is a lack of experimental data related to spray cooling in NDDCT, the model used for
spray cooling cannot be directly validated. An indirect way would be used for spray cooling validation.
In spray cooling study, a common practice is to validate the model with experimental data obtained
from droplet evaporation test, which provides accurate and ample data for model validation. For
instance, in the open literatures published by Alkhedhair [27], Tissot [143] and Sadafi [22], they all
used experimental data from single droplet evaporation tests to validate their model. Therefore, in
this research, the same approach was adopted to validate our model for spray cooling simulation.
According to the experimental study conducted by Sartor and Abbott [211], a single droplet falling
with a zero initial velocity in the air was simulated. Numerical conditions have been set in order to
match the experimental conditions: the temperature of ambient air and droplet were fixed at 295K
with the pressure of 82.8 kPa and a relative humidity 98%. As is shown in Figure 6-10, the droplet
velocity was plotted as a function time. The excellent agreement between the simulated results and
the experimental results demonstrates the ability of our model to predict water evaporation
phenomenon.
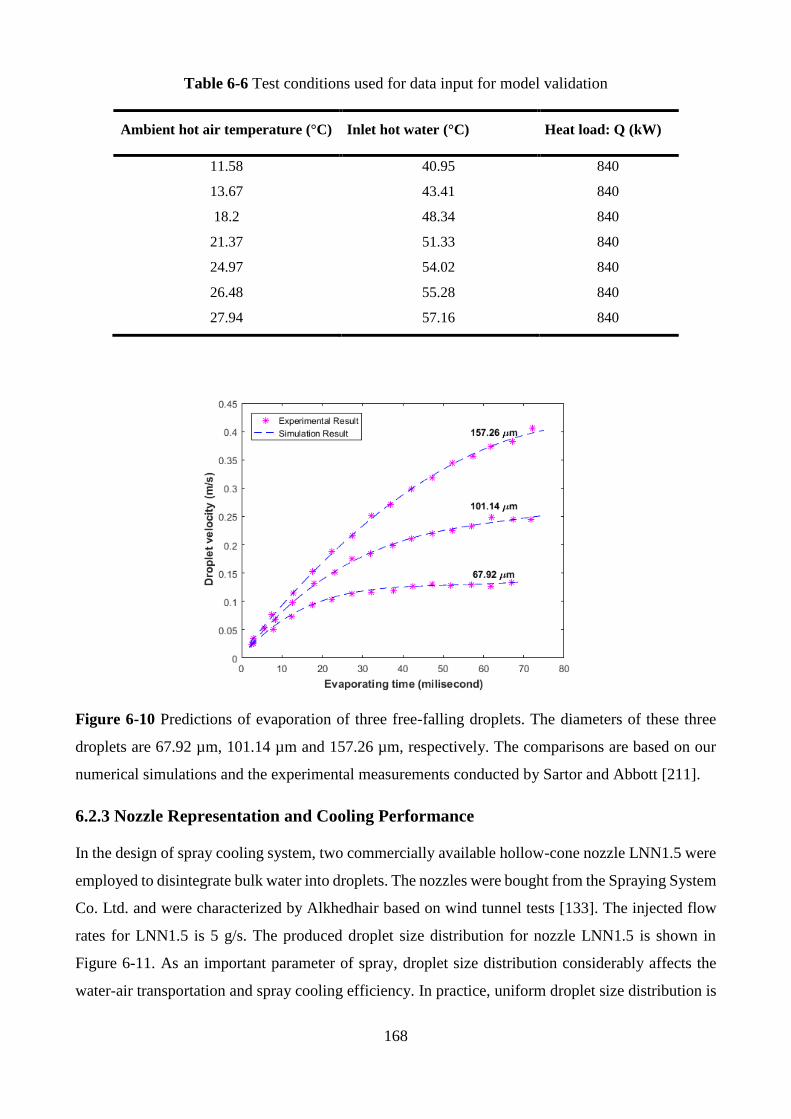
168
Table 6-6 Test conditions used for data input for model validation
Ambient hot air temperature (°C) Inlet hot water (°C) Heat load: Q (kW)
11.58 40.95 840
13.67 43.41 840
18.2 48.34 840
21.37 51.33 840
24.97 54.02 840
26.48 55.28 840
27.94 57.16 840
Figure 6-10 Predictions of evaporation of three free-falling droplets. The diameters of these three
droplets are 67.92 µm, 101.14 µm and 157.26 µm, respectively. The comparisons are based on our
numerical simulations and the experimental measurements conducted by Sartor and Abbott [211].
6.2.3 Nozzle Representation and Cooling Performance
In the design of spray cooling system, two commercially available hollow-cone nozzle LNN1.5 were
employed to disintegrate bulk water into droplets. The nozzles were bought from the Spraying System
Co. Ltd. and were characterized by Alkhedhair based on wind tunnel tests [133]. The injected flow
rates for LNN1.5 is 5 g/s. The produced droplet size distribution for nozzle LNN1.5 is shown in
Figure 6-11. As an important parameter of spray, droplet size distribution considerably affects the
water-air transportation and spray cooling efficiency. In practice, uniform droplet size distribution is
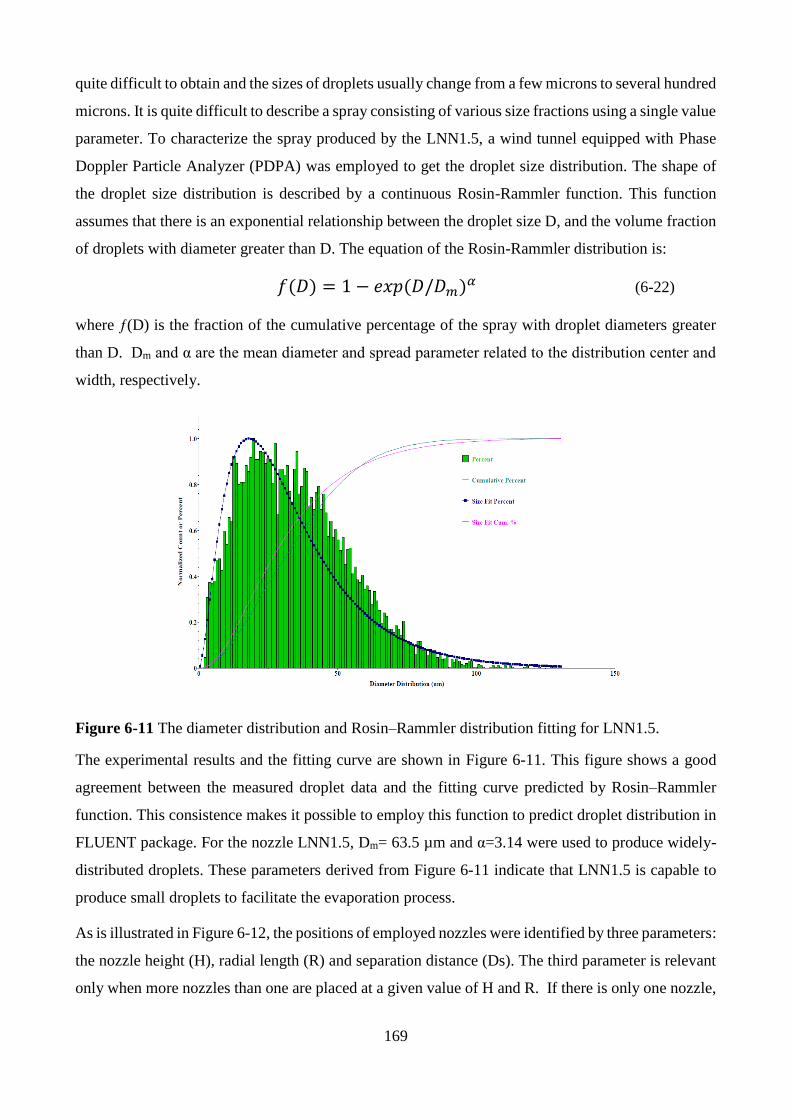
169
quite difficult to obtain and the sizes of droplets usually change from a few microns to several hundred
microns. It is quite difficult to describe a spray consisting of various size fractions using a single value
parameter. To characterize the spray produced by the LNN1.5, a wind tunnel equipped with Phase
Doppler Particle Analyzer (PDPA) was employed to get the droplet size distribution. The shape of
the droplet size distribution is described by a continuous Rosin-Rammler function. This function
assumes that there is an exponential relationship between the droplet size D, and the volume fraction
of droplets with diameter greater than D. The equation of the Rosin-Rammler distribution is:
𝑓(𝐷) = 1 − 𝑒𝑥𝑝(𝐷/𝐷𝑚)𝛼 (6-22)
where ƒ(D) is the fraction of the cumulative percentage of the spray with droplet diameters greater
than D. Dm and α are the mean diameter and spread parameter related to the distribution center and
width, respectively.
Figure 6-11 The diameter distribution and Rosin–Rammler distribution fitting for LNN1.5.
The experimental results and the fitting curve are shown in Figure 6-11. This figure shows a good
agreement between the measured droplet data and the fitting curve predicted by Rosin–Rammler
function. This consistence makes it possible to employ this function to predict droplet distribution in
FLUENT package. For the nozzle LNN1.5, Dm= 63.5 µm and α=3.14 were used to produce widely-
distributed droplets. These parameters derived from Figure 6-11 indicate that LNN1.5 is capable to
produce small droplets to facilitate the evaporation process.
As is illustrated in Figure 6-12, the positions of employed nozzles were identified by three parameters:
the nozzle height (H), radial length (R) and separation distance (Ds). The third parameter is relevant
only when more nozzles than one are placed at a given value of H and R. If there is only one nozzle,
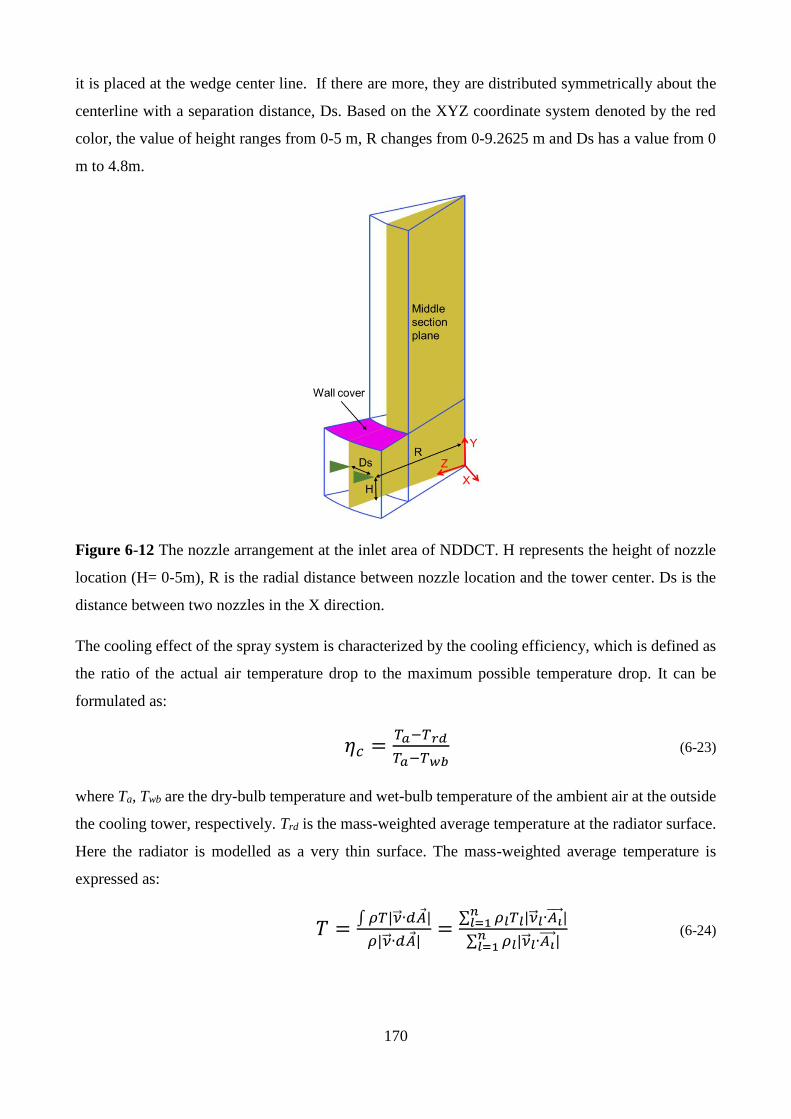
170
it is placed at the wedge center line. If there are more, they are distributed symmetrically about the
centerline with a separation distance, Ds. Based on the XYZ coordinate system denoted by the red
color, the value of height ranges from 0-5 m, R changes from 0-9.2625 m and Ds has a value from 0
m to 4.8m.
Figure 6-12 The nozzle arrangement at the inlet area of NDDCT. H represents the height of nozzle
location (H= 0-5m), R is the radial distance between nozzle location and the tower center. Ds is the
distance between two nozzles in the X direction.
The cooling effect of the spray system is characterized by the cooling efficiency, which is defined as
the ratio of the actual air temperature drop to the maximum possible temperature drop. It can be
formulated as:
𝜂𝑐 =𝑇𝑎−𝑇𝑟𝑑
𝑇𝑎−𝑇𝑤𝑏 (6-23)
where Ta, Twb are the dry-bulb temperature and wet-bulb temperature of the ambient air at the outside
the cooling tower, respectively. Trd is the mass-weighted average temperature at the radiator surface.
Here the radiator is modelled as a very thin surface. The mass-weighted average temperature is
expressed as:
𝑇 =∫𝜌𝑇|�� ∙𝑑𝐴 |
𝜌|�� ∙𝑑𝐴 |=
∑ 𝜌𝑙𝑇𝑙|�� 𝑙∙𝐴𝑖 |𝑛𝑙=1
∑ 𝜌𝑙|�� 𝑙∙𝐴𝑖 |𝑛𝑙=1
(6-24)
171
where 𝑇, 𝜌𝑙 and 𝜈 𝑙 are the mass-weighted average temperature, air density and the corresponding local
velocity at the small areas denoted by 𝐴𝑖
The mass-weighted average temperature can be used to characterize the cooling performance
achieved by different nozzle configurations. Furthermore, the temperature drop is defined as the
temperature difference between the mean (mass-averaged) temperature at the heat exchanger inlet
and the ambient air temperature (Ta=40˚C).
∆𝑇 = 𝑇𝑎 − 𝑇𝑟𝑑 (6-25)
Where Ta is the dry-bulb temperature of the ambient air outside the cooling tower; Trd is the
temperature of air at the radiator surface.
If an area at the radiator surface experiences a temperature drop larger than 0.62 ˚C, corresponding
to the cooling efficiency higher than 5%, it is denoted as part of the impact area. The impact area is
used to denote the size of the radiator surface influenced by the pre-cooled air. On the basis of impact
area, the spray cover ratio ψ is expressed as:
𝜓 =𝑇ℎ𝑒 𝑠𝑖𝑧𝑒 𝑜𝑓 𝑖𝑚𝑝𝑎𝑐𝑡 𝑎𝑟𝑒𝑎
𝑇ℎ𝑒 𝑠𝑖𝑧𝑒 𝑜𝑓 𝑟𝑎𝑑𝑖𝑎𝑡𝑜𝑟 𝑠𝑢𝑟𝑓𝑎𝑐𝑒 (10.27 𝑚2) (6-26)
In addition to the average temperature of the radiator and the corresponding temperature drop, the
evaporation rate is another important parameter to evaluate spray cooling. The more and faster water
evaporation, better cooling performance will be achieved. Hence the careful design of the NDDCT
cooling system should be done to reach full evaporation of water droplets at the bottom of tower, i.e.,
the lower 5m inlet area. The latent heat for water evaporation is provided by the sensible heat from
hot ambient air, thus the larger fraction of evaporated water, the lower the inlet air temperature will
be and the better pre-cooling performance is achieved. To quantitatively compare the cooling
performance in terms of the evaporated water amount, an evaporated water fraction β is defined as
below:
𝛽 =𝐸𝑣𝑎𝑝𝑜𝑟𝑎𝑡𝑒𝑑 𝑤𝑎𝑡𝑒𝑟 𝑓𝑙𝑜𝑤𝑟𝑎𝑡𝑒
𝐼𝑛𝑗𝑒𝑐𝑡𝑒𝑑 𝑤𝑎𝑡𝑒𝑟 𝑓𝑙𝑜𝑤𝑟𝑎𝑡𝑒 (6-27)
A larger value for β corresponds to the larger flowrate of evaporated water. To avoid the corrosion
problem caused by droplets evaporating on the heat exchanger surface and to minimize water waste,
the system should satisfy the condition of β ≥ 0.95 so that the majority of water would evaporate into
vapor.
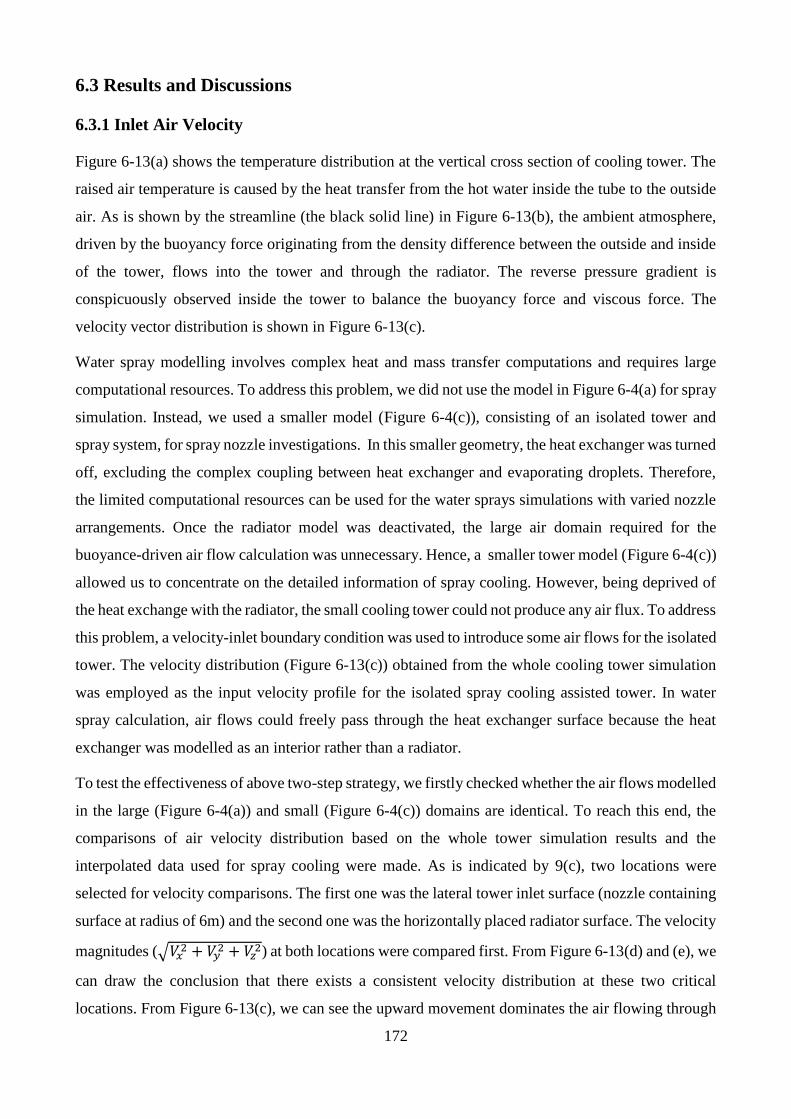
172
6.3 Results and Discussions
6.3.1 Inlet Air Velocity
Figure 6-13(a) shows the temperature distribution at the vertical cross section of cooling tower. The
raised air temperature is caused by the heat transfer from the hot water inside the tube to the outside
air. As is shown by the streamline (the black solid line) in Figure 6-13(b), the ambient atmosphere,
driven by the buoyancy force originating from the density difference between the outside and inside
of the tower, flows into the tower and through the radiator. The reverse pressure gradient is
conspicuously observed inside the tower to balance the buoyancy force and viscous force. The
velocity vector distribution is shown in Figure 6-13(c).
Water spray modelling involves complex heat and mass transfer computations and requires large
computational resources. To address this problem, we did not use the model in Figure 6-4(a) for spray
simulation. Instead, we used a smaller model (Figure 6-4(c)), consisting of an isolated tower and
spray system, for spray nozzle investigations. In this smaller geometry, the heat exchanger was turned
off, excluding the complex coupling between heat exchanger and evaporating droplets. Therefore,
the limited computational resources can be used for the water sprays simulations with varied nozzle
arrangements. Once the radiator model was deactivated, the large air domain required for the
buoyance-driven air flow calculation was unnecessary. Hence, a smaller tower model (Figure 6-4(c))
allowed us to concentrate on the detailed information of spray cooling. However, being deprived of
the heat exchange with the radiator, the small cooling tower could not produce any air flux. To address
this problem, a velocity-inlet boundary condition was used to introduce some air flows for the isolated
tower. The velocity distribution (Figure 6-13(c)) obtained from the whole cooling tower simulation
was employed as the input velocity profile for the isolated spray cooling assisted tower. In water
spray calculation, air flows could freely pass through the heat exchanger surface because the heat
exchanger was modelled as an interior rather than a radiator.
To test the effectiveness of above two-step strategy, we firstly checked whether the air flows modelled
in the large (Figure 6-4(a)) and small (Figure 6-4(c)) domains are identical. To reach this end, the
comparisons of air velocity distribution based on the whole tower simulation results and the
interpolated data used for spray cooling were made. As is indicated by 9(c), two locations were
selected for velocity comparisons. The first one was the lateral tower inlet surface (nozzle containing
surface at radius of 6m) and the second one was the horizontally placed radiator surface. The velocity
magnitudes (√𝑉𝑥2 + 𝑉𝑦2 + 𝑉𝑧2) at both locations were compared first. From Figure 6-13(d) and (e), we
can draw the conclusion that there exists a consistent velocity distribution at these two critical
locations. From Figure 6-13(c), we can see the upward movement dominates the air flowing through
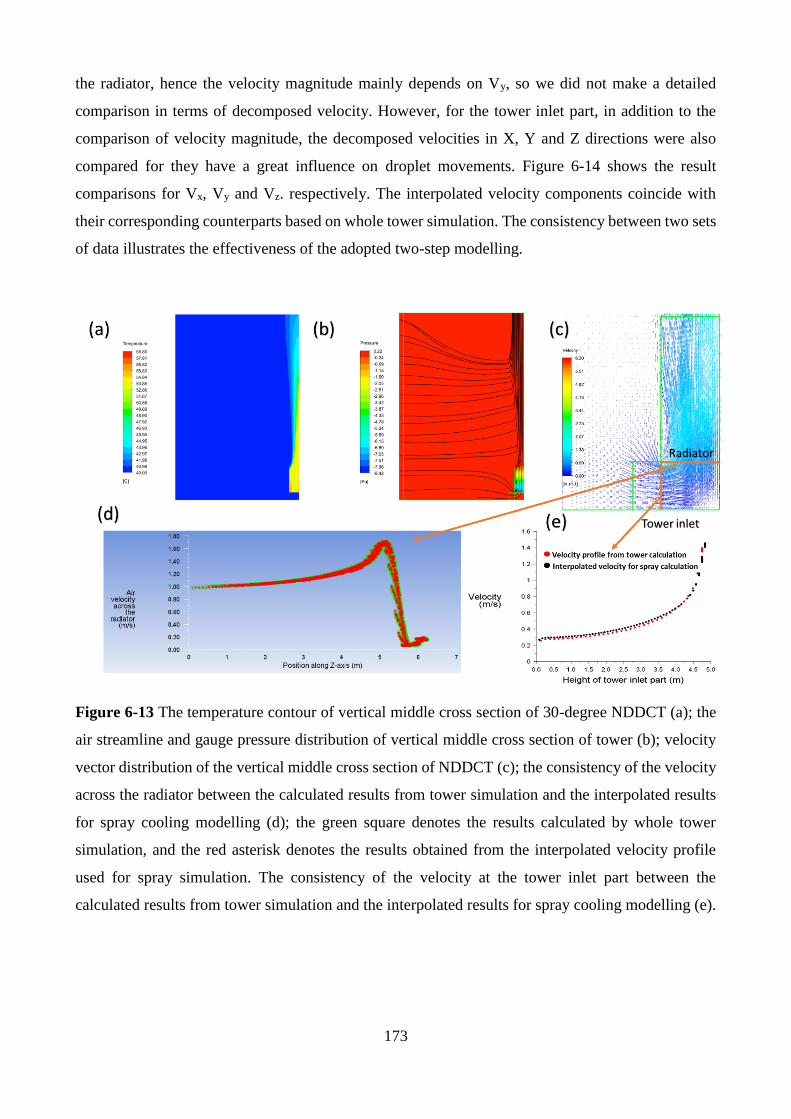
173
the radiator, hence the velocity magnitude mainly depends on Vy, so we did not make a detailed
comparison in terms of decomposed velocity. However, for the tower inlet part, in addition to the
comparison of velocity magnitude, the decomposed velocities in X, Y and Z directions were also
compared for they have a great influence on droplet movements. Figure 6-14 shows the result
comparisons for Vx, Vy and Vz. respectively. The interpolated velocity components coincide with
their corresponding counterparts based on whole tower simulation. The consistency between two sets
of data illustrates the effectiveness of the adopted two-step modelling.
Figure 6-13 The temperature contour of vertical middle cross section of 30-degree NDDCT (a); the
air streamline and gauge pressure distribution of vertical middle cross section of tower (b); velocity
vector distribution of the vertical middle cross section of NDDCT (c); the consistency of the velocity
across the radiator between the calculated results from tower simulation and the interpolated results
for spray cooling modelling (d); the green square denotes the results calculated by whole tower
simulation, and the red asterisk denotes the results obtained from the interpolated velocity profile
used for spray simulation. The consistency of the velocity at the tower inlet part between the
calculated results from tower simulation and the interpolated results for spray cooling modelling (e).
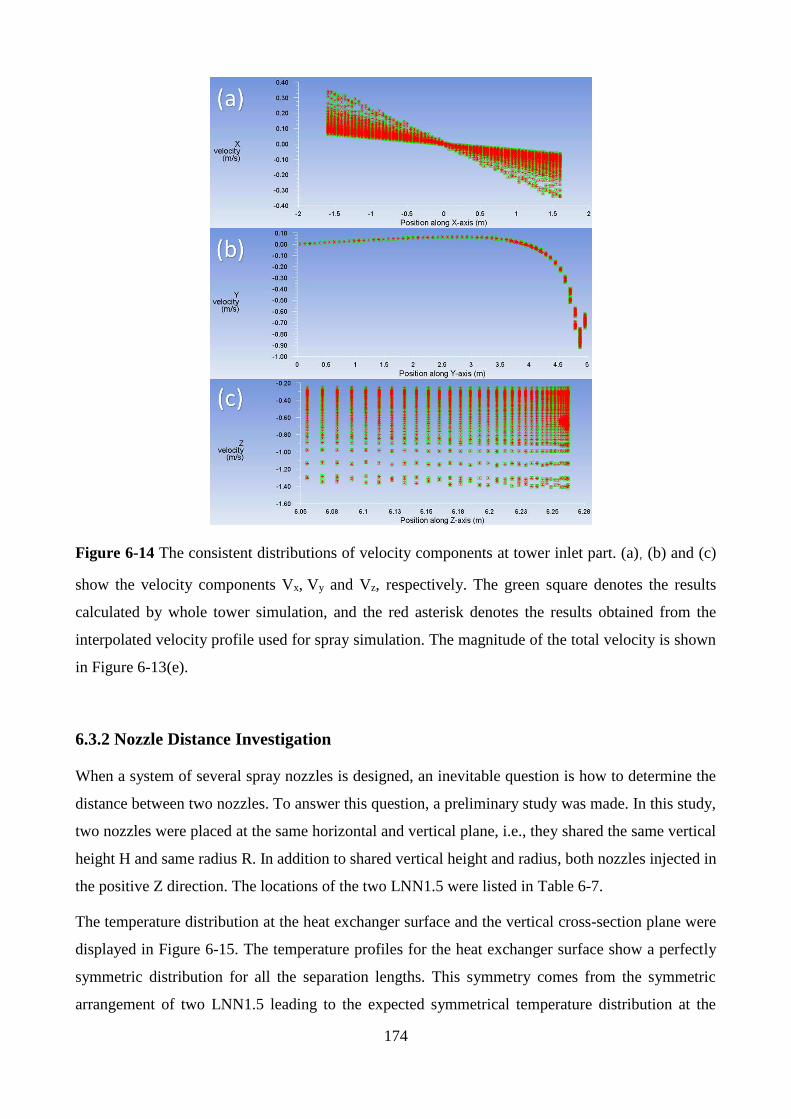
174
Figure 6-14 The consistent distributions of velocity components at tower inlet part. (a), (b) and (c)
show the velocity components Vx, Vy and Vz, respectively. The green square denotes the results
calculated by whole tower simulation, and the red asterisk denotes the results obtained from the
interpolated velocity profile used for spray simulation. The magnitude of the total velocity is shown
in Figure 6-13(e).
6.3.2 Nozzle Distance Investigation
When a system of several spray nozzles is designed, an inevitable question is how to determine the
distance between two nozzles. To answer this question, a preliminary study was made. In this study,
two nozzles were placed at the same horizontal and vertical plane, i.e., they shared the same vertical
height H and same radius R. In addition to shared vertical height and radius, both nozzles injected in
the positive Z direction. The locations of the two LNN1.5 were listed in Table 6-7.
The temperature distribution at the heat exchanger surface and the vertical cross-section plane were
displayed in Figure 6-15. The temperature profiles for the heat exchanger surface show a perfectly
symmetric distribution for all the separation lengths. This symmetry comes from the symmetric
arrangement of two LNN1.5 leading to the expected symmetrical temperature distribution at the
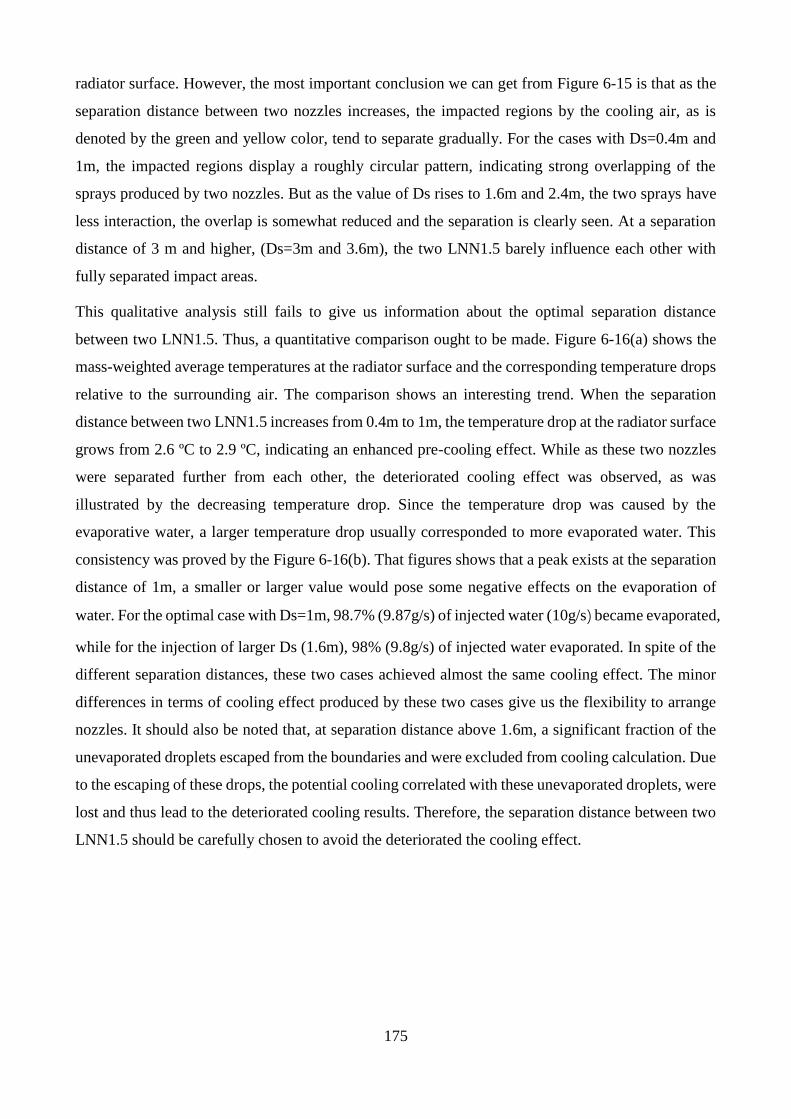
175
radiator surface. However, the most important conclusion we can get from Figure 6-15 is that as the
separation distance between two nozzles increases, the impacted regions by the cooling air, as is
denoted by the green and yellow color, tend to separate gradually. For the cases with Ds=0.4m and
1m, the impacted regions display a roughly circular pattern, indicating strong overlapping of the
sprays produced by two nozzles. But as the value of Ds rises to 1.6m and 2.4m, the two sprays have
less interaction, the overlap is somewhat reduced and the separation is clearly seen. At a separation
distance of 3 m and higher, (Ds=3m and 3.6m), the two LNN1.5 barely influence each other with
fully separated impact areas.
This qualitative analysis still fails to give us information about the optimal separation distance
between two LNN1.5. Thus, a quantitative comparison ought to be made. Figure 6-16(a) shows the
mass-weighted average temperatures at the radiator surface and the corresponding temperature drops
relative to the surrounding air. The comparison shows an interesting trend. When the separation
distance between two LNN1.5 increases from 0.4m to 1m, the temperature drop at the radiator surface
grows from 2.6 ºC to 2.9 ºC, indicating an enhanced pre-cooling effect. While as these two nozzles
were separated further from each other, the deteriorated cooling effect was observed, as was
illustrated by the decreasing temperature drop. Since the temperature drop was caused by the
evaporative water, a larger temperature drop usually corresponded to more evaporated water. This
consistency was proved by the Figure 6-16(b). That figures shows that a peak exists at the separation
distance of 1m, a smaller or larger value would pose some negative effects on the evaporation of
water. For the optimal case with Ds=1m, 98.7% (9.87g/s) of injected water (10g/s) became evaporated,
while for the injection of larger Ds (1.6m), 98% (9.8g/s) of injected water evaporated. In spite of the
different separation distances, these two cases achieved almost the same cooling effect. The minor
differences in terms of cooling effect produced by these two cases give us the flexibility to arrange
nozzles. It should also be noted that, at separation distance above 1.6m, a significant fraction of the
unevaporated droplets escaped from the boundaries and were excluded from cooling calculation. Due
to the escaping of these drops, the potential cooling correlated with these unevaporated droplets, were
lost and thus lead to the deteriorated cooling results. Therefore, the separation distance between two
LNN1.5 should be carefully chosen to avoid the deteriorated the cooling effect.
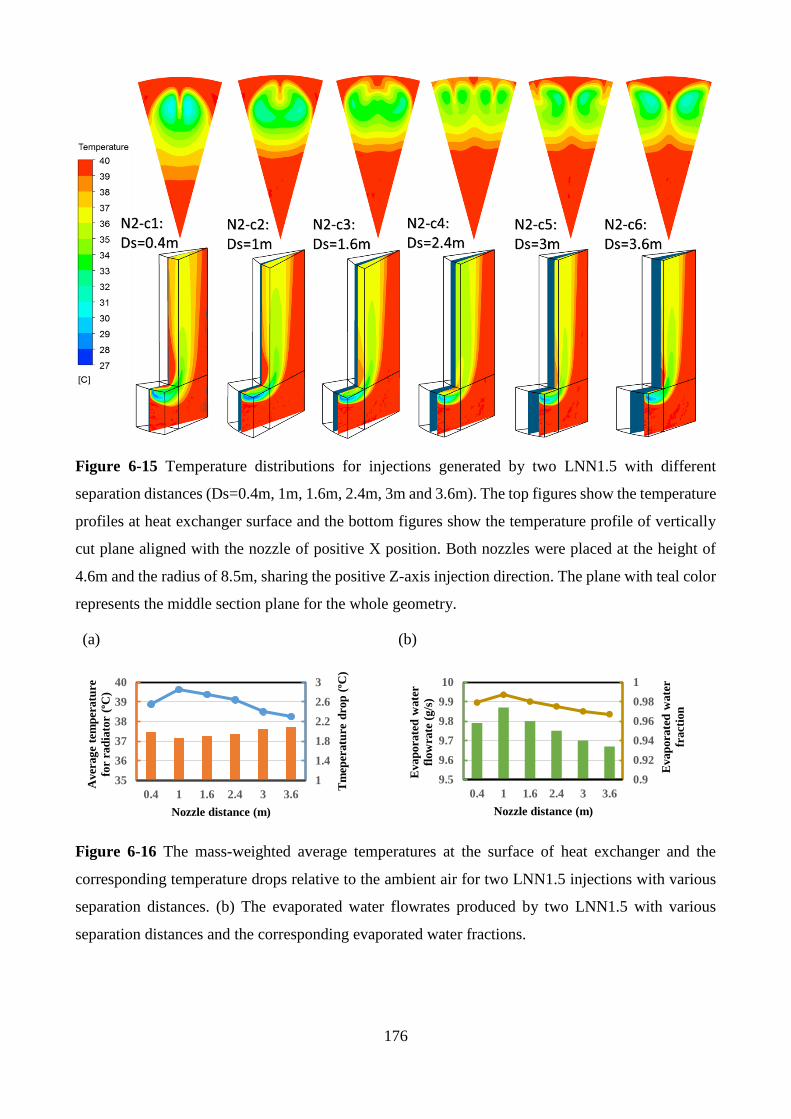
176
Figure 6-15 Temperature distributions for injections generated by two LNN1.5 with different
separation distances (Ds=0.4m, 1m, 1.6m, 2.4m, 3m and 3.6m). The top figures show the temperature
profiles at heat exchanger surface and the bottom figures show the temperature profile of vertically
cut plane aligned with the nozzle of positive X position. Both nozzles were placed at the height of
4.6m and the radius of 8.5m, sharing the positive Z-axis injection direction. The plane with teal color
represents the middle section plane for the whole geometry.
(a)
(b)
Figure 6-16 The mass-weighted average temperatures at the surface of heat exchanger and the
corresponding temperature drops relative to the ambient air for two LNN1.5 injections with various
separation distances. (b) The evaporated water flowrates produced by two LNN1.5 with various
separation distances and the corresponding evaporated water fractions.
1
1.4
1.8
2.2
2.6
3
35
36
37
38
39
40
0.4 1 1.6 2.4 3 3.6
Tm
eper
atu
re d
rop
(ºC
)
Aver
ag
e te
mp
eratu
re
for
rad
iato
r (º
C)
Nozzle distance (m)
0.9
0.92
0.94
0.96
0.98
1
0.4 1 1.6 2.4 3 3.6
9.5
9.6
9.7
9.8
9.9
10
Evap
ora
ted
wate
r
fract
ion
Nozzle distance (m)
Evap
ora
ted
wate
r
flow
rate
(g
/s)
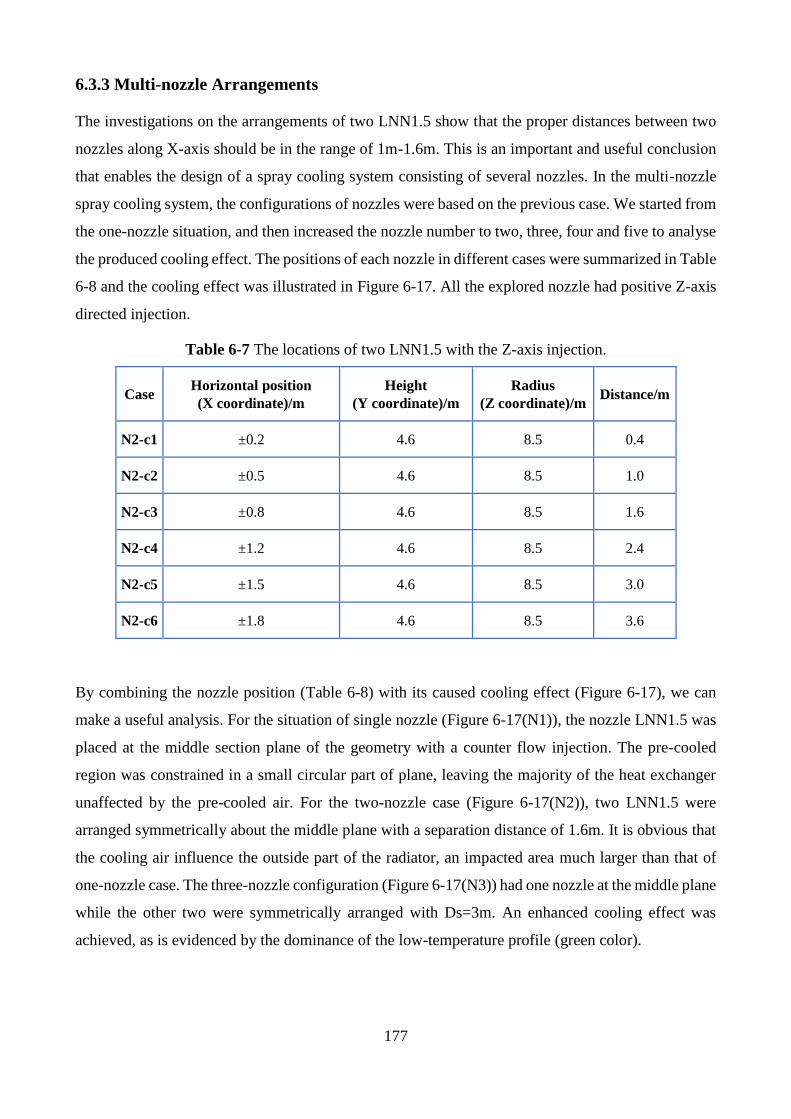
177
6.3.3 Multi-nozzle Arrangements
The investigations on the arrangements of two LNN1.5 show that the proper distances between two
nozzles along X-axis should be in the range of 1m-1.6m. This is an important and useful conclusion
that enables the design of a spray cooling system consisting of several nozzles. In the multi-nozzle
spray cooling system, the configurations of nozzles were based on the previous case. We started from
the one-nozzle situation, and then increased the nozzle number to two, three, four and five to analyse
the produced cooling effect. The positions of each nozzle in different cases were summarized in Table
6-8 and the cooling effect was illustrated in Figure 6-17. All the explored nozzle had positive Z-axis
directed injection.
Table 6-7 The locations of two LNN1.5 with the Z-axis injection.
Case Horizontal position
(X coordinate)/m
Height
(Y coordinate)/m
Radius
(Z coordinate)/m Distance/m
N2-c1 ±0.2 4.6 8.5 0.4
N2-c2 ±0.5 4.6 8.5 1.0
N2-c3 ±0.8 4.6 8.5 1.6
N2-c4 ±1.2 4.6 8.5 2.4
N2-c5 ±1.5 4.6 8.5 3.0
N2-c6 ±1.8 4.6 8.5 3.6
By combining the nozzle position (Table 6-8) with its caused cooling effect (Figure 6-17), we can
make a useful analysis. For the situation of single nozzle (Figure 6-17(N1)), the nozzle LNN1.5 was
placed at the middle section plane of the geometry with a counter flow injection. The pre-cooled
region was constrained in a small circular part of plane, leaving the majority of the heat exchanger
unaffected by the pre-cooled air. For the two-nozzle case (Figure 6-17(N2)), two LNN1.5 were
arranged symmetrically about the middle plane with a separation distance of 1.6m. It is obvious that
the cooling air influence the outside part of the radiator, an impacted area much larger than that of
one-nozzle case. The three-nozzle configuration (Figure 6-17(N3)) had one nozzle at the middle plane
while the other two were symmetrically arranged with Ds=3m. An enhanced cooling effect was
achieved, as is evidenced by the dominance of the low-temperature profile (green color).
178
Table 6-8 Nozzle arrangements for multi-nozzle spray cooling system. The orange bar highlights the
positions of nozzles placed at the middle of the geometry.
Case Nozzle ID Height
(Y coordinate)/m
Horizontal position
(X coordinate) /m
Radius
(Z coordinate)/m
Injection
direction Nozzle type
N1 N1 4.6 0 8.5 Z LNN1.5
N2
N2-1 4.6 0.8 8.5 Z LNN1.5
N2-2 4.6 -0.8 8.5 Z LNN1.5
N3
N3-1 4 0 8.5 Z LNN1.5
N3-2 4.6 1.5 8.5 Z LNN1.5
N3-3 4.6 -1.5 8.5 Z LNN1.5
N4
N4-1 3 1.2 7.5 Z LNN1.5
N4-2 3 -1.2 7.5 Z LNN1.5
N4-3 4.6 1.5 8.5 Z LNN1.5
N4-4 4.6 -1.5 8.5 Z LNN1.5
N5
N5-1 3 1.2 7.5 Z LNN1.5
N5-2 3 -1.2 7.5 Z LNN1.5
N5-3 4 0 8.5 Z LNN1.5
N5-4 4.6 1.5 8.5 Z LNN1.5
N5-5 4.6 -1.5 8.5 Z LNN1.5
When the nozzle number became four ((Figure 6-17(N4))), the nozzles were arranged at two different
heights. Two nozzles were grouped together and symmetrically put at a lower horizontal plane (H=3m)
with a smaller separation distance (Ds=2.4m), giving droplets longer residence time to evaporate.
Another group was placed at a higher horizontal plane of H= 4.6m, but the two nozzles had larger
separation (Ds=3m) to reduce the overlapping of these two sprays. The temperature contour shows
that the majority of the radiator surface was influenced by the cooling air. The stratified temperature
distribution is closely related to the cooling effect at different degrees. The central part of the tower
is not cooled as much as the outside part of the radiator, which would impair the overall performance
of the radiator. Therefore, in order to achieve relatively uniform temperature distribution at the
radiator surface, a system of five LNN1.5 was investigated.
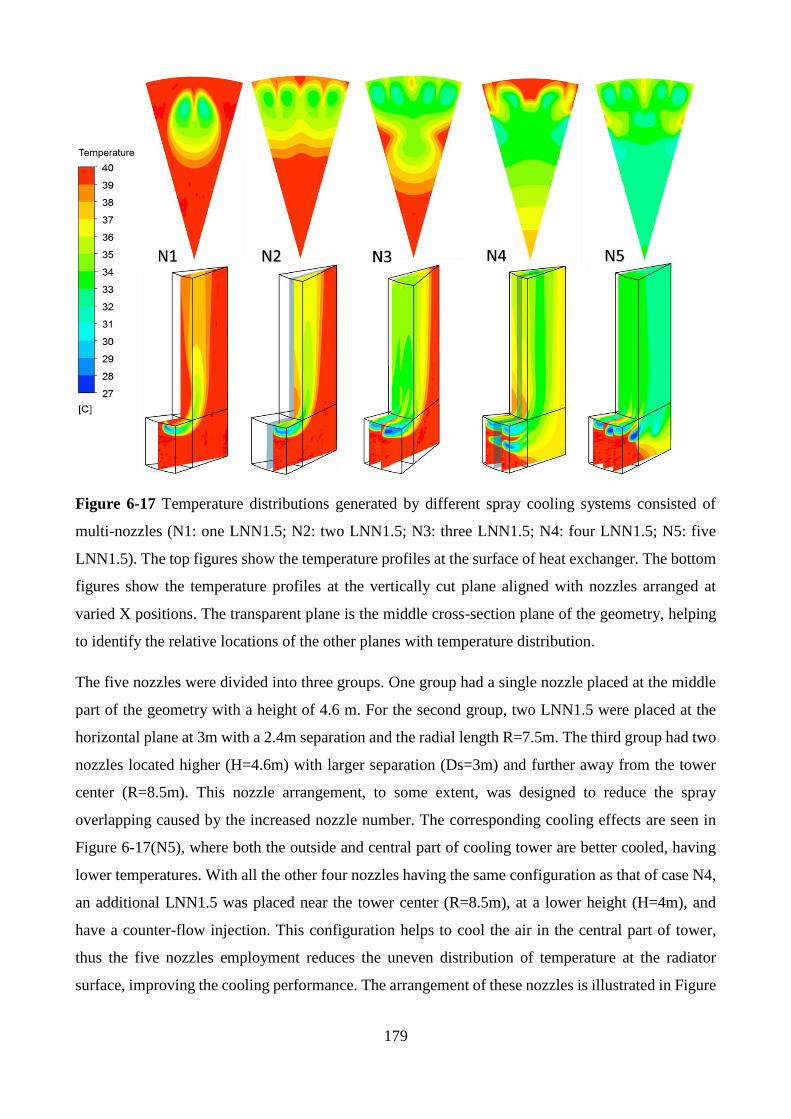
179
Figure 6-17 Temperature distributions generated by different spray cooling systems consisted of
multi-nozzles (N1: one LNN1.5; N2: two LNN1.5; N3: three LNN1.5; N4: four LNN1.5; N5: five
LNN1.5). The top figures show the temperature profiles at the surface of heat exchanger. The bottom
figures show the temperature profiles at the vertically cut plane aligned with nozzles arranged at
varied X positions. The transparent plane is the middle cross-section plane of the geometry, helping
to identify the relative locations of the other planes with temperature distribution.
The five nozzles were divided into three groups. One group had a single nozzle placed at the middle
part of the geometry with a height of 4.6 m. For the second group, two LNN1.5 were placed at the
horizontal plane at 3m with a 2.4m separation and the radial length R=7.5m. The third group had two
nozzles located higher (H=4.6m) with larger separation (Ds=3m) and further away from the tower
center (R=8.5m). This nozzle arrangement, to some extent, was designed to reduce the spray
overlapping caused by the increased nozzle number. The corresponding cooling effects are seen in
Figure 6-17(N5), where both the outside and central part of cooling tower are better cooled, having
lower temperatures. With all the other four nozzles having the same configuration as that of case N4,
an additional LNN1.5 was placed near the tower center (R=8.5m), at a lower height (H=4m), and
have a counter-flow injection. This configuration helps to cool the air in the central part of tower,
thus the five nozzles employment reduces the uneven distribution of temperature at the radiator
surface, improving the cooling performance. The arrangement of these nozzles is illustrated in Figure
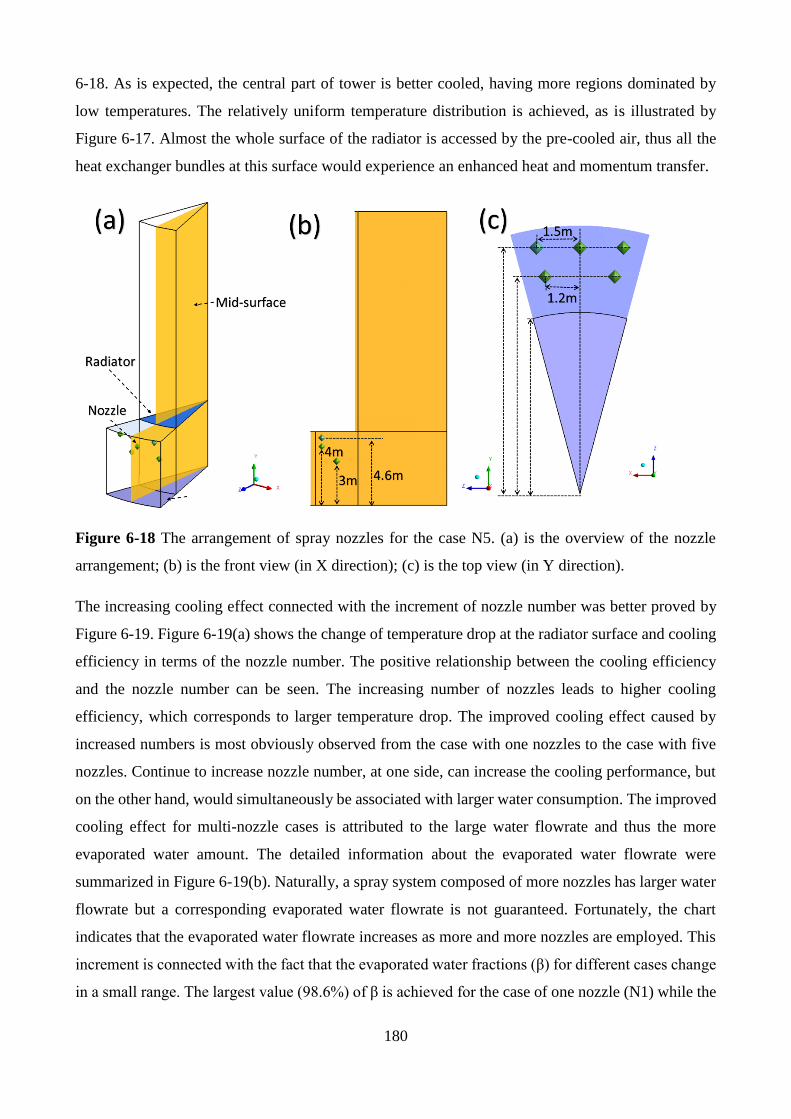
180
6-18. As is expected, the central part of tower is better cooled, having more regions dominated by
low temperatures. The relatively uniform temperature distribution is achieved, as is illustrated by
Figure 6-17. Almost the whole surface of the radiator is accessed by the pre-cooled air, thus all the
heat exchanger bundles at this surface would experience an enhanced heat and momentum transfer.
Figure 6-18 The arrangement of spray nozzles for the case N5. (a) is the overview of the nozzle
arrangement; (b) is the front view (in X direction); (c) is the top view (in Y direction).
The increasing cooling effect connected with the increment of nozzle number was better proved by
Figure 6-19. Figure 6-19(a) shows the change of temperature drop at the radiator surface and cooling
efficiency in terms of the nozzle number. The positive relationship between the cooling efficiency
and the nozzle number can be seen. The increasing number of nozzles leads to higher cooling
efficiency, which corresponds to larger temperature drop. The improved cooling effect caused by
increased numbers is most obviously observed from the case with one nozzles to the case with five
nozzles. Continue to increase nozzle number, at one side, can increase the cooling performance, but
on the other hand, would simultaneously be associated with larger water consumption. The improved
cooling effect for multi-nozzle cases is attributed to the large water flowrate and thus the more
evaporated water amount. The detailed information about the evaporated water flowrate were
summarized in Figure 6-19(b). Naturally, a spray system composed of more nozzles has larger water
flowrate but a corresponding evaporated water flowrate is not guaranteed. Fortunately, the chart
indicates that the evaporated water flowrate increases as more and more nozzles are employed. This
increment is connected with the fact that the evaporated water fractions (β) for different cases change
in a small range. The largest value (98.6%) of β is achieved for the case of one nozzle (N1) while the
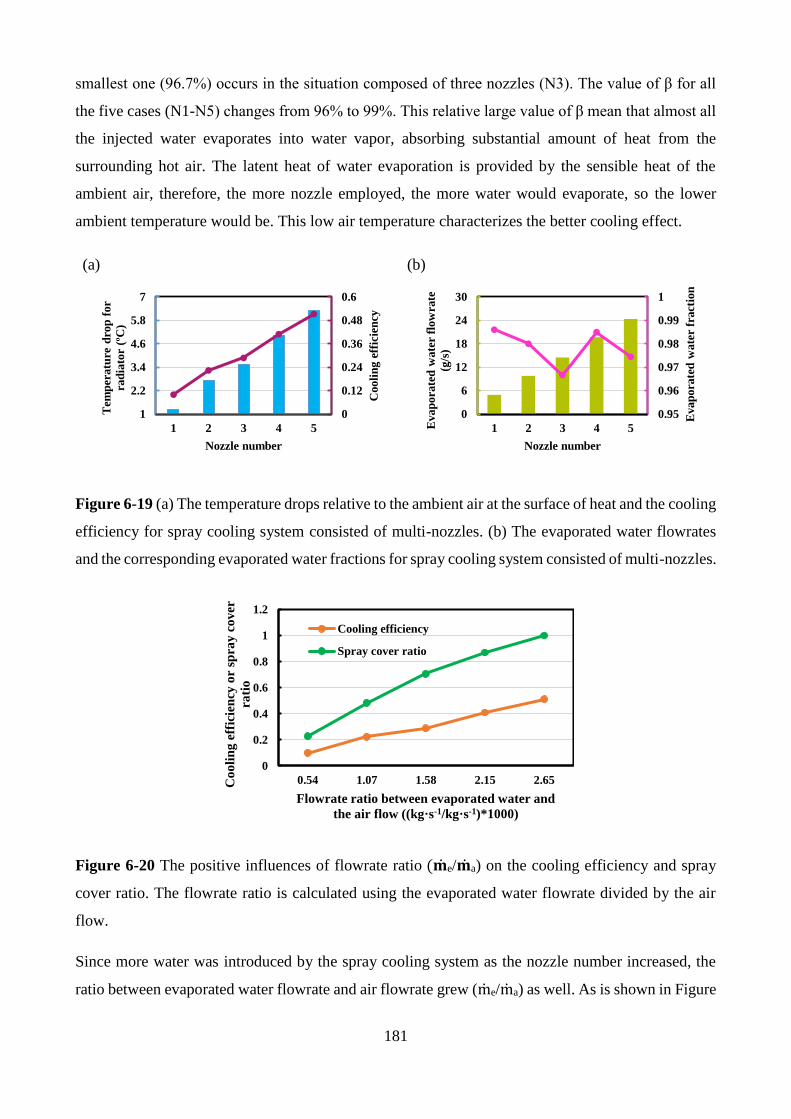
181
smallest one (96.7%) occurs in the situation composed of three nozzles (N3). The value of β for all
the five cases (N1-N5) changes from 96% to 99%. This relative large value of β mean that almost all
the injected water evaporates into water vapor, absorbing substantial amount of heat from the
surrounding hot air. The latent heat of water evaporation is provided by the sensible heat of the
ambient air, therefore, the more nozzle employed, the more water would evaporate, so the lower
ambient temperature would be. This low air temperature characterizes the better cooling effect.
(a)
(b)
Figure 6-19 (a) The temperature drops relative to the ambient air at the surface of heat and the cooling
efficiency for spray cooling system consisted of multi-nozzles. (b) The evaporated water flowrates
and the corresponding evaporated water fractions for spray cooling system consisted of multi-nozzles.
Figure 6-20 The positive influences of flowrate ratio (��e/��a) on the cooling efficiency and spray
cover ratio. The flowrate ratio is calculated using the evaporated water flowrate divided by the air
flow.
Since more water was introduced by the spray cooling system as the nozzle number increased, the
ratio between evaporated water flowrate and air flowrate grew (me/ma) as well. As is shown in Figure
0
0.12
0.24
0.36
0.48
0.6
1
2.2
3.4
4.6
5.8
7
1 2 3 4 5
Cooli
ng
eff
icie
ncy
Tem
per
atu
re d
rop
for
rad
iato
r (º
C)
Nozzle number
0.95
0.96
0.97
0.98
0.99
1
1 2 3 4 5
0
6
12
18
24
30
Evap
ora
ted
wate
r fr
act
ion
Nozzle number
Evap
ora
ted
wate
r fl
ow
rate
(g/s
)
0
0.2
0.4
0.6
0.8
1
1.2
0.54 1.07 1.58 2.15 2.65Co
oli
ng
eff
icie
ncy
or
spra
y c
ov
er
rati
o
Flowrate ratio between evaporated water and
the air flow ((kg·s-1/kg·s-1)*1000)
Cooling efficiency
Spray cover ratio
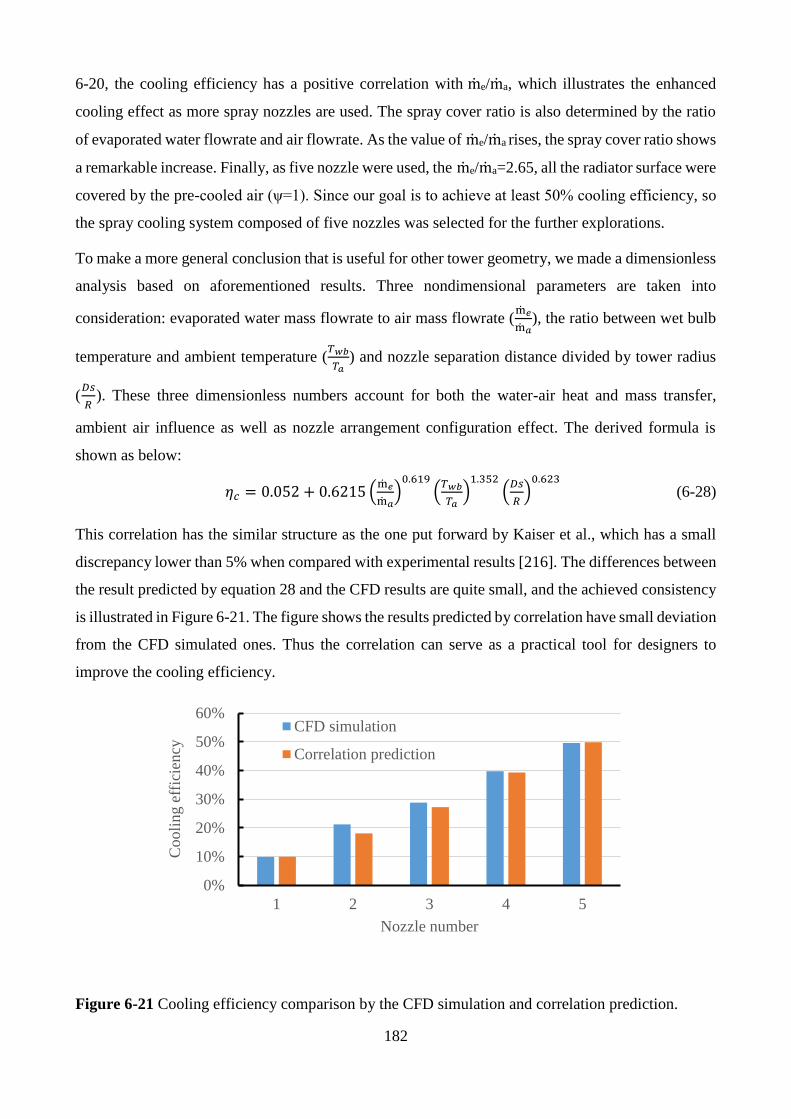
182
6-20, the cooling efficiency has a positive correlation with me/ma, which illustrates the enhanced
cooling effect as more spray nozzles are used. The spray cover ratio is also determined by the ratio
of evaporated water flowrate and air flowrate. As the value of me/ma rises, the spray cover ratio shows
a remarkable increase. Finally, as five nozzle were used, the me/ma=2.65, all the radiator surface were
covered by the pre-cooled air (ψ=1). Since our goal is to achieve at least 50% cooling efficiency, so
the spray cooling system composed of five nozzles was selected for the further explorations.
To make a more general conclusion that is useful for other tower geometry, we made a dimensionless
analysis based on aforementioned results. Three nondimensional parameters are taken into
consideration: evaporated water mass flowrate to air mass flowrate (m𝑒
m𝑎), the ratio between wet bulb
temperature and ambient temperature (𝑇𝑤𝑏
𝑇𝑎) and nozzle separation distance divided by tower radius
(𝐷𝑠
𝑅). These three dimensionless numbers account for both the water-air heat and mass transfer,
ambient air influence as well as nozzle arrangement configuration effect. The derived formula is
shown as below:
𝜂𝑐 = 0.052 + 0.6215 (m𝑒
m𝑎)0.619
(𝑇𝑤𝑏
𝑇𝑎)1.352
(𝐷𝑠
𝑅)0.623
(6-28)
This correlation has the similar structure as the one put forward by Kaiser et al., which has a small
discrepancy lower than 5% when compared with experimental results [216]. The differences between
the result predicted by equation 28 and the CFD results are quite small, and the achieved consistency
is illustrated in Figure 6-21. The figure shows the results predicted by correlation have small deviation
from the CFD simulated ones. Thus the correlation can serve as a practical tool for designers to
improve the cooling efficiency.
Figure 6-21 Cooling efficiency comparison by the CFD simulation and correlation prediction.
0%
10%
20%
30%
40%
50%
60%
1 2 3 4 5
Cooli
ng e
ffic
iency
Nozzle number
CFD simulation
Correlation prediction
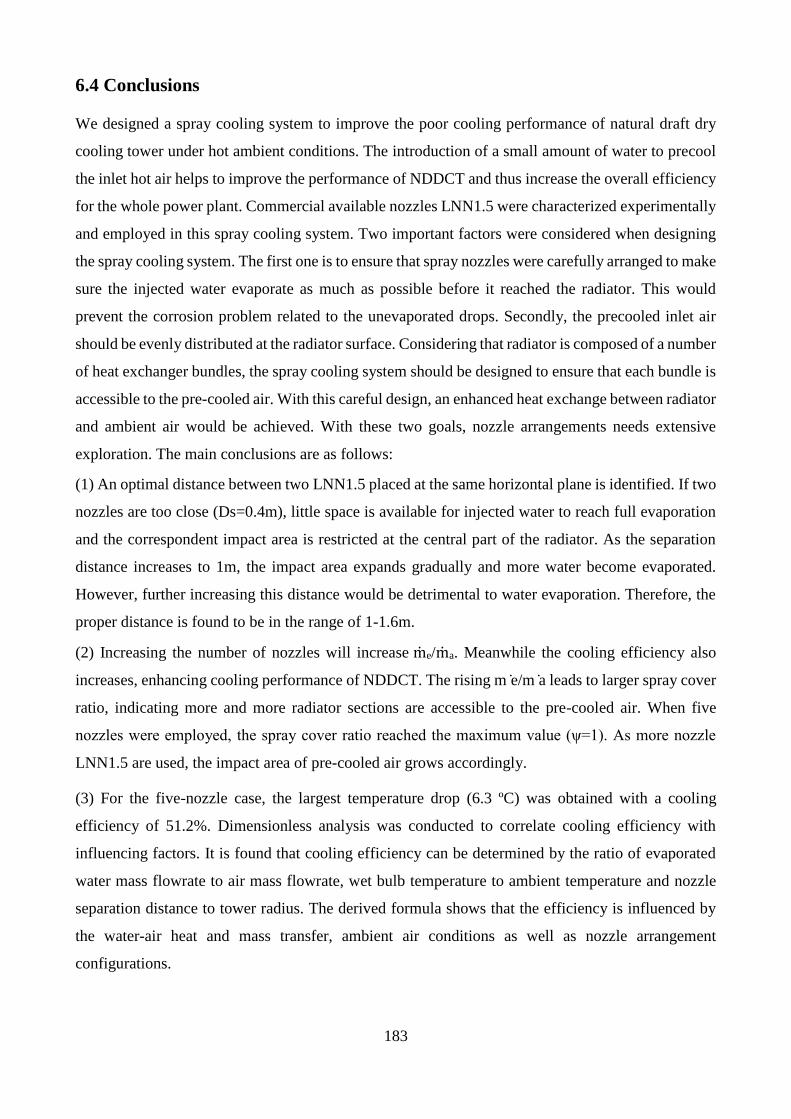
183
6.4 Conclusions
We designed a spray cooling system to improve the poor cooling performance of natural draft dry
cooling tower under hot ambient conditions. The introduction of a small amount of water to precool
the inlet hot air helps to improve the performance of NDDCT and thus increase the overall efficiency
for the whole power plant. Commercial available nozzles LNN1.5 were characterized experimentally
and employed in this spray cooling system. Two important factors were considered when designing
the spray cooling system. The first one is to ensure that spray nozzles were carefully arranged to make
sure the injected water evaporate as much as possible before it reached the radiator. This would
prevent the corrosion problem related to the unevaporated drops. Secondly, the precooled inlet air
should be evenly distributed at the radiator surface. Considering that radiator is composed of a number
of heat exchanger bundles, the spray cooling system should be designed to ensure that each bundle is
accessible to the pre-cooled air. With this careful design, an enhanced heat exchange between radiator
and ambient air would be achieved. With these two goals, nozzle arrangements needs extensive
exploration. The main conclusions are as follows:
(1) An optimal distance between two LNN1.5 placed at the same horizontal plane is identified. If two
nozzles are too close (Ds=0.4m), little space is available for injected water to reach full evaporation
and the correspondent impact area is restricted at the central part of the radiator. As the separation
distance increases to 1m, the impact area expands gradually and more water become evaporated.
However, further increasing this distance would be detrimental to water evaporation. Therefore, the
proper distance is found to be in the range of 1-1.6m.
(2) Increasing the number of nozzles will increase me/ma. Meanwhile the cooling efficiency also
increases, enhancing cooling performance of NDDCT. The rising m e/m a leads to larger spray cover
ratio, indicating more and more radiator sections are accessible to the pre-cooled air. When five
nozzles were employed, the spray cover ratio reached the maximum value (ψ=1). As more nozzle
LNN1.5 are used, the impact area of pre-cooled air grows accordingly.
(3) For the five-nozzle case, the largest temperature drop (6.3 ºC) was obtained with a cooling
efficiency of 51.2%. Dimensionless analysis was conducted to correlate cooling efficiency with
influencing factors. It is found that cooling efficiency can be determined by the ratio of evaporated
water mass flowrate to air mass flowrate, wet bulb temperature to ambient temperature and nozzle
separation distance to tower radius. The derived formula shows that the efficiency is influenced by
the water-air heat and mass transfer, ambient air conditions as well as nozzle arrangement
configurations.

184
Chapter 7 Spray Cooling Tests with Full-scale Natural Draft Dry
Cooling Towers
This Chapter is based on the paper published in Energy. This Chapter describes the detailed
information of the spray cooling tests conducted on the 20m high experimental cooling tower. The
description includes but not limited to the tower construction and configuration, spray cooling system
introduction, design parameters of air-cooled heat exchangers, diesel-based water heating system and
the control and measurement system as well as the arrangement of spray nozzle and measuring
sensors. Experimental data of the performance of this cooling tower have been collected from various
field tests and used to evaluate the cooling performance enhancement produced by the spray-cooling
system.
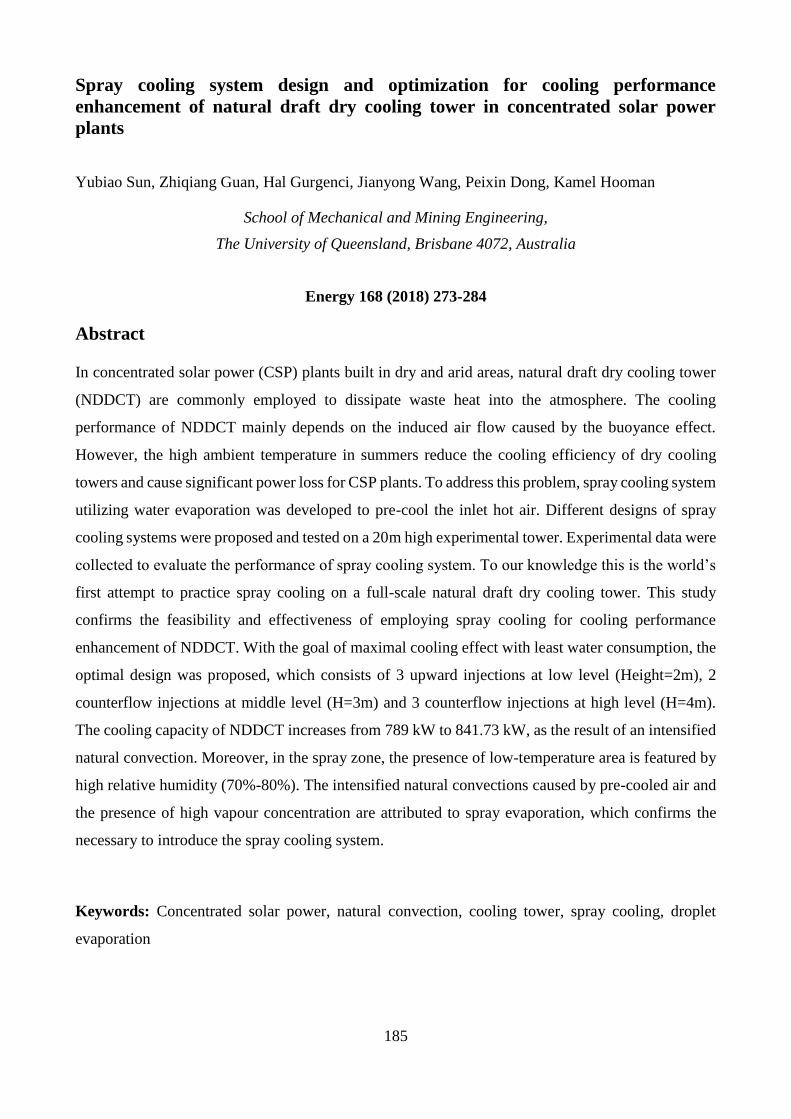
185
Spray cooling system design and optimization for cooling performance
enhancement of natural draft dry cooling tower in concentrated solar power
plants
Yubiao Sun, Zhiqiang Guan, Hal Gurgenci, Jianyong Wang, Peixin Dong, Kamel Hooman
School of Mechanical and Mining Engineering,
The University of Queensland, Brisbane 4072, Australia
Energy 168 (2018) 273-284
Abstract
In concentrated solar power (CSP) plants built in dry and arid areas, natural draft dry cooling tower
(NDDCT) are commonly employed to dissipate waste heat into the atmosphere. The cooling
performance of NDDCT mainly depends on the induced air flow caused by the buoyance effect.
However, the high ambient temperature in summers reduce the cooling efficiency of dry cooling
towers and cause significant power loss for CSP plants. To address this problem, spray cooling system
utilizing water evaporation was developed to pre-cool the inlet hot air. Different designs of spray
cooling systems were proposed and tested on a 20m high experimental tower. Experimental data were
collected to evaluate the performance of spray cooling system. To our knowledge this is the world’s
first attempt to practice spray cooling on a full-scale natural draft dry cooling tower. This study
confirms the feasibility and effectiveness of employing spray cooling for cooling performance
enhancement of NDDCT. With the goal of maximal cooling effect with least water consumption, the
optimal design was proposed, which consists of 3 upward injections at low level (Height=2m), 2
counterflow injections at middle level (H=3m) and 3 counterflow injections at high level (H=4m).
The cooling capacity of NDDCT increases from 789 kW to 841.73 kW, as the result of an intensified
natural convection. Moreover, in the spray zone, the presence of low-temperature area is featured by
high relative humidity (70%-80%). The intensified natural convections caused by pre-cooled air and
the presence of high vapour concentration are attributed to spray evaporation, which confirms the
necessary to introduce the spray cooling system.
Keywords: Concentrated solar power, natural convection, cooling tower, spray cooling, droplet
evaporation

186
7.1 Introduction
The abundant and clean solar energy is a promising alternative to the highly-polluted, nearly-
exhausted fossil fuels. In addition to its green nature, the amount of this energy source is staggering:
the energy received by the Earth from solar radiation in just an hour is equal to the global annual
energy consumption [10]. Concentrated solar power (CSP) plants convert energy contained in solar
irradiation into electricity. Specifically, concentrated solar power (CSP) harvests the incident sunlight
via a field of mirrors, and then the concentrated sunlight is converted to heat by absorbers. The
converted heat is carried away from absorbers stored in a thermal energy storage system. Then the
stored heat is delivered by the heat transfer fluid to drive a steam turbine to generate electricity [217].
A CSP plant with two-tank molten salt storage system is illustrated in Figure 7-1. Direct Normal
Insolation (DNI) reflected and concentrated by a receiver/absorber is converted into heat to produce
high-temperature and high-pressure steam, which drives Rankine power cycle for electricity
generation [218]. Typically, a CSP system requires high DNI for cost-effective operation. An
acknowledged fact is that an economical CSP system is only available for locations with DNI above
5 kW h/(m2 day) or 1800 kWh/(m2 year) [219]. DNI has a significant impact on solar system cost and
sites with strong solar radiation can achieve more attractive levelled [220]. Due to the fluctuating and
intermittent nature of solar irradiance, a fossil back-up burner or a thermal storage unit is commonly
employed to maintain constant steam parameters at fluctuant solar irradiation or even at the time of
no shining. Normally a natural gas burner is used to produce steam at the time of insufficient radiation
[221]. Except for the solar radiation, CSP plants require a large area for their solar field,
approximately a land area of 20,234 m2 is required per megawatt of electricity produced in a solar
thermal power plant [218][222][220].
This technology turns out to be particularly useful for the isolated, remote communities in Africa or
Australia. The sparsely populated regions need small-scale cost-effective solar power plants (1-10
MW) to meet their energy needs. In essence, the CSP plants is a heat engine and cooling tower is an
integral part for waste heat removal. Generally, most CSP plants are built in sunny arid regions with
abundant solar irritation but limited water resources. The stresses placed on water resources make
natural draft dry cooling tower (NDDCT), with the advantages of low water consumption, low noise,
simple maintenance and long service life, increasingly attractive for CSP plants. By removing the
same amount of waste heat, dry cooling towers consume 90% less water than wet cooling towers.
But NDDCT is subject to weather conditions and suffers from deteriorated performance during hot
summer days. Its poor performance negatively affects the efficiency and power output of the turbine,
especially when the sunlight is strongest [5]. Atmospheric conditions, in particular the ambient air

187
temperatures, have a huge impact on the performance of dry cooling towers. The deteriorated
performance of dry cooling tower causes the great fluctuation of turbine back pressure, which would
negatively influence on the electricity output. It is reported that the weather fluctuation can lead to a
maximum power output variation in the range of 5–10% of the nominal capacity [223]. During the
hottest summer period when air conditioning is in full operation, countries like China and Kuwait
often experience unwanted grid ‘cut-off’ due to the coupled effect of reduced power output and
excessive demand from the grid [224].
A promising solution is to introduce a spray cooling system to precool the inlet air and thus enhance
the cooling performance of NDDCT. Spray cooling is also referred to as evaporative cooling as it
requires the evaporation of water to remove heat. The latent heat related to water evaporation leads
to the reduction of air temperature. The vapour from vaporised water increases simultaneously,
creating wet air conditions. With its virtues of simplicity and low energy cost, spray cooling is
commonly used in air conditioning [225], food refrigeration [196] and gas turbine fogging [90].
Paepe et al. [226] developed a two-phase flow model to design a saturation tower for micro humid
air turbine. They found that the most crucial parameter for evaporation process is droplet diameter
and proposed a cross-current spray tower as saturator for the chosen turbine. Currently, spray cooling
is mainly studied for gas turbine inlet cooling, few studied focus on its application in cooling towers.
As a relatively immature field, the available publications on spray cooling for NDDCT are quite
limited.
S.P. Fisenko et al. [114] used nine ordinary differential equations to model the evaporative cooling
process, which is capable of calculating the joint evaporation of water droplets and films. Then they
even developed a mathematical model to predict evaporative cooling for a mechanical draft cooling
tower and revealed that the average cube of the droplet radius mainly determines thermal efficiency
[227]. He et al. studied wetted-medium evaporative pre-cooling based on the assumption that porous
media provide large contact surface areas and facilitate the heat and mass exchange between water
and air flow [228]. They even explored the water evaporation rate and water entrainment off the
media and put forward some correlations for the cooling efficiency and pressure drop [229]. More
details about using wet media for precooling can be found in [230].
Alkhedhair et al. developed 3D numerical model to study the inlet air precooling for NDDCT and
found that droplet transport and evaporation mainly depend on droplet size and air velocity [27,133].
They also developed an adaptable model to represent sprays from hollow-cone nozzle by taking into
consideration the evolution of droplet size distribution and the air/droplets momentum exchange
[165]. Xia et al. modelled and compared the cooling performance of sprays from a vertically arranged
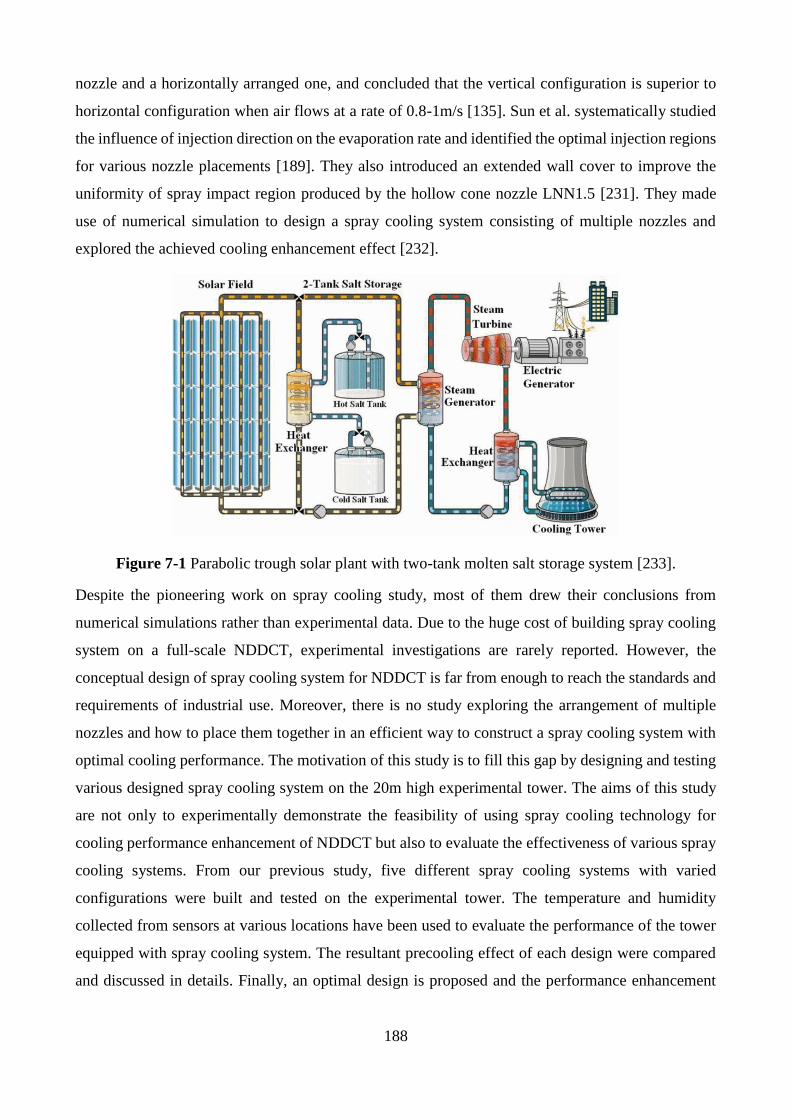
188
nozzle and a horizontally arranged one, and concluded that the vertical configuration is superior to
horizontal configuration when air flows at a rate of 0.8-1m/s [135]. Sun et al. systematically studied
the influence of injection direction on the evaporation rate and identified the optimal injection regions
for various nozzle placements [189]. They also introduced an extended wall cover to improve the
uniformity of spray impact region produced by the hollow cone nozzle LNN1.5 [231]. They made
use of numerical simulation to design a spray cooling system consisting of multiple nozzles and
explored the achieved cooling enhancement effect [232].
Figure 7-1 Parabolic trough solar plant with two-tank molten salt storage system [233].
Despite the pioneering work on spray cooling study, most of them drew their conclusions from
numerical simulations rather than experimental data. Due to the huge cost of building spray cooling
system on a full-scale NDDCT, experimental investigations are rarely reported. However, the
conceptual design of spray cooling system for NDDCT is far from enough to reach the standards and
requirements of industrial use. Moreover, there is no study exploring the arrangement of multiple
nozzles and how to place them together in an efficient way to construct a spray cooling system with
optimal cooling performance. The motivation of this study is to fill this gap by designing and testing
various designed spray cooling system on the 20m high experimental tower. The aims of this study
are not only to experimentally demonstrate the feasibility of using spray cooling technology for
cooling performance enhancement of NDDCT but also to evaluate the effectiveness of various spray
cooling systems. From our previous study, five different spray cooling systems with varied
configurations were built and tested on the experimental tower. The temperature and humidity
collected from sensors at various locations have been used to evaluate the performance of the tower
equipped with spray cooling system. The resultant precooling effect of each design were compared
and discussed in details. Finally, an optimal design is proposed and the performance enhancement
189
mechanism is explained. The influences of spray cooling system on the overall behavior of cooling
tower are described in details in the following parts.
7.2 Experimental Facility
7.2.1 Natural Draft Dry Cooling Tower Description
The experimental NDDCT has a hyperbolic shape and a height of 20 m. As is shown in Figure 7-2.
The base and top diameter of the NDDCT are 12.525 m. The tower is constructed using a steel truss
and a PVC membrane. It was built in the Gatton campus of the University of Queensland (UQ). As
part of the ambitious 1MW CSP plant exploiting supercritical carbon dioxide Brayton cycle for
electric generation, this cooling tower has a flexible design allowing operation across the range of
dry, wet, and hybrid cooling modes.
Figure 7-2 Configuration of NDDCT for experimental tests. The dimension is millimetre.
The air-cooled heat exchanger used for the UQ cooling tower were provided by Thermex Company.
18 individual heat exchanger bundles were horizontally installed at a height of 5 m. Figure 7-3 shows
the arrangement of the heat exchanger bundles. Each heat exchanger bundle consists of 22 parallel
circuits. Each circuit have 10 tubes delivering 10 passes of the entire length of the bundle. This
ensures that the fins along the entire length of the bundle will be evenly heated despite the sensible
heat transfer from the working fluid. Figure 7-4 shows tube arrangement of the heat exchanger bundle.
190
Tubes are constructed from pure copper seamless tube with an outer diameter of 9.53mm and a wall
thickness of 0.3mm. Fluid flow is arranged so that hot water enters from the top of the bundle and
exits at the bottom, thus delivering an optimal counter flow heat exchanger configuration. The water
circuits are arranged to eliminate potential vapor traps that may inhibit flow through individual
circuits. The detailed information of the air-cooled heat exchanger are presented in 7.2.2 Heating
system
Since the experimental cooling tower is isolated from the CSP plant, the heat input into the system
for experimental tests is produced by a heater. As illustrated in Figure 7-5, the hot water supply for
the cooling tower is composed by three parts: heater, water tank and water delivery pipe. Diesel is
used as fuel for the combustor and the heat released from diesel combustion is directed into the heater,
where cold water from the water tank is circulated to be heated to the pre-set temperature. Two pumps
work together to deliver the water from the water tank to the cooling tower and to the heater at the
same time. The total heat provided by the heater can be adjusted at three levels, i.e., 400 kW, 600 kW
and 840 kW. The heated water temperature is regulated using a thermostat. If the temperature exceeds
60°C the heater is turned off. The water flowrate and heated water temperature can be obtained via
the mass flowmeter and temperature sensor installed on the supply pipes. The flowrate of water can
be controlled via the pump fitted with a variable frequency drive (VFD). The VFD is used for
adjusting a flow to the actual demand. Significant power savings can be achieved when using a
variable-frequency drive to control the frequency of the electrical power supplied to the motor, which
determines the rotational speed of an alternating current electric motor. In addition to energy saving,
the other benefit of using a VFD-fitted pump is that it provides a constant water pressure supply. This
is because when the operating pressure is set an on the controller and the pump maintains this, it stops
the pressure and flow spikes that occur with most conventional house and irrigation pumps.
Table 7-1.
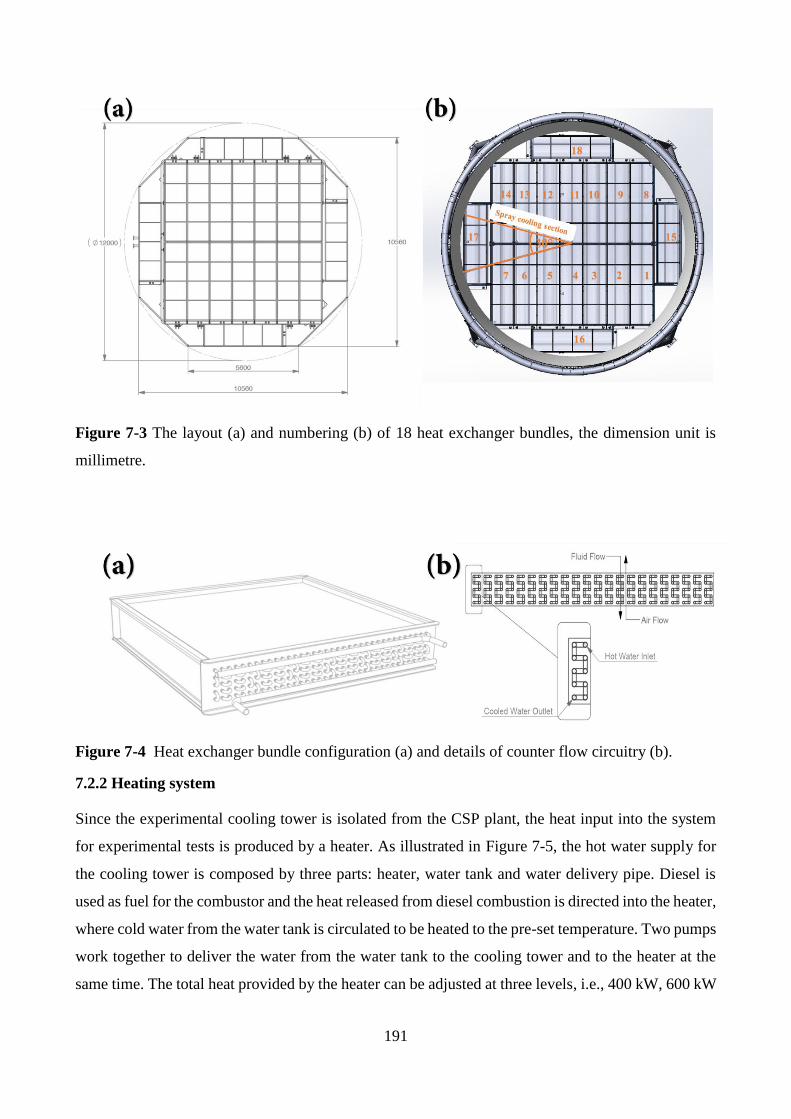
191
Figure 7-3 The layout (a) and numbering (b) of 18 heat exchanger bundles, the dimension unit is
millimetre.
Figure 7-4 Heat exchanger bundle configuration (a) and details of counter flow circuitry (b).
7.2.2 Heating system
Since the experimental cooling tower is isolated from the CSP plant, the heat input into the system
for experimental tests is produced by a heater. As illustrated in Figure 7-5, the hot water supply for
the cooling tower is composed by three parts: heater, water tank and water delivery pipe. Diesel is
used as fuel for the combustor and the heat released from diesel combustion is directed into the heater,
where cold water from the water tank is circulated to be heated to the pre-set temperature. Two pumps
work together to deliver the water from the water tank to the cooling tower and to the heater at the
same time. The total heat provided by the heater can be adjusted at three levels, i.e., 400 kW, 600 kW
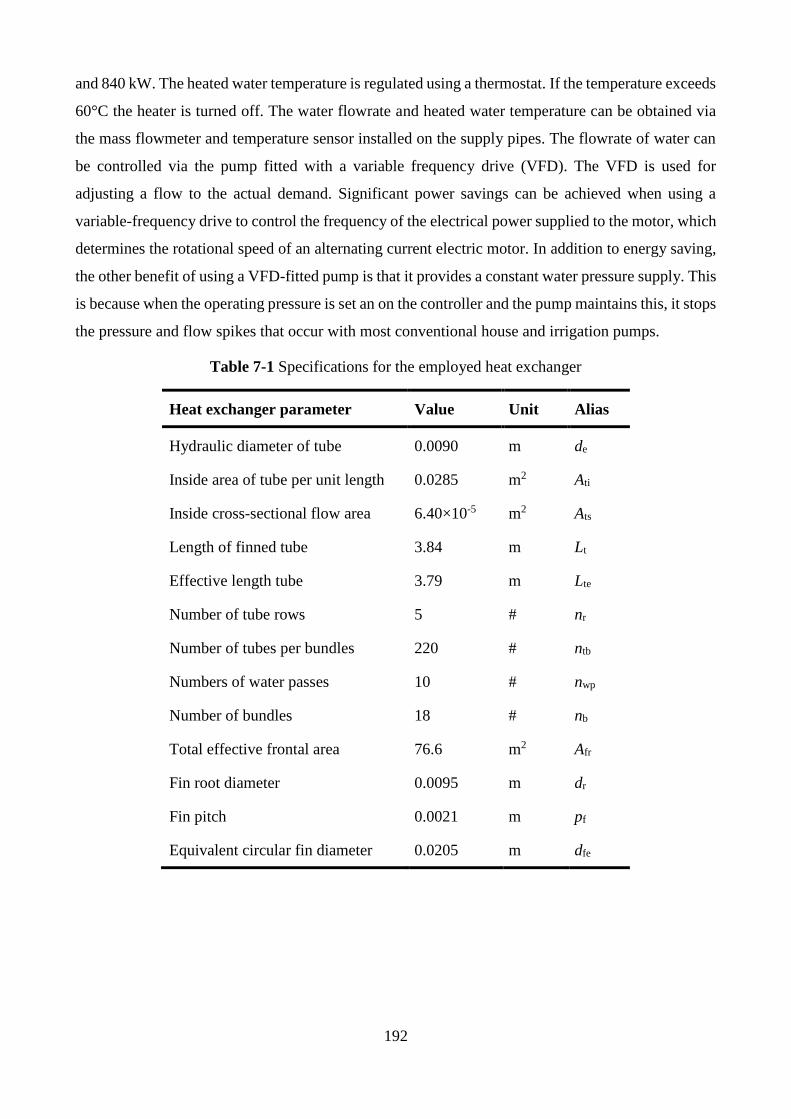
192
and 840 kW. The heated water temperature is regulated using a thermostat. If the temperature exceeds
60°C the heater is turned off. The water flowrate and heated water temperature can be obtained via
the mass flowmeter and temperature sensor installed on the supply pipes. The flowrate of water can
be controlled via the pump fitted with a variable frequency drive (VFD). The VFD is used for
adjusting a flow to the actual demand. Significant power savings can be achieved when using a
variable-frequency drive to control the frequency of the electrical power supplied to the motor, which
determines the rotational speed of an alternating current electric motor. In addition to energy saving,
the other benefit of using a VFD-fitted pump is that it provides a constant water pressure supply. This
is because when the operating pressure is set an on the controller and the pump maintains this, it stops
the pressure and flow spikes that occur with most conventional house and irrigation pumps.
Table 7-1 Specifications for the employed heat exchanger
Heat exchanger parameter Value Unit Alias
Hydraulic diameter of tube 0.0090 m de
Inside area of tube per unit length 0.0285 m2 Ati
Inside cross-sectional flow area 6.40×10⁻⁵ m2 Ats
Length of finned tube 3.84 m Lt
Effective length tube 3.79 m Lte
Number of tube rows 5 # nr
Number of tubes per bundles 220 # ntb
Numbers of water passes 10 # nwp
Number of bundles 18 # nb
Total effective frontal area 76.6 m2 Afr
Fin root diameter 0.0095 m dr
Fin pitch 0.0021 m pf
Equivalent circular fin diameter 0.0205 m dfe
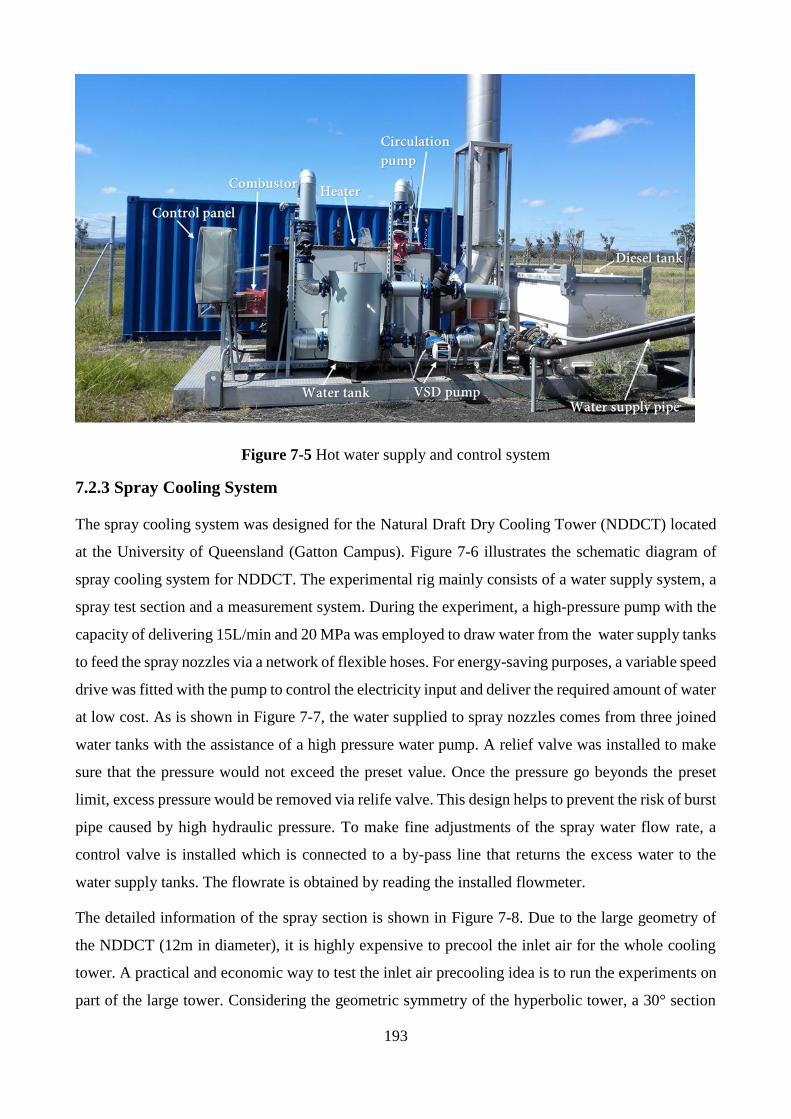
193
Figure 7-5 Hot water supply and control system
7.2.3 Spray Cooling System
The spray cooling system was designed for the Natural Draft Dry Cooling Tower (NDDCT) located
at the University of Queensland (Gatton Campus). Figure 7-6 illustrates the schematic diagram of
spray cooling system for NDDCT. The experimental rig mainly consists of a water supply system, a
spray test section and a measurement system. During the experiment, a high-pressure pump with the
capacity of delivering 15L/min and 20 MPa was employed to draw water from the water supply tanks
to feed the spray nozzles via a network of flexible hoses. For energy-saving purposes, a variable speed
drive was fitted with the pump to control the electricity input and deliver the required amount of water
at low cost. As is shown in Figure 7-7, the water supplied to spray nozzles comes from three joined
water tanks with the assistance of a high pressure water pump. A relief valve was installed to make
sure that the pressure would not exceed the preset value. Once the pressure go beyonds the preset
limit, excess pressure would be removed via relife valve. This design helps to prevent the risk of burst
pipe caused by high hydraulic pressure. To make fine adjustments of the spray water flow rate, a
control valve is installed which is connected to a by-pass line that returns the excess water to the
water supply tanks. The flowrate is obtained by reading the installed flowmeter.
The detailed information of the spray section is shown in Figure 7-8. Due to the large geometry of
the NDDCT (12m in diameter), it is highly expensive to precool the inlet air for the whole cooling
tower. A practical and economic way to test the inlet air precooling idea is to run the experiments on
part of the large tower. Considering the geometric symmetry of the hyperbolic tower, a 30° section

194
was chosen to study these spray cooling techniques. The 30° section wedge was seperated from the
rest of the NDDCT by two vertically erected sheets of tarpaulin. The tarpaulin was made of canvas
with a strength that can withstand crosswind as strong as 25 m/s. Another function of the fabricated
canvas is to protect the injected water droplets from being blow away by the crosswind. Spray nozzles
were mounted on the horizontal fixed beam, which served as the support structure for the spray
nozzles. The spray nozzle support structure was manufactured from aluminum to reduce the overall
weight of the system. The 4m long beams were clamped to three fixed posts in the ground. Since the
height of radially directed beams can be adjusted, the spray nozzles mounted onto these beams were
adjustable as well. The radial locations as well the injection directions of employed nozzles can be
changed by some easy maneuvers.
Figure 7-6 Schematic diagram of the spray cooling system for NDDCT
In this study, the swirl atomizer nozzle LNN1.5 from Spraying Systems Co. was chosen to
disintegrate the bulk liquid into fine droplets and to precool the inlet air. Compared with solid-cone
nozzles, this hollow cone nozzle produces an especially finer, atomized liquid flow at moderate
pressure, with spray patterns characterized by a ring-shaped impact area. These features give the
LNN1.5 an edge to be employed for spray cooling application. The details of the nozzle are shown in
Table 7-2.
For each injection case, the total flowrate was fixed to 0.0234 kg/s. For each LNN1.5, the flow rate
was around 0.0029 kg/s. This low flowrate was chosen considering the pre-vailing ambient conditions
to ensure all spray water droplets evaporate before they hit the radiator thus preventing, potential
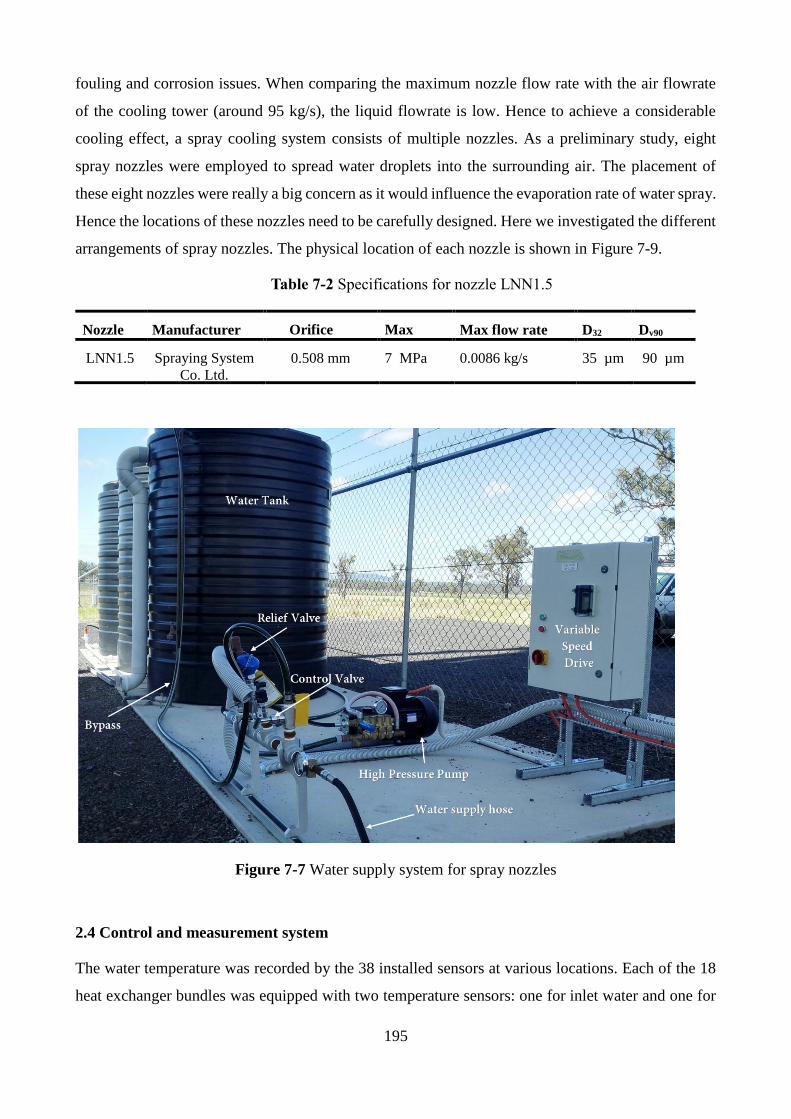
195
fouling and corrosion issues. When comparing the maximum nozzle flow rate with the air flowrate
of the cooling tower (around 95 kg/s), the liquid flowrate is low. Hence to achieve a considerable
cooling effect, a spray cooling system consists of multiple nozzles. As a preliminary study, eight
spray nozzles were employed to spread water droplets into the surrounding air. The placement of
these eight nozzles were really a big concern as it would influence the evaporation rate of water spray.
Hence the locations of these nozzles need to be carefully designed. Here we investigated the different
arrangements of spray nozzles. The physical location of each nozzle is shown in Figure 7-9.
Table 7-2 Specifications for nozzle LNN1.5
Nozzle Manufacturer Orifice
diameter
Max
pressure
Max flow rate
D32
Dv90
LNN1.5 Spraying System
Co. Ltd.
0.508 mm 7 MPa 0.0086 kg/s 35 µm 90 µm
Figure 7-7 Water supply system for spray nozzles
2.4 Control and measurement system
The water temperature was recorded by the 38 installed sensors at various locations. Each of the 18
heat exchanger bundles was equipped with two temperature sensors: one for inlet water and one for
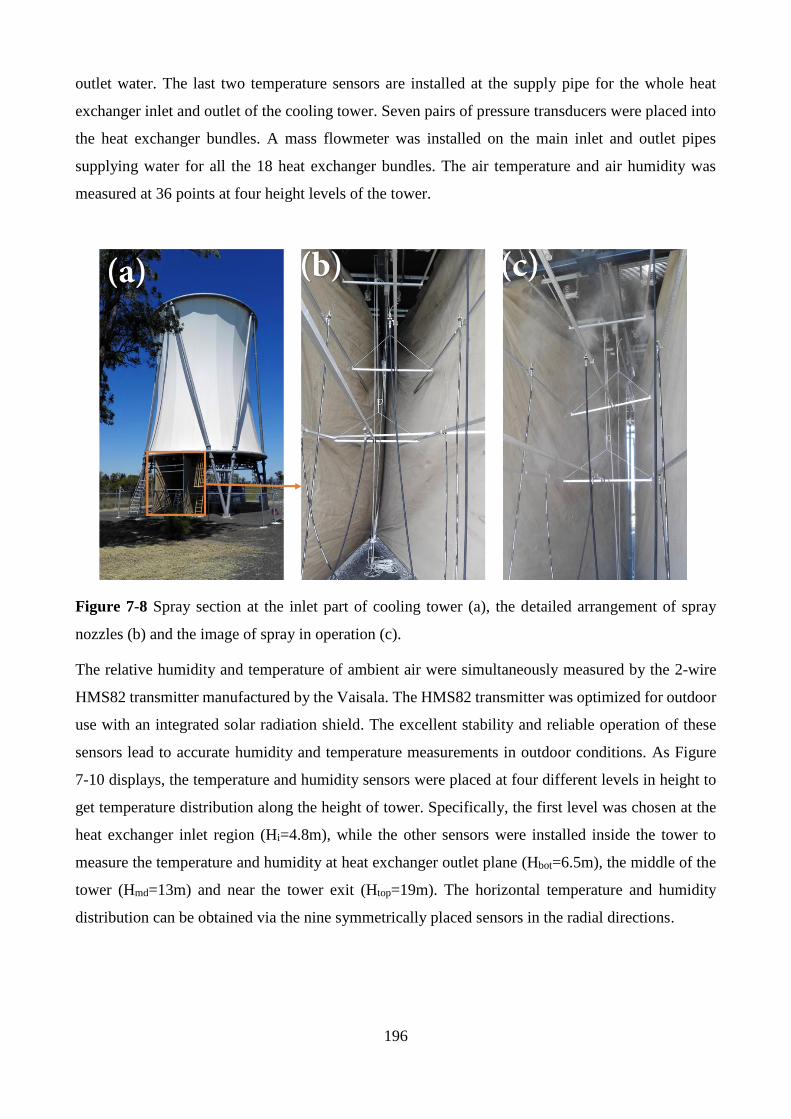
196
outlet water. The last two temperature sensors are installed at the supply pipe for the whole heat
exchanger inlet and outlet of the cooling tower. Seven pairs of pressure transducers were placed into
the heat exchanger bundles. A mass flowmeter was installed on the main inlet and outlet pipes
supplying water for all the 18 heat exchanger bundles. The air temperature and air humidity was
measured at 36 points at four height levels of the tower.
Figure 7-8 Spray section at the inlet part of cooling tower (a), the detailed arrangement of spray
nozzles (b) and the image of spray in operation (c).
The relative humidity and temperature of ambient air were simultaneously measured by the 2-wire
HMS82 transmitter manufactured by the Vaisala. The HMS82 transmitter was optimized for outdoor
use with an integrated solar radiation shield. The excellent stability and reliable operation of these
sensors lead to accurate humidity and temperature measurements in outdoor conditions. As Figure
7-10 displays, the temperature and humidity sensors were placed at four different levels in height to
get temperature distribution along the height of tower. Specifically, the first level was chosen at the
heat exchanger inlet region (Hi=4.8m), while the other sensors were installed inside the tower to
measure the temperature and humidity at heat exchanger outlet plane (Hbot=6.5m), the middle of the
tower (Hmd=13m) and near the tower exit (Htop=19m). The horizontal temperature and humidity
distribution can be obtained via the nine symmetrically placed sensors in the radial directions.
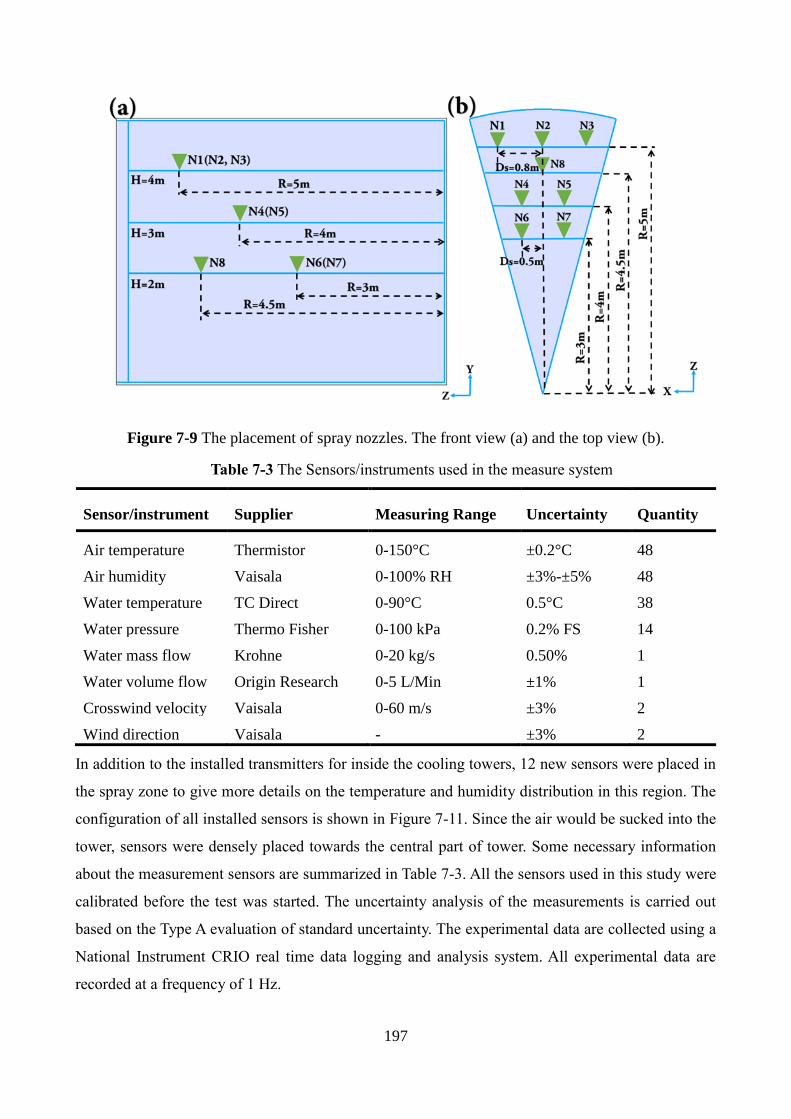
197
Figure 7-9 The placement of spray nozzles. The front view (a) and the top view (b).
Table 7-3 The Sensors/instruments used in the measure system
Sensor/instrument Supplier Measuring Range Uncertainty Quantity
Air temperature Thermistor 0-150°C ±0.2°C 48
Air humidity Vaisala 0-100% RH ±3%-±5% 48
Water temperature TC Direct 0-90°C 0.5°C 38
Water pressure Thermo Fisher 0-100 kPa 0.2% FS 14
Water mass flow Krohne 0-20 kg/s 0.50% 1
Water volume flow Origin Research 0-5 L/Min ±1% 1
Crosswind velocity Vaisala 0-60 m/s ±3% 2
Wind direction Vaisala - ±3% 2
In addition to the installed transmitters for inside the cooling towers, 12 new sensors were placed in
the spray zone to give more details on the temperature and humidity distribution in this region. The
configuration of all installed sensors is shown in Figure 7-11. Since the air would be sucked into the
tower, sensors were densely placed towards the central part of tower. Some necessary information
about the measurement sensors are summarized in Table 7-3. All the sensors used in this study were
calibrated before the test was started. The uncertainty analysis of the measurements is carried out
based on the Type A evaluation of standard uncertainty. The experimental data are collected using a
National Instrument CRIO real time data logging and analysis system. All experimental data are
recorded at a frequency of 1 Hz.
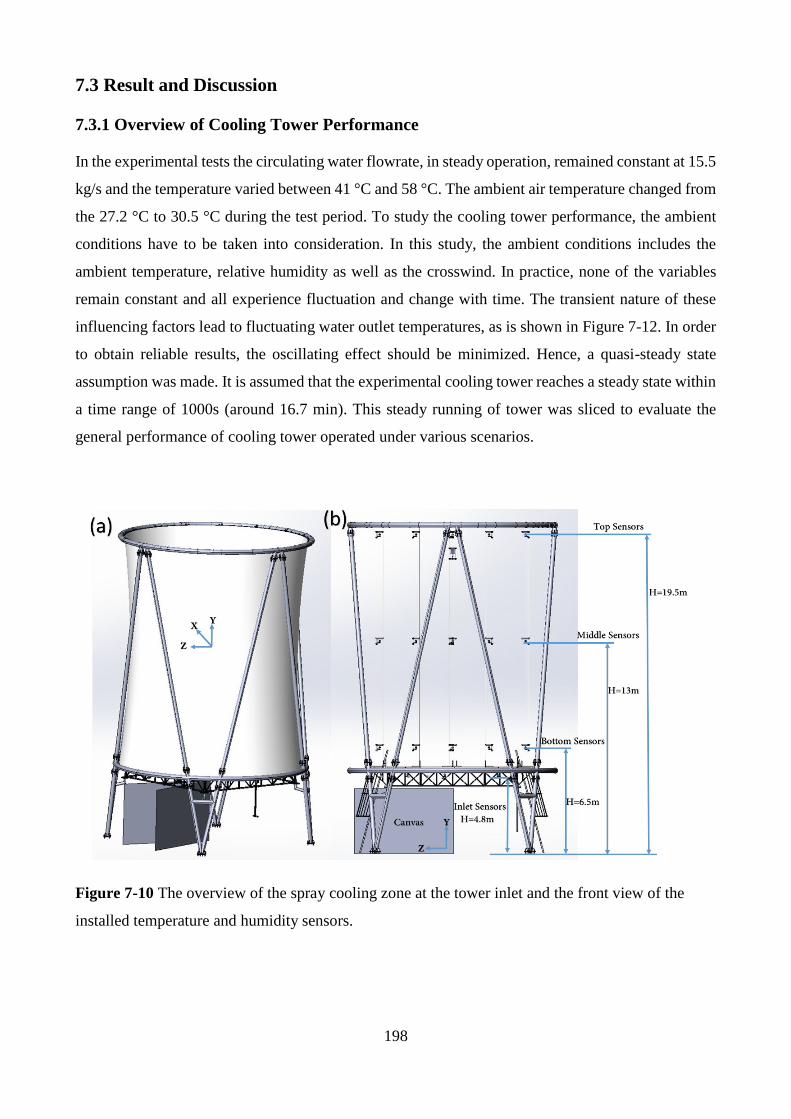
198
7.3 Result and Discussion
7.3.1 Overview of Cooling Tower Performance
In the experimental tests the circulating water flowrate, in steady operation, remained constant at 15.5
kg/s and the temperature varied between 41 °C and 58 °C. The ambient air temperature changed from
the 27.2 °C to 30.5 °C during the test period. To study the cooling tower performance, the ambient
conditions have to be taken into consideration. In this study, the ambient conditions includes the
ambient temperature, relative humidity as well as the crosswind. In practice, none of the variables
remain constant and all experience fluctuation and change with time. The transient nature of these
influencing factors lead to fluctuating water outlet temperatures, as is shown in Figure 7-12. In order
to obtain reliable results, the oscillating effect should be minimized. Hence, a quasi-steady state
assumption was made. It is assumed that the experimental cooling tower reaches a steady state within
a time range of 1000s (around 16.7 min). This steady running of tower was sliced to evaluate the
general performance of cooling tower operated under various scenarios.
Figure 7-10 The overview of the spray cooling zone at the tower inlet and the front view of the
installed temperature and humidity sensors.
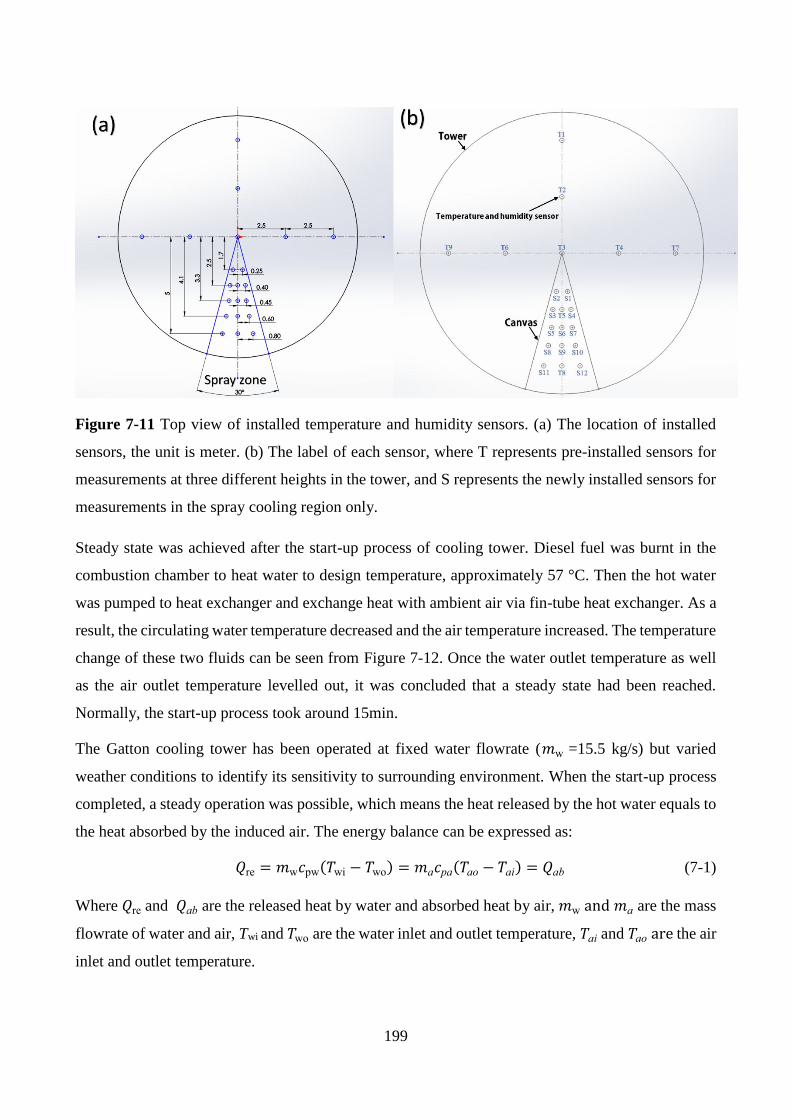
199
Figure 7-11 Top view of installed temperature and humidity sensors. (a) The location of installed
sensors, the unit is meter. (b) The label of each sensor, where T represents pre-installed sensors for
measurements at three different heights in the tower, and S represents the newly installed sensors for
measurements in the spray cooling region only.
Steady state was achieved after the start-up process of cooling tower. Diesel fuel was burnt in the
combustion chamber to heat water to design temperature, approximately 57 °C. Then the hot water
was pumped to heat exchanger and exchange heat with ambient air via fin-tube heat exchanger. As a
result, the circulating water temperature decreased and the air temperature increased. The temperature
change of these two fluids can be seen from Figure 7-12. Once the water outlet temperature as well
as the air outlet temperature levelled out, it was concluded that a steady state had been reached.
Normally, the start-up process took around 15min.
The Gatton cooling tower has been operated at fixed water flowrate (𝑚w =15.5 kg/s) but varied
weather conditions to identify its sensitivity to surrounding environment. When the start-up process
completed, a steady operation was possible, which means the heat released by the hot water equals to
the heat absorbed by the induced air. The energy balance can be expressed as:
𝑄re = 𝑚w𝑐pw(𝑇wi − 𝑇wo) = 𝑚a𝑐pa(𝑇ao − 𝑇ai) = 𝑄ab (7-1)
Where 𝑄re and 𝑄ab are the released heat by water and absorbed heat by air, 𝑚w and 𝑚a are the mass
flowrate of water and air, Twi and 𝑇wo are the water inlet and outlet temperature, 𝑇ai and 𝑇ao are the air
inlet and outlet temperature.
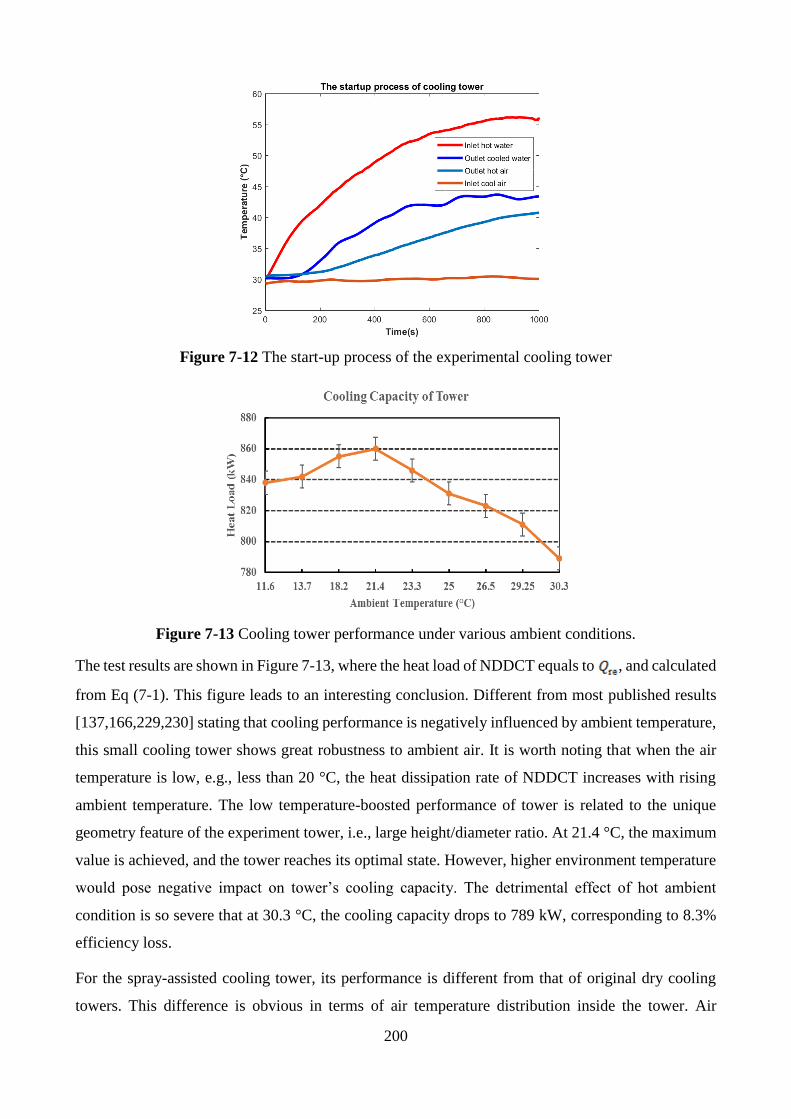
200
Figure 7-12 The start-up process of the experimental cooling tower
Figure 7-13 Cooling tower performance under various ambient conditions.
The test results are shown in Figure 7-13, where the heat load of NDDCT equals to , and calculated
from Eq (7-1). This figure leads to an interesting conclusion. Different from most published results
[137,166,229,230] stating that cooling performance is negatively influenced by ambient temperature,
this small cooling tower shows great robustness to ambient air. It is worth noting that when the air
temperature is low, e.g., less than 20 °C, the heat dissipation rate of NDDCT increases with rising
ambient temperature. The low temperature-boosted performance of tower is related to the unique
geometry feature of the experiment tower, i.e., large height/diameter ratio. At 21.4 °C, the maximum
value is achieved, and the tower reaches its optimal state. However, higher environment temperature
would pose negative impact on tower’s cooling capacity. The detrimental effect of hot ambient
condition is so severe that at 30.3 °C, the cooling capacity drops to 789 kW, corresponding to 8.3%
efficiency loss.
For the spray-assisted cooling tower, its performance is different from that of original dry cooling
towers. This difference is obvious in terms of air temperature distribution inside the tower. Air

201
temperatures inside the experimental towers were measured at three levels: the bottom level
represents air immediately above the radiator, the middle level denotes the middle part, near the throat,
of the cooling tower, while the top level close to the tower exit. At each level, nine temperature-
humidity sensors were used to collect real-time data. The results are shown in Figure 7-14.
The temporal evolution of temperature can be clearly seen from measured results at different levels.
In Figure 7-14, A1, B1 and C1 show that in the beginning, air temperature changed little as time
increases since no heat exchange occurs between ambient air and hot circulating water. Nevertheless,
once the heat exchanger started to work and spray cooling was initiated, the air experienced a
remarkable temperature increase as it was heated by the hot water. Meanwhile, the air temperatures
from different measurement points give quite readings. The hot air has a temperature of 46 °C while
the cool air has a low reading below 40 °C.
The spatial variation along the tower can be obtained by comparing the temperatures at the three
selected heights. For the bottom air (Hbot/HT=0.325), inhomogeneous temperature distribution was
observed as air at different measuring points was heated by the radiator to different extents. The
temperature difference narrows as the hot air rises to the tower top. More sensors record temperatures
ranging from 40 °C to 44 °C.
The three contours of A2, B2 and C2 in Fig. 14 illustrate temperature distributions inside the tower
at different heights (Hbot=6.5m, Hmd=13m and Htop=19m). For comparison purposes the instantaneous
temperature at 15830s is used. Obviously air temperature decreases with increasing height. It is noted
that just above the spray nozzle, there exists precooled air in the region with an azimuth angle between
240° and 300°. A higher altitude (middle level, Hmd/HT =0.65) causes substantial temperature drop.
The reduced temperature comes down to the rising altitude and the energy conversion from thermal
to kinetic form as air flow accelerates across the tower throat. Near the top of tower (Htop/HT =0.95),
temperature is slightly lower than the middle level and the hot plume has considerably shrunk. The
diminishing temperature along tower height is consistent with the published results [234].
𝑇𝑎,𝑡𝑜𝑝 = 𝑇𝑎,𝑏𝑜𝑡 − 𝛬(𝑇𝑎,𝑏𝑜𝑡 − 𝑇𝑎,𝑎𝑚𝑏) (7-2)
where 𝛬 is the air temperature decreasing factor, a parameter related to the geometrical and structural
design of towers. 𝑇𝑎,𝑎𝑚𝑏 , 𝑇𝑎,𝑏𝑜𝑡, 𝑎𝑛𝑑 𝑇𝑎,𝑡𝑜𝑝 are the ambient temperature, air temperatures at the
bottom and top level, respectively.
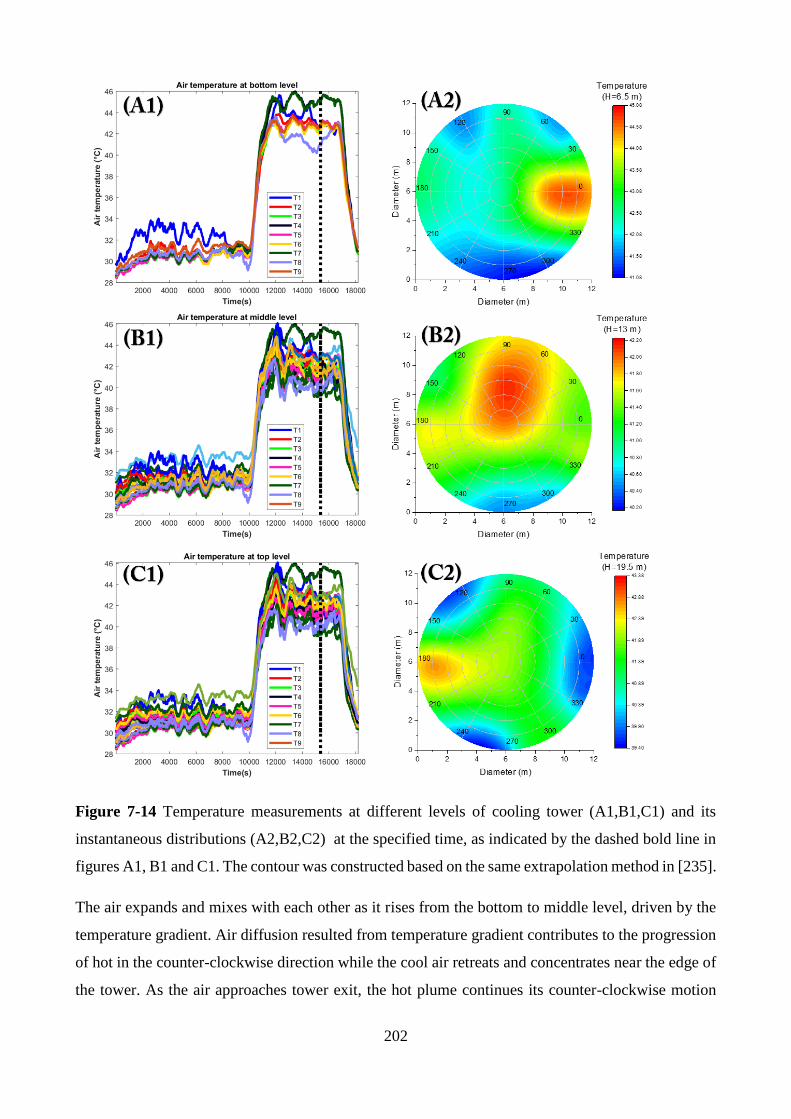
202
Figure 7-14 Temperature measurements at different levels of cooling tower (A1,B1,C1) and its
instantaneous distributions (A2,B2,C2) at the specified time, as indicated by the dashed bold line in
figures A1, B1 and C1. The contour was constructed based on the same extrapolation method in [235].
The air expands and mixes with each other as it rises from the bottom to middle level, driven by the
temperature gradient. Air diffusion resulted from temperature gradient contributes to the progression
of hot in the counter-clockwise direction while the cool air retreats and concentrates near the edge of
the tower. As the air approaches tower exit, the hot plume continues its counter-clockwise motion
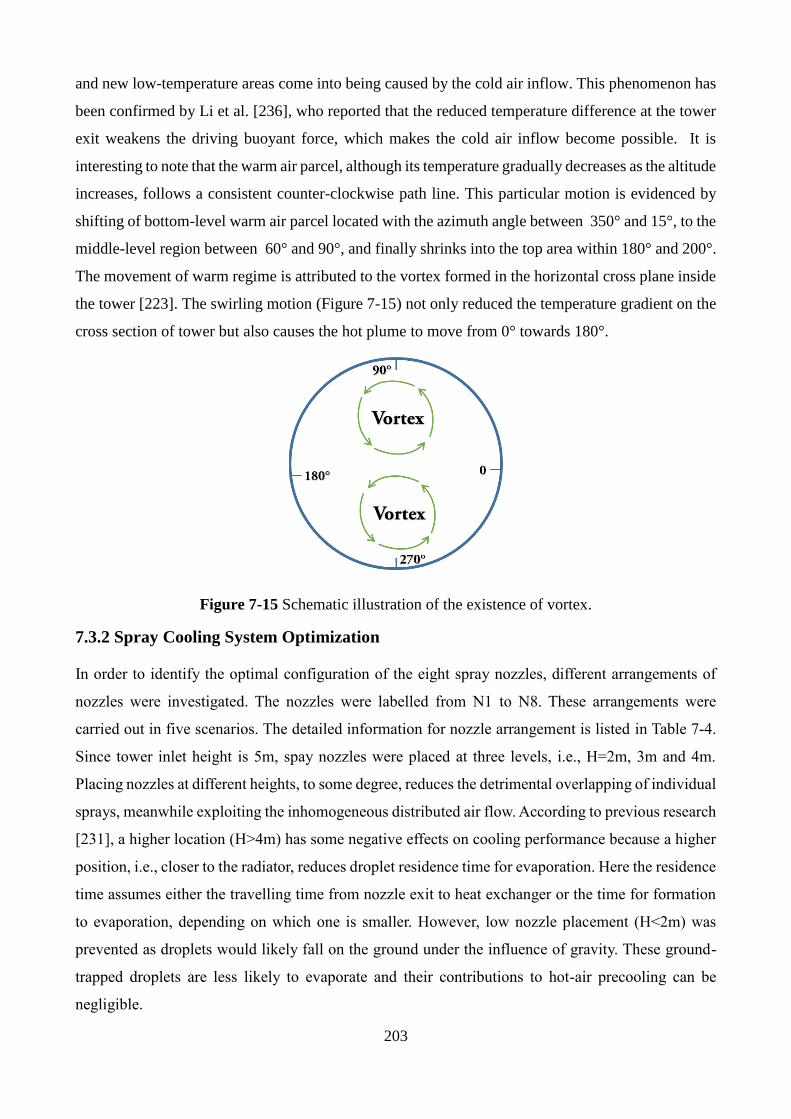
203
and new low-temperature areas come into being caused by the cold air inflow. This phenomenon has
been confirmed by Li et al. [236], who reported that the reduced temperature difference at the tower
exit weakens the driving buoyant force, which makes the cold air inflow become possible. It is
interesting to note that the warm air parcel, although its temperature gradually decreases as the altitude
increases, follows a consistent counter-clockwise path line. This particular motion is evidenced by
shifting of bottom-level warm air parcel located with the azimuth angle between 350° and 15°, to the
middle-level region between 60° and 90°, and finally shrinks into the top area within 180° and 200°.
The movement of warm regime is attributed to the vortex formed in the horizontal cross plane inside
the tower [223]. The swirling motion (Figure 7-15) not only reduced the temperature gradient on the
cross section of tower but also causes the hot plume to move from 0° towards 180°.
Figure 7-15 Schematic illustration of the existence of vortex.
7.3.2 Spray Cooling System Optimization
In order to identify the optimal configuration of the eight spray nozzles, different arrangements of
nozzles were investigated. The nozzles were labelled from N1 to N8. These arrangements were
carried out in five scenarios. The detailed information for nozzle arrangement is listed in Table 7-4.
Since tower inlet height is 5m, spay nozzles were placed at three levels, i.e., H=2m, 3m and 4m.
Placing nozzles at different heights, to some degree, reduces the detrimental overlapping of individual
sprays, meanwhile exploiting the inhomogeneous distributed air flow. According to previous research
[231], a higher location (H>4m) has some negative effects on cooling performance because a higher
position, i.e., closer to the radiator, reduces droplet residence time for evaporation. Here the residence
time assumes either the travelling time from nozzle exit to heat exchanger or the time for formation
to evaporation, depending on which one is smaller. However, low nozzle placement (H<2m) was
prevented as droplets would likely fall on the ground under the influence of gravity. These ground-
trapped droplets are less likely to evaporate and their contributions to hot-air precooling can be
negligible.

204
The main difference among these five cases lies in the injection direction. Theoretically, the injection
direction ought to be carefully chosen to facilitate the liquid evaporation. Since the injection angle
can be adjusted from 0° to 360°, there are numerous possibilities for a single injection, not to mention
the combination of various injection angle for eight nozzles. However, considering that the spray
cooling is designed for industrial use, the operational simplicity is quite important. Therefore, the
injection direction was limited to four most common injection directions used in power industry,
namely coflow, counterflow, upward and downward. The chosen direction for each nozzle was based
on the our numerical study [189], where injection at various angles were extensively studied and the
optimal results were revealed. Simply put, nozzles at 4m produced upward, downward and coflow
injections, the 3m-fixed nozzles have injections of upward, coflow and counterflow, whereas the
lowest nozzles (H=2m) had no choice but to inject upward.
The cooling tower performances of these five cases were explored experimentally and the final results
are shown in Figure 7-16. In spite of the different injection directions, all these five cases share a
same trend, i.e., the reduced temperature of inlet air. The comparison of Figure 7-16 and Figure 7-12
leads to the conclusion that the inlet air was precooled by the introduced spray cooling system and
has a lower temperature than the surrounding air. Quantitatively, the precooled inlet air has a
temperature ranging from 28 °C to 29 °C, lower than its ambient counterpart (30 °C).
Even if the effectiveness of the spray cooling system can be proved qualitatively, more quantitative
results need to be analysed to find the optimal arrangement of spray nozzles. Since the heat load is
the primary concern to evaluate the performance of cooling towers, it is chosen as the criterion for
judging the effectiveness of designed spray cooling system. The performances of the five employed
spray cooling systems are shown in Figure 7-17. It is apparent that the tower’s cooling capacity has
been improved by the spray cooling system. The cooling capacity of towers is enhanced by the spray
cooling system to various degrees. The greatest improvement is achieved in Case 3, then followed by
Case 4, while the least performance enhancement comes along with Case 1. Case 2 and Case 5 share
similar but intermediate performance augmentation.
For Case 1, all spray nozzles have the upward injection, and the uniform upward motion of millions
of droplets increase their possibility to collide and coalesce with each other, producing larger droplets.
According to the D2 law [237], droplet evaporation time is proportional to the square of droplet
diameter. Hence a large droplet size hinders the evaporation process, falling to cool the ambient air
to the desired temperature. It is reported that counterflow injection has superior effect on water
evaporation [238], therefore the attempts in Case 2 changed upward injection of 4m-placed nozzles
to counterflow. As expected, the cooling capacity has increased from 808.96 kW for Case 1 to 823.58
205
kW for Case 2. Enlightened by this progress, two nozzles placed at the height of 3m were changed to
counterflow. A big improvement of cooling performance caused by intense spray evaporation is
observed in Case 3. In this case, droplets injected in a direction opposed to air flow penetrate the
turbulent carrying flow, until completely lose their momentum. Then the droplets would be
accelerated to the air velocity and follow the streamline of air flow. The complex interactions of
droplets with surrounding air, not merely reinforce the turbulent mixing of droplet and promote their
spatial dispersion, but also prolong their residence time, which gives them enough room to evaporate.
To prevent spray overlapping, the injections at 3m were shifted to coflow, and this configuration was
tested in Case 4. Compared with Case 1 and Case 2, this attempt achieves greater cooling capacity
(835.43 kW). But its performance is still worse than Case 3, which dissipates waste heat at a rate of
841.73 kW. A final attempt was made by conducting downward injections for the 4m-sitting nozzles
while kept the counterflow injections for nozzles at 3m. The logic behind this design is similar to
Case 3, i.e., to promote droplet dispersion and mixing with air flow. In Case 5, droplets initially travel
downward and then are brought up by the rising air flow. The falling trajectory followed by lifting
path line give droplets sufficient time for evaporation. Unfortunately, the resultant cooling capacity
of 828.17 kW is still smaller than the maximum value of 841.73 kW. The inefficient counterflow
injections are evidenced by these two unsuccessful configurations (Case 4 and Case 5). The
counterflow injection of droplets into the gas flow enhances the turbulence intensity of the gas media
and causes different-scale vortices. The entrainment related to the centrifugal force of large vortex
leads to uneven droplet distribution and intensifies the mixing of droplets and gaseous flow. This
mechanism has been experimentally studied by Bai et al. [239].
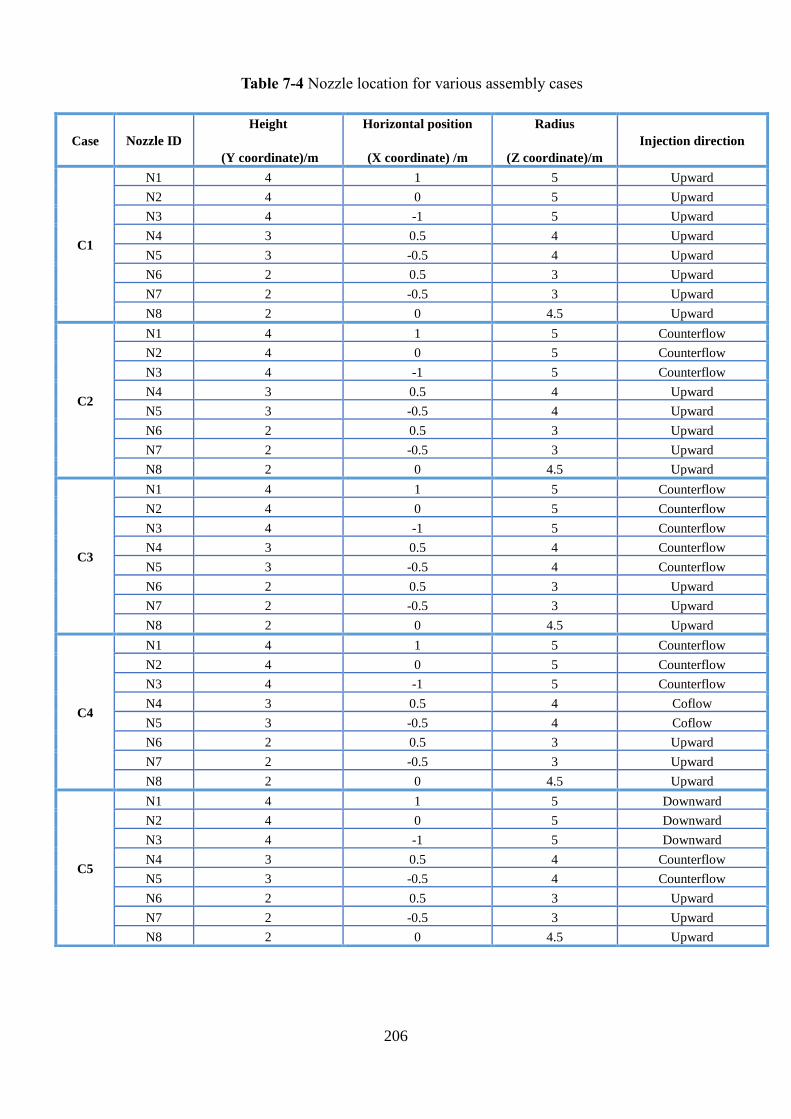
206
Table 7-4 Nozzle location for various assembly cases
Case Nozzle ID Height
(Y coordinate)/m
Horizontal position
(X coordinate) /m
Radius
(Z coordinate)/m Injection direction
C1
N1 4 1 5 Upward N2 4 0 5 Upward N3 4 -1 5 Upward N4 3 0.5 4 Upward N5 3 -0.5 4 Upward N6 2 0.5 3 Upward N7 2 -0.5 3 Upward N8 2 0 4.5 Upward
C2
N1 4 1 5 Counterflow N2 4 0 5 Counterflow N3 4 -1 5 Counterflow N4 3 0.5 4 Upward N5 3 -0.5 4 Upward N6 2 0.5 3 Upward N7 2 -0.5 3 Upward N8 2 0 4.5 Upward
C3
N1 4 1 5 Counterflow N2 4 0 5 Counterflow N3 4 -1 5 Counterflow N4 3 0.5 4 Counterflow N5 3 -0.5 4 Counterflow N6 2 0.5 3 Upward N7 2 -0.5 3 Upward N8 2 0 4.5 Upward
C4
N1 4 1 5 Counterflow N2 4 0 5 Counterflow N3 4 -1 5 Counterflow N4 3 0.5 4 Coflow N5 3 -0.5 4 Coflow N6 2 0.5 3 Upward N7 2 -0.5 3 Upward N8 2 0 4.5 Upward
C5
N1 4 1 5 Downward N2 4 0 5 Downward N3 4 -1 5 Downward N4 3 0.5 4 Counterflow N5 3 -0.5 4 Counterflow N6 2 0.5 3 Upward N7 2 -0.5 3 Upward N8 2 0 4.5 Upward
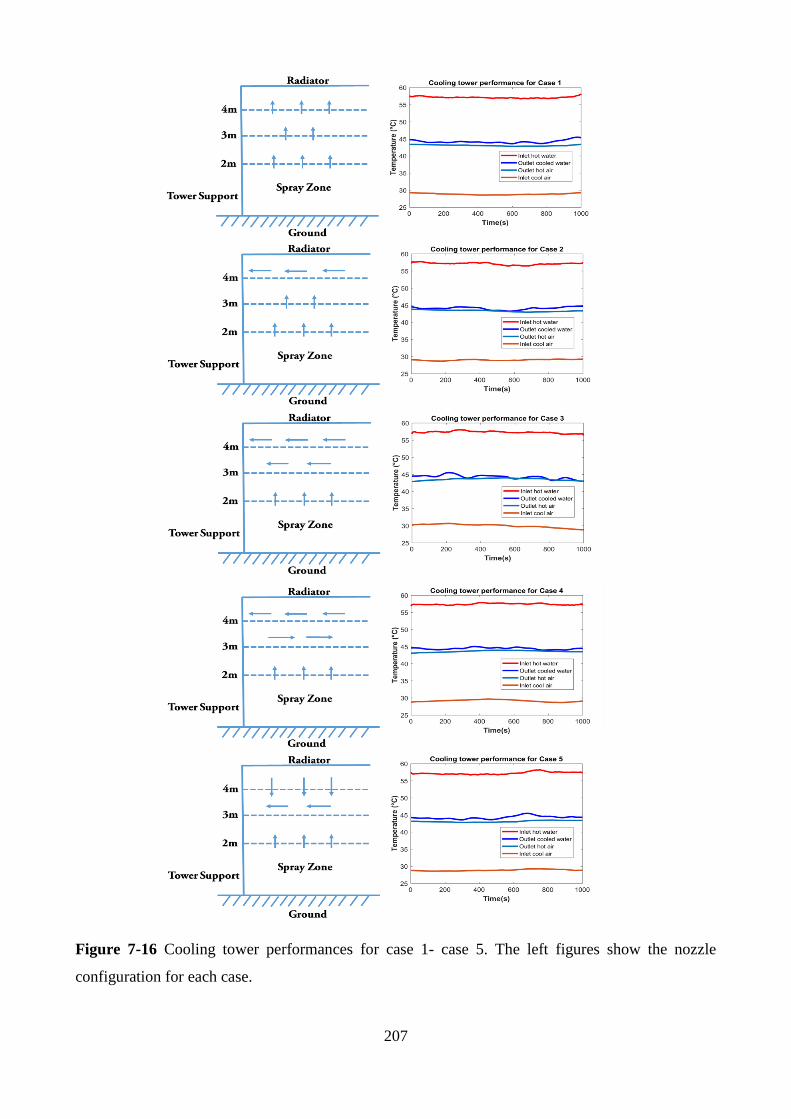
207
Figure 7-16 Cooling tower performances for case 1- case 5. The left figures show the nozzle
configuration for each case.
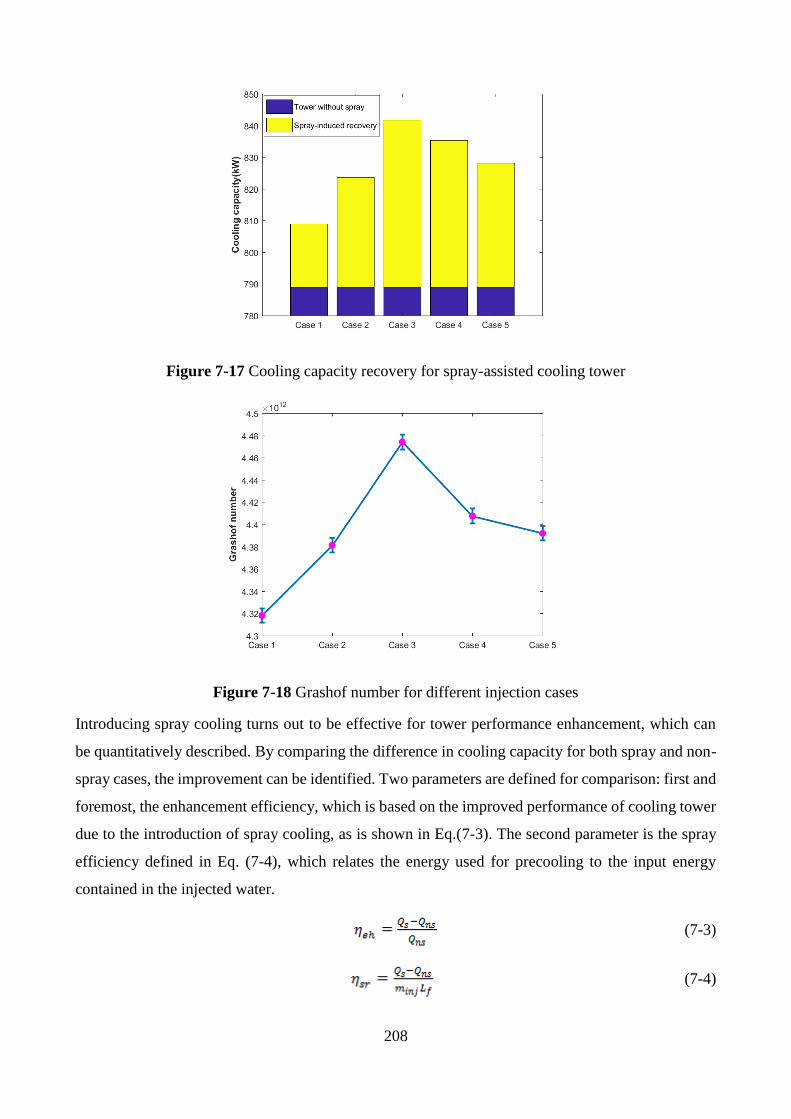
208
Figure 7-17 Cooling capacity recovery for spray-assisted cooling tower
Figure 7-18 Grashof number for different injection cases
Introducing spray cooling turns out to be effective for tower performance enhancement, which can
be quantitatively described. By comparing the difference in cooling capacity for both spray and non-
spray cases, the improvement can be identified. Two parameters are defined for comparison: first and
foremost, the enhancement efficiency, which is based on the improved performance of cooling tower
due to the introduction of spray cooling, as is shown in Eq.(7-3). The second parameter is the spray
efficiency defined in Eq. (7-4), which relates the energy used for precooling to the input energy
contained in the injected water.
(7-3)
(7-4)
209
Where represents the dissipated heat by cooling tower under sprayed cases and non-spray
cases. are the injected water mass flowrate and the latent heat of water.
The calculated results are shown in Table 7-5. The designed system can boost the performance of
tower by 6.68% in Case 3(where only 8% of the total inlet area of the tower was pre-cooled), which
is realized by the heat removed via water evaporation. The spray efficiency is 99.54%, indicating that
all injected water evaporates into vapour and thus creates an energy sink to absorb heat from the hot
air. For the Case 2, Case 4 and Case 5, their spray efficiency is lower than Case 3, meaning that the
injected water does not fully evaporate. Therefore, their corresponding enhancement efficiency is
expected to be lower than Case 3. The design of Case 1 ought not to be used in view of its lowest
spray efficiency as well as enhancement efficiency among the five designs. The poor performance of
Case 1 relates to its inability to fully evaporate the droplets in the restricted time and space.
Waste heat is dissipated by NDDCT via natural convection, thus the performance of NDDCT depends
on the intensity of natural convection. In general, the Grashof number has been used to characterize
the natural convection effects in the momentum balance equation. It is a measure of the relative
magnitudes of the buoyant force and the opposing viscous force acting on the fluid. In the case of dry
cooling towers, the characteristic length takes the base diameter of the studied tower. Hence the
corresponding Grashof number can be expressed by the following equation:
3
2
( )a r amb
a
g T T DGr
u
−= (7-5)
where g is the gravitational acceleration, β is the coefficient volume expansion (β=1/T for ideal gases),
Tr is the mean temperature of the heat exchanger, and μa is the viscosity of the air.
Table 7-5 Efficiency comparison for various spray cooling system designs.
Precooling system Case 1 Case 2 Case 3 Case 4 Case 5
Enhancement efficiency 2.53% 4.38% 6.68% 5.88% 4.96%
Spray efficiency 37.68% 65.28% 99.54% 87.66% 73.94%
The presence of spray cooling system would change the velocity field of air and consequently impact
the produced natural convection. In order to get information about the strength of natural convection,
we compare Grashof number for each spraying cooling system. The calculated dimensionless number
is shown in Figure 7-18. The figure shows the increasing Grashof number in the following trend:
Case 3 > Case 4 > Case 5 > Case 2 > Case 1. This trend is consistent with the recovered cooling
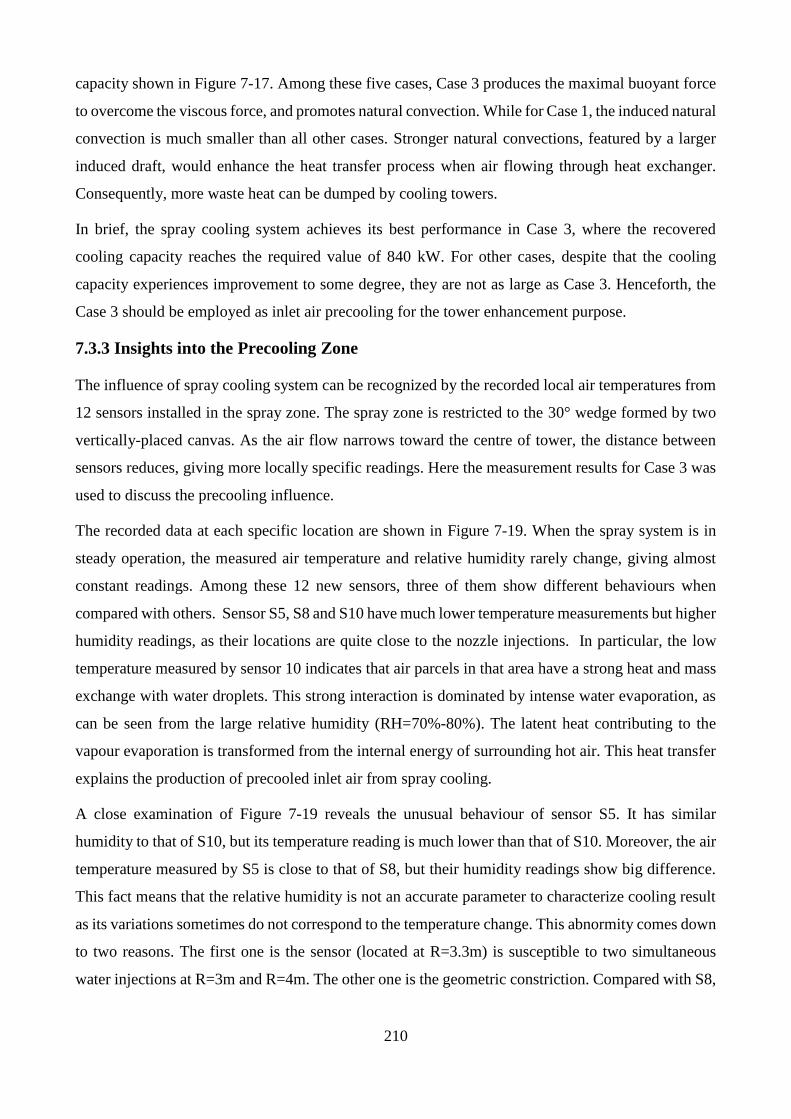
210
capacity shown in Figure 7-17. Among these five cases, Case 3 produces the maximal buoyant force
to overcome the viscous force, and promotes natural convection. While for Case 1, the induced natural
convection is much smaller than all other cases. Stronger natural convections, featured by a larger
induced draft, would enhance the heat transfer process when air flowing through heat exchanger.
Consequently, more waste heat can be dumped by cooling towers.
In brief, the spray cooling system achieves its best performance in Case 3, where the recovered
cooling capacity reaches the required value of 840 kW. For other cases, despite that the cooling
capacity experiences improvement to some degree, they are not as large as Case 3. Henceforth, the
Case 3 should be employed as inlet air precooling for the tower enhancement purpose.
7.3.3 Insights into the Precooling Zone
The influence of spray cooling system can be recognized by the recorded local air temperatures from
12 sensors installed in the spray zone. The spray zone is restricted to the 30° wedge formed by two
vertically-placed canvas. As the air flow narrows toward the centre of tower, the distance between
sensors reduces, giving more locally specific readings. Here the measurement results for Case 3 was
used to discuss the precooling influence.
The recorded data at each specific location are shown in Figure 7-19. When the spray system is in
steady operation, the measured air temperature and relative humidity rarely change, giving almost
constant readings. Among these 12 new sensors, three of them show different behaviours when
compared with others. Sensor S5, S8 and S10 have much lower temperature measurements but higher
humidity readings, as their locations are quite close to the nozzle injections. In particular, the low
temperature measured by sensor 10 indicates that air parcels in that area have a strong heat and mass
exchange with water droplets. This strong interaction is dominated by intense water evaporation, as
can be seen from the large relative humidity (RH=70%-80%). The latent heat contributing to the
vapour evaporation is transformed from the internal energy of surrounding hot air. This heat transfer
explains the production of precooled inlet air from spray cooling.
A close examination of Figure 7-19 reveals the unusual behaviour of sensor S5. It has similar
humidity to that of S10, but its temperature reading is much lower than that of S10. Moreover, the air
temperature measured by S5 is close to that of S8, but their humidity readings show big difference.
This fact means that the relative humidity is not an accurate parameter to characterize cooling result
as its variations sometimes do not correspond to the temperature change. This abnormity comes down
to two reasons. The first one is the sensor (located at R=3.3m) is susceptible to two simultaneous
water injections at R=3m and R=4m. The other one is the geometric constriction. Compared with S8,
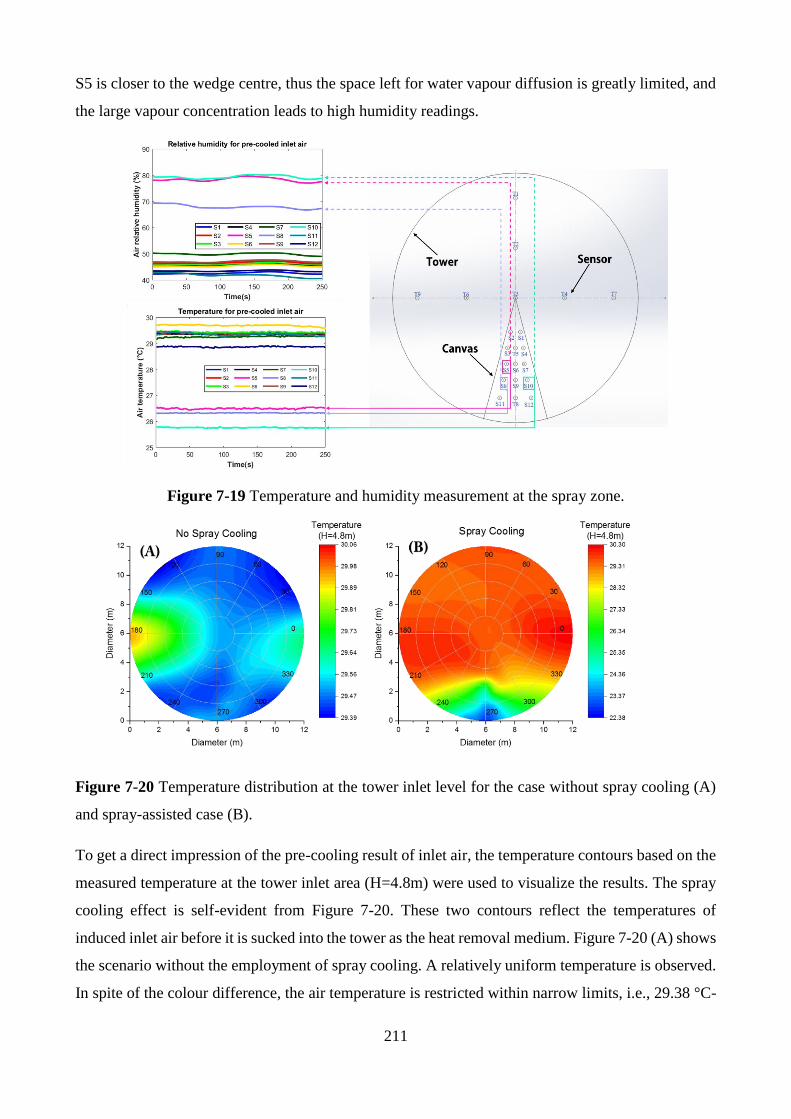
211
S5 is closer to the wedge centre, thus the space left for water vapour diffusion is greatly limited, and
the large vapour concentration leads to high humidity readings.
Figure 7-19 Temperature and humidity measurement at the spray zone.
Figure 7-20 Temperature distribution at the tower inlet level for the case without spray cooling (A)
and spray-assisted case (B).
To get a direct impression of the pre-cooling result of inlet air, the temperature contours based on the
measured temperature at the tower inlet area (H=4.8m) were used to visualize the results. The spray
cooling effect is self-evident from Figure 7-20. These two contours reflect the temperatures of
induced inlet air before it is sucked into the tower as the heat removal medium. Figure 7-20 (A) shows
the scenario without the employment of spray cooling. A relatively uniform temperature is observed.
In spite of the colour difference, the air temperature is restricted within narrow limits, i.e., 29.38 °C-

212
30.06 °C. Once the spray cooling system is in operation, there is a sharp temperature drop (Figure
7-20 (B)). Water spray cools the induced air flowing through the spray zone to be as low as 22.38 °C.
The low temperature region is not merely restricted to the spray zone, but also gradually expands to
the central part of tower, creating more cool areas. The air in the spray zone is precooled and have a
much lower temperature than the ambient air. Quantitatively, the air in the spray zone is cool,
experiencing low temperatures between 23-28 °C while in the rest part of the tower, the air is hot
(around 30 °C). The formation of pre-cooled air parcels is due to water evaporation. As injected water
evaporates in the spray zone, the energy deficit caused by water evaporation is compensated by the
transferred sensible heat from the hot air. Therefore, the air temperature decreases as water evaporates,
which produces more water vapour and consequently increases the relative humidity of the air flow.
The existence of temperature gradient facilitates air molecule diffusion, thus the precooled air parcels
cool the surrounding hot air, and gradually expands the cool air domain.
7.4 Conclusions
In this study, a spray cooling system consisting of eight pressure-swirl nozzles were designed and
tested on the experimental cooling tower. Pressure-swirl atomizer was used to break the injected water
into fine droplets to increase the liquid-gas interface and consequently accelerate the evaporation
process. Nevertheless, how to arrange these nozzles to achieve maximal cooling remained unknown.
To answer this question, we proposed five different designs and tested them on a 20m high natural
draft dry cooling tower with fully instrumented measurement system. The preliminary designs (Case
1-Case 5) are based on our previous simulation results [189,231,232], and the pressure-swirl nozzle
LNN1.5 was chosen as it produces fine droplets at moderate pressure. The nozzles were placed at
three levels (H=2m, 3m and 4m) with varied injection directions (co-flow, counter-flow, upward and
downward). To our knowledge, this is the world’s first experimental report of practicing spray cooling
system on full-scale dry cooling tower. The experimental results confirms the feasibility and
effectiveness of employing spray cooling to improve the heat removal capacity of NDDCT.
1. The optimal spray cooling system using 8 pressure-swirl nozzles LNN1.5 can improve the
cooling capacity of NDDCT by 6.68%, i.e., from 789 kW to 841.73 kW. This optimal design
consists of 3 upward injections at low level (Height=2m), 2 counterflow injections at middle
level (Height =3m) and 3 counterflow injections at high level (Height =4m). Among the five
proposed designs, Case 3 shows best cooling effect with limited water consumption. Its spray
efficiency of 99.57% is achieved by fully utilizing the latent heat of injected water to precool
the inlet hot air.
213
2. The presence of spray cooling system intensifies natural convection and consequently
accelerates the heat dissipation process of NDDCT. When compared with the other four
designs, the optimal one Case 3 has strongest natural convection, as evidenced by its largest
Grashof number, improve the tower performance to the largest extent.
3. Spray evaporation produce substantial water vapour, increasing the local relative humidity to
70%-80%. Near the tower edge, low-temperature regimes, formed by spray cooling and driven
by temperature gradient, cool the surrounding hot air and lead to relatively even temperature
distribution inside the tower.
In brief, this study proposed a spray cooling system for cooling performance enhancement of natural
draft dry cooling towers. The designed cooling system, by wisely combining multiple injections and
consuming small amount of water, precools the inlet air in a cost-effective way, and boost the cooling
performance of NDDCT under high ambient temperature conditions. This spray-assisted dry cooling
technology has been experimentally tested and proved to be a promising choice for system used in
CSP plants.
The addition of spray cooling system to dry cooling towers will have pronounced effects on the
performance and cost of CSP plants. In order to evaluate the impacts on a plant level, a complete
cooling system performance model needs to be developed using detailed mass and energy balances
for a CSP plant. Furthermore, the developed performance model is expected to be coupled with
engineering-economic models for the calculations of the capital cost, annual operating and
maintenance costs and total annual levelized cost of specified power plants. This new sophisticated
model would be able to identify and display the effects of key factors affecting spray-assisted cooling
system performance, cost and plant water use, including the plant steam cycle design, solar
irradiations and local ambient conditions. Future work on the development of such complex model
for CSP plants can be accelerated by learning from the Integrated Environmental Control Model
(IECM), which has been developed to estimate the performance, emissions, cost and uncertainties of
fossil-fuelled power plants [240].
214
Chapter 8 Summary and Future Work
Natural Draft Dry Cooling Towers (NDDCT) are receiving more and more attention in recent years
due to the demand for energy-saving purpose for CST power plants However, the main challenge
restricting the development of this technology is the reduced performance at high ambient air
temperature conditions. In this research, a spray cooling system based on water evaporation was
proposed to pre-cool the inlet air to enhance the cooling performance of natural draft dry cooling
towers during high ambient temperature periods with a very small amount of water consumption. The
latent heat from the evaporation of small amount of water comes from the sensible heat transfer from
the ambient air and thus an effect cooling can be realized. Detailed numerical and experimental
investigations of the spray cooling performance in natural draft dry cooling towers operating
conditions were conducted with the aim to optimise spray cooling systems for inlet air pre-cooling in
natural draft dry cooling towers. In brief, the spray cooling process was reviewed comprehensively,
simulated numerically and investigated experimentally.
8.1 Summary
The thesis focuses on the design and optimization of spray cooling system for inlet air precooling to
enhance the thermal performance of natural draft dry cooling tower (NDDCT). Numerical studies are
used as the main approach in the conceptual design and subsequent optimization process while
experimental investigations are also made to validate the models and to identify the spray cooling
effect. The 20m high natural draft cooling tower built in Gatton campus of the University of
Queensland is used for both numerical and experimental studies. This small-scale NDDCT is
designed for the applications in small scale concentrating solar power plants. A 3D CFD model for
this 20m high tower has been firstly developed without spray cooling system. The model is capable
of predicting the cooling performance of tower at different ambient temperatures and inlet water
temperatures. In this study, the model is mainly used for obtaining the detailed flow field information
inside the cooling tower, which is used for the boundary condition of the nozzle spray.
Conduct both numerical and experimental studies to investigate the macroscopic structure and
characteristics of sprays generated by a pressure swirl atomizer. The simulation employs Eulerian-
Lagrangian scheme to account for the multiphase flow and the linearized instability sheet atomization
model to predict film formation, sheet breakup and atomization. The model predictions show great
consistency with the experimental measurements of the spatial variation of the droplet size and
velocity obtained from Phase Doppler Particle Analyser (PDPA). The robustness of this model makes
it useful to predict the structures and characteristics of co-flow sprays produced by pressure-swirl
215
atomizers. The study reveals that the entrainment effect and intense central-region atomization cause
small droplets to concentrate on the spray axis and large droplets to dominate in the peripheral region
of the spray. This finding is consistent with the observation that turbulence kinetic energy of air is
maximum near the nozzle exit, where atomization is intense and momentum exchange is strong, and
gradually decreases in both radial and axial directions. Moreover, the drops inside the full cone are
relatively small, and evaporate more easily than their large counterparts in the peripheral region,
hence removing substantial sensible heat from surrounding air and creating low-temperature region
in the central of the spray.
Develop a 3D CFD model specific for the 20m high natural draft cooling tower and validate this
model with the measured data from experimental work. The model can be used for tower performance
prediction. Information like temperature, pressure and velocity distribution inside the cooling tower
has been obtained from this model to evaluate the performance of cooling tower and more importantly,
to design a cooling system.
Explore the influence of injection angle on the evaporation results of droplets in an isolated spray.
The results show that the spray evaporations are heavily dependent on the nozzle locations and
injection directions. It is found that injection angle alters the momentum exchange between ambient
air and sprayed water droplets. Varying injection direction changes the relative strength of the vertical
and horizontal components of droplet velocity. Increasing injection angle can enlarge the water-
cooled area of radiator, and a larger injection angle contributes to an enhanced pre-cooling result at
the central part of NDDCT.
Investigate how the placement of nozzle affects the temperature distributions of air flow immediately
beneath the heat exchange surface. It shows that lower nozzle placement can cool the central part of
the radiator while a higher one cools the middle part. The upward and co-flow injections have poorer
cooling performance than the downward and counter-flow injections. Furthermore, a wall cover has
been introduced into the tower to change the flow field and realize precooling for hot air at the edge
of radiator, which was difficult to be cooled without the addition of wall cover. The rationale behind
the addition of wall cover is that it reduces the blockage caused by the near-wall vortex and enable
the precooled air to move outwardly and reach a more uniform distribution at the heat exchanger level.
Propose a spray cooling system consisting of five commercial available nozzles (LNN1.5) to cool a
30 degree section of the tower. The nozzle (LNN1.5) are characterized experimentally in the wind
tunnel tests. The spray nozzles have been carefully arranged to make sure a complete evaporation of
all injected water droplets before they reach the radiator because the unevaporated drops would cause
fouling and corrosions of the radiator. An optimal distance between any two neighbouring spray
216
nozzles was identified to enhance the evaporation processing of sprays. A dimensionless analysis
shows that the achieved cooling efficiency is influenced by the heat and mass transfer between water
droplets and air flows, ambient air conditions as well as nozzle arrangement configurations.
Test the proposed spray cooling system on the full-scale experimental tower. The cooling system
consisting high-pressure pump, water delivery pipelines, spray nozzles and a simple and versatile
scaffold with for clamps for nozzle mounting has been installed at the air inlet part of the 20 m high
experimental NDDCT, which is equipped with sophisticated measurement system. Five different
nozzle arrangements have been proposed and tested. To our knowledge, this is the world’s first
attempt to practice spray cooling on a full-scale small natural draft dry cooling tower. The
experimental results prove that the introduced spray is a feasible and effective way of improving the
cooling performance of the cooling tower. The optimal spray cooling system consists of 3 upward
injections at low level, 2 counter-flow injections at middle level and 3 counter-flow injections at high
level. This arrangement helps to fully utilizes the latent heat of injected water to precool the inlet hot
air and consequently improve tower’s deteriorated performance.
8.2 Main Contributions
The main contributions of this thesis are:
(1) Develop a three-dimensional numerical model to represent sprays produced by pressure-swirl
atomizer and validate this model against experimental data measured by PDPA from the tests
conducted in a wind tunnel. The model, based on the Eulerian-Lagrangian scheme capable of
tracking both the droplet motion and air flow movement, can accurately predict spray
characteristics like droplet size and velocity distributions as well as air temperature
distribution at various locations.
(2) Build a 3-D numerical model for the 20m natural draft dry cooling tower. The model has been
refined and validated with the measured data from experimental work. This model provides
information like temperature, pressure and velocity distribution inside the cooling tower and
can be used for tower performance evaluation and more importantly, for estimating the
influence of the introduction of the spray cooling system.
(3) Identify the complicated interactions between the polydisperse and travelling droplets within
the spray and surrounding airflow under typical NDDCT operating conditions. The strong
coupling between the discrete liquid phase and continuous gaseous phase can be exploited to
accelerate droplet evaporation process and attain the goal of complete evaporation for
produced spray.
217
(4) Explore the effect of injection direction on the cooling behaviour of single spray and the
interactions between two neighbouring sprays. The revealed conclusions served as the
guidelines for nozzle arrangement, the foundation of spray cooling system design and
optimization.
(5) Design and optimize a spray cooling system for thermal performance enhancement of
NDDCT by pre-cool the hot inlet air flowing through cooling towers. Numerical study was
the main tool in the design process and experimental tests were also performed to evaluate
spray cooling system performance at various conditions. The findings will facilitate the
transformation of this new technology into industrial implementation.
(6) Establish valuable experimental database for spray cooling system model validation and
performance evaluation.
In a nutshell, the spray cooling system designed to cool the inlet ambient air provides a promising
opportunity to improve the cooling capacity of NDDCTs during high ambient temperature periods.
The enhanced performance will reduce the operating cost and boost power generation for the
concentrating solar power plants by preventing substantial water consumption and minimizing the
negative environmental impacts associated with the plumes inherent in wet cooling towers.
8.3 Recommendations for Future Work
This research work investigates the important and fundamental aspects of inlet air pre-cooling for
thermal performance enhancement of natural draft dry cooling towers. However, due to the limited
budget, the testing of nozzles in the real cooling tower was conducted with only a small section of
the full tower. Therefore, future studies are recommended to expand the numerical and experimental
for a full tower.
(1) Full-scale tests of the spray cooling system for the whole cooling tower instead of using the
30 section partial tower. Due to the restriction of research budget, a spray cooling system was
designed and installed to cool the inlet air flowing through the 30 section tower. This limited
to a small fraction of inlet air be precooled and the impact on the cooling tower performance
in terms of outlet hot water temperature is quite small. This small change, along with the
measurement errors, makes it difficult to evaluate the tower performance in an accurate way.
Moreover, the addition of canvas for 30 section separation construction changes flow path for
induced air, to the full tower test can avoid this disturbance induced by the separation canvas.
(2) Incorporation of the crosswind effects. As mentioned in Chapter 2, natural draft dry cooling
towers are susceptible to crosswinds under natural conditions. To simplify our model and
218
reduce the complexity in experimental work, the crosswind effects are neglected. However,
this effect cannot be ignored in dry cooling towers equipped with spray cooling system
because the crosswinds are always exist in the operation and may blow away injected small
droplets away from the inlet air. Hence the impact of crosswinds should be included in future
studies to make better predictions of the tower performance assisted by spray cooling system.
(3) The droplet breakup, collision and coalescence were neglected in current simulations due to
the dilute spray consumption. However, in real cases, droplet breakup, collision and
coalescence occur in the spray region and have some impacts on droplet dynamics, hence it
is necessary to include these phenomena in simulation in order to realize more accurate
predictions. Furthermore, in spray cooling calculation within the cooling towers, the injected
liquid is already atomized into droplets and no further breakup occurs. The model can be
further improved by considering the primary and secondary breakup using various breakup
models. Secondary breakup is highly possible for droplets with large momentum, i.e., large
droplet Reynold number. These improvements make it feasible to use CFD tools to predict
the achieved cooling effects caused by sprays in real situations.
(4) Detailed cost model of NDDCT equipped with spray cooling system ought to be developed.
The proposed mathematical model should consider the capital, labour, construction,
maintenance and operation costs of both the tower and the spray cooling system. The model
should combine the cooling benefit with the tower performance using a cost-benefit analysis
under different combinations of heat rejection capacities and meteorological conditions.
(5) The proposed spray-assisted cooling technology, a kind of hybrid instead of pure dry cooling
system, offers a viable option in for solar-integrated sCO2 Brayton cycle. sCO2 Brayton cycle
and its benefits such as high thermal efficiency and compact turbomachinery have been well-
recognized. Although numerous analysis has been performed on the cycle operation near the
CO2 critical point, the potential benefits of dry-air cooling for this Brayton cycle are not fully
understood. A quantitative comparison between the CO2-air heat rejection unit and an
equivalent air-cooled steam condenser should be made. Moreover, the performance and
effectiveness of this spray-assisted cooling technology vary with different cycle layouts.
Future work is expected to centre on the optimization and comparison of this spray-assisted
cooling scheme among various Brayton cycle configurations such as recompression cycle,
intercooling cycle and heating cycle for power production.
219
Reference
[1] Khan J, Arsalan MH. Solar power technologies for sustainable electricity generation – A
review. Renew Sustain Energy Rev 2016;55:414–25. doi:10.1016/j.rser.2015.10.135.
[2] Carson L. Solar Energy. Aust. Energy Resour. Assess., 2014, p. 261–84.
[3] Xu X, Vignarooban K, Xu B, Hsu K, Kannan AM. Prospects and problems of concentrating
solar power technologies for power generation in the desert regions. Renew Sustain Energy
Rev 2016;53:1106–31. doi:10.1016/j.rser.2015.09.015.
[4] Li X, Xia L, Gurgenci H, Guan Z. International Journal of Heat and Mass Transfer
Performance enhancement for the natural draft dry cooling tower under crosswind condition
by optimizing the water distribution. Int J Heat Mass Transf 2017;107:271–80.
doi:10.1016/j.ijheatmasstransfer.2016.11.046.
[5] Sun Y, Guan Z, Hooman K. A review on the performance evaluation of natural draft dry
cooling towers and possible improvements via inlet air spray cooling. Renew Sustain Energy
Rev 2017;79:618–37. doi:10.1016/j.rser.2017.05.151.
[6] Milani D, Luu MT, McNaughton R, Abbas A. Optimizing an advanced hybrid of solar-assisted
supercritical CO2 Brayton cycle: A vital transition for low-carbon power generation industry.
Energy Convers Manag 2017;148:1317–31. doi:10.1016/j.enconman.2017.06.017.
[7] Kulhánek M, Dostál V. Supercritical CO 2 Power Cycle Symposium Thermodynamic Analysis
and Comparison of Supercritical Carbon Dioxide Cycles Supercritical CO 2 Power Cycle
Symposium 2011:2–8.
[8] Ahn Y, Bae SJ, Kim M, Cho SK, Baik S, Lee JI, et al. Review of supercritical CO2 power
cycle technology and current status of research and development. Nucl Eng Technol
2015;47:647–61. doi:10.1016/j.net.2015.06.009.
[9] Hooman K. Dry cooling towers as condensers for geothermal power plants. Int Commun Heat
Mass Transf 2010;37:1215–20.
doi:http://dx.doi.org/10.1016/j.icheatmasstransfer.2010.07.011.
[10] Crabtree GW, Lewis NS. Solar energy conversion. Phys Today 2007;60:37–42.
doi:10.1063/1.2718755.
[11] UNDP. World Energy Assessment. Energy and the challenge of Sustainability. 2000.
[12] Chemistry TRS of. Energy. RscOrg 2014. http://www.rsc.org/campaigning-outreach/global-
220
challenges/energy/ (accessed January 12, 2016).
[13] Boerema N, Morrison G, Taylor R, Rosengarten G. High temperature solar thermal central-
receiver billboard design. Sol Energy 2013;97:356–68. doi:10.1016/j.solener.2013.09.008.
[14] Hodge B. Alternative energy systems and applications. Hoboken NJ: Wiley; 2010.
[15] Milosavljevic N, Heikkila P. A comprehensive approach to cooling tower design. Appl Therm
Eng 2001;21:899–915. doi:10.1016/s1359-4311(00)00078-8.
[16] Conradie AE, Kröger DG. Performance evaluation of dry-cooling systems for power plant
applications. Appl Therm Eng 1996;16:219–32. doi:10.1016/1359-4311(95)00068-2.
[17] Maulbetsch JS, DiFilippo MN. Spray cooling enhancement of air-cooled condensers. Electric
Power Research Institute; 2003.
[18] Kanoglu M, Cengel YA. Improving the Performance of an Existing Air-Cooled Binary
Geothermal Power Plant: A Case Study. J Energy Resour Technol 1999;121:196–202.
[19] Kutscher CF, Costenaro D. Assessment of Evaporative Cooling Enhancement Methods for
Air-cooled Geothermal Power Plants: Preprint 2002.
[20] Ashwood A, Bharathan D. Hybrid Cooling Systems for Low-Temperature Geothermal Power
Production. National Laboratory of the U.S; 2011.
[21] Boulay RB, Cerha MJ, Massoudi M. Dry and Hybrid Condenser Cooling Design to Maximize
Operating Income. ASME Conf Proc 2005:167–75.
[22] Sadafi MH, Jahn I, Hooman K. Nozzle arrangement effect on cooling performance of saline
water spray cooling. Appl Therm Eng 2016;105:1061–6.
doi:10.1016/j.applthermaleng.2016.01.078.
[23] Maulbetsch J, DiFilippo M. Spray Enhancement of Air Cooled Condensers. Public Interest
Energy Research Program (PIER), California Energy Commission ; 2003.
[24] Kröger DG. Air-cooled heat exchangers and cooling towers: thermal-flow performance
evaluation and design. PenWell Corporation; 2004.
[25] Tissot J, Boulet P, Labergue A, Castanet G, Trinquet F, Fournaison L. Experimental study on
air cooling by spray in the upstream flow of a heat exchanger. Int J Therm Sci 2012;60:23–31.
doi:http://dx.doi.org/10.1016/j.ijthermalsci.2012.06.005.
[26] He S, Gurgenci H, Guan Z, Alkhedhair AM. Pre-cooling with Munters media to improve the
performance of Natural Draft Dry Cooling Towers. Appl Therm Eng 2013;53:67–77.
221
doi:http://dx.doi.org/10.1016/j.applthermaleng.2012.12.033.
[27] Alkhedhair A, Gurgenci H, Jahn I, Guan Z, He S. Numerical simulation of water spray for pre-
cooling of inlet air in natural draft dry cooling towers. Appl Therm Eng 2013;61:416–24.
doi:http://dx.doi.org/10.1016/j.applthermaleng.2013.08.012.
[28] Molis S, Levine P. Combustion Turbine Spray Cooler Guide 1999.
[29] Chaker M, Meher-Homji CB. Evaporative Cooling of Gas Turbine Engines-Climatic Analysis
and Application in High Humidity Regions. ASME Turbo Expo 2007 Power Land, Sea Air,
Montreal, Canada: 2007.
[30] Jiyuan Tu, Guan Heng Yeoh CL. Computational Fluid Dynamics: A Practical Approach
[Kindle Edition]. 2nd Revise. ELSEVIER SCIENCE & TECHNOLOGY; 2012.
[31] Bender TJ, Bergstrom DJ, Rezkallah KS. A study on the effects of wind on the air intake flow
rate of a cooling tower: Part 3. Numerical study. J Wind Eng Ind Aerodyn 1996;64:73–88.
doi:10.1016/S0167-6105(96)00085-2.
[32] Tanimizu K, Hooman K. Natural draft dry cooling tower modelling. Heat Mass Transf
2012;49:155–61. doi:10.1007/s00231-012-1071-1.
[33] Ecker JG, Wiebking RD. Optimal design of a dry-type natural-draft cooling tower by
geometric programming. J Optim Theory Appl 1978;26:305–23. doi:10.1007/BF00933410.
[34] Liao HT, Yang LJ, Du XZ, Yang YP. Influences of height to diameter ratios of dry-cooling
tower upon thermo-flow characteristics of indirect dry cooling system. Int J Therm Sci
2015;94:178–92. doi:10.1016/j.ijthermalsci.2015.03.004.
[35] Hooman K. Theoretical Prediction With Numerical and Experimental Verification to Predict
Crosswind Effects on the Performance of Cooling Towers. Heat Transf Eng 2015;36:480–7.
doi:10.1080/01457632.2014.935223.
[36] Caytan Y. Validation of the two dimensional numerical model “STAR” developed for cooling
tower design. Proc. 3rd Cool. Tower Work., Budapest,Hungary: International Association for
Hydraulic Research; 1982.
[37] Hawlader MN., Liu B. Numerical study of the thermal–hydraulic performance of evaporative
natural draft cooling towers. Appl Therm Eng 2002;22:41–59. doi:10.1016/S1359-
4311(01)00065-5.
[38] Majumdar AK, Singhal AK, Reilly HE, Bartz JA. Numerical Modeling of Wet Cooling
Towers—Part 2: Application to Natural and Mechanical Draft Towers. J Heat Transfer
222
1983;105:736. doi:10.1115/1.3245656.
[39] Majumdar AK, Singhal AK, Spalding DB. Numerical Modeling of Wet Cooling Towers—Part
1: Mathematical and Physical Models. J Heat Transfer 1983;105:728. doi:10.1115/1.3245655.
[40] Benton DJ, Waldrop WR. Computer Simulation of Transport Phenomena in Evaporative
Cooling Towers. J Eng Gas Turbines Power 1988;110:190. doi:10.1115/1.3240102.
[41] KAPÁS N. INVESTIGATION OF FLOWCHARACTERISTICS OF HELLER-TYPE
COOLING TOWERS WITH DIFFERENT COOLING DELTA ANGLES. Period POL
YTECHNICA SER MECH ENG 2003;47:143–50.
[42] Kapas N. Behavior of Natural Draught Cooling Towers in Wind. CMFF’03, Budapest,
Hungary: 2003.
[43] Molle B, Tomas S, Hendawi M, Granier J. Evaporation and wind drift losses during sprinkler
irrigation influenced by droplet size distribution. Irrig Drain 2011:n/a-n/a. doi:10.1002/ird.648.
[44] Demuren AO, Rodi W. Three-Dimensional Numerical Calculations of Flow and Plume
Spreading Past Cooling Towers. J Heat Transfer 1987;109:113. doi:10.1115/1.3248029.
[45] du Preez AF, Kröger DG. The effect of the heat exchanger arrangement and wind-break walls
on the performance of natural draft dry-cooling towers subjected to cross-winds. J Wind Eng
Ind Aerodyn 1995;58:293–303. doi:10.1016/0167-6105(95)00026-7.
[46] Wei Q, Zhang B, Liu K, Du X, Meng X. A study of the unfavorable effects of wind on the
cooling efficiency of dry cooling towers. J Wind Eng Ind Aerodyn 1995;54–55:633–43.
doi:10.1016/0167-6105(94)00078-R.
[47] Su MD, Tang GF, Fu S. Numerical simulation of fluid flow and thermal performance of a dry-
cooling tower under cross wind condition. J Wind Eng Ind Aerodyn 1999;79:289–306.
doi:10.1016/S0167-6105(98)00121-4.
[48] Reshadatjoo H, Pormahmod N, Moltagh SY. The effect of cross-winds on an indirect dry
cooling tower with or without windbreaks 2011;225:635–46. doi:10.1177/0957650911400535.
[49] Al-Waked R, Behnia M. The performance of natural draft dry cooling towers under crosswind:
CFD study. Int J Energy Res 2004;28:147–61. doi:10.1002/er.958.
[50] Al-Waked R, Behnia M. The Effect of Windbreak Walls on the Thermal Performance of
Natural Draft Dry Cooling Towers. Heat Transf Eng 2005;26:50–62.
doi:10.1080/01457630591003763.
223
[51] Zhao W, Liu P. Effect of wind on recirculation of direct air-cooled condenser for a large power
plant. Asia-Pacific Power Energy Eng Conf APPEEC 2009:2–5.
doi:10.1109/APPEEC.2009.4918319.
[52] Wu XP, Yang LJ, Du XZ, Yang YP. Flow and heat transfer characteristics of indirect dry
cooling system with horizontal heat exchanger A-frames at ambient winds. Int J Therm Sci
2014;79:161–75. doi:10.1016/j.ijthermalsci.2014.01.007.
[53] Zhai Z, Fu S. Improving cooling efficiency of dry-cooling towers under cross-wind conditions
by using wind-break methods. Appl Therm Eng 2006;26:1008–17.
doi:10.1016/j.applthermaleng.2005.10.016.
[54] Yang LJ, Wu XP, Du XZ, Yang YP. Dimensional characteristics of wind effects on the
performance of indirect dry cooling system with vertically arranged heat exchanger bundles.
Int J Heat Mass Transf 2013;67:853–66. doi:10.1016/j.ijheatmasstransfer.2013.08.085.
[55] Goodarzi M, Keimanesh R. Heat rejection enhancement in natural draft cooling tower using
radiator-type windbreakers. Energy Convers Manag 2013;71:120–5.
doi:10.1016/j.enconman.2013.03.031.
[56] Goodarzi M. A proposed stack configuration for dry cooling tower to improve cooling
efficiency under crosswind. J Wind Eng Ind Aerodyn 2010;98:858–63.
doi:10.1016/j.jweia.2010.08.004.
[57] Lu Y, Gurgenci H, Guan Z, He S. The influence of windbreak wall orientation on the cooling
performance of small natural draft dry cooling towers. Int J Heat Mass Transf 2014;79:1059–
69. doi:10.1016/j.ijheatmasstransfer.2014.09.012.
[58] Wei Q, Du X, Zhang B, Meng X. Full scale measurement and wind tunnel modeling on the
effects of wind on the efficiency of dry cooling towers. 5th Int. Symp. Fluid Control. Meas.
Vis., Italy: 1997, p. 775–8.
[59] Du X, Wei Q, Meng X. The research of unfavorable effects of wind on the cooling efficiency
of dry cooling towers and improving methods. Annu. Conf. Mech. Comm. China, China: 1996.
[60] Lu Y, Guan Z, Gurgenci H, Hooman K, He S, Bharathan D. Experimental study of crosswind
effects on the performance of small cylindrical natural draft dry cooling towers. Energy
Convers Manag 2015;91:238–48. doi:http://dx.doi.org/10.1016/j.enconman.2014.12.018.
[61] Bom GJ, Robert F, Ebel D, Marja T. Evaporative air-conditioning : applications for
environmentally friendly cooling. Washington, DC: 1999.
224
[62] Lal Basediya A, Samuel DVK, Beera V. Evaporative cooling system for storage of fruits and
vegetables - a review. J Food Sci Technol 2013;50:429–42. doi:10.1007/s13197-011-0311-6.
[63] Camargo JR. Evaporative cooling: water for thermal comfort. Ambient Água - An Interdiscip
J Appl Sci 2007;3:51–61.
[64] Bete Limited. Guide to spray properties. 2000.
[65] Mugele R a., Evans HD. Droplet Size Distribution in Sprays. Ind Eng Chem 1951;43:1317–
24. doi:10.1021/ie50498a023.
[66] Grant G, Brenton J, Drysdale D. Fire suppression by water sprays. Prog Energy Combust Sci
2000;26:79–130. doi:10.1016/S0360-1285(99)00012-X.
[67] Lefebvre A. Atomization and sprays. Taylor & Francis.; 1989. doi:citeulike-article-id:7024471.
[68] Lad N, Aroussi A, Muhamad Sa MF. Droplet Size Measurement for Liquid Spray using Digital
Image Analysis Technique. J Appl Sci 2011;11:1966–72. doi:10.3923/jas.2011.1966.1972.
[69] Kashdan JT, Shrimpton JS, Whybrew A. A digital image analysis technique for quantitative
characterisation of high-speed sprays. Opt Lasers Eng 2007;45:106–15.
doi:10.1016/j.optlaseng.2006.03.006.
[70] Blaisot JB, Yon J. Droplet size and morphology characterization for dense sprays by image
processing: Application to the Diesel spray. Exp Fluids 2005;39:977–94. doi:10.1007/s00348-
005-0026-4.
[71] Lad N, Aroussi A, Muhamad Sa MF, Muhamad Said MF. Droplet Size Measurement for
Liquid Spray using Digital Image Analysis Technique. J Appl Sci 2011;11:1966–72.
doi:10.3923/jas.2011.1966.1972.
[72] Smolı´k Dumbova´, L., Schwarz, J., Kulmala, M. J, Smolık J, Džumbová L, Schwarz J,
Kulmala M. Evaporation of ventilated water droplet:connection between heat and mass
transfer. Aerosol Sci 2001;32:739–748. doi:10.1016/s0021-8502(00)00118-x.
[73] Luo Y, Miller DR, X. Yang, McManus ML, Krider HM. Characteristics of evaporation from
water-based bacterial pesticide droplets . Am Soc Agric Eng 1994;37:1473–9.
[74] Palaszewski SJ, Jiji LM, Weinbaum S. A three-dimensional air-vapor-droplet local interaction
model for spray units. J Heat Transfer 1981;103:514–21.
[75] ASHRAE. ASHRAE Handbook-Fundamentals. Am Soc Heating, Refrig Air-Conditioning
Eng 2009.
225
[76] Kincaid T.S. DC and L. A water droplet evaporation and temperature model. Trans ASAE
1989;32:457–63.
[77] Chaker Meher-Homji, C.B., Mee T.R. M. Inlet Fogging of Gas Turbine Engines-Part A:
fog droplet thermodynamics, heat transfer and practical considerations. Proc ASME Turbo
Expo 2002.
[78] H.J. Holterman, J.C. van de Zande, H.A.J. Porskamp JFMH. Modelling spray drift from boom
sprayers. Wageningen: IMAG; 1997.
[79] Sadafi MH, Jahn I, Stilgoe AB, Hooman K. A theoretical model with experimental verification
for heat and mass transfer of saline water droplets. Int J Heat Mass Transf 2015;81:1–9.
doi:10.1016/j.ijheatmasstransfer.2014.10.005.
[80] Meizhong Dai, J. Blair Perot, Schmidt DP. Heat transfer within deforming droplets. Proc.
ASME Intern. Combust. Engine Div. , New Orleans: 2002.
[81] Okaruma Nakanishi, K. S. Theoretical study on sprinkler sprays (part four) geometric pattern
form of single sprayer under wind conditions. Trans Japanese Soc Irrig Drain Reclam Eng
1969;29:35–43.
[82] Hughes E. RG. The mechanics of drops. Chem Eng Prog 1952;48.
[83] Licht W, Narasimhamurty GSR. Rate of fall of single liquid droplets. AIChE J 1955;1:366–
73. doi:10.1002/aic.690010316.
[84] Kukkonen J, Vesala T, Kulmala M. The interdependence of evaporation and settling for
airborne freely falling droplets. J Aerosol Sci 1989;20:749–63. doi:10.1016/0021-
8502(89)90087-6.
[85] Clift R, Grace JR, Weber ME. Bubbles, Drops and Particles. Academic Press; 1978.
doi:citeulike-article-id:1260309.
[86] Kinzer GD, Gunn R. the Evaporation, Temperature and Thermal Relaxation-Time of Freely
Falling Waterdrops. J Meteorol 1951;8:71–83.
[87] Wedding JB, Kim YJ, Dennison RS. Mass transfer from water droplets under simulated free-
fall conditions. Atmos Environ 1986;20:1039–45. doi:10.1016/0004-6981(86)90289-1.
[88] Ranz WE, Marshall WR 1952. Evaporation from drops. Chem Eng Prog 1952;48:141–6.
[89] Barker GL, Thompson. JF, Threadgill. ED. Spray Droplet deposition on a three-dimensional
object. Trans ASAE ASAE 1978;21:806–12.
226
[90] Wang T, Li X, Pinninti V. Simulation of mist transport for gas turbine inlet air cooling. Numer
Heat Transf Part A Appl 2008;53:10:1013–36.
[91] William A. Fluid dynamics and transport of droplets and sprays. 2nd ed. Cambridge University
Press, New York; 2010.
[92] Jiusheng Li HK. Simulating Water-Drop Movement from Noncircular Sprinkler Nozzles. J
Irrig Drain Eng 1995;121:7.
[93] Darvishvand Taher M, Brown RB. A virtual nozzle for modeling pesticide spray deposition in
a plant canopy. Canada: University of Guelph; 1999.
[94] Park SW, Mitchell JK, Bubenzer GD. Rainfall characteristics and their relation to splash
erosion. Trans ASAE - Am Soc Agric Eng 1983;26.
[95] Ashgriz N. Handbook of Atomization and Sprays: Theory and Applications. Springer Science
& Business Media; 2011.
[96] Morsi SA, Alexander AJ. An investigation of particle trajectories in two-phase flow systems.
J Fluid Mech 1972;55:193–208. doi:10.1017/S0022112072001806.
[97] Masters K. Spray drying handbook. 5th ed. Harlow: Longman Scientific & Technical; 1991.
[98] Watt J. Evaporative air conditioning. New York: Industrial Press; 1963.
[99] Leung CW, Wong TT, Kang HJ. Forced convection of turbulent flow in triangular ducts with
different angles and surface roughnesses. Heat Mass Transf 1998;34:63–8.
doi:10.1007/s002310050232.
[100] Halasz B. A general mathematical model of evaporative cooling devices. Rev Générale Therm
1998;37:245–55. doi:10.1016/S0035-3159(98)80092-5.
[101] Dai YJ, Sumathy K. Theoretical study on a cross-flow direct evaporative cooler using
honeycomb paper as packing material. Appl Therm Eng 2002;22:1417–30.
doi:10.1016/S1359-4311(02)00069-8.
[102] Hasan A, Sirén K. Performance investigation of plain and finned tube evaporatively cooled
heat exchangers. Appl Therm Eng 2003;23:325–40. doi:10.1016/S1359-4311(02)00194-1.
[103] F. Merkel. Verdunstungskühlung. VDI-Zeitchrif 1925;70:123–8.
[104] M. Poppe L, H. Rögener H. Berechnung von Rückkühlwerken. VDI-Wärmeatlas 1991:1228–
42. doi:10.1007/978-3-540-32218-4.
[105] Jaber H, Webb RL. Design of Cooling Towers by the Effectiveness-NTU Method. J Heat
227
Transfer 1989;111:837. doi:10.1115/1.3250794.
[106] Braun JE, Klein SA, J.W.Mitchell. Effictiveness models for cooling towers and cooling coils.
ASHRAE Trans 1989;95:164–74. doi:http://www.osti.gov/scitech/biblio/5770692.
[107] El-Dessouky HTA, Al-Haddad A, Al-Juwayhel F. A Modified Analysis of Counter Flow Wet
Cooling Towers. J Heat Transfer 1997;119:617. doi:10.1115/1.2824150.
[108] Khan J-R, Zubair SM. An Improved Design and Rating Analyses of Counter Flow Wet
Cooling Towers. J Heat Transfer 2001;123:770–8. doi:10.1115/1.1376395.
[109] Fujita T, Tezuka S. Calculation on Thermal Performance Capability of Mechanical Draft
Cooling Towers. Bull JSME 1984;37:490–7.
[110] Kloppers JC, Kröger DG. A critical investigation into the heat and mass transfer analysis of
counterflow wet-cooling towers. Int J Heat Mass Transf 2005;48:765–77.
doi:10.1016/j.ijheatmasstransfer.2004.09.004.
[111] Lu Lu, Wenjian Cai. A UNIVERSAL ENGINEERING MODEL FOR COOLING TOWERS.
Int. Refrig. Air Cond. Conf., 2002.
[112] Makkinejad N. Temperature profile in countercurrent/cocurrent spray towers. Int J Heat Mass
Transf 2001;44:429–42. doi:10.1016/S0017-9310(00)00088-0.
[113] Petruchik AI, Solodukhin AD, Fisenko SP. Simulation of Cooling of Water Droplet and Film
Flows in Large Natural Wet Cooling Towers. J Eng Phys Thermophys n.d.;74:62–8.
doi:10.1023/A:1016673803772.
[114] Fisenko SP, Petruchik AI, Solodukhin AD. Evaporative cooling of water in a natural draft
cooling tower. Int J Heat Mass Transf 2002;45:4683–94.
[115] Mickley HS. Design of forced draft air conditioning equipment. Chem Eng Prog 1949;45:739–
45.
[116] Baker DR, Mart LT. Cooling Tower Characteristics as Determined by the Unit-Volume
Coefficient. 1952.
[117] Snyder NW. Effect of air rate, water rate, temperature, and packing density in a cross-flow
cooling tower. Chem Eng Prog 1955;52:61.
[118] M. ZS, B. BB. An analysis of the cross flow cooling tower. Refrig Eng 1956;6431:90–2.
[119] Lowe HJ, Christie DG. Heat Transfer and Pressure Drop Data on Cooling Tower Packings,
and Model Studies of the Resistance of Natural - Draught Towers to Airflow. Proc. 1961 Int.
228
Heat Transf. Conf, 1961, p. 933–50.
[120] Hallett GF. Performance Curves for Mechanical Draft Cooling Towers. J Eng Power
1975;97:503. doi:10.1115/1.3446045.
[121] Kelly N. Kelly’s handbook of crossflow cooling tower performance. Kansas City Mo.: Neil
W. Kelly & Associates; 1976.
[122] Baker DR, Shryock HA. A Comprehensive Approach to the Analysis of Cooling Tower
Performance. J Heat Transfer 1961;83:339. doi:10.1115/1.3682276.
[123] Sutherland JW. Analysis of Mechanical-Draught Counterflow Air/Water Cooling Towers. J
Heat Transfer 1983;105:576. doi:10.1115/1.3245624.
[124] Osterle F. On the analysis of counter-flow cooling towers. Int J Heat Mass Transf
1991;34:1313–6. doi:10.1016/0017-9310(91)90040-L.
[125] Kloppers JC, Kröger DG. A critical investigation into the heat and mass transfer analysis of
counterflow wet-cooling towers. Int J Heat Mass Transf 2005;48:765–77.
doi:10.1016/j.ijheatmasstransfer.2004.09.004.
[126] Simpson WM, Sherwood TK. Performance of Small Mechanical Draft Cooling Towers. Refrig
Eng 1946;52:535–43.
[127] Carey BWF, Eng M, Mech MIE, Williamson GJ, Mech ME. Gas Cooling and Humidification :
Design of Packed Towers from Small-scale Tests 1950.
[128] Kachhwaha SS, Dhar PL, Kale SR. Experimental studies and numerical simulation of
evaporative cooling of air with a water sprayII. Horizontal counter flow. Int J Heat Mass Transf
1998;41:465–74. doi:10.1016/s0017-9310(97)00131-2.
[129] Kachhwaha SS, Dhar PL, Kale SR. Experimental studies and numerical simulation of
evaporative cooling of air with a water spray—I. Horizontal parallel flow. Int J Heat Mass
Transf 1998;41:447–64. doi:10.1016/s0017-9310(97)00133-6.
[130] Sureshkumar R, Kale SR, Dhar PL. Heat and mass transfer processes between a water spray
and ambient air – I. Experimental data. Appl Therm Eng 2008;28:349–60.
doi:10.1016/j.applthermaleng.2007.09.010.
[131] Sureshkumar R, Kale SR, Dhar PL. Heat and mass transfer processes between a water spray
and ambient air – II. Simulations. Appl Therm Eng 2008;28:361–71.
doi:10.1016/j.applthermaleng.2007.09.015.
229
[132] Montazeri H, Blocken B, Hensen JLM. Evaporative cooling by water spray systems: CFD
simulation, experimental validation and sensitivity analysis. Build Environ 2014;83:129–41.
doi:10.1016/j.buildenv.2014.03.022.
[133] Alkhedhair A, Guan Z, Jahn I, Gurgenci H, He S. Water spray for pre-cooling of inlet air for
Natural Draft Dry Cooling Towers – Experimental study. Int J Therm Sci 2015;90:70–8.
doi:http://dx.doi.org/10.1016/j.ijthermalsci.2014.11.029.
[134] Tissot J, Boulet P, Trinquet F, Fournaison L, Macchi-Tejeda H. Air cooling by evaporating
droplets in the upward flow of a condenser. Int J Therm Sci 2011;50:2122–31.
doi:10.1016/j.ijthermalsci.2011.06.004.
[135] Xia L, Gurgenci H, Liu D, Guan Z, Zhou L, Wang P. CFD analysis of pre-cooling water spray
system in natural draft dry cooling towers. Appl Therm Eng 2016;105:1051–60.
doi:10.1016/j.applthermaleng.2016.03.096.
[136] Sadafi MH, Jahn I, Hooman K. Cooling performance of solid containing water for spray
assisted dry cooling towers. Energy Convers Manag 2015;91:158–67.
doi:10.1016/j.enconman.2014.12.005.
[137] Sadafi MH, González Ruiz S, Vetrano MR, Jahn I, van Beeck J, Buchlin JM, et al. An
investigation on spray cooling using saline water with experimental verification. Energy
Convers Manag 2016;108:336–47. doi:10.1016/j.enconman.2015.11.025.
[138] Khan JR, Wang T, Chaker M. Investigation of Cooling Effectiveness of Gas Turbine Inlet
Fogging Location Relative to the Silencer. J Eng Gas Turbines Power 2012;134:022001.
doi:10.1115/1.4004044.
[139] Kang D, Strand RK. Modeling of simultaneous heat and mass transfer within passive down-
draft evaporative cooling (PDEC) towers with spray in FLUENT. Energy Build 2013;62:196–
209. doi:10.1016/j.enbuild.2013.02.039.
[140] Kim J. Spray cooling heat transfer: The state of the art. Int J Heat Fluid Flow 2007;28:753–67.
doi:10.1016/j.ijheatfluidflow.2006.09.003.
[141] Yoon SS, Hewson JC, DesJardin PE, Glaze DJ, Black AR, Skaggs RR. Numerical modeling
and experimental measurements of a high speed solid-cone water spray for use in fire
suppression applications. Int J Multiph Flow 2004;30:1369–88.
doi:http://dx.doi.org/10.1016/j.ijmultiphaseflow.2004.07.006.
[142] Ding H, Wang Z, Li Y, Xu H, Zuo C. Initial dynamic development of fuel spray analyzed by
230
ultra high speed imaging. Fuel 2016;169:99–110. doi:10.1016/j.fuel.2015.11.083.
[143] Tissot J, Boulet P, Trinquet F, Fournaison L, Macchi-Tejeda H. Air cooling by evaporating
droplets in the upward flow of a condenser. Int J Therm Sci 2011;50:2122–31.
doi:10.1016/j.ijthermalsci.2011.06.004.
[144] Jenny P, Roekaerts D, Beishuizen N. Modeling of turbulent dilute spray combustion. Prog
Energy Combust Sci 2012;38:846–87. doi:10.1016/j.pecs.2012.07.001.
[145] Rajamanickam K, Basu S. Insights into the dynamics of spray–swirl interactions. J Fluid Mech
2017;810:82–126. doi:10.1017/jfm.2016.710.
[146] Marchione T, Allouis C, Amoresano A, Beretta F. Experimental Investigation of a Pressure
Swirl Atomizer Spray. J Propuls Power 2007;23:1096–101. doi:10.2514/1.28513.
[147] Chaker M, Meher-Homji CB, Mee T. Inlet Fogging of Gas Turbine Engines—Part I: Fog
Droplet Thermodynamics, Heat Transfer, and Practical Considerations. J Eng Gas Turbines
Power 2004;126:545–58. doi:10.1115/1.1712981.
[148] Chaker M, Meher-Homji CB, Mee T. Inlet Fogging of Gas Turbine Engines—Part II: Fog
Droplet Sizing Analysis, Nozzle Types, Measurement, and Testing. J Eng Gas Turbines Power
2004;126:559. doi:10.1115/1.1712982.
[149] Durdina L, Jedelsky J, Jicha M. Spray structure of a pressure-swirl atomizer for combustion
applications. EPJ Web Conf 2012;25:01010. doi:10.1051/epjconf/20122501010.
[150] Chen PC, Wang WC, Roberts WL, Fang T. Spray and atomization of diesel fuel and its
alternatives from a single-hole injector using a common rail fuel injection system. Fuel
2013;103:850–61. doi:10.1016/j.fuel.2012.08.013.
[151] Jain M, John B, Iyer KN, Prabhu S V. Characterization of the full cone pressure swirl spray
nozzles for the nuclear reactor containment spray system. Nucl Eng Des 2014;273:131–42.
doi:10.1016/j.nucengdes.2014.02.025.
[152] Hong M, Jeon J, Lee SY. Discharge Coefficient of Pressure-Swirl Atomizers with Low Nozzle
Opening Coefficients. J Propuls Power 2012;28:213–8. doi:10.2514/1.B34168.
[153] Dorfner V, Domnick J, Durst F, Kohler R. VISCOSITY AND SURFACE TENSION
EFFECTS IN PRESSURE SWIRL ATOMIZATION. At Sprays 1995;5:261–85.
[154] Azami MH, Savill M. Modelling of spray evaporation and penetration for alternative fuels.
Fuel 2016;180:514–20. doi:10.1016/j.fuel.2016.04.050.
231
[155] Montazeri H, Blocken B, Hensen JLM. CFD analysis of the impact of physical parameters on
evaporative cooling by a mist spray system. Appl Therm Eng 2015;75:608–22.
doi:http://dx.doi.org/10.1016/j.applthermaleng.2014.09.078.
[156] Santolaya JL, Aísa LA, Calvo E, García I, Cerecedo LM. Experimental Study of Near-Field
Flow Structure in Hollow Cone Pressure Swirl Sprays. J Propuls Power 2007;23:382–9.
doi:10.2514/1.20713.
[157] Shim YS, Choi GM, Kim DJ. Numerical and experimental study on effect of wall geometry
on wall impingement process of hollow-cone fuel spray under various ambient conditions. Int
J Multiph Flow 2009;35:885–95. doi:10.1016/j.ijmultiphaseflow.2009.06.004.
[158] CHANG K-C, WANG M-R, WU W-J, HONG C-H. Experimental and theoretical study on
hollow-cone spray. J Propuls Power 1993;9:28–34. doi:10.2514/3.11481.
[159] Asheim JP, Kirwan JE, Peters JE. Modeling of a hollow-cone liquid spray including droplet
collisions. J Propuls Power 1988;4:391–8. doi:10.2514/3.23079.
[160] Belhadef A, Vallet A, Amielh M, Anselmet F. Pressure-swirl atomization: Modeling and
experimental approaches. Int J Multiph Flow 2012;39:13–20.
doi:10.1016/j.ijmultiphaseflow.2011.09.009.
[161] Elbadawy I, Gaskell PH, Lawes M, Thompson HM. Numerical investigation of the effect of
ambient turbulence on pressure swirl spray characteristics. Int J Multiph Flow 2015;77:271–
84. doi:10.1016/j.ijmultiphaseflow.2015.06.008.
[162] Babinsky E, Sojka PE. Modeling drop size distributions. Prog Energy Combust Sci
2002;28:303–29. doi:10.1016/S0360-1285(02)00004-7.
[163] ANSYS I. ANSYS FLUENT 12.1 User’s Guide 2009.
[164] Launder BE, Spalding DB. Lectures in Mathematical Models of Turbulence. Academic 1972.
[165] Alkhedhair A, Jahn I, Gurgenci H, Guan Z, He S, Lu Y. Numerical simulation of water spray
in natural draft dry cooling towers with a new nozzle representation approach. Appl Therm
Eng 2016;98:924–35. doi:10.1016/j.applthermaleng.2015.10.118.
[166] Alkhedhair A, Jahn I, Gurgenci H, Guan Z, He S. Parametric study on spray cooling system
for optimising nozzle design with pre-cooling application in natural draft dry cooling towers.
Int J Therm Sci 2016;104:448–60. doi:10.1016/j.ijthermalsci.2016.02.004.
[167] Morsi SA, Alexander AJ. An investigation of particle trajectories in two-phase flow systems.
J Fluid Mech 1972;55:193. doi:10.1017/S0022112072001806.
232
[168] Schmidt DP, Nouar I, Senecal PK, Rutland CJ, Martin JK, Reitz RD, et al. Pressure-Swirl
Atomization in the Near Field. SAE Tech. Pap., SAE International; 1999. doi:10.4271/1999-
01-0496.
[169] Weber C. Zum Zerfall eines Flüssigkeitsstrahles. ZAMM - Zeitschrift f?R Angew Math Und
Mech 1931;11:136–54. doi:10.1002/zamm.19310110207.
[170] O’Rourke PJ, Amsden AA. The TAB Method for Numerical Calculation of Spray Droplet
Breakup. SAE Tech. Pap., SAE International; 1987. doi:10.4271/872089.
[171] Lamb H. Hydrodynamics. Sixth Edit. New York, USA: Dover Publications; 1945.
[172] O’Rourke PJ, Amsden AA. The TAB Method for Numerical Calculation of Spray Droplet
Breakup. SAE Tech Pap 1987;872089.
[173] Spiegel M, Redel T, Zhang JJ, Struffert T, Hornegger J, Grossman RG, et al. Tetrahedral vs.
polyhedral mesh size evaluation on flow velocity and wall shear stress for cerebral
hemodynamic simulation. Comput Methods Biomech Biomed Engin 2011;14:9–22.
doi:10.1080/10255842.2010.518565.
[174] Sosnowski M, Krzywanski J, Gnatowska R. Polyhedral meshing as an innovative approach to
computational domain discretization of a cyclone in a fluidized bed CLC unit. Energy and
Fuels 2017;14. doi:10.1051/e3sconf/20171401027.
[175] Junwei S, Zhaolin G, Chungang C, Yun XX. A two‐layer mesh method for discrete element
simulation of gas‐particle systems with arbitrarily polyhedral mesh. Int J Numer Methods
Eng n.d.;103:759–80. doi:10.1002/nme.4911.
[176] Tao WQ, Qu ZG, He YL. A novel segregated algorithm for incompressible fluid flow and heat
transfer problems—clear (coupled and linked equations algorithm revised) part i:
Mathematical formulation and solution procedure. Numer Heat Transf Part B Fundam
2004;45:1–17. doi:10.1080/1040779049025485.
[177] Van Doormaal JP, Raithby GD. Enhancements of the simple method for predicting
incompressible fluid flows. Numer Heat Transf 1984;7:147–63.
doi:10.1080/01495728408961817.
[178] SANTAVICCA DA, BRACCO F V, COGHE A, WU K-J. LDV measurements of drop
velocity in diesel-type sprays. AIAA J 1984;22:1263–70. doi:10.2514/3.8770.
[179] Inthavong K, Yang W, Fung MC, Tu JY. External and Near-Nozzle Spray Characteristics of a
Continuous Spray Atomized from a Nasal Spray Device. Aerosol Sci Technol 2012;46:165–
233
77. doi:10.1080/02786826.2011.617793.
[180] Fung M, Inthavong K, Yang W. External characteristics of spray atomisation from a nasal
spray device. … Conf CFD … 2009:1–6.
[181] Liu Y, Matida EA, Gu J, Johnson MR. Numerical simulation of aerosol deposition in a 3-D
human nasal cavity using RANS, RANS/EIM, and LES. J Aerosol Sci 2007;38:683–700.
doi:10.1016/j.jaerosci.2007.05.003.
[182] Jing D, Zhang F, Li Y, Xu H, Shuai S. Experimental investigation on the macroscopic and
microscopic spray characteristics of dieseline fuel. Fuel 2017;199:478–87.
doi:10.1016/j.fuel.2017.02.055.
[183] Dumouchel C. The maximum entropy formalism and the prediction of liquid spray drop-size
distribution. Entropy 2009;11:713–47. doi:10.3390/e11040713.
[184] Shi H, Kleinstreuer C. Primary breakup of nonturbulent round liquid jets in gas crossflows. J
Fluids Eng 2007;129:621. doi:10.1115/1.2717621.
[185] Dukowicz JK. A particle-fluid numerical model for liquid sprays. J Comput Phys
1980;35:229–53. doi:https://doi.org/10.1016/0021-9991(80)90087-X.
[186] Lee S, Song K, Rho B. Investigation of turbulent spray disintegration characteristics depending
on the nozzle configuration. KSME Int J 2002;16:572–9.
[187] Balachandar S, Eaton JK. Turbulent Dispersed Multiphase Flow. Annu Rev Fluid Mech
2010;42:111–33. doi:10.1146/annurev.fluid.010908.165243.
[188] Zaichik LI, Pershukov VA. Influence of particles on the initial stage of homogeneous
turbulence degeneration. J Eng Phys 1990;58:408–12. doi:10.1007/BF00877345.
[189] Sun Y, Guan Z, Gurgenci H, Hooman K, Li X, Xia L. Investigation on the influence of
injection direction on the spray cooling performance in natural draft dry cooling tower. Int J
Heat Mass Transf 2017;110:113–31. doi:10.1016/j.ijheatmasstransfer.2017.02.069.
[190] Chaker M, Meher-Homji CB, Mee T, Mee III T. Inlet Fogging of Gas Turbine Engines - Part
B: Fog Droplet Sizing Analysis, Nozzle Types, Measurement, and Testing. Proc ASME Turbo
Expo 2002 2002;126:1–13. doi:10.1115/1.1712982.
[191] Tanimizu K, Hooman K. Natural draft dry cooling tower modelling. Heat Mass Transf
2013;49:155–61. doi:10.1007/s00231-012-1071-1.
[192] Rezaei E, Shafiei S, Abdollahnezhad A. Reducing water consumption of an industrial plant

234
cooling unit using hybrid cooling tower. Energy Convers Manag 2010;51:311–9.
doi:10.1016/j.enconman.2009.09.027.
[193] Zhao YB, Long G, Sun F, Li Y, Zhang C. Numerical study on the cooling performance of dry
cooling tower with vertical two-pass column radiators under crosswind. Appl Therm Eng
2015;75:1106–17. doi:10.1016/j.applthermaleng.2014.10.061.
[194] Zhao Y, Sun F, Li Y, Long G, Yang Z. Numerical study on the cooling performance of natural
draft dry cooling tower with vertical delta radiators under constant heat load. Appl Energy
2015;149:225–37. doi:10.1016/j.apenergy.2015.03.119.
[195] Chaker MA. Key Parameters for the Performance of Impaction-Pin Nozzles Used in Inlet
Fogging of Gas Turbine Engines. J Eng Gas Turbines Power 2007;129:473.
doi:10.1115/1.2364006.
[196] Jones SD, Robertson WM. The effects of spray-chilling carcasses on the shrinkage and quality
of beef. Meat Sci 1988;24:177–88. doi:10.1016/0309-1740(88)90076-9.
[197] Bianchi M, Chaker M, De Pascale A, Peretto A, Spina PR. CFD simulation of water injection
in gt inlet duct using spray experimentally tuned data: nozzle spray simulation model and
results for an application to a heavy-duty gas turbine. ASME Conf Proc 2007;2007:629–42.
[198] Wang T, Dhanasekaran TS. Calibration of a computational model to predict mist/steam
impinging jets cooling with an application to gas turbine blades. J Heat Transfer
2010;132:122201–11.
[199] Chaker M, Meher-Homji CB, Mee T. Inlet Fogging of Gas Turbine Engines—Part I: Fog
Droplet Thermodynamics, Heat Transfer, and Practical Considerations. J Eng Gas Turbines
Power 2004;126:545. doi:10.1115/1.1712981.
[200] Chaker M, Meher-Homji CB, Mee III T. Inlet Fogging of Gas Turbine Engines—Part III: Fog
Behavior in Inlet Ducts, Computational Fluid Dynamics Analysis, and Wind Tunnel
Experiments. J Eng Gas Turbines Power 2004;126:571–80. doi:10.1115/1.1712983.
[201] Elgobashi S. An Updated Classification Map of Particle-Laden Turbulent Flows IUTAM
Symposium on Computational Approaches to Multiphase Flow. In: Balachandar S, Prosperetti
A, editors. vol. 81, Springer Netherlands; 2006, p. 3–10. doi:10.1007/1-4020-4977-3_1.
[202] Gutheil E. Issues in computational studies of turbulent spray combustion experiments and
numerical simulations of diluted spray turbulent combustion. In: Merci B, Roekaerts D, Sadiki
A, editors. vol. 17, Springer Netherlands; 2011, p. 1–39. doi:10.1007/978-94-007-1409-0_1.
235
[203] Crowe C, Stock D, Sharma M. The particle-source-in cell/PSI-CELL/model for gas-droplet
flows. ASME J Fluid Eng 1977;99:325–32. doi:citeulike-article-id:4106760.
[204] Vahid E, Mofid G-B. Two-dimensional modeling of water spray cooling in superheated steam.
Therm Sci 2008;12:79–88.
[205] Lucas M, Martínez PJ, Ruiz J, Kaiser AS, Viedma A. On the influence of psychrometric
ambient conditions on cooling tower drift deposition. Int J Heat Mass Transf 2010;53:594–
604. doi:http://dx.doi.org/10.1016/j.ijheatmasstransfer.2009.10.037.
[206] Williamson NJ. Numerical modelling of heat and mass transfer and optimisation of a natural
draft wet cooling tower. University of Sydney, 2008.
[207] Jiang X, Siamas GA, Jagus K, Karayiannis TG. Physical modelling and advanced simulations
of gas–liquid two-phase jet flows in atomization and sprays. Prog Energy Combust Sci
2010;36:131–67. doi:10.1016/j.pecs.2009.09.002.
[208] Conradie AE, Buys JD, Kröger DG. Performance optimization of dry-cooling systems for
power plants through SQP methods. Appl Therm Eng 1998;18:25–45. doi:10.1016/S1359-
4311(97)00020-3.
[209] Zhang H, Bai B, Liu L, Sun H, Yan J. Droplet dispersion characteristics of the hollow cone
sprays in crossflow. Exp Therm Fluid Sci 2013;45:25–33.
doi:10.1016/j.expthermflusci.2012.09.021.
[210] Husted BP, Petersson P, Lund I, Holmstedt G. Comparison of PIV and PDA droplet velocity
measurement techniques on two high-pressure water mist nozzles. Fire Saf J 2009;44:1030–
45. doi:http://dx.doi.org/10.1016/j.firesaf.2009.07.003.
[211] Sartor JD, Abbott CE. Prediction and Measurement of the Accelerated Motion of Water Drops
in Air. J Appl Meteorol 1975;14:232–9. doi:10.1175/1520-
0450(1975)014<0232:PAMOTA>2.0.CO;2.
[212] van Hinsberg MAT, ten Thije Boonkkamp JHM, Clercx HJH. An efficient, second order
method for the approximation of the Basset history force. J Comput Phys 2011;230:1465–78.
doi:10.1016/j.jcp.2010.11.014.
[213] Holterman HJ, van de Zande JC, Porskamp HAJ, Huijsmans JFM. Modelling spray drift from
boom sprayers. Comput Electron Agric 1997;19:1–22. doi:10.1016/s0168-1699(97)00018-5.
[214] Ariane Vallet, Cyril Tinet, Jean-Paul Douzals. Effect of Nozzle Orientation on Droplet Size
and Droplet Velocity from Vineyard Sprays. J Agric Sci Technol B 2015;5:672–8.
236
doi:10.17265/2161-6264/2015.10.004.
[215] Bade KM, Kalata W, Schick RJ. Experimental and Computational Study of a Spray at Multiple
Injection Angles Spray Analysis and Research Services Spraying Systems Co . Analysis
2010:2010–2010.
[216] Kaiser AS, Lucas M, Viedma A, Zamora B. Numerical model of evaporative cooling processes
in a new type of cooling tower. Int J Heat Mass Transf 2005;48:986–99.
doi:10.1016/j.ijheatmasstransfer.2004.09.047.
[217] Weinstein LA, Loomis J, Bhatia B, Bierman DM, Wang EN, Chen G. Concentrating Solar
Power. Chem Rev 2015;115:acs.chemrev.5b00397. doi:10.1021/acs.chemrev.5b00397.
[218] Philibert C. The Present and Future use of Solar Thermal Energy as a Primary Source of Energy
2005.
[219] Kaygusuz K. Prospect of concentrating solar power in Turkey: The sustainable future. Renew
Sustain Energy Rev 2011;15:808–14. doi:10.1016/j.rser.2010.09.042.
[220] Tsoutsos T, Gekas V, Marketaki K. Technical and economical evaluation of solar thermal
power generation. Renew Energy 2003;28:873–86. doi:10.1016/S0960-1481(02)00152-0.
[221] Geyer M, Aringhoff R, Teske S, Brakmann G. Concentrated Solar Thermal Power. 2005.
[222] Mills D. Advances in solar thermal electricity technology. Sol Energy 2004;76:19–31.
doi:10.1016/S0038-092X(03)00102-6.
[223] Wang W, Zhang H, Liu P, Li Z, Lv J, Ni W. The cooling performance of a natural draft dry
cooling tower under crosswind and an enclosure approach to cooling efficiency enhancement.
Appl Energy 2017;186:336–46. doi:10.1016/j.apenergy.2016.02.007.
[224] El-Dessouky H, Ettouney H, Al-Zeefari A. Performance analysis of two-stage evaporative
coolers. Chem Eng J 2004;102:255–66. doi:10.1016/j.cej.2004.01.036.
[225] Chen Q, Yang K, Wang M, Pan N, Guo Z-Y. A new approach to analysis and optimization of
evaporative cooling system I: Theory. Energy 2010;35:2448–54.
doi:10.1016/j.energy.2010.02.037.
[226] De Paepe W, Contino F, Delattin F, Bram S, De Ruyck J. New concept of spray saturation
tower for micro Humid Air Turbine applications. Appl Energy 2014;130:723–37.
doi:10.1016/j.apenergy.2014.03.055.
[227] Fisenko SP, Brin AA, Petruchik AI. Evaporative cooling of water in a mechanical draft cooling
237
tower. Int J Heat Mass Transf 2004;47:165–77.
[228] He S, Guan Z, Gurgenci H, Hooman K, Lu Y, Alkhedhair AM. Experimental study of film
media used for evaporative pre-cooling of air. Energy Convers Manag 2014;87:874–84.
doi:10.1016/j.enconman.2014.07.084.
[229] He S, Guan Z, Gurgenci H, Hooman K, Lu Y, M. Alkhedhair A. Experimental study of the
application of two trickle media for inlet air pre-cooling of natural draft dry cooling towers.
Energy Convers Manag 2015;89:644–54.
doi:http://dx.doi.org/10.1016/j.enconman.2014.10.031.
[230] He S, Gurgenci H, Guan Z, Huang X, Lucas M. A review of wetted media with potential
application in the pre-cooling of natural draft dry cooling towers. Renew Sustain Energy Rev
2015;44:407–22. doi:http://dx.doi.org/10.1016/j.rser.2014.12.037.
[231] Sun Y, Guan Z, Gurgenci H, Hooman K, Li X. Investigations on the influence of nozzle
arrangement on the pre-cooling effect for the natural draft dry cooling tower. Appl Therm Eng
2018;130:979–96. doi:10.1016/j.applthermaleng.2017.10.171.
[232] Sun Y, Guan Z, Gurgenci H, Li X, Hooman K. A study on multi-nozzle arrangement for spray
cooling system in natural draft dry cooling tower. Appl Therm Eng 2017;124:795–814.
doi:10.1016/j.applthermaleng.2017.05.157.
[233] Roman C, Fireteanu V, Etay J, Fautrelle Y. An overview on solar energy, molten salts and
electromagnetic pumping technologies. 2011 10th Int. Conf. Environ. Electr. Eng., 2011, p. 1–
4. doi:10.1109/EEEIC.2011.5874692.
[234] Li X, Duniam S, Gurgenci H, Guan Z, Veeraragavan A. Full scale experimental study of a
small natural draft dry cooling tower for concentrating solar thermal power plant. Appl Energy
2017;193:15–27. doi:10.1016/j.apenergy.2017.02.032.
[235] Li X, Gurgenci H, Guan Z, Wang X, Duniam S. Measurements of crosswind influence on a
natural draft dry cooling tower for a solar thermal power plant. Appl Energy 2017;206:1169–
83. doi:10.1016/j.apenergy.2017.10.038.
[236] Li X, Gurgenci H, Guan Z, Sun Y. Experimental study of cold inflow effect on a small natural
draft dry cooling tower. Appl Therm Eng 2018;128.
doi:10.1016/j.applthermaleng.2017.09.071.
[237] Sazhin SS. Modelling of fuel droplet heating and evaporation: Recent results and unsolved
problems. Fuel 2017;196:69–101. doi:10.1016/j.fuel.2017.01.048.

238
[238] Purl IK, Libby P a. Droplet Behavior in Counterflowing Streams. Combust Sci Technol
1989;66:267–92. doi:10.1080/00102208908947154.
[239] Bai B-F, Zhang H-B, Liu L, Sun H-J. Experimental study on turbulent mixing of spray droplets
in crossflow. Exp Therm Fluid Sci 2009;33:1012–20.
doi:10.1016/j.expthermflusci.2009.05.002.
[240] Zhai H, Rubin ES. Performance and cost of wet and dry cooling systems for pulverized coal
power plants with and without carbon capture and storage. Energy Policy 2010;38:5653–60.
doi:10.1016/j.enpol.2010.05.013.
Related Documents