POLISH POLAR RESEARCH 11 1—2 47—48 1990 Ireneusz R. MORACZEWSKI Department of Plant Systematics and Geography, Institute of Botany, Warsaw University Al. Ujazdowskie 4 00—478 Warsaw, POLAND Numerical analysis of plant communities of tundra at the Varsolbukta, Bellsund, Spitsbergen ABSTRACT: This paper contains the results of phytosociological studies carried out on the model fragment of Spitsbergen tundra at Bellsund. In the area of 4800 m 2 19 plant communities have been distinguished through association analysis and these communities, in turn, have been compared according to cluster analysis. Also, ecological groups of species have been distinguished. Key words: Arctic, Spitsbergen, plant communities, numerical classification Introduction Arctic phytocoenoses have specific role in the process of learning of the structure and functioning of plant communities. Tundra phytocoenoses belong to the least complex plant communities and therefore they are very suitable subject of mathematical modelling. Spitsbergen, having a status of separate geobotanical province (Aleksand- rova 1971, 1980), belongs to the best known Arctic areas. Additional reason which makes Spitsbergen so attractive as a research area is its special political status facilitating the scientific penetration of this archipelago. The simplicity of organization of plant cover in Spitsbergen is manifested by: - small number of vascular plant species forming communities (on Svalbard archipelago there are no more than 200 species of vascular plants); — mono-stratum plant cover; predomination of the habitat — population interaction over interpopula- tion relations (Aleksandrova 1983).

Welcome message from author
This document is posted to help you gain knowledge. Please leave a comment to let me know what you think about it! Share it to your friends and learn new things together.
Transcript

P O L I S H P O L A R R E S E A R C H 11 1—2 4 7 — 4 8 1990
Ireneusz R. M O R A C Z E W S K I
Department of Plant Systematics and Geography, Institute of Botany, Warsaw University Al. Ujazdowskie 4 00—478 Warsaw, P O L A N D
Numerical analysis of plant communities of tundra at the Varsolbukta,
Bellsund, Spitsbergen
ABSTRACT: This paper contains the results of phytosociological studies carried out on the model fragment of Spitsbergen tundra at Bellsund. In the area of 4800 m 2 19 plant communit ies have been distinguished through association analysis and these communit ies , in turn, have been compared according to cluster analysis. Also, ecological groups of species have been distinguished.
K e y w o r d s : Arctic, Spitsbergen, plant communit ies , numerical classification
Introduction
Arctic phytocoenoses have specific role in the process of learning of the s t ructure and functioning of p lant communi t ies . T u n d r a phytocoenoses belong to the least complex p lant communi t ies and therefore they are very suitable subject of mathemat ica l modell ing.
Spitsbergen, having a s ta tus of separa te geobotanica l province (Aleksand-rova 1971, 1980), belongs to the best k n o w n Arctic areas . Addi t ional reason which makes Spitsbergen so at t ract ive as a research area is its special political s ta tus facilitating the scientific pene t ra t ion of this archipelago.
The simplicity of organiza t ion of plant cover in Spitsbergen is manifested by:
- small n u m b e r of vascular plant species forming communi t i e s (on Svalbard archipelago there are no m o r e than 200 species of vascular plants);
— m o n o - s t r a t u m plant cover; p redomina t ion of the habi ta t — popu la t i on in teract ion over in te rpopula-tion relations (Aleksandrova 1983).
48 Ireneusz R. Moraczewski
The a u t h o r s of papers deal ing with p lant communi t i e s of Spitsbergen publ ished so far have used a lmost exclusively collection m e t h o d and mater ia l processing applied by Braun-Blanque t school ( H a d a ć 1946, H o f m a n n 1968, G u g n a c k a - F i e d o r and Noryśkiewicz 1982, Dubie l and Olech 1985) o r Scand inavian phytosociologis ts (Ronning 1964, Euro la 1968). In these researches typological collection of mater ia l was used and the original mat r ix of d a t a was ordered intuitively, forming phytosociological tables showing dist inguished types of communi t ies and g roups of species character is t ic for them. As a result of these researches m a n y plant communi t i e s were dist inguished and mos t of t hem were suggested to be placed in the o rder Salicetalia polaris — arcticae ( H a r t m a n n 1980, Elvebakk 1985).
M a n y papers were devoted to the analysis of hab i ta t dependency of the variety of Arctic vegetat ion. As mos t impor t an t abiot ic factors de te rmining the qual i ta t ive composi t ion , d o m i n a t i o n s t ructure and phys ionomy of p lant communi t i e s in Spitsbergen were considered: permafrost (Eurola 1968, G u g nacka -F i edo r and Noryśkiewicz 1982, Reznićek and S v o b o d a 1982); h y d r o -logical regime (Eurola 1968, Sarul 1981, G u g n a c k a - F i e d o r and Noryśkiewicz 1982, B ra t t bakk 1985); geological kind of the g r o u n d (Eurola 1968, Elvebakk 1982); p H of the soil (Elvebakk 1982, 1984, Reznićek and S v o b o d a 1982); variabil i ty of du ra t i on and thickness of snow cover (Eurola 1968, G u g n a c ka -F i edo r and Noryśkiewicz 1982, Rzę tkowska 1987); nut r ients availabili ty (Eurola a n d H a k a l a 1977); t opograph ic gradient (Elvebakk 1985, Reznićek and S v o b o d a 1982); wind activity (Gugnacka -F i edo r and Noryśkiewicz 1982, Reznićek and Svoboda 1982) and mechanical g r o u n d instabil i ty (Fabiszewski 1975).
Euro la (1968) gave the mos t exhaust ive and detailed informat ion concerning ecological similarity of species for H o r n s u n d and Isfjord region. He h a d classified all collected species of vascular plants , mosses a n d lichens in to 5 g roups . H e had dist inguished g roups of species of deflation tundra , lichen tundra , dry and fresh moss t u n d r a and also a g r o u p of species typical of snow beds. The ecological g roups of species suggested by Euro la (1968) are the result of appl icat ion of mono the t i c classification p rocedure which does no t ensure full exploi ta t ion of information included in the original set of da ta .
Shor t characteris t ics of most impor t an t p lant species of Svalbard, informing mainly a b o u t their d iagnost ic value for communi t i e s dist inguished by var ious a u t h o r s are included in H a r t m a n n ' s work (1980).
The mos t impor t an t goals of the present work are: — to show the advan tage of non- typological m e t h o d of mater ia l collection
a n d of numerical classification m e t h o d s (association analysis and cluster analysis) used to dist inguish and describe p lan t communi t i e s in the Arctic basing on model example of t u n d r a at Bellsund;
— to present the dist inguished plant communi t i e s against the b a c k g r o u n d of chosen envi ronmenta l factors, such as t opography , exposure and g round quali ty;
Numerical analysis of plant communit ies of Spitsbergen tundra 49
— to g roup vascular plants in clusters, combin ing taxa of similar ecological requirements .
Investigated area
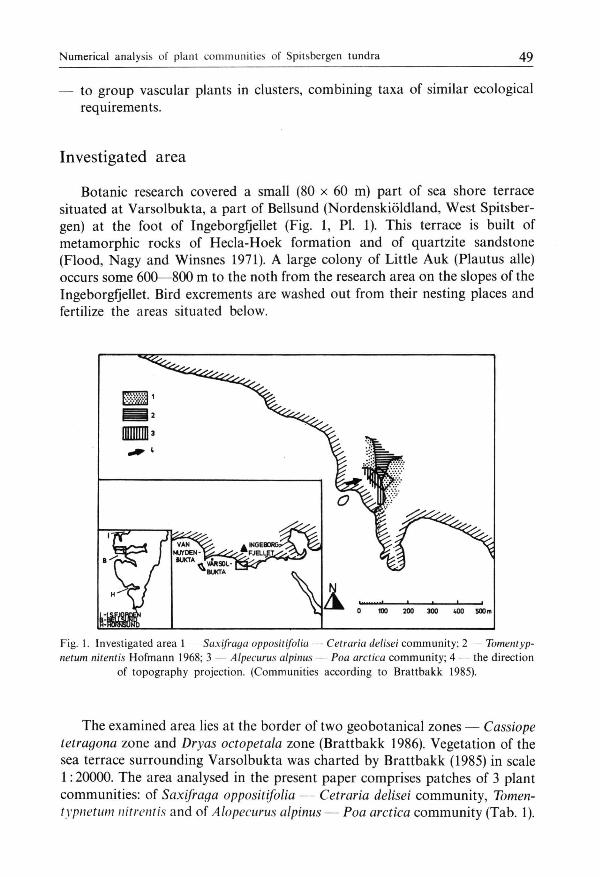
Botanic research covered a small (80 x 60 m) par t of sea shore terrace si tuated at Varso lbukta , a par t of Bellsund (Nordensk ió ld land , West Spitsbergen) at the foot of Ingeborgfjellet (Fig. 1, PI. 1). This terrace is built of me tamorph ic rocks of Hecla-Hoek format ion a n d of quar tz i te sands tone (Flood, Nagy and Winsnes 1971). A large colony of Little Auk (Plautus alle) occurs some 600—800 m to the no th from the research a rea on the slopes of the Ingeborgfjellet. Bird excrements are washed out from their nesting places and fertilize the areas si tuated below.
Fig. 1. Investigated area 1 — Saxifraga oppositifolia — Cetraria delisei community; 2 — Tomentyp-netum nitentis Hofmann 1968; 3 — Alpecurus alpinus — Poa arctica community; 4 — the direction
of topography projection. (Communities according to Brattbakk 1985).
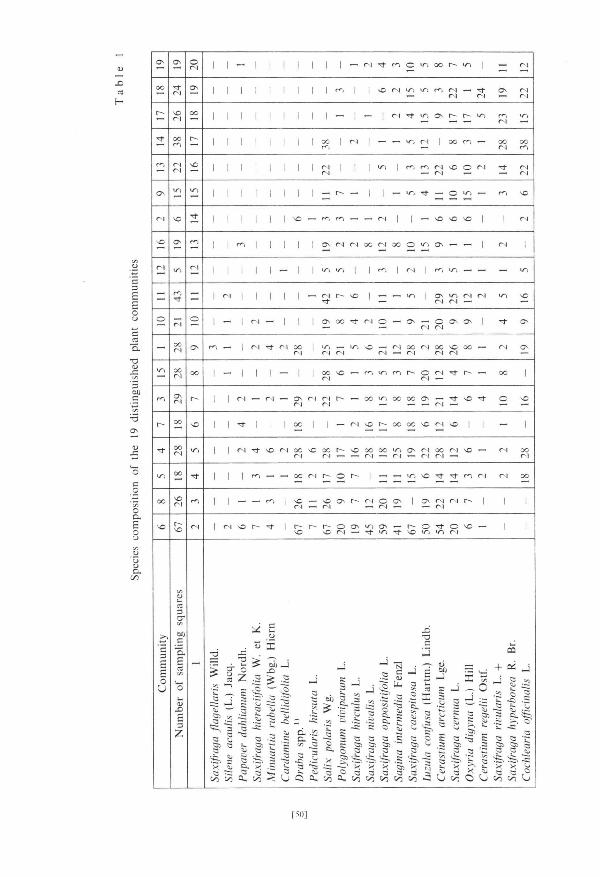
The examined area lies at the border of two geobotanica l zones — Cassiope tetragona zone and Dry as octopetala zone (Bra t tbakk 1986). Vegetat ion of the sea terrace su r round ing Varso lbuk ta was char ted by Bra t t bakk (1985) in scale 1:20000. The area analysed in the present pape r comprises pa tches of 3 plant communi t ies : of Saxifraga oppositifolia — Cetraria delisei communi ty , Tomen-typnetum nitrentis and of Alopecurus alpinus — Poa arctica communi ty (Tab. 1).
I I I I [ I — C M -^t r o © V J o o r - v i
I I I I — C M ( N — r i
I I
I I
I I I — I — I r-J ON ( — [— v~t m yr,
I I I
I t I I
c-i — — v> C N o c m — o c oo
I J - r - - - Vi - O ^ - en ' •O
I I j s o — rr, r*-, _ — r | | — O sO SO
I I I I o> fN n x <n x c ' n 0\ - - I r-J
I I r I I r*-, i/-, — —
I I — r i r - vo | •—• — i n r-J C M i n sD
r i — I I I ^ X T T M C - O - O O V ^ I 0*>
C M T t C M o c I "TJ — i n C M C M rs
o o — C M c v
I I - - f , V) f<i C M — o c
N — C M — r i r i r - — x C C O O C M C M
r f O
— r M ^ o r - o o o o s C r s i s c
C M Tf s o C M o c o oc r - ^o C M C M — —
o — C M oo
I c-I ~- — o c C M © r - | — — v , \ o T J - n r i C M oc
—• — <•*•> s o — \ o o r -C M — C M
^o s c C M —
O N C M C M r--
-s 5
—
-o
U
= . "2 i> a" o ei _ 1
:§ £ :§
-J > H
- 1
5
:5' - M
g».« •= .s -3 _g _ ^ M
^ "= "5 -S . ^ 'c §,3 . §, -e -5 S* a "S
-> £ » s 2 I
= , . + ffl
2 -J O ™
r* f-, ^ ~ SJ S a. a .fc . S g . t
1 Ł ft. 5 'u s c -s
£ a « 'c « 3 a g
s-. v r~» >• x
[50]

52 Ireneusz R. Moraczewski
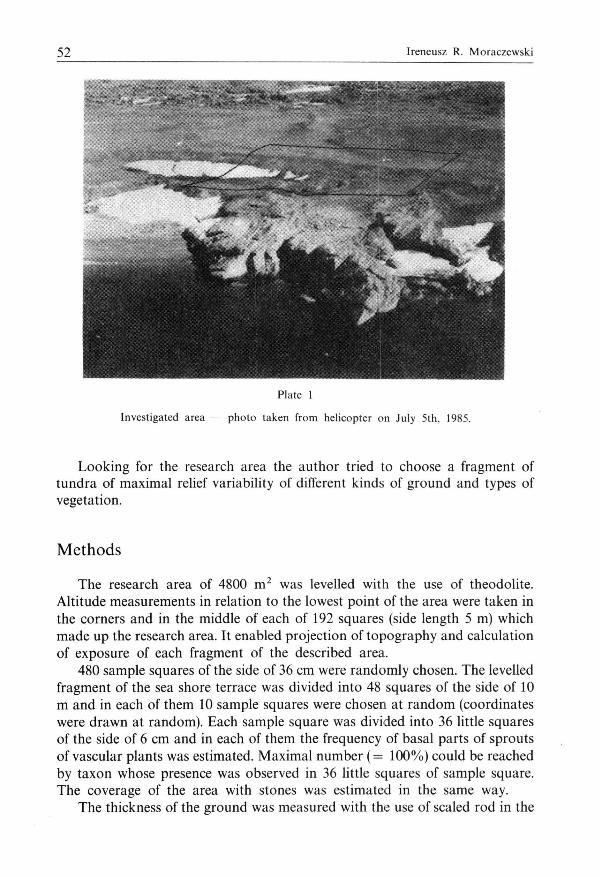
Piąte 1
Investigated area — photo taken from helicopter on July 5th, 1985.
Look ing for the research area the a u t h o r tried to choose a fragment of t u n d r a of maximal relief variabili ty of different kinds of g round and types of vegetat ion.
Methods
The research area of 4800 m 2 was levelled with the use of theodol i te . Al t i tude measurements in relat ion to the lowest point of the area were taken in the corners and in the middle of each of 192 squares (side length 5 m) which m a d e u p the research area. It enabled project ion of t o p o g r a p h y and calculat ion of exposure of each fragment of the described area.
480 sample squares of the side of 36 cm were r an d o mly chosen. The levelled fragment of the sea shore terrace was divided in to 48 squares of the side of 10 m a n d in each of them 10 sample squares were chosen at r a n d o m (coordinates were d r a w n at r andom) . Each sample square was divided in to 36 little squares of the side of 6 cm and in each of them the frequency of basal pa r t s of sprouts of vascular p lants was est imated. Max ima l n u m b e r ( = 100%) could be reached by t axon whose presence was observed in 36 little squares of sample square . T h e coverage of the area with s tones was es t imated in the same way.
The thickness of the g round was measured with the use of scaled rod in the

Numerical analysis of plant communit ies of Spitsbergen tundra 53
corners and in the middle of each sample square . The values of g round thickness presented in this paper are average values t aken from 5 measurements . The a m o u n t of s tones in the g round expressed as the degree to which the area was covered with stones in general agrees with the a m o u n t of s tones calculated th rough depth measurements (Eurola 1968); different results when using both me thods can be obta ined when under the s t r a tum of turf which is scarcely covered with stones a solid rock can be found. The appl ica t ion of bo th me thods of measurements can show the impenet rab le rock s t r a tum in the g round that may affect the hydra t ion of the examined fragment of tundra . Some pits were m a d e in par t s of the examined a rea clearly different in phys iognomy.
Nomenc la tu r e of plants is based on the key of Rónn ing (1979). All calculat ions and topography project ions were performed on ZX
Spec t rum compute r with the p rog ram writ ten by the au thor .
Results
1. Associat ion analysis and compar i son of dist inguished communi t ies
a) Algor i thm scheme Using associat ion analysis (Goodal l 1973b, Ke r shaw 1974) 480 sample
squares were divided into 19 subclasses — plant communi t ies . As a s topping rule it was taken the smallest statistically significant value of sum from the first division. D e n d r o g r a m of associat ion analysis is presented in Fig. 2; species composi t ion of 19 communi t ies is presented in T a b . 1.
Since associat ion analysis, as a mono the t i c technique, does no t demons t ra t e interrelat ions between the dist inguished classes (Gooda l l 1973b) therefore a cluster analysis of the dist inguished communi t ies has been performed. Table 1 served as an original da t a matr ix . Each element a^ of this table, defining the n u m b e r of communi ty squares , j " in which t axon „i" was found was divided by total n u m b e r of communi ty squares , j " and mult ipl ied by 100%. Using on such cons tancy matr ix Czekanowski ' s similarity coefficients for each communi ty has been calculated (percentage similarity: G o o d a l l 1973a). O n square basis (19 x 19) of the matr ix of similarity coefficients there has been m a d e a cluster izat ion of dist inguished communi ty applying the m e t h o d of weighed pair g r o u p (Anderberg 1973, Sneath and Sokal 1973, Kucharczyk 1982).
b) Character is t ics of dist inguished communi t i e s Dist inguished communi t ies numbered from 1 to 19 were clustered in
3 g roups (Fig. 3). The first g r o u p const i tu ted dry moss t u n d r a communi t ies , the second one — communi t ies of fresh grass t undra , the thi rd one — wet moss t u n d r a communi t ies .
Communi t i e s of dry moss t u n d r a occurred only in places where the g round was densely covered by stones (Fig. 4, PI. 2). They occupied those fragments of

54 Ireneusz R. Moraczewski
Maximum
1100 1000
240
220
200 •
180
160
140
1 2 0
1 0 0
8 0
6 0
4 0
M I N O
2 0
0 m i i e o rii os] gin ok g a oki iii o s i i ulu dn n ob n s okioki © © ® © © ® © © ® ® ® @ ® ® @ @ @ ® ©
Fig. 2 Dendrogram presenting the classification of 480 sampling squares according to the method of association analysis. Letters denote taxa which were the basis for the division of particular class of squares into subclasses — with (large letter) or without (small letter) of particular taxon: A — Draba spp., B — Equisetum spp., C — Salix polaris, D — Poaceae spp., E — Cochlearia officinalis, F — Ranunculus pygmaeus, G — Saxifraga caespitosa, H — Polygonum viviparum, I — Saxifraga nivalis, J — Cerastium regelii, K — Luzula confusa, L — Cerastium arcticum. Numerals in square frames denote the number of squares of particular group (community),
numerals in circles the ordinal number of the community .
the examined area tha t were high and best exposed to the sun (Figs. 5 and 6). Ex t reme hydrological condi t ions prevail in the c o m m u n i t y 7 due to its s i tuat ion and great a b u n d a n c e of stones. Lack of Salix polaris a n d Oxyria digyna can be here observed — a l though they occurred in o ther communi t i e s of dry moss tundra . C o m m u n i t y 16 was also s i tuated at the edge of upper terrace but milder condi t ions prevail here and Salix polaris occurred here with the cons tancy of 100%. In communi t ies 7 and 16 Papaver dahlianum reached the highest constancy. The main feature differing slightly m o r e humid communi t i e s 4 and 5 from m o r e dry 6 and 8 was the presence of Cochlearia officinalis in 4 and 5 and their lack in 6 and 8. Saxifraga hirculus a n d S. hieraciifolia reached the highest cons tancy in communi t ies 4 and 5. Communi t i e s 3 and 15 are floristically related to the fresh grass t u n d r a communi t ies .
Fresh grass t u n d r a communi t ies occupy the least s tony fragments of the described a rea (Fig. 4, PI. 2). Communi t i e s 10 and 11 are the richest in species; the c o m m u n i t y 10 is also privileged in terms of exposure (Figs. 4 and 6) — m a n y plant species reached here higher cons tancy t han in the c o m m u n i t y 11.
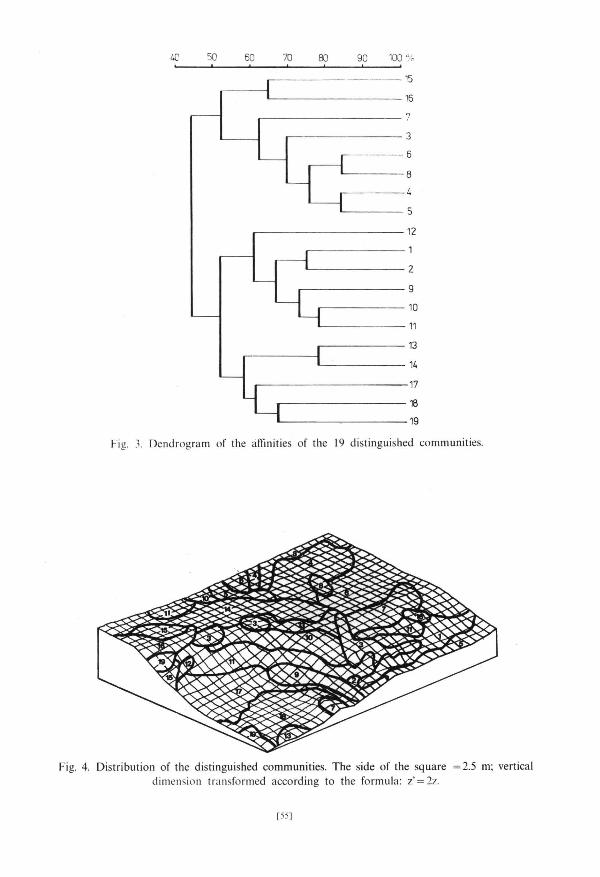

Plate 2
Fig. 1. Diversity of the ground cover with stones; the size of the circles corresponds to the intensity of this cover; the circles are put in the sampling place. Sampling squares without stones are not
marked.
Fig. 2. Diversity of the depth of the ground in the investigated area; the size of the co lumn put in the sampling place corresponds to this depth. Sampling squares with average depth of the ground
= 0 are not marked.
[56]
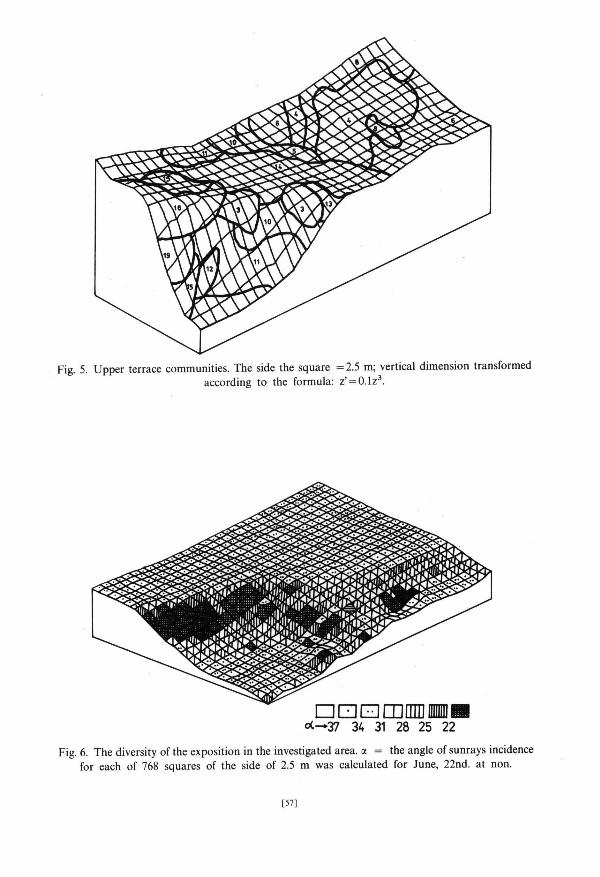
Fig. 5. Upper terrace communities. The side the square = 2.5 m; vertical dimension transformed according to the formula: z' = 0 .1z 3 .

58 Ireneusz R. Moraczewski
The species compos i t ion of the communi ty 9 is similar to those of the snow bed (17) being, however, somewhat richer. O n 5th of July snow cover was absent on the area of the communi ty 9. Communi t i e s 1, 2 and 12 were t rans i t ional between dry moss t u n d r a communi t i e s and typical communi t i e s of fresh grass t u n d r a (10 and 11).
Communi t i e s of wet moss t u n d r a occurred in local ter ra in depress ion (Figs. 4 and 5). Communi t i e s 13 and 14 are s i tuated on the upper terrace; the c o m m u n i t y 13 was somewha t richer. O n 5th of July snow bed (17) was a lmos t entirely covered with snow whereas the remaining par t of the examined area was free of the snow cover. The small angle at which sun rays fell on snow gathered at the foot of the slope did not favour quick mel t ing of thick snow cover (Fig. 6). T h e communi ty 18 character ized by the presence of Cerastium regelii occurred on lower terrace where waters flowing from the slopes s tagnated . T h e outflow of these water was difficult because of the presence of impenet rab le schists of Hec la -Hoek format ion which occur in this par t of the examined area. The communi ty 19 which is no t positively dist inguished by any of t axa forming division basis in associat ion analysis (Fig. 2) combines bo th the small n u m b e r of extremely p o o r sample squares s i tuated in the mos t s tony fragments of the upper terrace and also those mos t h u m i d ones, s i tuated on the lower terrace.
2. Ecological g roups of species
a) Algor i thm scheme T h e g roups combin ing t axa of similar ecological requi rements were
ob ta ined t h rough cluster analysis. T h e table describing the occurrence of 32 taxa found in the examined area in 480 sample squares was used as an original matr ix . Ecological similarity of taxa was es t imated using Dice coefficient (Mirk in and Rozenberg 1983):
QY) — a—min (b, c) l j a + min (b, c)
where: a — n u m b e r of cases when t axa „i" a n d , j " were in c o m m o n ; b — n u m b e r of sample squares in which t axon „i" occurred bu t t axon , j " was lacking; c — n u m b e r of sample squares in which t axon „i" did no t occur bu t where t axon , j " was observed. T h u s ob ta ined square (32 x 32) mat r ix of Dice coefficients was next t ransformed in to the mat r ix of Eukl idean distances between taxa within the space of these coefficients. Such t ransformat ion enables to take into considera t ion the relat ion between the c o m p a r e d pair of t axa a n d all o thers and it decreases all k inds of „noises" which can dis tor t the picture of similarity of taxa compared (Mirk in and Rozenberg 1983). Basing on the mat r ix of Eucl idean distances clusterizat ion of taxa was m a d e using weighted pair g r o u p me thod (Fig. 7).

Numerical analysis of plant communit ies of Spitsbergen tundra 59
•C
Poaceae spp Saxifraga cernua Cochlearla officinalis Polygonum viviparum Draba spp. Saxifraga oppositifolia Saxifraga caespitosa Luzula confusa Salix polaris Cerastium arcticum Saxifraga foliolosa Chrysosplenlum tetrandrum Cerastium regelli Saxifraga rlvularls*S. hyperborea Saxifraga f lagel lars Sllene acaulis Papaver dahlianum Cardamine bellidifolia Saxifraga hieraciifolia Minuartia rubella Saxifraga hirculus Pedicularis hirsuta Saxifraga nivalis Sagina intermedia Equisetum spp Oxyria digyna |\/a Minuartia bit lora Ranunculus pygmaeus
I Ranunculus sulphureus I Potentilla hyparctica | V D
I Stellaria crassipes — ' • Koenigia islandlca
Fig. 7. Dendrogram presenting ecological groups of species.
IV
b) Character is t ics of the distinguish g roups 32 taxa which were found in the examined area were clustered into 4 g roups
(Fig. 7). G r o u p I is composed of taxa of wide ecological ampl i tude in the examined
area. Sub-group Ia conta ins t axa occurr ing very c o m m o n l y with the exception of extremely dry communi t ies . The d is t r ibut ion of Cochlearia officinalis, a representat ive of this sub-group, is shown in PI. 3, fig. 1. T a x a belonging to the sub-g roup l b avoid wet places occurr ing in n u m b e r s in communi t ies of very s tony ground . The dis t r ibut ion of Saxifraga oppositifolia belonging to the sub-g roup l b is presented in PI. 3, fig. 2. Sub-g roup Ic is composed of taxa of widest ecological ampl i tude: Luzula confusa (PI. 4, fig. 1), Salix polaris and Cerastium arcticum.
T a x a occurr ing exclusively in very wet places belong to g r o u p II. Chrysosp-lenium tetrandrum belonging to this g r o u p was found only in pa tches of the communi t ies 13 and 19 si tuated at the edge of the lower terrace. Dis t r ibu t ion of Cerastium regelii, ano the r representat ive of this g roup , is shown on PI. 4, fig. 2.
G r o u p III is composed of species preferring dry habi ta ts . At the edge of the upper terrace, in places especially exposed to winds, species from sub-g roup
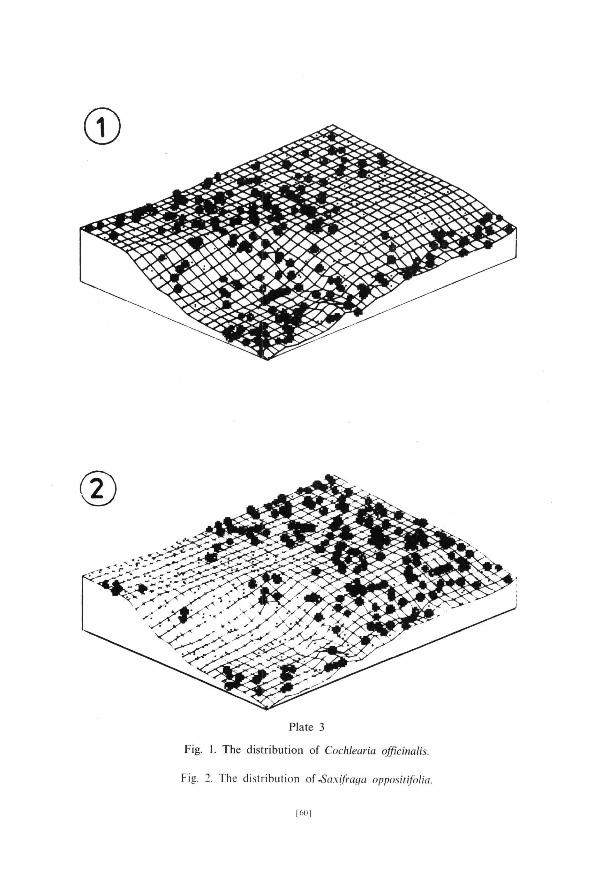
Plate 3
Fig. 1. The distribution of Cochlearia officinalis.
Fig. 2. The distribution of .Saxifraga oppositifolia.
[M l ]
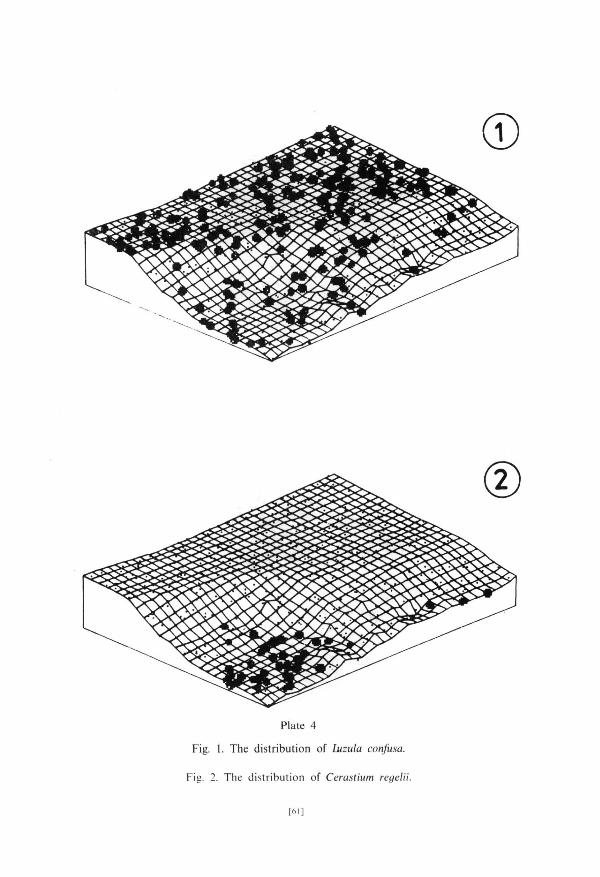
Plate 4
Fig. 1. The distribution of Luzula confusa.
Fig. 2. The distribution of Cerastium regelii.
[61]
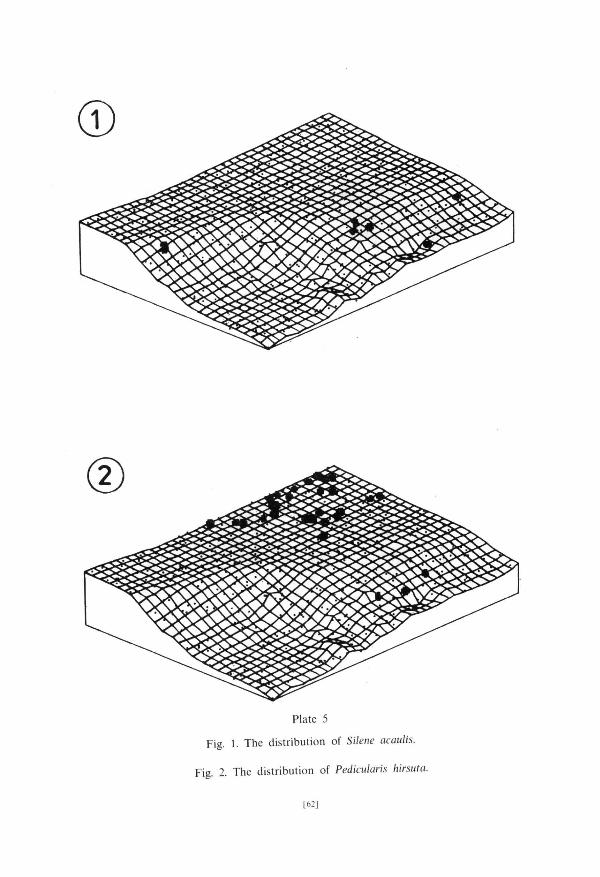
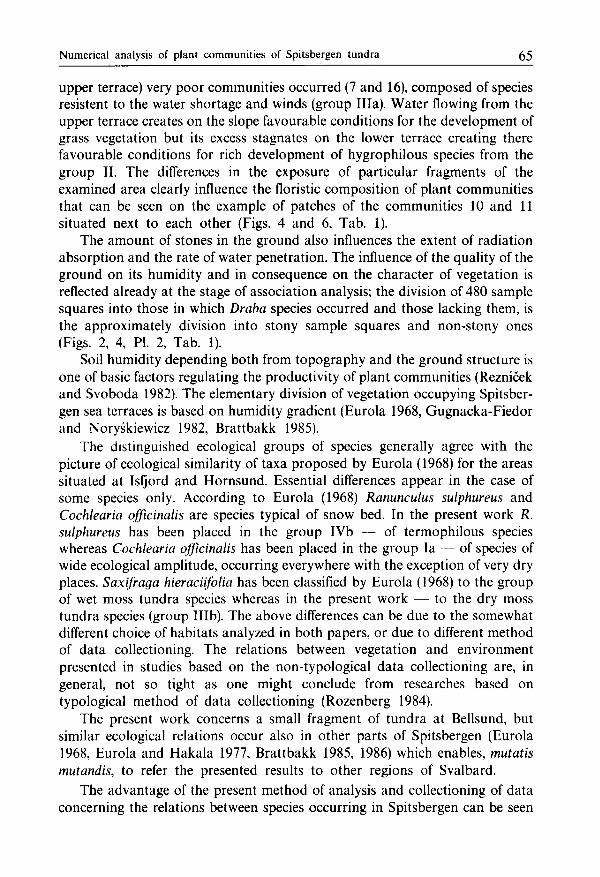
Plate 5
Fig. 1. The distribution of Silene acaulis.
Fig. 2. The distribution of Pedkularis hirsute!.
[62]

Plate 6
Fig. I. Distribution of Oxyria digyna.
;. 2. Distribution of Ranunculus sitlphureus.

64 Ireneusz R. Moraczewski
I l i a can be found. Papaver dahlianum occupied the mos t s tony habi ta t s , Silem acaulis (PI. 5, fig. 1) and Saxifraga flagellaris were found below the edge of the terrace. The species of the sub -g roup I l l b occurred in dry moss t u n d r a communi t ies (PI. 5, fig. 2).
T a x a occurr ing in modera te ly humid places in the described a rea belong to the g r o u p IV. Oxyria digyna which belongs to the sub -g roup IVa preferred places with thick soil (PI. 6, fig. 1) whereas Ranunculus pygmaeus occurred mainly in the snow bed. Ranunculus sulphureus, the representat ive of the sub -g roup IVb, preferred sunny places with small n u m b e r of s tones (PI. 6, fig- 2).
Discussion
Associat ion analysis widely applied in non-Arct ic communi t i e s appeared to be valuable also in the case of t u n d r a communi t ies . P lan t communi t i e s dis t inguished using this m e t h o d can be easily in terpreted in ecological terms. It appea red to be possible to dist inguish plant communi t i e s tak ing in to cons idera t ion vascular plants only. The appl ica t ion of associat ion analysis in the first s tage of regional izat ion procedure leads to considerable reduct ion of the a m o u n t of original d a t a which is a prerequisi te to use m o r e precise classification m e t h o d s such as cluster analysis. T h e use of cluster analysis a lgor i thms enables the release of informat ion „coded" in d a t a matr ix .
T h e scale of present research seriously differs from tha t of the former studies of Spitsbergen vegetat ion; moreover in this s tudy only vascular p lan ts were considered. Therefore the compar i son of communi t i e s dist inguished here with those described earlier is difficult.
The diversity of Arctic p lant communi t ies is the effect of coopera t ion of m a n y ecological factors (for example t opog raphy , nut r ients availability, microclimate) and also inter-species relat ions (Bliss 1956). In this work the influence of t o p o g r a p h y and qual i ty of the g r o u n d on the format ion of p lant communi t i e s in Spitsbergen t u n d r a has been presented. T h e shape, d is t r ibut ion and floristic composi t ions of pa tches of the communi t i e s dist inguished here are the functions of the relief and g round cons t ruc t ion (Fig. 4, PI. 2, T a b . 1). T h e ter ra in configurat ion determines the d is t r ibut ion of snow-beds and those fragments of t u n d r a which are termically favourable; it also determines the s i tua t ion of places exposed to winds and defines also the intensity and direct ion of water flow which is one of three basic elements of water circulat ion, next to infiltration and evapo t ransp i ra t ion (Sarul 1981).
Abiot ic factors ment ioned above tha t are de te rmined by t o p o g r a p h y shape, in turn , p lan t communi t ies . Snow cover at the foot of the upper terrace of the examined a rea favouring the soil humidi ty , shor tens on the o the r hand , the vegetat ion season and creates the condi t ions for the deve lopment of the c o m m u n i t y with Ranunculus pygmaeus. O n locally raised places (the border of
Numerical analysis of plant communit ies of Spitsbergen tundra 65
upper terrace) very poor communi t ies occurred (7 and 16), composed of species resistent to the water shor tage and winds (group I l ia) . W a t e r flowing from the upper terrace creates on the slope favourable condi t ions for the development of grass vegetat ion but its excess s tagnates on the lower terrace creat ing there favourable condi t ions for rich development of hygrophi lous species from the g r o u p II. The differences in the exposure of par t icular fragments of the examined area clearly influence the floristic compos i t ion of plant communi t ies that can be seen on the example of patches of the communi t ies 10 and 11 si tuated next to each o ther (Figs. 4 and 6, T a b . 1).
The a m o u n t of s tones in the g round also influences the extent of radia t ion absorp t ion and the rate of water penetra t ion. The influence of the quali ty of the g r o u n d on its humidi ty and in consequence on the charac te r of vegetat ion is reflected already at the stage of associat ion analysis; the division of 480 sample squares into those in which Draba species occurred and those lacking them, is the approximate ly division into s tony sample squares and non-s tony ones (Figs. 2, 4, PI. 2, T a b . 1).
Soil humidi ty depending both from topog raphy and the g r o u n d s t ructure is one of basic factors regulat ing the product ivi ty of p lant communi t ies (Reznićek and Svoboda 1982). The elementary division of vegetat ion occupying Spitsbergen sea terraces is based on humidi ty gradient (Eurola 1968, G u g n a c k a - F i e d o r and Noryśkiewicz 1982, Bra t tbakk 1985).
The distinguished ecological g roups of species generally agree with the picture of ecological similarity of taxa p roposed by Euro la (1968) for the areas si tuated at Isfjord and H o r n s u n d . Essential differences appea r in the case of some species only. According to Euro la (1968) Ranunculus sulphureus and Cochlearia officinalis are species typical of snow bed. In the present work R. sulphureus has been placed in the g r o u p IVb — of t e rmophi lous species whereas Cochlearia officinalis has been placed in the g r o u p l a — of species of wide ecological ampl i tude, occurr ing everywhere with the exception of very dry places. Saxifraga hieraciifolia has been classified by Euro la (1968) to the g roup of wet moss tundra species whereas in the present work — to the dry moss t u n d r a species (group I l lb) . The above differences can be due to the somewhat different choice of habi ta t s analyzed in bo th papers , or due to different m e t h o d of da t a collectioning. The relat ions between vegetat ion and envi ronment presented in studies based on the non- typological d a t a collectioning are, in general , not so tight as one might conclude from researches based on typological me thod of d a t a collectioning (Rozenberg 1984).
The present work concerns a small fragment of t u n d r a at Bellsund, but similar ecological relations occur also in o ther par t s of Spitsbergen (Eurola 1968, Eurola and H a k a l a 1977, Bra t tbakk 1985, 1986) which enables, mutatis mutandis, to refer the presented results to o ther regions of Svalbard.
The advan tage of the present m e t h o d of analysis and collectioning of da t a concerning the relations between species occurr ing in Spitsbergen can be seen
66 Ireneusz R. Moraczewski
when compar ing the a m o u n t of work d o n e by the present a u t h o r and by Eu ro l a (1968) to receive c o m p a r a b l e informat ion. T h e dis tance between mos t ext reme phytosociological m a d e by Euro la exceeds 140 km, whereas the same pa rame te r in the present work does not exceed 100 m. Euro la (1968) had precisely examined 1450m 2 of tundra . T h e total surface which has been analyzed in detail in the present work a m o u n t s only to 66,2 m 2 . Eu ro la has found 71 species of vascular plants , whereas 46 species have been recorded in the present work , ou t of which, due to the difficulties to identifig in situ some taxa on different developmenta l stages (Draba, Equisetum, Saxifraga rivularis s i . , Poaceae) only 28 were precisely analyzed. T h e high degree of representativeness of the area analyzed in this work (both in the relat ion to the diversity of p lant communi t ies and flora richness) is due to its par t icu lar s i tuat ion. T h e fragment of t u n d r a examined is s i tuated at the border of two geobotanica l zones (Bra t tbakk 1986) and is also very diversified in respect to t opography , geomorpho logy etc. The reduct ion of phytocoenologica l research to the small bu t s t rongly diversified area enables a t h o r o u g h examina t ion of vegetat ion of the examined area and its relat ions with env i ronmenta l factors. This can be d o n e with relatively small effort.
It seems tha t the me thods of mater ia l collectioning, da t a analysis and results presenta t ion applied in the present work could be very useful in analysis of Spitsbergen vegetat ion, par t icular ly in the case when the whole floristic diversity are taken into cons idera t ion and also when o the r abiot ic factors like chemism, soil t empera ture , wind velocity etc. a re considered.
Acknowledgments
I would like to express my thanks to Associate Professor A. Batko, D. Sc., K. Opaliński, D. Sc. and E. Dubiel , D. Sc. for critical remarks on this work. Thanks are due to A. Musiał, D. Sc. for making my trip to Spitsbergen possible with the group of Student Polar Expedition. Many thanks are also due to B. Horodyski , D . Sc. and to K. Kossobudzki . M. Sc. for their benevolent help.
Materials to this paper have been collected during Academic Polar Expedition, Spitsbergen '85 organized by researchers and students of the Institute of Geography and Regional Studies of Warsaw University.
References
Aleksandrova V. D., 1971. O n the principles of zonal subdivision of Arctic vegetation. — Bota-nićeskij Żurnal, 1: 3—21 .
Aleksandrova V. D. , 1980. The Arctic and Antarctic: their division into geobotanical areas. — Cambridge Univ. Press, Cambridge; 247 pp.
Aleksandrva V. D., 1983. Rastitel'nost' poljarnych pustyń' SSSR. Nauka , Leningrad; 142 pp. Anderberg M. R., 1973. Cluster analysis for applications. — Academic Press, N e w York —
London; 360 pp. Bliss L. C , 1956. A comparison of plant development in microenvironments of Arctic and alpine
tundras. — Ecol. Monogr. , 26: 303—337.
Numerical analysis of plant communit ies of Spitsbergen tundra 67
Brattbakk I., 1985. Varsolbukta, Lagnesflya, Svaibard, vegetasjonskart, 1:20000. — Univ. Trondh., Mus. Bot. avd. Trondheim.
Brattbakk I., 1986. Vegetasjonsregioner — Svaibard og Jan Mayen, 1:100000. — Norsk Polarinst., M a b — Svalbardprosjektet.
Dubiel E. and Olech M., 1985. Vegetation map of the N W part of Sorkappland (Spitsbergen). — Zesz. Nauk. Uniw. Jagiell., Pr. geogr., 63: 57—68.
Elvebakk A., 1982. Geological preferences among Svalbards plants. — Inter-Nord, 16: 11—31. Elvebakk A., 1984. Vegetation pattern and ecology of siliceous boulder snow beds on Svaibard. —
Polarforschung, 54: 9—20. Elvebakk A., 1985. Higher phytosociological syntaxa on Svaibard and their use in subdivision of
the Arctic. — Nord. J. Bot., 5: 273—284. Eurola S., 1968. Uber die Fjeldheidevegetation in den Gebieten von Isfjorden und Hornsund in
Westspitsbergen. — Aquilo, Ser. Bot., 7: 1—56. Eurola S. and Hakala A. V. K., 1977. The bird cliff vegetation of Svaibard. — Aquilo, Ser. Bot., 15:
1—18. Fabiszewski J., 1975. Migracja roślinności na przedpolu lodowca Werenskiolda (Spitsbergen
Zachodni). — Symp. Spitsbergeńskie — Materiały, Wrocław; 81—88. F lood B., Nagy J. and Winsnes T. S., 1971. Geological m a p of Svaibard. — Norsk Polarinst. Goodal l D. W., 1973a. Sample Similarity and Species Correlation. In: R. H. Whittaker (ed.).
Handbook of Vegetation Science, Pt. 5, Ordination and Classification of Communit ies . — Dr. Junk B. V., Hague; 105—156.
Goodal l D. W., 1973b. Numerical Classification. In: R. H. Whittaker (ed.), Handbook of Vegetation Science, Pt. 5, Ordination and Classification of Communit ies . — Dr. Junk B. V.. Hague; 575—615.
Gugnacka-Fiedor W. and Noryśkiewicz B., 1982. The vegetation of Kaffioyra, Oscar II Land, N W Spitsbergen. — Acta Univ. Nicolai Copernici, Nauki Mat.-Przyr., 51: 203—238.
Hadać E., 1946. The plant communities of Sassen Quarter, West Spitsbergen. — Stud. Bot. Cechoslov., 7: 127—164.
Hartmann H., 1980. Beitrag zur Kenntnis der Pflanzengesellschaften Spitzbergens. — Phytocoeno-logia, 8: 65—147.
Hofmann W., 1968. Geobotanische Untersuchungen in Siidost-Spitsbergen 1960. — Franz Steiner Verlag G M B H , Wiesbaden; 83 pp.
Kershaw K. A., 1973. Ilościowa i dynamiczna ekologia roślin. — P W N , Warszawa; 276 pp. Kucharczyk J., 1982. Algorytmy analizy skupień w języku A L G O L 60. — P W N , Warszawa;
276 pp. Mirkin B. M. and Rozenberg G. S., 1983. Tolkovyj slovar sovremennoj fitocenologii. — Izd.
„Nauka", Moskva; 136 pp. Reznićek A. S. and Svoboda J., 1982. Tundra communit ies a long a microenvironmental gradient at
Coral Harbour, Southampton Island, N . W. T. — Naturaliste can., 109: 583—595. Rónning O. I., 1964. Studies in Dryadion on Svaibard. — Norsk Polarinst., Skr. 134, Oslo; 52 pp. Rónning O. I., 1979. Svalbards flora. Norsk Polarinst., Oslo; 128 pp. Rozenberg G. S., 1984. Model i v fitocenologii. — Izd. „Nauka", Moskva , 264 pp. Rzętkowska A., 1987. Vegetation of Calypsostranda in Wedel Jarlsberg Land, Spitsbergen. — Pol.
Polar Res., 3: 251—260. Sarul J., 1981. Badania s tosunków wodnych tundry dolnej części zlewni Linneelva na Ziemi
Nordenskiolda (Zachodni Spitsbergen). — Studencka Sesja Polarna, Materiały, K N S G , UW, WGiSR, Warszawa.
Sneath P. H. A. and Sokal R. R., 1973. Numerical taxonomy. — Freeman, San Fransisco; 574 pp.
Received March 3, 1989 Revised and accepted July 15, 1989
68 Ireneusz R. Moraczewski
Streszczenie
W lipcu i w sierpniu 1985 roku prowadzone były badania fitosocjologiczne na m o d e l o w y m fragmencie tundry spitsbergeńskiej, po łożonym nad Bellsundem. Badany teren (Rys. 1, PI. 1) o powierzchni 4800 m 2 został zaniwelowany przy pomocy teodolitu, co umożl iwi ło wykonanie komputerowych projekcji topografii omawianego obszaru. N a badanym terenie rozmieszczono w sposób systematyczno-losowy 480 kwadratów próbnych o boku 36 cm. W każdym kwadracie ustalono i lościowość roślin naczyniowych oraz oceniano kamienistość podłoża.
Przy pomocy analizy asocjacji podzie lono klasę 480 kwadratów próbnych na 19 podklas — zbiorowisk roślinnych (Rys. 2, Tab. 1). Zostały one następnie porównane przy użyciu metod analizy skupień (Rys. 3). Wyróżnione zbiorowiska skupiły się w trzech grupach. Pierwsza grupa to zbiorowiska suchej tundry mszystej, druga — zbiorowiska świeżej tundry trawiastej, w trzeciej zaś grupie znalazły się zbiorowiska wilgotnej tundry mszystej. Wyodrębnione zbiorowiska roślinne zostały ukazane na tle wybranych czynników środowiskowych (rzeźba terenu, kamienistość podłoża, ekspozycja; Rys. 4—6, PI. 2).
Ekologiczne grupy gatunków roślin naczyniowych wyróżnione zostały przy p o m o c y analizy skupień. 32 znalezione na badanym obszarze taksony skupiły się w czterech grupach (Rys. 7). Grupę pierwszą tworzą taksony o szerokiej amplitudzie ekologicznej (PI. 3; PI. 4, rys. 1), grupę drugą - - taksony występujące wyłącznie w miejscach bardzo wilgotnych (PI. 4, rys. 2), w grupie trzeciej znalazły się gatunki preferujące suche siedliska (PI. 5), a do czwartej grupy należą taksony zajmujące umiarkowanie wilgotne stanowiska na badanym obszarze (PI. 6). Stwierdzono dużą zgodność wyróżnionych w tej pracy ekologicznych grup gatunków z danymi Euroli (1968).
Wykazano , że wyróżnione przy pomocy analizy asocjacji zbiorowiska roślinne dają się łatwo zinterpretować w kategoriach ekologicznych (pomimo uwzględnienia jedynie roślin naczyniowych).
Kształt, rozmieszczenie i skład florystyczny piatów zbiorowisk wyróżnionych w niniejszej pracy są funkcją reliefu i szkieletowości podłoża. Podstawowe czynniki abiotyczne środowiska — wilgotność, nasłonecznienie — determinowane są przez ukształtowanie terenu i kamienistość podłoża. Czynniki te kształtują z kolei oblicze zbiorowisk roślinnych.
Related Documents