Fusion Engineering and Design 85 (2010) 205–214 Contents lists available at ScienceDirect Fusion Engineering and Design journal homepage: www.elsevier.com/locate/fusengdes Numerical analysis of hydrogen risk mitigation measures for support of ITER licensing J. Xiao a,∗ , J.R. Travis b , W. Breitung a , T. Jordan a a Institute of Nuclear Energy and Technologies, Karlsruhe Institute of Technology, P.O. Box 3640, 76021 Karlsruhe, Germany b Dubois, Pitzer, Travis GmbH, Offenbach, Germany article info Article history: Received 30 July 2009 Received in revised form 12 December 2009 Accepted 12 December 2009 Available online 15 January 2010 Keywords: ITER Wet bypass scenario Hydrogen risk mitigation GASFLOW abstract In the ITER wet bypass scenario, water leakage, air ingress and hot dust (Be, W, and C) in the vac- uum vessel could generate combustible hydrogen–air–steam mixture. Hydrogen combustion may threaten the integrity of the ITER VV and lead to radioactivity release. To prevent hydrogen energetic combustion, nitrogen injection system in VV and hydrogen recombination system in the pressure suppression tank (ST) were proposed. The main objectives of this analysis are to study the distribution of hydrogen–air–steam mixtures in the ITER sub-volumes, to investigate the feasibility of the nitrogen injection system to fully inert the atmosphere in the VV and to evaluate the capability and efficiency of the hydrogen recombination system to remove hydrogen in the ST. 3D computational fluid dynamics (CFD) code GASFLOW was used to calculate the evolution of the mixtures and to evaluate the hydrogen combustion risks in the ITER sub-volumes. The results indicate that the proposed hydrogen risk mitiga- tion systems will generally prevent the risks of hydrogen detonation and fast deflagration. However, the atmosphere in ITER sub-volumes cannot be completely inerted at the early stage of the scenario. Slow deflagrations could still generate quasi-static pressures above 1 bar in the VV. The structural impact of the thermal and pressure loads generated by hydrogen combustions will be investigated in future studies. © 2009 Elsevier B.V. All rights reserved. 1. Introduction The ITER Generic Site Safety Report (GSSR) [1] has identi- fied two combustible substances which could have important safety implications: hydrogen produced from steam–metal reac- tions and various dust species of first wall materials (Be, W, and C, as shown in Fig. 2). The control of these combustible sub- stances is an important safety related R&D task for the support of ITER licensing [2] because hydrogen or dust explosions could act simultaneously as driving force for mobilization of the tritium inventory, as direct threat to the integrity of the VV or intercon- nected systems, and as cause for venting of radioactivity to the building. Abbreviations: ITER, international thermonuclear experimental reactor; VV, vac- uum vessel; VVPSS, vacuum vessel pressure suppression system; ST, suppression tank; CFD, computational fluid dynamics; LOVA, loss of vacuum accident; LOCA, loss of coolant accident; PC, plasma chamber; RH, remote handling; DV, divertor port; CP, cryo-pump; DNBI, diagnostic neutral beam injector; HNBI, heating neutral beam injector; PAR, passive autocatalytic recombiner; FA, flame acceleration; DDT, deflagration to detonation transition. ∗ Corresponding author. Tel.: +49 7247822437; fax: +49 7247 824777. E-mail address: [email protected] (J. Xiao). Several hundreds of kilograms of Be, W and graphite dust are expected to produce inside the ITER vacuum vessel. Dust can be mobilized in various accident sequences for example during loss of vacuum accidents (LOVAs) and loss of coolant accidents (LOCAs). In scenarios with steam ingress, hot beryllium dust can react with steam and lead to rapid formation of hydrogen mixtures inside the vacuum vessel. A probable ignition scenario is a weak spark starting a hydrogen burn which then triggers a dust explosion. Con- sequently, ITER has proposed additional R&D tasks to demonstrate either the exclusion of hydrogen combustion risks in the VV or fast countermeasures to mitigate these risks [2]. Therefore, nitrogen injection system in the VV and hydrogen recombination system in the ST were proposed to mitigate the risks of hydrogen combustion [3–5]. The feasibility and efficiency of these two hydrogen mitiga- tion measures to control hydrogen risks were evaluated using the 3D CFD code GASFLOW [6,7]. In Section 2 the wet bypass scenario in ITER VV and the proposed hydrogen mitigation measures are described. The GAS- FLOW geometric model and numerical models developed for the ITER safety analysis are presented in Section 3. Section 4 demon- strates the methodology of hydrogen safety analysis in ITER. The hydrogen risks and the mitigation measures are evaluated in Section 5. Section 6 summarizes the main findings of the study. 0920-3796/$ – see front matter © 2009 Elsevier B.V. All rights reserved. doi:10.1016/j.fusengdes.2009.12.008

Welcome message from author
This document is posted to help you gain knowledge. Please leave a comment to let me know what you think about it! Share it to your friends and learn new things together.
Transcript
NI
Ja
b
a
ARR1AA
KIWHG
1
fistCsoainb
utlpbd
0d
Fusion Engineering and Design 85 (2010) 205–214
Contents lists available at ScienceDirect
Fusion Engineering and Design
journa l homepage: www.e lsev ier .com/ locate / fusengdes
umerical analysis of hydrogen risk mitigation measures for support ofTER licensing
. Xiaoa,∗, J.R. Travisb, W. Breitunga, T. Jordana
Institute of Nuclear Energy and Technologies, Karlsruhe Institute of Technology, P.O. Box 3640, 76021 Karlsruhe, GermanyDubois, Pitzer, Travis GmbH, Offenbach, Germany
r t i c l e i n f o
rticle history:eceived 30 July 2009eceived in revised form2 December 2009ccepted 12 December 2009vailable online 15 January 2010
eywords:TER
a b s t r a c t
In the ITER wet bypass scenario, water leakage, air ingress and hot dust (Be, W, and C) in the vac-uum vessel could generate combustible hydrogen–air–steam mixture. Hydrogen combustion maythreaten the integrity of the ITER VV and lead to radioactivity release. To prevent hydrogen energeticcombustion, nitrogen injection system in VV and hydrogen recombination system in the pressuresuppression tank (ST) were proposed. The main objectives of this analysis are to study the distributionof hydrogen–air–steam mixtures in the ITER sub-volumes, to investigate the feasibility of the nitrogeninjection system to fully inert the atmosphere in the VV and to evaluate the capability and efficiency ofthe hydrogen recombination system to remove hydrogen in the ST. 3D computational fluid dynamics
et bypass scenarioydrogen risk mitigationASFLOW
(CFD) code GASFLOW was used to calculate the evolution of the mixtures and to evaluate the hydrogencombustion risks in the ITER sub-volumes. The results indicate that the proposed hydrogen risk mitiga-tion systems will generally prevent the risks of hydrogen detonation and fast deflagration. However, theatmosphere in ITER sub-volumes cannot be completely inerted at the early stage of the scenario. Slowdeflagrations could still generate quasi-static pressures above 1 bar in the VV. The structural impactof the thermal and pressure loads generated by hydrogen combustions will be investigated in future
studies.. Introduction
The ITER Generic Site Safety Report (GSSR) [1] has identi-ed two combustible substances which could have importantafety implications: hydrogen produced from steam–metal reac-ions and various dust species of first wall materials (Be, W, and, as shown in Fig. 2). The control of these combustible sub-tances is an important safety related R&D task for the supportf ITER licensing [2] because hydrogen or dust explosions couldct simultaneously as driving force for mobilization of the tritium
nventory, as direct threat to the integrity of the VV or intercon-ected systems, and as cause for venting of radioactivity to theuilding.Abbreviations: ITER, international thermonuclear experimental reactor; VV, vac-um vessel; VVPSS, vacuum vessel pressure suppression system; ST, suppressionank; CFD, computational fluid dynamics; LOVA, loss of vacuum accident; LOCA,oss of coolant accident; PC, plasma chamber; RH, remote handling; DV, divertorort; CP, cryo-pump; DNBI, diagnostic neutral beam injector; HNBI, heating neutraleam injector; PAR, passive autocatalytic recombiner; FA, flame acceleration; DDT,eflagration to detonation transition.∗ Corresponding author. Tel.: +49 7247822437; fax: +49 7247 824777.
E-mail address: [email protected] (J. Xiao).
920-3796/$ – see front matter © 2009 Elsevier B.V. All rights reserved.oi:10.1016/j.fusengdes.2009.12.008
© 2009 Elsevier B.V. All rights reserved.
Several hundreds of kilograms of Be, W and graphite dust areexpected to produce inside the ITER vacuum vessel. Dust can bemobilized in various accident sequences for example during loss ofvacuum accidents (LOVAs) and loss of coolant accidents (LOCAs).In scenarios with steam ingress, hot beryllium dust can react withsteam and lead to rapid formation of hydrogen mixtures insidethe vacuum vessel. A probable ignition scenario is a weak sparkstarting a hydrogen burn which then triggers a dust explosion. Con-sequently, ITER has proposed additional R&D tasks to demonstrateeither the exclusion of hydrogen combustion risks in the VV or fastcountermeasures to mitigate these risks [2]. Therefore, nitrogeninjection system in the VV and hydrogen recombination system inthe ST were proposed to mitigate the risks of hydrogen combustion[3–5]. The feasibility and efficiency of these two hydrogen mitiga-tion measures to control hydrogen risks were evaluated using the3D CFD code GASFLOW [6,7].
In Section 2 the wet bypass scenario in ITER VV and theproposed hydrogen mitigation measures are described. The GAS-FLOW geometric model and numerical models developed for the
ITER safety analysis are presented in Section 3. Section 4 demon-strates the methodology of hydrogen safety analysis in ITER.The hydrogen risks and the mitigation measures are evaluatedin Section 5. Section 6 summarizes the main findings of thestudy.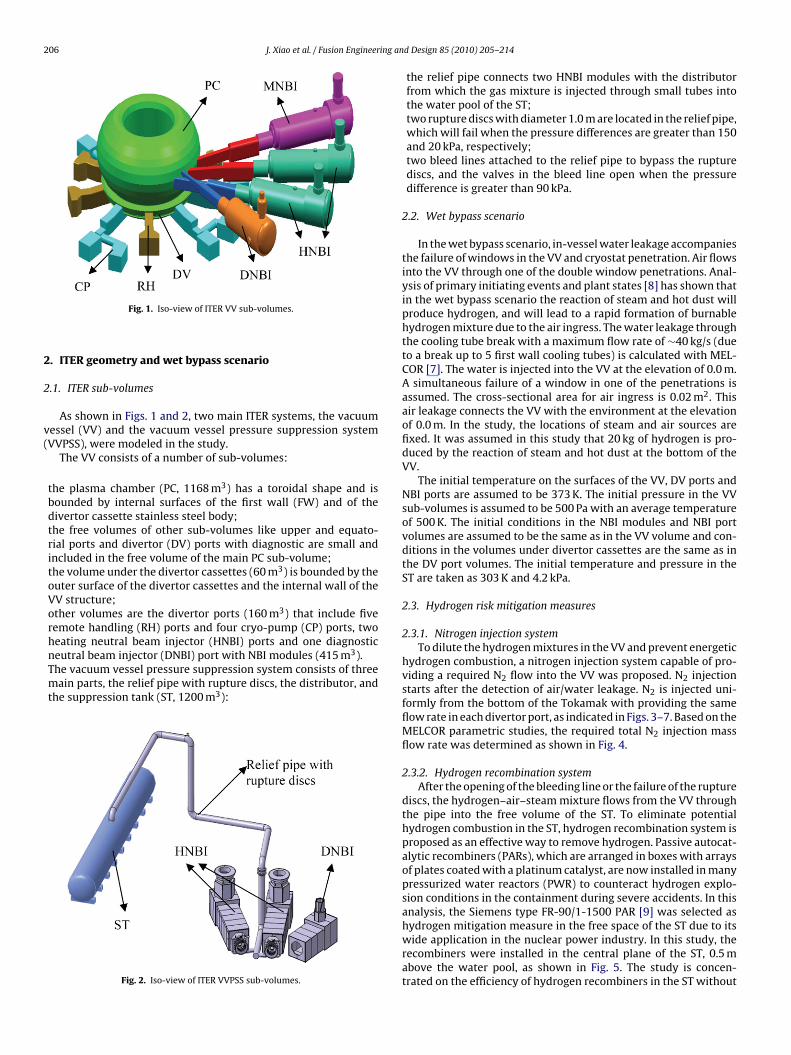
206 J. Xiao et al. / Fusion Engineering an
2
2
v(
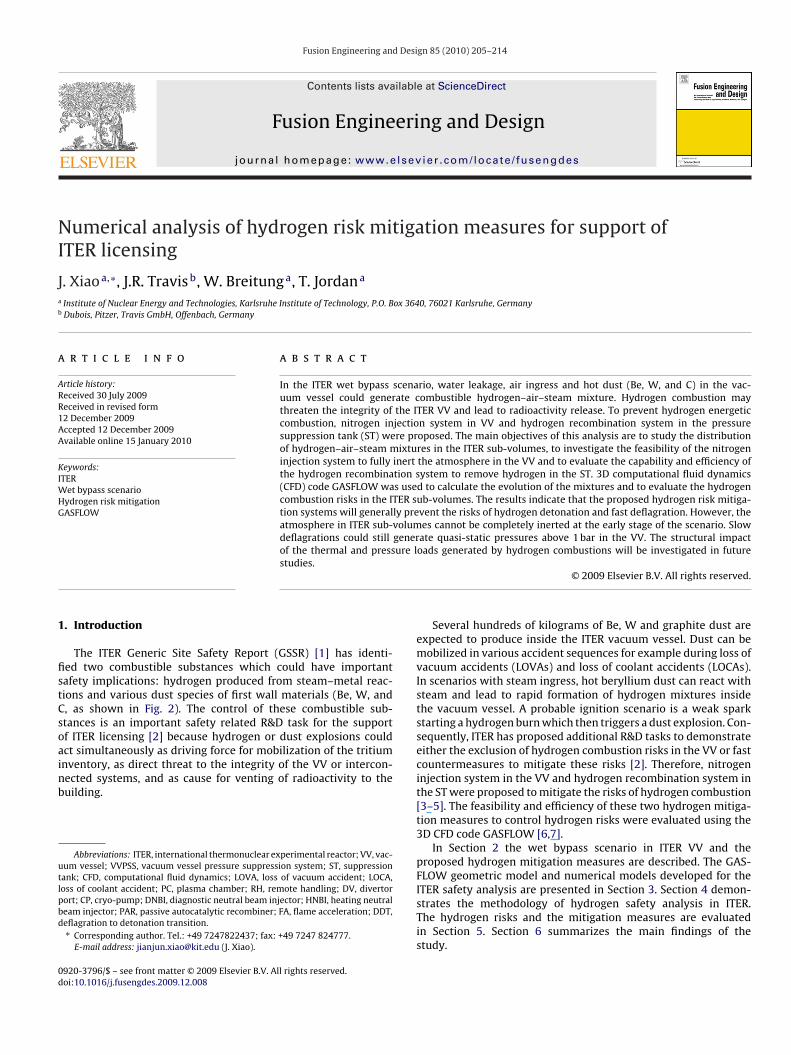
Fig. 1. Iso-view of ITER VV sub-volumes.
. ITER geometry and wet bypass scenario
.1. ITER sub-volumes
As shown in Figs. 1 and 2, two main ITER systems, the vacuumessel (VV) and the vacuum vessel pressure suppression systemVVPSS), were modeled in the study.
The VV consists of a number of sub-volumes:
the plasma chamber (PC, 1168 m3) has a toroidal shape and isbounded by internal surfaces of the first wall (FW) and of thedivertor cassette stainless steel body;the free volumes of other sub-volumes like upper and equato-rial ports and divertor (DV) ports with diagnostic are small andincluded in the free volume of the main PC sub-volume;the volume under the divertor cassettes (60 m3) is bounded by theouter surface of the divertor cassettes and the internal wall of theVV structure;other volumes are the divertor ports (160 m3) that include fiveremote handling (RH) ports and four cryo-pump (CP) ports, twoheating neutral beam injector (HNBI) ports and one diagnostic
neutral beam injector (DNBI) port with NBI modules (415 m3).The vacuum vessel pressure suppression system consists of threemain parts, the relief pipe with rupture discs, the distributor, andthe suppression tank (ST, 1200 m3):Fig. 2. Iso-view of ITER VVPSS sub-volumes.
d Design 85 (2010) 205–214
the relief pipe connects two HNBI modules with the distributorfrom which the gas mixture is injected through small tubes intothe water pool of the ST;two rupture discs with diameter 1.0 m are located in the relief pipe,which will fail when the pressure differences are greater than 150and 20 kPa, respectively;two bleed lines attached to the relief pipe to bypass the rupturediscs, and the valves in the bleed line open when the pressuredifference is greater than 90 kPa.
2.2. Wet bypass scenario
In the wet bypass scenario, in-vessel water leakage accompaniesthe failure of windows in the VV and cryostat penetration. Air flowsinto the VV through one of the double window penetrations. Anal-ysis of primary initiating events and plant states [8] has shown thatin the wet bypass scenario the reaction of steam and hot dust willproduce hydrogen, and will lead to a rapid formation of burnablehydrogen mixture due to the air ingress. The water leakage throughthe cooling tube break with a maximum flow rate of ∼40 kg/s (dueto a break up to 5 first wall cooling tubes) is calculated with MEL-COR [7]. The water is injected into the VV at the elevation of 0.0 m.A simultaneous failure of a window in one of the penetrations isassumed. The cross-sectional area for air ingress is 0.02 m2. Thisair leakage connects the VV with the environment at the elevationof 0.0 m. In the study, the locations of steam and air sources arefixed. It was assumed in this study that 20 kg of hydrogen is pro-duced by the reaction of steam and hot dust at the bottom of theVV.
The initial temperature on the surfaces of the VV, DV ports andNBI ports are assumed to be 373 K. The initial pressure in the VVsub-volumes is assumed to be 500 Pa with an average temperatureof 500 K. The initial conditions in the NBI modules and NBI portvolumes are assumed to be the same as in the VV volume and con-ditions in the volumes under divertor cassettes are the same as inthe DV port volumes. The initial temperature and pressure in theST are taken as 303 K and 4.2 kPa.
2.3. Hydrogen risk mitigation measures
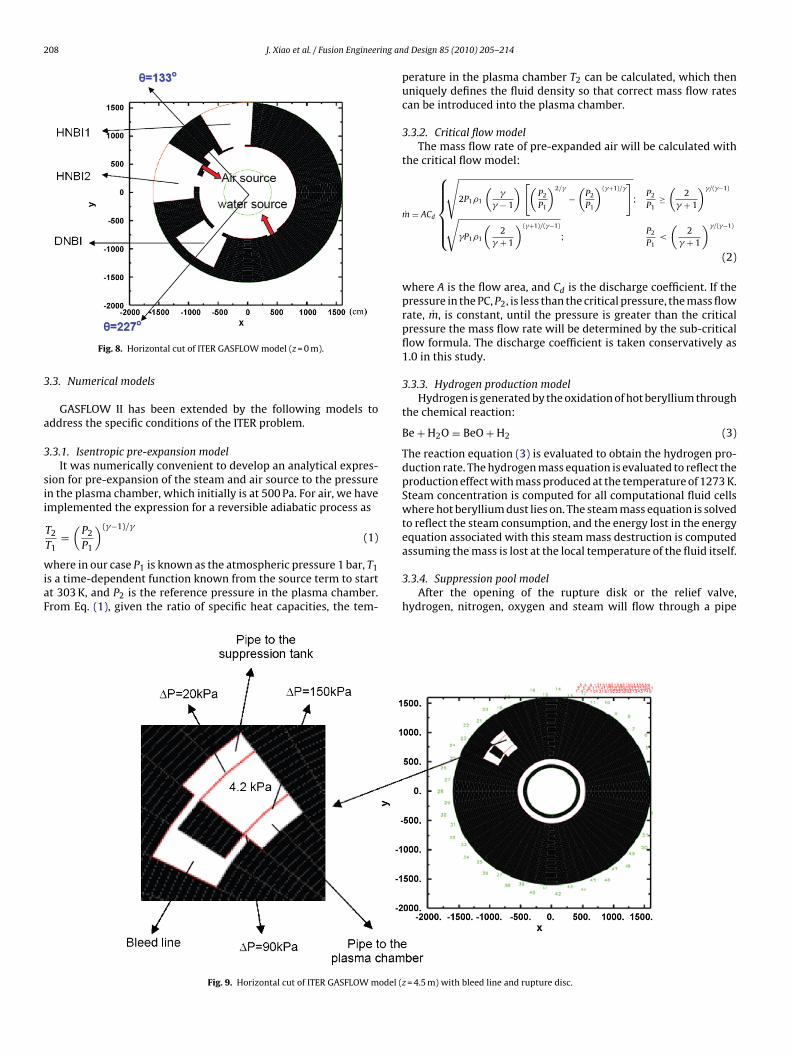
2.3.1. Nitrogen injection systemTo dilute the hydrogen mixtures in the VV and prevent energetic
hydrogen combustion, a nitrogen injection system capable of pro-viding a required N2 flow into the VV was proposed. N2 injectionstarts after the detection of air/water leakage. N2 is injected uni-formly from the bottom of the Tokamak with providing the sameflow rate in each divertor port, as indicated in Figs. 3–7. Based on theMELCOR parametric studies, the required total N2 injection massflow rate was determined as shown in Fig. 4.
2.3.2. Hydrogen recombination systemAfter the opening of the bleeding line or the failure of the rupture
discs, the hydrogen–air–steam mixture flows from the VV throughthe pipe into the free volume of the ST. To eliminate potentialhydrogen combustion in the ST, hydrogen recombination system isproposed as an effective way to remove hydrogen. Passive autocat-alytic recombiners (PARs), which are arranged in boxes with arraysof plates coated with a platinum catalyst, are now installed in manypressurized water reactors (PWR) to counteract hydrogen explo-sion conditions in the containment during severe accidents. In thisanalysis, the Siemens type FR-90/1-1500 PAR [9] was selected as
hydrogen mitigation measure in the free space of the ST due to itswide application in the nuclear power industry. In this study, therecombiners were installed in the central plane of the ST, 0.5 mabove the water pool, as shown in Fig. 5. The study is concen-trated on the efficiency of hydrogen recombiners in the ST without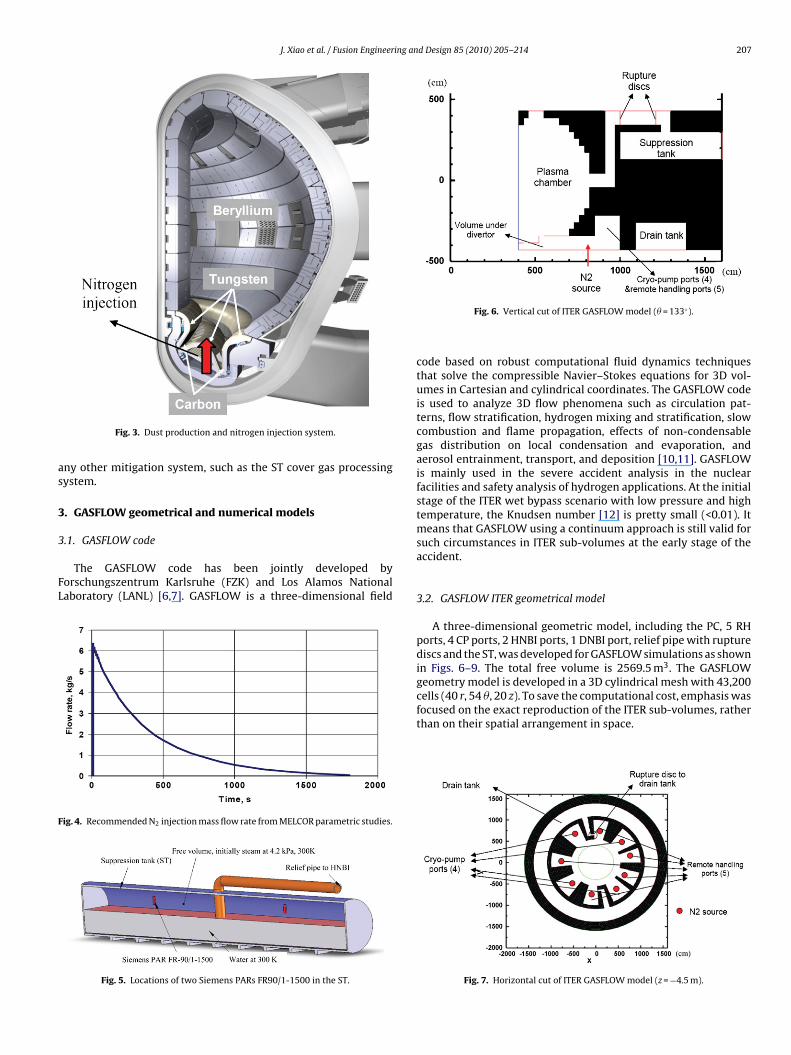
J. Xiao et al. / Fusion Engineering and Design 85 (2010) 205–214 207
as
3
3
FL
F
Fig. 3. Dust production and nitrogen injection system.
ny other mitigation system, such as the ST cover gas processingystem.
. GASFLOW geometrical and numerical models
.1. GASFLOW code
The GASFLOW code has been jointly developed byorschungszentrum Karlsruhe (FZK) and Los Alamos Nationalaboratory (LANL) [6,7]. GASFLOW is a three-dimensional field
ig. 4. Recommended N2 injection mass flow rate from MELCOR parametric studies.
Fig. 5. Locations of two Siemens PARs FR90/1-1500 in the ST.
Fig. 6. Vertical cut of ITER GASFLOW model (� = 133◦).
code based on robust computational fluid dynamics techniquesthat solve the compressible Navier–Stokes equations for 3D vol-umes in Cartesian and cylindrical coordinates. The GASFLOW codeis used to analyze 3D flow phenomena such as circulation pat-terns, flow stratification, hydrogen mixing and stratification, slowcombustion and flame propagation, effects of non-condensablegas distribution on local condensation and evaporation, andaerosol entrainment, transport, and deposition [10,11]. GASFLOWis mainly used in the severe accident analysis in the nuclearfacilities and safety analysis of hydrogen applications. At the initialstage of the ITER wet bypass scenario with low pressure and hightemperature, the Knudsen number [12] is pretty small (<0.01). Itmeans that GASFLOW using a continuum approach is still valid forsuch circumstances in ITER sub-volumes at the early stage of theaccident.
3.2. GASFLOW ITER geometrical model
A three-dimensional geometric model, including the PC, 5 RHports, 4 CP ports, 2 HNBI ports, 1 DNBI port, relief pipe with rupturediscs and the ST, was developed for GASFLOW simulations as shownin Figs. 6–9. The total free volume is 2569.5 m3. The GASFLOWgeometry model is developed in a 3D cylindrical mesh with 43,200cells (40 r, 54 �, 20 z). To save the computational cost, emphasis was
focused on the exact reproduction of the ITER sub-volumes, ratherthan on their spatial arrangement in space.Fig. 7. Horizontal cut of ITER GASFLOW model (z = −4.5 m).
208 J. Xiao et al. / Fusion Engineering an
3
a
3
sii
wiaF
Fig. 8. Horizontal cut of ITER GASFLOW model (z = 0 m).
.3. Numerical models
GASFLOW II has been extended by the following models toddress the specific conditions of the ITER problem.
.3.1. Isentropic pre-expansion modelIt was numerically convenient to develop an analytical expres-
ion for pre-expansion of the steam and air source to the pressuren the plasma chamber, which initially is at 500 Pa. For air, we havemplemented the expression for a reversible adiabatic process as
T2
T=
(P2
P
)(�−1)/�
(1)
1 1here in our case P1 is known as the atmospheric pressure 1 bar, T1s a time-dependent function known from the source term to startt 303 K, and P2 is the reference pressure in the plasma chamber.rom Eq. (1), given the ratio of specific heat capacities, the tem-
Fig. 9. Horizontal cut of ITER GASFLOW model (
d Design 85 (2010) 205–214
perature in the plasma chamber T2 can be calculated, which thenuniquely defines the fluid density so that correct mass flow ratescan be introduced into the plasma chamber.
3.3.2. Critical flow modelThe mass flow rate of pre-expanded air will be calculated with
the critical flow model:
m = ACd
⎧⎪⎪⎪⎨⎪⎪⎪⎩
√2P1�1
(�
� − 1
)[(P2
P1
)2/�
−(
P2
P1
)(�+1)/�]
;P2
P1≥(
2� + 1
)�/(�−1)
√�P1�1
(2
� + 1
)(�+1)/(�−1)
;P2
P1<
(2
� + 1
)�/(�−1)
(2)
where A is the flow area, and Cd is the discharge coefficient. If thepressure in the PC, P2, is less than the critical pressure, the mass flowrate, m, is constant, until the pressure is greater than the criticalpressure the mass flow rate will be determined by the sub-criticalflow formula. The discharge coefficient is taken conservatively as1.0 in this study.
3.3.3. Hydrogen production modelHydrogen is generated by the oxidation of hot beryllium through
the chemical reaction:
Be + H2O = BeO + H2 (3)
The reaction equation (3) is evaluated to obtain the hydrogen pro-duction rate. The hydrogen mass equation is evaluated to reflect theproduction effect with mass produced at the temperature of 1273 K.Steam concentration is computed for all computational fluid cellswhere hot beryllium dust lies on. The steam mass equation is solvedto reflect the steam consumption, and the energy lost in the energyequation associated with this steam mass destruction is computed
assuming the mass is lost at the local temperature of the fluid itself.3.3.4. Suppression pool modelAfter the opening of the rupture disk or the relief valve,
hydrogen, nitrogen, oxygen and steam will flow through a pipe
z = 4.5 m) with bleed line and rupture disc.
ing an
cwrtaActt
3
tbs
fkc
m
w
3
tasLaa
tr
�
s
�
Tsraca
pawjTaacaf
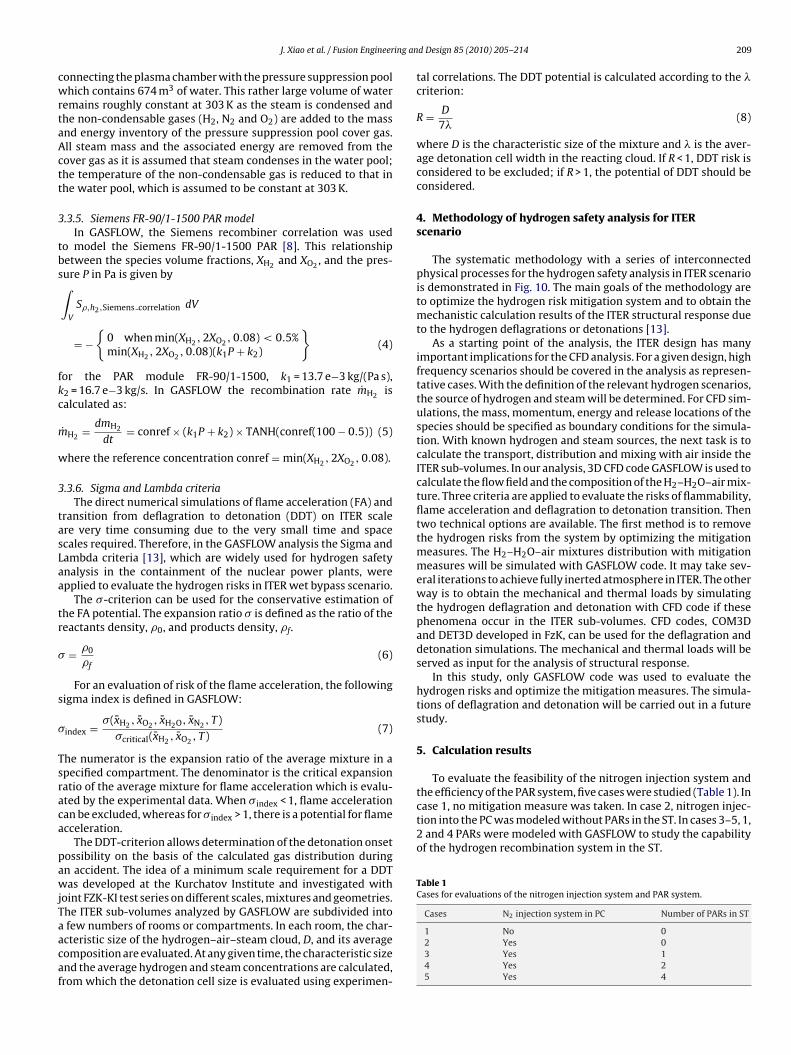
case 1, no mitigation measure was taken. In case 2, nitrogen injec-tion into the PC was modeled without PARs in the ST. In cases 3–5, 1,2 and 4 PARs were modeled with GASFLOW to study the capabilityof the hydrogen recombination system in the ST.
Table 1Cases for evaluations of the nitrogen injection system and PAR system.
Cases N2 injection system in PC Number of PARs in ST
J. Xiao et al. / Fusion Engineer
onnecting the plasma chamber with the pressure suppression poolhich contains 674 m3 of water. This rather large volume of water
emains roughly constant at 303 K as the steam is condensed andhe non-condensable gases (H2, N2 and O2) are added to the massnd energy inventory of the pressure suppression pool cover gas.ll steam mass and the associated energy are removed from theover gas as it is assumed that steam condenses in the water pool;he temperature of the non-condensable gas is reduced to that inhe water pool, which is assumed to be constant at 303 K.
.3.5. Siemens FR-90/1-1500 PAR modelIn GASFLOW, the Siemens recombiner correlation was used
o model the Siemens FR-90/1-1500 PAR [8]. This relationshipetween the species volume fractions, XH2 and XO2 , and the pres-ure P in Pa is given by∫
V
S�,h2,Siemens correlation dV
= −{
0 when min(XH2 , 2XO2 , 0.08) < 0.5%min(XH2 , 2XO2 , 0.08)(k1P + k2)
}(4)
or the PAR module FR-90/1-1500, k1 = 13.7 e−3 kg/(Pa s),2 = 16.7 e−3 kg/s. In GASFLOW the recombination rate mH2 isalculated as:
˙ H2 = dmH2
dt= conref × (k1P + k2) × TANH(conref(100 − 0.5)) (5)
here the reference concentration conref = min(XH2 , 2XO2 , 0.08).
.3.6. Sigma and Lambda criteriaThe direct numerical simulations of flame acceleration (FA) and
ransition from deflagration to detonation (DDT) on ITER scalere very time consuming due to the very small time and spacecales required. Therefore, in the GASFLOW analysis the Sigma andambda criteria [13], which are widely used for hydrogen safetynalysis in the containment of the nuclear power plants, werepplied to evaluate the hydrogen risks in ITER wet bypass scenario.
The �-criterion can be used for the conservative estimation ofhe FA potential. The expansion ratio � is defined as the ratio of theeactants density, �0, and products density, �f.
= �0
�f(6)
For an evaluation of risk of the flame acceleration, the followingigma index is defined in GASFLOW:
index = �(xH2 , xO2 , xH2O, xN2 , T)�critical(xH2 , xO2 , T)
(7)
he numerator is the expansion ratio of the average mixture in apecified compartment. The denominator is the critical expansionatio of the average mixture for flame acceleration which is evalu-ted by the experimental data. When �index < 1, flame accelerationan be excluded, whereas for �index > 1, there is a potential for flamecceleration.
The DDT-criterion allows determination of the detonation onsetossibility on the basis of the calculated gas distribution duringn accident. The idea of a minimum scale requirement for a DDTas developed at the Kurchatov Institute and investigated with
oint FZK-KI test series on different scales, mixtures and geometries.he ITER sub-volumes analyzed by GASFLOW are subdivided into
few numbers of rooms or compartments. In each room, the char-cteristic size of the hydrogen–air–steam cloud, D, and its averageomposition are evaluated. At any given time, the characteristic sizend the average hydrogen and steam concentrations are calculated,rom which the detonation cell size is evaluated using experimen-d Design 85 (2010) 205–214 209
tal correlations. The DDT potential is calculated according to the �criterion:
R = D
7�(8)
where D is the characteristic size of the mixture and � is the aver-age detonation cell width in the reacting cloud. If R < 1, DDT risk isconsidered to be excluded; if R > 1, the potential of DDT should beconsidered.
4. Methodology of hydrogen safety analysis for ITERscenario
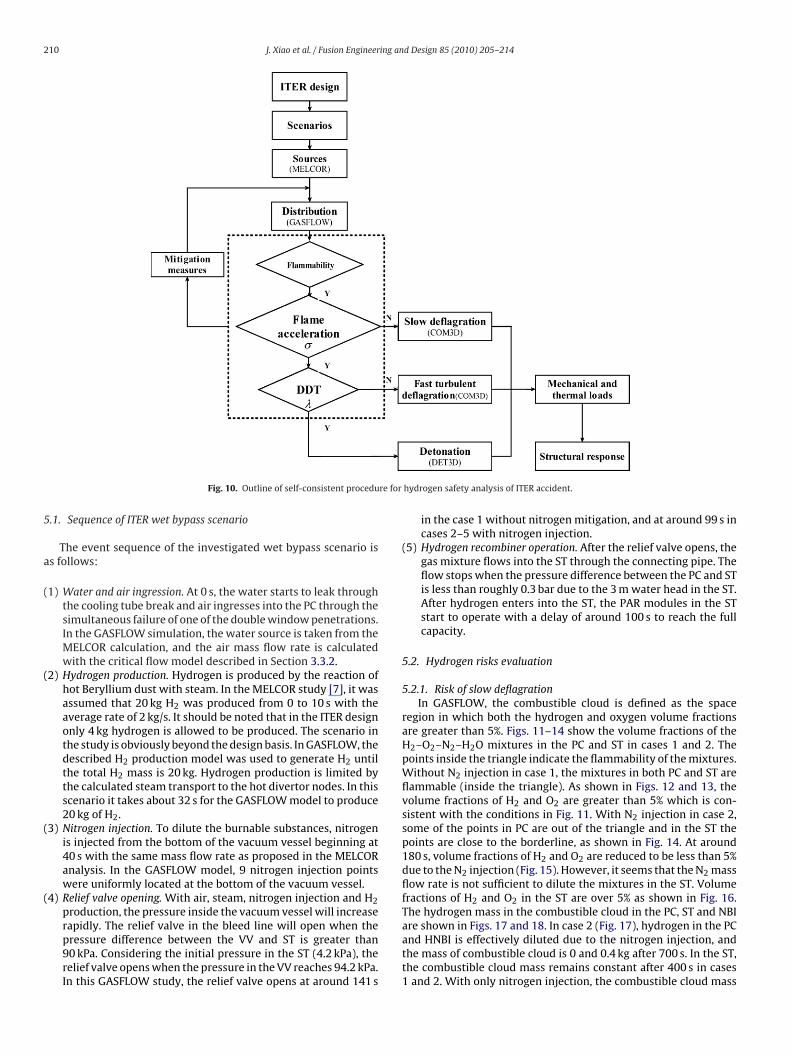
The systematic methodology with a series of interconnectedphysical processes for the hydrogen safety analysis in ITER scenariois demonstrated in Fig. 10. The main goals of the methodology areto optimize the hydrogen risk mitigation system and to obtain themechanistic calculation results of the ITER structural response dueto the hydrogen deflagrations or detonations [13].
As a starting point of the analysis, the ITER design has manyimportant implications for the CFD analysis. For a given design, highfrequency scenarios should be covered in the analysis as represen-tative cases. With the definition of the relevant hydrogen scenarios,the source of hydrogen and steam will be determined. For CFD sim-ulations, the mass, momentum, energy and release locations of thespecies should be specified as boundary conditions for the simula-tion. With known hydrogen and steam sources, the next task is tocalculate the transport, distribution and mixing with air inside theITER sub-volumes. In our analysis, 3D CFD code GASFLOW is used tocalculate the flow field and the composition of the H2–H2O–air mix-ture. Three criteria are applied to evaluate the risks of flammability,flame acceleration and deflagration to detonation transition. Thentwo technical options are available. The first method is to removethe hydrogen risks from the system by optimizing the mitigationmeasures. The H2–H2O–air mixtures distribution with mitigationmeasures will be simulated with GASFLOW code. It may take sev-eral iterations to achieve fully inerted atmosphere in ITER. The otherway is to obtain the mechanical and thermal loads by simulatingthe hydrogen deflagration and detonation with CFD code if thesephenomena occur in the ITER sub-volumes. CFD codes, COM3Dand DET3D developed in FzK, can be used for the deflagration anddetonation simulations. The mechanical and thermal loads will beserved as input for the analysis of structural response.
In this study, only GASFLOW code was used to evaluate thehydrogen risks and optimize the mitigation measures. The simula-tions of deflagration and detonation will be carried out in a futurestudy.
5. Calculation results
To evaluate the feasibility of the nitrogen injection system andthe efficiency of the PAR system, five cases were studied (Table 1). In
1 No 02 Yes 03 Yes 14 Yes 25 Yes 4
210 J. Xiao et al. / Fusion Engineering and Design 85 (2010) 205–214
re for
5
a
(
(
(
(
Fig. 10. Outline of self-consistent procedu
.1. Sequence of ITER wet bypass scenario
The event sequence of the investigated wet bypass scenario iss follows:
1) Water and air ingression. At 0 s, the water starts to leak throughthe cooling tube break and air ingresses into the PC through thesimultaneous failure of one of the double window penetrations.In the GASFLOW simulation, the water source is taken from theMELCOR calculation, and the air mass flow rate is calculatedwith the critical flow model described in Section 3.3.2.
2) Hydrogen production. Hydrogen is produced by the reaction ofhot Beryllium dust with steam. In the MELCOR study [7], it wasassumed that 20 kg H2 was produced from 0 to 10 s with theaverage rate of 2 kg/s. It should be noted that in the ITER designonly 4 kg hydrogen is allowed to be produced. The scenario inthe study is obviously beyond the design basis. In GASFLOW, thedescribed H2 production model was used to generate H2 untilthe total H2 mass is 20 kg. Hydrogen production is limited bythe calculated steam transport to the hot divertor nodes. In thisscenario it takes about 32 s for the GASFLOW model to produce20 kg of H2.
3) Nitrogen injection. To dilute the burnable substances, nitrogenis injected from the bottom of the vacuum vessel beginning at40 s with the same mass flow rate as proposed in the MELCORanalysis. In the GASFLOW model, 9 nitrogen injection pointswere uniformly located at the bottom of the vacuum vessel.
4) Relief valve opening. With air, steam, nitrogen injection and H2production, the pressure inside the vacuum vessel will increase
rapidly. The relief valve in the bleed line will open when thepressure difference between the VV and ST is greater than90 kPa. Considering the initial pressure in the ST (4.2 kPa), therelief valve opens when the pressure in the VV reaches 94.2 kPa.In this GASFLOW study, the relief valve opens at around 141 shydrogen safety analysis of ITER accident.
in the case 1 without nitrogen mitigation, and at around 99 s incases 2–5 with nitrogen injection.
(5) Hydrogen recombiner operation. After the relief valve opens, thegas mixture flows into the ST through the connecting pipe. Theflow stops when the pressure difference between the PC and STis less than roughly 0.3 bar due to the 3 m water head in the ST.After hydrogen enters into the ST, the PAR modules in the STstart to operate with a delay of around 100 s to reach the fullcapacity.
5.2. Hydrogen risks evaluation
5.2.1. Risk of slow deflagrationIn GASFLOW, the combustible cloud is defined as the space
region in which both the hydrogen and oxygen volume fractionsare greater than 5%. Figs. 11–14 show the volume fractions of theH2–O2–N2–H2O mixtures in the PC and ST in cases 1 and 2. Thepoints inside the triangle indicate the flammability of the mixtures.Without N2 injection in case 1, the mixtures in both PC and ST areflammable (inside the triangle). As shown in Figs. 12 and 13, thevolume fractions of H2 and O2 are greater than 5% which is con-sistent with the conditions in Fig. 11. With N2 injection in case 2,some of the points in PC are out of the triangle and in the ST thepoints are close to the borderline, as shown in Fig. 14. At around180 s, volume fractions of H2 and O2 are reduced to be less than 5%due to the N2 injection (Fig. 15). However, it seems that the N2 massflow rate is not sufficient to dilute the mixtures in the ST. Volumefractions of H2 and O2 in the ST are over 5% as shown in Fig. 16.The hydrogen mass in the combustible cloud in the PC, ST and NBI
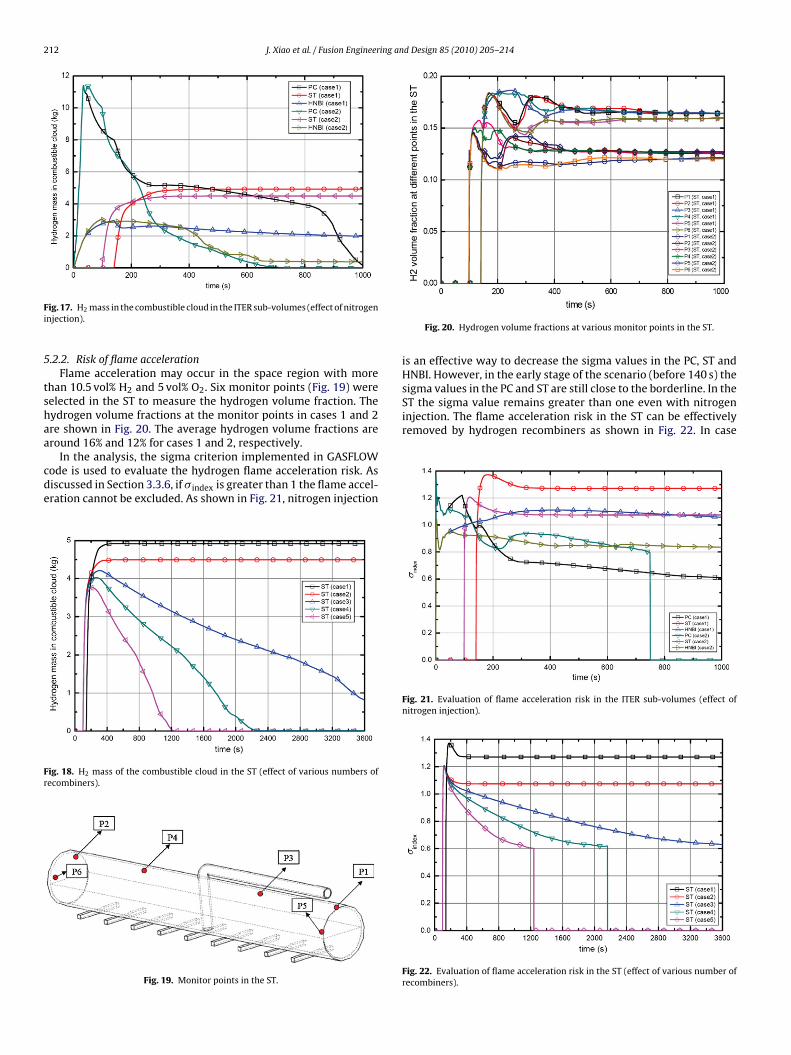
are shown in Figs. 17 and 18. In case 2 (Fig. 17), hydrogen in the PCand HNBI is effectively diluted due to the nitrogen injection, andthe mass of combustible cloud is 0 and 0.4 kg after 700 s. In the ST,the combustible cloud mass remains constant after 400 s in cases1 and 2. With only nitrogen injection, the combustible cloud mass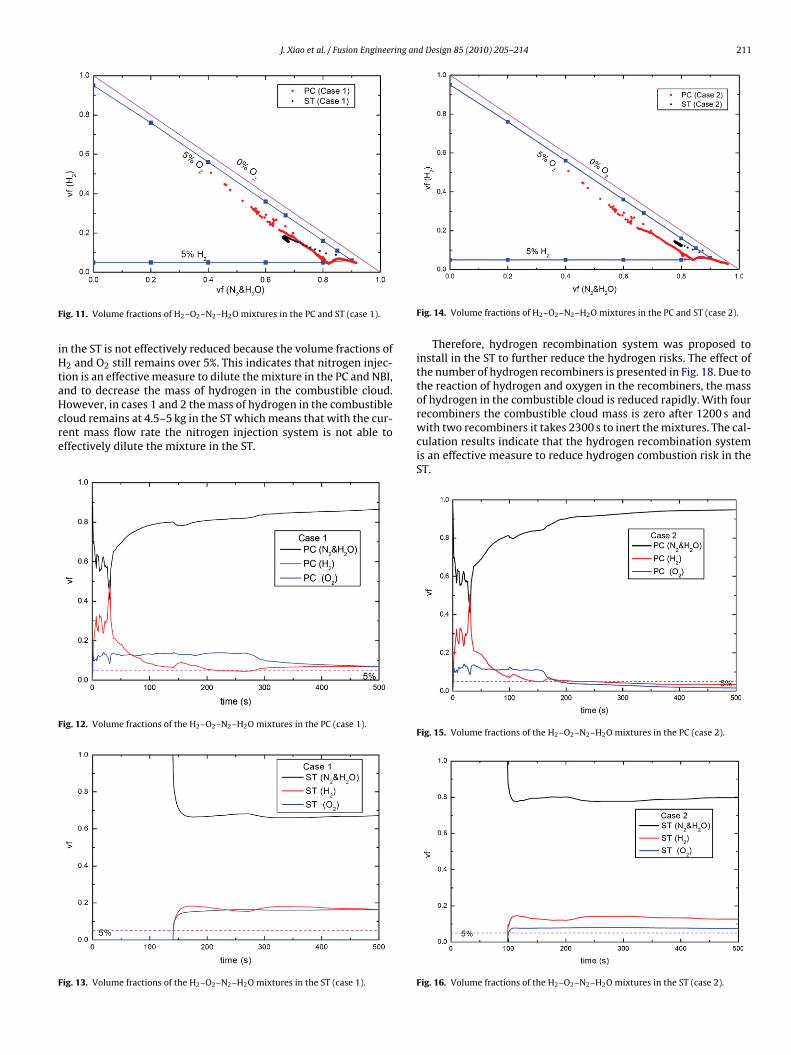
J. Xiao et al. / Fusion Engineering and Design 85 (2010) 205–214 211
F
iHtaHcre
F
F
ig. 11. Volume fractions of H2–O2–N2–H2O mixtures in the PC and ST (case 1).
n the ST is not effectively reduced because the volume fractions of2 and O2 still remains over 5%. This indicates that nitrogen injec-
ion is an effective measure to dilute the mixture in the PC and NBI,nd to decrease the mass of hydrogen in the combustible cloud.
owever, in cases 1 and 2 the mass of hydrogen in the combustibleloud remains at 4.5–5 kg in the ST which means that with the cur-ent mass flow rate the nitrogen injection system is not able toffectively dilute the mixture in the ST.ig. 12. Volume fractions of the H2–O2–N2–H2O mixtures in the PC (case 1).
ig. 13. Volume fractions of the H2–O2–N2–H2O mixtures in the ST (case 1).
Fig. 14. Volume fractions of H2–O2–N2–H2O mixtures in the PC and ST (case 2).
Therefore, hydrogen recombination system was proposed toinstall in the ST to further reduce the hydrogen risks. The effect ofthe number of hydrogen recombiners is presented in Fig. 18. Due tothe reaction of hydrogen and oxygen in the recombiners, the massof hydrogen in the combustible cloud is reduced rapidly. With fourrecombiners the combustible cloud mass is zero after 1200 s and
with two recombiners it takes 2300 s to inert the mixtures. The cal-culation results indicate that the hydrogen recombination systemis an effective measure to reduce hydrogen combustion risk in theST.Fig. 15. Volume fractions of the H2–O2–N2–H2O mixtures in the PC (case 2).
Fig. 16. Volume fractions of the H2–O2–N2–H2O mixtures in the ST (case 2).
212 J. Xiao et al. / Fusion Engineering and Design 85 (2010) 205–214
Fi
5
tshaa
cde
Fr
sigma values in the PC and ST are still close to the borderline. In theST the sigma value remains greater than one even with nitrogeninjection. The flame acceleration risk in the ST can be effectivelyremoved by hydrogen recombiners as shown in Fig. 22. In case
ig. 17. H2 mass in the combustible cloud in the ITER sub-volumes (effect of nitrogennjection).
.2.2. Risk of flame accelerationFlame acceleration may occur in the space region with more
han 10.5 vol% H2 and 5 vol% O2. Six monitor points (Fig. 19) wereelected in the ST to measure the hydrogen volume fraction. Theydrogen volume fractions at the monitor points in cases 1 and 2re shown in Fig. 20. The average hydrogen volume fractions areround 16% and 12% for cases 1 and 2, respectively.
In the analysis, the sigma criterion implemented in GASFLOWode is used to evaluate the hydrogen flame acceleration risk. Asiscussed in Section 3.3.6, if �index is greater than 1 the flame accel-ration cannot be excluded. As shown in Fig. 21, nitrogen injection
ig. 18. H2 mass of the combustible cloud in the ST (effect of various numbers ofecombiners).
Fig. 19. Monitor points in the ST.
Fig. 20. Hydrogen volume fractions at various monitor points in the ST.
is an effective way to decrease the sigma values in the PC, ST andHNBI. However, in the early stage of the scenario (before 140 s) the
Fig. 21. Evaluation of flame acceleration risk in the ITER sub-volumes (effect ofnitrogen injection).
Fig. 22. Evaluation of flame acceleration risk in the ST (effect of various number ofrecombiners).
J. Xiao et al. / Fusion Engineering an
F
3hgttbt
5
SbtmFip
5
5
tifaa
F
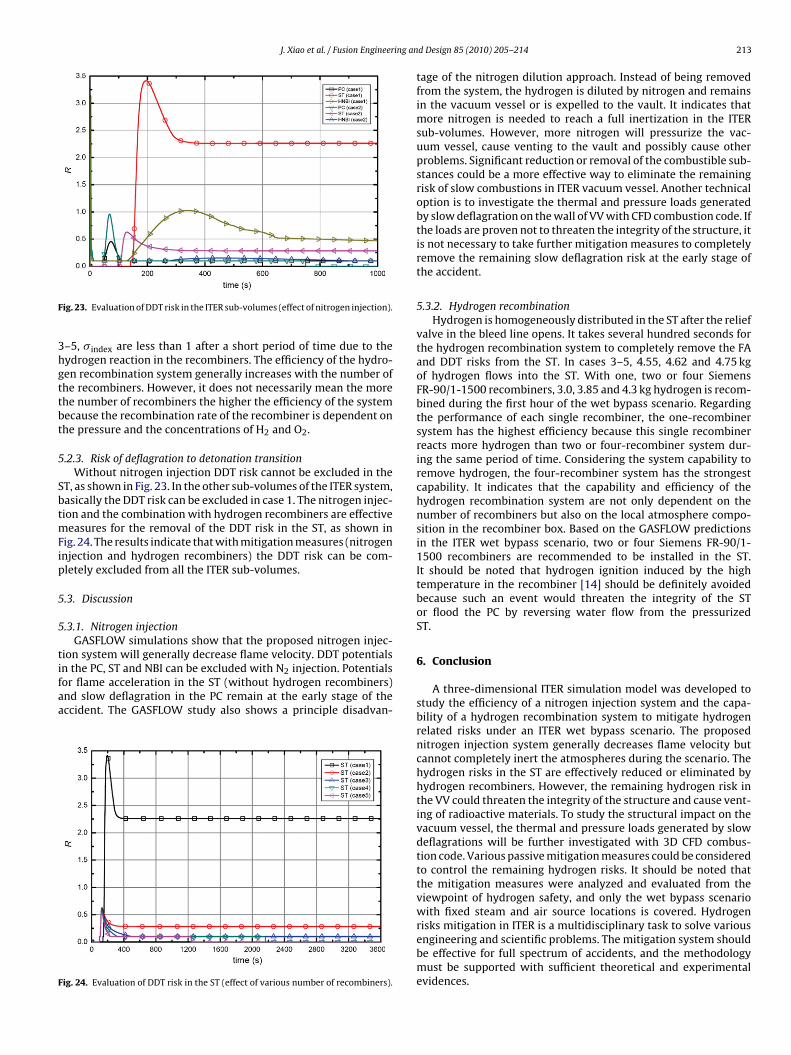
ig. 23. Evaluation of DDT risk in the ITER sub-volumes (effect of nitrogen injection).
–5, �index are less than 1 after a short period of time due to theydrogen reaction in the recombiners. The efficiency of the hydro-en recombination system generally increases with the number ofhe recombiners. However, it does not necessarily mean the morehe number of recombiners the higher the efficiency of the systemecause the recombination rate of the recombiner is dependent onhe pressure and the concentrations of H2 and O2.
.2.3. Risk of deflagration to detonation transitionWithout nitrogen injection DDT risk cannot be excluded in the
T, as shown in Fig. 23. In the other sub-volumes of the ITER system,asically the DDT risk can be excluded in case 1. The nitrogen injec-ion and the combination with hydrogen recombiners are effective
easures for the removal of the DDT risk in the ST, as shown inig. 24. The results indicate that with mitigation measures (nitrogennjection and hydrogen recombiners) the DDT risk can be com-letely excluded from all the ITER sub-volumes.
.3. Discussion
.3.1. Nitrogen injectionGASFLOW simulations show that the proposed nitrogen injec-
ion system will generally decrease flame velocity. DDT potentialsn the PC, ST and NBI can be excluded with N2 injection. Potentialsor flame acceleration in the ST (without hydrogen recombiners)nd slow deflagration in the PC remain at the early stage of theccident. The GASFLOW study also shows a principle disadvan-
ig. 24. Evaluation of DDT risk in the ST (effect of various number of recombiners).
d Design 85 (2010) 205–214 213
tage of the nitrogen dilution approach. Instead of being removedfrom the system, the hydrogen is diluted by nitrogen and remainsin the vacuum vessel or is expelled to the vault. It indicates thatmore nitrogen is needed to reach a full inertization in the ITERsub-volumes. However, more nitrogen will pressurize the vac-uum vessel, cause venting to the vault and possibly cause otherproblems. Significant reduction or removal of the combustible sub-stances could be a more effective way to eliminate the remainingrisk of slow combustions in ITER vacuum vessel. Another technicaloption is to investigate the thermal and pressure loads generatedby slow deflagration on the wall of VV with CFD combustion code. Ifthe loads are proven not to threaten the integrity of the structure, itis not necessary to take further mitigation measures to completelyremove the remaining slow deflagration risk at the early stage ofthe accident.
5.3.2. Hydrogen recombinationHydrogen is homogeneously distributed in the ST after the relief
valve in the bleed line opens. It takes several hundred seconds forthe hydrogen recombination system to completely remove the FAand DDT risks from the ST. In cases 3–5, 4.55, 4.62 and 4.75 kgof hydrogen flows into the ST. With one, two or four SiemensFR-90/1-1500 recombiners, 3.0, 3.85 and 4.3 kg hydrogen is recom-bined during the first hour of the wet bypass scenario. Regardingthe performance of each single recombiner, the one-recombinersystem has the highest efficiency because this single recombinerreacts more hydrogen than two or four-recombiner system dur-ing the same period of time. Considering the system capability toremove hydrogen, the four-recombiner system has the strongestcapability. It indicates that the capability and efficiency of thehydrogen recombination system are not only dependent on thenumber of recombiners but also on the local atmosphere compo-sition in the recombiner box. Based on the GASFLOW predictionsin the ITER wet bypass scenario, two or four Siemens FR-90/1-1500 recombiners are recommended to be installed in the ST.It should be noted that hydrogen ignition induced by the hightemperature in the recombiner [14] should be definitely avoidedbecause such an event would threaten the integrity of the STor flood the PC by reversing water flow from the pressurizedST.
6. Conclusion
A three-dimensional ITER simulation model was developed tostudy the efficiency of a nitrogen injection system and the capa-bility of a hydrogen recombination system to mitigate hydrogenrelated risks under an ITER wet bypass scenario. The proposednitrogen injection system generally decreases flame velocity butcannot completely inert the atmospheres during the scenario. Thehydrogen risks in the ST are effectively reduced or eliminated byhydrogen recombiners. However, the remaining hydrogen risk inthe VV could threaten the integrity of the structure and cause vent-ing of radioactive materials. To study the structural impact on thevacuum vessel, the thermal and pressure loads generated by slowdeflagrations will be further investigated with 3D CFD combus-tion code. Various passive mitigation measures could be consideredto control the remaining hydrogen risks. It should be noted thatthe mitigation measures were analyzed and evaluated from theviewpoint of hydrogen safety, and only the wet bypass scenariowith fixed steam and air source locations is covered. Hydrogen
risks mitigation in ITER is a multidisciplinary task to solve variousengineering and scientific problems. The mitigation system shouldbe effective for full spectrum of accidents, and the methodologymust be supported with sufficient theoretical and experimentalevidences.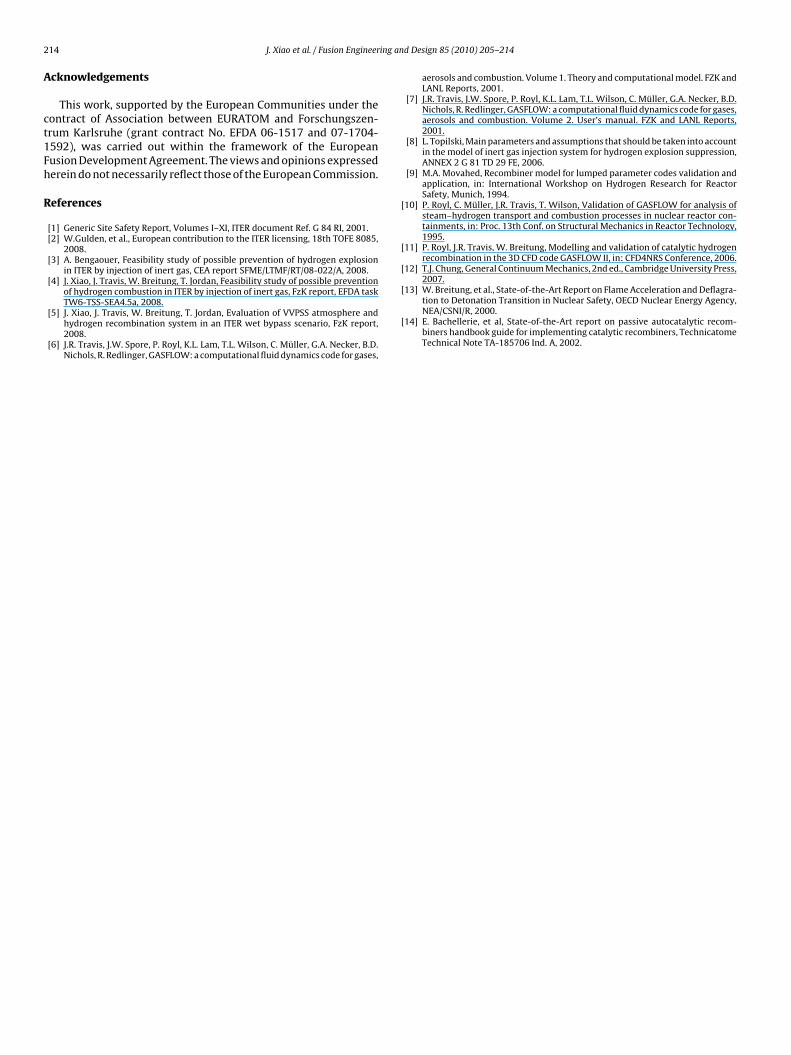
2 ing an
A
ct1Fh
R [
[
[
[13] W. Breitung, et al., State-of-the-Art Report on Flame Acceleration and Deflagra-
14 J. Xiao et al. / Fusion Engineer
cknowledgements
This work, supported by the European Communities under theontract of Association between EURATOM and Forschungszen-rum Karlsruhe (grant contract No. EFDA 06-1517 and 07-1704-592), was carried out within the framework of the Europeanusion Development Agreement. The views and opinions expressederein do not necessarily reflect those of the European Commission.
eferences
[1] Generic Site Safety Report, Volumes I–XI, ITER document Ref. G 84 RI, 2001.[2] W.Gulden, et al., European contribution to the ITER licensing, 18th TOFE 8085,
2008.[3] A. Bengaouer, Feasibility study of possible prevention of hydrogen explosion
in ITER by injection of inert gas, CEA report SFME/LTMF/RT/08-022/A, 2008.[4] J. Xiao, J. Travis, W. Breitung, T. Jordan, Feasibility study of possible prevention
of hydrogen combustion in ITER by injection of inert gas, FzK report, EFDA task
TW6-TSS-SEA4.5a, 2008.[5] J. Xiao, J. Travis, W. Breitung, T. Jordan, Evaluation of VVPSS atmosphere andhydrogen recombination system in an ITER wet bypass scenario, FzK report,2008.
[6] J.R. Travis, J.W. Spore, P. Royl, K.L. Lam, T.L. Wilson, C. Müller, G.A. Necker, B.D.Nichols, R. Redlinger, GASFLOW: a computational fluid dynamics code for gases,
[
d Design 85 (2010) 205–214
aerosols and combustion. Volume 1. Theory and computational model. FZK andLANL Reports, 2001.
[7] J.R. Travis, J.W. Spore, P. Royl, K.L. Lam, T.L. Wilson, C. Müller, G.A. Necker, B.D.Nichols, R. Redlinger, GASFLOW: a computational fluid dynamics code for gases,aerosols and combustion. Volume 2. User’s manual. FZK and LANL Reports,2001.
[8] L. Topilski, Main parameters and assumptions that should be taken into accountin the model of inert gas injection system for hydrogen explosion suppression,ANNEX 2 G 81 TD 29 FE, 2006.
[9] M.A. Movahed, Recombiner model for lumped parameter codes validation andapplication, in: International Workshop on Hydrogen Research for ReactorSafety, Munich, 1994.
10] P. Royl, C. Müller, J.R. Travis, T. Wilson, Validation of GASFLOW for analysis ofsteam–hydrogen transport and combustion processes in nuclear reactor con-tainments, in: Proc. 13th Conf. on Structural Mechanics in Reactor Technology,1995.
11] P. Royl, J.R. Travis, W. Breitung, Modelling and validation of catalytic hydrogenrecombination in the 3D CFD code GASFLOW II, in: CFD4NRS Conference, 2006.
12] T.J. Chung, General Continuum Mechanics, 2nd ed., Cambridge University Press,2007.
tion to Detonation Transition in Nuclear Safety, OECD Nuclear Energy Agency,NEA/CSNI/R, 2000.
14] E. Bachellerie, et al, State-of-the-Art report on passive autocatalytic recom-biners handbook guide for implementing catalytic recombiners, TechnicatomeTechnical Note TA-185706 Ind. A, 2002.
Related Documents