University of South Florida Scholar Commons Graduate eses and Dissertations Graduate School 2011 Numeracy, Cancer Risk Perceptions, and Self- Protective Behaviors among U.S. Adults Teri Malo University of South Florida, [email protected] Follow this and additional works at: hp://scholarcommons.usf.edu/etd Part of the American Studies Commons , Other Education Commons , and the Public Health Commons is Dissertation is brought to you for free and open access by the Graduate School at Scholar Commons. It has been accepted for inclusion in Graduate eses and Dissertations by an authorized administrator of Scholar Commons. For more information, please contact [email protected]. Scholar Commons Citation Malo, Teri, "Numeracy, Cancer Risk Perceptions, and Self-Protective Behaviors among U.S. Adults" (2011). Graduate eses and Dissertations. hp://scholarcommons.usf.edu/etd/3229

Welcome message from author
This document is posted to help you gain knowledge. Please leave a comment to let me know what you think about it! Share it to your friends and learn new things together.
Transcript
University of South FloridaScholar Commons
Graduate Theses and Dissertations Graduate School
2011
Numeracy, Cancer Risk Perceptions, and Self-Protective Behaviors among U.S. AdultsTeri MaloUniversity of South Florida, [email protected]
Follow this and additional works at: http://scholarcommons.usf.edu/etd
Part of the American Studies Commons, Other Education Commons, and the Public HealthCommons
This Dissertation is brought to you for free and open access by the Graduate School at Scholar Commons. It has been accepted for inclusion inGraduate Theses and Dissertations by an authorized administrator of Scholar Commons. For more information, please [email protected].
Scholar Commons CitationMalo, Teri, "Numeracy, Cancer Risk Perceptions, and Self-Protective Behaviors among U.S. Adults" (2011). Graduate Theses andDissertations.http://scholarcommons.usf.edu/etd/3229
Numeracy, Cancer Risk Perceptions, and Self-Protective Behaviors
among U.S. Adults
by
Teri L. Malo
A dissertation submitted in partial fulfillment
of the requirements for the degree of
Doctor of Philosophy
Department of Community and Family Health
College of Public Health
University of South Florida
Major Professor: Robert McDermott, Ph.D.
Eric Buhi, Ph.D.
Ellen Daley, Ph.D.
John Ferron, Ph.D.
Date of Approval:
April 4, 2011
Keywords: Health Literacy, Health Communication, Quantitative Literacy, Risk
Perception Attitude Framework, Risk Communication
Copyright © 2011, Teri L. Malo
Dedication
To my parents, Jack and Linda, who inspired my interests in numeracy and health
communication.
Acknowledgements
I am very grateful to many individuals who supported me throughout my studies.
I was fortunate to have a skilled and supportive committee guiding me through my
program. Thank you to my major professor, Dr. Robert McDermott, for encouraging me
to pursue a doctorate and providing invaluable guidance and opportunities for growth.
Today I am a better writer, data analyst, and critical thinker because of you. Dr. Eric
Buhi, thank you for sharing your wisdom of secondary data analysis. Dr. Ellen Daley,
thank you for my first research assistant position at USF, which sparked my interest and
encouraged me to pursue research in cervical cancer. Dr. John Ferron, thank you for
providing insight into data analysis that only comes with years of experience, and for
being so patient with all my questions.
I am also very grateful to my parents, Jack and Linda Malo, who provided me
with unconditional love and as much emotional and tangible support as possible to help
me pursue higher education.
Dave Hogeboom, thank you for spending countless hours discussing research
ideas and providing so much insight and encouragement. I truly appreciate your
friendship and would not have grown nearly as much as I have without you.
Thank you to my cohort; I relied on you so much to help me make it through the
program, and am very thankful to have traveled on this journey with such a talented
group of women.
i
Table of Contents
List of Tables ..................................................................................................................... iv
Abstract .............................................................................................................................. vi
Chapter One: Introduction ...................................................................................................1
Statement of the Problem .........................................................................................1
Implications for Public Health .................................................................................4
Health Communication ................................................................................4
Skin cancer ...................................................................................................4
Theoretical Frameworks ..........................................................................................6
Numeracy .....................................................................................................6
Risk perception and behavior.......................................................................6
Purpose .....................................................................................................................7
Research Questions ..................................................................................................8
Significance of the Study .........................................................................................9
Delimitations ............................................................................................................9
Limitations .............................................................................................................10
Assumptions ...........................................................................................................11
Operational Definition of Key Terms ....................................................................11
References ..............................................................................................................13
Chapter Two: Review of the Literature .............................................................................17
Risk Perception ......................................................................................................17
Defining Risk .............................................................................................17
Factors Associated with Risk Perception ...................................................19
Cancer Risk Perception ..............................................................................20
Value Judgments and Risk Perception .......................................................23
Models and Theories ..................................................................................24
Risk Perceptions and Behavior ..................................................................29
Summary of Risk Perception Literature ....................................................31
Numeracy ...............................................................................................................32
Defining Numeracy ....................................................................................32
Measurement of Numeracy ........................................................................34
Objective numeracy scales .............................................................34
Subjective numeracy scales ...........................................................46
Summary of measures ....................................................................48
Socio-demographic Factors and Numeracy Level .....................................49
ii
Numeracy and Health Risk Perceptions ....................................................50
Numeracy and Comprehension of Health Risks ........................................52
Numeracy and Health Decisions ................................................................54
Numeracy and Health Outcomes ...............................................................57
Conceptual Framework ..............................................................................57
Summary of Numeracy Literature .............................................................59
Application to Public Health ..................................................................................60
Summary ................................................................................................................62
References ..............................................................................................................63
Chapter Three: Methods ....................................................................................................75
Purpose ...................................................................................................................75
Research Questions ................................................................................................75
Hypotheses .............................................................................................................75
Research Design.....................................................................................................76
Population and Sample ..........................................................................................76
Participant Recruitment .........................................................................................78
Instrument ..............................................................................................................78
Measures ................................................................................................................79
Numeracy ...................................................................................................82
Cancer Risk Perception ..............................................................................83
Self-Protective Behavior ............................................................................83
Efficacy ......................................................................................................84
Cancer History ...........................................................................................84
Health Status ..............................................................................................84
Demographic Variables .............................................................................85
Human Subjects Review ........................................................................................85
Data Analysis .........................................................................................................85
Research Question 1 ..................................................................................86
Research Question 2 ..................................................................................87
Research Question 3 ..................................................................................88
Weights ......................................................................................................89
Design Limitations .................................................................................................89
References ..............................................................................................................91
Chapter Four: Results ........................................................................................................94
Sample....................................................................................................................94
Demographics ............................................................................................96
Numeracy ...................................................................................................96
Personal Characteristics .............................................................................96
Cancer Prevention Behaviors .....................................................................97
Diagnostics .............................................................................................................97
Research Question 1 ..............................................................................................97
Objective Numeracy ..................................................................................97
Subjective Numeracy ...............................................................................104
Research Question 2 ............................................................................................110
iii
Previous Cancer Diagnosis ......................................................................110
No Previous Cancer Diagnosis ................................................................118
Research Question 3 ............................................................................................128
Chapter Five: Discussion .................................................................................................131
Summary ..............................................................................................................131
Research Question 1 ................................................................................131
Objective numeracy .....................................................................131
Subjective numeracy ....................................................................132
Research Question 2 ................................................................................132
Previous cancer diagnosis ............................................................133
No previous cancer diagnosis ......................................................133
Research Question 3 ................................................................................133
Discussion ............................................................................................................134
Implications for Public Health .................................................................148
Study Strengths ........................................................................................153
Study Limitations .....................................................................................153
Conclusions ..........................................................................................................155
Future Research .......................................................................................155
References ............................................................................................................160
iv
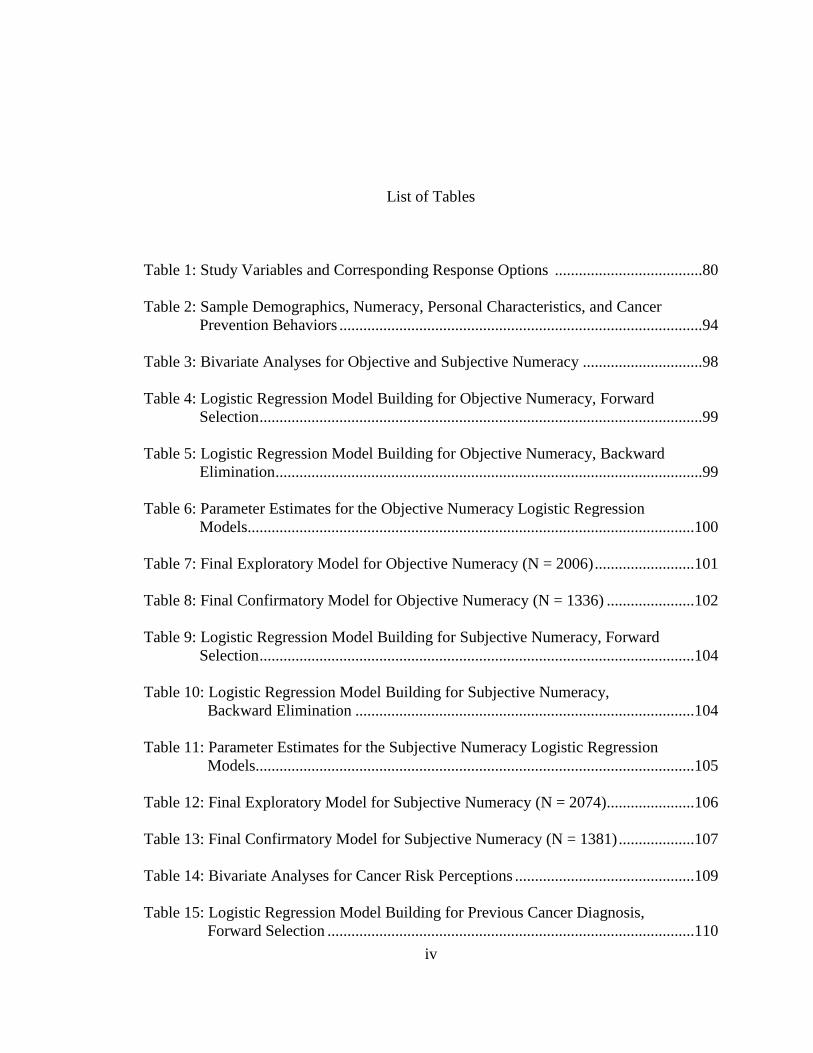
List of Tables
Table 1: Study Variables and Corresponding Response Options .....................................80
Table 2: Sample Demographics, Numeracy, Personal Characteristics, and Cancer
Prevention Behaviors ...........................................................................................94
Table 3: Bivariate Analyses for Objective and Subjective Numeracy ..............................98
Table 4: Logistic Regression Model Building for Objective Numeracy, Forward
Selection ...............................................................................................................99
Table 5: Logistic Regression Model Building for Objective Numeracy, Backward
Elimination ...........................................................................................................99
Table 6: Parameter Estimates for the Objective Numeracy Logistic Regression
Models................................................................................................................100
Table 7: Final Exploratory Model for Objective Numeracy (N = 2006) .........................101
Table 8: Final Confirmatory Model for Objective Numeracy (N = 1336) ......................102
Table 9: Logistic Regression Model Building for Subjective Numeracy, Forward
Selection .............................................................................................................104
Table 10: Logistic Regression Model Building for Subjective Numeracy,
Backward Elimination .....................................................................................104
Table 11: Parameter Estimates for the Subjective Numeracy Logistic Regression
Models..............................................................................................................105
Table 12: Final Exploratory Model for Subjective Numeracy (N = 2074)......................106
Table 13: Final Confirmatory Model for Subjective Numeracy (N = 1381) ...................107
Table 14: Bivariate Analyses for Cancer Risk Perceptions .............................................109
Table 15: Logistic Regression Model Building for Previous Cancer Diagnosis,
Forward Selection ............................................................................................110
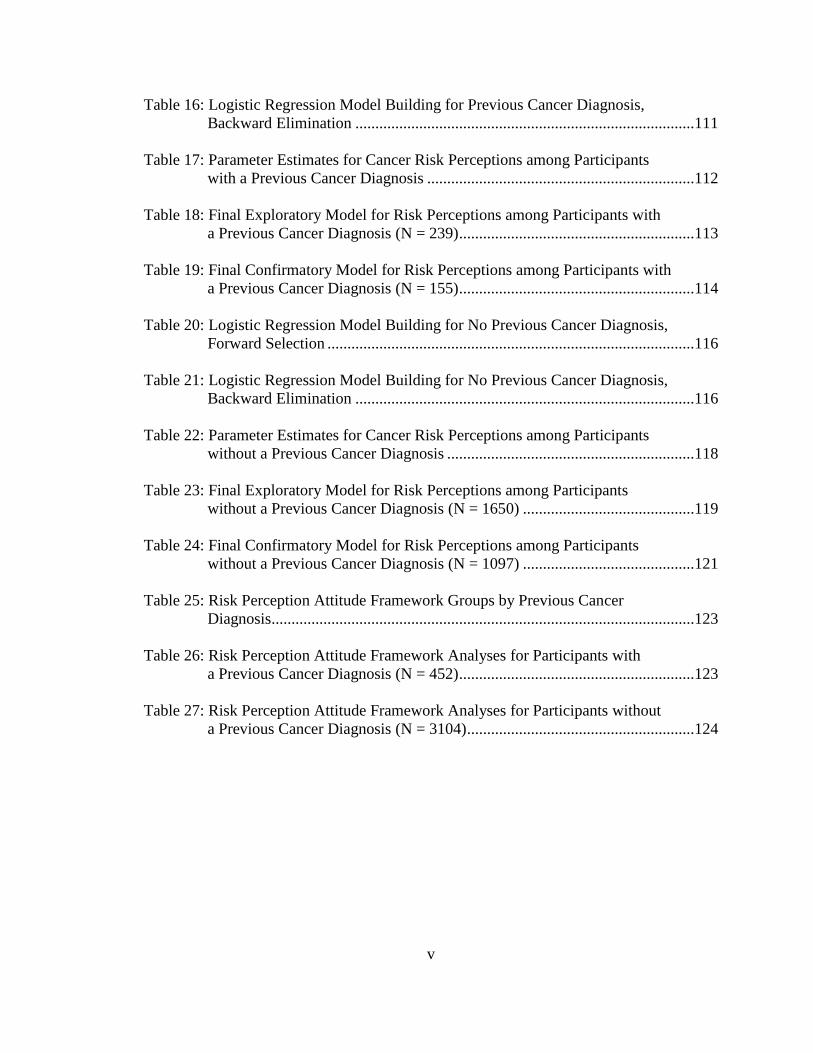
v
Table 16: Logistic Regression Model Building for Previous Cancer Diagnosis,
Backward Elimination .....................................................................................111
Table 17: Parameter Estimates for Cancer Risk Perceptions among Participants
with a Previous Cancer Diagnosis ...................................................................112
Table 18: Final Exploratory Model for Risk Perceptions among Participants with
a Previous Cancer Diagnosis (N = 239) ...........................................................113
Table 19: Final Confirmatory Model for Risk Perceptions among Participants with
a Previous Cancer Diagnosis (N = 155) ...........................................................114
Table 20: Logistic Regression Model Building for No Previous Cancer Diagnosis,
Forward Selection ............................................................................................116
Table 21: Logistic Regression Model Building for No Previous Cancer Diagnosis,
Backward Elimination .....................................................................................116
Table 22: Parameter Estimates for Cancer Risk Perceptions among Participants
without a Previous Cancer Diagnosis ..............................................................118
Table 23: Final Exploratory Model for Risk Perceptions among Participants
without a Previous Cancer Diagnosis (N = 1650) ...........................................119
Table 24: Final Confirmatory Model for Risk Perceptions among Participants
without a Previous Cancer Diagnosis (N = 1097) ...........................................121
Table 25: Risk Perception Attitude Framework Groups by Previous Cancer
Diagnosis..........................................................................................................123
Table 26: Risk Perception Attitude Framework Analyses for Participants with
a Previous Cancer Diagnosis (N = 452) ...........................................................123
Table 27: Risk Perception Attitude Framework Analyses for Participants without
a Previous Cancer Diagnosis (N = 3104) .........................................................124
vi
Abstract
Individuals have become more involved in health-related decisions, in part due to
an unprecedented access to information that can be used to enhance both physical and
mental health. Much of this health-related information is presented in a numerical format;
unfortunately, research suggests many Americans may not possess the literacy skills
necessary to comprehend numerical health-related information. More research needs to
be conducted to examine numeracy and its role in cancer risk perceptions, and how those
risk perceptions relate to cancer self-protective behaviors. The purpose of the current
study was to: (a) examine socio-demographic variables associated with numeracy, (b)
determine which factors are associated with cancer risk perceptions, and (c) apply the
Risk Perception Attitude (RPA) Framework to examine associations between risk
perception groups and cancer self-protective behaviors. The study used data from the
2007 Health Information National Trends Survey (HINTS), which was developed by the
National Cancer Institute to collect nationally representative data on the U.S. public‟s use
of cancer-related information. Logistic regression was used to assess the association
between each dependent variable and independent variables associated with each research
question. Results indicated age and education were associated with objective numeracy,
whereas age, education, and occupational status were associated with subjective
numeracy. Among participants with a previous cancer diagnosis, objective numeracy and
smoking status were associated with a somewhat high/very high perceived risk of
vii
developing cancer in the future. Age, race/ethnicity, family cancer history, smoking
status, and self-reported general health were associated with a somewhat high/very high
perceived risk of developing cancer in the future among participants without a previous
cancer diagnosis. RPA group was not significantly associated with cancer self-protective
behaviors. Findings from this study have important implications for public health,
including health communication and interventions designed to enhance health behaviors.
Future research should focus on using a full objective numeracy scale with a nationally
representative population and examining temporal relationships between cancer risk
perceptions and health behaviors.
1
Chapter One
Introduction
Statement of the Problem
Recent trends in health care have shifted the treatment paradigm from provider-
centered to shared decision-making (e.g., Apter et al., 2008). Individuals have become
more involved in health-related decisions, in part due to an unprecedented access to
information that can be used to enhance both physical and mental health (Reyna, Nelson,
Han, & Dieckmann, 2009). Much of this health-related information is presented in a
numerical format (Reyna et al., 2009); for instance, general information highlighting the
benefits of specific lifestyle changes in the reduction of cardiovascular disease risk
(Baker, 2006; Reyna et al., 2009) or statements such as “Mammograms lower a woman‟s
chance of dying from breast cancer by a third” (Woloshin, Schwartz, & Welch, 2005, p.
996). To make an informed decision, it is imperative that individuals understand the
information presented to them.
Unfortunately, research suggests many Americans may not possess the literacy
skills necessary to comprehend numerical health-related information. Results from the
2003 National Assessment of Adult Literacy (NAAL) survey suggest that 46 million U.S.
adults possess quantitative literacy skills that are below basic level (Kutner et al., 2007).
The key abilities associated with this level include locating numbers and performing
simple mathematical operations (e.g., addition). Given that risk information is much more
2
complex than simple addition, many Americans will have trouble understanding the risk
statistics needed to make an informed health-related decision.
The term numeracy has been commonly defined as one‟s skill with basic
probability and mathematical concepts (Lipkus, Samsa, & Rimer, 2001), but some argue
that it goes beyond comprehension and computation to encompass the ability to use
numeric data obtained from documents and graphics (Nelson, Reyna, Fagerlin, Lipkus, &
Peters, 2008). Research has indicated that numeracy is a construct independent of
intelligence (Reyna & Brainerd, 2007), which was further supported by a study that
found even highly educated individuals have difficulty with basic numeracy questions
(Lipkus et al., 2001). Difficulty understanding written materials containing numerical
information translates to a smaller chance that the material will have a meaningful impact
on one‟s comprehension of a given health issue, thereby impeding informed decision-
making. Moreover, low numeracy has been associated with self-reported poor health
(Baker, Parker, Williams, Clark, & Nurss, 1997) and poor disease self-management skills
(Williams, Baker, Parker, & Nurss, 1998).
Numeracy skills are essential for informed health-related decision-making
(Fagerlin et al., 2007; Reyna & Brainerd, 2007). For instance, a person diagnosed with
prostate cancer may be asked to participate in a treatment decision. Treatment options for
prostate cancer include surgery, radiation therapy, or waiting to see how the disease
progresses before choosing a treatment. To make an informed treatment decision, the
patient must be able to comprehend statistical differences in outcomes among the
treatments, as well as the chances of side effect occurrence for each treatment. Decision
aids describing the risks and benefits of each treatment are useful only if the patient is
3
able to understand the statistical information presented. Moreover, results from one study
suggest that lower health literacy levels may be related to a lower desire to participate in
the decision-making process altogether (Mancuso & Rincon, 2006).
Several health behavior theories have posited that perceived susceptibility (risk) is
associated with health behavior (Hochbaum, 1958; Weinstein, 1988; Weinstein &
Sandman, 2002). A paucity of research has been conducted to examine the association
between numeracy skills and perceptions of health risks (e.g., Schwartz, Woloshin,
Black, & Welch, 1997), but some research has linked inadequate numeracy to incorrect
estimations of personal health risks (Black, Nease, & Tosteson, 1995). For instance, in a
study of women aged 40 to 50 years with no history of breast cancer (n = 145), results
indicated that participants overestimated their probability of breast cancer death within 10
years by greater than 20-fold (Black et al., 1995). In addition to overestimating their
personal risk, participants overestimated the effectiveness of screening. Although both
those lower and higher in numeracy overestimated their breast cancer risk and screening
effectiveness, those lower in numeracy made larger overestimations. This heightened
perceived risk may motivate individuals to get screened, or it may induce a defensive
avoidance reaction that will prompt individuals to minimize the threat and avoid
screening (Witte, 1992). It is proposed that individuals with higher numeracy skills have
more accurate perceptions of health risks and may be more likely to engage in behaviors
that lower their chances of risk than their lower numerate counterparts. The relationship
between numeracy and health risk perceptions needs to be further understood.
4
Implications for Public Health
Health Communication
Healthy People 2010 is comprised of health objectives created to achieve two
overarching health goals for the United States (U.S.): (a) increase quality of life, and (b)
eliminate health disparities (U.S. Department of Health and Human Services, n.d.). These
objectives are organized into 28 focus areas, one of which is health communication. In
recognition that individuals need information to make decisions, the goal of the health
communication focus area is to “use communication strategically to improve health.”
Health communication includes a health literacy objective aimed at improving the health
literacy of individuals with insufficient or marginal literacy skills. The current research
focuses on numeracy, the quantitative dimension of health literacy, and assists in the
identification of socio-demographic groups that could benefit from targeted interventions
to improve numeracy.
Skin Cancer
In addition to numeracy, the current research focuses on several types of cancer
including skin cancer, the most common form of cancer in the U.S. (Centers for Disease
Control and Prevention, 2010). Basal cell and squamous cell carcinomas comprise the
two most common types of skin cancer; these types are highly curable and are not tracked
by central cancer registries. The third most common type, malignant melanoma, is more
dangerous than basal cell and squamous cell carcinomas. Data from 2006 indicate that
53,919 people in the U.S. were diagnosed with melanoma of the skin, of which about
57% were men, the majority being White (U.S. Cancer Statistics Working Group, 2010).
That same year, 8,441 people died of melanoma.
5
It has been estimated that approximately 65% to 90% of melanomas are the result
of ultraviolet (UV) exposure and research suggests most skin cancers could be prevented
by avoiding UV exposure (Centers for Disease Control and Prevention, 2002). The ACS
recommendations for skin cancer prevention include: (a) covering up with clothing to
protect as much skin as possible; (b) using about an ounce of sunscreen with a minimum
sun protection factor of 30, and reapplying at least every 2 hours; (c) wearing a hat that
has at least a 2- to 3-inch brim; (d) wearing sunglasses that block UV rays; (e) limiting
direct sun exposure midday, usually from 10:00 a.m. to 4:00 p.m.; and (f) avoiding
tanning beds (American Cancer Society, 2010). Despite these recommendations, a survey
conducted by the National Cancer Institute (2010) revealed that in 2008, only 57.6% of
adults reported protecting themselves from the sun by using sunscreen, wearing
protective clothing, or seeking shade when going outside on a sunny day for more than an
hour. Moreover, the percentage of adults aged 25 and older who reported using an indoor
tanning device in the past 12 months increased from 12.9% in 2005 to 14.2% in 2008
(National Cancer Institute, 2010).
The current research has important public health implications for understanding
how numeracy is associated with perceptions of cancer risk, and how those risk
perceptions are associated with sun protection behavior. The ultimate goal of researching
the intersection of numeracy, risk perception, and sun protection behavior is to improve
quality of life by reducing skin cancer incidence.
6
Theoretical Frameworks
Numeracy
The study of numeracy is still in its infancy; consequently, there is little
information about theoretical implications of numeracy in risk perception and health
behavior. A conceptual framework for understanding the role of numeracy in medical
decision-making processes was proposed by Lipkus and Peters (2009) and is presented in
detail in Chapter 2. Although not designed specifically for risk information, it is possible
to use the framework to understand how numeracy may affect the comprehension of risk
information in the more global context of health behavior. In brief, this framework
purports that numeracy may affect how a numerical stimulus (e.g., risk information) is
perceived (e.g., the perceived magnitude of the number) and how one: (a) attends to and
thinks about the numbers, (b) attends to and seeks out numerical information about skin
cancer risk, and (c) comprehends and interprets risk, which in turn leads to health
decisions and behaviors. Numeracy may also affect the use of strategies, such as number
manipulations, which may or may not result in a more accurate understanding of the risk
information. In addition to supporting the premise that numeracy is important to health
decisions and behaviors, this framework offers some perspective on how numeracy may
play a role in comprehension and information processing related to risk.
Risk Perception and Behavior
Perceived susceptibility (risk) is an important construct in several health behavior-
related models and theories, including the Health Belief Model (HBM) (Hochbaum,
1958) and Precaution Adoption Process Model (PAPM) (Weinstein, 1988; Weinstein &
Sandman, 2002). The inclusion of a perceived susceptibility, threat, or risk construct in
7
multiple models and theories highlights the significance of this construct in
understanding self-protective behavior. Given that the dataset that was used in the current
study was not designed specifically to examine the association between risk perception
and behavior, the availability of variables to study this topic is restricted. The risk
perception attitude (RPA) framework was selected as the framework to guide this
research based on its alignment with available variables.
Building on the extended parallel process model (EPPM) (Witte, 1992), Rimal
and Real (2003) developed the RPA framework to examine the associations among
perceived risk, perceived efficacy, and several outcomes, including self-protective
motivation and behavioral intention. The RPA categorizes individuals into one of four
attitudinal groups: responsive (high perceived risk, high perceived efficacy), avoidance
(high risk, low efficacy), proactive (low risk, high efficacy), and indifference (low risk,
low efficacy). Segmenting individuals into one of these groups allows for targeted
interventions specific to the groups‟ needs. For instance, women who believe they are at
high risk for skin cancer but feel they lack the efficacy to adopt preventive behaviors may
benefit from interventions designed to impart efficacy information, whereas women with
high efficacy may not derive as much benefit from this information.
Purpose
The purpose of the current study was to: (a) examine the socio-demographic
variables associated with numeracy, (b) determine which factors are associated with
cancer risk perceptions, and (c) apply the RPA framework to examine associations
between risk perception groups and cancer self-protective behavior.
8
Research Questions
Research question 1:
What is the association of socio-demographic factors with numeracy?
Hypothesis 1:
Sex, education, ethnicity, race, age, occupational status, and marital status will be
significantly associated with numeracy.
Research question 2:
Which factors are statistically significantly associated with individuals‟ personal risk
perceptions regarding cancer in general?
Hypothesis 2:
Objective numeracy, subjective numeracy, family member cancer history, personal
cancer history, smoking status, health status, sex, education, ethnicity, race, age,
occupational status, and marital status will be significantly associated with individuals‟
personal risk perceptions regarding cancer in general.
Research question 3:
What is the association between risk perception groups and whether one engages in
cancer self-protective behavior?
Hypothesis 3:
Responsive individuals (high perceived risk, high perceived efficacy) will exhibit a
greater odds of engaging in self-protective behavior than individuals classified as
proactive, avoidant, and indifferent.
9
Significance of the Study
Previous research regarding socio-demographic factors associated with numeracy
has been limited to small or convenience samples, or both. Relatively little research has
been conducted to examine the association between numeracy and risk perceptions.
Furthermore, no published research has examined the role numeracy plays in risk
perceptions while controlling for other variables. The current study was designed to
examine the role of numeracy in risk perceptions of cancer in general, which in turn may
affect self-protective health behavior. Individuals with lower numeracy levels may
exhibit a greater misunderstanding of health risks, leading to health decisions that may
not have been made had they had a better understanding of risk (e.g., engaging in sun
protection behavior). Results may be used to inform educational interventions aimed at
enhancing understanding of risk perceptions while accounting for numeracy level. This
study also examines numeracy and cancer risk perceptions among a nationally
representative sample, enhancing generalizability of the results. The current research is
needed to help fill gaps in the numeracy and risk perception literature and to inform
interventions providing targeted information.
Delimitations
Through their sampling process, the National Institutes of Health (NIH) imposed
several delimitations on study participants. Surveys were mailed to a nationally
representative random sample of households in the U.S. and participation was requested
from all adults in that household. The cover letter mailed to households did not define
“adult” and the HINTS 2007 final report did not disclose whether any participants were
excluded from the dataset based on age. Because age 18 is the legal age of adulthood in
10
the majority of states (United States Department of Health and Human Services, 2008),
only responses from individuals aged 18 or older were included in analyses. Therefore,
study results are delimited to individuals who: (a) reside in the U.S., (b) are not homeless,
(c) are not institutionalized or incarcerated, and (d) are an adult aged 18 years or older.
Limitations
Given that secondary data were used to conduct the study, the variables
representing the desired constructs were limited to those found in the dataset. For
instance, previous studies examined numeracy using an objective scale, such as the Peters
et al. (Peters, Dieckmann, Dixon, Hibbard, & Mertz, 2007) expanded numeracy scale
which assesses individuals‟ ability to convert percentages to proportions, proportions to
percentages, and probabilities to proportions, and complete more complex numeric tasks.
In contrast, only one objective item was available for analysis in the HINTS dataset; this
item assesses only individuals‟ ability to select the response option that represents the
biggest risk of getting a disease. As a result, findings are based on single-item
performance and do not mirror the depth of numeracy assessment found in previous
studies. Additionally, a cross-sectional study does not allow for the assessment of
temporality between variables; however, it allows for the examination of association
between variables, which is the focus of the current study. The current research focused
on numeracy predictors of risk perception and does not account for some non-numerical
predictors, such as subjective norm. Finally, data are limited to individuals who
completed the survey; this group may represent those with not only the highest
motivation, but also for whom the subject matter was most salient, and for whom literacy
or health literacy were not severe issues.
11
Assumptions
The current study uses data collected by researchers for the 2007 Health
Information National Trends Survey (HINTS). The research methods employed by these
researchers are briefly described in Chapter 3. Given the secondary nature of the data, the
researcher for the current study assumes the research methods protocol was followed.
Furthermore, it is assumed that:
1. Survey questions were appropriately designed to elicit intended responses from
study participants.
2. Study participants understood survey questions and responded truthfully and to
the best of their ability.
3. Survey data were correctly entered into the HINTS database.
Operational Definition of Key Terms
Cancer risk perception: Belief that one is vulnerable to cancer based on their
perceived likelihood (very low to very high) that they will develop cancer in the future.
Efficacy: Confidence in one‟s ability to perform a given task; specifically,
participants reported confidence in their ability to take good care of their health and the
extent to which they agreed that there is not much they can do to lower their chances of
getting cancer.
Health behavior (positive): Actions taken to attain or maintain good health,
including participating in recommended frequency and duration of physical activity,
consuming recommended amounts of fruits and vegetables, and refraining from smoking.
Objective numeracy: A correct response to a question regarding the risk of getting
a disease constitutes possessing basic facility with numbers.
12
Self-protective behaviors: Actions taken to protect oneself from sun exposure in
an effort to prevent skin cancer, including covering up with clothing, using sunscreen,
wearing a hat, wearing sunglasses that block UV rays, limiting direct sun exposure
midday, and avoiding tanning beds.
Subjective numeracy: Self-reported, self-assessed facility with numbers,
measured using an item regarding the degree to which one finds it easy or difficult to
understand medical statistics.
13
References
American Cancer Society. (2010). Skin cancer prevention and early detection. Retrieved
August 25, 2010, from
http://www.cancer.org/acs/groups/cid/documents/webcontent/003184-pdf.pdf
Apter, A., Paasche-Orlow, M., Remillard, J., Bennett, I., Ben-Joseph, E., Batista, R., et al.
(2008). Numeracy and communication with patients: they are counting on us.
Journal of General Internal Medicine, 23(12), 2117-2124.
Baker, D. W. (2006). The meaning and the measure of health literacy. Journal of General
Internal Medicine, 21(8), 878-883.
Baker, D. W., Parker, R. M., Williams, M. V., Clark, W. S., & Nurss, J. (1997). The
relationship of patient reading ability to self-reported health and use of health
services. American Journal of Public Health, 87(6), 1027-1030.
Black, W. C., Nease, R. F., & Tosteson, A. (1995). Perceptions of risk and screening
effectiveness in women younger than 50 years of age. Journal of the National
Cancer Institute, 87, 720-731.
Centers for Disease Control and Prevention. (2002). Guidelines for school programs to
prevent skin cancer. Morbidity and Mortality Weekly Report, 51(No. RR-4), 1-16.
Centers for Disease Control and Prevention. (2010). Skin cancer statistics. Retrieved
August 25, 2010, from http://www.cdc.gov/cancer/skin/statistics/index.htm
Fagerlin, A., Zikmund-Fisher, B. J., Ubel, P. A., Jankovic, A., Derry, H. A., & Smith, D.
M. (2007). Measuring numeracy without a math test: development of the
subjective numeracy scale. Medical Decision Making, 27(5), 672-680.
14
Hochbaum, G. M. (1958). Public participation in medical screening programs: a
sociopsychological study. PHS publication no. 572. Washington, D.C.:
Government Printing Office.
Kutner, M., Greenberg, E., Jin, Y., Boyle, B., Hsu, Y., Dunleavy, E., et al. (2007).
Literacy in everyday life: results from the 2003 National Assessment of Adult
Literacy (NCES 2007-480). U.S. Department of Education. Washington, DC:
National Center for Education Statistics.
Lipkus, I., & Peters, E. (2009). Understanding the role of numeracy in health: proposed
theoretical framework and practical insights. Health Education & Behavior,
36(6), 1065-1081.
Lipkus, I. M., Samsa, G., & Rimer, B. K. (2001). General performance on a numeracy
scale among highly educated samples. Medical Decision Making, 21(1), 37-44.
Mancuso, C., & Rincon, M. (2006). Asthma patients' assessments of health care and
medical decision making: the role of health literacy. Journal of Asthma, 43(1), 41-
44.
National Cancer Institute. (2010). Cancer trends progress report -- 2009/2010 update.
Retrieved August 25, 2010, from
http://progressreport.cancer.gov/doc_detail.asp?pid=1&did=2009&chid=91&coid
=911&mid=
Nelson, W., Reyna, V. F., Fagerlin, A., Lipkus, I., & Peters, E. (2008). Clinical
implications of numeracy: theory and practice. Annals of Behavioral Medicine,
35(3), 261-274.
15
Peters, E., Dieckmann, N., Dixon, A., Hibbard, J. H., & Mertz, C. K. (2007). Less is
more in presenting quality information to consumers. Medical Care Research and
Review, 64(2), 169-190.
Reyna, V. F., & Brainerd, C. J. (2007). The importance of mathematics in health and
human judgment: numeracy, risk communication, and medical decision making.
Learning and Individual Differences, 17(2), 147-159.
Reyna, V. F., Nelson, W. L., Han, P. K., & Dieckmann, N. F. (2009). How numeracy
influences risk comprehension and medical decision making. Psychological
Bulletin, 135(6), 943-973.
Rimal, R. N., & Real, K. (2003). Perceived risk and efficacy beliefs as motivators of
change: use of the risk perception attitude (RPA) framework to understand health
behaviors. Human Communication Research, 29(3), 370-399.
Schwartz, L. M., Woloshin, S., Black, W. C., & Welch, H. G. (1997). The role of
numeracy in understanding the benefit of screening mammography. Annals of
Internal Medicine, 127(11), 966-972.
U.S. Cancer Statistics Working Group. (2010). United States Cancer Statistics: 1999–
2006 Incidence and Mortality Web-based Report. Atlanta (GA): Department of
Health and Human Services, Centers for Disease Control and Prevention, and
National Cancer Institute. Retrieved August 25, 2010, from
http://www.cdc.gov/uscs
U.S. Department of Health and Human Services. (n.d.). Healthy People 2010. Retrieved
November 17, 2007, from http://www.health.gov/healthypeople/
16
United States Department of Health and Human Services. (2008). Office for Human
Research Protections (OHRP) informed consent frequently asked questions.
Retrieved August 25, 2010, from http://www.hhs.gov/ohrp/informconsfaq.html
Weinstein, N. D. (1988). The precaution adoption process. Health Psychology, 7(4), 355-
386.
Weinstein, N. D., & Sandman, P. M. (2002). The precaution adoption process model. In
K. Glanz, B. K. Rimer & F. M. Lewis (Eds.), Health Behavior and Health
Education: Theory, Research and Practice (3rd ed., pp. 121-143). San Francisco:
Jossey Bass.
Williams, M. V., Baker, D. W., Parker, R. M., & Nurss, J. R. (1998). Relationship of
functional health literacy to patients' knowledge of their chronic disease. Archives
of Internal Medicine, 158(2), 166-172.
Witte, K. (1992). Putting the fear back into fear appeals: the extended parallel process
model. Communication Monographs, 59(4), 329-349.
Woloshin, S., Schwartz, L. M., & Welch, H. G. (2005). Patients and medical statistics:
interest, confidence, and ability. Journal of General Internal Medicine, 20(11),
996-1000.
17
Chapter Two
Review of the Literature
This chapter details the available published literature on risk perception and
numeracy, and how these topics intersect to apply to a specific health behavior. An
overview of risk perceptions is provided, including factors associated with risk
perceptions, value judgments, health behavior models and theories with a perceived risk
component, and the association between risk perception and behavior. Next, numeracy is
discussed, including definitions of numeracy, measurement, socio-demographic factors
associated with numeracy, the association with health risk perceptions, comprehension of
health risks, health decisions and outcomes, and a theoretical framework for numeracy in
health decisions and behaviors. The chapter concludes with a discussion of how
numeracy and risk perceptions apply to a public health issue, specifically skin cancer.
Risk Perception
Defining Risk
Numerous definitions exist for the concept of risk. Perhaps one of the simplest
definitions was proposed by the British Medical Association (1990): “risk is the
probability that something unpleasant will happen” (p. 14). This definition highlights the
uncertainty of an event occurring, but that it will have negative consequences if it does
(Berry, 2004). In 1983, the Royal Society Study Group made the distinction between the
risk itself and resultant harm experienced (Adams, 1995). This group further defined
18
detriment as a “numerical measure of the expected harm or loss associated with an
adverse event…It is generally the integrated product of risk and harm and is often
expressed in terms such as cost in pounds, loss in expected years of life or loss of
productivity, and is needed for numerical exercises such as cost-benefit analysis or risk-
benefit analysis” (Adams, 1995, p. 8). As this definition indicates, whereas risk is often
defined objectively, other definitions emphasize its subjective nature. For instance, when
using the term risk, social scientists tend to emphasize the ways individuals and groups
identify and respond to risk (Berry, 2004).
Bogardus and colleagues (1999) identified five basic dimensions of risk: identity,
permanence, timing, probability, and value. Identity refers to the identification of
pertinent unwanted outcomes; these risks may be known or unknown, and are often
determined by the activity that provokes the risk. For instance, risk of injury resulting
from playing sports is known, whereas the risk resulting from taking a new therapeutic
drug may be unknown. Permanence or duration of an unwanted outcome may guide risk-
taking behavior. Outcomes may be permanent or transient. Based on the perceived
benefit of an activity, individuals may be willing to accept the high chance of an adverse
outcome if it is transient rather than permanent. Timing refers to when the outcome is
expected to occur, ranging from the near future to distant future. Regarding healthcare
decisions, cost-effectiveness models assume that present time is more valuable than
future time; therefore, future benefit is “discounted.” On the other hand, the preference
for something happening in the near future versus the distant future varies by individual.
Probability, or the likelihood of an outcome, is different for each individual. Moreover, it
can be difficult to communicate in a comprehensible manner, and a distinction must be
19
made between risk from a single exposure versus cumulative risk from multiple
exposures. The fifth and arguably the most important dimension to individuals is value,
which refers to the rating of the adverse outcome. Individual ratings will vary; what one
individual may deem tragic may be seen as relatively inconsequential when considering
impact on overall quality of life.
Factors Associated with Risk Perception
Risk can be evaluated using objective measures such as scales or other
instruments; however, individuals also use numerous subjective elements to shape their
perceptions of risk. Most people rely on intuitive risk judgments, or risk perceptions, to
assess hazards (Berry, 2004). Risk perceptions are thought to be influenced by gender
and world views (Caan & Hillier, 2006), the latter comprising a synthesis of one‟s
beliefs, attitudes, feelings, judgment, and social or cultural values assigned to a hazard
(Pidgeon, Hood, Jones, Turner, & Gibson, 1992). Research has shown that compared to
women, men tend to judge risks as smaller and less problematic, perhaps due to
biological and social factors (Caan & Hillier, 2006). World views include fatalism
towards control over health risks, and have been strongly linked to risk perceptions (Caan
& Hillier, 2006; Peters & Slovic, 1996).
Researchers have identified several “fright factors” associated with how
individuals perceive risk (Bennett & Calman, 2001). These researchers have found that
risks tend to be more worrisome, and therefore, less acceptable if perceived to be: (a)
involuntary, (b) inescapable or under the control of others, (c) unfamiliar, (d) inequitably
distributed, (e) poorly understood by science, (f) dreadful, (g) the source of potentially
hidden and irreversible effects, and (h) man-made rather than resulting from natural
20
sources (i.e., “acts of God”). Additionally, a risk is less acceptable if its victims are
identifiable rather than anonymous. The aforementioned factors are interdependent rather
than additive and it is unclear which factors are most important and for whom (Bennett &
Calman, 2001).
Cancer Risk Perception
Several studies have examined the association between socio-demographic
variables and cancer risk perceptions. Vernon (1999) reviewed 12 studies that examined
correlates of perceived risk for breast, colorectal, or “any” type of cancer. Most studies
were cross-sectional, but two of these studies involved data collected during at least two
time points. Measures of perceived risk varied; whereas some investigators asked
participants to compare their risk to a reference group (i.e., relative risk), other
researchers asked participants to rate their lifetime risk of cancer or their risk of
developing cancer over a specified time period. It is important to note that most of these
studies were limited by small samples, ones of convenience, or ones involving only
specific sub-populations, such as certain age groups or first degree relatives (FDRs) of
cancer patients.
Vernon‟s (1999) review demonstrated inconsistent results about the correlates of
perceived cancer risk, which may be a reflection of the different types of cancer studied
or the aforementioned sampling limitations. The studies supported association between
perceived risk of developing cancer and the following factors: age (Lipkus, Rimer, &
Strigo, 1996), race (Audrain et al., 1995; Vernon, Vogel, Halabi, & Bondy, 1993),
employment (Helzlsouer, Ford, Hayward, Midzenski, & Perry, 1994), having a relative
with cancer (Helzlsouer et al., 1994; Lipkus et al., 1996; Vernon et al., 1993), self-
21
reported health status (Helzlsouer et al., 1994), and cigarette smoking (Audrain et al.,
1995; Helzlsouer et al., 1994; Lipkus et al., 1996; Vernon et al., 1993). Other studies did
not find support for age (Audrain et al., 1995; Helzlsouer et al., 1994; Vernon et al.,
1993), having a relative with cancer (Audrain et al., 1995), and self-reported health status
(Lipkus et al., 1996). Additionally, Helzlsouer et al. (1994)found differences between
men and women regarding significant associations between perceived risk and
employment, relative with cancer, and self-rated health.
Additional support for the association between socio-demographic variables and
perceived cancer risk comes from Kim et al. (2008), who conducted a study in which
women (n = 1160) aged 50 to 80 years were interviewed about their perceived lifetime
risk of cancer. The diverse sample was comprised of 29% White, 14% African American,
21% Latina, and 36% Asian women. Perceived lifetime risk for breast, cervical, and
ovarian cancer was measured using three questions, one for each cancer site: “What
would you say is your risk of getting (cervical/breast/colorectal) cancer?” Five response
choices were presented, ranging from no risk to high/very high risk. Nearly 60% of the
women reported their lifetime risk of getting cervical cancer to be no risk or very low
risk, whereas about 42% of women reported no risk or very low risk for breast and colon
cancer. Compared to White women, Asian women had the lowest risk perception and
Latina women had the highest risk perception for each cancer site. Ethnicity remained a
significant predictor of risk perceptions after controlling for other socio-demographic
variables. Participants with a self-reported personal or family history of cancer had a
higher perceived risk for breast and colon cancer. Those who reported poor health had a
higher perceived risk for each cancer site. Higher perceived risk for cervical cancer was
22
observed for those who reported a household income of more than $50,000. The
researchers did not find an association between perceived risk and age, education, marital
status, employment, insurance coverage, or numeracy.
Another study of correlates of perceived cancer risk used an earlier version of the
survey used in the proposed study. Stark and colleagues (2006) studied factors associated
with perceived risk of colorectal cancer (CRC) in a sample of 1,646 men and women
aged 50-75 years. Perceived risk for CRC was measured using two items from the
National Cancer Institute‟s Health Information National Trends Survey (HINTS): (a)
“What is the chance that you will develop colon cancer in the future? very low; fairly
low; moderate; fairly high; very high” and (b) “Compared with the average person your
age, would you say that you are: more likely to get colon cancer, less likely or about as
likely?” Scores were summed to create an ordinal perceived risk score. A multiple
regression model was used to control for socio-demographic covariates and interaction
terms between covariates and personal history of polyps and family history of CRC.
Family history modified the association between perceived risk and both age and
insurance. Individuals with a family history had a higher perceived risk for CRC than
those without a family history, but the observed difference was greater for those in the
low-income stratum compared to other income groups. After controlling for other
covariates, only self-reported health status (p < .01), personal history of another cancer (p
= .01), CRC worry (p < .0001), and being up-to-date on American Cancer Society
(ACS)-preferred screening guidelines (p = .05) remained significantly associated with
perceived risk for CRC in the multivariate analysis. Education and income did not remain
significantly associated with perceived risk.
23
Again, it is important to note that because studies did not measure perceived risk
of cancer uniformly, it is difficult to make direct comparisons. Additionally, most studies
were cross-sectional and did not allow for speculation regarding temporality between
independent and dependent variables; however, factors such as race/ethnicity and family
history are unlikely to result from perceived risk, suggesting they are likely to influence
perceived risk.
Value Judgments and Risk Perception
Risk is inherent in nearly every activity, yet individuals continue to engage in
these activities because the risk is deemed acceptable. Responses to risk are often
intertwined with personal values (Adams, 1995). Calman (1998) identified five basic
values relevant to health: autonomy, justice, beneficence, non-malevolence, and utility.
There is a great deal of variation across individuals regarding values held and meaning
they attach to risks (Berry, 2004). For instance, racecar drivers willingly accept that there
is some degree of risk associated with racing, yet perhaps they place a high value on
personal autonomy to the extent that the benefits of autonomy outweigh the risks of
racing. Furthermore, fright factors may be good indicators of the general public‟s
response to risk, but are weak predictors of individual responses because of differences in
value systems and personalities.
What may be deemed a relatively unimportant risk to one individual may be
unacceptable to another (Berry, 2004). In the context of skin cancer, some individuals
exposing themselves to UV rays may not be especially concerned about the possibility of
developing skin cancer because they value the “benefits” of a suntan much more. They
may not be receptive to risk messages regarding skin cancer because they value the
24
societal benefits of a “healthy glow.” Conversely, other individuals may consider the
increased risk of skin cancer unacceptable and consider the risks of skin cancer to
outweigh the benefits of having a tan.
In summary, Lowrance (1976) notes: “Since the taking of both personal and
societal risks is inherent in human activity, there can be no hope of reducing all risks to
zero. Rather, as when steering any course, we must continuously adjust our heading so as
to enjoy the greatest benefit at the lowest risk cost” (p. 11).
Models and Theories
What follows is a brief description of several models and theories that propose an
association between perceived risk and health behavior. Included in this review are the
Health Belief Model, the Precaution Adoption Process Model, the Extended Parallel
Process Model, and the risk perception attitude framework
The Health Belief Model (HBM) (Hochbaum, 1958) is one of several theories
used in health promotion in which perceived susceptibility (risk) is an important
construct. The HBM is a value-expectancy theory whereby behavior results from the
subjective value of an outcome and the expectation that engaging in a specific activity
will produce that outcome (Janz, Champion, & Strecher, 2002). The HBM posits that
individuals will act to prevent, screen for, or control adverse health conditions if they
believe they are susceptible to the condition, they consider the condition to have serious
consequences, they believe that an action would be beneficial in reducing susceptibility
or severity, and if they think the barriers to taking action are outweighed by the benefits
(Janz et al., 2002). Although not systematically studied, cues to action (e.g., media
publicity) may also be important in determinant of health behavior. Self-efficacy, defined
25
as “the conviction that one can successfully execute the behavior required to produce the
outcomes” (Bandura, 1977, p. 193) was later added to the HBM. Health-related behavior
may also be indirectly affected by socio-demographic and other variables; factors such as
educational attainment may influence perceptions of benefits, barriers, severity, and
susceptibility.
The HBM has been used in numerous health behavior studies, including those
pertaining to cancer screening behaviors. For example, Champion and Menon (1997)
used HBM constructs in an examination of mammography and breast self-examination
(BSE) among African-American women (n = 328). Logistic regression results indicated
that mammography compliance was significantly associated with perceived barriers to
mammography, with women more likely to be compliant with mammography if they
perceived fewer barriers to screening. After controlling for other variables, BSE
frequency was significantly associated with perceived benefits and barriers, and BSE
proficiency was significantly associated with perceived susceptibility.
In addition to cancer screening, the HBM has been used to study self-protective
behaviors. Steers et al. (1996) surveyed undergraduate students at six universities (n =
424) about HIV/AIDS. Regression analyses indicated a statistically significant
association between perceived susceptibility to HIV/AIDS and behavior changes,
including increased condom use and decreased number of sexual partners. These findings
highlight the importance of perceived susceptibility in self-protective health behaviors.
Another intrapersonal theory of health behavior is the Precaution Adoption
Process Model (PAPM), a stage theory designed to help explain why and how individuals
make a decision to make changes in habitual patterns (Weinstein, 1988; Weinstein &
26
Sandman, 2002). The model is comprised of seven stages ranging from being unaware of
the issue to action and maintenance. Similar to the HBM, perceived susceptibility (or
perceived personal likelihood) is a factor that often influences the decision regarding a
course of action. Interestingly, Weinstein (1987) found that people are unwilling to
accept personal susceptibility to an adverse condition despite an acknowledgement of risk
faced by others, a phenomenon known as optimistic bias. Consequently, a challenge to
health promotion efforts is to help people accept personal susceptibility and modify
behavior accordingly.
PAPM constructs have been used to guide an intervention for a study on the
effects of colon cancer risk counseling for first-degree relatives (Glanz, Steffen, &
Taglialatela, 2007). The PAPM was used to develop a personalized intervention entailing
an individual counseling session, tailored print materials, and follow-up calls. The
counseling session and print materials were used to make participants aware of their
personal risk of developing colorectal cancer, and the benefits of and barriers to
screening. Participants were also provided with an action planning form. The follow-up
calls were used to review the action plans, reinforce risk information, and options for
reducing colorectal cancer risk. Compared to a general health counseling intervention
(control group), participants rated the personalized intervention better in terms of the
amount and usefulness of information. Moreover, the personalized intervention led to a
17% increase in screening adherence among those who were nonadherent at baseline.
The Extended Parallel Process Model (EPPM) (Witte, 1992) is a framework based
on fear appeals and suggests that when individuals are presented with a risk message,
they will engage in two appraisal processes: perceived efficacy and perceived threat.
27
Essentially, perceived threat motivates action and perceived efficacy determines whether
individuals will make behavioral changes to control the danger, or use psychological
defense mechanisms (e.g., avoidance) to control their fear.
The EPPM has been used as a theoretical guide for examining the relationship
between cancer information avoidance and cancer fear and fatalism (Miles, Voorwinden,
Chapman, & Wardle, 2008). Results indicated direct and indirect effects of both cancer
fear and fatalism on information avoidance. Overall, individuals with higher levels of
cancer fear and fatalism were more likely to avoid cancer-related information and may
miss information regarding positive developments in cancer control.
Building on the EPPM, Rimal and Real (2003) developed the risk perception
attitude (RPA) framework to examine the association between perceived risk and
behavior. Contrary to the EPPM, the RPA conceptualizes risk perception as a property of
the individual rather than of the message presented to individuals. In addition, the RPA
personalizes risk perception based on individuals‟ history and previous behaviors. The
RPA categorizes individuals into one of four attitudinal groups: responsive (high risk,
high efficacy), avoidance (high risk, low efficacy), proactive (low risk, high efficacy),
and indifference (low risk, low efficacy). Segmenting individuals into one of these groups
allows for targeted interventions specific to the groups‟ needs. For instance, women who
believe they are at high risk for skin cancer but feel they lack the efficacy to adopt sun
protection behaviors may benefit from interventions designed to impart efficacy
information.
Rimal and Real (2003) proposed that groups would differ in their self-protective
motivation, intention to seek information, behavioral intention, knowledge acquisition,
28
and time spent seeking information. The inclusion of information-seeking activities as a
form of self-protective behavior stems from the researchers‟ observation that these
activities typically are neglected in health behavior theories; however, steps individuals
take to inform themselves about prevention, early detection, and access to care all
represent important behaviors. The lack of attention to these behaviors in other theories
may be because these behaviors result in increased knowledge, which is often considered
a low effect. On the other hand, increasing information-seeking behaviors may be an
important outcome of health interventions as these behaviors are likely to remain
effective after the program has ended (Rimal, Flora, & Schooler, 1999).
Rimal and Real (2003) conducted two studies to test the RPA framework. In the
first study, they manipulated participants‟ (n = 182) perceived risk and efficacy beliefs in
the context of skin cancer. Results indicated that risk manipulation, but not efficacy,
affected self-protective motivation, information-seeking, and behavioral intentions. In the
second study, the researchers examined participants‟ (n = 323) information-seeking and
self-protective behaviors in the absence of variable manipulation. Results pointed to a
joint effect of risk and efficacy on information-seeking and behaviors. Overall, more
positive health outcomes were observed among those with greater efficacy beliefs than
those with lower efficacy beliefs. Study findings support the utility of the RPA
framework as a tool for developing targeted health interventions.
Sullivan et al. (2008) tested the RPA framework‟s ability to predict nutrition-
related cancer prevention cognitions and behavioral intentions, using data from the 2003
HINTS. Individuals were classified into one of the four RPA groups, and analyses were
conducted to test differences in groups‟ cognitions and behavioral intentions. With regard
29
to cognitions, perceived cancer prevention efficacy, but not risk, was an important
determinant of nutrition-related cognitions. Regarding behavioral intentions, efficacy
moderated the effect of risk perceptions. When perceived risk was high, perceived
efficacy increased intentions; however, efficacy did not have an impact on intentions
when perceived risk was low. Sullivan et al. (2008) concluded that the RPA framework is
useful for studying cancer prevention-related behavior change.
The aforementioned models and theories highlight the significance of perceived
risk in self-protective behavior. Given that the dataset used in the current study was not
designed specifically to examine the association between risk perception and behavior,
the availability of variables to study this topic is not comprehensive. That limitation
notwithstanding, the RPA framework was selected as the framework to guide this study
of perceived cancer risk and skin cancer prevention behaviors based on its alignment with
available variables.
Risk Perceptions and Behavior
As suggested by the theories and models reviewed above, there is some empirical
evidence to support the unique contribution of risk perceptions in the study of health
behaviors. Brewer et al. (2007) noted that previous research has found positive, negative,
and no relationship between risk perceptions and behavior, and that effect sizes found for
risk perceptions tend to be small in meta-analyses. The researchers purport that
inappropriate assessment and analyses make the association appear weak. In response to
these limitations, the researchers conducted a meta-analysis assessing the relationship
between vaccination behavior and perceived illness likelihood, susceptibility, and
severity, while taking into account factors that may modify the strength of the
30
relationships. Results indicate that higher perceived likelihood of illness was associated
with obtaining vaccination, with a moderate pooled effect size (r = .26) that was
statistically different from zero (p < .001). Perceived susceptibility was also associated
with vaccination, with a moderate pooled effect size (r = .24) that was significantly
different from zero (p < .001). These results indicate consistent relationships between risk
perceptions and vaccination behavior, with effect sizes larger than reported in previous
studies. The findings provide empirical support for the inclusion of risk perceptions in
models and theories of health behavior.
Some research specific to cancer risk perceptions and cancer prevention behavior
has been conducted, including a study of colon cancer screening by Kim et al. (2008).
After controlling for demographic factors and cancer history in a sample of ethnically
diverse women, the researchers found risk perception for colon cancer to be positively
associated with screening. Specifically, a greater odds of having a colonoscopy in the last
10 years (OR, 2.8; 95% CI, 1.4-5.4) was observed among women who reported a
moderate to very high risk perception for colon cancer. Perceived lifetime risk of breast
and cervical cancer was not significantly associated with screening behavior. These
findings should be weighed in light of the fact that these participants had a higher
screening rate than the national average, which may be because the women are
established patients and visited a clinic in the past two years. Additionally, culture may
affect cancer risk perception and screening behavior (Kim et al., 2008), but these
measures were not studied.
Risk perceptions and behavior were also studied in the context of skin cancer.
Pichon et al. (2010) studied African American adults‟ perceived risk of skin cancer and
31
sunscreen use (n = 1932). Perceived skin cancer risk was assessed using the following
question: “On a scale of 0 to 100, what do you think you your chances of getting skin
cancer are, where 0 is no chance of getting skin cancer, and 100 means you will definitely
get it?” Sunscreen use was assessed by asking participants: “During the summer months,
when you are out in the sun for more than 15 minutes, how often do you use sunscreen
with a sun protection factor (SPF) of 15 or higher?” Response choices ranged from never
to always, and responses were later collapsed into always vs. other use. The mean
perceived risk of skin cancer was 16.11 (SD = 23.87), with 46% of participants stating
their risk was 0%. In contrast to studies of Whites, perceived risk of skin cancer was not
significantly associated with sunscreen use among African Americans.
Brewer and colleagues (2007) proposed that the importance of risk perception in
health behaviors may vary by the specificity of the particular health-related action. They
suggested that risk perceptions may be more important for behaviors intended to reduce a
specific health threat, such as sunscreen use, than behaviors associated with a wide range
of health and non-health outcomes, such as physical activity. Moreover, risk perceptions
may be more important in behavioral decisions when external influences are dispersed
compared to strong external influences (e.g., physician recommendation). More research
is needed to support the association between risk perceptions and sun protection
behaviors, including sunscreen use.
Summary of Risk Perception Literature
In summary, numerous factors are associated with how individuals perceive risk,
yet it is unclear which factors are most important, and for whom, and under what
circumstances. Moreover, it appears factors associated with perceived risk may vary
32
across health behaviors, warranting behavior-specific research. Finally, more research
needs to be conducted with emerging correlates of risk perceptions.
Numeracy
Defining Numeracy
Although various definitions exist, Healthy People 2010 defines health literacy as
“the degree to which individuals have the capacity to obtain, process, and understand
basic health information and services needed to make appropriate health decisions” (U.S.
Department of Health and Human Services, n.d.). Health literacy includes both basic
reading and numerical skills, the latter often referred to as numeracy. A relatively broad
definition, the Merriam-Webster online dictionary (Merriam-Webster Incorporated, n.d.)
defines numeracy as “the capacity for quantitative thought and expression.” Numeracy
has been defined in various ways, which is likely the result of differences in domains of
study (Reyna, Nelson, Han, & Dieckmann, 2009). Researchers in healthcare tend to be
interested in individuals‟ ability to understand risks and benefits of medical treatments.
Given that these risk and benefits are often expressed in proportions, probabilities, and
percentages, numeracy is often defined as the ability to understand these forms of
quantitative expression (Burkell, 2004).
Different definitions for numeracy exist even within health and risk
communication-related research literature. Numeracy has been defined as “the ability to
process basic probability and numerical concepts” (Peters et al., 2006, p. 407) and “the
ability to think about and interpret probabilities, fractions, and ratios” (Fagerlin, Ubel,
Smith, & Zikmund-Fisher, 2007). These researchers have specifically noted the concept
of probability in their definitions; this inclusion of probability may stem from the
33
researchers‟ focus on risk communication, which often includes the presentation of
probabilities and ratios.
Golbeck et al. (2005) offer yet another definition for numeracy, this time with
specificity to health numeracy. They define health numeracy as “the degree to which
individuals have the capacity to access, process, interpret, communicate, and act on
numerical, quantitative, graphical, biostatistical, and probabilistic health information
needed to make effective health decisions” (p. 375). This definition combines features of
the Healthy People 2010 definition of health literacy with a broad definition of numeracy
proposed by Evans (2000). Golbeck and colleagues‟ definition of health numeracy
acknowledges that health numeracy is on a continuum, rather than a dichotomy of being
functional or not. Additionally, it emphasizes that health numeracy is not just about
understanding, but also functioning on numeric concepts.
Golbeck et al. (2005) further provide an operational framework for health
numeracy. They describe four functional categories of health numeracy and the
corresponding skills individuals should have to function in today‟s health care system.
The four categories include basic, computational, analytical, and statistical health
numeracy. Basic health numeracy includes the identification of numbers and making
sense of these quantitative data. Basic skills require no manipulation of numbers; for
example, the ability to use a prescription label on a pill bottle to determine the number of
pills to take. Computational health numeracy refers to the ability to count, compute, and
manipulate numbers to function in everyday health situations. An example of
computational skills is using a nutritional label to determine the number of calories
consumed based on a specified number of food servings. Analytical health numeracy
34
refers to the ability to make sense of information, plus concepts such as proportions,
percentages, and frequencies. For example, analytical health literacy includes an
understanding of basic graphs. Statistical health numeracy involves comprehension of
probability statements, the ability to compare information presented in different scale
formats (e.g., proportion, percent), and critical analysis skills to analyze health
information such as risk. For instance, individuals with adequate statistical numeracy
skills would be able to understand the difference between relative and absolute risk, and
use this information to make health decisions. Other proposed definitions of numeracy
seemed to be aligned with statistical health numeracy.
The discrepancy between varying definitions of numeracy and health numeracy
may complicate study comparisons. For instance, the National Assessment of Adult
Literacy (NAAL) survey adhered more closely to the Merriam-Webster dictionary
definition and assessed individuals‟ “knowledge and skills required to perform
quantitative tasks” (Kutner et al., 2007, p. 2). Therefore, the national estimates of
quantitative innumeracy are based on individuals‟ ability to apply arithmetic operations
and do not specifically measure ability to process and interpret probabilities. Another
problem with some researchers‟ definitions is the inclusion of the vague term basic. It is
unclear what constitutes basic and how to interpret this idea of skill with basic
probability and mathematical concepts.
Measurement of Numeracy
Objective numeracy scales. Researchers have assessed individuals‟ numeracy
using both objective and subjective scales. One of the first attempts at measuring
individuals‟ basic understanding of risk was undertaken by Black, Nease, and Tosteson
35
(1995). These researchers measured numeracy using one item asking participants how
many times a fair coin would come up heads in 1,000 tosses. Participants were deemed
numerate if based on a correct response to this question and logically consistent
responses to other questions about the probability of breast cancer development or death.
Schwartz , Woloshin, Black, and Welch (1997) used a quantitative approach to
examine the association between numeracy and understanding the benefit of screening
mammography. The researchers employed a randomized, cross-sectional survey design
and sampled 500 female veterans whose names were drawn from a New England
registry. Numeracy was assessed with three questions that measured basic familiarity
with probability, asked participants to convert a percentage to a proportion, and asked
participants to convert a proportion to a percentage:
Imagine that we flip a fair coin 1,000 times. What is your best guess about how
many times the coin would come up heads in 1,000 flips? _____times out of
1,000.
In the BIG BUCKS LOTTERY, the chance of winning a $10 prize is 1%. What
is your best guess about how many people would win a $10 prize if 1000 people
each buy a single ticket to BIG BUCKS? _____person(s) out of 1,000.
In ACME PUBLISHING SWEEPSTAKES, the chance of winning a car is 1 in
1,000. What percent of tickets to ACME PUBLISHING SWEEPSTAKES win a
car? _____%.
Scores were calculated as the total number of correct responses. Numeracy was
compared to participants‟ accuracy regarding application of risk reduction data. Accuracy
36
was strongly associated with numeracy, with higher numeracy scores linked to greater
accuracy in applying risk reduction data and gauging the benefit of mammography.
The study conducted by Schwartz et al. (1997) is one of the first to offer insight
into the relationship between numeracy and understanding the benefit of a screening
procedure; however, there are several study limitations. First, instrument validity and
reliability was not discussed, which raises questions regarding the extent to which the
instrument used is measuring numeracy, particularly with only three questions. The
authors did not discuss how these questions were developed nor whether they were pilot
tested. Reliability was later described in a review of numeracy measures more than a
decade after the original publication (Reyna et al., 2009). Based on a personal
communication with the instrument developers, Reyna and colleagues (2009) ascertained
that internal consistency reliability ranged between .56 and .80, and test-retest reliability
was .72. Additionally, the items are presented in a format that requires one to be able to
read and comprehend the question in order to provide a response. Therefore, it appears
that one‟s overall literacy impacts the ability to respond correctly to questions intended to
measure numeracy, thereby making it difficult to ascertain the unique contribution of
numeracy to a correct response. Finally, the results of this study should be reviewed in
light of limitations pertaining to the sample, which consisted of female veterans who
reported higher income and education levels compared with the general U.S. female
population. Higher income and education have been associated with higher levels of
numeracy; however, the sample was also older than the general population, which is
associated with lower numeracy.

37
Other studies used the Schwartz et al. (1997) scale to study numeracy (Estrada,
Barnes, Collins, & Byrd, 1999; Woloshin, Schwartz, Byram, Fischhoff, & Welch, 2000;
Woloshin, Schwartz, Moncur, Gabriel, & Tosteson, 2001). Generalizability of the
findings was limited by convenience samples, small samples, gender, age, health status,
education, or combinations of these variables. An interesting finding across studies is the
range of correct responses among the samples, given that participants reported relatively
high education. In the Woloshin et al. (2001) study, approximately two-thirds of
participants had numeracy scores less than three, compared to roughly 84% of female
veterans (Schwartz et al., 1997), 46% of faculty and students at Carnegie Mellon
University (Estrada et al., 1999), and 40% of medical staff attending grand rounds
(Woloshin et al., 2000). Although lower education levels are associated with lower
numeracy levels, it appears that even highly educated individuals can attain low scores on
numeracy scales.
Lipkus, Samsa, and Rimer (2001) researched performance on a numeracy scale
completed by highly educated samples. The researchers examined three independent
samples: Samples 1 and 2 consisted of 124 and 121 women, respectively, and Sample 3
included 87 men and 161 women. Participants were aged 40 and older, and most were
White, well-educated, and non-smokers. The researchers used the three-item general
numeracy scale created by Schwartz et al. (1997) and added seven numeracy scale items.
Instead of the question concerning the coin flip, the first item of the three-item scale was
modified to read: “Imagine that we rolled a fair, six-sided die 1,000 times. Out of 1,000
rolls, how many times do you think the die would come up even (2, 4, or 6)?” The
expanded seven-item numeracy scale was intended to assess “how well people 1)
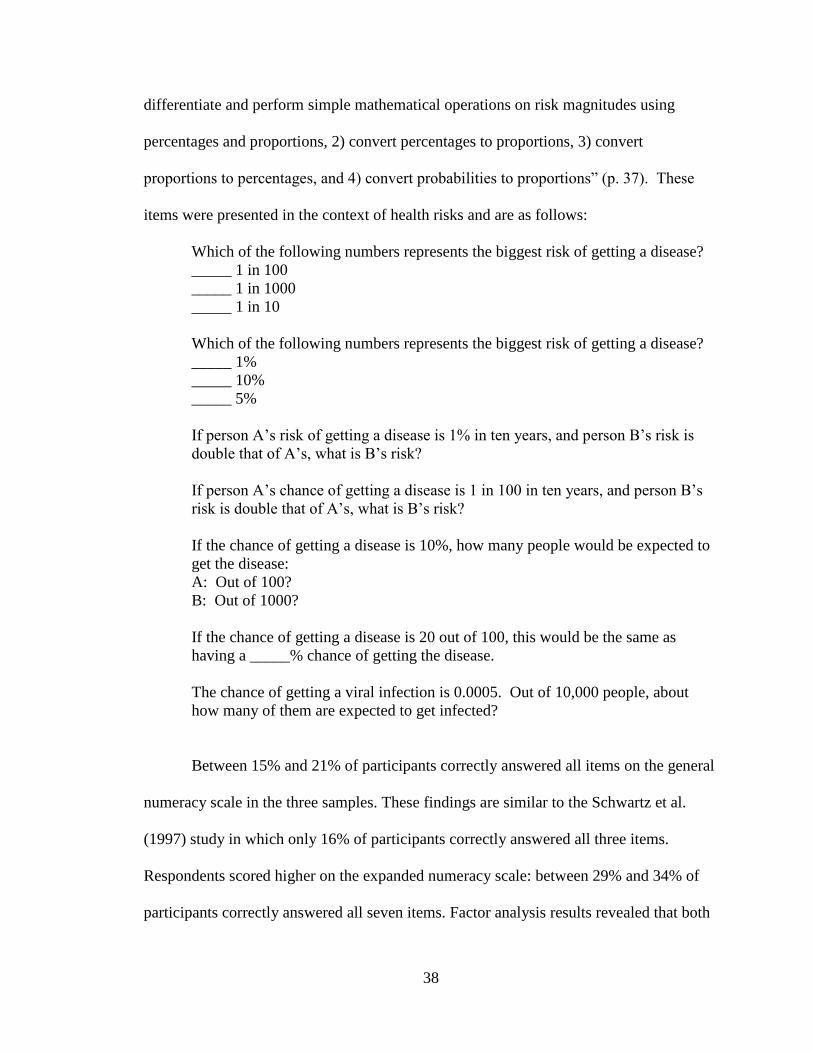
38
differentiate and perform simple mathematical operations on risk magnitudes using
percentages and proportions, 2) convert percentages to proportions, 3) convert
proportions to percentages, and 4) convert probabilities to proportions” (p. 37). These
items were presented in the context of health risks and are as follows:
Which of the following numbers represents the biggest risk of getting a disease?
_____ 1 in 100
_____ 1 in 1000
_____ 1 in 10
Which of the following numbers represents the biggest risk of getting a disease?
_____ 1%
_____ 10%
_____ 5%
If person A‟s risk of getting a disease is 1% in ten years, and person B‟s risk is
double that of A‟s, what is B‟s risk?
If person A‟s chance of getting a disease is 1 in 100 in ten years, and person B‟s
risk is double that of A‟s, what is B‟s risk?
If the chance of getting a disease is 10%, how many people would be expected to
get the disease:
A: Out of 100?
B: Out of 1000?
If the chance of getting a disease is 20 out of 100, this would be the same as
having a _____% chance of getting the disease.
The chance of getting a viral infection is 0.0005. Out of 10,000 people, about
how many of them are expected to get infected?
Between 15% and 21% of participants correctly answered all items on the general
numeracy scale in the three samples. These findings are similar to the Schwartz et al.
(1997) study in which only 16% of participants correctly answered all three items.
Respondents scored higher on the expanded numeracy scale: between 29% and 34% of
participants correctly answered all seven items. Factor analysis results revealed that both

39
the general and expanded numeracy scales tapped the global construct of numeracy;
however, Cronbach‟s alphas for the general numeracy scale were .63, .61, and .57. These
values indicate suboptimal internal consistency reliability across the three samples.
Conversely, Cronbach‟s alphas for the expanded numeracy scale were .74, .70, and .75
for Samples 1 through 3.
Although this study contributes to the growing literature on numeracy, there are
several limitations. First, “highly educated” was not defined for this study. This absence
of a definition is particularly disappointing inasmuch as this descriptor is central to the
study as indicated by its inclusion in the manuscript‟s title. It is unclear how this study‟s
“highly educated” participants differ from other studies in which 36% (Schwartz et al.,
1997) and 77% (Woloshin et al., 2001) of participants possessed at least some college
education. A second limitation is the potential for self-selection bias, as newspaper
advertisements directed interested individuals to call for study information. A third
limitation is that the study used a primarily homogeneous sample, thereby limiting
generalizability of the findings. This last limitation appears to be an issue in several
studies. The utility of the instrument may be limited by the administration time, which
was an upwards of 30 minutes (Reyna et al., 2009).
Peters and colleagues (2007) developed an expanded numeracy scale using the
11-item Lipkus et al. (2001) scale and adding four more complex numeric problems “to
improve the distributional properties of the scale” (Peters, Dieckmann et al., 2007, pp.
172-174). This expanded scale was used with a convenience sample of 303 adults aged
18 to 64 years (mean age = 37), 48% of whom were female and 76% were White. Half of
the sample had a high school degree or less and 74% had annual household incomes of
40
less than $20,000. The researchers categorized individuals into numeracy groups based
on a median split: lower in numeracy (0 to 9 correct responses) and higher in numeracy
(10 to 15 correct responses). The instrument demonstrated good internal consistency
reliability (α = .83), correlated with the S-TOFHLA (r = .51), and took 6 to 15 minutes to
administer (Reyna et al., 2009).
Aggarwal, Speckman, Paasche-Orlow, Roloff, and Battaglia (2007) studied the
role of numeracy on cancer screening among urban women. The researchers defined
numeracy as “the knowledge and skills needed to understand the fundamental notions of
numbers and chance” (p. S58). The authors further elaborated that numeracy “includes
the ability to perform calculations and to decipher numbers embedded in text, as well as
the ability to handle numbers when writing or filling out forms” (p. S58). This
constitutive definition is one of the most thorough definitions offered in literature
depicting original numeracy research. Participants were considered numerate if they met
three criteria for numeracy, adapted from Black et al. (1995): (a) basic familiarity with
probability, (b) comfort with using probability, and (c) basic familiarity with proportions.
The first criterion was assessed with the coin flip item. The second criterion was assessed
with three quantitative risk questions. A numerical response to all three items was
counted as correct. The third criterion was assessed by asking participants to rate their
lifetime and five-year risk of getting cancer. A response was considered correct if a
participant rated her lifetime risk to be greater than her five-year risk.
Although the survey appears to err on the liberal side regarding what constitutes a
correct response, only 26% of the 264 respondents were categorized as numerate. Most
participants were classified as innumerate based on an inability to correctly answer the
41
coin flip question. Participant numeracy was compared with other items measuring
knowledge of cancer screening guidelines and whether a participant was up-to-date with
cancer screening. Adequate numeracy was associated with increased knowledge of breast
cancer screening guidelines, but was not associated with being up-to-date with screening
practices.
One limitation of the Aggarwal et al. (2007) study was that the majority of
participants had a primary care provider, which is a strong predictor of compliance with
cancer screening. A second limitation is that although the numeracy items were based on
previous research, the scale used in this study was not validated. Instrument validity and
reliability should be established.
The Medical Data Interpretation Test (MDIT) (Schwartz, Woloshin, & Welch,
2005) is another objective scale measuring numeracy. The MDIT extends beyond simple
numeracy measures by testing individuals‟ ability to use numbers to compare risks and
put risk estimates into context. MDIT items cover health information that one would
routinely encounter in direct-to-consumer prescription drug advertisements, news media
reports, and statements physicians might make to patients. The test consists of 18 items
which were tested for validity and reliability in a sample of 178 individuals. Regarding
reliability, the MDIT demonstrated good repeatability and good internal consistency
reliability (α = .71). Content validity of the critical reading test was rated highly by 15
physicians; 60% rated the coverage of important concepts in critical reading skills as
“excellent” or “very good,” 73% reported the test clarity to be “excellent” or “very
good,” and 86% “strongly agreed” or “agreed” that individuals who answered most test
questions incorrectly possessed a limited ability to understand research findings.
42
Construct validity was supported by examining the distributions of data interpretation
scores. Individuals with high numeracy, quantitative literacy, and educational attainment
obtained higher critical reading scores than their low numeracy, quantitative literacy, and
educational attainment counterparts.
Although the MDIT attempts to fill a gap in the risk communication literature, it
is not without several important limitations. First, there is a degree of subjectivity in eight
of the test items. For instance, after reading a paragraph about an imaginary drug called
Gritagrel, participants are asked, “Which [of the following] would best help you to decide
whether you will benefit from Gritagrel?” Although more than one of the choices could
be true, respondents were supposed to have been led to choose the “correct” response
based on the information provided in the paragraph. Schwartz et al. (2005) argue against
subjectivity, citing that the 15 physician experts who completed the test correctly
responded to 7 of the 8 questions on average. On the other hand, it could be argued that
physicians‟ responses may differ from those of the general public.
Another limitation of the Schwartz et al. (2005) study is the low item-to-total
correlations; these correlations were presented in an appendix along with the distributions
of answers to the items, but were not discussed in the text. These correlations ranged
from 0.20 to 0.58, warranting a further investigation of these items. Furthermore, a more
thorough item analysis should be conducted, including an examination of item difficulty.
Other objective measures that assess multiple dimensions include the Test of
Functional Health Literacy in Adults (TOFHLA) and The Newest Vital Sign (NVS).
These measures assess numeracy along with other components of health literacy, such as
reading comprehension. The TOFHLA is a composite measure that assesses reading
43
comprehension and numeracy separately (Davis, Kennen, Gazmararian, & Williams,
2005). Although measured separately, psychometric evaluation treats the two
components as a single entity. Furthermore, the numeracy section was not validated
against an established measure of mathematical ability. The ability to use the TOFHLA to
ascertain numeracy alone is limited due to the psychometric evaluation and lack of
validation of the numeracy measure. In light of these limitations, the TOFHLA may be
useful for providing an indirect measure of key numeracy skills in the realm of functional
health literacy (Parker, Baker, Williams, & Nurss, 1995; Reyna et al., 2009). On the other
hand, the TOFHLA can take a relatively long time (up to 22 minutes) to administer. A
shorter version (S-TOFHLA) was developed to address the time issue (Baker, Williams,
Parker, Gazmararian, & Nurss, 1999). The initially developed instrument contained 2
prose passages and 4 numeracy items, and required only 12 minute to administer.
Although the four numeracy items had adequate internal consistency reliability (α = .68),
they had a suboptimal correlation with the Rapid Estimate of Adult Literacy in Medicine
(REALM; cite; α = .61) and were later dropped due to a high correlation between the
prose passages and the full TOFHLA (α = .91).
The NVS was developed as a rapid test for assessing limited literacy in primary
health care settings (Weiss et al., 2005). It includes six items based on information
presented in a nutrition label from an ice cream container. The English version of the
NVS demonstrated good internal consistency reliability (α = 0.76) and correlation with
the TOFHLA (r = .59, p < .001). An advantage to using the NVS is that the test can be
administered in about three minutes. On the other hand, the NVS is integrative and tasks
require application of multiple skills, including reading comprehension and numeracy, to
44
be successful. Tasks require participants to read a nutrition label and identify numbers
relevant to the task, then determine and apply the appropriate mathematical operation.
Because of this integration of skills, numeracy skills cannot be separated from literacy
and other skills; therefore, one cannot determine how numeracy contributes to one‟s
overall performance on the test.
Some less commonly used measures of numeracy include a single question asking
participants what a physician means when stating “40% of cases like yours” (Weinfurt et
al., 2003; Weinfurt et al., 2005). Other numeracy measures pertain to specific health
conditions, including anticoagulation control (Estrada, Martin-Hryniewicz, Peek, Collins,
& Byrd, 2004), asthma (Apter et al., 2006), and diabetes (Huizinga et al., 2008; Montori
et al., 2004).
Schapira and colleagues (2009) conducted an item analysis using both classical
test theory and item response theory (IRT) to evaluate the MDIT (Schwartz et al., 2005)
and Lipkus et al. (2001) measures of health numeracy. The researchers conducted a
cross-sectional survey of 359 participants recruited from 1 of 3 internal medicine primary
care clinic associated with an academic medical center. Participants were eligible for
inclusion in the study if they were 40-74 years of age, and the sample was stratified by
race and clinic site to select participants diverse in race and education. Using classical
test theory and IRT indicators, an evaluation of the Lipkus et al. (2001) expanded
numeracy scale revealed a low level of difficulty among most items. With the exception
of items 2, 3, and 11, the percentage of correct responses for each item was relatively
high, ranging from 68% to 89%.
45
Item 3 demonstrated the highest difficulty level, with only 18% of participants
selecting the correct response and exhibiting a high IRT difficulty parameter of 1.16. This
item asked participants to provide an open-ended response to the question: “In the ACME
PUBLISHING SWEEPSTAKES, the chance of winning a car is 1 in 1,000. What
percent of tickets to ACME PUBLISHING SWEEPSTAKES win a car? _____%.” This
item was originally developed by Schwartz and colleagues (1997) to assess participants‟
ability to convert a proportion to a percentage. Only 20% of 287 respondents in the
Schwartz et al. study were able to correctly convert 1 in 1000 to 0.1%. Similarly, results
from Lipkus et al.‟s (2001) study of three highly educated samples, 18.4% to 23.4% of
participants correctly responded to this item.
Lipkus et al. scale items 8 and 9 showed extremely large IRT discrimination
parameters. Upon an investigation of the item characteristic curves, the researchers found
these items were providing information at a single ability as opposed to a range of
abilities. The high discrimination patterns for these items produced a high peak in test
information function, indicating poor model fit for these items. Schapira and colleagues
(2009) modified the scale by removing these items and observed a modest decrease in
reliability; the coefficient alpha decreased from α = .79 for the 11-item scale to α = .76
for the modified 9-item scale. Furthermore, the elimination of items 8 and 9 resulted in a
bimodal test information function that provides a large amount of information for the
range of ability levels.
Schapira and colleagues (2009) also conducted an item analysis of the MDIT
using both classical test theory and IRT. Most MDIT items were at least moderately
discriminating; however, items 3 and 13-14 had discrimination parameters lower than
46
desired for quality items. Moreover, these items had low item-scale correlations (r = .15)
and high IRT difficulty parameters (b = 11.63 and 57.01). The original validation of the
MDIT also found items 13-14 to be the most difficult items (Schwartz et al., 2005).
Results from analyses conducted by Schapira et al. (2009) revealed that these items were
not only the most difficult, but also do not discriminate well between more and less
numerate individuals. Modifying the MDIT by removing items 3 and 13-14 did not
change the information provided by the test, nor did it change the internal consistency
reliability (α = .73). Overall, the Lipkus and MDIT measures of numeracy discriminate
well between more and less numerate individuals. The modified versions of these
measures offer equally strong measures of numeracy and the researchers recommend
administration of these shorter tests.
Subjective numeracy scales. The previous investigations have used objective
scales to measure numeracy. Because objective scales can be strenuous and aversive,
researchers have been interested in developing subjective numeracy scales. The first
scales developed were the STAT-Interest and STAT-Confidence scales, designed to
measure individuals‟ attitudes toward health-related statistics (Woloshin, Schwartz, &
Welch, 2005). The STAT-Interest scale is comprised of four statements and one question
pertaining to interest in medical statistics, whereas the STAT-Confidence scale is
comprised of two statements and one question pertaining to confidence in understanding
medical statistics. In testing the scales‟ psychometrics, internal consistency reliability was
good (α = .70 and α = .78, respectively), but test-retest reliability was suboptimal (r = .60
and r = .62, respectively). Both scales were significantly, but weakly correlated with the
MDIT (r = .26, p = .006 for STAT-Interest and r = .15, p = .04 for STAT-Confidence);
47
these data suggest that although participants generally reported high levels of interest and
confidence in medical statistics, they may have been poor judges of their ability to use
these statistics.
Another subjective numeracy scale was designed by Fagerlin and colleagues
(2007), with the objective of distinguishing low and high numerate individuals. The
premise for this subjective scale is three-fold: it is less aversive, faster to administer, and
more useable for telephone and Internet surveys than objective scales. The constitutive
definition of numeracy varied from previous definitions: “aptitude with probabilities,
fractions, and ratios” (Fagerlin, Zikmund-Fisher et al., 2007, p. 672).
The researchers conducted three studies to refine and test a final version of the
Subjective Numeracy Scale (SNS). Paper-and-pencil surveys were administered to a total
of 703 individuals at two hospitals. An 8-item SNS was developed and refined through
several rounds of testing. Four items were intended to measure beliefs regarding skill in
performing mathematical operations, and four items assessed preferences pertaining to
the presentation of numerical data. For instance, individuals were asked “How good are
you at working with fractions?” and “When you hear a weather forecast, do you prefer
predictions using percentages (e.g., „there will be a 20% chance of rain today‟) or
predictions using only words (e.g., „there is a small chance of rain today‟)? (1 = always
prefer percentages, 6 =always prefer words; reverse coded).” The SNS exhibited good
internal consistency reliability (α = .82).
The SNS was compared to the objective scale used in the Lipkus et al. (2001)
study. In contrast to the Woloshin et al. (2005) findings, results indicated the SNS was
moderately correlated with the objective numeracy scale (rs = .63- 68); these data suggest

48
subjective scales may be feasible measures for estimating numeracy. Compared to the
objective scale, the SNS was completed in less time (about five minutes) and perceived
as less stressful and less frustrating. These positive survey attributes may translate to
better completion and attrition rates, and result in fewer missing data. Participants may
also exhibit greater willingness to participate in future numeracy-related studies.
A potential limitation of the Fagerlin et al. (2007) study was the possibility that
not all constructs related to numeracy were included in the SNS. Also, the researchers
strived to correlate with the Lipkus et al. scale and selected items accordingly. It would
seem that absence of other objective scales serves to limit the ways in which researchers
measure numeracy. This need for more validated scales and other ways of thinking about
how to measure numeracy serves as the foundation of the current study.
Summary of measures. There are several scales designed to measure numeracy;
some scales include numeracy as a component of a larger scale measuring health literacy
(composite and integrated scales), whereas other scales were designed to measure only
numeracy. A major limitation of the composite and integrated scales is the absence of an
assessment of risk and probability comprehension, and it may not be possible to ascertain
the contribution of numeracy to one‟s overall test score.
Objective scales measuring disease-general numeracy include the 3-item
numeracy assessment (Schwartz et al., 1997), 11-item numeracy scale (Lipkus et al.,
2001), MDIT (Schwartz et al., 2005), and expanded numeracy scale (Peters, Dieckmann
et al., 2007). Although quick to administer, the 3-item numeracy assessment does not
appear to have been validated against existing measures and assesses few dimensions of
numeracy. The 11-item numeracy scale had good internal consistency reliability and
49
covers more dimensions of numeracy than the 3-item scale, but may take a relatively long
time to administer. The MDIT exhibited good internal consistency reliability, but there
was a degree of subjectivity in what constitutes the “best” response. The expanded
numeracy scale includes more complex questions than the original 11-item scale, which
may help to further classify individuals into numeracy levels (high, average, and low).
Interestingly, the 15-item expanded numeracy scale took less time to administer than the
11-item scale (6-15 minutes versus up to 30 minutes).
Subjective numeracy scales may be less strenuous and aversive for individuals to
complete, but they may also be less accurate in assessing numeracy. The STAT-Interest
and STAT-Confidence scales were poorly correlated with the MDIT, suggesting
individuals may not be good judges of their numerical ability. On the other hand, the SNS
was moderately correlated with the Lipkus et al. (2001) numeracy scale, providing some
evidence of the utility of subjective scales.
All objective and subjective scales are limited by the population on which the
scales were tested. These assessments should be tested on a larger scale, with a greater
number of and more demographically diverse individuals. Furthermore, more rigorous
psychometric testing should be undertaken.
Socio-demographic Factors and Numeracy Level
Little research has been conducted to ascertain socio-demographic predictors of
numeracy level, and research generally has been limited to relatively small convenience
samples. Some research suggests differences in health numeracy mirror general
demographic social inequities, with poorer numeracy observed among individuals who
are female, non-White, less educated, of lower socioeconomic status, and elderly (Lipkus
50
& Peters, 2009; Peters, 2008; Reyna & Brainerd, 2007). More research needs to be
conducted with a larger, nationally representative sample to better understand the
relationship between socio-demographic variables and numeracy level; results from this
research may assist in developing targeted interventions aimed at increasing risk
comprehension based on numeracy level.
Numeracy and Health Risk Perceptions
Understanding the risks and benefits of a particular medical procedure or health
behavior is necessary for making an informed decision. Individuals with lower numeracy
skills have consistently exhibited biases in their perceptions of health risks and benefits
(Reyna et al., 2009).
Many studies of numeracy and health risk perceptions were conducted in the
context of breast cancer research. Black et al. (1995) studied women aged 40 to 50 years
who had no history of breast cancer (n = 145) to determine how their perceived risk of
developing breast cancer and perceived benefit of screening correlated with estimates
from epidemiologic studies of breast cancer incidence and clinical trials of screening.
Women‟s numeracy was assessed using one question regarding how many times a fair
coin would come up heads in 1,000 tosses. Results indicated that although both those
lower and higher in numeracy overestimated their breast cancer risk and screening
effectiveness, those lower in numeracy made larger overestimations.
Similar results regarding overestimation of screening effectiveness was found in
another study. Schwartz et al. (1997) examined the relationship between numeracy and
female veterans‟ ability to use risk reduction expressions about the benefit of screening
mammography (n = 287). The women were randomly assigned to receive one of four
51
questionnaires, which differed only in how the risk reduction information was framed.
Numeracy was assessed using a three-item scale, and accuracy was calculated by
participants‟ ability to adjust perceived risk based on the risk reduction information they
received. Results indicated poor accuracy among all four groups, with most women
overestimating the effectiveness of screening mammography. The researchers observed a
linear relationship between the accuracy in applying risk reduction data and the number
of correct responses to the three numeracy items, with higher numeracy scores associated
with higher accuracy. This effect remained even after controlling for age, income,
education, and framing of the information.
Conversely, other research has not shown a relationship between numeracy and
breast cancer risk estimates. One such study was conducted by Dillard and colleagues
(2006), who explored the association between numeracy and consistent overestimation of
breast cancer risk despite provision of epidemiologic risk information. The three-item
scale developed by Schwartz et al. (1997) was used to measure numeracy. Results
indicated numeracy was not significantly related to overestimation of breast cancer risk.
It should be noted that the study was conducted with a small sample of women (n = 62),
which may not offer enough statistical power.
Outside of breast cancer, at least one study has been conducted to examine the
relationship between numeracy and health risk perceptions. Gurmankin et al. (2004)
presented participants with hypothetical scenarios describing a physician‟s estimate of a
patient‟s cancer risk. When asked to imagine they were the patient, participants rated
their risk of cancer. Using the 11-item Lipkus et al. (2001) numeracy scale, the
52
researchers observed that patients lower in numeracy were more likely to overestimate
their cancer risk than those higher in numeracy.
Numeracy and Comprehension of Health Risks
Given the discrepancy between what information is meant to relay and what is
actually understood by consumers of that information, researchers have explored optimal
formats for presenting numerical health information. Studies have been conducted to
better understand how numeracy level is associated with framing and formatting risk
information (e.g., Peters et al., 2006).
How information is framed can affect comprehension of health risks, particularly
for lower numerate individuals. Framing bias may occur when the same risk information
is presented in different ways (Gordon-Lubitz, 2003). Negative versus positive frames is
one type of framing effect studied by Peters and colleagues (2006) with a sample of 100
college students. The researchers used the 11-item Lipkus et al. (2001) numeracy scale
and dichotomized participants into “less numerate” (two to eight correct items) and
“more numerate” (more than eight correct items) groups. Participants were asked to rate
the quality of hypothetical students‟ work based on exam scores. Both less and more
numerate participants rated the students‟ work differently when the exam scores were
framed negatively (e.g., 20% incorrect) versus positively (e.g., 80% correct), with less
numerate individuals exhibiting larger framing differences.
Another type of framing effect relates to presentation of data in frequency versus
percentage format. Peters et al. (2006) studied the effects of numeracy on comprehension
of probability information with a sample of 46 participants. These individuals were
presented with a hypothetical scenario about the risk of discharging a psychiatric patient.
53
Half of the participants received information presented in a frequency format (“Of every
100 patients similar to Mr. Jones, 10 are estimated to commit an act of violence to others
during the first several months after discharge”), whereas the other half received this
information in a percentage format (“Of every 100 patients similar to Mr. Jones, 10% are
estimated to commit an act of violence to others during the first several months after
discharge”). Although these scenarios are mathematically equivalent, less numerate
participants rated Mr. Jones as less risky to others when they read the percentage format,
whereas more numerate participants did not differ in their risk ratings.
In addition to framing effects, numeracy has been linked to the comprehension of
survival graphs. In one study, participants (n = 155) were presented with graphs depicting
the number of people who would be alive over a span of 50 years depending on which of
two drugs they received (Fisher et al., 2007). Participants were then asked four questions
about the information presented in the graph and numeracy was measured using a
subjective numeracy scale. Individuals with higher numeracy levels were able to
correctly answer more questions compared to their lower numerate counterparts.
Numeracy has also been related to trust of health information based on verbal or
numerical format. Gurmankin et al. (2004) presented 115 participants with hypothetical
risk scenarios in which a physician presented the risk of a patient having cancer using
verbal, numerical – probability as a percentage, and numerical – probability as a fraction
formats. Numeracy was measured using an adapted version of the Lipkus et al. (2001)
scale. Even after adjusting for gender, age, and education, the researchers found that
participants with the lowest numeracy scores trusted information in the verbal format
54
over the numeric formats. On the contrary, participants with higher numeracy scores
trusted the numerical information more than the verbal.
Numeracy has also been linked to data presentation formats. Miron-Shatz et al.
(2009) studied the effects of presentation format and numeracy on comprehension of
prenatal screening results, as well as assessment of the risk that a fetus would be
diagnosed with Down syndrome. A convenience sample of college students (n = 241)
was recruited to complete an online survey about medical decision making. Participants
were randomly assigned of three presentation formats: (a) 1-in-N format, (b) frequency
format, or (c) visual format. Numeracy was assessed using the 11-item Lipkus et al.
(2001) scale, and participants were grouped using a median split: higher numeracy (11
correct responses) and lower numeracy (10 or fewer correct responses). Numeracy did
not have a main effect on comprehension, but did have an effect on risk assessment.
Higher numerate individuals assessed the risk to be lower than the lower numerate
individuals. Further analysis of the lower numerate group revealed that presentation
format had a significant effect on mean comprehension and risk assessments, with the
frequency format associated with a lower, more accurate risk assessment. College
students may be more educated and therefore possess higher literacy and numeracy skills
than the general population, thereby limiting generalizability to this population.
Numeracy and Health Decisions
Adequate numeracy skills are necessary for comprehending the risks of health
behaviors and making treatment decisions (Fagerlin, Ubel et al., 2007); however,
relatively little research has been conducted to examine the effect of numeracy on
specific health-related judgments and decisions (Reyna & Brainerd, 2007). Inadequate
55
numeracy has been associated with incorrect estimations of personal health risks (Black
et al., 1995) and can encumber comprehension of health statistics (Schwartz et al., 1997),
which may undermine informed decision making. Understanding how numeracy impacts
health behaviors can have valuable implications for research and health education
practice. For instance, if it appears that individuals with lower numeracy levels tend to
choose riskier behaviors, further research could be conducted to determine whether these
choices stem from misunderstanding health statistics or other determinants (Fagerlin,
Ubel et al., 2007).
When studying the role of numeracy in understanding the benefit of screening
mammography, Schwartz et al. (1997) found that most women overestimate the benefits
of mammography; however, a greater proportion of women with lower numeracy
overestimated the benefits. Misunderstanding the benefits of mammography may result in
dissatisfaction with care, distrust in the medical profession, or delay in obtaining future
screenings. On the other hand, Aggarwal et al. (2007) found no association between
numeracy and cancer screening practices. Instead, having a primary care provider was the
strongest predictor of breast cancer screening, whereas having private health insurance
was the strongest predictor of colorectal cancer screening.
Numeracy skill is also necessary for individuals to weigh short-term benefits
against long-term benefits (Peters, Hibbard, Slovic, & Dieckmann, 2007). Individuals are
often asked to incur costs now to benefit from long-term, theoretical rewards in the
future. For instance, individuals who are asked to quit smoking may experience short-
term costs such as nicotine withdrawal and anxiety; however, it is expected that the long-
term benefit is increased quality of life. Compared with more numerate individuals, less
56
numerate individuals are more likely to weigh short-term, rather than long-term, costs
and benefits.
Although little research has been conducted to examine whether and how
numeracy influences behavioral change, experts have posited that numeracy may affect
the motivation to engage in behaviors based on numerical information (Lipkus & Peters,
2009). A study conducted by Estrada and colleagues (2004) provides some evidence
linking numeracy to health behavior. These researchers found that less numerate patients
exhibited poorer self-management of anticoagulation therapy compared to their more
numerate counterparts. Cavanaugh et al. (2008) obtained similar results regarding
diabetes self-management. More research is needed to understand how numeracy may
affect decisions to engage in preventive behaviors, such as applying sunscreen to prevent
skin cancer.
Information providers, such as health educators and physicians, may inadvertently
influence health decisions by how they frame health outcomes (Peters et al., 2006).
Edwards and Elwyn (2001) have found that perceptions of risk are vulnerable to framing
effects. For instance, a treatment could be described as having a 90% survival rate or a
10% failure rate. Despite their identical risks, the latter is perceived as more unsafe
(Malenka, Baron, Johansen, Wahrenberger, & Ross, 1993).
Although more research needs to be conducted, there is some evidence that low
numerate and high numerate individuals are impacted differently by framing effects.
Peters et al. (2006) found that when framing an exam score as “74% correct” or “26%
incorrect,” less numerate participants demonstrated a stronger framing effect. Higher
numerate individuals are more likely to transform the numbers, switching from one frame
57
to another. If applied to a health condition in which individuals need to make a medical
decision, it seems plausible that less numerate individuals may not make completely
informed decisions depending on the manner in which treatment outcomes are framed.
Numeracy and Health Outcomes
The effect of numeracy on health outcomes may be context dependent (Montori &
Rothman, 2001) and vary according to factors that determine the numerical skills
required of individuals (Reyna et al., 2009). For instance, the aforementioned study
regarding anticoagulation therapy required patients to have fairly basic arithmetic skills
for self-management. Conversely, other health behaviors and health decisions may
require a higher level understanding of risk information. There may be some instances in
which numeracy has no discernible effect on health outcomes (Reyna et al., 2009).
Moreover, the effect of numeracy on health outcomes may be confounded by other, non-
computational factors. Important moderators and mediators of the effects of numeracy on
health outcomes should be explored to develop theoretical models of the relationship
between numeracy and proximal and distal health outcomes.
Conceptual Framework
Lipkus and Peters (2009) proposed a conceptual framework for understanding the
role of numeracy in medical decision-making processes. This framework is based in dual-
process theory, which purports information is processed using two modes of thinking:
System 1 - an affective or intuitive mode and System 2 - a deliberative mode (Sloman,
1996; Stanovich & West, 2002). Based on feelings and intuition, System 1 processing is
associative and fast. Conversely, System 2 processing is more deliberative and slow; it is
conscious and based on reason. Each system informs the other, and researchers contend
58
that good choices are made when individuals use both systems to think and feel their way
through a decision (Damasio, 1994). When confronted with a decision to be made,
individuals need to not only comprehend information, but also be motivated by the
information with which they are presented; the meaning derived from the information
may ultimately direct final decisions (Slovic, Finucane, Peters, & MacGregor, 2002).
Some research suggests that individuals who are more numerate have more
precise mental images of numbers and can access numerical comparisons more quickly
than their less numerate counterparts (Peters, Slovic, Vastfjall, & Mertz, 2008). They
may be more likely to manipulate numbers in a manner to affect decisions (Lipkus &
Peters, 2009). The more numerate may also draw more affective meaning from numbers
than the less numerate (Peters, 2006). Taken together, the empirical and theoretical
findings were integrated into a framework for numeracy with several components:
“These components include a numerical stimulus and how the number is represented,
attended to, comprehended, and interpreted factually and via affective meaning to
determine decisions and behaviors” (Lipkus & Peters, 2009, p. 1072). The framework
also includes internal and external stimuli that may affect decisions and behaviors.
Using the framework in the context of risk information regarding skin cancer, the
model begins with the presentation of numeric stimuli (e.g., information regarding the
probability of developing skin cancer after repeated sun exposure). Numeracy may affect
how this numerical stimulus is perceived (e.g., the perceived magnitude of the number).
There are two proposed consequences of this perception: (a) numeracy may influence
how individuals attend to and think about the numbers, or (b) the perception of the
numerical information may prompt a more automatic, affective response about the
59
meaning of the numbers. In the event that the decision maker feels his or her
interpretation is incorrect or unclear, he or she may seek additional information. Other
factors, such as education or motivation, may affect how one attends to and seeks out
numerical information about skin cancer risk, or the comprehension and interpretation of
risk. Numeracy may affect the use of strategies, such as number manipulations, which
may or may not result in a more accurate understanding of the risk information. Other
external factors may affect comprehension and interpretation of the risk data; these
factors include prior experiences, situational factors (e.g., emotional state), and the social
environment (e.g., information presented in the media). These external sources may
affect decisions beyond information comprehension and interpretation by way of social
norms and other mechanisms. Lipkus and Peters (2009) hypothesize that these non-
numerical sources may be more influential for the less numerate than for the more
numerate.
Summary of Numeracy Literature
Most research on numeracy has pertained to medical decision making with less
having been focused on decision making related to preventive behaviors. A wide range of
definitions and measures for numeracy exist, making it difficult to make direct
comparisons of results across multiple studies. Little research has been conducted to
ascertain socio-demographic correlates of numeracy, which may be helpful in preparing
focused interventions for priority audiences to enhance comprehension and use of risk
information in health behavior decisions. Lower numerate individuals appear to be
susceptible to differences in presentation of risk information, making it imperative to
60
study different formats to ascertain the format that yields the most informed decision
making.
Application to Public Health
Key determinants of health include genetic, environmental, lifestyle, and social
and economic factors, as well as relevant health services (Calman, 1998), and many
diseases result as a combination of these factors (Berry, 2004). Although some factors are
not modifiable (e.g., genetic factors), individuals can take action to prevent adverse
health outcomes through factors that are modifiable (e.g., lifestyle factors). Health
decision-making occurs in the public health field as individuals make decisions to avert
adverse health conditions. The public needs information about antecedents of health
conditions to make choices regarding behavior modification. It is imperative to educate
individuals about the risks of health impairing habits, the benefits of engaging in health
protective behaviors (Berry, 2004), and to present information in comprehensible
formats.
The current research focuses on several types of cancer including skin cancer, the
most common form of cancer in the U.S. (Centers for Disease Control and Prevention,
2010). Basal cell and squamous cell carcinomas comprise the two most common types of
skin cancer; these types are highly curable and are not tracked by central cancer
registries. The third most common type, malignant melanoma, is more dangerous than
basal cell and squamous cell carcinomas. Data from 2006 indicate that 53,919 people in
the U.S. were diagnosed with malignant melanoma, of which about 57% were men and
most were White (U.S. Cancer Statistics Working Group, 2010). That same year, 8,441
people died of melanoma.
61
Approximately 65% to 90% of melanomas result from ultraviolet (UV) exposure
and research suggests most skin cancers could be prevented by avoiding UV exposure
(Centers for Disease Control and Prevention, 2002). The ACS recommendations for skin
cancer prevention include: (a) covering up with clothing to protect as much skin as
possible; (b) using about an ounce of sunscreen with a minimum sun protection factor of
30, and reapplying at least every 2 hours; (c) wearing a hat that has at least a 2- to 3-inch
brim; (d) wearing sunglasses that block UV rays; (e) limiting direct sun exposure midday,
usually from 10:00 a.m. to 4:00 p.m.; and (f) avoiding tanning beds (American Cancer
Society, 2010). Despite these recommendations, a 2008 National Cancer Institute (NCI)
(2010) survey revealed that only 57.6% of adults reported protecting themselves from the
sun by using sunscreen, wearing protective clothing, or seeking shade when going outside
on a sunny day for more than an hour. Moreover, the percentage of adults aged 25 and
older who reported using an indoor tanning device in the past 12 months increased from
12.9% in 2005 to 14.2% in 2008 (National Cancer Institute, 2010).
The current research has important public health implications for understanding
how numeracy is associated with perceptions of cancer risk, and how those risk
perceptions are associated with sun protection behavior. Previous research on numeracy
and risk perceptions has been limited by small or convenience samples, or both. The
current research uses a dataset intended to be nationally representative, thereby enhancing
generalizability of the results. Additionally, previous research has not examined the
unique contribution of both objective and subjective numeracy to general cancer risk
perception, while controlling for other socio-demographic factors. Furthermore, the
current research will shed light on the combined effect of perceived risk and efficacy on
62
sun protection behavior, which will inform targeted interventions for self-protective
behavior. The ultimate goal of researching the intersection of numeracy, risk perception,
and sun protection behavior is to improve quality of life by reducing skin cancer
incidence.
Summary
Individuals need to be able to make informed decisions regarding their health.
One‟s numeracy level may impact how health risk messages are received, thereby
influencing perceptions of health and an eventual course of action. More research is
needed regarding how numeracy level affects both health risk perceptions and health
behavior. The information obtained can have significant implications for the design of
health education messages and interventions.
63
References
Adams, J. (1995). Risk. London: University College London Press.
Aggarwal, A., Speckman, J. L., Paasche-Orlow, M. K., Roloff, K. S., & Battaglia, T. A.
(2007). The role of numeracy on cancer screening among urban women.
American Journal of Health Behavior, 31, S57-S68.
American Cancer Society. (2010). Skin cancer prevention and early detection. Retrieved
August 25, 2010, from
http://www.cancer.org/acs/groups/cid/documents/webcontent/003184-pdf.pdf
Apter, A. J., Cheng, J., Small, D., Bennett, I. M., Albert, C., Fein, D. G., et al. (2006).
Asthma numeracy skill and health literacy. Journal of Asthma, 43(9), 705-710.
Audrain, J., Lerman, C., Rimer, B., Cella, D., Steffens, R., & Gomez-Caminero, A.
(1995). Awareness of heightened breast cancer risk among first-degree relatives
of recently diagnosed breast cancer patients. Cancer Epidemiology, Biomarkers &
Prevention, 4(5), 561-565.
Baker, D. W., Williams, M. V., Parker, R. M., Gazmararian, J. A., & Nurss, J. (1999).
Development of a brief test to measure functional health literacy. Patient
Education and Counseling, 38(1), 33-42.
Bandura, A. (1977). Self-efficacy: toward a unifying theory of behavioral change.
Psychological Review, 84(2), 191-215.
Bennett, P., & Calman, K. C. (2001). Risk communication and public health. Oxford:
Oxford Univ. Press.
Berry, D. C. (2004). Risk, communication and health psychology. Maidenhead [u.a.]:
Open Univ. Press.
64
Black, W. C., Nease, R. F., & Tosteson, A. (1995). Perceptions of risk and screening
effectiveness in women younger than 50 years of age. Journal of the National
Cancer Institute, 87, 720-731.
Bogardus, S. T., Holmboe, E., & Jekel, J. F. (1999). Perils, pitfalls, and possibilities in
talking about medical risk. Journal of the American Medical Association,
281(11), 1037-1041.
Brewer, N. T., Chapman, G. B., Gibbons, F. X., Gerrard, M., McCaul, K. D., &
Weinstein, N. D. (2007). Meta-analysis of the relationship between risk
perception and health behavior: the example of vaccination. Health Psychology,
26(2), 136-145.
British Medical Association. (1990). The BMA guide to living with risk. London:
Penguin.
Burkell, J. (2004). What are the chances? Evaluating risk and benefit information in
consumer health materials. Journal of the Medical Library Association, 92(2),
200-208.
Caan, W., & Hillier, D. (2006). How do we perceive risks? In D. Hillier (Ed.),
Communicating health risks to the public : a global perspective (pp. 33-46).
Aldershot, England; Burlington, VT: Gower.
Calman, K. C. (1998). The potential for health: how to improve the nation's health.
Oxford: Oxford University Press.
Cavanaugh, K., Huizinga, M. M., Wolff, K. L., Davis, D., Gregory, B., White, R., et al.
(2008). Diabetes Literacy and Numeracy Education Toolkit (DLNET): a
65
randomized controlled trial of numeracy-focused enhanced diabetes education.
Diabetes, 57, A38-A38.
Centers for Disease Control and Prevention. (2002). Guidelines for school programs to
prevent skin cancer. Morbidity and Mortality Weekly Report, 51(No. RR-4), 1-16.
Centers for Disease Control and Prevention. (2010). Skin cancer statistics. Retrieved
August 25, 2010, from http://www.cdc.gov/cancer/skin/statistics/index.htm
Champion, V., & Menon, U. (1997). Predicting mammography and breast self-
examination in African-American women. Cancer Nursing, 20(5), 315-322.
Damasio, A. R. (1994). Descartes' error: emotion, reason, and the human brain. New
York: Avon.
Davis, T., Kennen, E. M., Gazmararian, J. A., & Williams, M. V. (2005). Literacy testing
in health care research. In J. G. Schwartzberg, J. VanGeest & C. Wang (Eds.),
Understanding health literacy : implications for medicine and public health (pp.
157-179). Chicago: American Medical Association Press.
Dillard, A. J., McCaul, K. D., Kelso, P. D., & Klein, W. M. P. (2006). Resisting good
news: reactions to breast cancer risk communication. Health Communication,
19(2), 115-123.
Edwards, A., & Elwyn, G. (2001). Understanding risk and lessons for clinical risk
communication about treatment preferences. Quality in Health Care, 10(Suppl I),
i9-i13.
Estrada, C., Barnes, V., Collins, C., & Byrd, J. C. (1999). Health literacy and numeracy.
Journal of the American Medical Association, 282(6), 523.
66
Estrada, C. A., Martin-Hryniewicz, M., Peek, B. T., Collins, C., & Byrd, J. C. (2004).
Literacy and numeracy skills and anticoagulation control. American Journal of
the Medical Sciences, 328(2), 88-93.
Evans, J. (2000). Adult's mathematical thinking and emotions: a study of numerate
practices. New York: Routledge Falmer.
Fagerlin, A., Ubel, P. A., Smith, D. M., & Zikmund-Fisher, B. J. (2007). Making
numbers matter: Present and future research in risk communication. American
Journal of Health Behavior, 31, S47-S56.
Fagerlin, A., Zikmund-Fisher, B. J., Ubel, P. A., Jankovic, A., Derry, H. A., & Smith, D.
M. (2007). Measuring numeracy without a math test: development of the
subjective numeracy scale. Medical Decision Making, 27(5), 672-680.
Glanz, K., Steffen, A. D., & Taglialatela, L. A. (2007). Effects of colon cancer risk
counseling for first-degree relatives. Cancer Epidemiology, Biomarkers &
Prevention, 16(7), 1485-1491.
Golbeck, A. L., Ahlers-Schmidt, C. R., Paschal, A. M., & Dismuke, S. E. (2005). A
definition and operational framework for health numeracy. American Journal of
Preventive Medicine, 29(4), 375-376.
Gordon-Lubitz, R. J. (2003). Risk communication: problems of presentation and
understanding. Journal of the American Medical Association., 289(1), 95.
Gurmankin, A. D., Baron, J., & Annstrong, K. (2004). The effect of numerical statements
of risk on trust and comfort with hypothetical physician risk communication.
Medical Decision Making, 24(3), 265-271.
67
Gurmankin, A. D., Baron, J., & Armstrong, K. (2004). Intended message versus message
received in hypothetical physician risk communications: exploring the gap. Risk
Analysis, 24(5), 1337-1347.
Helzlsouer, K. J., Ford, D. E., Hayward, R. S., Midzenski, M., & Perry, H. (1994).
Perceived risk of cancer and practice of cancer prevention behaviors among
employees in an oncology center. Preventive Medicine, 23(3), 302-308.
Hochbaum, G. M. (1958). Public participation in medical screening programs: a
sociopsychological study. PHS publication no. 572. Washington, D.C.:
Government Printing Office.
Huizinga, M. M., Elasy, T. A., Wallston, K. A., Cavanaugh, K., Davis, D., Gregory, R.
P., et al. (2008). Development and validation of the Diabetes Numeracy Test
(DNT). BMC Health Services Research, 8, 96.
Janz, N. K., Champion, V. L., & Strecher, V. J. (2002). The health belief model. In K.
Glanz, B. K. Rimer & F. M. Lewis (Eds.), Health behavior and health education:
theory, research, and practice (pp. 45-66). San Francisco: Jossey-Bass.
Kim, S. E., Pérez-Stable, E. J., Wong, S., Gregorich, S., Sawaya, G. F., Walsh, J. M., et
al. (2008). Association between cancer risk perception and screening behavior
among diverse women. Archives of Internal Medicine, 168(7), 728-734.
Kutner, M., Greenberg, E., Jin, Y., Boyle, B., Hsu, Y., Dunleavy, E., et al. (2007).
Literacy in everyday life: results from the 2003 National Assessment of Adult
Literacy (NCES 2007-480). U.S. Department of Education. Washington, DC:
National Center for Education Statistics.
68
Lipkus, I., & Peters, E. (2009). Understanding the role of numeracy in health: proposed
theoretical framework and practical insights. Health Education & Behavior,
36(6), 1065-1081.
Lipkus, I. M., Rimer, B. K., & Strigo, T. S. (1996). Relationships among objective and
subjective risk for breast cancer and mammography stages of change. Cancer
Epidemiology, Biomarkers & Prevention, 5(12), 1005-1011.
Lipkus, I. M., Samsa, G., & Rimer, B. K. (2001). General performance on a numeracy
scale among highly educated samples. Medical Decision Making, 21(1), 37-44.
Lowrance, W. W. (1976). Of acceptable risk: science and the determination of safety.
Los Altos: W. Kaufmann.
Malenka, D. J., Baron, J. A., Johansen, S., Wahrenberger, J. W., & Ross, J. M. (1993).
The framing effect of relative and absolute risk. Journal of General Internal
Medicine, 8(10), 543-548.
Merriam-Webster Incorporated. (n.d.). Merriam-Webster Online Dictionary. Retrieved
November 23, 2007, from http://www.merriam-webster.com/dictionary/numeracy
Miles, A., Voorwinden, S., Chapman, S., & Wardle, J. (2008). Psychologic predictors of
cancer information avoidance among older adults: the role of cancer rear and
fatalism. Cancer Epidemiology, Biomarkers & Prevention, 17(8), 1872-1879.
Miron-Shatz, T., Hanoch, Y., Graef, D., & Sagi, M. (2009). Presentation format affects
comprehension and risk assessment: the case of prenatal screening. Journal of
Health Communication, 14(5), 439-450.
69
Montori, V. M., Leung, T. W., Thompson, C. A., Chung, J. A., Capes, S. E., & Smith, S.
A. (2004). Validation of a diabetes numeracy evaluation tool. Diabetes, 53, A224-
A225.
National Cancer Institute. (2010). Cancer trends progress report -- 2009/2010 update.
Retrieved August 25, 2010, from
http://progressreport.cancer.gov/doc_detail.asp?pid=1&did=2009&chid=91&coid
=911&mid=
Parker, R. M., Baker, D. W., Williams, M. V., & Nurss, J. R. (1995). The Test of
Functional Health Literacy in Adults: a new instrument for measuring patients'
literacy skills. Journal of General Internal Medicine, 10(10), 537-541.
Peters, E. (2006). The functions of affect in the construction of preferences. In S.
Lichtenstein & P. Slovic (Eds.), The construction of preference (pp. 454-463).
New York: Cambridge University Press.
Peters, E. (2008). Numeracy and the perception and communication of risk. Annals of the
New York Academy of Sciences, 1128(1), 1-7.
Peters, E., Dieckmann, N., Dixon, A., Hibbard, J. H., & Mertz, C. K. (2007). Less is
more in presenting quality information to consumers. Medical Care Research and
Review, 64(2), 169-190.
Peters, E., Hibbard, J., Slovic, P., & Dieckmann, N. (2007). Numeracy skill and the
communication, comprehension, and use of risk-benefit information. Health
Affairs, 26(3), 741-748.
70
Peters, E., & Slovic, P. (1996). The role of affect and worldviews as orienting
dispositions in the perception and acceptance of nuclear power. Journal of
Applied Social Psychology, 26(16), 1427-1453.
Peters, E., Slovic, P., Vastfjall, D., & Mertz, C. K. (2008). Intuitive numbers guide
decisions. Judgment and Decision Making, 3(8), 619-635.
Peters, E., Vastfjall, D., Slovic, P., Mertz, C. K., Mazzocco, K., & Dickert, S. (2006).
Numeracy and decision making. Psychological Science, 17(5), 407-413.
Pichon, L. C., Corral, I., Landrine, H., Mayer, J. A., & Adams-Simms, D. (2010).
Perceived skin cancer risk and sunscreen use among African American adults.
Journal of Health Psychology, [Epub ahead of print].
Pidgeon, N., Hood, C., Jones, D., Turner, B., & Gibson, R. (1992). Risk perception. In
Risk: Analysis, Perception and Management: A Report of the Royal Society Study
Group (pp. 89-134). London: Royal Society.
Reyna, V. F., & Brainerd, C. J. (2007). The importance of mathematics in health and
human judgment: numeracy, risk communication, and medical decision making.
Learning and Individual Differences, 17(2), 147-159.
Reyna, V. F., Nelson, W. L., Han, P. K., & Dieckmann, N. F. (2009). How numeracy
influences risk comprehension and medical decision making. Psychological
Bulletin, 135(6), 943-973.
Rimal, R. N., Flora, J. A., & Schooler, C. (1999). Achieving improvements in overall
health orientation: effects of campaign exposure, information seeking, and health
media use. Communication Research, 26(3), 322-348.
71
Rimal, R. N., & Real, K. (2003). Perceived risk and efficacy beliefs as motivators of
change: use of the risk perception attitude (RPA) framework to understand health
behaviors. Human Communication Research, 29(3), 370-399.
Schapira, M. M., Walker, C. M., & Sedivy, S. K. (2009). Evaluating existing measures of
health numeracy using item response theory. Patient Education and Counseling,
75, 308-314.
Schwartz, L. M., Woloshin, S., Black, W. C., & Welch, H. G. (1997). The role of
numeracy in understanding the benefit of screening mammography. Annals of
Internal Medicine, 127(11), 966-972.
Schwartz, L. M., Woloshin, S., & Welch, H. G. (2005). Can patients interpret health
information? An assessment of the medical data interpretation test. Medical
Decision Making, 25(3), 290-300.
Sloman, S. A. (1996). The empirical case for two systems of reasoning. Psychological
Bulletin, 119(1), 3-22.
Slovic, P., Finucane, M., Peters, E., & MacGregor, D. G. (2002). The affect heuristic. In
T. Gilovich, D. W. Griffin & D. Kahneman (Eds.), Heuristics and biases: the
psychology of intuitive judgement. New York: Cambridge University Press.
Stanovich, K. E., & West, R. F. (2002). Individual differences in reasoning: implications
for the rationality debate? In T. Gilovich, D. W. Griffin & D. Kahneman (Eds.),
Heuristics and biases: the psychology of intuitive judgement (pp. 421-440). New
York: Cambridge University Press.
72
Stark, J. R., Bertone-Johnson, E. R., Costanza, M. E., & Stoddard, A. M. (2006). Factors
associated with colorectal cancer risk perception: the role of polyps and family
history. Health Education Research, 21(5), 740-749.
Steers, W. N., Elliott, E., Nemiro, J., Ditman, D., & Oskamp, S. (1996). Health beliefs as
predictors of HIV-preventive behavior and ethnic differences in prediction.
Journal of Social Psychology, 136(1), 99-110.
Sullivan, H. W., Burke Beckjord, E., Finney Rutten, L. J., & Hesse, B. W. (2008).
Nutrition-related cancer prevention cognitions and behavioral intentions: testing
the risk perception attitude framework. Health Education & Behavior, 35(6), 866-
879.
U.S. Cancer Statistics Working Group. (2010). United States Cancer Statistics: 1999–
2006 Incidence and Mortality Web-based Report. Atlanta (GA): Department of
Health and Human Services, Centers for Disease Control and Prevention, and
National Cancer Institute. Retrieved August 25, 2010, from
http://www.cdc.gov/uscs
U.S. Department of Health and Human Services. (n.d.). Healthy People 2010: health
communication. Retrieved November 17, 2007, from
http://www.healthypeople.gov/document/html/volume1/11healthcom.htm
Vernon, S. W. (1999). Risk perception and risk communication for cancer screening
behaviors: a review. Journal of the National Cancer Institute. Monographs(25),
101-119.
73
Vernon, S. W., Vogel, V. G., Halabi, S., & Bondy, M. L. (1993). Factors associated with
perceived risk of breast cancer among women attending a screening program.
Breast Cancer Research and Treatment, 28(2), 137-144.
Weinfurt, K. P., Castel, L. D., Li, Y., Sulmasy, D. P., Balshem, A. M., Benson, A. B., et
al. (2003). The correlation between patient characteristics and expectations of
benefit from Phase I clinical trials. Cancer, 98(1), 166-175.
Weinfurt, K. P., Depuy, V., Castel, L. D., Sulmasy, D. P., Schulman, K. A., & Meropol,
N. J. (2005). Understanding of an aggregate probability statement by patients who
are offered participation in Phase I clinical trials. Cancer, 103(1), 140-147.
Weinstein, N. D. (1987). Unrealistic optimism about susceptibility to health problems:
conclusions from a community-wide sample. Journal of Behavioral Medicine,
10(5), 481-500.
Weinstein, N. D. (1988). The precaution adoption process. Health Psychology, 7(4), 355-
386.
Weinstein, N. D., & Sandman, P. M. (2002). The precaution adoption process model. In
K. Glanz, B. K. Rimer & F. M. Lewis (Eds.), Health Behavior and Health
Education: Theory, Research and Practice (3rd ed., pp. 121-143). San Francisco:
Jossey Bass.
Weiss, B. D., Mays, M. Z., Martz, W., Castro, K. M., DeWalt, D. A., Pignone, M. P., et
al. (2005). Quick assessment of literacy in primary care: the newest vital sign.
Annals of Family Medicine, 3(6), 514-522.
Witte, K. (1992). Putting the fear back into fear appeals: the extended parallel process
model. Communication Monographs, 59(4), 329-349.
74
Woloshin, S., Schwartz, L. M., Byram, S., Fischhoff, B., & Welch, H. G. (2000). A new
scale for assessing perceptions of chance: a validation study. Medical Decision
Making, 20(3), 298-307.
Woloshin, S., Schwartz, L. M., Moncur, M., Gabriel, S., & Tosteson, A. N. (2001).
Assessing values for health: numeracy matters. Medical Decision Making, 21(5),
382-390.
Woloshin, S., Schwartz, L. M., & Welch, H. G. (2005). Patients and medical statistics:
interest, confidence, and ability. Journal of General Internal Medicine, 20(11),
996-1000.
75
Chapter Three
Methods
Purpose
The purpose of the current study was to: (a) examine the socio-demographic
variables associated with numeracy, (b) determine which factors are associated with
cancer risk perceptions, and (c) apply the RPA framework to examine associations
between risk perception groups and cancer self-protective behavior.
Research Questions
The research questions were as follows:
1. What is the association of socio-demographic factors with numeracy?
2. Which factors are statistically significantly associated with individuals‟
personal risk perceptions regarding cancer in general?
3. What is the association between risk perception groups and whether one
engages in cancer self-protective behavior?
Hypotheses
The study hypotheses were as follows:
1. Sex, education, ethnicity, race, age, occupational status, and marital status will
be significantly associated with numeracy.
2. Objective numeracy, subjective numeracy, family member cancer history,
personal cancer history, smoking status, health status, sex, education,
76
ethnicity, race, age, occupational status, and marital status will be significantly
associated with individuals‟ personal risk perceptions regarding cancer in
general.
3. Responsive individuals (high perceived risk, high perceived efficacy) will
exhibit a greater odds of engaging in cancer self-protective behavior than
individuals classified as proactive, avoidant, and indifferent.
Research Design
The current study entails an analysis of secondary data from the 2007 Health
Information National Trends Survey (HINTS). HINTS used a survey research design,
which involves the administration of a questionnaire as a means for eliciting information
from a sample selected from a target population (Gall, Gall, & Borg, 2007). This study
design is aligned with previous studies on numeracy and risk perceptions (e.g., Dillard,
McCaul, Kelso, & Klein, 2006; Schwartz, Woloshin, Black, & Welch, 1997). Although
HINTS data have been collected at three time points to allow for the examination of
trends over time, the current study uses data from only the survey administered in 2007
because numeracy was not measured in previous years; therefore, this study is cross-
sectional because it offers a glimpse into a group‟s beliefs, behaviors, and characteristics
at a single point in time (Gall et al., 2007).
Population and Sample
The HINTS 2007 questionnaire was administered via telephone (random digit
dialing [RDD]) and mail. Objective numeracy, an outcome variable of interest, was
measured only in the mailed questionnaire; therefore, only individuals who participated
in the mailed questionnaire were included in the current study.
77
HINTS data were collected from a nationally representative sample of U.S.
households (Cantor et al., 2009). For the mailed survey, a stratified random sample was
selected from a list of addresses. The stratification oversampled minority households.
Addresses in the sample were matched to a database of telephone numbers, of which 50%
of were successfully matched. For instances when an individual appeared in both the
matched telephone/address list and the RDD sample, he or she was deleted from the
mailed questionnaire sample. The final mailed survey sample included 7,851 households.
The sampling frame for the mailed survey was obtained using a database of U.S.
residential addresses, including post office boxes, throwbacks (i.e., addresses on city
routes to which mail carriers do not deliver because the mail is delivered elsewhere, such
as to a post office box), vacant addresses, and seasonal addresses (Cantor et al., 2009).
The sampling frame was stratified into a high-minority stratum and a low-minority
stratum based on census block groups. The classification of addresses to the high-
minority stratum was based on a population proportion of ≥ 24% for Hispanics or African
Americans. All other addresses were classified as low-minority. An equal-probability
sample of addresses was selected from each stratum. The high-minority stratum‟s
proportion of the sampling frame was 25.1%, and it was oversampled so that its
proportion of the sample was 50% (Cantor et al., 2009).
The survey cover letter requested participation from all adults in a household;
therefore, the sample was a stratified cluster sample, with the household as the cluster
(Cantor et al., 2009). Results of an evaluation study (Battaglia, Link, Frankel, & Mokdad,
2005) led to HINTS researchers‟ decision not to subsample adults in a given household.
These results indicated household-level completion rates were comparable among three
78
respondent selection methods: any adult, the adult having the next birthday, and all
adults in the household. Although completion rates were comparable, the all adults
method yielded differences in response rates by gender and age that were less than the
other methods.
Participant Recruitment
Mail survey data were collected from January 15 to April 27, 2008 (Cantor et al.,
2009). Recruitment began with an advance letter sent to households to introduce the
study and explain the survey, with frequently asked questions about the study printed on
the reverse side of the letter. A week following the advance letter, a packet was sent to
each sample household; packets contained three surveys, instructions requesting survey
completion from each adult in the household, and a $2 incentive. Households that had not
responded after two weeks following the packet mailing were sent a reminder postcard. If
households did not respond two weeks following the postcard, then they were mailed
another packet of questionnaires. If a response was not received within two weeks after
the second packet, households for which telephone numbers were available were entered
into an interactive voice response (IVR) experiment in which IVR or a live prompt from
an interviewer was used to encourage study participation. Questionnaires received after
April 27, 2008 were not eligible for entry into the study.
Instrument
The HINTS instrument was developed by the National Cancer Institute (NCI) to
collect nationally representative data on the U.S. public‟s use of cancer-related
information (Cantor et al., 2009). The HINTS 2007 questionnaire development began
with input from NCI investigators and other HINTS stakeholders to determine important
79
constructs to be assessed. Based on these findings, the NCI established working groups to
develop and identify survey questions. The working groups submitted possible survey
items and the NCI HINTS management developed the questionnaire framework, dividing
questions among five main sections: health communication, health services, behaviors
and risk factors, cancer, and health status and demographics. Three rounds of cognitive
interviews were conducted as part of the development of the computer-assisted telephone
interview (CATI) instrument. Once items were finalized for the pilot test, the mail
questionnaire development began. Questions for the mail questionnaire were similar to
those included in the CATI. Some questions were reworded to reflect self-administration
and, in some cases, different questions were used to measure similar constructs. Selected
sections of the mail questionnaire underwent three rounds of cognitive testing. Following
the pilot testing, the questionnaire was finalized. The final mail instrument contained 189
items.
Measures
The selection of variables for the current study was based on a review of existing
literature and the RPA framework. All variables in the HINTS 2007 dataset were
examined for theoretical and practical importance. Survey items of interest and
corresponding response options are presented in Table 1.
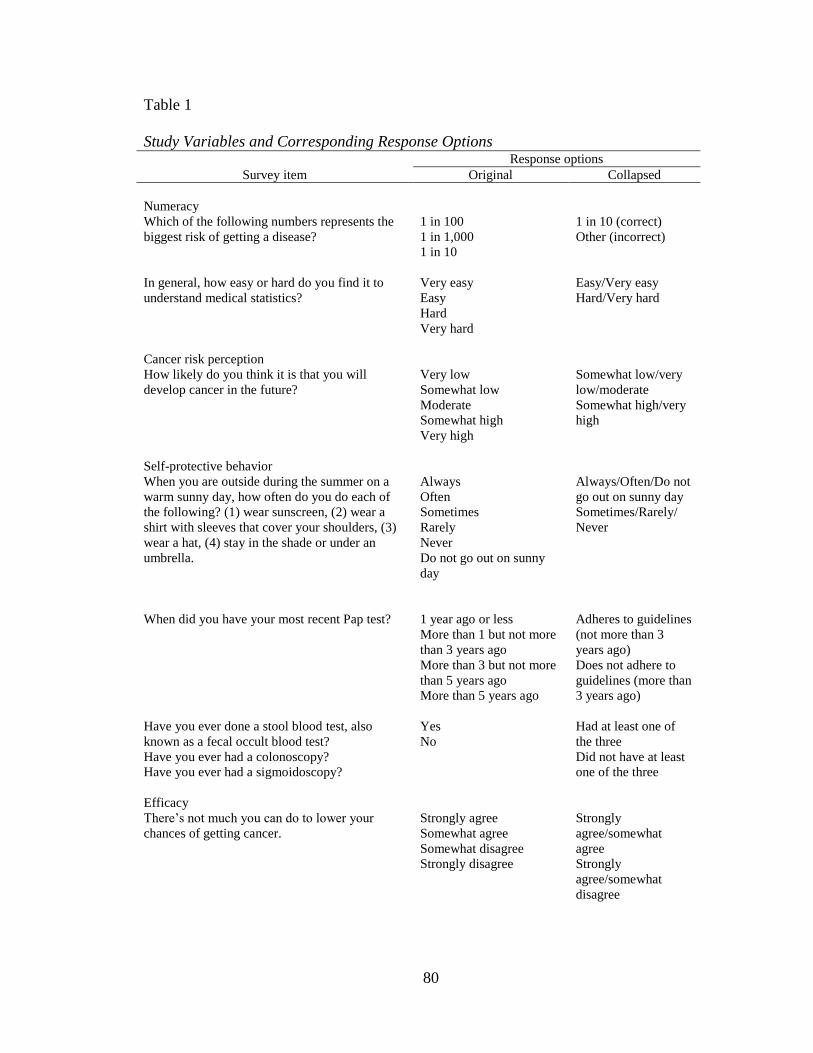
80
Table 1
Study Variables and Corresponding Response Options Response options
Survey item Original Collapsed
Numeracy
Which of the following numbers represents the
biggest risk of getting a disease?
1 in 100
1 in 1,000
1 in 10
1 in 10 (correct)
Other (incorrect)
In general, how easy or hard do you find it to
understand medical statistics?
Very easy
Easy
Hard
Very hard
Easy/Very easy
Hard/Very hard
Cancer risk perception
How likely do you think it is that you will
develop cancer in the future?
Very low
Somewhat low
Moderate
Somewhat high
Very high
Somewhat low/very
low/moderate
Somewhat high/very
high
Self-protective behavior
When you are outside during the summer on a
warm sunny day, how often do you do each of
the following? (1) wear sunscreen, (2) wear a
shirt with sleeves that cover your shoulders, (3)
wear a hat, (4) stay in the shade or under an
umbrella.
Always
Often
Sometimes
Rarely
Never
Do not go out on sunny
day
Always/Often/Do not
go out on sunny day
Sometimes/Rarely/
Never
When did you have your most recent Pap test? 1 year ago or less
More than 1 but not more
than 3 years ago
More than 3 but not more
than 5 years ago
More than 5 years ago
Adheres to guidelines
(not more than 3
years ago)
Does not adhere to
guidelines (more than
3 years ago)
Have you ever done a stool blood test, also
known as a fecal occult blood test?
Have you ever had a colonoscopy?
Have you ever had a sigmoidoscopy?
Yes
No
Had at least one of
the three
Did not have at least
one of the three
Efficacy
There‟s not much you can do to lower your
chances of getting cancer.
Strongly agree
Somewhat agree
Somewhat disagree
Strongly disagree
Strongly
agree/somewhat
agree
Strongly
agree/somewhat
disagree
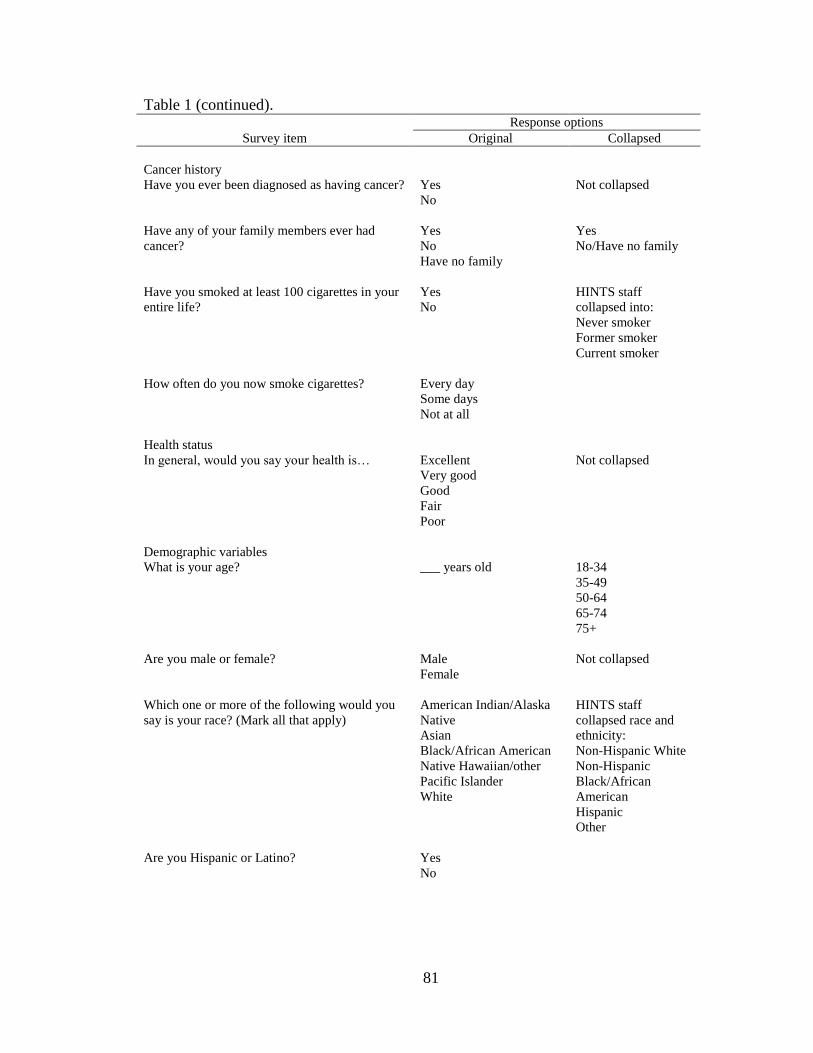
81
Table 1 (continued).
Response options
Survey item Original Collapsed
Cancer history
Have you ever been diagnosed as having cancer? Yes
No
Not collapsed
Have any of your family members ever had
cancer?
Yes
No
Have no family
Yes
No/Have no family
Have you smoked at least 100 cigarettes in your
entire life?
Yes
No
HINTS staff
collapsed into:
Never smoker
Former smoker
Current smoker
How often do you now smoke cigarettes? Every day
Some days
Not at all
Health status
In general, would you say your health is… Excellent
Very good
Good
Fair
Poor
Not collapsed
Demographic variables
What is your age? ___ years old 18-34
35-49
50-64
65-74
75+
Are you male or female? Male
Female
Not collapsed
Which one or more of the following would you
say is your race? (Mark all that apply)
American Indian/Alaska
Native
Asian
Black/African American
Native Hawaiian/other
Pacific Islander
White
HINTS staff
collapsed race and
ethnicity:
Non-Hispanic White
Non-Hispanic
Black/African
American
Hispanic
Other
Are you Hispanic or Latino? Yes
No
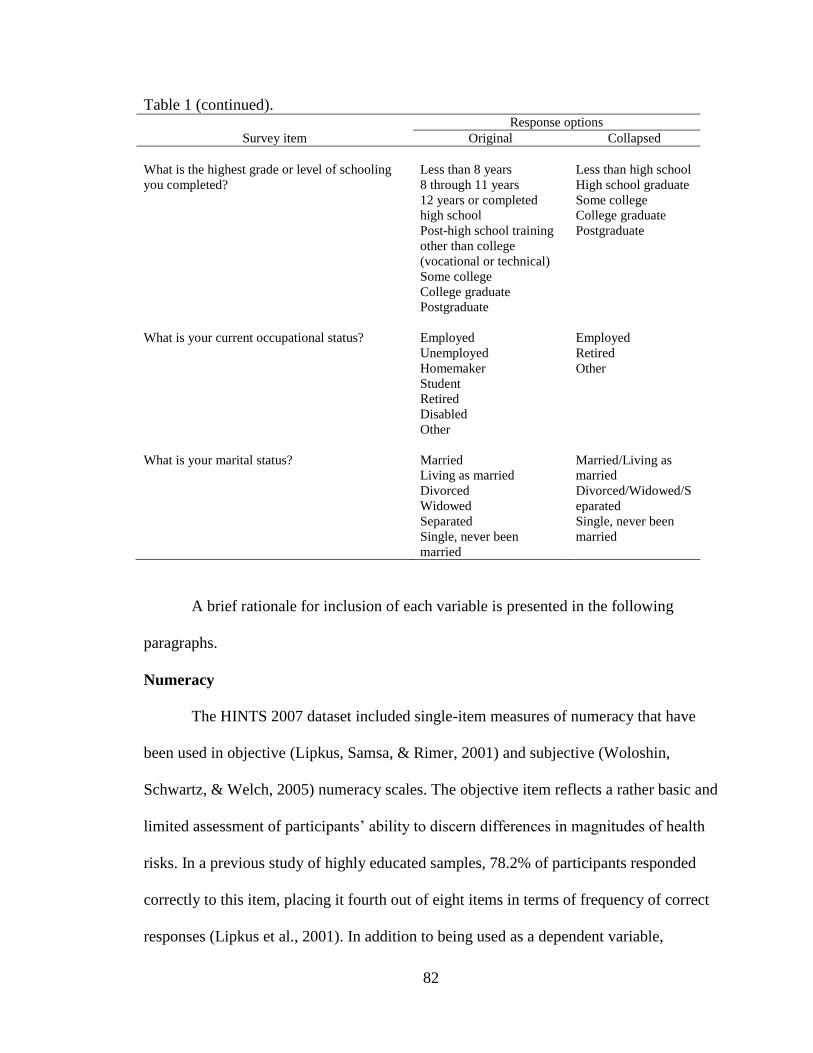
82
Table 1 (continued).
Response options
Survey item Original Collapsed
What is the highest grade or level of schooling
you completed?
Less than 8 years
8 through 11 years
12 years or completed
high school
Post-high school training
other than college
(vocational or technical)
Some college
College graduate
Postgraduate
Less than high school
High school graduate
Some college
College graduate
Postgraduate
What is your current occupational status? Employed
Unemployed
Homemaker
Student
Retired
Disabled
Other
Employed
Retired
Other
What is your marital status? Married
Living as married
Divorced
Widowed
Separated
Single, never been
married
Married/Living as
married
Divorced/Widowed/S
eparated
Single, never been
married
A brief rationale for inclusion of each variable is presented in the following
paragraphs.
Numeracy
The HINTS 2007 dataset included single-item measures of numeracy that have
been used in objective (Lipkus, Samsa, & Rimer, 2001) and subjective (Woloshin,
Schwartz, & Welch, 2005) numeracy scales. The objective item reflects a rather basic and
limited assessment of participants‟ ability to discern differences in magnitudes of health
risks. In a previous study of highly educated samples, 78.2% of participants responded
correctly to this item, placing it fourth out of eight items in terms of frequency of correct
responses (Lipkus et al., 2001). In addition to being used as a dependent variable,
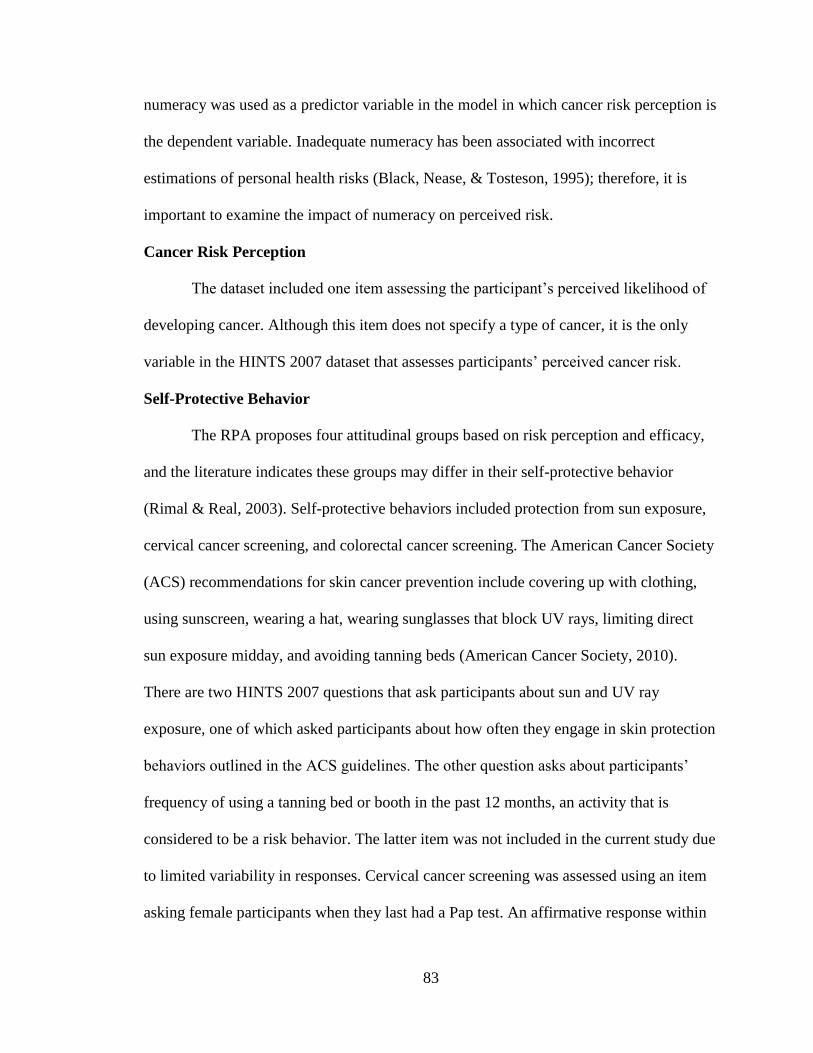
83
numeracy was used as a predictor variable in the model in which cancer risk perception is
the dependent variable. Inadequate numeracy has been associated with incorrect
estimations of personal health risks (Black, Nease, & Tosteson, 1995); therefore, it is
important to examine the impact of numeracy on perceived risk.
Cancer Risk Perception
The dataset included one item assessing the participant‟s perceived likelihood of
developing cancer. Although this item does not specify a type of cancer, it is the only
variable in the HINTS 2007 dataset that assesses participants‟ perceived cancer risk.
Self-Protective Behavior
The RPA proposes four attitudinal groups based on risk perception and efficacy,
and the literature indicates these groups may differ in their self-protective behavior
(Rimal & Real, 2003). Self-protective behaviors included protection from sun exposure,
cervical cancer screening, and colorectal cancer screening. The American Cancer Society
(ACS) recommendations for skin cancer prevention include covering up with clothing,
using sunscreen, wearing a hat, wearing sunglasses that block UV rays, limiting direct
sun exposure midday, and avoiding tanning beds (American Cancer Society, 2010).
There are two HINTS 2007 questions that ask participants about sun and UV ray
exposure, one of which asked participants about how often they engage in skin protection
behaviors outlined in the ACS guidelines. The other question asks about participants‟
frequency of using a tanning bed or booth in the past 12 months, an activity that is
considered to be a risk behavior. The latter item was not included in the current study due
to limited variability in responses. Cervical cancer screening was assessed using an item
asking female participants when they last had a Pap test. An affirmative response within
84
the past three years was considered adherent based on ACS guidelines. Adherence to
colon cancer screening guidelines was based on an affirmative response to a fecal occult
blood test (FOBT), colonoscopy, or sigmoidoscopy.
Efficacy
Efficacy is a major component of the RPA framework (Rimal & Real, 2003).
Participants were asked two items related to efficacy: (a) “Overall, how confident are you
about your ability to take good care of your health?” and (b) “There‟s not much you can
do to lower your chances of getting cancer.” Given that wording for the second item was
specific to cancer and was used as the efficacy item in a previous study using the RPA
framework to study HINTS data (Sullivan, Burke Beckjord, Finney Rutten, & Hesse,
2008), this item was used for the efficacy variable in the current study.
Cancer History
Personal and family member cancer histories have been shown to heighten cancer
risk perceptions (e.g., Kim et al., 2008). Participants in this study were asked to provide
information about a previous personal and family cancer diagnosis.
Health Status
Individuals may not believe in the accuracy of objective health risk measures
based on the belief that these measures do not account for some health behaviors thought
to protect one from disease (Lipkus & Peters, 2009). For example, an individual who
does not use tobacco products and uses sunscreen before every instance of sun exposure
may feel the collective effect of these behaviors substantially lowers his or her chances of
developing cancer. Variables assessing some general health behaviors were included in
the cancer risk perception analysis to help control for this effect, one of which was self-
85
reported health status. This variable has been associated with cancer risk perceptions,
with poor ratings associated with higher perceived risk (e.g., Kim et al., 2008). An item
asking participants to rate their general health was included in the cancer risk perception
analysis. Smoking status was also included in this analysis.
Demographic Variables
Several demographic variables have been associated with numeracy and risk
perceptions, including age, sex, education, ethnicity, race, and income (Lipkus & Peters,
2009; Peters, 2008; Reyna & Brainerd, 2007). These variables have not been assessed
simultaneously for their effect on numeracy and risk perception, therefore acting as an
impetus for the current research. Also, because there is conflicting evidence regarding the
association among specific demographic variables and risk perceptions and numeracy, all
variables will be examined in this study. Additional demographic variables that have not
been studied, but will be included in this study for thoroughness include occupational
status and marital status.
Human Subjects Review
Prior to beginning the study, the researcher obtained IRB approval to conduct the
study. Because secondary data from a publicly available dataset were used, the study was
exempt from full IRB review.
Data Analysis
After scanning surveys, HINTS staff examined data for implausible responses and
accuracy of following skip patterns, updating data as needed and running multiple edit
cycles until data were clean (Cantor et al., 2009). A SAS® file containing de-identified
data was downloaded from the HINTS website (http://hints.cancer.gov).
86
Data were analyzed using SAS® version 9.2. Similar to previous research using
HINTS data (e.g., Moser, McCaul, Peters, Nelson, & Marcus, 2007), only participants
with complete data for all variables of interest were included in the analyses. Univariate
analysis provided descriptive statistics, including frequency counts and percentages, for
each variable. Bivariate analyses were conducted to assess the association between each
dependent variable and independent variables associated with each research question.
Analyses were considered statistically significant at p < .05, which indicates there is a 5%
possibility that results are due to chance alone. A statistically significant finding is likely
given the large sample size; therefore, practical significance was examined using effect
sizes. Following is a brief description and rationale for analyses.
Research Question 1
The first research question was “What is the association of socio-demographic
factors with numeracy?” The objective and subjective numeracy items were examined
separately. The objective numeracy item was dichotomized into correct and incorrect
responses. After examining an overall (mail and phone survey) frequency distribution on
the HINTS website, the subjective numeracy item was dichotomized into easy/very easy
and hard/very hard. Independent variables included age, sex, education, race/ethnicity,
occupational status, and marital status.
Simple logistic regression was used to assess the association between each
numeracy item and each independent variable in the bivariate analyses. Given the
exploratory nature of the study, various logistic regression methods were used to model
the relationships between the independent and dependent variables in the multivariate
analyses. Logistic regression is a statistical analysis procedure used to predict a discrete
87
outcome using a set of continuous, discrete, or dichotomous variables (Tabachnick &
Fidell, 2007). This statistical method was used to determine which independent variables
remained significantly associated with the dependent variable while controlling for other
independent variables. Methods included direct logistic, forward selection, backward
elimination, and variables significant from the bivariate analyses. Using direct logistic
regression, all independent variables are entered into the model simultaneously; this
method is used in the absence of specific hypotheses regarding variable order or
importance of independent variables, as was the case for the current study (Tabachnick &
Fidell, 2007). Forward selection entails beginning with one independent variable and
adding additional variables one at a time, whereas backward elimination begins with all
independent variables in the model and removing one individual variable at a time in an
effort to improve fit.
The objective and subjective items were the dependent variable in separate
logistic regression models. Although there are no assumptions about the distributions of
the predictor variables in logistic regression, it is sensitive to extremely high correlations
among predictor variables; therefore, the variables were tested for multicollinearity prior
to conducting the regression. Cross-validation was achieved by randomly splitting the
dataset into two samples: the first sample contained 60% of the cases and was used to
develop the model, and the second sample used the remaining 40% of cases to estimate
relationships and test the model.
Research Question 2
The second research question was “Which factors are statistically significantly
associated with individuals‟ personal risk perceptions regarding cancer in general?” The
88
dependent variable, cancer risk perception, was collapsed into somewhat low/very
low/moderate and somewhat high/very high based on the overall HINTS frequency
distribution. Independent variables included objective numeracy level, subjective
numeracy level, family member cancer history, personal cancer history, smoking status,
sex, education, ethnicity, race, health status, age, occupational status, and marital status.
Simple logistic regression was used to assess the relationship between the
dependent variable and independent variables in the bivariate analyses. Similar to the first
research question, the sample was split into exploratory and confirmatory samples. Direct
logistic regression, forward selection, backward elimination, and variables significant in
the bivariate analyses were used for the multivariate analysis. Additionally, separate
analyses were conducted based on participants‟ previous cancer diagnosis status.
Research Question 3
The third research question asks “What is the association between risk perception
groups and whether one engages in cancer self-protective behavior?” Participants were
categorized into one of the four RPA framework domains based on their responses to risk
perception and self-efficacy items. Efficacy responses were dichotomized into somewhat
disagree/strongly disagree (high efficacy) and somewhat agree/strongly agree (low
efficacy). Risk perception responses were dichotomized into moderate/somewhat
low/very low (low risk) and somewhat high/very high (high risk). Participants were then
classified into one of four RPA groups based on their efficacy and risk: indifference (low
efficacy, low risk), avoidance (low efficacy, high risk), proactive (high efficacy, low
risk), and responsive (high efficacy, high risk).
89
Self-protective behavior was measured using three outcome variables: sun
protection, Pap test, and colorectal cancer screening. For sun protection, variables were
collapsed using methods similar to research conducted by the NCI for the 2009/2010
Cancer Trends Progress Report. Participants were asked: “When you are outside during
the summer on a warm sunny day, how often do you do each of the following? (1) wear
sunscreen, (2) wear a shirt with sleeves that cover your shoulders, (3) wear a hat, (4) stay
in the shade or under an umbrella.” For each item, responses were dichotomized into
always/often/do not go out on sunny day and sometimes/rarely/never. If participants
reported always/often/do not go out on sunny day for at least one of the four items, they
were classified as engaging in skin cancer self-protective behavior. Regarding cervical
cancer screening, female participants were considered to be adherent to the screening
guidelines if they had a Pap test in the past three years. Participants were considered
adherent to colon cancer screening guidelines if they had a colonoscopy, sigmoidoscopy,
or fecal occult blood test. Direct logistic regression was used to examine the association
between the RPA groups and each self-protective behavior.
Weights
Sample and replicate weights were calculated for each responding individual to
account for the complex sampling design used for HINTS. These weights were applied in
the logistic regression analyses using SAS PROC SURVEYLOGISTIC.
Design Limitations
Because secondary data were used to conduct the study, the variables representing
the desired constructs were limited to those found in the dataset. For instance, previous
studies examined numeracy using a scale; in this dataset, only one objective and one
90
subjective item were available for analysis. As a result, findings were based on single-
item performance and could not mirror the depth of assessment found in previous studies.
Additionally, a cross-sectional study does not allow for the assessment of temporality
between variables; however, it allows for the examination of association between
variables, which was the focus of the current study. Hispanics were underrepresented in
the mailed questionnaire format of HINTS, as the survey was provided only in English;
therefore, results may not be generalizable to Hispanics who read text only in Spanish.
Finally, some survey questions were arguably subject to participant recall bias as they
asked participants to recall engagement in behaviors over a specified time period in the
past.
91
References
American Cancer Society. (2010). Skin cancer prevention and early detection. Retrieved
August 25, 2010, from
http://www.cancer.org/acs/groups/cid/documents/webcontent/003184-pdf.pdf
Audrain, J., Lerman, C., Rimer, B., Cella, D., Steffens, R., & Gomez-Caminero, A.
(1995). Awareness of heightened breast cancer risk among first-degree relatives
of recently diagnosed breast cancer patients. Cancer Epidemiology, Biomarkers &
Prevention, 4(5), 561-565.
Battaglia, M. P., Link, M. W., Frankel, M. R., & Mokdad, A. H. (2005). An evaluation of
respondent selection methods for household mail surveys. Paper presented at the
Proceedings of the Section on Survey Research Methods.
Black, W. C., Nease, R. F., & Tosteson, A. (1995). Perceptions of risk and screening
effectiveness in women younger than 50 years of age. Journal of the National
Cancer Institute, 87, 720-731.
Cantor, D., Coa, K., Crystal-Mansour, S., Davis, T., Dipko, S., & Sigman, R. (2009).
Health Information National Trends Survey (HINTS) 2007 final report.
Dillard, A. J., McCaul, K. D., Kelso, P. D., & Klein, W. M. P. (2006). Resisting good
news: reactions to breast cancer risk communication. Health Communication,
19(2), 115-123.
Gall, M. D., Gall, J. P., & Borg, W. R. (2007). Educational research: an introduction.
Boston: Allyn and Bacon.
92
Helzlsouer, K. J., Ford, D. E., Hayward, R. S., Midzenski, M., & Perry, H. (1994).
Perceived risk of cancer and practice of cancer prevention behaviors among
employees in an oncology center. Preventive Medicine, 23(3), 302-308.
Kim, S. E., Pérez-Stable, E. J., Wong, S., Gregorich, S., Sawaya, G. F., Walsh, J. M., et
al. (2008). Association between cancer risk perception and screening behavior
among diverse women. Archives of Internal Medicine, 168(7), 728-734.
Lipkus, I., & Peters, E. (2009). Understanding the role of numeracy in health: proposed
theoretical framework and practical insights. Health Education & Behavior,
36(6), 1065-1081.
Lipkus, I. M., Rimer, B. K., & Strigo, T. S. (1996). Relationships among objective and
subjective risk for breast cancer and mammography stages of change. Cancer
Epidemiology, Biomarkers & Prevention, 5(12), 1005-1011.
Lipkus, I. M., Samsa, G., & Rimer, B. K. (2001). General performance on a numeracy
scale among highly educated samples. Medical Decision Making, 21(1), 37-44.
Moser, R. P., McCaul, K., Peters, E., Nelson, W., & Marcus, S. E. (2007). Associations
of perceived risk and worry with cancer health-protective actions: Data from the
Health Information National Trends Survey (HINTS). Journal of Health
Psychology, 12(1), 53-65.
Peters, E. (2008). Numeracy and the perception and communication of risk. Annals of the
New York Academy of Sciences, 1128(1), 1-7.
Reyna, V. F., & Brainerd, C. J. (2007). The importance of mathematics in health and
human judgment: numeracy, risk communication, and medical decision making.
Learning and Individual Differences, 17(2), 147-159.
93
Rimal, R. N., & Real, K. (2003). Perceived risk and efficacy beliefs as motivators of
change: use of the risk perception attitude (RPA) framework to understand health
behaviors. Human Communication Research, 29(3), 370-399.
Schwartz, L. M., Woloshin, S., Black, W. C., & Welch, H. G. (1997). The role of
numeracy in understanding the benefit of screening mammography. Annals of
Internal Medicine, 127(11), 966-972.
Sullivan, H. W., Burke Beckjord, E., Finney Rutten, L. J., & Hesse, B. W. (2008).
Nutrition-related cancer prevention cognitions and behavioral intentions: testing
the risk perception attitude framework. Health Education & Behavior, 35(6), 866-
879.
Tabachnick, B. G., & Fidell, L. S. (2007). Using multivariate statistics (5th ed.). Boston:
Allyn and Bacon.
Vernon, S. W., Vogel, V. G., Halabi, S., & Bondy, M. L. (1993). Factors associated with
perceived risk of breast cancer among women attending a screening program.
Breast Cancer Research and Treatment, 28(2), 137-144.
Woloshin, S., Schwartz, L. M., & Welch, H. G. (2005). Patients and medical statistics:
interest, confidence, and ability. Journal of General Internal Medicine, 20(11),
996-1000.
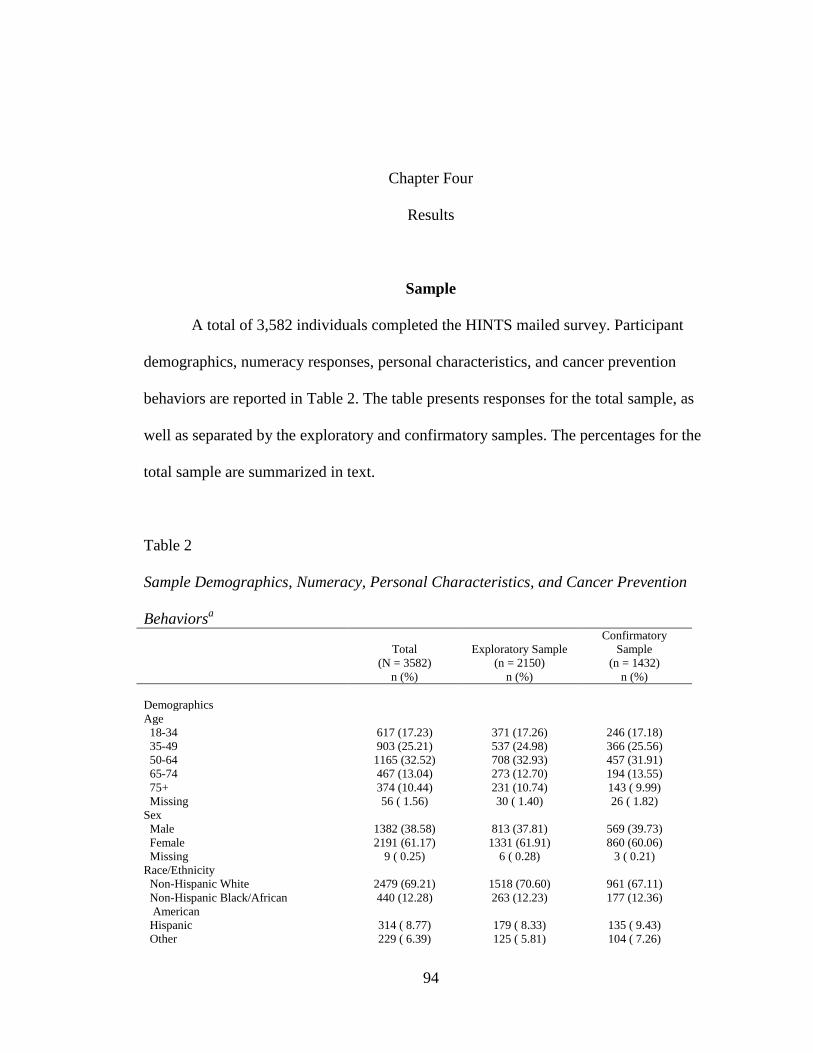
94
Chapter Four
Results
Sample
A total of 3,582 individuals completed the HINTS mailed survey. Participant
demographics, numeracy responses, personal characteristics, and cancer prevention
behaviors are reported in Table 2. The table presents responses for the total sample, as
well as separated by the exploratory and confirmatory samples. The percentages for the
total sample are summarized in text.
Table 2
Sample Demographics, Numeracy, Personal Characteristics, and Cancer Prevention
Behaviorsa
Total
(N = 3582)
n (%)
Exploratory Sample
(n = 2150)
n (%)
Confirmatory
Sample
(n = 1432)
n (%)
Demographics
Age
18-34 617 (17.23) 371 (17.26) 246 (17.18)
35-49 903 (25.21) 537 (24.98) 366 (25.56)
50-64 1165 (32.52) 708 (32.93) 457 (31.91)
65-74 467 (13.04) 273 (12.70) 194 (13.55)
75+ 374 (10.44) 231 (10.74) 143 ( 9.99)
Missing 56 ( 1.56) 30 ( 1.40) 26 ( 1.82)
Sex
Male 1382 (38.58) 813 (37.81) 569 (39.73)
Female 2191 (61.17) 1331 (61.91) 860 (60.06)
Missing 9 ( 0.25) 6 ( 0.28) 3 ( 0.21)
Race/Ethnicity
Non-Hispanic White 2479 (69.21) 1518 (70.60) 961 (67.11)
Non-Hispanic Black/African
American
440 (12.28) 263 (12.23) 177 (12.36)
Hispanic 314 ( 8.77) 179 ( 8.33) 135 ( 9.43)
Other 229 ( 6.39) 125 ( 5.81) 104 ( 7.26)
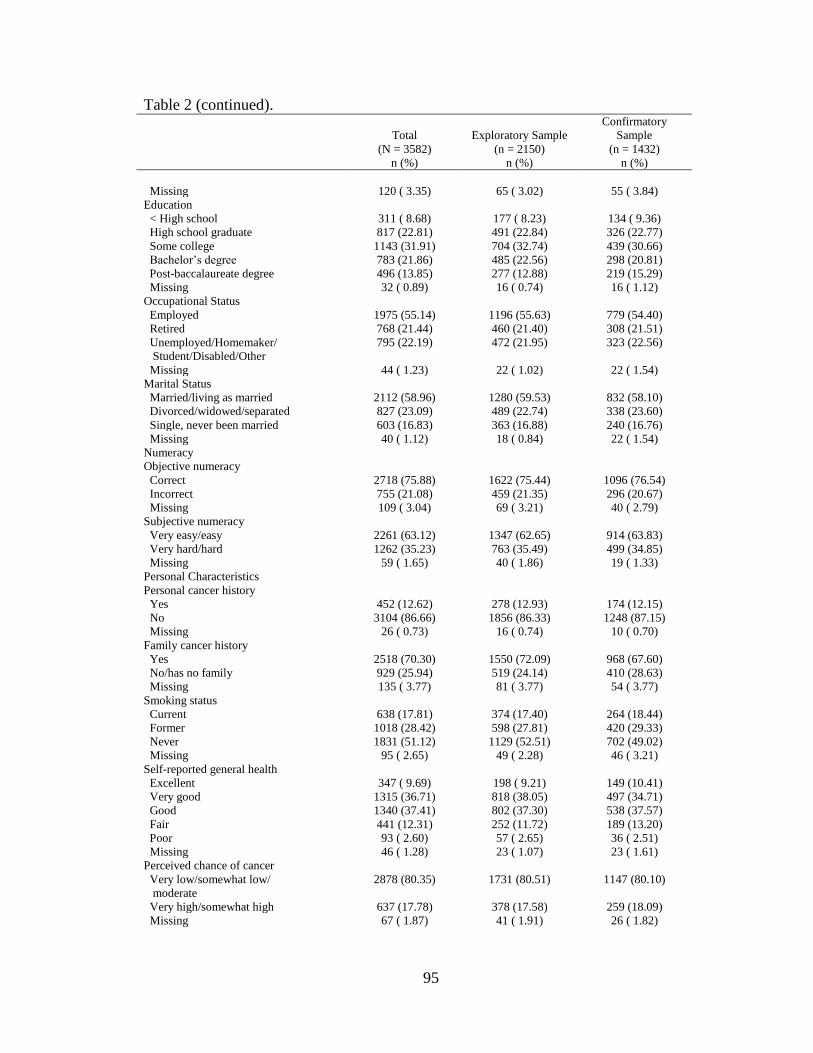
95
Table 2 (continued).
Total
(N = 3582)
n (%)
Exploratory Sample
(n = 2150)
n (%)
Confirmatory
Sample
(n = 1432)
n (%)
Missing 120 ( 3.35) 65 ( 3.02) 55 ( 3.84)
Education
< High school 311 ( 8.68) 177 ( 8.23) 134 ( 9.36)
High school graduate 817 (22.81) 491 (22.84) 326 (22.77)
Some college 1143 (31.91) 704 (32.74) 439 (30.66)
Bachelor‟s degree 783 (21.86) 485 (22.56) 298 (20.81)
Post-baccalaureate degree 496 (13.85) 277 (12.88) 219 (15.29)
Missing 32 ( 0.89) 16 ( 0.74) 16 ( 1.12)
Occupational Status
Employed 1975 (55.14) 1196 (55.63) 779 (54.40)
Retired 768 (21.44) 460 (21.40) 308 (21.51)
Unemployed/Homemaker/
Student/Disabled/Other
795 (22.19) 472 (21.95) 323 (22.56)
Missing 44 ( 1.23) 22 ( 1.02) 22 ( 1.54)
Marital Status
Married/living as married 2112 (58.96) 1280 (59.53) 832 (58.10)
Divorced/widowed/separated 827 (23.09) 489 (22.74) 338 (23.60)
Single, never been married 603 (16.83) 363 (16.88) 240 (16.76)
Missing 40 ( 1.12) 18 ( 0.84) 22 ( 1.54)
Numeracy
Objective numeracy
Correct 2718 (75.88) 1622 (75.44) 1096 (76.54)
Incorrect 755 (21.08) 459 (21.35) 296 (20.67)
Missing 109 ( 3.04) 69 ( 3.21) 40 ( 2.79)
Subjective numeracy
Very easy/easy 2261 (63.12) 1347 (62.65) 914 (63.83)
Very hard/hard 1262 (35.23) 763 (35.49) 499 (34.85)
Missing 59 ( 1.65) 40 ( 1.86) 19 ( 1.33)
Personal Characteristics
Personal cancer history
Yes 452 (12.62) 278 (12.93) 174 (12.15)
No 3104 (86.66) 1856 (86.33) 1248 (87.15)
Missing 26 ( 0.73) 16 ( 0.74) 10 ( 0.70)
Family cancer history
Yes 2518 (70.30) 1550 (72.09) 968 (67.60)
No/has no family 929 (25.94) 519 (24.14) 410 (28.63)
Missing 135 ( 3.77) 81 ( 3.77) 54 ( 3.77)
Smoking status
Current 638 (17.81) 374 (17.40) 264 (18.44)
Former 1018 (28.42) 598 (27.81) 420 (29.33)
Never 1831 (51.12) 1129 (52.51) 702 (49.02)
Missing 95 ( 2.65) 49 ( 2.28) 46 ( 3.21)
Self-reported general health
Excellent 347 ( 9.69) 198 ( 9.21) 149 (10.41)
Very good 1315 (36.71) 818 (38.05) 497 (34.71)
Good 1340 (37.41) 802 (37.30) 538 (37.57)
Fair 441 (12.31) 252 (11.72) 189 (13.20)
Poor 93 ( 2.60) 57 ( 2.65) 36 ( 2.51)
Missing 46 ( 1.28) 23 ( 1.07) 23 ( 1.61)
Perceived chance of cancer
Very low/somewhat low/
moderate
2878 (80.35) 1731 (80.51) 1147 (80.10)
Very high/somewhat high 637 (17.78) 378 (17.58) 259 (18.09)
Missing 67 ( 1.87) 41 ( 1.91) 26 ( 1.82)
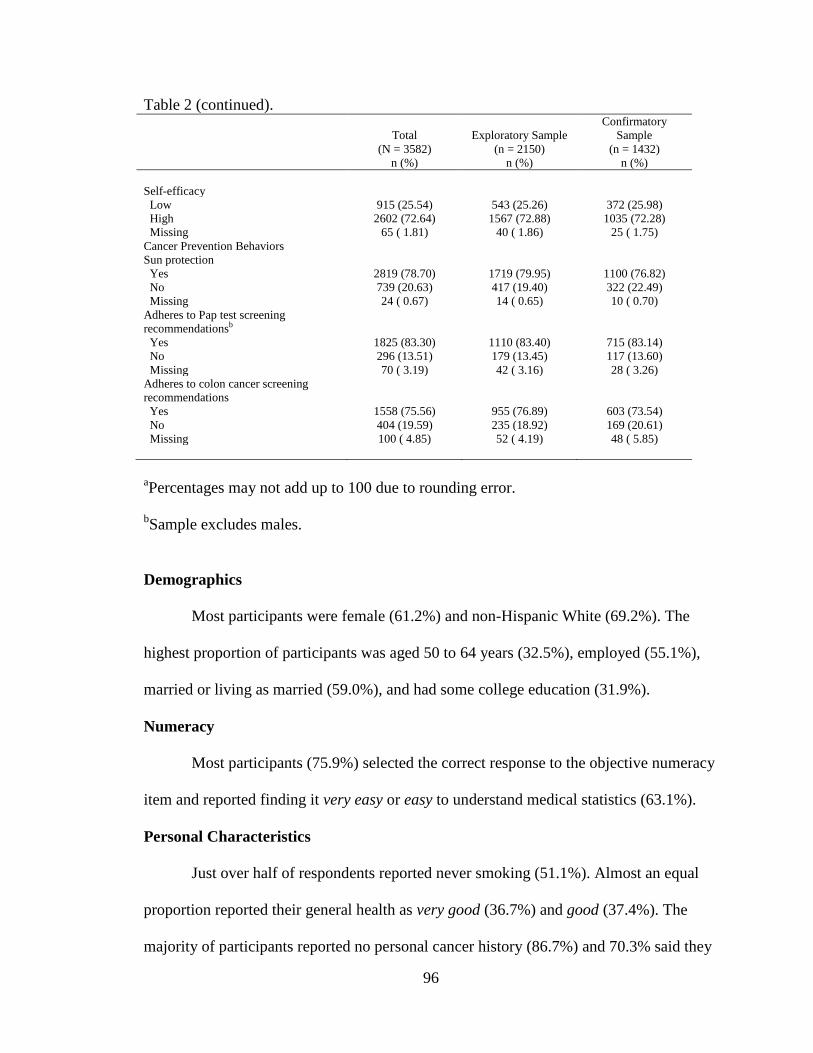
96
Table 2 (continued).
Total
(N = 3582)
n (%)
Exploratory Sample
(n = 2150)
n (%)
Confirmatory
Sample
(n = 1432)
n (%)
Self-efficacy
Low 915 (25.54) 543 (25.26) 372 (25.98)
High 2602 (72.64) 1567 (72.88) 1035 (72.28)
Missing 65 ( 1.81) 40 ( 1.86) 25 ( 1.75)
Cancer Prevention Behaviors
Sun protection
Yes 2819 (78.70) 1719 (79.95) 1100 (76.82)
No 739 (20.63) 417 (19.40) 322 (22.49)
Missing 24 ( 0.67) 14 ( 0.65) 10 ( 0.70)
Adheres to Pap test screening
recommendationsb
Yes 1825 (83.30) 1110 (83.40) 715 (83.14)
No 296 (13.51) 179 (13.45) 117 (13.60)
Missing 70 ( 3.19) 42 ( 3.16) 28 ( 3.26)
Adheres to colon cancer screening
recommendations
Yes 1558 (75.56) 955 (76.89) 603 (73.54)
No 404 (19.59) 235 (18.92) 169 (20.61)
Missing 100 ( 4.85) 52 ( 4.19) 48 ( 5.85)
aPercentages may not add up to 100 due to rounding error.
bSample excludes males.
Demographics
Most participants were female (61.2%) and non-Hispanic White (69.2%). The
highest proportion of participants was aged 50 to 64 years (32.5%), employed (55.1%),
married or living as married (59.0%), and had some college education (31.9%).
Numeracy
Most participants (75.9%) selected the correct response to the objective numeracy
item and reported finding it very easy or easy to understand medical statistics (63.1%).
Personal Characteristics
Just over half of respondents reported never smoking (51.1%). Almost an equal
proportion reported their general health as very good (36.7%) and good (37.4%). The
majority of participants reported no personal cancer history (86.7%) and 70.3% said they
97
had a family member who had cancer. Most participants (80.4%) reported a very low,
somewhat low, or moderate perceived likelihood of developing cancer in the future, and
72.6% somewhat or strongly disagreed with the item: “There‟s not much you can do to
lower your chances of getting cancer” (self-efficacy).
Cancer Prevention Behaviors
A total of 78.7% of participants reported they do not go out on a sunny day, or
always or often do at least one of the following: wear sunscreen, wear a shirt with sleeves
that cover the shoulders, wear a hat, or stay in the shade or under an umbrella. About
75.6% of respondents adhered to colon cancer screening recommendations, and 83.3% of
women adhered to Pap test screening recommendations.
Diagnostics
Prior to bivariate and multivariate analyses, all variables were examined for
multicollinearity using PROC REG in SAS. None of the condition indexes exceeded 30
coupled with variance proportions greater than 0.50 for two or more variables. Variance
inflation values were all less than 10 and none of the tolerance values were less than 0.1.
These results suggest no evidence of multicollinearity.
Research Question 1
The first research question was, “What is the association of socio-demographic
factors with numeracy?” It was hypothesized that sex, education, ethnicity, race, age,
and income would be statistically significantly associated with numeracy.
Objective Numeracy
In exploratory bivariate analyses, age, race/ethnicity, education, and occupational
status were significantly associated with correctly responding to the objective numeracy
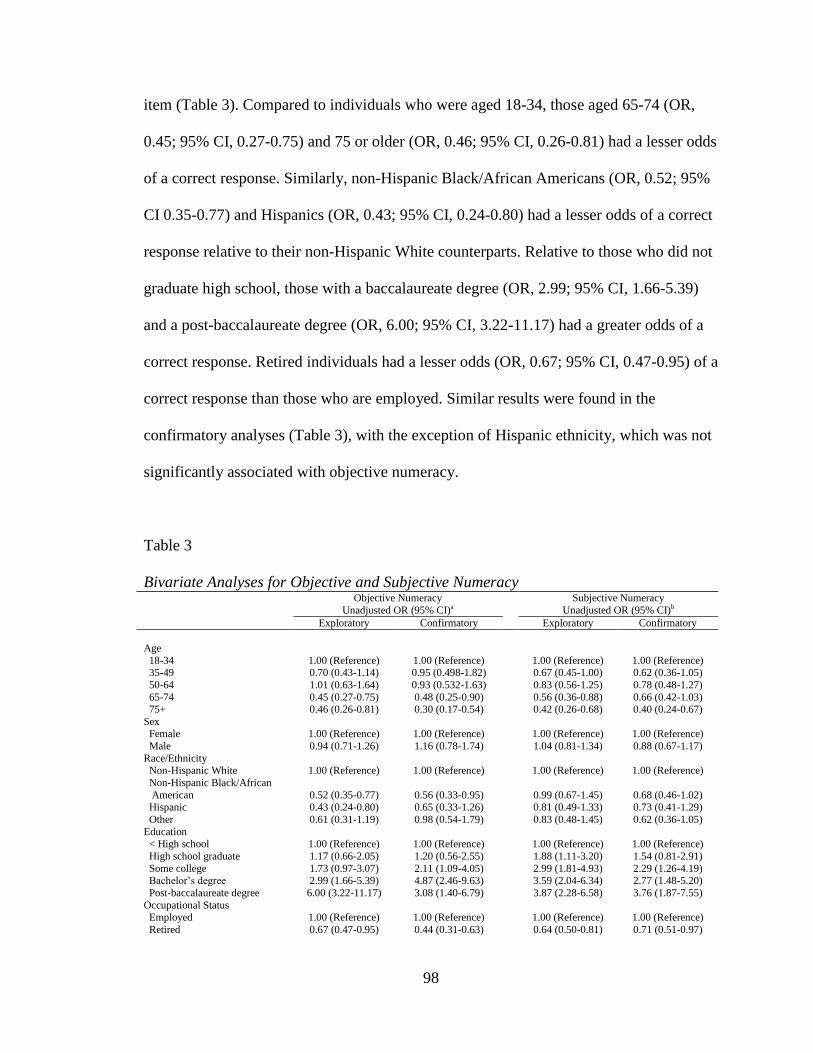
98
item (Table 3). Compared to individuals who were aged 18-34, those aged 65-74 (OR,
0.45; 95% CI, 0.27-0.75) and 75 or older (OR, 0.46; 95% CI, 0.26-0.81) had a lesser odds
of a correct response. Similarly, non-Hispanic Black/African Americans (OR, 0.52; 95%
CI 0.35-0.77) and Hispanics (OR, 0.43; 95% CI, 0.24-0.80) had a lesser odds of a correct
response relative to their non-Hispanic White counterparts. Relative to those who did not
graduate high school, those with a baccalaureate degree (OR, 2.99; 95% CI, 1.66-5.39)
and a post-baccalaureate degree (OR, 6.00; 95% CI, 3.22-11.17) had a greater odds of a
correct response. Retired individuals had a lesser odds (OR, 0.67; 95% CI, 0.47-0.95) of a
correct response than those who are employed. Similar results were found in the
confirmatory analyses (Table 3), with the exception of Hispanic ethnicity, which was not
significantly associated with objective numeracy.
Table 3
Bivariate Analyses for Objective and Subjective Numeracy Objective Numeracy
Unadjusted OR (95% CI)a
Subjective Numeracy
Unadjusted OR (95% CI)b
Exploratory Confirmatory Exploratory Confirmatory
Age
18-34 1.00 (Reference) 1.00 (Reference) 1.00 (Reference) 1.00 (Reference) 35-49 0.70 (0.43-1.14) 0.95 (0.498-1.82) 0.67 (0.45-1.00) 0.62 (0.36-1.05)
50-64 1.01 (0.63-1.64) 0.93 (0.532-1.63) 0.83 (0.56-1.25) 0.78 (0.48-1.27)
65-74 0.45 (0.27-0.75) 0.48 (0.25-0.90) 0.56 (0.36-0.88) 0.66 (0.42-1.03) 75+ 0.46 (0.26-0.81) 0.30 (0.17-0.54) 0.42 (0.26-0.68) 0.40 (0.24-0.67)
Sex Female 1.00 (Reference) 1.00 (Reference) 1.00 (Reference) 1.00 (Reference)
Male 0.94 (0.71-1.26) 1.16 (0.78-1.74) 1.04 (0.81-1.34) 0.88 (0.67-1.17)
Race/Ethnicity Non-Hispanic White 1.00 (Reference) 1.00 (Reference) 1.00 (Reference) 1.00 (Reference)
Non-Hispanic Black/African
American 0.52 (0.35-0.77) 0.56 (0.33-0.95)
0.99 (0.67-1.45) 0.68 (0.46-1.02)
Hispanic 0.43 (0.24-0.80) 0.65 (0.33-1.26) 0.81 (0.49-1.33) 0.73 (0.41-1.29)
Other 0.61 (0.31-1.19) 0.98 (0.54-1.79) 0.83 (0.48-1.45) 0.62 (0.36-1.05)
Education < High school 1.00 (Reference) 1.00 (Reference) 1.00 (Reference) 1.00 (Reference)
High school graduate 1.17 (0.66-2.05) 1.20 (0.56-2.55) 1.88 (1.11-3.20) 1.54 (0.81-2.91)
Some college 1.73 (0.97-3.07) 2.11 (1.09-4.05) 2.99 (1.81-4.93) 2.29 (1.26-4.19) Bachelor‟s degree 2.99 (1.66-5.39) 4.87 (2.46-9.63) 3.59 (2.04-6.34) 2.77 (1.48-5.20)
Post-baccalaureate degree 6.00 (3.22-11.17) 3.08 (1.40-6.79) 3.87 (2.28-6.58) 3.76 (1.87-7.55)
Occupational Status Employed 1.00 (Reference) 1.00 (Reference) 1.00 (Reference) 1.00 (Reference)
Retired 0.67 (0.47-0.95) 0.44 (0.31-0.63) 0.64 (0.50-0.81) 0.71 (0.51-0.97)
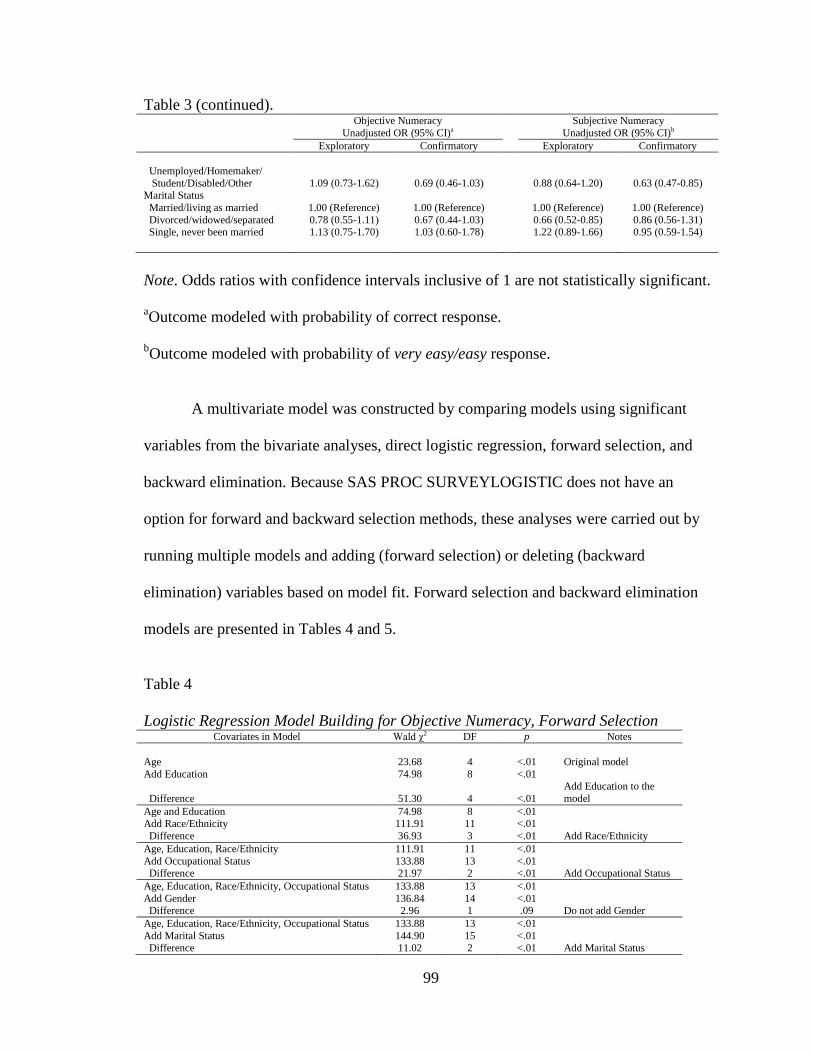
99
Table 3 (continued).
Objective Numeracy
Unadjusted OR (95% CI)a
Subjective Numeracy
Unadjusted OR (95% CI)b
Exploratory Confirmatory Exploratory Confirmatory
Unemployed/Homemaker/
Student/Disabled/Other 1.09 (0.73-1.62) 0.69 (0.46-1.03)
0.88 (0.64-1.20) 0.63 (0.47-0.85) Marital Status
Married/living as married 1.00 (Reference) 1.00 (Reference) 1.00 (Reference) 1.00 (Reference)
Divorced/widowed/separated 0.78 (0.55-1.11) 0.67 (0.44-1.03) 0.66 (0.52-0.85) 0.86 (0.56-1.31) Single, never been married 1.13 (0.75-1.70) 1.03 (0.60-1.78) 1.22 (0.89-1.66) 0.95 (0.59-1.54)
Note. Odds ratios with confidence intervals inclusive of 1 are not statistically significant.
aOutcome modeled with probability of correct response.
bOutcome modeled with probability of very easy/easy response.
A multivariate model was constructed by comparing models using significant
variables from the bivariate analyses, direct logistic regression, forward selection, and
backward elimination. Because SAS PROC SURVEYLOGISTIC does not have an
option for forward and backward selection methods, these analyses were carried out by
running multiple models and adding (forward selection) or deleting (backward
elimination) variables based on model fit. Forward selection and backward elimination
models are presented in Tables 4 and 5.
Table 4
Logistic Regression Model Building for Objective Numeracy, Forward Selection Covariates in Model Wald χ2 DF p Notes
Age 23.68 4 <.01 Original model
Add Education 74.98 8 <.01
Difference 51.30 4 <.01
Add Education to the
model
Age and Education 74.98 8 <.01 Add Race/Ethnicity 111.91 11 <.01
Difference 36.93 3 <.01 Add Race/Ethnicity
Age, Education, Race/Ethnicity 111.91 11 <.01
Add Occupational Status 133.88 13 <.01 Difference 21.97 2 <.01 Add Occupational Status
Age, Education, Race/Ethnicity, Occupational Status 133.88 13 <.01
Add Gender 136.84 14 <.01 Difference 2.96 1 .09 Do not add Gender
Age, Education, Race/Ethnicity, Occupational Status 133.88 13 <.01
Add Marital Status 144.90 15 <.01 Difference 11.02 2 <.01 Add Marital Status
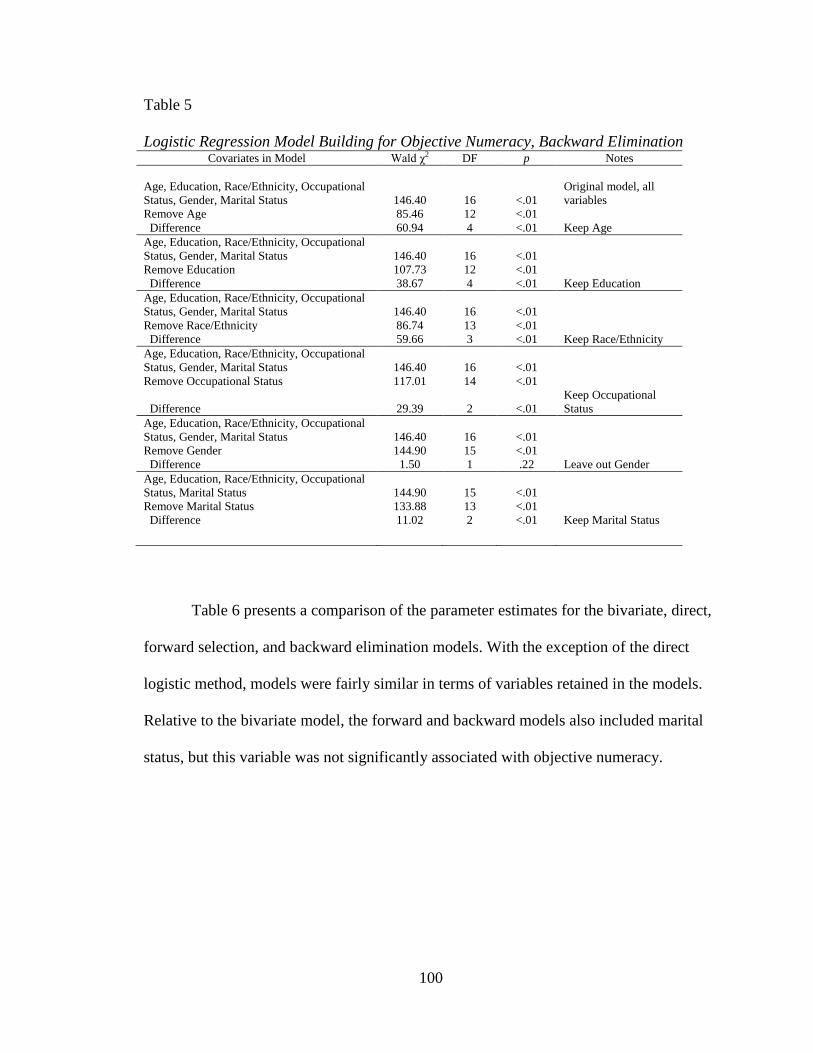
100
Table 5
Logistic Regression Model Building for Objective Numeracy, Backward Elimination Covariates in Model Wald χ2 DF p Notes
Age, Education, Race/Ethnicity, Occupational
Status, Gender, Marital Status 146.40 16 <.01
Original model, all
variables
Remove Age 85.46 12 <.01
Difference 60.94 4 <.01 Keep Age
Age, Education, Race/Ethnicity, Occupational
Status, Gender, Marital Status 146.40 16 <.01
Remove Education 107.73 12 <.01
Difference 38.67 4 <.01 Keep Education
Age, Education, Race/Ethnicity, Occupational
Status, Gender, Marital Status 146.40 16 <.01
Remove Race/Ethnicity 86.74 13 <.01
Difference 59.66 3 <.01 Keep Race/Ethnicity
Age, Education, Race/Ethnicity, Occupational
Status, Gender, Marital Status 146.40 16 <.01
Remove Occupational Status 117.01 14 <.01
Difference 29.39 2 <.01
Keep Occupational
Status
Age, Education, Race/Ethnicity, Occupational
Status, Gender, Marital Status 146.40 16 <.01
Remove Gender 144.90 15 <.01
Difference 1.50 1 .22 Leave out Gender
Age, Education, Race/Ethnicity, Occupational
Status, Marital Status 144.90 15 <.01
Remove Marital Status 133.88 13 <.01
Difference 11.02 2 <.01 Keep Marital Status
Table 6 presents a comparison of the parameter estimates for the bivariate, direct,
forward selection, and backward elimination models. With the exception of the direct
logistic method, models were fairly similar in terms of variables retained in the models.
Relative to the bivariate model, the forward and backward models also included marital
status, but this variable was not significantly associated with objective numeracy.
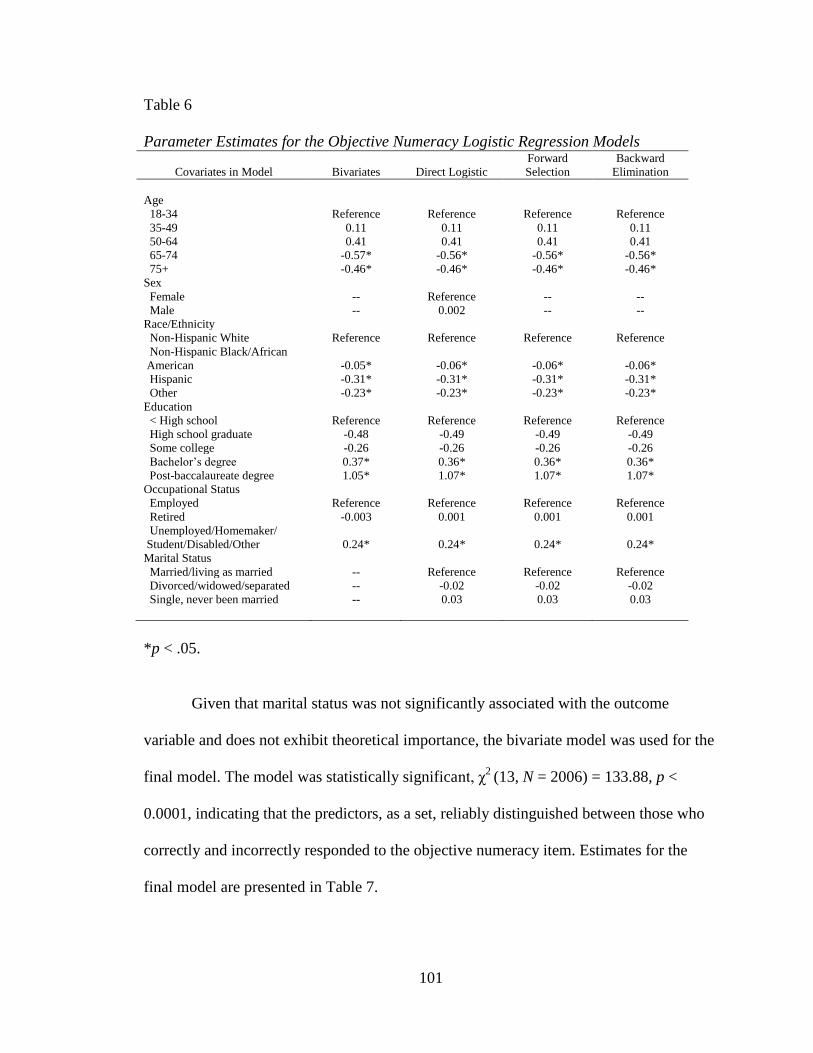
101
Table 6
Parameter Estimates for the Objective Numeracy Logistic Regression Models
Covariates in Model Bivariates Direct Logistic
Forward
Selection
Backward
Elimination
Age
18-34 Reference Reference Reference Reference
35-49 0.11 0.11 0.11 0.11
50-64 0.41 0.41 0.41 0.41
65-74 -0.57* -0.56* -0.56* -0.56*
75+ -0.46* -0.46* -0.46* -0.46*
Sex
Female -- Reference -- --
Male -- 0.002 -- --
Race/Ethnicity
Non-Hispanic White Reference Reference Reference Reference
Non-Hispanic Black/African
American -0.05* -0.06* -0.06* -0.06*
Hispanic -0.31* -0.31* -0.31* -0.31*
Other -0.23* -0.23* -0.23* -0.23*
Education
< High school Reference Reference Reference Reference
High school graduate -0.48 -0.49 -0.49 -0.49
Some college -0.26 -0.26 -0.26 -0.26
Bachelor‟s degree 0.37* 0.36* 0.36* 0.36*
Post-baccalaureate degree 1.05* 1.07* 1.07* 1.07*
Occupational Status
Employed Reference Reference Reference Reference
Retired -0.003 0.001 0.001 0.001
Unemployed/Homemaker/
Student/Disabled/Other 0.24* 0.24* 0.24* 0.24*
Marital Status
Married/living as married -- Reference Reference Reference
Divorced/widowed/separated -- -0.02 -0.02 -0.02
Single, never been married -- 0.03 0.03 0.03
*p < .05.
Given that marital status was not significantly associated with the outcome
variable and does not exhibit theoretical importance, the bivariate model was used for the
final model. The model was statistically significant, χ2
(13, N = 2006) = 133.88, p <
0.0001, indicating that the predictors, as a set, reliably distinguished between those who
correctly and incorrectly responded to the objective numeracy item. Estimates for the
final model are presented in Table 7.
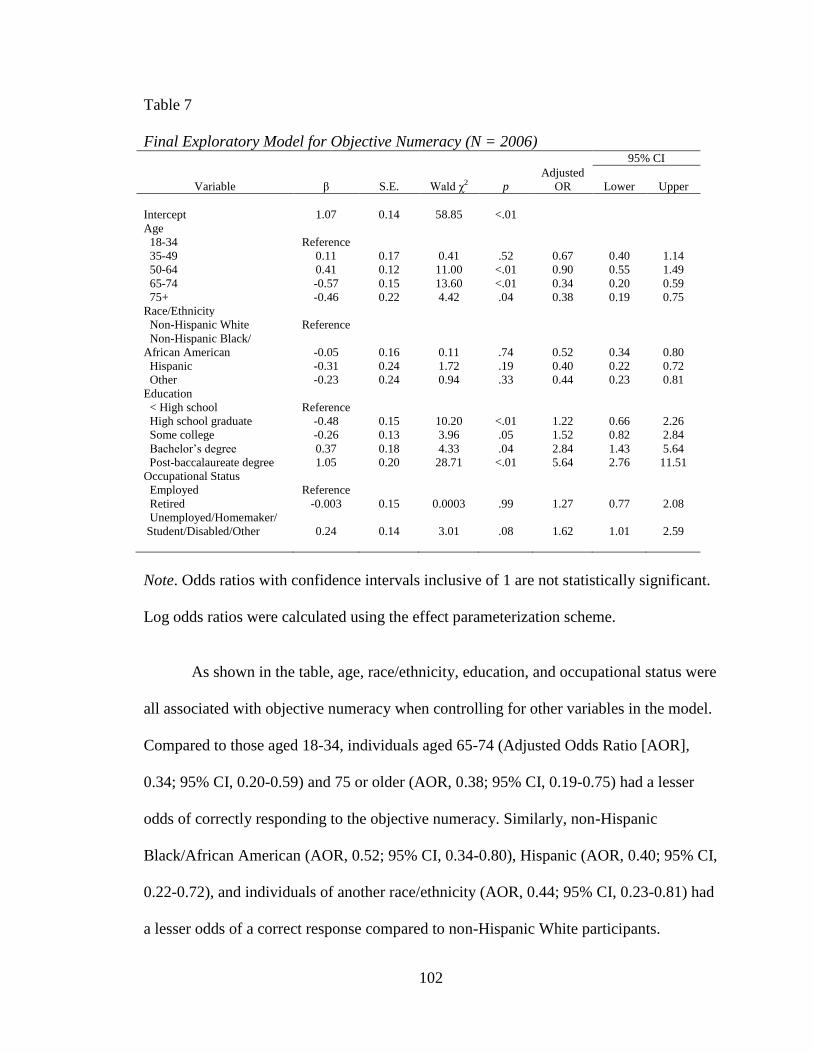
102
Table 7
Final Exploratory Model for Objective Numeracy (N = 2006) 95% CI
Variable β S.E. Wald χ2 p
Adjusted
OR Lower Upper
Intercept 1.07 0.14 58.85 <.01
Age
18-34 Reference
35-49 0.11 0.17 0.41 .52 0.67 0.40 1.14
50-64 0.41 0.12 11.00 <.01 0.90 0.55 1.49
65-74 -0.57 0.15 13.60 <.01 0.34 0.20 0.59
75+ -0.46 0.22 4.42 .04 0.38 0.19 0.75
Race/Ethnicity
Non-Hispanic White Reference
Non-Hispanic Black/
African American -0.05 0.16 0.11 .74 0.52 0.34 0.80
Hispanic -0.31 0.24 1.72 .19 0.40 0.22 0.72
Other -0.23 0.24 0.94 .33 0.44 0.23 0.81
Education
< High school Reference
High school graduate -0.48 0.15 10.20 <.01 1.22 0.66 2.26
Some college -0.26 0.13 3.96 .05 1.52 0.82 2.84
Bachelor‟s degree 0.37 0.18 4.33 .04 2.84 1.43 5.64
Post-baccalaureate degree 1.05 0.20 28.71 <.01 5.64 2.76 11.51
Occupational Status
Employed Reference
Retired -0.003 0.15 0.0003 .99 1.27 0.77 2.08
Unemployed/Homemaker/
Student/Disabled/Other 0.24 0.14 3.01 .08 1.62 1.01 2.59
Note. Odds ratios with confidence intervals inclusive of 1 are not statistically significant.
Log odds ratios were calculated using the effect parameterization scheme.
As shown in the table, age, race/ethnicity, education, and occupational status were
all associated with objective numeracy when controlling for other variables in the model.
Compared to those aged 18-34, individuals aged 65-74 (Adjusted Odds Ratio [AOR],
0.34; 95% CI, 0.20-0.59) and 75 or older (AOR, 0.38; 95% CI, 0.19-0.75) had a lesser
odds of correctly responding to the objective numeracy. Similarly, non-Hispanic
Black/African American (AOR, 0.52; 95% CI, 0.34-0.80), Hispanic (AOR, 0.40; 95% CI,
0.22-0.72), and individuals of another race/ethnicity (AOR, 0.44; 95% CI, 0.23-0.81) had
a lesser odds of a correct response compared to non-Hispanic White participants.
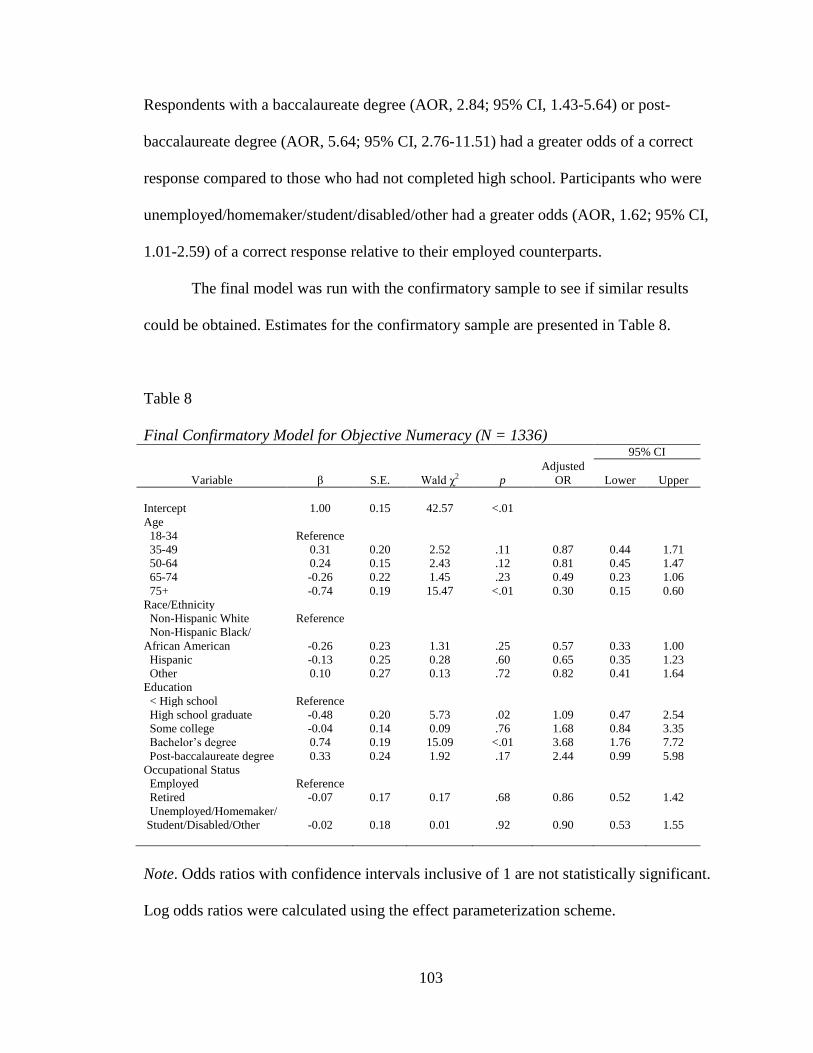
103
Respondents with a baccalaureate degree (AOR, 2.84; 95% CI, 1.43-5.64) or post-
baccalaureate degree (AOR, 5.64; 95% CI, 2.76-11.51) had a greater odds of a correct
response compared to those who had not completed high school. Participants who were
unemployed/homemaker/student/disabled/other had a greater odds (AOR, 1.62; 95% CI,
1.01-2.59) of a correct response relative to their employed counterparts.
The final model was run with the confirmatory sample to see if similar results
could be obtained. Estimates for the confirmatory sample are presented in Table 8.
Table 8
Final Confirmatory Model for Objective Numeracy (N = 1336) 95% CI
Variable β S.E. Wald χ2 p
Adjusted
OR Lower Upper
Intercept 1.00 0.15 42.57 <.01
Age
18-34 Reference
35-49 0.31 0.20 2.52 .11 0.87 0.44 1.71
50-64 0.24 0.15 2.43 .12 0.81 0.45 1.47
65-74 -0.26 0.22 1.45 .23 0.49 0.23 1.06
75+ -0.74 0.19 15.47 <.01 0.30 0.15 0.60
Race/Ethnicity
Non-Hispanic White Reference
Non-Hispanic Black/
African American -0.26 0.23 1.31 .25 0.57 0.33 1.00
Hispanic -0.13 0.25 0.28 .60 0.65 0.35 1.23
Other 0.10 0.27 0.13 .72 0.82 0.41 1.64
Education
< High school Reference
High school graduate -0.48 0.20 5.73 .02 1.09 0.47 2.54
Some college -0.04 0.14 0.09 .76 1.68 0.84 3.35
Bachelor‟s degree 0.74 0.19 15.09 <.01 3.68 1.76 7.72
Post-baccalaureate degree 0.33 0.24 1.92 .17 2.44 0.99 5.98
Occupational Status
Employed Reference
Retired -0.07 0.17 0.17 .68 0.86 0.52 1.42
Unemployed/Homemaker/
Student/Disabled/Other -0.02 0.18 0.01 .92 0.90 0.53 1.55
Note. Odds ratios with confidence intervals inclusive of 1 are not statistically significant.
Log odds ratios were calculated using the effect parameterization scheme.
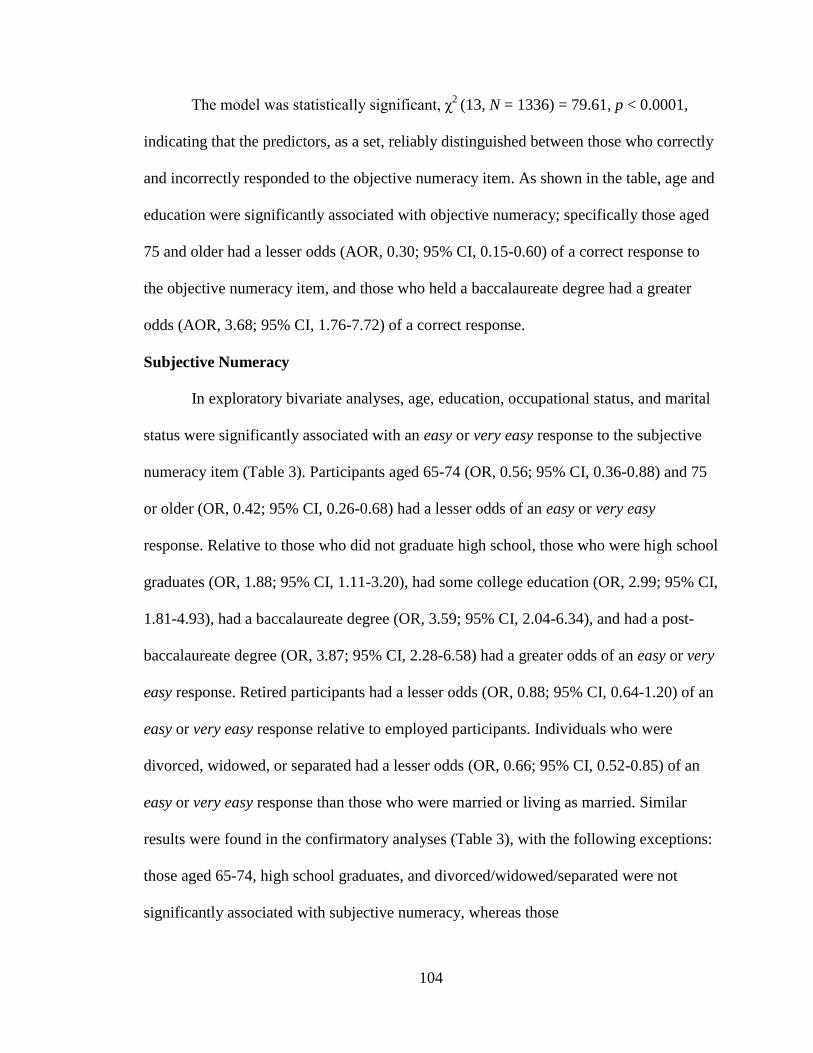
104
The model was statistically significant, χ2
(13, N = 1336) = 79.61, p < 0.0001,
indicating that the predictors, as a set, reliably distinguished between those who correctly
and incorrectly responded to the objective numeracy item. As shown in the table, age and
education were significantly associated with objective numeracy; specifically those aged
75 and older had a lesser odds (AOR, 0.30; 95% CI, 0.15-0.60) of a correct response to
the objective numeracy item, and those who held a baccalaureate degree had a greater
odds (AOR, 3.68; 95% CI, 1.76-7.72) of a correct response.
Subjective Numeracy
In exploratory bivariate analyses, age, education, occupational status, and marital
status were significantly associated with an easy or very easy response to the subjective
numeracy item (Table 3). Participants aged 65-74 (OR, 0.56; 95% CI, 0.36-0.88) and 75
or older (OR, 0.42; 95% CI, 0.26-0.68) had a lesser odds of an easy or very easy
response. Relative to those who did not graduate high school, those who were high school
graduates (OR, 1.88; 95% CI, 1.11-3.20), had some college education (OR, 2.99; 95% CI,
1.81-4.93), had a baccalaureate degree (OR, 3.59; 95% CI, 2.04-6.34), and had a post-
baccalaureate degree (OR, 3.87; 95% CI, 2.28-6.58) had a greater odds of an easy or very
easy response. Retired participants had a lesser odds (OR, 0.88; 95% CI, 0.64-1.20) of an
easy or very easy response relative to employed participants. Individuals who were
divorced, widowed, or separated had a lesser odds (OR, 0.66; 95% CI, 0.52-0.85) of an
easy or very easy response than those who were married or living as married. Similar
results were found in the confirmatory analyses (Table 3), with the following exceptions:
those aged 65-74, high school graduates, and divorced/widowed/separated were not
significantly associated with subjective numeracy, whereas those
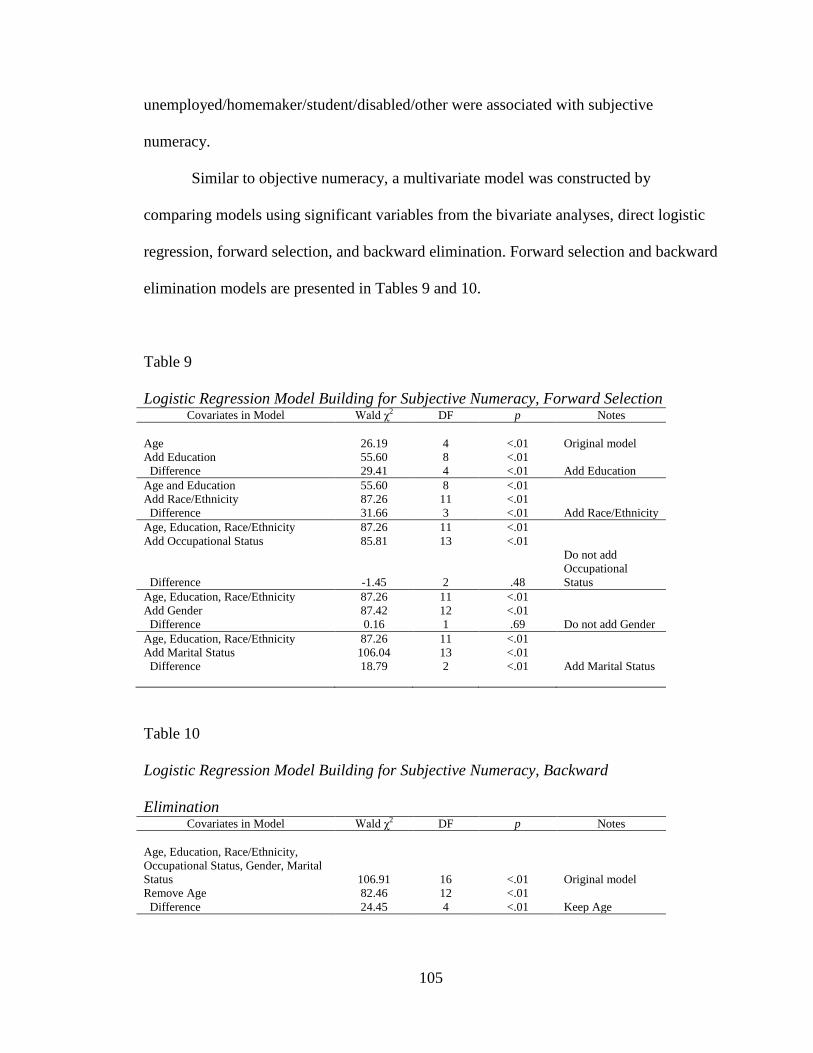
105
unemployed/homemaker/student/disabled/other were associated with subjective
numeracy.
Similar to objective numeracy, a multivariate model was constructed by
comparing models using significant variables from the bivariate analyses, direct logistic
regression, forward selection, and backward elimination. Forward selection and backward
elimination models are presented in Tables 9 and 10.
Table 9
Logistic Regression Model Building for Subjective Numeracy, Forward Selection Covariates in Model Wald χ2 DF p Notes
Age 26.19 4 <.01 Original model
Add Education 55.60 8 <.01
Difference 29.41 4 <.01 Add Education
Age and Education 55.60 8 <.01
Add Race/Ethnicity 87.26 11 <.01
Difference 31.66 3 <.01 Add Race/Ethnicity
Age, Education, Race/Ethnicity 87.26 11 <.01
Add Occupational Status 85.81 13 <.01
Difference -1.45 2 .48
Do not add
Occupational
Status
Age, Education, Race/Ethnicity 87.26 11 <.01
Add Gender 87.42 12 <.01
Difference 0.16 1 .69 Do not add Gender
Age, Education, Race/Ethnicity 87.26 11 <.01
Add Marital Status 106.04 13 <.01
Difference 18.79 2 <.01 Add Marital Status
Table 10
Logistic Regression Model Building for Subjective Numeracy, Backward
Elimination Covariates in Model Wald χ2 DF p Notes
Age, Education, Race/Ethnicity,
Occupational Status, Gender, Marital
Status 106.91 16 <.01 Original model
Remove Age 82.46 12 <.01
Difference 24.45 4 <.01 Keep Age
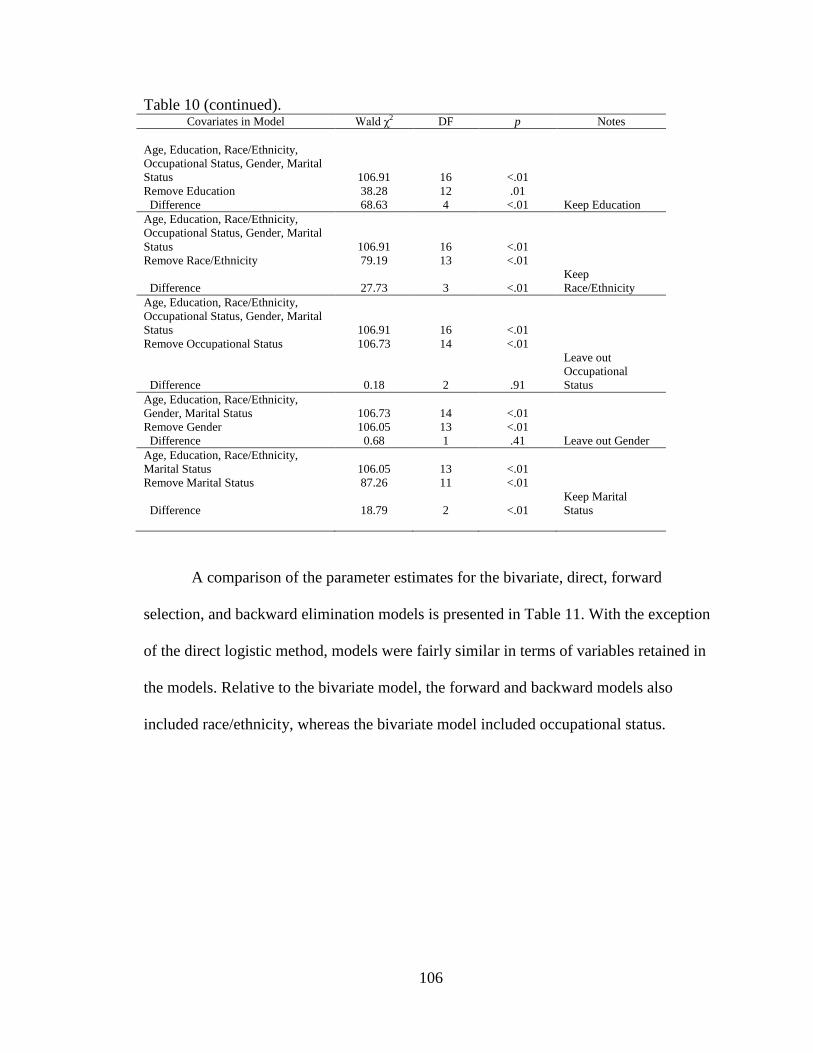
106
Table 10 (continued).
Covariates in Model Wald χ2 DF p Notes
Age, Education, Race/Ethnicity,
Occupational Status, Gender, Marital
Status 106.91 16 <.01
Remove Education 38.28 12 .01
Difference 68.63 4 <.01 Keep Education
Age, Education, Race/Ethnicity,
Occupational Status, Gender, Marital
Status 106.91 16 <.01
Remove Race/Ethnicity 79.19 13 <.01
Difference 27.73 3 <.01
Keep
Race/Ethnicity
Age, Education, Race/Ethnicity,
Occupational Status, Gender, Marital
Status 106.91 16 <.01
Remove Occupational Status 106.73 14 <.01
Difference 0.18 2 .91
Leave out
Occupational
Status
Age, Education, Race/Ethnicity,
Gender, Marital Status 106.73 14 <.01
Remove Gender 106.05 13 <.01
Difference 0.68 1 .41 Leave out Gender
Age, Education, Race/Ethnicity,
Marital Status 106.05 13 <.01
Remove Marital Status 87.26 11 <.01
Difference 18.79 2 <.01
Keep Marital
Status
A comparison of the parameter estimates for the bivariate, direct, forward
selection, and backward elimination models is presented in Table 11. With the exception
of the direct logistic method, models were fairly similar in terms of variables retained in
the models. Relative to the bivariate model, the forward and backward models also
included race/ethnicity, whereas the bivariate model included occupational status.
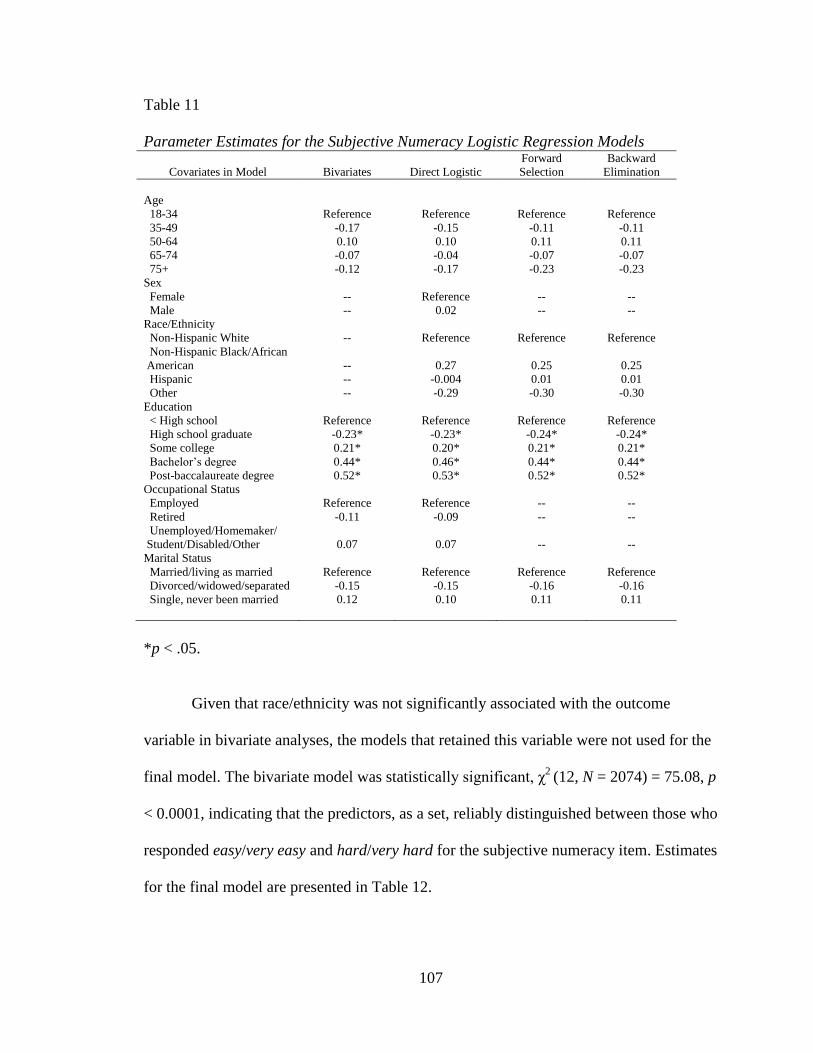
107
Table 11
Parameter Estimates for the Subjective Numeracy Logistic Regression Models
Covariates in Model Bivariates Direct Logistic
Forward
Selection
Backward
Elimination
Age
18-34 Reference Reference Reference Reference
35-49 -0.17 -0.15 -0.11 -0.11
50-64 0.10 0.10 0.11 0.11
65-74 -0.07 -0.04 -0.07 -0.07
75+ -0.12 -0.17 -0.23 -0.23
Sex
Female -- Reference -- --
Male -- 0.02 -- --
Race/Ethnicity
Non-Hispanic White -- Reference Reference Reference
Non-Hispanic Black/African
American -- 0.27 0.25 0.25
Hispanic -- -0.004 0.01 0.01
Other -- -0.29 -0.30 -0.30
Education
< High school Reference Reference Reference Reference
High school graduate -0.23* -0.23* -0.24* -0.24*
Some college 0.21* 0.20* 0.21* 0.21*
Bachelor‟s degree 0.44* 0.46* 0.44* 0.44*
Post-baccalaureate degree 0.52* 0.53* 0.52* 0.52*
Occupational Status
Employed Reference Reference -- --
Retired -0.11 -0.09 -- --
Unemployed/Homemaker/
Student/Disabled/Other 0.07 0.07 -- --
Marital Status
Married/living as married Reference Reference Reference Reference
Divorced/widowed/separated -0.15 -0.15 -0.16 -0.16
Single, never been married 0.12 0.10 0.11 0.11
*p < .05.
Given that race/ethnicity was not significantly associated with the outcome
variable in bivariate analyses, the models that retained this variable were not used for the
final model. The bivariate model was statistically significant, χ2
(12, N = 2074) = 75.08, p
< 0.0001, indicating that the predictors, as a set, reliably distinguished between those who
responded easy/very easy and hard/very hard for the subjective numeracy item. Estimates
for the final model are presented in Table 12.
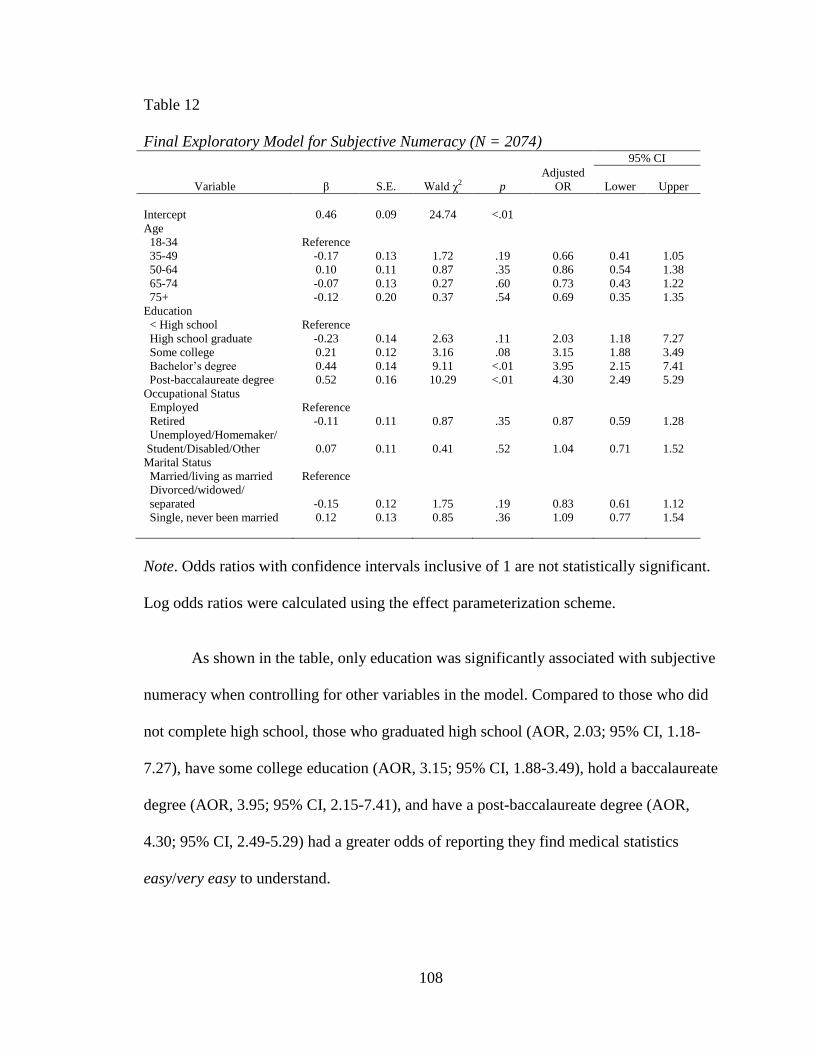
108
Table 12
Final Exploratory Model for Subjective Numeracy (N = 2074) 95% CI
Variable β S.E. Wald χ2 p
Adjusted
OR Lower Upper
Intercept 0.46 0.09 24.74 <.01
Age
18-34 Reference
35-49 -0.17 0.13 1.72 .19 0.66 0.41 1.05
50-64 0.10 0.11 0.87 .35 0.86 0.54 1.38
65-74 -0.07 0.13 0.27 .60 0.73 0.43 1.22
75+ -0.12 0.20 0.37 .54 0.69 0.35 1.35
Education
< High school Reference
High school graduate -0.23 0.14 2.63 .11 2.03 1.18 7.27
Some college 0.21 0.12 3.16 .08 3.15 1.88 3.49
Bachelor‟s degree 0.44 0.14 9.11 <.01 3.95 2.15 7.41
Post-baccalaureate degree 0.52 0.16 10.29 <.01 4.30 2.49 5.29
Occupational Status
Employed Reference
Retired -0.11 0.11 0.87 .35 0.87 0.59 1.28
Unemployed/Homemaker/
Student/Disabled/Other 0.07 0.11 0.41 .52 1.04 0.71 1.52
Marital Status
Married/living as married Reference
Divorced/widowed/
separated -0.15 0.12 1.75 .19 0.83 0.61 1.12
Single, never been married 0.12 0.13 0.85 .36 1.09 0.77 1.54
Note. Odds ratios with confidence intervals inclusive of 1 are not statistically significant.
Log odds ratios were calculated using the effect parameterization scheme.
As shown in the table, only education was significantly associated with subjective
numeracy when controlling for other variables in the model. Compared to those who did
not complete high school, those who graduated high school (AOR, 2.03; 95% CI, 1.18-
7.27), have some college education (AOR, 3.15; 95% CI, 1.88-3.49), hold a baccalaureate
degree (AOR, 3.95; 95% CI, 2.15-7.41), and have a post-baccalaureate degree (AOR,
4.30; 95% CI, 2.49-5.29) had a greater odds of reporting they find medical statistics
easy/very easy to understand.
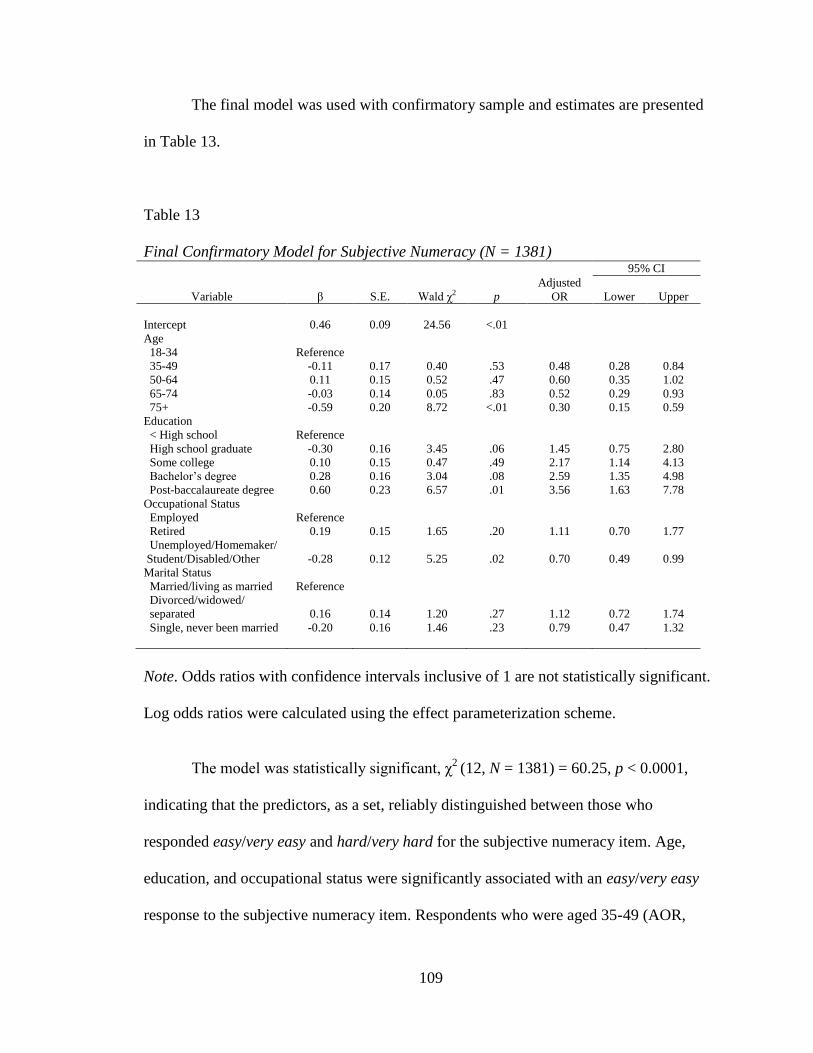
109
The final model was used with confirmatory sample and estimates are presented
in Table 13.
Table 13
Final Confirmatory Model for Subjective Numeracy (N = 1381) 95% CI
Variable β S.E. Wald χ2 p
Adjusted
OR Lower Upper
Intercept 0.46 0.09 24.56 <.01
Age
18-34 Reference
35-49 -0.11 0.17 0.40 .53 0.48 0.28 0.84
50-64 0.11 0.15 0.52 .47 0.60 0.35 1.02
65-74 -0.03 0.14 0.05 .83 0.52 0.29 0.93
75+ -0.59 0.20 8.72 <.01 0.30 0.15 0.59
Education
< High school Reference
High school graduate -0.30 0.16 3.45 .06 1.45 0.75 2.80
Some college 0.10 0.15 0.47 .49 2.17 1.14 4.13
Bachelor‟s degree 0.28 0.16 3.04 .08 2.59 1.35 4.98
Post-baccalaureate degree 0.60 0.23 6.57 .01 3.56 1.63 7.78
Occupational Status
Employed Reference
Retired 0.19 0.15 1.65 .20 1.11 0.70 1.77
Unemployed/Homemaker/
Student/Disabled/Other -0.28 0.12 5.25 .02 0.70 0.49 0.99
Marital Status
Married/living as married Reference
Divorced/widowed/
separated 0.16 0.14 1.20 .27 1.12 0.72 1.74
Single, never been married -0.20 0.16 1.46 .23 0.79 0.47 1.32
Note. Odds ratios with confidence intervals inclusive of 1 are not statistically significant.
Log odds ratios were calculated using the effect parameterization scheme.
The model was statistically significant, χ2
(12, N = 1381) = 60.25, p < 0.0001,
indicating that the predictors, as a set, reliably distinguished between those who
responded easy/very easy and hard/very hard for the subjective numeracy item. Age,
education, and occupational status were significantly associated with an easy/very easy
response to the subjective numeracy item. Respondents who were aged 35-49 (AOR,
110
0.48; 95% CI, 0.28-0.84), 65-74 (AOR, 0.52; 95% CI, 0.29-0.93), and 75 or older (AOR,
0.30; 95% CI, 0.15-0.59) had a lesser odds of an easy/very easy response than those aged
18-34. Participants with some college (AOR, 2.17; 95% CI, 1.14-4.13), a baccalaureate
degree (AOR, 2.59; 95% CI, 1.35-4.98), and a post-baccalaureate degree (AOR, 3.56;
95% CI, 1.63-7.78) had a greater odds of an easy/very easy response than those who did
not complete high school. Those unemployed/homemaker/student/disabled/other had a
lesser odds (AOR, 0.70; 95% CI, 0.49-0.99) of an easy/very easy response than employed
participants.
Research Question 2
The second research question was, “Which factors are statistically significantly
associated with individuals’ personal risk perceptions regarding cancer in general?”
It was hypothesized that objective numeracy, subjective numeracy, family member
cancer history, personal cancer history, smoking status, health status, sex, education,
ethnicity, race, age, and income would be significantly associated with individuals‟
personal risk perceptions regarding cancer in general.
Previous Cancer Diagnosis
In exploratory bivariate analyses, race/ethnicity, objective numeracy, and
smoking status were significantly associated with a somewhat high or very high perceived
risk of a future cancer diagnosis among those previously diagnosed with cancer (Table
14). Non-Hispanic Black/African American participants had a lesser odds (OR, 0.29;
95% CI, 0.10-0.80) of a somewhat high or very high perceived risk of a future cancer
diagnosis than Non-Hispanic White participants. Compared to those who provided a
correct response to the objective numeracy item, those who provided an incorrect
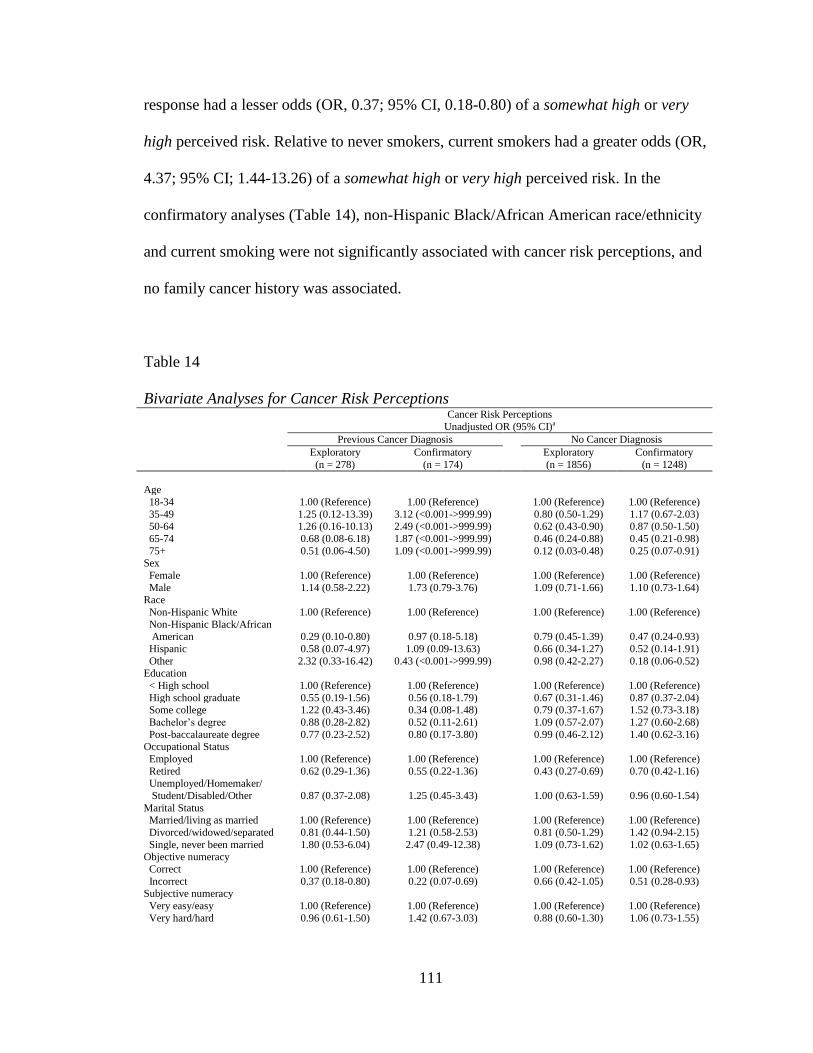
111
response had a lesser odds (OR, 0.37; 95% CI, 0.18-0.80) of a somewhat high or very
high perceived risk. Relative to never smokers, current smokers had a greater odds (OR,
4.37; 95% CI; 1.44-13.26) of a somewhat high or very high perceived risk. In the
confirmatory analyses (Table 14), non-Hispanic Black/African American race/ethnicity
and current smoking were not significantly associated with cancer risk perceptions, and
no family cancer history was associated.
Table 14
Bivariate Analyses for Cancer Risk Perceptions Cancer Risk Perceptions
Unadjusted OR (95% CI)a
Previous Cancer Diagnosis No Cancer Diagnosis
Exploratory
(n = 278)
Confirmatory
(n = 174)
Exploratory
(n = 1856)
Confirmatory
(n = 1248)
Age
18-34 1.00 (Reference) 1.00 (Reference) 1.00 (Reference) 1.00 (Reference)
35-49 1.25 (0.12-13.39) 3.12 (<0.001->999.99) 0.80 (0.50-1.29) 1.17 (0.67-2.03) 50-64 1.26 (0.16-10.13) 2.49 (<0.001->999.99) 0.62 (0.43-0.90) 0.87 (0.50-1.50)
65-74 0.68 (0.08-6.18) 1.87 (<0.001->999.99) 0.46 (0.24-0.88) 0.45 (0.21-0.98)
75+ 0.51 (0.06-4.50) 1.09 (<0.001->999.99) 0.12 (0.03-0.48) 0.25 (0.07-0.91) Sex
Female 1.00 (Reference) 1.00 (Reference) 1.00 (Reference) 1.00 (Reference)
Male 1.14 (0.58-2.22) 1.73 (0.79-3.76) 1.09 (0.71-1.66) 1.10 (0.73-1.64) Race
Non-Hispanic White 1.00 (Reference) 1.00 (Reference) 1.00 (Reference) 1.00 (Reference)
Non-Hispanic Black/African American 0.29 (0.10-0.80) 0.97 (0.18-5.18)
0.79 (0.45-1.39) 0.47 (0.24-0.93)
Hispanic 0.58 (0.07-4.97) 1.09 (0.09-13.63) 0.66 (0.34-1.27) 0.52 (0.14-1.91)
Other 2.32 (0.33-16.42) 0.43 (<0.001->999.99) 0.98 (0.42-2.27) 0.18 (0.06-0.52) Education
< High school 1.00 (Reference) 1.00 (Reference) 1.00 (Reference) 1.00 (Reference)
High school graduate 0.55 (0.19-1.56) 0.56 (0.18-1.79) 0.67 (0.31-1.46) 0.87 (0.37-2.04) Some college 1.22 (0.43-3.46) 0.34 (0.08-1.48) 0.79 (0.37-1.67) 1.52 (0.73-3.18)
Bachelor‟s degree 0.88 (0.28-2.82) 0.52 (0.11-2.61) 1.09 (0.57-2.07) 1.27 (0.60-2.68)
Post-baccalaureate degree 0.77 (0.23-2.52) 0.80 (0.17-3.80) 0.99 (0.46-2.12) 1.40 (0.62-3.16) Occupational Status
Employed 1.00 (Reference) 1.00 (Reference) 1.00 (Reference) 1.00 (Reference)
Retired 0.62 (0.29-1.36) 0.55 (0.22-1.36) 0.43 (0.27-0.69) 0.70 (0.42-1.16) Unemployed/Homemaker/
Student/Disabled/Other 0.87 (0.37-2.08) 1.25 (0.45-3.43)
1.00 (0.63-1.59) 0.96 (0.60-1.54)
Marital Status Married/living as married 1.00 (Reference) 1.00 (Reference) 1.00 (Reference) 1.00 (Reference)
Divorced/widowed/separated 0.81 (0.44-1.50) 1.21 (0.58-2.53) 0.81 (0.50-1.29) 1.42 (0.94-2.15)
Single, never been married 1.80 (0.53-6.04) 2.47 (0.49-12.38) 1.09 (0.73-1.62) 1.02 (0.63-1.65) Objective numeracy
Correct 1.00 (Reference) 1.00 (Reference) 1.00 (Reference) 1.00 (Reference)
Incorrect 0.37 (0.18-0.80) 0.22 (0.07-0.69) 0.66 (0.42-1.05) 0.51 (0.28-0.93) Subjective numeracy
Very easy/easy 1.00 (Reference) 1.00 (Reference) 1.00 (Reference) 1.00 (Reference)
Very hard/hard 0.96 (0.61-1.50) 1.42 (0.67-3.03) 0.88 (0.60-1.30) 1.06 (0.73-1.55)
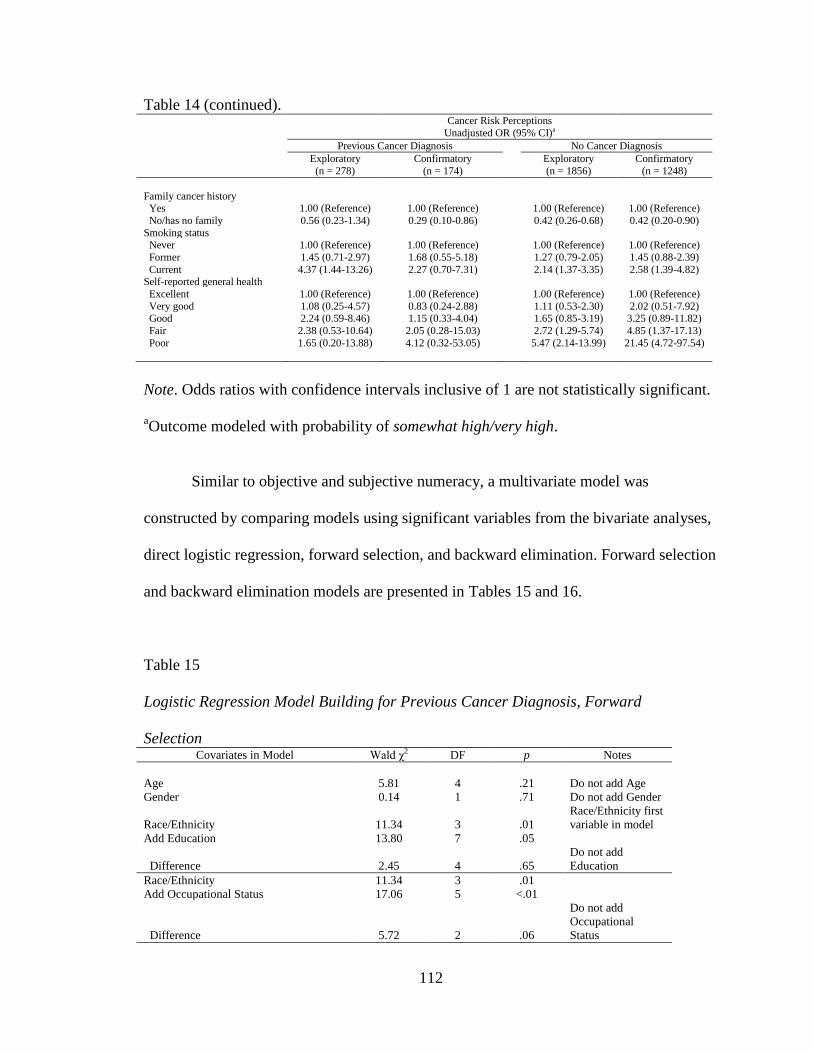
112
Table 14 (continued).
Cancer Risk Perceptions
Unadjusted OR (95% CI)a
Previous Cancer Diagnosis No Cancer Diagnosis
Exploratory
(n = 278)
Confirmatory
(n = 174)
Exploratory
(n = 1856)
Confirmatory
(n = 1248)
Family cancer history Yes 1.00 (Reference) 1.00 (Reference) 1.00 (Reference) 1.00 (Reference)
No/has no family 0.56 (0.23-1.34) 0.29 (0.10-0.86) 0.42 (0.26-0.68) 0.42 (0.20-0.90)
Smoking status Never 1.00 (Reference) 1.00 (Reference) 1.00 (Reference) 1.00 (Reference)
Former 1.45 (0.71-2.97) 1.68 (0.55-5.18) 1.27 (0.79-2.05) 1.45 (0.88-2.39)
Current 4.37 (1.44-13.26) 2.27 (0.70-7.31) 2.14 (1.37-3.35) 2.58 (1.39-4.82) Self-reported general health
Excellent 1.00 (Reference) 1.00 (Reference) 1.00 (Reference) 1.00 (Reference)
Very good 1.08 (0.25-4.57) 0.83 (0.24-2.88) 1.11 (0.53-2.30) 2.02 (0.51-7.92) Good 2.24 (0.59-8.46) 1.15 (0.33-4.04) 1.65 (0.85-3.19) 3.25 (0.89-11.82)
Fair 2.38 (0.53-10.64) 2.05 (0.28-15.03) 2.72 (1.29-5.74) 4.85 (1.37-17.13)
Poor 1.65 (0.20-13.88) 4.12 (0.32-53.05) 5.47 (2.14-13.99) 21.45 (4.72-97.54)
Note. Odds ratios with confidence intervals inclusive of 1 are not statistically significant.
aOutcome modeled with probability of somewhat high/very high.
Similar to objective and subjective numeracy, a multivariate model was
constructed by comparing models using significant variables from the bivariate analyses,
direct logistic regression, forward selection, and backward elimination. Forward selection
and backward elimination models are presented in Tables 15 and 16.
Table 15
Logistic Regression Model Building for Previous Cancer Diagnosis, Forward
Selection Covariates in Model Wald χ2 DF p Notes
Age 5.81 4 .21 Do not add Age
Gender 0.14 1 .71 Do not add Gender
Race/Ethnicity 11.34 3 .01
Race/Ethnicity first
variable in model
Add Education 13.80 7 .05
Difference 2.45 4 .65
Do not add
Education
Race/Ethnicity 11.34 3 .01
Add Occupational Status 17.06 5 <.01
Difference 5.72 2 .06
Do not add
Occupational
Status
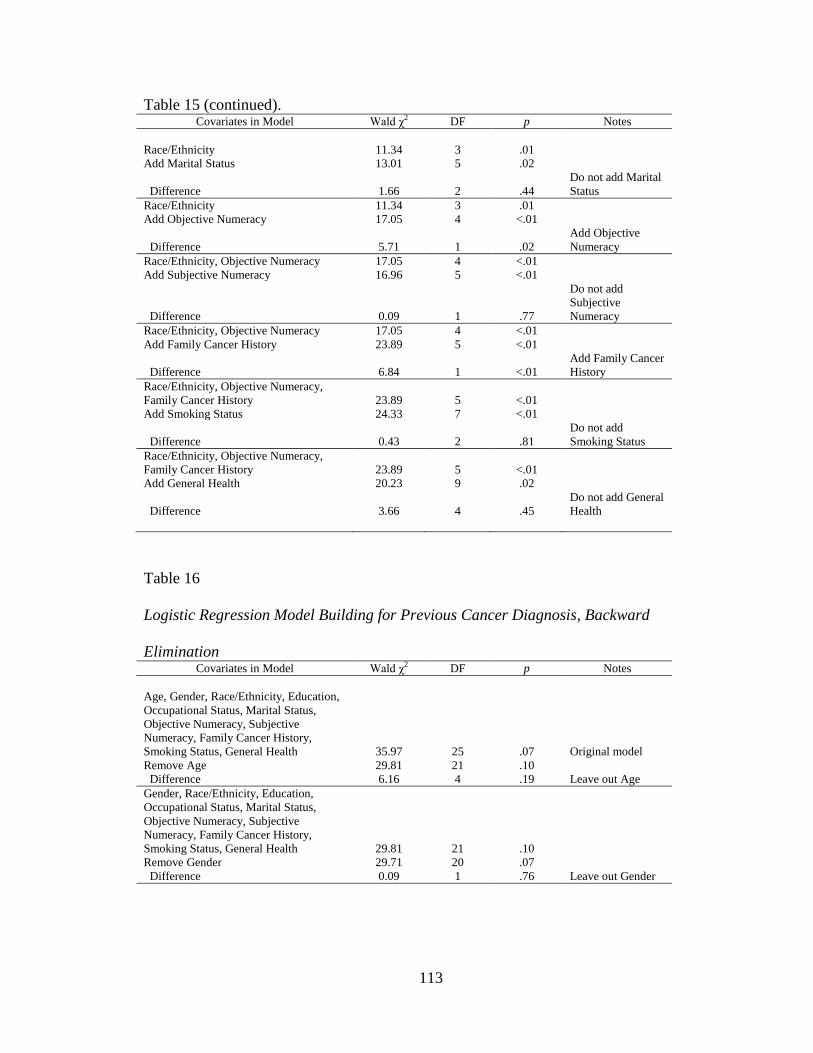
113
Table 15 (continued).
Covariates in Model Wald χ2 DF p Notes
Race/Ethnicity 11.34 3 .01
Add Marital Status 13.01 5 .02
Difference 1.66 2 .44
Do not add Marital
Status
Race/Ethnicity 11.34 3 .01
Add Objective Numeracy 17.05 4 <.01
Difference 5.71 1 .02
Add Objective
Numeracy
Race/Ethnicity, Objective Numeracy 17.05 4 <.01
Add Subjective Numeracy 16.96 5 <.01
Difference 0.09 1 .77
Do not add
Subjective
Numeracy
Race/Ethnicity, Objective Numeracy 17.05 4 <.01
Add Family Cancer History 23.89 5 <.01
Difference 6.84 1 <.01
Add Family Cancer
History
Race/Ethnicity, Objective Numeracy,
Family Cancer History 23.89 5 <.01
Add Smoking Status 24.33 7 <.01
Difference 0.43 2 .81
Do not add
Smoking Status
Race/Ethnicity, Objective Numeracy,
Family Cancer History 23.89 5 <.01
Add General Health 20.23 9 .02
Difference 3.66 4 .45
Do not add General
Health
Table 16
Logistic Regression Model Building for Previous Cancer Diagnosis, Backward
Elimination Covariates in Model Wald χ2 DF p Notes
Age, Gender, Race/Ethnicity, Education,
Occupational Status, Marital Status,
Objective Numeracy, Subjective
Numeracy, Family Cancer History,
Smoking Status, General Health 35.97 25 .07 Original model
Remove Age 29.81 21 .10
Difference 6.16 4 .19 Leave out Age
Gender, Race/Ethnicity, Education,
Occupational Status, Marital Status,
Objective Numeracy, Subjective
Numeracy, Family Cancer History,
Smoking Status, General Health 29.81 21 .10
Remove Gender 29.71 20 .07
Difference 0.09 1 .76 Leave out Gender
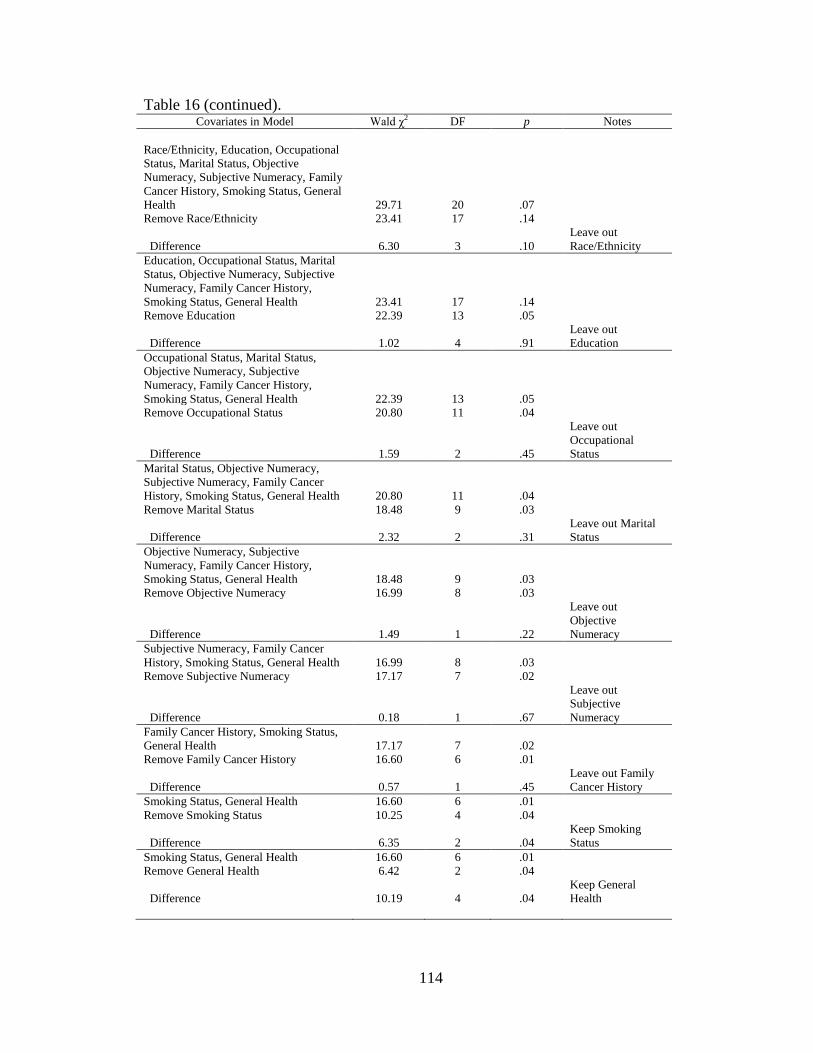
114
Table 16 (continued).
Covariates in Model Wald χ2 DF p Notes
Race/Ethnicity, Education, Occupational
Status, Marital Status, Objective
Numeracy, Subjective Numeracy, Family
Cancer History, Smoking Status, General
Health 29.71 20 .07
Remove Race/Ethnicity 23.41 17 .14
Difference 6.30 3 .10
Leave out
Race/Ethnicity
Education, Occupational Status, Marital
Status, Objective Numeracy, Subjective
Numeracy, Family Cancer History,
Smoking Status, General Health 23.41 17 .14
Remove Education 22.39 13 .05
Difference 1.02 4 .91
Leave out
Education
Occupational Status, Marital Status,
Objective Numeracy, Subjective
Numeracy, Family Cancer History,
Smoking Status, General Health 22.39 13 .05
Remove Occupational Status 20.80 11 .04
Difference 1.59 2 .45
Leave out
Occupational
Status
Marital Status, Objective Numeracy,
Subjective Numeracy, Family Cancer
History, Smoking Status, General Health 20.80 11 .04
Remove Marital Status 18.48 9 .03
Difference 2.32 2 .31
Leave out Marital
Status
Objective Numeracy, Subjective
Numeracy, Family Cancer History,
Smoking Status, General Health 18.48 9 .03
Remove Objective Numeracy 16.99 8 .03
Difference 1.49 1 .22
Leave out
Objective
Numeracy
Subjective Numeracy, Family Cancer
History, Smoking Status, General Health 16.99 8 .03
Remove Subjective Numeracy 17.17 7 .02
Difference 0.18 1 .67
Leave out
Subjective
Numeracy
Family Cancer History, Smoking Status,
General Health 17.17 7 .02
Remove Family Cancer History 16.60 6 .01
Difference 0.57 1 .45
Leave out Family
Cancer History
Smoking Status, General Health 16.60 6 .01
Remove Smoking Status 10.25 4 .04
Difference 6.35 2 .04
Keep Smoking
Status
Smoking Status, General Health 16.60 6 .01
Remove General Health 6.42 2 .04
Difference 10.19 4 .04
Keep General
Health
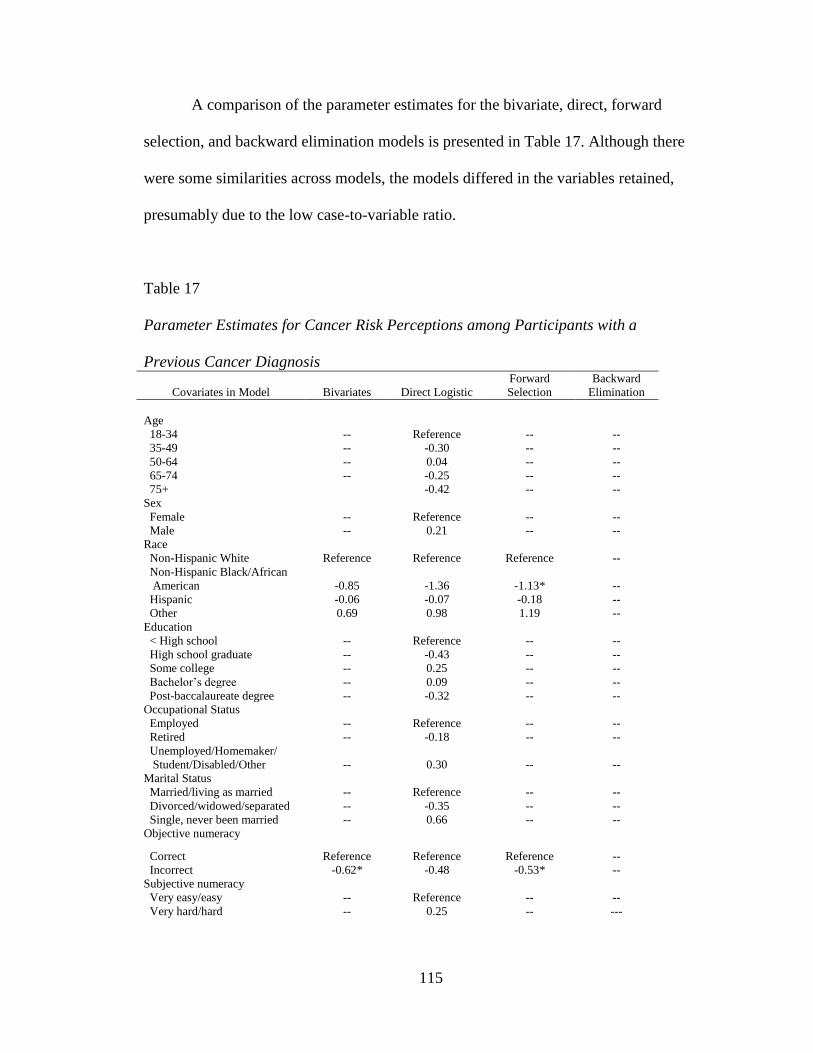
115
A comparison of the parameter estimates for the bivariate, direct, forward
selection, and backward elimination models is presented in Table 17. Although there
were some similarities across models, the models differed in the variables retained,
presumably due to the low case-to-variable ratio.
Table 17
Parameter Estimates for Cancer Risk Perceptions among Participants with a
Previous Cancer Diagnosis
Covariates in Model Bivariates Direct Logistic
Forward
Selection
Backward
Elimination
Age
18-34 -- Reference -- --
35-49 -- -0.30 -- --
50-64 -- 0.04 -- --
65-74 -- -0.25 -- --
75+ -0.42 -- --
Sex
Female -- Reference -- --
Male -- 0.21 -- --
Race
Non-Hispanic White Reference Reference Reference --
Non-Hispanic Black/African
American -0.85 -1.36 -1.13* --
Hispanic -0.06 -0.07 -0.18 --
Other 0.69 0.98 1.19 --
Education
< High school -- Reference -- --
High school graduate -- -0.43 -- --
Some college -- 0.25 -- --
Bachelor‟s degree -- 0.09 -- --
Post-baccalaureate degree -- -0.32 -- --
Occupational Status
Employed -- Reference -- --
Retired -- -0.18 -- --
Unemployed/Homemaker/
Student/Disabled/Other -- 0.30 -- --
Marital Status
Married/living as married -- Reference -- --
Divorced/widowed/separated -- -0.35 -- --
Single, never been married -- 0.66 -- --
Objective numeracy
Correct Reference Reference Reference --
Incorrect -0.62* -0.48 -0.53* --
Subjective numeracy
Very easy/easy -- Reference -- --
Very hard/hard -- 0.25 -- ---
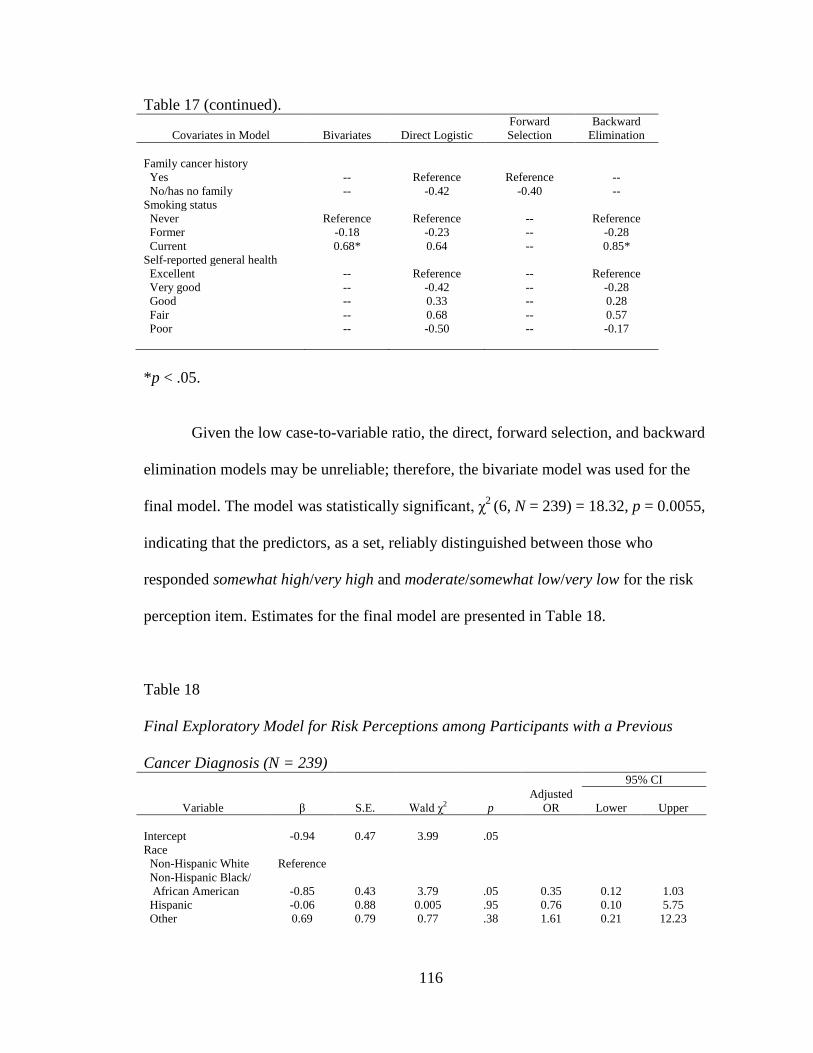
116
Table 17 (continued).
Covariates in Model Bivariates Direct Logistic
Forward
Selection
Backward
Elimination
Family cancer history
Yes -- Reference Reference --
No/has no family -- -0.42 -0.40 --
Smoking status
Never Reference Reference -- Reference
Former -0.18 -0.23 -- -0.28
Current 0.68* 0.64 -- 0.85*
Self-reported general health
Excellent -- Reference -- Reference
Very good -- -0.42 -- -0.28
Good -- 0.33 -- 0.28
Fair -- 0.68 -- 0.57
Poor -- -0.50 -- -0.17
*p < .05.
Given the low case-to-variable ratio, the direct, forward selection, and backward
elimination models may be unreliable; therefore, the bivariate model was used for the
final model. The model was statistically significant, χ2
(6, N = 239) = 18.32, p = 0.0055,
indicating that the predictors, as a set, reliably distinguished between those who
responded somewhat high/very high and moderate/somewhat low/very low for the risk
perception item. Estimates for the final model are presented in Table 18.
Table 18
Final Exploratory Model for Risk Perceptions among Participants with a Previous
Cancer Diagnosis (N = 239) 95% CI
Variable β S.E. Wald χ2 p
Adjusted
OR Lower Upper
Intercept -0.94 0.47 3.99 .05
Race
Non-Hispanic White Reference
Non-Hispanic Black/
African American -0.85 0.43 3.79 .05 0.35 0.12 1.03
Hispanic -0.06 0.88 0.005 .95 0.76 0.10 5.75
Other 0.69 0.79 0.77 .38 1.61 0.21 12.23
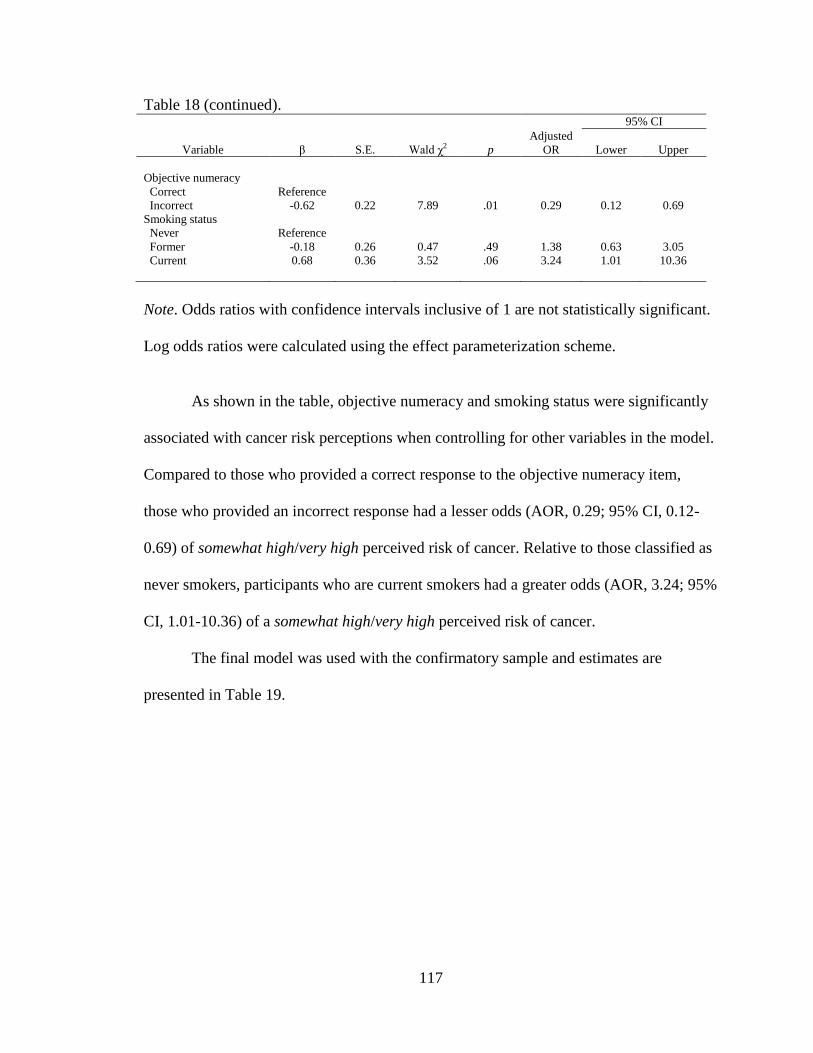
117
Table 18 (continued).
95% CI
Variable β S.E. Wald χ2 p
Adjusted
OR Lower Upper
Objective numeracy
Correct Reference
Incorrect -0.62 0.22 7.89 .01 0.29 0.12 0.69
Smoking status
Never Reference
Former -0.18 0.26 0.47 .49 1.38 0.63 3.05
Current 0.68 0.36 3.52 .06 3.24 1.01 10.36
Note. Odds ratios with confidence intervals inclusive of 1 are not statistically significant.
Log odds ratios were calculated using the effect parameterization scheme.
As shown in the table, objective numeracy and smoking status were significantly
associated with cancer risk perceptions when controlling for other variables in the model.
Compared to those who provided a correct response to the objective numeracy item,
those who provided an incorrect response had a lesser odds (AOR, 0.29; 95% CI, 0.12-
0.69) of somewhat high/very high perceived risk of cancer. Relative to those classified as
never smokers, participants who are current smokers had a greater odds (AOR, 3.24; 95%
CI, 1.01-10.36) of a somewhat high/very high perceived risk of cancer.
The final model was used with the confirmatory sample and estimates are
presented in Table 19.
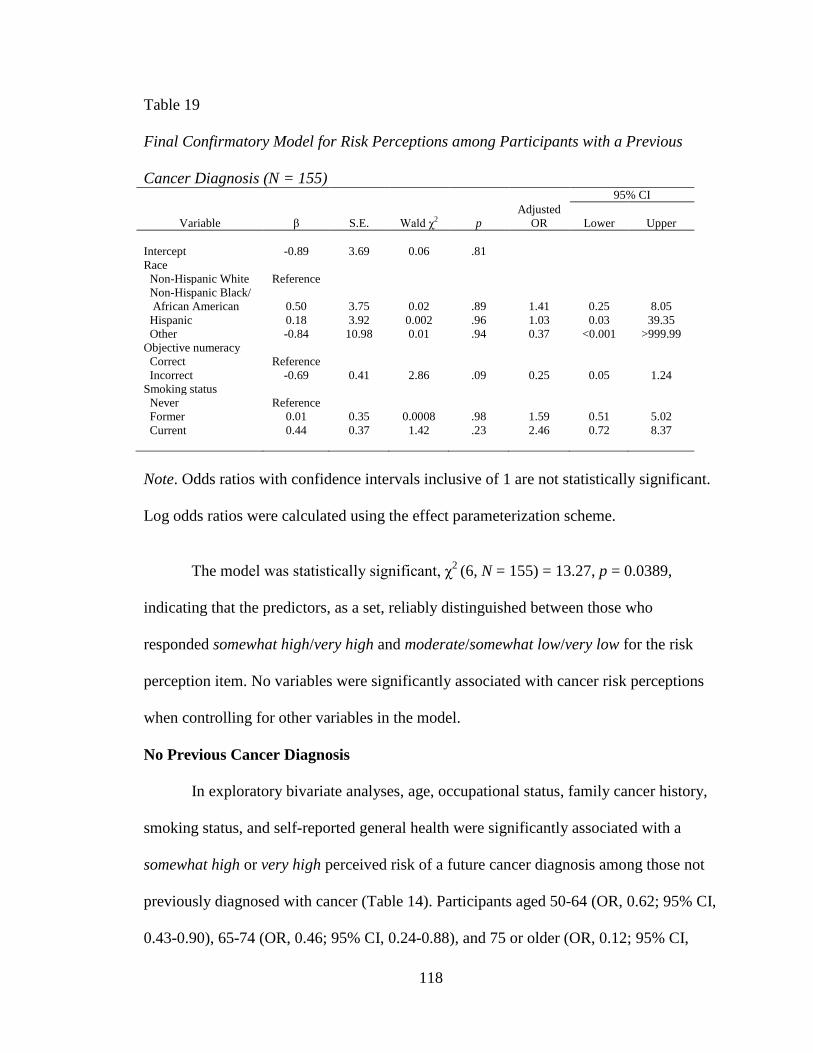
118
Table 19
Final Confirmatory Model for Risk Perceptions among Participants with a Previous
Cancer Diagnosis (N = 155) 95% CI
Variable β S.E. Wald χ2 p
Adjusted
OR Lower Upper
Intercept -0.89 3.69 0.06 .81
Race
Non-Hispanic White Reference
Non-Hispanic Black/
African American 0.50 3.75 0.02 .89 1.41 0.25 8.05
Hispanic 0.18 3.92 0.002 .96 1.03 0.03 39.35
Other -0.84 10.98 0.01 .94 0.37 <0.001 >999.99
Objective numeracy
Correct Reference
Incorrect -0.69 0.41 2.86 .09 0.25 0.05 1.24
Smoking status
Never Reference
Former 0.01 0.35 0.0008 .98 1.59 0.51 5.02
Current 0.44 0.37 1.42 .23 2.46 0.72 8.37
Note. Odds ratios with confidence intervals inclusive of 1 are not statistically significant.
Log odds ratios were calculated using the effect parameterization scheme.
The model was statistically significant, χ2
(6, N = 155) = 13.27, p = 0.0389,
indicating that the predictors, as a set, reliably distinguished between those who
responded somewhat high/very high and moderate/somewhat low/very low for the risk
perception item. No variables were significantly associated with cancer risk perceptions
when controlling for other variables in the model.
No Previous Cancer Diagnosis
In exploratory bivariate analyses, age, occupational status, family cancer history,
smoking status, and self-reported general health were significantly associated with a
somewhat high or very high perceived risk of a future cancer diagnosis among those not
previously diagnosed with cancer (Table 14). Participants aged 50-64 (OR, 0.62; 95% CI,
0.43-0.90), 65-74 (OR, 0.46; 95% CI, 0.24-0.88), and 75 or older (OR, 0.12; 95% CI,
119
0.03-0.48) had a lesser odds of a somewhat high or very high perceived risk of a future
cancer diagnosis compared to those aged 18-34. Retired respondents had a lesser odds
(OR, 0.43; 95% CI, 0.27-0.69) of a somewhat high or very high perceived risk compared
to employed respondents. Compared to participants with a family cancer history, those
without a family history or who had no family had a lesser odds (OR, 0.42; 95% CI, 0.26-
0.68) of a somewhat high or very high perceived risk. Current smokers had a greater odds
(OR, 2.14; 95% CI, 1.37-3.35) of a somewhat high or very high perceived risk than never
smokers. Those who reported fair (OR, 2.72; 95% CI, 1.29-5.74) or poor health (OR,
5.47; 95% CI, 2.14-13.99) had a greater odds of a somewhat high or very high perceived
risk compared to those who reported excellent health. In the confirmatory analyses (Table
14), age 50-64 and retired occupational status were not significantly associated with
cancer risk perceptions. Additionally, objective numeracy and non-Hispanic
Black/African American and other race/ethnicity were significantly associated with
cancer risk perceptions.
A multivariate model was constructed by comparing models using significant
variables from the bivariate analyses, direct logistic regression, forward selection, and
backward elimination. Forward selection and backward elimination models are presented
in Tables 20 and 21.
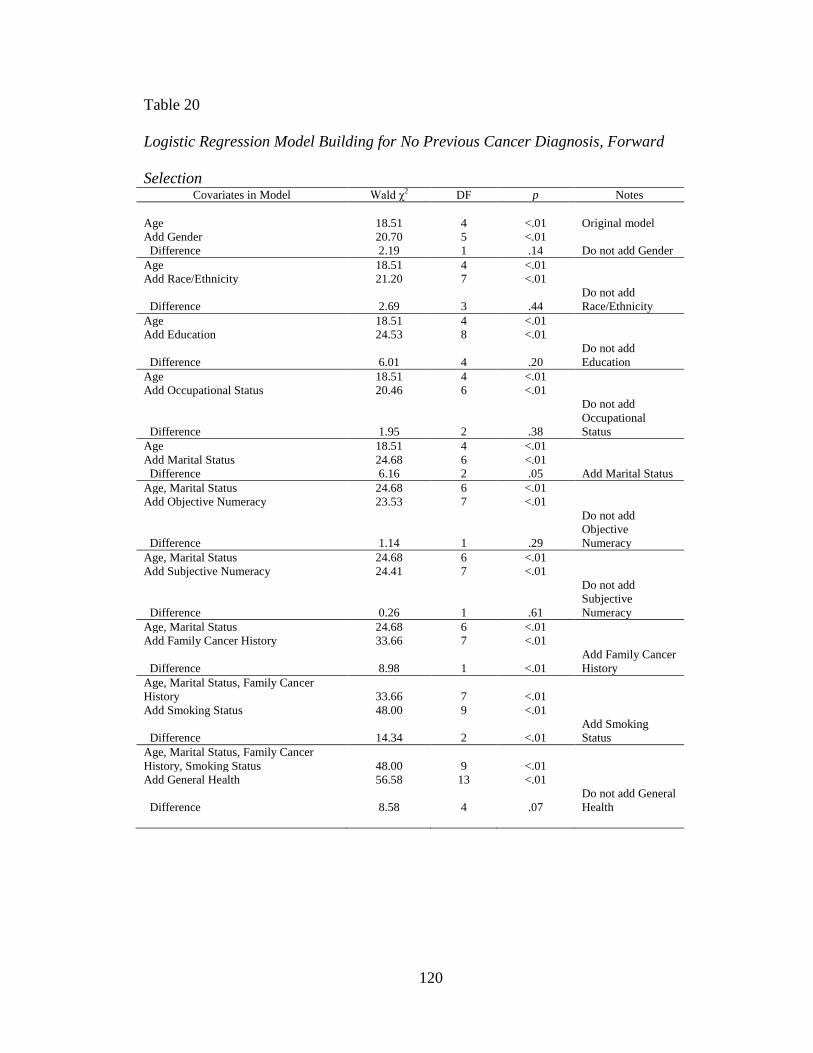
120
Table 20
Logistic Regression Model Building for No Previous Cancer Diagnosis, Forward
Selection Covariates in Model Wald χ2 DF p Notes
Age 18.51 4 <.01 Original model
Add Gender 20.70 5 <.01
Difference 2.19 1 .14 Do not add Gender
Age 18.51 4 <.01
Add Race/Ethnicity 21.20 7 <.01
Difference 2.69 3 .44
Do not add
Race/Ethnicity
Age 18.51 4 <.01
Add Education 24.53 8 <.01
Difference 6.01 4 .20
Do not add
Education
Age 18.51 4 <.01
Add Occupational Status 20.46 6 <.01
Difference 1.95 2 .38
Do not add
Occupational
Status
Age 18.51 4 <.01
Add Marital Status 24.68 6 <.01
Difference 6.16 2 .05 Add Marital Status
Age, Marital Status 24.68 6 <.01
Add Objective Numeracy 23.53 7 <.01
Difference 1.14 1 .29
Do not add
Objective
Numeracy
Age, Marital Status 24.68 6 <.01
Add Subjective Numeracy 24.41 7 <.01
Difference 0.26 1 .61
Do not add
Subjective
Numeracy
Age, Marital Status 24.68 6 <.01
Add Family Cancer History 33.66 7 <.01
Difference 8.98 1 <.01
Add Family Cancer
History
Age, Marital Status, Family Cancer
History 33.66 7 <.01
Add Smoking Status 48.00 9 <.01
Difference 14.34 2 <.01
Add Smoking
Status
Age, Marital Status, Family Cancer
History, Smoking Status 48.00 9 <.01
Add General Health 56.58 13 <.01
Difference 8.58 4 .07
Do not add General
Health
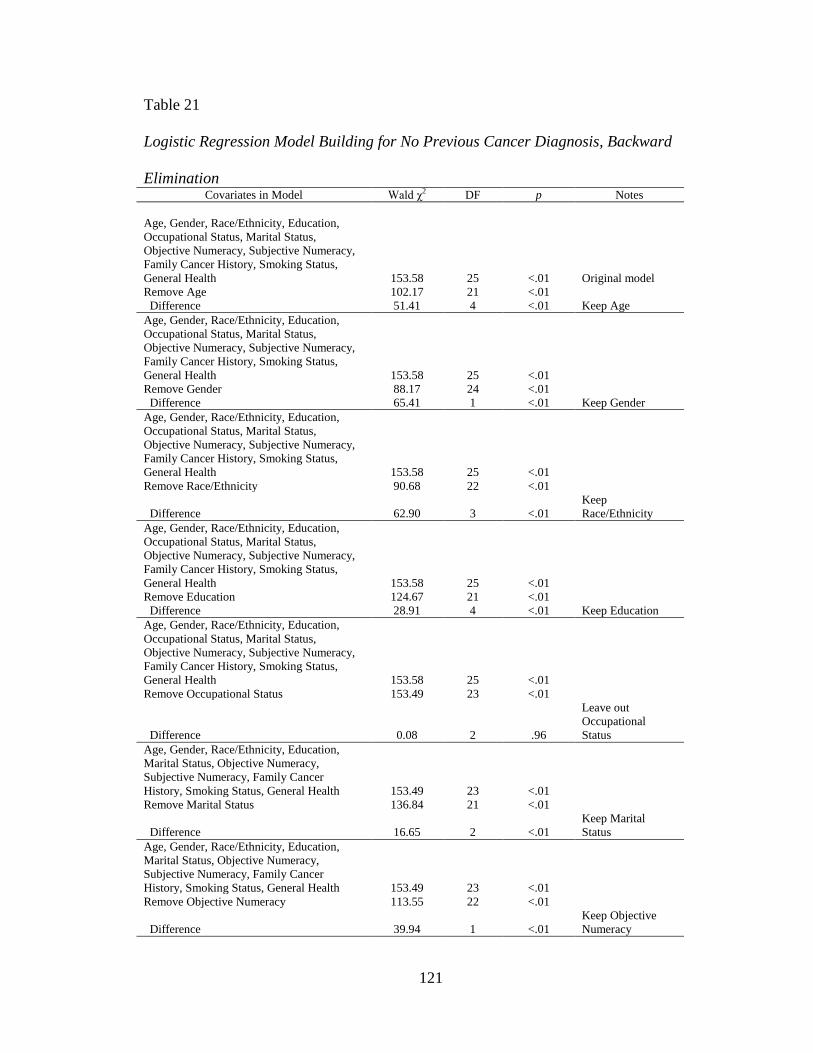
121
Table 21
Logistic Regression Model Building for No Previous Cancer Diagnosis, Backward
Elimination Covariates in Model Wald χ2 DF p Notes
Age, Gender, Race/Ethnicity, Education,
Occupational Status, Marital Status,
Objective Numeracy, Subjective Numeracy,
Family Cancer History, Smoking Status,
General Health 153.58 25 <.01 Original model
Remove Age 102.17 21 <.01
Difference 51.41 4 <.01 Keep Age
Age, Gender, Race/Ethnicity, Education,
Occupational Status, Marital Status,
Objective Numeracy, Subjective Numeracy,
Family Cancer History, Smoking Status,
General Health 153.58 25 <.01
Remove Gender 88.17 24 <.01
Difference 65.41 1 <.01 Keep Gender
Age, Gender, Race/Ethnicity, Education,
Occupational Status, Marital Status,
Objective Numeracy, Subjective Numeracy,
Family Cancer History, Smoking Status,
General Health 153.58 25 <.01
Remove Race/Ethnicity 90.68 22 <.01
Difference 62.90 3 <.01
Keep
Race/Ethnicity
Age, Gender, Race/Ethnicity, Education,
Occupational Status, Marital Status,
Objective Numeracy, Subjective Numeracy,
Family Cancer History, Smoking Status,
General Health 153.58 25 <.01
Remove Education 124.67 21 <.01
Difference 28.91 4 <.01 Keep Education
Age, Gender, Race/Ethnicity, Education,
Occupational Status, Marital Status,
Objective Numeracy, Subjective Numeracy,
Family Cancer History, Smoking Status,
General Health 153.58 25 <.01
Remove Occupational Status 153.49 23 <.01
Difference 0.08 2 .96
Leave out
Occupational
Status
Age, Gender, Race/Ethnicity, Education,
Marital Status, Objective Numeracy,
Subjective Numeracy, Family Cancer
History, Smoking Status, General Health 153.49 23 <.01
Remove Marital Status 136.84 21 <.01
Difference 16.65 2 <.01
Keep Marital
Status
Age, Gender, Race/Ethnicity, Education,
Marital Status, Objective Numeracy,
Subjective Numeracy, Family Cancer
History, Smoking Status, General Health 153.49 23 <.01
Remove Objective Numeracy 113.55 22 <.01
Difference 39.94 1 <.01
Keep Objective
Numeracy
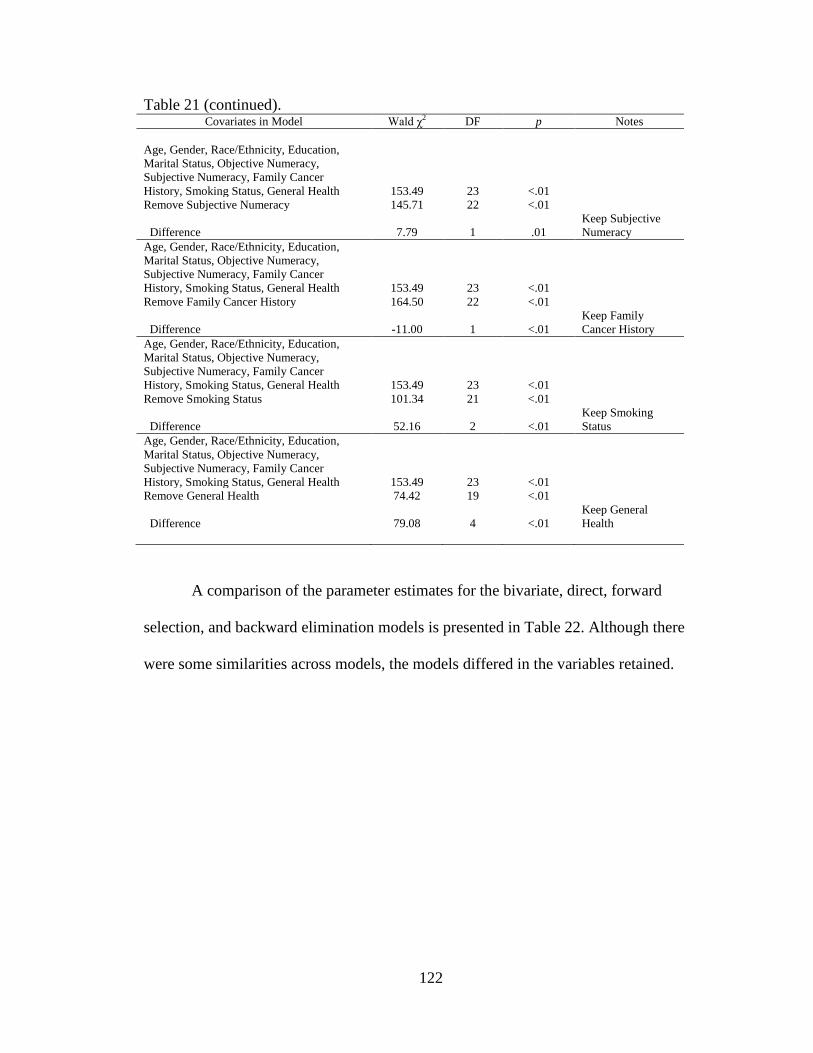
122
Table 21 (continued).
Covariates in Model Wald χ2 DF p Notes
Age, Gender, Race/Ethnicity, Education,
Marital Status, Objective Numeracy,
Subjective Numeracy, Family Cancer
History, Smoking Status, General Health 153.49 23 <.01
Remove Subjective Numeracy 145.71 22 <.01
Difference 7.79 1 .01
Keep Subjective
Numeracy
Age, Gender, Race/Ethnicity, Education,
Marital Status, Objective Numeracy,
Subjective Numeracy, Family Cancer
History, Smoking Status, General Health 153.49 23 <.01
Remove Family Cancer History 164.50 22 <.01
Difference -11.00 1 <.01
Keep Family
Cancer History
Age, Gender, Race/Ethnicity, Education,
Marital Status, Objective Numeracy,
Subjective Numeracy, Family Cancer
History, Smoking Status, General Health 153.49 23 <.01
Remove Smoking Status 101.34 21 <.01
Difference 52.16 2 <.01
Keep Smoking
Status
Age, Gender, Race/Ethnicity, Education,
Marital Status, Objective Numeracy,
Subjective Numeracy, Family Cancer
History, Smoking Status, General Health 153.49 23 <.01
Remove General Health 74.42 19 <.01
Difference 79.08 4 <.01
Keep General
Health
A comparison of the parameter estimates for the bivariate, direct, forward
selection, and backward elimination models is presented in Table 22. Although there
were some similarities across models, the models differed in the variables retained.
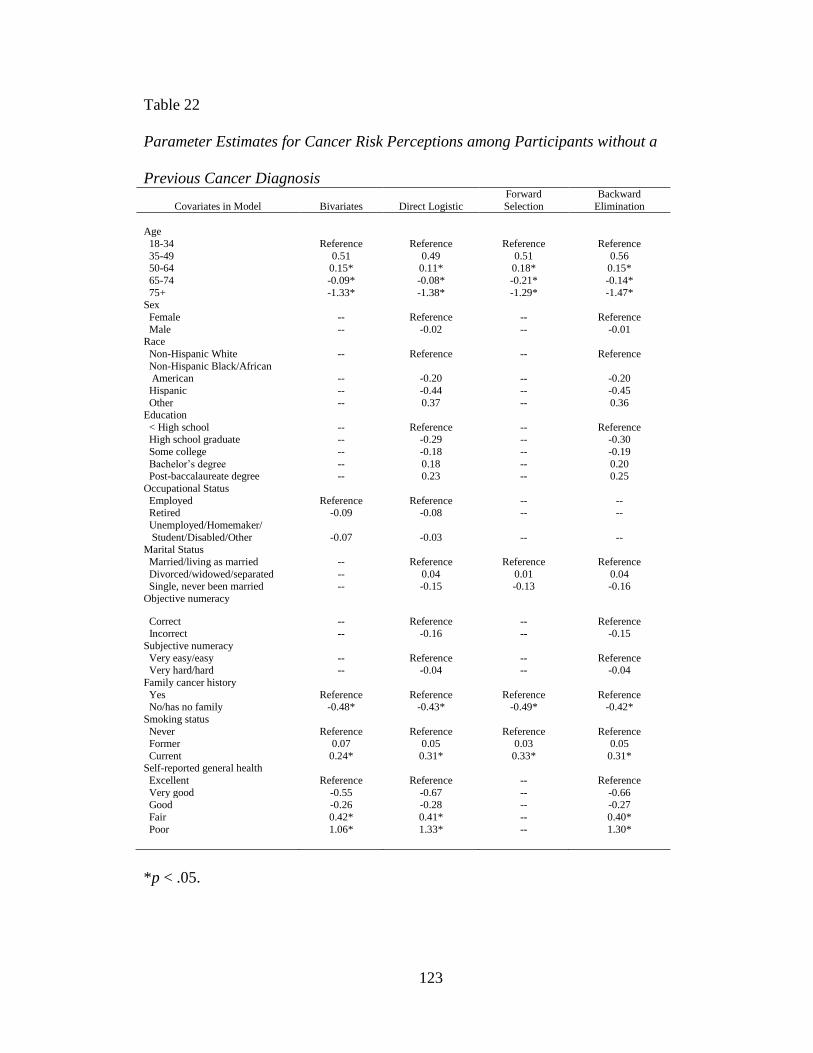
123
Table 22
Parameter Estimates for Cancer Risk Perceptions among Participants without a
Previous Cancer Diagnosis
Covariates in Model Bivariates Direct Logistic
Forward
Selection
Backward
Elimination
Age
18-34 Reference Reference Reference Reference
35-49 0.51 0.49 0.51 0.56 50-64 0.15* 0.11* 0.18* 0.15*
65-74 -0.09* -0.08* -0.21* -0.14*
75+ -1.33* -1.38* -1.29* -1.47* Sex
Female -- Reference -- Reference
Male -- -0.02 -- -0.01 Race
Non-Hispanic White -- Reference -- Reference
Non-Hispanic Black/African American -- -0.20 -- -0.20
Hispanic -- -0.44 -- -0.45
Other -- 0.37 -- 0.36 Education
< High school -- Reference -- Reference High school graduate -- -0.29 -- -0.30
Some college -- -0.18 -- -0.19
Bachelor‟s degree -- 0.18 -- 0.20 Post-baccalaureate degree -- 0.23 -- 0.25
Occupational Status
Employed Reference Reference -- -- Retired -0.09 -0.08 -- --
Unemployed/Homemaker/
Student/Disabled/Other -0.07 -0.03 -- -- Marital Status
Married/living as married -- Reference Reference Reference
Divorced/widowed/separated -- 0.04 0.01 0.04 Single, never been married -- -0.15 -0.13 -0.16
Objective numeracy
Correct -- Reference -- Reference Incorrect -- -0.16 -- -0.15
Subjective numeracy
Very easy/easy -- Reference -- Reference Very hard/hard -- -0.04 -- -0.04
Family cancer history
Yes Reference Reference Reference Reference No/has no family -0.48* -0.43* -0.49* -0.42*
Smoking status
Never Reference Reference Reference Reference Former 0.07 0.05 0.03 0.05
Current 0.24* 0.31* 0.33* 0.31* Self-reported general health
Excellent Reference Reference -- Reference
Very good -0.55 -0.67 -- -0.66
Good -0.26 -0.28 -- -0.27
Fair 0.42* 0.41* -- 0.40*
Poor 1.06* 1.33* -- 1.30*
*p < .05.
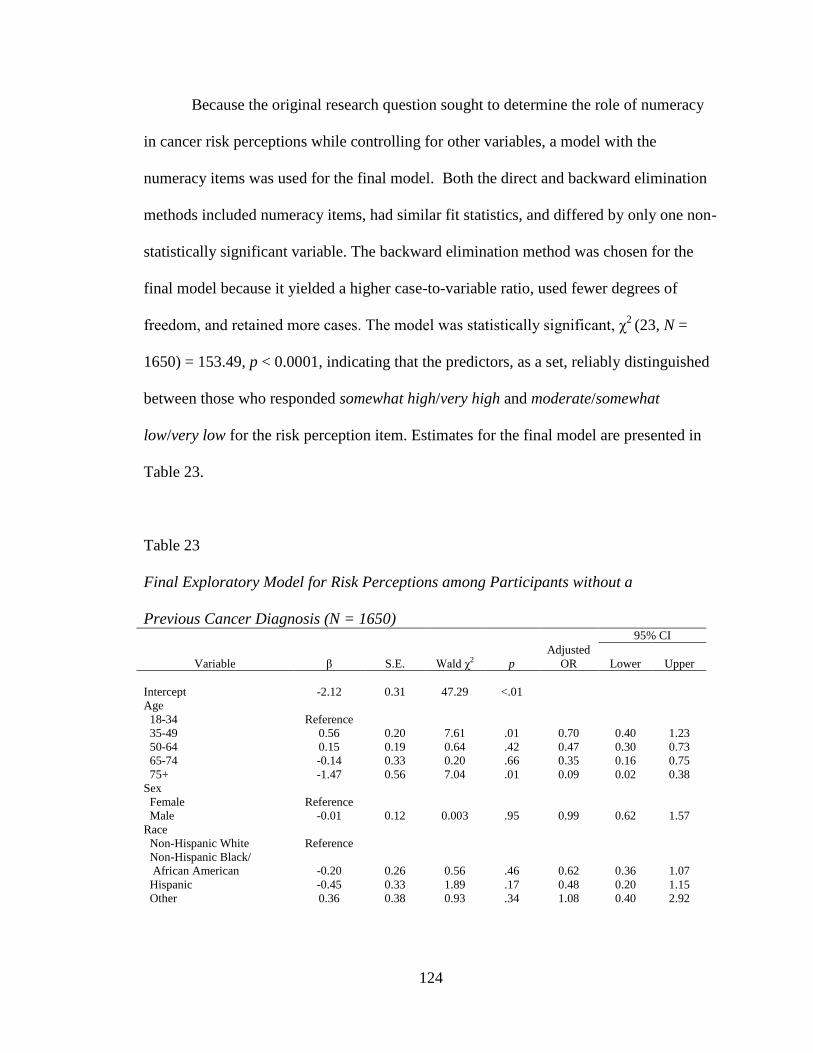
124
Because the original research question sought to determine the role of numeracy
in cancer risk perceptions while controlling for other variables, a model with the
numeracy items was used for the final model. Both the direct and backward elimination
methods included numeracy items, had similar fit statistics, and differed by only one non-
statistically significant variable. The backward elimination method was chosen for the
final model because it yielded a higher case-to-variable ratio, used fewer degrees of
freedom, and retained more cases. The model was statistically significant, χ2
(23, N =
1650) = 153.49, p < 0.0001, indicating that the predictors, as a set, reliably distinguished
between those who responded somewhat high/very high and moderate/somewhat
low/very low for the risk perception item. Estimates for the final model are presented in
Table 23.
Table 23
Final Exploratory Model for Risk Perceptions among Participants without a
Previous Cancer Diagnosis (N = 1650) 95% CI
Variable β S.E. Wald χ2 p
Adjusted
OR Lower Upper
Intercept -2.12 0.31 47.29 <.01
Age
18-34 Reference
35-49 0.56 0.20 7.61 .01 0.70 0.40 1.23
50-64 0.15 0.19 0.64 .42 0.47 0.30 0.73
65-74 -0.14 0.33 0.20 .66 0.35 0.16 0.75
75+ -1.47 0.56 7.04 .01 0.09 0.02 0.38
Sex
Female Reference
Male -0.01 0.12 0.003 .95 0.99 0.62 1.57
Race
Non-Hispanic White Reference
Non-Hispanic Black/
African American -0.20 0.26 0.56 .46 0.62 0.36 1.07
Hispanic -0.45 0.33 1.89 .17 0.48 0.20 1.15
Other 0.36 0.38 0.93 .34 1.08 0.40 2.92
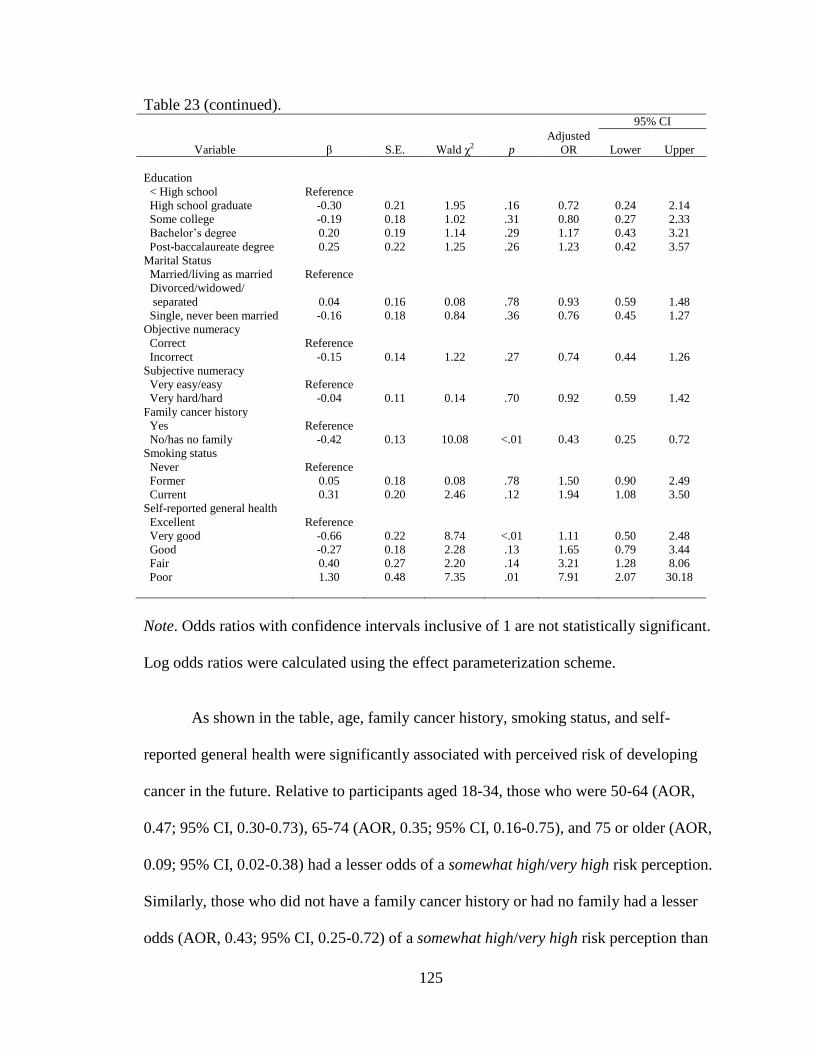
125
Table 23 (continued).
95% CI
Variable β S.E. Wald χ2 p
Adjusted
OR Lower Upper
Education
< High school Reference
High school graduate -0.30 0.21 1.95 .16 0.72 0.24 2.14
Some college -0.19 0.18 1.02 .31 0.80 0.27 2.33
Bachelor‟s degree 0.20 0.19 1.14 .29 1.17 0.43 3.21
Post-baccalaureate degree 0.25 0.22 1.25 .26 1.23 0.42 3.57
Marital Status
Married/living as married Reference
Divorced/widowed/
separated 0.04 0.16 0.08 .78 0.93 0.59 1.48
Single, never been married -0.16 0.18 0.84 .36 0.76 0.45 1.27
Objective numeracy
Correct Reference
Incorrect -0.15 0.14 1.22 .27 0.74 0.44 1.26
Subjective numeracy
Very easy/easy Reference
Very hard/hard -0.04 0.11 0.14 .70 0.92 0.59 1.42
Family cancer history
Yes Reference
No/has no family -0.42 0.13 10.08 <.01 0.43 0.25 0.72
Smoking status
Never Reference
Former 0.05 0.18 0.08 .78 1.50 0.90 2.49
Current 0.31 0.20 2.46 .12 1.94 1.08 3.50
Self-reported general health
Excellent Reference
Very good -0.66 0.22 8.74 <.01 1.11 0.50 2.48
Good -0.27 0.18 2.28 .13 1.65 0.79 3.44
Fair 0.40 0.27 2.20 .14 3.21 1.28 8.06
Poor 1.30 0.48 7.35 .01 7.91 2.07 30.18
Note. Odds ratios with confidence intervals inclusive of 1 are not statistically significant.
Log odds ratios were calculated using the effect parameterization scheme.
As shown in the table, age, family cancer history, smoking status, and self-
reported general health were significantly associated with perceived risk of developing
cancer in the future. Relative to participants aged 18-34, those who were 50-64 (AOR,
0.47; 95% CI, 0.30-0.73), 65-74 (AOR, 0.35; 95% CI, 0.16-0.75), and 75 or older (AOR,
0.09; 95% CI, 0.02-0.38) had a lesser odds of a somewhat high/very high risk perception.
Similarly, those who did not have a family cancer history or had no family had a lesser
odds (AOR, 0.43; 95% CI, 0.25-0.72) of a somewhat high/very high risk perception than
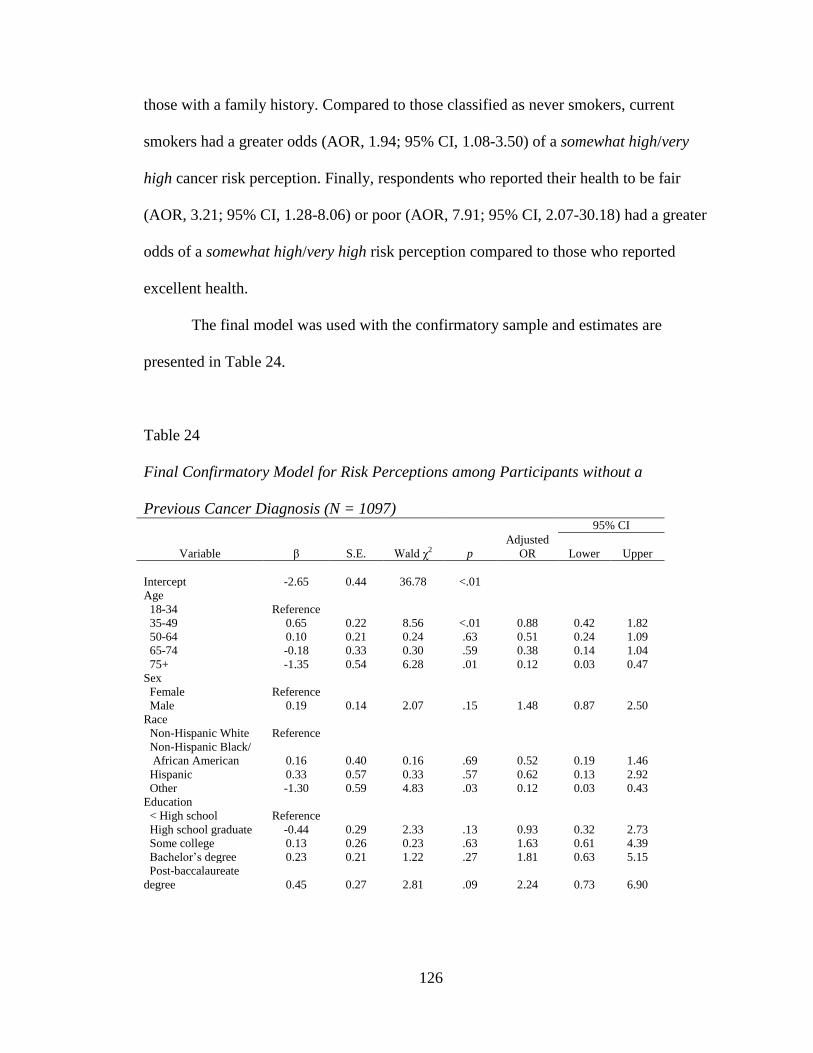
126
those with a family history. Compared to those classified as never smokers, current
smokers had a greater odds (AOR, 1.94; 95% CI, 1.08-3.50) of a somewhat high/very
high cancer risk perception. Finally, respondents who reported their health to be fair
(AOR, 3.21; 95% CI, 1.28-8.06) or poor (AOR, 7.91; 95% CI, 2.07-30.18) had a greater
odds of a somewhat high/very high risk perception compared to those who reported
excellent health.
The final model was used with the confirmatory sample and estimates are
presented in Table 24.
Table 24
Final Confirmatory Model for Risk Perceptions among Participants without a
Previous Cancer Diagnosis (N = 1097) 95% CI
Variable β S.E. Wald χ2 p
Adjusted
OR Lower Upper
Intercept -2.65 0.44 36.78 <.01
Age
18-34 Reference
35-49 0.65 0.22 8.56 <.01 0.88 0.42 1.82
50-64 0.10 0.21 0.24 .63 0.51 0.24 1.09
65-74 -0.18 0.33 0.30 .59 0.38 0.14 1.04
75+ -1.35 0.54 6.28 .01 0.12 0.03 0.47
Sex
Female Reference
Male 0.19 0.14 2.07 .15 1.48 0.87 2.50
Race
Non-Hispanic White Reference
Non-Hispanic Black/
African American 0.16 0.40 0.16 .69 0.52 0.19 1.46
Hispanic 0.33 0.57 0.33 .57 0.62 0.13 2.92
Other -1.30 0.59 4.83 .03 0.12 0.03 0.43
Education
< High school Reference
High school graduate -0.44 0.29 2.33 .13 0.93 0.32 2.73
Some college 0.13 0.26 0.23 .63 1.63 0.61 4.39
Bachelor‟s degree 0.23 0.21 1.22 .27 1.81 0.63 5.15
Post-baccalaureate
degree 0.45 0.27 2.81 .09 2.24 0.73 6.90
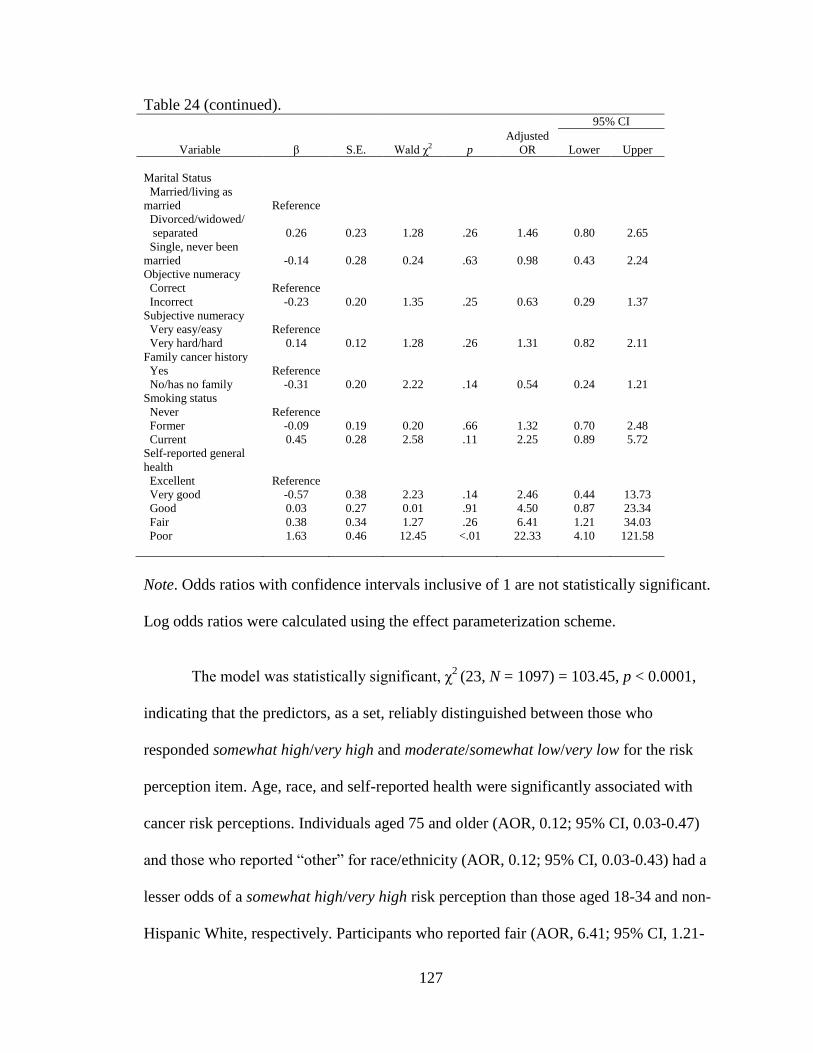
127
Table 24 (continued).
95% CI
Variable β S.E. Wald χ2 p
Adjusted
OR Lower Upper
Marital Status
Married/living as
married Reference
Divorced/widowed/
separated 0.26 0.23 1.28 .26 1.46 0.80 2.65
Single, never been
married -0.14 0.28 0.24 .63 0.98 0.43 2.24
Objective numeracy
Correct Reference
Incorrect -0.23 0.20 1.35 .25 0.63 0.29 1.37
Subjective numeracy
Very easy/easy Reference
Very hard/hard 0.14 0.12 1.28 .26 1.31 0.82 2.11
Family cancer history
Yes Reference
No/has no family -0.31 0.20 2.22 .14 0.54 0.24 1.21
Smoking status
Never Reference
Former -0.09 0.19 0.20 .66 1.32 0.70 2.48
Current 0.45 0.28 2.58 .11 2.25 0.89 5.72
Self-reported general
health
Excellent Reference
Very good -0.57 0.38 2.23 .14 2.46 0.44 13.73
Good 0.03 0.27 0.01 .91 4.50 0.87 23.34
Fair 0.38 0.34 1.27 .26 6.41 1.21 34.03
Poor 1.63 0.46 12.45 <.01 22.33 4.10 121.58
Note. Odds ratios with confidence intervals inclusive of 1 are not statistically significant.
Log odds ratios were calculated using the effect parameterization scheme.
The model was statistically significant, χ2
(23, N = 1097) = 103.45, p < 0.0001,
indicating that the predictors, as a set, reliably distinguished between those who
responded somewhat high/very high and moderate/somewhat low/very low for the risk
perception item. Age, race, and self-reported health were significantly associated with
cancer risk perceptions. Individuals aged 75 and older (AOR, 0.12; 95% CI, 0.03-0.47)
and those who reported “other” for race/ethnicity (AOR, 0.12; 95% CI, 0.03-0.43) had a
lesser odds of a somewhat high/very high risk perception than those aged 18-34 and non-
Hispanic White, respectively. Participants who reported fair (AOR, 6.41; 95% CI, 1.21-
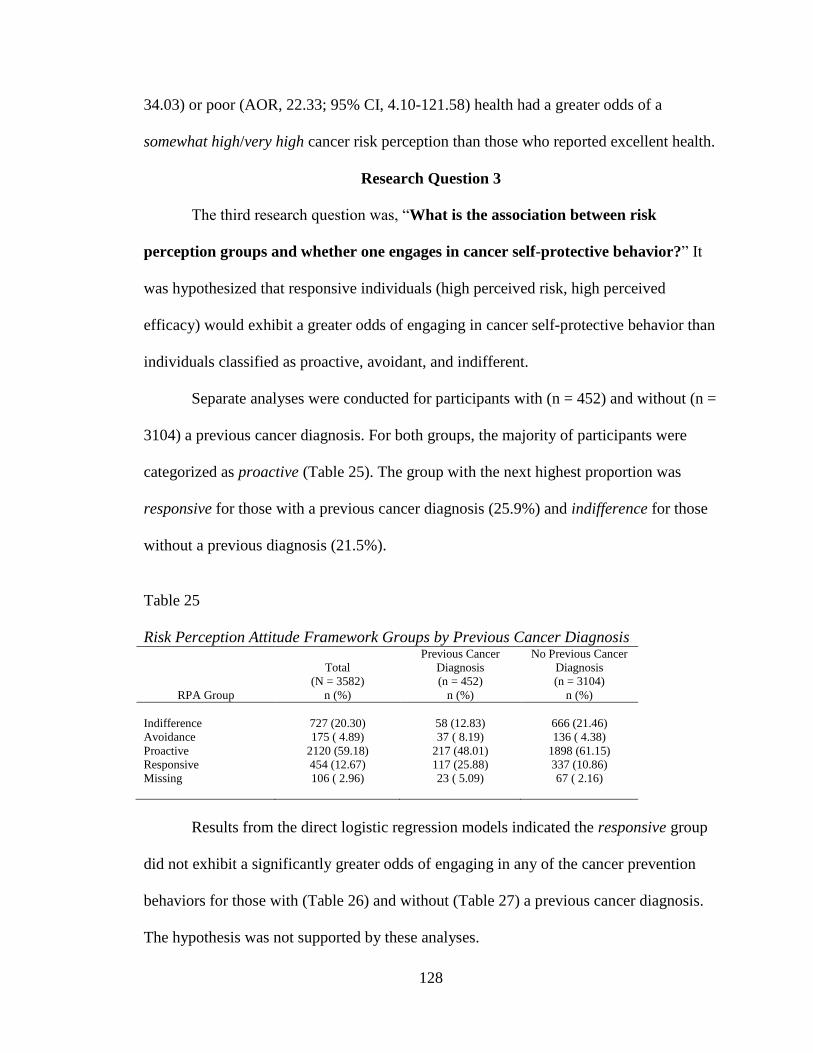
128
34.03) or poor (AOR, 22.33; 95% CI, 4.10-121.58) health had a greater odds of a
somewhat high/very high cancer risk perception than those who reported excellent health.
Research Question 3
The third research question was, “What is the association between risk
perception groups and whether one engages in cancer self-protective behavior?” It
was hypothesized that responsive individuals (high perceived risk, high perceived
efficacy) would exhibit a greater odds of engaging in cancer self-protective behavior than
individuals classified as proactive, avoidant, and indifferent.
Separate analyses were conducted for participants with (n = 452) and without (n =
3104) a previous cancer diagnosis. For both groups, the majority of participants were
categorized as proactive (Table 25). The group with the next highest proportion was
responsive for those with a previous cancer diagnosis (25.9%) and indifference for those
without a previous diagnosis (21.5%).
Table 25
Risk Perception Attitude Framework Groups by Previous Cancer Diagnosis
RPA Group
Total
(N = 3582)
n (%)
Previous Cancer
Diagnosis
(n = 452)
n (%)
No Previous Cancer
Diagnosis
(n = 3104)
n (%)
Indifference 727 (20.30) 58 (12.83) 666 (21.46)
Avoidance 175 ( 4.89) 37 ( 8.19) 136 ( 4.38)
Proactive 2120 (59.18) 217 (48.01) 1898 (61.15)
Responsive 454 (12.67) 117 (25.88) 337 (10.86)
Missing 106 ( 2.96) 23 ( 5.09) 67 ( 2.16)
Results from the direct logistic regression models indicated the responsive group
did not exhibit a significantly greater odds of engaging in any of the cancer prevention
behaviors for those with (Table 26) and without (Table 27) a previous cancer diagnosis.
The hypothesis was not supported by these analyses.
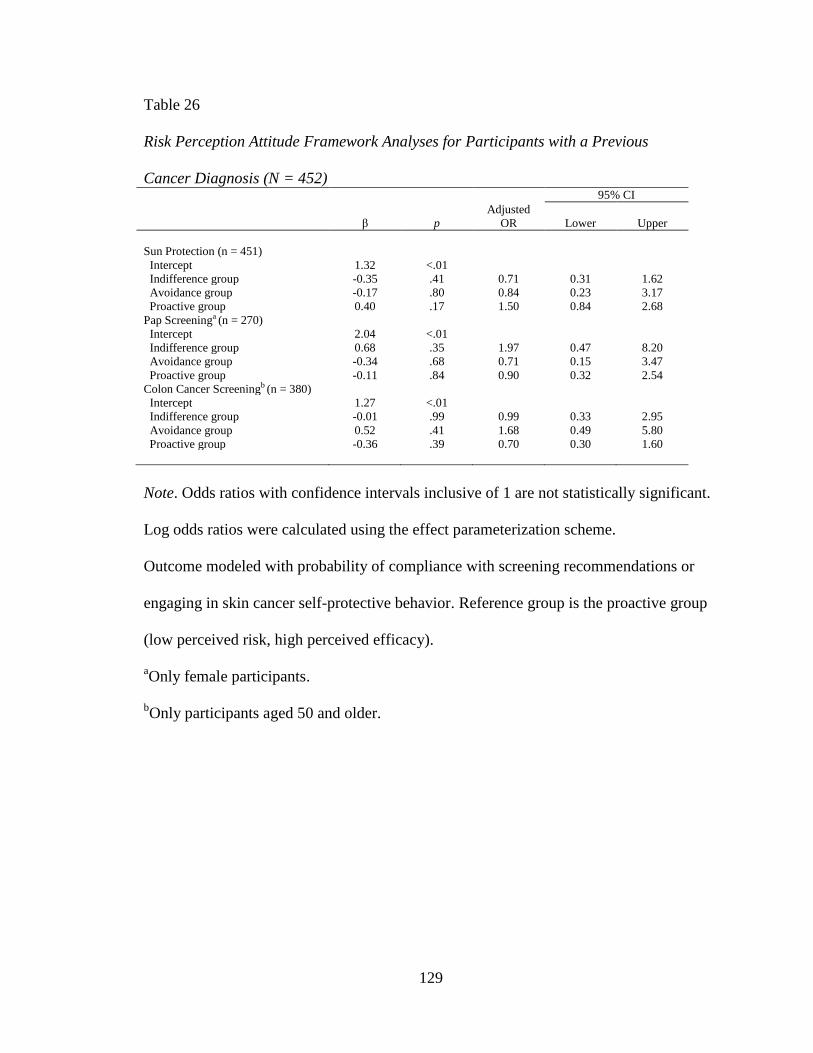
129
Table 26
Risk Perception Attitude Framework Analyses for Participants with a Previous
Cancer Diagnosis (N = 452) 95% CI
β p
Adjusted
OR Lower Upper
Sun Protection (n = 451)
Intercept 1.32 <.01
Indifference group -0.35 .41 0.71 0.31 1.62
Avoidance group -0.17 .80 0.84 0.23 3.17
Proactive group 0.40 .17 1.50 0.84 2.68
Pap Screeninga (n = 270)
Intercept 2.04 <.01
Indifference group 0.68 .35 1.97 0.47 8.20
Avoidance group -0.34 .68 0.71 0.15 3.47
Proactive group -0.11 .84 0.90 0.32 2.54
Colon Cancer Screeningb (n = 380)
Intercept 1.27 <.01
Indifference group -0.01 .99 0.99 0.33 2.95
Avoidance group 0.52 .41 1.68 0.49 5.80
Proactive group -0.36 .39 0.70 0.30 1.60
Note. Odds ratios with confidence intervals inclusive of 1 are not statistically significant.
Log odds ratios were calculated using the effect parameterization scheme.
Outcome modeled with probability of compliance with screening recommendations or
engaging in skin cancer self-protective behavior. Reference group is the proactive group
(low perceived risk, high perceived efficacy).
aOnly female participants.
bOnly participants aged 50 and older.
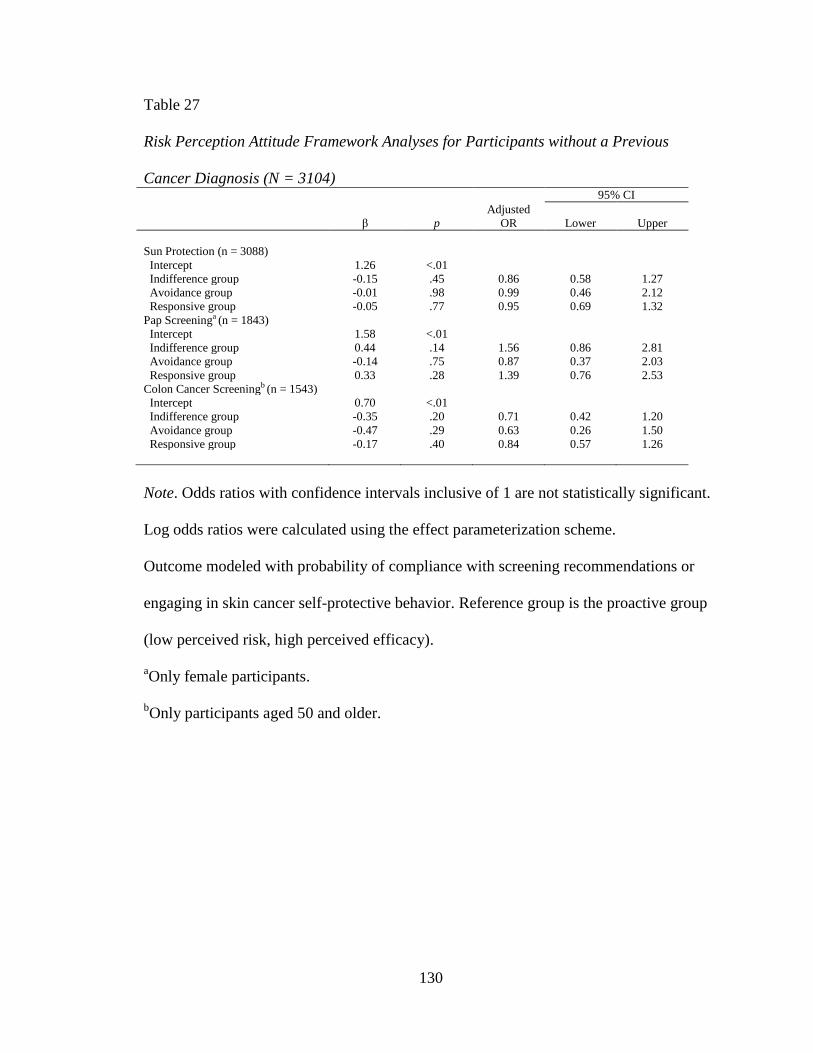
130
Table 27
Risk Perception Attitude Framework Analyses for Participants without a Previous
Cancer Diagnosis (N = 3104) 95% CI
β p
Adjusted
OR Lower Upper
Sun Protection (n = 3088)
Intercept 1.26 <.01
Indifference group -0.15 .45 0.86 0.58 1.27
Avoidance group -0.01 .98 0.99 0.46 2.12
Responsive group -0.05 .77 0.95 0.69 1.32
Pap Screeninga (n = 1843)
Intercept 1.58 <.01
Indifference group 0.44 .14 1.56 0.86 2.81
Avoidance group -0.14 .75 0.87 0.37 2.03
Responsive group 0.33 .28 1.39 0.76 2.53
Colon Cancer Screeningb (n = 1543)
Intercept 0.70 <.01
Indifference group -0.35 .20 0.71 0.42 1.20
Avoidance group -0.47 .29 0.63 0.26 1.50
Responsive group -0.17 .40 0.84 0.57 1.26
Note. Odds ratios with confidence intervals inclusive of 1 are not statistically significant.
Log odds ratios were calculated using the effect parameterization scheme.
Outcome modeled with probability of compliance with screening recommendations or
engaging in skin cancer self-protective behavior. Reference group is the proactive group
(low perceived risk, high perceived efficacy).
aOnly female participants.
bOnly participants aged 50 and older.
131
Chapter Five
Discussion
Summary
Even when individuals become more involved in health-related decisions, they
may not possess the literacy skills necessary to comprehend numerical health-related
information. The current study sought to ascertain factors associated with numeracy, and
more specifically, how numeracy relates to cancer risk perceptions, and how cancer risk
perceptions relate to cancer prevention and screening behaviors.
The following summary reviews study findings by question-by-question.
Research Question 1
“What is the association of socio-demographic factors with numeracy?” It was
hypothesized that sex, education, ethnicity, race, age, and income would be significantly
associated with numeracy.
Objective numeracy. After controlling for other covariates, age, race/ethnicity,
education, and occupational status were significantly associated with objective numeracy
in the exploratory sample. Specifically, the following variables were significantly
associated with a lesser odds of a correct response to the objective numeracy item: (a) age
65-74 and 75 or older, and (b) non-Hispanic Black/African American, Hispanic, and
“other” race/ethnicity. A baccalaureate degree and post-baccalaureate degree were
associated with a greater odds of a correct response. The status of being unemployed, or
132
being a homemaker or student, being disabled, or having some other occupational status
was marginally associated with a greater odds of objective numeracy. Only being ≥ 75
years of age or having a baccalaureate degree was significantly associated with greater or
lesser odds of having a correct response in the confirmatory sample.
Subjective numeracy. In the exploratory sample, only education was
significantly associated with participants declaring an easy or very easy response to the
subjective numeracy item while controlling for other covariates. Participants with at least
a high school education had a greater odds of an easy/very easy response compared to
those who did not graduate high school. In the confirmatory sample, age, education, and
occupational status were associated with an easy/very easy response to the subjective
numeracy item while controlling for other covariates. Variables significantly associated
with a lesser odds of an easy/very easy response included: (a) age 35-49, 65-74, and 75 or
older, and (b) unemployed/homemaker/student/disabled/other occupational status.
Persons with at least some college education had greater odds of an easy/very easy
response relative to those without a high school degree.
Research Question 2
“Which factors are significantly associated with individuals‟ personal risk
perceptions regarding cancer in general?” It was hypothesized that objective numeracy,
subjective numeracy, family member cancer history, personal cancer history, smoking
status, health status, sex, education, ethnicity, race, age, and income would be
significantly associated with individuals‟ personal risk perceptions regarding cancer in
general.
133
Previous cancer diagnosis. Among participants with a previous cancer diagnosis,
objective numeracy and smoking status were significantly associated with having a
somewhat high/very high cancer risk perception in the exploratory multivariate analysis.
Those who provided an incorrect response to the objective numeracy item had a lesser
odds of having a somewhat high/very high risk perception than those who provided a
correct response. Current smokers had a marginally significantly greater odds of a
somewhat high/very high risk perception compared to never smokers. In the confirmatory
multivariate analysis, none of the variables were significantly associated with cancer risk
perceptions when controlling for other variables in the model.
No previous cancer diagnosis. In the exploratory multivariate analysis, age,
family cancer history, smoking status, and self-reported general health were significantly
associated with a somewhat high/very high cancer risk perception. The following
variables were significantly associated with a lesser odds of having a somewhat high/very
high risk perception: (a) being at least 50 years old, and (b) no family cancer history.
Current smoking status, fair health, and poor health were significantly associated with a
greater odds of a somewhat high/very high cancer risk perception. In the confirmatory
sample, age 75 or older and “other” race/ethnicity were significantly associated with a
lesser odds of reporting a somewhat high/very high cancer risk perception, whereas fair
and poor health were associated with a greater odds of a somewhat high/very high cancer
risk perception.
Research Question 3
“What is the association between risk perception groups and whether one engages
in cancer self-protective behavior?” It was hypothesized that responsive individuals (high
134
perceived risk, high perceived efficacy) would exhibit a greater odds of engaging in
cancer self-protective behavior than individuals classified as proactive, avoidant, and
indifferent.
The proactive group (low perceived risk, high perceived efficacy) comprised the
largest group for both those with and without a previous cancer diagnosis. The responsive
group did not exhibit a statistically significantly greater odds of engaging in sun
protection, cervical cancer (i.e., Pap test) screening, or colon cancer screening than the
other RPA groups.
Discussion
Socio-demographic factors associated with objective and subjective numeracy
were evaluated as a means of identifying intervention points to improve comprehension
of numerical information. The 2007 HINTS instrument included single-item measures of
objective and subjective numeracy derived from previously validated instruments
(Lipkus, Samsa, & Rimer, 2001; Woloshin, Schwartz, & Welch, 2005). The objective
item measured participants‟ ability to discern differences in magnitudes of health risks,
which may be appropriate for the current study given its focus on risk perceptions. In a
study using “highly educated” samples (undefined, but participants with a high school
education or less ranged from 6% to 16% across three samples), about 78% of all
participants provided a correct response to the same objective item (Lipkus et al., 2001),
placing it fourth out of eight expanded numeracy scale items in terms of percentage of
correct responses. A slightly lower percentage (76%) of respondents across multiple
educational levels provided a correct response in the current study.
135
Previous research based on full objective numeracy scales found several
demographic variables were associated with numeracy, including age, sex, education,
race, and income (Lipkus & Peters, 2009; Peters, 2008). Results from the current study
indicated age, race/ethnicity, education, and occupational status (a proxy for income)
were significantly associated with the single-item numeracy measure in bivariate
analyses. These variables remained significant in exploratory multivariate analyses, but
only age and education were significant in confirmatory analyses. The variables
consistent across both samples were age 75 or older and a baccalaureate degree. These
results suggest that older individuals may find risk magnitude information more difficult
to understand than younger individuals, and those who have earned at least a
baccalaureate degree may have an easier time understanding risk information compared
to those who do not have a high school degree or its equivalent.
Research suggests the ability to understand numerical information can be
hindered by stress or advanced age (Fagerlin, Ubel, Smith, & Zikmund-Fisher, 2007).
Poor numeracy is particularly problematic for older adults given that they may be
required to use numerical skills to assess health information more frequently than their
younger counterparts because risk for disease increases with age (Galesic, Gigerenzer, &
Straubinger, 2009). Normal loss of cognitive ability (Li et al., 2004) coupled with a risk
for misunderstanding probability expressions (Galesic et al., 2009; Hibbard, Peters,
Slovic, Finucane, & Tusler, 2001) translates to suboptimal numeracy skills, which may
negatively impact important patient outcomes (Fagerlin, Ubel et al., 2007). Efforts
focused on enhancing comprehension of numerical information among older adults may
be warranted.
136
Interventions designed to improve comprehension of risk magnitude information
might focus on age and education as targets, and consider race and occupational status as
possible targets. Specifically, other methods for communicating risk magnitude may be
more effective for older individuals and those of lower educational attainment. The
HINTS item used a frequency presentation format, which may be a better format for
enhancing comprehension relative to a percentage format (Fagerlin, Ubel et al., 2007);
however, a visual display may have yielded higher comprehension among these groups as
empirical research has shown that this format facilitates the greatest understanding
(Nelson, Reyna, Fagerlin, Lipkus, & Peters, 2008). The efficacy of various graphics
formats for communicating numerical information seems to vary by the intended clinical
purpose (Ancker, Senathirajah, Kukafka, & Starren, 2006; Nelson et al., 2008); for
instance, risk ladders may be effective for communicating a level of risk, whereas icon
arrays (e.g., using shaded-in stick figures to show how many people are affected by a
condition) can illustrate magnitude (Nelson et al., 2008). It is important to note that the
formatting of the graph can have a substantial impact on comprehension (Nelson et al.,
2008). For example, a random rather than systematic display of figures in a pictograph
may decrease the precision of risk estimates because it is difficult to ascertain relative
magnitudes (Nelson et al., 2008; Reyna & Brainerd, 1994). Interventions designed to
enhance comprehension of numerical information among older individuals and lower
educational attainment may consider using appropriately designed visual displays to
convey information.
Subjective numeracy scales were developed as a less aversive method for
measuring numeracy compared to the objective scales (Nelson et al., 2008). The
137
subjective numeracy item in HINTS was derived from the STAT-confidence scale
(Woloshin et al., 2005), which consists of three items that measure confidence in ability
to understand medical statistics. Although subjective scales may be less aversive than
objective measures, they may also produce less accurate estimates of one‟s numerical
ability (Nelson et al., 2008). In fact, in developing the STAT-confidence scale,
researchers found that confidence in using statistics was weakly related to ability to use
data (Woloshin et al., 2005).
To develop and assess validity and reliability of the STAT-confidence scale,
Woloshin and colleagues (2005) conducted a study using a sample of 224 participants,
95% of whom were White and 52% of whom had a college degree. Results indicate that
72% of participants reported finding it easy or very easy to understand medical statistics.
Comparatively, about 63% of participants in the current study reported finding it easy or
very easy to understand medical statistics. The majority of studies using a measure of
numeracy tend to use objective measures, perhaps because these measures may yield
higher predictive power (Zikmund-Fisher, Smith, Ubel, & Fagerlin, 2007). The lack of
studies using subjective measures makes it difficult to compare results from the current
study to previous studies; therefore, results are discussed in light of findings from
previous studies using objective measures, with the understanding that objective and
subjective measures cannot be directly compared.
After controlling for other socio-demographic variables, only education was
significantly associated with subjective numeracy in the exploratory multivariate
analysis. Specifically, having at least a high school diploma was associated with greater
odds of finding medical statistics easy/very easy to understand (referent: no high school
138
diploma). These findings are similar to those for objective numeracy, which found that
lower educational attainment may translate to lower numerical ability.
The confirmatory model for subjective numeracy also suggested that ages 35-49,
65-74, and 75 or older (relative to ages 18-34) and unemployed, homemaker, student,
disabled, or other occupational status (relative to employed) had a lesser odds of finding
medical statistics easy/very easy to understand. The association between older age and
confidence in understanding medical statistics was similar to results for the objective
numeracy model. Given that occupational status was used as a proxy for income, the
findings may suggest that lower income is associated with lower confidence in
understanding medical statistics. Previous numeracy research has indicated that lower
SES has been associated with poorer numeracy (Lipkus & Peters, 2009; Peters, 2008;
Reyna & Brainerd, 2007). Taken together, findings from the current study and previous
research on numeracy suggest the need for SES to be included as a target for
interventions to improve comprehension of numerical information.
Some research has suggested an association between numeracy and health risk
perceptions (Black, Nease, & Tosteson, 1995; Gurmankin, Baron, & Armstrong, 2004),
but has not assessed this association while simultaneously controlling for other factors
that may be associated with risk perceptions. In the current study, cancer risk perceptions
were assessed using a single measure regarding perceived likelihood of developing
cancer in the future. Participants were separated by previous cancer diagnosis given that
responses regarding risk perceptions may vary based on the perception of ever
developing cancer (participants with no previous cancer diagnosis) versus the perception
of developing another cancer (participants with a previous cancer diagnosis).
139
Among participants with a previous cancer diagnosis, objective numeracy and
smoking status were significantly associated with cancer risk perceptions in the
exploratory model, but no variables were significant in the confirmatory model. The
relatively small sample sizes (239 and 155, respectively) for this subgroup may at least
partially account for the differences in the multivariate results.
An incorrect response to the objective numeracy item corresponded with a lesser
odds of a somewhat high/very high perceived risk of developing cancer in the future
relative to those who provided a correct response. Although survey questions do not
allow for an examination of actual risk for cancer, and therefore, a comparison of
perceived and actual risk cannot be made, this finding offers evidence that objective
numeracy is associated with cancer risk perceptions while controlling for other variables.
It is unknown whether participants providing an incorrect response in the current study
are making inaccurate judgments about their risk, but previous research suggests those
with lower numeracy tend to overestimate their cancer risk compared to their higher
numerate counterparts (Black et al., 1995; Gurmankin et al., 2004). It seems results from
the current study contradict previous findings given that lower numerate persons had
lesser odds of reporting a somewhat high/very high risk of developing cancer than higher
numerate participants. On the other hand, it is important to review these results in light of
the fact that only one item was used to measure objective numeracy in the current study
compared to a 3-item or 11-item scales used in previous research. Still, other research has
found no association between numeracy and an overestimation of breast cancer risk in a
small sample (n = 62) of women (Dillard, McCaul, Kelso, & Klein, 2006). More research
140
is needed to examine the relationship between numeracy and general cancer and site-
specific cancer risk perceptions with large samples.
Being a current smoker was associated with having a marginally significantly
greater odds of reporting a somewhat high/very high risk of developing cancer in the
future relative to those who were never smokers. Whereas these findings could suggest
participants understand the link between smoking and cancer risk, they also could be a
reflection of experiencing poorer health than never or former smokers, which in turn,
may prompt one to experience more perceived susceptibility to adverse health conditions,
such as cancer. On the other hand, some smokers have exhibited unrealistic optimism
about their risk for lung cancer (Weinstein, Marcus, & Moser, 2005). In a national survey
that included 1,245 current smokers, Weinstein and colleagues found that smokers
surveyed underestimated their lung cancer risk compared to both the average smoker and
non-smokers. Some research has examined perceived risk of cancers other than lung
cancer. Saules and colleagues (2007) studied perceived risk of cervical cancer in a sample
of female college students who were smokers. Compared to non-smokers, current
smokers demonstrated a higher perceived risk for developing cervical cancer, but did not
seem to be aware that smoking was a risk factor for cervical cancer. This finding may
suggest individuals do not understand that smoking is a risk factor for developing cancer
in sites other than the lungs.
Among participants without a previous cancer diagnosis, objective numeracy was
associated with cancer risk perceptions in the confirmatory bivariate analyses and was
marginally non-significant in the exploratory bivariate analyses. When accounting for
other variables in multivariate analyses, numeracy was not significantly associated with
141
cancer risk perceptions in this subsample. Objective numeracy was retained in the
backward elimination model in the exploratory analyses, despite its ultimate non-
significant association with the outcome variable. Given these results, it is possible that
objective numeracy acts as a moderating or mediating variable.
In multivariate analyses, age, family cancer history, smoking status, and self-
reported general health were significantly associated with cancer risk perceptions in the
exploratory model, whereas age, race, and self-reported general health were significant in
the confirmatory model. Older age (75+) was significantly associated with a lesser odds
of a perceiving a somewhat high/very high risk of developing cancer relative to those
aged 18-34. Previous research has yielded a similar inverse relationship between age and
perceived cancer risk (Stark, Bertone-Johnson, Costanza, & Stoddard, 2006; Vernon,
Myers, Tilley, & Li, 2001). Interestingly, with respect to colorectal cancer, no study has
reported that perceived risk increases with age despite the fact that actual risk is
associated with age (Robb, Miles, & Wardle, 2004; Stark et al., 2006). The association
between older age and lesser odds of a reporting a somewhat high/very high perceived
risk of cancer could imply that older adults who have not been diagnosed with cancer
believe that if they have not developed cancer by a certain age, then they will probably
not be at a high risk for developing cancer in the future.
Previous research has supported the role of family cancer history in perceived risk
of developing cancer (Helzlsouer, Ford, Hayward, Midzenski, & Perry, 1994; Lipkus,
Rimer, & Strigo, 1996; Robb et al., 2004; Stark et al., 2006; Vernon, Vogel, Halabi, &
Bondy, 1993). Individuals may experience a heightened sense of perceived vulnerability
to cancer based on a belief that they may be genetically predisposed if a close relative is
142
diagnosed with cancer (Robb et al., 2004). An alternative explanation for the association
between family history and perceived risk is the possibility of increased perceived risk
based on vicarious learning; that is, personally experiencing cancer through a family
member may make one feel vulnerable to the illness (Robb et al., 2004; Schwarzer,
1994). A potential problem with relying on family history for assessing personal cancer
risk is that the genetic link for some cancers, such as colorectal cancer, is limited
(Lichtenstein et al., 2000; Robb et al., 2004); therefore, although family history is
associated with increased cancer risk in some cases, it is important to communicate other
factors associated with a heightened risk for a given cancer.
The role of self-reported health status in cancer risk perceptions also has been
supported by previous studies (Helzlsouer et al., 1994; Robb et al., 2004; Stark et al.,
2006) that have indicated that poorer self-reported health is associated with greater
perceived risk of cancer. It has been hypothesized that the relationship may be a spurious
one given that poor health is linked to lower SES, greater likelihood of physician visits,
and higher levels of mental health issues, including anxiety and depression (Robb et al.,
2004).
Results from the confirmatory analyses indicated that “other” race/ethnicity was
significantly associated with a lesser odds of perceiving a somewhat high/very high risk
of developing cancer than non-Hispanic White participants. The “other” category was
comprised of non-Hispanic American Indian or Alaska natives, non-Hispanic Asians,
non-Hispanic native Hawaiian or other Pacific Islander, and non-Hispanic participants of
multiple races. This category accounted for a little over 6% of the total sample, with non-
Hispanic Asians accounting for almost 4% of that 6%. Previous research has indicated
143
that cervical and colorectal cancer screening is lower among Asians than Whites (Orom,
Kiviniemi, Underwood, Ross, & Shavers, 2010), which may be due to lower perceived
risk of cancer given Asians‟ lower cancer incidence and mortality across all sites
compared to Whites (Jemal et al., 2009). Orom and colleagues (2010) used the 2007
HINTS data to examine perceived risk and race/ethnicity among U.S. adults. The
researchers found that Asians were less likely to have smoked in their lifetimes compared
to Whites, which was associated with lower perceived risk of cancer. In the current study,
smoking status, but not race/ethnicity, was significant in the exploratory model, whereas
the opposite was true in the confirmatory model. Taken with the findings in the Orom et
al. study, it may be that there is a link between race/ethnicity, smoking status, and cancer
risk perceptions.
Similar to persons with a previous cancer diagnosis, being a current smoker was
significantly associated with greater odds of having a somewhat high/very high perceived
risk for developing cancer. Again, these results may suggest an understanding of the link
between smoking and cancer, or participants who are current smokers experience health
problems that heighten their cancer risk perception.
To examine associations between independent and dependent variables for the
first two research questions, the dataset was split into two samples and various logistic
modeling techniques were used to arrive at a “final” model. The dataset was randomly
split so that the exploratory sample contained 60% of the cases and the confirmatory
sample used the remaining 40% of cases. Splitting the sample allowed for model
development (exploratory sample) and subsequent estimation of relationships and model
testing (confirmatory sample). Although splitting the sample addresses potential
144
criticisms that the logistic regression models are “overfit” to the data, it also reduces
power. A reduction in power may have been particularly problematic for the analyses
among participants with a previous cancer diagnosis, and may have been the underlying
reason for an overall significant model with no significant predictors in the confirmatory
analysis.
By using a larger proportion of the original sample to develop the model, it is
more likely that the analyses yielded the “best” model, while still retaining an adequate
proportion of cases to test the model. The sample could have been split differently; for
instance, 50% of cases in each subsample. This split would have increased power in the
confirmatory sample and perhaps would have increased the likelihood of finding similar
relationships between independent and dependent variables across samples, but would
have reduced the likelihood of developing the “best” model.
In terms of specific statistically significant variables, the four modeling
techniques yielded fairly similar results for the objective numeracy, subjective numeracy,
and risk perceptions among participants without a previous cancer diagnosis analyses.
Conversely, there was variability in statistically significant variables across models for
risk perceptions among participants with a previous cancer diagnosis. Objective
numeracy and smoking status were significant in the bivariates model, race/ethnicity and
objective numeracy were significant in the forward selection model, smoking status was
significant in the backward elimination model, and no variables were significant in the
direct logistic regression model. The relatively small number of participants relative to
the number of variables in these analyses may account for the variability across the
models. These results highlight how modeling technique can produce different outcomes
145
and result in different conclusions regarding statistically significant relationships between
independent and dependent variables.
The third research question was designed to ascertain whether cancer risk
perceptions were associated with cancer prevention behavior. The RPA framework was
used to categorize individuals into one of four groups based on their perceived risk of
developing cancer as well as self-efficacy. The latter was measured by asking participants
the degree to which they agreed with a single statement: “There‟s not much you can do to
lower your chances of getting cancer.” Similar to the risk perception analyses,
participants were split into two subgroups based on their previous cancer diagnosis status.
Of the four RPA groups (indifference, avoidance, proactive, and responsive),
most participants (59%) were classified as proactive. These results indicate that these
participants perceived their risk of developing cancer to be low, as well as believed there
were measures that could be taken to lower their chances of getting cancer. Contrary to
what was hypothesized, the responsive group did not have a significantly greater odds of
engaging in skin cancer prevention behaviors, nor compliance with cervical and
colorectal cancer screening. In fact, RPA group was not associated with engaging in
cancer prevention and screening behavior.
The HBM suggests perceived risk is an important construct in understanding
health behavior (Hochbaum, 1958). The RPA framework allows for the examination of
the association between risk perception and self-protective behavior while taking into
account the moderating role of efficacy beliefs (Rimal & Real, 2003). In testing the RPA,
Rimal and Real found inconsistent support for RPA framework predictions, but noted
that risk perceptions guide subsequent actions when risk and efficacy are made salient,
146
whereas risk and efficacy jointly affect behavior in a natural context. The researchers
noted that the framework is useful as an audience-targeting tool in public health
campaigns.
Given that the purpose of the third research question was to examine the
association between cancer risk perceptions and preventive behavior, additional analyses
were conducted to examine this association outside the context of the RPA framework
(data not shown). Analyses were conducted to examine the association between the risk
perception item by itself and each of the three cancer self-protective behaviors; these
associations were not statistically significant (p > 0.05). Because a number of participants
selected moderate risk, further analyses were conducted in which participants were
reclassified into somewhat low/very low and moderate/somewhat high/very high groups.
These associations were also not statistically significant (p > 0.05).
Some research has shown that cancer risk perceptions are linked to cancer
screening behaviors, particularly in the context of colorectal cancer. Kim and colleagues
(2008) found perceived risk for colorectal cancer to be related to having a colonoscopy;
however, perceived lifetime risk of breast and cervical cancer was not associated with
screening behavior for these cancers. Other studies have found that perceived risk is not
linked to cancer prevention behaviors. In a study of African Americans and skin cancer,
Pichon and colleagues (2010) found relatively low perceived risk of developing skin
cancer in this population, and a non-significant association between perceived risk of skin
cancer and sunscreen use. Additionally, Helzlsouer et al. (1994) studied employees of an
oncology center and did not find an association between perceived risk for developing
147
cancer and cancer screening behaviors, including sigmoidoscopy, FOBT, Pap test, and
mammogram.
Discrepancies in research regarding cancer risk perceptions and prevention or
screening behavior may stem from characteristics of the specific samples, types of cancer
studied, and study designs. The majority of aforementioned studies employed a cross-
sectional survey to study this association, and therefore, a temporal relationship between
the variables cannot be ascertained. At the time of the survey, participants are
concurrently responding to items about risk perceptions and behavior. Perceived risk
may, for instance, be lower after receiving one or more negative test results. Also, health-
conscious participants may engage in screening behavior independent of risk perceptions
and a negative test result. This hypothesis may be supported by one study that showed
perceived risk was not related to screening, but 89% of women sampled had a Pap test in
the past three years, and most women had a mammogram in the past two years
(Helzlsouer et al., 1994). In the current study, about 79% of participants engaged in sun
protection behaviors, 83% of women adhered to Pap test recommendations, and 76%
adhered to colon cancer screening recommendations. Another possible explanation for
inconsistencies across studies relates to measurement of cancer risk perceptions. In the
current study, perceived risk pertained to cancer in general and was not site-specific;
therefore, participants may not have known how to respond to the item given that they
may perceive their risk for one type of cancer to be high and low for another type of
cancer. The large proportion of participants who selected moderate (43%) may support
this hypothesis.
148
Implications for Public Health
Findings from this study have important implications for public health, including
health communication and interventions designed to enhance health behaviors. One of the
focus areas of Healthy People 2010 is health communication (U.S. Department of Health
and Human Services, n.d.), with a goal to “use communication strategically to improve
health.” Given that individuals need information to make health-related decisions, it is
imperative to improve the health literacy of individuals with insufficient or marginal
literacy skills. The current research examined numeracy, the quantitative component of
health literacy, and examined socio-demographic factors to which interventions could be
targeted to improve numeracy. It may be more important to focus on objective numeracy
measures rather than subjective measures, as they may be more accurate in assessing
ability. Results from the current study suggest age, race/ethnicity, education, and
occupational status are associated with objective numeracy; therefore, interventions
aimed at improving numeracy could focus on older adults, non-Whites, lower educational
attainment, and possibly those who are unemployed, a homemaker, student, or disabled.
Individuals from these socio-demographic subgroups may also benefit from health
information that is presented in a visual format, which may enhance comprehension.
The Committee on Health Literacy (1999) defines literacy as “an individual‟s
ability to read, write, and speak in English, and compute and solve problems at levels of
proficiency necessary to function on the job and in society, to achieve one‟s goals, and
develop one‟s knowledge and potential.” Literacy is comprised of several components,
including oral literacy, print literacy, and numeracy (Institute of Medicine Committee on
Health Literacy, 2004), yet previous research has primarily focused on oral and print
149
literacy. Health numeracy is a relatively new topic of research that is gaining attention,
but has yet to be assigned a formal definition and only recently was a theoretical
framework proposed for the role of numeracy in health decisions (Lipkus & Peters,
2009). Given that risk information is often presented in a numerical format, it is
imperative for individuals to possess adequate numeracy skills in order to be health
literate according to the definition of literacy. The importance of health numeracy is
supported by a study assessing participants‟ comprehension of health care performance
reports (Hibbard, Peters, Dixon, & Tusler, 2007). Health literacy (defined as oral and
print literacy) and numeracy were measured separately, and results indicated numeracy
was a stronger predictor of comprehension than health literacy. Public health researchers
and practitioners should ensure that health literacy measures examine all components of
health literacy to gain a more thorough understanding of literacy‟s role in information
comprehension and health behaviors.
The current research also provided insight into the role of numeracy in cancer risk
perceptions. For participants with a previous cancer diagnosis, objective numeracy was
significantly associated with cancer risk perceptions while controlling for other variables
that may be related to cancer risk perceptions. Without knowing one‟s actual risk of
developing cancer, it is difficult to draw conclusions concerning accuracy of these risk
perceptions; however, there is some evidence to suggest lower numeracy is associated
with inaccurate estimations of cancer risk (Black et al., 1995; Gurmankin et al., 2004).
Perceived susceptibility (risk) is a key component of several health behavior-related
models and theories (Hochbaum, 1958; Weinstein, 1988; Weinstein & Sandman, 2002),
which highlights the importance of this construct in understanding self-protective health
150
behavior. Individuals who misunderstand their risk may elect not to engage in protective
behavior because they either believe they are not at risk or believe they are at risk, but are
avoiding the behavior out of fear. On the other hand, misunderstanding one‟s risk may
prompt individuals to be overly concerned about their health when this concern is not
warranted.
Actual risk of developing a particular disease may be viewed as a “moving target”
given that risk changes with age and circumstances, which has important implications for
health communication. Individual perceptions of risk may be inaccurate in the presence
of a universal approach to conveying risk information, which may then result in
subsequent health action or inaction based on a misunderstanding of actual risk.
Numerous studies that have found that many women overestimate their lifetime risk of
developing breast cancer (e.g., Croyle & Lerman, 1999) may be the result of this
misunderstanding. Better efforts should be made to communicate that risk statistics are
contingent upon a number of individual factors at a given point in time. Additionally, it
may be possible for tailored risk statistics to be produced and made more readily
available to the public by developing disease-specific risk calculators that could be
completed on a health-related website.
In addition to numeracy, the current research focused on skin cancer, the most
common form of cancer in the U.S. (Centers for Disease Control and Prevention, 2010),
as well as cervical and colorectal cancer. Results from the current study indicate that
about one out of five participants did not often or always engage in at least one behavior
to protect against skin cancer. These results suggest the need for a better understanding of
why individuals do not engage in skin cancer self-protective behavior, such as
151
misconceptions about low risk due to racial or ethnic background or perceived benefits of
not protecting oneself from the sun. Similar research needs to be conducted to examine
cervical and colorectal cancer screening compliance, which was about 83% and 76%,
respectively. These results may be due to barriers that were not examined, or may be due
to measurement error (e.g., women with a hysterectomy were counted as non-adherent
because they reported not having a Pap test in the past three years). With a better
understanding of cancer prevention behaviors, public health professionals can help
improve quality of life by reducing cancer incidence.
Public health interventions aimed at long-term health behavior change often rely
on information dissemination, operating under the assumption that increasing knowledge
impacts behavior change (Rimal & Real, 2003). The RPA framework focuses only on
perceived risk and self-efficacy beliefs as motivators of behavior change, and does not
include a knowledge component. Although the role of knowledge in the RPA framework
is unknown, knowledge of some kind is likely a necessary, but insufficient, prerequisite
for health action (Green & Kreuter, 1999). Additionally, knowledge has been identified
as a modifying factor for perceived threat of disease, including perceived risk, in the
Health Belief Model (Janz, Champion, & Strecher, 2002). One could then infer that
enhancing knowledge may change perceived risk and subsequently change an
individual‟s classification in the RPA framework. For instance, after learning that their
risk of a particular disease is high, individuals in the proactive group (low perceived risk
and high perceived efficacy) may shift to the responsive group (high perceived risk and
high perceived efficacy); individuals in this group are expected to be the most motivated
to engage in self-protective behavior (Rimal & Real, 2003). Public health practitioners
152
using the RPA framework to design interventions should be cognizant that perceived risk
and self-efficacy are situational constructs and individual placement in the framework
can vary depending on their manipulation (Rimal & Real, 2003).
Finally, public health professionals may face ethical issues with regard to
communicating health information. Deliberate framing of information may raise ethical
concerns as it may be viewed as wrong to manipulate the information consumers‟
preferences (Slovic, Peters, Finucane, & MacGregor, 2005). On the other hand, it may
not be possible to frame the information neutrally; therefore, it has been argued that
information should be presented in a manner likely to promote individual welfare (Slovic
et al., 2005). Other arguments about the ethics of message framing stem from the medical
field and pertain to presentation of information in terms of absolute risk and benefits
(Schwartz & Meslin, 2008). Some authorities have argued for presenting individuals
seeking preventive services with information in terms of absolute probabilities (Paling,
2003; Thomson, Edwards, & Grey, 2005), based on the concern that not providing
information in this format violates respect for autonomy because patients cannot make
informed decisions without this information. Conversely, it has been argued that patients
may misunderstand and act irrationally in response to this information, resulting in
adverse effects on autonomy and outcomes (Schwartz & Meslin, 2008). These ethical
principles have important implications for public health communication, specifically in
terms of how much information to convey and the appropriate format for conveying
information that will optimize comprehension of the risks and benefits of preventive or
screening behaviors, while maintaining individual autonomy to choose whether to
participate in those behaviors.
153
Study Strengths
Previous research regarding socio-demographic factors associated with numeracy
has been limited to small or convenience samples, or both. The current study used a large,
nationally representative sample to examine numeracy, risk perceptions, and cancer self-
protective behaviors, thereby enhancing generalizability of the results to a larger
audience. Given that relatively little research has been conducted to examine the
association between numeracy and risk perceptions, this study helps to fill gaps in the
existing literature in these areas. Additionally, some findings from the current study
reinforce those of previous studies, thereby confirming the importance of some variables
in the study of numeracy and risk perceptions. Results may be used to inform educational
interventions aimed at enhancing understanding of risk perceptions while accounting for
numeracy level.
In addition to the large, nationally representative sample, a unique aspect of the
current study was the use of exploratory and confirmatory samples to examine factors
associated with numeracy and risk perceptions. These samples were used to explore
whether factors would remain constant across subsamples from the same sample, which
serves to strengthen the study by addressing potential criticisms that the logistic
regression models are “overfit” to the data. Although some factors significant with the
outcome variable differed from the exploratory to the confirmatory samples, the overall
models were significant across the samples.
Study Limitations
Despite its strengths, there are several limitations of this study. As stated
previously, the use of secondary data in the conduct the study limits the measurement of
154
the desired constructs to variables available in the HINTS dataset. Previous studies on
both objective and subjective numeracy used scales to measure a range of ability. In
contrast, only one objective and one subjective item was available for analysis in the
HINTS dataset, thereby limiting not only the examination of breadth of individual ability,
but also the extent to which findings could be compared to previous research.
Furthermore, the measures used for other constructs may not have been optimal.
Perceived risk was about cancer in general and not site-specific; therefore, participants
may not have known how to respond to the item given that perceived risk may vary by
cancer site. Self-efficacy was measured using an item regarding the ability to prevent
cancer. Again, an item regarding a site-specific cancer may have elicited more precise
self-efficacy responses. The absence of site-specific measures of cancer risk perceptions
and self-efficacy made it somewhat difficult to link perceived risk and self-efficacy to
cancer prevention behaviors. Three different cancer prevention behaviors were selected
as outcome variables in an attempt to account for the ambiguity in these independent
variables.
The cross-sectional nature of this study does not allow for the assessment of
temporal comparisons of variables; thus, the current study is exploratory and focuses only
on an examination of the association between variables. The current research focused on
numeracy predictors of risk perception and does not account for some non-numerical
predictors, such as subjective norm. Hispanics were underrepresented in the mailed
questionnaire format of HINTS, as the survey was provided only in English; therefore,
results may not be generalizable to Hispanics who read text only in Spanish. Finally, data
are limited to individuals who completed the survey; this group may represent those with
155
not only the highest motivation, but also for whom the subject matter was most salient,
and for whom literacy or health literacy were not severe issues.
Conclusions
Future Research
The current study contributes to the numeracy, cancer risk perception, and cancer
self-protective behavior literature by offering a look at the association between these
variables using a nationally representative sample. In light of the study‟s strengths and
weaknesses, several recommendations for future research are presented.
More research is warranted to examine various aspects of numeracy, including
measurement, theory, and use in practice. Schapira (n.d.) received an NCI RO1 grant to
develop a health numeracy measure based on an empirically-derived framework. The
domains of the framework include primary numeric skills (e.g., ability to apply numbers
to concepts such as dates and time), applied numeracy (e.g., use of numbers in day to day
tasks, communicating probabilistic information, and weighing risks and benefits of a
medical decision), and interpretive numeracy (e.g., ability to understand strengths and
limitations of using numbers to convey concepts such as intervention efficacy). In
addition to these domains, positive and negative affect can influence communication with
numbers. Schapira proposed to develop and establish validity and reliability of a health
numeracy measure that is based on this framework, cross-culturally equivalent across
racial and ethnic groups, and developed using Item Response Theory. Based on this
description, the final instrument appears to represent a more thorough assessment of
health numeracy than previous instruments. It would be interesting to see how this
measure of numeracy relates to cancer risk perceptions and self-protective behavior.
156
A theoretical framework for numeracy was previously proposed by Lipkus and
Peters (2009) and described in Chapter 2. This framework describes the manner in which
numeric stimuli is processed and used to arrive at health decisions and behaviors. Based
on the outcomes of the current and previous studies, perhaps it would be useful to add
socio-demographic factors to this model. Age and education were factors consistently
associated with objective numeracy in the exploratory and confirmatory samples in the
current study. Older age and lower educational attainment may impede comprehension
and interpretation of numbers; perhaps these factors should be added to the sixth box in
the framework. More research is needed to confirm the importance of these factors, as
well as to provide empirical evidence for the framework.
Additional research is also needed to assess the tradeoff between higher predictive
power (objective numeracy) and less aversive measures (subjective numeracy).
Subjective measures may take less time to complete and perceived to be less stressful and
frustrating than objective measures, which may translate to better completion rates and
fewer missing data (Fagerlin, Zikmund-Fisher et al., 2007). Subjective numeracy
measures may also be ideal in instances where numeracy needs to be assessed quickly in
an effort to tailor the communication of health information, such as in a physician‟s
office. On the other hand, the utility of subjective measures may be limited if they lack
accuracy. More research is needed to determine whether one measure is “better” than the
other and, if so, whether it is true for most cases or context-specific (e.g., subjective
numeracy is better for quick assessments at health fairs).
More research is also needed to examine numeracy, risk perceptions, and
behavior among large, nationally representative samples by either expanding HINTS in
157
the next iteration, or by using another dataset altogether. The HINTS instrument was
designed to examine health information trends among those residing in the U.S. Given
the purpose of the instrument, it would make sense to add more numeracy items so as to
give a better understanding of not only how individuals obtain health information, but
also to ascertain how individuals understand the information. It would also be helpful if
the next HINTS instrument contained site-specific cancer risk perception items. Previous
versions of HINTS contained these items, but may have been traded for a more general
cancer risk perception item in an effort to reduce the total number of survey items. It is
important to maintain a balance between obtaining necessary information and limiting the
number of survey items so as to reduce participant burden. In that regard, it may be
advantageous to conduct a separate survey on numeracy, cancer risk perceptions, and
behavior, if funds are available to conduct the survey at the magnitude necessary for
generalizability. In addition, a longitudinal study design would assist in identifying
temporal relationships between variables and therefore would assist in establishing
whether perceived risk results in subsequent preventive behavior.
There is a need to continue to focus on best practices regarding health information
presentation format for individuals based on numeracy level. For instance, more research
is needed to determine whether certain graphics are more appropriate or preferable for
communicating risk information based on numeracy level (Fagerlin, Ubel et al., 2007).
Additional research is needed to determine whether denominator size affects
comprehension based on numeracy level. The objective numeracy item in the current
study asked participants to identify the largest risk based on different denominators (1 in
10; 1 in 100; 1 in 1,000). Participants who did not provide a correct response may be
158
confused by varying denominators. Other presentation formats that should be considered
in future research include absolute versus relative risk, frequencies versus percentages,
and gain versus loss frames (Fagerlin, Ubel et al., 2007), as relatively little research has
been conducted to determine the optimal format for presenting information based on
numeracy level.
As suggested by previous research (Nelson et al., 2008) and the framework
proposed by Schapira, future research should focus on the relationship between affect (an
aspect of intuition) and numeracy. When making decisions, lower numerate individuals
may rely more on non-numeric sources of information, such as mood or affect, than
numerical information (Nelson et al., 2008), whereas higher numerate individuals may
rely more on numerical information to make decisions. Affect has been associated with
cancer decisions, including the decision to seek prostate cancer screening (Myers, 2005).
Further research is needed to examine affect and numeracy in health decision-making.
Finally, future research should focus on examining causes of numerical ability.
Perhaps a means for improving numeracy as it relates to health decision-making is to
enhance these skills in primary education. One Australian study examined the association
between infant, maternal, and neighborhood characteristics at birth, and numeracy
attainment in third grade (Malacova et al., 2008). Term birth and head growth were
associated with higher numeracy scores, while controlling for all other characteristics.
More research is warranted to examine these maternal and child health factors that may
impact numeracy.
In summary, numeracy research is still in its infancy. More research is needed to
study its measurement and best practices for communicating health information based on

159
numerical ability. A better understanding of numeracy and its role in health
communication will translate to more informed health decision-making and, ultimately,
better health outcomes.
160
References
Ancker, J. S., Senathirajah, Y., Kukafka, R., & Starren, J. B. (2006). Design features of
graphs in health risk communication: A systematic review. Journal of the
American Medical Informatics Association, 13(6), 608-618.
Black, W. C., Nease, R. F., & Tosteson, A. (1995). Perceptions of risk and screening
effectiveness in women younger than 50 years of age. Journal of the National
Cancer Institute, 87(10), 720-731.
Centers for Disease Control and Prevention. (2010). Skin cancer statistics. Retrieved
August 25, 2010, from http://www.cdc.gov/cancer/skin/statistics/index.htm
Committee on Health Literacy. (1999). Health literacy: Report of the council on scientific
affairs. Ad Hoc committee on health literacy for the council on scientific affairs.
American Medical Association. Journal of the American Medical Association,
281(6), 552-557.
Croyle, R. T., & Lerman, C. (1999). Risk communication in genetic testing for cancer
susceptibility. Journal of the National Cancer Institute Monographs No. 25, 59-
66.
Dillard, A. J., McCaul, K. D., Kelso, P. D., & Klein, W. M. P. (2006). Resisting good
news: reactions to breast cancer risk communication. Health Communication,
19(2), 115-123.
Fagerlin, A., Ubel, P. A., Smith, D. M., & Zikmund-Fisher, B. J. (2007). Making
numbers matter: Present and future research in risk communication. American
Journal of Health Behavior, 31, S47-S56.
161
Fagerlin, A., Zikmund-Fisher, B. J., Ubel, P. A., Jankovic, A., Derry, H. A., & Smith, D.
M. (2007). Measuring numeracy without a math test: development of the
subjective numeracy scale. Medical Decision Making, 27(5), 672-680.
Galesic, M., Gigerenzer, G., & Straubinger, N. (2009). Natural frequencies help older
adults and people with low numeracy to evaluate medical screening tests. Medical
Decision Making, 29(3), 368-371.
Green, L.W., & Kreuter, M. W. (1999). Health promotion planning: An educational and
ecological approach. New York: McGraw-Hill.
Gurmankin, A. D., Baron, J., & Armstrong, K. (2004). Intended message versus message
received in hypothetical physician risk communications: exploring the gap. Risk
Analysis, 24(5), 1337-1347.
Helzlsouer, K. J., Ford, D. E., Hayward, R. S., Midzenski, M., & Perry, H. (1994).
Perceived risk of cancer and practice of cancer prevention behaviors among
employees in an oncology center. Preventive Medicine, 23(3), 302-308.
Hibbard, J. H., Peters, E., Dixon, A., & Tusler, M. (2007). Consumer competencies and
the use of comparative quality information: It isn't just about literacy. Medical
Care Research and Review, 64(4): 379-394.
Hibbard, J. H., Peters, E., Slovic, P., Finucane, M. L., & Tusler, M. (2001). Making
health care quality report cards easier to use. Joint Commission Journal on
Quality Improvement, 27, 591-604.
Hochbaum, G. M. (1958). Public participation in medical screening programs: A
sociopsychological study. PHS publication no. 572. Washington, D.C.:
Government Printing Office.
162
Institute of Medicine (IOM) Committee on Health Literacy. (2004). Health literacy: A
prescription to end confusion. Washington, DC: The National Academies Press.
Janz, N. K., Champion, V. L., & Strecher, V. J. (2002). The health belief model. In K.
Glanz, B. K. Rimer & F. M. Lewis (Eds.), Health behavior and health education:
Theory, research, and practice (pp. 45-66). San Francisco: Jossey-Bass.
Jemal, A., Siegel, R., Ward, E., Hao, Y., Xu, J., & Thun, M. J. (2009). Cancer statistics,
2009. CA Cancer Journal for Clinicians, 59(4), 225-249.
Kim, S. E., Pérez-Stable, E. J., Wong, S., Gregorich, S., Sawaya, G. F., Walsh, J. M., et
al. (2008). Association between cancer risk perception and screening behavior
among diverse women. Archives of Internal Medicine, 168(7), 728-734.
Li, S.-C., Lindenberger, U., Hommel, B., Aschersleben, G., Prinz, W., & Baltes, P. B.
(2004). Transformations in the couplings among intellectual abilities and
constituent cognitive processes across the life span. Psychological Science, 15(3),
155-163.
Lichtenstein, P., Holm, N. V., Verkasalo, P. K., Iliadou, A., Kaprio, J., Koskenvuo, M., et
al. (2000). Environmental and heritable factors in the causation of cancer--
analyses of cohorts of twins from Sweden, Denmark, and Finland. The New
England Journal of Medicine, 343(2), 78-85.
Lipkus, I., & Peters, E. (2009). Understanding the role of numeracy in health: proposed
theoretical framework and practical insights. Health Education & Behavior,
36(6), 1065-1081.
163
Lipkus, I. M., Rimer, B. K., & Strigo, T. S. (1996). Relationships among objective and
subjective risk for breast cancer and mammography stages of change. Cancer
Epidemiology, Biomarkers & Prevention, 5(12), 1005-1011.
Lipkus, I. M., Samsa, G., & Rimer, B. K. (2001). General performance on a numeracy
scale among highly educated samples. Medical Decision Making, 21(1), 37-44.
Malacova, E., Li, J. H., Blair, E., Leonard, H., de Klerk, N., & Stanley, F. (2008).
Association of birth outcomes and maternal, school, and neighborhood
characteristics with subsequent numeracy achievement. American Journal of
Epidemiology, 168(1), 21-29.
Myers, R. E. (2005). Decision counseling in cancer prevention and control. Health
Psychology, 24(Suppl. 4), S71-S77.
Nelson, W., Reyna, V. F., Fagerlin, A., Lipkus, I., & Peters, E. (2008). Clinical
implications of numeracy: theory and practice. Annals of Behavioral Medicine,
35(3), 261-274.
Orom, H., Kiviniemi, M. T., Underwood, I. W., Ross, L., & Shavers, V. L. (2010).
Perceived cancer risk: Why is it lower among nonwhites than whites? Cancer
Epidemiology, Biomarkers & Prevention, 19(3), 746-754.
Paling, J. (2003). Strategies to help patients understand risks. British Medical Journal,
327(7417), 745-748.
Peters, E. (2008). Numeracy and the perception and communication of risk. Annals of the
New York Academy of Sciences, 1128(1), 1-7.
164
Pichon, L. C., Corral, I., Landrine, H., Mayer, J. A., & Adams-Simms, D. (2010).
Perceived skin cancer risk and sunscreen use among African American adults.
Journal of Health Psychology, [Epub ahead of print].
Reyna, V. F., & Brainerd, C. J. (1994). The origins of probability judgment: A review of
data and theories. In G. Wright & P. Ayton (Eds.), Subjective Probability (pp.
239-272). New York: Wiley.
Reyna, V. F., & Brainerd, C. J. (2007). The importance of mathematics in health and
human judgment: numeracy, risk communication, and medical decision making.
Learning and Individual Differences, 17(2), 147-159.
Rimal, R. N., & Real, K. (2003). Perceived risk and efficacy beliefs as motivators of
change: use of the risk perception attitude (RPA) framework to understand health
behaviors. Human Communication Research, 29(3), 370-399.
Robb, K. A., Miles, A., & Wardle, J. (2004). Demographic and psychosocial factors
associated withperceived risk for colorectal cancer. Cancer Epidemiology,
Biomarkers & Prevention, 13(3), 366-372.
Saules, K. K., Vannest, N. O., Mehringer, A. M., Pomerleau, C. S., Lee, K., Opipari, A.
W., et al. (2007). Actual versus perceived risk of cervical cancer among college
women smokers. Journal of American College Health, 55(4), 207-213.
Schapira, M. M. (n.d.). The development of a health numeracy measure. Retrieved
February 27, 2011, from
http://cancercontrol.cancer.gov/grants/abstract.asp?ApplID=7679114
165
Schwartz, P. H., & Meslin, E. M. (2008). The ethics of information: Absolute risk
reduction and patient understanding of screening. Journal of General Internal
Medicine, 23(6), 867-870.
Schwarzer, R. (1994). Optimism, vulnerability, and self-beliefs as health-related
cognitions: A systematic overview. Psychology and Health, 9(3), 161-180.
Slovic, P., Peters, E., Finucane, M. L., & MacGregor, D. G. (2005). Affect, risk, and
decision making. Health Psychology, 24(4), S35-S40.
Stark, J. R., Bertone-Johnson, E. R., Costanza, M. E., & Stoddard, A. M. (2006). Factors
associated with colorectal cancer risk perception: The role of polyps and family
history. Health Education Research, 21(5), 740-749.
Thomson, R., Edwards, A., & Grey, J. (2005). Risk communication in the clinical
consultation. Clinical Medicine, 5(5), 465-469.
U.S. Department of Health and Human Services. (n.d.). Healthy People 2010. Retrieved
November 17, 2007, from http://www.health.gov/healthypeople/
Vernon, S. W., Myers, R. E., Tilley, B. C., & Li, S. (2001). Factors associated with
perceived risk in automotive employees at increased risk of colorectal cancer.
Cancer Epidemiology, Biomarkers & Prevention, 10(1), 35-43.
Vernon, S. W., Vogel, V. G., Halabi, S., & Bondy, M. L. (1993). Factors associated with
perceived risk of breast cancer among women attending a screening program.
Breast Cancer Research and Treatment, 28(2), 137-144.
Weinstein, N. D. (1988). The precaution adoption process. Health Psychology, 7(4), 355-
386.
166
Weinstein, N. D., Marcus, S. E., & Moser, R. P. (2005). Smokers' unrealistic optimism
about their risk. Tobacco Control, 14(1), 55-59.
Weinstein, N. D., & Sandman, P. M. (2002). The precaution adoption process model. In
K. Glanz, B. K. Rimer & F. M. Lewis (Eds.), Health Behavior and Health
Education: Theory, Research and Practice (3rd ed., pp. 121-143). San Francisco:
Jossey Bass.
Woloshin, S., Schwartz, L. M., & Welch, H. G. (2005). Patients and medical statistics:
interest, confidence, and ability. Journal of General Internal Medicine, 20(11),
996-1000.
Zikmund-Fisher, B. J., Smith, D. M., Ubel, P. A., & Fagerlin, A. (2007). Validation of
the subjective numeracy scale: Effects of low numeracy on comprehension of risk
communications and utility elicitations. Medical Decision Making, 27(5), 663-
671.
Related Documents