Nudging Technology Use: Descriptive and Experimental Evidence from School Information Systems * Peter Bergman † As schools are making significant investments in education technologies it is important to assess whether various products are adopted by their end users and whether they are effective as used. This paper studies the adoption and ability to promote usage of one type of technology that is increasingly ubiquitous: school-to-parent communication technologies. Analyzing usage data from a Learning Management System across several hundred schools and then conducting a two-stage experiment across 59 schools to nudge the use of this tech- nology by families, I find that 57% of families ever use it and adoption correlates strongly with measures of income and student achievement. While a simple nudge increases usage and modestly improves student achievement, without more significant intervention these tech- nologies may exacerbate gaps in information access and student performance across income and performance levels. * I thank Josefa Aguirre and Eric Chan for excellent research assistance. I am particularly grateful to the Seminar for the Study of Development strategies and Abhit Bhandari and Kolby Hanson for thoughtfully replicating this paper and providing comments. I also thank George Bulman, Sue Dynarski, Jay Greene, Macartan Humphreys, Scott Imberman, Brian Jacob, Isaac McFarlin, Richard Murphy, Kevin Stange, and seminar participants at the University of Arkansas, the University of Michigan and the University of Connecticut for their comments and suggestions. All errors are my own. † Teachers College, Columbia University, 525 W. 120th Street New York, New York 10027 E-mail: [email protected] Website: www.columbia.edu/ ~ psb2101

Welcome message from author
This document is posted to help you gain knowledge. Please leave a comment to let me know what you think about it! Share it to your friends and learn new things together.
Transcript

Nudging Technology Use: Descriptive and Experimental Evidencefrom School Information Systems∗
Peter Bergman†
As schools are making significant investments in education technologies it is importantto assess whether various products are adopted by their end users and whether they areeffective as used. This paper studies the adoption and ability to promote usage of one typeof technology that is increasingly ubiquitous: school-to-parent communication technologies.Analyzing usage data from a Learning Management System across several hundred schoolsand then conducting a two-stage experiment across 59 schools to nudge the use of this tech-nology by families, I find that 57% of families ever use it and adoption correlates stronglywith measures of income and student achievement. While a simple nudge increases usage andmodestly improves student achievement, without more significant intervention these tech-nologies may exacerbate gaps in information access and student performance across incomeand performance levels.
∗I thank Josefa Aguirre and Eric Chan for excellent research assistance. I am particularlygrateful to the Seminar for the Study of Development strategies and Abhit Bhandari andKolby Hanson for thoughtfully replicating this paper and providing comments. I also thankGeorge Bulman, Sue Dynarski, Jay Greene, Macartan Humphreys, Scott Imberman, BrianJacob, Isaac McFarlin, Richard Murphy, Kevin Stange, and seminar participants at theUniversity of Arkansas, the University of Michigan and the University of Connecticut fortheir comments and suggestions. All errors are my own.†Teachers College, Columbia University, 525 W. 120th Street New York, New York 10027
E-mail: [email protected] Website: www.columbia.edu/~psb2101

I Introduction
New technologies in the public sector often aim to improve the quality of government-
provided services. This is true in the education sector, where the purchase of technologies
may improve curriculum delivery, data management and school-to-parent communication.
A number of papers have studied the educational impacts of information technologies such
as computers (Machin et al., 2007; Barrera-Osorio and Linden, 2009; Malamud and Pop-
Eleches, 2011; Fairlie and Robinson, 2013; Vigdor et al., 2014; Beuermann et al., 2015),
access to the Internet (Goolsbee and Guryan, 2006; Belo et al., 2013; Bulman and Fairlie,
2015; Dettling et al., 2015), computer-aided instruction (Angrist and Lavy, 2002; Rouse and
Krueger, 2004; Barrow et al., 2009; Banerjee et al., 2007; Linden, 2008; Taylor, 2015), teacher
dashboards (Tyler, 2013) and mobile devices (Fryer, 2013; Bergman, 2014; Castleman and
Page, 2014; York and Loeb, 2014; Beland and Murphy, 2015; Castleman and Page, 2016;
Bergman and Chan, 2017; Page and Gehlbach, 2017).
Similar to many other contexts however, the end users of education technologies may
be distinct from the administrators in control of procurement. While the end users for
local education agencies are often teachers, parents and students, many purchasing decisions
are made at the district or school level. For instance, New York City spent $95 million
on their “Achievement Reporting and Innovation System,” which was subsequently ended
as a result of high costs and low usage by teachers and parents, according to an agency
spokesperson.1 Given the growing private-sector investments in new education technologies,
from $600 million in 2009 to $2.5 billion in the first half of 2015 alone, plus an additional $11
billion spent by K-12 and higher-education institutions (Adkins, 2016; McCarthy, 2016), an
important question is how the products purchased by local education agencies are adopted
by their end users and whether promoting usage impacts outcomes.
This paper studies a technology that is increasingly ubiquitous in schools: school-to-family
1See this article in theThe Daily News.
1

communication technologies. Unlike computer-aided instructional technologies, which can
substitute for teacher instruction (Taylor, 2015), communication technologies can comple-
ment instruction in the classroom by informing families about students’ academic progress.
These technologies also have the potential to remedy the gap in communication quality that
exists between low and high-achieving schools (Bridgeland et al., 2008).
Previous research suggests school-to-parent communication can address significant infor-
mation asymmetries that exist between parents and their children. These asymmetries can
impede human capital investments (Akabayashi, 2006; Bergman, 2014; Bursztyn and Coff-
man, 2012; Cosconati, 2009; Hao et al., 2008; Weinberg, 2001). Recent experimental evidence
shows that reducing these information problems can improve student achievement, and often
at low cost. For instance, Kraft and Dougherty (2013) conducted an experiment in a Boston
charter school that shows daily phone calls home to parents from their child’s teachers im-
prove student behaviors. Bergman (2014) and Bergman and Chan (2017) randomized the
provision of text messages to parents detailing their child’s missing assignments and grades
increased student effort and achievement. Kraft and Rogers (2015) show that messages from
teachers to parents significantly reduced dropout from a high school credit recovery program
and Rogers and Feller (2016) find letters to parents about their child’s absences and designed
using ideas from behavioral science reduce absenteeism.
Many school districts are leveraging Learning Management Systems (LMS) to improve
family access to student information at scale by placing students’ academic data onto an
online “portal” for view online. This technology allows families to view performance indica-
tors such as their child’s grades, attendance and missing assignments in real time as teachers
update it. Figure 1 shows an example of the portal studied in this paper. Families are
provided a website address, a user name, and a password either by teachers or other school
employees. Once a family logs in they see the student’s classes, teachers and the associated
grades. Figure 2 displays the screen seen once they click on a specific class their child is
taking. Families can then view their child’s assignments, assignment scores, the grading scale
2

and scoring codes. The exact same information can be viewed through a student account
with a separate user name and password also for the purpose of tracking assignments and
grades.
However these systems are typically purchased at the school or district level, and the
adoption, usage and effects of this technology are unknown. As opposed to the experimental
evidence on school-to-parent communication described above, which pushes information out
to families via text messages and phone calls, this parent-portal technology requires much
more of a pull. There are several potential barriers to adoption and usage: parents must
have internet access, be aware the system exists, keep track of their user name and password,
and remember to log in. Like many school-to-parent communication systems, parent user
names and passwords must be downloaded from the LMS and distributed to parents. This
distribution can occur by mail, email, or at school events.
This paper studies the adoption of this education technology by families and whether a
simple nudge can promote usage and improve student outcomes. To examine use, I analyze
data from a learning management company operating in 15 school districts that tracks parent
and student logins into the portal as well as student grades.
To nudge additional use, I selected a sample of low-users across three school districts
and conducted a two-stage experiment informing families about the portal and providing
families their account information. The experimental design is similar to that used by Duflo
and Saez (2003) to study the role of social interactions in retirement plan decisions: First,
schools are randomized to either have a sample of families treated or to have no families
treated. Second, families within treated schools are randomly selected to actually receive
the intervention, which provides sign-up information to parents via phone calls and letters.
This design permits analysis of the direct effects of the intervention on usage as well as
potential spillover effects.
In general, the influence of peers on individuals’ behaviors is difficult to estimate due to
the reflection problem (Manski, 1993). A number of papers show how peer influence can
3

either encourage or discourage the adoption of health and agricultural-related technologies,
particularly in lower-income countries (Foster and Rosenzweig, 1995; Kremer and Miguel,
2007; Conley and Udry, 2010; Foster and Rosenzweig, 2010; Duflo et al., 2011; Oster and
Thornton, 2012; Dupas, 2014). Several other papers find that social norms can “nudge” the
adoption of new behaviors in a variety of contexts (Cialdini et al., 2006; Goldstein et al., 2007;
Gerber and Rogers, 2009; Allcott, 2011; Allcott and Rogers, 2014; Bhargava and Manoli,
2015; Hallsworth et al., 2017; Bird et al., 2017). This paper contributes to this literature
by studying whether peers influence the adoption of an education-related technology in the
United States.
Qualitative interviews with school administrators and parents revealed many parents use
their child’s student account to log in, as they can each view the same information. I
report “family” usage of parent and student accounts. I find that family adoption of this
technology follows an S-shape curve over the course of the school year that rises quickly then
levels off. Usage is far from complete. Across several hundred schools, 25% of families have
ever logged into their parent accounts by the end of the year and roughly 4% of families
log into those accounts at least once per week. More families use the student accounts:
49% of student accounts have ever been used and 57% of either parents or student accounts
have ever been used. School-level adoption rates positively correlate with measures of family
income, school-level test scores and teacher usage. Families with higher-achieving students
adopt. Importantly, these patterns suggest that this technology, without intervention, may
not address the disparities in student achievement or school-to-family communication that
exist across income and performance groups.
The experimental intervention increased total family usage (either to student or parent
accounts) by nearly two logins per month compared to families in schools where no one
received the intervention. There are significant and near-complete spillovers, which is similar
to the findings in Duflo and Saez (2003).
Increasing usage modestly improved student grades. For both the treatment and spillover
4

groups, GPA improved by 0.10 points. Though it is difficult to consider a treatment-on-the
treated effect given the effects on both adoption and usage through multiple channels, the
results suggest this technology is capable of a modest improvement in student outcomes
but that usage is not widespread without significant intervention, especially among schools
serving lower-income and lower-performing students.
The rest of this paper is organized as follows. Section II describes the data and patterns
of usage. Sections III describes the experimental design to nudge additional usage. Sections
IV presents the results of this experiment. Section V concludes and provides a basic cost
analysis.
II Data and Descriptive Results
This study draws data from several sources. The first is deidentified data from a Learning
Management System (LMS) company for the 2013-2014 school years. This LMS provider
hosts a parent portal, a teacher gradebook, and a student portal. The student portal shows
the same academic information to students as the parent portal shows to parents, but the
user name and password are distinct from the parent user name and password.
The LMS records logins into the parent, student and teacher portals by date. During the
2012-2013 school year, there are nearly 7,000,000 logins-by-week observations across 149,107
students. The LMS also records student grades by marking period and course. Students in
elementary school do not receive letter grades, so these marks are excluded from the analysis
sample (9.75% of marks).
While the data have the unique aspect of recording portal usage and student grades the
data have several limitations as well. First, the LMS data only have a single demographic
variable that is recorded across all schools, which is student gender. Second, grade levels
for students are missing. Third, there are no standardized test scores in the data. However,
GPA is a stronger predictor of college performance than SAT or ACT scores, even unadjusted
5

for high school quality (Rothstein, 2004; Bowen et al., 2009; Hiss and Franks, 2014; Scott-
Clayton et al., 2014).
I supplement these LMS data with information from the NCES Common Core Data,
which records school-level characteristics for the universe of public schools in the United
States. These data describe, at the school level, demographic shares by race, receipt of
free/reduced-price lunch, as well as Title I status and location in an urban, suburban, town
or rural location.
Lastly, to obtain a unified measure of school performance across school districts, I draw
on the decile performance ratings constructed by GreatSchools, a nonprofit organization.
In most settings, GreatSchools formulates these ratings by calculating the average share of
students who are proficient in math and English per grade and averaging these shares across
the grades a school offers. GreatSchools then uses this measure to assign schools their state-
wide decile. Thus if a school receives a rating of 10, that school is in the top-ten percent of
the state according to this measure of proficiency. This variable is only used as a covariate.
Table 1 presents summary statistics of the data used to describe portal usage. There are
264 schools across 15 school districts. These schools enroll 149,107 students. On average,
schools are 78% white, 15% Black, and 4% Hispanic. The majority (55%) receive free or
reduced-price lunch. The plurality of the sample is rural (41%) with the remaining sample
primarily urban and suburban. While this geographic balance is not representative of the
United States, it nonetheless has significant enough variation to find informative correlates
of portal adoption and usage across a variety of contexts.
The vast majority of families have never logged into their parent accounts. Table 2 uses
data from the LMS to describe basic usage patterns. During the 2013-2014 school year, the
share of families who had ever logged into the system was 25%. Overall, 8% of parents log
in at least once per week and a total of 13 times during the year, on average. For student
accounts, 49% had ever been used and 22% were used at least once per week for a total of 48
times during the year, on average. There is significant overlap in the usage between student
6

and parent accounts: 57% of either account have ever been logged into.
Figure 3 shows the distribution of total usage of parent accounts for all users who have
logged in at least once. The latter is important because it defines those who likely knew
their account information at one point. Likewise, Figure 4 shows the same histograms for
student account usage conditional on logging in at least once. All of the histograms have
long right tails, though student-account usage dwarfs parent-account usage both in terms of
extensive and intensive margins. Because interviews with school officials and parents found
that parents use both student and parent accounts, I focus on usage of either account from
here on.
Figure 5 traces out the adoption curve for either account—the share of families using
either the parent portal or the student portal by date over the course of 2013-2014 school
year. Adoption takes on an “S” shape, similar to that found in the adoption of other types
of products and technologies (Rogers, 2010). There is a sharp rise at the start of the school
year, but by late November the curve levels off. The share of families who have ever logged
into the system reaches just under 60% by the end of the school year.
Adoption also correlates with measures of income and test scores. Figure 6 shows a
negative correlation between the share of students receiving free or reduced price lunch and
the share of parents who have ever logged in. Figure 7 uses the decile-proficiency measure to
chart the relationship between test scores and the share of families who have ever logged in.
For the highest-performing ten percent of schools, roughly 75% of families have ever logged
into the system. For the lowest-performing ten percent of schools, roughly 20% of families
have ever logged into the system.
To study how usage correlates with achievement at the individual level, I estimate the
following regression model:
GPAi = α +K∑k=1
βk ∗ 1[logins ∈ [ak, bk)] + εi
7

In which GPAi is the average grade of student i. βk are coefficients on indicator variables
for whether a family has logged in to any account between ak and bk times, where the latter
take on values such as 25 to 50 times or 50 to 75 times. Zero logins is the omitted category.
I report the GPAs associated with each category of logins.
Figure 8 plots these predicted GPAs based on the regression above. This graph shows
the average grade of students whose family has never logged into the system, followed by
those who have logged in between 25 and 50 times, and so on. There is a strong correlation
between logins and GPA. The most substantial association–roughly half a GPA point—occurs
between logging in zero times versus 25 times or more over the course of the year.
To study the correlates of adoption rates at the school level, I estimate the following:
ShareAdopteds = γ +X ′sθ + ψs
The dependent variable is the share of families who have ever logged into any account at
school s. The independent variables, Xs, also measured at the school level, are indicators for
whether a school is a middle or high school, Title I status, urban, rural or suburban location,
as well as variables for share Hispanic, Black, free and reduced-price lunch recipients. Average
student-to-teacher ratio and total teacher logins at school s are included as well. ψs is the
residual term, and the regression weights each school observation by the number of students
enrolled.
Table 3 presents the results of this regression for the year 2012-2013. The share Black at a
given school negatively correlates with adoption while the coefficient on the share Hispanic is
small and insignificant after controlling for the remaining covariates. Interestingly, adoption
at the middle-school level is largest and statistically different from elementary and high school
families’ adoption. Though cross sectional, this disparity is in line with other cross-sectional
measures of parental monitoring, such as parent teacher conference attendance, which drops
sharply from middle to high school (Noel et al., 2013).
8

The final row of Table 3 shows two measures related to the potential supply of information.
The logins-per-teacher variable equals the total teacher logins to the LMS at a given school
divided by the number of teachers at the school. This measure of how often teachers use
the gradebook positively correlates with family adoption of the system.2 Higher student-
to-teacher ratios, which may make it more difficult to keep grade information up to date,
negatively correlates with adoption.
Overall these variables can explain nearly 70% of the variation in the adoption shares.
Much of this variation appears to be explained by Title I status, the grade levels served
by the school, and teacher logins. The results also highlight how the supply and demand
for information are likely determined simultaneously, and the difficulty of recovering the
causal effects of the technology on student outcomes. The experiment discussed below iden-
tifies the effects of usage, spillovers and achievement impacts of this technology through an
encouragement design.
III Experimental Design and Implementation
Experimental Design
The experimental intervention consisted of a mailer and a phone call targeted to parents.
The mailer informed families about the parent portal, that they will be called regarding the
parent portal service, and provided the school phone number so parents can obtain their
account information directly from the school. The subsequent phone call to parents told
families their user name, password and the website URL for the parent portal if they had
not already obtained it from the school.
The sample frame for the intervention was comprised of three districts operating 59 ele-
mentary, middle and high schools across two states. Within these districts, the sample was
restricted to parents who had ever logged into the parent portal five times or less. The latter
2Similar measures of supply, such as the average number of teacher logins per student, also positively correlate with parentadoption.
9
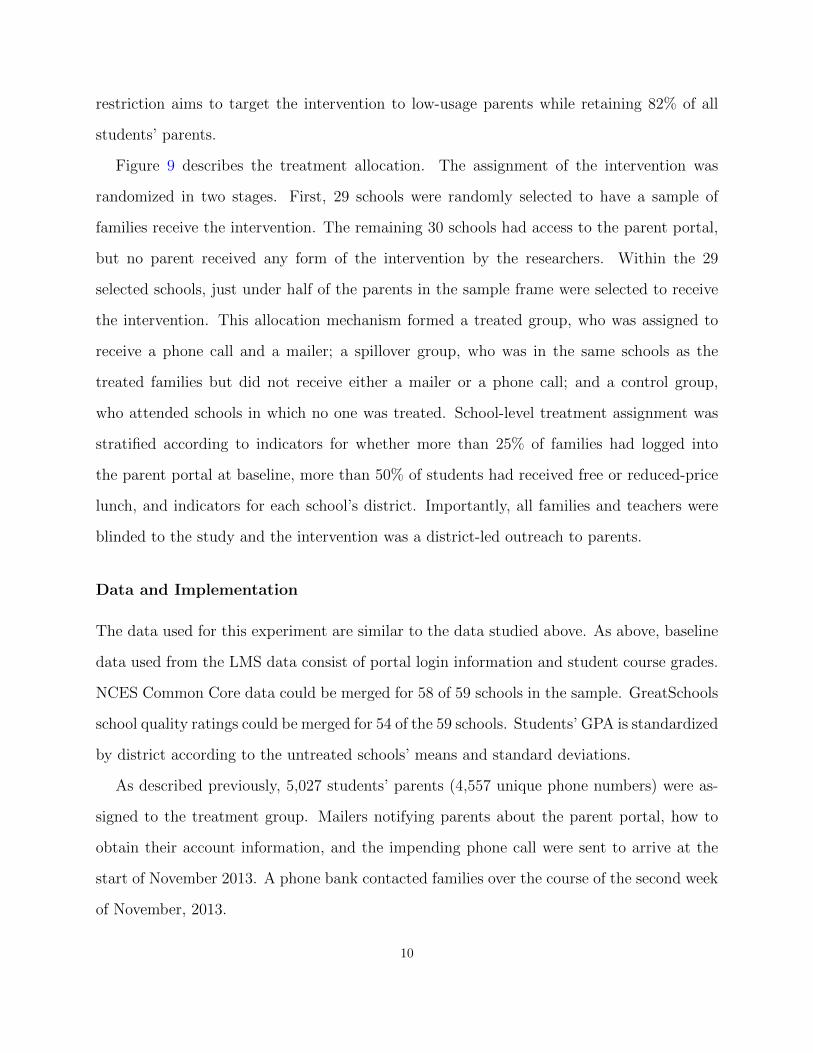
restriction aims to target the intervention to low-usage parents while retaining 82% of all
students’ parents.
Figure 9 describes the treatment allocation. The assignment of the intervention was
randomized in two stages. First, 29 schools were randomly selected to have a sample of
families receive the intervention. The remaining 30 schools had access to the parent portal,
but no parent received any form of the intervention by the researchers. Within the 29
selected schools, just under half of the parents in the sample frame were selected to receive
the intervention. This allocation mechanism formed a treated group, who was assigned to
receive a phone call and a mailer; a spillover group, who was in the same schools as the
treated families but did not receive either a mailer or a phone call; and a control group,
who attended schools in which no one was treated. School-level treatment assignment was
stratified according to indicators for whether more than 25% of families had logged into
the parent portal at baseline, more than 50% of students had received free or reduced-price
lunch, and indicators for each school’s district. Importantly, all families and teachers were
blinded to the study and the intervention was a district-led outreach to parents.
Data and Implementation
The data used for this experiment are similar to the data studied above. As above, baseline
data used from the LMS data consist of portal login information and student course grades.
NCES Common Core data could be merged for 58 of 59 schools in the sample. GreatSchools
school quality ratings could be merged for 54 of the 59 schools. Students’ GPA is standardized
by district according to the untreated schools’ means and standard deviations.
As described previously, 5,027 students’ parents (4,557 unique phone numbers) were as-
signed to the treatment group. Mailers notifying parents about the parent portal, how to
obtain their account information, and the impending phone call were sent to arrive at the
start of November 2013. A phone bank contacted families over the course of the second week
of November, 2013.
10

Empirical Strategy
The random assignment of the phone and the mailer intervention across schools, and subse-
quently across individuals, means that families in the treatment, spillover and control groups
have similar potential outcomes with respect to the treatments. By comparing outcomes be-
tween each group it is possible to estimate the impacts on the treatment and spillover groups.
I estimate intent-to-treat impacts as follows.3
yis = β0 + β1Treatschoolis + β2Spilloveris +X ′isΓ + ηis (1)
Outcomes yis are login and academic outcomes at the individual level for students in school
s.4 The Treatschoolis variable indicates whether a student is in a school in which anyone
receives the treatment. The Spilloveris variable indicates a student who was not assigned to
the intervention, though the individual may have been in a treated school. This specification
implies that the β1 coefficient is the effect of the intervention on those families who were
selected to receive the treatment. The coefficient on the spillover term, β2, estimates the
differential impact on the spillover group—those who were in schools with families selected
for treatment. The test of significance for this coefficient provides evidence whether we can
reject that the spillover group experienced similar effects to the treated group. The Xis
term is a vector with school and individual-level controls as well as strata indicators: the
share white and share Black at the school, the GreatSchools rating of the school, the fraction
receiving free or reduced-priced lunch, baseline total logins and an indicator for ever logging
in. I impute any missing values with the mean value of the variable and include indicators for
missing data for any schools or students lacking such data. All standard errors are clustered
at the school level.
The histograms described previously show that the measures of the number of logins are
3Treatment-on-the-treated impacts are confounded by the simultaneous impact on additional usage by existing users andadoption by new users through their parent or student account.
4There are no effects on the amount of logins by teacher (results available upon request).
11

heavily-skewed count variables (e.g. Figure 3). As such, I model the data on logins using a
negative binomial regression and report marginal effects at the means. Though not shown,
results are similar in magnitude and precision to a transformation of the data as well, such
as inverse-hyperbolic sine transformation;5 results are also quite similar, though marginally
less precise, when using linear regression. When the outcome is an indicator for any usage, I
model the data using a linear-probability model, though average marginal effects are almost
exactly the same when estimated using a Probit or Logit model.
Random assignment also implies background characteristics should be comparable across
groups in expectation. Table 4 shows the covariate balance across the three groups, respec-
tively. The average GPA in the sample is 2.5, students miss 8% of their assignments, on
average, and average total logins into the parent and student portals from the start of the
school year until the second week of October are 0.6 and 22, respectively. As in the descrip-
tive results, Table 4 also shows that logins into the student account are much higher in the
study sample.
The schools are 63% white, 30% Black, and 3% Hispanic. 60% of students receive free
or reduced price lunch. At the individual level and the school level there are no significant
differences between the treatment, spillover and control groups. The number of schools is
small relative to the number of observations however, and results will be shown with and
without controls.
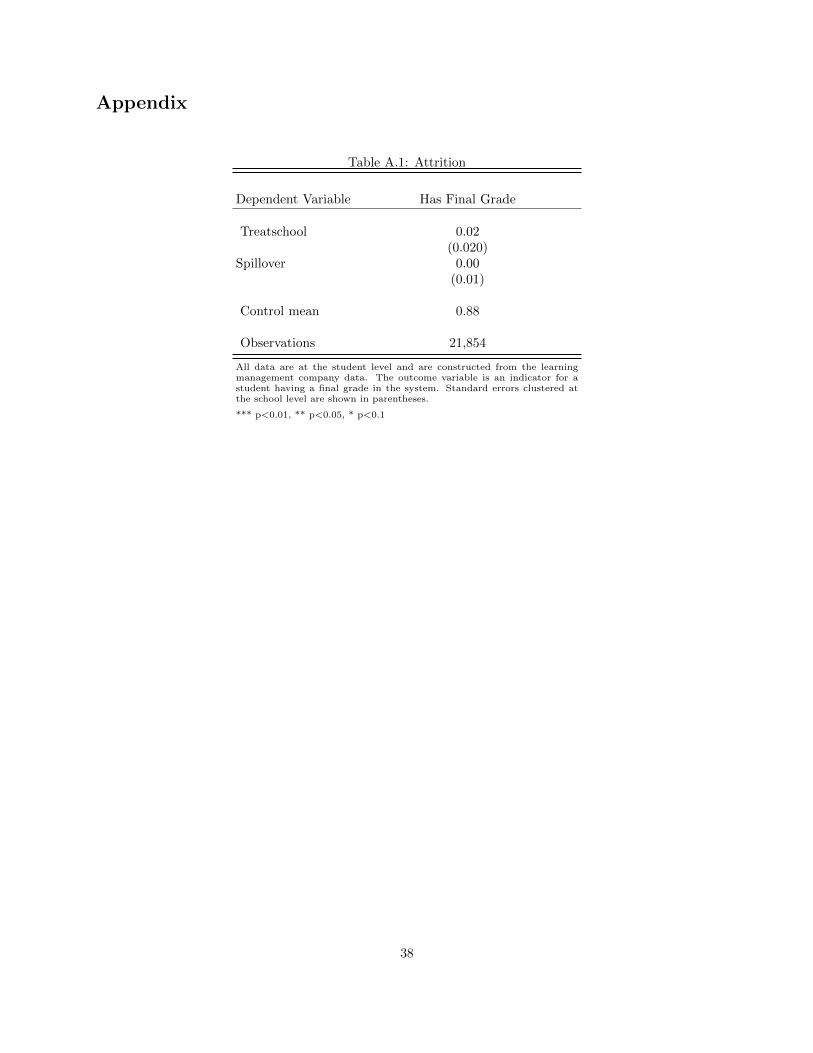
Differential attrition across treatment, spillover and control groups could bias estimates of
treatment effects. The login data do not indicate whether a student has left a participating
district, but observing no final grades is an indicator of district attrition. Table A.1 tests
for differential attrition across treatment and spillover groups by estimating equation (1),
without controls, on an indicator for whether or not a student has a final grade. There is no
evidence of differential attrition from the sample.
5This transformation is akin to a log transformation though it does not treat zeros as missing.
12

IV Adoption, Spillovers and Efficacy
Usage Effects
Figure 10 plots the treatment effect on logins per month for the treatment group compared
to the control schools. The vertical red line in the figure indicates when the phone treatment
occurred. Usage immediately increases by roughly 1.5-2.5 logins per month. The treatment
effect persists through the remainder of the school year, with an upward spike in March.
Figure 11 shows the same graph for the spillover group. Treatment effects on the spillover
group exhibit a similar pattern as the treatment: an swift rise at the outset that largely
persists throughout the remainder of the academic year. The levels of the effect are slightly
smaller however, but nonetheless this is an indicator of positive spillovers.
Table 5 presents the regression results. The Treated school variable indicates whether a
school was treated and the spillover term indicates the differential impact for the spillover
group. The effect on the spillover group is the Treated school coefficient plus the interaction-
term coefficient. The significance or not of the interaction term tests whether the differential
effect is statistically significant. For each outcome, the first column shows the effects with no
control variables (except strata indicators and baseline usage to assess effects at the mean)
and the control mean. The adjacent column presents the same outcome with the additional
controls as described above.
The first two columns of Table 5 show that total usage increased by roughly 11 logins, or
nearly two logins per month as a result of the intervention. The effects are smaller for the
spillover group by one login in total and this difference is significant at the 10% level from
the treatment group when controls are included. This indicates significant spillovers that
are only marginally smaller than the effects on the treatment group. This large spillover
effect is consistent with the large spillovers found by Duflo and Saez (2003) (though they
need not be), which found increases in the enrollment of Tax Deferred Accounts that were
statistically indistinguishable between the treatment and spillover groups.
13

The remaining two columns show that, by the end of the year, just over two-thirds of
families had logged into either the student or parent portal. There is a four percentage point
increase in the likelihood of logging into a portal. This effect is significantly smaller for the
spillover group, which was not provided their account information. The latter is likely a
reason why total logins are slightly smaller for the spillover group than the treatment group.
In results not shown, the effects on take up are significantly larger among those who had
never logged in at baseline—8 percentage points—and remain smaller for the spillover group.
The results on both adoption and usage have implications for interpreting any kind of
treatment-on-the-treated effect for other outcomes. Viewing the effects as only operating
through one channel or the other clearly violates the exclusion restriction as there are effects
on both the intensive and extensive margins and the intervention may have affected usage by
revising parents’ view on the importance of monitoring their children. Overall, the reduced-
form effects of the intervention shows additional usage that is equivalent to between one and
two logins per month for the treatment and spillover groups.
Student Achievement Effects
This section examines the impact of the nudge intervention described in Section III on
student GPA. Table 6 presents the results. The first column shows results without controls
and the second column adds the controls described in the text, including baseline GPA. The
latter improve the precision of the estimates significantly but the point estimate remains
almost unchanged. Overall the effect size is 0.10 standard deviations and is significant at
the 5% level.
The effect on student grades does not significantly differ by treatment or spillover group.
This result is consistent with the effects on total logins patterns, which are similar for both
treatment and spillover groups. The effect size is roughly half of the effect size found in
Bergman (2014), in which information was actively pushed to parents about their child’s
academic performance rather pulled from a portal system. As stated above, it is difficult
14

to scale this effect through an instrumental-variable strategy that uses the intervention as
an instrument for usage; the exclusion restriction is not satisfied as adoption, usage and
potentially awareness about the importance of monitoring and information may all have
been affected by the intervention. Nonetheless, the results do highlight the potential for a
low-cost intervention to leverage this technology to promote academic achievement.
Table A.2 shows exploratory analyses of whether the effects on GPA vary by subgroup.
For ease of presentation the analysis is conducted with a school-level treatment indicator,
which combines treated and spillover groups. There are no differences in heterogeneity
between the spillover and treatment groups (results available on request). The results show
there are no differential effects by baseline GPA, gender, or school-level demographic and
performance characteristics.
Heterogeneity does appear to occur by measures of baseline usage. Parents who used
the system more at baseline saw smaller effects. Moreover, higher levels of student usage is
associated with larger effects and students whose teachers use the system more frequently also
experience larger gains in GPA. To benchmark the amount of heterogeneity, a half-standard
deviation increase in student usage leads to .02 standard deviation gain in GPA and a half-
standard deviation increase in the average logins by a student’s teachers leads to .10 standard
deviation increase in GPA. A half-standard deviation increase in parent usage reduces effects
by .01 standard deviations. These results highlight the apparent complementarity between
parent usage and teacher usage of the portal.
V Discussion and Conclusion
Previous research has shown that school-to-parent communication can improve parental
monitoring and a range of student outcomes. This paper documents some of the first evidence
on families’ adoption of a school communication technology that aims to scale school-to-
family communication. Adoption is not universal; more than 40% of families have never
15

logged into the system. Schools with higher login rates tend to serve higher income and
higher performing students, which suggests that this technology may not close achievement
gaps without active efforts to promote adoption and usage.
A simple intervention providing account information to parents increased families’ adop-
tion and usage by almost two logins per month. Interestingly, there were significant usage
spillovers on families who did not receive the intervention. This increase in usage led to a
modest increase in grades in both treated and spillover group students. Though these gains
are small, the intervention has low marginal cost as well. The mailers cost $0.70 to print and
send across two states. The phone calls cost $1.36 per student to manage and implement.
Nonetheless, the effects on usage are far from sufficient to close the gaps between schools
with high test scores and low test score or schools serving a majority of students who receive
free or reduced priced lunch versus those that serve a majority of students who do not.
The results also emphasize the complementarity between parent usage and teacher usage
of the portal. Both the usage and the GPA treatment effects are larger for schools in which
teachers used the system more frequently. One might hope that the intervention could
generate a demand shock for information sufficient enough to increase the supply information
as proxied by teacher logins, but the study is underpowered to detect such effects.6
Overall, these results indicate both the promise and pitfalls of these technologies. Merely
providing access to information online may not improve outcomes in low-income area schools
and low-performing schools. Given the potential importance of this information and the bar-
riers to online access, future research could examine the take up and efficacy of information
technologies aimed at actively pushing information to parents at scale.
6There is no effect on teacher usage of the portal.
16

References
Adkins, Sam, “2015 International Learning Technology Investment Patterns,” Technical
Report, Ambient Insight 2016.
Akabayashi, Hideo, “An equilibrium model of child maltreatment,” Journal of Economic
Dynamics and Control, 2006, 30 (6), 993–1025.
Allcott, Hunt, “Social norms and energy conservation,” Journal of Public Economics, 2011,
95 (9), 1082–1095.
and Todd Rogers, “The Short-Run and Long-Run Effects of Behavioral Interventions:
Experimental Evidence from Energy Conservation,” American Economic Review, 2014,
104 (10), 3003–37.
Angrist, Joshua and Victor Lavy, “New Evidence on Classroom Computers and Pupil
Learning,” The Economic Journal, 2002, 112 (482), 735–765.
Banerjee, Abhijit V, Shawn Cole, Esther Duflo, and Leigh Linden, “Remedying
Education: Evidence from Two Randomized Experiments in India,” The Quarterly Journal
of Economics, 2007, 122 (3), 1235–1264.
Barrera-Osorio, Felipe and Leigh L Linden, “The Use and Misuse of Computers in
Education,” 2009.
Barrow, Lisa, Lisa Markman, and Cecilia Elena Rouse, “Technology’s Edge: The
Educational Benefits of Computer-Aided Instruction,” American Economic Journal: Eco-
nomic Policy, 2009, 1 (1), 52–74.
Beland, Louis-Philippe and Richard Murphy, “Ill Communication: Technology, Dis-
traction & Student Performance,” Technical Report 2015.
Belo, Rodrigo, Pedro Ferreira, and Rahul Telang, “Broadband in school: Impact on
student performance,” Management Science, 2013, 60 (2), 265–282.
17

Bergman, Peter, “Parent-Child Information Frictions and Human Capital Investment:
Evidence from a Field Experiment,” Columbia University Teachers College Working Paper,
2014.
and Eric W Chan, “Leveraging Technology to Engage Parents at Scale: Evidence from
a Randomized Controlled Trial,” Unpublished paper, 2017.
Beuermann, Diether W, Julian Cristia, Santiago Cueto, Ofer Malamud, and
Yyannu Cruz-Aguayo, “One Laptop per Child at Home: Short-Term Impacts from
a Randomized Experiment in Peru,” American Economic Journal: Applied Economics,
2015, 7 (2), 53–80.
Bhargava, Saurabh and Dayanand Manoli, “Psychological frictions and the incom-
plete take-up of social benefits: Evidence from an IRS field experiment,” The American
Economic Review, 2015, 105 (11), 3489–3529.
Bird, Kelli A, Benjamin L Castleman, Joshua Goodman, and Cait Lamberton,
“Nudging at a National Scale: Experimental Evidence from a Fafsa Completion Cam-
paign,” Unpublished paper, 2017.
Bowen, William G, Matthew M Chingos, and Michael S McPherson, Crossing
the finish line: Completing college at America’s public universities, Princeton University
Press, 2009.
Bridgeland, John M, John J DiIulio, Ryan T Streeter, and James R Mason,
“One Dream, Two Realities: Perspectives of Parents on America’s High Schools.,” Civic
Enterprises, 2008.
Bulman, George and Robert W Fairlie, “Technology and Education: Computers, Soft-
ware, and the Internet,” 2015.
18

Bursztyn, Leonardo and Lucas C Coffman, “The schooling decision: Family prefer-
ences, intergenerational conflict, and moral hazard in the Brazilian favelas,” Journal of
Political Economy, 2012, 120 (3), 359–397.
Castleman, Benjamin and Lindsay Page, “Parental Influences on Postsecondary
Decision-Making: Evidence from a Text Messaging Experiment,” SSRN Working Paper,
2016.
Castleman, Benjamin L and Lindsay C Page, “Summer nudging: Can personalized
text messages and peer mentor outreach increase college going among low-income high
school graduates?,” Journal of Economic Behavior & Organization, 2014.
Cialdini, Robert B, Linda J Demaine, Brad J Sagarin, Daniel W Barrett, Kelton
Rhoads, and Patricia L Winter, “Managing social norms for persuasive impact,” Social
influence, 2006, 1 (1), 3–15.
Conley, Timothy G and Christopher R Udry, “Learning about a new technology:
Pineapple in Ghana,” The American Economic Review, 2010, pp. 35–69.
Cosconati, Marco, “Parenting style and the development of human capital in children,”
Job Market Paper, University of Pennsylvania, 2009.
Dettling, Lisa J, Sarena Goodman, and Jonathan Smith, “Every Little Bit Counts:
The Impact of High-speed Internet on the Transition to College,” 2015.
Duflo, Esther and Emmanuel Saez, “The Role of Information and Social Interactions in
Retirement Plan Decisions: Evidence from a Randomized Experiment*,” The Quarterly
journal of economics, 2003, 118 (3), 815–842.
, Michael Kremer, and Jonathan Robinson, “Nudging Farmers to Use Fertilizer:
Theory and Experimental Evidence from Kenya,” American Economic Review, 2011, 101,
2350–2390.
19

Dupas, Pascaline, “Short-Run Subsidies and Long-Run Adoption of New Health Products:
Evidence from a Field Experiment,” Econometrica, 2014, 82 (1), 197.
Fairlie, Robert W. and Jonathan Robinson, “Experimental Evidence on the Effects of
Home Computers on Academic Achievement among Schoolchildren,” American Economic
Journal: Applied Economics, July 2013, 5 (3), 211–40.
Foster, Andrew D and Mark R Rosenzweig, “Learning by doing and learning from
others: Human capital and technical change in agriculture,” Journal of political Economy,
1995, pp. 1176–1209.
and , “Microeconomics of technology adoption,” Annual Review of Economics, 2010,
2.
Fryer, Roland G, “Information and student achievement: evidence from a cellular phone
experiment,” Technical Report, National Bureau of Economic Research 2013.
Gerber, Alan S and Todd Rogers, “Descriptive social norms and motivation to vote:
Everybody’s voting and so should you,” The Journal of Politics, 2009, 71 (1), 178–191.
Goldstein, Noah J, Vladas Griskevicius, and Robert B Cialdini, “Invoking Social
Norms A Social Psychology Perspective on Improving Hotels’ Linen-Reuse Programs,”
Cornell Hotel and Restaurant Administration Quarterly, 2007, 48 (2), 145–150.
Goolsbee, Austan and Jonathan Guryan, “The impact of Internet subsidies in public
schools,” The Review of Economics and Statistics, 2006, 88 (2), 336–347.
Hallsworth, Michael, John A List, Robert D Metcalfe, and Ivo Vlaev, “The be-
havioralist as tax collector: Using natural field experiments to enhance tax compliance,”
Journal of Public Economics, 2017, 148, 14–31.
20

Hao, Lingxin, V Joseph Hotz, and Ginger Z Jin, “Games Parents and Adolescents
Play: Risky Behaviour, Parental Reputation and Strategic Transfers*,” The Economic
Journal, 2008, 118 (528), 515–555.
Hiss, William C and Valerie W Franks, “Defining promise: Optional standard-
ized testing policies in American college and university admissions,” Report of the Na-
tional Association for College Admission Counseling (NACAC). http://www. nacacnet.
org/research/research-data/nacac-research/Documents/DefiningPromise. pdf, 2014.
Kraft, Matthew A and Shaun M Dougherty, “The effect of teacher–family communi-
cation on student engagement: Evidence from a randomized field experiment,” Journal of
Research on Educational Effectiveness, 2013, 6 (3), 199–222.
and Todd Rogers, “The underutilized potential of teacher-to-parent communication:
Evidence from a field experiment,” Economics of Education Review, 2015, 47, 49–63.
Kremer, Michael and Edward Miguel, “The Illusion of Sustainability*,” The Quarterly
journal of economics, 2007, 122 (3), 1007–1065.
Linden, Leigh L, “Complement or Substitute? The Effect of Technology on Student
Achievement in India,” 2008.
Machin, Stephen, Sandra McNally, and Olmo Silva, “New Technology in Schools: Is
There a Payoff?,” The Economic Journal, 2007, 117 (522), 1145–1167.
Malamud, Ofer and Cristian Pop-Eleches, “Home Computer Use and the Development
of Human Capital,” The Quarterly journal of economics, 2011, 126 (2), 987–1027.
Manski, Charles F, “Identification of endogenous social effects: The reflection problem,”
The review of economic studies, 1993, 60 (3), 531–542.
McCarthy, Shawn, “Pivot Table: U.S. Education IT Spending Guide, Version 1,
20132018,” Technical Report, International Data Corporation 2016.
21

Noel, Amber, Patrick Stark, and Jeremy Redford, “Parent and Family Involvement
in Education, from the National Household Education Surveys Program of 2012. First
Look. NCES 2013-028.,” National Center for Education Statistics, 2013.
Oster, Emily and Rebecca Thornton, “Determinants Of Technology Adoption: Peer
Effects In Menstrual Cup Take-Up,” Journal of the European Economic Association, 2012,
10 (6), 1263–1293.
Page, Lindsay C and Hunter Gehlbach, “How an Artificially Intelligent Virtual Assis-
tant Helps Students Navigate the Road to College,” Unpublished paper, 2017.
Rogers, Everett M, Diffusion of innovations, Simon and Schuster, 2010.
Rogers, Todd and Avi Feller, “Reducing student absences at scale,” Unpublished paper,
2016.
Rothstein, Jesse M, “College performance predictions and the SAT,” Journal of Econo-
metrics, 2004, 121 (1), 297–317.
Rouse, Cecilia Elena and Alan B Krueger, “Putting computerized instruction to the
test: a randomized evaluation of a scientifically based reading program,” Economics of
Education Review, 2004, 23 (4), 323–338.
Scott-Clayton, Judith, Peter M Crosta, and Clive R Belfield, “Improving the Tar-
geting of Treatment Evidence From College Remediation,” Educational Evaluation and
Policy Analysis, 2014, 36 (3), 371–393.
Taylor, Eric, “New Technology and Teacher Productivity,” Technical Report 2015.
Tyler, John H, “If You Build It Will They Come? Teachers’ Online Use of Student
Performance Data.,” Education Finance and Policy, 2013, 8 (2), 168–207.
22

Vigdor, Jacob L, Helen F Ladd, and Erika Martinez, “Scaling The Digital Divide:
Home Computer Technology And Student Achievement,” Economic Inquiry, 2014, 52 (3),
1103–1119.
Weinberg, Bruce A, “An Incentive Model of the Effect of Parental Income on Children,”
Journal of Political Economy, 2001, 109 (2), 266–280.
York, Benjamin N and Susanna Loeb, “One step at a time: the effects of an early
literacy text messaging program for parents of preschoolers,” Technical Report, National
Bureau of Economic Research 2014.
23

Figure 1: Parent Portal: Main Screen
The figure shows an example of the type of academic information that can be found on parent portal. All information on thisfigure is fictional.
Figure 2: Parent Portal: Specific Class Information
The figure shows an example of the type of academic information that can be found on parent portal once a parent clicks on aspecific class. All information on this figure is fictional.
24

Figure 3: Parent Portal Usage During the 2013-2014 School Year, Conditional on Using at Least Once
0.0
5.1
.15
Fra
ctio
n
0 50 100 150 200 250Total Usage 2013−2014
The figure shows the distribution of portal logins during the 2013-2014 school year conditional on logging in at least once. Thisfigure is constructed using data from the Learning Management System and trims the top-most percentile from the data.
25

Figure 4: Student Portal Usage During the 2013-2014 School Year, Conditional on Using at Least Once
0.0
2.0
4.0
6Fr
actio
n
0 100 200 300 400Total Usage 2013-2014
The figure shows the distribution of portal logins during the 2013-2014 school year conditional on logging in at least once. Thisfigure is constructed using data from the Learning Management System and trims the top-most percentile from the data.
26

Figure 5: Portal Adoption During the 2012-2013 School Year
The figure shows the share of families who have ever logged into a portal during the 2012-2013 school year. This figure isconstructed using data from the Learning Management System.
27

Figure 6: Share Ever Logged In by Share Free/Reduced Price Lunch
0.2
.4.6
.81
Shar
e Ev
er L
ogge
d In
0 .2 .4 .6 .8 1Share of Students Receiving Free/Reduced Price Lunch by School
The figure shows the share of families who have ever logged into a portal plotted against the share of students who receivefree/reduced price lunch in each school. This figure is constructed using data from the Learning Management System and NCESCommon Core data.
28

Figure 7: Share of Families who Ever Logged in by GreatSchools Rating
0.2
.4.6
.8Sh
are
Ever
Log
ged
In
1 2 3 4 5 6 7 8 9 10GreatSchools Rating
The figure shows the share of parents who have ever logged into a portal for each GreatSchools Rating of schools. This figure isconstructed using data from the Learning Management System and GreatSchools ratings.
29

Figure 8: Correlation between Parent Logins and Student Grades
22.
252.
52.
753
GPA
0 25 50 75 100 125 150 175 200Total Logins
This figure shows the grade-point averages associated with different levels of portal usage relative. This figure is constructed usingdata from the Learning Management System.
30

Figure 9: Experimental Design
This figure shows the experimental design for the account-information intervention. Randomization occurs first at the school leveland then at the student level.
31

Figure 10: Usage: Treatment v. Control
-2-1
01
23
45
Effe
ct o
n Lo
gins
Per
Mon
th
2013
m8
2013
m9
2013
m10
2013
m11
2013
m12
2014
m1
2014
m2
2014
m3
2014
m4
2014
m5
Month
This figure shows the treatment effect on the number of times families logged in per month over the course of the school year. Thevertical red line indicates when the treatment began. The effects are marginal effects at mean usage from the negative-binomialregression described in the text with usage for each month as the outcome. 95% confidence intervals shown. Data come from theLMS company.
32
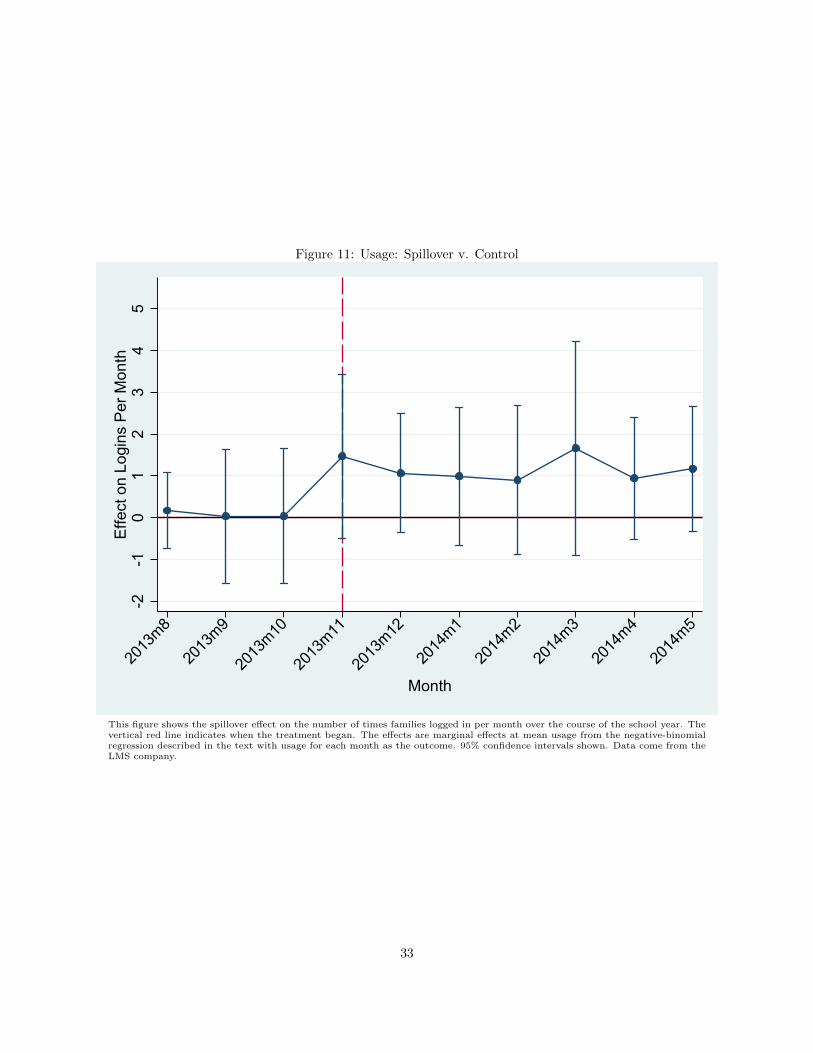
Figure 11: Usage: Spillover v. Control
-2-1
01
23
45
Effe
ct o
n Lo
gins
Per
Mon
th
2013
m8
2013
m9
2013
m10
2013
m11
2013
m12
2014
m1
2014
m2
2014
m3
2014
m4
2014
m5
Month
This figure shows the spillover effect on the number of times families logged in per month over the course of the school year. Thevertical red line indicates when the treatment began. The effects are marginal effects at mean usage from the negative-binomialregression described in the text with usage for each month as the outcome. 95% confidence intervals shown. Data come from theLMS company.
33

Table 1: District Summary Statistics
Variable Mean Observations
Districts N/A 15Schools N/A 264Students N/A 149,107Female 49% 149,107
Share Hispanic 5.2% 244Share Black 16.2% 244Share White 77.5% 244Share Free/Reduced Lunch 54.5% 244
Urban 21.5% 244Suburb 20.7% 244Town 15.1% 244Rural 42.6% 244
This table describes school characteristics for the descriptive study.The upper four rows use data from the Learning Management Sys-tem. The remaining rows use data from the NCES Common CoreData set.
Table 2: Parent-Portal Usage Information: 2013-2014
Variable Mean Observations
Parent Logins
Share ever logged in 25% 149,107Share who log in ≥1 per week 8% 6,956,448Average Total logins 13 149,107
Student Logins
Share ever logged in 49% 149,107Share who log in ≥1 per week 22% 6,956,448Average Total logins 48 149,107
Share any family ever logged in 57% 149,107
This table describes school characteristics for the descriptive study.These numbers are constructed using data from the Learning Man-agement System.
34

Table 3: School-Level Correlates of Adoption
Dependent variable Ever Logged In
Black -0.24*** Hispanic -0.04(0.09) (0.18)
Middle School 0.26*** High School -0.11**(0.04) (0.04)
Share Free/Reduced Lunch 0.22 Suburban 0.03(0.17) (0.04)
Urban -0.05 GreatSchools Rating 0.020**(0.05) (0.01)
Rural 0.01 Title I -0.08*(0.04) (0.05)
Student/Teacher -0.01*** Logins/Teacher (thousands) 0.01***(0.00) (0.00)
Observations 264 schools 145,139 studentsR-squared 0.69
This table presents results from a student-weighted regression of the school-level share of families who haveever logged into the portal on school-level demographic and performance indicators. Student/teacher ratiosare coded as missing if larger than 100. Teacher logins are coded as missing if larger than the 99th percentileof all logins. Log-in data are from the learning-management system on 264 schools representing 145,139students linked to school-level data from the NCES Common Core Data. Missing values are imputed andindicators for missing data are included in the regression. Robust standard errors in parentheses.
*** p<0.01, ** p<0.05, * p<0.1
35

Table 4: Balance Table
Treatment Mean Control Mean T−C P-value N Obs.
Treatment v. Control
GPA 2.43 2.48 -0.05 0.50 59 15,192Fraction Missing 0.08 0.07 0.01 0.65 59 16,174Parent Logins 0.60 0.74 -0.14 0.16 59 16,367Student Logins 23.3 20.6 2.68 0.24 59 16,367
Spillover v. Control
GPA 2.44 2.48 -0.04 0.53 59 15,680Fraction Missing 0.08 0.07 0.01 0.64 59 16,639Parent Logins 0.66 0.74 -0.08 0.43 59 16,827Student Logins 22.7 20.6 2.71 0.21 59 16,827
School Level
White 0.63 0.64 -0.01 0.64 58 N/ABlack 0.30 0.31 0.02 0.53 58 N/AHispanic 0.02 0.03 -0.01 0.64 58 N/AFraction FRL 0.60 0.61 -0.01 0.90 58 N/ARating 4.5 5.0 -0.49 0.34 54 N/A
All data are at the student level and are constructed from the learning management company data, with theexception of variables under the ”School Level” heading, which are from the NCES Common Core Data andare school-level aggregate variables. Standard errors clustered at the school level are shown in parentheses.
*** p<0.01, ** p<0.05, * p<0.1
Table 5: Effects on Usage
Dependent variable Total Logins Total Logins Ever Logged In Ever Logged In
Treated school 12.07** 10.58** 0.07* 0.04**(6.12) (4.89) (0.04) (0.02)
Spillover differential -0.78 -1.01* -0.04*** -0.03**(0.54) (0.59) (0.01) (0.01 )
Control mean 45.47 0.68
Observations 21,854 21,854 21,854 21,854
Additional Controls No Yes No Yes
All data are at the student level and are constructed from the learning management company data.Total logins represents the total number of logins into the student or parent portal. Ever loggedin is an indicator for whether there was any login to either the student or parent portal after theintervention. The Spillover differential variable show the difference in effect between the treatmentgroup and the spillover group. The first two columns are marginal effects from a negative-binomialregression. Columns three and four are marginal effects from a linear-probability model. Additionalcontrols described in the text. Marginal effects reported at baseline-mean usage. Standard errorsclustered at the school level are shown in parentheses.
*** p<0.01, ** p<0.05, * p<0.1
36

Table 6: Effects on Student GPA
Dependent variable GPA Z-Score
Treatment 0.11 0.10**(0.09) (0.05)
Spillover differential -0.06 -0.01(0.02) (0.02)
Observations 19,218 19,218
Additional Controls No Yes
All data are at the student level and are con-structed from the learning management com-pany data. GPA standardized according tocontrol-group means. The Spillover differentialvariable show the difference in effect betweenthe treatment group and the spillover group.Additional controls variables described in thetext. Standard errors clustered at the schoollevel are shown in parentheses.
*** p<0.01, ** p<0.05, * p<0.1
37
Appendix
Table A.1: Attrition
Dependent Variable Has Final Grade
Treatschool 0.02(0.020)
Spillover 0.00(0.01)
Control mean 0.88
Observations 21,854
All data are at the student level and are constructed from the learningmanagement company data. The outcome variable is an indicator for astudent having a final grade in the system. Standard errors clustered atthe school level are shown in parentheses.
*** p<0.01, ** p<0.05, * p<0.1
38

Table A.2: Subgroup Effects on Student GPA
Dependent variable Grade Point Average
Treatschool 0.126 0.107** 0.135* -0.015 0.171 0.107** 0.072 -0.129*(0.116) (0.045) (0.068) (0.141) (0.121) (0.046) (0.046) (0.065)
Treatschool×Base GPA -0.010(0.043)
Treatschoo×Female -0.013(0.022)
Treatschool×Share Black -0.113(0.114)
Treatschoo×Share Reduced-Price Lunch 0.214(0.218)
Treatschool×GS Rating -0.013(0.024)
Treatschool×Base Usage -0.008*(0.004)
Treatschool×Student Base Usage 0.001**(0.000)
Treatschool×Teacher Base Usage 0.001***(0.000)
Observations 19,218 19,218 19,218 19,218 19,218 19,218 19,218 19,218
Controls Yes Yes Yes Yes Yes Yes Yes YesOutliers Excluded No No No No No No No No
All data are at the student level and are constructed from the learning management company data. Standard errors clustered at theschool level are shown in parentheses.
*** p<0.01, ** p<0.05, * p<0.1
39
Related Documents