Citation: Martí, J.; Mazzanti, F.; Astrakharchik, G.E.; Batet, L.; Portos-Amill, L.; Pedre no, B. Nucleation of Helium in Liquid Lithium at 843 K and High Pressures. Materials 2022, 15, 2866. https://doi.org/10.3390/ma15082866 Academic Editor: Edgar Dutra Zanotto Received: 10 March 2022 Accepted: 12 April 2022 Published: 13 April 2022 Publisher’s Note: MDPI stays neutral with regard to jurisdictional claims in published maps and institutional affil- iations. Copyright: © 2022 by the authors. Licensee MDPI, Basel, Switzerland. This article is an open access article distributed under the terms and conditions of the Creative Commons Attribution (CC BY) license (https:// creativecommons.org/licenses/by/ 4.0/). materials Article Nucleation of Helium in Liquid Lithium at 843 K and High Pressures Jordi Martí 1, * , Ferran Mazzanti 1 , Grigori E. Astrakharchik 1 , Lluís Batet 1 , Laura Portos-Amill 2 and Borja Pedreño 2 1 Department of Physics, Polytechnic University of Catalonia-Barcelona Tech, 08034 Barcelona, Spain; [email protected] (F.M.); [email protected] (G.E.A.); [email protected] (L.B.) 2 Barcelona School of Telecommunications Engineering, Polytechnic University of Catalonia-Barcelona Tech, 08034 Barcelona, Spain; [email protected] (L.P.-A.); [email protected] (B.P.) * Correspondence: [email protected] Abstract: Fusion energy stands out as a promising alternative for a future decarbonised energy system. In order to be sustainable, future fusion nuclear reactors will have to produce their own tritium. In the so-called breeding blanket of a reactor, the neutron bombardment of lithium will produce the desired tritium, but also helium, which can trigger nucleation mechanisms owing to the very low solubility of helium in liquid metals. An understanding of the underlying microscopic processes is important for improving the efficiency, sustainability and reliability of the fusion energy conversion process. The spontaneous creation of helium droplets or bubbles in the liquid metal used as breeding material in some designs may be a serious issue for the performance of the breeding blankets. This phenomenon has yet to be fully studied and understood. This work aims to provide some insight on the behaviour of lithium and helium mixtures at experimentally corresponding operating conditions (843 K and pressures between 10 8 and 10 10 Pa). We report a microscopic study of the thermodynamic, structural and dynamical properties of lithium–helium mixtures, as a first step to the simulation of the environment in a nuclear fusion power plant. We introduce a new microscopic model devised to describe the formation of helium droplets in the thermodynamic range considered. Our model predicts the formation of helium droplets at pressures around 10 9 Pa, with radii between 1 and 2 Å. The diffusion coefficient of lithium (2 Å 2 /ps) is in excellent agreement with reference experimental data, whereas the diffusion coefficient of helium is in the range of 1 Å 2 /ps and tends to decrease as pressure increases. Keywords: nucleation; breeding blankets; fusion reactors; helium–lithium mixtures 1. Introduction Within the framework of future energy supply, with the constraints posed by the need of electrification of the final energy demand, and the quest for more sustainable power generation methods in order to achieve a decarbonised electricity system; nuclear fusion energy stands out as a promising alternative. The fusion reaction that results in being the most convenient in the present state of technological development is: D + T → 4 He + n + 17.6 MeV, (1) where ’D’ stands for deuterium, ’T’ for tritium and ’n’ for a free neutron and where helium is a by-product [1]. Deuterium is abundant in water, but tritium (t 1/2 = 12.3 year) must be artificially created. Therefore, in order for fusion energy to be sustainable, it is necessary that tritium be produced in the reactor itself. Tritium will be generated by means of the reactions of neutrons escaping from the plasma with lithium in the so-called breeding blankets (see, for instance, [2] for an overview of these relevant components in DEMO, a demonstration power plant contemplated in the European Roadmap to Fusion). Breeding blankets (BB) will Materials 2022, 15, 2866. https://doi.org/10.3390/ma15082866 https://www.mdpi.com/journal/materials

Welcome message from author
This document is posted to help you gain knowledge. Please leave a comment to let me know what you think about it! Share it to your friends and learn new things together.
Transcript

�����������������
Citation: Martí, J.; Mazzanti, F.;
Astrakharchik, G.E.; Batet, L.;
Portos-Amill, L.; Pedre no, B.
Nucleation of Helium in Liquid
Lithium at 843 K and High Pressures.
Materials 2022, 15, 2866.
https://doi.org/10.3390/ma15082866
Academic Editor: Edgar Dutra
Zanotto
Received: 10 March 2022
Accepted: 12 April 2022
Published: 13 April 2022
Publisher’s Note: MDPI stays neutral
with regard to jurisdictional claims in
published maps and institutional affil-
iations.
Copyright: © 2022 by the authors.
Licensee MDPI, Basel, Switzerland.
This article is an open access article
distributed under the terms and
conditions of the Creative Commons
Attribution (CC BY) license (https://
creativecommons.org/licenses/by/
4.0/).
materials
Article
Nucleation of Helium in Liquid Lithium at 843 K andHigh PressuresJordi Martí 1,* , Ferran Mazzanti 1, Grigori E. Astrakharchik 1, Lluís Batet 1 , Laura Portos-Amill 2
and Borja Pedreño 2
1 Department of Physics, Polytechnic University of Catalonia-Barcelona Tech, 08034 Barcelona, Spain;[email protected] (F.M.); [email protected] (G.E.A.); [email protected] (L.B.)
2 Barcelona School of Telecommunications Engineering, Polytechnic University of Catalonia-Barcelona Tech,08034 Barcelona, Spain; [email protected] (L.P.-A.); [email protected] (B.P.)
* Correspondence: [email protected]
Abstract: Fusion energy stands out as a promising alternative for a future decarbonised energysystem. In order to be sustainable, future fusion nuclear reactors will have to produce their owntritium. In the so-called breeding blanket of a reactor, the neutron bombardment of lithium willproduce the desired tritium, but also helium, which can trigger nucleation mechanisms owing tothe very low solubility of helium in liquid metals. An understanding of the underlying microscopicprocesses is important for improving the efficiency, sustainability and reliability of the fusion energyconversion process. The spontaneous creation of helium droplets or bubbles in the liquid metal usedas breeding material in some designs may be a serious issue for the performance of the breedingblankets. This phenomenon has yet to be fully studied and understood. This work aims to providesome insight on the behaviour of lithium and helium mixtures at experimentally correspondingoperating conditions (843 K and pressures between 108 and 1010 Pa). We report a microscopic studyof the thermodynamic, structural and dynamical properties of lithium–helium mixtures, as a firststep to the simulation of the environment in a nuclear fusion power plant. We introduce a newmicroscopic model devised to describe the formation of helium droplets in the thermodynamic rangeconsidered. Our model predicts the formation of helium droplets at pressures around 109 Pa, withradii between 1 and 2 Å. The diffusion coefficient of lithium (2 Å2/ps) is in excellent agreement withreference experimental data, whereas the diffusion coefficient of helium is in the range of 1 Å2/psand tends to decrease as pressure increases.
Keywords: nucleation; breeding blankets; fusion reactors; helium–lithium mixtures
1. Introduction
Within the framework of future energy supply, with the constraints posed by the needof electrification of the final energy demand, and the quest for more sustainable powergeneration methods in order to achieve a decarbonised electricity system; nuclear fusionenergy stands out as a promising alternative. The fusion reaction that results in being themost convenient in the present state of technological development is:
D + T→ 4He + n + 17.6 MeV, (1)
where ’D’ stands for deuterium, ’T’ for tritium and ’n’ for a free neutron and where heliumis a by-product [1]. Deuterium is abundant in water, but tritium (t1/2 = 12.3 year) must beartificially created. Therefore, in order for fusion energy to be sustainable, it is necessary thattritium be produced in the reactor itself. Tritium will be generated by means of the reactionsof neutrons escaping from the plasma with lithium in the so-called breeding blankets (see,for instance, [2] for an overview of these relevant components in DEMO, a demonstrationpower plant contemplated in the European Roadmap to Fusion). Breeding blankets (BB) will
Materials 2022, 15, 2866. https://doi.org/10.3390/ma15082866 https://www.mdpi.com/journal/materials

Materials 2022, 15, 2866 2 of 18
perform two additional functions besides producing tritium: extraction of fusion heat andshielding the magnets (superconducting coils) from the radiation escaping the plasma.
Lithium has two natural isotopes 6Li (abundance 7.5%) and 7Li (92.5%), both produc-ing tritium when capturing a neutron [3]:
n + 6Li→ T + 4He + 4.78 MeV (2)
n + 7Li→ T + 4He + n− 2.47 MeV (3)
Tritium self-sufficiency will require a certain neutron multiplication in order to closethe fuel cycle with a net gain so that the so-called tritium breeding ratio is greater than 1. Inorder to fulfil their functions, some BB designs feature solid (ceramic) breeders cooled byhelium, while others rely on a liquid metal (LM) cooled by helium or water. The LM BBdesigns are considering the use of lithium–lead eutectic (LLE) [2,4,5]. Besides 7Li, lead willprovide some fast neutron multiplication (neutrons hit the walls of the reaction chamberwith energies bigger than 14 MeV). As shown in Equations (2) and (3), He is producedmol-to-mol along with T. However, He is practically insoluble in the liquid metal (Henry’sconstant for helium in Li at 843 K would be around 7×10⁻¹⁴ Pa−1 atomic fraction; forLLE, it is estimated to be lower [6]). Tritium self-sufficiency requirement is thus linked toa possible super-saturation of helium in the liquid metal and, consequently, to a possiblenucleation of helium in the form of bubbles. This phenomenon may have a great impact inthe performance of the BB: changes in the magnetohydrodynamic flow, affectation of theheat transfer, and changes in the tritium migration mechanisms. Other systems that couldbe affected by helium nucleation are, for instance, free-surface Li first wall concepts [7,8]and the Li jet targets in the future International Fusion Materials Irradiation Facility [9].
In the quest for tools to model the effect of the undesired helium bubbles being formedin the blanket walls of a nuclear fusion plant, helium nucleation models must be developed.Thus far, no experiments exist allowing for validating such models. The low solubility ofHe in LM makes computer simulations extremely expensive when trying to capture theonset of nucleation at the design operational pressures and temperatures of BB. Indeed, arough estimation based on the Gibbs’ Classical Nucleation Theory [10,11] (CNT) can bedone using parameters from Ref. [12]. In order to have a stable bubble, a critical sizemust be achieved when the internal energy of the bubble is able to overcome the energyneeded to create the surface around it. The smaller is the critical size, the higher is thesupersaturation level needed to achieve it.
To highlight this point, we report in Figure 1 a graphical representation of the work offormation (Gibbs free energy) of a cluster of radius rc (see [12]):
∆Gtot = ∆Gsur f . + ∆Gvol. = 4π r2c σ +
43
π r3c ∆gvol., (4)
where σ is the surface tension and ∆gvol. is the driving force for nucleation per unit volumeof the new phase i.e., the Gibbs free energy difference between the cluster and the dissolvedstates of one He atom per unit volume. According to CNT, it can be expressed as [13,14]:
∆gvol. =−kBT
v0ln ψ, (5)
where kB is the Boltzmann constant, T is the liquid metal bulk temperature, v0 is the volumeof one He atom in the cluster and ψ is the supersaturation ratio, relating the actual Heconcentration to the saturation concentration.
Given a fixed concentration of helium in the solvent, when the solubility increases (i.e.,ψ decreases), the critical bubble size (i.e., the radius at which the total Gibbs free energy ismaximum) is larger (in the example of Figure 1 ψ equals 2 for a critical size of 110 atomsof helium). If the solubility is lower, the critical bubble size is smaller (in the example ofFigure 1 ψ equals 6 for a critical size of 42 atoms of helium). Thus, in order to have a stablebubble, a critical size must be achieved when the internal energy in the bubble is able to

Materials 2022, 15, 2866 3 of 18
overcome the energy needed to create the surface around it. The smaller the critical size(around 40 atoms in the example above), the higher the supersaturation level needed toachieve it. Consequently, a simulation involving 40 atoms of helium at 843 K and 1 barwould require almost 109 atoms of lithium to be in those conditions. However, at 100 GPaonly, around 1000 atoms of lithium would be needed.
0 1 2 3 4 5 6 7 8 9 10 11 12 13 14Radius of cluster (Å
-1 × 10-18
-2 × 10-18
-3 × 10-18
0
1 × 10-18
2 × 10-18
3 × 10-18
4 × 10-18
5 × 10-18
Free
ene
rgy
(J)
SurfaceVolume Ψ = 6Total Ψ = 6Volume Ψ = 2Total Ψ = 2
)
Figure 1. Free energy of a He cluster forming in lithium at 843 K assuming a surface tensionof 0.34 N/m [15]. Using a volume of 17 Å3 for helium [12], the critical size is 42 atoms whensupersaturation ratio ψ = 6 and 110 atoms when ψ = 2, where ψ is defined as the ratio between theactual helium concentration and the saturated concentration.
The complexity of the chemistry of the LLE system, with bred tritium and helium,including possible interactions between all types of atoms and the possibility of the for-mation of molecules (LiT when the eutectic composition is not well adjusted and Li2 andT2 in the gas phase), makes it unaffordable to try to model the interactions between allpossible species at once, when the nucleation mechanism in this case has not been fullycaptured by models yet. For these reasons, the present work focuses on the simulationof He-Li mixtures at high pressures as a first step towards the simulation of the Li-Pb-Hemixtures at low pressure. Our main goal is to capture the onset of the nucleation at aqualitative level, in order to advance towards the full modelling of the phenomenon. Wedescribe a mixture of helium and lithium atoms in the bulk, developing a microscopicmodel that is able to reproduce the helium–lithium mixture instability towards nucleationof helium droplets. We thus acquire valuable structural and dynamical data from classicalsimulations, showing remarkable good agreement with radial distribution functions oflithium as well as with its self-diffusion coefficient, compared to data from experimentaland computational sources. Full verification of the model is limited by the current lack ofavailable data on Li-He mixtures at high temperatures and pressures.
In particular, Li-Li, He-He and He-Li pair interactions are fed as an input to both classi-cal Monte Carlo (MC) and molecular dynamics (MD) simulations. We find thermodynamic,structural and dynamic properties of lithium and helium mixtures at high temperaturesand in a wide range of pressures between 0.1 and 10 GPa. Both MC and MD computationaltechniques have been previously proven to provide reliable predictions for a wide varietyof classical and quantum atomic and molecular systems, ranging from pure quantum

Materials 2022, 15, 2866 4 of 18
systems including hydrogen and helium [16–19] to classical molecular liquids such aswater, in solution [20–22] and at interfaces [23,24], and to highly complex biosystems suchas proteins or membranes [25,26]. MC and MD can be the source of mixed methods such astransition path sampling [27,28], which is able to describe the free energy hypersurface of agiven statistical process without the previous knowledge of the reaction coordinates. Wecalculate and report thermodynamic properties such as the average internal energy as afunction of pressure. To quantify the spatial and dynamical structure, we calculate atomicpair distribution functions, structure factors, mean squared displacements and velocityautocorrelation functions in order to obtain atomic spectra. We also can obtain the diffusioncoefficients of lithium and helium at different pressures as well as the spectral densities ofHe and Li, reporting information on their main translation and vibration modes.
2. Methods2.1. Microscopic Model
We base our simulations on a microscopic model Hamiltonian describing a mixtureof NLi lithium and NHe helium atoms, which are taken to be point-like particles of massmLi and mHe, respectively. In order to reproduce the experimental conditions, we onlyconsider situations where NLi � NHe. Each species is characterised by particle coordinatesand velocities {rLi,i, vLi,i} and {rHe,j, vHe,j}, with i and j spanning the ranges 1, . . . , NLi and1, . . . , NHe, respectively. The Hamiltonian of the system is then written as
H =12
NLi
∑i=1
mLiv2Li,i +
12
NHe
∑i=1
mHev2He,i (6)
+NLi
∑i<j
VLi−Li(|rLi,i − rLi,j|) +NHe
∑i<j
VHe−He(|rHe,i − rHe,j|) +NLi
∑i=1
NHe
∑j=1
VLi−He(|rLi,i − rHe,j|) ,
where the first two terms describe the kinetic energy, while the last three terms accountfor the intra- and inter-species interaction, respectively. Periodic boundary conditions areapplied in order to minimise the finite-size effects and approximate better the properties ofa large system. The typical simulation cage is a square box of length around 29 Å for thereference pressure of 1 GPa. At lower pressure setups, box lengths are larger than 40 Å.
A crucial point of our model is an appropriate choice of the pair interaction potentials.For lithium–lithium interactions (Equation (7)), we rely on the model proposed by Canaleset al. in Ref. [29,30], whereas the remaining interactions are a novelty of the present work.The Li-Li pair potential V(r) is modelled as [29,30]
VLi−Li(r) = Ar−12 + B exp Cr · cos D(r− E), (7)
where r is the distance between the two atoms in Angströms and the potential coefficientsare A = 2.22125 × 10⁷ K Å 12, B = 41828.9 K, C = −1.20145 Å−1, D = 1.84959 Å−1,E = 5.03762 Å. This potential is shown in Figure 2, featuring strong short-distancerepulsion caused by Pauli exclusion due to overlapping electron orbitals, a highly non-monotonic behaviour at the distances around the van der Waals radii and an attractivelong-range tail. In particular, the characteristic length of the potential corresponds to thesmallest distance at which the interaction changes sign, VLi−Li(σLi−Li) = 0, and is equalto σLi−Li = 2.5668 Å. The characteristic energy scale is defined by the depth of the firstminimum, equal to εLi−Li ≡ VLi−Li(3.06) = −887.9 K.
The helium–helium interaction is considered to be of the Lennard–Jones (LJ) type, andit is parameterised to accurately describe the system at the temperatures and pressuresof interest which are well beyond ambient conditions. From preliminary simulations, wehave found that the Aziz II potential model [31], which is known to provide an excellentdescription of superfluid liquid helium at temperatures close to absolute zero and moderatepressures around saturation density, does not apply quite well at temperatures as high as843 K and pressures in the GPa regime considered in the present study when combined

Materials 2022, 15, 2866 5 of 18
with the Li-Li model given above (Equation (7)). Instead, we retain the same widthσHe−He = 2.556 Å but treat the potential depth εHe−He as a free adjustable parameter. Inthis work, we have found that, in order to be able to reproduce the nucleation process, thedepth must be increased to the typical values of the Li-Li potential (Equation (7)). In orderto test the influence of this interaction parameter, we considered two different values ofthe potential depth, εHe−He = −1200 K and εHe−He = −800 K, henceforth referred to as“model 1” and “model 2”, respectively.
Finally, the helium–lithium interaction is modelled by a truncated Lennard–Jonespotential at short distances, namely a “hard" wall where we have basically eliminatedthe attractive part, with characteristic parameters given by the Lorentz–Berthelot rulesobtained from the corresponding Li-Li and He-He values, and a cutoff beyond that point.This results in σLi−He = 2.5615 Å and εLi−He = −1032.2 K. The potential model is givenby:
VLi−He(r) = 4εLi−He
[(σ
r
)12−(σ
r
)6]
, r ≤ σLi−He (8)
= 0, r > σLi−He
The four considered pairwise interactions are shown in Figure 2. In a very recentwork [32], it has been reported that specific interatomic potentials based on Daw–Baskesand Finnis–Sinclair formalisms are able to describe the formation of helium bubbles in apalladium tritide lattice at temperatures of the order of 400 K and pressures in the rangeof 0.1 to 2.2 GPa. Furthermore, the formation of helium bubbles in tungsten was alsoreproduced using purely repulsive He-W interaction potentials in cluster simulations [33],models rather close to the ones presented in this work.
2 3 4 5 6 7 8r (Å
-1200
-1000
-800
-600
-400
-200
0
200
V(r
) (K
)
2.525 2.55 2.575 2.6 2.625-100
0
100
)
Figure 2. Microscopic two-body interaction potentials employed in this work. Main figure: overallview of the interaction potentials V(r). Li-Li (black line); He-He model 1 (dot-dashed blue line);He-He model 2 (dashed green line); Li-He model 1 (red circles) and Li-He model 2 (dotted orangelines). The inset represents a zoom of the “hard-wall” area at short distances.
2.2. Monte Carlo and Molecular Dynamics Methods
We rely on MC and MD methods to perform a series of computer simulations of thesystem. Both methods use the microscopic model introduced in the previous section todescribe the interactions between the atoms as an input.

Materials 2022, 15, 2866 6 of 18
The Monte Carlo method has been used to obtain the equilibrium properties at fixedpressure P, particle number N and temperature T. Calculations are performed startingfrom the microscopic Hamiltonian of Equation (6), using it to define the probability of astate with energy E according to the Maxwell–Boltzmann distribution, p = exp(−E/kBT),which is sampled using the standard Metropolis algorithm. Once the system has beenequilibrated, we perform simulations to estimate quantities of interest such as the energyper particle and the volume, as well as correlation functions such as the pair distributionfunction and the low-momentum static structure factor. An advantage of the MC methodis that it only uses the particle positions, in contrast to MD where their velocities have alsoto be sampled. This halves the number of microscopic variables to estimate, thus reducingthe phase space and making the exploration more efficient. This, however, comes at a price:since Monte Carlo can only sample equilibrium configurations, it is not able to provideinformation about the time-dependent properties, in contrast to MD where the simulationpropagates in real time.
In molecular dynamics, the force fields are also obtained from the model in Equation (6)and the corresponding Newton’s equations of motion, which are integrated numericallyusing a standard leap-frog Verlet procedure [34]. In each simulation, we fix the number ofparticles N and the pressure P, while the volume is adjusted accordingly. In addition tothe energetic and structural properties obtained also in MC, MD provides access to time-dependent quantities such as the diffusion coefficient, velocity autocorrelation functionsand spectral densities. As a stringent test of self-consistency, strict agreement between thecommon quantities sampled in MC and MD has to be obtained, which requires the properthermalization and averaging in both methods.
3. Results and Discussion
In all cases, a homogeneous mixture of helium and lithium has been considered asthe starting point of the simulations. The concentration of helium has been set to ∼0.04for a total of 40 helium atoms dissolved in a sea of 960 lithium atoms. The main results forthe thermodynamic quantities of interest obtained in both MC and MD are summarisedin Table 1. Additional simulations at intermediate pressures (0.3 and 0.4 GPa for instance)have also been considered in several other sections of the manuscript.
As a starting point of our analysis, we have obtained the average internal energies andpressures, as reported in Table 1. In the MC simulations, the system was initially allowed toequilibrate for a total of 107 MC random movements. The statistics was collected over thesubsequent 108 random steps. In the case of MD, we employed a total time of about 50 ps forthe equilibration of each system and later on we collected MD trajectories 200 ps long in allcases to compute meaningful physical properties. In both MC and MD, the statistical errorswere less than 1% in all reported quantities. The state of lowest internal energy is found at thepressure of 1 GPa. As an additional test, and in order to explore the influence of the heliumconcentration on the total energy of the system, we report energies as a function of the relativehelium concentrations in Figure 3. We define the relative helium concentration p as
p =nLi − nHe
nLi + nHe(9)
and observe a monotonic behaviour at the lowest pressure (0.1 GPa), while it becomesnon-monotonic for the second pressure (0.3 GPa). This might be an indication of a differentqualitative phase coexistence for the two selected pressures. We report further informationabout this aspect in the following sections.

Materials 2022, 15, 2866 7 of 18
Table 1. Average internal energies (U), pressures (P) and temperatures (T) for the simulated setups. AllMC simulations considered 108 sampling moves and all MD simulations were of total length 200 ps.
Method U(K) P (GPa) T(K)
71.1 0.104 843−187.0 0.122 843−430.3 0.146 843−553.3 0.178 843
MC −700.0 0.208 843−1183.7 0.500 843−1398.6 1.005 843−1197.6 5.002 843−261.9 9.994 843
150.8 0.105 842.3−214.2 0.128 842.1−380.4 0.152 842.1−507.6 0.177 842.1
MD −720.8 0.202 841.9−1182.3 0.501 841.7−1405.2 0.999 841.6−1199.1 4.999 841.0−262.8 9.998 840.3
0.86 0.88 0.9 0.92 0.94 0.96 0.98 1p
-1000
-800
-600
-400
-200
0
200
U (K
)
0.1 GPa0.3 GPa
Figure 3. Total internal energies U as a function of concentration p for two characteristic pressures(0.1–0.3 GPa).
It has been reported in Ref. [35] that the solubility of helium in lithium is∼5×10⁻⁷ mol/(L ·bar) at the pressure of 2.38 bar for temperatures in the range of 922–1144 K,which is in agreement with Henry’s law. At the same time, one should keep in mind thatHenry’s law is based on the assumption that the system behaves as an ideal gas and describesthe overall incompressibility of liquid metals. Such a low solubility value means that, whenapplied to the typical conditions of our simulations (pressure of 1 GPa inside a volume of24.26 nm3, see Figure 4), only around 0.06 helium atoms would be able to dissolve.

Materials 2022, 15, 2866 8 of 18
This explains why simulations performed at 843 K and high pressures (helium inversedensities are within the cubic nanometer range) are able to capture the phenomenon ofhelium nucleation, where helium cannot dissolve. Conversely, at lower pressures, heliumis able to dissolve in lithium. Furthermore, at the very high densities and pressures insidethe projected nuclear fusion facilities, Henry’s law is rather unlikely to apply due to largedeviations from the ideal gas behaviour. Figure 3 reports dependence of the specific volume(defined as the inverse of the density n−1) on the pressure. One can see that the pressurerapidly increases as the specific volume is diminished, and that a plateau is reached oncethe mean interparticle distance n−1/3 becomes comparable to the hard-core size σ. At thatpoint, the pressure can increase without a significant change in the density resulting in avanishing compressibility
κ = − 1V
∂V∂P
= − 1n−1
∂n−1
∂P→ 0, P→ ∞ . (10)
On the other hand, the observed asymptotic incompressibility of lithium is in overallagreement with Henry’s law.
0 2 4 6 8 10P (GPa)
0
0.02
0.04
0.06
0.08
n-1(n
m3 )
σ3
-
Figure 4. Specific volume n−1 as a function of the pressure in a wide range of pressures P (0.1–10 GPa).Symbols: results of the simulation, with the error bars smaller than the symbol size. Dashed line:hard-wall volume associated with the Van der Waals radius σ of lithium and helium (both are∼2.5 Å).
3.1. Structure: Pair Distribution Function and Structure Factor
In order to quantify the spatial correlations and visualise the structure of heliumdroplets, we evaluate the pair distribution function g(r) (RDF) in the simulated mixture of960 Li and 40 He atoms at 843 K. The RDF quantifies the probability of finding two atomsof species α and β at a distance r,
gα,β(r) =1
NαNβ
Nα
∑i=1
Nβ
∑j=1
⟨δ(|r|ij − r)
⟩, (11)
where 〈· · · 〉 denotes a thermal average. Being a two-particle correlator, the RDF is capableof capturing a translationally invariant ordering and is therefore suitable to identify droplet

Materials 2022, 15, 2866 9 of 18
formation independently of its center of mass position. Typical RDF functions for Li-Li,Li-He and He-He pairs are shown in Figure 5 for different pressures. The shape of theLi-Li pair distribution functions is characteristic of a liquid at equilibrium. The Li-Li RDFsare hardly affected by the presence of a small concentration of helium atoms, as it can beseen in comparison with the behaviour of pure lithium at 1 GPa and the same temperature,taken from Ref. [30]. One might also note that a change of two orders of magnitude inthe pressure does not significantly affect the overall shape of gLi−Li(r). The short-rangeregion is voided due to the steep hard-core potential. High-amplitude oscillations appear atseparations comparable to the mean interparticle distance and witness strong correlationsin the liquid that can be interpreted as shell effects.
1 2 3 4 5 6 7 8 9 10 11r (Å
0
15
30
45
60
g He-
He(r
)
0
0.5
1
1.5
2
2.5
g Li-L
i(r)
0.1 GPa0.2 GPa0.5 GPaCanales et al. (1 GPa)1 GPa5 GPa10 GPa
0
0.5
1
1.5
2
g Li-H
e(r)
(a)
(b)
(c)
)Figure 5. Pair distribution functions in a wide range of pressures (0.1–10 GPa) quantifying (a) He-He;(b) He-Li; and (c) Li-Li correlations. Green circles, single-species Li-Li data from Ref. [30]. Lines:0.1 GPa (dotted blue); 0.2 GPa (dashed red); 0.5 GPa (dot-dashed orange); 5 GPa (dot-dot-dashedcyan); 10 GPa (dash-dash-dotted violet).

Materials 2022, 15, 2866 10 of 18
At large distances, the pair distribution function approaches a constant value, thusconfirming that lithium atoms are homogeneously filling the whole space. The situation isdrastically different in the He-He RDFs, as they vanish at large distances as seen in Figure 5c.While at low pressure, gHe−He still shows a long-range plateau; this is not the case for largepressure where the RDF strongly decreases. This implies that helium atoms bunch up closeto each other, thus forming droplets. In this way, helium atoms form a miscible mixtureon a lithium background at low pressure but have a tendency to phase separate at largepressures, splitting the system into pure lithium and helium phases. This scenario is furthersupported by the massive increase in the height of the first and subsequent shells in a Hedroplet. The droplet size can be roughly estimated as the difference between the distanceat which gHe−He(r) significantly decays (taken from the first minimum) and the position ofthe starting non-zero value of the RDF.
In order to verify the robustness of our analysis, we have compared the results obtainedwith the two different He-He potential models proposed (see Section 2) correspondingto a depth well of 800 K and 1200 K, to find only minor changes. We have observed that,when this depth is below 650 K, long-lived helium droplets are not formed and becomesignificantly unstable in short time intervals of the order of 1 ps. From here on, the reportedresults correspond to model 1, as it predicts more stable helium droplets.
A set of four characteristic snapshots of the system at pressures P = 0.1, 0.2, 1 and10 GPa is shown in Figure 6 to illustrate the tendency of the system to form helium dropletswhen the pressure is increased above approximately 0.2 GPa. At the lowest pressuresconsidered, helium is uniformly diluted in the lithium bath, showing that only smallclusters of the size of a few helium units appear. This is also seen in the He-He pairdistribution function, which is shown in Figure 7 for several values of P close to the criticaltransition pressure. We observe that larger helium droplets start to form at a crossoverpressure around 0.175 GPa, which corresponds to phase separation (helium droplets inliquid lithium), and fully stable ones appear at 0.2 GPa. A possible explanation of this effectcan be based on the behaviour of the binding (cohesive) potential energy of helium
Ubinding ≡UHe−Li −ULi
NHe(12)
where UHe−Li and ULi stand for the internal energies of the mixture and pure lithium, respec-tively, and NHe is the total number of helium atoms, fixed to 40 in this work. The obtainedresults are reported in Table 2. Here, the values of ULi have been extracted from additionalsimulations of pure lithium at 0.1, 1 and 10 GPa. We find that the cohesive potential energyis positive at low pressures where the lithium atoms prefer not to bind, while it becomesnegative at large pressures, where the formation of large lithium droplets is observed. Thus,the stability of the helium droplets is significantly enhanced at high pressures.
0.1 GPa 1 GPa0.2 GPa 10 GPa
Figure 6. Snapshots of the He-Li mixtures at characteristic pressures: 0.1 GPa, 0.2 GPa, 1 GPa, and10 GPa.
A possible effect that could be expected is the formation of aggregates of lithium andhelium due to van der Waals forces [36]. However, we have not observed that pairing inour simulations, as it can be seen from the Li-He RDF of Figure 5. This is probably due tothe short-range repulsive He-Li interactions considered, as shown in Equation 8.

Materials 2022, 15, 2866 11 of 18
Table 2. Binding energies of helium at 800 K as a function of the pressure.
Pressure (GPa) UHe−Li (K) ULi (K) Ubinding (K)
0.1 110 −58 4.21 −1402 −1413 0.27510 −262 −188 −1.85
2 4 6 8 10 12r (Å
0
10
20
30
40
50g H
e-H
e(r)
0.1 GPa0.125 GPa0.15 GPa0.175 GPa0.2 GPa
)Figure 7. He-He pair distribution functions in the vicinity of the phase-separation transition(0.1–0.2 GPa). Lines: 0.1 GPa (dotted blue); 0.125 GPa (dot-dashed green); 0.15 GPa (dot-dot-dashedorange); 0.175 GPa (black); 0.2 GPa (dashed red).
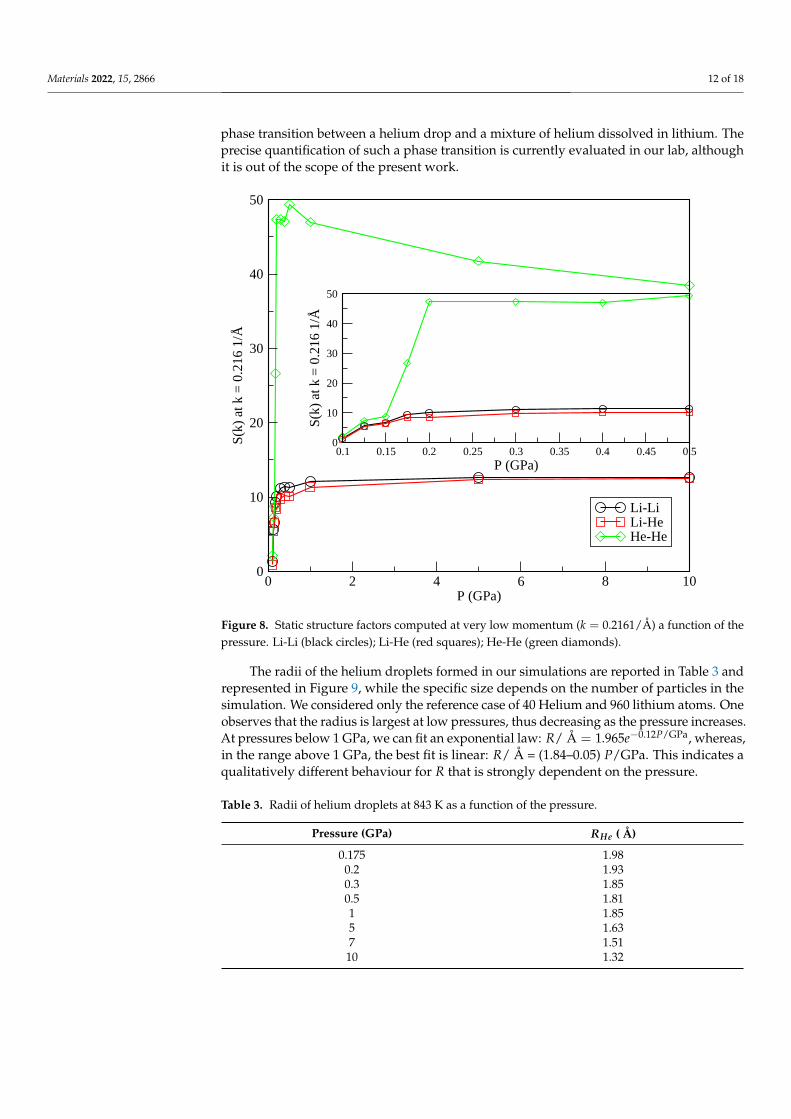
In order to further characterise the phase separation, we also report static structurefactors S(k) computed from the RDF (Equation (11)) at low momenta (k = 0.216 −1) as afunction of the pressure (see, for instance, [37]):
S(k) = 1 +4πρ0
k
∫ ∞
0dr r [g(r)− 1] sin kr, (13)
where ρ0 is the density of a pure species or the average (√
ρLiρHe) for the Li-He paircorrelation. The results are shown in Figure 8. The change in the slope of S(k) is particularlysharp in the He-He case, around the crossover pressure of 0.175 GPa, as opposed to whathappens in the Li-Li and Li-He cases. It has recently been reported [38] that the sensibilityof changes in the slope of the static structure factors may be a clear indication of a possible
Materials 2022, 15, 2866 12 of 18
phase transition between a helium drop and a mixture of helium dissolved in lithium. Theprecise quantification of such a phase transition is currently evaluated in our lab, althoughit is out of the scope of the present work.
0 2 4 6 8 10P (GPa)
0
10
20
30
40
50
S(k)
at k
= 0
.216
1/Å
Li-LiLi-HeHe-He
0.1 0.15 0.2 0.25 0.3 0.35 0.4 0.45 0.5P (GPa)
0
10
20
30
40
50
S(k)
at k
= 0
.216
1/Å
Figure 8. Static structure factors computed at very low momentum (k = 0.2161/Å) a function of thepressure. Li-Li (black circles); Li-He (red squares); He-He (green diamonds).
The radii of the helium droplets formed in our simulations are reported in Table 3 andrepresented in Figure 9, while the specific size depends on the number of particles in thesimulation. We considered only the reference case of 40 Helium and 960 lithium atoms. Oneobserves that the radius is largest at low pressures, thus decreasing as the pressure increases.At pressures below 1 GPa, we can fit an exponential law: R/ Å = 1.965e−0.12P/GPa, whereas,in the range above 1 GPa, the best fit is linear: R/ Å = (1.84–0.05) P/GPa. This indicates aqualitatively different behaviour for R that is strongly dependent on the pressure.
Table 3. Radii of helium droplets at 843 K as a function of the pressure.
Pressure (GPa) RHe ( Å)
0.175 1.980.2 1.930.3 1.850.5 1.811 1.855 1.637 1.5110 1.32

Materials 2022, 15, 2866 13 of 18
0 1 2 3 4 5 6 7 8 9 10P (GPa)
1.3
1.4
1.5
1.6
1.7
1.8
1.9
2
R (Å
)
Figure 9. Radii of helium droplets for the pressure range 0.175–10 GPa.
3.2. Dynamics: Atomic Self-Diffusion Coefficients
Another experimentally relevant quantity is the diffusion coefficient. We obtain themean square displacement (MSD) for both helium and lithium from the MD simulations.The value of the diffusion coefficient D is then computed from the slope of the steady-stateMSD curve, using Einstein’s formula
D =16
limt→∞
ddt〈|r(t)− r(0)|2〉, (14)
where r stands for the coordinate of each species. The coefficients for all simulated statesare reported in Table 4. Canales et al. [30] obtained a value for the diffusion coefficient ofpure lithium at 843 K (around 1 GPa) of 2.47 Å2/ps, whereas Jayaram et al. [39] reported0.8 Å2/ps at 500 K. We get a similar value, D = 2.0 Å2/ps at 843 K, indicating that thelithium diffusion coefficient does not change significantly from its value in the absence ofhelium. This is not surprising considering the low concentration of helium atoms in theregimes analysed. It is also worth noticing that a significantly higher experimental valueof 45 Å2/ps at 523 K, reported by Nieto et al. [40] for helium injected onto the surfaceof a stream of flowing lithium, was obtained in a system out of equilibrium, which is adifferent situation from the one analysed here. This can explain the large difference of abouttwo orders of magnitude when compared to our result, 0.833 Å2/ps at 843 K and 1 GPa(see Table 4). Experiments in similar systems might provide a more suitable reference towhich we can compare our results. Figure 10 shows the dependence of D obtained in oursimulations as a function of the pressure. As it can be seen, the dependence of D on P isapproximately linear, with a slower diffusion at pressures above 1 GPa.

Materials 2022, 15, 2866 14 of 18
Table 4. Diffusion coefficients of lithium and helium at 843 K as a function of the pressure.
Pressure (GPa) DHe ( Å2/ps) DLi ( Å2/ps)
0.1 1.850 3.5830.125 1.936 3.2170.15 1.822 3.0100.175 2.071 2.958
0.2 1.670 2.8330.3 1.350 2.6670.4 1.300 2.3330.5 1.167 2.1671 0.833 2.0065 0.583 1.4087 0.430 1.12010 0.350 1.067
0.1 1 10P (GPa)
0.1
1
10
D (
Ų
HeLi
/ ps)
Figure 10. Diffusion coefficients of lithium (blue squares) and helium (red circles) at 800 K as afunction of the pressure on a logarithmic scale. Green straight lines are a guide to the eye.
Experimental infrared spectra are usually obtained from the absorption coefficientα(ω) or the imaginary part of the frequency-dependent dielectric constant [41]. Theseproperties are directly related to the absorption lineshape I(ω), which can also be obtainedin molecular dynamics simulations [42,43]. In most cases, the physically relevant propertyto be computed is the so-called atomic spectral density Si(ω):
Si(ω) =∫ ∞
0dt 〈~vi(t)~vi(0)〉 cos(ωt), (15)
where ~vi(t) is the velocity of the i − th atom at time t, while the brackets 〈· · · 〉 denote anequilibrium ensemble average. In our case, we have obtained the spectral density of each atomic

Materials 2022, 15, 2866 15 of 18
species separately. Generally speaking, classical molecular dynamics simulations are not able tofully reproduce experimental absorption coefficients, these being quantum properties. However,they can be used to locate the position of the spectral bands since, in the harmonic (oscillator)approximation, the classical and quantum ground state frequencies are equal.
The power spectrum describes the main vibrational modes of a molecular system,including low frequencies below 100 ps−1, associated with translational and rotationalmodes, and high frequencies of stretching and bending vibrations around and above500 ps−1. The power spectra were obtained for the velocity autocorrelation functions oflithium and helium atoms and are reported in Figure 11. We find that lithium atoms havea tendency to oscillate at frequencies between 30 and 85 ps−1, whereas the vibrationalfrequency for helium atoms is between 2 and 100 ps−1, approximately. The fact that thesepeaks are found at low frequencies is consistent with a picture where the atoms can onlypresent translational vibration modes, mainly associated with the restricted translationsoften referenced as the cage effect. These are typical of most condensed liquids and in thepresent case due to short-range interactions of a given lithium or helium atom with itsclosest neighbours [44]. As a general trend, we observe that translational modes decreasetheir values as pressure rises, as expected due to condensation effects.
0
10
20
30
40
S Li(ω
)
0.1 GPa0.2 GPa0.5 GPa1 GPa5 GPa10 GPa
1 10 100ω (ps-1)
0
20
40
60
S He(ω
)
-Figure 11. Spectral densities of lithium (top) and helium (bottom) at 843 K as a function of pressure.Lines: 0.1 GPa (dotted blue); 0.2 GPa (dashed red); 0.5 GPa (dot-dashed green); 1 GPa (black); 5 GPa(dot-dot-dashed orange); 10 GPa (dash-dash-dotted violet).

Materials 2022, 15, 2866 16 of 18
4. Conclusions
In this work, we have analysed the structure and dynamics of lithium-helium mixtureswith a very low He concentration as a first step towards the simulation of the typical envi-ronmental conditions in the BB of a fusion power plant. We perform classical simulationsof the lithium–helium mixture using Monte Carlo and molecular dynamics methods, bothyielding the same predictions at equilibrium. The Monte Carlo approach is more efficientfor the calculation of thermodynamic quantities, and we employ it for the estimation ofthe total energy and pressure, along with some of its structural properties as the pairdistribution functions. In addition, molecular dynamics is used to obtain time-dependentquantities such as the diffusion coefficients, velocity autocorrelation functions and powerspectra of the atoms in the mixture.
In our simulations, we have observed that lithium becomes incompressible at pressuresabove 2 GPa, in overall agreement with Henry’s law. At the same time, the helium solubilityis too low in the range of high pressures considered so we observe the formation of heliumdroplets within our microscopic model. Furthermore, we also find that helium atoms aremiscible in the lithium bath at low pressures.
The simulations reported in this work provide a first step towards the understandingof the phenomenon of helium nucleation in liquid lithium directly from a microscopicmodel. We have shown that, at high temperatures and high pressures, this can be capturedby classical computer simulations at its inception if appropriate potential models are used.Independently of the initial homogeneous disposition of atoms in the system, our simu-lations show the formation of helium droplets systematically if the same environmentalconditions are met. Dynamical properties of the mixture, such as diffusion coefficientsof lithium and helium, are very well reproduced, in overall good agreement with theexperimental and computational data available. Future studies would likely involve the cal-culation of surface tensions of the droplets and the analysis of the nucleation phenomenonon lithium–lead-helium mixtures in the range of high temperatures and pressures.
Author Contributions: Conceptualization, J.M., F.M., G.E.A. and L.B.; methodology, J.M., F.M., G.E.A.and L.B.; software, J.M., L.P.-A, B.P.; validation, J.M., F.M., G.E.A. and L.B.; formal analysis, J.M.,F.M., G.E.A., L.B., L.P.-A. and B.P.; investigation, J.M., F.M., G.E.A., L.B., L.P.-A. and B.P.; resources,J.M. and L.B.; data curation, J.M., F.M., G.E.A., L.B. and B.P.; writing–original draft preparation, J.M.,F.M., G.E.A. and L.B.; writing–review and editing, J.M., F.M., G.E.A. and L.B.; visualization, J.M.,F.M., G.E.A., L.B., L.P.-A. and B.P.; supervision, J.M., F.M., G.E.A. and L.B.; project administration,J.M., F.M., G.E.A. and L.B.; funding acquisition, J.M., F.M., G.E.A. and L.B. All authors have read andagreed to the published version of the manuscript.
Funding: J.M. and L.B. acknowledge financial support from the Secretaria d’Universitats i Recercadel Departament d’Empresa i Coneixement de la Generalitat de Catalunya within the ERDF Op-erational Program of Catalunya (project FusionCat, Ref. 001- P-001722). J.M. thanks the SpanishMinistry of Science, Innovation and Universities (project number PGC2018-099277-B-C21, fundsMCIU/AEI/FEDER, UE). G.E.A. and F.M. acknowledge financial support from the Secretariad’Universitats i Recerca del Departament d’Empresa i Coneixement de la Generalitat de Catalunyawithin the ERDF Operational Program of Catalunya (project QuantumCat, Ref. 001-P-001644) and theSpanish MINECO (FIS2017-84114-C2-1-P, PID2020-113565GB-C21) funded by MCIN/AEI/10.13039/501100011033.
Institutional Review Board Statement: Not applicable.
Informed Consent Statement: Not applicable.
Data Availability Statement: Not applicable.
Acknowledgments: We thank L. A. Sedano and A. Al Awad for fruitful discussions.
Conflicts of Interest: The authors declare no conflict of interest.

Materials 2022, 15, 2866 17 of 18
AbbreviationsThe following abbreviations are used in this manuscript:
BB breeding blanketCNT classical nucleation theoryLM liquid metalLLE lithium–lead eutecticMC Monte Carlo simulationsMD molecular dynamics simulationsRDF radial distribution functionMSD mean square displacement
References1. Kordac, M.; Košek, L. Helium bubble formation in Pb-16Li within the breeding blanket. Fusion Eng. Des. 2017, 124, 700–704.2. Federici, G.; Boccaccini, L.; Cismondi, F.; Gasparotto, M.; Poitevin, Y.; Ricapito, I. An overview of the EU breeding blanket design
strategy as an integral part of the DEMO design effort. Fusion Eng. Des. 2019, 141, 30–42.3. Rubel, M. Fusion neutrons: tritium breeding and impact on wall materials and components of diagnostic systems. J. Fusion
Energy 2019, 38, 315–329.4. Coen, V. lithium–lead eutectic as breeding material in fusion reactors. J. Nucl. Mater. 1985, 133, 46–51.5. De Les Valls, E.M.; Sedano, L.; Batet, L.; Ricapito, I.; Aiello, A.; Gastaldi, O.; Gabriel, F. Lead–lithium eutectic material database
for nuclear fusion technology. J. Nucl. Mater. 2008, 376, 353–357.6. Sedano, L. Helium Bubbles Cavitation Phenomena in Pb-15.7 Li and Potential Impact on Tritium Transport Behaviour in HCLL Breeding
Channels; Technical Report; Centro de Investigaciones Energeticas Medioambientales y Tecnologicas (CIEMAT): Madrid, Spain,2007.
7. Ruzic, D.; Szott, M.; Sandoval, C.; Christenson, M.; Fiflis, P.; Hammouti, S.; Kalathiparambil, K.; Shchelkanov, I.; Andruczyk, D.;Stubbers, R.; et al. Flowing liquid lithium plasma-facing components–Physics, technology and system analysis of the LiMITsystem. Nucl. Mater. Energy 2017, 12, 1324–1329.
8. Smolentsev, S.; Rognlien, T.; Tillack, M.; Waganer, L.; Kessel, C. Integrated Liquid Metal Flowing First Wall and Open-SurfaceDivertor for Fusion Nuclear Science Facility: Concept, Design, and Analysis. Fusion Sci. Technol. 2019, 75, 939–958.
9. Nakamura, H.; Agostini, P.; Ara, K.; Cevolani, S.; Chida, T.; Ciotti, M.; Fukada, S.; Furuya, K.; Garin, P.; Gessii, A.; et al. Latestdesign of liquid lithium target in IFMIF. Fusion Eng. Des. 2008, 83, 1007–1014.
10. Gibbs, J.W. On the equilibrium of heterogeneous substances. Am. J. Sci. 1878, 3, 441–458.11. Gibbs, J.W. Scientific Papers of J. Willard Gibbs, in Two Volumes; Longmans, Green: London, UK, 1906; Volume 1.12. Batet, L.; Fradera, J.; de les Valls, E.M.; Sedano, L. Numeric implementation of a nucleation, growth and transport model
for helium bubbles in lead–lithium HCLL breeding blanket channels: Theory and code development. Fusion Eng. Des. 2011,86, 421–428.
13. Frenkel, J. Kinetic Theory of Liquids; Oxford Univ. Press: New York, NY, USA, 1946.14. Gunton, J. Homogeneous nucleation. J. Stat. Phys. 1999, 95, 903–923.15. Yakimovich, K.A.; Mozgovoi, A.G. Experimental investigation of the density and surface tension of molten lithium at temperatures
up to 1300 K. High Temp. 2000, 38, 657–659.16. Mazzanti, F.; Polls, A.; Boronat, J.; Casulleras, J. High-Momentum Response of Liquid He3. Phys. Rev. Lett. 2004, 92, 085301.17. Pierleoni, C.; Morales, M.A.; Rillo, G.; Holzmann, M.; Ceperley, D.M. Liquid–liquid phase transition in hydrogen by coupled
electron–ion Monte Carlo simulations. Proc. Natl. Acad. Sci. USA 2016, 113, 4953–4957.18. Bombin, R.; Boronat, J.; Mazzanti, F. Dipolar Bose supersolid stripes. Phys. Rev. Lett. 2017, 119, 250402.19. Sánchez-Baena, J.; Boronat, J.; Mazzanti, F. Supersolid stripes enhanced by correlations in a Raman spin-orbit-coupled system.
Phys. Rev. A 2020, 101, 043602.20. Padro, J.; Martí, J.; Guàrdia, E. Molecular dynamics simulation of liquid water at 523 K. J. Phys. Condens. Matter 1994, 6, 2283.21. Nagy, G.; Gordillo, M.; Guàrdia, E.; Martí, J. Liquid water confined in carbon nanochannels at high temperatures. J. Phys. Chem.
B 2007, 111, 12524–12530.22. Calero, C.; Martí, J.; Guàrdia, E. 1H nuclear spin relaxation of liquid water from molecular dynamics simulations. J. Phys. Chem.
B 2015, 119, 1966–1973.23. Zambrano, H.A.; Walther, J.H.; Koumoutsakos, P.; Sbalzarini, I.F. Thermophoretic motion of water nanodroplets confined inside
carbon nanotubes. Nano Lett. 2009, 9, 66–71.24. Videla, P.; Sala, J.; Martí, J.; Guàrdia, E.; Laria, D. Aqueous electrolytes confined within functionalized silica nanopores. J. Chem.
Phys. 2011, 135, 104503.25. Karplus, M.; McCammon, J. Molecular dynamics simulations of biomolecules. Nat. Struct. Biol. 2002, 9, 646–652.26. Yang, J.; Calero, C.; Martí, J. Diffusion and spectroscopy of water and lipids in fully hydrated dimyristoylphosphatidylcholine
bilayer membranes. J. Chem. Phys. 2014, 140, 03B606_1.

Materials 2022, 15, 2866 18 of 18
27. Martí, J.; Csajka, F. The aqueous solvation of sodium chloride: A Monte Carlo transition path sampling study. J. Chem. Phys. 2000,113, 1154–1161.
28. Bolhuis, P.G.; Chandler, D.; Dellago, C.; Geissler, P.L. Transition path sampling: Throwing ropes over rough mountain passes, inthe dark. Annu. Rev. Phys. Chem. 2002, 53, 291–318.
29. Canales, M.; Padró, J.; González, L.; Giró, A. Molecular dynamics simulation of liquid lithium. J. Phys. Condens. Matter 1993,5, 3095.
30. Canales, M.; González, L.; Padró, J. Computer simulation study of liquid lithium at 470 and 843 K. Phys. Rev. E 1994, 50, 3656.31. Aziz, R.A.; McCourt, F.R.; Wong, C.C. A new determination of the ground state interatomic potential for He2. Mol. Phys. 1987,
61, 1487–1511.32. Zhou, X.; Bartelt, N.; Sills, R. Enabling simulations of helium bubble nucleation and growth: A strategy for interatomic potentials.
Phys. Rev. B 2021, 103, 014108.33. Juslin, N.; Wirth, B. Interatomic potentials for simulation of He bubble formation in W. J. Nucl. Mater. 2013, 432, 61–66.34. Frenkel, D.; Smit, B. Understanding Molecular Simulation: From Algorithms to Applications; Elsevier: Amsterdam, The Netherlands,
2001; Volume 1.35. Slotnick, H. The Solubility of Helium in Lithium and Potassium; Pratt & Whitney Aircraft Division, United Aircraft Corporation,
CANEL Operations: Middletown, CT, USA, 1965; Volume 380.36. Al Taisan, N.A. Spectroscopic Detection of the Lithium Helium (LiHe) van der Waals Molecule; University of Nevada: Reno, NV, USA,
2013.37. Chandler, D. Introduction to modern statistical. In Mechanics; Oxford University Press: Oxford, UK, 1987; Volume 5.38. Wang, L. Discovering phase transitions with unsupervised learning. Phys. Rev. B 2016, 94, 195105.39. Jayaram, C.; Ravi, R.; Chhabra, R. Calculation of self-diffusion coefficients in liquid metals based on hard sphere diameters
estimated from viscosity data. Chem. Phys. Lett. 2001, 341, 179–184.40. Nieto, M.; Ruzic, D.; Allain, J.P.; Coventry, M.; Vargas-Lopez, E. Helium retention and diffusivity in flowing liquid lithium. J.
Nucl. Mater. 2003, 313, 646–650.41. McQuarrie, D.A. Statistical Mechanics; University Science Books: Sausalito, CA, USA, 2000.42. Martí, J.; Padró, J.; Guàrdia, E. Computer simulation of molecular motions in liquids: Infrared spectra of water and heavy water.
Mol. Simul. 1993, 11, 321–336.43. Praprotnik, M.; Janežic, D. Molecular dynamics integration and molecular vibrational theory. III. The infrared spectrum of water.
J. Chem. Phys. 2005, 122, 174103.44. Padró, J.; Martí, J. Response to “Comment on ‘An interpretation of the low-frequency spectrum of liquid water’” [J. Chem. Phys.
118, 452 (2003)]. J. Chem. Phys. 2004, 120, 1659–1660.
Related Documents