Nucleation and growth of octacalcium phosphate on treated titanium by immersion in a simplified simulated body fluid Enori Gemelli • Cristiane Xavier Resende • Gloria Dulce de Almeida Soares Received: 28 July 2008 / Accepted: 26 March 2010 / Published online: 14 April 2010 Ó Springer Science+Business Media, LLC 2010 Abstract A simplified simulated body fluid solution (S-SBF) was used to study the kinetics and mechanism of nucleation and growth of octacalcium phosphate (OCP) on the surfaces of alkali and heat-treated titanium samples. After the alkali and heat treatments, the samples were soaked in S-SBF for periods varying up to 24 h. A thin layer of poorly crystallized calcium titanate was formed after 15 min of immersion, allowing for the deposition of another layer of amorphous calcium phosphate (ACP). After 2.5 h of immersion, OCP nuclei were observed on the surface of the ACP layer. After 5 h of immersion in S-SBF solution, the specimens were completely covered with a homogeneous plate-like layer of OCP. Analyses by trans- mission electron microscopy revealed that nucleation and growth of OCP occurred concomitantly to the crystalliza- tion of ACP in hydroxyapatite (HA). This transformation took place by solid-state diffusion, forming a needle-like HA structure underneath the OCP film. 1 Introduction Although nucleation of biological apatite has been inves- tigated and discussed for many years, the theory that amorphous calcium phosphate (ACP) and/or octacalcium phosphate (OCP) act as precursor pathways for the bio- logical formation of apatite is not unanimously accepted. In an investigation of early embryonic chicken bone, Wu et al. [1] detected hydrogen phosphates and/or protein phos- phoryl groups that might be part of a range of phosphate environments in early mineralization. More recently, Crane et al. [2] used micro-Raman spectroscopy to monitor mineral formation at the suture boundaries of mice calvaria and, by adding FGF2 to the medium, they induced rapid mineralization. Their results revealed the presence of OCP. Octacalcium phosphate has also been identified by other techniques as one of the Ca–P phases that nucleate in the early stage of biomineralization, which is transformed into hydroxyapatite (HA) in biological matrix [3, 4]. Observa- tions of this nature have been used to argue that OCP is present in new bone mineral formation. However, handling of the sample, dehydration, complexity of in vivo envi- ronment, structure, nonstoichiometry, impurities and size- related effects are the major factors that affect the nature of the early formed mineral phase. Many in vitro studies have reported the deposition of OCP and HA films on chemically treated titanium surfaces by soaking the material in simulated body fluid (SBF) solutions [5–8]. Theoretical analyses have shown that HA and OCP are thermodynamically stable phases in SBF solutions at physiological pH and temperature [9]. HA is thermodynamically more stable than OCP, but the nucle- ation rate of OCP is higher than that of HA in SBF solu- tions [9–11]. These theoretical studies show that Ca–P precipitation on bioactive materials may lead to the for- mation of a layer of OCP, followed eventually by the formation of an external layer of HA. Feng et al. [6] chemically activated a titanium surface with NaOH in order to study the deposition mechanism of calcium E. Gemelli (&) Department of Mechanical Engineering, Center of Technological Science, State University of Santa Catarina, Campus Universita ´rio, Bairro Bom Retiro, 631, Joinville 89223-100, SC, Brazil e-mail: [email protected] E. Gemelli C. X. Resende G. D. de Almeida Soares Metallurgy and Materials Engineering, Federal University of Rio de Janeiro, COPPE, 68505, Rio de Janeiro 21941-972, RJ, Brazil 123 J Mater Sci: Mater Med (2010) 21:2035–2047 DOI 10.1007/s10856-010-4074-9

Welcome message from author
This document is posted to help you gain knowledge. Please leave a comment to let me know what you think about it! Share it to your friends and learn new things together.
Transcript
Nucleation and growth of octacalcium phosphate on treatedtitanium by immersion in a simplified simulated body fluid
Enori Gemelli • Cristiane Xavier Resende •
Gloria Dulce de Almeida Soares
Received: 28 July 2008 / Accepted: 26 March 2010 / Published online: 14 April 2010
� Springer Science+Business Media, LLC 2010
Abstract A simplified simulated body fluid solution
(S-SBF) was used to study the kinetics and mechanism of
nucleation and growth of octacalcium phosphate (OCP) on
the surfaces of alkali and heat-treated titanium samples.
After the alkali and heat treatments, the samples were
soaked in S-SBF for periods varying up to 24 h. A thin
layer of poorly crystallized calcium titanate was formed
after 15 min of immersion, allowing for the deposition of
another layer of amorphous calcium phosphate (ACP).
After 2.5 h of immersion, OCP nuclei were observed on the
surface of the ACP layer. After 5 h of immersion in S-SBF
solution, the specimens were completely covered with a
homogeneous plate-like layer of OCP. Analyses by trans-
mission electron microscopy revealed that nucleation and
growth of OCP occurred concomitantly to the crystalliza-
tion of ACP in hydroxyapatite (HA). This transformation
took place by solid-state diffusion, forming a needle-like
HA structure underneath the OCP film.
1 Introduction
Although nucleation of biological apatite has been inves-
tigated and discussed for many years, the theory that
amorphous calcium phosphate (ACP) and/or octacalcium
phosphate (OCP) act as precursor pathways for the bio-
logical formation of apatite is not unanimously accepted. In
an investigation of early embryonic chicken bone, Wu et al.
[1] detected hydrogen phosphates and/or protein phos-
phoryl groups that might be part of a range of phosphate
environments in early mineralization. More recently, Crane
et al. [2] used micro-Raman spectroscopy to monitor
mineral formation at the suture boundaries of mice calvaria
and, by adding FGF2 to the medium, they induced rapid
mineralization. Their results revealed the presence of OCP.
Octacalcium phosphate has also been identified by other
techniques as one of the Ca–P phases that nucleate in the
early stage of biomineralization, which is transformed into
hydroxyapatite (HA) in biological matrix [3, 4]. Observa-
tions of this nature have been used to argue that OCP is
present in new bone mineral formation. However, handling
of the sample, dehydration, complexity of in vivo envi-
ronment, structure, nonstoichiometry, impurities and size-
related effects are the major factors that affect the nature of
the early formed mineral phase.
Many in vitro studies have reported the deposition of
OCP and HA films on chemically treated titanium surfaces
by soaking the material in simulated body fluid (SBF)
solutions [5–8]. Theoretical analyses have shown that HA
and OCP are thermodynamically stable phases in SBF
solutions at physiological pH and temperature [9]. HA is
thermodynamically more stable than OCP, but the nucle-
ation rate of OCP is higher than that of HA in SBF solu-
tions [9–11]. These theoretical studies show that Ca–P
precipitation on bioactive materials may lead to the for-
mation of a layer of OCP, followed eventually by the
formation of an external layer of HA. Feng et al. [6]
chemically activated a titanium surface with NaOH in
order to study the deposition mechanism of calcium
E. Gemelli (&)
Department of Mechanical Engineering, Center of Technological
Science, State University of Santa Catarina, Campus
Universitario, Bairro Bom Retiro, 631, Joinville 89223-100,
SC, Brazil
e-mail: [email protected]
E. Gemelli � C. X. Resende � G. D. de Almeida Soares
Metallurgy and Materials Engineering, Federal University of Rio
de Janeiro, COPPE, 68505, Rio de Janeiro 21941-972,
RJ, Brazil
123
J Mater Sci: Mater Med (2010) 21:2035–2047
DOI 10.1007/s10856-010-4074-9
phosphate in simple supersaturated calcification solution.
In their experiment, two layers of Ca–P crystals were found
on the activated titanium surface: OCP deposited from
different concentrations of supersaturated calcification
solution, followed by HA with [001] preferred orientation
on OCP [6]. Many other studies have reported the depo-
sition of OCP and/or HA on bioactive titanium by biomi-
metic methods [5, 8, 12, 13]. Bioactive titanium surfaces
were prepared by chemical treatment in NaOH, nitric acid
or modified simulated body fluid solutions, followed by
immersion in SBF solutions or supersaturated calcium
phosphate solutions. The structure formed on pre-treated
titanium surfaces generally depends on the composition of
the solution. Subsequent films prepared under physiologi-
cal conditions exhibited structures composed of OCP and/
or HA.
Lu and Leng [14] investigated the formation of Ca–P
phases on alkali and heat-treated titanium surfaces, fol-
lowed by immersion in Kokubo revised SBF (R-SBF)
solution. Their study revealed that OCP, instead of HA,
nucleated directly from amorphous calcium phosphate. The
OCP crystals grew continuously on the titanium surfaces
rather than transforming into apatite. Calcium titanate was
also identified by electron diffraction as a precursor phase
to Ca–P deposition [14]. Similar studies in Kokubo con-
ventional SBF solution lead to a film essentially composed
of apatite [7, 15–17]. The difference in structure of the
Ca–P layer may be attributed to the difference in the
concentration of carbonate ions in the solutions [9].
Recently, Kamakura et al. [18] confirmed that OCP is
more resorbable and enhances bone formation more than
do other Ca–P phases such as b-tricalcium phosphate (b-
TCP) and HA. Also, it was found that the OCP phase grows
preferentially, even in the presence of b-TCP seeds from
solutions supersaturated with b-TCP, HA and OCP [19].
Therefore, presuming that OCP or OCP-like phosphate
may be a transient precursor strategy for the initiation of
biological apatite, deposition of OCP film may lead to the
rapid formation of a biological apatite layer on the surface
of the implant. Ca–P films are also well known as the main
requirement for biological fixation and long-term clinical
success [20, 21]. These films have been successfully
deposited on bioactive titanium surfaces by biomimetic
processes in SBF solutions. Thus, the purpose of this
investigation was to coat pure titanium with OCP by a
similar process, using a simplified SBF solution. This
solution was already theoretically studied [22] and a film of
OCP on alkali and heat-treated titanium surfaces was
observed by soaking the material in this solution for one or
more days [15]. The aim of this work was to study the
initial period of formation of OCP up to 24 h, involving the
kinetics and the nucleation and growth mechanism of OCP.
This study was also motivated by the fact that the solution
used herein leads to the formation of an OCP film on the
titanium surface instead of a HA film, as reported in many
biomimetic studies [5, 6, 13, 23, 24]. Moreover, the
nucleation and growth of this OCP film is very fast. To our
knowledge, a systematic study of such rapid film formation
using a simplified solution with calcium and phosphate
concentration equal to SBF has not yet been reported.
2 Materials and methods
2.1 Preparation of simplified simulated body fluid
solution (S-SBF)
The simplified solution (S-SBF), which was designed by
Resende et al. [15] in their quest for a less complex com-
position, consists of sodium bicarbonate (99.7% pure),
dipotassium hydrogen phosphate (99% pure) and calcium
chloride (96% pure). All reagents were from VETEC
Quımica Fina, Brazil. The impurities present in the pre-
cursor reagents were specified by the company. The prep-
aration consists of sequentially dissolving reagent-grade
NaHCO3, K2HPO4�3H2O and CaCl2 in distilled water at
approximately 36.5�C buffered to pH = 7.4 with Tris-
hydroxymethyl aminomethane (TRIS) and HCl, according
to the guidelines set forth in the ISO 23317: 2007 standard.
Table 1 shows the ionic concentration of the S-SBF solu-
tion compared with that of human blood plasma.
2.2 Sample preparation and analyses
Commercially pure 8 9 8 9 1 mm titanium sheets were
polished mechanically using Si carbide sandpaper from
grade 100, 240, 400–600 grits. The samples were ultra-
sonically cleaned in acetone, alcohol and distilled water for
10 min each, followed by immersion in 5 M NaOH
(VETEC Quımica Fina, Brazil) aqueous solution at 60�C
for 24 h, then washed with distilled water, dried at 50�C in
air and heated at 600�C for 1 h in a furnace. After cooling
Table 1 Composition of S-SBF solution and of human blood plasma (mM)
Na? K? Ca2? Mg2? Cl- HCO3- HPO4
2- SO42-
Plasma 142.0 3.6–5.5 2.12–2.6 1.0 95–107 27.0 1.0 0.65–1.45
S–SBF 4.2 2.0 2.5 – 5.0 4.2 1.0 –
2036 J Mater Sci: Mater Med (2010) 21:2035–2047
123
to room temperature, each Ti sheet was soaked in 16 ml of
S-SBF solution at 37�C for various periods (15–30 min,
from 1 to 24 h), removed from the S-SBF, washed with
distilled water and dried in air atmosphere. The samples
immersed in this solution were maintained leaning and its
superior side was analyzed.
Sample surfaces were analyzed by scanning electron
microscopy (SEM), X-ray diffraction (XRD), X-ray pho-
toelectron spectroscopy (XPS), and transmission electron
microscopy (TEM) coupled to X-ray energy dispersive
spectrometry (EDS). The SEM analyses were carried out
under a JEOL JSM 6460LV microscope (Japan) operating
between 10 and 20 kV. A Shimadzu XRD-6000 X-ray
diffractometer (Japan) was used to identify the phases
formed on titanium surfaces. A CuKa radiation source was
used and the incidence beam scan was 2�/min. The XRD
patterns were recorded with scan range from 3 to 60� (2h),
incremental steps of 0.02� and a count time of 0.6 s. The
XPS analyses were performed with a Phoibos 100 spec-
trometer (SPECS, Germany). The X-ray source was gen-
erated by MgKa (1253.6 eV), with 200 W power. The C1 s
peak (284.6 eV) was used as an internal standard to correct
the peak shifts caused by the accumulation of surface
charge on insulating samples. In preparation for the TEM
analysis, the samples were immersed in an ethanol bath
with ultrasonic vibration to separate the layer of coating
from the titanium substrate. The material was deposited on
a TEM copper grid coated with formvar and carbon films
and examined in a JEOL 2000FX microscope (Japan)
operating at 200 kV. This analysis was performed on par-
ticles extracted from the coatings produced by immersion
in S-SBF for 1, 2.5 and 6 h.
3 Results and discussion
3.1 Alkali and thermal treatments
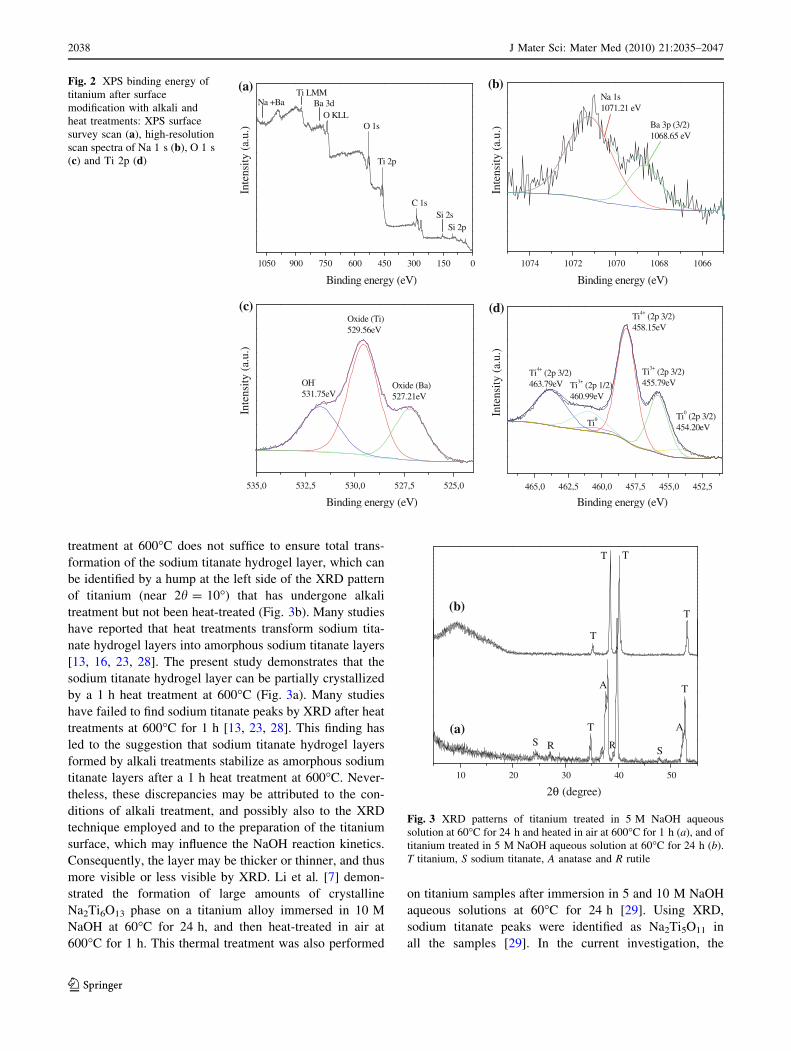
Figure 1 shows the morphology of the titanium surface
after alkali and thermal treatments. Note the network
structure with high interpenetrating sub-micrometric
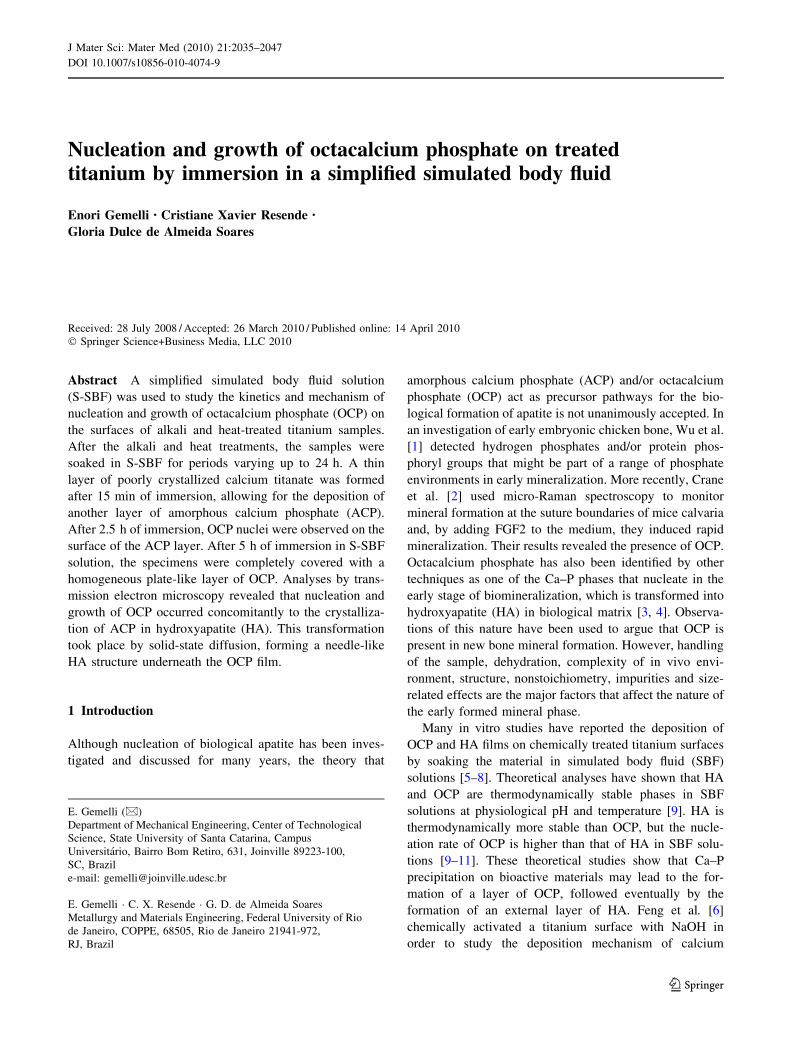
porosity due to the attack of NaOH. The XPS results
depicted in Fig. 2 indicate that the main components of this
sample surface were Ti, O, and Na, with small amounts of
C (due to contamination by XPS), Ba and Si. Peaks asso-
ciated with Ba and Si may arise due to impurities in the
reagents used to treat Ti or prepare the S-SBF. Sodium
(Na) was found in its monovalent state (Na?) with a
binding energy of 1071.21 eV (Fig. 2b), which is low
energy compared with that of pure Na 1 s (1072.00 eV).
The chemical shift indicated that the sodium (Na) was
bound to other chemical species such as Ti and oxygen.
The binding energies of O 1 s (Fig. 2c) indicated that the
surface contained titanium and barium oxides and hydro-
xyl, most likely from Ti–OH groups formed by the reaction
between the Ti substrate and OH- ions in the solution.
Figure 2d presents the Ti 2p spectrum, together with the
oxidation states. Three oxidation states are presented: Ti0,
Ti3? and Ti4?. Ti0 corresponds to metallic Ti and was
detected by XPS because of the high porosity produced by
the alkali attack on the titanium surface. The Ti4? peak
originates from TiO2 and sodium titanate oxide and the
Ti3? peak indicates the presence of Ti2O3 and/or barium
sodium titanate oxide.
It is well known that when metallic titanium is exposed
to ambient air at room temperature, a passive oxide film
forms spontaneously on its surface. This passive film is
amorphous, very thin (5–10 nm thickness) [25], and com-
posed of three layers [26, 27]: the first layer adjacent to
metallic titanium is TiO, the intermediary layer is Ti2O3,
and the third and most important layer in thickness, which
is in contact with the environment, is anatase TiO2. During
the alkali treatment, OH- ions react with this passive oxide
film, forming titanate hydroxide. These hydroxides are
essentially joined by Na? ions in the aqueous solution,
resulting in the formation of a porous network layer of
sodium titanate hydroxide [23]. Some titanate hydroxide
may be also joined by barium, forming barium sodium
titanate hydroxide. Titanate hydroxide not bonded with
Na? (and eventually with Ba?) is converted into TiO2 by
dehydration during heating. After the heat treatment,
amorphous sodium titanate and/or sodium titanate oxide is
formed by removal of water from the sodium titanate
hydrogel layer.
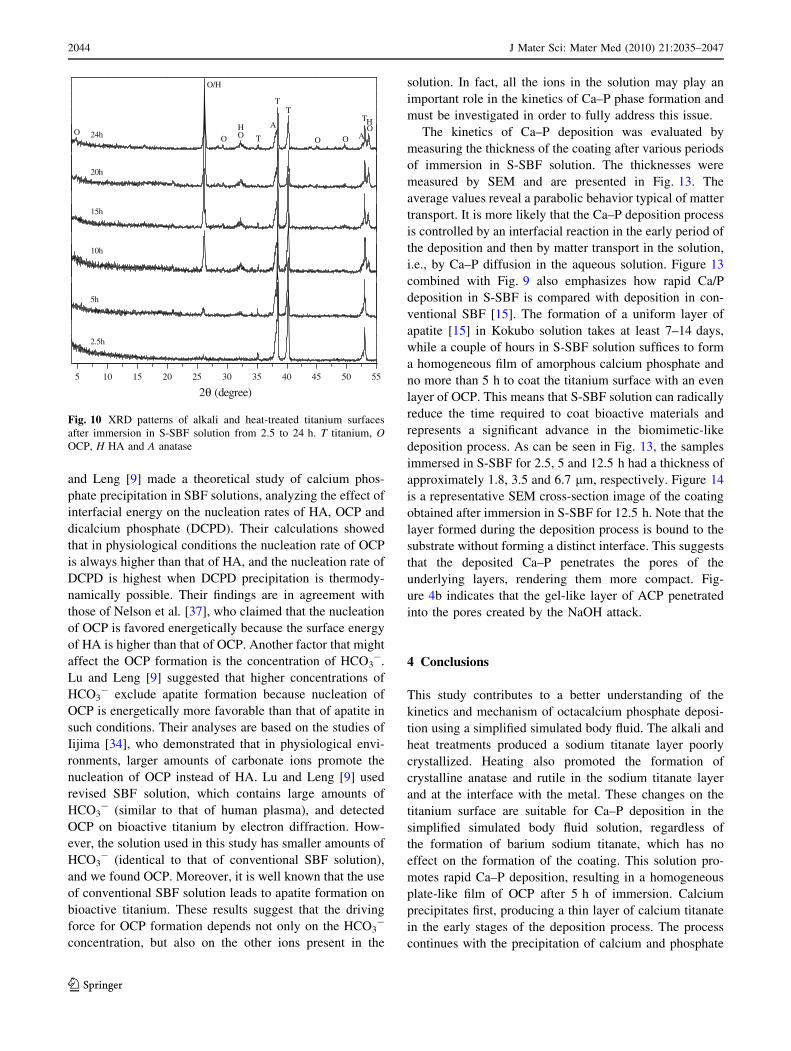
Figure 3a shows broad low peaks ascribed to sodium
titanate oxide at approximately 2h = 24.5 and 48.8�. The
broad peaks indicate low crystallinity, i.e., a 1 h heat
Fig. 1 SEM micrograph of titanium surface treated in 5 M NaOH
aqueous solution at 60�C for 24 h and sequentially heat-treated in air
at 600�C for 1 h
J Mater Sci: Mater Med (2010) 21:2035–2047 2037
123
treatment at 600�C does not suffice to ensure total trans-
formation of the sodium titanate hydrogel layer, which can
be identified by a hump at the left side of the XRD pattern
of titanium (near 2h = 10�) that has undergone alkali
treatment but not been heat-treated (Fig. 3b). Many studies
have reported that heat treatments transform sodium tita-
nate hydrogel layers into amorphous sodium titanate layers
[13, 16, 23, 28]. The present study demonstrates that the
sodium titanate hydrogel layer can be partially crystallized
by a 1 h heat treatment at 600�C (Fig. 3a). Many studies
have failed to find sodium titanate peaks by XRD after heat
treatments at 600�C for 1 h [13, 23, 28]. This finding has
led to the suggestion that sodium titanate hydrogel layers
formed by alkali treatments stabilize as amorphous sodium
titanate layers after a 1 h heat treatment at 600�C. Never-
theless, these discrepancies may be attributed to the con-
ditions of alkali treatment, and possibly also to the XRD
technique employed and to the preparation of the titanium
surface, which may influence the NaOH reaction kinetics.
Consequently, the layer may be thicker or thinner, and thus
more visible or less visible by XRD. Li et al. [7] demon-
strated the formation of large amounts of crystalline
Na2Ti6O13 phase on a titanium alloy immersed in 10 M
NaOH at 60�C for 24 h, and then heat-treated in air at
600�C for 1 h. This thermal treatment was also performed
on titanium samples after immersion in 5 and 10 M NaOH
aqueous solutions at 60�C for 24 h [29]. Using XRD,
sodium titanate peaks were identified as Na2Ti5O11 in
all the samples [29]. In the current investigation, the
Si 2sSi 2p
C 1s
(a)Ba 3d
Ti 2p
O 1sO KLL
Ti LMMNa +Ba
Inte
nsity
(a.
u.)
Binding energy (eV)
Ba 3p (3/2)1068.65 eV
Na 1s1071.21 eV
(b)
Inte
nsity
(a.
u.)
Binding energy (eV)
(c)
OH-
531.75eV
Oxide (Ti)529.56eV
Oxide (Ba)527.21eV
Inte
nsity
(a.
u.)
Binding energy (eV)
1050 900 750 600 450 300 150 0 1074 1072 1070 1068 1066
535,0 532,5 530,0 527,5 525,0 465,0 462,5 460,0 457,5 455,0 452,5
Ti0
(d)
Ti0 (2p 3/2)454.20eV
Ti3+ (2p 1/2)460.99eV
Ti4+ (2p 3/2)463.79eV
Ti3+ (2p 3/2)455.79eV
Ti4+ (2p 3/2)458.15eV
Inte
nsity
(a.
u.)
Binding energy (eV)
Fig. 2 XPS binding energy of
titanium after surface
modification with alkali and
heat treatments: XPS surface
survey scan (a), high-resolution
scan spectra of Na 1 s (b), O 1 s
(c) and Ti 2p (d)
10 20 30 40 50
(a)
A
A
SS
T
T
RR
2θ (degree)
(b)T
TT
T
Fig. 3 XRD patterns of titanium treated in 5 M NaOH aqueous
solution at 60�C for 24 h and heated in air at 600�C for 1 h (a), and of
titanium treated in 5 M NaOH aqueous solution at 60�C for 24 h (b).
T titanium, S sodium titanate, A anatase and R rutile
2038 J Mater Sci: Mater Med (2010) 21:2035–2047
123
crystalline part of sodium titanate that appears in Fig. 3a is
best matched to Na2Ti6O13 (JCPDS 73-1398 card).
Crystalline rutile and anatase (TiO2) were also detected
by XRD (Fig. 3a). After the alkali treatment, the samples
were exposed to ambient air at room temperature and
washed with water. This procedure led to the formation of
a passive oxide film at the interface with the metal due to
the porosity of sodium titanate. During heating, the passive
film is transformed into crystalline rutile and anatase.
Therefore, the Ti4? found in the spectra of O 1 s (Fig. 2c)
and Ti 2p (Fig. 2d) also originates from the oxide formed
in contact with the metal. The Ti3? peak in the Ti 2p
spectrum (Fig. 2d) may originate from Ti2O3 passive film
not converted into crystalline TiO2. However, the fact that
TiO was not identified by XPS suggests that all the passive
film was crystallized and that the Ti3? comes from barium
sodium titanate oxide in the form of BaNaTiO3, which was
formed by the removal of water from the barium sodium
titanate hydroxide during heating. Because oxygen can
penetrate porous sodium titanate, diffusion of titanium and/
or oxygen through the oxide film in contact with the sub-
strate occurs during heating, increasing the thickness of
rutile and anatase film.
3.2 Initial period of the coating process (from 15 min
to 2.5 h)
Various coatings were produced on alkali and heat-treated
titanium by controlling the immersion time. It was found
that calcium deposition occurred before phosphate depo-
sition when treated titanium was soaked in supersaturated
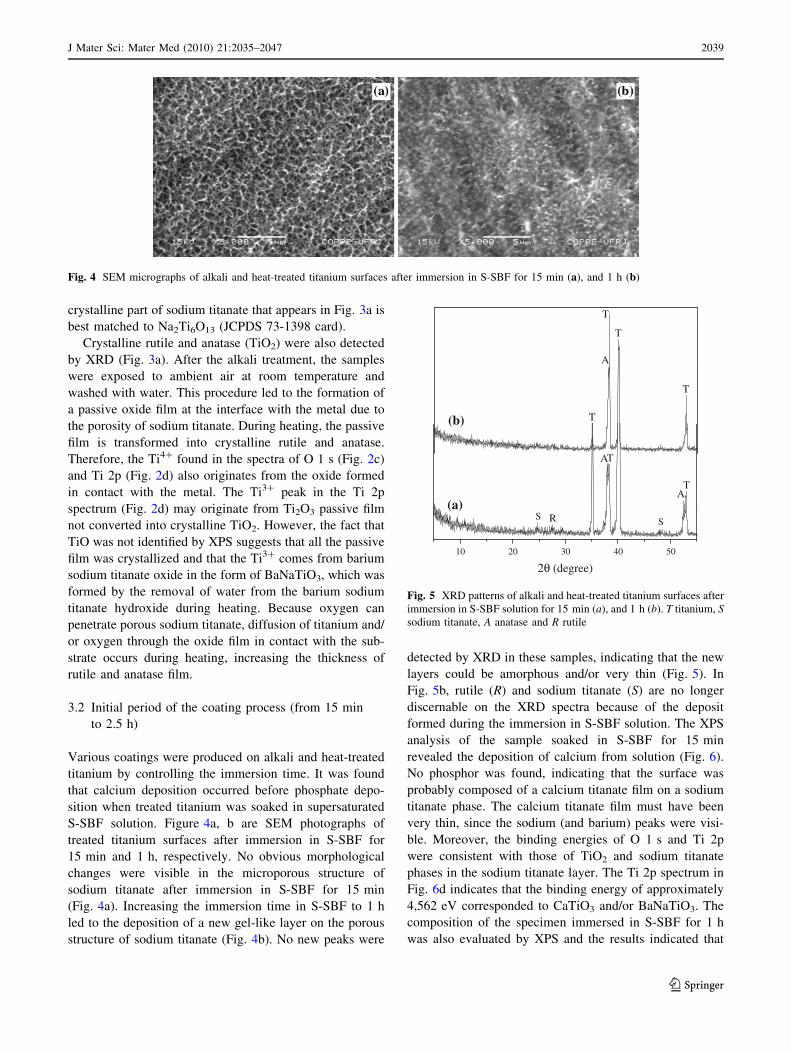
S-SBF solution. Figure 4a, b are SEM photographs of
treated titanium surfaces after immersion in S-SBF for
15 min and 1 h, respectively. No obvious morphological
changes were visible in the microporous structure of
sodium titanate after immersion in S-SBF for 15 min
(Fig. 4a). Increasing the immersion time in S-SBF to 1 h
led to the deposition of a new gel-like layer on the porous
structure of sodium titanate (Fig. 4b). No new peaks were
detected by XRD in these samples, indicating that the new
layers could be amorphous and/or very thin (Fig. 5). In
Fig. 5b, rutile (R) and sodium titanate (S) are no longer
discernable on the XRD spectra because of the deposit
formed during the immersion in S-SBF solution. The XPS
analysis of the sample soaked in S-SBF for 15 min
revealed the deposition of calcium from solution (Fig. 6).
No phosphor was found, indicating that the surface was
probably composed of a calcium titanate film on a sodium
titanate phase. The calcium titanate film must have been
very thin, since the sodium (and barium) peaks were visi-
ble. Moreover, the binding energies of O 1 s and Ti 2p
were consistent with those of TiO2 and sodium titanate
phases in the sodium titanate layer. The Ti 2p spectrum in
Fig. 6d indicates that the binding energy of approximately
4,562 eV corresponded to CaTiO3 and/or BaNaTiO3. The
composition of the specimen immersed in S-SBF for 1 h
was also evaluated by XPS and the results indicated that
Fig. 4 SEM micrographs of alkali and heat-treated titanium surfaces after immersion in S-SBF for 15 min (a), and 1 h (b)
10 20 30 40 50
A
A
R SS
(a)
T
T
2θ (degree)
A
(b)
T
T
T
T
Fig. 5 XRD patterns of alkali and heat-treated titanium surfaces after
immersion in S-SBF solution for 15 min (a), and 1 h (b). T titanium, Ssodium titanate, A anatase and R rutile
J Mater Sci: Mater Med (2010) 21:2035–2047 2039
123
the gel-like layer was composed mainly of phosphor, cal-
cium and oxygen (spectrum not shown here).
The structure of the coating produced on the alkali and
heat-treated titanium surface after immersion in S-SBF
solution for 1 h was also assessed by TEM on the layer of
coating detached from the substrate by ultrasound. Figure 7a
shows the bright-field TEM image of a region containing
particles of amorphous calcium phosphate with islands of
a needle-like structure. The electron diffraction pattern
(Fig. 7b) confirms the amorphous nature of the gel-like layer
of calcium phosphate observed in Fig. 7a. A TEM analysis
of particles from the coating produced by immersion in
S-SBF for 1–2.5 h also revealed the presence of calcium
titanate particles (Fig. 8a, b). The strong Cu peak indicates
that the analysis was performed close to the copper grid.
Figure 8b also highlights small amounts of sulfur, chloride,
phosphor and silicon incorporated into the structure during
the deposition process. Figure 8a shows rounded particles of
poorly crystallized calcium titanate. Lu and Leng [14] also
found this phase on a bioactive titanium surface after
immersion in R-SBF solution. However, in this case, the
calcium titanate was totally crystallized because the samples
were kept in the solution for 1 month (the solution was
refreshed every 3 days). The electron diffraction pattern of
these crystalline grains was indexed as the diffraction of
cubic structure of CaTiO3 [14]. Indications of calcium tita-
nate in vivo were found in recent years on implants of alkali
modified plasma-sprayed titanium coatings inserted in dog
femur [30]. EDS analyses of the implant one month after
implantation revealed the presence of calcium and titanium
at the interface between the titanium implant and bone. No
phosphor was detected by this technique, indicating that
calcium titanate could be formed and could link directly to
the bone. In this work, the evidence revealed by XPS and
TEM indicated that the porous structure of sodium titanate
was covered by a continuous thin film of poorly crystallized
calcium titanate. This film, which was formed shortly after
the sample’s immersion in S-SBF solution, was followed by
another thicker film of amorphous calcium phosphate (ACP)
formed on the surface during the initial period of formation
of the Ca–P coating.
The mechanism of Ca–P coating on alkali and heat-
treated titanium in SBF solution was proposed by Kokubo
et al. [28]. When exposed to SBF solution, bioactive tita-
nium generally releases the Na? ion from its sodium tita-
nate surface into the SBF via exchange with H3O? ions in
the fluid, thereby forming many Ti–OH groups on its sur-
face [28]. As a result, the surface is negatively charged, and
then reacts with Ca? cations in SBF to form a calcium
titanate. As the Ca2? cations accumulate, the surface
(a)
C 1s
Ca 2p
Ti 2p
O 1sO KLL
Na+Ba
Ti LMN
Inte
nsity
(a.
u.)
Binding energy (eV)
1000 800 600 400 200 0 357 354 351 348 345 342 339
(b)Ca 2p
Inte
nsity
(a.
u.)
Binding energy (eV)
(c)
Oxide (Ba)
Oxide (Ti)
Inte
nsity
(a.
u.)
Binding energy (eV)
536 534 532 530 528 526 524 468 465 462 459 456 453 450
(d)
Sodium titanate + TiO2
CaTiO3 and/or
BaNaTiO3
Inte
nsity
(a.
u.)
Binding energy (eV)
Fig. 6 XPS spectra of treated
titanium after immersion in
S-SBF solution for 15 min. XPS
surface survey scan (a), and
spectra of Ca 2p (b), O 1 s (c)
and Ti 2p (d)
2040 J Mater Sci: Mater Med (2010) 21:2035–2047
123
becomes positively charged, reacting with phosphate
anions to form a bone-like apatite [28]. Chen et al. [23]
investigated the release of Na? ions from NaOH-treated
titanium with and without a 1 h heat treatment at 600�C.
The specimens were immersed in a buffer solution at
biological temperature and pH and the release of Na? ions
into the buffer solution was measured after 1, 3, 5 and
7 days. They found that the Na? concentration increased
sharply in the buffer solution, and that the amount of this
increase in NaOH heat-treated titanium was higher than in
NaOH heat-treated titanium. The Na? ion concentration
reached its highest dissolution level of 0.20 and 0.55 mM
after 1–3 days in samples with and without heat treatment,
respectively. The sodium titanate appeared to become more
stable after heating, hindering the release of Na? ions. This
experiment confirmed the dissolution of Na? ions in the
solution. However, compelling and irrefutable experimen-
tal data about its dissolution via exchange with H3O? ions
in the fluid has not yet been presented, leaving room for
speculation about other mechanisms. For instance, some
dissolution due to the chemical potential between solid/
liquid phases might suffice to ensure the formation of
Ti–OH bonds on the surface. Na? ion dissolution, espe-
cially from the amorphous sodium titanate part, which is
less stable, could occur along with dissolution and rede-
position of Ti through the reaction:
H2Oþ O2� ¼ 2OH�;
Fig. 7 TEM morphology of
needle-like structure surrounded
by amorphous calcium
phosphate formed on alkali and
heat-treated titanium surface
after immersion in S-SBF
solution for 1 h (a), and its
corresponding electron
diffraction pattern (b)
0 2 4 6 8 10
0
200
400
600
800
1000
Ca
(b)Cu
Ti
TiCa
SPSi ClCu
Inte
nsity
(a.
u.)
Energy (keV)
(a)Fig. 8 TEM image (a), and its
EDS spectrum (b) of calcium
titanate obtained from the layer
of alkali and heat-treated
titanium surface after
immersion in S-SBF solution
for 2.5 h
J Mater Sci: Mater Med (2010) 21:2035–2047 2041
123
creating Ti–OH groups and/or attracting Ca2? from the
solution to form a thin layer of calcium titanate. It should
be noted that Ti is highly reactive and that the solution is
slightly alkaline, facilitating the formation of Ti–OH on the
surface.
3.3 Transient stage and last period of the coating
process (from 2.5 to 24 h)
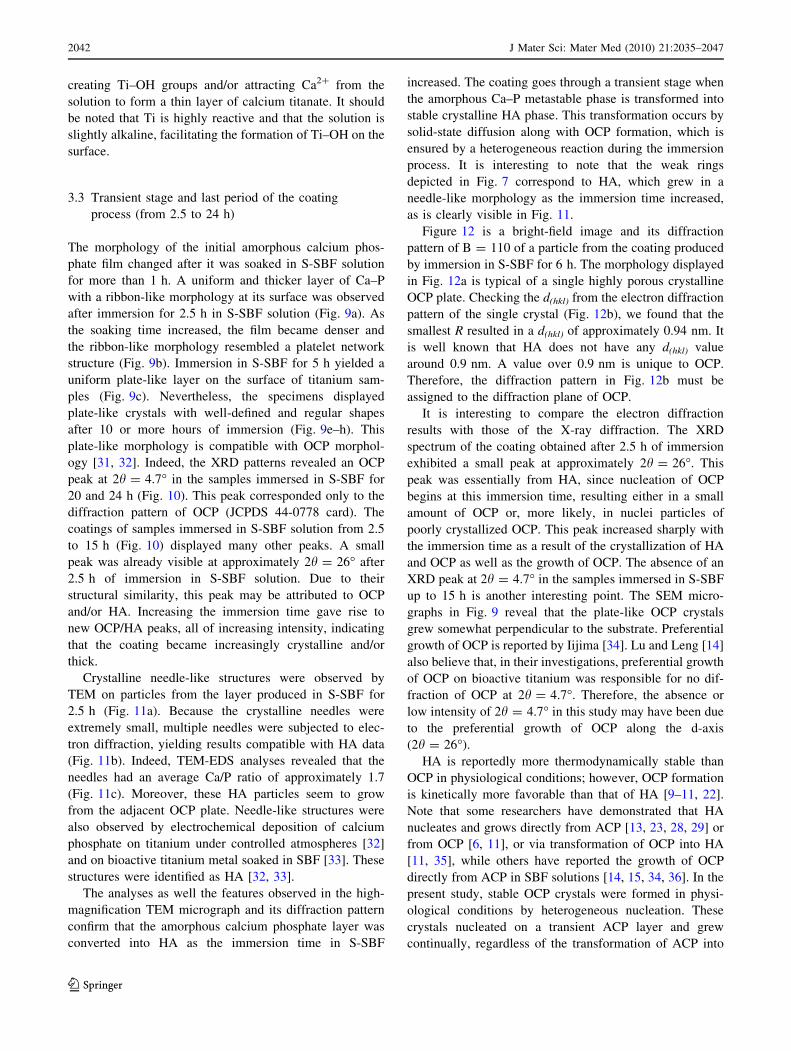
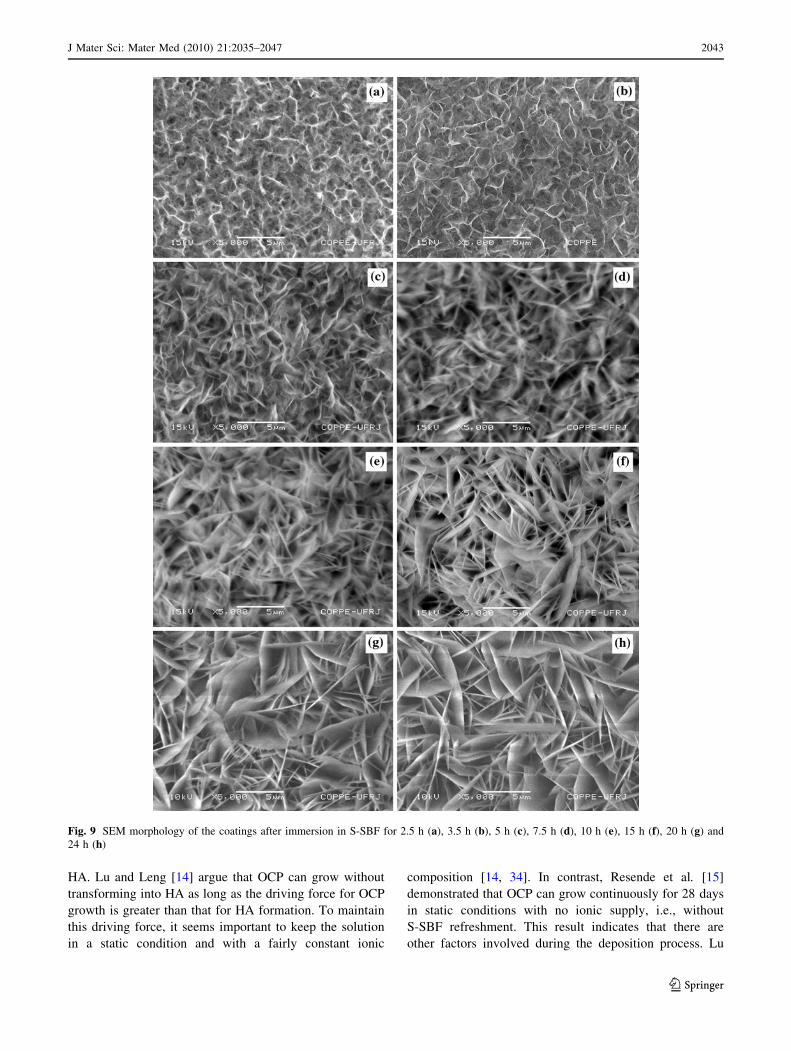
The morphology of the initial amorphous calcium phos-
phate film changed after it was soaked in S-SBF solution
for more than 1 h. A uniform and thicker layer of Ca–P
with a ribbon-like morphology at its surface was observed
after immersion for 2.5 h in S-SBF solution (Fig. 9a). As
the soaking time increased, the film became denser and
the ribbon-like morphology resembled a platelet network
structure (Fig. 9b). Immersion in S-SBF for 5 h yielded a
uniform plate-like layer on the surface of titanium sam-
ples (Fig. 9c). Nevertheless, the specimens displayed
plate-like crystals with well-defined and regular shapes
after 10 or more hours of immersion (Fig. 9e–h). This
plate-like morphology is compatible with OCP morphol-
ogy [31, 32]. Indeed, the XRD patterns revealed an OCP
peak at 2h = 4.7� in the samples immersed in S-SBF for
20 and 24 h (Fig. 10). This peak corresponded only to the
diffraction pattern of OCP (JCPDS 44-0778 card). The
coatings of samples immersed in S-SBF solution from 2.5
to 15 h (Fig. 10) displayed many other peaks. A small
peak was already visible at approximately 2h = 26� after
2.5 h of immersion in S-SBF solution. Due to their
structural similarity, this peak may be attributed to OCP
and/or HA. Increasing the immersion time gave rise to
new OCP/HA peaks, all of increasing intensity, indicating
that the coating became increasingly crystalline and/or
thick.
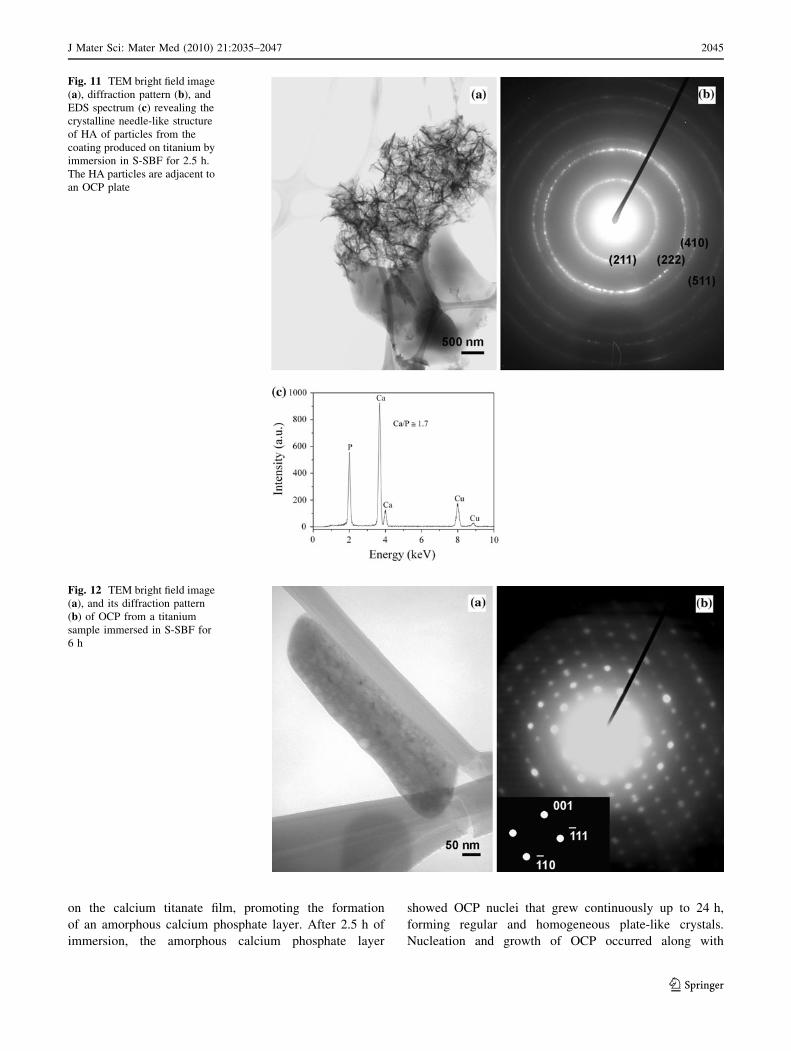
Crystalline needle-like structures were observed by
TEM on particles from the layer produced in S-SBF for
2.5 h (Fig. 11a). Because the crystalline needles were
extremely small, multiple needles were subjected to elec-
tron diffraction, yielding results compatible with HA data
(Fig. 11b). Indeed, TEM-EDS analyses revealed that the
needles had an average Ca/P ratio of approximately 1.7
(Fig. 11c). Moreover, these HA particles seem to grow
from the adjacent OCP plate. Needle-like structures were
also observed by electrochemical deposition of calcium
phosphate on titanium under controlled atmospheres [32]
and on bioactive titanium metal soaked in SBF [33]. These
structures were identified as HA [32, 33].
The analyses as well the features observed in the high-
magnification TEM micrograph and its diffraction pattern
confirm that the amorphous calcium phosphate layer was
converted into HA as the immersion time in S-SBF
increased. The coating goes through a transient stage when
the amorphous Ca–P metastable phase is transformed into
stable crystalline HA phase. This transformation occurs by
solid-state diffusion along with OCP formation, which is
ensured by a heterogeneous reaction during the immersion
process. It is interesting to note that the weak rings
depicted in Fig. 7 correspond to HA, which grew in a
needle-like morphology as the immersion time increased,
as is clearly visible in Fig. 11.
Figure 12 is a bright-field image and its diffraction
pattern of B = 110 of a particle from the coating produced
by immersion in S-SBF for 6 h. The morphology displayed
in Fig. 12a is typical of a single highly porous crystalline
OCP plate. Checking the d(hkl) from the electron diffraction
pattern of the single crystal (Fig. 12b), we found that the
smallest R resulted in a d(hkl) of approximately 0.94 nm. It
is well known that HA does not have any d(hkl) value
around 0.9 nm. A value over 0.9 nm is unique to OCP.
Therefore, the diffraction pattern in Fig. 12b must be
assigned to the diffraction plane of OCP.
It is interesting to compare the electron diffraction
results with those of the X-ray diffraction. The XRD
spectrum of the coating obtained after 2.5 h of immersion
exhibited a small peak at approximately 2h = 26�. This
peak was essentially from HA, since nucleation of OCP
begins at this immersion time, resulting either in a small
amount of OCP or, more likely, in nuclei particles of
poorly crystallized OCP. This peak increased sharply with
the immersion time as a result of the crystallization of HA
and OCP as well as the growth of OCP. The absence of an
XRD peak at 2h = 4.7� in the samples immersed in S-SBF
up to 15 h is another interesting point. The SEM micro-
graphs in Fig. 9 reveal that the plate-like OCP crystals
grew somewhat perpendicular to the substrate. Preferential
growth of OCP is reported by Iijima [34]. Lu and Leng [14]
also believe that, in their investigations, preferential growth
of OCP on bioactive titanium was responsible for no dif-
fraction of OCP at 2h = 4.7�. Therefore, the absence or
low intensity of 2h = 4.7� in this study may have been due
to the preferential growth of OCP along the d-axis
(2h = 26�).
HA is reportedly more thermodynamically stable than
OCP in physiological conditions; however, OCP formation
is kinetically more favorable than that of HA [9–11, 22].
Note that some researchers have demonstrated that HA
nucleates and grows directly from ACP [13, 23, 28, 29] or
from OCP [6, 11], or via transformation of OCP into HA
[11, 35], while others have reported the growth of OCP
directly from ACP in SBF solutions [14, 15, 34, 36]. In the
present study, stable OCP crystals were formed in physi-
ological conditions by heterogeneous nucleation. These
crystals nucleated on a transient ACP layer and grew
continually, regardless of the transformation of ACP into
2042 J Mater Sci: Mater Med (2010) 21:2035–2047
123
HA. Lu and Leng [14] argue that OCP can grow without
transforming into HA as long as the driving force for OCP
growth is greater than that for HA formation. To maintain
this driving force, it seems important to keep the solution
in a static condition and with a fairly constant ionic
composition [14, 34]. In contrast, Resende et al. [15]
demonstrated that OCP can grow continuously for 28 days
in static conditions with no ionic supply, i.e., without
S-SBF refreshment. This result indicates that there are
other factors involved during the deposition process. Lu
Fig. 9 SEM morphology of the coatings after immersion in S-SBF for 2.5 h (a), 3.5 h (b), 5 h (c), 7.5 h (d), 10 h (e), 15 h (f), 20 h (g) and
24 h (h)
J Mater Sci: Mater Med (2010) 21:2035–2047 2043
123
and Leng [9] made a theoretical study of calcium phos-
phate precipitation in SBF solutions, analyzing the effect of
interfacial energy on the nucleation rates of HA, OCP and
dicalcium phosphate (DCPD). Their calculations showed
that in physiological conditions the nucleation rate of OCP
is always higher than that of HA, and the nucleation rate of
DCPD is highest when DCPD precipitation is thermody-
namically possible. Their findings are in agreement with
those of Nelson et al. [37], who claimed that the nucleation
of OCP is favored energetically because the surface energy
of HA is higher than that of OCP. Another factor that might
affect the OCP formation is the concentration of HCO3-.
Lu and Leng [9] suggested that higher concentrations of
HCO3- exclude apatite formation because nucleation of
OCP is energetically more favorable than that of apatite in
such conditions. Their analyses are based on the studies of
Iijima [34], who demonstrated that in physiological envi-
ronments, larger amounts of carbonate ions promote the
nucleation of OCP instead of HA. Lu and Leng [9] used
revised SBF solution, which contains large amounts of
HCO3- (similar to that of human plasma), and detected
OCP on bioactive titanium by electron diffraction. How-
ever, the solution used in this study has smaller amounts of
HCO3- (identical to that of conventional SBF solution),
and we found OCP. Moreover, it is well known that the use
of conventional SBF solution leads to apatite formation on
bioactive titanium. These results suggest that the driving
force for OCP formation depends not only on the HCO3-
concentration, but also on the other ions present in the
solution. In fact, all the ions in the solution may play an
important role in the kinetics of Ca–P phase formation and
must be investigated in order to fully address this issue.
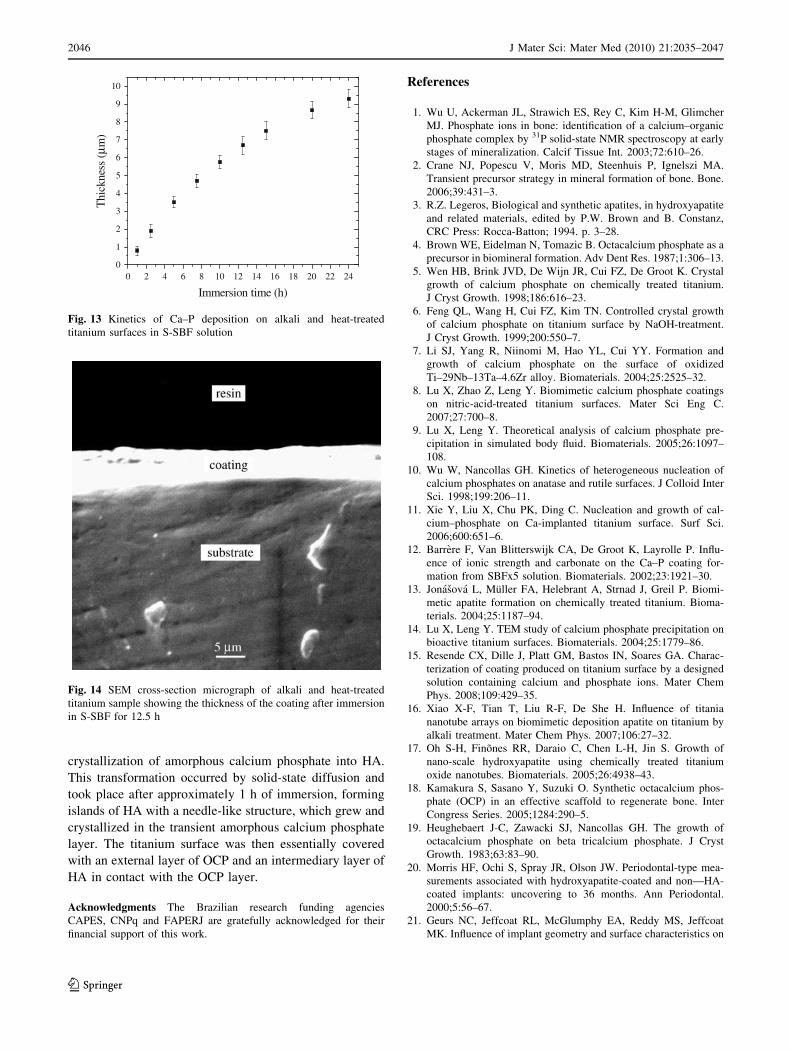
The kinetics of Ca–P deposition was evaluated by
measuring the thickness of the coating after various periods
of immersion in S-SBF solution. The thicknesses were
measured by SEM and are presented in Fig. 13. The
average values reveal a parabolic behavior typical of matter
transport. It is more likely that the Ca–P deposition process
is controlled by an interfacial reaction in the early period of
the deposition and then by matter transport in the solution,
i.e., by Ca–P diffusion in the aqueous solution. Figure 13
combined with Fig. 9 also emphasizes how rapid Ca/P
deposition in S-SBF is compared with deposition in con-
ventional SBF [15]. The formation of a uniform layer of
apatite [15] in Kokubo solution takes at least 7–14 days,
while a couple of hours in S-SBF solution suffices to form
a homogeneous film of amorphous calcium phosphate and
no more than 5 h to coat the titanium surface with an even
layer of OCP. This means that S-SBF solution can radically
reduce the time required to coat bioactive materials and
represents a significant advance in the biomimetic-like
deposition process. As can be seen in Fig. 13, the samples
immersed in S-SBF for 2.5, 5 and 12.5 h had a thickness of
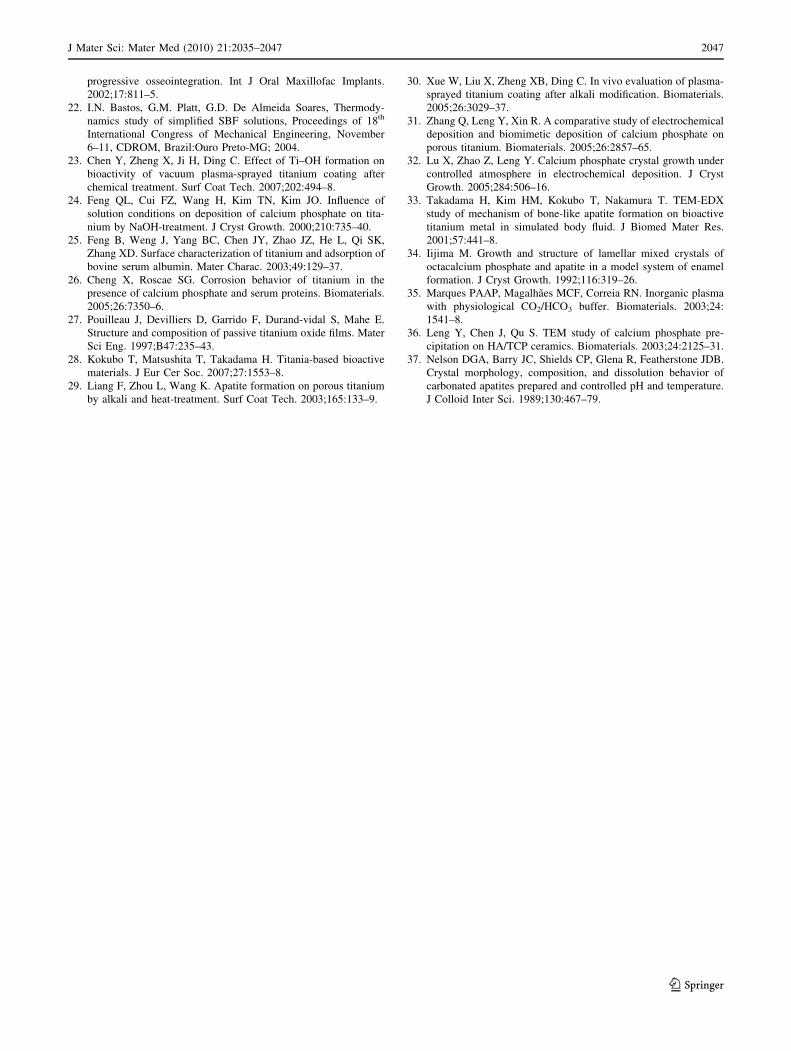
approximately 1.8, 3.5 and 6.7 lm, respectively. Figure 14
is a representative SEM cross-section image of the coating
obtained after immersion in S-SBF for 12.5 h. Note that the
layer formed during the deposition process is bound to the
substrate without forming a distinct interface. This suggests
that the deposited Ca–P penetrates the pores of the
underlying layers, rendering them more compact. Fig-
ure 4b indicates that the gel-like layer of ACP penetrated
into the pores created by the NaOH attack.
4 Conclusions
This study contributes to a better understanding of the
kinetics and mechanism of octacalcium phosphate deposi-
tion using a simplified simulated body fluid. The alkali and
heat treatments produced a sodium titanate layer poorly
crystallized. Heating also promoted the formation of
crystalline anatase and rutile in the sodium titanate layer
and at the interface with the metal. These changes on the
titanium surface are suitable for Ca–P deposition in the
simplified simulated body fluid solution, regardless of
the formation of barium sodium titanate, which has no
effect on the formation of the coating. This solution pro-
motes rapid Ca–P deposition, resulting in a homogeneous
plate-like film of OCP after 5 h of immersion. Calcium
precipitates first, producing a thin layer of calcium titanate
in the early stages of the deposition process. The process
continues with the precipitation of calcium and phosphate
5 10 15 20 25 30 35 40 45 50 55
2.5h
2θ (degree)
5h
10h
T
15h
AA
HT
TO
O/H
O O T OOO 24h
20h
H
Fig. 10 XRD patterns of alkali and heat-treated titanium surfaces
after immersion in S-SBF solution from 2.5 to 24 h. T titanium, OOCP, H HA and A anatase
2044 J Mater Sci: Mater Med (2010) 21:2035–2047
123
on the calcium titanate film, promoting the formation
of an amorphous calcium phosphate layer. After 2.5 h of
immersion, the amorphous calcium phosphate layer
showed OCP nuclei that grew continuously up to 24 h,
forming regular and homogeneous plate-like crystals.
Nucleation and growth of OCP occurred along with
Fig. 11 TEM bright field image
(a), diffraction pattern (b), and
EDS spectrum (c) revealing the
crystalline needle-like structure
of HA of particles from the
coating produced on titanium by
immersion in S-SBF for 2.5 h.
The HA particles are adjacent to
an OCP plate
Fig. 12 TEM bright field image
(a), and its diffraction pattern
(b) of OCP from a titanium
sample immersed in S-SBF for
6 h
J Mater Sci: Mater Med (2010) 21:2035–2047 2045
123
crystallization of amorphous calcium phosphate into HA.
This transformation occurred by solid-state diffusion and
took place after approximately 1 h of immersion, forming
islands of HA with a needle-like structure, which grew and
crystallized in the transient amorphous calcium phosphate
layer. The titanium surface was then essentially covered
with an external layer of OCP and an intermediary layer of
HA in contact with the OCP layer.
Acknowledgments The Brazilian research funding agencies
CAPES, CNPq and FAPERJ are gratefully acknowledged for their
financial support of this work.
References
1. Wu U, Ackerman JL, Strawich ES, Rey C, Kim H-M, Glimcher
MJ. Phosphate ions in bone: identification of a calcium–organic
phosphate complex by 31P solid-state NMR spectroscopy at early
stages of mineralization. Calcif Tissue Int. 2003;72:610–26.
2. Crane NJ, Popescu V, Moris MD, Steenhuis P, Ignelszi MA.
Transient precursor strategy in mineral formation of bone. Bone.
2006;39:431–3.
3. R.Z. Legeros, Biological and synthetic apatites, in hydroxyapatite
and related materials, edited by P.W. Brown and B. Constanz,
CRC Press: Rocca-Batton; 1994. p. 3–28.
4. Brown WE, Eidelman N, Tomazic B. Octacalcium phosphate as a
precursor in biomineral formation. Adv Dent Res. 1987;1:306–13.
5. Wen HB, Brink JVD, De Wijn JR, Cui FZ, De Groot K. Crystal
growth of calcium phosphate on chemically treated titanium.
J Cryst Growth. 1998;186:616–23.
6. Feng QL, Wang H, Cui FZ, Kim TN. Controlled crystal growth
of calcium phosphate on titanium surface by NaOH-treatment.
J Cryst Growth. 1999;200:550–7.
7. Li SJ, Yang R, Niinomi M, Hao YL, Cui YY. Formation and
growth of calcium phosphate on the surface of oxidized
Ti–29Nb–13Ta–4.6Zr alloy. Biomaterials. 2004;25:2525–32.
8. Lu X, Zhao Z, Leng Y. Biomimetic calcium phosphate coatings
on nitric-acid-treated titanium surfaces. Mater Sci Eng C.
2007;27:700–8.
9. Lu X, Leng Y. Theoretical analysis of calcium phosphate pre-
cipitation in simulated body fluid. Biomaterials. 2005;26:1097–
108.
10. Wu W, Nancollas GH. Kinetics of heterogeneous nucleation of
calcium phosphates on anatase and rutile surfaces. J Colloid Inter
Sci. 1998;199:206–11.
11. Xie Y, Liu X, Chu PK, Ding C. Nucleation and growth of cal-
cium–phosphate on Ca-implanted titanium surface. Surf Sci.
2006;600:651–6.
12. Barrere F, Van Blitterswijk CA, De Groot K, Layrolle P. Influ-
ence of ionic strength and carbonate on the Ca–P coating for-
mation from SBFx5 solution. Biomaterials. 2002;23:1921–30.
13. Jonasova L, Muller FA, Helebrant A, Strnad J, Greil P. Biomi-
metic apatite formation on chemically treated titanium. Bioma-
terials. 2004;25:1187–94.
14. Lu X, Leng Y. TEM study of calcium phosphate precipitation on
bioactive titanium surfaces. Biomaterials. 2004;25:1779–86.
15. Resende CX, Dille J, Platt GM, Bastos IN, Soares GA. Charac-
terization of coating produced on titanium surface by a designed
solution containing calcium and phosphate ions. Mater Chem
Phys. 2008;109:429–35.
16. Xiao X-F, Tian T, Liu R-F, De She H. Influence of titania
nanotube arrays on biomimetic deposition apatite on titanium by
alkali treatment. Mater Chem Phys. 2007;106:27–32.
17. Oh S-H, Finones RR, Daraio C, Chen L-H, Jin S. Growth of
nano-scale hydroxyapatite using chemically treated titanium
oxide nanotubes. Biomaterials. 2005;26:4938–43.
18. Kamakura S, Sasano Y, Suzuki O. Synthetic octacalcium phos-
phate (OCP) in an effective scaffold to regenerate bone. Inter
Congress Series. 2005;1284:290–5.
19. Heughebaert J-C, Zawacki SJ, Nancollas GH. The growth of
octacalcium phosphate on beta tricalcium phosphate. J Cryst
Growth. 1983;63:83–90.
20. Morris HF, Ochi S, Spray JR, Olson JW. Periodontal-type mea-
surements associated with hydroxyapatite-coated and non—HA-
coated implants: uncovering to 36 months. Ann Periodontal.
2000;5:56–67.
21. Geurs NC, Jeffcoat RL, McGlumphy EA, Reddy MS, Jeffcoat
MK. Influence of implant geometry and surface characteristics on
0 2 4 6 8 10 12 14 16 18 20 22 240
1
2
3
4
5
6
7
8
9
10
Thi
ckne
ss (
μm)
Immersion time (h)
Fig. 13 Kinetics of Ca–P deposition on alkali and heat-treated
titanium surfaces in S-SBF solution
Fig. 14 SEM cross-section micrograph of alkali and heat-treated
titanium sample showing the thickness of the coating after immersion
in S-SBF for 12.5 h
2046 J Mater Sci: Mater Med (2010) 21:2035–2047
123
progressive osseointegration. Int J Oral Maxillofac Implants.
2002;17:811–5.
22. I.N. Bastos, G.M. Platt, G.D. De Almeida Soares, Thermody-
namics study of simplified SBF solutions, Proceedings of 18th
International Congress of Mechanical Engineering, November
6–11, CDROM, Brazil:Ouro Preto-MG; 2004.
23. Chen Y, Zheng X, Ji H, Ding C. Effect of Ti–OH formation on
bioactivity of vacuum plasma-sprayed titanium coating after
chemical treatment. Surf Coat Tech. 2007;202:494–8.
24. Feng QL, Cui FZ, Wang H, Kim TN, Kim JO. Influence of
solution conditions on deposition of calcium phosphate on tita-
nium by NaOH-treatment. J Cryst Growth. 2000;210:735–40.
25. Feng B, Weng J, Yang BC, Chen JY, Zhao JZ, He L, Qi SK,
Zhang XD. Surface characterization of titanium and adsorption of
bovine serum albumin. Mater Charac. 2003;49:129–37.
26. Cheng X, Roscae SG. Corrosion behavior of titanium in the
presence of calcium phosphate and serum proteins. Biomaterials.
2005;26:7350–6.
27. Pouilleau J, Devilliers D, Garrido F, Durand-vidal S, Mahe E.
Structure and composition of passive titanium oxide films. Mater
Sci Eng. 1997;B47:235–43.
28. Kokubo T, Matsushita T, Takadama H. Titania-based bioactive
materials. J Eur Cer Soc. 2007;27:1553–8.
29. Liang F, Zhou L, Wang K. Apatite formation on porous titanium
by alkali and heat-treatment. Surf Coat Tech. 2003;165:133–9.
30. Xue W, Liu X, Zheng XB, Ding C. In vivo evaluation of plasma-
sprayed titanium coating after alkali modification. Biomaterials.
2005;26:3029–37.
31. Zhang Q, Leng Y, Xin R. A comparative study of electrochemical
deposition and biomimetic deposition of calcium phosphate on
porous titanium. Biomaterials. 2005;26:2857–65.
32. Lu X, Zhao Z, Leng Y. Calcium phosphate crystal growth under
controlled atmosphere in electrochemical deposition. J Cryst
Growth. 2005;284:506–16.
33. Takadama H, Kim HM, Kokubo T, Nakamura T. TEM-EDX
study of mechanism of bone-like apatite formation on bioactive
titanium metal in simulated body fluid. J Biomed Mater Res.
2001;57:441–8.
34. Iijima M. Growth and structure of lamellar mixed crystals of
octacalcium phosphate and apatite in a model system of enamel
formation. J Cryst Growth. 1992;116:319–26.
35. Marques PAAP, Magalhaes MCF, Correia RN. Inorganic plasma
with physiological CO2/HCO3 buffer. Biomaterials. 2003;24:
1541–8.
36. Leng Y, Chen J, Qu S. TEM study of calcium phosphate pre-
cipitation on HA/TCP ceramics. Biomaterials. 2003;24:2125–31.
37. Nelson DGA, Barry JC, Shields CP, Glena R, Featherstone JDB.
Crystal morphology, composition, and dissolution behavior of
carbonated apatites prepared and controlled pH and temperature.
J Colloid Inter Sci. 1989;130:467–79.
J Mater Sci: Mater Med (2010) 21:2035–2047 2047
123
Related Documents