Nuclear Astrophysics 1 Lecture 3 Thurs. Nov. 3, 2011 Prof. Shawn Bishop, Office 2013, Ex. 12437 www.nucastro.ph.tum .de

Welcome message from author
This document is posted to help you gain knowledge. Please leave a comment to let me know what you think about it! Share it to your friends and learn new things together.
Transcript

Nuclear Astrophysics
1
Lecture 3Thurs. Nov. 3, 2011
Prof. Shawn Bishop, Office 2013, Ex. 12437
www.nucastro.ph.tum.de

2
Summary of Results Thus Far

If species “z” can be ionized, the number of particles can be where is the number of free particles produced by species “z” (nucleus + free electrons). If fully ionized, and
Mass fraction, in volume V, of species “z” is just And clearly,
Alternative expressions for Pressures
3
is the number of atoms of atomic species with atomic number “z” in the volume V
Mass density of each species is just: where are the atomic mass of species “z” and Avogadro’s number, respectively
Collect the algebra to write
And so we have for :

4
The mean molecular weight is defined by the quantity:
We can write it out as:
is the average of for atomic species Z > 2
For atomic species heavier than helium, average atomic weight is and if fullyionized,
Fully ionized gas:
Same game can be played for electrons:

Temp. vs Density Plane
5
Rela
tivis
tic
Non
-Rel
ativi
stic
g cm-3

Thermodynamics of the Gas
6
1st Law of Thermodynamics:
Thermal energy of the system (heat)
Total energy of the system
Assume that , then
Substitute into dQ:
Heat capacity at constant volume:
Heat capacity at constant pressure:
We finally have:

7
For an ideal gas:
Therefore,
And,
So,
Let’s go back to first law, now, for ideal gas:
using
For an isentropic change in the gas, dQ = 0
This leads to, after integration of the above with dQ = 0, and

Use
8
First Law for isentropic changes:
Take differentials of
but
Finally
Because is constant, we can integrate the last equation over the star:
Total energy of Star is gravitational binding energy and internal energy U
4/3 if star is to remain bound! (Ideal gas: = 5/3, so it’s safe)

AGB Pulsation
9
University of Minnesota's Laboratory for Computational Science & Engineering (LCSE)

Carinae (Southern Hemisphere)
Hubble Space Telescope10
• Eta Carinae: star of ~ 100 Solar masses • Radiation pressure dominant over gas pressure• Radiation luminosity is tearing star apart• A case where < 4/3 in most regions of the star!

Polytrope: First Stellar Structure Model
11
We have seen, under adiabatic/isentropic conditions that:
Deg. and Rel. Deg. electron gas
Lane-Emden Equation results:
Rearrange
Differentiate:
Let’s go back to hydrostatic equilibrium equation:

12
Motivated by these P- relationships, the polytrope model adopts a pressure profile:
And the density function is given by where is a dimensionless function of radial coordinate .
Put these into the Lane-Emden equation:
Clean it up by setting and
Finally, we have:

13
Boundary conditions for function : ,
Homework: Show that the case n=0, solution to the Lane-Emden equation is:
Mass:

Polytrope Solutions
14
n = 0
n = 2n = 1
n = 5
n = 3n = 4

Case n = 3: Relativistic Deg. Electron Gas and White Dwarfs
15
Therefore, we have:

16
When n = 3
Substitute in for K from previous page:
Where is in grams.
This is Chandrasekhar’s mass relation for White Dwarf’s, and now you’ve seen how it is derived!

17
C = 48%, O = 48%, Ne = 2%
Chandra X-ray Spectrum of WD H1504+65
What is a mass estimate of this Oxygen-Neon WD?

18
Central Pressure: Use equations on page 29 for and , along with and the result for Mass on page 30.
Exercise for student: Show that the ratio of mean to central density is (for any index n):
Exercise for student: show that
For n = 3:
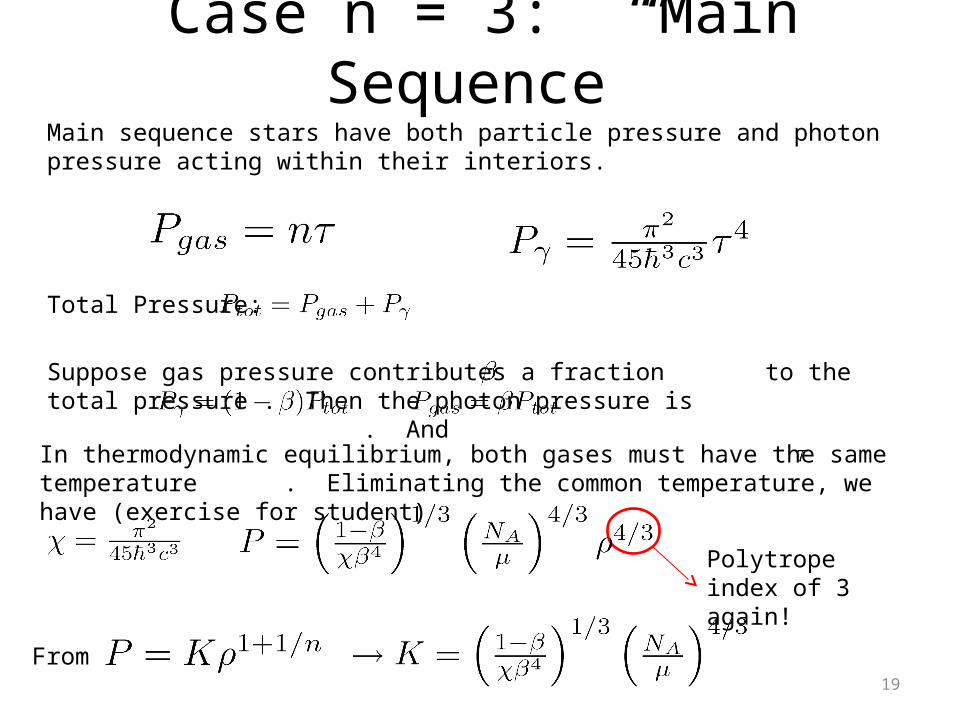
Suppose gas pressure contributes a fraction to the total pressure . Then the photon pressure is . And
Total Pressure:
Case n = 3: “Main Sequence”
19
Main sequence stars have both particle pressure and photon pressure acting within their interiors.
In thermodynamic equilibrium, both gases must have the same temperature . Eliminating the common temperature, we have (exercise for student)
Polytrope index of 3 again!
From

20
This value of K can be used in mass expression (page 13) to determine Main sequence masses. For you to show that the Mass is given by:
Finally, let’s get the central temperature of this Main Sequence model:
(From previous page )

21
In terms of the mean density, using from page 35and table on page 31:

22
Homework: A certain star has the following properties:
Using these values, graph below, and the previous equation, estimate the central temperature using the previous result for the polytrope Standard Model.
Parametric plot of versus
Refer to page 37 for the final mass formula of the Main Sequence Star model to understand why the plot is parameterized. (We do not Isolate in the mass formula. We isolate and plot its values for values of ) And this is what we see in the graph.
Related Documents