NREM sleep alterations in narcolepsy/cataplexy Raffaele Ferri a, * , Silvia Miano a , Oliviero Bruni b , Jitka Vankova c , Sona Nevsimalova c , Stefano Vandi d , Pasquale Montagna d , Luigi Ferini-Strambi e , Giuseppe Plazzi d a Department of Neurology I.C., Sleep Research Centre, Oasi Institute (IRCCS), via Conte Ruggero, 73, Troina, Enna 94018, Italy b Centre for Pediatric Sleep Disorders, Department of Developmental Neurology and Psychiatry, University of Rome “La Sapienza”, Rome, Italy c Department of Neurology, 1 st Medical Faculty, Charles University, Prague, Czech Republic d Department of Neurological Sciences, University of Bologna, Bologna, Italy e Department of Neurology, Sleep Disorders Center, H San Raffaele Scientific Institute, Universita ` Vita-Salute San Raffaele, Milan, Italy Accepted 4 August 2005 Abstract Objective: NREM sleep patterns of narcoleptic patients with cataplexy were studied, focusing on their sleep ‘microstructure’, by analyzing the cyclic alternating pattern (CAP). Methods: Forty-nine HLA DQB1*0602-positive patients with narcolepsy/cataplexy (32 men and 17 women, aged 18–46 years) were included together with 37 age-matched normal controls. Each subject underwent one polysomnographic night recording after an adaptation night. Sleep stages were scored following standard criteria and CAP A phases were detected and classified into 3 subtypes (A1, A2, and A3). Power spectra for frequencies between 0.5 and 25 Hz were obtained for each CAP condition, separately in sleep stage 2 and SWS. Results: Narcoleptic patients displayed reduced total CAP rate. A selective reduction in the number of A1 subtypes/hour and a reduced A3 index were found in narcoleptics who had also a smaller average number of CAP sequences. Narcoleptic patients had higher power spectra for fast frequencies mostly during SWS, while REM sleep power spectra showed significantly higher power density for frequency bins 0.5–1.5, 8.5–9.5, and 17.5–25 Hz. Similarly, CAP A1 subtypes and NCAP epochs during SWS displayed significantly higher power density for fast frequency bins. Conclusions: The main finding of this study is that the occurrence of the A1 CAP subtypes is impaired during NREM sleep in narcoleptic patients. Thus, narcolepsy seems to be accompanied not only by alterations of REM but also NREM sleep which is subtly but significantly impaired, as reflected by CAP and the corresponding EEG spectral analysis. Significance: Our findings might indicate that in narcolepsy very-slow oscillation processes less effective than normal might be present, with a subtly impaired capability of grouping the other sleep EEG activities; this aspect deserves further insight in order to obtain a better understanding of its functional meaning. q 2005 International Federation of Clinical Neurophysiology. Published by Elsevier Ireland Ltd. All rights reserved. Keywords: Narcolepsy; NREM sleep; Cyclic alternating pattern; EEG spectral analysis; Sleep microstructure 1. Introduction Narcolepsy with cataplexy is a homogeneous (Sturze- negger and Bassetti, 2004), disabling neurological disease linked to the HLA-DQB1*0602 haplotype (Mignot et al., 1994), affecting approximately one in 2000 individuals. It is characterized by excessive daytime sleepiness (EDS), cataplexy, sleep paralysis, hypnagogic hallucinations, and disturbed nocturnal sleep (American Academy of Sleep Medicine, 2001) and is related to a severe orexin deficiency (hypocretin) (Dauvilliers et al., 2003; Mignot et al., 2002; Nishino et al., 2000; Ripley et al., 2001). An autoimmune mechanism has been implicated on the basis of the strong association with the HLA-DQB1*0602 (Mignot et al., 1995). This was recently supported by pathological findings and evidence of functional cholin- ergic autoantibodies in the serum of narcolepsy patients (Smith et al., 2004). Clinical Neurophysiology 116 (2005) 2675–2684 www.elsevier.com/locate/clinph 1388-2457/$30.00 q 2005 International Federation of Clinical Neurophysiology. Published by Elsevier Ireland Ltd. All rights reserved. doi:10.1016/j.clinph.2005.08.004 * Corresponding author. Tel.: C39 0935 653966; fax: C39 0935 936694. E-mail address: [email protected] (R. Ferri).

Welcome message from author
This document is posted to help you gain knowledge. Please leave a comment to let me know what you think about it! Share it to your friends and learn new things together.
Transcript
NREM sleep alterations in narcolepsy/cataplexy
Raffaele Ferria,*, Silvia Mianoa, Oliviero Brunib, Jitka Vankovac, Sona Nevsimalovac,
Stefano Vandid, Pasquale Montagnad, Luigi Ferini-Strambie, Giuseppe Plazzid
aDepartment of Neurology I.C., Sleep Research Centre, Oasi Institute (IRCCS), via Conte Ruggero, 73, Troina, Enna 94018, ItalybCentre for Pediatric Sleep Disorders, Department of Developmental Neurology and Psychiatry, University of Rome “La Sapienza”, Rome, Italy
cDepartment of Neurology, 1st Medical Faculty, Charles University, Prague, Czech RepublicdDepartment of Neurological Sciences, University of Bologna, Bologna, Italy
eDepartment of Neurology, Sleep Disorders Center, H San Raffaele Scientific Institute, Universita Vita-Salute San Raffaele, Milan, Italy
Accepted 4 August 2005
Abstract
Objective: NREM sleep patterns of narcoleptic patients with cataplexy were studied, focusing on their sleep ‘microstructure’, by analyzing
the cyclic alternating pattern (CAP).
Methods: Forty-nine HLA DQB1*0602-positive patients with narcolepsy/cataplexy (32 men and 17 women, aged 18–46 years) were
included together with 37 age-matched normal controls. Each subject underwent one polysomnographic night recording after an adaptation
night. Sleep stages were scored following standard criteria and CAP A phases were detected and classified into 3 subtypes (A1, A2, and A3).
Power spectra for frequencies between 0.5 and 25 Hz were obtained for each CAP condition, separately in sleep stage 2 and SWS.
Results: Narcoleptic patients displayed reduced total CAP rate. A selective reduction in the number of A1 subtypes/hour and a reduced A3
index were found in narcoleptics who had also a smaller average number of CAP sequences. Narcoleptic patients had higher power spectra
for fast frequencies mostly during SWS, while REM sleep power spectra showed significantly higher power density for frequency bins
0.5–1.5, 8.5–9.5, and 17.5–25 Hz. Similarly, CAP A1 subtypes and NCAP epochs during SWS displayed significantly higher power density
for fast frequency bins.
Conclusions: The main finding of this study is that the occurrence of the A1 CAP subtypes is impaired during NREM sleep in narcoleptic
patients. Thus, narcolepsy seems to be accompanied not only by alterations of REM but also NREM sleep which is subtly but significantly
impaired, as reflected by CAP and the corresponding EEG spectral analysis.
Significance: Our findings might indicate that in narcolepsy very-slow oscillation processes less effective than normal might be present, with
a subtly impaired capability of grouping the other sleep EEG activities; this aspect deserves further insight in order to obtain a better
understanding of its functional meaning.
q 2005 International Federation of Clinical Neurophysiology. Published by Elsevier Ireland Ltd. All rights reserved.
Keywords: Narcolepsy; NREM sleep; Cyclic alternating pattern; EEG spectral analysis; Sleep microstructure
1. Introduction
Narcolepsy with cataplexy is a homogeneous (Sturze-
negger and Bassetti, 2004), disabling neurological disease
linked to the HLA-DQB1*0602 haplotype (Mignot et al.,
1994), affecting approximately one in 2000 individuals. It
is characterized by excessive daytime sleepiness (EDS),
1388-2457/$30.00 q 2005 International Federation of Clinical Neurophysiology.
doi:10.1016/j.clinph.2005.08.004
* Corresponding author. Tel.: C39 0935 653966; fax: C39 0935 936694.
E-mail address: [email protected] (R. Ferri).
cataplexy, sleep paralysis, hypnagogic hallucinations, and
disturbed nocturnal sleep (American Academy of Sleep
Medicine, 2001) and is related to a severe orexin
deficiency (hypocretin) (Dauvilliers et al., 2003; Mignot
et al., 2002; Nishino et al., 2000; Ripley et al., 2001). An
autoimmune mechanism has been implicated on the basis
of the strong association with the HLA-DQB1*0602
(Mignot et al., 1995). This was recently supported by
pathological findings and evidence of functional cholin-
ergic autoantibodies in the serum of narcolepsy patients
(Smith et al., 2004).
Clinical Neurophysiology 116 (2005) 2675–2684
www.elsevier.com/locate/clinph
Published by Elsevier Ireland Ltd. All rights reserved.
R. Ferri et al. / Clinical Neurophysiology 116 (2005) 2675–26842676
Hypocretin deficiency accounts for REM sleep abnorm-
alities, sleep onset REM periods and dissociated REM sleep
manifestations of cataplexy in experimental animals
(Bourgin et al., 2000; Burlet et al., 2002; Hungs and
Mignot, 2001), but also for non-rapid eye movement
(NREM) sleep abnormalities (Mochizuki et al., 2004).
This paper addresses the NREM sleep patterns of adult
and young adult narcoleptic patients with cataplexy,
focusing not only on conventional sleep parameters, but
also on sleep ‘microstructure’ by analysng the cyclic
alternating pattern (CAP) (Terzano et al., 1985, 1988).
2. Subjects and methods
2.1. Subjects
Forty-nine patients with narcolepsy (32 men with mean
age 30.1 years, SD 6.53, and 17 women with mean age 26.2
years, SD 4.85) were included in this study. The diagnosis
was based on clinical and laboratory criteria. All patients
had at least two sleep onset REM-sleep episodes upon the
multiple sleep latency test (MSLT), cataplexy and EDS,
reflected by a mean sleep latency at the MSLT of 5 min or
less, and all had the human leukocyte antigen (HLA)
DQB1*0602. None of the patients was taking drugs at the
time of recording.
Thirty-seven normal subjects (14 men with mean age
29.0 years, SD 4.12, and 23 women with mean age 28.8
years, SD 8.50) served as a control group. None had any
physical, neurological or psychiatric disorder or history of
sleep problems and none was taking medication at the time
of recording. The multifactor ANOVA of age per gender
and group did not disclose significant differences between
the 4 subgroups of subjects selected.
All patients and subjects gave their informed consent
according to the Declaration of Helsinki and the study was
approved by the Ethics Committee of the Oasi Institute
(Troina, Italy).
2.2. Polygraphic sleep recording
Each subject underwent one polysomnographic night
recording after an adaptation night, carried out in a sleep
laboratory with controlled sound (noise level to a maximum
of 30 dB). Subjects were not allowed to have drinks
containing caffeine during the afternoon preceding the
recording. Light-out time was based on the individual
habitual bed time and ranged between 09:30 and 11:30 p.m.;
subjects were allowed to sleep until spontaneous awakening
in the morning.
The following parameters were included in the poly-
somnographic study: EEG (at least 3 channels, one frontal,
one central and one occipital, referred to the contralateral
earlobe); electrooculogram (electrodes placed 1 cm above
the right outer cantus and 1 cm below the left outer cantus
and referred to A1), electromyogram (EMG) of the
submentalis muscle, EMG of the right and left tibialis
anterior muscle, and ECG (one derivation). Sleep signals
were sampled at 128 or 256 Hz and stored on hard disk in
European data format (EDF, see Kemp et al., 1992 for
details) for further analysis. EEG signals in particular were
digitally bandpass filtered at 0.1–50 Hz, 12-bit A/D
precision.
2.3. Sleep scoring
Sleep stages were scored following standard criteria
(Rechtschaffen and Kales, 1968) on 30-s epochs. Sub-
sequently, each CAP A phase was detected in each
recording on the C3/A2 or C4/A1 derivation, based on
the availability in the polysomnographic recording and on
the absence of long periods with artifacts; the side of this
EEG channel should not influence the detection of CAP
because CAP components have been shown to map
symmetrically over the scalp (Ferri et al., 2005b). All
CAP phases during NREM sleep were detected and
classified into 3 subtypes (A1, A2, and A3) according to
Terzano et al. (2001). As an example, Fig. 1 shows one
example of the different CAP A phases and the average
spectra obtained from these phases by means of a method
similar to that described below.
CAP was detected by the sleep analysis software
Hypnolab 1.2 (SWS Soft, Italy) which allows computer-
assisted detection of CAP A phase subtypes. With this
software, detection is performed by means of a human-
supervised automatic approach controlled by the scorer. The
performances of this system have been evaluated and
validated (Ferri et al., 2005a), but for this study the scorer
visually edited the detections proposed by the automatic
analysis, before the computation of the various CAP
parameters which were automatically generated by the
same software and used for statistical analysis.
2.4. Selection of EEG mini-epochs and power spectra
computation
The same channel used for the detection of CAP A
phases (C3/A2 or C4/A1), in each subject was divided into
two-second mini-epochs; as an example, a sleep recording
lasting 8 h was divided into 14,400 mini-epochs (8 h!60 min!60 s/2Z14,400). Each mini-epoch was assigned to
a sleep stage based on the sleep scoring previously
performed, for the analysis of power spectra of the different
sleep stages. Afterwards, only mini-epochs from sleep stage
2 and sleep stages 3 or 4 (SWS) were considered to assign
them to a CAP condition (based on the CAP detection
carried out previously); in particular, the following CAP
conditions were assigned: A1, A2, A3, and NCAP.
Additionally, CAP B phases were also indicated as B1 (B
phase following A1), B2 (B phase following A2) and B3
(B phase following A1). Only mini-epochs which
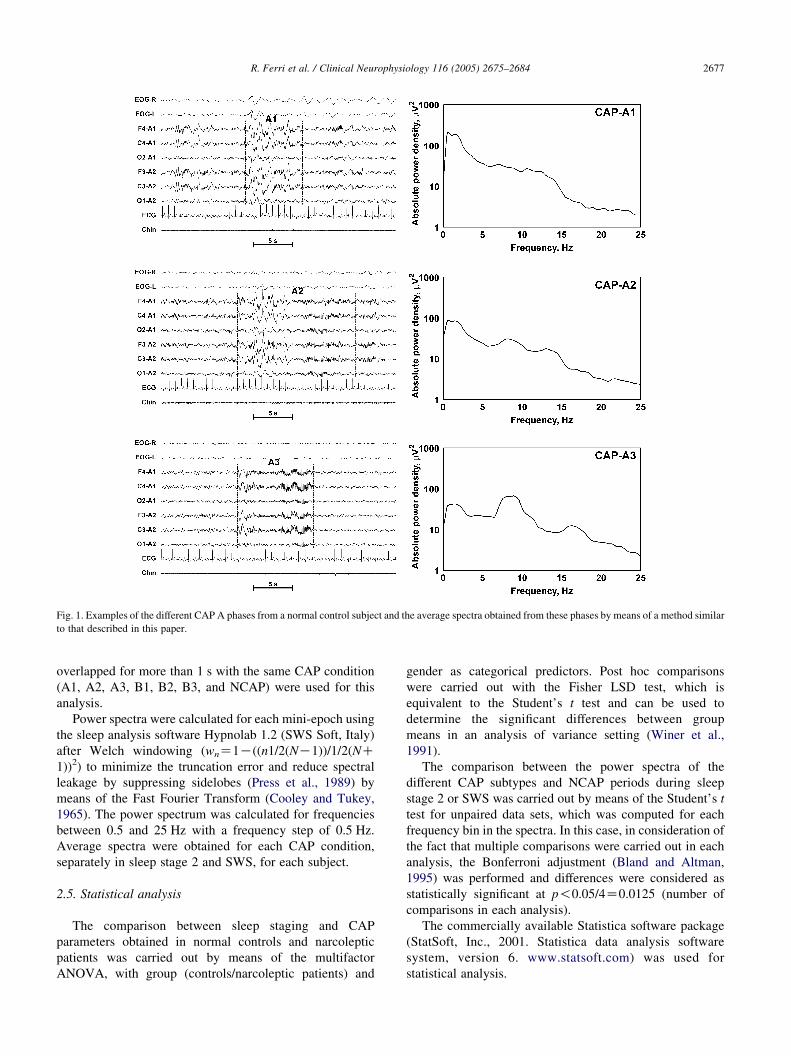
Fig. 1. Examples of the different CAP A phases from a normal control subject and the average spectra obtained from these phases by means of a method similar
to that described in this paper.
R. Ferri et al. / Clinical Neurophysiology 116 (2005) 2675–2684 2677
overlapped for more than 1 s with the same CAP condition
(A1, A2, A3, B1, B2, B3, and NCAP) were used for this
analysis.
Power spectra were calculated for each mini-epoch using
the sleep analysis software Hypnolab 1.2 (SWS Soft, Italy)
after Welch windowing (wnZ1K((n1/2(NK1))/1/2(NC1))2) to minimize the truncation error and reduce spectral
leakage by suppressing sidelobes (Press et al., 1989) by
means of the Fast Fourier Transform (Cooley and Tukey,
1965). The power spectrum was calculated for frequencies
between 0.5 and 25 Hz with a frequency step of 0.5 Hz.
Average spectra were obtained for each CAP condition,
separately in sleep stage 2 and SWS, for each subject.
2.5. Statistical analysis
The comparison between sleep staging and CAP
parameters obtained in normal controls and narcoleptic
patients was carried out by means of the multifactor
ANOVA, with group (controls/narcoleptic patients) and
gender as categorical predictors. Post hoc comparisons
were carried out with the Fisher LSD test, which is
equivalent to the Student’s t test and can be used to
determine the significant differences between group
means in an analysis of variance setting (Winer et al.,
1991).
The comparison between the power spectra of the
different CAP subtypes and NCAP periods during sleep
stage 2 or SWS was carried out by means of the Student’s t
test for unpaired data sets, which was computed for each
frequency bin in the spectra. In this case, in consideration of
the fact that multiple comparisons were carried out in each
analysis, the Bonferroni adjustment (Bland and Altman,
1995) was performed and differences were considered as
statistically significant at p!0.05/4Z0.0125 (number of
comparisons in each analysis).
The commercially available Statistica software package
(StatSoft, Inc., 2001. Statistica data analysis software
system, version 6. www.statsoft.com) was used for
statistical analysis.
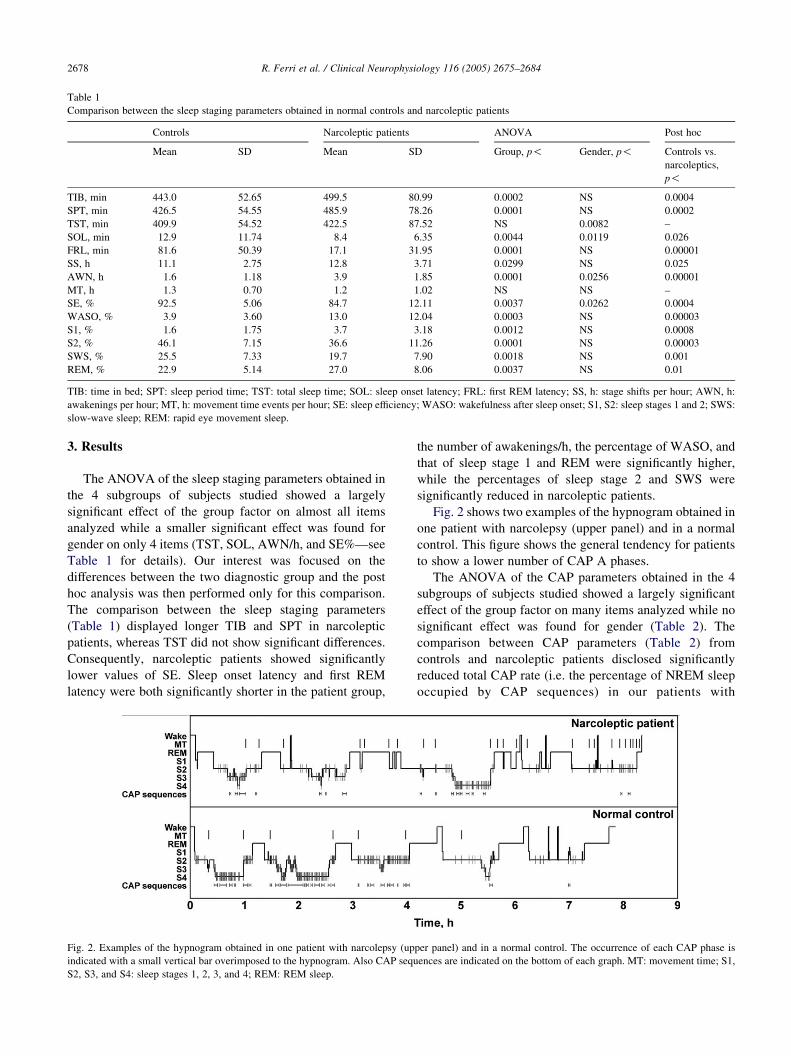
Table 1
Comparison between the sleep staging parameters obtained in normal controls and narcoleptic patients
Controls Narcoleptic patients ANOVA Post hoc
Mean SD Mean SD Group, p! Gender, p! Controls vs.
narcoleptics,
p!
TIB, min 443.0 52.65 499.5 80.99 0.0002 NS 0.0004
SPT, min 426.5 54.55 485.9 78.26 0.0001 NS 0.0002
TST, min 409.9 54.52 422.5 87.52 NS 0.0082 –
SOL, min 12.9 11.74 8.4 6.35 0.0044 0.0119 0.026
FRL, min 81.6 50.39 17.1 31.95 0.0001 NS 0.00001
SS, h 11.1 2.75 12.8 3.71 0.0299 NS 0.025
AWN, h 1.6 1.18 3.9 1.85 0.0001 0.0256 0.00001
MT, h 1.3 0.70 1.2 1.02 NS NS –
SE, % 92.5 5.06 84.7 12.11 0.0037 0.0262 0.0004
WASO, % 3.9 3.60 13.0 12.04 0.0003 NS 0.00003
S1, % 1.6 1.75 3.7 3.18 0.0012 NS 0.0008
S2, % 46.1 7.15 36.6 11.26 0.0001 NS 0.00003
SWS, % 25.5 7.33 19.7 7.90 0.0018 NS 0.001
REM, % 22.9 5.14 27.0 8.06 0.0037 NS 0.01
TIB: time in bed; SPT: sleep period time; TST: total sleep time; SOL: sleep onset latency; FRL: first REM latency; SS, h: stage shifts per hour; AWN, h:
awakenings per hour; MT, h: movement time events per hour; SE: sleep efficiency; WASO: wakefulness after sleep onset; S1, S2: sleep stages 1 and 2; SWS:
slow-wave sleep; REM: rapid eye movement sleep.
R. Ferri et al. / Clinical Neurophysiology 116 (2005) 2675–26842678
3. Results
The ANOVA of the sleep staging parameters obtained in
the 4 subgroups of subjects studied showed a largely
significant effect of the group factor on almost all items
analyzed while a smaller significant effect was found for
gender on only 4 items (TST, SOL, AWN/h, and SE%—see
Table 1 for details). Our interest was focused on the
differences between the two diagnostic group and the post
hoc analysis was then performed only for this comparison.
The comparison between the sleep staging parameters
(Table 1) displayed longer TIB and SPT in narcoleptic
patients, whereas TST did not show significant differences.
Consequently, narcoleptic patients showed significantly
lower values of SE. Sleep onset latency and first REM
latency were both significantly shorter in the patient group,
Fig. 2. Examples of the hypnogram obtained in one patient with narcolepsy (up
indicated with a small vertical bar overimposed to the hypnogram. Also CAP sequ
S2, S3, and S4: sleep stages 1, 2, 3, and 4; REM: REM sleep.
the number of awakenings/h, the percentage of WASO, and
that of sleep stage 1 and REM were significantly higher,
while the percentages of sleep stage 2 and SWS were
significantly reduced in narcoleptic patients.
Fig. 2 shows two examples of the hypnogram obtained in
one patient with narcolepsy (upper panel) and in a normal
control. This figure shows the general tendency for patients
to show a lower number of CAP A phases.
The ANOVA of the CAP parameters obtained in the 4
subgroups of subjects studied showed a largely significant
effect of the group factor on many items analyzed while no
significant effect was found for gender (Table 2). The
comparison between CAP parameters (Table 2) from
controls and narcoleptic patients disclosed significantly
reduced total CAP rate (i.e. the percentage of NREM sleep
occupied by CAP sequences) in our patients with
per panel) and in a normal control. The occurrence of each CAP phase is
ences are indicated on the bottom of each graph. MT: movement time; S1,
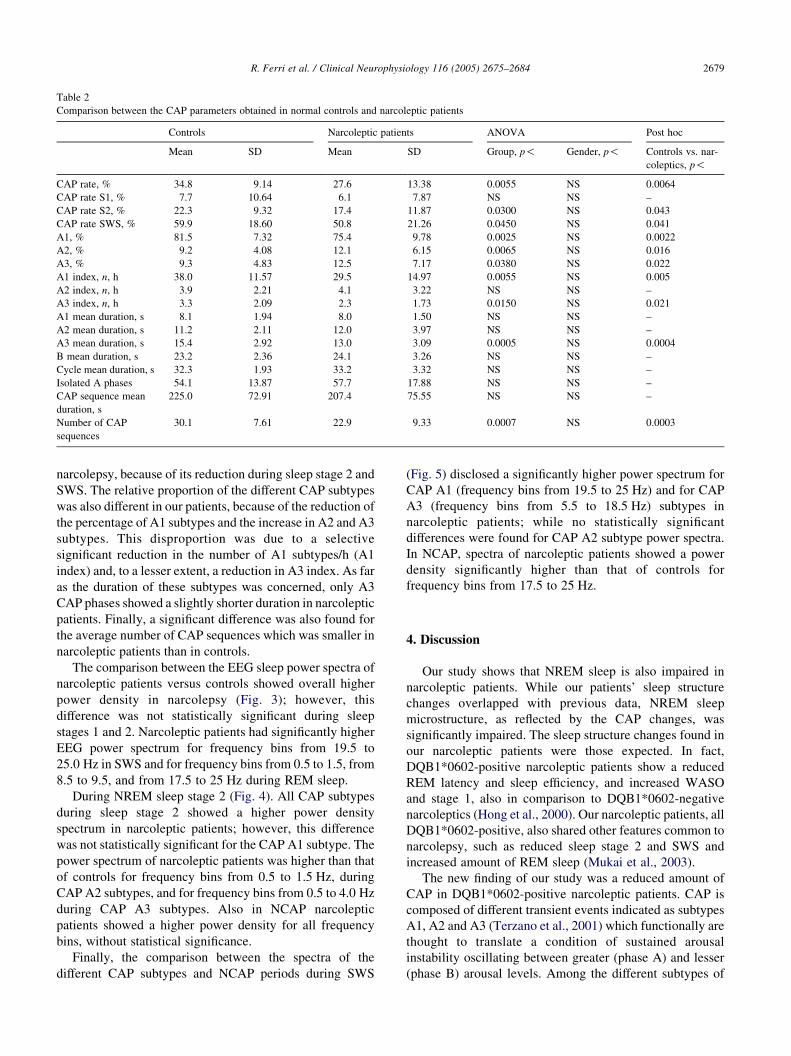
Table 2
Comparison between the CAP parameters obtained in normal controls and narcoleptic patients
Controls Narcoleptic patients ANOVA Post hoc
Mean SD Mean SD Group, p! Gender, p! Controls vs. nar-
coleptics, p!
CAP rate, % 34.8 9.14 27.6 13.38 0.0055 NS 0.0064
CAP rate S1, % 7.7 10.64 6.1 7.87 NS NS –
CAP rate S2, % 22.3 9.32 17.4 11.87 0.0300 NS 0.043
CAP rate SWS, % 59.9 18.60 50.8 21.26 0.0450 NS 0.041
A1, % 81.5 7.32 75.4 9.78 0.0025 NS 0.0022
A2, % 9.2 4.08 12.1 6.15 0.0065 NS 0.016
A3, % 9.3 4.83 12.5 7.17 0.0380 NS 0.022
A1 index, n, h 38.0 11.57 29.5 14.97 0.0055 NS 0.005
A2 index, n, h 3.9 2.21 4.1 3.22 NS NS –
A3 index, n, h 3.3 2.09 2.3 1.73 0.0150 NS 0.021
A1 mean duration, s 8.1 1.94 8.0 1.50 NS NS –
A2 mean duration, s 11.2 2.11 12.0 3.97 NS NS –
A3 mean duration, s 15.4 2.92 13.0 3.09 0.0005 NS 0.0004
B mean duration, s 23.2 2.36 24.1 3.26 NS NS –
Cycle mean duration, s 32.3 1.93 33.2 3.32 NS NS –
Isolated A phases 54.1 13.87 57.7 17.88 NS NS –
CAP sequence mean
duration, s
225.0 72.91 207.4 75.55 NS NS –
Number of CAP
sequences
30.1 7.61 22.9 9.33 0.0007 NS 0.0003
R. Ferri et al. / Clinical Neurophysiology 116 (2005) 2675–2684 2679
narcolepsy, because of its reduction during sleep stage 2 and
SWS. The relative proportion of the different CAP subtypes
was also different in our patients, because of the reduction of
the percentage of A1 subtypes and the increase in A2 and A3
subtypes. This disproportion was due to a selective
significant reduction in the number of A1 subtypes/h (A1
index) and, to a lesser extent, a reduction in A3 index. As far
as the duration of these subtypes was concerned, only A3
CAP phases showed a slightly shorter duration in narcoleptic
patients. Finally, a significant difference was also found for
the average number of CAP sequences which was smaller in
narcoleptic patients than in controls.
The comparison between the EEG sleep power spectra of
narcoleptic patients versus controls showed overall higher
power density in narcolepsy (Fig. 3); however, this
difference was not statistically significant during sleep
stages 1 and 2. Narcoleptic patients had significantly higher
EEG power spectrum for frequency bins from 19.5 to
25.0 Hz in SWS and for frequency bins from 0.5 to 1.5, from
8.5 to 9.5, and from 17.5 to 25 Hz during REM sleep.
During NREM sleep stage 2 (Fig. 4). All CAP subtypes
during sleep stage 2 showed a higher power density
spectrum in narcoleptic patients; however, this difference
was not statistically significant for the CAP A1 subtype. The
power spectrum of narcoleptic patients was higher than that
of controls for frequency bins from 0.5 to 1.5 Hz, during
CAP A2 subtypes, and for frequency bins from 0.5 to 4.0 Hz
during CAP A3 subtypes. Also in NCAP narcoleptic
patients showed a higher power density for all frequency
bins, without statistical significance.
Finally, the comparison between the spectra of the
different CAP subtypes and NCAP periods during SWS
(Fig. 5) disclosed a significantly higher power spectrum for
CAP A1 (frequency bins from 19.5 to 25 Hz) and for CAP
A3 (frequency bins from 5.5 to 18.5 Hz) subtypes in
narcoleptic patients; while no statistically significant
differences were found for CAP A2 subtype power spectra.
In NCAP, spectra of narcoleptic patients showed a power
density significantly higher than that of controls for
frequency bins from 17.5 to 25 Hz.
4. Discussion
Our study shows that NREM sleep is also impaired in
narcoleptic patients. While our patients’ sleep structure
changes overlapped with previous data, NREM sleep
microstructure, as reflected by the CAP changes, was
significantly impaired. The sleep structure changes found in
our narcoleptic patients were those expected. In fact,
DQB1*0602-positive narcoleptic patients show a reduced
REM latency and sleep efficiency, and increased WASO
and stage 1, also in comparison to DQB1*0602-negative
narcoleptics (Hong et al., 2000). Our narcoleptic patients, all
DQB1*0602-positive, also shared other features common to
narcolepsy, such as reduced sleep stage 2 and SWS and
increased amount of REM sleep (Mukai et al., 2003).
The new finding of our study was a reduced amount of
CAP in DQB1*0602-positive narcoleptic patients. CAP is
composed of different transient events indicated as subtypes
A1, A2 and A3 (Terzano et al., 2001) which functionally are
thought to translate a condition of sustained arousal
instability oscillating between greater (phase A) and lesser
(phase B) arousal levels. Among the different subtypes of
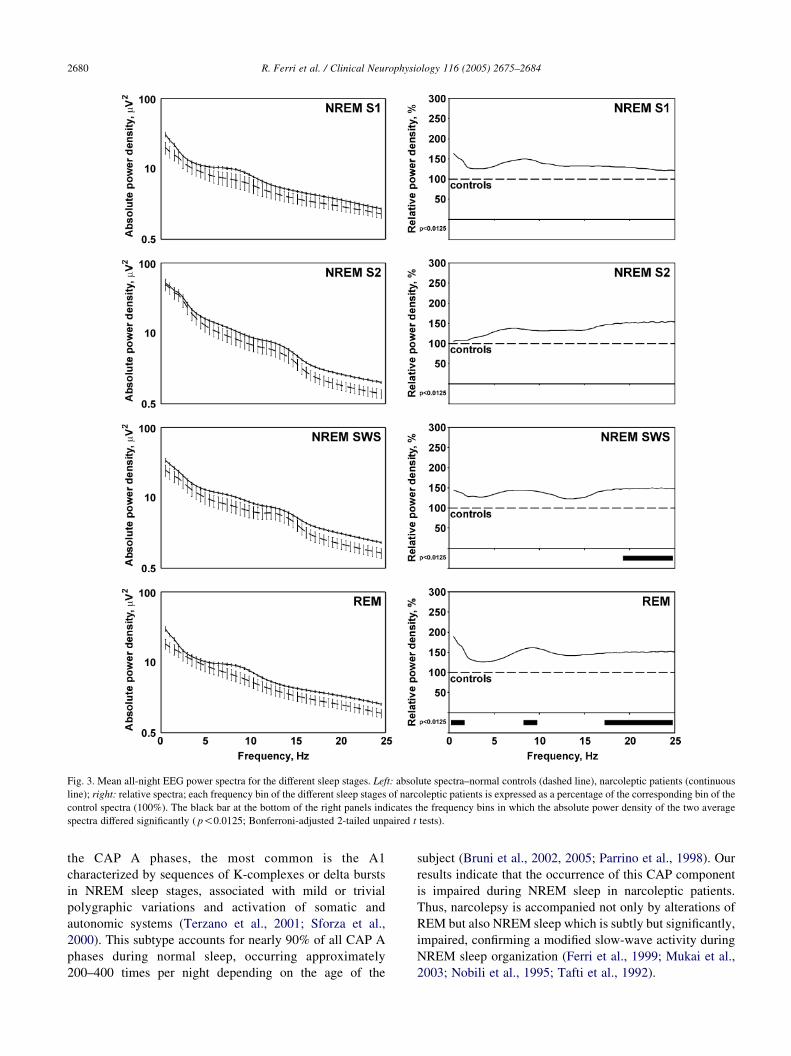
Fig. 3. Mean all-night EEG power spectra for the different sleep stages. Left: absolute spectra–normal controls (dashed line), narcoleptic patients (continuous
line); right: relative spectra; each frequency bin of the different sleep stages of narcoleptic patients is expressed as a percentage of the corresponding bin of the
control spectra (100%). The black bar at the bottom of the right panels indicates the frequency bins in which the absolute power density of the two average
spectra differed significantly ( p!0.0125; Bonferroni-adjusted 2-tailed unpaired t tests).
R. Ferri et al. / Clinical Neurophysiology 116 (2005) 2675–26842680
the CAP A phases, the most common is the A1
characterized by sequences of K-complexes or delta bursts
in NREM sleep stages, associated with mild or trivial
polygraphic variations and activation of somatic and
autonomic systems (Terzano et al., 2001; Sforza et al.,
2000). This subtype accounts for nearly 90% of all CAP A
phases during normal sleep, occurring approximately
200–400 times per night depending on the age of the
subject (Bruni et al., 2002, 2005; Parrino et al., 1998). Our
results indicate that the occurrence of this CAP component
is impaired during NREM sleep in narcoleptic patients.
Thus, narcolepsy is accompanied not only by alterations of
REM but also NREM sleep which is subtly but significantly,
impaired, confirming a modified slow-wave activity during
NREM sleep organization (Ferri et al., 1999; Mukai et al.,
2003; Nobili et al., 1995; Tafti et al., 1992).
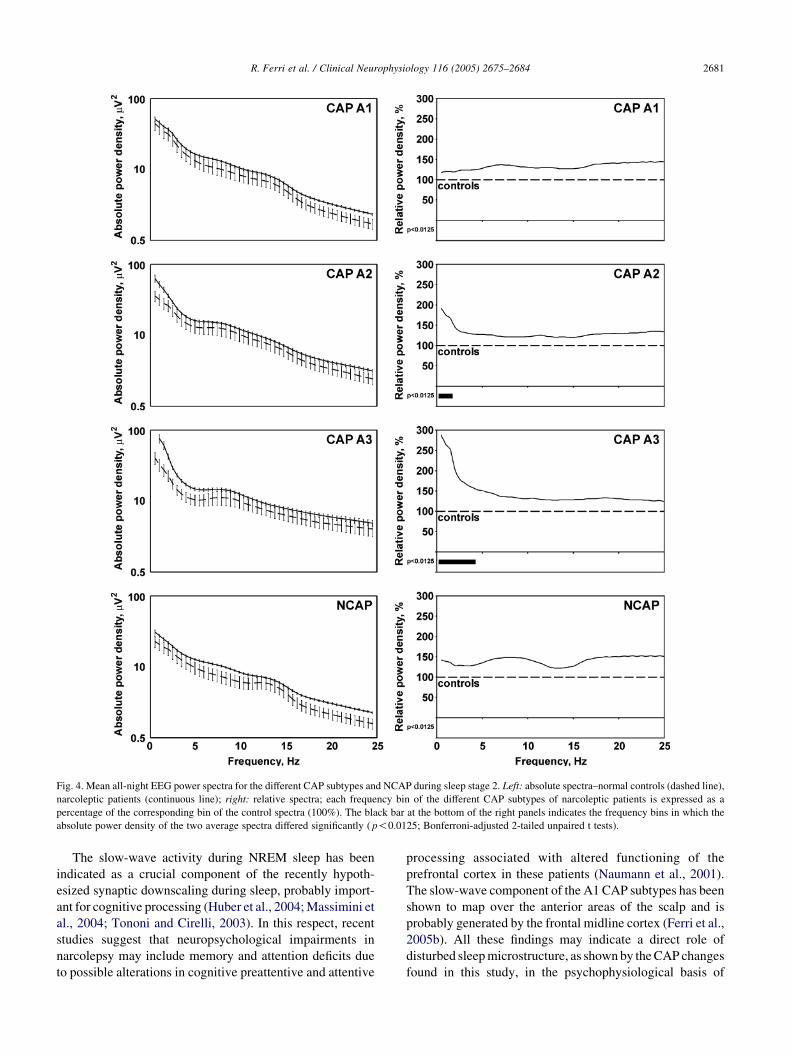
Fig. 4. Mean all-night EEG power spectra for the different CAP subtypes and NCAP during sleep stage 2. Left: absolute spectra–normal controls (dashed line),
narcoleptic patients (continuous line); right: relative spectra; each frequency bin of the different CAP subtypes of narcoleptic patients is expressed as a
percentage of the corresponding bin of the control spectra (100%). The black bar at the bottom of the right panels indicates the frequency bins in which the
absolute power density of the two average spectra differed significantly ( p!0.0125; Bonferroni-adjusted 2-tailed unpaired t tests).
R. Ferri et al. / Clinical Neurophysiology 116 (2005) 2675–2684 2681
The slow-wave activity during NREM sleep has been
indicated as a crucial component of the recently hypoth-
esized synaptic downscaling during sleep, probably import-
ant for cognitive processing (Huber et al., 2004; Massimini et
al., 2004; Tononi and Cirelli, 2003). In this respect, recent
studies suggest that neuropsychological impairments in
narcolepsy may include memory and attention deficits due
to possible alterations in cognitive preattentive and attentive
processing associated with altered functioning of the
prefrontal cortex in these patients (Naumann et al., 2001).
The slow-wave component of the A1 CAP subtypes has been
shown to map over the anterior areas of the scalp and is
probably generated by the frontal midline cortex (Ferri et al.,
2005b). All these findings may indicate a direct role of
disturbed sleep microstructure, as shown by the CAP changes
found in this study, in the psychophysiological basis of
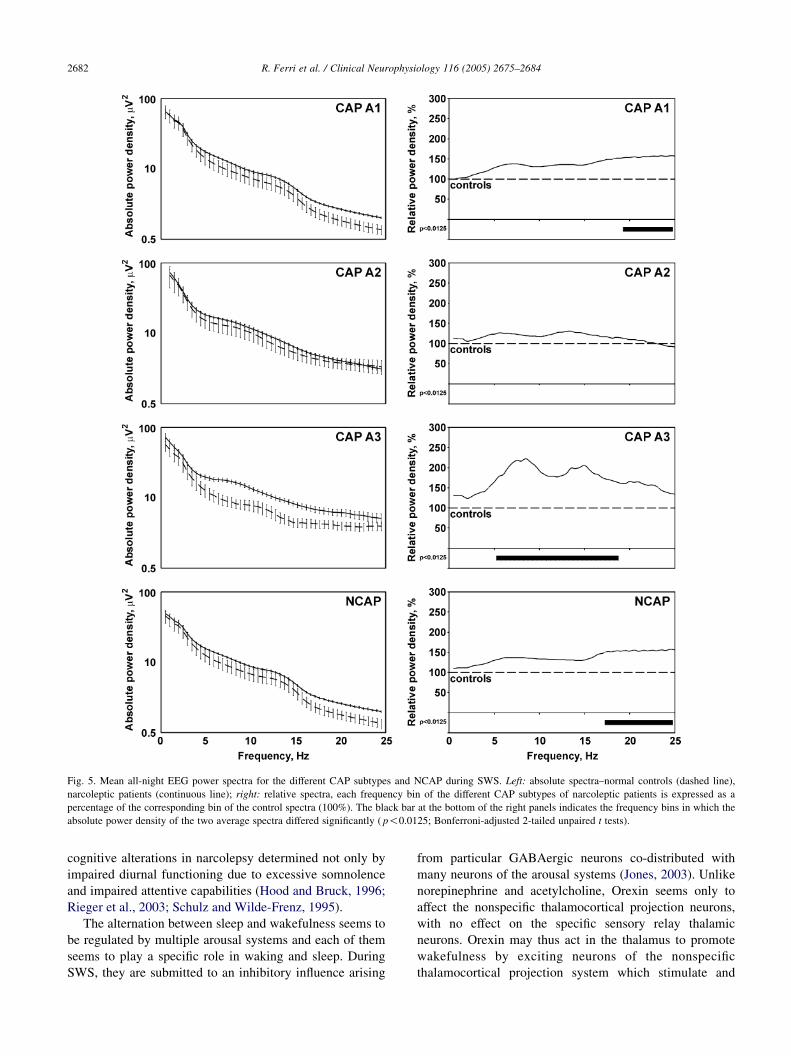
Fig. 5. Mean all-night EEG power spectra for the different CAP subtypes and NCAP during SWS. Left: absolute spectra–normal controls (dashed line),
narcoleptic patients (continuous line); right: relative spectra, each frequency bin of the different CAP subtypes of narcoleptic patients is expressed as a
percentage of the corresponding bin of the control spectra (100%). The black bar at the bottom of the right panels indicates the frequency bins in which the
absolute power density of the two average spectra differed significantly ( p!0.0125; Bonferroni-adjusted 2-tailed unpaired t tests).
R. Ferri et al. / Clinical Neurophysiology 116 (2005) 2675–26842682
cognitive alterations in narcolepsy determined not only by
impaired diurnal functioning due to excessive somnolence
and impaired attentive capabilities (Hood and Bruck, 1996;
Rieger et al., 2003; Schulz and Wilde-Frenz, 1995).
The alternation between sleep and wakefulness seems to
be regulated by multiple arousal systems and each of them
seems to play a specific role in waking and sleep. During
SWS, they are submitted to an inhibitory influence arising
from particular GABAergic neurons co-distributed with
many neurons of the arousal systems (Jones, 2003). Unlike
norepinephrine and acetylcholine, Orexin seems only to
affect the nonspecific thalamocortical projection neurons,
with no effect on the specific sensory relay thalamic
neurons. Orexin may thus act in the thalamus to promote
wakefulness by exciting neurons of the nonspecific
thalamocortical projection system which stimulate and
R. Ferri et al. / Clinical Neurophysiology 116 (2005) 2675–2684 2683
maintain cortical activation via widespread projections to
the cerebral cortex (Bayer et al., 2002). Also in the cortex,
orexin has been shown to excite a specific subset of cortical
neurons which may also be involved in promoting wide-
spread cortical activation via corticocortical projections
(Bayer et al., 2004).
From the CAP standpoint, transient slow-wave activity
bursts (A1 subtypes) are considered cortical activation
events also accompanied by autonomic subcortical changes
(Ferini-Strambi et al., 2000; Ferri et al., 2000b; Sforza et al.,
2000). In narcolepsy, orexin deficiency may reflect in
reduced activity of cortical arousal regions, resulting in the
reducted CAP rate encountered in NREM sleep.
Besides the alterations of the visually derived CAP
parameters, we also used spectral analysis to quantitate the
EEG abnormalities during sleep in our narcoleptic patients.
Considering the classical sleep stages, power spectra of
narcoleptic patients were significantly higher mostly for
frequencies between 17.5–19.0 and 25.0 Hz in NREM sleep
stage 2 and SWS; during REM sleep power spectra of
narcoleptic patients showed significantly higher power
density for frequency bins from 0.5 to 1.5, from 8.5 to
9.5, and from 17.5 to 25 Hz. Since an increase in fast
frequencies (15.5–34.5 Hz) has been reported in normal
subjects during REM sleep (Ferri et al., 2000a, 2001, 2002),
our results might indicate a ‘leakage’ of EEG frequencies
typical of normal REM sleep into NREM sleep in
narcoleptic patients, in addition to the abnormally higher
power in a larger spectral band during REM sleep. These
results are only in partial agreement with those of Mukai et
al. (2003), but they pooled all EEG epochs in NREM sleep
and studied only 8 patients.
The presence of an abnormally high level of fast EEG
frequencies also affects the spectra of the CAP A1 subtypes
and NCAP sleep mostly during SWS. This seems to indicate
that CAP A1 subtypes are not only reduced in number in
narcolepsy but are also significantly different from normal
for an abnormal content in fast frequencies. The clear and
significant intrusion of fast EEG frequencies during CAP
and NCAP NREM sleep might indicate the persistence of
neurophysiological mechanisms typical of REM sleep
during these stages in narcoleptic patients. Finally, CAP
A2 and A3 subtypes of our narcoleptic subjects also showed
alterations in their spectra difficult to interpret at this stage.
There are at least 3 distinct delta sleep oscillations: a
very-slow (!1 Hz) cortically-generated oscillation (Acher-
mann and Borbely, 1997; Amzica and Steriade, 1997;
Steriade et al., 1993a,b), a clock-like thalamic oscillation
(1–4 Hz), and a cortical oscillation (1–4 Hz). The very-slow
(!1 Hz) oscillation seems to be reflected in the EEG as
rhythmic sequences of surface-negative waves (associated
with hyperpolarizations of deeply-lying neurons) and
surface-positive K-complexes (representing excitation in
large pools of cortical neurons). The very-slow oscillation is
believed to have the ability to trigger and to group the two
delta (1–4 Hz) oscillations (Amzica and Steriade, 1998;
Steriade and Amzica, 1998) and thalamically-generated
spindles and beta activities (Molle et al., 2002). We have
recently shown that A components of CAP might
correspond to periods in which the very-slow delta rhythm
of sleep groups a range of different EEG activities including
slow waves, and the sigma and beta bands, while the B
phase of CAP might correspond to a period in which these
activities are quiescent or inhibited (Ferri et al., 2005c). The
results of the present study might indicate that this
mechanism can be subtly altered in narcolepsy and that
very-slow oscillation processes less effective than normal
might be present, with an impaired capability of grouping
the other faster EEG activities indicated above.
In conclusion, our findings show that not only REM but
also NREM sleep is significantly altered in narcolepsy. The
neurophysiological alterations of NREM sleep in narco-
lepsy are significant, add new information on the sleep
neurophysiology of this clinical condition and deserve
further insight in order to obtain a better understanding of
their functional meaning.
References
Achermann P, Borbely AA. Low-frequency (!1 Hz) oscillations in the
human sleep electroencephalogram. Neuroscience 1997;81:213–22.
American Academy of Sleep Medicine. The international classification of
sleep disorders (ICSD), revised Diagnostic and coding manual.
Rochester, MN: American Academy of Sleep Medicine; 2001.
Amzica F, Steriade M. The K-complex: its slow (!1-Hz) rhythmicity and
relation to delta waves. Neurology 1997;49:952–9.
Amzica F, Steriade M. Electrophysiological correlates of sleep delta waves.
Electroencephalogr Clin Neurophysiol 1998;107:69–83.
Bayer L, Eggermann E, Saint-Mleux B, Machard D, Jones BE,
Muhlethaler M, Serafin M. Selective action of orexin (hypocretin) on
nonspecific thalamocortical projection neurons. J Neurosci 2002;22:
7835–9.
Bayer L, Serafin M, Eggermann E, Saint-Mleux B, Machard D, Jones BE,
Muhlethaler M. Exclusive postsynaptic action of hypocretin–orexin on
sublayer 6b cortical neurons. J Neurosci 2004;24:6760–4.
Bland JM, Altman DG. Multiple significance tests: the Bonferroni method.
BMJ 1995;310:170.
Bourgin P, Huitron-Resendiz S, Spier AD, Fabre V, Morte B, Criado JR,
Sutcliffe JG, Henriksen SJ, de Lecea L. Hypocretin-1 modulates rapid
eye movement sleep through activation of locus ceruleus neurons.
J Neurosci 2000;20:7760–5.
Bruni O, Ferri R, Miano S, Verrillo E, Vittori E, Della Marca G, Farina B,
Mennuni G. Sleep cyclic alternating pattern in normal school-age
children. Clin Neurophysiol 2002;113:1806–14.
Bruni O, Ferri R, Miano S, Verrillo E, Vittori E, Farina B, Smerieri A,
Terzano MG. Sleep cyclic alternating pattern in normal preschool-age
children. Sleep 2005;28:220–30.
Burlet S, Tyler CJ, Leonard CS. Direct and indirect excitation of
laterodorsal tegmental neurons by hypocretin/orexin peptides: impli-
cations for wakefulness and narcolepsy. J Neurosci 2002;22:2862–72.
Cooley JW, Tukey OW. An algorithm for the machine calculation of
complex Fourier series. Math Comput 1965;19:297–301.
Dauvilliers Y, Baumann CR, Maly FE, Billiard M, Bassetti C. CSF
hypocretin-1 levels in narcolepsy, Kleine–Levin syndrome, other
hypersomnias and neurological conditions. J Neurol Neurosurg
Psychiatry 2003;74:1667–73.
R. Ferri et al. / Clinical Neurophysiology 116 (2005) 2675–26842684
Ferini-Strambi L, Bianchi A, Zucconi M, Oldani A, Castronovo V,
Smirne S. The impact of cyclic alternating pattern on heart rate
variability during sleep in healthy young adults. Clin Neurophysiol
2000;111:99–101.
Ferri R, Pettinato S, Nobili L, Billiard M, Ferrillo F. Correlation dimension
of EEG slow-wave activity during sleep in narcoleptic patients under
bed rest conditions. Int J Psychophysiol 1999;34:37–43.
Ferri R, Elia M, Musumeci SA, Pettinato S. The time course of high-
frequency bands (15–45 Hz) in all-night spectral analysis of sleep EEG.
Clin Neurophysiol 2000a;111:1258–65.
Ferri R, Parrino L, Smerieri A, Terzano MG, Elia M, Musumeci SA,
Pettinato S. Cyclic alternating pattern and spectral analysis of heart rate
variability during normal sleep. J Sleep Res 2000b;9:13–18.
Ferri R, Cosentino FI, Elia M, Musumeci SA, Marinig R, Bergonzi P.
Relationship between delta, sigma, beta, and gamma EEG bands at
REM sleep onset and REM sleep end. Clin Neurophysiol 2001;112:
2046–52.
Ferri R, Bergonzi P, Cosentino II Eli, Elia M, Lanuzza B, Marinig R,
Musumeci SA. Scalp topographic distribution of beta and gamma ratios
during sleep. J Psychophysiol 2002;16:107–13.
Ferri R, Bruni O, Miano S, Smerieri A, Spruyt K, Terzano MG. Inter-rater
reliability of sleep cyclic alternating pattern (CAP) scoring and
validation of a new computer-assisted CAP scoring method. Clin
Neurophysiol 2005a;116:696–707.
Ferri R, Bruni O, Miano S, Terzano MG. Topographic mapping of the
spectral components of the ‘cyclic alternating pattern’ (CAP). Sleep
Med 2005b;6:29–36.
Ferri R, Bruni O, Miano S, Plazzi G, Terzano MG. All-night EEG power
spectral analysis of the cyclic alternating pattern components in young
adult subjects. Clinical Neurophysiology 2005;116:1430–41.
Hong SC, Hayduk R, Lim J, Mignot E. Clinical and polysomnographic
features in DQB1*0602 positive and negative narcolepsy patients:
results from the modafinil clinical trial. Sleep Med 2000;1:33–9.
Hood B, Bruck D. Sleepiness and performance in narcolepsy. J Sleep Res
1996;5:128–34.
Huber R, Ghilardi MF, Massimini M, Tononi G. Local sleep and learning.
Nature 2004;430:78–81.
Hungs M, Mignot E. Hypocretin/orexin, sleep, and narcolepsy. BioEssays
2001;23:397–408.
Jones BE. Arousal system. Front Biosci 2003;8:438–51.
Kemp B, Varri A, Rosa AC, Nielsen KD, Gade J. A simple format for
exchange of digitized polygraphic recordings. Electroencephalogr Clin
Neurophysiol 1992;82:391–3.
Massimini M, Huber R, Ferrarelli F, Hill S, Tononi G. The sleep slow
oscillation as a traveling wave. J Neurosci 2004;24:6862–70.
Mignot E, Lin X, Arrigoni J, Macaubas C, Olive F, Hallmayer J,
Underhill P, Guilleminault C, Dement WC, Grumet FC. DQB1*0602
and DQA1*0102 (DQ1) are better markers than DR2 for narcolepsy in
Caucasian and black Americans. Sleep 1994;17:60–7.
Mignot E, Tafti M, Dement WC, Grumet FC. Narcolepsy and immunity.
Adv Neuroimmunol 1995;5:23–37.
Mignot E, Lammers GJ, Ripley B, Okun M, Nevsimalova S, Overeem S,
Vankova J, Black J, Harsh J, Bassetti C, Schrader H, Nishino S. The role
of cerebrospinal fluid hypocretin measurement in the diagnosis of
narcolepsy and other hypersomnias. Arch Neurol 2002;59:1553–62.
Mochizuki T, Crocker A, McCormack S, Yanagisawa M, Sakurai T,
Scammell TE. Behavioral state instability in orexin knock-out mice.
J Neurosci 2004;24:6291–300.
Molle M, Marshall L, Gais S, Born J. Grouping of spindle activity during
slow oscillations in human non-rapid eye movement sleep. J Neurosci
2002;22:10941–7.
Mukai J, Uchida S, Miyazaki S, Nishihara K, Honda Y. Spectral analysis of
all-night human sleep EEG in narcoleptic patients and normal subjects.
J Sleep Res 2003;12:63–71.
Naumann A, Bierbrauer J, Przuntek H, Daum I. Attentive and preattentive
processing in narcolepsy as revealed by event-related potentials (ERPs).
Neuroreport 2001;12:2807–11.
Nishino N, Ripley B, Overeem S, Lammers GJ, Mignot E. Hypocretin
(orexin) deficiency in human narcolepsy. Lancet 2000;355:39–40.
Nobili L, Besset A, Ferrillo F, Rosadini G, Schiavi G, Billiard M. Dynamics
of slow wave activity in narcoleptic patients under bed rest conditions.
Electroenceph Clin Neurophysiol 1995;95:414–25.
Parrino L, Boselli M, Spaggiari MC, Smerieri A, Terzano MG. Cyclic
alternating pattern (CAP) in normal sleep: polysomnographic par-
ameters in different age groups. Electroencephalogr Clin Neurophysiol
1998;107:439–50.
Press WH, Flannery BP, Teukolsky SA, Vetterling WT. Numerical recipes
The art of scientific computing. Cambridge: Press Syndicate of the
University of Cambridge; 1989.
Rechtschaffen A, Kales A. A manual of standardized terminology,
techniques and scoring system of sleep stages of human subjects.
Washington, DC: US Government Printing Office, US Public Health
Service; 1968.
Rieger M, Mayer G, Gauggel S. Attention deficits in patients with
narcolepsy. Sleep 2003;26:36–43.
Ripley B, Overeem S, Fujiki N, Nevsimalova S, Uchino M, Yesavage J, Di
Monte D, Dohi K, Melberg A, Lammers GJ, Nishida Y, Roelandse FW,
Hungs M, Mignot E, Nishino S. CSF hypocretin/orexin levels in
narcolepsy and other neurological conditions. Neurology 2001;57:
2253–8.
Schulz H, Wilde-Frenz J. Symposium: cognitive processes and sleep
disturbances: the disturbance of cognitive processes in narcolepsy.
J Sleep Res 1995;4:10–14.
Sforza E, Jouny C, Ibanez V. Cardiac activation during arousal in humans:
further evidence for hierarchy in the arousal response. Clin
Neurophysiol 2000;111:1611–9.
Smith AJF, Jackson MW, Neufing P, McEvoy RD, Gordon TP. A
functional autoantibody in narcolepsy. Lancet 2004;364:2122–4.
Steriade M, Amzica F. Coalescence of sleep rhythms and their chronology
in corticothalamic networks. Sleep Res Online 1998;1:1–10.
Steriade M, Contreras D, Curro-Rossi R, Nunez A. The slow (!1 Hz)
oscillation in reticular thalami and thalamocortical neurons: scenario of
sleep rhythms generation in interacting thalamic and neocortical
networks. J Neurosci 1993a;13:3284–99.
Steriade M, Nunez A, Amzica F. A novel slow (!1 Hz) oscillation of
neocortical neurons in vivo: depolarizing and hyperpolarizing
components. J Neurosci 1993b;13:3252–65.
Sturzenegger C, Bassetti C. The clinical spectrum of narcolepsy with
cataplexy: a reappraisal. J Sleep Res 2004;13:395–406.
Tafti M, Rondouin G, Besset A, Billiard M. Sleep deprivation in narcoleptic
subjects: effect on sleep stages and EEG power density. Electro-
encephalogr Clin Neurophysiol 1992;83:339–49.
Terzano MG, Mancia D, Salati MR, Costani G, Decembrino A, Parrino L.
The cyclic alternating pattern as a physiologic component of normal
NREM sleep. Sleep 1985;8:137–45.
Terzano MG, Parrino L, Spaggiari MC. The cyclic alternating pattern
sequences in the dynamic organization of sleep. Electroencephalogr
Clin Neurophysiol 1988;69:437–47.
Terzano MG, Parrino L, Smerieri A, Chervin R, Chokroverty S,
Guilleminault C, Hirshkowitz M, Mahowald M, Moldofsky H,
Rosa A, Thomas R, Walters A. Consensus report. Atlas, rules, and
recording techniques for the scoring of cyclic alternating pattern (CAP)
in human sleep. Sleep Med 2001;2:537–53.
Tononi G, Cirelli C. Sleep and synaptic homeostasis: a hypothesis. Brain
Res Bull 2003;62:143–50.
Winer BJ, Brown DR, Michels KM. Statistical principals in experimental
design. 3rd ed. New York: McGraw-Hill; 1991.
Related Documents