Bridging the Clean Energy Divide: Affordable Clean Energy Solutions for Today and Tomorrow N R DC REPORT APRIL 2015 R:15-01-B

Welcome message from author
This document is posted to help you gain knowledge. Please leave a comment to let me know what you think about it! Share it to your friends and learn new things together.
Transcript
Bridging the Clean Energy Divide: Affordable Clean Energy Solutions for Today and Tomorrow
NRDC rEporT
NRDC: Bridging the Clean Energy Divide - Affordable Clean Energy Solutions for Today and Tomorrow (PDF)
april 2015 r:15-01-B
acknowledgmentsReport Written byKatharine McCormick, NRDC
Thanks to the many at NRDC who contributed to the research and writing of this report, including but not limited to Ariana Gonzalez, Nathanael Greene, Khalil Shahyd, Meredith Connolly, Rebecca Stanfield, Cai Steger, Anjali Jaiswal, Amanda Levin, Kevin Steinberger, and Lara Ettenson. Thanks also to ACEEE, ISO New England, The Kentucky Energy and Environment Cabinet, and Acadia Center for their amazing graphics. And finally, thanks to the many consumer advocates, low-income advocates, and other experts who took the time to review this report and who work every day to improve peoples’ lives.
about NrDCThe Natural Resources Defense Council (NRDC) is an international nonprofit environmental organization with more than 1.4 million members and online activists. Since 1970, our lawyers, scientists, and otherenvironmental specialists have worked to protect the world’s natural resources, public health, and the environment. NRDC has offices in New York City, Washington, D.C., Los Angeles, San Francisco, Chicago, Bozeman, MT, and Beijing and works with partners in Canada, India, Europe, and Latin America. Visit us at www.nrdc.org and follow us on Twitter @NRDC.
NRDC Director of Communications: Lisa Benenson
NRDC Deputy Director of Communications: Lisa Goffredi
NRDC Policy Publications Director: Alex Kennaugh
Design and Production: www.suerossi.com
© Natural Resources Defense Council 2015
paGE 3 | Bridging the Clean Energy Divide: affordable Clean Energy Solutions for Today and Tomorrow
ExECuTivE Summary
The impacts of pollution often hit the poor the hardest. And experts predict that climate
change will worsen the situation. However, the shift to clean energy offers a chance to
prevent the worst impacts of climate change, while lessening the toll that dirty fossil
fuels are currently wreaking on some of our most vulnerable communities.
Our nation limits mercury, lead, sulfur, and other dangerous air pollutants and is now poised to deal with the carbon emissions hastening climate change. The best way to do that is a strong embrace of energy efficiency to make our homes and buildings more comfortable using less energy, as well as advance clean energy sources like wind and solar. These are the core policies of the U.S. Environmental Protection Agency’s (EPA) proposed Clean Power Plan to reduce dangerous carbon pollution from power plants and they offer Americans huge added environmental, economic, and health benefits.
Polluters and their allies insist that cutting power plant carbon pollution will increase energy costs, but that is simply not the case. In fact, according to the U.S. EPA’s analysis the transition to a cleaner energy future will help low- and fixed-income Americans lower their electric bills by an average of 8 percent.1 This is a huge impact as fixed-income households spend a much higher percentage of their income on energy costs.
This report discusses specific ways energy efficiency and renewable power can help this segment of our population.
HEalTH BENEfiTSNationally, the Clean Power Plan’s efforts to curtail carbon pollution will help prevent up to 6,600 premature deaths, 150,000 asthma attacks in children, 3,300 heart attacks, 2,800 hospital admissions,and 490,000 missed work/school days annually in the United States.2 A sizable impact will be felt by those with the least resources and least access to quality healthcare—low- and fixed-income Americans; in part because low-income communities are stuck living closer to dirty power plants.
ENErGy EffiCiENCy BENEfiTSEnergy efficiency can be the single best energy resource investment for low- and fixed-income households struggling to pay their utility bills. People can reduce their energy use and their energy bills to further stretch their dollars. Further, investments in efficiency by some customers can actually lower bills for all customers on the system, and even lower the price of electricity sold in regional markets. Reducing electricity consumption reduces the pollution from burning fossil fuels.
As consumers save money and reduce their use of energy, efficiency upgrades will make living environments more comfortable and healthier. This can help preserve affordable housing by reducing operating expenses for landlords and lessen rental turnover while increasing property values.
For example, rural low-income communities benefit from innovative rural electric cooperative programs like How$martKY, which allows customers to pay for efficiency investments through monthly installments on their utility bills and saves the average home $11 on their monthly electricity bills.3 In addition, weatherization services are often provided for seniors at county, state, and federal levels, improving quality of life, enhancing health and indoor comfort, and promoting an active lifestyle.
rENEwaBlE ENErGy BENEfiTSInvestments in renewable energy help low-income communities by providing steady power not subject to the same sudden fuel shocks from coal or gas price spikes. Today, companies offer solar energy as a benefit and rural communities in the United States are being revitalized by local wind farm development.4 Renewable energy will continue to become more affordable as it grows and, as a result, an increasing number of fixed- and low-income households will receive meaningful environmental, health, and economic benefits.
This report discusses a host of ways low- and fixed-income communities are affected by dirty energy as well as possible benefits from shifting to cleaner energy made possible largely by implementing the Clean Power Plan. The report covers clean energy success stories around the country, addresses the economics of fossil fuel generation, explores how clean energy can affect housing affordability in urban and rural areas, explains the health and environmental benefits of clean energy, and explores reliability issues.
Because energy affects every aspect of our daily lives, access to clean energy can transform the living environment and help to address many of the challenges that low- and fixed-income communities face. One of the most positive effects of the Clean Power Plan will be to stimulate more investment in energy efficiency and renewable energy to maximize a wide array of health, economic, environmental, and societal benefits, while curbing harmful pollution that threatens our communities and our planet.
paGE 4 | Bridging the Clean Energy Divide: affordable Clean Energy Solutions for Today and Tomorrow
On June 2, 2014, the U.S. Environmental Protection Agency (EPA) proposed the Clean Power Plan to establish limits on carbon pollution from existing power plants. Despite its significant contribution to the climate change that threatens our infrastructure, economy, and health, and unlike other pollutants such as sulfur and mercury, carbon pollution emitted by power plants has never before faced federal limits. The plan takes a flexible, system-wide approach that includes upgrades to power plants as well as the addition of renewable energy and energy efficiency. Each state will have a specific target of carbon pollution reduction and can design its own plan to reach that goal. Working with utilities and grid operators, states will examine the many available strategies to reduce carbon pollution and save consumers money while providing reliable and cleaner electric power to meet our nation’s needs.
Coal iNDuSTry’S SElf-SErviNG SCarE TaCTiCS Entrenched coal interests are pushing a claim that the EPA is waging a “war on coal” that will lead to massive increases in electricity costs, power outages, and job losses across the nation, throwing people into poverty. They contend that the Clean Power Plan will create burdens that fall disproportionately on those with fixed and low incomes, including seniors and minorities. These interests argue that the Clean Power Plan will cut coal use dramatically and force the implementation of new, expensive technologies, raising electricity rates and hurting those vulnerable populations. This is self-serving because continued coal dependence in the United States would prop up coal prices and thus profits.
In reality, coal plants are being retired as cheaper power becomes available from natural gas, wind, and solar, and as households and businesses increasingly save energy and money through investments in efficiency.
a TraNSiTioN To ClEaN ENErGy iS GooD for CuSTomErSThe Clean Power Plan will help to alleviate the impacts of pollution from existing power plants. Because energy is so central to human development, because energy enters into every aspect of our daily lives, access to clean energy can transform the living environment and aid in addressing many of the challenges that low- and fixed-income communities face. The EPA has proposed standards that will gradually reduce the carbon intensity of our electricity system over the next 15 years, which will lead to lower electricity costs, healthier homes and buildings, increased employment, and a better electricity grid with reliability that is second to none. Under the EPA’s proposal, coal will still play a part in our electricity system. However, the plan does make room for clean energy to play a bigger role, and this will help to
iNTroDuCTioN
lower costs and lessen dependence on fossil fuels, to the benefit of all customers. The benefits of clean energy are great and growing, and it is critical that low- and fixed-income households share in these benefits.
Investment in clean energy benefits everyone. Vulnerable populations lack access to clean energy; the solution is not to continue our dependence on fossil fuels but rather to make clean energy more accessible and affordable. This is beginning to happen all over the United States, with the potential to be greatly expanded.
Low- and fixed-income households spend a higher proportion of their income on energy costs than do higher-income families.5 While 2.9 percent of the average U.S. household’s income goes toward electricity bills, low-income households spend 8.3 percent of their income on electricity; these households must often make difficult choices when trying to cover their energy costs and other nonnegotiable expenses, like food and medicine.6 This becomes more challenging when energy bills rise.
In addition to being vulnerable to high energy costs, people with low or fixed incomes tend to suffer more direct health impacts from power plant pollution. These direct health impacts are exacerbated by preexisting vulnerability from other health problems and lack of access to health care, as well as inequities in education, employment, and civil rights. Low- and fixed-income communities are more often sited in close proximity to dirty power generation. People with low and fixed incomes are also disproportionately impacted by climate change and because of limited resources, have less capacity to adapt to those changes, as seen in recent years with such natural disasters as Hurricanes Katrina and Sandy, rising food prices, and severe droughts.
Energy efficiency and renewable energy have the potential to help address these challenges. With innovative programs and policies, the United States can transition to cleaner power generation, cutting pollution in neighborhoods near power plants and providing opportunities for employment and community growth. Better buildings will save people money while promoting health and protecting those most susceptible to illness. All of these gains can be realized, as long as we work to ensure that the intrinsic benefits of clean energy are equitably distributed across all populations.
Adoption of the Clean Power Plan will help drive renewable energy and energy efficiency, innovative solutions based on research and experience. In developing a strategy to limit carbon pollution, states should prioritize energy efficiency and renewable energy because of the myriad benefits that can be achieved. In particular, they carry the potential to ease inequities in energy access, electricity bill payments, and health. This report outlines some of the reasons why expanding the use of energy efficiency and renewable energy is, in fact, the best way to help the energy-poor and low-income households in the United States and around the world.
paGE 5 | Bridging the Clean Energy Divide: affordable Clean Energy Solutions for Today and Tomorrow
THE rEal rEaSoN THE Coal iNDuSTry iS SHriNKiNG: iT’S Too ExpENSivE!
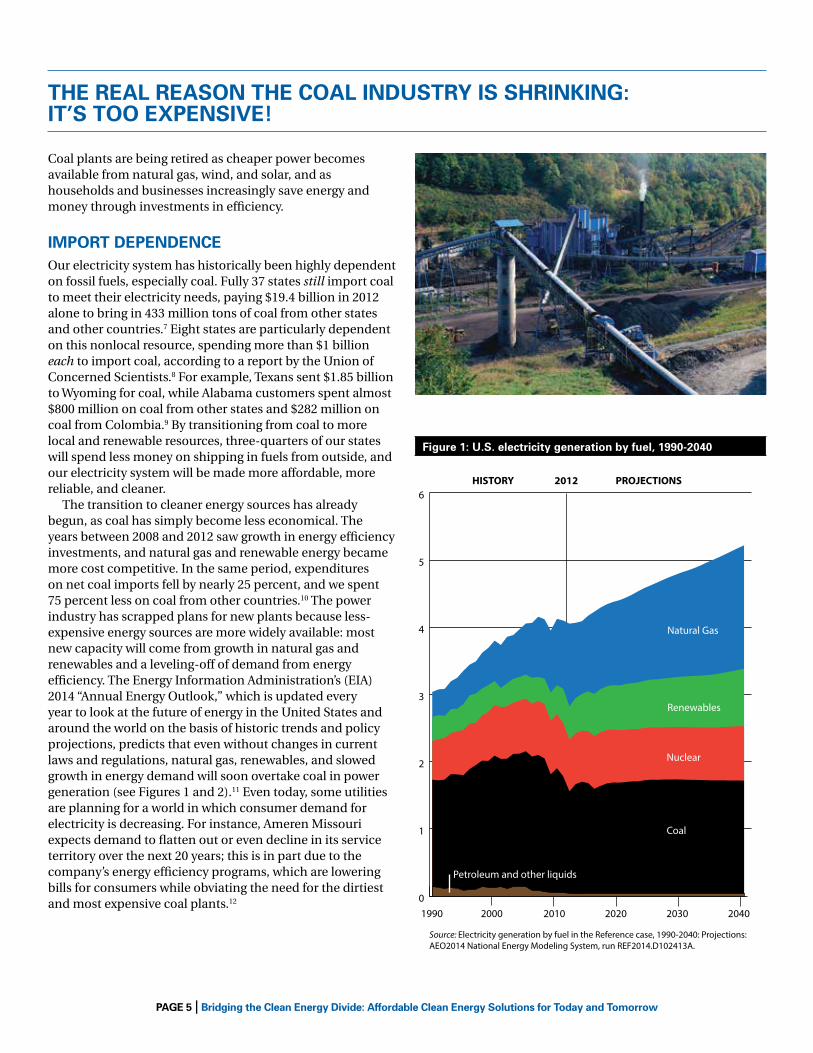
Coal plants are being retired as cheaper power becomes available from natural gas, wind, and solar, and as households and businesses increasingly save energy and money through investments in efficiency.
imporT DEpENDENCEOur electricity system has historically been highly dependent on fossil fuels, especially coal. Fully 37 states still import coal to meet their electricity needs, paying $19.4 billion in 2012 alone to bring in 433 million tons of coal from other states and other countries.7 Eight states are particularly dependent on this nonlocal resource, spending more than $1 billion each to import coal, according to a report by the Union of Concerned Scientists.8 For example, Texans sent $1.85 billion to Wyoming for coal, while Alabama customers spent almost $800 million on coal from other states and $282 million on coal from Colombia.9 By transitioning from coal to more local and renewable resources, three-quarters of our states will spend less money on shipping in fuels from outside, and our electricity system will be made more affordable, more reliable, and cleaner.
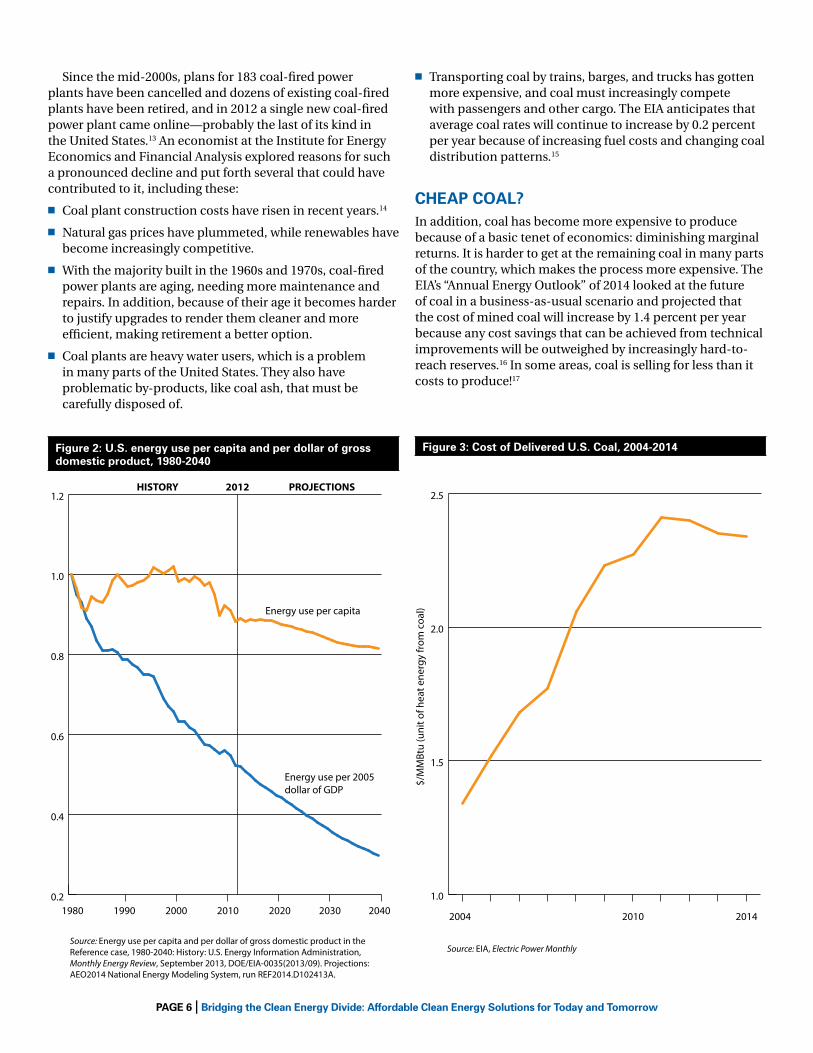
The transition to cleaner energy sources has already begun, as coal has simply become less economical. The years between 2008 and 2012 saw growth in energy efficiency investments, and natural gas and renewable energy became more cost competitive. In the same period, expenditures on net coal imports fell by nearly 25 percent, and we spent 75 percent less on coal from other countries.10 The power industry has scrapped plans for new plants because less-expensive energy sources are more widely available: most new capacity will come from growth in natural gas and renewables and a leveling-off of demand from energy efficiency. The Energy Information Administration’s (EIA) 2014 “Annual Energy Outlook,” which is updated every year to look at the future of energy in the United States and around the world on the basis of historic trends and policy projections, predicts that even without changes in current laws and regulations, natural gas, renewables, and slowed growth in energy demand will soon overtake coal in power generation (see Figures 1 and 2).11 Even today, some utilities are planning for a world in which consumer demand for electricity is decreasing. For instance, Ameren Missouri expects demand to flatten out or even decline in its service territory over the next 20 years; this is in part due to the company’s energy efficiency programs, which are lowering bills for consumers while obviating the need for the dirtiest and most expensive coal plants.12
0
1
2
3
4
5
6
Figure 1: U.S. electricity generation by fuel, 1990-2040
Petroleum and other liquids
Coal
Nuclear
Renewables
Natural Gas
1990 2000
HISTORY 2012 PROJECTIONS
2010 2020 2030 2040
Source: Electricity generation by fuel in the Reference case, 1990-2040: Projections: AEO2014 National Energy Modeling System, run REF2014.D102413A.
figure 1: u.S. electricity generation by fuel, 1990-2040
paGE 6 | Bridging the Clean Energy Divide: affordable Clean Energy Solutions for Today and Tomorrow
Since the mid-2000s, plans for 183 coal-fired power plants have been cancelled and dozens of existing coal-fired plants have been retired, and in 2012 a single new coal-fired power plant came online—probably the last of its kind in the United States.13 An economist at the Institute for Energy Economics and Financial Analysis explored reasons for such a pronounced decline and put forth several that could have contributed to it, including these:
n Coal plant construction costs have risen in recent years.14
n Natural gas prices have plummeted, while renewables have become increasingly competitive.
n With the majority built in the 1960s and 1970s, coal-fired power plants are aging, needing more maintenance and repairs. In addition, because of their age it becomes harder to justify upgrades to render them cleaner and more efficient, making retirement a better option.
n Coal plants are heavy water users, which is a problem in many parts of the United States. They also have problematic by-products, like coal ash, that must be carefully disposed of.
n Transporting coal by trains, barges, and trucks has gotten more expensive, and coal must increasingly compete with passengers and other cargo. The EIA anticipates that average coal rates will continue to increase by 0.2 percent per year because of increasing fuel costs and changing coal distribution patterns.15
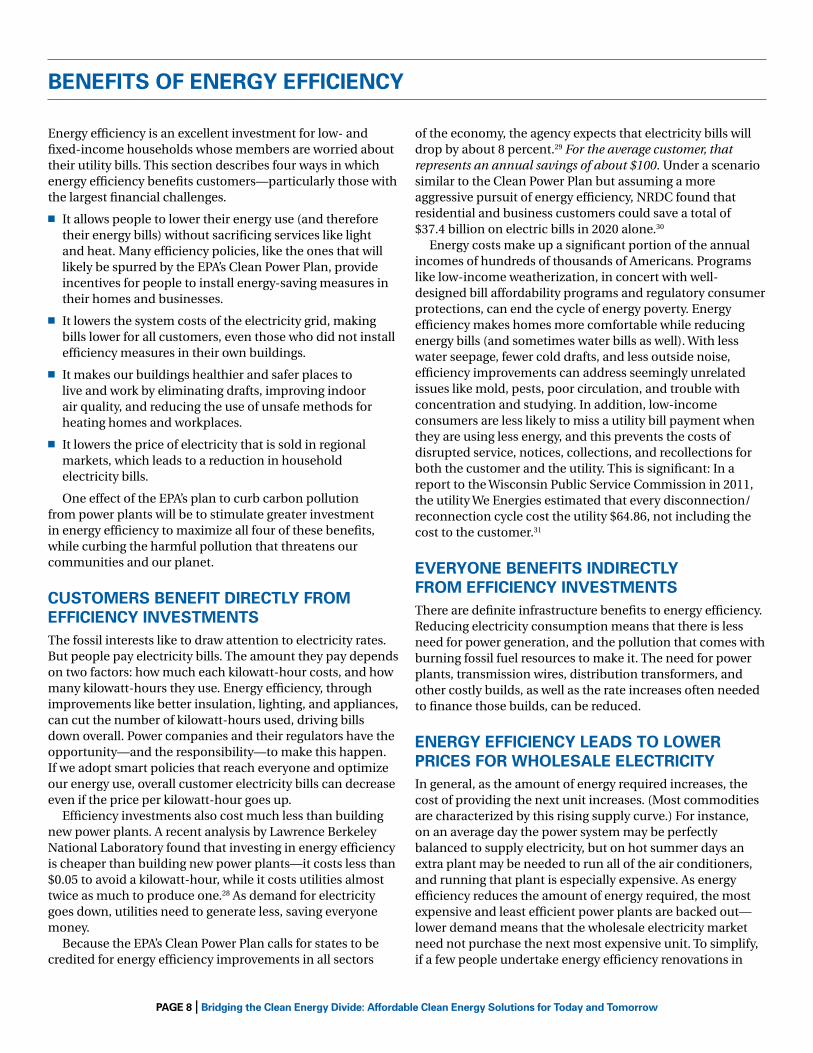
CHEap Coal?In addition, coal has become more expensive to produce because of a basic tenet of economics: diminishing marginal returns. It is harder to get at the remaining coal in many parts of the country, which makes the process more expensive. The EIA’s “Annual Energy Outlook” of 2014 looked at the future of coal in a business-as-usual scenario and projected that the cost of mined coal will increase by 1.4 percent per year because any cost savings that can be achieved from technical improvements will be outweighed by increasingly hard-to-reach reserves.16 In some areas, coal is selling for less than it costs to produce!17
Energy use per capita
Energy use per 2005 dollar of GDP
1980 1990 2000
HISTORY 2012 PROJECTIONS
2010 2020 2030 2040
Source: Energy use per capita and per dollar of gross domestic product in the Reference case, 1980-2040: History: U.S. Energy Information Administration, Monthly Energy Review, September 2013, DOE/EIA-0035(2013/09). Projections: AEO2014 National Energy Modeling System, run REF2014.D102413A.
0.2
0.4
0.6
0.8
1.0
1.2
Figure 2: U.S. energy use per capita and per dollar of gross domestic product, 1980-2040
$/M
MBt
u (u
nit o
f hea
t ene
rgy
from
coa
l)
2004 2010 2014
Source: EIA, Electric Power Monthly
Figure 3: Cost of Delivered U.S. Coal, 2004-2014
1.0
1.5
2.0
2.5
figure 3: Cost of Delivered u.S. Coal, 2004-2014figure 2: u.S. energy use per capita and per dollar of gross domestic product, 1980-2040

paGE 7 | Bridging the Clean Energy Divide: affordable Clean Energy Solutions for Today and Tomorrow
There’s another basic, Economics 101 reason coal companies are experiencing problems: the Law of Supply and Demand. Right now, because coal is costly, dirty, and inconvenient, there is lower-than-historic demand to use it in electricity generation, leading to low purchase prices and reduced revenues for coal producers. While the coal industry claims it wants to lift millions out of poverty, it actually hopes to boost demand for its coal by maintaining or increasing domestic use while increasing exports—thereby raising the prices for its coal as well. Unfortunately for the coal producers, renewables and efficiency have led to
lower European demand, and upticks in coal exports from Australia, Indonesia, Canada, and Russia have been crowding out U.S. coal.18
Low natural gas prices and an increase in efficiency and distributed generation have had an indirect effect on coal prices and have also lowered electricity prices directly. And, while low coal demand and electricity prices may be bad for the coal industry, they are good for consumers. Expanding the use of energy efficiency and renewable energy is, in fact, the best way to help energy-poor and low-income households around the world.
HEalTH impaCTS
Because the power plants that produce carbon pollution also produce other particles and pollutants that directly cause health problems, the EPA’s proposal to limit the plants’ carbon pollution directly benefits human health by cleaning up our power supply. The reduction of harmful co-pollutants will improve air quality and deliver significant health benefits. The agency estimates that the Clean Power Plan can help prevent up to 6,600 premature deaths, 150,000 asthma attacks in children, 3,300 heart attacks, 2,800 hospital admissions, and 490,000 missed work/school days annually in the United States.19
The dangers to human health of air pollution and climate change are well documented, leading to other limits on pollution from the emitters of these pollutants across various sectors of the economy. While carbon emitted into the atmosphere spreads out and becomes global, accumulating over the decades like film on unwashed glass, more potent pollutants remain localized for their lifetime and have a direct impact on the health of people near the emission sources. These include sulfur dioxide (SO2), which in high amounts leads to acid rain; nitrogen oxide (NOx), which reacts with oxygen to create ozone; mercury; arsenic; uranium; lead; and other heavy metals. Coal-fired power plants emit fine particulate pollution (PM2.5), created when sulfur dioxide and nitrogen oxide particles react in the atmosphere. PM2.5 is among the deadliest of pollutants; the tiny size of the particles allows them to easily pass through the throat and nose to enter the lungs and then to other parts of the body, causing chronic bronchitis, heart conditions, aggravated asthma, and sometimes premature death.20
The argument from fossil fuel interests is that fossil fuels, like coal and natural gas, are good for low-income households because energy makes up a disproportionately large part of their budgets. However, health care costs account for a large part as well, and those costs are exacerbated by pollution in the surrounding environment. Roughly 30 percent of childhood asthma is due to environmental exposures, with costs of $4,900 per patient, on average (for the families, but also for the American taxpayer by way of Medicaid).21 Heart
attacks are more likely and cancer is more common, leading to extended hospital stays, surgery, and lost work days.22 If we are truly committed to easing hardship for low-income families, we should be protecting them from the costs of pollutants from dirty electricity generation.
Therefore, in addition to considering the impacts of climate change in driving a transition toward a cleaner economy, we must consider the disproportionate health impacts of dirty, coal-fired power generation on low-income communities and people of color. According to the National Association for the Advancement of Colored People (NAACP), people of color and low-income families are more likely to live in close proximity to the coal plants that generate most of our electricity. People of color make up 36 percent of the U.S. population, but 39 percent of those who live within three miles of a coal-fired power plant.23 Coal plants that are located in urban areas are overwhelmingly sited in communities of color.24 While 56 percent of white Americans live within 30 miles of a power plant, 68 percent of African Americans do. African Americans frequent the emergency room for asthma attacks three times as often as white Americans do.25
A 2010 report from the National Research Council (NRC) found that particulate matter pollution from coal-fired power plants in the United States was complicit in 1,530 excess deaths every year, and that the 402 largest U.S. coal-fired facilities caused $62 billion in damage from SO2, NOx, and PM in 2005 alone.26 Other analyses have found costs many times greater. Harvard University found that adverse health impacts from coal generation cost the public an average of 9.3 cents per kilowatt-hour (kWh) of power generated, and contributed to 24,475 excess deaths in 2005 alone.27 It should be easy to see that these increased health costs add greatly to the cost of electricity that comes from fossil fuels. The argument that moving away from fossil fuels will hurt families with low or fixed incomes is a specious one, as the pollutants from dirty power plants add much more to these families’ costs than do investments in new and cleaner technologies.
paGE 8 | Bridging the Clean Energy Divide: affordable Clean Energy Solutions for Today and Tomorrow
BENEfiTS of ENErGy EffiCiENCy
Energy efficiency is an excellent investment for low- and fixed-income households whose members are worried about their utility bills. This section describes four ways in which energy efficiency benefits customers—particularly those with the largest financial challenges.
n It allows people to lower their energy use (and therefore their energy bills) without sacrificing services like light and heat. Many efficiency policies, like the ones that will likely be spurred by the EPA’s Clean Power Plan, provide incentives for people to install energy-saving measures in their homes and businesses.
n It lowers the system costs of the electricity grid, making bills lower for all customers, even those who did not install efficiency measures in their own buildings.
n It makes our buildings healthier and safer places to live and work by eliminating drafts, improving indoor air quality, and reducing the use of unsafe methods for heating homes and workplaces.
n It lowers the price of electricity that is sold in regional markets, which leads to a reduction in household electricity bills.
One effect of the EPA’s plan to curb carbon pollution from power plants will be to stimulate greater investment in energy efficiency to maximize all four of these benefits, while curbing the harmful pollution that threatens our communities and our planet.
CuSTomErS BENEfiT DirECTly from EffiCiENCy iNvESTmENTSThe fossil interests like to draw attention to electricity rates. But people pay electricity bills. The amount they pay depends on two factors: how much each kilowatt-hour costs, and how many kilowatt-hours they use. Energy efficiency, through improvements like better insulation, lighting, and appliances, can cut the number of kilowatt-hours used, driving bills down overall. Power companies and their regulators have the opportunity—and the responsibility—to make this happen. If we adopt smart policies that reach everyone and optimize our energy use, overall customer electricity bills can decrease even if the price per kilowatt-hour goes up.
Efficiency investments also cost much less than building new power plants. A recent analysis by Lawrence Berkeley National Laboratory found that investing in energy efficiency is cheaper than building new power plants—it costs less than $0.05 to avoid a kilowatt-hour, while it costs utilities almost twice as much to produce one.28 As demand for electricity goes down, utilities need to generate less, saving everyone money.
Because the EPA’s Clean Power Plan calls for states to be credited for energy efficiency improvements in all sectors
of the economy, the agency expects that electricity bills will drop by about 8 percent.29 For the average customer, that represents an annual savings of about $100. Under a scenario similar to the Clean Power Plan but assuming a more aggressive pursuit of energy efficiency, NRDC found that residential and business customers could save a total of $37.4 billion on electric bills in 2020 alone.30
Energy costs make up a significant portion of the annual incomes of hundreds of thousands of Americans. Programs like low-income weatherization, in concert with well-designed bill affordability programs and regulatory consumer protections, can end the cycle of energy poverty. Energy efficiency makes homes more comfortable while reducing energy bills (and sometimes water bills as well). With less water seepage, fewer cold drafts, and less outside noise, efficiency improvements can address seemingly unrelated issues like mold, pests, poor circulation, and trouble with concentration and studying. In addition, low-income consumers are less likely to miss a utility bill payment when they are using less energy, and this prevents the costs of disrupted service, notices, collections, and recollections for both the customer and the utility. This is significant: In a report to the Wisconsin Public Service Commission in 2011, the utility We Energies estimated that every disconnection/reconnection cycle cost the utility $64.86, not including the cost to the customer.31
EvEryoNE BENEfiTS iNDirECTly from EffiCiENCy iNvESTmENTS There are definite infrastructure benefits to energy efficiency. Reducing electricity consumption means that there is less need for power generation, and the pollution that comes with burning fossil fuel resources to make it. The need for power plants, transmission wires, distribution transformers, and other costly builds, as well as the rate increases often needed to finance those builds, can be reduced.
ENErGy EffiCiENCy lEaDS To lowEr priCES for wHolESalE ElECTriCiTyIn general, as the amount of energy required increases, the cost of providing the next unit increases. (Most commodities are characterized by this rising supply curve.) For instance, on an average day the power system may be perfectly balanced to supply electricity, but on hot summer days an extra plant may be needed to run all of the air conditioners, and running that plant is especially expensive. As energy efficiency reduces the amount of energy required, the most expensive and least efficient power plants are backed out— lower demand means that the wholesale electricity market need not purchase the next most expensive unit. To simplify, if a few people undertake energy efficiency renovations in

paGE 9 | Bridging the Clean Energy Divide: affordable Clean Energy Solutions for Today and Tomorrow
their homes or businesses and that results in a reduction in demand for electricity, it may not be necessary to run that one old, dirty coal plant that takes days to start up. Many save on the cost of running that generator, because of the actions of a few; this phenomenon is referred to the Demand-
Reduction Induced Price Effect (DRIPE). To illustrate, DRIPE saves Illinoisans an estimated $150 million every year, on top of the $1 billion they will save by 2016 on their bills and by avoiding unnecessary investments in the grid.32
California: 35+ years of Commitment to Energy
LO HINOT ENERGYEFFICIENT
LO HIENERGYEFFICIENT
APPLIANCES ENERGY DEMAND POWER PLANTSINVESTMENT SAVINGS
DRIPE: The Demand-Reduction Induced Price Effect
California: 35+ years of Commitment to Energy Efficiency
California has been leading the way on energy efficiency since the 1970s, saving Californians at least $75 billion to-date.33 The state has been finding ways to support smarter use of energy like upgrading old, drafty homes and setting better standards for energy-guzzling appliances. These investments have benefited all Californians. Electricity consumption per person in the state is now lower than it was in 1973.34 And California residents pay an average monthly electric bill that is lower than all but nine other states in the nation, $20 less than the average U.S. household.35 Since 2006 alone, efficiency programs delivered by private and public utilities, third parties, local governments, and trade allies have saved customers nearly $12 billion after accounting for the cost of the programs. In other words, utility customers paid $12 billion less on energy services than they would have without efficiency.36
Low-income households have not been left out of these savings. While California’s efficiency efforts help make everyone’s utility bills more affordable, targeted efforts assist lower-income households in improving efficiency and reducing energy bills. Indeed, in May 2001, California regulators set a goal of reaching 100 percent of low-income customers who want to participate in energy efficiency programs by 2020.37 Between 2002 and 2012, the state’s regulated utilities provided energy efficiency services to nearly 2.5 million low-income households.38
The largest low-income energy efficiency program in the state is the Energy Savings Assistance program (ESA), overseen by the California public Utilities Commission (CpUC). Under this program, which aims to reduce energy consumption and lower costs while improving health, comfort, and safety, all four large utilities in the state provide efficiency services—including attic insulation, efficient refrigerators and air conditioners, caulking, low-flow showerheads, and more—at no cost to low-income households. The program also provides education on how to use energy more efficiently and helps to connect participants with other low-income programs that can help them save on other essentials like housing and food. participants in the ESA program save nearly $400 on average during the life of the efficiency upgrades.39 Since 2006, according to conservative estimates, the program has saved enough electricity to power 80,000 California homes for one year and enough natural gas to heat approximately 52,000 California homes for one year.40 In a survey prepared for the CpUC in 2012 by Evergreen Economics, a majority of ESA participants said they noticed improvements in their safety and comfort and reduced bills as a result of ESA participation, with 81 percent noting lower energy bills, 64 percent feeling safer, 65 percent feeling more comfortable, and 44 percent noticing health improvements in household members.41
DripE: The Demand-reduction induced price Effect
paGE 10 | Bridging the Clean Energy Divide: affordable Clean Energy Solutions for Today and Tomorrow
NoN-ENErGy BENEfiTS of ENErGy EffiCiENCyBesides cutting energy costs for households and businesses, energy efficiency has many other non-energy benefits (NEBs). These are often hard to quantify, but studies estimate that these very real benefits are often worth far more than the energy and bill savings themselves. In other words, the non-energy benefits are often the most beneficial aspect of energy efficiency. These NEBs are commonly classified according to who receives the benefits: utilities, participants/tenants, owners of rental properties, and society in general.
n utility NEBs: Utilities benefit from energy efficiency because lower energy bills for program participants can mean fewer problems with bill payment. Utilities have reduced collection costs, need to subsidize fewer households’ electricity rates, and avoid the costs of service terminations and reconnections. These savings may be amplified in affordable multifamily housing, where an investment in a single building yields savings for multiple units. Utilities’ customer relations and overall reputation also benefit, given the value that customers place on thermal comfort in their homes.
n participant NEBs: The people who pay the electricity bills enjoy benefits from efficiency that go beyond lower costs. These include increased comfort, improved health and safety, and increased property value. For instance, upgrading building envelopes in order to save energy can also reduce pest infestations. In another example, a 2008 New Zealand study found that weatherization reduced wheezing and cold symptoms for people with respiratory problems and resulted in fewer missed days of school and work and fewer hospital admissions—all in addition to the 23 percent energy savings. The next year, another study found that children with asthma had reduced symptoms and missed less school with the installation of insulation and sustainable heating.42
n owner NEBs: Multifamily building owners experience many non-energy benefits of efficiency. Rent is more likely to be on time, tenant turnover drops because of increased affordability and comfort, and new equipment needs less maintenance. A report conducted by Tetra Tech for the state of Massachusetts found that reduced maintenance for lighting is most valuable for owners, saving them $66.73 per housing unit per year on time and bulbs, while reduced tenant complaints are worth an estimated $19.61 per year to building owners.43
n Societal NEBs: There are also indirect program effects that accrue to society at large. These include impacts on the environment, the economy, and energy security. Low-income communities in particular may experience a reduction in inequality, and as families move above the poverty level, social service agencies may be able to turn their attention to other families in need.
It is especially important to include non-energy benefits when considering the costs and benefits of efficiency programs for low-income customers. Because all program costs are paid by the publicly regulated utilities, it is harder for these programs to pass traditional cost-benefit tests. Including the NEBs can often be the difference in justifying the costs of these programs, and analyzing and quantifying them as much as possible yields a more accurate and complete account of returns on these public investments. In cost-benefit tests, NEBs are often included through a mechanism called an “adder,” which multiplies the benefits of energy efficiency beyond cost and energy savings to include many of the NEBs outlined above. An analysis by Skumatz Economic Research Associates (SERA) for Xcel Energy looked at the NEBs for the utility’s low-income energy efficiency programs and found that the NEBs were on average worth 185 percent of the cost and energy benefits.44 That is, the four low-income programs analyzed were more valuable because of their benefits for health, economic development, and financial savings for utilities than they were because of the energy saved and bill reductions. A later analysis by SERA for NRDC found a similar value (184 percent) from NEBs ranging from improved home aesthetics ($18 per household per year) to knowledge of and control over bills ($35) to wastewater bill savings ($15).45 In testimony to the Public Utilities Commission of Colorado, Tim Woolf of Synapse Energy Economics recommended an adder of a conservative 70 percent for low-income programs in Colorado, acknowledging more of the NEBs than the state would with its existing 25 percent adder. In his analysis, Woolf found that the NEBs from Colorado’s low-income programs had a value equal to $1.9 million in 2013.46
ENErGy EffiCiENCy aND afforDaBlE HouSiNG Whether owned housing is affordable for an individual or family depends not only on the nominal rent or mortgage payment, but also on regular monthly expenses that include maintenance costs, transportation costs to and from work, and most pertinent to this report, utility costs. Energy inefficient housing can be expensive, even if the nominal mortgage payment or rent is low, and energy efficiency can make a big difference in achieving and keeping the dream of home ownership. A study from the University of North Carolina at Chapel Hill and the Institute of Market Transformation found that mortgages secured by families in houses meeting Energy Star efficiency standards experienced substantially lower rates of delinquency and default, with 32 percent fewer defaults compared with non-Energy Star homes. And further, beyond the Energy Star designation as efficiency improves, the risk of default decreases.47 The obvious implication is that the cost savings from energy improvements makes it more possible for families to pay their mortgages.

paGE 11 | Bridging the Clean Energy Divide: affordable Clean Energy Solutions for Today and Tomorrow
The SavE act (S. 1737)
The SAVE Act (S. 1737) is a bipartisan bill meant to help lenders better determine whether a loan applicant can afford a mortgage loan on a particular house. As it stands today, lenders consider the applicant’s income as compared with expenses, but they assume that everyone will have average utility bill expenses. In reality, these expenses may vary widely. The SAVE Act would require federal mortgage agencies, including Fannie Mae, Freddie Mac, and the Federal Housing Administration, to assess expected energy expenses when evaluating whether a loan applicant can afford home ownership. The lender would also share with the loan applicant the estimate of utility expenses in the house. This would arm potential homeowners with more information about the homes they are considering, protecting in particular those who are planning to buy houses with very high energy expenses. Today, many home buyers do not know the actual energy expenses of their new home until the first year’s worth of bills have arrived. Under the SAVE Act, if a home is unaffordable because of high energy costs, the loan process could help to reveal this information to the home buyer. This is already being done in the U.S. Veterans Administration’s residential mortgage program, which instructs lenders to include utilities and maintenance expenses in their underwriting assessments. In comparison with the average lender, VA loans experienced substantially better loan performance, with fewer delinquencies and defaults, during the recent default crisis.48
mulTifamily HouSiNGMultifamily housing accounts for 26.1 percent of all housing units in the United States, providing homes to more than 17 million households nationwide—including nearly one-half of all very low-income renters.49 Multifamily buildings have remained largely untouched by energy efficiency improvements; those improvements could save building owners and residents up to $3.4 billion every year, according to Elevate Energy, a Chicago nonprofit organization that works to improve access to energy efficiency.50 In 2005 alone, U.S. energy bills in multifamily buildings reached $18.03 billion, and they have been increasing every year since.51 As long as energy efficiency in multifamily buildings remains mostly untapped, especially for affordable multifamily dwellings, many of the families least able to afford high energy bills will continue to face tough choices. However, dedicated energy efficiency programs, like the Energy Savers program (see text box) have driven cost-effective upgrades in multifamily buildings that have reduced energy use by 15 to 30 percent.52
Another effort to change this dynamic involves an initiative by a number of national organizations, including NRDC, the National Housing Trust, and the Energy Foundation, to advocate that utilities in a dozen states increase funding for efficiency for the affordable multifamily housing sector and improve existing programs’ effectiveness. Called Energy Efficiency for All (EEFA), it knits together on-the-ground coalitions of local groups and provides the resources and networks needed to advocate to the many stakeholders that drive change on this issue. EEFA also works to ensure building owners can effectively access utility programs, by increasing the resources and information available to them and advocating for positive changes to utility programs. To date, this effort has helped expand and improve utility programs for energy efficiency in eight states.

paGE 12 | Bridging the Clean Energy Divide: affordable Clean Energy Solutions for Today and Tomorrow
Energy Savers
Energy Savers is a Chicago-based energy efficiency program that guides the owners of multifamily buildings through every step of the retrofit process, from building assessment to installation to the verification of savings. Chicago is ripe for efficiency investments in its multifamily housing stock: With 874,107 units, it represents more than one-fourth of all housing in the area.53 Energy Savers has provided $14 million in loans and grants to buildings that comprise almost 7,000 units.54 Three of these buildings, the Boulevard Apartments, were owned and retrofitted by the Bickerdike redevelopment Corporation. The buildings contain 70 housing units, 15 of which have residents who receive federal assistance for very low-income households. The Energy Savers retrofits in 2011 included improvements in insulation and furnace replacements. After the retrofits, overall utility expenses dropped by 10 percent and maintenance and repair expenses dropped by 17 percent. A year later, a survey of tenants found that they had observed a difference after the insulation was improved, with 8 out of 10 reporting that their units stayed warm when it was cold outside (especially important in Chicago, where winters can be frigid). It was also an instructive experience for the tenants, with 89 percent reporting that they would ask about energy efficiency in future moves. one-third of tenants reported less stress about paying rent and utility bills.55
ENErGy EffiCiENCy for fixED-iNComE HouSEHolDSAs seniors enter retirement, most of them must live on fixed incomes and face many of the same constraints as low-income households. Nor do seniors only face fixed incomes: many seniors face the challenges of a low, fixed income. And this situation is not restricted to seniors: Many non-elders with disabilities also must live on a fixed low income. Seniors and people with chronic illness or disability are more vulnerable to heat and cold as well as pollutants from power plants. There are various programs in place around the United States that offer energy efficiency improvements to fixed-income households and communities, adding to the quality of life for seniors and people with disabilities and allowing them to stay healthy, remain active, and keep warm year-round.
For example, the Energy Efficiency and Conservation Block Grant (EECBG) program run by the U.S. Department of Energy (DOE) awarded a grant to the Greater Randolph Senior Center in Converse, Texas. The center serves 13 small communities in Bexar County, a population of about 200,000. With funding from the U.S. Department of Housing and Urban Development (HUD), the senior center had made energy upgrades; with the EECBG grant it conducted an
energy audit and identified additional ways to save energy. The county spent $65,739 on more efficient lighting, heating, and air conditioning and an energy-saving water heater. It also installed a 7 kilowatt solar photovoltaic system. In just two years since the retrofit, the Greater Randolph Senior Center has saved more than 45 percent on its energy bills, allowing it to redirect those funds to provide additional services and programs.56
Most states and some counties offer weatherization programs to seniors—adding insulation, caulking windowpanes, replacing siding, and more. As an example of the extended opportunities for senior homeowners, at the end of October 2014 a new weatherization program was announced in Nevada, the Home Energy Retrofit Opportunities for Seniors (HEROS) program. Funded by the Governor’s Office of Energy and administered by the Nevada Housing Division, the program offers energy efficiency measures to senior and disabled homeowners at no cost, allowing them to reduce their monthly energy expenses. HEROS provides an energy assessment to home-owning seniors and persons with disabilities. Based on the results of that assessment, and through a network of nonprofit service provider agencies, the program installs up to $6,000 of weatherization measures such as solar screens, insulation, and HVAC repairs.57
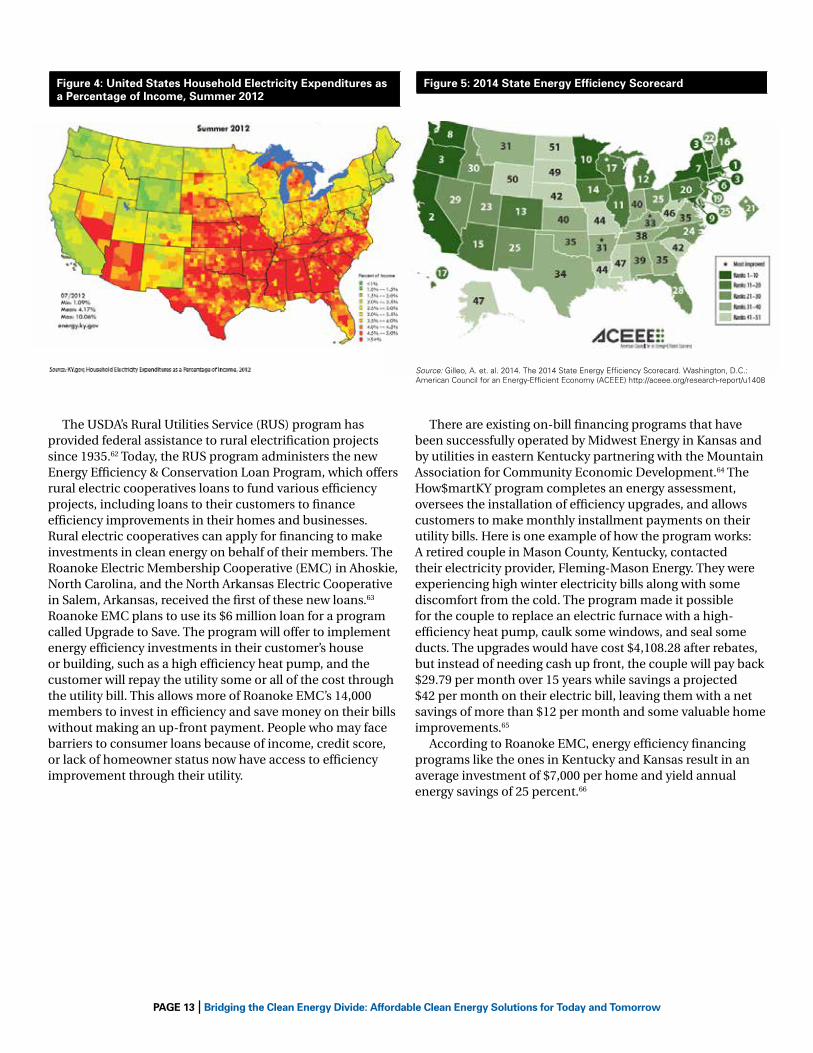
ENErGy EffiCiENCy iN rural amEriCaRural communities experience poverty at a higher rate than do other communities. According to the U.S. Department of Agriculture (USDA), 17.7 percent of rural families fall below the federal poverty guidelines, compared with 14.5 percent in the rest of the country.58 Rural communities are often served by electric cooperatives, power generators and distributors which first took form in the 1930s under Franklin D. Roosevelt to address the fact that 9 in 10 rural households were still without power. Rural electric cooperatives provide electricity to households and businesses in 327 out of the nation’s 353 “persistent poverty counties,” where the poverty rate has remained above 20 percent for decades.59 Rural electric cooperatives face constraints that utilities in population-dense areas do not face. For instance, because they must spread the costs of maintaining transmission lines among fewer people, their electricity rates are, on average, higher than those of non-rural utilities.60 That is, without investments in energy efficiency that lower the amount of energy used, electricity costs are generally higher for households in regions characterized by the highest and most persistent poverty rates. Unlike the larger, investor owned utilities, rural electric cooperatives are often unregulated, but they are member-owned and often seek to provide efficiency services to address those high electricity bills. Figures 4 and 5 below suggest that the high percentage of income that is devoted to energy bills in some regions—particularly in less population-dense states—may be inversely related to the level of investment in energy efficiency.61
paGE 13 | Bridging the Clean Energy Divide: affordable Clean Energy Solutions for Today and Tomorrow
The USDA’s Rural Utilities Service (RUS) program has provided federal assistance to rural electrification projects since 1935.62 Today, the RUS program administers the new Energy Efficiency & Conservation Loan Program, which offers rural electric cooperatives loans to fund various efficiency projects, including loans to their customers to finance efficiency improvements in their homes and businesses. Rural electric cooperatives can apply for financing to make investments in clean energy on behalf of their members. The Roanoke Electric Membership Cooperative (EMC) in Ahoskie, North Carolina, and the North Arkansas Electric Cooperative in Salem, Arkansas, received the first of these new loans.63 Roanoke EMC plans to use its $6 million loan for a program called Upgrade to Save. The program will offer to implement energy efficiency investments in their customer’s house or building, such as a high efficiency heat pump, and the customer will repay the utility some or all of the cost through the utility bill. This allows more of Roanoke EMC’s 14,000 members to invest in efficiency and save money on their bills without making an up-front payment. People who may face barriers to consumer loans because of income, credit score, or lack of homeowner status now have access to efficiency improvement through their utility.
There are existing on-bill financing programs that have been successfully operated by Midwest Energy in Kansas and by utilities in eastern Kentucky partnering with the Mountain Association for Community Economic Development.64 The How$martKY program completes an energy assessment, oversees the installation of efficiency upgrades, and allows customers to make monthly installment payments on their utility bills. Here is one example of how the program works: A retired couple in Mason County, Kentucky, contacted their electricity provider, Fleming-Mason Energy. They were experiencing high winter electricity bills along with some discomfort from the cold. The program made it possible for the couple to replace an electric furnace with a high-efficiency heat pump, caulk some windows, and seal some ducts. The upgrades would have cost $4,108.28 after rebates, but instead of needing cash up front, the couple will pay back $29.79 per month over 15 years while savings a projected $42 per month on their electric bill, leaving them with a net savings of more than $12 per month and some valuable home improvements.65
According to Roanoke EMC, energy efficiency financing programs like the ones in Kentucky and Kansas result in an average investment of $7,000 per home and yield annual energy savings of 25 percent.66
figure 4: united States Household Electricity Expenditures as a percentage of income, Summer 2012
figure 5: 2014 State Energy Efficiency Scorecard
Source: Gilleo, A. et. al. 2014. The 2014 State Energy Efficiency Scorecard. Washington, D.C.: American Council for an Energy-Efficient Economy (ACEEE) http://aceee.org/research-report/u1408
paGE 14 | Bridging the Clean Energy Divide: affordable Clean Energy Solutions for Today and Tomorrow
BENEfiTS of rENEwaBlE ENErGy
Renewable energy brings obvious benefits. Installations can be sited on urban rooftops or in fields of corn, they use no water (important in arid regions), and they have little to no environmental side effects. While fuel may account for up to 90 percent of the wholesale price of electric power from coal- and gas-burning plants, wind and solar have no fuel costs. The savings can be significant: In Texas, for instance, wind energy saved consumers $736 million in 2013, while Illinois saw $176.85 million in savings from the integration of renewable resources in 2011.67 As more renewable energy comes onto the grid, it reduces demand for the most expensive fossil power, saving consumers money. A report by PJM Interconnection LLC, the largest grid operator in the nation, found that generating 30 percent of the electricity in its region with renewable energy— which would reduce harmful pollution without compromising reliability—would save consumers up to 30 percent, even after factoring in the cost of additional transmission lines.68
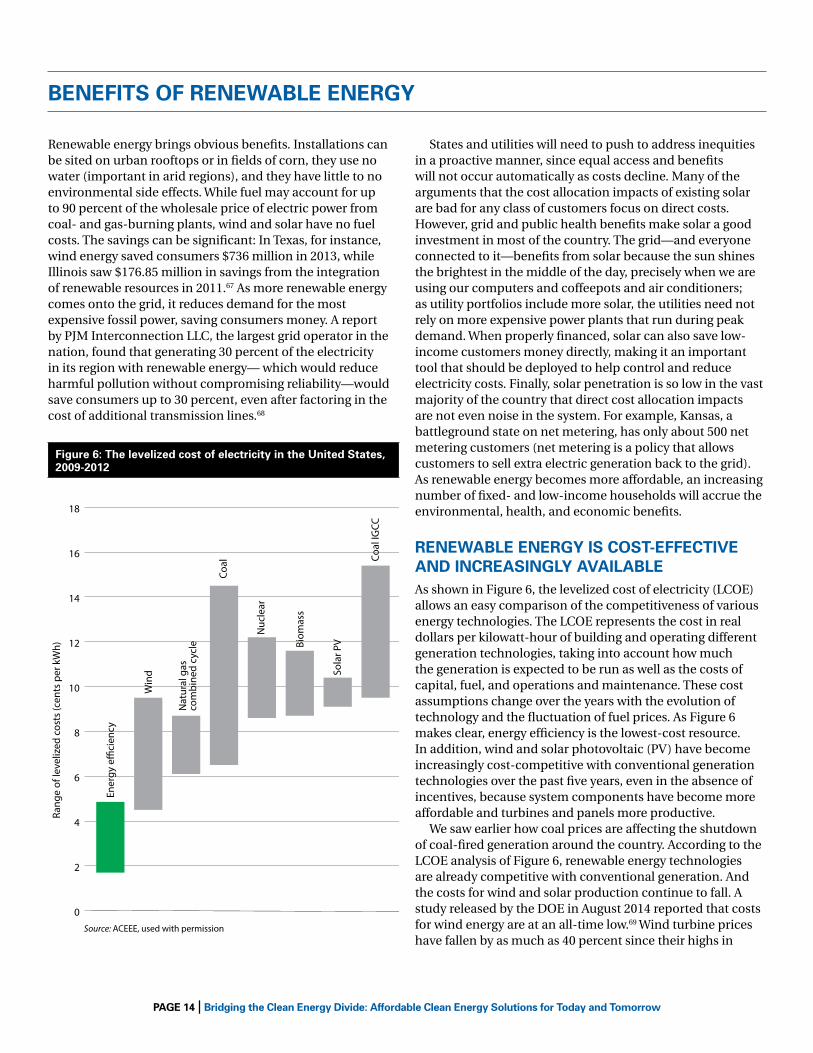
Source: ACEEE, used with permission
Figure 4: The levelized cost of electricity in the United States, 2009-2012
0
2
4
6
8
10
12
14
16
18
Coal
IGCC
Sola
r PVBi
omas
s
Nuc
lear
Coal
Nat
ural
gas
com
bine
d cy
cle
Win
d
Ener
gy e
�ci
ency
Rang
e of
leve
lized
cos
ts (c
ents
per
kW
h)
figure 6: The levelized cost of electricity in the united States, 2009-2012
States and utilities will need to push to address inequities in a proactive manner, since equal access and benefits will not occur automatically as costs decline. Many of the arguments that the cost allocation impacts of existing solar are bad for any class of customers focus on direct costs. However, grid and public health benefits make solar a good investment in most of the country. The grid—and everyone connected to it—benefits from solar because the sun shines the brightest in the middle of the day, precisely when we are using our computers and coffeepots and air conditioners; as utility portfolios include more solar, the utilities need not rely on more expensive power plants that run during peak demand. When properly financed, solar can also save low-income customers money directly, making it an important tool that should be deployed to help control and reduce electricity costs. Finally, solar penetration is so low in the vast majority of the country that direct cost allocation impacts are not even noise in the system. For example, Kansas, a battleground state on net metering, has only about 500 net metering customers (net metering is a policy that allows customers to sell extra electric generation back to the grid). As renewable energy becomes more affordable, an increasing number of fixed- and low-income households will accrue the environmental, health, and economic benefits.
rENEwaBlE ENErGy iS CoST-EffECTivE aND iNCrEaSiNGly availaBlEAs shown in Figure 6, the levelized cost of electricity (LCOE) allows an easy comparison of the competitiveness of various energy technologies. The LCOE represents the cost in real dollars per kilowatt-hour of building and operating different generation technologies, taking into account how much the generation is expected to be run as well as the costs of capital, fuel, and operations and maintenance. These cost assumptions change over the years with the evolution of technology and the fluctuation of fuel prices. As Figure 6 makes clear, energy efficiency is the lowest-cost resource. In addition, wind and solar photovoltaic (PV) have become increasingly cost-competitive with conventional generation technologies over the past five years, even in the absence of incentives, because system components have become more affordable and turbines and panels more productive.
We saw earlier how coal prices are affecting the shutdown of coal-fired generation around the country. According to the LCOE analysis of Figure 6, renewable energy technologies are already competitive with conventional generation. And the costs for wind and solar production continue to fall. A study released by the DOE in August 2014 reported that costs for wind energy are at an all-time low.69 Wind turbine prices have fallen by as much as 40 percent since their highs in

paGE 15 | Bridging the Clean Energy Divide: affordable Clean Energy Solutions for Today and Tomorrow
2008, and these reductions are pushing project-level costs down. Wind energy is on the verge of edging out fossil fuels in affordability, with electricity from wind dropping in price from $2,200 to $1,630 per kilowatt in a few short years.
DiSTriBuTED aND CommuNiTy-SCalE rENEwaBlES for low-iNComE HouSEHolDSAs the capital costs for solar PV fall precipitously, and as states undertake aggressive new funding and innovative program design, solar promises to significantly reduce the energy burden of low-income households. The lower capital costs mean that expanding access to solar among low-income communities becomes more feasible. Community solar gardens, programs to train workers and install distributed generation (generation on-site, where it is actually consumed), and innovative financing models have all expanded access to renewable energy.
Community SolarThe need for costly up-front investments has been a barrier to the deployment of solar in low-income communities in the past. One way to expand solar to low-income communities is by developing community solar, which, by pooling the resources of multiple community members, allows people to purchase as little or as much renewable energy as they can afford. The projects are especially beneficial for crowded urban areas like the New York City area, where the electric grid is already overextended. Community solar paired with remote, or virtual, net metering programs allow customers who do not have or own their roofs to directly participate
as part-owners and investors in real, tangible solar projects that, in partnership with the utilities’ superior knowledge of the grid, are targeted geographically to parts of the system that most need local generation. With community solar in strategic places, close to load centers where power demand is greatest, it can reduce stress and strain on the grid as well as transmission losses that eat up fully 6 percent of the electricity generated in the United States.70 While some community solar programs require up-front panel purchases, many work on a subscription model that lets you pay as you go, making these solar arrays accessible to low-income customers. Recognizing these benefits, New York State will allow investments in community solar as early as this spring.
Green Mountain Power (GMP) is one pioneering utility working to install solar in Rutland, Vermont. Most of these community solar grants are offered to non-profit organizations: GMP matches the organization’s investment in on-site generation for up to $20,000. GMP’s grantees in 2013 included Rutland Regional Community Television, Good Shepherd Lutheran Church, and Vermont Farmers Food Center, all experiencing lower electricity bills today.71 In another instance, GMP owns, operates, and maintains a 150 kW solar array at Rutland Regional Medical Center. GMP benefits from access to the Medical Center’s grounds, and the Medical Center benefits because it receives 10 percent of the system’s output as a credit towards their electricity needs. Finally, in partnership with the local government, GMC added a 2.3 megawatt (MW) solar installation on an empty, abandoned landfill. GMP is certainly a pioneer, but it is not alone. In December 2014, Xcel Energy in Minnesota began accepting applications for community solar with plans already under way to install solar at Bethel Evangelical
paGE 16 | Bridging the Clean Energy Divide: affordable Clean Energy Solutions for Today and Tomorrow
Lutheran Church and at Northern Sun Merchandising, a small business in Minneapolis.72 Other programs are working in locales as varied as Sacramento, California; Brighton, Colorado; and Shepherdstown, West Virginia.73 Not only do community solar gardens make renewable energy investments a possibility for lower-income households, but they also can be sited in repurposed toxic, abandoned, or unsightly spaces or on large, well-situated rooftops, which may aid in the rehabilitation of existing buildings.
Expanding programs to encourage solar gardens in other states will improve access to renewable energy. And other programs to promote distributed generation for low-income households are needed.
Grid alternativesOne program that successfully encourages the aggressive deployment of solar power among low-income families is California’s Grid Alternatives. In 2007, the state launched a Go Solar California campaign to meet a goal of deploying 3,000 MW of solar PV to homes and businesses by 2016.74 As part of that campaign, the California Solar Initiative (CSI) offers rebates for every watt of solar installed; 10 percent of its $2 billion in funding is reserved to support the installation of solar on low-income households. One of the low-income programs under CSI is the Single Family Affordable Housing Program (SASH), managed by Grid Alternatives, an Oakland-based nonprofit. With $108 million in funding, SASH fully or partially subsidizes 1-kilowatt solar PV systems for low-income households. Grid Alternatives has installed more than 4,400 systems across the state of California. The labor costs in installation normally make up about 10 percent of the cost of a residential solar PV system; by using a volunteer-based installation model, Grid Alternatives has significantly reduced costs.75 As Grid Alternatives has trained more than 16,000 volunteers, the organization has been able to educate consumers and community members, thereby addressing an additional challenge to renewable generation: information barriers.76
Navigant Consulting performed an analysis for the California Public Utilities Commission on SASH’s impacts in its first several years of operation. The analysis found that the rate of PV installation has been steadily increasing, showing that there does exist a demand for clean energy in low-income communities and that information about its availability is spreading. With distributed solar reducing the need for generation during the busiest and most energy-intensive hours of the day, Navigant estimated a peak demand reduction of about 26 kW in 2009, reaching 208 kW by the next year. Though these amounts are small, they are still significant because by reducing demand during the hours when electricity is most needed, utilities can avoid running their older, dirtier, and more expensive peak generation facilities, and they may also be able to defer the need for new generating capacity or delivery infrastructure. And families are seeing direct benefits: In 2010, the average SASH participant saw energy bills go down by $336 per year.77
Solar as an Employee BenefitThe Solar Community Initiative was launched in October 2014 by the World Wildlife Fund and four major corporations: Cisco Systems, 3M, Kimberly-Clark, and National Geographic. Employees of these companies will be able to buy or lease residential solar PV systems at reduced cost as one of their corporate benefits, using an online marketer of solar PV systems, Geostellar.78 Because there are more than 100,000 employees who can take advantage of this program, Geostellar will be able to coordinate bulk purchases and achieve major discounts on home systems. As a result, the employees and some friends and family can achieve solar at rates substantially lower than the national average – about 17 percent lower than the already-low price that Geostellar usually achieves, and almost 34 percent lower than the average cost in the United States.79 Under the program, homeowners can have solar panels installed for zero money down, saving more than 30 percent every month on their utility bills and making clean energy even more affordable. Once more, this reflects growing interest in making clean energy accessible to people of all income levels. And as more groups, cities, and companies join the Solar Community Initiative, the increasingly large pool of employees will be able to leverage its purchasing power even more and achieve even greater savings.
wiND BENEfiTS rural arEaSRenewable power has also brought significant benefits to rural areas across the country. Specifically, wind farms have revitalized rural areas that have seen stagnant or declining populations and income since 1970.80 As populations have shifted to city centers, rural areas have lost much of their tax base. Wind is bringing it back in many locales.
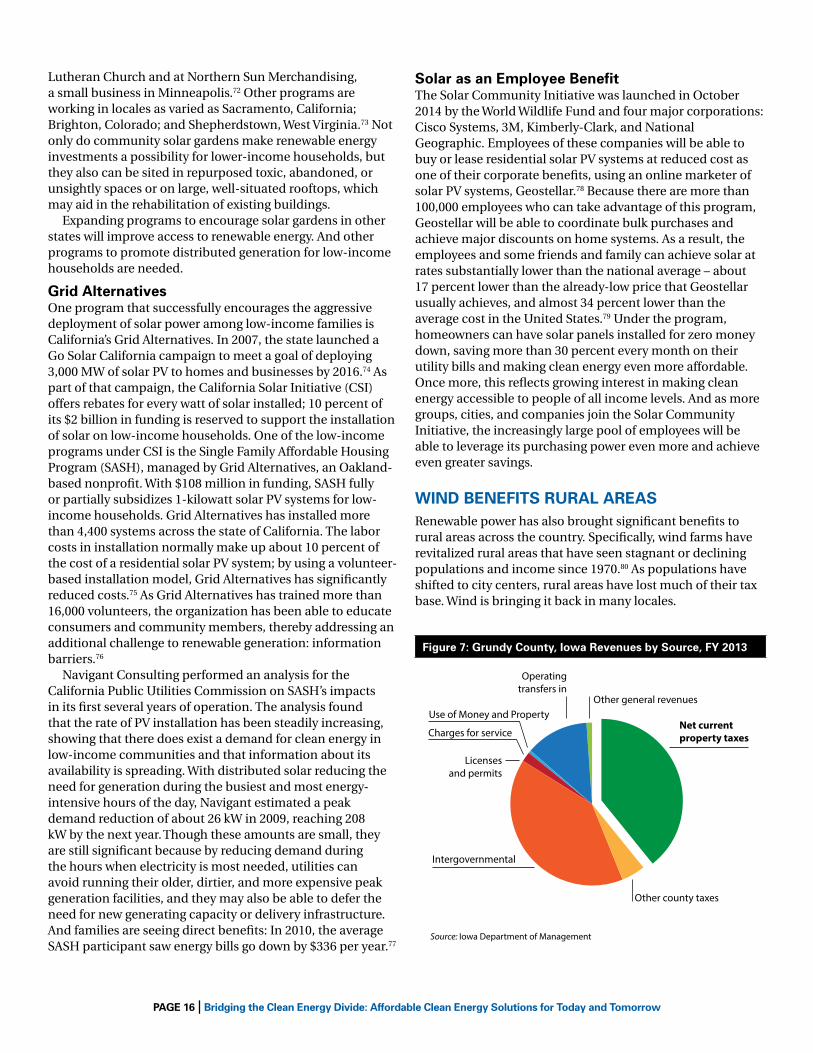
Source: Iowa Department of Management
Figure 7: Grundy County, Iowa Revenues by Source, FY 201
Other general revenues
Net current property taxes
Other county taxes
Intergovernmental
Licensesand permits
Charges for service
Use of Money and Property
Operatingtransfers in
figure 7: Grundy County, iowa revenues by Source, fy 2013
paGE 17 | Bridging the Clean Energy Divide: affordable Clean Energy Solutions for Today and Tomorrow
<$30
CORN PRODUCTION
$100
GOLFCOURSE
$500 – $620
HOGCONFINEMENT
$700
RESIDENTIAL
$30,000+
WINDFARM
WELLSBURG WIND FARM
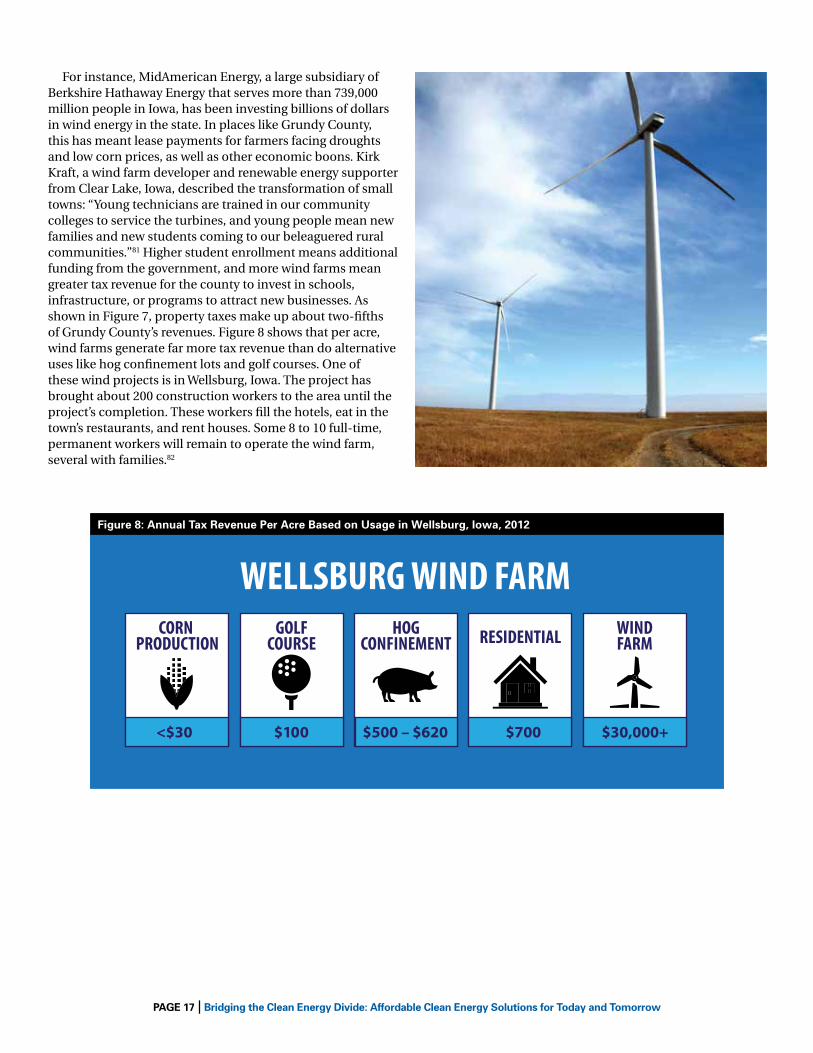
figure 8: annual Tax revenue per acre Based on usage in wellsburg, iowa, 2012
For instance, MidAmerican Energy, a large subsidiary of Berkshire Hathaway Energy that serves more than 739,000 million people in Iowa, has been investing billions of dollars in wind energy in the state. In places like Grundy County, this has meant lease payments for farmers facing droughts and low corn prices, as well as other economic boons. Kirk Kraft, a wind farm developer and renewable energy supporter from Clear Lake, Iowa, described the transformation of small towns: “Young technicians are trained in our community colleges to service the turbines, and young people mean new families and new students coming to our beleaguered rural communities.”81 Higher student enrollment means additional funding from the government, and more wind farms mean greater tax revenue for the county to invest in schools, infrastructure, or programs to attract new businesses. As shown in Figure 7, property taxes make up about two-fifths of Grundy County’s revenues. Figure 8 shows that per acre, wind farms generate far more tax revenue than do alternative uses like hog confinement lots and golf courses. One of these wind projects is in Wellsburg, Iowa. The project has brought about 200 construction workers to the area until the project’s completion. These workers fill the hotels, eat in the town’s restaurants, and rent houses. Some 8 to 10 full-time, permanent workers will remain to operate the wind farm, several with families.82

paGE 18 | Bridging the Clean Energy Divide: affordable Clean Energy Solutions for Today and Tomorrow
renewable Energy in Developing Nations
It is worth taking a moment to address the argument that fossil fuels are needed to lift billions of people out of poverty around the world. Energy poverty is certainly a critical problem, but fossil fuels are not the only answer.
According to the United Nations, 1.3 billion people live without access to electricity today, and more than one-third of the world’s population still relies on traditional biomass like wood for cooking and heating.83 Even where electricity services are made available, there often are high barriers to access, such as cost. Access to reliable electricity is necessary for development and the accompanying improvements in education, health, food security, and more; equitable access to reliable electricity is necessary for equitable development.
renewable energy can play a central role in providing modern energy services. Without an intransigent, fossil fuel–reliant infrastructure, energy-poor nations will face less pressure (and fewer costs) to retool existing coal or natural gas facilities. renewable energy does not draw on scarce water resources, as conventional power plants must for cooling purposes, leaving water for human and agricultural use. And renewable technologies are intrinsically local. Wind energy can be concentrated on windy plains and in windy valleys, solar energy can be deployed in deserts, tidal energy can be harnessed along the coast. Distributed, renewable energy could stimulate local economies, providing employment opportunities and strengthening a nation’s tax base.
Many developing countries are giving priority to renewable energy options in their energy policies. Solar has been growing rapidly in India. The Ministry of New and renewable Energy (MNrE) in India is financing a round of solar projects through the National Solar Mission, with a goal of adding to the almost 3 gigawatts (GW) of solar installed as of November 2014 and reaching 100 GW by 2019.84 The country is also aiming to achieve 40 GW of onshore wind power by 2019, doubling its currently installed wind capacity. In February 2014, MNrE announced plans to launch a National Wind Mission, targeting a goal of 100 GW of utility-scale wind power and 1 GW of distributed wind power by the end of 2022.85 renewable energy is incredibly cost-effective in India: Solar pV is now cheaper than imported coal.86 According to Bob Lieberman of the regulatory Assistance project, India is turning to renewables to address energy poverty because once installed, the technologies have almost no additional cost. “If a decade ago renewable energy adoption was solely an aspirational goal, today it is rapidly becoming a commercial proposition with important and positive social macroeconomic impacts while continuing to provide affordable electricity.”87
A nation’s economic development does not always correlate with access to cheap energy. Indonesia, with 81 million people without electricity in 2009, makes the top 10 list in the world for the sheer number of people lacking access to electricity. And yet it is a net energy exporter, selling abroad about 75 percent of its coal, the most coal by weight of any country in the world.88 Cheap and abundant fossil fuels are not the answer to energy poverty.
Where electricity prices are high, as in Fiji and Cambodia, it is mostly because of the cost of importing fuels like diesel.89 once more, the fuel-free nature of renewables would be a boon in reducing costs for households. renewables are a logical response when people lack access to grid infrastructure, and they are often cheaper. Much of the world population without access to electricity is rural and would be served particularly well by technologies that are smaller and easier to transport, and that require less transmission and distribution infrastructure. The International Energy Agency (IEA) projects that investments of $30.6 billion every year would eliminate energy poverty by 2030. For a total of $586 billion, universal electrification could be achieved, with a focus on low-carbon, off-grid electricity in rural areas.90 To put this number in perspective, countries spent $544 billion in 2012 alone to directly subsidize fossil fuels.

paGE 19 | Bridging the Clean Energy Divide: affordable Clean Energy Solutions for Today and Tomorrow
rEliaBiliTy
Another oft-voiced concern is the reliability of our electric grid. Low-income households are disproportionately affected by the loss of electricity, especially during extreme cold or heat. In the summer of 2012, high temperatures in Maryland, Ohio, Virginia, and West Virginia, combined with a series of powerful thunderstorms, knocked out electricity for almost 4 million people for as long as a week. Thirty-two people died from excessive heat exposure, which was possible because of the loss of power.91 Sadly, seniors, children, and those already suffering from conditions like asthma and heart disease are more vulnerable than average to this type of adverse situation. A simple conclusion one might draw is that distributed generation can be a boon to community resiliency: While a storm may take out some solar panels or disrupt some wind turbines, it would be highly unlikely to destroy everything. This is one argument for the strength of clean energy in combating reliability and resiliency issues in energy access, and there are many other reasons to believe that reliability concerns have been exaggerated.
CloSurE prEDiCTioNS HavE BEEN ovErSTaTEDThe Clean Power Plan would require a modest shift in resources compared with business as usual. Power plants are already being closed all over; those slated to close by the end of 2015 ran only 38 percent of the time in the first half of last year because they were expensive to operate and were not needed to meet demand.92 The nation’s electric grid operators have confirmed that planned closures under a business-as-usual scenario can occur without triggering electricity service reliability concerns.93 Moreover, states have years to begin reducing their carbon pollution under the Clean Power Plan. Working with power producers and grid operators, states can carefully plan to comply with the carbon pollution limits through a gradual transition while preventing power shortages. In addition, by increasing demand response and energy efficiency, states can also increase their reserve margins.
2003 2004 2005 2006 2007 2008 2009 2010 2011 2012 2013 2014
Source: ISO-NE Market Analysis and Settlement Department
Figure 9: New England electricity and natural gas prices, 2003-2012
0
5
10
15
20
$25
0
50
100
150
$200
$/M
egaw
att-
hour
(MW
h)$/M
MBtu
Natural Gas Price
Real-Time Energy Market Price
figure 9: New England electricity and natural gas prices, 2003-2014
paGE 20 | Bridging the Clean Energy Divide: affordable Clean Energy Solutions for Today and Tomorrow
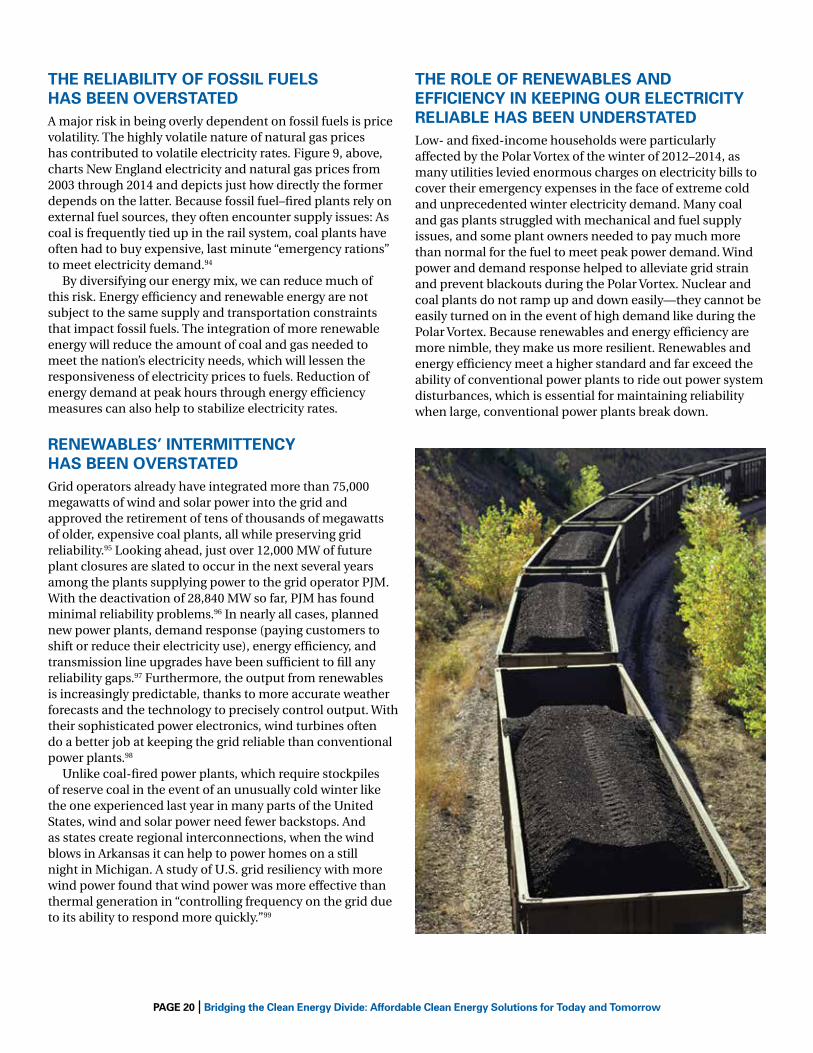
THE rEliaBiliTy of foSSil fuElS HaS BEEN ovErSTaTEDA major risk in being overly dependent on fossil fuels is price volatility. The highly volatile nature of natural gas prices has contributed to volatile electricity rates. Figure 9, above, charts New England electricity and natural gas prices from 2003 through 2014 and depicts just how directly the former depends on the latter. Because fossil fuel–fired plants rely on external fuel sources, they often encounter supply issues: As coal is frequently tied up in the rail system, coal plants have often had to buy expensive, last minute “emergency rations” to meet electricity demand.94
By diversifying our energy mix, we can reduce much of this risk. Energy efficiency and renewable energy are not subject to the same supply and transportation constraints that impact fossil fuels. The integration of more renewable energy will reduce the amount of coal and gas needed to meet the nation’s electricity needs, which will lessen the responsiveness of electricity prices to fuels. Reduction of energy demand at peak hours through energy efficiency measures can also help to stabilize electricity rates.
rENEwaBlES’ iNTErmiTTENCy HaS BEEN ovErSTaTEDGrid operators already have integrated more than 75,000 megawatts of wind and solar power into the grid and approved the retirement of tens of thousands of megawatts of older, expensive coal plants, all while preserving grid reliability.95 Looking ahead, just over 12,000 MW of future plant closures are slated to occur in the next several years among the plants supplying power to the grid operator PJM. With the deactivation of 28,840 MW so far, PJM has found minimal reliability problems.96 In nearly all cases, planned new power plants, demand response (paying customers to shift or reduce their electricity use), energy efficiency, and transmission line upgrades have been sufficient to fill any reliability gaps.97 Furthermore, the output from renewables is increasingly predictable, thanks to more accurate weather forecasts and the technology to precisely control output. With their sophisticated power electronics, wind turbines often do a better job at keeping the grid reliable than conventional power plants.98
Unlike coal-fired power plants, which require stockpiles of reserve coal in the event of an unusually cold winter like the one experienced last year in many parts of the United States, wind and solar power need fewer backstops. And as states create regional interconnections, when the wind blows in Arkansas it can help to power homes on a still night in Michigan. A study of U.S. grid resiliency with more wind power found that wind power was more effective than thermal generation in “controlling frequency on the grid due to its ability to respond more quickly.”99
THE rolE of rENEwaBlES aND EffiCiENCy iN KEEpiNG our ElECTriCiTy rEliaBlE HaS BEEN uNDErSTaTEDLow- and fixed-income households were particularly affected by the Polar Vortex of the winter of 2012–2014, as many utilities levied enormous charges on electricity bills to cover their emergency expenses in the face of extreme cold and unprecedented winter electricity demand. Many coal and gas plants struggled with mechanical and fuel supply issues, and some plant owners needed to pay much more than normal for the fuel to meet peak power demand. Wind power and demand response helped to alleviate grid strain and prevent blackouts during the Polar Vortex. Nuclear and coal plants do not ramp up and down easily—they cannot be easily turned on in the event of high demand like during the Polar Vortex. Because renewables and energy efficiency are more nimble, they make us more resilient. Renewables and energy efficiency meet a higher standard and far exceed the ability of conventional power plants to ride out power system disturbances, which is essential for maintaining reliability when large, conventional power plants break down.
paGE 21 | Bridging the Clean Energy Divide: affordable Clean Energy Solutions for Today and Tomorrow
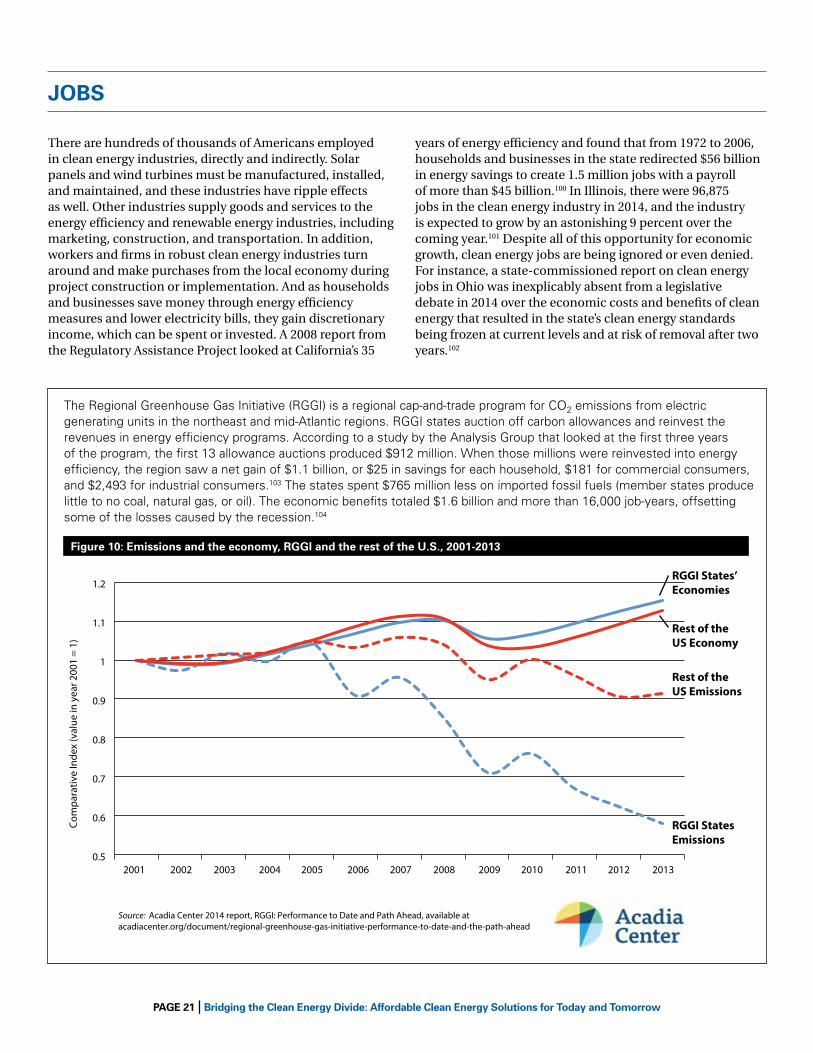
JoBS
There are hundreds of thousands of Americans employed in clean energy industries, directly and indirectly. Solar panels and wind turbines must be manufactured, installed, and maintained, and these industries have ripple effects as well. Other industries supply goods and services to the energy efficiency and renewable energy industries, including marketing, construction, and transportation. In addition, workers and firms in robust clean energy industries turn around and make purchases from the local economy during project construction or implementation. And as households and businesses save money through energy efficiency measures and lower electricity bills, they gain discretionary income, which can be spent or invested. A 2008 report from the Regulatory Assistance Project looked at California’s 35
years of energy efficiency and found that from 1972 to 2006, households and businesses in the state redirected $56 billion in energy savings to create 1.5 million jobs with a payroll of more than $45 billion.100 In Illinois, there were 96,875 jobs in the clean energy industry in 2014, and the industry is expected to grow by an astonishing 9 percent over the coming year.101 Despite all of this opportunity for economic growth, clean energy jobs are being ignored or even denied. For instance, a state-commissioned report on clean energy jobs in Ohio was inexplicably absent from a legislative debate in 2014 over the economic costs and benefits of clean energy that resulted in the state’s clean energy standards being frozen at current levels and at risk of removal after two years.102
The regional Greenhouse Gas Initiative (rGGI) is a regional cap-and-trade program for Co2 emissions from electric generating units in the northeast and mid-Atlantic regions. rGGI states auction off carbon allowances and reinvest the revenues in energy efficiency programs. According to a study by the Analysis Group that looked at the first three years of the program, the first 13 allowance auctions produced $912 million. When those millions were reinvested into energy efficiency, the region saw a net gain of $1.1 billion, or $25 in savings for each household, $181 for commercial consumers, and $2,493 for industrial consumers.103 The states spent $765 million less on imported fossil fuels (member states produce little to no coal, natural gas, or oil). The economic benefits totaled $1.6 billion and more than 16,000 job-years, offsetting some of the losses caused by the recession.104
figure 10: Emissions and the economy, rGGi and the rest of the u.S., 2001-2013
2001 2002 2003 2004 2005 2006 2007 2008 2009 2010 2011 2012 2013
Source: Acadia Center 2014 report, RGGI: Performance to Date and Path Ahead, available at acadiacenter.org/document/regional-greenhouse-gas-initiative-performance-to-date-and-the-path-ahead
Figure 10: Emissions and the economy, RGGI and the rest of the U.S., 2001-2013
0.5
0.6
0.7
0.8
0.9
1
1.1
1.2
Com
para
tive
Inde
x (v
alue
in y
ear 2
001
= 1)
RGGI States’ Economies
RGGI States Emissions
Rest of theUS Economy
Rest of theUS Emissions

paGE 22 | Bridging the Clean Energy Divide: affordable Clean Energy Solutions for Today and Tomorrow
According to a report by the Brookings Institution and Battelle, there are more than 820,000 people working within various sectors of energy efficiency in the United States.105 The American Council for an Energy Efficient Economy (ACEEE) and the Alliance to Save Energy (ASE) have performed independent analyses projecting that this can grow to 1.3–1.9 million jobs by 2050. In the solar industry there were 119,016 existing jobs in the United States at the end of 2012, a 13.2 percent increase from the year before.106 Since the rest of the economy grew at 2.3 percent in the same time period, the solar industry’s growth is stunning, creating 1 out of every 230 new American jobs in 2012. Wind makes room for 80,000 Americans in the manufacturing of turbines and turbine components, construction, and the development and operations of wind farms.107 Geothermal, fuel cells, waste-to-energy, and wave and ocean power employ thousands more.108 In aggregate, the clean energy economy rivals the fossil fuel industry, and it has more potential for growth since there is so much clean energy that remains untapped in this country and around the world. According to Environmental Entrepreneurs, there were more than 18,000 new jobs announced in the clean energy field in the third quarter of 2014 alone.109 And NRDC found that if the nation shifted to clean energy under a scenario similar to the Clean Power Plan, there would be $37.4 billion in savings on electric bills in 2020 and more than 274,000 efficiency-related jobs created across the country.110
Very relevant for low-income individuals in the United States, clean energy jobs tend to pay more while still being accessible to those without advanced degrees. The typical wage for someone employed in a clean energy industry is, at $44,000, 13 percent higher than the median wage in the United States.111 This is because of the large number of installation and construction jobs, which are more than 1.5 times more prevalent in the clean economy than in other sectors. And yet, almost one-half of clean energy workers have a high school diploma or less, and half of those low-skill jobs are also strong-wage (paying more than the U.S. median wage). These jobs are also local, involving people who work at the local level installing efficiency measures that fit individual homes and businesses, installing solar the roofs of local banks and schools, and contracting with farmers around the country to site turbines far afield. By their very nature, these jobs cannot be exported. About 26 percent of all clean energy jobs are manufacturing jobs, especially in electric vehicles and lighting, as compared with 9 percent in the general economy. And, compared with the fossil fuel industry, the clean energy industry generates more jobs per unit of energy delivered and uses a higher proportion of local labor.112
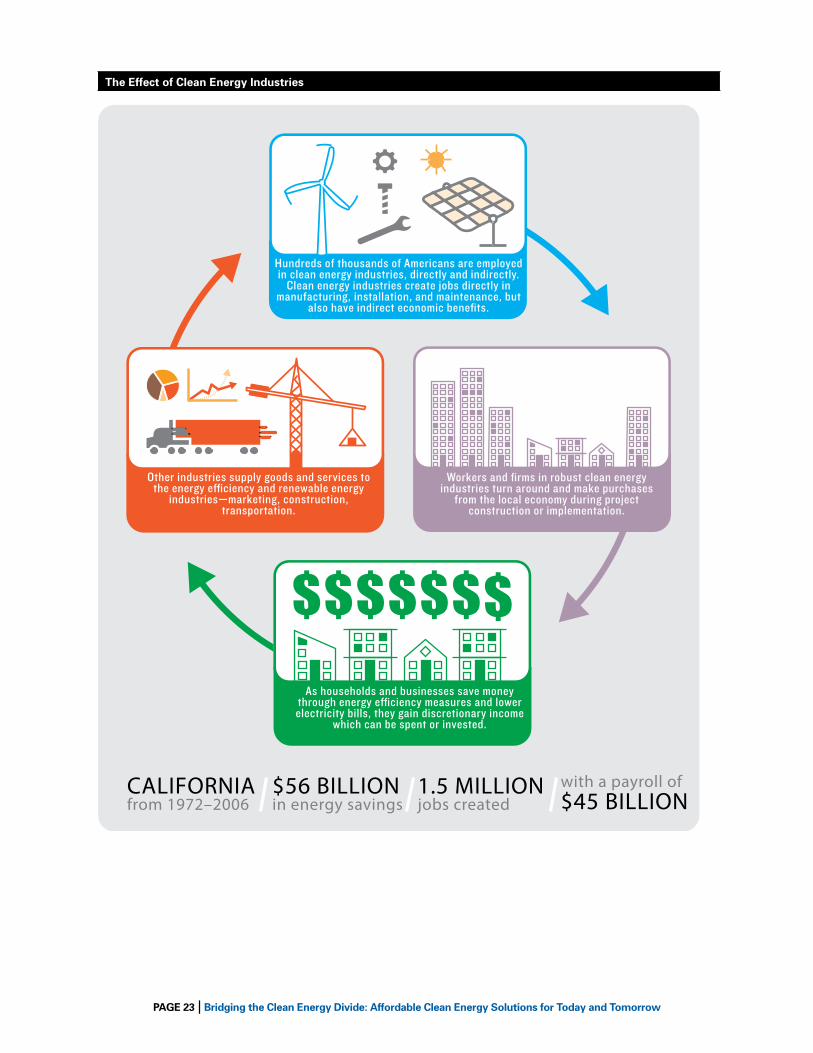
paGE 23 | Bridging the Clean Energy Divide: affordable Clean Energy Solutions for Today and Tomorrow
$56 BILLIONin energy savings
1.5 MILLIONjobs created
with a payroll of$45 BILLION
CALIFORNIAfrom 1972–2006
THE EFFECT OF CLEAN ENERGY INDUSTRIES
Hundreds of thousands of Americans are employed in clean energy industries, directly and indirectly.
Clean energy industries create jobs directly in manufacturing, installation, and maintenance, but
also have indirect economic benefits.
Other industries supply goods and services to the energy e�ciency and renewable energy
industries—marketing, construction, transportation.
Workers and firms in robust clean energy industries turn around and make purchases
from the local economy during project construction or implementation.
As households and businesses save money through energy e�ciency measures and lower electricity bills, they gain discretionary income
which can be spent or invested.
The Effect of Clean Energy industries
paGE 24 | Bridging the Clean Energy Divide: affordable Clean Energy Solutions for Today and Tomorrow
CoNCluSioN
Coal is oversupplied around the world, leading to depressed prices. In a bid to resuscitate these prices, coal interests are pushing for an increase in demand. Part of this push includes declaiming the EPA for a “war on coal” that will supposedly lead to massive increases in electricity costs, power outages, and job losses across the nation, throwing people into poverty. They contend that the EPA’s Clean Power Plan will place disproportionate burdens upon those with fixed and low incomes, including seniors and minorities. The argument we are hearing from fossil fuel interests—that fossil fuels like coal and natural gas are good for low-income households— is clearly a specious one.
In reality, the Clean Power Plan will gradually transition our electricity system to cleaner sources of power over the next 15 years, which will lead to lower electricity costs, healthier homes and buildings, increased employment, and a better electricity grid with reliability that is second to none. The proposed plan makes room for clean energy to play a bigger role, and this will help to lower costs and lessen dependence on fossil fuels, to the benefit of all customers.
The Clean Power Plan to cut carbon pollution from power plants offers serious benefits for low- and fixed-income households in particular. Common sense and experience tell us that the claims of the coal industry are wrong. Once installed, turbines and solar panels generate electricity without fuel costs, and any generation from sunlight or wind does not compete with the sunlight or wind available elsewhere. Clean renewable energy and energy efficiency insulate people from fuel price fluctuations and prevent bill shocks from coal or gas price spikes. Currently beholden to the whims of the market, weather, and existing infrastructure, people are increasingly feeling empowered to generate their own electricity. Households and businesses all
over the country are increasingly taking control of their own electricity generation and installing efficiency measures that reduce their dependence on large energy companies.
The Clean Power Plan will result in significant improvements in air quality across the country, which will improve the health of millions of Americans while protecting them from the worst impacts of climate change. The federal government, state governments, interest groups, and communities should be vigilant and ensure that the benefits of the Clean Power Plan are received equitably, with emphasis on low- and fixed-income populations. Later this year, the EPA is scheduled to issue its final version of the Clean Power Plan, which could deliver even larger pollution reductions and ensure even greater benefits for low- and fixed-income communities. Separate analysis from NRDC has shown that low-cost EE and RE can help lead the way towards compliance with the Clean Power Plan, and can even result in substantial net savings for the power sector—savings that can be passed down to consumers.113 Other limits on ozone, mercury, and methane pollution will complement the Clean Power Plan’s carbon dioxide reductions in addressing harmful air pollution. How states choose to implement the Clean Power Plan matters when it comes to the impacts on low-income communities. States have the flexibility to develop plans that suit their particular resources and economies, and it is important that these plans promote equity by ensuring there are actual emissions reductions in communities that currently bear a disproportionate burden of power plant pollution. If implemented well, the EPA’s plan to reduce harmful carbon pollution from power plants will motivate the development of more of the innovative and successful programs that are making clean energy more accessible and affordable around the world.

paGE 25 | Bridging the Clean Energy Divide: affordable Clean Energy Solutions for Today and Tomorrow
ENDNoTES
1 U.S. Environmental protection Agency (hereinafter EpA), “Why We Need a Cleaner, More Efficient power Sector,” June 2014, www2.epa.gov/sites/production/files/2014-05/documents/20140602fs-benefits.pdf. EpA, “By the Numbers: Cutting Carbon pollution from power plants,” June 2014, http://www2.epa.gov/sites/production/files/2014-06/documents/20140602fs-important-numbers-clean-power-plan.pdf.
2 Ibid.
3 Kentuckians for the Commonwealth, “Energy Efficiency programs,” https://www.kftc.org/energy-efficiency-programs (accessed February 7, 2015).
4 Diane Cardwell, “Home Solar power Discounts Are Worker perk in New program,” New York Times, october 22, 2014, www.nytimes.com/2014/10/23/business/solar-energy-discounts-become-employee-perkin-new-program.html?_r=0. Kirk Kraft, “Don’t End Incentives for renewable Energy projects,” Mason City [Iowa] Globe Gazette, July 29, 2012.
5 For the purposes of this report, “low income” refers generally to households that fall at or below about 200 percent of federal poverty guidelines. According to the U.S. Department of Health and Human Services, in 2014 a family of four living on $23,850 would be considered poor, so a family of four living on $47,700 would be considered low-income. U.S. Department of Health and Human Services (hereinafter HHS), “2014 poverty Guidelines,” January 24, 2013, aspe.hhs.gov/poverty/14poverty.cfm.
6 U.S. Department of Health and Human Services, “LIHEAp Home Energy Notebook for FY 2011,” June 2014, www.acf.hhs.gov/sites/default/files/ocs/fy2011_hen_final.pdf.
7 Union of Concerned Scientists, “Burning Coal, Burning Cash: ranking the States That Import the Most Coal,” January 2014, www.ucsusa.org/sites/default/files/attach/2014/08/Burning-Coal-Burning-Cash-2014-Update-National-Findings.pdf.
8 Ibid.
9 Ibid.
10 Ibid.
11 U.S. Energy Information Administration (hereinafter EIA), “Annual Energy outlook 2014,” April 2014, DoE.EIA-0383(2014).
12 Ameren Missouri, “2014 Integrated resource plan,” october 1, 2014, www.ameren.com/missouri/environment/renewables/ameren-missouri-irp.
13 Sierra Club, “proposed Coal plant Tracker,” content.sierraclub.org/coal/environmentallaw/plant-tracker (accessed December 1, 2014).
14 David Schlissel, “Beyond the Hype: The Full Economic Impacts of Using Coal,” lecture, AAAS 2013 Annual Meeting, Boston, Massachusetts, February 17, 2013.
15 EIA, “Annual Energy outlook 2014.”
16 Ibid.
17 According to Alpha Natural resources’ second-quarter earnings report, coal that cost $75.09 per ton to produce sold for $66.29 per ton. Alpha Natural resources, “Alpha Natural resources Announces results for Second Quarter 2013,” August 2, 2013, files.shareholder.com/downloads/ALNr/0x0x681676/623fcf9f-a034-4a98-bf0e-776fe14f9bf2/ANr_News_2013_8_2_Financial.pdf.
18 EIA, “U.S. Coal Exports Fall on Lower European Demand, Increased Global Supply,” october 3, 2014, www.eia.gov/todayinenergy/detail.cfm?id=18251.
19 EpA, “By the Numbers.”
20 EpA, “particulate Matter (pM): Health,” May 6, 2014, www.epa.gov/pm/health.html (accessed December 2, 2014).
21 Miriam Cisternas et al., “A Comprehensive Study of the Direct and Indirect Costs of Adult Asthma,” Journal of Allergy and Clinical Immunology 111, no. 6 (2003): 1212, www.jacionline.org/article/S0091-6749(03)01071-6/pdf.
22 Mike Dorning, “Life Worth $10 Million, Tears Averted $16 Under EpA plan,” Bloomberg News, June 2, 2014, www.bloomberg.com/news/2014-06-04/life-worth-10-million-tears-averted-16-under-epa-plan.html.
23 Adrian Wilson, Coal Blooded: Putting Profits Before People, National Association for the Advancement of Colored people (NAACp), Indigenous Environmental Network, and Little Village Environmental Justice organization, 2011, naacp.3cdn.net/afe739fe212e246f76_i8m6yek0x.pdf
24 Ibid.
25 Martha Keating and Felicia Davis, “Air of Injustice,” Clear the Air and the Georgia Coalition for the peoples’ Agenda, october 2002, www.energyjustice.net/files/coal/Air_of_Injustice.pdf.
26 National research Council, “Hidden Costs of Energy: Unpriced Consequences of Energy production and Use,” National Academies press, 2010.
27 paul Epstein et al., “Full Cost Accounting for the Life Cycle of Coal,” Annals of the New York Academy of Sciences 1219 (2011): 73, www.chgeharvard.org/sites/default/files/epstein_full%20cost%20of%20coal.pdf.
28 Lawrence Berkeley National Laboratory (hereinafter LBNL), “The Total Cost of Saving Electricity Through Utility Customer-Funded Energy Efficiency programs,” presentation, NArUC Annual Meeting, San Francisco, California, November 17, 2014, www.emp.lbl.gov/sites/all/files/Tr%20CSE_NArUC_111714_Final%20release.pdf.
29 EpA, “By the Numbers.”
30 Natural resources Defense Council (hereinafter NrDC), “America Can Create 274,000 Efficiency-related Jobs, Cut Electric Bills by Billions, and Curb Carbon pollution,” May 2014, www.nrdc.org/air/pollution-standards/files/national-cps-bills-jobs-FS.pdf.
31 Low Income Task Force, Wisconsin public Service Commission, “Low Income Task Force Final report,” April 1, 2011, Docket No. 05-GF-144, www.psc.wi.gov/apps35/ErF_view/viewdoc.aspx?docid=146652.
32 patrick Kenneally, “DrIpE: A Funny Word That Could Mean Serious Savings for Illinoisans,” NrDC Switchboard, November 21, 2014, switchboard.nrdc.org/blogs/pkenneally/dripe_a_funny_word_that_could.html.
33 This figure includes only the savings from codes and standards. It does not include savings from utility energy efficiency programs, nor the billions of dollars saved in avoided natural gas expenditures. California Energy Commission, “2013 Integrated Energy policy report,” 2013, publi cation Number: CEC-100-2013-001-CMF, www.energy.ca.gov/2013publications/CEC-100-2013-001/CEC-100-2013-001-CMF.pdf.
34 Arthur H. rosenfeld and Deborah poskanzer, “A Graph Is Worth a Thousand Gigawatt-Hours: How California Came to Lead the United States in Energy Efficiency,” Innovations (Fall 2009): 57-79.
35 EIA, “2012 Average Monthly Bill—residential,” November 8, 2013, www.eia.gov/electricity/sales_revenue_price/pdf/table5_a.pdf (accessed December 1, 2014).
36 Net benefits for investor-owned utilities comes from the most recent publicly available program Administrator Cost Test data from the California public Utilities Commission. The publicly owned utilities data are from the California Municipal Utilities Association, “Energy Efficiency in California’s public power Sector—A Status report” (March 2009, March 2008, and December 2006).
37 David roland-Holst, “Energy Efficiency, Innovation, and Job Creation in California,” University of California – Berkeley, Center for Energy, resources, and Economic Sustainability (CErES), october 2008, are.berkeley.edu/~dwrh/CErES_Web/Docs/UCB%20Energy%20Innovation%20and%20Job%20Creation%2010-20-08.pdf.

paGE 26 | Bridging the Clean Energy Divide: affordable Clean Energy Solutions for Today and Tomorrow
38 Evergreen Economics, “Needs Assessment for the Energy Savings Assistance and the California Alternate rates for Energy programs,” December 16, 2013, www.energydataweb.com/cpucFiles/pdaDocs/1015/ESA%20CArE%20LI%20Needs%20Assessment%20Final%20report%20-%20Volume%202%20-%2012-16-13.pdf.
39 NrDC, “The Benefits of Energy Efficiency for California’s Low Income Households,” prepared for the California Senate Energy, Utilities and Communications Committee, seuc.senate.ca.gov/sites/seuc.senate.ca.gov/files/NrDC%20Fact%20Sheet.pdf.
40 See California public Utilities Commission, evaluated and verified savings reports and utility monthly Energy Savings Assistance filings, 2006–2013. Maria Stamas, “regulators Approve Major Upgrades to California’s Largest Low-Income Energy Efficiency program,” NrDC Switchboard, August 14, 2014, switchboard.nrdc.org/blogs/mstamas/regu-lators_approve_major_upgra.html.
41 Evergreen Economics, “Needs Assessment for the Energy Savings Assistance and the California Alternate rates for Energy programs.”
42 Grayson Heffner and Nina Campbell, “Evaluating the Co-benefits of Low-income Energy-efficiency programmes,” International Energy Agency, Dublin Workshop report, June 2011, www.iea.org/publications/freepublications/publication/low_income_energy_efficiency.pdf.
43 Tetra Tech, “Massachusetts Special and Cross-Sector Studies Area, residential and Low-Income Non-Energy Impacts (NEI) Evaluation,” prepared for Massachusetts program Administrators, August 15, 2011, www.rieermc.ri.gov/documents/evaluationstudies/2011/Tetra_Tech_and_NMr_2011_MA_res_and_LI_NEI_Evaluation%2876%29.pdf.
44 More recently, SErA looked at NEBs for the state of Maryland and found that while more research is needed, NEBs are higher for low-income households than for non-low-income households. Skumatz Economic research Associates, Inc., “Non-energy Benefits Analysis for Xcel Energy’s Low-income Energy Efficiency programs,” May 27, 2010, Docket No. 13A-0686EG, Exhibit TW-8.
45 Skumatz Economic research Associates, Inc., “Non-energy Benefits/Non-energy Impacts (NEBs/NEIs) and Their role and Values in Cost-Effectiveness Tests: State of Maryland,” prepared for NrDC, March 31, 2014.
46 Tim Woolf, “on the Topic of Setting Energy Efficiency Goals,” testimony on behalf of the Sierra Club, october 16, 2013, Docket No. 13A-0686EG.
47 Institute for Market Transformation, “Home Energy Efficiency and Mortgage risks,” research report, March 2013, www.imt.org/uploads/resources/files/IMT_UNC_HomeEEMortgagerisksfinal.pdf.
48 NrDC, “The Save Act—Correcting a Blind Spot in Federal Mortgage policy,” docs.nrdc.org/legislation/files/leg_11101901a.pdf (accessed December 1, 2014).
49 The federal government defines “very low income” as households that earn less than half the national median income. U.S. Census Bureau, “population and Housing Narrative profile: 2011,” factfinder2.census.gov/faces/tableservices/jsf/pages/productview.xhtml?pid=ACS_11_1Yr_Np01&prodType=narrative_profile (accessed December 1, 2014). Gary pivo, “Energy Efficiency and Its relationship to Household Income in Multifamily rental Housing,” Fannie Mae, September 12, 2012, https://www.fanniemae.com/content/fact_sheet/energy-efficiency-rental-housing.pdf.
50 Anne McKibben et al., “Engaging as partners in Energy Efficiency: Multifamily Housing and Utilities,” American Council for an Energy Efficient Economy (ACEEE) and CNT Energy (now Elevate Energy), January 2012, www.elevateenergy.org/wp-content/uploads/2014/01/Engaging_as_partners_in_Energy_Efficiency_Multifamily_Housing_and_Utilities.pdf.
51 McKibben et al., “Engaging as partners in Energy Efficiency.”
52 Ibid.
53 Jenne Farley and russell ruch, “Evaluation of CNT Energy Savers retrofit packages Implemented in Multifamily Buildings,” U.S. Department of Energy (hereinafter DoE), September 2013, www.elevateenergy.org/prod/httpdocs/wp/wp-content/uploads/2014/01/Evaluation_of_CNT_Energy_Savers_retrofit_packages_Implemented_in_Multifamily_Buildings.pdf.
54 Jack Markowski et al., “Financing Energy Efficiency retrofits of Affordable Multifamily Buildings,” Federal reserve Bank of San Francisco, Community Development Investment Review 10, no. 1 (2014), www.frbsf.org/community-development/publications/community-development-investment-review/2014/march/green-environment-energy/.
55 Elevate Energy, “preserving Affordable Multifamily Housing through Energy Efficiency,” January 2014, www.elevateenergy.org/prod/httpdocs/wp/wp-content/uploads/preserving_Affordable_Multifamily_Housing_through_Energy_Efficiency_Final_2.18.14.pdf.
56 DoE, “Saving Energy and Keeping Seniors Warm This Season,” January 7, 2013, energy.gov/articles/saving-energy-and-keeping-seniors-warm-season.
57 ACEEE, Nevada, database.aceee.org/state/nevada (Accessed December 1, 2014).
58 U.S. Department of Agriculture (hereinafter USDA), “rural poverty & Well-being,” February 28, 2014, www.ers.usda.gov/topics/rural-economy-population/rural-poverty-well-being/poverty-overview.aspx (accessed December 2, 2014).
59 National rural Electric Cooperative Association (hereinafter NrECA), “Electric Cooperatives Serving persistent poverty Counties,” www.nreca.coop/wp-content/plugins/nreca-interactive-maps/persistent-poverty/ (accessed December 1, 2014).
60 russell Tucker et al., “Affordable Electricity and Economic Development: The role of Electric Cooperatives in the 21st Century,” NrECA, http://www.nreca.coop/wp-content/uploads/2014/09/Final_NrECA_Affordable_Electricity_White_paper.pdf (accessed March 3, 2015).
61 Kentucky Energy and Environment Cabinet, Household Electricity Expenditures as a percentage of Income, 2012 http://1.usa.gov/1rFQ1xh.
62 NrECA, “History of Electric Co-ops,” www.nreca.coop/about-electric-cooperatives/history-of-electric-co-ops/ (accessed December 1, 2014).
63 USDA, “USDA Launches New Initiative: Finances First Energy Efficiency program Loans in Arkansas and North Carolina,” press release, october 23, 2014, www.usda.gov/wps/portal/usda/usdahome?contentid=2014/10/0237.xml&contentidonly=true.
64 Mountain Association for Community Economic Development (hereinafter MACED), “About How$martKY,” www.maced.org/howsmart-about.htm (accessed December 2, 2014).
65 MACED, “replacing an Electric Furnace with a High Efficiency Heat pump,” www.maced.org/HowSmart/replacing-furnace.htm (accessed December 2, 2014).
66 roanoke Electric Cooperative, “New USDA program for Financing Energy Efficiency Awards $6 Million to roanoke Electric Cooperative”
67 Mark Bolinger and ryan Wiser, “The Value of renewable Energy as a Hedge Against Fuel price risk: Analytic Contributions from Economic and Finance Theory,” LBNL, August 17, 2009, http://escholarship.org/uc/item/65g8f2t4. richard Kessler, “Wind provides Major Cost Benefits for Texas—AWEA report,” Recharge News, November 10, 2014, www.rechargenews.com/wind/1383119/Wind-provides-major-cost-benefits-for-Texas---AWEA-report. Illinois power Agency, “Annual report: The Costs and Benefits of renewable resource procurement in Illinois Under the Illinois power Agency and Illinois public Utilities Acts,” March 31, 2014, www2.illinois.gov/xxipa/Documents/IpA-2014-renewables-report-3-31-14-final.pdf.

paGE 27 | Bridging the Clean Energy Divide: affordable Clean Energy Solutions for Today and Tomorrow
68 General Electric International, Inc., “pJM renewable Integration Study,” prepared for pJM Interconnection LLC, March 31, 2014, pjm.com/~/media/committees-groups/task-forces/irtf/postings/pris-executive-summary.ashx.
69 DoE, “2013 Wind Technologies Market report,” August 2014, emp.lbl.gov/sites/all/files/2013_Wind_Technologies_Market_report_Final3.pdf.
70 EIA, “How much electricity is lost in transmission and distribution in the United States?,” May 7, 2014, www.eia.gov/tools/faqs/faq.cfm?id=105&t=3 (accessed January 5, 2015).
71 Jonathan Blansfield and Kevin Jones, “Industry response to revenue Erosion from Solar pVs,” Distributed Generation and its Implications for the Utility Industry (Academic press, June 26, 2014).
72 Frank Jossi, “Minnesota Will ‘Get the Ball rolling’ on Community Solar Today,” Midwest Energy News, December 12, 2014, www.midwestenergynews.com/2014/12/12/minnesota-will-get-the-ball-rolling-on-community-solar-today/ (accessed December 12, 2014).
73 DoE, “A Guide to Community Solar: Utility, private, and Non-profit project Development,” November 2010, www.nrel.gov/docs/fy11osti/49930.pdf. Solar Holler, “Shepherdstown presbyterian Church dedicates largest community-supported solar system in West Virginia,” press release, August 26, 2014, www.solarholler.com/shepherdstown-presbyterian-dedicates-largest-community-solar-project-in-west-virginia/.
74 Go Solar California, “History of Go Solar, California!” www.gosolarcalifornia.ca.gov/about/gosolar/history.php (accessed December 1, 2014).
75 National renewable Energy Laboratory (NrEL), “NrEL reports Soft Costs Now Largest piece of Solar Installation Total Cost,” December 2, 2013, www.nrel.gov/news/press/2013/5306.html.
76 California public Utilities Commission (hereinafter CpUC), “Single-family Affordable Solar Homes (SASH) program: Q2 2014 program Status report,” August 2014, www.cpuc.ca.gov/Nr/rdonlyres/52E04E00-9848-4894-9E63-7C78003851D3/0/Q2_2014_SASH_program_Status_report_8814.pdf.
77 Navigant, California Solar Initiative Low-Income Solar program Evaluation, prepared for the CpUC, August 24, 2011, www.cpuc.ca.gov/Nr/rdonlyres/13AAEDF8-BB7D-4FBD-AC05-3FC2B9CBF746/0/CSISASH_MASHImpact_and_Cost_Benefit_report.pdf.
78 Diane Cardwell, “Home Solar power Discounts Are Worker perk in New program,” New York Times, october 22, 2014, www.nytimes.com/2014/10/23/business/solar-energy-discounts-become-employee-perk-in-new-program.html?_r=0.
79 Solar Energy Industries Association (hereinafter SEIA)/GTM research, “Solar Market Insight report 2014 Q1,” www.seia.org/research-resources/solar-market-insight-report-2014-q1 (accessed December 1, 2014).
80 John Cromartie, Economic research Service, “How Is rural American Changing?” USDA, May 24, 2013, www.census.gov/newsroom/cspan/rural_america/20130524_rural_america_slides.pdf.
81 Kirk Kraft, “Don’t End Incentives for renewable Energy projects,” Mason City [Iowa] Globe Gazette, July 29, 2012.
82 Jim offner, “Wellsburg Wind Farm Gets Set to Go online,” Waterloo-Cedar Falls [Iowa] Courier, November 2, 2014, wcfcourier.com/business/local/wellsburg-wind-farm-gets-set-to-go-online/article_af7eec96-82fa-5065-928e-7a237ef177e5.html.
83 United Nations, “United Nations General Assembly Declares 2014-2024 Decade of Sustainable Energy for All,” December 21, 2012, press release, www.un.org/News/press/docs/2012/ga11333.doc.htm.
84 Smiti Mittal, “India Eyes $100 Billion Investment in renewable Energy,” Cleantechnica, November 9, 2014, cleantechnica.com/2014/11/09/india-eyes-100-billion-investment-renewable-energy/ (accessed November 11, 2014). renewable Energy policy Network for the 21st Century, “renewables 2014: Global Status report,” www.ren21.net/portals/0/documents/resources/GSr/2014/GSr2014_full%20report_low%20res.pdf (accessed December 10, 2014).
85 IndianEnergySector.com, “National Wind Energy Mission,” www.indianenergysector.com/wind/national-wind-energy-mission-nwem (accessed September 9, 2014).
86 “Solar pV in India Is Cheaper than Importing Coal from Australia,” Cleantechnica, october 29, 2014, cleantechnica.com/2014/10/29/solar-pv-india-cheaper-importing-coal-australia/ (Accessed December 9, 2014).
87 personal communication, robert Lieberman, principal, regulatory Assistance project, November 28, 2014.
88 EIA, “Indonesia,” www.eia.gov/countries/country-data.cfm?fips=id (accessed December 2, 2014).
89 United Nations Development programme, “Achieving Sustainable Energy for All in the Asia-pacific,” August 2013, www.id.undp.org/content/dam/indonesia/docs/envi/AprC-EE-2013-SE4ALL.pdf (accessed December 2, 2014).
90 Ben Bovarnick and Eliza Dach, “Electricity Without the Grid,” Center for American progress, July 17, 2014, www.americanprogress.org/issues/green/news/2014/07/17/93853/electricity-without-the-grid/.
91 Centers for Disease Control and prevention, “Heat-related Deaths After an Extreme Heat Event—Four States, 2012, and United States, 1999–2009,” Morbidity and Mortality Weekly Report, June 7, 2013, www.cdc.gov/mmwr/preview/mmwrhtml/mm6222a1.htm.
92 Moore, J., “Environmental Standards Will Help reduce Consumer Electricity Bills,” NrDC Switchboard, November 4, 2014, http://switchboard.nrdc.org/blogs/jmoore/environmental_standards_will_h.html.
93 “EpA’s Clean power plan and reliability: Assessing NErC‘s Initial reliability review,” The Brattle Group, February 2015, http://info.aee.net/hs-fs/hub/211732/file-2486162659-pdf/pDF/EpAs-Clean-power-plan--reliability-Brattle.pdf.
94 Synapse Energy Economics, Inc., Costs and Benefits of Electric Utility Energy Efficiency in Massachusetts, prepared for Northeast Energy Efficiency Council, August 2008, www.synapse-energy.com/sites/default/files/Synapsereport.2008-08.0.MA-Electric-Utility-Energy-Efficiency.08-075.pdf.
95 There were 61,327 MW of wind installed capacity and 15,900 MW of solar by mid-2014. American Wind Energy Association (hereinafter AWEA), “Wind Energy Facts at a Glance,” www.awea.org/resources/Content.aspx?ItemNumber=5059&navItemNumber=742 (accessed November 25, 2014). SEIA, “Solar Energy Facts: Q3 2014,” September 22, 2014, http://www.seia.org/sites/default/files/Q3%202014%20SMI%20Fact%20Sheet.pdf (accessed November 25, 2014).
96 pJM Interconnection LLC, “Generator Deactivations (as of January 5, 2015),” www.pjm.com/planning/generation-deactivation/gd-summaries.aspx (accessed January 5, 2015).
97 pJM Interconnection, LLC, “Future Deactivations (as of December 1, 2014),” www.pjm.com/~/media/planning/gen-retire/pending-deactivation-requests.ashx (accessed December 2, 2014).
98 AWEA, “Wind energy helps build a more reliable and balanced electricity portfolio,” February 12, 2015, http://awea.files.cms-plus.com/AWEA%20reliability%20White%20paper%20-%202-12-15.pdf.
99 General Electric, “GE Study: Wind power Can Improve resiliency of Electrical Grids,” press release, August 27, 2014, www.genewsroom.com/press-releases/GE-Study-Wind-power-Can-Improve-resiliency-of-Electrical-Grids-277767.
100 Jim Lazar and Ken Colburn, “recognizing the Full Value of Energy Efficiency,” regulatory Assistance project, September 2013, www.raponline.org/press-release/recognizing-the-full-value-of-efficiency-theres-more-layers-in-the-layer-cake-than-many-account.
101 Clean Energy Trust, “Clean Jobs Illinois,” March 2014, info.cleanenergytrust.org/clean-jobs-illinois-full-length-report.
102 Dan Gearino, “Why Don’t Some State officials Want You to read This report on ‘Green’ Energy Jobs?” The Columbus Dispatch, November 17, 2014, www.dispatch.com/content/stories/business/2014/11/16/report-on-green-energy-jobs-was-put-on-ice-during-debate.html.

paGE 28 | Bridging the Clean Energy Divide: affordable Clean Energy Solutions for Today and Tomorrow
103 paul Hibbard et al., “The Economic Impacts of the regional Greenhouse Gas Initiative on Ten Northeast and Mid-Atlantic States,” The Analysis Group, November 15, 2011, www.analysisgroup.com/uploadedFiles/publishing/Articles/Economic_Impact_rGGI_report.pdf.
104 Lazar and Colburn, “recognizing the Full Value of Energy Efficiency.”
105 Mark Muro, Jonathan rothwell, and Devashree Saha, “Sizing the Clean Economy: A National and regional Green Jobs Assessment,” Brookings Institution and Battelle Technology partnership practice, 2011, www.brookings.edu/~/media/series/resources/0713_clean_economy.pdf.
106 The Solar Foundation, “National Solar Jobs Census 2012,” November 2012, thesolarfoundation.org/sites/thesolarfoundation.org/files/TSF%20Solar%20Jobs%20Census%202012%20Final.pdf.
107 AWEA, “What Does Wind power Mean for America?” www.awea.org/resources/Content.aspx?ItemNumber=3393 (accessed December 2, 2014).
108 National research Council, “Hidden Costs of Energy: Unpriced Consequences of Energy production and Use,” National Academies press, 2010.
109 Environmental Entrepreneurs, “Q3 2014 Jobs report,” November 2014, cleanenergyworksforus.org/wp-content/uploads/2014/11/2014_Q3_report_final.pdf.
110 NrDC, “America Can Create 274,000 Efficiency-related Jobs, Cut Electric Bills by Billions, and Curb Carbon pollution,” May 2014, www.nrdc.org/air/pollution-standards/files/national-cps-bills-jobs-FS.pdf.
111 Muro et al. “Sizing the Clean Economy.”
112 Max Wei, Shana patadia, and Daniel M. Kammen, “putting renewables and Energy Efficiency to Work: How Many Jobs Can the Clean Energy Industry Generate in the US?” Energy Policy 38 (2010), rael.berkeley.edu/sites/default/files/WeipatadiaKammen_CleanEnergyJobs_Epolicy2010.pdf.
113 NrDC, “The EpA’s Clean power plan Could Save Up to $9 Billion in 2030,” issue brief, November 2014, www.nrdc.org/air/pollution-standards/files/clean-power-plan-energy-savings-IB.pdf.

Related Documents