Q2 2021 Shareholders’ Report For the six months ended June 30, 2021

Welcome message from author
This document is posted to help you gain knowledge. Please leave a comment to let me know what you think about it! Share it to your friends and learn new things together.
Transcript

Q2 2021Shareholders’ Report
For the six months ended June 30, 2021


Altus Group Limited
Shareholders’ Report
June 30, 2021
Contents
Management’s Discussion & Analysis
Forward‐Looking Information 1
Non‐IFRS Measures 3
Overview of the Business 4
Strategy 6
Financial and Operating Highlights 9
Discussion of Operations 13
Three and Six Months Ended June 30, 2021 13
Revenues and Adjusted EBITDA by Business Unit 17
Altus Analytics 18
Commercial Real Estate Consulting 21
Corporate Costs 23
Liquidity and Capital Resources 23
Reconciliation of Adjusted EBITDA to Profit (Loss) 27
Reconciliation of Adjusted Earnings (Loss) Per Share to Profit (Loss) 28
Summary of Quarterly Results 29
Share Data 30
Financial Instruments and Other Instruments 30
Contingencies 31
Changes in Significant Accounting Policies and Estimates 32
Disclosure Controls and Procedures and Internal Controls over Financial Reporting 32
Additional Information 34
Unaudited Interim Condensed Consolidated Financial Statements
Interim Condensed Consolidated Statements of Comprehensive Income (Loss) 36
Interim Condensed Consolidated Balance Sheets 37
Interim Condensed Consolidated Statements of Changes in Equity 38
Interim Condensed Consolidated Statements of Cash Flows 39
Notes to Interim Condensed Consolidated Financial Statements 40
Management’s Discussion & Analysis June 30, 2021
The following management’s discussion and analysis (“MD&A”) is intended to assist readers in understanding Altus
Group Limited’s consolidated business, its business environment, strategies, performance, outlook and applicable
risks. References to the “Company” or “Altus Group” are to the consolidated group of entities, and this should be read
in conjunction with our unaudited interim condensed consolidated financial statements and accompanying notes (the
“interim financial statements”) as at and for the three and six months ended June 30, 2021, which have been prepared
on the basis of International Financial Reporting Standards (“IFRS”) and reported in Canadian dollars. Unless
otherwise indicated herein, references to “$” are to Canadian dollars and percentages are in comparison to the same
period in 2020. Starting in the first quarter of 2021, segmented results presented (including restated comparative
figures) include variable compensation costs that are accrued and allocated directly to the Company’s business units
on a quarterly basis. A table detailing the comparative 2020 quarterly results under the new treatment is posted on
our website under the Investor Relations section with our 2020 year‐end disclosure materials.
Unless the context indicates otherwise, all references to “we”, “us”, “our” or similar terms refer to Altus Group, and,
as appropriate, our consolidated operations.
This MD&A is dated as of August 12, 2021.
Forward‐Looking Information
Certain information in this MD&A may constitute “forward‐looking information” within the meaning of
applicable securities legislation. All information contained in this MD&A, other than statements of current
and historical fact, is forward‐looking information. Forward‐looking information includes, but is not
limited to, the discussion of our business and operating initiatives, focuses and strategies, our expectations
of future performance for our various business units and our consolidated financial results, including the
guidance on financial expectations, and our expectations with respect to cash flows and liquidity.
Generally, forward‐looking information can be identified by use of words such as “may”, “will”, “expect”,
“believe”, “plan”, “would”, “could”, “remain” and other similar terminology. All of the forward‐looking
information in this MD&A is qualified by this cautionary statement.
Forward‐looking information is not, and cannot be, a guarantee of future results or events. Forward‐
looking information is based on, among other things, opinions, assumptions, estimates and analyses that,
while considered reasonable by us at the date the forward‐looking information is provided, inherently are
subject to significant risks, uncertainties, contingencies and other factors that may cause actual results,
performance or achievements, industry results or events to be materially different from those expressed or
implied by the forward‐looking information. The material factors or assumptions that we identified and
applied in drawing conclusions or making forecasts or projections set out in the forward‐looking
information include, but are not limited to: engagement and product pipeline opportunities in Altus
Analytics will result in associated definitive agreements; settlement volumes in the Property Tax business
will occur on a timely basis and that assessment authorities will process appeals in a manner consistent
with expectations; the successful execution of our business strategies; consistent and stable economic
conditions or conditions in the financial markets; consistent and stable legislation in the various countries
in which we operate; no disruptive changes in the technology environment; the opportunity to acquire
accretive businesses; the successful integration of acquired businesses; and the continued availability of
qualified professionals.
The COVID‐19 pandemic has cast additional uncertainty on each of these factors and assumptions. There
can be no assurance that they will continue to be valid. Given the rapid pace of change with respect to the
1
Management’s Discussion & Analysis June 30, 2021
COVID‐19 pandemic, it is difficult to make further assumptions about these matters. The duration, extent
and severity of the impact the COVID‐19 pandemic, including measures to prevent its spread, will have on
our business is uncertain and difficult to predict at this time. As of the date of this MD&A, many of our
offices and clients remain subject to limitations and restrictions set to reduce the spread of COVID‐19, and
a significant portion of our employees continue to work remotely.
Inherent in the forward‐looking information are known and unknown risks, uncertainties and other factors
that could cause our actual results, performance or achievements, or industry results, to differ materially
from any results, performance or achievements expressed or implied by such forward‐looking information.
Those risks, uncertainties and other factors that could cause actual results to differ materially from the
forward‐looking information include, but are not limited to: the general state of the economy; the COVID‐
19 pandemic; currency; our financial performance; our financial targets; the commercial real estate market;
industry competition; our acquisitions; our cloud subscriptions transition; software renewals; professional
talent; third party information; enterprise transactions; new product introductions; technological change;
intellectual property; technology strategy; information technology governance and security; our product
pipeline; property tax appeals; legislative and regulatory changes; fixed‐price and contingency
engagements; appraisal and appraisal management mandates; the Canadian multi‐residential market;
customer concentration and the loss of material clients; interest rates; credit; income tax matters; health and
safety hazards; our contractual obligations; legal proceedings; our insurance limits; our ability to meet the
solvency requirements necessary to make dividend payments; leverage and financial covenants; our share
price; our capital investments; and the issuance of additional common shares, as well as those described in
our annual publicly filed documents, including the Annual Information Form for the year ended December
31, 2020 (which are available on SEDAR at www.sedar.com). In addition, while the investigation of the
June 13, 2021 cybersecurity incident (as discussed on page 11) to date has not identified any compromise
to our products, services, data or other information, and we have implemented our cybersecurity and
business continuity protocols and adopted additional measures to enhance the security of our IT systems
to help detect and prevent future attempts or incidents of malicious activity, we are subject to a number of
risks and uncertainties in connection with the incident. Such risks and uncertainties include, but are not
limited to: the outcome of the ongoing investigation into the incident; costs related to the investigation and
any potential liabilities, regulatory investigation or lawsuit resulting from the incident; costs related to and
the effectiveness of our mitigation and remediation efforts; our ability to recover proceeds under our
insurance policies; and the potential loss of customer and other stakeholder confidence in our ability to
protect their information, and the potential adverse financial impact such loss of confidence may have on
our business.
Given these risks, uncertainties and other factors, investors should not place undue reliance on forward‐
looking information as a prediction of actual results. The forward‐looking information reflects
management’s current expectations and beliefs regarding future events and operating performance and is
based on information currently available to management. Although we have attempted to identify
important factors that could cause actual results to differ materially from the forward‐looking information
contained herein, there are other factors that could cause results not to be as anticipated, estimated or
intended. The forward‐looking information contained herein is current as of the date of this MD&A and,
except as required under applicable law, we do not undertake to update or revise it to reflect new events
or circumstances. Additionally, we undertake no obligation to comment on analyses, expectations or
statements made by third parties in respect of Altus Group, our financial or operating results, or our
securities.
2

Management’s Discussion & Analysis June 30, 2021
Certain information in this MD&A may be considered as “financial outlook” within the meaning of
applicable securities legislation. The purpose of this financial outlook is to provide readers with disclosure
regarding Altus Group’s reasonable expectations as to the anticipated results of its proposed business
activities for the periods indicated. Readers are cautioned that the financial outlook may not be appropriate
for other purposes.
Non‐IFRS Measures
We use certain non‐IFRS measures as indicators of financial performance. Readers are cautioned that they
are not defined performance measures, and do not have any standardized meaning under IFRS and may
differ from similar computations as reported by other similar entities and, accordingly, may not be
comparable to financial measures as reported by those entities. We believe that these measures are useful
supplemental measures that may assist investors in assessing an investment in our shares and that they
provide more insight into our performance. These non‐IFRS measures should not be considered in isolation
or as a substitute for financial measures prepared in accordance with IFRS.
Adjusted Earnings before Interest, Taxes, Depreciation and Amortization (“Adjusted EBITDA”) represents
profit (loss) from continuing operations before income taxes, adjusted for the effects of: occupancy costs
calculated on a similar basis prior to the adoption of IFRS 16, finance costs (income), net ‐ other,
depreciation of property, plant and equipment and amortization of intangibles, depreciation of right‐of‐
use assets, finance costs (income), net ‐ leases, acquisition and related transition costs (income), unrealized
foreign exchange (gains) losses, (gains) losses on disposal of right‐of‐use assets, property, plant and
equipment and intangibles, share of (profit) loss of joint venture, impairment charges, non‐cash share‐
based compensation costs, (gains) losses on equity derivatives net of mark‐to‐market adjustments on
related restricted share units (“RSUs”) and deferred share units (“DSUs”) being hedged, (gains) losses on
derivatives, restructuring costs (recovery), (gains) losses on investments, (gains) losses on hedging
transactions, and other costs or income of a non‐operating and/or non‐recurring nature.
Adjusted EBITDA margin represents the percentage factor of Adjusted EBITDA to revenues. Refer to page
27 for a reconciliation of Adjusted EBITDA to our interim financial statements.
Adjusted Earnings (Loss) per Share (“Adjusted EPS”) represents basic earnings (loss) per share from
continuing operations adjusted for the effects of: occupancy costs calculated on a similar basis prior to the
adoption of IFRS 16, depreciation of right‐of‐use assets, finance costs (income), net ‐ leases, amortization of
intangibles of acquired businesses, unrealized foreign exchange losses (gains), (gains) losses on disposal of
right‐of‐use assets, property, plant and equipment and intangibles, non‐cash share‐based compensation
costs, losses (gains) on equity derivatives net of mark‐to‐market adjustments on related RSUs and DSUs
being hedged, interest accretion on contingent consideration payables, restructuring costs (recovery), losses
(gains) on hedging transactions and interest expense (income) on swaps, acquisition and related transition
costs (income), losses (gains) on investments, share of (profit) loss of joint venture, impairment charges,
(gains) losses on derivatives, and other costs or income of a non‐operating and/or non‐recurring nature.
The adjusted earnings (loss) reflect the above adjustments, net of tax. The basic weighted average number
of shares is adjusted for the effects of weighted average number of restricted shares. Refer to page 28 for a
reconciliation of Adjusted EPS to our interim financial statements.
ARGUS Enterprise (“AE”) software maintenance retention rate is calculated as a percentage of AE software
maintenance revenue retained upon renewal; it represents the percentage of the available renewal
3
Management’s Discussion & Analysis June 30, 2021
opportunity in a fiscal period that renews, calculated on a dollar basis, excluding any growth in user count
or product expansion.
Over Time revenues is a metric consistent with IFRS 15, Revenue from Contracts with Customers, for the Altus
Analytics business segment. Our Over Time revenues are comprised of software subscription revenues
recognized on an over time basis in accordance with IFRS 15, software maintenance revenues associated
with our legacy licenses sold on perpetual terms, Appraisal Management revenues, and data subscription
revenues. Refer to page 18 for discussion of Over Time revenues.
Cloud adoption rate is a metric that represents the percentage of the total AE user base contracted on the
ARGUS Cloud platform. It includes both new AE cloud users as well as those who have migrated from our
AE on‐premise software.
Bookings is a new metric we introduced in the first quarter of 2021 for the Altus Analytics business
segment. We define Bookings as the annual contract value (“ACV”) for new sales of our recurring offerings
(software, Appraisal Management solutions and data subscriptions) and the total contract value (“TCV”)
for one‐time engagements (consulting, training and due diligence). The contract value of renewals is
excluded from this metric, with the exception of additional capacity or products purchased at the time of
renewal.
Constant currency allows for current financial and operational performance to be understood against
comparative periods without the impact of fluctuations in foreign currency exchange rates against the
Canadian dollar. The financial results and non‐IFRS measures presented at constant currency within this
MD&A are obtained by translating monthly results denominated in local currency (US dollars, British
pound, Euro, Australian dollars, and other foreign currencies) at the foreign exchange rates of the
comparable month.
Overview of the Business
Altus Group Limited is a leading provider of software, data solutions and independent advisory services
to the global commercial real estate (“CRE”) industry. Our businesses, Altus Analytics and Commercial
Real Estate Consulting (“CRE Consulting”), reflect decades of experience, a range of expertise, and
technology‐enabled capabilities. Our solutions empower clients to analyze, gain insight and recognize
value on their real estate investments. Headquartered in Canada, we have approximately 2,600 employees
around the world, with operations in North America, Europe and Asia Pacific. Our clients include many
of the world’s largest CRE industry participants. Altus Group pays a quarterly dividend of $0.15 per share
and our shares are traded on the Toronto Stock Exchange (“TSX”) under the symbol AIF.
We have two reporting business segments ‐ Altus Analytics and CRE Consulting.
Altus Analytics
Our Altus Analytics segment primarily consists of Over Time revenues, comprising software subscriptions
and maintenance, and data solutions that are made available to clients through our Appraisal Management
solutions and data subscription products. A smaller portion of the segment includes non‐recurring
revenues primarily from software services. Altus Analytics clients predominately consist of CRE asset and
investment management firms, including large owners, managers and investors of CRE assets and funds,
4
Management’s Discussion & Analysis June 30, 2021
as well as other industry participants including service providers, brokers, appraisers, developers, financial
institutions and the public sector.
Our globally sold ARGUS software solutions are among the most recognizable in the CRE industry. Our
cloud‐enabled product stack for global CRE asset and investment management comprises end‐to‐end
integrated software solutions that provide visibility at the asset, portfolio and fund level to help clients
enhance performance of their CRE investments. Our flagship AE software is the leading global solution for
CRE valuation and portfolio management and is widely recognized as the industry property valuation
standard in key CRE markets and is primarily offered on a cloud platform. AE’s suite of functionality
enables organizations to manage and predict the performance of their CRE assets throughout the
investment cycle supporting property valuations, investments, portfolios and budgeting. In addition to AE,
we also sell other cloud‐based software solutions to address key workflows in the areas of fund modeling
and forecasting, data management, development feasibility, and acquisitions. Following the April 1, 2021
acquisition of Finance Active SAS (“Finance Active”) (as discussed on page 10), we now also offer debt
management SaaS solutions for treasury and investment management. In addition to standard technology
services related to education, training and implementation, we offer strategic advisory and managed
services for real estate organizations’ front‐to‐back‐office strategies, processes and technology.
Fueled by our ARGUS software solutions, we also provide information services on a global basis through
our Appraisal Management solutions and data subscription products. Our global Appraisal Management
solutions combine data and analytics functionality with a managed service delivery to enable institutional
real estate investors to perform quarterly performance reviews, benchmarking and attribution analysis of
their portfolios. Through these offerings we provide an end‐to‐end valuation management solution for our
institutional clients, providing independent oversight and expertise while leveraging our data analytics
platform. We primarily offer Appraisal Management solutions in the U.S., and we are expanding into
Europe and Asia Pacific. Our Appraisal Management clients primarily consist of open and closed real estate
funds, including large pension funds. Altus Analytics also includes data analytics products that are sold
on a subscription basis. Our Altus Data Studio provides comprehensive real estate information on the
Canadian residential, office, industrial and investment markets with unique data visualization capabilities.
Our Canadian data covers new homes, investment transactions and commercial market inventory in key
markets, and provides intelligence on the national housing market and consumer home buying and
borrowing patterns.
Prior to 2020, the majority of our customers had licensed our AE software products on an on‐premise basis,
and had either paid on perpetual terms with ongoing maintenance, or on subscription terms. As of the start
of 2020, our Altus Analytics software products have been sold only on a subscription‐based model and
increasingly as cloud solutions. Our software subscription agreements vary in length between one to five
years, and the subscription fee depends primarily on the number of users and the applications deployed.
We enjoy industry leading retention rates for our AE software. In addition to software subscriptions, our
software services are charged primarily on a time and materials basis, billed and recognized monthly as
delivered. The contractual terms of our Appraisal Management contracts generally provide for terms of
three years and pricing is primarily based on the number of real estate assets on our platform, adjusted for
frequency of valuations and complexity of asset class. We enjoy very high contract renewal rates. Our
Appraisal Management teams are also engaged from time to time to perform due diligence assignments in
connection with CRE transactions. Our data products are sold on a subscription basis.
5
Management’s Discussion & Analysis June 30, 2021
Commercial Real Estate Consulting
Our CRE Consulting segment consists of the Property Tax, and the Valuation and Cost Advisory business
units. Through our various practice areas, we are well‐equipped to serve clients with an end‐to‐end
solution that spans the life cycle of CRE assets ‐ from feasibility, development, acquisition, management
and disposition. Our professionals possess extensive industry, market and asset‐specific knowledge that
contribute to our proprietary internal databases that help drive successful client outcomes. We have long‐
standing relationships with leading CRE market participants ‐ including owner operators, developers,
financial institutions, and various CRE asset holders and investors.
Our largest revenue contributor to CRE Consulting is our Property Tax business which operates in Canada,
the U.S. and the U.K. Our team of Property Tax professionals help clients minimize the tax burden and
reduce the cost of compliance. Our core real estate property tax services include assessment reviews,
management and appeals, as well as in the U.S., personal property and state and local tax advisory services.
The majority of our Property Tax revenues are derived on a contingency basis, representing a percentage
of the savings we achieve for our clients. As such, we recognize contingency revenues when settlements
are made, which in some cases could span multiple years. A smaller portion of our fees are based on a time
and materials basis. Valuation services, which are predominantly provided in Canada, consist of appraisals
of real estate portfolios, valuation of properties for transactional purposes, due diligence and litigation and
economic consulting. Our Cost Advisory practice, offered in both the private and public sectors in Canada
and Asia Pacific, provides expert services in the areas of construction feasibility studies, budgeting, cost
and loan monitoring and project management. Pricing for our Valuation and Cost Advisory services is
primarily based on a fixed fee or time and materials basis. Given the strength of our brand, our
independence and quality of our work, we enjoy a high rate of client renewals across all of our CRE
Consulting businesses.
Strategy
Commercial real estate continues to see a steady rise in investment allocation by global institutions,
solidifying it as an important and well‐defined asset class. Higher volumes of cross‐border transactions
and institutional capital flows are adding new complexity and pressure on top of increasing risk and
regulatory demands. To better cope, the CRE industry is rapidly re‐examining their digital strategies and
demanding more sophisticated processes and data to drive returns. Customers are increasingly looking for
interoperability across software applications, data and workflows in a manner that drives real‐time
business insights. In addition, investors, regulators and the broader CRE community are demanding
greater transparency on worldwide asset and portfolio performance, valuations, risk and Environmental,
Social, and Governance (“ESG”) compliance, and are increasingly relying on independent expert service
providers in this pursuit.
With a global footprint, a prominent customer base, and through our Altus Analytics solutions, Property
Tax and other CRE technology‐enabled offerings, Altus Group is uniquely positioned to capitalize on the
opportunities presented by these trends and to drive significant value for the industry. We are at the
forefront of innovation in our industry and are well equipped to help our clients navigate the complexities
of the CRE market to make better informed decisions and maximize the value of their real estate assets and
investments.
Our vision is to be the leader for the valuation and management of risk for real estate assets by enhancing
the decision making across the value chain through the use of technology, data, analytics and services.
6
Management’s Discussion & Analysis June 30, 2021
Over the past several years, we have positioned ourselves as a leading CRE technology and technology‐
enabled services provider through our investments in cloud technology, the integration of our software
technology stack, the expansion of our products and services into Europe and the Asia Pacific region, and
the digitization of our Property Tax and other service lines. We have also initiated the transition of our
Altus Analytics business to a predominately recurring revenue model by moving from on‐premise
software sales, sold on perpetual and subscription terms, to cloud SaaS products.
Our next phase of growth involves driving deeper penetration across the CRE value chain by accelerating
cloud adoption, creating greater interoperability of customers’ embedded software and data applications,
providing new and adjacent data and software solutions, and further integrating our existing product and
service offerings to provide end‐to‐end data‐driven insights.
Strategic Priorities
Our 2021 strategic priorities consist of:
Accelerating the global adoption of ARGUS Cloud and increasing the proliferation of our
applications across clients’ workflows and the CRE value chain;
Expanding into the CRE debt markets through a combination of organic and acquisitive initiatives;
Expanding our data capabilities and developing new areas of opportunities;
Continuing to build market leadership in Property Tax; and
Enhancing our go‐to‐market strategies across the Company.
Our top priority is accelerating global adoption of ARGUS Cloud. We remain focused on establishing
ARGUS Cloud as the foundational enterprise platform for global CRE asset and investment management,
which in the long run we envision will leverage data and predictive data analytics to deliver real‐time
business insights. In support of this vision, we continue our transition from high‐value point solutions to a
more ubiquitous model that unifies our valuation and asset management capabilities on to a single, cloud‐
based platform that integrates numerous key workflows and enhances data‐driven insights for the CRE
industry. In order to drive faster adoption, we are focused on creating a much deeper differentiation in the
value proposition between our cloud and on‐premise products. Future version releases will see greater
functionality developed exclusively on ARGUS Cloud, including additional application programming
interfaces (“APIs”) and interoperability that facilitates enhanced workflows and collaboration.
Our early foray into the CRE debt markets validates that there is a significant opportunity for us in this
market adjacency. Although we currently provide valuation and risk management solutions to some clients
in the debt space, deeper capabilities are required to fully address this growing market segment. Our
customers and the industry would derive significant value and be better equipped to manage risk
performance from a fulsome 360‐degree view of their assets that combines equity and debt considerations.
The April 1, 2021 acquisition of Finance Active, a European provider of debt management SaaS solutions
for treasury and investment management, is an important step to accelerate our growth in the CRE debt
market. It provides us with the immediate benefit of approaching a much larger client segment while
expanding our reach across use cases and workflows. In addition, Finance Active provides us with greater
cross‐sell opportunities and a strengthened footprint in Europe that we plan to leverage to further our
international expansion. As part of our product roadmap, we plan to integrate Finance Active’s debt
management SaaS solutions with our ARGUS Cloud platform.
7
Management’s Discussion & Analysis June 30, 2021
A key company‐wide initiative in 2021 is to expand our data capabilities and develop new opportunities.
The market for real‐time insights from data presents a substantial opportunity. Typical industry data is
complex, voluminous, and unstructured. The data that is collected and generated by our various cloud
solution products and by our Appraisal Management, Property Tax, and Valuations and Cost Advisory
businesses is specific, timely and precise. Our opportunity lies in the ability to provide our clients with data
architecture and data model solutions, enabled by ARGUS Cloud, allowing clients to aggregate data
sourced from internal systems, Altus data and potentially other third‐party data providers. Such a data
platform with predictive analytics and alert capabilities would enable both equity and debt stakeholders
to drive investment performance and manage risk. In support of this opportunity, we have formed a
dedicated team and initiated internal workstreams to establish market use cases, feasibility studies and a
technology roadmap. The May 4, 2021 acquisition of certain assets of StratoDem Analytics, LLC
(“StratoDem Analytics”) (as discussed on page 11) is a core component to our long‐term data strategy,
bringing valuable data science technology and talent, and accelerating our speed to market for future data
analytics products.
With market leading practices in Canada, the U.K. and the U.S., our Property Tax practice is one of the
largest and fastest growing property tax advisors globally. Our global Property Tax practice continues to
represent an attractive growth opportunity in a consolidating industry, driven by solid market
fundamentals and our strong competitive position. We will continue to invest organically and in tuck‐in
acquisitions of both core tax practices and adjacencies in order to grow our market share. Additionally, we
will further digitize our data and workflows to drive efficiencies, gain incremental insights, and deliver
greater client value. Lastly, we are re‐organizing the tax business under a centralized leadership model
with a global president and chief operating officer, in order to better align our regional tax practices under
a common global model, drive best practices, and accelerate digital transformation. Our strategy is centered
on strengthening this business with technology and data, and in doing so, improving the repeatability and
growth of our revenues and our operating leverage.
Finally, we will align and enhance our go‐to‐market strategies across our businesses. By leveraging
investments we have made in core platforms such as Salesforce, we will re‐tool and scale our sales
organization to better address the market opportunities in North America and Europe. We will evolve our
customer success and drive deeper marketing programs to strengthen business development and sales
initiatives. Our focus on account planning will better position us to identify our clients’ enterprise needs,
enabling us to provide them with an enterprise solution of our various offerings, rather than taking a single
point selling approach. We believe this will drive higher client value and customer satisfaction, which in
turn will result in higher, recurring revenue streams.
8

Management’s Discussion & Analysis June 30, 2021
Financial and Operating Highlights
Selected Financial Information Three months ended June 30, Six months ended June 30,
In thousands of dollars, except for per share amounts 2021 2020 2021 2020
Revenues $ 173,523 $ 155,470 $ 310,681 $ 286,726
Canada 25% 30% 31% 34%
U.S. 33% 36% 34% 37%
Europe 38% 29% 31% 24%
Asia Pacific 4% 5% 4% 5%
Adjusted EBITDA $ 42,239 $ 34,899 $ 59,479 $ 48,147
Adjusted EBITDA margin 24.3% 22.4% 19.1% 16.8%
Profit (loss) for the period from continuing
operations $ 16,341 $ 11,333 $ 18,978 $ 13,090
Profit (loss) for the period from discontinued
operations $ ‐ $ 266 $ ‐ $ (5,170)
Profit (loss) for the period $ 16,341 $ 11,599 $ 18,978 $ 7,920
Earnings (loss) per share:
Basic
Continuing operations $0.40 $0.28 $0.47 $0.33
Discontinued operations $0.00 $0.01 $0.00 $(0.13)
Diluted
Continuing operations $0.39 $0.28 $0.45 $0.32
Discontinued operations $0.00 $0.01 $0.00 $(0.13)
Adjusted $0.75 $0.62 $1.09 $0.82
Dividends declared per share $0.15 $0.15 $0.30 $0.30
Financial Highlights
Revenues were $173.5 million for the three months ended June 30, 2021, up 11.6% (16.5% on a constant
currency basis) or $18.0 million ($25.7 million on a constant currency basis), from $155.5 million in the
same period in 2020. Organic revenue growth was 6.0% (10.9% on a constant currency basis) for the
three months ended June 30, 2021. For the six months ended June 30, 2021, revenues were $310.7
million, up 8.4% (11.8% on a constant currency basis) or $24.0 million ($33.7 million on a constant
currency basis), from $286.7 million in the same period in 2020. Organic revenue growth was 4.5%
(7.9% on a constant currency basis) for the six months ended June 30, 2021. Revenue growth for the
quarter was led by a historical high revenue quarter from Property Tax with growth of 12.8% (16.2%
on a constant currency basis) and Altus Analytics, including the acquisition of Finance Active, which
grew 15.7% (25.8% on a constant currency basis), helped by Over Time revenues growing 17.2% (26.6%
on a constant currency basis). During the quarter, organic Bookings in Altus Analytics grew 63.4%
(79.7% on a constant currency basis) over the same period in 2020.
Adjusted EBITDA was $42.2 million for the three months ended June 30, 2021, up 21.0% (26.2% on a
constant currency basis) or $7.3 million ($9.1 million on a constant currency basis), from $34.9 million
in the same period in 2020. Organic Adjusted EBITDA growth was 22.6% (27.7% on a constant currency
basis) for the three months ended June 30, 2021. For the six months ended June 30, 2021, Adjusted
9
Management’s Discussion & Analysis June 30, 2021
EBITDA was $59.5 million, up 23.5% (27.7% on a constant currency basis) or $11.4 million ($13.3 million
on a constant currency basis), from $48.1 million in the same period in 2020. Organic Adjusted EBITDA
growth was 22.6% (26.7% on a constant currency basis) for the six months ended June 30, 2021. Earnings
increased on account of higher revenues, and Adjusted EBITDA growth and margin improvement was
largely owing to strength in our Altus Analytics and Property Tax businesses.
Profit (loss) from continuing operations for the three months ended June 30, 2021 was $16.3 million,
up 44.2% or $5.0 million from $11.3 million in the same period in 2020. For the six months ended June
30, 2021, profit (loss) from continuing operations was $19.0 million, up 45.0% or $5.9 million from $13.1
million in the same period in 2020. In addition to the items affecting Adjusted EBITDA as discussed
above, profit (loss) from continuing operations for the three and six months ended June 30, 2021
increased as a result of lower amortization of some historical acquisition‐related intangibles and lower
restructuring costs related to our 2020 global restructuring program, offset by acquisition and related
costs for the April 1, 2021 acquisition of Finance Active and the May 4, 2021 acquisition of StratoDem
Analytics, costs related to the June 13, 2021 cybersecurity incident (as discussed on page 11), and higher
income taxes on higher profit before tax.
For the three months ended June 30, 2021, earnings (loss) per share from continuing operations was
$0.40, basic and $0.39, diluted, as compared to $0.28, basic and diluted, in the same period in 2020. For
the six months ended June 30, 2021, earnings (loss) per share from continuing operations was $0.47,
basic and $0.45, diluted, as compared to $0.33, basic and $0.32, diluted, in the same period in 2020.
For the three months ended June 30, 2021, Adjusted EPS was $0.75, up 21.0% from $0.62 in the same
period in 2020. For the six months ended June 30, 2021, Adjusted EPS was $1.09, up 32.9% from $0.82
in the same period in 2020.
We returned $6.2 million to shareholders in the quarter through quarterly dividends of $0.15 per
common share.
As at June 30, 2021, our bank debt was $248.8 million, representing a funded debt to EBITDA leverage
ratio of 2.03 times (compared to 1.09 times as at December 31, 2020), well below our maximum ratio of
4.00 times. As at June 30, 2021, cash and cash equivalents were $74.1 million (compared to $69.6 million
as at December 31, 2020).
Operating Highlights
Acquisition of Finance Active
On April 1, 2021, we acquired all of the issued and outstanding shares of Finance Active and its subsidiaries
for approximately EUR106.5 million (CAD157.3 million) including a working capital payable of EUR0.1
million (CAD0.1 million). On closing, we paid a total of EUR89.2 million (CAD131.7 million) in cash,
funded by drawing down on our credit facilities. In addition, we issued 303,177 common shares to the
selling shareholders and certain members of Finance Active’s management team valued at EUR12.4 million
(CAD18.3 million) from treasury. These common shares will be held in escrow and will vest and be released
over two‐ or three‐year periods on each anniversary of the closing date, subject to compliance with certain
terms and conditions. Of the shares issued, 156,405 valued at EUR6.4 million (CAD9.5 million) are also
subject to continued employment over the vesting period. As part of the purchase price, EUR4.8 million
10

Management’s Discussion & Analysis June 30, 2021
(CAD7.1 million) is also payable in cash over two years after closing. As part of the transaction, we entered
into non‐compete agreements with members of management of Finance Active. Founded in 2000, Finance
Active is a European provider of SaaS debt management and financial risk management SaaS solutions for
treasury and investment management serving public, corporate and financial institutions. Finance Active
is headquartered in Paris, France, with a wide geographic footprint in Europe including over 3,000
customers ranging from small‐to‐medium businesses to large, global institutions. Finance Active’s team of
approximately 160 professionals is integrating with our Altus Analytics business. Finance Active, with its
SaaS business model, will strengthen our Over Time revenues and provide additional opportunities for
organic growth as we integrate our go‐to‐market operations.
Acquisition of StratoDem Analytics
On May 4, 2021, we acquired certain assets of StratoDem Analytics for USD24.4 million (CAD29.9 million)
in cash and common shares, subject to adjustments. As part of the transaction, we entered into a non‐
compete agreement with members of management of StratoDem Analytics. As consideration for these
assets, we paid cash of USD16.0 million (CAD19.6 million). In addition, we issued 165,320 common shares
to the vendors valued at USD8.4 million (CAD10.3 million) from treasury. The common shares will be held
in escrow, and will vest and be released 50% on the first anniversary and the remaining 50% equally at 25%
on each of the second and third anniversary of the closing date, subject to continued employment and
compliance with certain terms and conditions. Of the shares issued, 139,977 valued at USD7.1 million
(CAD8.7 million) are also subject to continued employment over the vesting period. StratoDem Analytics
is an early‐stage company offering data‐science‐as‐a‐service for the real estate sector. The cloud‐based
StratoDem Analytics platform integrates vast amounts of granular local demographic and economic
datasets to generate predictive models and analytical tools that enable clients to better understand the
factors influencing the market and build more accurate models and forecasts. Through this acquisition, the
StratoDem Analytics platform is a core component to our long‐term data strategy, bringing valuable data
science talent and technology, and accelerating our speed to market for future data analytics products.
Based in the U.S., StratoDem Analytics’ team has been integrated with our Altus Analytics business.
Cybersecurity Incident
On June 13, 2021, we discovered that we were the target of a ransomware attack, which involved the
encryption of a number of our back‐office systems. We took immediate action to implement our
cybersecurity protocols, notified law enforcement, and engaged with cybersecurity experts and
professional advisers to assist in addressing the issue as quickly as possible. A customer business continuity
protocol was implemented and, as a precautionary measure, our IT back‐office systems were temporarily
taken offline until they were rebuilt in greenfield environments under guidance of leading cybersecurity
experts with additional measures to enhance the security of our systems. In conjunction with these
activities, we have taken the opportunity to advance various transformational initiatives that will
modernize our applications and processes onto cloud platforms. Since discovery of the incident, our client‐
facing, cloud‐based data and software systems remained fully operational. Investigation into the incident
is ongoing, and we are still in the process of assessing the full impact of the incident. Based on the
investigation to date, there is no evidence of any customer or employee data having been impacted as a
result of the incident. While the cybersecurity incident caused some internal operational disruption, the
impact to revenues was limited to certain areas of our business and overall was not considered material.
While the investigation to date has not identified any compromise to our products, services, data or other
information, and we have implemented our cybersecurity and business continuity protocols and adopted
11
Management’s Discussion & Analysis June 30, 2021
additional measures to enhance the security of our IT systems to help detect and prevent future attempts
or incidents of malicious activity, we are subject to a number of risks and uncertainties in connection with
the incident. We confirm that all of our software and anti‐malware programs are up to date, complete and
current.
12
Management’s Discussion & Analysis June 30, 2021
Discussion of Operations
Three and Six Months Ended June 30, 2021
Three months ended June 30, Six months ended June 30,
In thousands of dollars 2021 2020 2021 2020
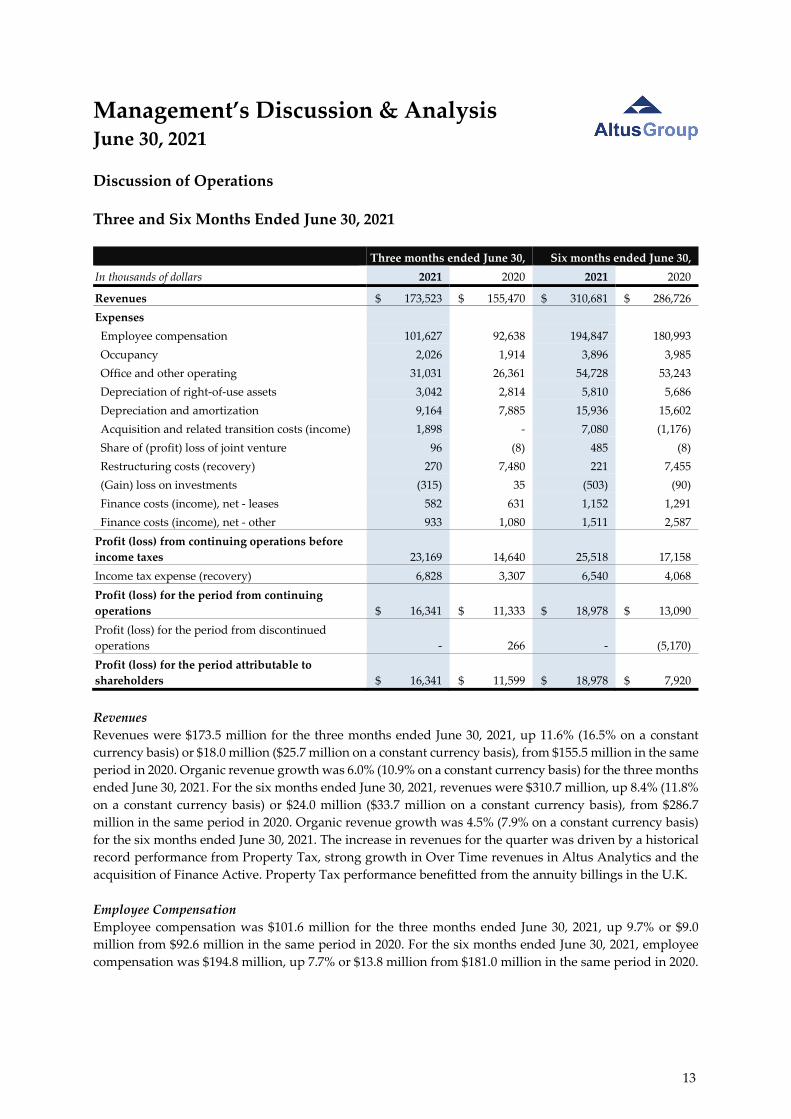
Revenues $ 173,523 $ 155,470 $ 310,681 $ 286,726
Expenses
Employee compensation 101,627 92,638 194,847 180,993
Occupancy 2,026 1,914 3,896 3,985
Office and other operating 31,031 26,361 54,728 53,243
Depreciation of right‐of‐use assets 3,042 2,814 5,810 5,686
Depreciation and amortization 9,164 7,885 15,936 15,602
Acquisition and related transition costs (income) 1,898 ‐ 7,080 (1,176)
Share of (profit) loss of joint venture 96 (8) 485 (8)
Restructuring costs (recovery) 270 7,480 221 7,455
(Gain) loss on investments (315) 35 (503) (90)
Finance costs (income), net ‐ leases 582 631 1,152 1,291
Finance costs (income), net ‐ other 933 1,080 1,511 2,587
Profit (loss) from continuing operations before
income taxes 23,169 14,640 25,518 17,158
Income tax expense (recovery) 6,828 3,307 6,540 4,068
Profit (loss) for the period from continuing
operations $ 16,341 $ 11,333 $ 18,978 $ 13,090
Profit (loss) for the period from discontinued
operations ‐ 266 ‐ (5,170)
Profit (loss) for the period attributable to
shareholders $ 16,341 $ 11,599 $ 18,978 $ 7,920
Revenues
Revenues were $173.5 million for the three months ended June 30, 2021, up 11.6% (16.5% on a constant
currency basis) or $18.0 million ($25.7 million on a constant currency basis), from $155.5 million in the same
period in 2020. Organic revenue growth was 6.0% (10.9% on a constant currency basis) for the three months
ended June 30, 2021. For the six months ended June 30, 2021, revenues were $310.7 million, up 8.4% (11.8%
on a constant currency basis) or $24.0 million ($33.7 million on a constant currency basis), from $286.7
million in the same period in 2020. Organic revenue growth was 4.5% (7.9% on a constant currency basis)
for the six months ended June 30, 2021. The increase in revenues for the quarter was driven by a historical
record performance from Property Tax, strong growth in Over Time revenues in Altus Analytics and the
acquisition of Finance Active. Property Tax performance benefitted from the annuity billings in the U.K.
Employee Compensation
Employee compensation was $101.6 million for the three months ended June 30, 2021, up 9.7% or $9.0
million from $92.6 million in the same period in 2020. For the six months ended June 30, 2021, employee
compensation was $194.8 million, up 7.7% or $13.8 million from $181.0 million in the same period in 2020.
13
Management’s Discussion & Analysis June 30, 2021
For the three and six months ended June 30, 2021, the increase in compensation was mainly due to
headcount additions within Altus Analytics and Property Tax and the acquisitions of Property Tax
Assistance Company Inc. (“PTA”), Finance Active and StratoDem Analytics. For the three and six months
ended June 30, 2021, employee compensation as a percentage of revenues was 58.6% and 62.7%, as
compared to 59.6% and 63.1% in the corresponding periods in 2020, respectively.
Occupancy
Occupancy represents amounts pertaining to short‐term leases, low‐value assets, and variable lease
payments and was $2.0 million for the three months ended June 30, 2021, up 5.9% or $0.1 million from $1.9
million in the same period in 2020. For the six months ended June 30, 2021, occupancy was $3.9 million,
down 2.2% or $0.1 million from $4.0 million in the same period in 2020. For the three and six months ended
June 30, 2021, the impacts of IFRS 16 decreased occupancy costs by $3.3 million and $6.4 million, as
compared to $3.2 million and $6.2 million in the corresponding periods in 2020, respectively. Without the
impact of IFRS 16, occupancy costs for the three and six months ended June 30, 2021 increased moderately.
For the three and six months ended June 30, 2021, occupancy as a percentage of revenues was 1.2% and
1.3%, as compared to 1.2% and 1.4% in the corresponding periods in 2020, respectively. Without the impact
of IFRS 16, occupancy as a percentage of revenues would have been 3.1% and 3.3% for the three and six
months ended June 30, 2021, as compared to 3.3% and 3.6% in the corresponding periods in 2020,
respectively.
Office and Other Operating Costs
Office and other operating costs were $31.0 million for the three months ended June 30, 2021, up 17.7% or
$4.6 million from $26.4 million in the same period in 2020. For the six months ended June 30, 2021, office
and other operating costs were $54.7 million, up 2.8%% or $1.5 million from $53.2 million in the same period
in 2020. For the three months ended June 30, 2021, the increase was due to acquisitions, professional fees
for strategic advisory work, and costs related to the cybersecurity incident. For the six months ended June
30, 2021, the decrease was due to savings on travel, conference related costs and lower subcontractor
disbursements, partly offset by acquisitions, higher professional fees for strategic advisory work, and costs
related to the cybersecurity incident. For the three and six months ended June 30, 2021, office and other
operating costs as a percentage of revenues were 17.9% and 17.6%, as compared to 17.0% and 18.6% in the
corresponding periods in 2020, respectively.
Depreciation of Right‐of‐Use Assets
Depreciation of right‐of‐use assets was $3.0 million and $5.8 million for the three and six months ended
June 30, 2021, as compared to $2.8 million and $5.7 million in the corresponding periods in 2020,
respectively. The increase is primarily due to the acquisition of Finance Active office leases.
Depreciation and Amortization
Depreciation and amortization were $9.2 million and $15.9 million for the three and six months ended June
30, 2021, as compared to $7.9 million and $15.6 million in the corresponding periods in 2020, respectively.
The increase is mainly due to the recognition and the amortization of intangible assets related to recent
acquisitions.
Acquisition and Related Transition Costs (Income)
Acquisition and related transition costs (income) were $1.9 million and $7.1 million for the three and six
months ended June 30, 2021, as compared to $nil and $(1.2) million in the corresponding periods in 2020,
14

Management’s Discussion & Analysis June 30, 2021
respectively. Costs incurred for the periods ended June 30, 2021 were related to the April 1, 2021 acquisition
of Finance Active and the May 4, 2021 acquisition of StratoDem Analytics. The income recorded for the six
months ended June 30, 2020 was due to a downward revaluation of our acquisition‐related contingent
consideration payables on historical acquisitions.
Share of (Profit) Loss of Joint Venture
Share of (profit) loss of joint venture represents our share of the profit/loss in GeoVerra Inc. (“GeoVerra”)
and was $0.1 million and $0.5 million for the three and six months ended June 30, 2021, as compared to $nil
in the corresponding periods in 2020, respectively, as it was launched on June 27, 2020.
Restructuring Costs (Recovery)
Restructuring costs (recovery) were $0.3 million and $0.2 million for the three and six months ended June
30, 2021 related to true‐ups for the settlement of charges pertaining to the global restructuring program
initiated in the second quarter of 2020, as compared to $7.5 million in the corresponding periods in 2020,
respectively.
(Gain) Loss on Investments
(Gain) loss on investments was $(0.3) million and $(0.5) million for the three and six months ended June 30,
2021, as compared to $nil and $(0.1) million in the corresponding periods in 2020, respectively. The amount
represents changes in the fair value of our investments in partnerships.
Finance Costs (Income), Net
Three months ended June 30, Six months ended June 30,
In thousands of dollars 2021 2020 % Change 2021 2020 % Change
Interest on borrowings $ 861 $ 1,052 (18.2%) $ 1,461 $ 2,377 (38.5%)
Interest on lease liabilities 582 631 (7.8%) 1,152 1,291 (10.8%)
Unwinding of discounts 32 67 (52.2%) 35 130 (73.1%)
Interest ‐ other 59 ‐ 100.0% 59 ‐ 100.0%
Change in fair value of interest rate swaps ‐ (16) (100.0%) ‐ 138 100.0%
Finance income (19) (23) (17.4%) (44) (58) (24.1%)
Finance costs (income), net $ 1,515 $ 1,711 (11.5%) $ 2,663 $ 3,878 (31.3%)
Finance costs (income), net for the three months ended June 30, 2021 was $1.5 million, down 11.5% or $0.2
million from $1.7 million in the same period in 2020. For the six months ended June 30, 2021, finance costs
(income), net was $2.7 million, down 31.3% or $1.2 million from $3.9 million in the same period in 2020.
Our finance costs decreased mainly due to the lower interest on our bank credit facilities and leases, and
the lower change in fair value recognized in relation to our $65.0 million interest rate swap which was
settled in the second quarter of 2020.
Income Tax Expense (Recovery)
Income tax expense (recovery) for the three and six months ended June 30, 2021 was $6.8 million and $6.5
million, as compared to $3.3 million and $4.1 million in the corresponding periods in 2020, respectively. A
significant amount of our earnings is derived outside of Canada and as a result a change in the mix of
earnings and losses in countries with differing statutory tax rates have impacted our effective tax rates for
the period ended June 30, 2021.
15

Management’s Discussion & Analysis June 30, 2021
Profit (Loss) from Continuing Operations
Profit (loss) from continuing operations for the three months ended June 30, 2021 was $16.3 million and
$0.40 per share, basic and $0.39 per share, diluted, as compared to $11.3 million and $0.28 per share, basic
and diluted, in the same period in 2020. For the six months ended June 30, 2021, profit (loss) from
continuing operations was $19.0 million and $0.47 per share, basic and $0.45 per share, diluted, as
compared to $13.1 million and $0.33 per share, basic and $0.32 per share, diluted, in the same period in
2020.
Profit (Loss) from Discontinued Operations
Profit (loss) from discontinued operations for the three months ended June 30, 2021 was $nil and $0.00 per
share, basic and diluted, as compared to $0.3 million and $0.01 per share, basic and diluted, in the same
period in 2020. For the six months ended June 30, 2021, profit (loss) from discontinued operations was $nil
and $0.00 per share, basic and diluted, as compared to $(5.2) million and $(0.13) per share, basic and diluted,
in the same period in 2020. This was due mainly to the contribution of our Geomatics discontinued
operations into the GeoVerra joint venture in the second quarter of 2020.
Profit (Loss)
Profit (loss) for the three months ended June 30, 2021 was $16.3 million and $0.40 per share, basic and $0.39
per share, diluted, as compared to $11.6 million and $0.29 per share, basic and $0.28 per share, diluted, in
the same period in 2020. For the six months ended June 30, 2021, profit (loss) was $19.0 million and $0.47
per share, basic and $0.45 per share, diluted, as compared to $7.9 million and $0.20 per share, basic and
$0.19 per share, diluted, in the same period in 2020.
16
Management’s Discussion & Analysis June 30, 2021
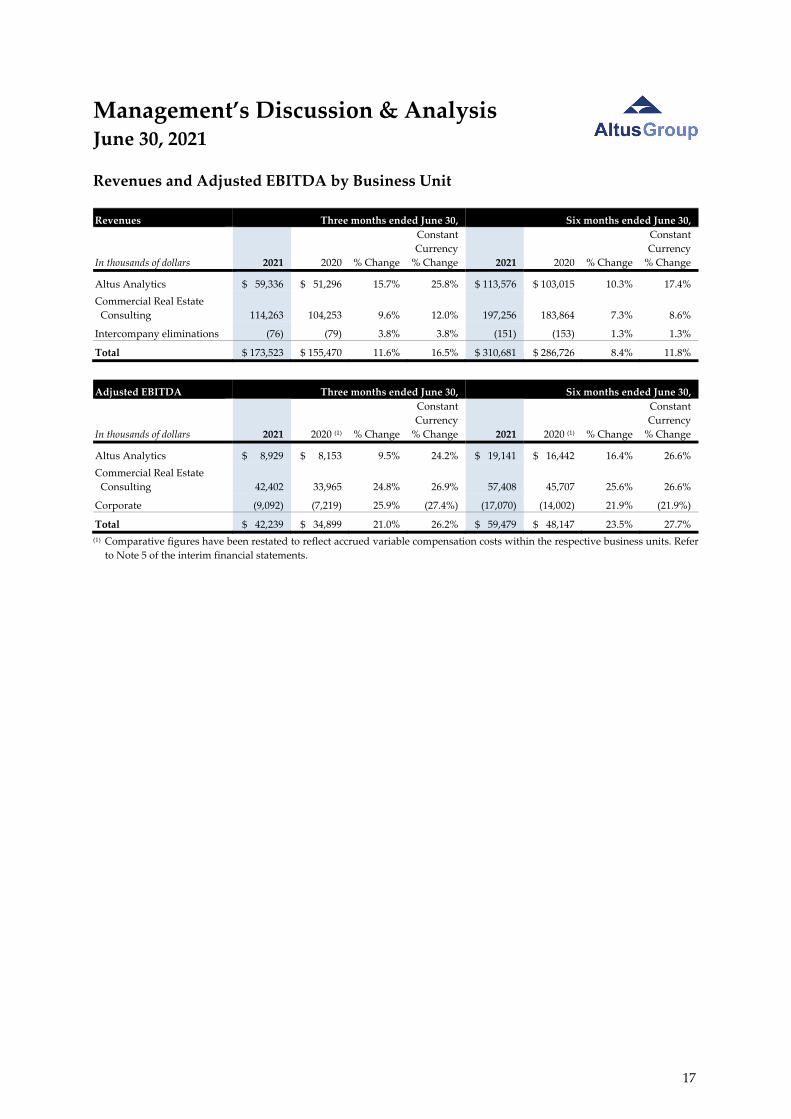
Revenues and Adjusted EBITDA by Business Unit
Revenues Three months ended June 30, Six months ended June 30,
In thousands of dollars 2021 2020 % Change
Constant
Currency
% Change 2021 2020 % Change
Constant
Currency
% Change
Altus Analytics $ 59,336 $ 51,296 15.7% 25.8% $ 113,576 $ 103,015 10.3% 17.4%
Commercial Real Estate
Consulting 114,263 104,253 9.6% 12.0% 197,256 183,864 7.3% 8.6%
Intercompany eliminations (76) (79) 3.8% 3.8% (151) (153) 1.3% 1.3%
Total $ 173,523 $ 155,470 11.6% 16.5% $ 310,681 $ 286,726 8.4% 11.8%
Adjusted EBITDA Three months ended June 30, Six months ended June 30,
In thousands of dollars 2021 2020 (1) % Change
Constant
Currency
% Change 2021 2020 (1) % Change
Constant
Currency
% Change
Altus Analytics $ 8,929 $ 8,153 9.5% 24.2% $ 19,141 $ 16,442 16.4% 26.6%
Commercial Real Estate
Consulting 42,402 33,965 24.8% 26.9% 57,408 45,707 25.6% 26.6%
Corporate (9,092) (7,219) 25.9% (27.4%) (17,070) (14,002) 21.9% (21.9%)
Total $ 42,239 $ 34,899 21.0% 26.2% $ 59,479 $ 48,147 23.5% 27.7%
(1) Comparative figures have been restated to reflect accrued variable compensation costs within the respective business units. Refer
to Note 5 of the interim financial statements.
17

Management’s Discussion & Analysis June 30, 2021
Altus Analytics
Three months ended June 30, Six months ended June 30,
In thousands of dollars 2021 2020 % Change
Constant
Currency
% Change 2021 2020 % Change
Constant
Currency
% Change
Revenues $ 59,336 $ 51,296 15.7% 25.8% $ 113,576 $ 103,015 10.3% 17.4%
Adjusted EBITDA (1) $ 8,929 $ 8,153 9.5% 24.2% $ 19,141 $ 16,442 16.4% 26.6%
Adjusted EBITDA Margin (1) 15.0% 15.9% 16.9% 16.0%
Selected Metrics (2)
Bookings $ 22,123 $ 12,838 72.3% 88.7% $ 43,421 $ 27,819 56.1% 68.0%
Over Time revenues $ 50,123 $ 42,756 17.2% 26.6% $ 92,911 $ 82,839 12.2% 19.0%
AE software maintenance
retention rate 94% 95% 94% 96%
Geographical revenue split
North America 72% 83% 76% 83%
International 28% 17% 24% 17%
Cloud adoption rate (as at
end of period) 26% 8%
(1) Comparative figures have been restated to reflect accrued variable compensation costs within the respective business units. Refer
to Note 5 of the interim financial statements.
(2) Refer to pages 3 and 4 of this MD&A for definitions of the Selected Metrics presented above.
Quarterly Discussion
Revenues were $59.3 million for the three months ended June 30, 2021, up 15.7% (25.8% on a constant
currency basis) or $8.0 million ($13.2 million on a constant currency basis), from $51.3 million in the same
period in 2020. Organic revenues were down 0.3% (up 9.8% on a constant currency basis). The acquisitions
of Finance Active and StratoDem Analytics represented 16.0% of the 15.7% revenue growth. Total revenue
growth benefitted from Over Time revenue growth on higher subscription revenues and increased year‐
over‐year revenue from a rebound in software consulting services.
Over Time revenues, as described above in the “Overview of the Business” section, were $50.1 million for
the three months ended June 30, 2021, up 17.2% (26.6% on a constant currency basis) or $7.4 million ($11.4
million on a constant currency basis), from $42.8 million in the same period in 2020. On an organic basis,
Over Time revenues were down 1.1% (up 8.3% on a constant currency basis). Over Time revenues
benefitted from the acquisition of Finance Active, as well as higher subscription revenue for our software
and data solutions, and steady performance from our Appraisal Management solutions. Sequentially, Over
Time revenues grew 17.1% (19.7% on a constant currency basis) or $7.3 million ($8.4 million on a constant
currency basis), from $42.8 million in the first quarter of 2021, primarily driven by the acquisition of Finance
Active. On an organic basis, Over Time Revenues were down 1.2% (up 1.4% on a constant currency basis)
from the first quarter of 2021 on higher subscription revenues.
Bookings in the quarter increased by 72.3% year‐over‐year (88.7% on a constant currency basis), from $12.8
million to $22.1 million and we finished the quarter with a growing pipeline of future opportunities.
Organic growth in Bookings was 63.4% (79.7% on a constant currency basis) from the same period in 2020.
18
Management’s Discussion & Analysis June 30, 2021
Our transition to AE cloud subscriptions continues to progress at a healthy pace. In the second quarter, we
continued the momentum in migrating existing customers from the on‐premise product and selling cloud‐
enabled AE to new customers. At the end of the second quarter of 2021, 26% of our total AE user base had
been contracted on ARGUS Cloud, compared to 22% the previous quarter, 14% at the end of 2020, and 8%
at the end of the second quarter of 2020.
Adjusted EBITDA was $8.9 million for the three months ended June 30, 2021, up 9.5% (24.2% on a constant
currency basis) or $0.7 million ($2.0 million on a constant currency basis), from $8.2 million in the same
period in 2020. Organic Adjusted EBITDA growth was 5.9% (20.6% on a constant currency basis). Adjusted
EBITDA improved on higher revenues, however was impacted by the purchase price accounting
adjustment of $1.4 million to Finance Active’s deferred revenues as well as higher investment related to
accelerating our data strategy. The purchase price accounting adjustment had a 2% impact to Adjusted
EBITDA margin.
Year‐to‐Date Discussion
Revenues were $113.6 million for the six months ended June 30, 2021, up 10.3% (17.4% on a constant
currency basis) or $10.6 million ($17.9 million on a constant currency basis), from $103.0 million in the same
period in 2020. Organic revenues growth was 2.3% (9.4% on a constant currency basis). The acquisitions of
Finance Active and StratoDem Analytics represented 8.0% revenue growth. Total revenue growth
benefitted from Over Time revenue growth on higher subscription revenues and increased year‐over‐year
revenue from a rebound in software consulting services.
Over Time revenues, as described above in the “Overview of the Business” section, were $92.9 million for
the six months ended June 30, 2021, up 12.2% (19.0% on a constant currency basis) or $10.1 million ($15.7
million on a constant currency basis), from $82.8 million in the same period in 2020. On an organic basis,
Over Time revenues were up 2.7% (up 9.5% on a constant currency basis). Over Time revenues increased
on higher subscription revenue and robust growth generated by our Appraisal Management solutions from
new clients and additional assets from existing clients and the acquisition of Finance Active.
Bookings in the six months ended June 30, 2021 increased by 56.1% year‐over‐year (68.0% on a constant
currency basis) from $27.8 million to $43.4 million and we finished the quarter with a growing pipeline of
future opportunities.
Adjusted EBITDA was $19.1 million for the six months ended June 30, 2021, up 16.4% (26.6% on a constant
currency basis) or $2.7 million ($4.4 million on a constant currency basis), from $16.4 million in the same
period in 2020. Organic Adjusted EBITDA growth was 14.6% (24.8% on a constant currency basis).
Adjusted EBITDA improved on higher revenues and improved operating margins, however was impacted
by the purchase price accounting adjustment of $1.4 million to Finance Active’s deferred revenues as well
as higher investment related to accelerating our data strategy. The purchase price accounting adjustment
had a 1% impact to Adjusted EBITDA margin.
Outlook
Our Altus Analytics business continues to have an attractive growth outlook, supported by favourable
market trends of growing global demand for CRE‐related technology and data solutions. We remain well
positioned to deliver sustained growth over the long term through the execution of our multi‐year strategy.
The successful execution of our annual strategic initiatives is expected to drive sustained year‐over‐year
19
Management’s Discussion & Analysis June 30, 2021
revenue growth in 2021, particularly double‐digit growth in our Over Time revenues on a constant
currency basis, and a double‐digit year‐over‐year improvement in our Adjusted EBITDA on a constant
currency basis. Taking into consideration the purchase price accounting adjustment to Finance Active’s
deferred revenues, combined with our investment to accelerate our data strategy (including building out
the recently acquired StratoDem Analytics platform), we expect our full year Adjusted EBITDA margins
will be similar to full year 2020 before they start to increase in 2022.
In 2021, we expect organic growth in our Over Time revenues from higher software subscription license
sales and continued strength from our Appraisal Management and data subscription solutions. Software
subscription license sales should benefit from sustained customer expansion through our dedicated focus
on customer success, and the steady addition of new software clients globally. Having fully shifted to a
subscription model since the start of 2020, in 2021 we will benefit from the full year impact of past
subscription deals given the stacking effect of a subscription model, and the comparative year no longer
including upfront perpetual deals. Consistent with the growth momentum from 2020, our Appraisal
Management practice is expected to benefit from new client additions, customer expansion as more assets
are added on our platform or as new funds are launched, and our ongoing expansion into the European
and Asia Pacific markets. Additionally, our data subscription products continue to be favourably
positioned as new product functionality, the addition of the StratoDem Analytics platform, and new
partnership opportunities provide us with additional prospects for growth. We also expect acquisitive
growth in Over Time revenues from our acquisition of Finance Active and StratoDem Analytics, as well as
enhanced cross‐sell opportunities. As many of our solutions are considered to be mission critical by our
customers, we expect our gross retention rates for AE (maintenance and subscriptions) as well as the
Finance Active SaaS solutions will remain in the industry leading mid‐90’s range and that our renewal rates
for our Appraisal Management engagements and data subscription products will remain exceptionally
strong. This will be supported by our revamped customer success programs.
The ongoing COVID‐19 pandemic has both spurred demand for some of our analytics solutions and
challenged certain parts of our software business. The initial impact, which is less pronounced today, was
mainly to our software consulting and training services, and to a lesser degree also impacted the volume
of license sales in the SMB segment and extended the sales cycles for our larger transactions. However,
based on recent trends and some planned changes to our go‐to‐market strategies, we remain optimistic
about improvements for 2021. Our Bookings pipeline is building and remains robust. Overall, we anticipate
a lesser impact as a result of the COVID‐19 pandemic in 2021 than we experienced in 2020. By and large,
demand for our Altus Analytics solutions remains robust. As the global economy starts to recover from the
impacts of the pandemic, activity levels have started to rebound as companies worldwide push for more
data‐driven visibility on their CRE assets, endeavor to streamline operations with technology and prioritize
cloud‐based solutions.
The migration of on‐premise AE users to cloud‐based subscription contracts is ongoing, and we expect to
make significant progress in 2021. As planned, early adoption continues to be led by SMB firms as they are
much easier to transition and typically have less complex IT infrastructure requirements. Our latest
enhancements to cloud‐enabled AE and the integration with APIs are an important catalyst for many larger
firms and we expect a greater volume of our larger customers to begin their migration journey. Our
progress should be reflected in our growing cloud adoption rate and the growth in Over Time revenues.
We continue to expect that the significant majority of our AE users will be contracted to the cloud by the
end of 2023.
20
Management’s Discussion & Analysis June 30, 2021
As we move into the second half of the year, with the strong Bookings growth as an indicator of future
revenue growth, we anticipate robust revenue growth in the second half of the year. For context, our
organic Bookings in the first half of this year amount to more than two‐thirds of what we did in all of 2020.
Based on current rates, we expect foreign exchange will continue to be a headwind in the third quarter of
2021.
We remain committed to our aspirational long‐term goal of achieving revenues of $400 million by the end
of 2023. We have multiple paths to accelerate our revenue growth over the next three years, including
driving double digit organic revenue growth and accelerating our expansion into strategic adjacencies in
debt and data analytics through both internal and acquisitive investments.
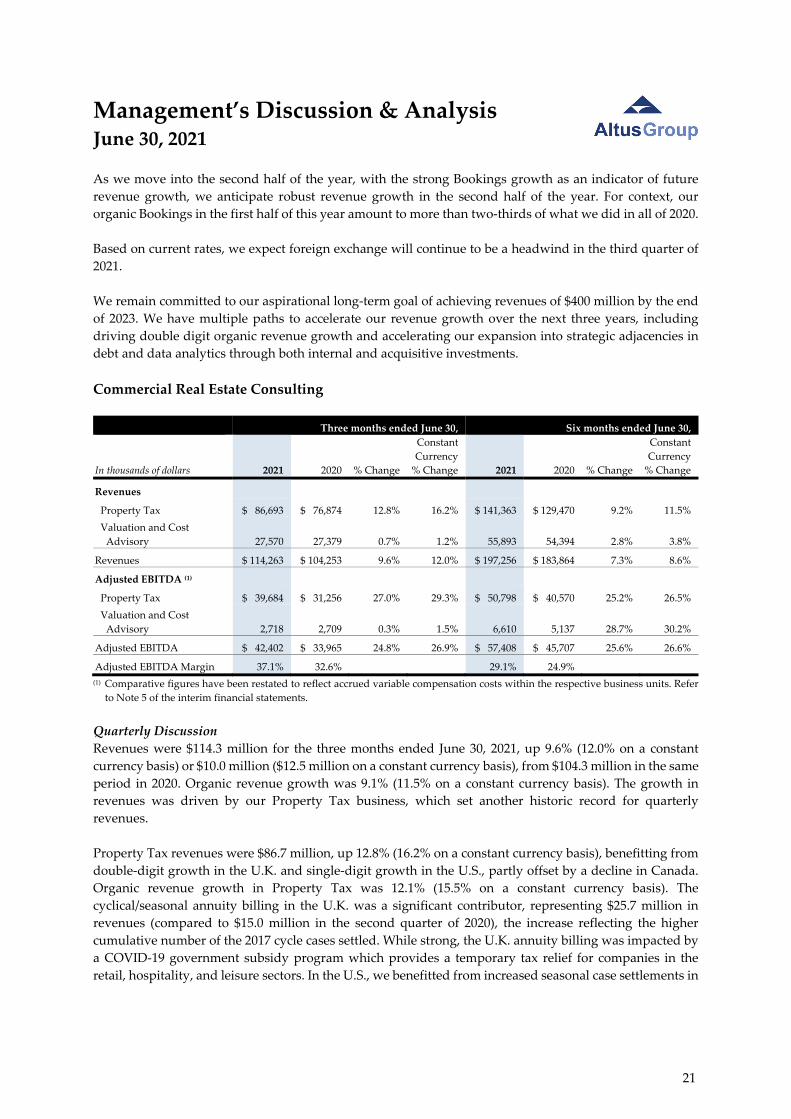
Commercial Real Estate Consulting
Three months ended June 30, Six months ended June 30,
In thousands of dollars 2021 2020 % Change
Constant
Currency
% Change 2021 2020 % Change
Constant
Currency
% Change
Revenues
Property Tax $ 86,693 $ 76,874 12.8% 16.2% $ 141,363 $ 129,470 9.2% 11.5%
Valuation and Cost
Advisory 27,570 27,379 0.7% 1.2% 55,893 54,394 2.8% 3.8%
Revenues $ 114,263 $ 104,253 9.6% 12.0% $ 197,256 $ 183,864 7.3% 8.6%
Adjusted EBITDA (1)
Property Tax $ 39,684 $ 31,256 27.0% 29.3% $ 50,798 $ 40,570 25.2% 26.5%
Valuation and Cost
Advisory 2,718 2,709 0.3% 1.5% 6,610 5,137 28.7% 30.2%
Adjusted EBITDA $ 42,402 $ 33,965 24.8% 26.9% $ 57,408 $ 45,707 25.6% 26.6%
Adjusted EBITDA Margin 37.1% 32.6% 29.1% 24.9%
(1) Comparative figures have been restated to reflect accrued variable compensation costs within the respective business units. Refer
to Note 5 of the interim financial statements.
Quarterly Discussion
Revenues were $114.3 million for the three months ended June 30, 2021, up 9.6% (12.0% on a constant
currency basis) or $10.0 million ($12.5 million on a constant currency basis), from $104.3 million in the same
period in 2020. Organic revenue growth was 9.1% (11.5% on a constant currency basis). The growth in
revenues was driven by our Property Tax business, which set another historic record for quarterly
revenues.
Property Tax revenues were $86.7 million, up 12.8% (16.2% on a constant currency basis), benefitting from
double‐digit growth in the U.K. and single‐digit growth in the U.S., partly offset by a decline in Canada.
Organic revenue growth in Property Tax was 12.1% (15.5% on a constant currency basis). The
cyclical/seasonal annuity billing in the U.K. was a significant contributor, representing $25.7 million in
revenues (compared to $15.0 million in the second quarter of 2020), the increase reflecting the higher
cumulative number of the 2017 cycle cases settled. While strong, the U.K. annuity billing was impacted by
a COVID‐19 government subsidy program which provides a temporary tax relief for companies in the
retail, hospitality, and leisure sectors. In the U.S., we benefitted from increased seasonal case settlements in
21

Management’s Discussion & Analysis June 30, 2021
Texas, as well as a catch up on COVID‐19 related delays from prior quarters. In Canada, revenues were
lower, primarily impacted by timing of Ontario settlements (some of which were pulled forward into the
first quarter), as well as lower year‐over‐year comparative performance in Montreal and Manitoba which
were more favourably positioned in their cycles in the prior year, partly offset by a significant multi‐year
case settlement in Saskatchewan.
Revenue from our Valuation and Cost Advisory businesses were higher as underlying activity levels were
higher from prior year. However, the cyber incident which occurred late in the quarter caused projects to
be deferred and impacted revenues by approximately $1.6 million.
Adjusted EBITDA was $42.4 million for the three months ended June 30, 2021, up 24.8% (26.9% on a
constant currency basis) or $8.4 million ($9.1 million on a constant currency basis), from $34.0 million in
the same period in 2020. Organic Adjusted EBITDA growth was 27.3% (29.4% on a constant currency basis).
The increase in earnings resulted from higher revenues from Property Tax.
Year‐to‐Date Discussion
Revenues were $197.3 million for the six months ended June 30, 2021, up 7.3% (8.6% on a constant currency
basis) or $13.4 million ($15.8 million on a constant currency basis), from $183.9 million in the same period
in 2020. Organic revenue growth was 5.8% (7.1% on a constant currency basis). The growth in revenues
was driven by our Property Tax business and our Valuation practice.
Property Tax revenues were $141.4 million, up 9.2% (11.5% on a constant currency basis) and were higher
as a result of annuity billings in the U.K. and a healthy start to the year in Western Canada, offset by
COVID‐19 delayed settlement activity in the U.S. in the first quarter of this year, and the negative currency
impact from a weaker U.S. dollar. Organic revenue growth in Property Tax was 7.0% (9.3% on a constant
currency basis). Consistent with seasonal patterns, the U.S. continues to build its pipeline that is expected
to benefit future quarters. Our Valuation and Cost Advisory business grew on increased activity levels.
Adjusted EBITDA was $57.4 million for the six months ended June 30, 2021, up 25.6% (26.6% on a constant
currency basis) or $11.7 million ($12.2 million on a constant currency basis), from $45.7 million in the same
period in 2020. Organic Adjusted EBITDA growth was 25.2% (26.2% on a constant currency basis). The
increase in earnings resulted from higher revenues from Property Tax.
Outlook
Our global Property Tax practice is one of the largest and fastest growing property tax practices and
continues to represent an attractive growth opportunity in a consolidating industry, driven by solid market
fundamentals, our strong competitive position, and resilient demand for our specialized services.
Following our best‐ever performance in 2020, we remain well positioned to deliver another record revenue
year in 2021. Our outlook is supported by a healthy pipeline of cases to be settled, catch up from COVID‐
19 related delays experienced in 2020 and in the first quarter of 2021, and higher annuity billings in the
U.K. Given the seasonal and cyclical variations of the Property Tax business (as discussed in more detail
on page 29 of this MD&A), we expect to experience typical quarterly variability in our financial
performance, including the second quarter being our seasonally strongest quarter. The ongoing COVID‐19
pandemic has and could continue to potentially impact some of these typical variations, and cause some
short‐term disruption related to the anticipated timing of settlements.
22
Management’s Discussion & Analysis June 30, 2021
Our Valuation and Cost Advisory practices enjoy significant market share and, as a result, have been
growing modestly. We have enhanced these businesses with the use of technology and expect that to drive
operational efficiencies. Although the COVID‐19 pandemic has had some impact on activity levels,
business resumption in key jurisdictions mitigates against further declines. A significant portion of the
Valuation business consists of periodic valuations of CRE portfolios, which are expected to remain stable
or in some cases increase in frequency. Our Cost Advisory business depends to a large extent on an active
CRE developer market, which appears to be stable. Aside from any short‐term disruptions, the long‐term
opportunity associated with this business remains intact as many engagements are multi‐year. Although
the cybersecurity incident impacted revenues in the second quarter, we expect to return to normalized
levels for the balance of the year.
Corporate Costs
Quarterly Discussion
Corporate costs were $9.1 million for the three months ended June 30, 2021, as compared to $7.2 million
(restated to reflect accrued variable compensation costs within the respective business units) in the same
period in 2020. Corporate costs increased primarily due to higher consulting fees for professional advisory.
Starting in the first quarter of 2021, we accrued and allocated variable compensation costs for the business
units directly on a quarterly basis, versus the former treatment of accruing under the Corporate segment
and reallocating in the fourth quarter. A table detailing the 2020 quarterly results under the new treatment
is posted on our website under the Investor Relations section.
Year‐to‐Date Discussion
Corporate costs were $17.1 million for the six months ended June 30, 2021, as compared to $14.0 million
(restated to reflect accrued variable compensation costs within the respective business units) in the same
period in 2020. Corporate costs increased primarily due to higher consulting fees for professional advisory.
Starting in the first quarter of 2021, we accrued and allocated variable compensation costs for the business
units directly on a quarterly basis, versus the former treatment of accruing under the Corporate segment
and reallocating in the fourth quarter. A table detailing the 2020 quarterly results under the new treatment
is posted on our website under the Investor Relations section.
Liquidity and Capital Resources
Cash Flow Three months ended June 30, Six months ended June 30,
In thousands of dollars 2021 2020 (1) 2021 2020 (1)
Net cash related to operating activities $ 36,204 $ 26,321 $ 39,935 $ 9,909
Net cash related to financing activities 116,321 (24,306) 114,469 5,430
Net cash related to investing activities (146,171) (1,886) (147,644) (2,961)
Effect of foreign currency translation (1,347) (931) (2,318) 1,426
Change in cash position during the period $ 5,007 $ (802) $ 4,442 $ 13,804
Dividends paid $ 5,166 $ 5,980 $ 10,603 $ 11,320 (1) The net cash flows provided by (used in) the operating, financing, and investing activities of the Geomatics discontinued operations
for the three months ended June 30, 2020 were $1.6 million, $(0.4) million, and $(1.3) million, respectively. For the six months ended
June 30, 2020, the net cash flows provided by (used in) the operating, financing, and investing activities of the Geomatics
discontinued operations were $3.1 million, $(0.7) million, and $(1.4) million, respectively. The Geomatics discontinued operations
was contributed into the GeoVerra joint venture in the second quarter of 2020.
23

Management’s Discussion & Analysis June 30, 2021
We expect to fund operations with cash on hand and cash derived from operating activities. Deficiencies
arising from short‐term working capital requirements and capital expenditures may be financed on a short‐
term basis with bank indebtedness or on a permanent basis with offerings of securities. Whilst we continue
to generate strong cash flows from our operating activities, significant erosion in the general state of the
economy or further prolonged impacts of the COVID‐19 pandemic or the cybersecurity incident could
affect our liquidity by reducing future cash generated from operating activities or by limiting access to
short‐term financing as a result of tightening credit markets.
Cash from Operating Activities
Working Capital
In thousands of dollars June 30, 2021 December 31, 2020
Current assets $ 284,009 $ 268,571
Current liabilities 172,941 153,184
Working capital $ 111,068 $ 115,387
Current assets are composed primarily of cash and cash equivalents and trade receivables and other
(including a $1.8 million related party receivable from our GeoVerra joint venture related mainly to the
settlement of our initial contributions, which as a related party transaction, is described in the notes to our
2020 annual financial statements). It also includes income taxes recoverable and derivative financial
instruments for our equity hedges on RSUs and DSUs. The increase is primarily due to the generation of
cash and cash equivalents through collection of trade receivables from operations.
Current liabilities are composed primarily of trade payables and other (including a $0.3 million related
party payable to our GeoVerra joint venture related mainly to customer payments received on its behalf),
lease liabilities. It also includes income taxes payable and derivative financial instruments in a liability
position. The increase in current liabilities is mainly due to the increase in accrued expenses and the contract
liabilities (deferred revenue) and deferred consideration payables resulting from the Finance Active
acquisition, offset by continued payment of restructuring provisions related to our 2020 global
restructuring program.
As at June 30, 2021, trade receivables, net and contract assets (unbilled revenue on customer contracts) net
of contract liabilities (deferred revenue) was $124.0 million, down 7.2% or $9.6 million from $133.6 million
as at December 31, 2020. As a percentage of the trailing 12‐month revenues, trade receivables and unbilled
revenue on customer contracts net of deferred revenue, for continuing operations, was 20.0% as at June 30,
2021, as compared to 23.4% as at December 31, 2020.
Our Days Sales Outstanding (“DSO”) from continuing operations was 77 days as at June 30, 2021, as
compared to 84 days as at December 31, 2020. We calculate DSO by taking the five‐quarter average balance
of trade receivables, net and unbilled revenue on customer contracts net of deferred revenue and the result
is then divided by the trailing 12‐month revenues plus any pre‐acquisition revenues, as applicable, and
multiplied by 365 days. Our method of calculating DSO may differ from the methods used by other issuers
and, accordingly, may not be comparable to similar measures used by other issuers. We believe this
measure is useful to investors as it demonstrates our ability to convert revenue into cash.
24
Management’s Discussion & Analysis June 30, 2021
Current and long‐term liabilities include amounts owing to the vendors of acquired businesses on account
of excess working capital, deferred purchase price payments and other closing adjustments. As at June 30,
2021, the amounts owing to the vendors of acquired businesses were $8.7 million, as compared to $3.7
million as at December 31, 2020. We intend to satisfy the payments with cash on hand.
We expect to satisfy the balance of our current liabilities through the realization of our current assets.
Cash from Financing Activities
Our revolving bank credit facilities are unsecured and used for general corporate purposes and the funding
of our acquisitions. In March 2020, we amended our bank credit facilities to further strengthen our financial
and liquidity position, increasing our borrowing capacity from $200.0 million to $275.0 million, with certain
provisions that allow us to further increase the limit to $350.0 million. The bank credit facilities have a three
year term expiring March 24, 2023, with an additional two‐year extension available at our option.
As at June 30, 2021, our total borrowings on our bank credit facilities amounted to $248.8 million, an
increase of $120.8 million from December 31, 2020.
Loans under the bank credit facilities bear interest at a floating rate, based on the Canadian Prime rates,
Canadian Bankers’ Acceptance rates, U.S. Base rates or LIBOR rates plus, in each case, an applicable margin
to those rates. The applicable margin for Canadian Bankers’ Acceptance and LIBOR borrowings depends
on a trailing four‐quarter calculation of the funded debt to EBITDA ratio. The weighted average effective
rate of interest for the three and six months ended June 30, 2021 on our bank credit facilities was 1.28% and
2.56%, as compared to 2.37% and 2.84% in the corresponding periods in 2020, respectively.
The bank credit facilities require us to comply with the following financial ratios:
Maximum Funded Debt to EBITDA ratio: maximum of 4.00:1
Minimum Interest Coverage ratio: minimum of 3.00:1
In addition, the Company and certain of its subsidiaries, collectively the guarantors, must account for at
least 80% of consolidated revenues on a trailing 12‐month basis. The bank credit facilities require
repayment of the principal at such time as we receive proceeds of insurance, equity or debt issuances, or
sale of assets in excess of certain thresholds. Letters of credit are also available on customary terms for bank
credit facilities of this nature.
We also have outstanding letters of credit under our bank credit facilities in the total amount of $1.1 million
(December 31, 2020 ‐ $1.1 million).
As at June 30, 2021, we have guaranteed up to $1.5 million in connection with vehicle leases and related
services entered into by GeoVerra (December 31, 2020 ‐ $1.5 million).
25

Management’s Discussion & Analysis June 30, 2021
As at June 30, 2021, we were in compliance with the financial covenants of our amended bank credit
facilities, which are summarized below:
June 30, 2021
Funded debt to EBITDA (maximum of 4.00:1) 2.03:1
Interest coverage (minimum of 3.00:1) 42.12:1
Other than long‐term debt and letters of credit, we are subject to other contractual obligations, such as
leases and amounts owing to the vendors of acquired businesses as discussed above.
Contractual Obligations (1) Payments Due by Period (undiscounted)
In thousands of dollars Total
Less than
1 year 1 to 3 years 4 to 5 years Over 5 years
Bank credit facilities $ 248,839 $ ‐ $ 248,839 $ ‐ $ ‐
Lease obligations 79,816 14,780 28,923 18,658 17,455
Deferred consideration payables 8,691 4,369 4,322 ‐ ‐
Due to GeoVerra 314 314 ‐ ‐ ‐
Other liabilities 161,699 143,514 7,054 847 10,284
Total contractual obligations $ 499,359 $ 162,977 $ 289,138 $ 19,505 $ 27,739 (1) Contractual obligations exclude aggregate unfunded capital contributions of $2.3 million to certain partnerships as the amount and
timing of such payments are uncertain.
Cash from Investing Activities
We invest in property, plant and equipment and intangible assets to support the activities of the business.
Capital expenditures for accounting purposes include property, plant and equipment in substance and in
form, and intangible assets.
Capital expenditures are reconciled as follows:
Capital Expenditures Three months ended June 30, Six months ended June 30,
In thousands of dollars 2021 2020 (1) 2021 2020 (1)
Property, plant and equipment additions $ 1,241 $ 740 $ 1,730 $ 1,660
Intangibles additions 1,319 3 2,267 66
Proceeds from disposal of property, plant and
equipment and intangibles ‐ (43) ‐ (96)
Capital expenditures $ 2,560 $ 700 $ 3,997 $ 1,630 (1) Capital expenditures related to the Geomatics discontinued operations for the three and six months ended June 30, 2020 were $0.2
million and $0.3 million, respectively. The Geomatics discontinued operations was contributed into the GeoVerra joint venture in
the second quarter of 2020.
26
Management’s Discussion & Analysis June 30, 2021
Reconciliation of Adjusted EBITDA to Profit (Loss)
The following table provides a reconciliation between Adjusted EBITDA and profit (loss):
Three months ended June 30, Six months ended June 30,
In thousands of dollars 2021 2020 2021 2020
Adjusted EBITDA $ 42,239 $ 34,899 $ 59,479 $ 48,147
Occupancy costs calculated on a similar basis prior
to the adoption of IFRS 16 (1) 3,309 3,194 6,428 6,236
Depreciation of right‐of‐use assets (3,042) (2,814) (5,810) (5,686)
Depreciation of property, plant and equipment
and amortization of intangibles (9,164) (7,885) (15,936) (15,602)
Acquisition and related transition (costs) income (1,898) ‐ (7,080) 1,176
Unrealized foreign exchange gain (loss) (2) (323) (836) (742) (64)
Gain (loss) on disposal of right‐of‐use assets,
property, plant and equipment and intangibles (2) 5 (10) 243 (24)
Share of profit (loss) of joint venture (96) 8 (485) 8
Non‐cash share‐based compensation costs (3) (4,980) (2,353) (7,412) (3,868)
Gain (loss) on equity derivatives net of mark‐to‐
market adjustments on related RSUs and DSUs
being hedged (3) (449) 67 176 (697)
Restructuring (costs) recovery (270) (7,480) (221) (7,455)
Gain (loss) on investments (4) 315 (35) 503 90
Impairment charge ‐ leases ‐ (36) ‐ (36)
Other non‐operating and/or non‐recurring income
(costs) (5) (962) (368) (962) (1,189)
Earnings (loss) from continuing operations
before finance costs and income taxes 24,684 16,351 28,181 21,036
Finance (costs) income, net ‐ leases (582) (631) (1,152) (1,291)
Finance (costs) income, net ‐ other (933) (1,080) (1,511) (2,587)
Profit (loss) from continuing operations before
income taxes 23,169 14,640 25,518 17,158
Income tax (expense) recovery (6,828) (3,307) (6,540) (4,068)
Profit (loss) for the period from continuing
operations $ 16,341 $ 11,333 $ 18,978 $ 13,090
Profit (loss) for the period from discontinued
operations ‐ 266 ‐ (5,170)
Profit (loss) for the period $ 16,341 $ 11,599 $ 18,978 $ 7,920 (1) Management uses the non‐GAAP occupancy costs calculated on a similar basis prior to the adoption of IFRS 16 when analyzing financial and
operating performance.
(2) Included in office and other operating expenses in the interim condensed consolidated statements of comprehensive income (loss). (3) Included in employee compensation expenses in the interim condensed consolidated statements of comprehensive income (loss). (4) Gain (loss) on investments relates to changes in the fair value of investments in partnerships. (5) Other non‐operating and/or non‐recurring income (costs) for the three and six months ended June 30, 2021 relate to (i) costs relating to the June 13,
2021 cybersecurity incident. For the three months ended June 30, 2020, other non‐operating and/or non‐recurring income (costs) relate to (i) legal,
advisory, and other consulting costs related to a Board strategic initiative, and (ii) transaction and other related costs. For the six months ended June
30, 2020, other non‐operating and/or non‐recurring income (costs) also includes transitional costs related to the departure of a senior executive. These
are included in office and other operating expenses in the interim condensed consolidated statements of comprehensive income (loss).
27

Management’s Discussion & Analysis June 30, 2021
Reconciliation of Adjusted Earnings (Loss) Per Share to Profit (Loss)
The following table provides a reconciliation between Adjusted EPS and profit (loss):
Three months ended June 30, Six months ended June 30,
In thousands of dollars, except for per share amounts 2021 2020 2021 2020
Profit (loss) for the period $ 16,341 $ 11,599 $ 18,978 $ 7,920
(Profit) loss for the period from discontinued
operations ‐ (266) ‐ 5,170
Occupancy costs calculated on a similar basis
prior to the adoption of IFRS 16 (1) (3,309) (3,194) (6,428) (6,236)
Depreciation of right‐of‐use assets 3,042 2,814 5,810 5,686
Finance costs (income), net ‐ leases 582 631 1,152 1,291
Amortization of intangibles of acquired
businesses 7,971 6,028 13,488 12,205
Unrealized foreign exchange loss (gain) 323 836 742 64
Loss (gain) on disposal of right‐of‐use assets,
property, plant and equipment and intangibles (5) 10 (243) 24
Non‐cash share‐based compensation costs 4,980 2,353 7,412 3,868
Loss (gain) on equity derivatives net of mark‐to‐
market adjustments on related RSUs and DSUs
being hedged 449 (67) (176) 697
Interest accretion on contingent consideration
payables ‐ 57 ‐ 102
Restructuring costs (recovery) 270 7,480 221 7,455
Loss (gain) on hedging transactions, including
currency forward contracts and interest expense
(income) on swaps ‐ (16) ‐ 138
Acquisition and related transition costs (income) 1,898 ‐ 7,080 (1,176)
Loss (gain) on investments (315) 35 (503) (90)
Share of loss (profit) of joint venture 96 (8) 485 (8)
Impairment charge ‐ leases ‐ 36 ‐ 36
Other non‐operating and/or non‐recurring costs
(income) 962 368 962 1,189
Tax impact on above (2,006) (3,577) (3,942) (5,058)
Adjusted earnings (loss) for the period $ 31,279 $ 25,119 $ 45,038 $ 33,277
Weighted average number of shares ‐ basic 41,049,045 40,114,805 40,801,797 40,005,374
Weighted average number of restricted shares 586,221 337,341 491,652 380,208
Weighted average number of shares ‐ adjusted 41,635,266 40,452,146 41,293,449 40,385,582
Adjusted earnings (loss) per share $0.75 $0.62 $1.09 $0.82 (1) Management uses the non‐GAAP occupancy costs calculated on a similar basis prior to the adoption of IFRS 16 when analyzing
financial and operating performance.
28
Management’s Discussion & Analysis June 30, 2021
Summary of Quarterly Results
2021 2020 2019
In thousands of dollars, except
for per share amounts Jun 30 Mar 31
Fiscal
2020 Dec 31 Sep 30 Jun 30 Mar 31
Fiscal
2019 Dec 31 Sep 30
Results of Operations
Revenues $ 173,523 $ 137,158 $ 561,156 $ 139,480 $ 134,950 $ 155,470 $ 131,256 $ 525,717 $ 138,451 $ 126,787
Adjusted EBITDA $ 42,239 $ 17,240 $ 98,928 $ 26,734 $ 24,047 $ 34,899 $ 13,248 $ 84,709 $ 22,331 $ 18,785
Adjusted EBITDA margin 24.3% 12.6% 17.6% 19.2% 17.8% 22.4% 10.1% 16.1% 16.1% 14.8%
Profit (loss) for the period
from continuing
operations $ 16,341 $ 2,637 $ 27,009 $ 4,622 $ 9,297 $ 11,333 $ 1,757 $ 23,891 $ 6,118 $ 4,598
Profit (loss) for the period
from discontinued
operations $ ‐ $ ‐ $ (5,576) $ (276) $ (130) $ 266 $ (5,436) $ (5,697) $ (5,846) $ 438
Basic earnings (loss) per
share:
Continuing operations
Discontinued operations
$0.40
$0.00
$0.07
$0.00
$0.67
$(0.14)
$0.11
$(0.01)
$0.23
$0.00
$0.28
$0.01
$0.04
$(0.14)
$0.61
$(0.14)
$0.15
$(0.15)
$0.12
$0.01
Diluted earnings (loss) per
share:
Continuing operations
Discontinued operations
$0.39
$0.00
$0.06
$0.00
$0.66
$(0.14)
$0.11
$(0.01)
$0.22
$0.00
$0.28
$0.01
$0.04
$(0.13)
$0.60
$(0.14)
$0.15
$(0.14)
$0.11
$0.01
Adjusted earnings (loss)
per share $0.75 $0.34 $1.67 $0.44 $0.40 $0.62 $0.20 $1.43 $0.42 $0.28
Weighted average number
shares (‘000s):
Basic
Diluted
41,049
42,116
40,552
41,642
40,159
41,209
40,380
41,532
40,240
41,348
40,115
41,039
39,896
40,869
39,461
40,084
39,787
40,653
39,643
40,411
Our global Property Tax practice (which made up approximately 50% of total consolidated revenues in Q2
2021) is subject to seasonal and cyclical variations which may impact overall quarterly results, which could
potentially be more pronounced during the COVID‐19 pandemic. Significant fluctuations on a quarterly
basis arise as a result of the timing of contingency settlements and other factors, such as the wide‐ranging
variety of tax cycles across our various jurisdictions (which range from annual to seven‐year cycles). We
also experience some seasonal peaks in the U.K. and U.S. markets. In the U.K., the second quarter benefits
from annuity billing starting in the second year of a new cycle, and in the U.S. we tend to experience higher
volumes of settlements in the second and third quarters. We perform annuity billing in the U.K. for a
significant number of our contracts that occur each April starting in the second year of the cycle. The
revenues from the annuity billings are expected to grow cumulatively over the cycle as more cases are
settled and as the volume of billable clients increases concurrent with case settlements. It should also be
noted that since a higher portion of our revenues come from contingency contracts, the front‐end of a cycle
typically requires a ramp‐up period in preparation for the appeals and therefore tends to have lower
earnings than later in the cycles when more settlements are made and those revenues flow directly to the
bottom line.
29

Management’s Discussion & Analysis June 30, 2021
Share Data
As at August 10, 2021, 41,151,606 common shares were outstanding and are net of 638,376 treasury shares.
These treasury shares are shares held by Altus Group, which are subject to restrictive covenants and may
or may not vest for employees. Accordingly, these shares are not included in the total number of common
shares outstanding for financial reporting purposes and are not included in basic earnings per share
calculations.
As at June 30, 2021, there were 1,612,157 share options outstanding (December 31, 2020 ‐ 1,791,682 share
options outstanding) at a weighted average exercise price of $40.08 per share (December 31, 2020 ‐ $35.78
per share) and 511,828 share options were exercisable (December 31, 2020 ‐ 453,517). All share options are
exercisable into common shares on a one‐for‐one basis.
Shareholders who are resident in Canada may elect to automatically reinvest quarterly dividends in
additional Altus Group common shares under our Dividend Reinvestment Plan (“DRIP”).
Pursuant to the DRIP, and in the case where common shares are issued from treasury, cash dividends will
be reinvested in additional Altus Group common shares at the weighted average market price of our
common shares for the five trading days immediately preceding the relevant dividend payment date, less
a discount, currently set at 4%. In the case where common shares will be purchased on the open market,
cash dividends will be reinvested in additional Altus Group common shares at the relevant average market
price paid in respect of satisfying this reinvestment plan.
For the three and six months ended June 30, 2021, 17,384 and 32,027 common shares, respectively (2020 ‐
2,325 and 19,863 common shares, respectively) were issued under the DRIP.
Financial Instruments and Other Instruments
Financial instruments held in the normal course of business included in our unaudited interim condensed
consolidated balance sheet as at June 30, 2021 consist of cash and cash equivalents, trade receivables and
other (excluding deferred costs to obtain customer contracts and prepayments), trade payables and other
(excluding contract liabilities), income taxes recoverable and payable, investments, borrowings and
derivative financial instruments. We do not enter into financial instrument arrangements for speculative
purposes.
The fair values of the short‐term financial instruments approximate their carrying values. The fair values
of borrowings are not significantly different than their carrying values, as these instruments bear interest
at rates comparable to current market rates. The fair values of other long‐term assets and liabilities, and
contingent consideration payables are measured using a discounted cash flow analysis of expected cash
flows in future periods. The investments in equity instruments are measured based on valuations of the
respective entities. Investments in partnerships are measured in relation to the fair value of assets in the
respective partnerships.
The fair value of the liabilities for our RSUs and DSUs as at June 30, 2021 was approximately $21.8 million,
based on the published trading price on the TSX for our common shares.
30

Management’s Discussion & Analysis June 30, 2021
We are exposed to interest rate risk in the event of fluctuations in the Canadian Prime rates, Canadian
Bankers’ Acceptance rates, U.S. Base rates or LIBOR rates, as the interest rates on the bank credit facilities
fluctuate with changes in these rates.
To mitigate our exposure to interest rate fluctuations, we monitor interest rates and consider entering into
interest rate swap agreements in connection with our bank credit facilities.
We are exposed to price risk as the liabilities for cash‐settled plans are classified as fair value through profit
or loss, and linked to the price of our common shares.
We enter into equity derivatives to manage our exposure to changes in the fair value of RSUs and DSUs,
issued under their respective plans, due to changes in the fair value of our common shares. Changes in the
fair value of these derivatives are recorded as employee compensation expense and offset the impact of
mark‐to‐market adjustments on the RSUs and DSUs that have been accrued.
As at June 30, 2021, we have equity derivatives relating to RSUs and DSUs outstanding with a notional
amount of $14.8 million. The net fair value of these derivatives is $15.0 million in our favour.
We are exposed to credit risk with respect to our cash and cash equivalents, trade receivables and other
and derivative financial instruments. Credit risk is not concentrated with any particular customer. In
certain parts of our business, it is often common business practice of our customers to pay invoices over an
extended period of time and/or at the completion of the project or on receipt of funds. In addition, the
COVID‐19 pandemic has introduced additional credit risk. We assess lifetime expected credit losses for all
trade receivables and contract assets for unbilled revenue on customer contracts by grouping customers
with shared credit risk characteristics, the days past due, and by incorporating forward‐looking
information as applicable.
Liquidity risk is the risk that we will not be able to meet our financial obligations as they become due. We
manage liquidity risk through the management of our capital structure and financial leverage. We also
manage liquidity risk by continuously monitoring actual and projected cash flows, taking into account the
seasonality of our revenues and receipts and the maturity profile of our financial assets and liabilities. Our
Board of Directors reviews and approves our operating and capital budgets, as well as any material
transactions outside the ordinary course of business, including proposals on mergers, acquisitions or other
major investments.
Contingencies
From time to time, we or our subsidiaries are involved in legal proceedings, claims and litigation in the
ordinary course of business with customers, former employees and other parties. Although it is not possible
to determine the final outcome of such matters, based on all currently available information, we believe
that our liabilities, if any, arising from such matters will not have a material adverse effect on our financial
position or results of operations and have been adequately provided for in the interim financial statements.
In the ordinary course of business, we are subject to tax audits from various government agencies relating
to income and commodity taxes. As a result, from time to time, the tax authorities may disagree with the
positions and conclusions we made in our tax filings, which could lead to assessments and reassessments.
31

Management’s Discussion & Analysis June 30, 2021
These assessments and reassessments may have a material adverse effect on our financial position or results
of operations.
Changes in Significant Accounting Policies and Estimates
In March 2020, the World Health Organization declared COVID‐19 a global pandemic. The continued
spread of this contagious disease outbreak and related public health developments have adversely affected
workforces, economies, and financial markets globally, leading to an economic downturn and to legislative
and regulatory changes that have impacted our business and operations. The duration and magnitude of
the impact of the outbreak and its potential adverse effects on our business or results of operations continue
to be uncertain and will depend on future developments. Judgments made in the June 30, 2021 interim
financial statements reflect management’s best estimates as of the period end, taking into consideration the
most significant judgments that may be directly impacted by COVID‐19. Management’s significant
estimates and assumptions that could be impacted most by COVID‐19 are: revenue recognition and
determination and allocation of the transaction price, impairment of trade receivables and contract assets,
and estimated impairment of goodwill.
On June 13, 2021, we experienced a cybersecurity incident impacting some of our IT back‐office systems
(as discussed on page 11). As part of our cybersecurity and business continuity protocols, a select number
of controls and processes were adapted where automated integrations or systems access were temporarily
unavailable. As a result, there were no significant changes in our controls or significant assumptions and
estimates that have materially affected, or are reasonably likely to materially affect, our internal controls
over financial reporting or interim financial statements for the second quarter.
Disclosure Controls and Procedures and Internal Controls over Financial Reporting
Management is responsible for establishing and maintaining disclosure controls and procedures (“DC&P”)
and internal controls over financial reporting (“ICFR”), as those terms are defined in National Instrument
52‐109 ‐ Certification of Disclosure in Issuers’ Annual and Interim Filings (“NI 52‐109”).
Management has caused such DC&P to be designed under its supervision to provide reasonable assurance
that our material information, including material information of our consolidated subsidiaries, is made
known to our Chief Executive Officer and our Chief Financial Officer for the period in which the annual
and interim filings are prepared. Further, such DC&P are designed to provide reasonable assurance that
information we are required to disclose in our annual filings, interim filings or other reports we have filed
or submitted under securities legislation is recorded, processed, summarized and reported within the time
periods specified in the applicable securities legislation.
Management has caused such ICFR to be designed under its supervision using the framework established
in Internal Control ‐ Integrated Framework (2013) published by the Committee of Sponsoring
Organizations of the Treadway Commission (“COSO”) to provide reasonable assurance regarding the
reliability of financial reporting and the preparation of the interim financial statements for external
purposes in accordance with IFRS.
Section 3.3(1)(b) of NI 52‐109 allows an issuer to limit its design of DC&P and ICFR to exclude controls,
policies and procedures of a business that the issuer acquired not exceeding 365 days from the date of
acquisition.
32
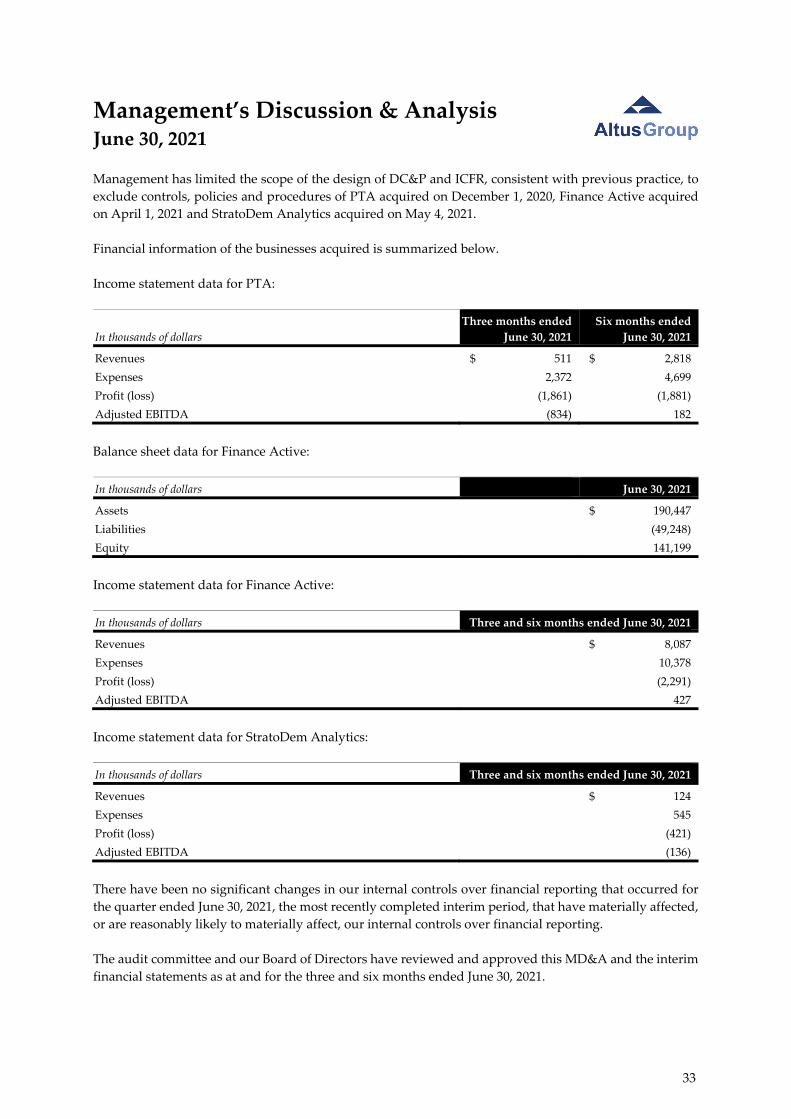
Management’s Discussion & Analysis June 30, 2021
Management has limited the scope of the design of DC&P and ICFR, consistent with previous practice, to
exclude controls, policies and procedures of PTA acquired on December 1, 2020, Finance Active acquired
on April 1, 2021 and StratoDem Analytics acquired on May 4, 2021.
Financial information of the businesses acquired is summarized below.
Income statement data for PTA:
In thousands of dollars
Three months ended
June 30, 2021
Six months ended
June 30, 2021
Revenues $ 511 $ 2,818
Expenses 2,372 4,699
Profit (loss) (1,861) (1,881)
Adjusted EBITDA (834) 182
Balance sheet data for Finance Active:
In thousands of dollars June 30, 2021
Assets $ 190,447
Liabilities (49,248)
Equity 141,199
Income statement data for Finance Active:
In thousands of dollars Three and six months ended June 30, 2021
Revenues $ 8,087
Expenses 10,378
Profit (loss) (2,291)
Adjusted EBITDA 427
Income statement data for StratoDem Analytics:
In thousands of dollars Three and six months ended June 30, 2021
Revenues $ 124
Expenses 545
Profit (loss) (421)
Adjusted EBITDA (136)
There have been no significant changes in our internal controls over financial reporting that occurred for
the quarter ended June 30, 2021, the most recently completed interim period, that have materially affected,
or are reasonably likely to materially affect, our internal controls over financial reporting.
The audit committee and our Board of Directors have reviewed and approved this MD&A and the interim
financial statements as at and for the three and six months ended June 30, 2021.
33

Management’s Discussion & Analysis June 30, 2021
Additional Information
Additional information relating to Altus Group Limited, including our Annual Information Form, is
available on SEDAR at www.sedar.com and on our corporate website at www.altusgroup.com under the
Investors tab. Our common shares trade on the TSX under the symbol “AIF”.
34
Altus Group Limited
Interim Condensed Consolidated Financial Statements
June 30, 2021 and 2020
(Unaudited) (Expressed in Thousands of Canadian Dollars)
35
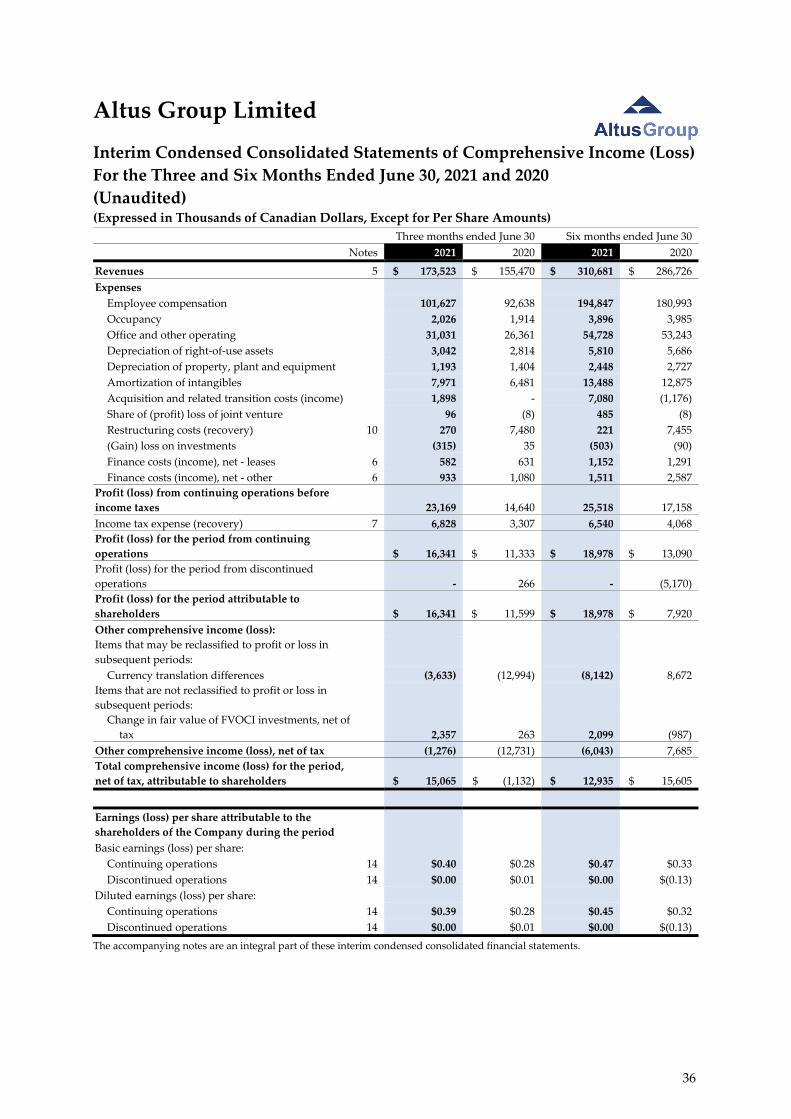
Altus Group Limited
Interim Condensed Consolidated Statements of Comprehensive Income (Loss)
For the Three and Six Months Ended June 30, 2021 and 2020
(Unaudited) (Expressed in Thousands of Canadian Dollars, Except for Per Share Amounts)
The accompanying notes are an integral part of these interim condensed consolidated financial statements.
Three months ended June 30 Six months ended June 30
Notes 2021 2020 2021 2020
Revenues 5 $ 173,523 $ 155,470 $ 310,681 $ 286,726
Expenses
Employee compensation 101,627 92,638 194,847 180,993
Occupancy 2,026 1,914 3,896 3,985
Office and other operating 31,031 26,361 54,728 53,243
Depreciation of right‐of‐use assets 3,042 2,814 5,810 5,686
Depreciation of property, plant and equipment 1,193 1,404 2,448 2,727
Amortization of intangibles 7,971 6,481 13,488 12,875
Acquisition and related transition costs (income) 1,898 ‐ 7,080 (1,176)
Share of (profit) loss of joint venture 96 (8) 485 (8)
Restructuring costs (recovery) 10 270 7,480 221 7,455
(Gain) loss on investments (315) 35 (503) (90)
Finance costs (income), net ‐ leases 6 582 631 1,152 1,291
Finance costs (income), net ‐ other 6 933 1,080 1,511 2,587
Profit (loss) from continuing operations before
income taxes 23,169 14,640 25,518 17,158
Income tax expense (recovery) 7 6,828 3,307 6,540 4,068
Profit (loss) for the period from continuing
operations $ 16,341 $ 11,333 $ 18,978 $ 13,090
Profit (loss) for the period from discontinued
operations ‐ 266 ‐ (5,170)
Profit (loss) for the period attributable to
shareholders $ 16,341 $ 11,599 $ 18,978 $ 7,920
Other comprehensive income (loss):
Items that may be reclassified to profit or loss in
subsequent periods:
Currency translation differences (3,633) (12,994) (8,142) 8,672
Items that are not reclassified to profit or loss in
subsequent periods:
Change in fair value of FVOCI investments, net of
tax 2,357 263 2,099 (987)
Other comprehensive income (loss), net of tax (1,276) (12,731) (6,043) 7,685
Total comprehensive income (loss) for the period,
net of tax, attributable to shareholders $ 15,065 $ (1,132) $ 12,935 $ 15,605
Earnings (loss) per share attributable to the
shareholders of the Company during the period
Basic earnings (loss) per share:
Continuing operations 14 $0.40 $0.28 $0.47 $0.33
Discontinued operations 14 $0.00 $0.01 $0.00 $(0.13)
Diluted earnings (loss) per share:
Continuing operations 14 $0.39 $0.28 $0.45 $0.32
Discontinued operations 14 $0.00 $0.01 $0.00 $(0.13)
36
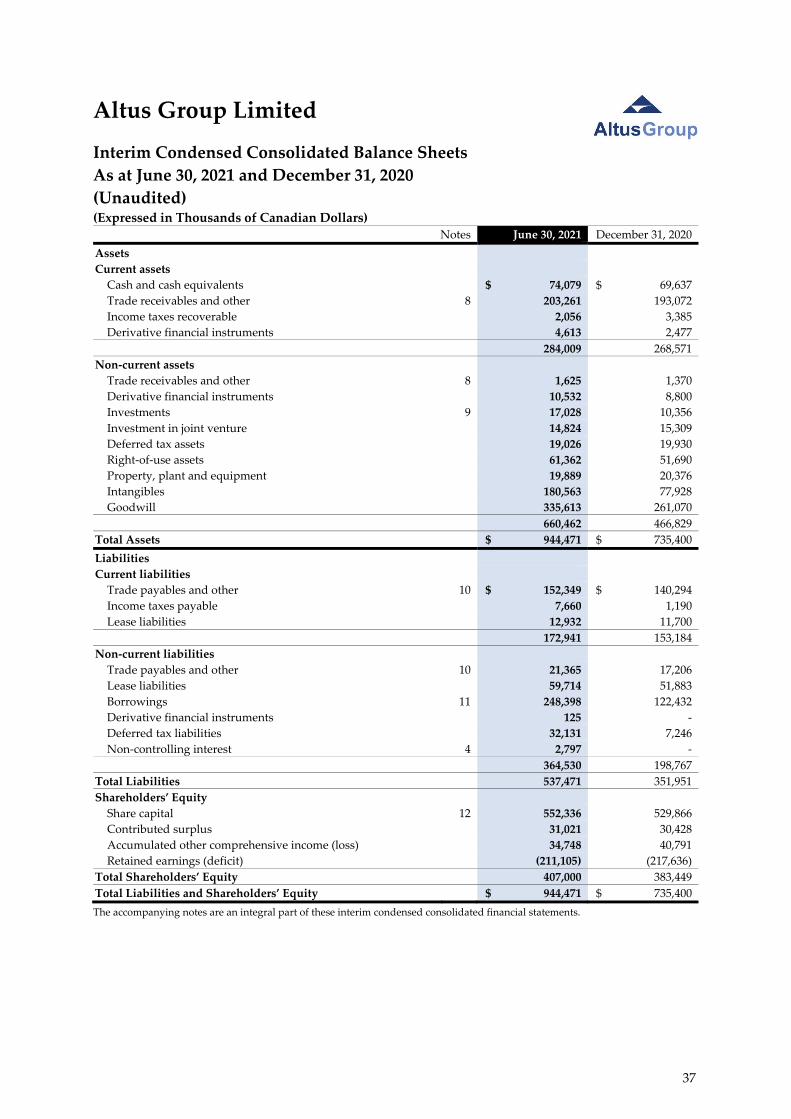
Altus Group Limited
Interim Condensed Consolidated Balance Sheets
As at June 30, 2021 and December 31, 2020
(Unaudited) (Expressed in Thousands of Canadian Dollars)
Notes June 30, 2021 December 31, 2020
Assets
Current assets
Cash and cash equivalents $ 74,079 $ 69,637
Trade receivables and other 8 203,261 193,072
Income taxes recoverable 2,056 3,385
Derivative financial instruments 4,613 2,477
284,009 268,571
Non‐current assets
Trade receivables and other 8 1,625 1,370
Derivative financial instruments 10,532 8,800
Investments 9 17,028 10,356
Investment in joint venture 14,824 15,309
Deferred tax assets 19,026 19,930
Right‐of‐use assets 61,362 51,690
Property, plant and equipment 19,889 20,376
Intangibles 180,563 77,928
Goodwill 335,613 261,070
660,462 466,829
Total Assets $ 944,471 $ 735,400
Liabilities
Current liabilities
Trade payables and other 10 $ 152,349 $ 140,294
Income taxes payable 7,660 1,190
Lease liabilities 12,932 11,700
172,941 153,184
Non‐current liabilities
Trade payables and other 10 21,365 17,206
Lease liabilities 59,714 51,883
Borrowings 11 248,398 122,432
Derivative financial instruments 125 ‐
Deferred tax liabilities 32,131 7,246
Non‐controlling interest 4 2,797 ‐
364,530 198,767
Total Liabilities 537,471 351,951
Shareholders’ Equity
Share capital 12 552,336 529,866
Contributed surplus 31,021 30,428
Accumulated other comprehensive income (loss) 34,748 40,791
Retained earnings (deficit) (211,105) (217,636)
Total Shareholders’ Equity 407,000 383,449
Total Liabilities and Shareholders’ Equity $ 944,471 $ 735,400
The accompanying notes are an integral part of these interim condensed consolidated financial statements.
37
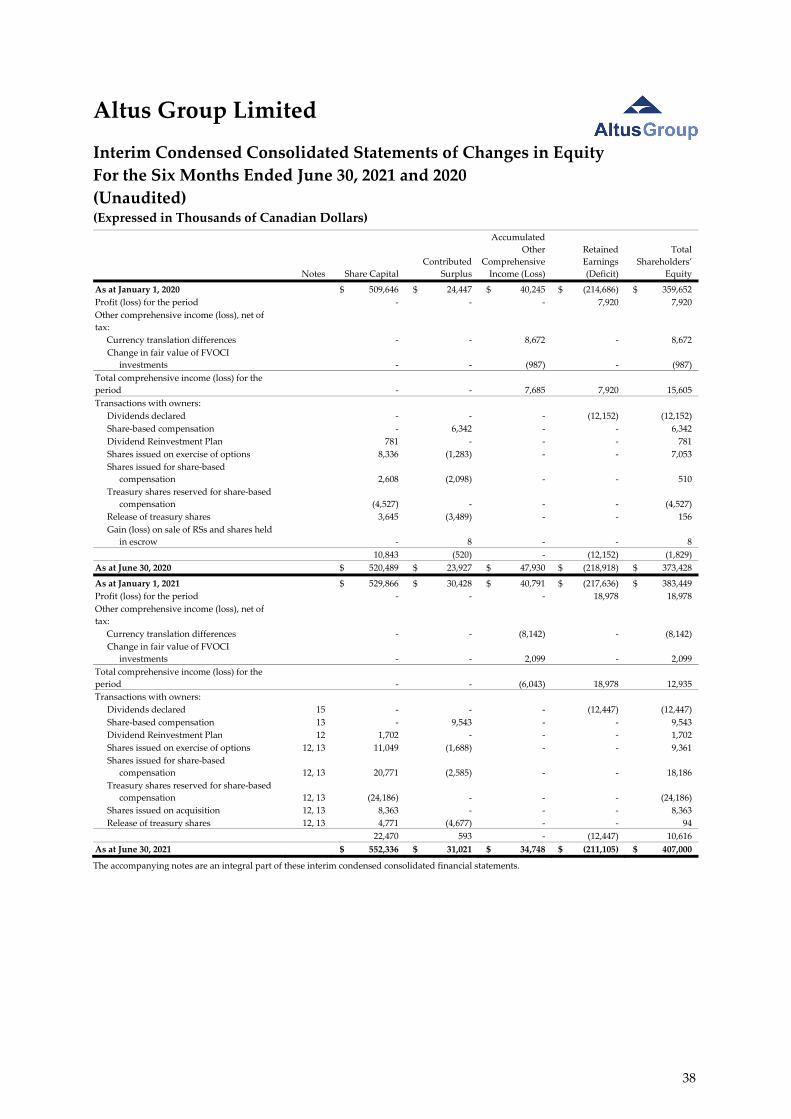
Altus Group Limited
Interim Condensed Consolidated Statements of Changes in Equity
For the Six Months Ended June 30, 2021 and 2020
(Unaudited) (Expressed in Thousands of Canadian Dollars)
The accompanying notes are an integral part of these interim condensed consolidated financial statements.
Notes Share Capital
Contributed
Surplus
Accumulated
Other
Comprehensive
Income (Loss)
Retained
Earnings
(Deficit)
Total
Shareholders’
Equity
As at January 1, 2020 $ 509,646 $ 24,447 $ 40,245 $ (214,686) $ 359,652
Profit (loss) for the period ‐ ‐ ‐ 7,920 7,920
Other comprehensive income (loss), net of
tax:
Currency translation differences ‐ ‐ 8,672 ‐ 8,672
Change in fair value of FVOCI
investments ‐ ‐ (987) ‐ (987)
Total comprehensive income (loss) for the
period ‐ ‐ 7,685 7,920 15,605
Transactions with owners:
Dividends declared ‐ ‐ ‐ (12,152) (12,152)
Share‐based compensation ‐ 6,342 ‐ ‐ 6,342
Dividend Reinvestment Plan 781 ‐ ‐ ‐ 781
Shares issued on exercise of options 8,336 (1,283) ‐ ‐ 7,053
Shares issued for share‐based
compensation 2,608 (2,098) ‐ ‐ 510
Treasury shares reserved for share‐based
compensation (4,527) ‐ ‐ ‐ (4,527)
Release of treasury shares 3,645 (3,489) ‐ ‐ 156
Gain (loss) on sale of RSs and shares held
in escrow ‐ 8 ‐ ‐ 8
10,843 (520) ‐ (12,152) (1,829)
As at June 30, 2020 $ 520,489 $ 23,927 $ 47,930 $ (218,918) $ 373,428
As at January 1, 2021 $ 529,866 $ 30,428 $ 40,791 $ (217,636) $ 383,449
Profit (loss) for the period ‐ ‐ ‐ 18,978 18,978
Other comprehensive income (loss), net of
tax:
Currency translation differences ‐ ‐ (8,142) ‐ (8,142)
Change in fair value of FVOCI
investments ‐ ‐ 2,099 ‐ 2,099
Total comprehensive income (loss) for the
period ‐ ‐ (6,043) 18,978 12,935
Transactions with owners:
Dividends declared 15 ‐ ‐ ‐ (12,447) (12,447)
Share‐based compensation 13 ‐ 9,543 ‐ ‐ 9,543
Dividend Reinvestment Plan 12 1,702 ‐ ‐ ‐ 1,702
Shares issued on exercise of options 12, 13 11,049 (1,688) ‐ ‐ 9,361
Shares issued for share‐based
compensation 12, 13 20,771 (2,585) ‐ ‐ 18,186
Treasury shares reserved for share‐based
compensation 12, 13 (24,186) ‐ ‐ ‐ (24,186)
Shares issued on acquisition 12, 13 8,363 ‐ ‐ ‐ 8,363
Release of treasury shares 12, 13 4,771 (4,677) ‐ ‐ 94
22,470 593 ‐ (12,447) 10,616
As at June 30, 2021 $ 552,336 $ 31,021 $ 34,748 $ (211,105) $ 407,000
38
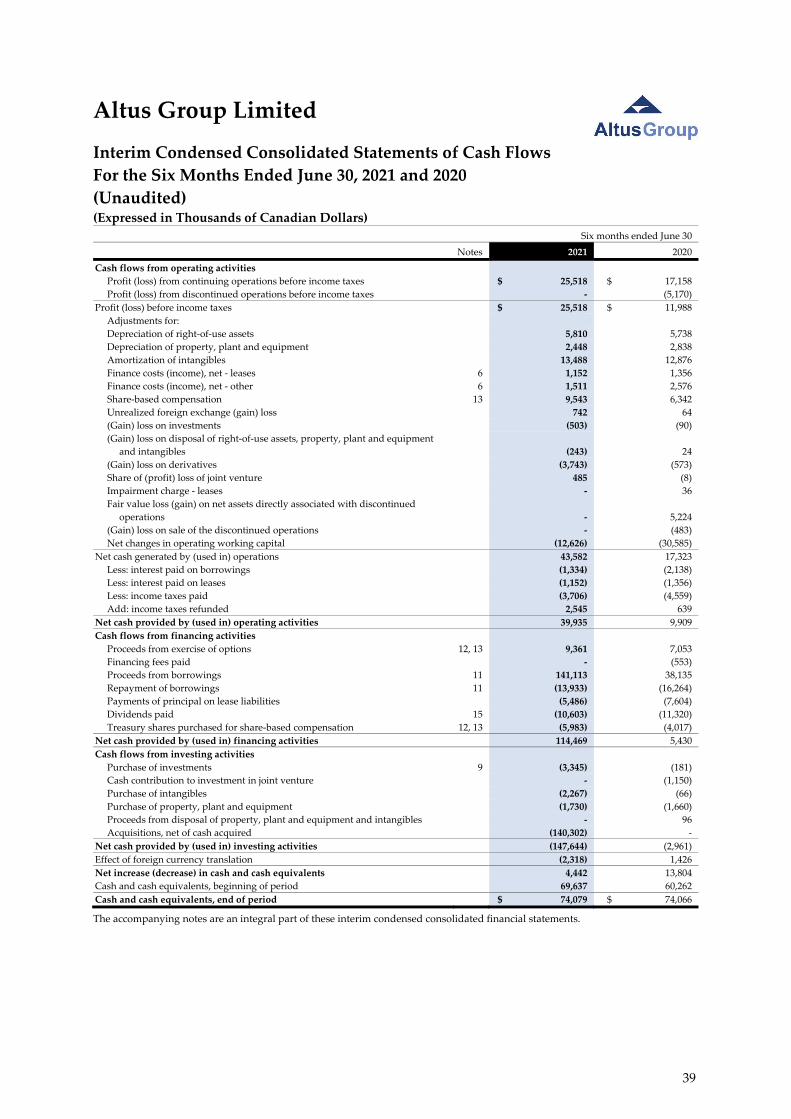
Altus Group Limited
Interim Condensed Consolidated Statements of Cash Flows
For the Six Months Ended June 30, 2021 and 2020
(Unaudited) (Expressed in Thousands of Canadian Dollars)
Six months ended June 30
Notes 2021 2020
Cash flows from operating activities
Profit (loss) from continuing operations before income taxes $ 25,518 $ 17,158
Profit (loss) from discontinued operations before income taxes ‐ (5,170)
Profit (loss) before income taxes $ 25,518 $ 11,988
Adjustments for:
Depreciation of right‐of‐use assets 5,810 5,738
Depreciation of property, plant and equipment 2,448 2,838
Amortization of intangibles 13,488 12,876
Finance costs (income), net ‐ leases 6 1,152 1,356
Finance costs (income), net ‐ other 6 1,511 2,576
Share‐based compensation 13 9,543 6,342
Unrealized foreign exchange (gain) loss 742 64
(Gain) loss on investments (503) (90)
(Gain) loss on disposal of right‐of‐use assets, property, plant and equipment
and intangibles (243) 24
(Gain) loss on derivatives (3,743) (573)
Share of (profit) loss of joint venture 485 (8)
Impairment charge ‐ leases ‐ 36
Fair value loss (gain) on net assets directly associated with discontinued
operations ‐ 5,224
(Gain) loss on sale of the discontinued operations ‐ (483)
Net changes in operating working capital (12,626) (30,585)
Net cash generated by (used in) operations 43,582 17,323
Less: interest paid on borrowings (1,334) (2,138)
Less: interest paid on leases (1,152) (1,356)
Less: income taxes paid (3,706) (4,559)
Add: income taxes refunded 2,545 639
Net cash provided by (used in) operating activities 39,935 9,909
Cash flows from financing activities
Proceeds from exercise of options 12, 13 9,361 7,053
Financing fees paid ‐ (553)
Proceeds from borrowings 11 141,113 38,135
Repayment of borrowings 11 (13,933) (16,264)
Payments of principal on lease liabilities (5,486) (7,604)
Dividends paid 15 (10,603) (11,320)
Treasury shares purchased for share‐based compensation 12, 13 (5,983) (4,017)
Net cash provided by (used in) financing activities 114,469 5,430
Cash flows from investing activities
Purchase of investments 9 (3,345) (181)
Cash contribution to investment in joint venture ‐ (1,150)
Purchase of intangibles (2,267) (66)
Purchase of property, plant and equipment (1,730) (1,660)
Proceeds from disposal of property, plant and equipment and intangibles ‐ 96
Acquisitions, net of cash acquired (140,302) ‐
Net cash provided by (used in) investing activities (147,644) (2,961)
Effect of foreign currency translation (2,318) 1,426
Net increase (decrease) in cash and cash equivalents 4,442 13,804
Cash and cash equivalents, beginning of period 69,637 60,262
Cash and cash equivalents, end of period $ 74,079 $ 74,066
The accompanying notes are an integral part of these interim condensed consolidated financial statements.
39
Altus Group Limited
Notes to Interim Condensed Consolidated Financial Statements
June 30, 2021 and 2020
(Unaudited) (Expressed in Thousands of Canadian Dollars, Except for Shares and Per Share Amounts)
1. Business and Structure
Altus Group Limited (the “Company”) is a leading provider of software, data solutions and
independent advisory services to the global commercial real estate (“CRE”) industry. The Company’s
businesses, Altus Analytics and Commercial Real Estate Consulting, reflect decades of experience, a
range of expertise, and technology‐enabled capabilities. The Company’s solutions empower clients to
analyze, gain insight and recognize value on their real estate investments. Headquartered in Canada,
the Company has approximately 2,600 employees around the world, with operations in North
America, Europe and Asia Pacific. The Company’s clients include many of the world’s largest CRE
industry participants.
The address of the Company’s registered office is 33 Yonge Street, Suite 500, Toronto, Ontario, Canada.
The Company is listed on the Toronto Stock Exchange (“TSX”) under the symbol AIF and is domiciled
in Canada.
“Altus Group” refers to the consolidated operations of the Company.
2. Basis of Preparation
These interim condensed consolidated financial statements (“interim financial statements”) as at and
for the period ended June 30, 2021 follow the same accounting policies and methods of their
application as those used in the Company’s most recent audited annual consolidated financial
statements as at and for the year ended December 31, 2020.
These interim financial statements have been prepared in accordance with International Accounting
Standard (“IAS”) 34, Interim Financial Reporting. Accordingly, they do not include all of the
information and disclosures required in annual financial statements prepared in accordance with
International Financial Reporting Standards (“IFRS”), and should be read in conjunction with the
Company’s audited annual consolidated financial statements as at and for the year ended
December 31, 2020.
These interim financial statements were approved by the Board of Directors for issue on
August 12, 2021.
40
Altus Group Limited
Notes to Interim Condensed Consolidated Financial Statements
June 30, 2021 and 2020
(Unaudited) (Expressed in Thousands of Canadian Dollars, Except for Shares and Per Share Amounts)
3. Critical Accounting Estimates and Judgments
The preparation of financial statements in conformity with IFRS requires management to make
estimates and assumptions concerning the future. It also requires management to exercise judgment
in applying the Company’s accounting policies and the reported amounts of assets and liabilities,
revenue and expenses, and related disclosures. Estimates and judgments are continually evaluated
and are based on current facts, historical experience and other factors, including expectations of future
events that are believed to be reasonable under the circumstances. Accounting estimates will, by
definition, seldom equal the actual results. The following are management’s most significant estimates
and assumptions in determining the value of assets and liabilities and the most significant judgments
in applying its accounting policies: revenue recognition and determination and allocation of the
transaction price, impairment of trade receivables and contract assets, estimated impairment of
goodwill, determination of purchase price allocations and contingent consideration, and income taxes.
In March 2020, the World Health Organization declared COVID‐19 a global pandemic. The continued
spread of this contagious disease outbreak and related public health developments have adversely
affected workforces, economies, and financial markets globally, leading to an economic downturn and
to legislative and regulatory changes that have impacted the Company’s business and operations. The
duration and magnitude of the impact of the outbreak and its potential adverse effects on the
Company’s business or results of operations continue to be uncertain and will depend on future
developments. Judgments made in these interim financial statements reflect management’s best
estimates as of the period end, taking into consideration the most significant judgments that may be
directly impacted by COVID‐19. Management’s significant estimates and assumptions that could be
impacted most by COVID‐19 are: revenue recognition and determination and allocation of the
transaction price, impairment of trade receivables and contract assets, and estimated impairment of
goodwill.
On June 13, 2021, the Company experienced a cybersecurity incident impacting some of its IT back‐
office systems. As part of the Company’s cybersecurity and business continuity protocols, manual
instances of controls and processes were adopted where automated integrations or systems access
were temporarily unavailable. As a result, there were no significant changes in the Company’s
controls or significant assumptions and estimates that have materially affected, or are reasonably
likely to materially affect, the Company’s internal controls over financial reporting or interim financial
statements for the second quarter.
41

Altus Group Limited
Notes to Interim Condensed Consolidated Financial Statements
June 30, 2021 and 2020
(Unaudited) (Expressed in Thousands of Canadian Dollars, Except for Shares and Per Share Amounts)
4. Acquisitions
Acquisition of Finance Active SAS
On April 1, 2021, the Company acquired all of the issued and outstanding shares of Finance Active
SAS (“Finance Active”) and its subsidiaries for approximately EUR106,524 (CAD157,288) including a
working capital payable of EUR96 (CAD141). On closing, the Company paid a total of EUR89,211
(CAD131,866) in cash, funded by drawing down on the Company’s credit facilities. In addition, the
Company issued 303,177 common shares to the selling shareholders and certain members of Finance
Active’s management team valued at EUR12,410 (CAD18,324) from treasury. These common shares
will be held in escrow and will vest and be released over two‐ or three‐year periods on each
anniversary of the closing date, subject to compliance with certain terms and conditions. Of the shares
issued, 156,405 valued at EUR6,402 (CAD9,453) are also subject to continued employment over the
vesting period. As part of the purchase price, EUR4,807 (CAD7,098) is also payable in cash over two
years after closing. As part of the transaction, the Company entered into non‐compete agreements
with members of management of Finance Active. Founded in 2000, Finance Active is a European
provider of SaaS debt management and financial risk management SaaS solutions for treasury and
investment management serving public, corporate and financial institutions. Finance Active is
headquartered in Paris, France, with a wide geographic footprint in Europe including over 3,000
customers ranging from small‐to‐medium businesses to large, global institutions. Finance Active’s
team of approximately 160 professionals is integrating with the Company’s Altus Analytics business.
For accounting purposes, the 156,405 common shares granted and subject to continued employment
are held as treasury shares. As these common shares vest, the fair value of the award will be
recognized as employee compensation expense with a corresponding amount recognized in
contributed surplus. When these common shares are released, the amounts recognized in contributed
surplus will be transferred to share capital within shareholders’ equity. In addition, the Company
recognized the settlement of a put option derivative liability with the selling shareholders of Finance
Active of EUR1,500 (CAD2,215) on the acquisition date as part of the consideration transferred.
42

Altus Group Limited
Notes to Interim Condensed Consolidated Financial Statements
June 30, 2021 and 2020
(Unaudited) (Expressed in Thousands of Canadian Dollars, Except for Shares and Per Share Amounts)
4. Acquisitions, cont’d
Acquisition of StratoDem Analytics
On May 4, 2021, the Company acquired certain assets of StratoDem Analytics, LLC (“StratoDem
Analytics”) for USD24,350 (CAD29,916) in cash and common shares, subject to adjustments. As part
of the transaction, the Company entered into a non‐compete agreement with members of management
of StratoDem Analytics. As consideration for these assets, the Company paid cash of USD15,950
(CAD19,596). In addition, the Company issued 165,320 common shares to the vendors valued at
USD8,400 (CAD10,320) from treasury. The common shares will be held in escrow, and will vest and
be released 50% on the first anniversary and the remaining 50% equally at 25% on each of the second
and third anniversary of the closing date, subject to compliance with certain terms and conditions. Of
the shares issued, 139,977 valued at USD7,112 (CAD8,738) are also subject to continued employment
over the vesting period. StratoDem Analytics is an early‐stage company offering data‐science‐as‐a‐
service for the real estate sector. The cloud‐based StratoDem Analytics platform integrates vast
amounts of granular local demographic and economic datasets to generate predictive models and
analytical tools that enable clients to better understand the factors influencing the market and build
more accurate models and forecasts. Through this acquisition, the StratoDem Analytics platform is a
core component to the Company’s long‐term data strategy, bringing valuable data science talent and
technology, and accelerating the Company’s speed to market for future data analytics products. Based
in the U.S., StratoDem Analytics’ team has integrated with the Company’s Altus Analytics business
unit.
For accounting purposes, the 139,977 common shares granted and subject to continued employment
are held as treasury shares. As these common shares vest, the fair value of the award will be
recognized as employee compensation expense with a corresponding amount recognized in
contributed surplus. When these common shares are released, the amounts recognized in contributed
surplus will be transferred to share capital within shareholders’ equity.
43
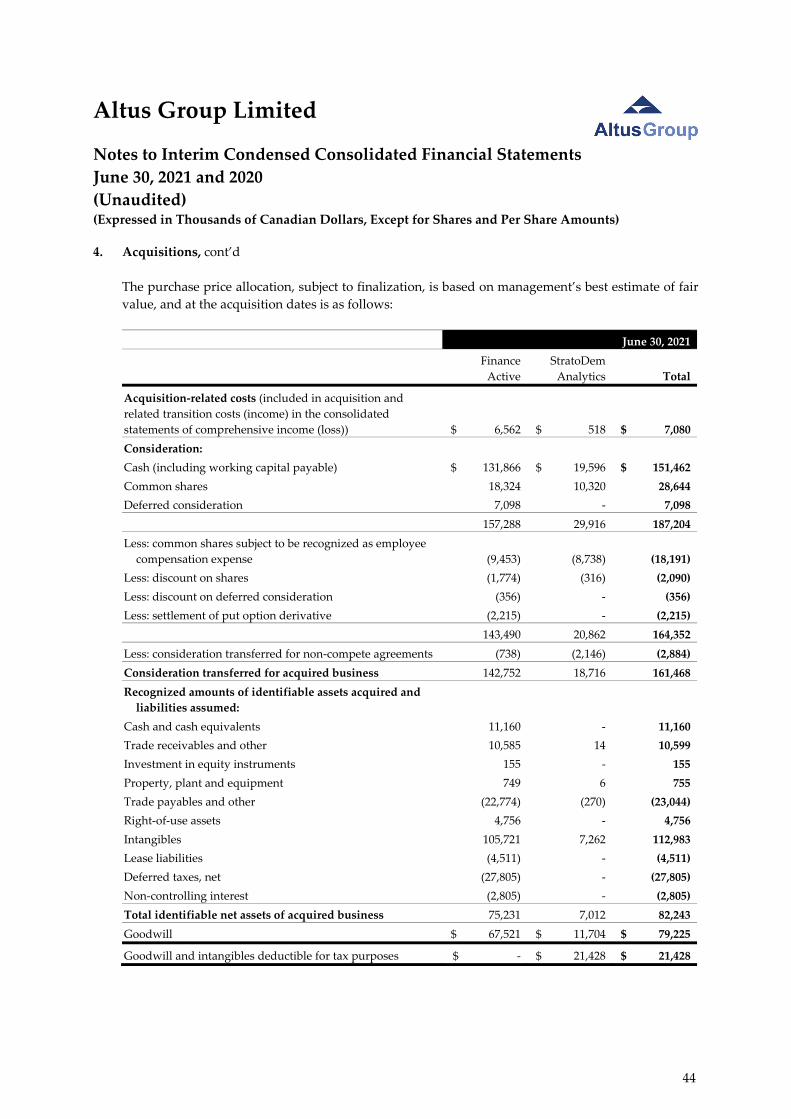
Altus Group Limited
Notes to Interim Condensed Consolidated Financial Statements
June 30, 2021 and 2020
(Unaudited) (Expressed in Thousands of Canadian Dollars, Except for Shares and Per Share Amounts)
4. Acquisitions, cont’d
The purchase price allocation, subject to finalization, is based on management’s best estimate of fair
value, and at the acquisition dates is as follows:
June 30, 2021
Finance
Active
StratoDem
Analytics Total
Acquisition‐related costs (included in acquisition and
related transition costs (income) in the consolidated
statements of comprehensive income (loss)) $ 6,562 $ 518 $ 7,080
Consideration:
Cash (including working capital payable) $ 131,866 $ 19,596 $ 151,462
Common shares 18,324 10,320 28,644
Deferred consideration 7,098 ‐ 7,098
157,288 29,916 187,204
Less: common shares subject to be recognized as employee
compensation expense (9,453) (8,738) (18,191)
Less: discount on shares (1,774) (316) (2,090)
Less: discount on deferred consideration (356) ‐ (356)
Less: settlement of put option derivative (2,215) ‐ (2,215)
143,490 20,862 164,352
Less: consideration transferred for non‐compete agreements (738) (2,146) (2,884)
Consideration transferred for acquired business 142,752 18,716 161,468
Recognized amounts of identifiable assets acquired and
liabilities assumed:
Cash and cash equivalents 11,160 ‐ 11,160
Trade receivables and other 10,585 14 10,599
Investment in equity instruments 155 ‐ 155
Property, plant and equipment 749 6 755
Trade payables and other (22,774) (270) (23,044)
Right‐of‐use assets 4,756 ‐ 4,756
Intangibles 105,721 7,262 112,983
Lease liabilities (4,511) ‐ (4,511)
Deferred taxes, net (27,805) ‐ (27,805)
Non‐controlling interest (2,805) ‐ (2,805)
Total identifiable net assets of acquired business 75,231 7,012 82,243
Goodwill $ 67,521 $ 11,704 $ 79,225
Goodwill and intangibles deductible for tax purposes $ ‐ $ 21,428 $ 21,428
44
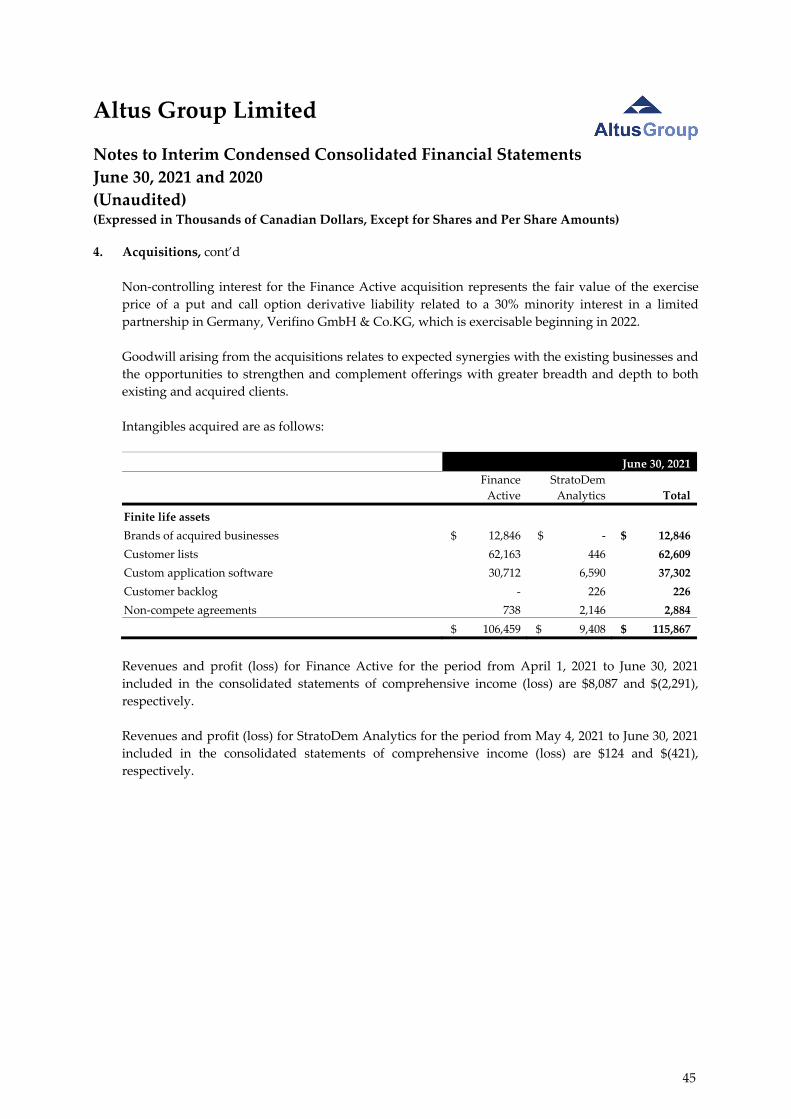
Altus Group Limited
Notes to Interim Condensed Consolidated Financial Statements
June 30, 2021 and 2020
(Unaudited) (Expressed in Thousands of Canadian Dollars, Except for Shares and Per Share Amounts)
4. Acquisitions, cont’d
Non‐controlling interest for the Finance Active acquisition represents the fair value of the exercise
price of a put and call option derivative liability related to a 30% minority interest in a limited
partnership in Germany, Verifino GmbH & Co.KG, which is exercisable beginning in 2022.
Goodwill arising from the acquisitions relates to expected synergies with the existing businesses and
the opportunities to strengthen and complement offerings with greater breadth and depth to both
existing and acquired clients.
Intangibles acquired are as follows:
June 30, 2021
Finance
Active
StratoDem
Analytics Total
Finite life assets
Brands of acquired businesses $ 12,846 $ ‐ $ 12,846
Customer lists 62,163 446 62,609
Custom application software 30,712 6,590 37,302
Customer backlog ‐ 226 226
Non‐compete agreements 738 2,146 2,884
$ 106,459 $ 9,408 $ 115,867
Revenues and profit (loss) for Finance Active for the period from April 1, 2021 to June 30, 2021
included in the consolidated statements of comprehensive income (loss) are $8,087 and $(2,291),
respectively.
Revenues and profit (loss) for StratoDem Analytics for the period from May 4, 2021 to June 30, 2021
included in the consolidated statements of comprehensive income (loss) are $124 and $(421),
respectively.
45

Altus Group Limited
Notes to Interim Condensed Consolidated Financial Statements
June 30, 2021 and 2020
(Unaudited) (Expressed in Thousands of Canadian Dollars, Except for Shares and Per Share Amounts)
5. Segmented Information
The segmentation reflects the way the Chief Executive Officer (“CEO”) allocates resources and
assesses performance. The CEO considers the business from a core service perspective. The areas of
core service are Altus Analytics and Commercial Real Estate Consulting.
Altus Analytics provides data, analytics software and technology‐related services. Proprietary data
and data analytics platforms provide comprehensive real estate information and enable performance
reviews, benchmarking and attribution analysis of commercial real estate portfolios. Software, such
as ARGUS branded products, represents comprehensive global solutions for managing commercial
real estate portfolios and improving the visibility and flow of information throughout critical
processes.
Commercial Real Estate Consulting provides Property Tax, and Valuation and Cost Advisory
solutions that span the life cycle of commercial real estate ‐ feasibility, development, acquisition,
management and disposition. Property Tax performs assessment reviews, management, appeals and
personal property and state and local tax advisory services. Valuation and Cost Advisory provides
appraisals of real estate portfolios, valuation of properties for transactional purposes, due diligence
and litigation and economic consulting, in addition to services in the areas of construction feasibility
studies, budgeting, cost and loan monitoring and project management.
The accounting policies of the segments are the same as those applied in these interim financial
statements. Revenue transactions between segments are valued at market rates and eliminated on
consolidation. Revenues represent those recognized from contracts with customers.
The CEO assesses the performance of the operating segments based on a measure of Adjusted
EBITDA. This measurement basis represents profit (loss) from continuing operations before income
taxes, adjusted for the effects of: occupancy costs calculated on a similar basis prior to the adoption of
IFRS 16, finance costs (income), net ‐ other, depreciation of property, plant and equipment and
amortization of intangibles, depreciation of right‐of‐use assets, finance costs (income), net ‐ leases,
acquisition and related transition costs (income), unrealized foreign exchange (gains) losses, (gains)
losses on disposal of right‐of‐use assets, property, plant and equipment and intangibles, share of
(profit) loss of joint venture, impairment charges, non‐cash share‐based compensation costs, (gains)
losses on equity derivatives net of mark‐to‐market adjustments on related restricted share units
(“RSUs”) and deferred share units (“DSUs”) being hedged, (gains) losses on derivatives, restructuring
costs (recovery), (gains) losses on investments, (gains) losses on hedging transactions, and other costs
or income of a non‐operating and/or non‐recurring nature.
46
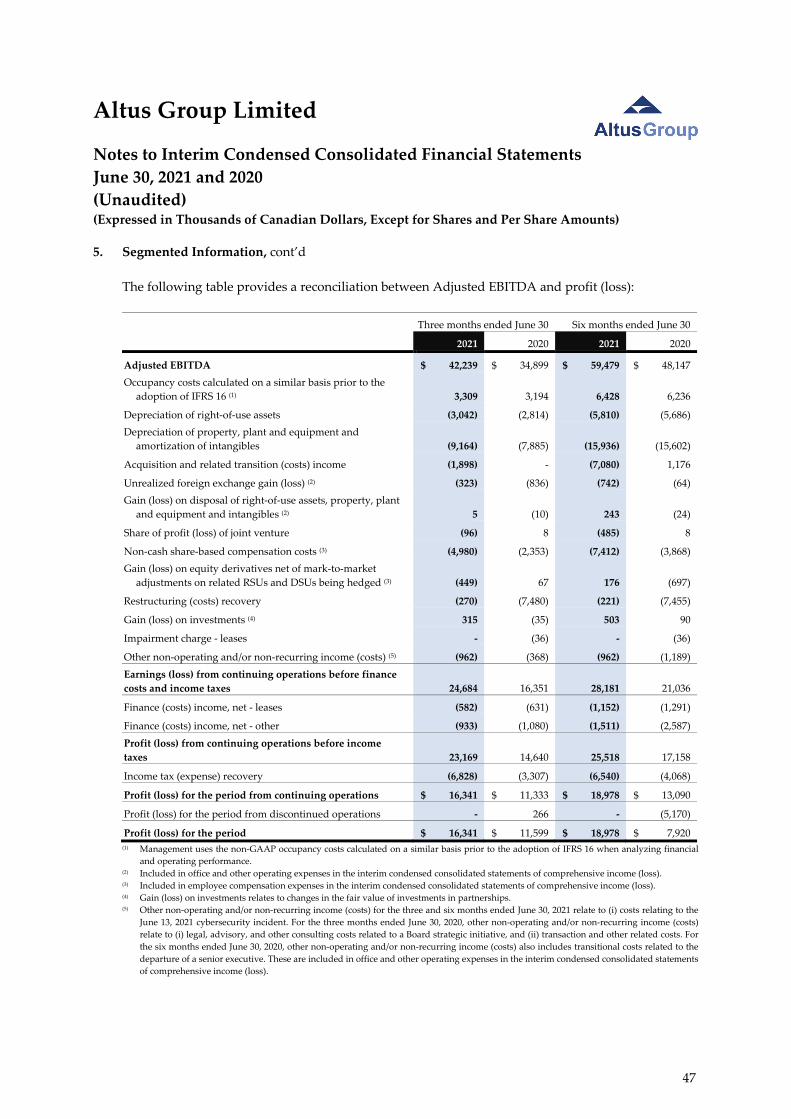
Altus Group Limited
Notes to Interim Condensed Consolidated Financial Statements
June 30, 2021 and 2020
(Unaudited) (Expressed in Thousands of Canadian Dollars, Except for Shares and Per Share Amounts)
5. Segmented Information, cont’d
The following table provides a reconciliation between Adjusted EBITDA and profit (loss):
Three months ended June 30 Six months ended June 30
2021 2020 2021 2020
Adjusted EBITDA $ 42,239 $ 34,899 $ 59,479 $ 48,147
Occupancy costs calculated on a similar basis prior to the
adoption of IFRS 16 (1) 3,309 3,194 6,428 6,236
Depreciation of right‐of‐use assets (3,042) (2,814) (5,810) (5,686)
Depreciation of property, plant and equipment and
amortization of intangibles (9,164) (7,885) (15,936) (15,602)
Acquisition and related transition (costs) income (1,898) ‐ (7,080) 1,176
Unrealized foreign exchange gain (loss) (2) (323) (836) (742) (64)
Gain (loss) on disposal of right‐of‐use assets, property, plant
and equipment and intangibles (2) 5 (10) 243 (24)
Share of profit (loss) of joint venture (96) 8 (485) 8
Non‐cash share‐based compensation costs (3) (4,980) (2,353) (7,412) (3,868)
Gain (loss) on equity derivatives net of mark‐to‐market
adjustments on related RSUs and DSUs being hedged (3) (449) 67 176 (697)
Restructuring (costs) recovery (270) (7,480) (221) (7,455)
Gain (loss) on investments (4) 315 (35) 503 90
Impairment charge ‐ leases ‐ (36) ‐ (36)
Other non‐operating and/or non‐recurring income (costs) (5) (962) (368) (962) (1,189)
Earnings (loss) from continuing operations before finance
costs and income taxes 24,684 16,351 28,181 21,036
Finance (costs) income, net ‐ leases (582) (631) (1,152) (1,291)
Finance (costs) income, net ‐ other (933) (1,080) (1,511) (2,587)
Profit (loss) from continuing operations before income
taxes 23,169 14,640 25,518 17,158
Income tax (expense) recovery (6,828) (3,307) (6,540) (4,068)
Profit (loss) for the period from continuing operations $ 16,341 $ 11,333 $ 18,978 $ 13,090
Profit (loss) for the period from discontinued operations ‐ 266 ‐ (5,170)
Profit (loss) for the period $ 16,341 $ 11,599 $ 18,978 $ 7,920 (1) Management uses the non‐GAAP occupancy costs calculated on a similar basis prior to the adoption of IFRS 16 when analyzing financial
and operating performance. (2) Included in office and other operating expenses in the interim condensed consolidated statements of comprehensive income (loss).
(3) Included in employee compensation expenses in the interim condensed consolidated statements of comprehensive income (loss). (4) Gain (loss) on investments relates to changes in the fair value of investments in partnerships. (5) Other non‐operating and/or non‐recurring income (costs) for the three and six months ended June 30, 2021 relate to (i) costs relating to the
June 13, 2021 cybersecurity incident. For the three months ended June 30, 2020, other non‐operating and/or non‐recurring income (costs)
relate to (i) legal, advisory, and other consulting costs related to a Board strategic initiative, and (ii) transaction and other related costs. For
the six months ended June 30, 2020, other non‐operating and/or non‐recurring income (costs) also includes transitional costs related to the
departure of a senior executive. These are included in office and other operating expenses in the interim condensed consolidated statements
of comprehensive income (loss).
47
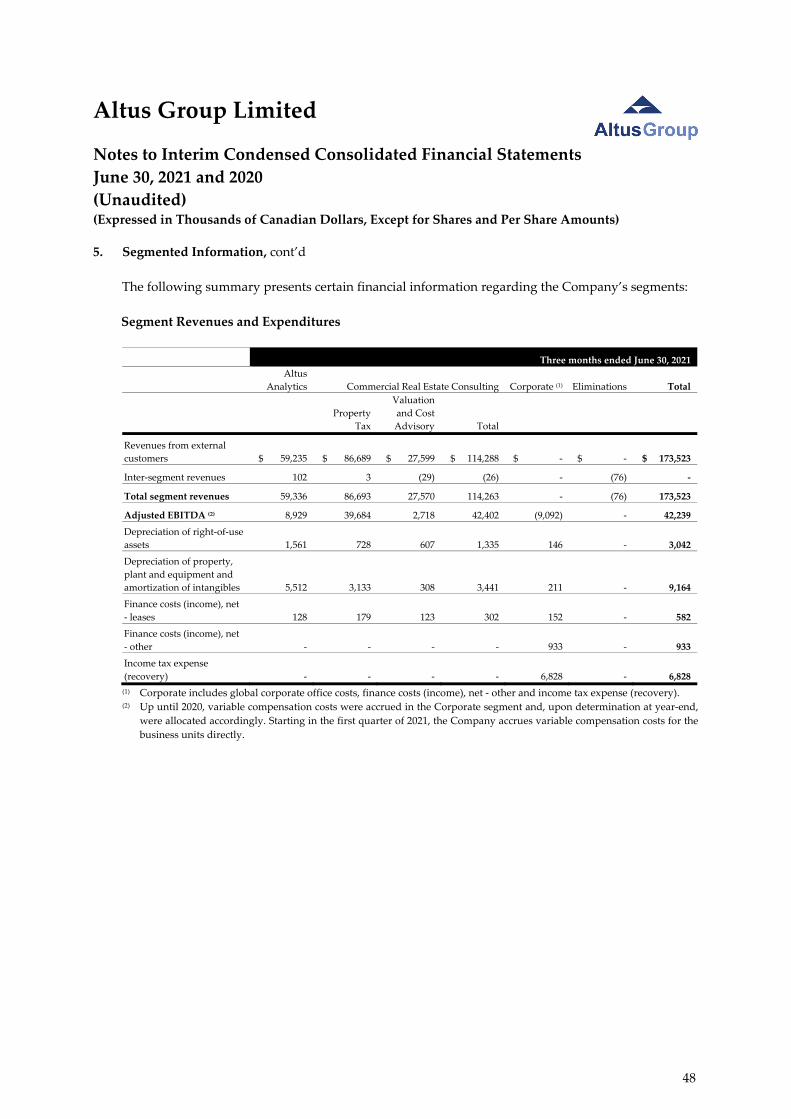
Altus Group Limited
Notes to Interim Condensed Consolidated Financial Statements
June 30, 2021 and 2020
(Unaudited) (Expressed in Thousands of Canadian Dollars, Except for Shares and Per Share Amounts)
5. Segmented Information, cont’d
The following summary presents certain financial information regarding the Company’s segments:
Segment Revenues and Expenditures
Three months ended June 30, 2021
Altus
Analytics Commercial Real Estate Consulting Corporate (1) Eliminations Total
Property
Tax
Valuation
and Cost
Advisory Total
Revenues from external
customers $ 59,235 $ 86,689 $ 27,599 $ 114,288 $ ‐ $ ‐ $ 173,523
Inter‐segment revenues 102 3 (29) (26) ‐ (76) ‐
Total segment revenues 59,336 86,693 27,570 114,263 ‐ (76) 173,523
Adjusted EBITDA (2) 8,929 39,684 2,718 42,402 (9,092) ‐ 42,239
Depreciation of right‐of‐use
assets 1,561 728 607 1,335 146 ‐ 3,042
Depreciation of property,
plant and equipment and
amortization of intangibles 5,512 3,133 308 3,441 211 ‐ 9,164
Finance costs (income), net
‐ leases 128 179 123 302 152 ‐ 582
Finance costs (income), net
‐ other ‐ ‐ ‐ ‐ 933 ‐ 933
Income tax expense
(recovery) ‐ ‐ ‐ ‐ 6,828 ‐ 6,828
(1) Corporate includes global corporate office costs, finance costs (income), net ‐ other and income tax expense (recovery). (2) Up until 2020, variable compensation costs were accrued in the Corporate segment and, upon determination at year‐end,
were allocated accordingly. Starting in the first quarter of 2021, the Company accrues variable compensation costs for the
business units directly.
48

Altus Group Limited
Notes to Interim Condensed Consolidated Financial Statements
June 30, 2021 and 2020
(Unaudited) (Expressed in Thousands of Canadian Dollars, Except for Shares and Per Share Amounts)
5. Segmented Information, cont’d
Three months ended June 30, 2020
Altus
Analytics Commercial Real Estate Consulting Corporate (1) Eliminations Total
Property
Tax
Valuation
and Cost
Advisory Total
Revenues from external
customers $ 51,157 $ 76,873 $ 27,440 $ 104,313 $ ‐ $ ‐ $ 155,470
Inter‐segment revenues 139 1 (61) (60) ‐ (79) ‐
Total segment revenues 51,296 76,874 27,379 104,253 ‐ (79) 155,470
Adjusted EBITDA (2) 8,153 31,256 2,709 33,965 (7,219) ‐ 34,899
Depreciation of right‐of‐
use assets 1,218 831 693 1,524 72 ‐ 2,814
Depreciation of property,
plant and equipment and
amortization of intangibles 3,643 3,253 603 3,856 386 ‐ 7,885
Finance costs (income), net
‐ leases 42 190 157 347 242 ‐ 631
Finance costs (income), net
‐ other ‐ ‐ ‐ ‐ 1,080 ‐ 1,080
Income tax expense
(recovery) ‐ ‐ ‐ ‐ 3,307 ‐ 3,307
(1) Corporate includes global corporate office costs, finance costs (income), net ‐ other and income tax expense (recovery). (2) Up until 2020, variable compensation costs were accrued in the Corporate segment and, upon determination at year‐end,
were allocated accordingly. Starting in the first quarter of 2021, the Company accrues variable compensation costs for the
business units directly. As such, comparative figures have been restated to reflect accrued variable compensation costs
within the respective business units.
49
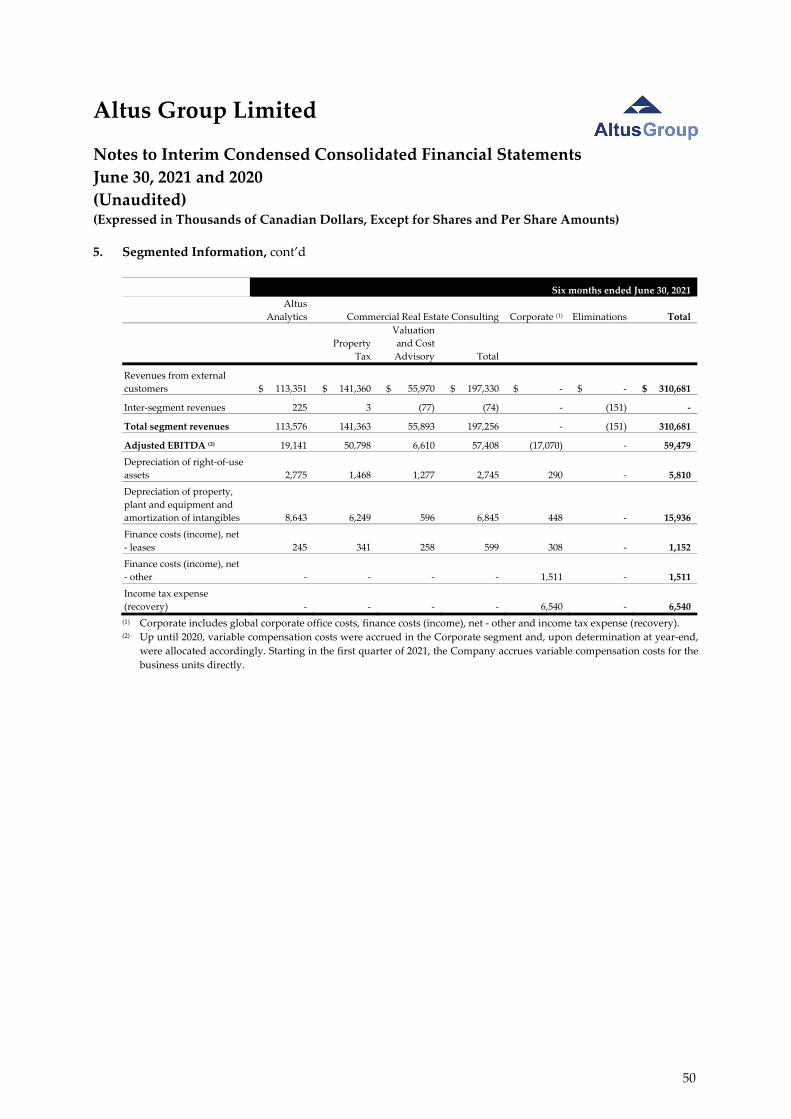
Altus Group Limited
Notes to Interim Condensed Consolidated Financial Statements
June 30, 2021 and 2020
(Unaudited) (Expressed in Thousands of Canadian Dollars, Except for Shares and Per Share Amounts)
5. Segmented Information, cont’d
Six months ended June 30, 2021
Altus
Analytics Commercial Real Estate Consulting Corporate (1) Eliminations Total
Property
Tax
Valuation
and Cost
Advisory Total
Revenues from external
customers $ 113,351 $ 141,360 $ 55,970 $ 197,330 $ ‐ $ ‐ $ 310,681
Inter‐segment revenues 225 3 (77) (74) ‐ (151) ‐
Total segment revenues 113,576 141,363 55,893 197,256 ‐ (151) 310,681
Adjusted EBITDA (2) 19,141 50,798 6,610 57,408 (17,070) ‐ 59,479
Depreciation of right‐of‐use
assets 2,775 1,468 1,277 2,745 290 ‐ 5,810
Depreciation of property,
plant and equipment and
amortization of intangibles 8,643 6,249 596 6,845 448 ‐ 15,936
Finance costs (income), net
‐ leases 245 341 258 599 308 ‐ 1,152
Finance costs (income), net
‐ other ‐ ‐ ‐ ‐ 1,511 ‐ 1,511
Income tax expense
(recovery) ‐ ‐ ‐ ‐ 6,540 ‐ 6,540
(1) Corporate includes global corporate office costs, finance costs (income), net ‐ other and income tax expense (recovery). (2) Up until 2020, variable compensation costs were accrued in the Corporate segment and, upon determination at year‐end,
were allocated accordingly. Starting in the first quarter of 2021, the Company accrues variable compensation costs for the
business units directly.
50
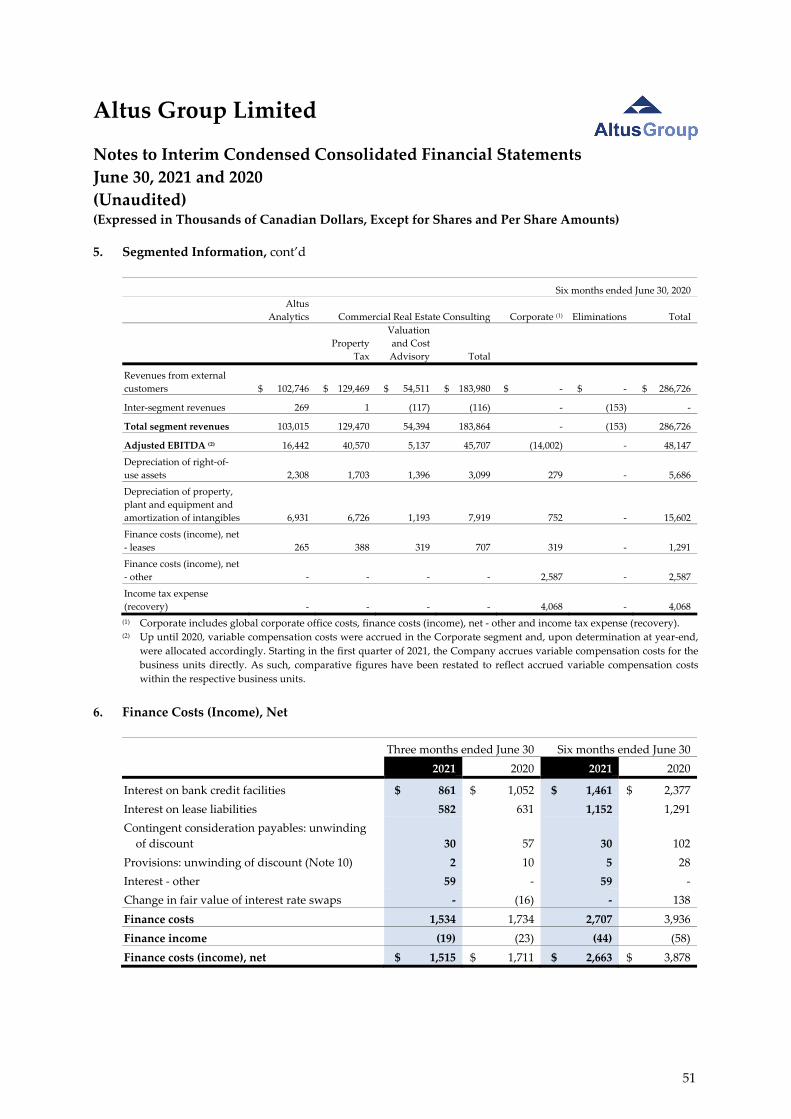
Altus Group Limited
Notes to Interim Condensed Consolidated Financial Statements
June 30, 2021 and 2020
(Unaudited) (Expressed in Thousands of Canadian Dollars, Except for Shares and Per Share Amounts)
5. Segmented Information, cont’d
Six months ended June 30, 2020
Altus
Analytics Commercial Real Estate Consulting Corporate (1) Eliminations Total
Property
Tax
Valuation
and Cost
Advisory Total
Revenues from external
customers $ 102,746 $ 129,469 $ 54,511 $ 183,980 $ ‐ $ ‐ $ 286,726
Inter‐segment revenues 269 1 (117) (116) ‐ (153) ‐
Total segment revenues 103,015 129,470 54,394 183,864 ‐ (153) 286,726
Adjusted EBITDA (2) 16,442 40,570 5,137 45,707 (14,002) ‐ 48,147
Depreciation of right‐of‐
use assets 2,308 1,703 1,396 3,099 279 ‐ 5,686
Depreciation of property,
plant and equipment and
amortization of intangibles 6,931 6,726 1,193 7,919 752 ‐ 15,602
Finance costs (income), net
‐ leases 265 388 319 707 319 ‐ 1,291
Finance costs (income), net
‐ other ‐ ‐ ‐ ‐ 2,587 ‐ 2,587
Income tax expense
(recovery) ‐ ‐ ‐ ‐ 4,068 ‐ 4,068
(1) Corporate includes global corporate office costs, finance costs (income), net ‐ other and income tax expense (recovery). (2) Up until 2020, variable compensation costs were accrued in the Corporate segment and, upon determination at year‐end,
were allocated accordingly. Starting in the first quarter of 2021, the Company accrues variable compensation costs for the
business units directly. As such, comparative figures have been restated to reflect accrued variable compensation costs
within the respective business units.
6. Finance Costs (Income), Net
Three months ended June 30 Six months ended June 30
2021 2020 2021 2020
Interest on bank credit facilities $ 861 $ 1,052 $ 1,461 $ 2,377
Interest on lease liabilities 582 631 1,152 1,291
Contingent consideration payables: unwinding
of discount 30 57 30 102
Provisions: unwinding of discount (Note 10) 2 10 5 28
Interest ‐ other 59 ‐ 59 ‐
Change in fair value of interest rate swaps ‐ (16) ‐ 138
Finance costs 1,534 1,734 2,707 3,936
Finance income (19) (23) (44) (58)
Finance costs (income), net $ 1,515 $ 1,711 $ 2,663 $ 3,878
51
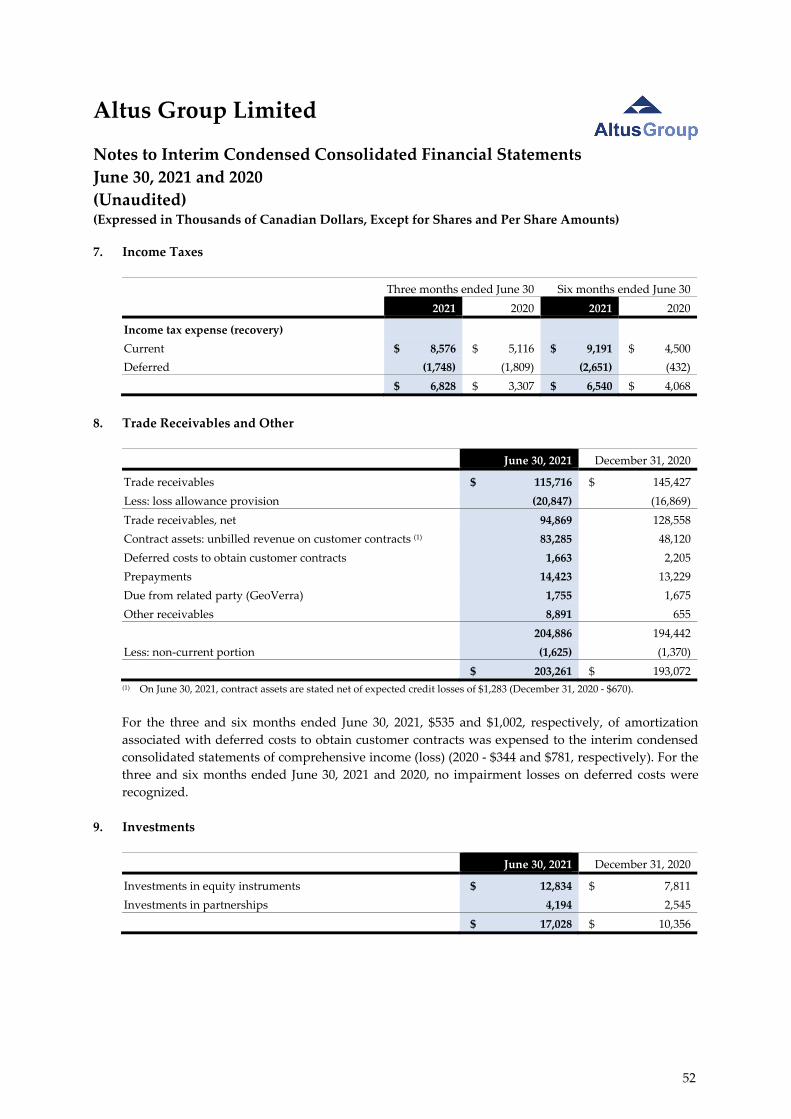
Altus Group Limited
Notes to Interim Condensed Consolidated Financial Statements
June 30, 2021 and 2020
(Unaudited) (Expressed in Thousands of Canadian Dollars, Except for Shares and Per Share Amounts)
7. Income Taxes
Three months ended June 30 Six months ended June 30
2021 2020 2021 2020
Income tax expense (recovery)
Current $ 8,576 $ 5,116 $ 9,191 $ 4,500
Deferred (1,748) (1,809) (2,651) (432)
$ 6,828 $ 3,307 $ 6,540 $ 4,068
8. Trade Receivables and Other
June 30, 2021 December 31, 2020
Trade receivables $ 115,716 $ 145,427
Less: loss allowance provision (20,847) (16,869)
Trade receivables, net 94,869 128,558
Contract assets: unbilled revenue on customer contracts (1) 83,285 48,120
Deferred costs to obtain customer contracts 1,663 2,205
Prepayments 14,423 13,229
Due from related party (GeoVerra) 1,755 1,675
Other receivables 8,891 655
204,886 194,442
Less: non‐current portion (1,625) (1,370)
$ 203,261 $ 193,072 (1) On June 30, 2021, contract assets are stated net of expected credit losses of $1,283 (December 31, 2020 ‐ $670).
For the three and six months ended June 30, 2021, $535 and $1,002, respectively, of amortization
associated with deferred costs to obtain customer contracts was expensed to the interim condensed
consolidated statements of comprehensive income (loss) (2020 ‐ $344 and $781, respectively). For the
three and six months ended June 30, 2021 and 2020, no impairment losses on deferred costs were
recognized.
9. Investments
June 30, 2021 December 31, 2020
Investments in equity instruments $ 12,834 $ 7,811
Investments in partnerships 4,194 2,545
$ 17,028 $ 10,356
52

Altus Group Limited
Notes to Interim Condensed Consolidated Financial Statements
June 30, 2021 and 2020
(Unaudited) (Expressed in Thousands of Canadian Dollars, Except for Shares and Per Share Amounts)
9. Investments, cont’d
During the six months ended June 30, 2021, the Company purchased $2,153 of preferred shares as
equity instruments (2020 ‐ $nil) and contributed $1,192 towards capital in various partnerships
(2020 ‐ $181).
10. Trade Payables and Other
June 30, 2021 December 31, 2020
Trade payables $ 8,296 $ 7,596
Accrued expenses 92,476 94,354
Contract liabilities: deferred revenue 54,167 43,032
Deferred consideration payables 8,691 47
Dividends payable (Note 15) 6,266 6,124
Provisions 3,504 6,018
Due to related party (GeoVerra) 314 329
173,714 157,500
Less non‐current portion:
Accrued expenses 15,407 15,449
Contract liabilities: deferred revenue 1,190 681
Deferred consideration payables 4,322 ‐
Provisions 446 1,076
21,365 17,206
$ 152,349 $ 140,294
Provisions consist of:
Restructuring Other Total
Balance as at January 1, 2021 $ 5,800 $ 218 $ 6,018
Charged to profit or loss:
Additional provisions, net of releases 221 (24) 197
Unwinding of discount (Note 6) ‐ 5 5
Used during the period (2,656) (3) (2,659)
Exchange differences (45) (12) (57)
Balance as at June 30, 2021 3,320 184 3,504
Less: non‐current portion (262) (184) (446)
$ 3,058 $ ‐ $ 3,058
53
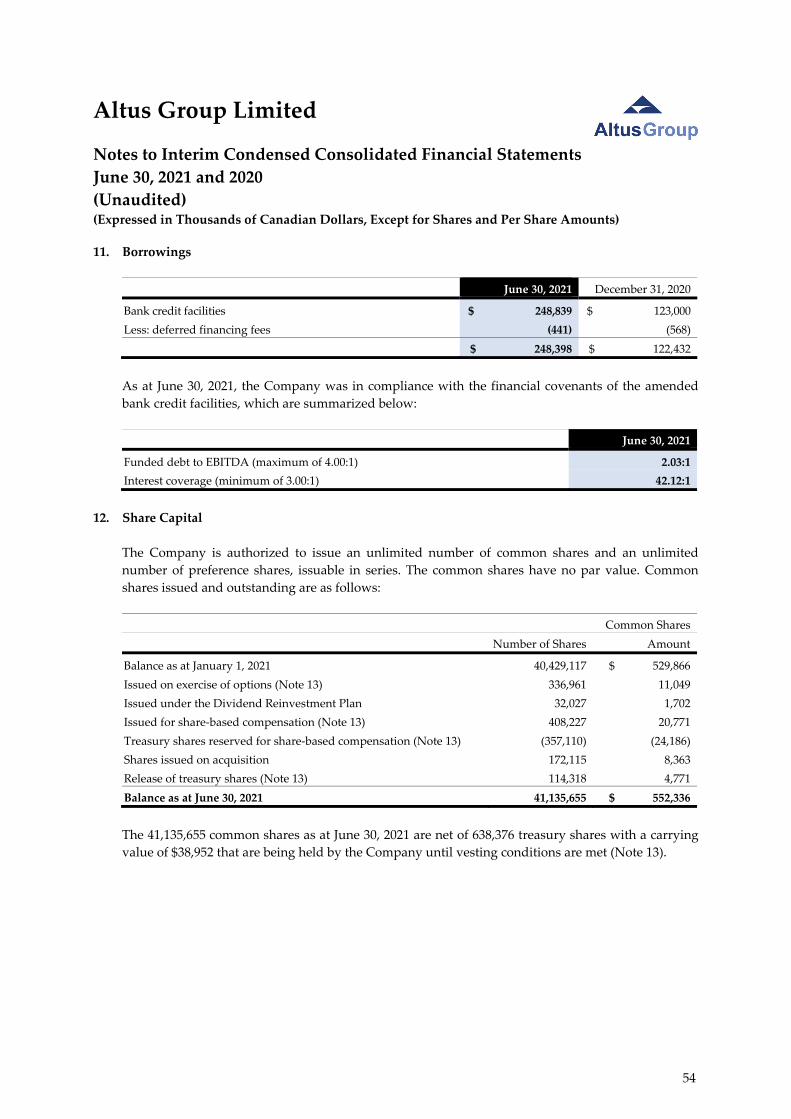
Altus Group Limited
Notes to Interim Condensed Consolidated Financial Statements
June 30, 2021 and 2020
(Unaudited) (Expressed in Thousands of Canadian Dollars, Except for Shares and Per Share Amounts)
11. Borrowings
June 30, 2021 December 31, 2020
Bank credit facilities $ 248,839 $ 123,000
Less: deferred financing fees (441) (568)
$ 248,398 $ 122,432
As at June 30, 2021, the Company was in compliance with the financial covenants of the amended
bank credit facilities, which are summarized below:
June 30, 2021
Funded debt to EBITDA (maximum of 4.00:1) 2.03:1
Interest coverage (minimum of 3.00:1) 42.12:1
12. Share Capital
The Company is authorized to issue an unlimited number of common shares and an unlimited
number of preference shares, issuable in series. The common shares have no par value. Common
shares issued and outstanding are as follows:
Common Shares
Number of Shares Amount
Balance as at January 1, 2021 40,429,117 $ 529,866
Issued on exercise of options (Note 13) 336,961 11,049
Issued under the Dividend Reinvestment Plan 32,027 1,702
Issued for share‐based compensation (Note 13) 408,227 20,771
Treasury shares reserved for share‐based compensation (Note 13) (357,110) (24,186)
Shares issued on acquisition 172,115 8,363
Release of treasury shares (Note 13) 114,318 4,771
Balance as at June 30, 2021 41,135,655 $ 552,336
The 41,135,655 common shares as at June 30, 2021 are net of 638,376 treasury shares with a carrying
value of $38,952 that are being held by the Company until vesting conditions are met (Note 13).
54
Altus Group Limited
Notes to Interim Condensed Consolidated Financial Statements
June 30, 2021 and 2020
(Unaudited) (Expressed in Thousands of Canadian Dollars, Except for Shares and Per Share Amounts)
13. Share‐based Compensation
The activity in the Company’s share‐based compensation plans during the period is as follows:
(i) Executive Compensation Plan and Long‐Term Equity Incentive Plan
The following is a summary of the Company’s share option activity:
Movements in the number of options outstanding and the weighted average exercise price are as
follows:
Number of Options
Outstanding
Weighted Average
Exercise Price
Balance as at January 1, 2021 1,791,682 $35.78
Granted 202,464 $58.14
Exercised (336,961) $27.81
Expired/Forfeited (45,028) $41.95
Balance as at June 30, 2021 1,612,157 $40.08
Information about the Company’s share options outstanding and exercisable as at June 30, 2021 is as
follows:
Exercise Price
Number of
Options Outstanding
Weighted
Average Remaining
Contractual Life
Number of
Options Exercisable
$19.67 ‐ $29.72 312,653 2.23 years 164,234
$30.70 ‐ $37.93 483,351 2.27 years 244,885
$45.11 ‐ $59.15 816,153 4.05 years 102,709
$40.08 1,612,157 3.16 years 511,828
55
Altus Group Limited
Notes to Interim Condensed Consolidated Financial Statements
June 30, 2021 and 2020
(Unaudited) (Expressed in Thousands of Canadian Dollars, Except for Shares and Per Share Amounts)
13. Share‐based Compensation, cont’d
The options granted vest over a period of up to 48 months. The fair value of the options granted was
estimated on the date of grant using the Black‐Scholes option pricing model with the following
assumptions:
2021
Risk‐free interest rate 0.78%
Expected dividend yield 1.0%
Expected volatility 30.11% ‐ 32.92%
Expected option life 3.00 ‐ 4.50 years
Weighted average exercise price $58.14
Weighted average grant‐date fair value per option $11.39 ‐ $14.25
The following is a summary of the activity related to common shares held in escrow under the Equity
Compensation Plan and Long‐Term Equity Incentive Plan:
Number of common shares
Balance as at January 1, 2021 116,309
Settled (60,790)
Forfeited (1,567)
Balance as at June 30, 2021 53,952
The Company settled vested Performance Share Units (“PSUs”) under the Equity Compensation Plan
and Long‐Term Equity Incentive Plan through the issuance of common shares:
Number of common shares
Settled in March 2020 54,707
Settled in March 2021 111,845
The Company granted the following PSUs under the Long‐Term Equity Incentive Plan:
Number of PSUs
Granted in 2020 172,350
Granted in 2021 101,709
56
Altus Group Limited
Notes to Interim Condensed Consolidated Financial Statements
June 30, 2021 and 2020
(Unaudited) (Expressed in Thousands of Canadian Dollars, Except for Shares and Per Share Amounts)
13. Share‐based Compensation, cont’d
(ii) Long‐Term Incentive Restricted Share Plan and Long‐Term Incentive Restricted Share Unit
Plan
In March 2021, the Board of Directors approved two new long‐term incentive plans, the Long‐Term
Incentive Restricted Share Plan (“LTIRS Plan”) and Long‐Term Incentive Restricted Share Unit Plan
(“LTIRSU Plan”), to complement the existing Long‐Term Equity Incentive Plan.
Restricted shares (“RSs”) and restricted share units (“RSUs”) granted under these plans will not be
available to the employee until three years following the grant date. After three years from the date of
grant, the RSs and RSUs will be released, provided, subject to certain exceptions such as retirement,
disability or death, that the individual is employed with the Company at the time of the release.
Participants are entitled to receive cash dividends or notional distributions that are paid on common
shares, respectively. If an employee resigned from the Company or is terminated for cause, all RSs
and RSUs that have not yet been released from the three‐year restriction period will be forfeited.
With respect to RSs that are equity‐settled, the Company contributes funds to purchase common
shares in the open market (through the facilities of the TSX or by private agreement) and are held by
the Company as treasury shares until they vest. This amount is shown as a reduction in the carrying
value of the Company’s common shares. The Company recognizes the fair value of the award when
granted as employee compensation expense with a corresponding credit to contributed surplus over
a three‐year period from the date of grant. As RSs are released, the portion of the contributed surplus
relating to the RSs is credited to share capital within shareholders’ equity.
With respect to RSUs that are cash‐settled, the Company recognizes the fair value of the award when
granted as employee compensation expense with a corresponding credit to trade payables and other
over a three‐year period from the date of grant. Changes in the liability subsequent to the grant date
and prior to settlement due to changes in fair value of the Company’s common shares are recorded as
employee compensation expense in the period incurred.
The following is a summary of the Company’s LTIRS Plan activity:
Number of RSs
Balance as at January 1, 2021 (all unvested) ‐
Granted 17,576
Balance as at June 30, 2021 (all unvested) 17,576
In 2021, the Company granted a total value of $1,757 under the LTIRS Plan and purchased 17,576
common shares in the open market (through the facilities of the TSX or by private agreement).
57
Altus Group Limited
Notes to Interim Condensed Consolidated Financial Statements
June 30, 2021 and 2020
(Unaudited) (Expressed in Thousands of Canadian Dollars, Except for Shares and Per Share Amounts)
13. Share‐based Compensation, cont’d
The following is a summary of the Company’s LTIRSU Plan activity:
Number of RSUs
Balance as at January 1, 2021 (all unvested) ‐
Granted 45,332
Settled (259)
Forfeited (864)
Balance as at June 30, 2021 (all unvested) 44,209
(iii) Deferred Compensation Plans
The following is a summary of the Company’s Restricted Share Plan (“RS Plan”) activity:
Number of RSs
Balance as at January 1, 2021 (all unvested) 194,654
Granted 43,152
Settled (52,012)
Forfeited (2,125)
Balance as at June 30, 2021 (all unvested) 183,669
In connection with the 2020 performance year, the Company granted a total value of $4,191 under the
RS Plan. In March 2021, the Company purchased 42,705 common shares in the open market (through
the facilities of the TSX or by private agreement).
In connection with the 2019 performance year, the Company granted a total value of $4,017 under the
RS Plan. In March 2020, the Company purchased 55,543 common shares in the open market (through
the facilities of the TSX or by private agreement).
The following is a summary of the Company’s Restricted Share Unit Plan (“RSU Plan”) activity:
Number of RSUs
Balance as at January 1, 2021 (all unvested) 302,325
Granted 81,060
Settled (66,905)
Forfeited (23,207)
Balance as at June 30, 2021 (all unvested) 293,273
58
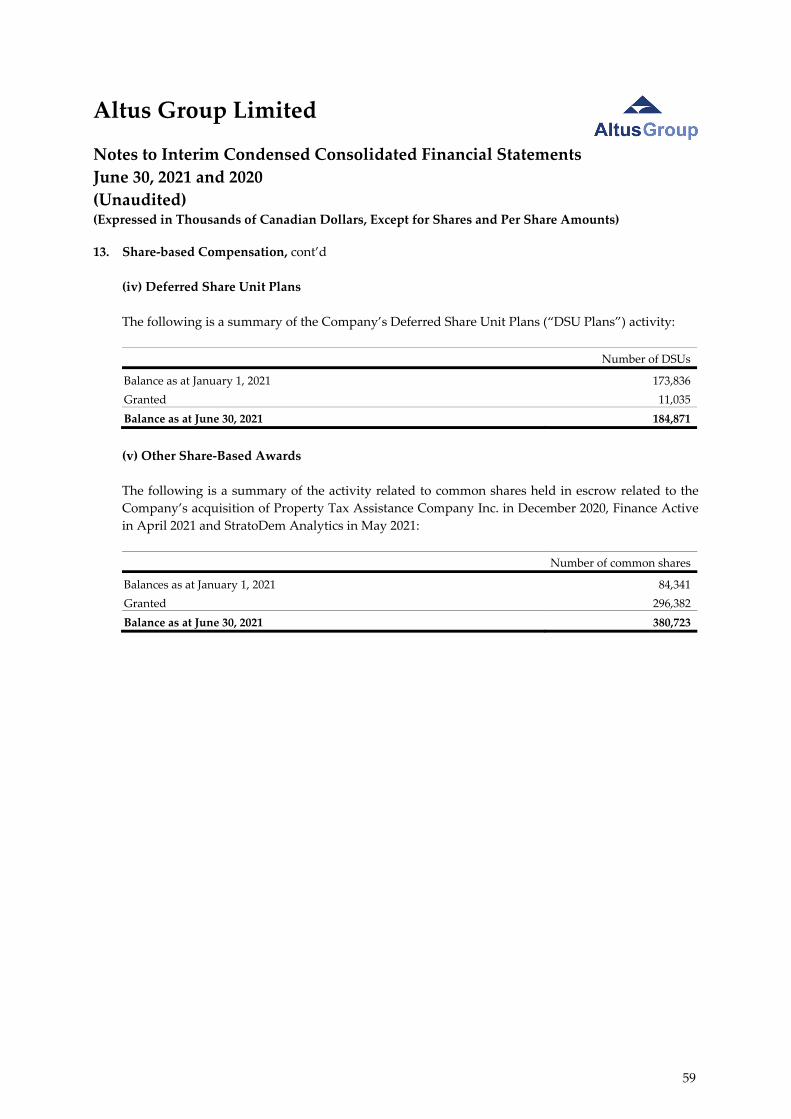
Altus Group Limited
Notes to Interim Condensed Consolidated Financial Statements
June 30, 2021 and 2020
(Unaudited) (Expressed in Thousands of Canadian Dollars, Except for Shares and Per Share Amounts)
13. Share‐based Compensation, cont’d
(iv) Deferred Share Unit Plans
The following is a summary of the Company’s Deferred Share Unit Plans (“DSU Plans”) activity:
Number of DSUs
Balance as at January 1, 2021 173,836
Granted 11,035
Balance as at June 30, 2021 184,871
(v) Other Share‐Based Awards
The following is a summary of the activity related to common shares held in escrow related to the
Company’s acquisition of Property Tax Assistance Company Inc. in December 2020, Finance Active
in April 2021 and StratoDem Analytics in May 2021:
Number of common shares
Balances as at January 1, 2021 84,341
Granted 296,382
Balance as at June 30, 2021 380,723
59
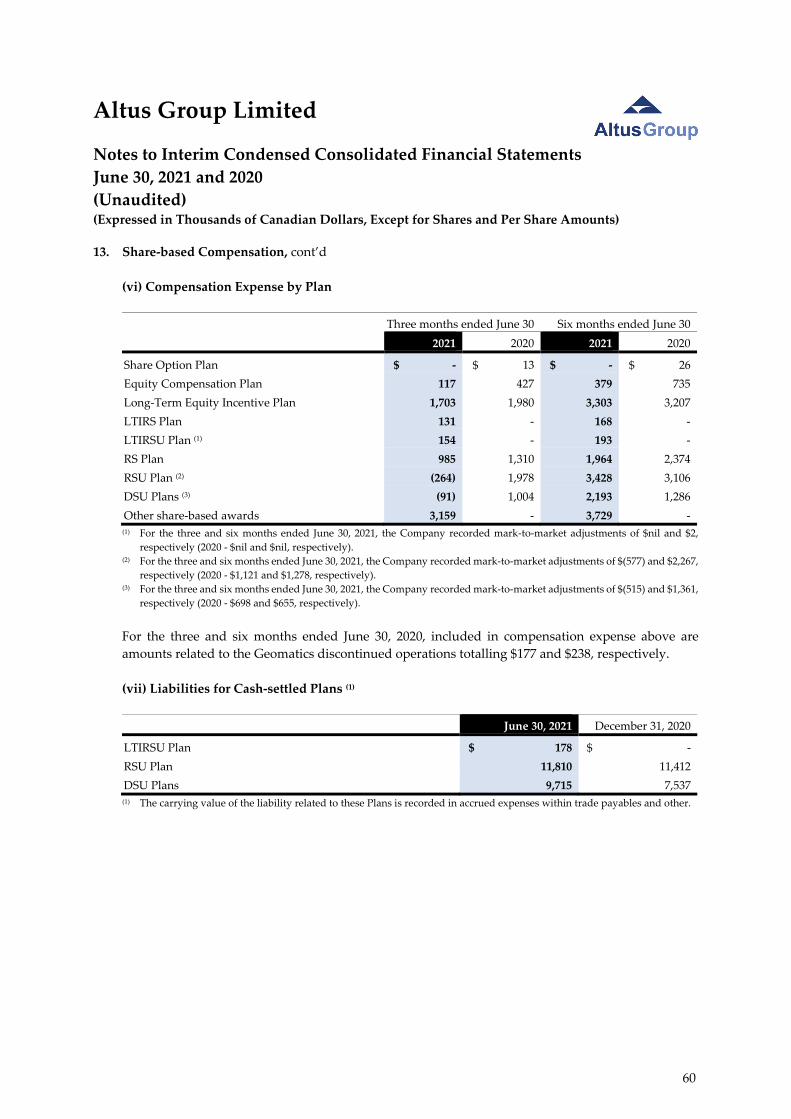
Altus Group Limited
Notes to Interim Condensed Consolidated Financial Statements
June 30, 2021 and 2020
(Unaudited) (Expressed in Thousands of Canadian Dollars, Except for Shares and Per Share Amounts)
13. Share‐based Compensation, cont’d
(vi) Compensation Expense by Plan
Three months ended June 30 Six months ended June 30
2021 2020 2021 2020
Share Option Plan $ ‐ $ 13 $ ‐ $ 26
Equity Compensation Plan 117 427 379 735
Long‐Term Equity Incentive Plan 1,703 1,980 3,303 3,207
LTIRS Plan 131 ‐ 168 ‐
LTIRSU Plan (1) 154 ‐ 193 ‐
RS Plan 985 1,310 1,964 2,374
RSU Plan (2) (264) 1,978 3,428 3,106
DSU Plans (3) (91) 1,004 2,193 1,286
Other share‐based awards 3,159 ‐ 3,729 ‐ (1) For the three and six months ended June 30, 2021, the Company recorded mark‐to‐market adjustments of $nil and $2,
respectively (2020 ‐ $nil and $nil, respectively). (2) For the three and six months ended June 30, 2021, the Company recorded mark‐to‐market adjustments of $(577) and $2,267,
respectively (2020 ‐ $1,121 and $1,278, respectively). (3) For the three and six months ended June 30, 2021, the Company recorded mark‐to‐market adjustments of $(515) and $1,361,
respectively (2020 ‐ $698 and $655, respectively).
For the three and six months ended June 30, 2020, included in compensation expense above are
amounts related to the Geomatics discontinued operations totalling $177 and $238, respectively.
(vii) Liabilities for Cash‐settled Plans (1)
June 30, 2021 December 31, 2020
LTIRSU Plan $ 178 $ ‐
RSU Plan 11,810 11,412
DSU Plans 9,715 7,537 (1) The carrying value of the liability related to these Plans is recorded in accrued expenses within trade payables and other.
60
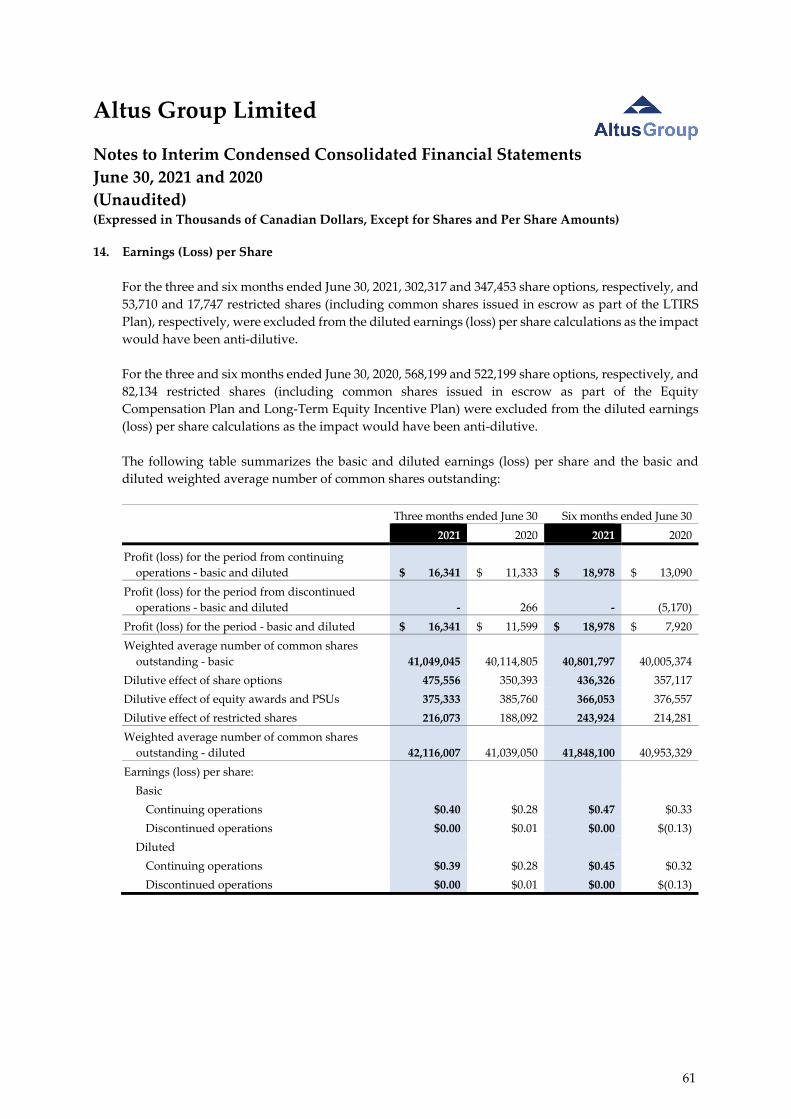
Altus Group Limited
Notes to Interim Condensed Consolidated Financial Statements
June 30, 2021 and 2020
(Unaudited) (Expressed in Thousands of Canadian Dollars, Except for Shares and Per Share Amounts)
14. Earnings (Loss) per Share
For the three and six months ended June 30, 2021, 302,317 and 347,453 share options, respectively, and
53,710 and 17,747 restricted shares (including common shares issued in escrow as part of the LTIRS
Plan), respectively, were excluded from the diluted earnings (loss) per share calculations as the impact
would have been anti‐dilutive.
For the three and six months ended June 30, 2020, 568,199 and 522,199 share options, respectively, and
82,134 restricted shares (including common shares issued in escrow as part of the Equity
Compensation Plan and Long‐Term Equity Incentive Plan) were excluded from the diluted earnings
(loss) per share calculations as the impact would have been anti‐dilutive.
The following table summarizes the basic and diluted earnings (loss) per share and the basic and
diluted weighted average number of common shares outstanding:
Three months ended June 30 Six months ended June 30
2021 2020 2021 2020
Profit (loss) for the period from continuing
operations ‐ basic and diluted $ 16,341 $ 11,333 $ 18,978 $ 13,090
Profit (loss) for the period from discontinued
operations ‐ basic and diluted ‐ 266 ‐ (5,170)
Profit (loss) for the period ‐ basic and diluted $ 16,341 $ 11,599 $ 18,978 $ 7,920
Weighted average number of common shares
outstanding ‐ basic 41,049,045 40,114,805 40,801,797 40,005,374
Dilutive effect of share options 475,556 350,393 436,326 357,117
Dilutive effect of equity awards and PSUs 375,333 385,760 366,053 376,557
Dilutive effect of restricted shares 216,073 188,092 243,924 214,281
Weighted average number of common shares
outstanding ‐ diluted 42,116,007 41,039,050 41,848,100 40,953,329
Earnings (loss) per share:
Basic
Continuing operations $0.40 $0.28 $0.47 $0.33
Discontinued operations $0.00 $0.01 $0.00 $(0.13)
Diluted
Continuing operations $0.39 $0.28 $0.45 $0.32
Discontinued operations $0.00 $0.01 $0.00 $(0.13)
61
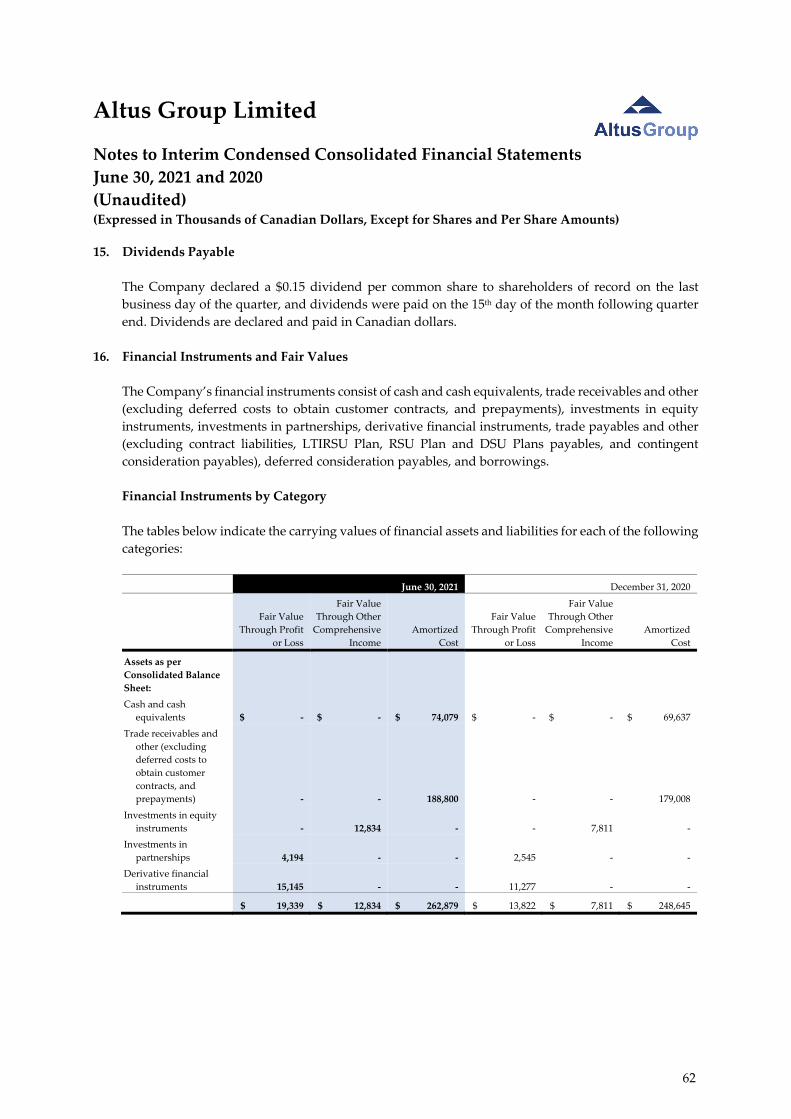
Altus Group Limited
Notes to Interim Condensed Consolidated Financial Statements
June 30, 2021 and 2020
(Unaudited) (Expressed in Thousands of Canadian Dollars, Except for Shares and Per Share Amounts)
15. Dividends Payable
The Company declared a $0.15 dividend per common share to shareholders of record on the last
business day of the quarter, and dividends were paid on the 15th day of the month following quarter
end. Dividends are declared and paid in Canadian dollars.
16. Financial Instruments and Fair Values
The Company’s financial instruments consist of cash and cash equivalents, trade receivables and other
(excluding deferred costs to obtain customer contracts, and prepayments), investments in equity
instruments, investments in partnerships, derivative financial instruments, trade payables and other
(excluding contract liabilities, LTIRSU Plan, RSU Plan and DSU Plans payables, and contingent
consideration payables), deferred consideration payables, and borrowings.
Financial Instruments by Category
The tables below indicate the carrying values of financial assets and liabilities for each of the following
categories:
June 30, 2021 December 31, 2020
Fair Value
Through Profit
or Loss
Fair Value
Through Other
Comprehensive
Income
Amortized
Cost
Fair Value
Through Profit
or Loss
Fair Value
Through Other
Comprehensive
Income
Amortized
Cost
Assets as per
Consolidated Balance
Sheet:
Cash and cash
equivalents $ ‐ $ ‐ $ 74,079 $ ‐ $ ‐ $ 69,637
Trade receivables and
other (excluding
deferred costs to
obtain customer
contracts, and
prepayments) ‐ ‐ 188,800 ‐ ‐ 179,008
Investments in equity
instruments ‐ 12,834 ‐ ‐ 7,811 ‐
Investments in
partnerships 4,194 ‐ ‐ 2,545 ‐ ‐
Derivative financial
instruments 15,145 ‐ ‐ 11,277 ‐ ‐
$ 19,339 $ 12,834 $ 262,879 $ 13,822 $ 7,811 $ 248,645
62
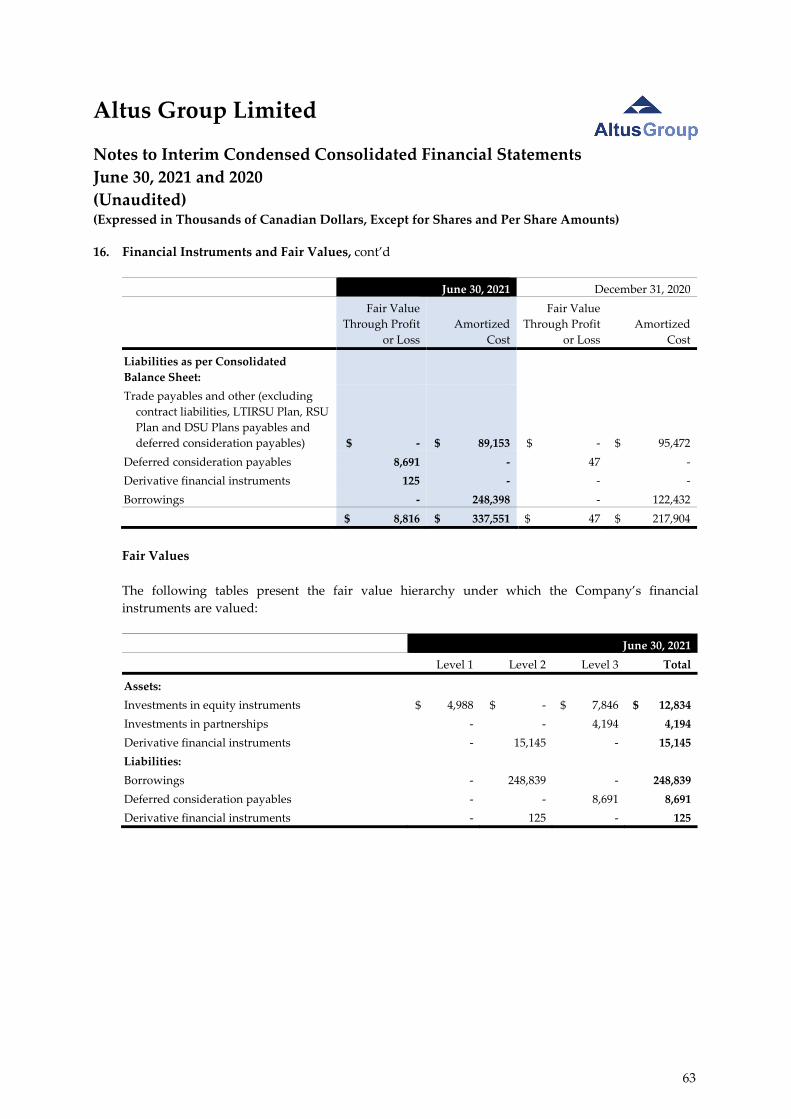
Altus Group Limited
Notes to Interim Condensed Consolidated Financial Statements
June 30, 2021 and 2020
(Unaudited) (Expressed in Thousands of Canadian Dollars, Except for Shares and Per Share Amounts)
16. Financial Instruments and Fair Values, cont’d
June 30, 2021 December 31, 2020
Fair Value
Through Profit
or Loss
Amortized
Cost
Fair Value
Through Profit
or Loss
Amortized
Cost
Liabilities as per Consolidated
Balance Sheet:
Trade payables and other (excluding
contract liabilities, LTIRSU Plan, RSU
Plan and DSU Plans payables and
deferred consideration payables) $ ‐ $ 89,153 $ ‐ $ 95,472
Deferred consideration payables 8,691 ‐ 47 ‐
Derivative financial instruments 125 ‐ ‐ ‐
Borrowings ‐ 248,398 ‐ 122,432
$ 8,816 $ 337,551 $ 47 $ 217,904
Fair Values
The following tables present the fair value hierarchy under which the Company’s financial
instruments are valued:
June 30, 2021
Level 1 Level 2 Level 3 Total
Assets:
Investments in equity instruments $ 4,988 $ ‐ $ 7,846 $ 12,834
Investments in partnerships ‐ ‐ 4,194 4,194
Derivative financial instruments ‐ 15,145 ‐ 15,145
Liabilities:
Borrowings ‐ 248,839 ‐ 248,839
Deferred consideration payables ‐ ‐ 8,691 8,691
Derivative financial instruments ‐ 125 ‐ 125
63
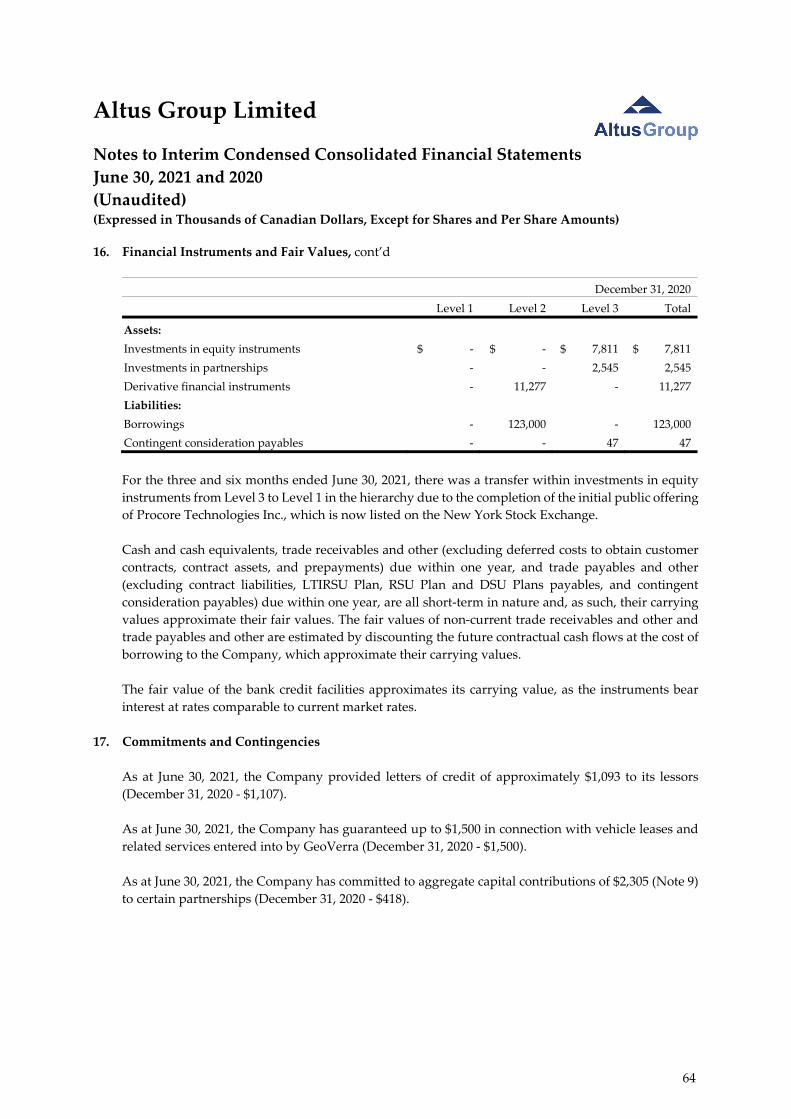
Altus Group Limited
Notes to Interim Condensed Consolidated Financial Statements
June 30, 2021 and 2020
(Unaudited) (Expressed in Thousands of Canadian Dollars, Except for Shares and Per Share Amounts)
16. Financial Instruments and Fair Values, cont’d
December 31, 2020
Level 1 Level 2 Level 3 Total
Assets:
Investments in equity instruments $ ‐ $ ‐ $ 7,811 $ 7,811
Investments in partnerships ‐ ‐ 2,545 2,545
Derivative financial instruments ‐ 11,277 ‐ 11,277
Liabilities:
Borrowings ‐ 123,000 ‐ 123,000
Contingent consideration payables ‐ ‐ 47 47
For the three and six months ended June 30, 2021, there was a transfer within investments in equity
instruments from Level 3 to Level 1 in the hierarchy due to the completion of the initial public offering
of Procore Technologies Inc., which is now listed on the New York Stock Exchange.
Cash and cash equivalents, trade receivables and other (excluding deferred costs to obtain customer
contracts, contract assets, and prepayments) due within one year, and trade payables and other
(excluding contract liabilities, LTIRSU Plan, RSU Plan and DSU Plans payables, and contingent
consideration payables) due within one year, are all short‐term in nature and, as such, their carrying
values approximate their fair values. The fair values of non‐current trade receivables and other and
trade payables and other are estimated by discounting the future contractual cash flows at the cost of
borrowing to the Company, which approximate their carrying values.
The fair value of the bank credit facilities approximates its carrying value, as the instruments bear
interest at rates comparable to current market rates.
17. Commitments and Contingencies
As at June 30, 2021, the Company provided letters of credit of approximately $1,093 to its lessors
(December 31, 2020 ‐ $1,107).
As at June 30, 2021, the Company has guaranteed up to $1,500 in connection with vehicle leases and
related services entered into by GeoVerra (December 31, 2020 ‐ $1,500).
As at June 30, 2021, the Company has committed to aggregate capital contributions of $2,305 (Note 9)
to certain partnerships (December 31, 2020 ‐ $418).
64
Altus Group Limited
Notes to Interim Condensed Consolidated Financial Statements
June 30, 2021 and 2020
(Unaudited) (Expressed in Thousands of Canadian Dollars, Except for Shares and Per Share Amounts)
17. Commitments and Contingencies, cont’d
From time to time, the Company or its subsidiaries are involved in legal proceedings, claims and
litigation in the ordinary course of business with customers, former employees and other parties.
Although it is not possible to determine the final outcome of such matters, based on all currently
available information, management believes that liabilities, if any, arising from such matters will not
have a material adverse effect on the Company’s financial position or results of operations and have
been adequately provided for in these interim financial statements.
In the ordinary course of business, the Company is subject to tax audits from various government
agencies relating to income and commodity taxes. As a result, from time to time, the tax authorities
may disagree with the positions and conclusions made by the Company in its tax filings, which could
lead to assessments and reassessments. These assessments and reassessments may have a material
adverse effect on the Company’s financial position or results of operations.
65


LISTINGSToronto Stock Exchange
Stock trading symbol: AIF
AUDITORSERNST & YOUNG LLP
TRANSFER AGENTAST TRUST COMPANY (CANADA)
P.O. Box 700
Station B
Montreal, Quebec, Canada H3B 3K3
Toronto: (416) 682-3860
Toll-free throughout North America: 1 (800) 387-0825
Facsimile: 1 (888) 249-6189
Website: www.astfinancial.com/ca-en
Email: [email protected]
HEADQUARTERS33 Yonge Street, Suite 500
Toronto, Ontario, Canada M5E 1G4
Telephone: (416) 641-9500
Toll-free Telephone: 1 (877) 953-9948
Facsimile: (416) 641-9501
Website: www.altusgroup.com
Email: [email protected]
Related Documents