S. SAN JACINTO AVE. @ E. COMMONWEALTH AVE., SAN JACINTO, CA NEECE COMMERCIAL | BILL NEECE | 619.920.4800 COMMONWEALTH PLAZA HIGHLIGHTS • Located in the heart of San Jacinto’s major retail hub • Across the street from Walmart Super Center • Pads, shops, and anchor space available S. San Jacinto Ave. at Commonwealth Ave. | San Jacinto, California SITE NOW LEASING | 40,000 SF Shopping Center Bill Neece | (619) 920-4800 Neece Commercial | [email protected] 6965 El Camino Real, Suite 105, Carlsbad, CA 92009 The information contained herein was obtained from sources which are deemed reliable but are not guaranteed by broker.

Welcome message from author
This document is posted to help you gain knowledge. Please leave a comment to let me know what you think about it! Share it to your friends and learn new things together.
Transcript

S. SAN JACINTO AVE. @ E. COMMONWEALTH AVE., SAN JACINTO, CANEECE COMMERCIAL | BILL NEECE | 619.920.4800
COMMONWEALTH PLAZAHIGHLIGHTS
• LocatedintheheartofSanJacinto’smajorretailhub
• AcrossthestreetfromWalmartSuperCenter• Pads,shops,andanchorspaceavailable
S. San Jacinto Ave. at Commonwealth Ave. | San Jacinto, California
SITE
NOW LEASING | 40,000 SF Shopping Center
Bill Neece | (619) 920-4800NeeceCommercial|[email protected],Suite105,Carlsbad,CA92009
The information contained herein was obtained from sources which are deemed reliable but are not guaranteed by broker.

S. SAN JACINTO AVE. @ E. COMMONWEALTH AVE., SAN JACINTO, CANEECE COMMERCIAL | BILL NEECE | 619.920.4800
EXECUTIVE SUMMARY
LOCATION: SouthSanJacintoAvenueatCommonwealthAvenue,SanJacinto(RiversideCounty),California.AcrossthestreetfromWalmartSuperCenterintheheartofSanJacinto’smajorretailhub.
DESCRIPTION: Planned40,000square-footshoppingcenterwithfree-standingpads.
DEVELOPER: RanchoEmpire,LLC
AREARETAILERS: WalmartSuperCenter,WalgreensDrugStore,RiteAid,StaterBros.Market,Cardena’s,anda12-plexRegalCinemas
AREARESTAURANTS: Wendy’s,ElPolloLoco,BurgerKing,andDelTaco
TwoMileRadius ThreeMileRadius FiveMileRadius
POPULATION(2016): 54,668 112,507 160,553AVERAGEHOUSEHOLDINCOME: $49,899 $53,827 $57,851
TRAFFIC: SouthSanJacintoAvenueisthecity’smajorretailstreetandcarriesanestimated27,425vehiclesperday.Theplannedshoppingcenterislocatedatatrafficsignal.
COMMENTS: • LocatedintheheartofSanJacinto’smajorretailhub
• Easyaccess
• Strongpopulationbase
• Over200,000peopleinthetradearea

S. SAN JACINTO AVE. @ E. COMMONWEALTH AVE., SAN JACINTO, CANEECE COMMERCIAL | BILL NEECE | 619.920.4800
AREA MAP
SITE

S. SAN JACINTO AVE. @ E. COMMONWEALTH AVE., SAN JACINTO, CANEECE COMMERCIAL | BILL NEECE | 619.920.4800
AERIAL OF SAN JACINTO
SITE

S. SAN JACINTO AVE. @ E. COMMONWEALTH AVE., SAN JACINTO, CANEECE COMMERCIAL | BILL NEECE | 619.920.4800
AREA RESTAURANTS & RETAILERS
SUBJECTPROPERTY
Found from websiteRecreate PMS
(Planned)

S. SAN JACINTO AVE. @ E. COMMONWEALTH AVE., SAN JACINTO, CANEECE COMMERCIAL | BILL NEECE | 619.920.4800
AERIAL WITH SITE PLAN

S. SAN JACINTO AVE. @ E. COMMONWEALTH AVE., SAN JACINTO, CANEECE COMMERCIAL | BILL NEECE | 619.920.4800
SITE PLAN
S. SAN JACINTO AVE. @ E. COMMONWEALTH AVE., SAN JACINTO, CANEECE COMMERCIAL | BILL NEECE | 619.920.4800
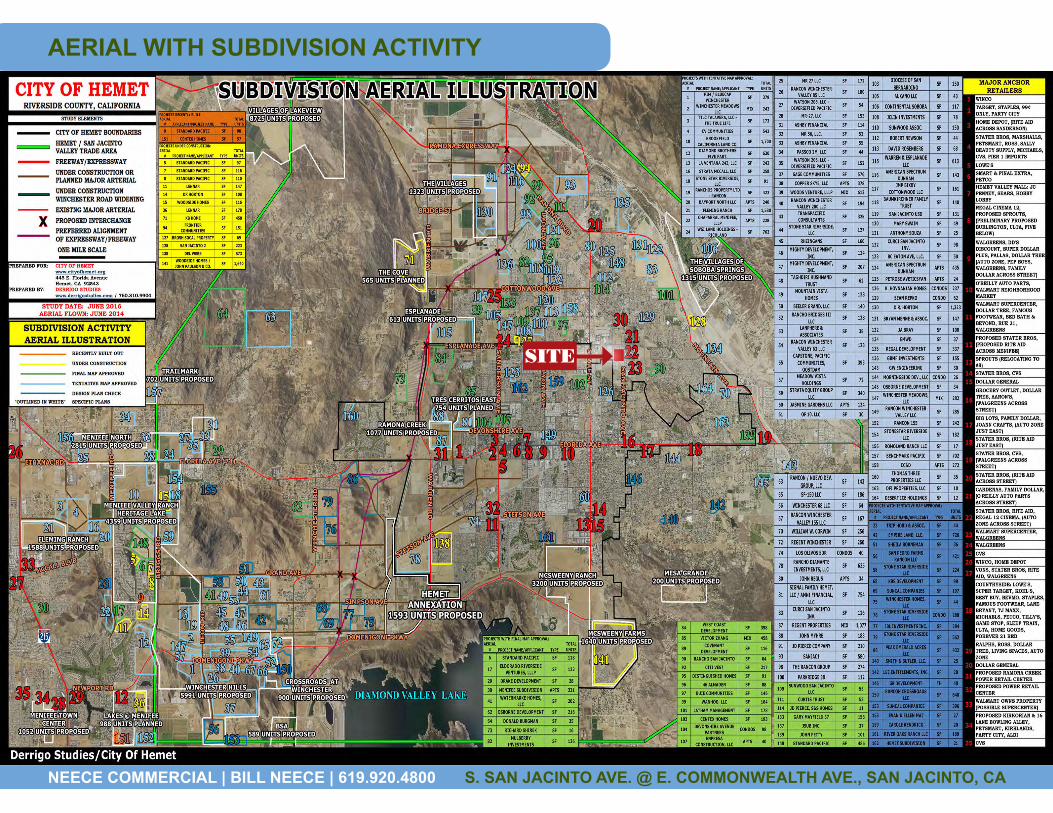
AERIAL WITH SUBDIVISION ACTIVITY
SITE

S. SAN JACINTO AVE. @ E. COMMONWEALTH AVE., SAN JACINTO, CANEECE COMMERCIAL | BILL NEECE | 619.920.4800
DEMOGRAPHICS: BUSINESS SUMMARY
Source:Dun&Bradstreet,Inc.
Business Summary1861 S San Jacinto Ave, San Jacinto, CA 92583 Prepared by Jerry Holdner1861 S San Jacinto Ave, San Jacinto, California, 92583, Latitude: 33.767018437Rings: 2, 3, 5 mile radii Longitude: -116.9587264
Data for all businesses in area 2 miles 3 miles 5 milesTotal Businesses: 2,174 3,720 5,028Total Employees: 11,288 19,998 27,797Total Residential Population: 53,224 109,243 155,009Employee/Residential Population Ratio: 0.21 0.18 0.18
Businesses Employees Businesses Employees Businesses Employees
by SIC Codes Number Percent Number Percent Number Percent Number Percent Number Percent Number PercentAgriculture & Mining 55 2.5% 182 1.6% 96 2.6% 351 1.8% 152 3.0% 668 2.4%Construction 182 8.4% 668 5.9% 370 9.9% 1,091 5.5% 535 10.6% 1,465 5.3%Manufacturing 73 3.4% 1,256 11.1% 112 3.0% 1,693 8.5% 149 3.0% 2,543 9.1%Transportation 70 3.2% 335 3.0% 122 3.3% 458 2.3% 167 3.3% 570 2.1%Communication 15 0.7% 96 0.9% 23 0.6% 129 0.6% 29 0.6% 236 0.8%Utility 4 0.2% 9 0.1% 6 0.2% 15 0.1% 10 0.2% 302 1.1%Wholesale Trade 76 3.5% 198 1.8% 131 3.5% 369 1.8% 185 3.7% 507 1.8%
Retail Trade Summary 445 20.5% 2,019 17.9% 714 19.2% 4,617 23.1% 923 18.4% 6,596 23.7%Home Improvement 28 1.3% 121 1.1% 42 1.1% 302 1.5% 57 1.1% 546 2.0%General Merchandise Stores 11 0.5% 111 1.0% 17 0.5% 387 1.9% 22 0.4% 733 2.6%Food Stores 46 2.1% 169 1.5% 73 2.0% 806 4.0% 96 1.9% 1,259 4.5%Auto Dealers, Gas Stations, Auto Aftermarket 53 2.4% 226 2.0% 70 1.9% 337 1.7% 96 1.9% 583 2.1%Apparel & Accessory Stores 35 1.6% 90 0.8% 47 1.3% 124 0.6% 58 1.2% 159 0.6%Furniture & Home Furnishings 41 1.9% 165 1.5% 68 1.8% 237 1.2% 91 1.8% 328 1.2%Eating & Drinking Places 99 4.6% 631 5.6% 176 4.7% 1,425 7.1% 222 4.4% 1,728 6.2%Miscellaneous Retail 131 6.0% 507 4.5% 221 5.9% 1,000 5.0% 283 5.6% 1,260 4.5%
Finance, Insurance, Real Estate Summary 158 7.3% 729 6.5% 265 7.1% 1,184 5.9% 361 7.2% 1,619 5.8%Banks, Savings & Lending Institutions 18 0.8% 207 1.8% 31 0.8% 283 1.4% 44 0.9% 358 1.3%Securities Brokers 12 0.6% 28 0.2% 17 0.5% 41 0.2% 22 0.4% 51 0.2%Insurance Carriers & Agents 31 1.4% 96 0.9% 41 1.1% 115 0.6% 50 1.0% 255 0.9%Real Estate, Holding, Other Investment Offices 96 4.4% 398 3.5% 176 4.7% 745 3.7% 246 4.9% 955 3.4%
Services Summary 1,074 49.4% 5,147 45.6% 1,849 49.7% 9,206 46.0% 2,476 49.2% 12,224 44.0%Hotels & Lodging 18 0.8% 60 0.5% 31 0.8% 122 0.6% 38 0.8% 189 0.7%Automotive Services 95 4.4% 297 2.6% 142 3.8% 453 2.3% 177 3.5% 585 2.1%Motion Pictures & Amusements 48 2.2% 284 2.5% 86 2.3% 483 2.4% 121 2.4% 569 2.0%Health Services 229 10.5% 1,724 15.3% 285 7.7% 2,273 11.4% 330 6.6% 2,689 9.7%Legal Services 35 1.6% 105 0.9% 45 1.2% 141 0.7% 52 1.0% 158 0.6%Education Institutions & Libraries 44 2.0% 774 6.9% 75 2.0% 2,049 10.2% 98 1.9% 2,515 9.0%Other Services 605 27.8% 1,903 16.9% 1,185 31.9% 3,685 18.4% 1,660 33.0% 5,518 19.9%
Government 21 1.0% 649 5.7% 31 0.8% 886 4.4% 40 0.8% 1,067 3.8%
Totals 2,174 100% 11,288 100% 3,720 100% 19,998 100% 5,028 100% 27,797 100%
September 02, 2014
©2014 Esri Page 1 of 2
Source: Copyright 2013 Dun & Bradstreet, Inc. All rights reserved. Esri Total Residential Population forecasts for 2013.

S. SAN JACINTO AVE. @ E. COMMONWEALTH AVE., SAN JACINTO, CANEECE COMMERCIAL | BILL NEECE | 619.920.4800
DEMOGRAPHICS: BUSINESS SUMMARY
Source:Dun&Bradstreet,Inc.
Business Summary1861 S San Jacinto Ave, San Jacinto, CA 92583 Prepared by Jerry Holdner1861 S San Jacinto Ave, San Jacinto, California, 92583, Latitude: 33.767018437Rings: 2, 3, 5 mile radii Longitude: -116.9587264
Businesses Employees Businesses Employees Businesses Employees
by NAICS Codes Number Percent Number Percent Number Percent Number Percent Number Percent Number PercentAgriculture, Forestry, Fishing & Hunting 16 0.7% 65 0.6% 27 0.7% 159 0.8% 56 1.1% 412 1.5%Mining 0 0.0% 0 0.0% 0 0.0% 2 0.0% 2 0.0% 6 0.0%Utilities 1 0.0% 0 0.0% 2 0.1% 2 0.0% 4 0.1% 36 0.1%Construction 184 8.5% 709 6.3% 374 10.1% 1,137 5.7% 543 10.8% 1,517 5.5%Manufacturing 74 3.4% 1,231 10.9% 116 3.1% 1,692 8.5% 150 3.0% 2,529 9.1%Wholesale Trade 76 3.5% 198 1.8% 131 3.5% 369 1.8% 185 3.7% 507 1.8%Retail Trade 342 15.7% 1,382 12.2% 531 14.3% 3,177 15.9% 695 13.8% 4,852 17.5%
Motor Vehicle & Parts Dealers 48 2.2% 232 2.1% 59 1.6% 322 1.6% 82 1.6% 556 2.0%Furniture & Home Furnishings Stores 23 1.1% 59 0.5% 37 1.0% 93 0.5% 51 1.0% 154 0.6%Electronics & Appliance Stores 16 0.7% 65 0.6% 30 0.8% 96 0.5% 38 0.8% 123 0.4%Bldg Material & Garden Equipment & Supplies Dealers 24 1.1% 104 0.9% 37 1.0% 284 1.4% 52 1.0% 524 1.9%Food & Beverage Stores 48 2.2% 191 1.7% 74 2.0% 832 4.2% 99 2.0% 1,296 4.7%Health & Personal Care Stores 26 1.2% 244 2.2% 44 1.2% 469 2.3% 53 1.1% 593 2.1%Gasoline Stations 7 0.3% 33 0.3% 14 0.4% 57 0.3% 16 0.3% 69 0.2%Clothing & Clothing Accessories Stores 45 2.1% 109 1.0% 65 1.7% 169 0.8% 80 1.6% 210 0.8%Sport Goods, Hobby, Book, & Music Stores 16 0.7% 47 0.4% 28 0.8% 124 0.6% 39 0.8% 148 0.5%General Merchandise Stores 11 0.5% 111 1.0% 17 0.5% 387 1.9% 22 0.4% 733 2.6%Miscellaneous Store Retailers 65 3.0% 160 1.4% 105 2.8% 305 1.5% 137 2.7% 396 1.4%Nonstore Retailers 14 0.6% 28 0.2% 21 0.6% 38 0.2% 26 0.5% 51 0.2%
Transportation & Warehousing 58 2.7% 212 1.9% 103 2.8% 305 1.5% 133 2.6% 382 1.4%Information 33 1.5% 213 1.9% 49 1.3% 289 1.4% 68 1.4% 431 1.6%Finance & Insurance 72 3.3% 348 3.1% 109 2.9% 475 2.4% 144 2.9% 723 2.6%
Central Bank/Credit Intermediation & Related Activities 21 1.0% 210 1.9% 34 0.9% 286 1.4% 46 0.9% 358 1.3%Securities, Commodity Contracts & Other Financial 19 0.9% 43 0.4% 34 0.9% 74 0.4% 47 0.9% 102 0.4%Insurance Carriers & Related Activities; Funds, Trusts & 31 1.4% 96 0.9% 41 1.1% 115 0.6% 52 1.0% 262 0.9%
Real Estate, Rental & Leasing 108 5.0% 409 3.6% 181 4.9% 738 3.7% 253 5.0% 991 3.6%Professional, Scientific & Tech Services 207 9.5% 586 5.2% 386 10.4% 964 4.8% 537 10.7% 1,293 4.7%
Legal Services 42 1.9% 116 1.0% 57 1.5% 164 0.8% 67 1.3% 189 0.7%Management of Companies & Enterprises 1 0.0% 2 0.0% 2 0.1% 3 0.0% 3 0.1% 7 0.0%Administrative & Support & Waste Management & Remediation 202 9.3% 437 3.9% 437 11.7% 1,033 5.2% 663 13.2% 2,462 8.9%Educational Services 50 2.3% 766 6.8% 86 2.3% 2,050 10.3% 112 2.2% 2,520 9.1%Health Care & Social Assistance 290 13.3% 2,166 19.2% 387 10.4% 2,973 14.9% 459 9.1% 3,525 12.7%Arts, Entertainment & Recreation 37 1.7% 218 1.9% 70 1.9% 381 1.9% 97 1.9% 452 1.6%Accommodation & Food Services 117 5.4% 691 6.1% 206 5.5% 1,546 7.7% 260 5.2% 1,917 6.9%
Accommodation 18 0.8% 60 0.5% 31 0.8% 122 0.6% 38 0.8% 189 0.7%Food Services & Drinking Places 99 4.6% 631 5.6% 176 4.7% 1,425 7.1% 222 4.4% 1,728 6.2%
Other Services (except Public Administration) 284 13.1% 994 8.8% 489 13.1% 1,804 9.0% 623 12.4% 2,155 7.8%Automotive Repair & Maintenance 81 3.7% 249 2.2% 125 3.4% 399 2.0% 155 3.1% 502 1.8%
Public Administration 22 1.0% 662 5.9% 32 0.9% 899 4.5% 41 0.8% 1,080 3.9%
Total 2,174 100% 11,288 100% 3,720 100% 19,998 100% 5,028 100% 27,797 100%
September 02, 2014
©2014 Esri Page 2 of 2
Source: Copyright 2013 Dun & Bradstreet, Inc. All rights reserved. Esri Total Residential Population forecasts for 2013.

S. SAN JACINTO AVE. @ E. COMMONWEALTH AVE., SAN JACINTO, CANEECE COMMERCIAL | BILL NEECE | 619.920.4800
DEMOGRAPHICS: EXECUTIVE SUMMARY
Source:U.S.CensusBureau,Census2010
Executive Summary1861 S San Jacinto Ave, San Jacinto, CA 92583 Prepared by Jerry Holdner1861 S San Jacinto Ave, San Jacinto, California, 92583, Latitude: 33.767018437Rings: 2, 3, 5 mile radii Longitude: -116.9587264
2 miles 3 miles 5 milesPopulation
2000 Population 41,398 83,600 111,906
2010 Population 52,362 107,084 151,178
2013 Population 53,224 109,243 155,009
2018 Population 56,124 115,968 165,081
2000-2010 Annual Rate 2.38% 2.51% 3.05%
2010-2013 Annual Rate 0.50% 0.62% 0.77%
2013-2018 Annual Rate 1.07% 1.20% 1.27%2013 Male Population 48.2% 48.0% 48.1%2013 Female Population 51.8% 52.0% 51.9%2013 Median Age 31.6 34.2 35.7
In the identified area, the current year population is 155,009. In 2010, the Census count in the area was 151,178. The rate of change since2010 was 0.77% annually. The five-year projection for the population in the area is 165,081 representing a change of 1.27% annually from2013 to 2018. Currently, the population is 48.1% male and 51.9% female.
Median Age
The median age in this area is 35.7, compared to U.S. median age of 37.3.
Race and Ethnicity2013 White Alone 58.5% 62.3% 64.3%
2013 Black Alone 6.4% 5.9% 5.8%2013 American Indian/Alaska Native Alone 1.9% 1.9% 2.0%2013 Asian Alone 1.8% 2.2% 2.7%2013 Pacific Islander Alone 0.3% 0.3% 0.3%2013 Other Race 25.4% 21.8% 19.4%2013 Two or More Races 5.6% 5.6% 5.6%2013 Hispanic Origin (Any Race) 52.3% 46.6% 42.8%
Persons of Hispanic origin represent 42.8% of the population in the identified area compared to 17.4% of the U.S. population. Persons ofHispanic Origin may be of any race. The Diversity Index, which measures the probability that two people from the same area will be fromdifferent race/ethnic groups, is 78.7 in the identified area, compared to 62.1 for the U.S. as a whole.
Households
2000 Households 15,031 32,231 44,3482010 Households 17,268 37,145 52,7072013 Total Households 17,363 37,439 53,2562018 Total Households 18,171 39,434 56,2052000-2010 Annual Rate 1.40% 1.43% 1.74%2010-2013 Annual Rate 0.17% 0.24% 0.32%2013-2018 Annual Rate 0.91% 1.04% 1.08%2013 Average Household Size 3.04 2.89 2.89
The household count in this area has changed from 52,707 in 2010 to 53,256 in the current year, a change of 0.32% annually. The five-yearprojection of households is 56,205, a change of 1.08% annually from the current year total. Average household size is currently 2.89,compared to 2.84 in the year 2010. The number of families in the current year is 36,330 in the specified area.
September 02, 2014
©2014 Esri Page 1 of 2
Data Note: Income is expressed in current dollarsSource: U.S. Census Bureau, Census 2010 Summary File 1. Esri forecasts for 2013 and 2018. Esri converted Census 2000 data into 2010 geography.

S. SAN JACINTO AVE. @ E. COMMONWEALTH AVE., SAN JACINTO, CANEECE COMMERCIAL | BILL NEECE | 619.920.4800
DEMOGRAPHICS: EXECUTIVE SUMMARYExecutive Summary1861 S San Jacinto Ave, San Jacinto, CA 92583 Prepared by Jerry Holdner1861 S San Jacinto Ave, San Jacinto, California, 92583, Latitude: 33.767018437Rings: 2, 3, 5 mile radii Longitude: -116.9587264
2 miles 3 miles 5 milesMedian Household Income
2013 Median Household Income $33,477 $36,499 $38,8782018 Median Household Income $36,192 $39,288 $42,3462013-2018 Annual Rate 1.57% 1.48% 1.72%
Average Household Income
2013 Average Household Income $46,200 $50,211 $53,7412018 Average Household Income $51,587 $56,166 $60,2222013-2018 Annual Rate 2.23% 2.27% 2.30%
Per Capita Income
2013 Per Capita Income $15,335 $17,289 $18,5872018 Per Capita Income $16,958 $19,147 $20,6122013-2018 Annual Rate 2.03% 2.06% 2.09%
Households by Income
Current median household income is $38,878 in the area, compared to $51,314 for all U.S. households. Median household income isprojected to be $42,346 in five years, compared to $59,580 for all U.S. households
Current average household income is $53,741 in this area, compared to $71,842 for all U.S households. Average household income isprojected to be $60,222 in five years, compared to $83,667 for all U.S. households
Current per capita income is $18,587 in the area, compared to the U.S. per capita income of $27,567. The per capita income is projected tobe $20,612 in five years, compared to $32,073 for all U.S. households Housing
2000 Total Housing Units 17,123 36,456 50,4392000 Owner Occupied Housing Units 8,383 20,429 30,4572000 Owner Occupied Housing Units 6,649 11,801 13,8912000 Vacant Housing Units 2,091 4,226 6,091
2010 Total Housing Units 19,964 42,780 60,8742010 Owner Occupied Housing Units 9,232 22,146 34,1132010 Renter Occupied Housing Units 8,036 14,999 18,5942010 Vacant Housing Units 2,696 5,635 8,167
2013 Total Housing Units 20,276 43,469 61,9182013 Owner Occupied Housing Units 8,869 21,527 33,4042013 Renter Occupied Housing Units 8,495 15,912 19,8532013 Vacant Housing Units 2,913 6,030 8,662
2018 Total Housing Units 21,545 46,206 65,7702018 Owner Occupied Housing Units 9,417 23,085 35,8162018 Renter Occupied Housing Units 8,754 16,349 20,3882018 Vacant Housing Units 3,374 6,772 9,565
Currently, 53.9% of the 61,918 housing units in the area are owner occupied; 32.1%, renter occupied; and 14.0% are vacant. Currently, inthe U.S., 56.4% of the housing units in the area are owner occupied; 32.3% are renter occupied; and 11.3% are vacant. In 2010, therewere 60,874 housing units in the area - 56.0% owner occupied, 30.5% renter occupied, and 13.4% vacant. The annual rate of change inhousing units since 2010 is 0.76%. Median home value in the area is $142,677, compared to a median home value of $177,257 for the U.S.In five years, median value is projected to change by 3.58% annually to $170,094.
September 02, 2014
©2014 Esri Page 2 of 2
Data Note: Income is expressed in current dollarsSource: U.S. Census Bureau, Census 2010 Summary File 1. Esri forecasts for 2013 and 2018. Esri converted Census 2000 data into 2010 geography.
Source:U.S.CensusBureau,Census2010

S. SAN JACINTO AVE. @ E. COMMONWEALTH AVE., SAN JACINTO, CANEECE COMMERCIAL | BILL NEECE | 619.920.4800
DEMOGRAPHICS: MARKET PROFILE
Market Profile1861 S San Jacinto Ave, San Jacinto, CA 92583 Prepared by Jerry Holdner1861 S San Jacinto Ave, San Jacinto, California, 92583, Latitude: 33.767018437Rings: 2, 3, 5 mile radii Longitude: -116.9587264
2 miles 3 miles 5 milesPopulation Summary
2000 Total Population 41,398 83,600 111,9062010 Total Population 52,362 107,084 151,1782013 Total Population 53,224 109,243 155,009
2013 Group Quarters 475 943 1,2482018 Total Population 56,124 115,968 165,081
2013-2018 Annual Rate 1.07% 1.20% 1.27%Household Summary
2000 Households 15,031 32,231 44,3482000 Average Household Size 2.70 2.53 2.46
2010 Households 17,268 37,145 52,7072010 Average Household Size 3.00 2.86 2.84
2013 Households 17,363 37,439 53,2562013 Average Household Size 3.04 2.89 2.89
2018 Households 18,171 39,434 56,2052018 Average Household Size 3.06 2.92 2.912013-2018 Annual Rate 0.91% 1.04% 1.08%
2010 Families 11,795 25,127 36,0472010 Average Family Size 3.62 3.46 3.43
2013 Families 11,816 25,260 36,3302013 Average Family Size 3.66 3.51 3.49
2018 Families 12,331 26,546 38,2672018 Average Family Size 3.69 3.54 3.522013-2018 Annual Rate 0.86% 1.00% 1.04%
Housing Unit Summary2000 Housing Units 17,123 36,456 50,439
Owner Occupied Housing Units 49.0% 56.0% 60.4%Renter Occupied Housing Units 38.8% 32.4% 27.5%Vacant Housing Units 12.2% 11.6% 12.1%
2010 Housing Units 19,964 42,780 60,874Owner Occupied Housing Units 46.2% 51.8% 56.0%Renter Occupied Housing Units 40.3% 35.1% 30.5%Vacant Housing Units 13.5% 13.2% 13.4%
2013 Housing Units 20,276 43,469 61,918Owner Occupied Housing Units 43.7% 49.5% 53.9%Renter Occupied Housing Units 41.9% 36.6% 32.1%Vacant Housing Units 14.4% 13.9% 14.0%
2018 Housing Units 21,545 46,206 65,770Owner Occupied Housing Units 43.7% 50.0% 54.5%Renter Occupied Housing Units 40.6% 35.4% 31.0%Vacant Housing Units 15.7% 14.7% 14.5%
Median Household Income2013 $33,477 $36,499 $38,8782018 $36,192 $39,288 $42,346
Median Home Value2013 $131,169 $135,484 $142,6772018 $166,147 $164,100 $170,094
Per Capita Income2013 $15,335 $17,289 $18,5872018 $16,958 $19,147 $20,612
Median Age2010 31.5 34.0 35.32013 31.6 34.2 35.72018 32.2 34.9 36.4
Data Note: Household population includes persons not residing in group quarters. Average Household Size is the household population divided by total households.Persons in families include the householder and persons related to the householder by birth, marriage, or adoption. Per Capita Income represents the income received byall persons aged 15 years and over divided by the total population.
September 02, 2014
©2014 Esri Page 1 of 7
Source: U.S. Census Bureau, Census 2010 Summary File 1. Esri forecasts for 2013 and 2018. Esri converted Census 2000 data into 2010 geography.
Source:U.S.CensusBureau,Census2010

S. SAN JACINTO AVE. @ E. COMMONWEALTH AVE., SAN JACINTO, CANEECE COMMERCIAL | BILL NEECE | 619.920.4800
DEMOGRAPHICS: MARKET PROFILEMarket Profile1861 S San Jacinto Ave, San Jacinto, CA 92583 Prepared by Jerry Holdner1861 S San Jacinto Ave, San Jacinto, California, 92583, Latitude: 33.767018437Rings: 2, 3, 5 mile radii Longitude: -116.9587264
2 miles 3 miles 5 miles2013 Households by Income
Household Income Base 17,363 37,439 53,256<$15,000 20.8% 18.1% 16.8%$15,000 - $24,999 16.6% 15.5% 14.7%$25,000 - $34,999 14.4% 14.2% 13.1%$35,000 - $49,999 15.3% 16.0% 16.2%$50,000 - $74,999 15.9% 16.6% 17.2%$75,000 - $99,999 8.5% 9.3% 9.7%$100,000 - $149,999 6.0% 7.3% 8.4%$150,000 - $199,999 1.8% 1.9% 2.4%$200,000+ 0.7% 1.2% 1.4%
Average Household Income $46,200 $50,211 $53,7412018 Households by Income
Household Income Base 18,171 39,434 56,205<$15,000 20.8% 18.1% 16.7%$15,000 - $24,999 13.4% 12.6% 11.8%$25,000 - $34,999 14.2% 13.8% 12.7%$35,000 - $49,999 14.8% 15.3% 15.4%$50,000 - $74,999 14.1% 14.6% 15.0%$75,000 - $99,999 11.2% 12.0% 12.5%$100,000 - $149,999 8.0% 9.6% 11.0%$150,000 - $199,999 2.6% 2.6% 3.3%$200,000+ 0.9% 1.4% 1.6%
Average Household Income $51,587 $56,166 $60,2222013 Owner Occupied Housing Units by Value
Total 8,869 21,527 33,404<$50,000 15.1% 12.7% 12.8%$50,000 - $99,999 18.0% 17.5% 16.1%$100,000 - $149,999 27.2% 27.9% 24.8%$150,000 - $199,999 23.2% 24.7% 25.7%$200,000 - $249,999 8.4% 9.3% 11.5%$250,000 - $299,999 2.8% 2.9% 3.9%$300,000 - $399,999 1.5% 1.7% 2.1%$400,000 - $499,999 0.7% 0.7% 0.8%$500,000 - $749,999 0.7% 0.8% 0.7%$750,000 - $999,999 0.3% 0.2% 0.1%$1,000,000 + 2.2% 1.8% 1.6%
Average Home Value $160,670 $160,167 $163,9002018 Owner Occupied Housing Units by Value
Total 9,417 23,085 35,816<$50,000 9.5% 7.6% 7.4%$50,000 - $99,999 11.7% 12.3% 11.1%$100,000 - $149,999 20.4% 22.4% 19.9%$150,000 - $199,999 26.0% 27.5% 28.9%$200,000 - $249,999 10.7% 11.4% 13.9%$250,000 - $299,999 3.5% 3.5% 4.3%$300,000 - $399,999 3.4% 3.1% 3.4%$400,000 - $499,999 4.9% 4.2% 4.1%$500,000 - $749,999 3.0% 2.6% 2.5%$750,000 - $999,999 3.4% 2.4% 2.0%$1,000,000 + 3.6% 2.9% 2.5%
Average Home Value $242,622 $226,306 $223,299
Data Note: Income represents the preceding year, expressed in current dollars. Household income includes wage and salary earnings, interest dividends, net rents,pensions, SSI and welfare payments, child support, and alimony.
September 02, 2014
©2014 Esri Page 2 of 7
Source: U.S. Census Bureau, Census 2010 Summary File 1. Esri forecasts for 2013 and 2018. Esri converted Census 2000 data into 2010 geography.
Source:U.S.CensusBureau,Census2010

S. SAN JACINTO AVE. @ E. COMMONWEALTH AVE., SAN JACINTO, CANEECE COMMERCIAL | BILL NEECE | 619.920.4800
DEMOGRAPHICS: MARKET PROFILEMarket Profile1861 S San Jacinto Ave, San Jacinto, CA 92583 Prepared by Jerry Holdner1861 S San Jacinto Ave, San Jacinto, California, 92583, Latitude: 33.767018437Rings: 2, 3, 5 mile radii Longitude: -116.9587264
2 miles 3 miles 5 miles2010 Population by Age
Total 52,363 107,087 151,1790 - 4 8.9% 8.0% 7.6%5 - 9 8.3% 7.7% 7.6%10 - 14 8.2% 8.0% 7.9%15 - 24 15.7% 15.0% 14.4%25 - 34 13.3% 12.5% 12.1%35 - 44 12.0% 11.7% 11.7%45 - 54 11.6% 11.8% 11.8%55 - 64 9.0% 9.5% 9.8%65 - 74 6.2% 7.3% 7.9%75 - 84 4.5% 5.6% 6.2%85 + 2.3% 3.0% 3.0%
18 + 69.3% 71.2% 71.8%2013 Population by Age
Total 53,222 109,244 155,0090 - 4 8.9% 8.0% 7.6%5 - 9 8.1% 7.5% 7.2%10 - 14 7.9% 7.5% 7.4%15 - 24 16.0% 15.2% 14.7%25 - 34 13.6% 12.8% 12.3%35 - 44 11.5% 11.2% 11.2%45 - 54 11.4% 11.5% 11.6%55 - 64 9.7% 10.2% 10.5%65 - 74 6.4% 7.7% 8.3%75 - 84 4.3% 5.4% 6.0%85 + 2.4% 3.1% 3.1%
18 + 70.4% 72.4% 73.1%2018 Population by Age
Total 56,122 115,970 165,0810 - 4 9.0% 8.1% 7.7%5 - 9 7.9% 7.3% 7.0%10 - 14 7.6% 7.1% 7.0%15 - 24 14.7% 13.8% 13.4%25 - 34 14.6% 13.8% 13.3%35 - 44 11.4% 11.0% 10.9%45 - 54 10.6% 10.7% 10.8%55 - 64 10.0% 10.7% 11.1%65 - 74 7.4% 8.9% 9.6%75 - 84 4.5% 5.5% 6.1%85 + 2.4% 3.0% 3.1%
18 + 71.0% 73.3% 74.1%
2010 Population by SexMales 25,180 51,302 72,448Females 27,182 55,782 78,730
2013 Population by SexMales 25,676 52,488 74,498Females 27,548 56,755 80,511
2018 Population by SexMales 27,193 55,958 79,662Females 28,931 60,009 85,418
September 02, 2014
©2014 Esri Page 3 of 7
Source: U.S. Census Bureau, Census 2010 Summary File 1. Esri forecasts for 2013 and 2018. Esri converted Census 2000 data into 2010 geography.
Source:U.S.CensusBureau,Census2010

S. SAN JACINTO AVE. @ E. COMMONWEALTH AVE., SAN JACINTO, CANEECE COMMERCIAL | BILL NEECE | 619.920.4800
Market Profile1861 S San Jacinto Ave, San Jacinto, CA 92583 Prepared by Jerry Holdner1861 S San Jacinto Ave, San Jacinto, California, 92583, Latitude: 33.767018437Rings: 2, 3, 5 mile radii Longitude: -116.9587264
2 miles 3 miles 5 miles2010 Population by Race/Ethnicity
Total 52,361 107,084 151,179White Alone 60.1% 63.9% 65.9%Black Alone 6.5% 6.0% 5.8%American Indian Alone 1.9% 1.8% 1.9%Asian Alone 1.8% 2.2% 2.6%Pacific Islander Alone 0.3% 0.3% 0.3%Some Other Race Alone 24.1% 20.6% 18.2%Two or More Races 5.3% 5.3% 5.3%
Hispanic Origin 49.7% 44.0% 40.2%Diversity Index 81.7 79.1 77.3
2013 Population by Race/EthnicityTotal 53,224 109,243 155,008
White Alone 58.5% 62.3% 64.3%Black Alone 6.4% 5.9% 5.8%American Indian Alone 1.9% 1.9% 2.0%Asian Alone 1.8% 2.2% 2.7%Pacific Islander Alone 0.3% 0.3% 0.3%Some Other Race Alone 25.4% 21.8% 19.4%Two or More Races 5.6% 5.6% 5.6%
Hispanic Origin 52.3% 46.6% 42.8%Diversity Index 82.6 80.3 78.7
2018 Population by Race/EthnicityTotal 56,124 115,967 165,080
White Alone 56.2% 59.9% 61.9%Black Alone 6.4% 5.8% 5.7%American Indian Alone 2.0% 1.9% 2.0%Asian Alone 2.0% 2.4% 2.9%Pacific Islander Alone 0.3% 0.3% 0.3%Some Other Race Alone 27.3% 23.6% 21.1%Two or More Races 5.9% 6.0% 6.0%
Hispanic Origin 56.6% 50.9% 47.0%Diversity Index 83.7 81.8 80.5
2010 Population by Relationship and Household TypeTotal 52,362 107,084 151,178
In Households 99.1% 99.1% 99.2%In Family Households 85.7% 85.1% 85.5%
Householder 22.6% 23.4% 23.8%Spouse 14.1% 15.4% 16.4%Child 38.1% 36.2% 35.5%Other relative 6.7% 6.3% 6.2%Nonrelative 4.2% 3.8% 3.6%
In Nonfamily Households 13.4% 14.0% 13.7%In Group Quarters 0.9% 0.9% 0.8%
Institutionalized Population 0.5% 0.4% 0.4%Noninstitutionalized Population 0.4% 0.5% 0.5%
Data Note: Persons of Hispanic Origin may be of any race. The Diversity Index measures the probability that two people from the same area will be from differentrace/ethnic groups.
September 02, 2014
©2014 Esri Page 4 of 7
Source: U.S. Census Bureau, Census 2010 Summary File 1. Esri forecasts for 2013 and 2018. Esri converted Census 2000 data into 2010 geography.
DEMOGRAPHICS: MARKET PROFILE
Source:U.S.CensusBureau,Census2010

S. SAN JACINTO AVE. @ E. COMMONWEALTH AVE., SAN JACINTO, CANEECE COMMERCIAL | BILL NEECE | 619.920.4800
DEMOGRAPHICS: MARKET PROFILE
Market Profile1861 S San Jacinto Ave, San Jacinto, CA 92583 Prepared by Jerry Holdner1861 S San Jacinto Ave, San Jacinto, California, 92583, Latitude: 33.767018437Rings: 2, 3, 5 mile radii Longitude: -116.9587264
2 miles 3 miles 5 miles2013 Population 25+ by Educational AttainmentTotal 31,528 67,610 97,804
Less than 9th Grade 13.7% 10.2% 8.4%9th - 12th Grade, No Diploma 14.4% 14.2% 13.6%High School Graduate 28.7% 29.5% 30.0%Some College, No Degree 25.8% 27.0% 27.2%Associate Degree 7.3% 7.7% 7.6%Bachelor's Degree 6.4% 7.2% 8.1%Graduate/Professional Degree 3.7% 4.3% 5.1%
2013 Population 15+ by Marital StatusTotal 40,018 84,206 120,548
Never Married 32.2% 29.4% 27.7%Married 48.7% 49.1% 50.7%Widowed 7.0% 8.6% 8.9%Divorced 12.1% 12.8% 12.7%
2013 Civilian Population 16+ in Labor Force Civilian Employed 82.0% 82.3% 83.9% Civilian Unemployed 18.0% 17.7% 16.1%2013 Employed Population 16+ by IndustryTotal 16,451 34,335 48,930 Agriculture/Mining 1.6% 1.4% 1.1% Construction 8.1% 8.3% 8.0% Manufacturing 6.0% 5.8% 5.9% Wholesale Trade 1.7% 1.5% 1.5% Retail Trade 14.1% 13.7% 13.4% Transportation/Utilities 5.7% 5.5% 5.5% Information 1.1% 1.4% 1.4% Finance/Insurance/Real Estate 4.0% 4.3% 4.6% Services 53.8% 54.2% 54.1% Public Administration 3.9% 3.8% 4.4%2013 Employed Population 16+ by OccupationTotal 16,453 34,333 48,931 White Collar 41.2% 46.4% 49.4% Management/Business/Financial 5.6% 6.9% 8.1% Professional 12.5% 15.2% 17.1% Sales 10.2% 10.5% 10.5% Administrative Support 12.9% 13.7% 13.8% Services 29.8% 27.3% 25.8% Blue Collar 29.0% 26.3% 24.8% Farming/Forestry/Fishing 1.3% 1.0% 0.7% Construction/Extraction 7.8% 7.2% 6.9% Installation/Maintenance/Repair 6.6% 6.1% 5.5% Production 5.2% 5.1% 4.9% Transportation/Material Moving 8.0% 7.0% 6.7%
September 02, 2014
©2014 Esri Page 5 of 7
Source: U.S. Census Bureau, Census 2010 Summary File 1. Esri forecasts for 2013 and 2018. Esri converted Census 2000 data into 2010 geography.
Source:U.S.CensusBureau,Census2010

S. SAN JACINTO AVE. @ E. COMMONWEALTH AVE., SAN JACINTO, CANEECE COMMERCIAL | BILL NEECE | 619.920.4800
DEMOGRAPHICS: MARKET PROFILE
Source:U.S.CensusBureau,Census2010
Market Profile1861 S San Jacinto Ave, San Jacinto, CA 92583 Prepared by Jerry Holdner1861 S San Jacinto Ave, San Jacinto, California, 92583, Latitude: 33.767018437Rings: 2, 3, 5 mile radii Longitude: -116.9587264
2 miles 3 miles 5 miles2010 Households by Type
Total 17,268 37,144 52,708Households with 1 Person 25.4% 26.3% 25.8%Households with 2+ People 74.6% 73.7% 74.2%
Family Households 68.3% 67.6% 68.4%Husband-wife Families 42.4% 44.7% 47.1%
With Related Children 23.9% 22.9% 23.1%Other Family (No Spouse Present) 25.9% 23.0% 21.3%
Other Family with Male Householder 7.1% 6.5% 6.1%With Related Children 4.8% 4.2% 4.0%
Other Family with Female Householder 18.8% 16.5% 15.2%With Related Children 13.5% 11.3% 10.2%
Nonfamily Households 6.3% 6.0% 5.8%
All Households with Children 42.9% 39.0% 37.9%
Multigenerational Households 7.7% 7.1% 6.9%Unmarried Partner Households 9.1% 8.1% 7.7%
Male-female 8.4% 7.4% 6.9%Same-sex 0.7% 0.8% 0.7%
2010 Households by SizeTotal 17,267 37,144 52,708
1 Person Household 25.4% 26.3% 25.8%2 Person Household 25.6% 28.0% 29.6%3 Person Household 14.3% 13.9% 13.6%4 Person Household 14.2% 13.3% 13.1%5 Person Household 10.3% 9.4% 9.2%6 Person Household 5.4% 4.7% 4.6%7 + Person Household 4.8% 4.3% 4.2%
2010 Households by Tenure and Mortgage Status
Total 17,268 37,145 52,707Owner Occupied 53.5% 59.6% 64.7%
Owned with a Mortgage/Loan 34.8% 38.9% 41.3%Owned Free and Clear 18.7% 20.8% 23.5%
Renter Occupied 46.5% 40.4% 35.3%
Data Note: Households with children include any households with people under age 18, related or not. Multigenerational households are families with 3 or more parent-child relationships. Unmarried partner households are usually classified as nonfamily households unless there is another member of the household related to thehouseholder. Multigenerational and unmarried partner households are reported only to the tract level. Esri estimated block group data, which is used to estimatepolygons or non-standard geography.
September 02, 2014
©2014 Esri Page 6 of 7
Source: U.S. Census Bureau, Census 2010 Summary File 1. Esri forecasts for 2013 and 2018. Esri converted Census 2000 data into 2010 geography.

S. SAN JACINTO AVE. @ E. COMMONWEALTH AVE., SAN JACINTO, CANEECE COMMERCIAL | BILL NEECE | 619.920.4800
DEMOGRAPHICS: MARKET PROFILE
Market Profile1861 S San Jacinto Ave, San Jacinto, CA 92583 Prepared by Jerry Holdner1861 S San Jacinto Ave, San Jacinto, California, 92583, Latitude: 33.767018437Rings: 2, 3, 5 mile radii Longitude: -116.9587264
2 miles 3 miles 5 milesTop 3 Tapestry Segments
1. Industrious Urban Fringe Industrious Urban Fringe Senior Sun Seekers
2. City Dimensions Senior Sun Seekers Industrious Urban Fringe
3. Midland Crowd City Dimensions Midland Crowd
2013 Consumer Spending Apparel & Services: Total $ $17,680,793 $39,872,220 $59,886,326
Average Spent $1,018.30 $1,064.99 $1,124.50Spending Potential Index 45 47 50
Computers & Accessories: Total $ $2,827,365 $6,494,488 $9,823,097Average Spent $162.83 $173.47 $184.45Spending Potential Index 66 70 74
Education: Total $ $16,184,558 $35,217,874 $52,241,315Average Spent $932.13 $940.67 $980.95Spending Potential Index 64 64 67
Entertainment/Recreation: Total $ $37,043,865 $87,888,756 $134,501,915Average Spent $2,133.49 $2,347.52 $2,525.57Spending Potential Index 66 72 78
Food at Home: Total $ $59,259,669 $137,070,516 $207,478,691Average Spent $3,412.99 $3,661.17 $3,895.87Spending Potential Index 68 73 77
Food Away from Home: Total $ $37,454,120 $85,884,221 $129,730,246Average Spent $2,157.12 $2,293.98 $2,435.97Spending Potential Index 68 72 76
Health Care: Total $ $48,465,348 $120,629,871 $186,995,843Average Spent $2,791.30 $3,222.04 $3,511.26Spending Potential Index 63 72 79
HH Furnishings & Equipment: Total $ $17,850,787 $42,127,362 $64,370,274Average Spent $1,028.09 $1,125.23 $1,208.70Spending Potential Index 57 62 67
Investments: Total $ $22,820,114 $60,160,744 $94,159,709Average Spent $1,314.30 $1,606.90 $1,768.06Spending Potential Index 63 77 85
Retail Goods: Total $ $261,251,127 $619,823,875 $948,134,452Average Spent $15,046.43 $16,555.57 $17,803.34Spending Potential Index 62 69 74
Shelter: Total $ $188,776,704 $431,616,471 $650,149,705Average Spent $10,872.36 $11,528.53 $12,208.01Spending Potential Index 67 71 75
TV/Video/Audio:Total $ $15,034,581 $35,043,813 $53,268,140Average Spent $865.90 $936.02 $1,000.23Spending Potential Index 67 73 78
Travel: Total $ $19,602,182 $47,133,486 $72,366,180Average Spent $1,128.96 $1,258.94 $1,358.84Spending Potential Index 62 69 74
Vehicle Maintenance & Repairs: Total $ $12,435,192 $29,368,506 $44,818,406Average Spent $716.19 $784.44 $841.57Spending Potential Index 65 72 77
Data Note: Consumer spending shows the amount spent on a variety of goods and services by households that reside in the area. Expenditures are shown by broadbudget categories that are not mutually exclusive. Consumer spending does not equal business revenue. Total and Average Amount Spent Per Household represent annualfigures. The Spending Potential Index represents the amount spent in the area relative to a national average of 100.Source: Consumer Spending data are derived from the 2010 and 2011 Consumer Expenditure Surveys, Bureau of Labor Statistics. Esri.
September 02, 2014
©2014 Esri Page 7 of 7
Source: U.S. Census Bureau, Census 2010 Summary File 1. Esri forecasts for 2013 and 2018. Esri converted Census 2000 data into 2010 geography.
Source:U.S.CensusBureau,Census2010
Related Documents