November 23, 2008 Impact of Poverty to Rural Sustainability in Java and Japan z Hiroshi Tsujii z Ishikawa Prefectural University

Welcome message from author
This document is posted to help you gain knowledge. Please leave a comment to let me know what you think about it! Share it to your friends and learn new things together.
Transcript

November 23, 2008
Impact of Poverty to Rural Sustainability in Java and Japan
Hiroshi TsujiiIshikawa Prefectural University

1. The Impact of Poverty to Sustainability of Agroforestry in a West Java Village.
West Java, Indonesia

西ジャワ地図
西ジャワ州チアンジュー
ル県ボジョンピチュン郡
Kemang村

Kemang村の地図N

The Characterisitics of Village Kemang
Low population densityImportance of pasir (agroforestry in private forest/satoyama)Surrounded by vast national forest Very fast expansion of leaf banana in both pasirand national forestDecline of palm sugar area and traditional agroforestry (talun huma system).Soil depletion by leaf banana


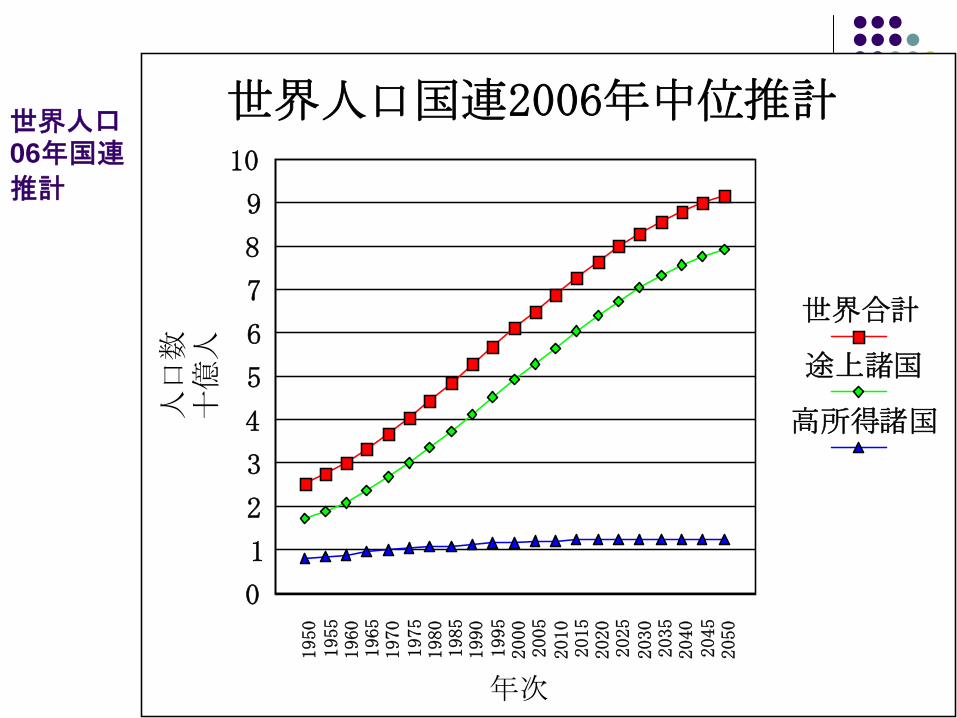
世界人口
06年国連
推計
1950
1955
1960
1965
1970
1975
1980
1985
1990
1995
2000
2005
2010
2015
2020
2025
2030
2035
2040
2045
2050
年次
0
1
2
3
4
5
6
7
8
9
10
十億
人人
口数
世界合計
途上諸国
高所得諸国
世界人口国連2006年中位推計

3. Leaf banana area expansion from the farm survey
Figure 1 N um bers of D om inant Trees M anaged by the Surveyed
A groforesters A djusted for N um ber of Surveyed H ouseholds D uring past
Three D ecades
0
10000
20000
30000
40000
50000
60000
70000
1970 1980 1990 2001Year
Number of Trees
A lbizzia
Sugar Palm
Kihiang
Banana LeafTrees
Banana FruitsTrees

Leaf banana area has been replacing the talung-huma system and the soil-mining-type leaf banana system has been increasing.
Fi 5 1 Ch f h f h T H f LB CS f
0102030405060708090
100
1990 1991 1992 1993 1994 1995 1996 1997 1998 1999 2000 2001 2002
Year
Perc
enta
ges
I= Total T-H Systeplot/total plot
II= Total LBplot/total plot
LB mixed treesplot/total LB plot(II
Soil Mining LBplot/total LB plot(II

Inherent soil fertility decline for red rice and cassava in Java
Figure 2.1 Changes in inherent yield of dryland paddy, cassava, andsweet potato adjusted to chemical fertilizers application in Java
(1988=1)
0.00
0.20
0.40
0.60
0.80
1.00
1.20
1.40
1.60
1.80
1988 1989 1990 1991 1993 1994 1995 1996 1997 1998 1999
Year
Inde
ces
Drylandpaddy
Cassava
Sweetpotato

Table 4, Household Income per economic Activities according to Strata (2001)3) Upland Farm
Strata Rice Farm
PlmS BnnLf
Hsbdry. Agr.L
ab. Non.A
gr L.O/S.I
Total
A 13
1,757 9.2
4,379 23.0
8794.6
2,75714.5
75 0,4
230.1
12,64266.4
1520.8
19,028
100B 19
622 4.9
3,083 24.4
1,32410.5
1,26710.0
515 4.1
3212.5
7,61160.2
4863.8
12,638
100C 18
117 2.6
3,618 79.1
1,68336.8
1,07023.4
-3 -0.1
1723.8
62913.7
430.9
4,576100
D 11
53 1.4
1,074 29.2
1,03828.2
-361-9.8
-5 -0.1
2,27361.8
2837.7
00
3,678100
Total 61
612 5.9
3,155 30.6
1,28812.5
1,26012.2
175 1.7
5665.5
5,61054.4
1961.9
10,314
100
Unit:1000rupiah

5.9 30.6 12.5 12.2 1.7 5.5 54.4 1.9100
(Source; Field Survey) (Note ) (1) PlmS : Palm Sugar
BnnLf : Banana Leaf Hsbdry : Husbandry Agr.Lab : Agricultural Labor Non.Agr : Non Agriculture L.O/S.I : Lease Out/ Share In
(2) Strata codes are based on scoring of socio-economic factors of surveyed households. Agricultural land was classified according to the status of ownership, that is either owned, mortgaged, shared, and leased. Farmhouses were classified into 4 groups according to the types of roof, walls, and floors. Occupations were classified into 4 groups. According to these classifications, scores were given to each status, type, and group. Strata of households were decided according to the scores given to each household. For further explanations, refer to (Mugniesyah et al, 2001)
(3)Kosuke Mizuno, Sugiah Machfud Mugniesyah, Ageng Herianto, and Hiroshi Tsujii ∗, “Agricultural Sustainability and Economic Activities in a Highland Village in West Java, -Duration of Land Use Cycles in the Highlands-.” A paper presented in a symposium supporterd by JSPS in 2003.

Table 5, Composition of Household Non Agricultural Income, (Unit: Rp. 1000, %)
Str
ata
Rc
Mill
Ho
.
In
dst
r
Ar
tsn
Grsr.
Shop
Trde
Sgr
Trdg
.
Woo
d
Tra
ns
Pub.
Wkn
g
No
n
F
W
G
Own
Mchn
Rmt
nc
Othe
r
Total
N.Agr
A
13
554
2.9
0
0
25
0.1
2,945
15.5
0
0
462
2.4
0
0
5,086
26.7
0
0
3,085
16.2
323
1.7
162
0.9
12,642
66.4
B
19
164
1.3
27
0.2
53
0.4
2,021
16.0
1,074
8.5
505
4.0
707
5.6
706
5.6
5
0.0
1,471
11.6
611
4.8
267
2.1
7,611
60.2
C
18
0
0
0
0
43
0.9
187
4.1
0
0
23
0.5
0
0
0
0
0
0
0
0
54
1.2
322
7.0
629
13.7
D
11
0
0
64
1.7
0
0
0
0
0
0
0
0
0
0
218
5.9
0
0
0
0
0
0
1
0.0
283
7.7
Tot
al
61
169
1.6
20
0.2
34
0.3
1,312
12.7
334
3.2
263
2.5
220
2.1
1,343
13.0
2
0.0
1,115
10.8
275
2.7
523
5.1
5,610
54.4
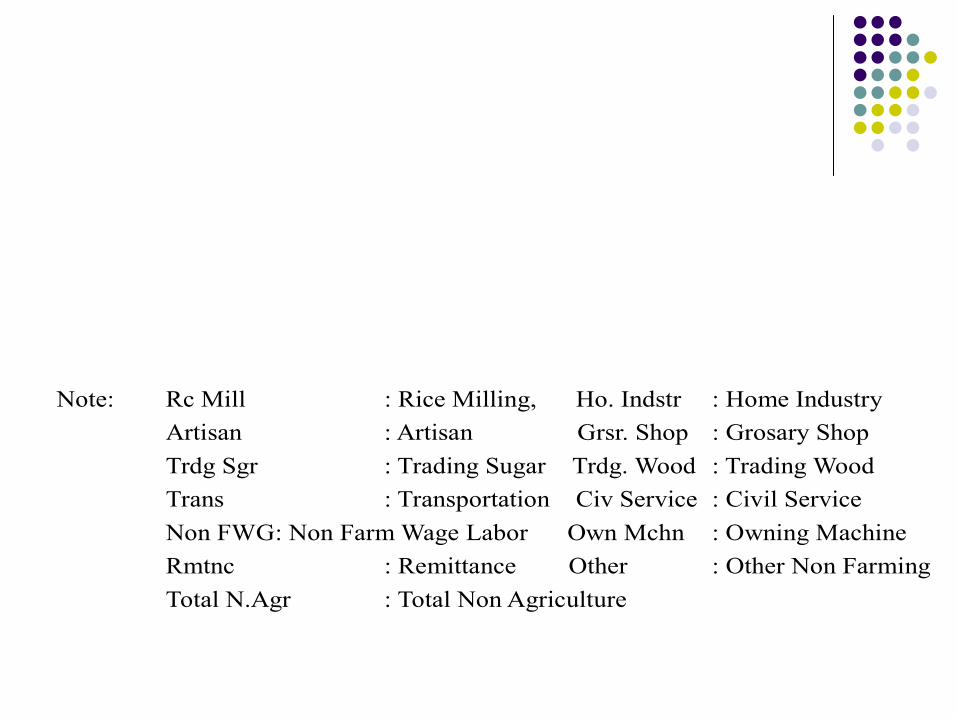
Note: Rc Mill : Rice Milling, Ho. Indstr : Home Industry Artisan : Artisan Grsr. Shop : Grosary Shop Trdg Sgr : Trading Sugar Trdg. Wood : Trading Wood Trans : Transportation Civ Service : Civil Service Non FWG: Non Farm Wage Labor Own Mchn : Owning Machine Rmtnc : Remittance Other : Other Non Farming Total N.Agr : Total Non Agriculture

Kosuke Mizuno, Sugiah Machfud Mugniesyah, Ageng Herianto, andHiroshi Tsujii ∗, “Agricultural Sustainability and EconomicActivities in a Highland Village in West Java, -Duration of Land UseCycles in the Highlands-.” A paper presented in a symposium supporterd byJSPS in 2003.

4. Farmers’ perception of soil fertilityTable 1 Estimation results of the agroforesters’ perception function for BL plot soil fertility
Variables Standardized (βi ) t-value Significance level Constant 1.806 DNBL -0.275 -2.495 ** MRU 0.206 1.846 * CFN -0.135 -0.989 CFP 0.137 1.030 WF 0.276 2.509 ** SL -0.014 -0.113 HF -0.023 -0.194 DNFL 0.225 1.689 *
Adjusted R2 = 0.22
Note: *** = 1%; **= 5%; and * = 10%, significant level

5. Variable definitions
SFBLA = Agroforesters’ plot-wise soil fertility perception (low=1; normal=2; high=3).DNBL = BL plot size/number of BL trees in the plot, m2. MRU = Green/Home yard manure used for each banana leaf plot (kg). CFN = Chemical nitrogenous fertilizer used for food crops (kg). CFP = Chemical phosphate fertilizer used for food crops (kg). WF = Annual weeding frequency for each banana leaf plot (times). SL = Land slope for each plot (%). HF = Frequency of past huma stage in a slopeland plot managed by each household (times). DNFL = the national forest dummy. If 1, then the plot is in national forest land; =0, then in self-
owned.

6. Leaf banana production function: the log-linear type.
Table 2 Estimated plot-wise BL production function
Variables Standardized βi t-value Significance level Constant 2.496 P-SBFLA 0.343 3.715 *** BLA 0.176 1.850 * LBH 0.222 2.394 ** DMFC -0.352 -3.402 *** DMTR -0.097 -0.983
Adjusted R2 = 0.55
Note: *** = 1%; ** = 5%; and * = 10%, significant level

7. Variable definitions
PRBL = Production of banana leaf from each plot (ponggol) 3)
SFBLA = Agroforesters’ plot-wise soil fertility perception (low=1; normal=2; high=3). BLA = Size of each BL plot (m2). LBH = Labor use for harvesting banana leaves for each plot (hours). DMFC = Dummy variable for BL cropping patterns. If it is e, and DMTR = 0, then the BL trees
are mixed with food crops, and its parameter is the difference between intercept for the group of plots with BL trees mixed with foodcrops and of the group of plots with BL monoculture.
DMTR = If it is e, and DMFC = 0, then the BL plot is mixed with other trees, and its parameteris the difference between intercepts for the group of plots with BL trees mixed withother trees and of the group of plots with BL monoculture.

8. Leaf banana income share functions of the farmers
Table 3 Estimated function for the managed BL area by the households surveyed
Variables Standardized βi t-value Significance level Constant -7059.28 TSA 0.848 7.981 *** NPLOT -0.189 -1.902 * PFL 0.140 1.737 * EXBL 0.149 1.831 * PREDU 0.081 0.932 PBLBS21 0.030 0.357
Adjusted R2 = 0.714
Note: *** = 1%; **= 5%; and * = 10%, significant level
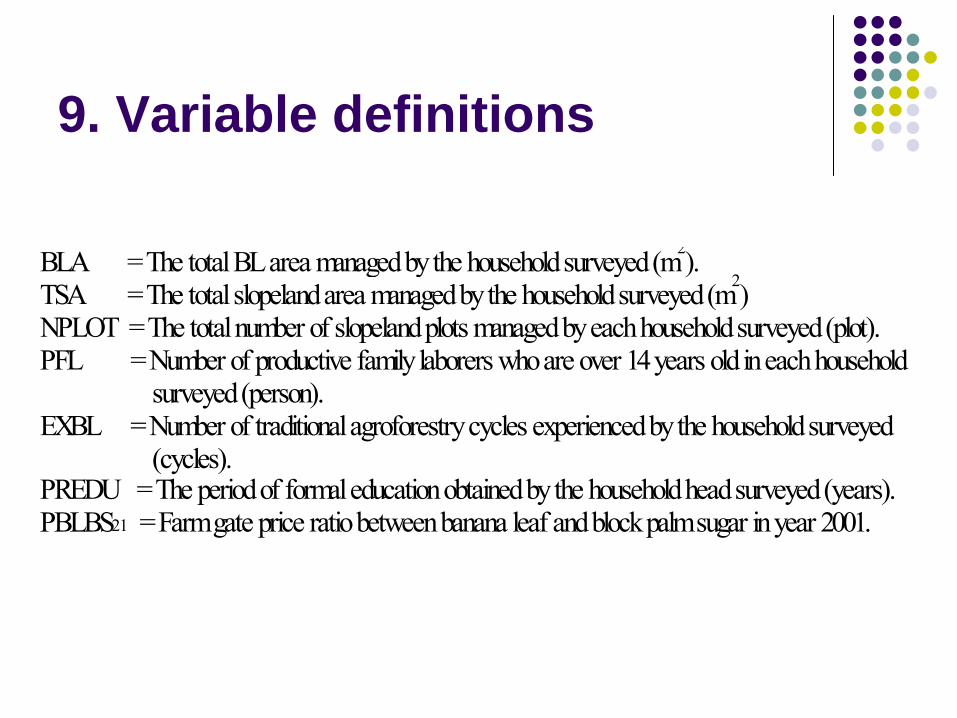
9. Variable definitions
BLA = The total BL area managed by the household surveyed (m2).TSA = The total slopeland area managed by the household surveyed (m2) NPLOT = The total number of slopeland plots managed by each household surveyed (plot). PFL = Number of productive family laborers who are over 14 years old in each household
surveyed (person). EXBL = Number of traditional agroforestry cycles experienced by the household surveyed
(cycles). PREDU = The period of formal education obtained by the household head surveyed (years). PBLBS21 = Farm gate price ratio between banana leaf and block palm sugar in year 2001.

0. A logit analysis of HH adoption of the SM leaf banana systems.G e n e ra l M o d e l In te ra c tio n T e rm s
M a in fu n c tio n F in a l F u n c tio n F u n c tio n 1 F u n c tio n 2 V a r ia b le s
L o g o d d s O d d s r a tio
L o g o d d s O dd s ra tio
L o g o d d s O d d s ra tio
L o g o d d s
O dd s ra tio
A GE -1 .76 (2 .34 )+ +
F M LA B O R 1 .26 (2 .48 )+ +
1 .16 (3 .4 0 )*
1 .53 (2 .04 )+
0 .9 7 (1 .81 ) +
H H D T R EE -2 .95 (8 .07 )* * *
-3 .19 (8 .4 4 )* * *
-2 .85 (3 .83 )* *
-2 .38 (4 .1 5 )* *
O R M EM 1 .36 (2 .96 )*
0 .84 (2 .63 )+ +
1 .44 (3 .13 )*
1 .4 4 (2 .92 )*
D EP EN D 2 .38 (4 .66 )* *
2 .38 (4 .86 )* *
3 .27 (6 .46 )* * *
2 .3 1 (5 .2 0 )* *
[D N F LA N D ] 4 .67 (5 .6 1 )* *
106 .29 4 .33 (6 .50 )* *
76 .15 5 .24 (6 .34 )* *
188 .5 3 5 .1 2 (6 .4 1 )* *
16 8 .22
[D LES S ER ] -1 .03 (0 .44 )
0 .36 -8 .35 (2 .74 )*
0 .001
[D ED U C A ] 3 .47 (1 .53 )
32 .13
[D N F IN C O -1 .25 (0 .67 )
0 .29 -3 .51 (1 .92 )+
0 .03
H H D T R EE* D LES S ER
-8 .35 (3 .88 )* *
H H D T R EE* D N F IN C O
-4 .56 (2 .25 )+
C o n s t a n t 2 .70 (0 .48 )
-2 .57 (2 .03 0)+
0 .71 (0 .82 )
0 .301 (0 .11 )
N a g e lk e rk e ’s R 2
0 .8 2 0 .7 9 0 .8 4 0 .8 2
M o d e l χ 2 5 6 .0 2 52 .9 2 5 8 .8 0 5 5 .9 3
% -c o rre c t p re d ic t e d m o d e l
9 1 .5 8 6 .4 8 9 .8 8 8 .1
N o te s : * * * = 1 % ; * * = 5 % ; * = 1 0 % ; + + = 1 5 % ; + = 2 0 % s ig n if ic a n t le v e ls ; W a ld te s t v a lu e s a re in p a re n th e s es . In itia l -2 ln = 8 1 .3 7 . [ ]= ca te g o r ic a l v a r ia b le w ith (ψ ) = e x p δ u ; I f ψ < 1 , δ u < 0 o th e rw is e δ u ? 0

11. Variable definitions
V a ria ble s D e sc ription A D L B C S D ic hotom ous va ria ble , 1 if the surve ye d house hold a dopte d the soil m ining
L B c ropping sys te m s a t le a s t one plot of a ll the c ultiva te d plots , 0 if othe rw ise .
A G E H ouse hold he a d a ge (ye a rs ) FM L A B O R N um be r of produc tive fa rm la bore rs in the surve ye d house holds be fore
a dopting the soil m ining L B c ropping sys te m s (pe rsons ) H H D T R E E D e ns ity of tre e s of the surve ye d house holds ’ c ultiva te d s loping la nd be fore
a dopting the soil m ining L B c ropping sys te m s (tre e s /1000m 2 ) O R M E M M e m be rship in the loc a l orga niza tions be fore a dopting the soil m ining L B
c ropping sys te m s (num be rs of orga niza tions ) D E P E N D N um be r of de pe nda nts in the surve ye d house holds be fore a dopting the soil
m ining L B c ropping sys te m s (pe rsons ) D N FL A N D C a te goric a l va ria ble of the surve ye d house hold w ho c a n a c c e ss to the
na tiona l fore s t la nd be fore a dopting the soil m ining L B c ropping sys te m s , 1; 0 if othe rw ise
D L E SSE R C a te goric a l va ria ble of the surve ye d house hold, w ho is a la ndow ne r/le s se r w ho sha re out the la nd to le s se e be fore a dopting the soil m ining L B c ropping sys te m s ; 1; 0 if othe rw ise .
D E D U C A C a te goric a l va ria ble of the pe riod of form a l e duc a tion a tta ine d by the surve ye d house hold he a d; 1 if obta ine d ≥ 6 ye a rs , 0 if othe rw ise
D N FIN C O C a te goric a l va ria ble of the surve ye d house hold, w ho c a n a c c e ss to non- fa rm a c tivitie s be fore a dopting the soil m ining L B c ropping sys te m s 1; 0 if othe rw ise .

The Reasons for the Fast Expansion of LB area in Kemang
1. Poverty of farmers.2. Short-run income increase at the expense of long-run soil depletion.3. Incresing stability in the variation of farmers’ income.

How to cope with this problem.
1. Informing farmers of this problem.2. Introducing less soil depleting LB systems such as LB with trees, LB with leguminous trees, and LB with optimal spacing.3. Introducing less soil depleting and farmers’income increasing log sharing system.

12. The social forestry program in KemangIn 1934-35 National Forest was established by compensation to the farmers who were living or using the area. But the farmers had been using the NF area freely. Dinas Perhutanan had been in charge.After 1988?, The PP(Public Forest Corporation) had barred the farmers from the NF. The PP had partly opened the NF for the Social Forestry program(Taunya type. No product sharing). In 1977 an NGO proposed a sharing(30%) social forestry program to the PP. Not created. Severe(50%) National Forest Looting During Crisis and Post Crisis Period.

13. Slow killing of teak and mahogany by the farmers in the remote NF of Kemang for continuation of leaf banana production.
Tacit agreements among the looters, the farmers, the mandors, and the merchants? No long-run incentive for the farmers to let trees survive in the autonomi situation. BH(Banjar Harian. Direct Forest Planting and Management by the PP). 70ha in September 2004.

14. Importance of sharing in the harvested log sales in the national forest.
Product sharing and its effect to the incentive for the farmers to conserve trees in the new social forestry program.About ten cases in Java with NGO involvement. Law? Its study in Central Java in our core university project. More study is needed.

2. What is satoyama?Sato=a hamletYama=hillsThus satoyama is a belt of nearby hills surrounding a hamlet. It does not cover the hamlet. Outside of satoyama belt, there is okuyama. Oku means faraway, thus okuyama is hills and mountains faraway from the hamlet. In Japan during the 17th to the first half of the 20th century, and in Indonesia, Thailand, the Philippines, and other developing countries in the world until now, people in hamlets and their satoyama have had many types of interactions. Some types of interactions have maintained sustainable relationships between sato and satoyama, but other types have destroyed the ecosystem of satoyama and the people who destroyed the satoyama ecosystem often must move to the other area.

What is satoyama?(Cont.)Mr. J. Miyake in religion ethnography, wrote that outside of okuyama belt there exists take(岳). In satoyama, foxes, raccoons, monkeys, rabbits, and wild boars live. In okuyama, yamahito(山人), Yamanba(山姥), and demons live. In take, legendary wizards(仙人)、long-nosed goblins(天狗) andswans live.(J. Miyake, in Japanese, 1986)

sato
norarice & crop land
satoyama(hayashi)pasir, munoa, pa?
okuyama(mori)kami, ghosts, pee
Charcoal, kindling woods, fallen leaves,grass, branches & forest products
were obtained.
take
take


丹後半島日ヶ谷での谷地田・棚田・はさ掛け稲作


Satoyama during 17th century to first half of 20th century in Japan.
Satoyama have been very important source of grass, tree branches, and leaf and branch litter as fertilizer (karishiki or grass fertilizer(草肥), 刈敷) to paddies and upland fields, of wood, fire woods, charcoal, leaves and other wrapping materials, vines, roof materials (kaya, 茅), paper plants, mulberry leaves for silk worms, edible mountain plants(山菜) and bamboo shoots, other edible satoyama materials, etc. Especially, karishiki has been extremely important to Japanese farmers as it has been most important source of fertilizer for them for almost four centuries from the 17th century. Consequently, Japanese farmers in hamlets have tried very hard and have been successful to maintain the ecosystem of satoyama as grass mountains(草山) or bush mountains(柴山) so that they can harvest grass and branches best. It was shown by historians that Japanese farmers have long managed to sustain satoyama ecosystem in Japan as grass and bush mountains. Thus landscape of satoyama form sato was dominated by grass mountains for about four centuries from the 17th century, that is completely different from the present day landscape of satoyama.
Kunihiko Mizumoto, Grass Mountains and Edo Period, (in Japanese) Libretto Japan History 52, Yamakawa P.C., 2003.

Some Evidences of Grass Mountain Ecosystem Landscape of Satoyama.


Dominance of Grass and Bush Mountains in the Gocho(郷帳)Mountain Landscapes in Some Provinces of Japan in Mid 17th Century(%)Provinces No. of Villages Grass&Bush Grass&Trees TreesKawachi 184 31 41.3 27.7Awa 217 49.3 46.1 4.6Ecchu 505 75.2 0 24.8Mutu 374 69.8 7.7 22.5Note: Kunihiko Mizumoto, Grass Mountains and Edo Period,(in Japanese) LibrettoJapan History 52, Yamakawa P.C., 2003.

Satoyama in the Last Half of the 20th Century
Collapse in the interdependences between sato farmers and satoyama:Increase of chemical fertilizer use.Decrease of charcoal and fire woods use.Decrease in the sato farmers other dependences on satoyama.Rural depopulation and aging.Increase in abandoned crop land.Increase in wild Birds and Animal Damages (BAD) to crops. Disappearance of grass and bush mountains, and dominance of tree covered mountains.

1950
1955
1960
1965
1970
1975
1980
1990
1995
1997
2002
Year
0
500
1000
1500
2000
2500
Thousand Tons
Y軸 Charcoal Production
Fig Disappearance of Charcoal production in Japan

先進各国の食糧自給率の内日本 のみ減少してきた。
61 62 63 64 65 66 67 68 69 70 71 72 73 74 75 76 77 78 79 80 81 82 83 84 85 86 87 88 89 90 91 92 93 94 95 96 97 98 9920
0020
0120
02
暦年
50
100
150
%
日本
英国
フランス
ドイツ
アメリカ
注:農水省が食糧需給表とFAOのFood Balance Sheetsを使用して推計。
図 主要先進諸国の供給熱量総合食料自給率の推移

C.
日本は世界最大
ないし第2位の大農水産
物輸入国であり、農産物
の平均輸入関税率は
12%で、EUの20%、タイ
の35%、アルゼンチンの
33%と比べ低い水準にあ
る。日本は世界で最も農
産物輸入を開放
している国の一つである。
1961
1962
1963
1964
1965
1966
1967
1968
1969
1970
1971
1972
1973
1974
1975
1976
1977
1978
1979
1980
1981
1982
1983
1984
1985
1986
1987
1988
1989
1990
1991
1992
1993
1994
1995
1996
1997
1998
1999
2000
2001
2002
2003
2004
2005
年次
0
10
20
30
40
50
60
70
80
10億
ドル
国別
輸入
額
GermanyJapanUKUSA
注)FAOデータに基づき辻井が作
図 90年代日本が世界最大の農水産物輸入国21世紀は米国に次ぎ2番目の大輸入国である

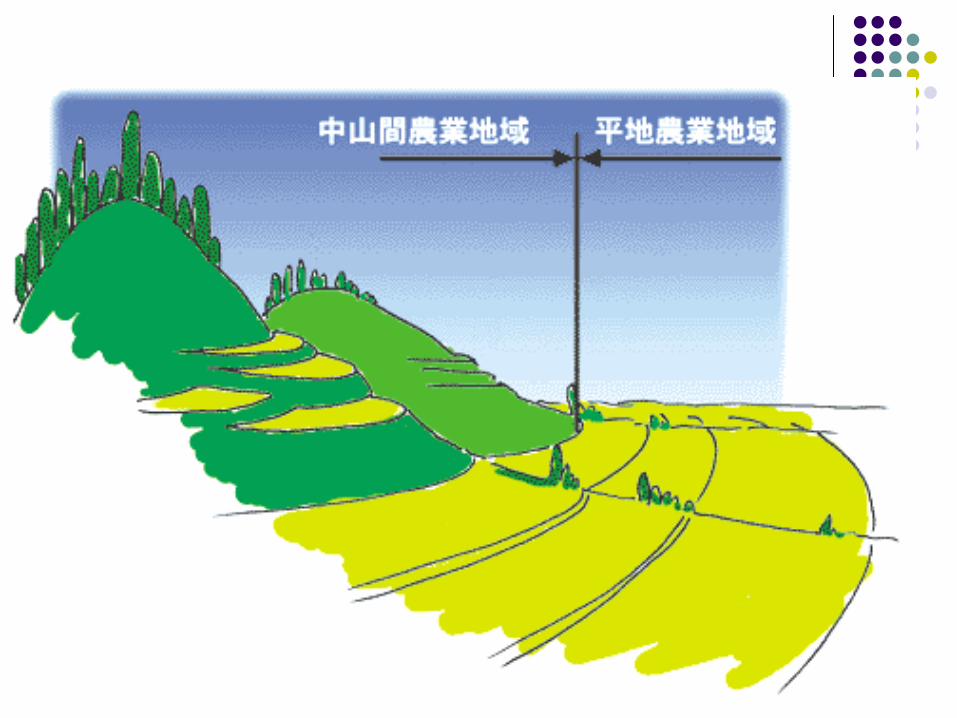
Importance of Satoyama (chusankan area)
Importance of Mountainous (chusankan) Area and Agriculture in Japan Area(mill. ha) No. of Local GPopulation Aging Level Agr. Prod. No. of Farms Arable Land
2000 2004 2000, Mill. 2000, (%) Bill. Yen, 200 2000, mill. 2003, mill. haChusankan 2.551 1689 17.43 25.1 3377 1.35 1.99Japan 3.717 3100 126.93 17.3 8999 3.12 4.74Share(%) 67 55 14 - 38 43 42Sourses: Japan government statistics.Note: Chusankan area means mountainous and nearby disadvanntageous area.

石川県の中山間地域:緑山間、黄緑中間、黄土色平地、桃都市。Green: Mountain, Light green: Intermediate, Khaki: Flat, Pink: Urban.

1960
1965
1970
1975
1980
1985
1990
1995
2000
2005
2010
2015
2020
2025
2030
2035
2040
2045
2050
2055
2060
2065
2070
2075
2080
2085
2090
2095
2100
年度
0
1
2
3
4
5
6
7
8
9
万農
家数
石川県の農家数
珠洲市の農家数
輪島市の農家数
2030年での石川県農家の消滅予測

a. Loco(トロッコ蒸気機関車)輸入走行による奥能 登活性化企画の目的と方法
1) 目的: 過疎化・高齢化が激しく、人口減が激しい奥能登へ、ジャワのトロッコ蒸気機関車と改造客車を輸入して、能登鉄道廃線跡にエコトレインとして走行させ、ロコ・ファンなどを、観光・乗車・環境保全活動などに集客し、奥能登の農林水産物と郷土料理を食べてもらい、空き家の利用事業も行い定住者を増やし、農林漁業と観光・商業を発展させる。ロコは薪で走るので、走行途中参加者に、沿線の農林漁民の協力を得て、森林の間伐と薪の作製、沿線の放棄棚田での田植え・草刈り・収穫作業、海岸での水産物の採集や掃除を実行してもらう。2) 方法:既存の辻井が代表の任意組織を発展的に改組してNPOなどの経営体を立ち上げ、支持者を糾合し、LOCOの輸入・走行を実現する。資金を調達し、来年春までに実現する。

3) 企画核組織
「ロコで奥能登を活性化する会」代表 辻井 博 石川県立大学「ロコで奥能登を活性化する会」核要員
高橋
強
石川県立大学中村文美
石川県立大学学生中村
金沢大学宇野
金沢大学濱田隆伸・珠洲市市会議員、NPO能登レール・エア21理事長赤坂・珠洲市市会議員、NPO能登レール・エア21理事
海老名和博
グリーンツーリズム推進協議会
代表
Dr. Ageng Herianto, Assoc. Prof. Gadjamada University, Yog Yakarta, Inodonesia
Dr. Bungaran Sragih, former Minister of Agriculture, Prof., Bogor Agr. Univ., Indonesia

4) 支持・協力体制
県地産業化資源活用推進ファンド助成金条件付き採用。他の助成金も応募。
NPO 能登半島 おらっちゃの里山?
県インドネシア友好協会。
のと鉄道でかつて蒸気機関車を保守・点検・保線などをしていた専
門家5人。
地方公共団体。農協、漁協、森林組合。
農林漁家。
商工会議所、観光協会、民宿協議会、のと鉄道。
地域伝統食推進団体。
県・市民、学生。
北国新聞、赤旗、NHK TV、朝日テレビなどマスコミ。
・
朝日テレビの「宇宙船地球号」収録内諾。NHKの「熱中人」に売
り込み中。

5)この企画の視点: 2030年での奥能登の人口急減。
農林漁業振興だけでは過疎化の
問題を適切に解決できないので、
第2次・第3次産業側からの接近
が必要ではないか。
金沢
蛸島
七尾
穴水
能登鉄道営業路線 廃線跡
七尾
穴水
のと鉄道廃線2005年
旧蛸島駅


短期的資金計画
蒸気機関車と改造客車の購入交渉と陸送・輸入契約と海上輸送と保険の契約をし、(c)
日本で21年夏に陸送と実走を行い、(d)持続的企画として収支計画などを確実化する。
研 究 経 費 の 内 訳
平成20年度小計(21年度分も含む) 850万円 予定経費小計 850万円
県補助金 300万円
トロッコ蒸気機関車購入費 1台 辻井個人 200万円
改造客車購入費 1台 50万円 協力NPO 200万円
機関車・客車各1台海送費 50万円 有志者出資 100万円
機関車・客車各1台日本陸送費 100万円 募金 50万円
機関車・客車各1台ジャワ陸送費 20万円
項
科 目 金 額 経費の準備状況(見通し)
500万円
ジャワ調査・交渉・契約旅費(2人x1週間) 40万円

Regional revaitalization through kiriko festivals and many vacant old houses

Thank you.
Related Documents


