December 25, 2021 1 Statistical Models of Human Response Times For Task Modeling in HCI by Maria Vicente Bonto-Kane North Carolina State University North Carolina State University September 14, 2009 http://www.marivicbontokane.com/research/mbontokaneDefense2009.ppt Robert St. Amant (Adviser)

November 21, 2015 1 Statistical Models of Human Response Times For Task Modeling in HCI by Maria Vicente Bonto-Kane North Carolina State University September.
Jan 14, 2016
Welcome message from author
This document is posted to help you gain knowledge. Please leave a comment to let me know what you think about it! Share it to your friends and learn new things together.
Transcript

April 21, 2023 1
Statistical Models of Human Response Times
For Task Modeling in HCIby
Maria Vicente Bonto-Kane
North Carolina State UniversityNorth Carolina State University
September 14, 2009
http://www.marivicbontokane.com/research/mbontokaneDefense2009.ppt
Robert St. Amant (Adviser)

April 21, 2023 2
Human-Machine Interfaces (HMI)

April 21, 2023 3
Usability (Definition)“Usability refers to the efficiency, comfort, safety, and satisfaction with which a wide range of people and under a variety of conditions perform their tasks with a product (i.e., a good or a service). It is much more than a measure of how easily a thing can be used… it encompasses all aspects of the product and its use, including the hardware and software interfaces, the documentation, the packaging and the services associated with the product.” -- Linux Information Project
Markers for Usability (Shneiderman, 1987) Efficiency Learnability Memorability Errors Satisfaction

April 21, 2023 4
Usability“Usability is the extent to which a product can be used by specified users to achieve specified goals with effectiveness, efficiency, and satisfaction, in a specified context of use.” --ISO 9241-11: Guidance on Usability (1998)
Design standards written for 3 main categories:Product usage characteristics
ISO 9241-11(1998) Guidance on UsabilityISO/IEC DTR 9126-4 (2001)
Product interface attributesISO/IEC FDIS 9126-1 (2000)ISO 9241-9 (2000)
Product development processISO 9241-17 (1998)ISO DTR16982 (2001)
http://www.usabilitypartners.se/usability/standards.shtml

April 21, 2023 5
Current Methods Task Analysis
Detailed description of tasks (blueprint) Hierarchical layout of tasks and subtasks
Live User Testing Users perform tasks on software application Often done in a laboratory environment Observations and evaluation done by skilled professionals
Task Modeling Approaches GOMS Modeling Techniques Fitts’s Law Predictions Give estimates for task difficulty and task duration

April 21, 2023 6
Task Analysis
1.1.9.1Facilitate plate labeling and reading
1.1.9.2Facilitate sample plate preparation (serial dilution test compounds)
1.1.9.3Facilitate test plate preparation
1.1.9.4Facilitate test plate incubation
1.1.9.5Facilitate raw data collection
1.1.9Develop program for assay method using HTS line control software (e.g., Beckman-Coulter SAMI)
Determine functions of device to be used during assay.
identify stock solution (deep-well) plates to be used as resources, sample plates to be used as transports, and tip types and other resources.
Integrate bar coder and reader into method.
Integrate pipeting device into HTS line control (SAMI) method – Link pipetting device to other devices to be used in automated process (e.g., Bioworks).
Integrate incubator into method.
Integrate plate reader into method.
Reference plate reader method from Plate reader software (e.g., Flustart software).
Source: Entzian, K. and Kaber, D (2004). “Goal Directed Task Analysis of High Throughput Molecular Compound Screening”

April 21, 2023 7
Live User Testing
Observations1. Did user accomplish the task? How long did it take?2. What types of errors were made?3. Did the user express any questions, suggestions while doing the
task?4. Did user recognize the icons for their functions?5. Was the Help documentation useful?

April 21, 2023 8
GOMS Model ScriptSelection_rules_for_goal: Enter Assay_Instructions
If <next_step> of <current_task> is_equal_to "PipetteTransfer", Then Accomplish_goal: Choose Pipette_Transfer.
If <next_step> of <current_task> is_equal_to “TipChange", Then Accomplish_goal: Choose Tip_Change.
.
.
.
Return_with_goal_accomplished.
Method_for_goal: Choose Pipette_TransferStep 10. Point_to Pipette_Transfer_PB.Step 20. Click Pipette_Transfer_PB.Step 30. Accomplish_goal: Enter Pipette_Transfer_Parameters
Step 40. Return_with_goal_accomplished.
Method_for_goal: Choose Tip_ChangeStep 10. Point_to Tip_Change_PB.Step 20. Click Tip_Change_PB.Step 30. Accomplish_goal: Enter Tip_Change_Parameters
Step 40. Return_with_goal_accomplished.
GOMS Operators Mean Time (ms)
Point to 1100Click 200Keypress 280

April 21, 2023 9
Limitations of GOMS Approaches Use of point estimates
Not an exact measure But GOMS estimates useful for making decisions
No statistical foundation for its metrics Range? Mean? Standard Deviation? What is the statistical/probability distribution?
Assumes independence of operators A keypress is a keypress regardless of task context Priming? Interference ? in sequences of operators?
Goals and Methods equally probable All goals equally probable All methods equally probable

April 21, 2023 10
Research Goals Initial research goal:
Consider usage patterns for device Design of interface optimized around most probable
patterns of use Current research goals:
Examine characteristics in the execution of task operators
Derive a statistical model distribution of response time (RT) data for some task operators
Examine GOMS assumption of independence among task operators
Provide novel directions for task modeling using statistical modeling of RT data (distributional analysis)

April 21, 2023 11/32
Life Sciences ApplicationHigh Throughput Screening (HTS) environment

April 21, 2023 12/32
Usage Patterns
Published assay procedures from Promega® website

April 21, 2023 13
Usage Patterns
Reset Cursor
Mix
Pipette Transfer
Aspirate
Bulk Dispense
Serial Transfer
Purge Tool
Wash Button
HighDensity Replicate
Next Labware
Plate Read
Set Shelf
End Loop
User Function
Insert BioScript
Clear Marks
Comment
Shift Stack
System Pause
Tip Change
Reset Tip
Pause Labware
Send to Device
Device Control
Begin Loop
Wait for Device
Gripper Move

April 21, 2023 14
Measure of Task Difficulty
W
DbaMT
2log2
Fitts’s LawWhere,
D = Displacement from source to targetW = Width of target areaa and b are constants representing intercept and slope respectivelya = 50msec b = 300msec (one user and mouse) (Raskin, 2000 “The Humane Interface”)
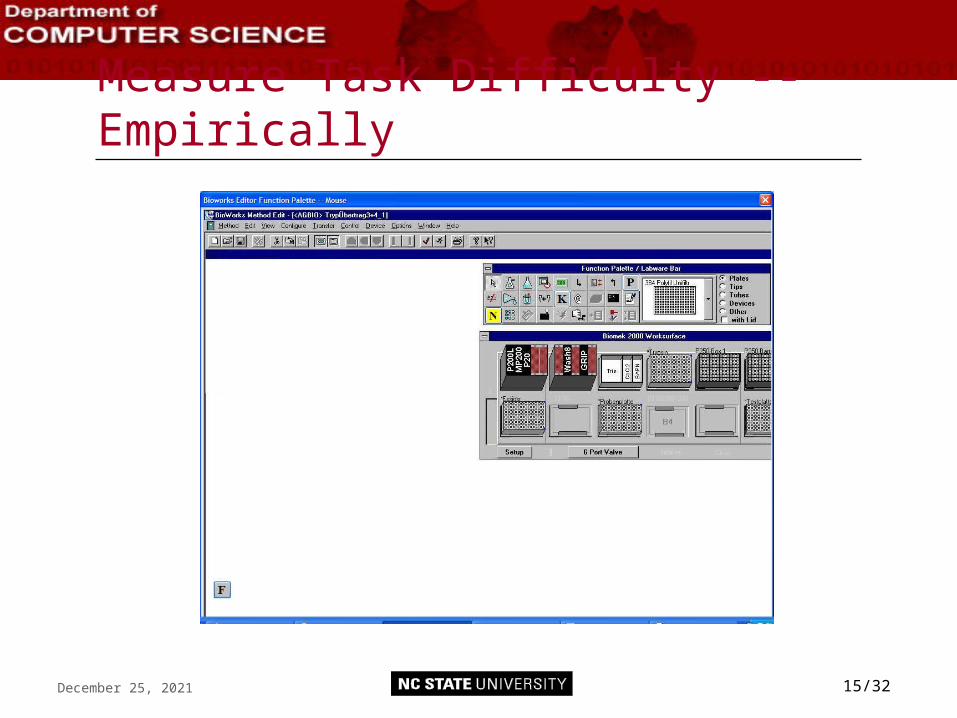
April 21, 2023 15/32
Measure Task Difficulty -- Empirically

Experiment 1 – Mouse Mediated
April 21, 2023 16
2 x 3 x 2 within subjects design Independent variables:
Random vs. Predictable targets 3 target locations on the toolbar 2 batches of trials
Dependent variable: Reaction Time (speed and accuracy)
Subjects 41 Computer Science students 41 x 2 x 180 trials (14760 data points)
Materials: Screen displays Software Engineering lab (same configured machines)

Experiment 1 - Results
April 21, 2023 17
ANOVA showed significant results for icon location, random vs. predictable targets, practice effects, and subjects

April 21, 2023 18
Distributional Analysis
Means and other measures of central tendency do not give the complete picture (important to know shape and scale of the distribution)
Important to determine critical boundaries in performance Important to estimate percentage of user groups that can be
expected to perform at a certain level

Experiment 1 – Distributional Analysis
April 21, 2023 19

April 21, 2023 20
Experiment 1 – RT Data Distribution

Experiment 1 – RT Data Distribution
April 21, 2023 21

April 21, 2023 22
Distribution Mean Std Dev Shape Scale Kolmogorov-
Smirnov
Cramer-
von Mises
Normal 942.45 188.06 N/A N/A <0.010 <0.005
Lognormal 941.77 174.52 0.183752 6.830882 <0.010 <0.005
Gamma 942.45 176.30 28.57739 32.9788 <0.001 <0.001
Weibull 926.37 246.02 4.249705 1018.489 N/A <0.010
Experiment 1 – Data Distribution
RT data appears to be a skewed distribution Goodness-of-fit tests on the aggregate data rejected normal,
lognormal, weibull, and gamma Analyses showed lower Mean Square Error for lognormal and
gamma But, goodness-of-fit tests on individual subjects show preference
for lognormal and gamma models
Statistical Distribution Mean Squared Error
Normal 3710.97
Gamma 2307.201
Lognormal 1790.71

Experiment 1 – Subject Distribution
April 21, 2023 23

Experiment 1 - Results
April 21, 2023 24
Analysis using 98% IQR of the data produced the same results Non-parametric tests (Kruskal-Wallis and Wilcoxon Rank Sum)
support results of parametric analyses and also yielded additional results

April 21, 2023 25
Experiment 1 - Summary Significant differences in RT as a result of:
icon location random vs. predictable targets practice effects individual differences
RT data is a skewed distribution RT data appears to have a lognormal or gamma
distribution Use of non-parametric statistics supports and
also yields additional findings to parametric results

Experiment 1 – Normal Distribution
April 21, 2023 26

April 21, 2023 27
Experiment 1 – Lognormal Distribution

April 21, 2023 28
Experiment 1 – Gamma Distribution

April 21, 2023 29
Advantages of a Model DistributionConsider Icon 1 GOMS Law prediction: Mpoint (1100msec) + Mclick (300msec) = 1400msec
Fitts’s Law prediction:
Icon 1 MT = 1229 msec
Lognormal parameters Shape = 0.18 Scale = 6.83 About 44.42%, 1SD < 1229msec, about 60.58%, 2SDs < 1229msec
Gamma parameters Shape = 28.58 Scale = 32.98 About 42.54%, 1SD < 1229msec, about 58.77%, 2SDs < 1229 msec
W
DbaMT
2log2

April 21, 2023 30
Distributional Analysis
Gaussian distribution is symmetric 34% of data 1SD to left of Mean, also 34% 1SD right of Mean Useful in predicting where subjects will perform

April 21, 2023 31
Experiment 1 – Lognormal Distribution

April 21, 2023 32
Experiment 1 – Gamma Distribution

April 21, 2023 33
Experiment 1 - Implications Response time data is asymmetric and not a normally
distributed variable Contrasts with widely held assumptions in the HCI and
Behavioral Sciences literature Conclusions derived using parametric statistics are
limited Need to augment with non-parametric methods of
analyses Distributional analyses of RT data:
Avoids the problem of misrepresenting central tendency Understand dynamics behind the execution of a behavioral
responses (important for some models of GOMS) Enables one to make better predictions of user performance

April 21, 2023 34
Experiment 1 - Implications Independent work by a few researchers documenting
RT data is a skewed distribution (Heathcote 1991, van Zandt 2000, 2001)
Rest of the Behavioral Sciences community has not caught on
Support for an ex-Gaussian model, the convolution of exponential and Gaussian models
The use of Ex-Gaussian remains contentious since it is an atheoretic model

Experiment 2 – Keyboard Mediated
April 21, 2023 35
2 x 3 x 2 within subjects design Independent variables:
Random vs. Predictable targets 3 target locations on the toolbar 2 batches of trials
Dependent variable: Reaction Time (speed and accuracy)
Subjects 41 Computer Science students 41 x 2 x 180 trials (14760 data points)
Materials: Screen displays Software Engineering lab (same configured machines)

Experiment 2 - Results
April 21, 2023 36
ANOVA showed main effects of icon location, random vs. predictable targets, batch, and subjects
Analysis on 98% interquartile range produced the same results Non-parametric tests (Kruskal-Wallis and Wilcoxon Rank Sum) replicated
results and yielded additional new results

April 21, 2023 37
Experiment 2 – Data Distribution
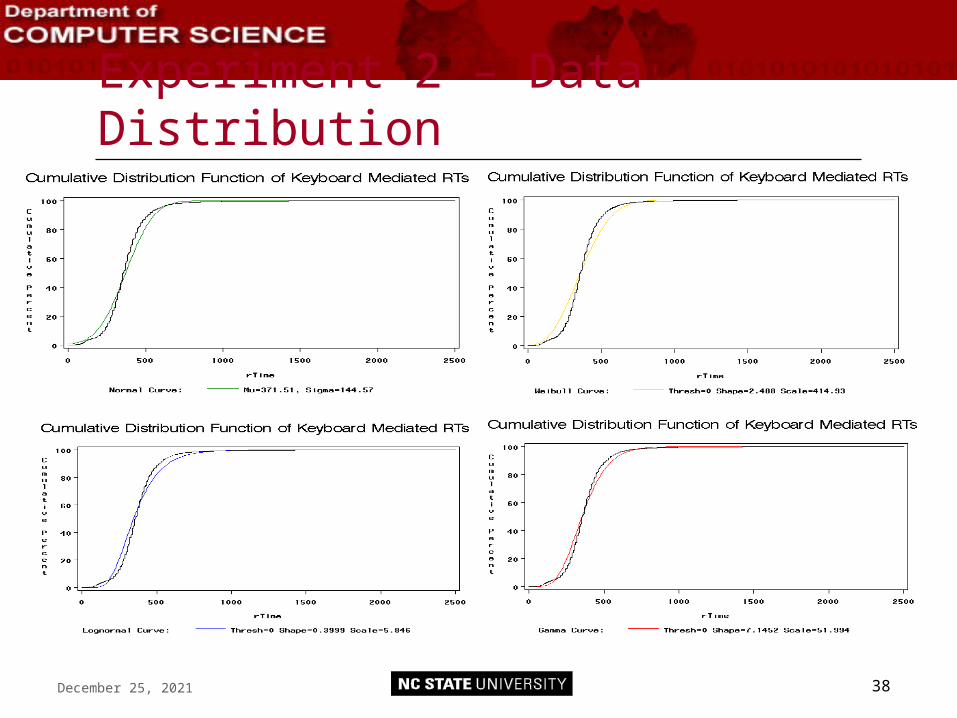
Experiment 2 – Data Distribution
April 21, 2023 38

April 21, 2023 39
Experiment 2 – Data Distribution
RT data for keyboard also appears to be a skewed distribution Goodness-of-fit tests on the aggregate data rejected normal,
lognormal, weibull, and gamma Analyses showed lower MSE error for lognormal But 80% of subject data showed preference for lognormal
distribution
Distribution Mean Std Dev Shape Scale Kolmogorov-
Smirnov
Cramer-
von Mises
Normal371.43 144.66
N/A N/A <0.010 <0.005
Lognormal 374.62 155.99 0.399874 5.845966 <0.010 <0.005
Gamma 371.51 138.98 7.14 51.99 <0.001 <0.001
Weibull 368.11 158.20 2.49 414.93 N/A <0.010
Statistical Distribution Mean Squared Error
Normal 3515.36
Gamma 2237.24
Lognormal 1860.45

Experiment 2 – Subject Distribution
April 21, 2023 40

April 21, 2023 41
Experiment 2 – Summary RT data once again appears to be a skewed
distribution Keyboard responses were faster than mouse Goodness-of-fit tests on the aggregate data
rejected normal, lognormal, weibull or gamma Lognormal was a better fit for individual data than
gamma Different dynamics involved in keyboard
mediated vs. mouse mediated responses

April 21, 2023 42
Research Goals Current research goals:
Examine characteristics in the execution of task operators
Derive a statistical model distribution of response time (RT) data for some task operators
Examine GOMS assumption of independence among task operators
Compare performance on successive execution of similar vs. dissimilar operators
Compare successive performance on similar vs. dissimilar controls Compare total task time using mouse alone vs. mixed keyboard and
mouse vs. keyboard alone responses
Provide novel directions for task modeling using distributional analyses of RT data

Experiments 3-4-5 Design
April 21, 2023 43
11 x 2 within subjects design: 11 control objects 2 batches of trials
Subjects 41 Computer Science students 11 x 25 x 2 trials (22500 data points)
Materials: Screen displays Software Engineering lab (identically configured machines)

Experiment 3 - Results
April 21, 2023 44

Experiment 3 – RT Distribution
April 21, 2023 45
Dialogue Box Mouse Mediated By Control
0
100
200
300
400
500
600
700
200
400
600
800
1000
1200
1400
1600
1800
2000
2200
2400
2600
2800
3000
3200
3400
3600
3800
1020
0
Response Time (msec)
Fre
qu
nec
y C
ou
nt
Control1
Control2
Control3
Control4
Control5
Control6
Control7
Control8
Control9
Control10
Control11

Experiment 3 – Subject Distribution
April 21, 2023 46

April 21, 2023 47
Experiment 4 - Results

Experiment 5 - Results
April 21, 2023 48

Experiments 3-4-5 – Overall Results
April 21, 2023 49

Experiments 3-4-5 Results
April 21, 2023 50

April 21, 2023 51
Composite Means, Variances, and Distributions GOMS method of predicting total task
completion time is to sum up individual point estimates,
Ka + Kb + Kc = Total Task Time
Is this a valid estimate? Yes. The sum of the means is equivalent to the mean of
the sums The total variance is the sum of each operator’s
variance plus a correction factor The standard deviation is the square root of the
combined variance

Composite Means, Variances, and Distributions
April 21, 2023 52
Control2 Control3 Control4 Sum
342 295 342 979
279 1762 264 2305
279 248 388 915
279 342 264 885
295 326 1060 1681
279 280 280 839
451 2386 669 3506
279 310 311 900
279 295 295 869
295 264 264 823
264 327 1200 1791
295 342 295 932
264 296 280 840
295 311 310 916
295 295 295 885
451 295 295 1041
373 716 436 1525
607 357 295 1259
405 310 326 1041
311 311 327 949
358 342 342 1042
310 1122 311 1743
295 373 279 947
358 326 279 963
389 310 264 963
333.08 501.64 386.84 1221.56 Mean 1221.56 Mean
6286.243 264255.1 57239.06 327780.4 Variance 371213.3 Variance
32778Correction Factor 10% of Variance 609.2727 Std Dev
360558.4 Sum
600.4651 Square Root

April 21, 2023 53
Composite Means, Variances, and Distributions
Estimated Total Task Time: (Expt. 3, Batch 1, Trial 20)
Across subjects Mean of Sums = 6218.12 Variance = 673101.86 Std Dev = 820.34
Across controls Sum of Means = 6218.12 Variance = 513513.68 (correction factor of 24%)
Mean of Sums = Sum of Means Variance of Sums = Sum of Variances + CF(correction factor)
Standard Deviation = sqrt of Combined Variance

April 21, 2023 54
Composite Means, Variances, and Distributions What is the model distribution for the sum of a
sequence of operators?
Kalognormal + Kblognormal + Kclognormal = Total Task Time
What is the model distribution for a sum of lognormal variables? Sums of lognormals is a lognormally distributed variable
– Dufresne (2009) What is the model distribution for a sum of
gamma variables? Sums of gamma variables is gamma as long as they
have the same parameters --Bergstrom

April 21, 2023 55
Composite Means, Variances, and Distributions
Sum of lognormals is a lognormally distributed variable – Dufresne (2009)
Given two random lognormal variates L1 and L2, the distribution of their sum is the convolution of their integrals and the outcome is lognormal.
222
1
21
log2
1
0212
lwew
LL elwl
dlwf

April 21, 2023 56
Composite Means, Variances, and Distributions
What is the model distribution for a sum of gamma variables?
Sums of gamma variables is gamma as long as they have the same parameters –Bergstrom
Proof by induction: Variates from the same gamma distribution, added together
generate the same distribution Equation for convolution of gamma variates
dybe
aeyzdyyfyzfzf ybb
zyzaa
Y
z
xYX
11 1
0
1
0

Composite Means, Variances, and Distributions
April 21, 2023 57

April 21, 2023 58
Composite Means, Variances, and Distributions
Subject 7 Total Task Time: (Batch 1, all trials) Across trials:
Mean of Sums = 7210.32 Variance = 503826.14 Std Dev = 709.81
Across controls Sum of Means = 7210.32 Variance = 503935.65 (correction factor of 40%)
Mean of Sums = Sum of Means Variance of Sums = Sum of Variance of each Mean +
correction factor Std Dev = square root of Variance

April 21, 2023 59
Composite Means, Variances, and Distributions
Subject 7: Mean: 7210.32 Standard Deviation: 709.81
Sum of lognormals is lognormal Meanlognormal: 7211.89
Standard Deviationlognormal: 715.45
Scalelognormal: 8.878589
Shapelognormal: 0.098962 Goodness of Fit Tests:
Kolmogorov-Smirnov: D=0.10 p > 0.15 Carmer-von Mises: W-Sq=0.04 p > 0.50
lTotalRTCCCCCCCCCCClllllllllll 1110987654321

April 21, 2023 60
Experiments 3-4-5 – Summary Facilitation and interference effects depending on
context task variables: Sequences of similar operators (reduction in RT by 50%) Mixed sequences of operators elevates RTs Distances accessing screen controls affects RTs
Keyboard responses generally faster Difference of 10-15 msec significant for both
keyboard and mouse RTs Total task completion times can be derived using
composite means and variances

April 21, 2023 61
Experiments 3-4-5 – Summary Verified GOMS approach of computing total
task times from task operators: Composite Means:
Mean of Sums = Sum of Means Composite Variances:
Variance of Sums = Sum of Variances + CF Standard deviation = square root of Variance
Composite distribution: Sum of lognormal variates is lognormal Sum of gamma variates is gamma provided the
variates have the same gamma parameters

April 21, 2023 62
Summary of Overall Findings Distances among control objects affect RT RT data is a skewed distribution favoring
lognormal or gamma distributions Distributional analyses of RT data help make
better predictions for task performance Observations question GOMS assumption of
independence of operators Observations support the approach of using
composite means, variances, and distributions Distributional model analysis provides novel
directions for task modeling approaches

April 21, 2023 63
Value of RT Distributional Analysis
Identifying and using correct model distribution helps with: Performance prediction Performance analysis Performance improvement (usability - task efficiency)
Statistical distributional models enhance task modeling techniques Consider embedding in GOMS techniques (e.g., NGOMSL)

April 21, 2023 64
Thank You!

April 21, 2023 65
Contact Information Name: Maria Vicente Bonto-Kane Email: [email protected] Education:
PhD candidate Computer Science (NCSU) MS Computer Science (SUNY-Binghamton) MA Experimental Psychology (SUNY-Binghamton)
URL for presentation http://www.marivicbontokane.com/research/mbontokaneOrals2008.ppt
Some publications:Pervasive 2007: It’s About the User by Maria Vicente A. Bonto-Kane, Alvin Chin, Sheila McCarthy, Mayuree Srikulwong, and Paul J. Timmins
IEEE Pervasive Computing, Vol. 6, No. 4, pp 95-97. (October-December, 2007)
Examination of Variance in Production of Task Operators Questions GOMS Ability for a Quick Semi-Automated Usability Assessment of User Interfacesby Maria Vicente A. Bonto-Kane and Robert St. Amant, Grace Hopper Conference 2008
Use of Markov Models for Designing Intelligent Mobile Device Interfaces by Maria Vicente A. Bonto-Kane, Doctoral Colloquium, Pervasive Computing 2007 (Toronto, Canada)
Related Documents