by Kristian Niemietz November 2010 The Instute of Economic Affairs, 2 Lord North Street, London, SW1P 3LB; Tel 020 7799 8900; email [email protected] Transforming welfare - incentives, localisation and non-discrimination IEA Discussion Paper No. 32

Welcome message from author
This document is posted to help you gain knowledge. Please leave a comment to let me know what you think about it! Share it to your friends and learn new things together.
Transcript
by
Kristian Niemietz
November 2010
The Institute of Economic Affairs, 2 Lord North Street, London, SW1P 3LB; Tel 020 7799 8900; email [email protected]
Transforming welfare -incentives, localisation and non-discrimination
IEA Discussion Paper No. 32

About the author
Kristian Niemietz is the Institute of Economic Affairs’ Poverty Research Fellow
IEA web publications are designed to promote discussion on economic issues and the role of markets in solving economic and social problems. Copyright remains with the author. If you would like to contact the author, in the first instance please contact [email protected]. As with all IEA publications, the views expressed in IEA web publications are those of the author and not those of the Institute (which has no corporate view), its managing trustees, Academic Advisory Council or senior staff.
Institute of Economic Affairs2 Lord North StreetLondonSW1P 3LB
www.iea.org.uk
2

Contents
Executive Summary 4
7
10
Introduction
A snapshot of welfare in the UK
3
Curtailing middle-class benefits 14
17Draining the fiscal illusions swamp
Flat-rate housing benefits 20
23Old-age and disability provision
Full-time work requirements 25
27Conclusion
References 31

Executive Summary
The UK spends more on welfare benefits than most of Continental Europe, and even more than some Scandinavian countries, but the outcomes are poor. Indeed, The British welfare state often combines the worst features of different models:
Income replacement in times of need is not particularly generous – but its effect is • ‘sticky’ nevertheless - discouraging re-entry into the workforce. Transfer payments are poorly targeted – but benefit withdrawal rates associated with • targeting nevertheless discourage progress in the labour market. Withdrawal rates are often high and sometimes excessive, acting effectively like a • second income tax on the labour market’s weakest participants. The contributory principle in welfare has been largely eroded – but the typical side-ef-• fect of contribution-based systems, the crowding out of individual savings and private insurance, remains.
Key aims
The proposals outlined in this paper therefore aim to:
improve incentives to enter the labour market;• improve incentives to progress within the labour market;• make the tax and benefit system more transparent;• end discrimination against particular family types within the benefit system;• restore the contributory principle to old-age and disability provision; and• control runaway spending.•
These objectives can be achieved by a series of specific reforms to the welfare system, the most important of which are summarised below.
Breaking the Housing Benefit trap
The cost explosion in the Housing Benefit (HB) system and the weak incentives to enter the labour market have a common root. HB closely follows local rent levels, so that recipients do not benefit from relocating to less expensive areas. As a result, HB recipients tend to be concentrated in high-rent areas, where they find it especially difficult to replace HB with earned income.
This paper proposes to standardise HB rates, so that recipients begin to make trade-offs between housing and other goods in the same way as low-earners. This offers the potential to cut HB expen-diture substantially and improve the relative pay-off from moving into employment.
Replacing tax credits with a Negative Income Tax
To restore transparency, tax liability and benefit entitlement should be separated, so that every household is either a tax payer or a transfer recipient, but not both simultaneously. Tax-free allow-ances should be raised substantially to improve work incentives, while a simple Negative Income Tax (NIT) should replace all transfers that can be received while in work, such as tax credits.
4

Curtailing middle-class benefits
‘Middle-class’ benefits should be severely curtailed – but not simply by raising withdrawal rates, since this would penalise efforts to progress in the labour market, almost certainly entailing adverse dynamic effects. Access to benefits should be restricted in ways that ‘crowd in’, rather than crowd out work effort, by making work the very condition of entitlement. In particular, the NIT should be contingent on full-time employment, limiting receipt to low earners who do their best to improve their own situation. The rationale is simple: topping up the incomes of low-paid full-time workers is much cheaper than replacing the pay of several workdays. Therefore, the maximum claimable sum can be lower to begin with, which makes a low withdrawal rate possible without the NIT degenerating into a middle-class benefit. This is the key to addressing the poverty trap.
Introducing a ‘workfare’ system
The minimum number of working hours required to qualify for in-work benefits should be raised, but this must not be pursued in isolation. If so, it would only push many tax credit recipients from part-time employment into worklessness. A necessary companion reform is the attachment of work requirements to the receipt of out-of-work benefits, following the model tested in the US state of Wis-consin. Under this ‘workfare’ system, the daily life of benefit recipients is not that different from the daily life of their working peers, which would both remove the stigma from recipients, and encourage them to look for full-time employment in the regular labour market straight away.
Abolishing winter fuel payments and free bus passes
Special age-contingent benefits, cash and kind, should be merged into one single payment. The level of assistance payment is either sufficiently high to cover the cost of items like winter fuel, bus travel, eye tests etc, or it is not. If the former, top-up benefits for special purposes are unnecessary; if the latter, the most obvious solution is to raise the level of the assistance payment itself. In neither case is there a convincing rationale for adding layer upon layer of additional transfers.
Freeing labour and housing markets
Welfare reform would be much more effective if accompanied by a liberalisation of the labour market and the land-use planning system. This would enable an increase in the demand for labour, and make housing easily affordable at every point of the income distribution.
The most radical reforms since Beveridge?
On 11th November, 2011, the government announced welfare reforms which move somewhat in the direction of the approach suggested here. However, there are important distinctions between what is proposed here and the coalition’s proposals. The coalition’s proposals may lead to some im-provement but they are not as radical as is being suggested. The following points distinguish these proposals:
A formal negative income tax with lower withdrawal rates than the coalition proposes • (The White Paper expects that Universal Credit will be withdrawn at a constant rate of around 65 pence for each pound of net earnings (DWP, 2010b, p. 13)). Removal of middle class benefits in such a way that the middle classes do not see •
5

reductions in net incomes because of the complementary tax reductions.These proposals substantially remove the discrimination against couples within the • tax and benefits system: this measure alone can be expected to have substantial dy-namic effects. Continuing work requirements for those who are not in full-time work but who are • claiming benefits which would be administered at local level with appropriate financial responsibility being delegated.A radical reform of housing benefit.•
6

In 2006, the UK’s net expenditure on social protection benefits amounted to 25% of GDP (Eurostat, 2009). This is not just a remarkable share by domestic historical standards. It also contradicts a com-mon international classification, which counts the UK among the so-called ‘basic security welfare states’, as opposed to the – supposedly much more encompassing – Scandinavian and continental welfare regimes (British Social Attitudes Survey, 2010). Yet as far as aggregate social spending is concerned, the UK now belongs to the European Economic Area’s top group.
7
Introduction
% of GDP>25% Austria, Belgium, France, Germany, Sweden, UK20-25% Denmark, Finland, Italy, Netherlands, Norway15-20% Iceland, Ireland, Luxembourg, Spain
Table 1: Net government spending on social transfer benefits (% of GDP) in selected EEA countries
Data from Eurostat (2009)
The sheer largesse of transfer spending makes this area an obvious target for major cuts. On the other hand, this very largesse is also the reason why any government will tread very carefully in this area. It may, at first sight, seem counterintuitive that spending on social transfers is so much higher today than half a century ago given that real incomes of the bottom deciles have almost doubled since then (based on IFS data, 2010). But welfare has long ceased to be a ‘safety net’, in the sense of a last-resort provider of temporary assistance in exceptional situations.
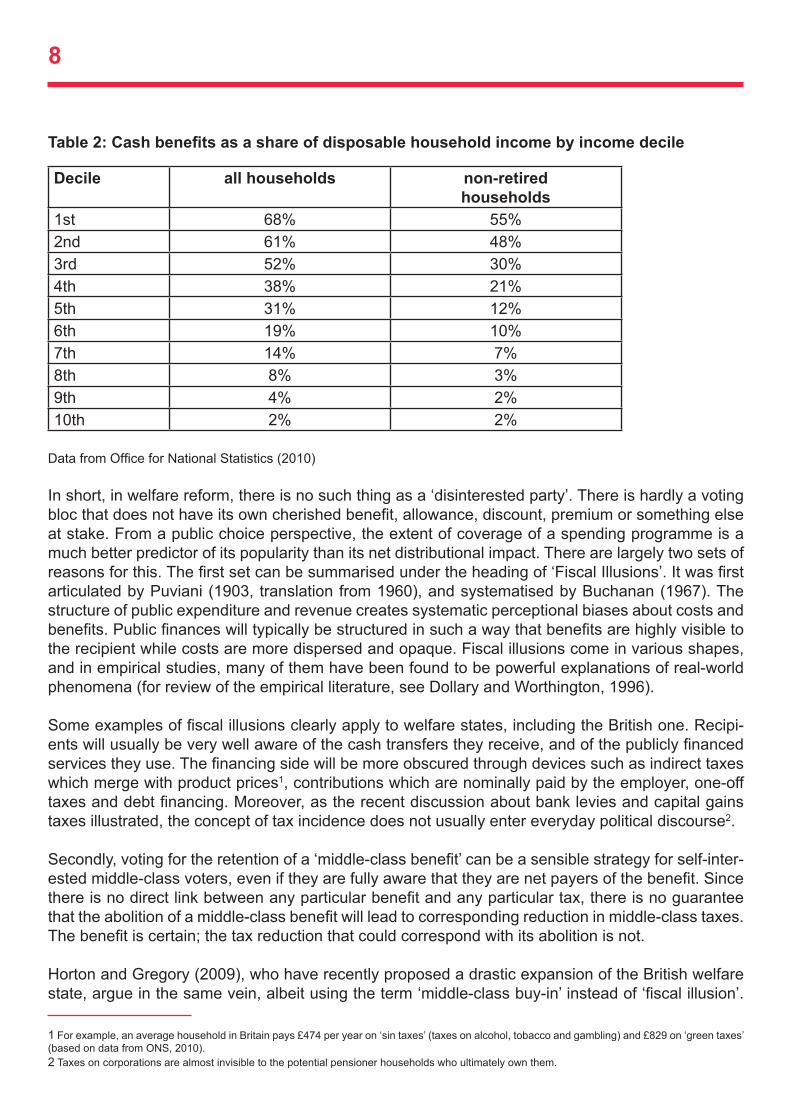
Instead, as Table 2 shows, government transfers have become a regular income source for people at just about every point of the income distribution. Indeed, it has become almost impossible not to be a transfer recipient at some stage in life. For the bottom third of the population, the state has already become the main financial provider. But transfers are by no means limited to those with the lowest earnings. They continue to represent a sizeable component of household income until far up the income distribution, and this is not simply explained by a rising old-age dependency ratio.
It should be noted that the figures in Table 2 hugely understate the role of government welfare provi-sion in most people’s economic lives. Firstly, they only include transfers paid out in cash, ignoring the value of services provided for free or at highly subsidised rates (such as education and health): arguably, these constitute the largest component of most modern welfare states. Secondly, ONS figures rely on large-scale surveys, and it is well-known that benefits are significantly underreported in survey responses. For example, grossing up the ONS’ figures for Housing Benefit, it would appear that UK households have received £13.1bn in Housing Benefit in total. However, judging from DWP data, around £18.7bn must have been paid out during 2009 (DWP and ONS, 2010).
In short, in welfare reform, there is no such thing as a ‘disinterested party’. There is hardly a voting bloc that does not have its own cherished benefit, allowance, discount, premium or something else at stake. From a public choice perspective, the extent of coverage of a spending programme is a much better predictor of its popularity than its net distributional impact. There are largely two sets of reasons for this. The first set can be summarised under the heading of ‘Fiscal Illusions’. It was first articulated by Puviani (1903, translation from 1960), and systematised by Buchanan (1967). The structure of public expenditure and revenue creates systematic perceptional biases about costs and benefits. Public finances will typically be structured in such a way that benefits are highly visible to the recipient while costs are more dispersed and opaque. Fiscal illusions come in various shapes, and in empirical studies, many of them have been found to be powerful explanations of real-world phenomena (for review of the empirical literature, see Dollary and Worthington, 1996).
Some examples of fiscal illusions clearly apply to welfare states, including the British one. Recipi-ents will usually be very well aware of the cash transfers they receive, and of the publicly financed services they use. The financing side will be more obscured through devices such as indirect taxes which merge with product prices1, contributions which are nominally paid by the employer, one-off taxes and debt financing. Moreover, as the recent discussion about bank levies and capital gains taxes illustrated, the concept of tax incidence does not usually enter everyday political discourse2.
Secondly, voting for the retention of a ‘middle-class benefit’ can be a sensible strategy for self-inter-ested middle-class voters, even if they are fully aware that they are net payers of the benefit. Since there is no direct link between any particular benefit and any particular tax, there is no guarantee that the abolition of a middle-class benefit will lead to corresponding reduction in middle-class taxes. The benefit is certain; the tax reduction that could correspond with its abolition is not.
Horton and Gregory (2009), who have recently proposed a drastic expansion of the British welfare state, argue in the same vein, albeit using the term ‘middle-class buy-in’ instead of ‘fiscal illusion’.
8
Decile all households non-retired households
1st 68% 55%2nd 61% 48%3rd 52% 30%4th 38% 21%5th 31% 12%6th 19% 10%7th 14% 7%8th 8% 3%9th 4% 2%10th 2% 2%
Table 2: Cash benefits as a share of disposable household income by income decile
Data from Office for National Statistics (2010)
1 For example, an average household in Britain pays £474 per year on ‘sin taxes’ (taxes on alcohol, tobacco and gambling) and £829 on ‘green taxes’ (based on data from ONS, 2010).2 Taxes on corporations are almost invisible to the potential pensioner households who ultimately own them.

They examine public support for expansions of different types of welfare spending, and find that, with some exceptions, there is a direct relationship between coverage and popularity. Increasing spending on universal or near-universal programmes (e.g. child benefit) is always popular; increas-ing spending on tightly targeted benefits (e.g. social housing) is not. They thus propose to move away from targeting and extend the coverage of benefits in cash and kind to wide segments of society, because ‘while narrowly targeted policies will fail to draw on the strength of middle-class political pressure to defend welfare, policies with wider coverage actively recruit the sharp elbows of the middle class’ (p. 85).
This article agrees with Horton and Gregory’s analysis of the expansionary effect of middle-class buy-in. But it argues for the precise opposite: i.e. it argues for a reduction of the amount of fiscal il-lusion in the welfare system, in order to enable a pronounced and lasting contraction of the welfare state’s remit. Given that welfare spending is 25% of national income, one wonders where the growth
9

in spending would stop if fiscal illusion were increased. There would be a strong case for a wholesale reform of welfare provision in the UK even if explicit and implicit debt ratios were zero and the budget balanced. Welfare in the UK is not simply ‘too ex-pensive’. In terms of the conventional trade-offs faced in the design of welfare regimes, it turns out that the UK often finds itself in the worst of both worlds. Income replacement versus work incentives
The most widely discussed trade-off in welfare policy is between the aims of providing income re-placement in emergency situations, and of preserving incentives to re-enter the labour market. With standard rates of £65.45 per week, the two main income replacement tools – Income Support (IS) and Jobseeker’s Allowance (JSA) – are not particularly generous. Nevertheless, for those outside the labour market, financial incentives to re-enter are generally moderate, and very weak for specific groups such as single parents. This is best captured in the replacement ratios: the ratio of benefit income without work to disposable income in a low-paid occupation.
10
A snapshot of welfare in the UK
Replacement ratio range
Share of working adults in this range
≥ 50% 47%≥ 60% 32%≥ 80% 11%
Table 3: Prevalence of high replacement ratios
From Adams et al. (2006)
The indicative data from Table 3 are from before the recession, which has further depressed wages relative to benefits. Incentives to enter the labour market can only have weakened. Since those data were collected, there has also been an expansion of benefits at certain points on the scale which, by the government’s own figures, worsen work incentives.
Controlling spending while minimising disincentives
The targeting of benefits is used instrument to keep welfare spending under control and to have the biggest impact on poverty with a given budget. As we have noted, in the long run, targeting can reduce fiscal illusions that lead to permanent electoral pressure for welfare expansion. For a set of wealthy OECD countries, Korpi and Palme (1998) show that the degree of targeting is inversely related to the size of the welfare budget.
But stringent income targeting comes with a severe side-effect. It requires a steep withdrawal of benefits as the recipient’s income rises, so it effectively acts like a second income tax on transfer recipients who attempt to progress gradually in the labour market. This effect is often discussed in terms of work incentives but it also leads to disincentives to train, obtain promotion and so on. Levying higher implicit marginal tax rates selectively on any population subgroup would be likely to

11
deter that group’s progress in the labour market. But levying higher implicit marginal tax rates on the weakest groups in the labour market is almost a guarantee for creating destructive dynamic effects. Indeed, labour market models show high labour supply elasticities among the low-skilled, and in particular among single mothers (Blundell et al, 1998; Meghir and Phillips, 2008).
This trade-off between limiting coverage and avoiding disincentives at the margin is frequently ig-nored in welfare policies. A case in point is the recent strategy paper by the Department for Work and Pensions (DWP, 2010a), which argues that
‘Reforms could:improve work incentives by reforming the way in which benefits are tapered as incomes rise • and allow people to keep more of their earnings;be fair and targeted to those most in need through tapers which focus payments on those on • the lowest incomes’ (ibid., p. 38).
The first point implies lower implicit marginal tax rates; the second point implies higher ones.
But the trade-off is present. It can be illustrated by a comparison of Jobseeker’s Allowance (JSA) and Child Benefit (CB). JSA is among the most strictly targeted benefits in the UK. Above a small disregard, it is reduced by £1 for every £1 the recipient earns. This makes the circle of recipients much smaller than that of any other benefit: 87% of total spending on JSA goes to people in the bot-tom three deciles. But it also creates an effective marginal tax rate (EMTR) of 100%, at least over a short range of income. To a weaker extent, the same logic applies to Housing Benefit and Tax Credits.
On the other hand, CB is among the least targeted benefits in the UK, having no taper rate at all. CB therefore creates no adverse incentives at the margin. But it is paid out to numerous people who do not need it. 43% of total CB spending goes to people in the upper half of the income distribution. To a weaker extent, the same logic applies to the Family Element of Child Tax Credit. Table 3 illustrates the inverse relationship between the degree of income targeting and implicit marginal tax rates.
Share of total spending going to recipients in the bottom three
deciles
Withdrawal rate
Income-based Jobseeker’s Allowance
87% 100%
Tax credits 61% 39%Housing Benefit 54% 65% of net incomeChild Benefit 36% 0%
Table 4: Targeting versus work disincentives
Means-testing plays an important role in the British welfare state; most types of cash benefits have some kind of taper rate attached to them. But what is characteristic about the present setup is that high EMTRs on disadvantaged groups coexist with poorly targeted transfer spending. Huge sums of money are channelled to middle and higher income groups (Table 2), and at the same time, the median EMTR among single parents is just under 70% (Adam et al, 2006, p. 14).

12
Improving work incentives
The most straightforward way of reducing disincentives against progressing in the labour market is by lowering the rate at which transfers are withdrawn with income. The disadvantage of lower-ing taper rates (ignoring issues of costs and fiscal illusion) is that it increases the number of people who are on a taper. There is a trade-off between levying relatively high EMTRs on a large number of people, and levying extremely high EMTRs on a small number of people. A case in point is the last government’s attempt to bring down excessive EMTRs through measures such as reducing the withdrawal rates of in-work benefits. Between the late 1990s and the early-2000s, there was indeed a 5%-decline in the number of working parents facing EMTRs above 80% (based on data from Brewer and Shephard, 2004). But this action also led to a more than 20% increase in the num-ber of working parents facing EMTRs above 50% (and below 80%). By lowering some taper rates, the ‘Universal Credit’ recently announced by the Department for Work and Pensions (DWP, 2010a) might move the system further in this direction.
What is noteworthy about the present situation is that both ills – relatively high EMTRs on many; very high EMTRs on some – coexist. Estimates from Adam el al (2006) show that about a quarter of working adults face EMTRs above the nominal higher rate of income tax of 40%. At the same time, more than one in ten working adults face EMTRs above 60% (and thus above the top marginal income tax rate of Sweden and Denmark). Occasionally, EMTRs can go above 80% or even 90%, when several benefits are withdrawn at the same time.
EMTR-range Share of working adults in this range
≥ 40% 24%≥ 60% 11%≥ 90% 1%
Table 5: Prevalence of high effective marginal tax rates (EMTRs)
From Adams et al. (2006)
Again, given the increases in some tax rates and benefit withdrawal rates (HM Treasury, 2010), as well as a recession-related increase in the benefit rolls, incentives to progress in the labour market can only have worsened in the meantime.
Contribution versus ‘need’
Another common way to classify welfare regimes, or individual programmes within them, is by their way of assigning whether a recipient qualifies for payments. This can be on the basis of a previous contribution record, or on the basis of ‘need’. Transfer systems serve two purposes: redistribution and risk provisioning. In need-based welfare systems, the former motive dominates, while the latter dominates in contribution-based systems. In other words, need-based systems are dominated by inter-personal redistribution (i.e. from Jones to Smith), while contributory systems are dominated by ‘intra-personal’ redistribution (i.e. from the young/healthy/employed Jones of today to the old/sick/

unemployed Jones of tomorrow). The ratio of intra-personal to inter-personal redistribution in trans-fer spending is roughly 3:1 in Sweden and Denmark and 1:1 in Australia and Ireland (Sørensen and Bovenberg, 2007, pp. 6-9).
The general advantage of contributory or ‘Bismarckian’ welfare states is that they provide a direct link between how much people pay into the common pool and how much they are entitled to take out of it. Therefore, social insurance contributions do not provide the same disincentives as taxes. However, Bismarckian welfare programmes are not intended to complement, but to fully substitute for private provision. They therefore tend to be much larger than need-based systems, and more aggressive in crowding out private savings and private insurance.
On this measure, the UK’s welfare state combines negative features from both regimes – the disin-centive effects of needs-based welfare regimes and the crowding-out effects of Bismarckian ones. In terms of the ratio of intra-personal to inter-personal redistribution spending, the UK is closer to Scandinavian than to so-called ‘Anglo-Saxon’ systems, so the larger part of welfare spending merely replaces functions which could readily be provided by private financial intermediaries. At the same time, the weight of transfer payments which bear a strong relationship to the recipient’s past con-tribution record is very small (see Brewer, 2009). To all intents and purposes, National Insurance contributions are little else but a second income tax.
The flaws in the British welfare state do not just make it excessively costly, but render it dysfunc-tional. It fails those it is supposed to protect. The case for reforming welfare goes far beyond easing fiscal pressures. Perhaps the starkest testimony of this failure is that, after a decade of strong labour market performance up to 2008 together with expensive employment policies, there was little impact on long-term worklessness, underemployment and dependency. While official employment figures looked impressive until summer 2008, economic inactivity in the UK is much more concentrated and entrenched than elsewhere. The UK has a much lower unemployment rate than France and Germany, but the share of workless households (working-age households with no member in gain-ful employment) is about the same in all three countries. Worst of all, more than 16% of all children in the UK – 1.8m – live in a workless household. This is, by a wide margin, the highest share in the EU-27 (Joseph Rowntree Foundation and New Policy Institute, 2007, pp. 52-56).
The group which the present system fails worst are single parents. In most European countries, the share of children living in single parent families is between 5% and 15% (Snowdon, 2010), and employment rates of single parents are between 70% and 80% (Eurostat, 2009a; HM Treasury & DWP, 2010). Countries outside this range fall into two categories: countries where single parent-hood is very prevalent and most of them are employed (Sweden, Denmark), or countries where the employment rate among single parents is low but there are few of them (Belgium). The situation of the UK is exceptional in Europe insofar as it combines one of the highest shares of single parent households, and by far the lowest employment rate amongst them. Almost a quarter of all children live with a single parent, and only 56% of these parents are in some form of employment.
13

Why is it a problem if the state becomes a key breadwinner and service provider for large segments of society? For Horton and Gregory (2009), opposition to widespread state dependency is a merely ‘ideological’ one:
‘If you are a libertarian, then you have a prima facie objection to coercive taxation...and welfare spending. In such a case, even if you accept the ‘humanitarian’ case for welfare, you regard being in receipt of welfare as necessarily an ‘aberrant’ state of affairs – and something to be ‘moved off’ – hence the right’s concept of ‘welfare dependency’. By contrast, because for social democrats public spending and welfare provision are not morally objectionable in their own right, there is no logical contradiction between receiving welfare and being a full and equal member of society’ (ibid., p. 17).
This description does not tell the whole story. From a ‘Hayekian’ classical liberal perspective, the main objection to an omnipresent transfer state is that it crowds out alternative, potentially superior, ways of making provision against risks, and smoothing consumption over the life cycle. As with most goods and services, no single institution can know in advance which way of delivering these things works best, in which setting and for which people.
Removing the state from large areas of welfare provision is not just about ‘cutting benefits’, but about enabling competition at various levels: non-profit versus for-profit organisations; specialised versus integrated providers; small independent providers versus large chains etc. Historically, many of the functions which are performed by the welfare state today have been fully or partially privately provided (Seldon, 1996). But competition is not possible when one provider can rely on coercive funding and deliver ‘free’ services. If a discovery process in welfare provision is to be unleashed, with consumers as sovereigns, then the role of the state is to be diminished to that of a provider of last resort. The most immediate step towards a less state-centric welfare setup is the removal of ‘middle-class benefits’.
Poorly targeted transfers that largely end up in the pockets of reasonably well-off recipients have recently come under renewed scrutiny (see Cawston et al, 2009, for a well-argued case). Since ben-efits to the better-off will not command much public sympathy in the present fiscal situation, there is now a realistic chance to curtail middle-class welfare substantially, even in the face of entrenched vested interests. There are indeed signs that the coalition government is planning to move into this direction.
The ‘Family Element’, a very weakly targeted component of Child Tax Credit, will be tapered away from a lower income level onward. Child Benefit will no longer be paid to households where at least one member pays the higher rate of income tax. On the one hand, the fierce resistance which the latter proposal provoked shows how deeply entrenched middle-class welfare has become. But then again, much of the criticism has focused on the chaotic way in which the idea is put into practice. Under the present proposal, a single-breadwinner household with an income just at the threshold for the higher rate of income tax will lose entitlement to Child Benefit completely. A dual earner house-hold where both members earn just below that threshold will continue to receive the full amount, even though its household income is almost twice as high as in the first example. Also, Child Benefit will not be tapered off, but cancelled at once when the higher rate threshold is crossed, producing problematic work incentive effects in that range.
Curtailing middle-class benefits
14

Still, when avoiding such unnecessary anomalies, it would be a feasible short-term goal to end the payment of non-contributory benefits to households in at least the upper half of the income distri-bution. This would require a readjustment of the transfer system’s parameters so that benefits are tapered off to zero before they reach households on median income.
Table 6 summarises the fiscal cost of non-contributory benefits paid to people in the upper half of the distribution. It provides an absolute lower bound for the fiscal savings that could be achieved in the short term by making transfer spending more focused. This is an approximation with no precise values for parameters such as taper rates and thresholds of an alternative tax and benefit system. It does therefore not include the savings that would be achieved over the range where benefits are gradually withdrawn – it only includes the savings for those from whom benefits are withdrawn to-tally. Table 6 pretends, as it were, that transfers were suddenly ‘capped’ at median income levels3. The estimates also do not include the substantial degree of benefit under-reporting, which cannot be allocated to specific ranges of the income distribution, or the impact on the labour supply of these changes. The latter could only be positive because income and substitution effect would work in the same direction.
Annual amount received by the upper half of the income distribution
Benefits in cashIncome support and pension credit £2.2bnChild benefit £4.7bnIncome-based Jobseeker’s Allowance £0.1bnStudent support £0.4bnNon-contributory incapacity-related benefits (except for severe disability)
£4.3bn
Other non-contributory cash benefits £1.1bnBenefits in kindHousing subsidy £0.2bnRail travel subsidy £1.1bnBus travel subsidy £1.1bnTotal cash & kind £15.2bn
Table 6: Non-contributory transfer payments to people in the upper half of the distribution of equivalised incomes
Based on data from the Office for National Statistics (2010)
Unfortunately, curtailing middle-class benefits is not the “no-brainer” it is sometimes presented to be. Some middle-class benefits have evolved accidentally: they were not launched with the inten-tion of benefiting the middle classes. Tax credits fall into this category. When their taper rates were lowered, the – entirely sensible – motivation was to improve work incentives for low-earners. The transformation of a limited wage subsidy to a middle-class benefit was an undesirable side-effect.
3 For a more detailed proposal, including more sophisticated definitions of where the ‘middle-class’ begins, see Cawston et al (2009, pp. 10-13 & pp. 26-31).
15

Technically, the easiest way to constrict benefit entitlement to those on the lowest incomes would be to steepen taper rates drastically. But since this would be tantamount to a drastic increase in EMTRs for the weakest groups in the labour market, this mechanism would almost certainly create adverse dynamic effects. Curtailing, and ideally abolishing middle-class benefits remains a valuable aim, but the devil is in the mechanism by which they are being curtailed: this will be discussed later.
16

A longer-lasting approach to restoring the public finances would consist of uncovering the fiscal illu-sions which feed the demand for ever-increasing volumes of income transfers. In the UK’s transfer system, this applies especially to the large amount of ‘churning’, which occurs when people pay direct taxes and receive cash transfers at the same time (so that they effectively pay for their own transfers). The volume of churning could be substantially reduced in a fiscally neutral way. The first step would be to convert Working Tax Credit (WTC) and Child Tax Credit (CTC), and preferably also Child Benefit, into a Negative Income Tax. At present, the standard income threshold above which tax credits are withdrawn is slightly below the tax-free personal allowance. Therefore, most recipi-ents of tax credits are also taxpayers and NIC payers.
This situation would be impossible under a Negative Income Tax, where the amounts to which re-cipients are entitled would depend on the distance between their income and the tax-free personal allowance. By definition a household receiving payments through the negative income tax system would be a household the income of which falls below the personal allowance. This reform would require that personal allowances are allocated to households instead of individuals, so that the tax system and the benefit system deal with the same unit. The personal allowance of a household would depend on the number of adults and children. In effect, this reform would hugely increase personal allowances4 and decrease the maximum benefits payable.
In 2010-11, total spending on tax credits amounts to about £29bn (IFS, 2010a). In crude aggregate terms, only the bottom three deciles are net beneficiaries of tax credits plus child benefit, receiving more in the form of these transfers than they pay in income tax and NIC. Even for the bottom decile, the aggregate amount of ‘churning’ is considerable, with about a third of the payments received in tax credits and child benefit being clawed back in the form of income tax and NIC (based on data from Office for National Statistics, 2010.)
If it were possible to implement this reform in a fiscally neutral way, then the £29bn5 saved through the abolition of WTC and CTC would be fully recycled into higher tax-free allowances and the cost of the newly introduced Negative Income Tax. Fiscal neutrality is, of course, not feasible. The present tax credit system contains a host of different rates, special rules and differential treatments of differ-ent family types, which could hardly be fully translated into a Negative Income Tax system – much less so if it were to have as few tax rates as possible. But a standardisation and simplification would, in fact, be desirable. It would enable additional savings (which will not be quantified here) by reduc-ing the present system’s preferential treatment (in equivalised terms) of single parents. This would also reduce adverse incentives, created by the sharp withdrawal of benefits that is usually triggered once a single parent forms a joint household with a partner.
It is beyond the scope of this paper to provide numerical values for the thresholds and rates of a new tax and benefit system. Nevertheless, Tables 7a and 7b provide an intuitive indication of how such an alternative might work. Table 7a refers to a single-breadwinner household with two adults and two children, and a market income of £18,000 per year. Table 7b refers to a double-breadwinner
Draining the fiscal illusions swamp
4 Indeed, they would no longer be personal!5 The amount of fiscal savings which can be recycled into higher tax-free allowances and the NIT would be even higher, because Child Benefit would also be abolished in its present form. But Child Benefit is already contained in Table 6, so in order to avoid a partial double-counting, it is ignored here.
17

household with two adults and two children, and a market income of £23,500 per year. Under the present system, both households could apply for a variety of income transfers, partially subject to withdrawal, and would also be liable to pay income tax and NIC. Both families would end up with virtually the same disposable income if there were a tax-free allowance of £28,000 for every two-adult-two-children household, and a Negative Income Tax with an average rate of -33%6. This would also mean that if these households reached an income of £28,000 (£18,667 in equivalised terms7), then their entitlement to Negative Income Tax would end. Tax-free allowances for other household types could be set in such a way that equivalised tax-free allowances are broadly the same across household types. This would make the tax system neutral with regard to household composition and family structure. To keep the reform revenue-neutral, adjustments such as closing ‘tax loopholes’ may be necessary further up the income scale.
6 This would be almost identical to the combined rate of income tax (basic rate) and employee NIC, so this system would avoid the present system’s sudden jump in EMTRs. 7 Under the McClements’ equivalence scale used in the UK, this household’s equivalence number is 1+0.25+0.25 = 1.5, assuming the children are eleven and twelve years old, which would assign them an equivalence weight of 0.25 each. The household’s equivalised income would then be its face-value income divided by their equivalence number, or £28,000/1.5 = £18,667. This means that a family of two adults and two children aged eleven and twelve on an income of £28,000 reaches the same living standard as a two-adult household with an income of £18.667. The two-adult household is the reference category (see ONS, 2008, p. 32).
PRESENT SYSTEM SIMPLIFIED SYSTEM
Market income £18,000 Market Income £18,000Basic Element of Working Tax Credit +£1,920Couple Element of Working Tax Credit +£1,89030 Hour Element of Working Tax Credit +£790Child Element of Child Tax Credit +£4,600Family Element of Child Tax Credit +£545 Child Benefit +£1,750Benefit withdrawal (39% above threshold) -£4,515Income Tax (20%) and employee National Insurance Contributions (11%)
-£3,655 Negative Income Tax (-33%)
+£3,300
Disposable income ≈£21,300 ≈£21,300
Table 7a: A family of two adults and two children with one member in full-time work
However, converting tax credits into negative taxes can be only a first step. Churning arises not only through tax credits, but in many other parts of the tax and benefit system as well. Many other benefit types have to be integrated into this system of either positive or negative taxation too. This requires a radical simplification of the benefit system, standardising key variables and merging the many different types of benefits into as few as possible. Detailed proposals for benefit simplification are available from Martin (2009) and Brewer et al (2008, pp. 54-60). In less detail, the Department for Work and Pensions announcements to merge key out-of-work benefits and tax credits into a single ‘Universal Credit’ promise important steps into the right direction (DWP, 2010a). But these propos-als do not involve disentangling tax liabilities and transfer entitlements. If fiscal illusions are to be debunked, benefit simplification would be a necessary, but insufficient precondition. It is the restora-tion of fiscal transparency which, while not saving any money on its own (other than administrative
18

PRESENT SYSTEM SIMPLIFIED SYSTEM
Market income £23,500 Market Income £23,500Basic Element of Working Tax Credit +£1,920Couple Element of Working Tax Credit +£1,89030 Hour Element of Working Tax Credit +£790Child Element of Child Tax Credit +£4,600Family Element of Child Tax Credit +£545 Child Benefit +£1,750Benefit withdrawal (39% above threshold) -£6,665Income Tax (20%) and employee National Insurance Contributions (11%)
-£3,435 Negative Income Tax (-33%)
+£1,500
Disposable income ≈£25,000 ≈£25,000
Table 7b: A family of two adults and two children, with one member in full-time and one in part-time work
expenses), would ease the long-term upward pressure on public spending.
The mentioned simplification and standardisation would inevitably make some beneficiaries worse off. But even for them, there would be gains. A highly desirable side-effect of the above-described reforms is that they would, at one stroke, slash the highest EMTRs. These arise, as Table 7 shows, when taxes are paid and benefits are withdrawn at the same time. Even in the short term, the dy-namics created by removing obstacles to progressing in the labour market could only be positive, unless the wage elasticity of labour supply was zero.
Taxes/benefit withdrawal EMTR
Basic rate of income tax (IT)+National Insurance Contributions (NIC)
20%+12%=32%
IT+NIC+tapering of Working Tax Credit and/or Child Tax Credit (WTC/CTC)
20%+12%+41%=73%
IT+NIC+tapering of Housing Benefit (HB) 20%+12%+(65%of(100%-20%-2%))=76%IT+NIC+tapering of HB and Council Tax Benefit (CTB)
20%+12%+((65%+25%) of(100%-20%-12%))=90%
IT+NIC+tapering of WTC/CTC, HB and CTB 20%+12%+41%+((65%+25%) of(100%-20%-12%-41%))=96%
Table 8: EMTRs resulting from various interactions of taxes and benefits
Rates for 2011; from HM Treasury (2010)
19

It has been mentioned that while standard rates of income replacement benefits are not particularly generous, replacement ratios can nevertheless be very high, weakening financial incentives to take up work. The gap is largely explained by Housing Benefit and exacerbated by Council Tax Benefit. Recipients do not have command over these earmarked benefits, but they are withdrawn with net income, and therefore drive up replacement ratios and EMTRs. Their fiscal costs are also huge. In January 2010, the government spent £1.7bn on Housing Benefit and a further £0.4bn on Council tax Benefit. If these numbers were to persist throughout the year, they would add up to £20.2bn and £4.6bn respectively (data from DWP & ONS, 2010).
In his budget speech, Osborne explicitly addressed the cost explosion in Housing Benefit. The Chancellor proposed to save £1.8bn through limiting perks and introducing caps: most notably by using quantitative upper limits for reimbursable housing costs. But these proposals do not address the underlying dynamics of the explosion in Housing Benefit, which are engrained in the system’s in-centive structure. The amount of Housing Benefit which a recipient can claim is equal to the median rent in a specified area: the so-called ‘Broad Rental Market Area’ (BRMA). Since the net of BRMAs is very tight – England is divided into 153 BRMAs and Greater London alone into 12 (Local Housing Allowance Direct, 2010) – a tenant’s actual rent will usually be quite close to their reimbursable rent. This means that the HB systems works, in practice, much like a full cost reimbursement scheme. It provides very weak incentives for recipients to economise on housing costs. Moving from an average-priced one-bedroom-flat in Inner North London to one in Outer Northeast London would cut rental costs by almost £5,000 per year, for example. But this would cut a recipient’s HB entitlement by the same amount.
As a result, Housing Benefit recipients are often over represented in high-rent areas. Nationwide, 18% of all households are in receipt of the benefit. In Inner London – which, on some measures, has the highest rental costs in the world – the share of households receiving the benefit reaches a staggering 30% (DWP & ONS, 2010). Table 8 shows reimbursable Housing Benefit amounts for one-bedroom flats in the areas with the highest Housing Benefit dependency rates nationwide. Even within a given BRMA, there is no financial incentive to undercut the maximum reimbursable rent by more than £15 per week, which is the amount of the difference recipients can keep.
Flat-rate housing benefits
20

Borough Housing Benefit caseload as % of households
Reimbursable weekly rent for a one-bedroom flat*
Hackney 44% £235 - £350Tower Hamlets 39% £235 - £350Newham 38% £165Islington 35% £178 - £350Haringey 34% £178 - £250Lambeth 32% £185 - £240Glasgow City 32% £87 - £98Manchester 32% £104Brent 31% £173 - £250Southwark 31% £185Liverpool 31% £93Barking & Dagenham 31% £150Lewisham 29% £150 - £185Kingston upon Hull 29% £75Sefton 29% £92 - £93Middlesbrough 29% £90West Dunbartonshire 28% £91Knowsley 28% £89 - £96Hammersmith & Fulham 28% £245 - £350South Tyneside 28% £91 - £92
Table 9: Reimbursable rent for a one-bedroom flat in the areas with the highest Housing Benefit dependency
Data from DWP & ONS (2010) and LHA Direct (2010)
* BRMAs are hypothetical geographical units; their borders do not have to overlap with those of a borough. Some of the boroughs listed here belong to two or more BRMAs; in this case, the third column contains a range instead of a single value.
George Osborne’s approach leaves this defective incentive structure in place, and essentially ig-nores the importance of economic incentives. Iain Duncan Smith’s approach would unite Housing Benefit and other transfers under a common roof, the new Universal Credit (DWP, 2010a), but mov-ing and merging it will not reduce its shortcomings. A better alternative would consist of moving away from quasi-reimbursement and converting Housing Benefit into a flat rate payment. This could be achieved by, first of all, slashing the number of BRMAs to 12 (one for each English region, and one for Wales, Scotland and Northern Ireland respectively). Within each BRMA, the benefit would be paid out as a lump sum depending on household size only, and in the course of this, the differentiation by household size should also become less fine-grained. The current practice is that a larger family is generally entitled to a larger flat, with no upper limit. This is not just fiscally wasteful, but also unfair towards the low-paid, who are not suddenly entitled to a larger flat if their family gets bigger. In the end, this would mean that Housing Benefit would cease to exist as a benefit in its own right. It would simply become an add-on to conventional tools of income replacement or income supplement, paid out as one single transfer. It would still perform a useful role in ensuring the benefit’s system was
21

more tailored to local conditions of living costs (and, indirectly, wages).
Recipients would then begin to make trade-offs between housing and other goods like everyone else. If they saved rental costs by relocating, they would be able to keep the full amount. If they incurred additional rental costs, they would have to pay in full. This would give policymakers an effective tool to control costs. They could then commit to a medium-term spending reduction plan such as lowering total benefit levels by five percentage points per year. Recipients could respond by gradually moving to cheaper areas, moving to cheaper accommodation within a given area, and/or increasing work search efforts. Integrating Council Tax Benefit into the same system would increase the potential for savings and make voters more sensitive to Council Taxes charged in different areas. Under this system, reducing Housing Benefit spending by £1bn per year and Council Tax Benefit spending by £0.2bn per year need not be a particularly painful reform. Since the new system would encourage recipients to become cost-conscious, relocation movements would take place anyway.
But the actual savings potential from reforming the way housing is provided to the poor is much greater than that. So far, only cash transfers have been considered. But the British safety net for housing consists of a 2:1-mix of subject subsidies (where the poor are given cash sums to purchase a particular good on the market) and object subsidies (where state-sponsored, state-regulated pro-viders supply the good to the poor only, below cost-covering prices). The latter occurs in the form of subsidised and regulated Social Housing, an extra-market structure of housing provision for the poor only. Economic arguments for object subsidies are generally weak. It is easy to see why the maintenance of state-sponsored ‘social bakeries’, as a parallel supply chain for the poor, would be undesirable. In the field of housing, too, the case for object subsidies is full of holes (see King, 2006, pp. 29-51). State-sponsored ‘Social Housing’ as a distinct tenure, separate from the regular housing market, should be ended. Object subsidies should be converted into subject subsidies, and subjected to across-the-board spending cuts of the type described above. All the lettable housing stock would move to the private sector, with all landlords and housing associations being subject to the same regulatory framework. All landlords would then have to compete for tenants, instead of fulfilling governmental targets (see King, 2006, pp. 113-123). This would mean genuine choice and empowerment for tenants. As a handy side-effect, the greater efficiency that can be expected to result from unleashing the market discovery process could be used to reduce HB rates further, leading to additional fiscal savings.
22

In the very long term, the largest fiscal savings can be achieved by removing some key tasks in welfare from the political sphere in their entirety. In particular, the implicit debt incurred in the form of unfunded pension liabilities has been estimated at 273% of GDP (Silver, 2010). No details on reduc-ing this burden will be provided here because, unless the government partially reneges on its own promises, none of the realisable fiscal savings would occur in the near future. Indeed, the future of the pension system is not the topic of this paper. However, it is worth noting that there are very few insurance-based elements of the so-called National Insurance system left.
Pension provision is one of those aspects and disability insurance another. We do not consider dis-ability insurance in detail here but it is worth noting that in Chile the privatisation of old-age provi-sion has been coupled with the privatisation of disability insurance. Providers of retirement savings accounts act as intermediaries taking out group insurance contracts for their clients to cover the risk of work incapacity. The system has so far demonstrated a high level of cost-effectiveness, with generous income replacement for those whose disability status is unequivocally ascertained, but strong financial incentives to limit misuse (James and Iglesias, 2007). In the longer term, a way to move the UK’s systems of old-age and disability provision in this direction would be to convert the nominal ‘employer NIC’ (which is, of course, just another component of labour costs) into a formal part of employee’s pay, and earmark it for savings and insurance.
What can be reformed more quickly is the system of old-age assistance benefits - generally means-tested benefits. Regardless of whether the regular income source in old-age consists of entitlements built up through previous contributions (in a pay-as-you-go system), or of assets built up through previous savings (in a funded system), there will be an auxiliary pillar for those whose entitlements or assets are insufficient. The system of non-contributory old-age benefits in the UK reflects all the deficiencies of the benefit system for working-age households and should be reformed along the same lines.
Special age-contingent benefits, cash and kind, should be merged into one single payment. The level of assistance payment is either sufficiently high to cover the cost of items like winter fuel, bus travel, eye tests etc, or it is not. If the former, top-up benefits for special purposes are unnecessary; if the latter, the most obvious solution is to raise the level of the assistance payment itself. In neither case is there a convincing rationale for adding layer upon layer of additional transfers.
In principle, there is no reason for running two separate benefit systems, one for people of working-age and one for older people. The tax and benefit system described above should be the same for all households.
Again, this report will not provide parameters of an alternative tax and benefit system, so the purpose of the following numbers is merely to illustrate the system’s logic. Consider the case of a pensioner couple with an annual gross income of £10,000, made up of the Basic State Pension and additional income from savings. At present, this couple can claim about £525 in Guarantee Credit, £1,100 in Savings Credit, and £250 of Winter Fuel Payment. They would also be liable to a small income tax payment of about £100, leaving them with a disposable income of around £11,775 and access to various benefits in kind. Alternatively, a household tax-free allowance of £18,000, combined with a NIT with an average rate of -33%, would leave them with about £12,650. But they would have to pay
Old-age and disability provision
23

for public transport and eye tests like everybody else.
The changeover will work less smoothly for households with a different composition, a different in-come situation, and/or entitlement to different benefits. Changes would have to be phased in over a longer period, and transitional arrangements might be required. But the final goal should be a unified system of positive and negative taxation, neutral with regard to age and income composi-tion, in which saving and working always pays off, and political vote-buying cannot be hidden from taxpayers’ sight.
24

It was argued above that spending on middle-class benefits should be constrained, but without rais-ing the taper rates which give rise to adverse dynamic effects. There need not be a contradiction between these two aims. Entitlement to benefits, both in-work and out-of-work, can be limited in ways other than through the use of taper rates.
In-work benefits should be made contingent on full-time work, at least for the vast majority of recipi-ents below some specified age. This would limit in-work support to those who are doing their best to improve their own situation first. Since in-work support would no longer have to replace the pay of entire workdays, the maximum amount could be much lower to begin with, which would make a low withdrawal rate feasible without in-work support turning into a middle-class benefit. A full-time work condition would also help to overcome the disincentives provided by the present system. To qualify for WTC, recipients are required to work at least 16 hours per week. This makes it lucrative to move from, say, a one-day working week to a two-day working week. But the move from a two-day working week to a three-day working week is penalised by steep EMTRs, so unsurprisingly, half of all single parents receiving WTC work at, or just above the minimum threshold (ONS & HMRC, 2010).
In isolation, raising the bar for the receipt of in-work support would, of course, only push part-time employees receiving tax credits into worklessness. The above must go in tandem with a wholesale reform of out-of-work support for working-age households. In terms of moving recipients back into work, perhaps the most successful reform package tested over the last few decades is Wisconsin’s ‘workfare’ policy.
In this system, there is no automatic entitlement to benefits anymore. Instead, entitlement is con-ditional on participation in a work capability assessment and, provided the results are positive, in activities such as working for the local council or guided job search. Work requirements as such are nothing exotic. What distinguishes Wisconsin, not least compared with many other US states, is that they are actually enforced on the ground in the vast majority of cases (Mead, 2004, p. 6 & p. 71).
This model turns the incentive structure of welfare upside down. Engaging in a structured daily rou-tine and receiving the full amount of benefits becomes the baseline scenario. Non-participation in the requested activities, or turning down job offers, then leads to deductions from the full amount. In effect, in this system, the daily life of a working-age welfare recipient who is not employed is not that different from the daily life of their working peers. This leaves no reason for not seeking regular full-time employment. A very likely and highly desirable side-effect would be the removal of the social stigma from welfare recipients as well as the rooting out of fraudulent claimants (who are working in the black market and receiving benefits). These issues are particularly relevant in the UK, where attitudes towards welfare recipients are much more negative than elsewhere in Europe (see Sefton, 2009, pp.237-242, on survey data).
After the enactment of the key work requirement reform, welfare caseloads in Wisconsin fell by 82% in just over half a decade (Mead, 2004, p. 5). Labour market models (Mead, 1999) and surveys among senior welfare administrators (Mead, 2004, pp. 197-202) suggest that work requirements were the main contributory factor. If a similar system were adopted in the UK and if it was only half as successful as the prototype – that is, if caseloads were cut by 40% – this would already save around £4.6bn in Income Support and Job Seekers Allowance (based on data from DWP, 2010).
Full-time work requirements
25

What is important to note about the Wisconsin model is that it did not emerge as a single model, but through local variation and mutual learning (Mead, 2004, pp. 79-106). This stands in sharp contrast to the UK’s centralised approach to welfare policy. An effective work requirement system demands a high level of administrative capacity, and imposed from above with no trial-and-error element, it would be almost certainly doomed to failure. Instead of the traditional UK, top down, approach we could grant local governments a high degree of autonomy in the administration of the new regime – coupled, of course, with a high degree of fis-cal responsibility. Local governments would meet the cost of workfare up front out of locally raised taxes, with the central government then reimbursing much of the money, but leaving a substantial percentage excess that was not reimbursed. Critics will point out that structurally weak areas, with both a narrower tax base and a higher welfare caseload, would lose out. But, in fact, this system would merely make the lax enforcement of work requirements recognisable as what it is: a luxury good, which thriving areas can afford (if local residents are prepared to pay the extra local taxes), but struggling ones cannot.
26

The present fiscal situation has made the dire need for welfare reform obvious. But the case for a wholesale reform of the UK’s transfer system goes well beyond a mere lack of money. Evaluating the system in terms of the conventional trade-offs faced in welfare design shows that the UK often combines the worst features of different setups.
Short-term income replacement devices are not particularly generous, but high replacement ratios arise nevertheless. Withdrawal rates are generally high, and yet benefits are poorly targeted. High taper rates for many are usually the price to pay for preventing excessively high taper rates for a few; and yet in the UK, both ills coexist. Most redistribution is intra-personal, crowding out private savings and insurance; but in most transfer programmes, the link between contribution and entitle-ment is rather weak.
As a whole, the system lowers savings ratios and capital accumulation, discourages entry into and progress within the labour market, as well as labour mobility and even the formation of joint house-holds between partners. Even a decade of robust labour market performance and extensive work promotion programmes have done little to curb concentrated, entrenched dependency.
The fact that the transfer state could grow so large despite performing so poorly suggests that fiscal illusions are at work, creating permanent electoral pressure for further rounds of expansion. Any re-form that is meant to last longer would have to address these underlying dynamics to prevent a ‘yo-yo effect’, otherwise, spending pressures will dam up behind the barrier of budget freezes and caps. Fiscal illusions need to be reduced through a strict separation of tax liability and transfer entitlement, which, in turn, requires a substantial simplification and standardisation of the benefit system (and ideally the tax system as well). As a highly desirable side-effect, this would immediately cut the high-est EMTRs, creating beneficial dynamics.
This paper proposes to cut back transfer spending by around £55bn, of which around £30bn would be recycled into higher Personal Allowance and a newly introduced Negative Income Tax. The in-centives structure of Housing Benefits, and perhaps Council Tax Benefits, should be reformed by converting the benefits into flat rate payments. Middle-class benefits should be cut drastically – but not by increasing benefit taper rates, which would create adverse dynamic effects. Access to ben-efits has to be restricted in some way, but this can be done in ways that ‘crowd in’ rather than crowd out recipients’ own efforts, by making self-help the very condition of entitlement. More precisely, the NIT would be tied to full-time work, even for single parents, who would receive help with childcare if needed.
At the same time, support for working-age households outside the labour market would be tied to Wisconsin-style work requirements, which turn the traditional incentive structure of welfare on its head. Given the negative experience with the UK’s centralised governance structure, the system ought to evolve from a local discovery process, which requires at least partial funding from local taxation.
Conclusion
27

Reform area Approximate fiscal savings
Curtailing middle-class benefits £15.2bnAbolishing tax credits £29.0bnRaising tax-free allowances and 1%introducing a Negative Income Tax -£29.0bnCutting HB and CTB linearly £6bnLimiting receipt of IS, JSA and ESA through ‘Wisconsin-style’ work tests and work requirements
£4.6bn
Total ≈£25.8
Table 10: Summary of fiscal savings
The reforms proposed here would be more effective, and easier to implement, when coupled with reforms in other areas. These are beyond the scope of this paper, but suffice it to name two areas. The beneficial effects of improved work incentives will, of course, best unfold in a flourishing labour market where labour is in high demand. Indeed, introducing the work requirement system proposed above will only lead to fiscal savings if it succeeds in moving many recipients into the regular labour market eventually.
Welfare reform would increase labour supply. If labour demand is to soar simultaneously, changes to the UK labour market regime are required. Contrary to popular belief, labour markets in the UK are regulated rather tightly, at least in comparison with the rest of the English-speaking world (and even with a few ‘Germanic’ nations).
Labour Freedom(0 – 100)
Australia 94.9US 94.8Denmark 93.7New Zealand 88.8Switzerland 81.8Canada 81.5Austria 79.1Ireland 79.0UK 72.8Belgium 67.1
Table 11: Index of Labour Market Freedom (sub-index of the 2010 Index of Economic Freedom)
Data from Heritage Foundation and Wall Street Journal (2010
Another important companion reform would be a wholesale liberalisation of the land use planning
28

system, enabling a large increase in the supply of housing and a significant reduction in its cost. The remit of the welfare state could be substantially reduced if basic requirements such as housing were easily affordable across the income distribution. If smaller transfer sums are required to enable a decent minimum standard of living, then replacement ratios and EMTRs can fall, leading to a further strengthening of work incentives. On top of that, relocations to areas with better employment pros-pects would become more lucrative, because differences in housing costs would no longer eat up a large share of the gains realised by relocating. This would increase the responsiveness to improved work incentives. In short, against a backdrop of steeply falling housing costs, the reforms proposed here could be taken further and their effectiveness would be greater. Detailed proposals for an over-haul of the planning system are available from Pennington (2002).
So while welfare reform cannot be seen as a stand-alone policy, flourishing labour markets and product markets will not reduce worklessness, dependency and poverty within a dysfunctional wel-fare system either. This paper has outlined a strategy to address these issues and, as a desirable side-effect, realise significant fiscal savings. Some will mistake these proposals as ‘blaming the victim’, or forcing people into dead-end jobs instead of providing them with support. The opposite is true. The logic of this proposal is a simple one. Topping up the incomes of low-earning full-time work-ers requires much less input from the state than substituting the pay of several workdays8. If the initial payment of a transfer is low enough, then the withdrawal rate can be low without the transfer degenerating into a middle-class benefit. In this combination, full-time work requirements are by no means ‘tough on the poor’. They are the very prerequisite for low EMTRs, which, in turn, are the key to addressing the poverty trap.
At the time of writing, the coalition government’s welfare proposals have just been announced (DWP, 2010b). These were trailed as the most radical reform since Beveridge, which is certainly not a com-pliment to those who have attempted system-wide welfare reform in the recent past. The proposals presented here have the following important differences:
They include a formal negative income tax with lower withdrawal rates than the coali-• tion proposes (The White Paper expects that Universal Credit will be withdrawn at a constant rate of around 65 pence for each pound of net earnings (DWP, 2010b, p. 13)). This will ensure that work incentives amongst the low paid are not substantially differ-ent from those facing people on higher incomes. Middle class benefits would be removed but there would be complementary tax reduc-• tions.The proposals in this paper substantially remove the discrimination against couples • within the tax and benefits system: this measure alone can be expected to have im-portant dynamic effects. It is proposed that there are continuing work requirements for those who are not in • full-time work but who are claiming benefits which would be administered at local level with appropriate financial responsibility being delegated.A radical reform of housing benefit is also proposed here.•
The government’s proposals take us in the same direction as the proposals in this paper but it is
8 Consider the case of a workless single-adult household receiving a transfer of £680 per month; composed of £280 in IS, and £400 in HB. (This is somewhat below the monthly HB amount that can be claimed in places like Birmingham, Colchester, Coventry, Leeds and Manchester, and ignores CTB.) If the amount was withdrawn at a rate of 33% with no further strings attached, this person would have to earn nearly £2,200 per month to come off benefits, which would place him or her somewhere between the 85th and the 90th percentile of the equivalised income distribution. The equivalised income would be close to £3600 under the McClement equivalence scale.
29

30
likely that many of the static and dynamic benefits of reform will be lost by the coalition as a result of an unwillingness to go far enough.

Adam, S., M. Brewer and A. Shephard (2006) ‘Financial work incentives in Britain: Comparisons over time and between family types’, Working Paper 06/2006, Institute for Fiscal Studies.
Blundell, R.; A. Duncan and C. Meghir (1998) ‘Estimating labor supply responses using tax reforms’, Econometrica, 66, 4, 827-861.
Brewer, M (2009) ‘How do income support systems in the UK affect labour force participation?’, Working Paper 2009: 27, Institute for Labour Market Policy Evaluation.
Brewer, M., E. Saez and A. Shephard (2008) ‘Means-testing and tax rates on earnings’, paper prepared for the Report of a Commission on Reforming the Tax System for the 21st century, (‘Mir-rlees Review’); The Institute for Fiscal Studies. Brewer, M. and A. Shephard (2004): ‘Has Labour made work pay?’; London: Institute for Fiscal Studies and Joseph Rowntree Foundation
British Social Attitudes Survey (2010) ‘Has welfare made us lazy? Employment commitment in different welfare states’, BSA, The 25th Report, Sage.
Buchanan, J. (1967, reprinted 1999) Public Finance in Democratic Process: Fiscal Institutions and Individual Choice, Indianapolis: Liberty Fund.
Cawston, T., A. Haldenby and P. Nolan (2009) ‘The end of entitlement’, London: REFORM.
Department for Work and Pensions (2010) ‘Benefit expenditure by local authority’, dataset, available at http://research.dwp.gov.uk/asd/asd4/expenditure.asp
Department for Work and Pensions (2010a) 21st century welfare, London: DWP.
Department for Work and Pensions (2010b) Universal Credit: a new approach to welfare, London: DWP.
Department for Work and Pensions and Office for National Statistics (2010) ‘Housing Benefit and Council Tax Benefit, summary statistics’, Dataset, available at: campaigns.dwp.gov.uk/asd/asd1/hb_ctb/hbctb_release_feb10.xls
Dollary, B. and A. Worthington (1996) ‘The empirical analysis of fiscal illusion, Journal of Economic Surveys, 10, 3, 261-297.
Eurostat (2009) ‘Net expenditure on social protection benefits’, Statistics in Focus 102/2009.
Eurostat (2009a) Labour market statistics, Eurostat Pocket Books, Luxembourg: Publication Office of the European Union.
Institute for Fiscal Studies (2010) Inequality and Poverty Spreadsheet, Online spreadsheet
References
31

accompanying ‘Poverty and Inequality in the UK: 2010’, IFS Commentary No. 116.
Institute for Fiscal Studies (2010a) ‘Conservatives and Liberal Democrats would extend Labour’s tax credit cuts for middle-income families’, Observations: Reflections on current events, by Mike Brewer.
James, E. and A. Iglesias (2007) ‘Integrated disability and retirement systems in Chile’, NCPA Policy Report No. 302, Dallas: National Center for Policy Analysis.
Joseph Rowntree Foundation & New Policy Institute (2007) Monitoring poverty and social exclusion 2007, Alden Press.
HM Treasury (2010) ‘Budget 2010, Press Notice 2: Rates and allowances’.
HM Treasury & Department for Work and Pensions (2010) ‘Ending child poverty: Mapping the route to 2020’, Companion document to the 2010/11 budget.
Heritage Foundation & Wall Street Journal (2010) 2010 Index of Economic Freedom, Washington: Heritage Foundation.
Horton, T. and J. Gregory (2009) The solidarity society: Why we can afford to end poverty, and how to do it with public support, London: Fabian Society and Webb Memorial Trust.
King, P. (2006) Choice and the end of social housing, Hobart Paper 155, London: Institute of Economic Affairs.
Korpi, W. and J. Palme (1998) ‘The paradox of redictribution and the paradox of equality: Welfare state institutions, inequality and poverty in the Western countries’, American Sociological Review, 63, 5, 661-687.
Local Housing Allowance Direct (2010) LHA-Direct website, available at https://lha-direct.voa.gov.uk/Secure/Default.aspx
Martin, D. (2009) ‘Benefit simplification: How, and why, it must be done’, Centre for Policy Studies.
Mead, L. (2004) Government matters. Welfare reform in Wisconsin, Princeton: Princeton University Press.
Mead, L. (1999) ‘The decline of welfare in Wisconsin’, Journal of Public Administration Research and Theory (J-PART), 9, 4, 597-622.
Meghir, C. and Phillips, D. (2008), ‘Labour supply and taxes’, Working Paper 08/04, London: Insti-tute for Fiscal Studies.
Office for National Statistics (2010) ‘Data: The effects of taxes and benefits on household income, 2008/09’, dataset, available at: http://www.statistics.gov.uk/downloads/theme_social/Taxes-Bene-fits/All_fig_&_tabs_0809.xls
32

Office for National Statistics (2008) Family Spending, 2007 edition, Hampshire: Palgrave Macmillan. Office for National Statistics & HM Revenue and Custom (2010) ‘Child and Working Tax Credits statistics’, London: ONS & HMRC.
Pennington, M. (2002) Liberating the land. The case for private land-use planning, London: Institute of Economic Affairs.
Puviani, A. (1960) Die Illusionen in der öffentlichen Finanzwirtschaft, Berlin: Duncker & Humblot; originally (1903) Teoria dell’Illusione finanziara, Milan/Palermo/Naples: Remo Sandron Editore Libraio.
Sefton, T. (2009) ‘Moving in the right direction? Public attitudes to poverty, inequality and redistribution’, in Hills, J., T. Sefton and K. Stewart (eds.) Towards a more equal society? Poverty, inequality and policy since 1997, Bristol: The Policy Press.
Seldon, A. (ed.) (1996) Re-privatising Welfare: After the lost century, IEA Readings 45, London: Institute of Economic Affairs.
Silver, N. (2010) ‘A bankruptcy foretold 2010: Post-financial-crisis update’, IEA Discussion Paper No. 28, London: Institute of Economic Affairs.
Snowdon, Ch. (2010) The Spirit Level delusion: Fact-checking the left’s new theory of everything, Trinity Farm/Ripon: Little Dice.
Sørensen, P. and Bovenberg, A. (2007) Working to account? Social security without dependency, London: Politeia.
33
Institute of Economic Affairs2 Lord North Street
LondonSW1P 3LB
www.iea.org.uk
Related Documents