November 19, 2007 What The Cornell University Survey Research Institute Can Do For You

November 19, 2007 What The Cornell University Survey Research Institute Can Do For You.
Jan 03, 2016
Welcome message from author
This document is posted to help you gain knowledge. Please leave a comment to let me know what you think about it! Share it to your friends and learn new things together.
Transcript

November 19, 2007
What The Cornell University
Survey Research Institute
Can Do For You
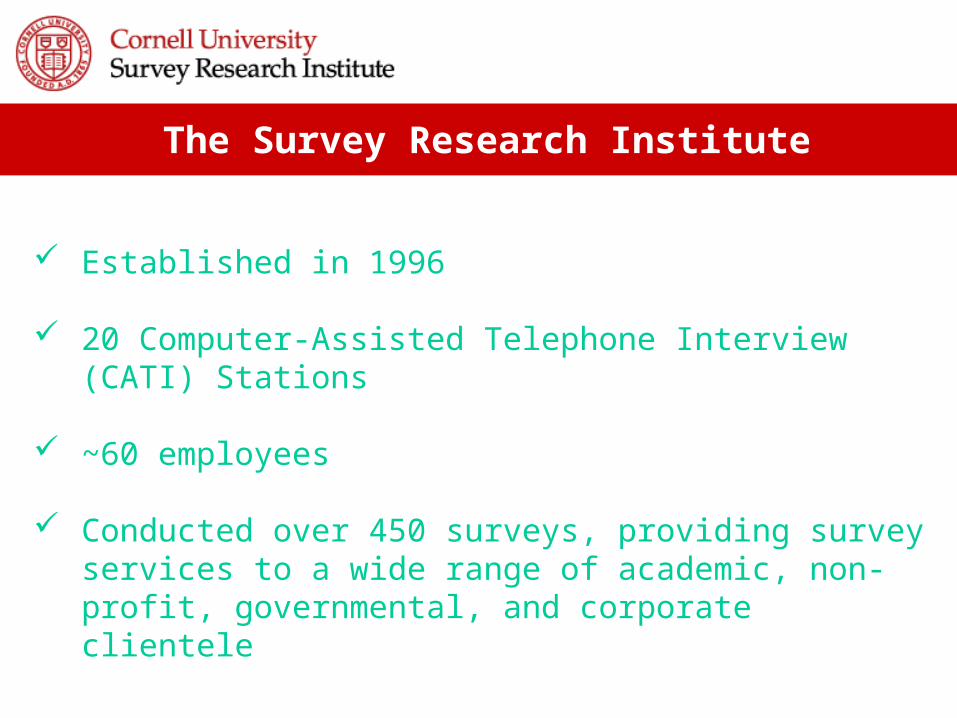
Established in 1996
20 Computer-Assisted Telephone Interview (CATI) Stations
~60 employees
Conducted over 450 surveys, providing survey services to a wide range of academic, non-profit, governmental, and corporate clientele
The Survey Research Institute

Examples of SRI Surveys
Effects of Retirement on Health and Drinking BehaviorNew York Nursing Home Project: Quality Care Technology Demonstration Project
Presidential Task Force Survey of ADA Compliance for Presidents Clinton and Bush
Post-September 11th Study of NYC Firefighter Traumatic Stress, Workplace Conditions and Well-BeingAttitudes Towards Public Funding of Stem Cell ResearchCornell Couples and Careers Study (how couples balance work and life)
Public Perceptions of Globalization
Employee Satisfaction Survey for NYS Controller H. Carl McCall
SRI Services
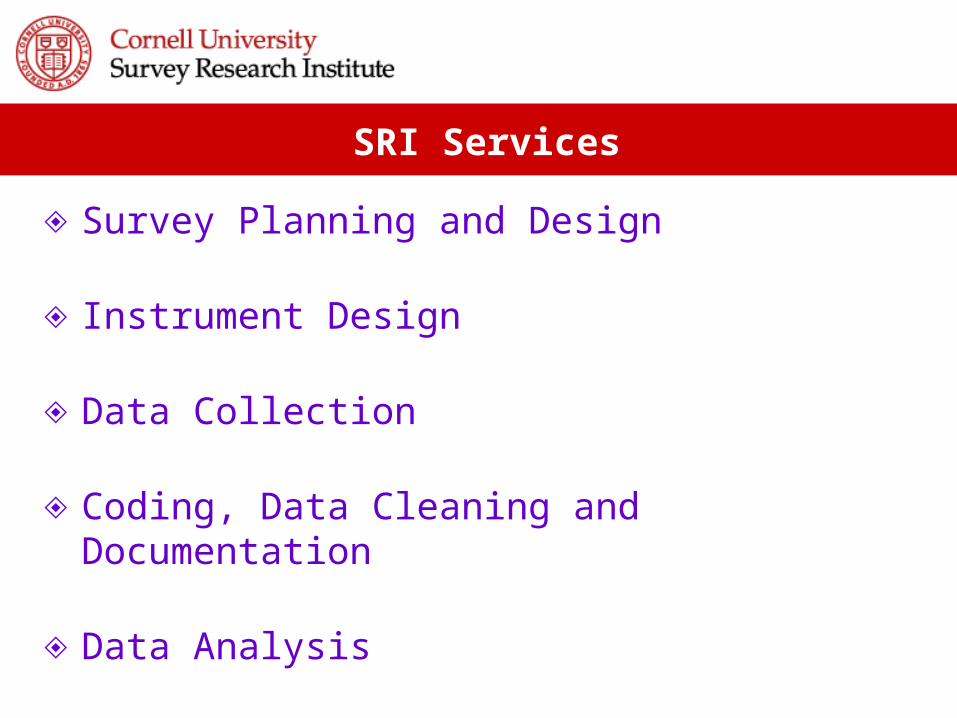
◈ Survey Planning and Design
◈ Instrument Design
◈ Data Collection
◈ Coding, Data Cleaning and Documentation
◈ Data Analysis
◈ Consultation / Cost Estimates

Survey Planning and Design
Define work objectives
Identify key concepts
Target your population
Choose sampling, data collection and analysis method
Determine sample sizes to meet study objectives
Develop realistic budgets and schedules for each stage of the survey

Instrument Design
Questionnaire design and production
Questionnaire testing for validity and reliability
Multi-language questionnaires
Translation back and forth
Pilot testing
Longest process

Instrument Design
Must Consider Four Sources of Survey Error and Their Consequences:
Sampling
Error
Coverage
Error
Measurement
Error
Non-response
Bias
Results of surveying only some (not all) of the survey population
Those who do not respond may be different than those who do respond to the survey
Question wording so poor that answers are inaccurate or un-interpretable
Not all members of the population have an equal chance of being sampled for
participation in the study
Instrument Design
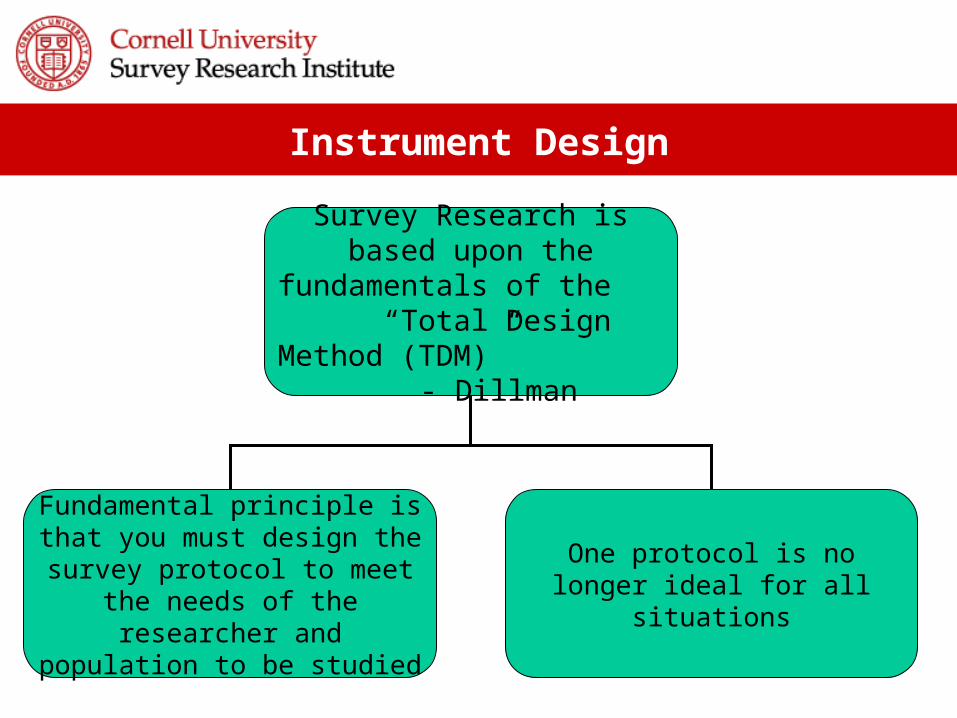
Survey Research is based upon the fundamentals of
the “Total Design Method (TDM)” -
Dillman
Fundamental principle is that you must design the survey protocol to meet the needs
of the researcher and population to be studied
One protocol is no longer ideal for all situations
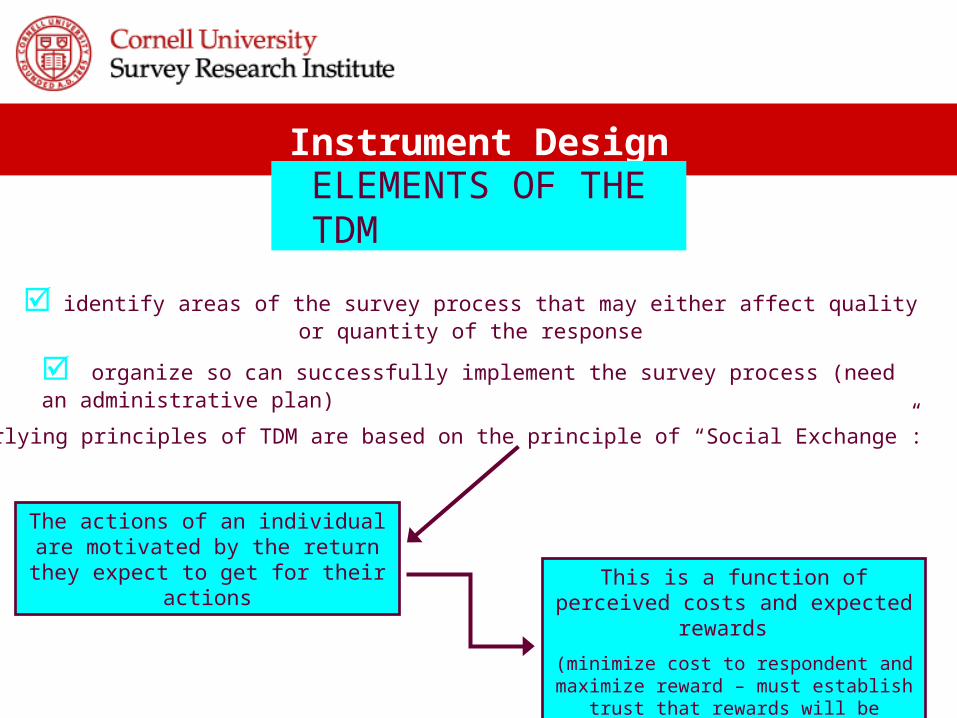
Instrument DesignELEMENTS OF THE TDM
identify areas of the survey process that may either affect quality or quantity of the response
organize so can successfully implement the survey process (need an administrative plan)
underlying principles of TDM are based on the principle of “Social Exchange”:
The actions of an individual are motivated by the return they expect to get for their actions This is a function of perceived
costs and expected rewards
(minimize cost to respondent and maximize reward – must establish
trust that rewards will be delivered)
Instrument Design-Elements of the TDM
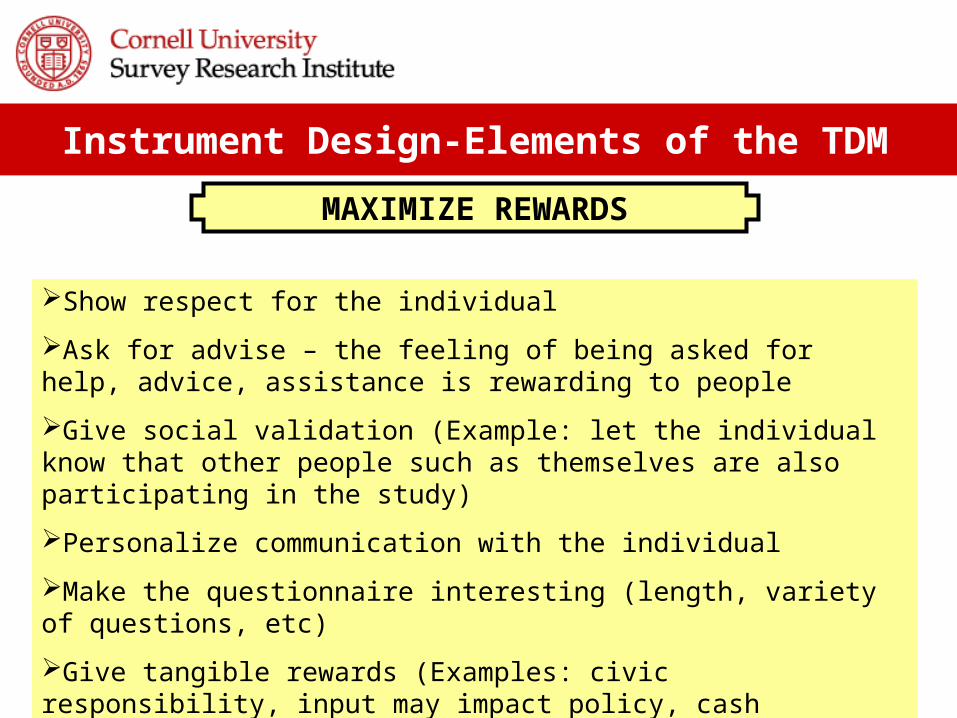
MAXIMIZE REWARDS
Show respect for the individual
Ask for advise – the feeling of being asked for help, advice, assistance is rewarding to people
Give social validation (Example: let the individual know that other people such as themselves are also participating in the study)
Personalize communication with the individual
Make the questionnaire interesting (length, variety of questions, etc)
Give tangible rewards (Examples: civic responsibility, input may impact policy, cash incentive, offer copy of the summary report)

Starting a Survey
Surveys should begin with a statement that clearly explains:Surveys should begin with a statement that clearly explains:
1. purpose of the survey1. purpose of the survey
2. participation is voluntary2. participation is voluntary
3. they can choose not to answer any questions they do not 3. they can choose not to answer any questions they do not want to answerwant to answer
4. whether their responses will be treated as anonymous 4. whether their responses will be treated as anonymous and/or confidentialand/or confidential
5. how the information will be reported and used5. how the information will be reported and used

Instrument Design-Elements of the TDM
Minimize Costs
Keep survey as short as possible
Avoid embarrassing or insulting the individual (must understand your population)
Avoid monetary costs to individual (calling someone on their cell phone during peak time)
Instrument Design-Elements of the TDM
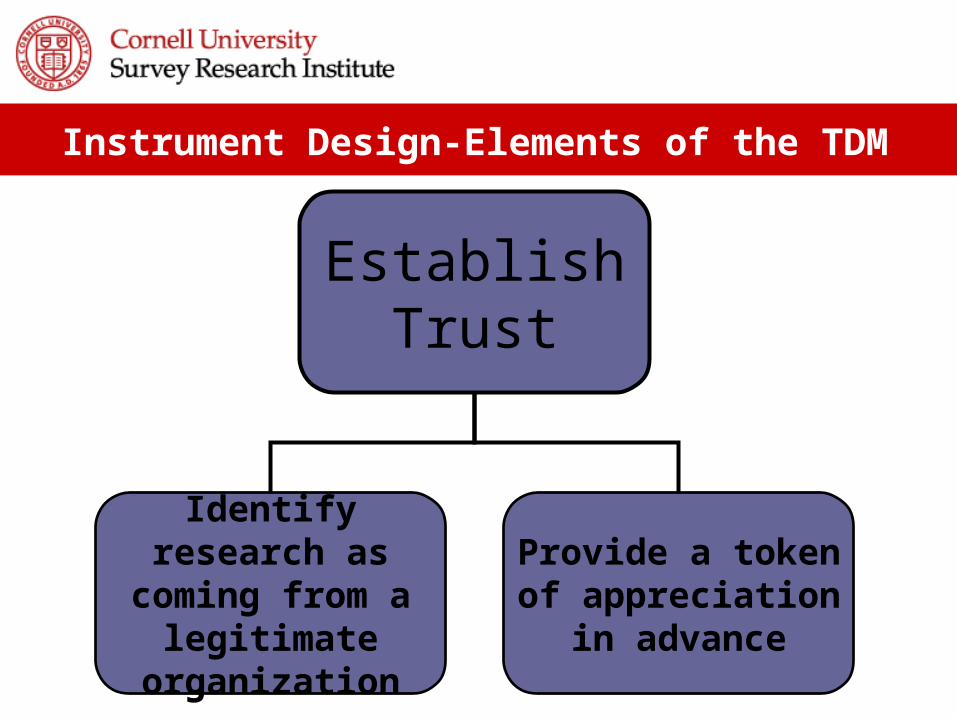
Establish Trust
Identify research as coming from a
legitimate organization
Provide a token of appreciation in
advance
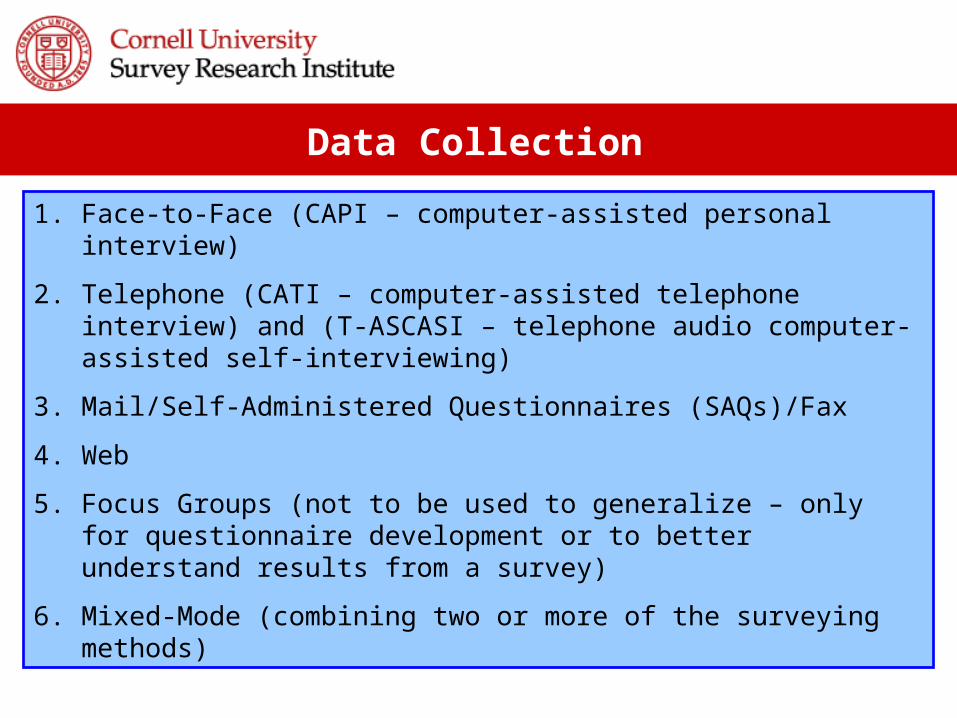
Data Collection
1. Face-to-Face (CAPI – computer-assisted personal interview)
2. Telephone (CATI – computer-assisted telephone interview) and (T-ASCASI – telephone audio computer-assisted self-interviewing)
3. Mail/Self-Administered Questionnaires (SAQs)/Fax
4. Web
5. Focus Groups (not to be used to generalize – only for questionnaire development or to better understand results from a survey)
6. Mixed-Mode (combining two or more of the surveying methods)

Data Collection
Which method is best?
…It Depends.

• Recruit and Train Students
• Extensive Two Day Training Process (to learn survey protocol and our internal systems)
• Must pass Human Subjects test before conducting any surveys
• Monitored 10% of the time at ALL times
• Have targets for productivity
• Have capability to monitor (listening in and watching)
SRI Field Staff

Coding - Data Cleaning - Documentation
Important Second-Stage Steps In Processing Survey Research

The Research ProcessSurvey Research Question
Budget & Schedule
Form the ideas to cover
Identify Population/Sample
Select a Research Strategy/Methodology
Questionnaire Construction
Pre-Test
Field Work/Data Collection
Data Entry/Processing/Cleaning
Data Analysis
Report Writing
Budget & Schedule
Budget & Schedule
What Else Do You Need To Know?
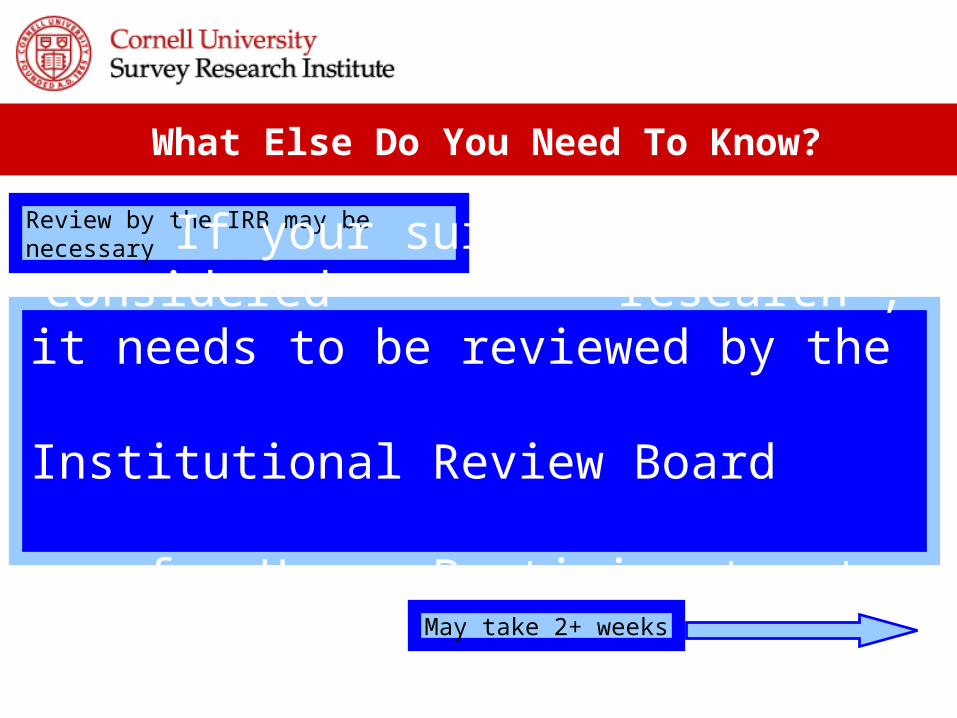
Review by the IRB may be necessary
If your survey can be considered “research”, it needs to be reviewed by the Institutional Review Board for Human Participants at
Cornell
May take 2+ weeks

What Else Do You Need To Know?
In general, surveys related to academic course requirements and surveys that produce data that will be presented at or published in off-campus venues will
require IRB review and approval.
Contact the IRB for further information: http://www.irb.cornell.edu/
Research is “an activity designed to test an hypothesis, permit conclusions to be drawn, and thereby to develop or contribute to generalizable knowledge (expressed, for example, in theories, principles, and statements of relationships)” (from The Belmont Report: Ethical Principles and Guidelines for the Protection of Human Subjects of Research).

Data Security
Survey respondents need to be told if their responses will be anonymous, kept confidential, or are entirely non-confidential
►Anonymous data do not include names, addresses, or any other personal information that would make it possible to associate a response with any given individual
►Confidential data contain information that may identify the individual
►Advantages of collecting identifiers – allow to conduct pre and post studies through linked data files
►If plan to collect confidential data, must pay attention to data security and access issues

New York Empire State Poll 2007New York Empire State Poll 2007

Objectives:
• Collect current opinion data on New Yorkers – first of its kind
• Provide a benchmark of New York State residents’ views on a wide-range of issues: labor, economic, governmental, community, social
• Support other research at Cornell University and elsewhere through omnibus modules
• Fifth ESP recently completed (March 2007)
New York Empire State Poll 2007
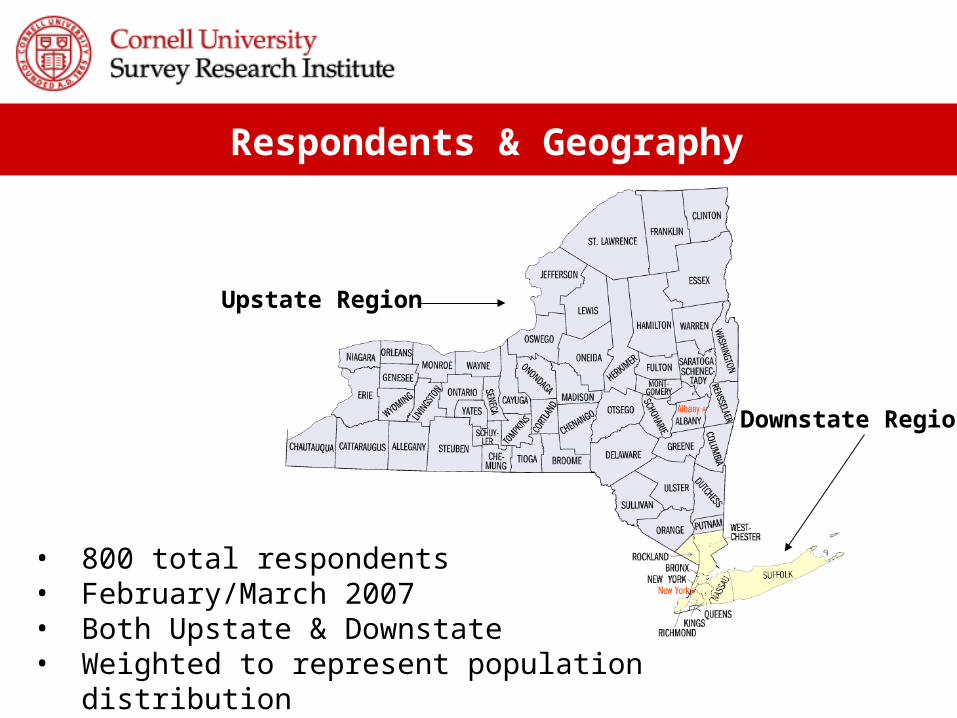
Upstate Region
Downstate Region
Respondents & Geography
• 800 total respondents• February/March 2007• Both Upstate & Downstate• Weighted to represent population
distribution

% of respondents citing… as most important issue
Taxes, crime and
employment are the most frequently cited issues facing local
communities.
Most Important Issue in Local Community
Note: In the other responses (36%) include: drug use, traffic and parking, facilities and services for children, public utilities and fostering a more friendly community.
18
12
9
8
7
5
5
36
0 5 10 15 20 25 30 35 40
Taxes (Local, State orFederal)
Crime
Employment
Education
Land Development
Economic Growth
Housing
Other Issues

% of respondents citing… as most important issueUpstate residents are more than three times as likely (29% vs. 9%) to cite taxes as an issue as downstate residents.
Downstate residents are substantially more likely to cite crime (20% vs. 6%), education (12% vs. 5%).
Most Important Issue in Local Community, by Region
29
6
12
5
7
9
2
30
9
20
6
12
7
1
9
36
0 5 10 15 20 25 30 35 40
Taxes (local, state, orfederal)
Crime
Employment
Education
Land Development
Economic Growth
Housing
Other Issues
Upstate
Downstate
Note: In the other responses (36%) include: drug use, traffic and parking, facilities and services for children, public utilities and fostering a more friendly community.

% of respondents satisfied with…
Satisfaction with local government and employment in 2007 were comparable to 2004 and 2005.
However, satisfaction with local public education declined in 2007 compared to 2005 (56% vs. 65%).
Community Satisfaction: 2004, 2005, 2007
31
46
57
35
50
65
33
49
56
0 10 20 30 40 50 60 70
Employment in NYS
City/Town Government
Public Education
2007
2005
2004

% of respondents satisfied with…by region.
Upstate residents are substantially more likely to be satisfied with local public education (70% vs. 45%) than downstate residents.
However, downstate residents are more likely to be satisfied with employment conditions in their local community (41% vs. 27%).
Community Satisfaction by Region: 2004, 2005, 2007
Dimension Upstate DownstateAll NYS
2007 2005 2004
Public Education
70 45 56 65 57
City/Town Government
53 48 49 50 46
Employment 27 41 33 35 31
% of all respondents who said…
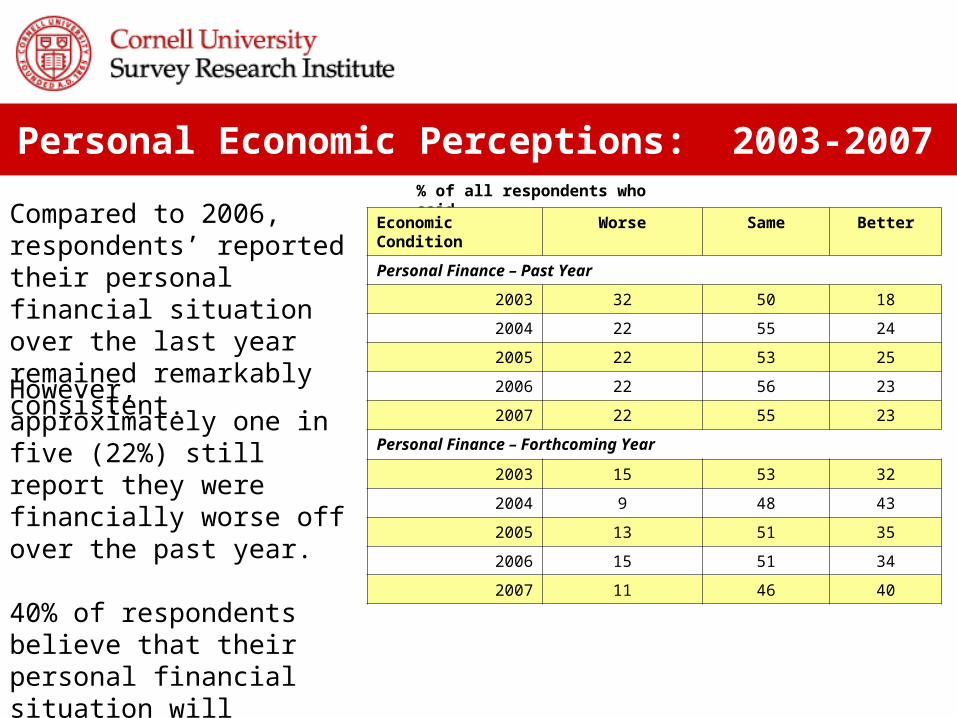
Compared to 2006, respondents’ reported their personal financial situation over the last year remained remarkably consistent.
However, approximately one in five (22%) still report they were financially worse off over the past year.
40% of respondents believe that their personal financial situation will improve over the next year. Only in 2004, were respondents more optimistic.
Personal Economic Perceptions: 2003-2007
Economic Condition Worse Same Better
Personal Finance – Past Year
2003 32 50 18
2004 22 55 24
2005 22 53 25
2006 22 56 23
2007 22 55 23
Personal Finance – Forthcoming Year
2003 15 53 32
2004 9 48 43
2005 13 51 35
2006 15 51 34
2007 11 46 40
22 2325 2421 21
5550
57
0
10
20
30
40
50
60
Worse Same Better
Personal Economic Perception
Pe
rce
nta
ge
of
Re
spo
nd
en
ts
All NYS
Upstate
Downstate
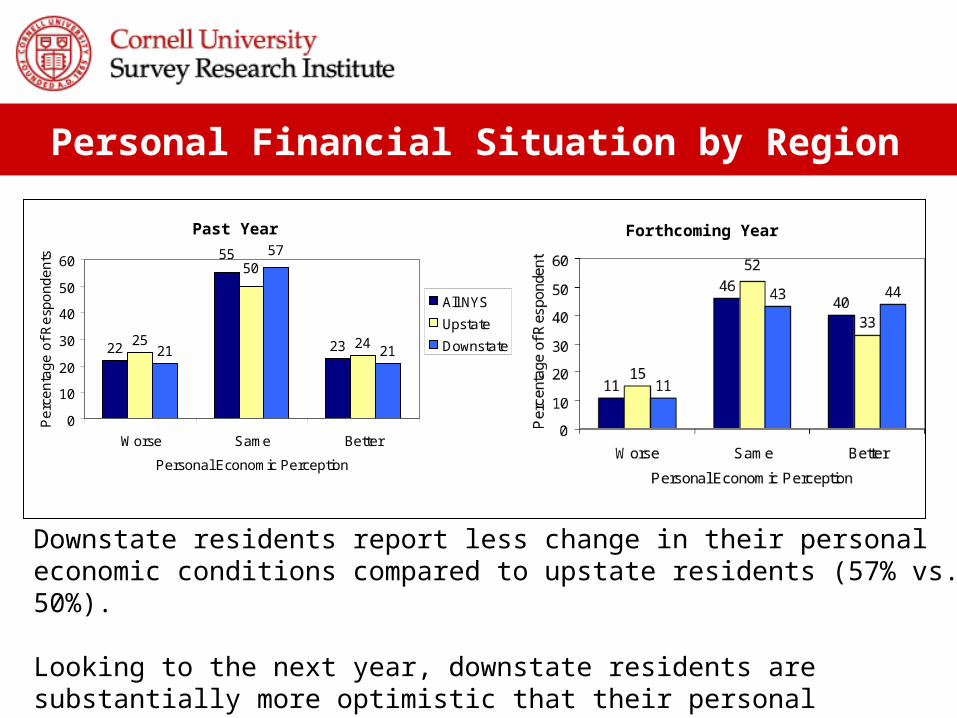
Downstate residents report less change in their personal economic conditions compared to upstate residents (57% vs. 50%).
Looking to the next year, downstate residents are substantially more optimistic that their personal financial conditions will improve compared to upstate residents (44% vs. 33% respectively).
Past Year Forthcoming Year
Personal Financial Situation by Region

The number of residents who believe the state economy is getting worse over the past year increased to 43% in 2007 from 36% in 2006.
The number of residents who expect the state economy to improve in the forthcoming year increased (from 23% in 2006 to 34% in 2007).
State Economic Perceptions: 2003-2007% of all respondents who said…
Economic Condition Worse Same Better
NYS Economy – Past Year
2003 79 17 3
2004 54 29 17
2005 50 34 16
2006 36 47 16
2007 43 37 20
NYS Economy – Forthcoming Year
2003 34 25 24
2004 27 39 34
2005 31 45 25
2006 25 52 23
2007 28 38 34
4337
20
50
41
9
3935
27
0
10
20
30
40
50
60
Worse Same Better
Perceptions of State Economy
Pe
rce
nta
ge
of
Re
spo
nd
en
ts
All NYS
Upstate
Downstate
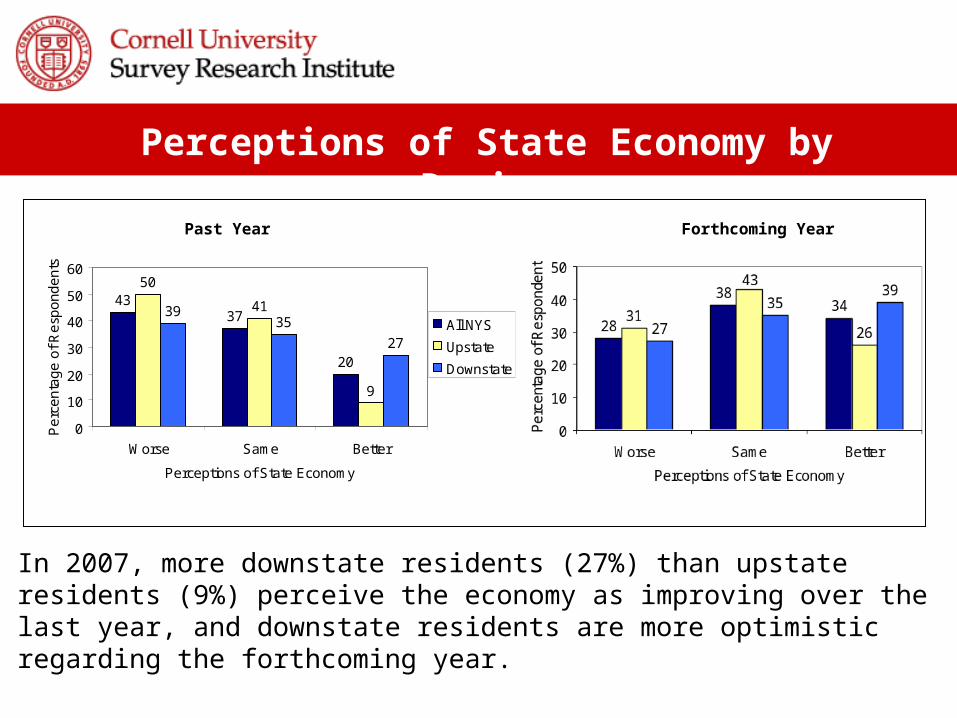
In 2007, more downstate residents (27%) than upstate residents (9%) perceive the economy as improving over the last year, and downstate residents are more optimistic regarding the forthcoming year.
Perceptions of State Economy by Region
Past Year Forthcoming Year

A parallel survey of 1000 New York State businesses closely mirrored those of the general population.
Business expectations for the state economy over the next year also matched those of the general population, except upstate businesses were somewhat more likely to believe the economy will be worse (35% vs. 29%) and less likely to believe that it will be better (29% vs. 37%) than the upstate general population.
Businesses in NYS – Perceptions of State Economic Conditions
Year% of all respondents
Worse Same Better
Perceptions of Past Year
2007 overall 44 37 19
- 2007 (upstate) 51 38 11
- 2007 (downstate) 39 36 24
Perceptions of Forthcoming Year
2007 overall 31 35 35
- 2007 (upstate) 35 36 29
- 2007 (downstate) 29 34 37
Business Perceptions

Statewide, there is least opposition marrying someone who is white and the most opposition to marrying someone who is black (4% vs. 16%, respectively).
Residents from upstate NY were more than twice as likely to oppose having a close relative marry someone who is black than residents from downstate NY (26% vs. 11%).
Social Distance in NYS by Race/Ethnicity Groups
4
16
11
11
5
26
16
17
3
11
10
8
0 5 10 15 20 25 30
White
Black
Asian
Hispanic
Downstate
Upstate
Statewide
% who oppose marriage of a close relative to someone who is…
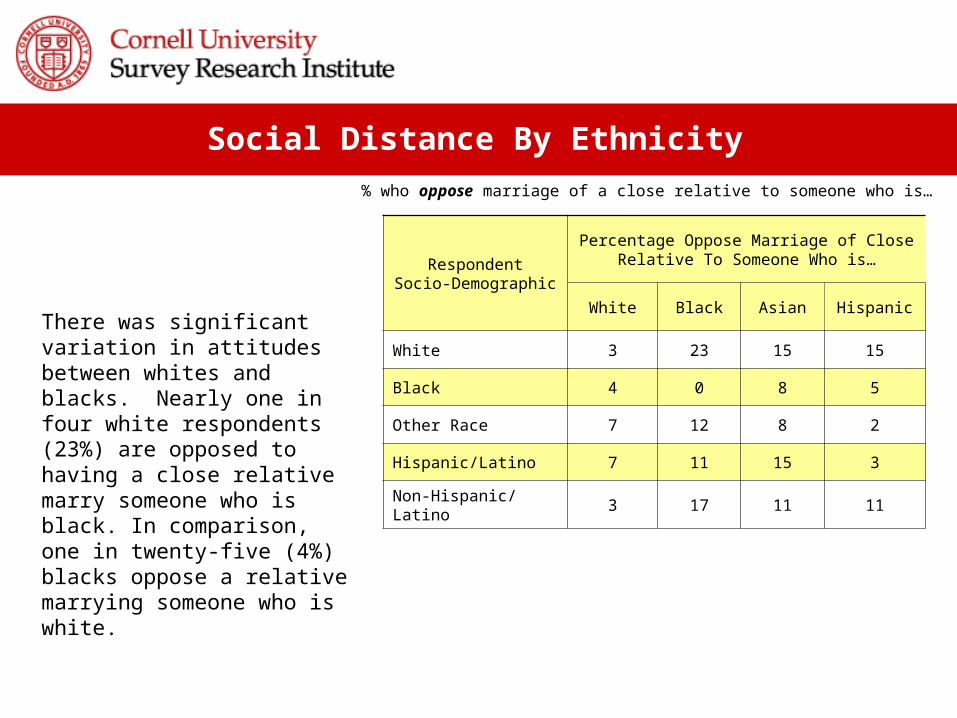
There was significant variation in attitudes between whites and blacks. Nearly one in four white respondents (23%) are opposed to having a close relative marry someone who is black. In comparison, one in twenty-five (4%) blacks oppose a relative marrying someone who is white.
Social Distance By Ethnicity
% who oppose marriage of a close relative to someone who is…
RespondentSocio-Demographic
Percentage Oppose Marriage of Close Relative To Someone Who is…
White Black Asian Hispanic
White 3 23 15 15
Black 4 0 8 5
Other Race 7 12 8 2
Hispanic/Latino 7 11 15 3
Non-Hispanic/Latino
3 17 11 11
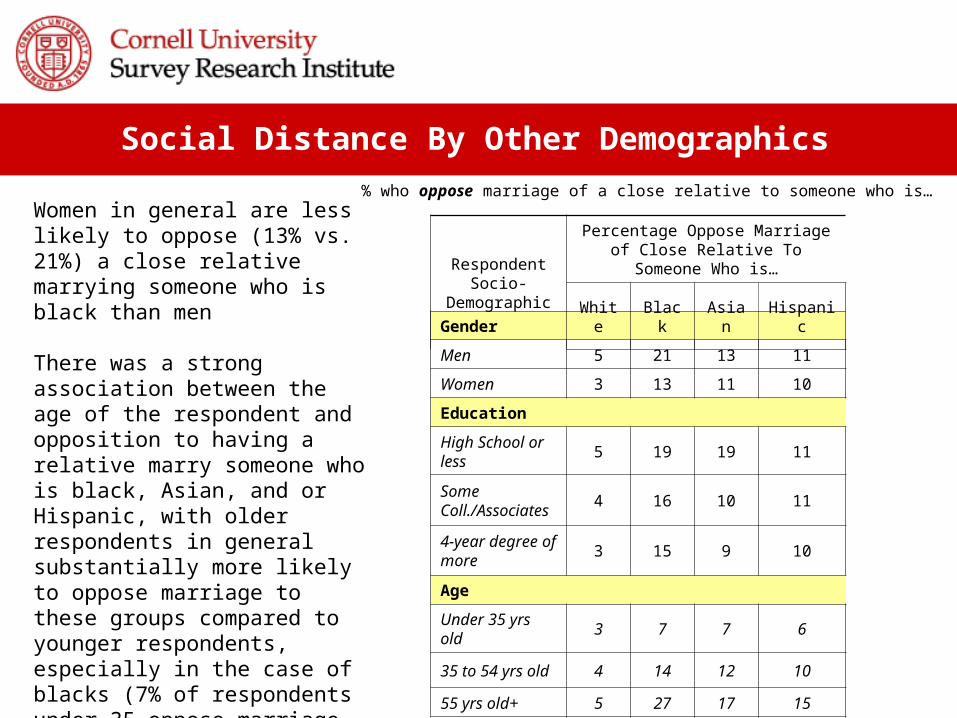
Women in general are less likely to oppose (13% vs. 21%) a close relative marrying someone who is black than men
There was a strong association between the age of the respondent and opposition to having a relative marry someone who is black, Asian, and or Hispanic, with older respondents in general substantially more likely to oppose marriage to these groups compared to younger respondents, especially in the case of blacks (7% of respondents under 35 oppose marriage to blacks compared to 27% of respondents who are 55 or older).
Social Distance By Other Demographics
% who oppose marriage of a close relative to someone who is…
Gender
Men 5 21 13 11
Women 3 13 11 10
Education
High School or less
5 19 19 11
Some Coll./Associates
4 16 10 11
4-year degree of more
3 15 9 10
Age
Under 35 yrs old
3 7 7 6
35 to 54 yrs old
4 14 12 10
55 yrs old+ 5 27 17 15
RespondentSocio-
Demographic
Percentage Oppose Marriage of Close Relative To Someone
Who is…
White
Black
AsianHispani
c

Statewide, a majority oppose having a close relative marrying someone who is of the same gender.
Favor/Oppose Same-Sex Marriage
% who oppose marriage of a close relative to someone who is…
44
52
43
52
44
51
0
10
20
30
40
50
60
Favor Oppose
Per
cen
tag
e o
f R
esp
on
den
ts
Statewide
Upstate
Downstate

In 2007, 63% of New York State residents believe that they will be living within their current community in five years (this is down from 70% in 2006)
Only 59% of downstate compared to 69% of upstate will be living in their community in 5 years.Downstate experiences overall higher resident mobility than upstate New York, but upstate residents are more likely to leave New York State altogether.
Mobility by Region
70
3
63
3
76
2
2734
24
0
1020
30
40
5060
70
80
Stay in NYS Leave NYS UndecidedP
erce
ntag
e of
Res
pond
ents
All NYS
Upstate
Downstate
Of Those Leaving Their Community
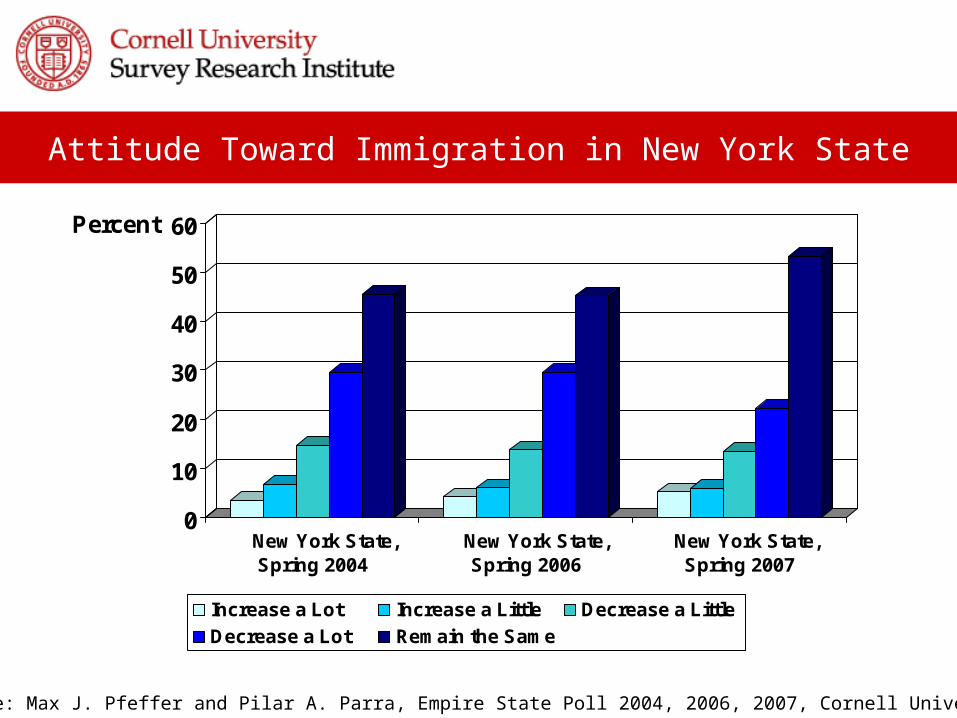
Attitude Toward Immigration in New York State
Source: Max J. Pfeffer and Pilar A. Parra, Empire State Poll 2004, 2006, 2007, Cornell University
0
10
20
30
40
50
60Percent
New York State,Spring 2004
New York State,Spring 2006
New York State,Spring 2007
Increase a Lot Increase a Little Decrease a Little
Decrease a Lot Remain the Same

Proportion of New Yorkers Who Consider Immigrants to Be an Asset or Burden
05
101520253035404550
Burden Neither AssetNor Burden
Both Asset andBurden
Asset
Non-Latino Latino
Source: Max J. Pfeffer and Pilar A. Parra, Empire State Poll 2007, Cornell University

Proportion of New Yorkers Who Think Their City or Township Should Provide Support to Immigrants
0
10
20
30
40
City/Township Helps Find Affordable Housing
Not at All Important
Somewhat Unimportant
Neutral
Somewhat Important
Very Important
0
20
40
60
80
City/Township Provides English Language Training
Not at All Important
Somewhat Unimportant
Neutral
Somewhat Important
Very Important
Source: Max J. Pfeffer and Pilar A. Parra, Empire State Poll 2007, Cornell University
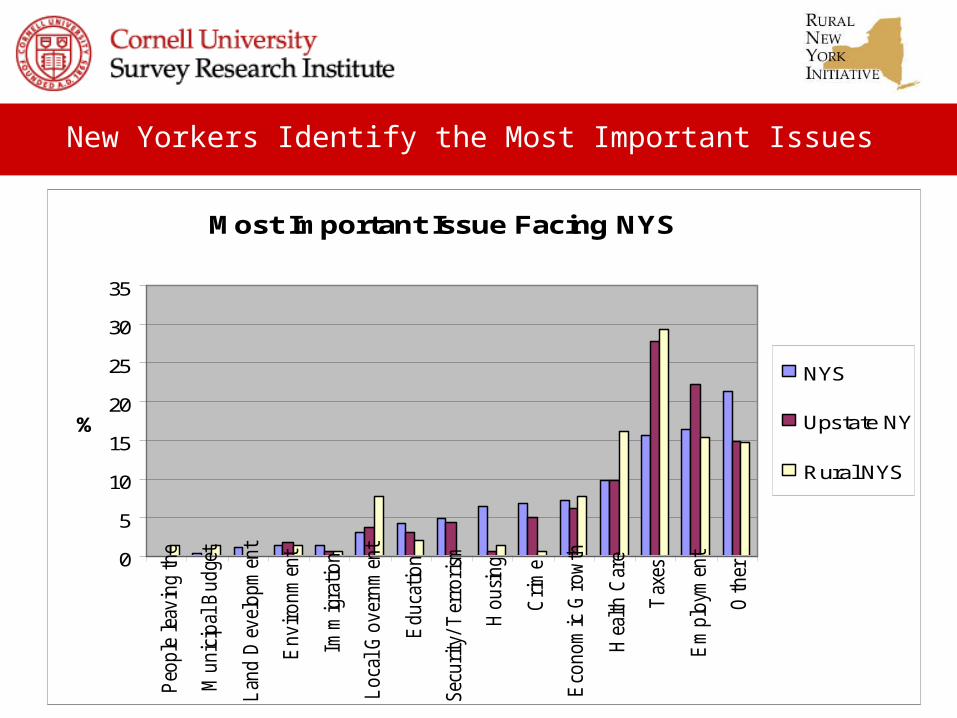
New Yorkers Identify the Most Important Issues
Most Important Issue Facing NYS
0
5
10
15
20
25
30
35
Peo
ple lea
vin
g th
e
Municip
al B
udge
t
Lan
d D
evelopm
ent
Environm
ent
Imm
igra
tion
Loca
l G
over
nm
ent
Educa
tion
Sec
urity
/Ter
rorism
Housing
Crim
e
Eco
nom
ic G
rowth
Hea
lth C
are
Tax
es
Em
plo
ymen
t
Oth
er
NYS
Upstate NY
Rural NYS

Other topics on the Empire State Poll 2006 include:
• Preferences for locally produced foods.• Border fencing.• Wildlife management. • Nanotechnology.•. Healthcare in schools. • West nile virus• Youth obesity.• Media use.
What topics are of interest to you?
Other ESP Topics
Thank You
For more information, please visit:
http://www.sri.cornell.edu/
Related Documents