November 13, 2017 Rakuten, Inc.

Welcome message from author
This document is posted to help you gain knowledge. Please leave a comment to let me know what you think about it! Share it to your friends and learn new things together.
Transcript

November 13, 2017
Rakuten, Inc.

2

3 3
Global GTV: +21.6% YoY
Non-GAAP OI: +91.6% YoY boosted by successful data-centric investment strategy
Domestic E-Commerce GMS: +13.7% YoY, OI -6.7% YoY on investments in C2C and
start-up businesses
FinTech: stable revenue growth at Rakuten Card, strong OI growth at Rakuten Bank,
Rakuten Securities bounced back
Raising brand awareness: partnering with Golden State Warriors

4 4
(JPY bn, IFRS)
Q3/16 Q3/17 YoY
Revenue 190.5 236.4 +24.1%
Non-GAAP Operating Income 30.2 57.8 +91.6%
IFRS Operating Income 26.4 51.5 +95.4%
5 5
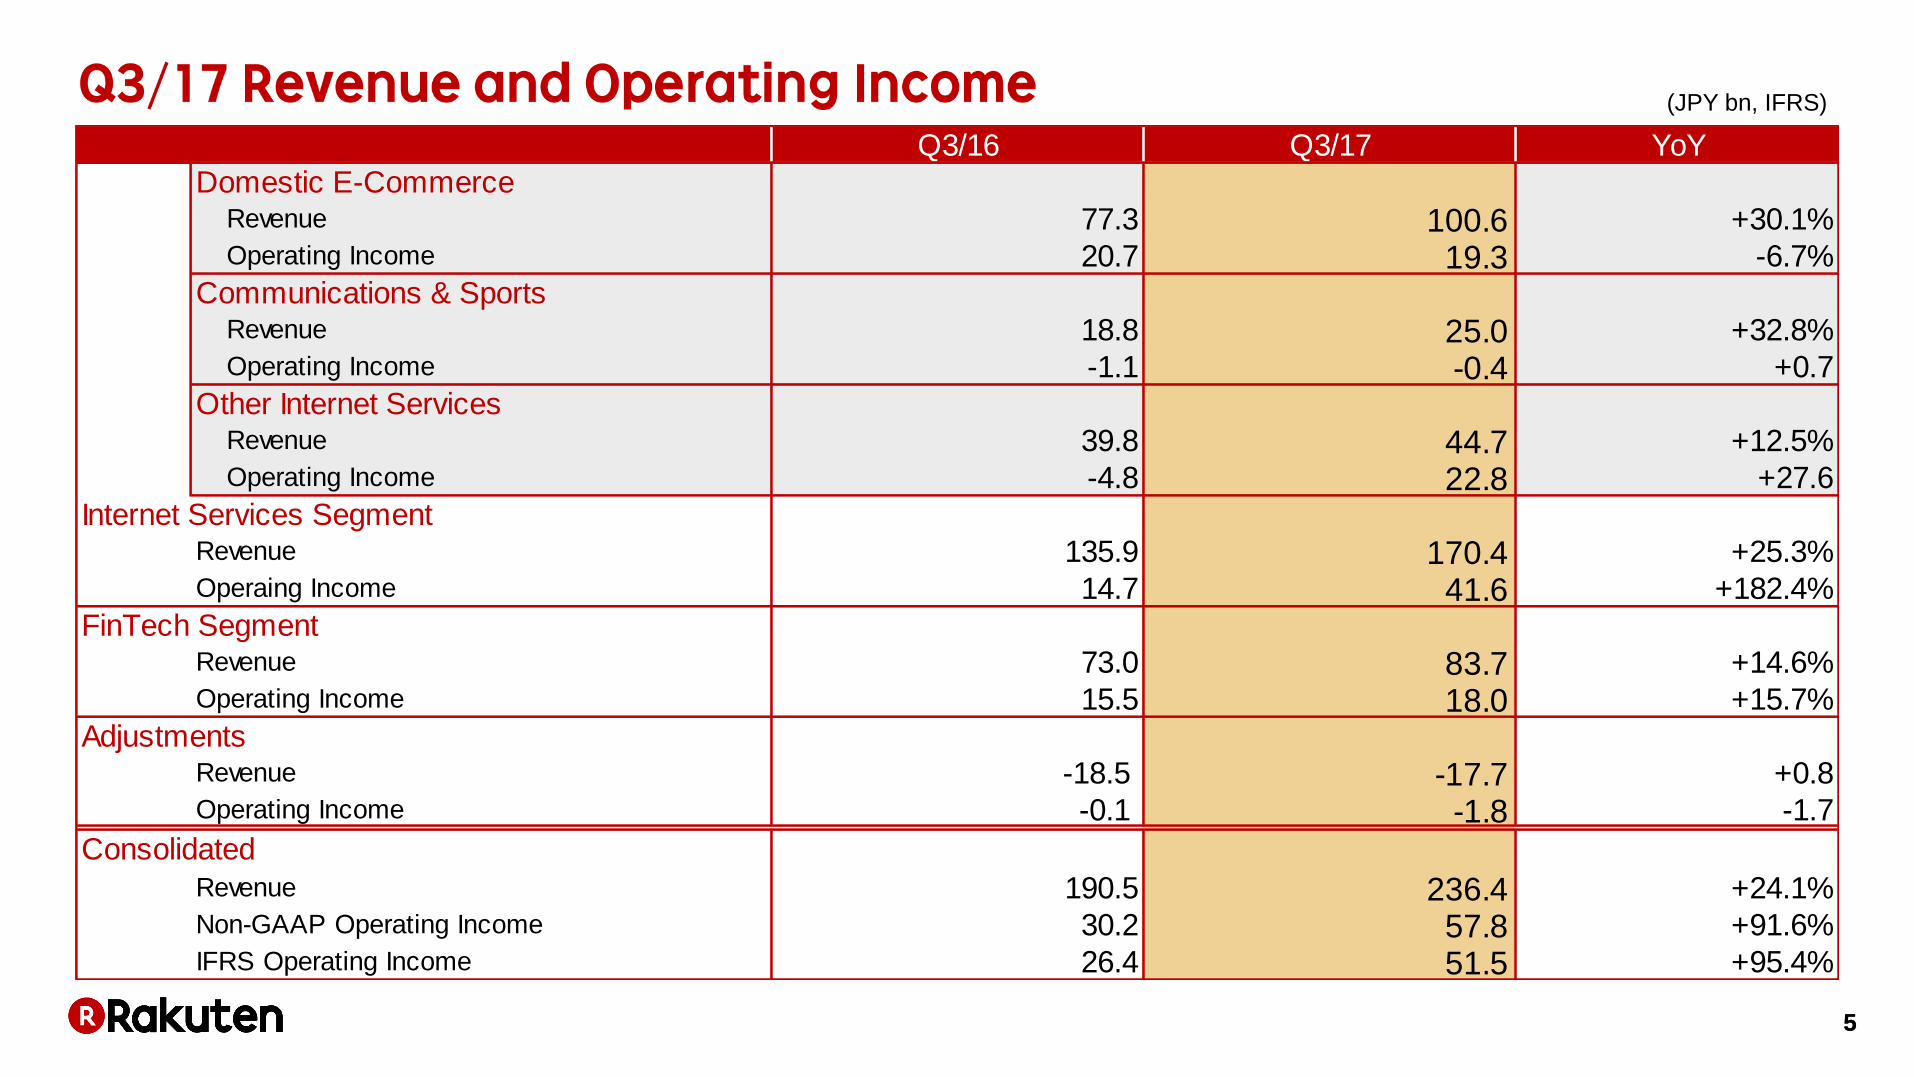
(JPY bn, IFRS)
Q3/16 Q3/17 YoY
Domestic E-Commerce
Revenue 77.3 100.6 +30.1%Operating Income 20.7 19.3 -6.7%
Communications & SportsRevenue 18.8 25.0 +32.8%Operating Income -1.1 -0.4 +0.7
Other Internet ServicesRevenue 39.8 44.7 +12.5%Operating Income -4.8 22.8 +27.6
Internet Services SegmentRevenue 135.9 170.4 +25.3%Operaing Income 14.7 41.6 +182.4%
FinTech SegmentRevenue 73.0 83.7 +14.6%Operating Income 15.5 18.0 +15.7%
AdjustmentsRevenue -18.5 -17.7 +0.8Operating Income -0.1 -1.8 -1.7
Consolidated
Revenue 190.5 236.4 +24.1%Non-GAAP Operating Income 30.2 57.8 +91.6%IFRS Operating Income 26.4 51.5 +95.4%

6
(JPY bn, IFRS)
Q3/16 Q3/17 YoY
Domestic E-Commerce
Revenue 77.3 100.6 +30.1%
EBITDA 22.8 22.3 -2.3%
Communications & Sports
Revenue 18.8 25.0 +32.8%
EBITDA -0.1 1.0 +1.0
Other Internet Services
Revenue 39.8 44.7 +12.5%
EBITDA -1.9 25.4 +27.2
Internet Services Segment
Revenue 135.9 170.4 +25.3%
EBITDA 20.9 48.6 +133.1%
FinTech Segment
Revenue 73.0 83.7 +14.6%
EBITDA 19.8 23.6 +18.9%
Adjustments
Revenue -18.5 -17.7 +0.8
EBITDA -0.6 -1.9 -1.2
Consolidated
Revenue 190.5 236.4 +24.1%
Non-GAAP EBITDA 40.1 70.4 +75.6%

7
+21.6% YoY
* Global Gross Transaction Value = Domestic E-Commerce GMS + Credit Card GTV + Edy GTV + Rakuten Point Card GTV + Overseas E-Commerce GMS + Ebates GMS
+ Digital Contents GTV + Rakuten Marketing GTV * Includes intercompany transactions for settlement and affiliate services
(JPY tn)

8
*1: Domestic E-Commerce GMS includes consumption tax. Consumption tax not included in GMS for businesses not required to pay consumption tax.
GMS comprises Ichiba, Travel GTV on checkout basis, Books, Golf, Ticket, Stylife, Dream businesses, Video streaming, Dining, Beauty, Mart, Delivery,
Rakuten Direct(Soukai Drug, Kenko.com) Energy, Car Life, Rakuten Pay, Coupon, Rakuma, FRIL, Rakubin, Rebates etc. *2: Definition of GMS for first party businesses was revised mainly upon the merger between Soukai Drug and Kenko.com. This has resulted in retroactive adjustments to
Domestic E-Commerce GMS
+13.7% YoY
(JPY bn)

9 9
Valuation Gains from Ride-Sharing Investment
JPY 22.8 bn Profit on Sale of The Grommet
JPY 5.0 bn
*1
*2
*1: JPY 21.3bn is included in Other Internet Services and JPY 1.5bn included in Adjustments
*2: JPY 4.7bn is included in Other Internet Services and JPY 0.3bn included in Adjustments
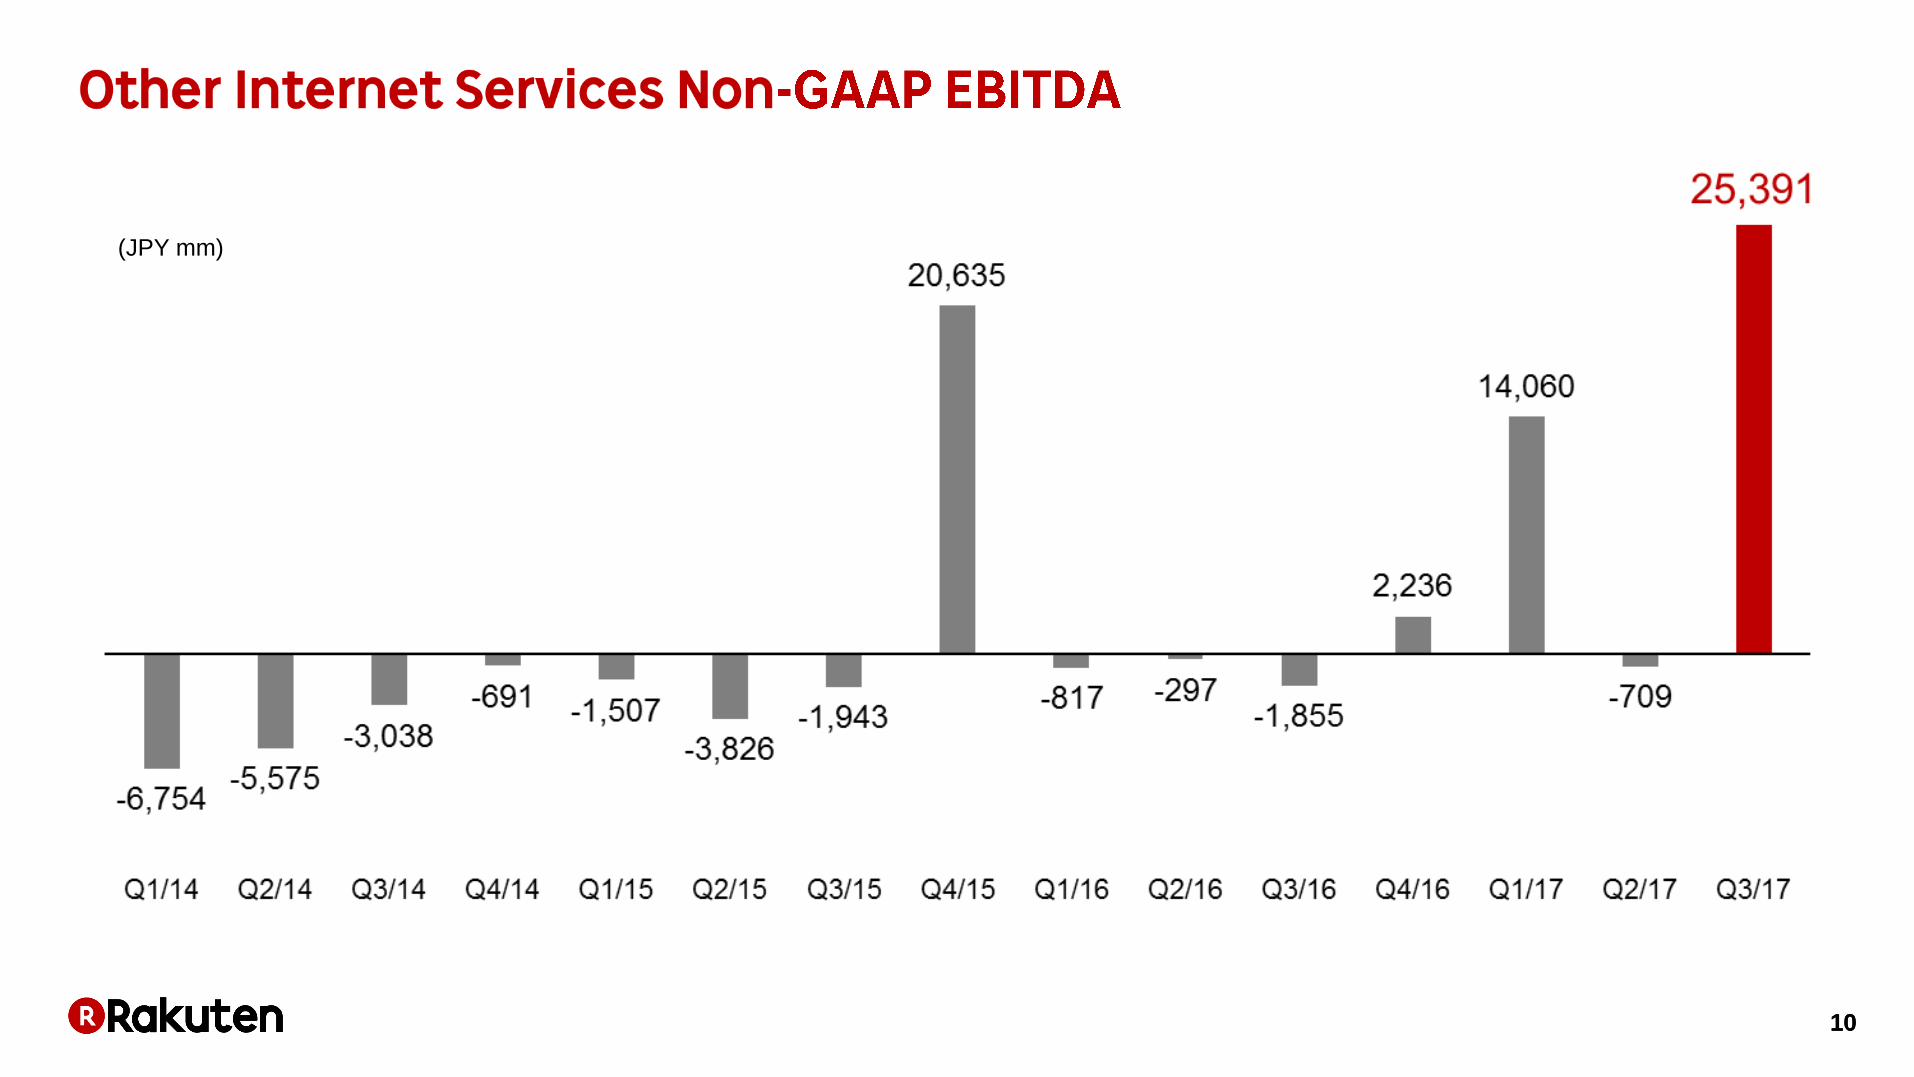
10 10
(JPY mm)

11 11

12
Rakuten became the NBA’s exclusive distribution partner in Japan
NBA League Pass powered by Rakuten, will be limited to Rakuten members in Japan
Subscription package on Rakuten TV in Japan
13

14 14
Big
Data
Internet FinTech
Media Investments
Concept Vision
Sourcing
Adding
Value
Screening by Big Data
Leveraging Rakuten global network
Venture/Investment community at
global level
Providing various management
know-how such as marketing and
KPI management
Adding corporate value utilizing
Big Data
Director level and hands-on support
Brand

15 15
Internet Services Fin-Tech
Ride-sharing Healthcare

16
+1,065
(USD mm)
ROI
+70%
IRR
+34%
1,508
2,573
Initial Investment (2012-2017)
Fair Value (as of end September 2017)
Gain
17 17
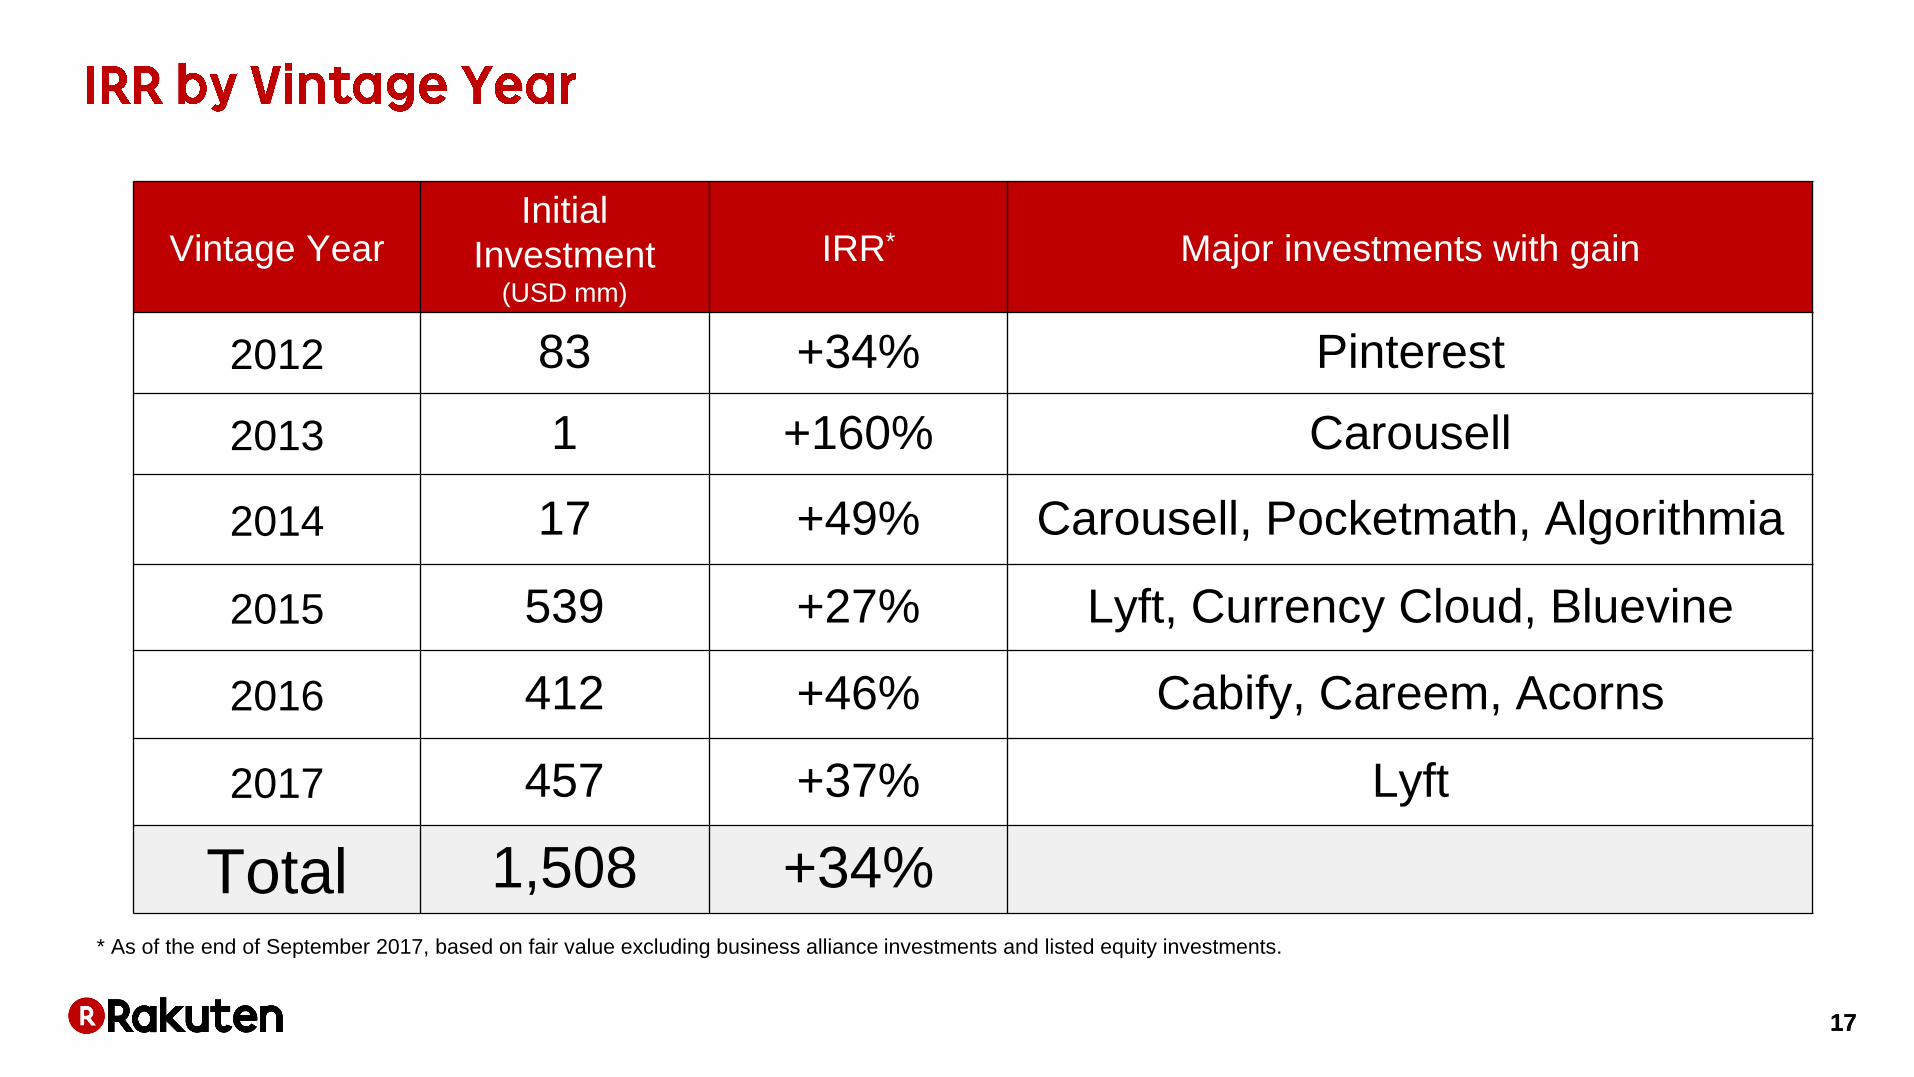
Vintage Year Initial
Investment (USD mm)
IRR* Major investments with gain
2012 83 +34% Pinterest
2013 1 +160% Carousell
2014 17 +49% Carousell, Pocketmath, Algorithmia
2015 539 +27% Lyft, Currency Cloud, Bluevine
2016 412 +46% Cabify, Careem, Acorns
2017 457 +37% Lyft
Total 1,508 +34% * As of the end of September 2017, based on fair value excluding business alliance investments and listed equity investments.

18
19
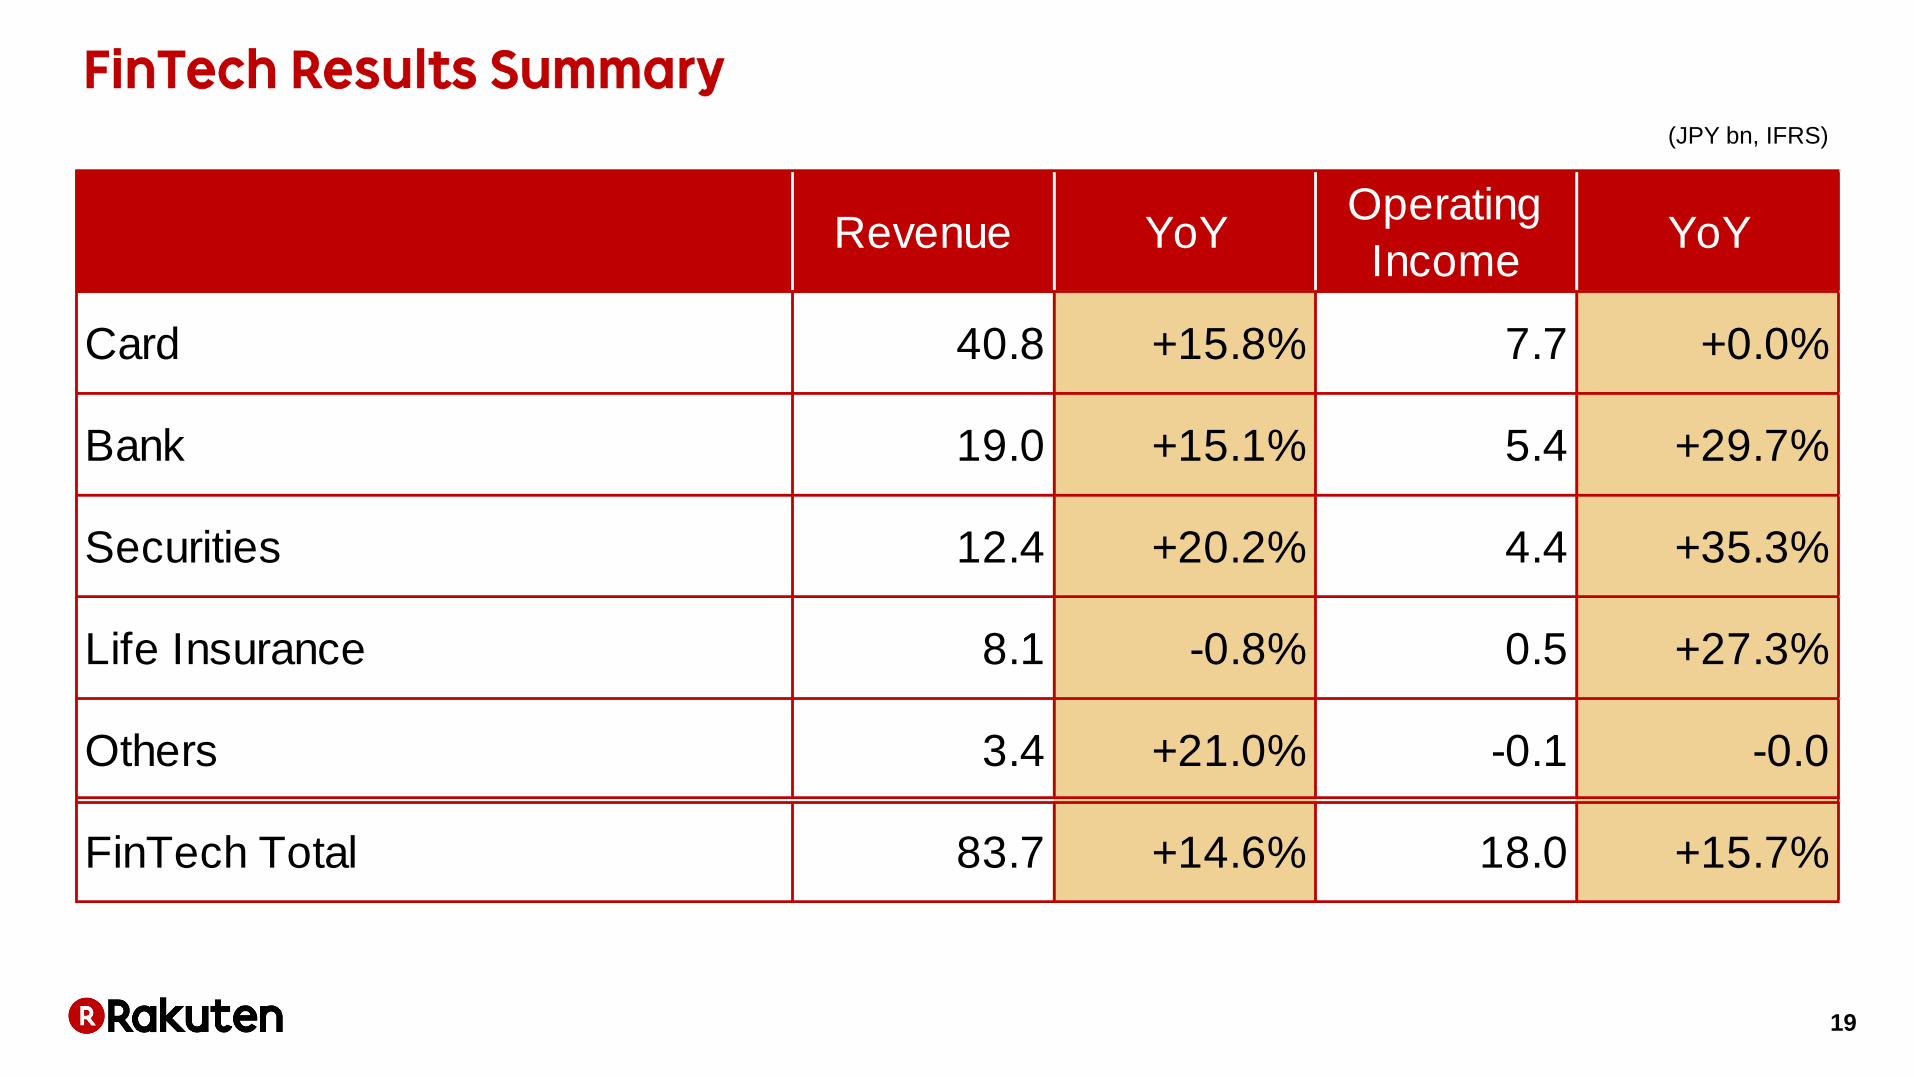
(JPY bn, IFRS)
Revenue YoYOperating
IncomeYoY
Card 40.8 +15.8% 7.7 +0.0%
Bank 19.0 +15.1% 5.4 +29.7%
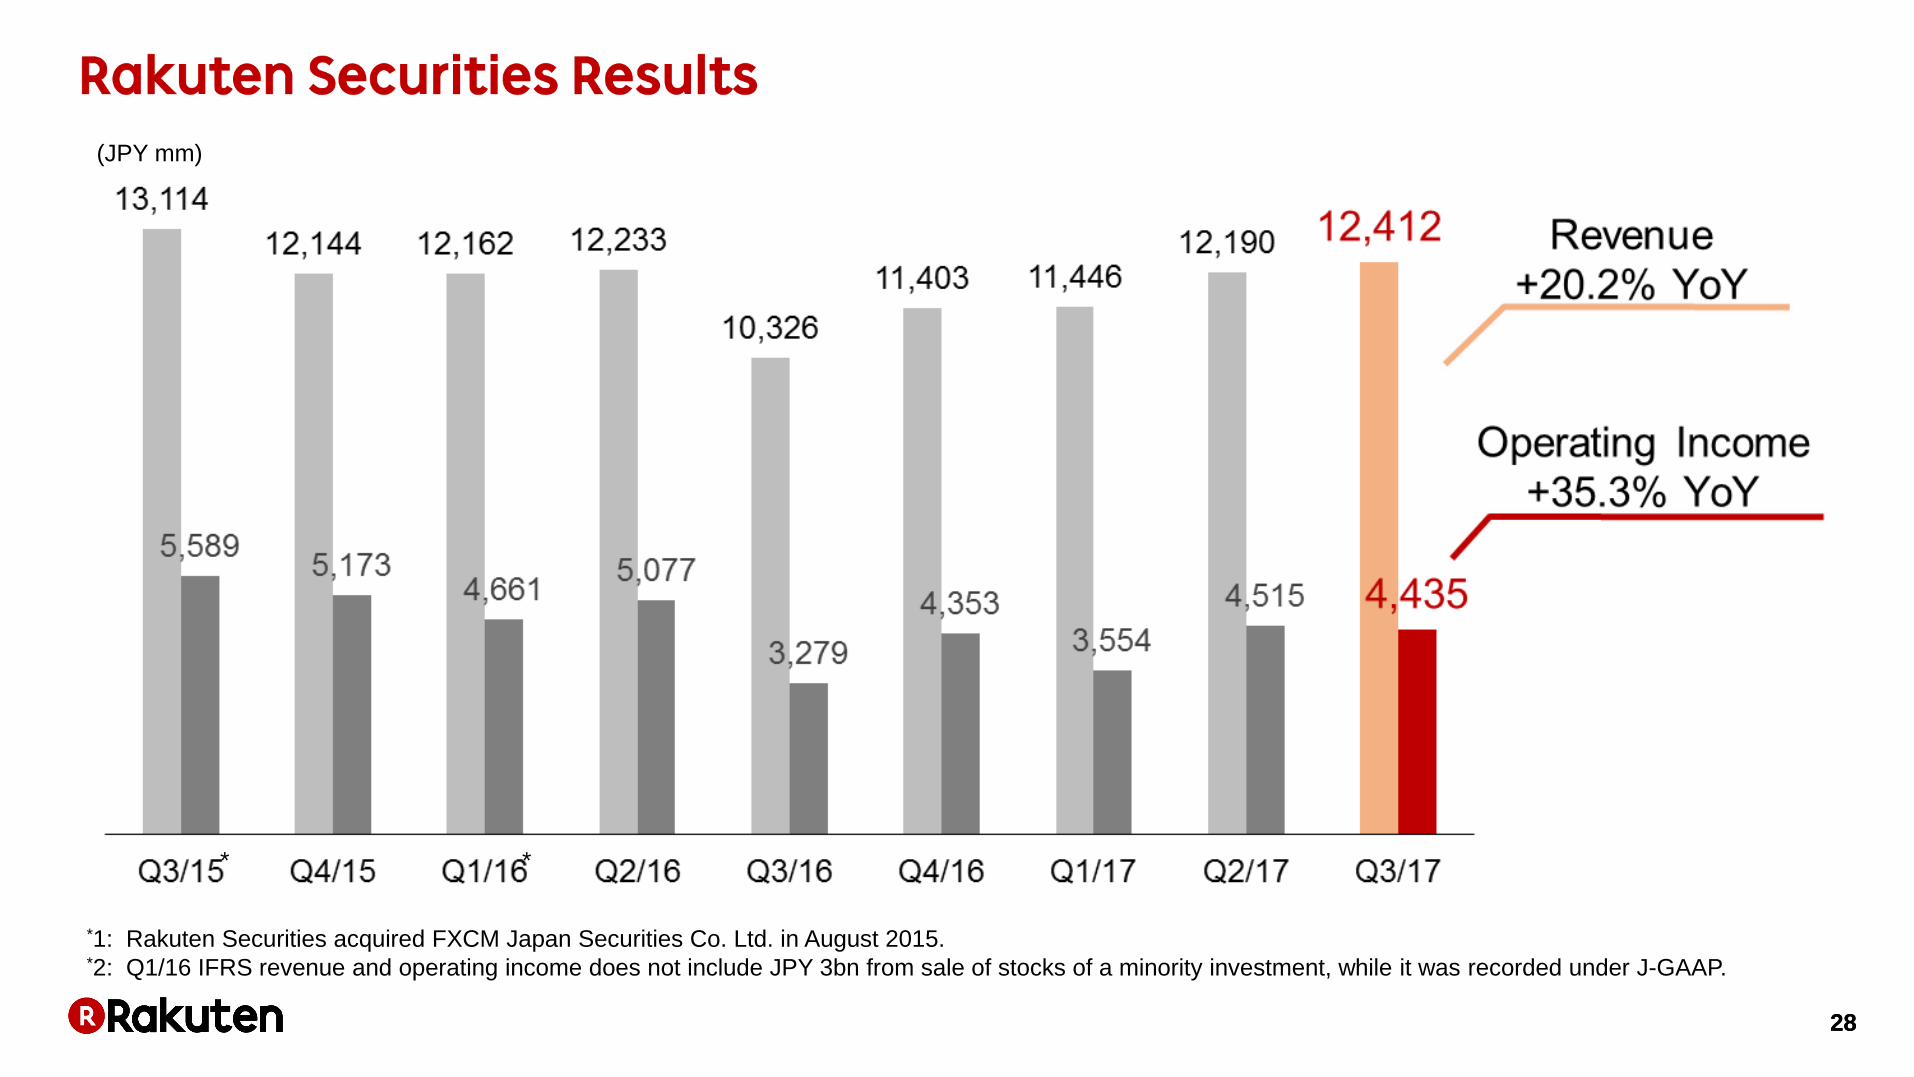
Securities 12.4 +20.2% 4.4 +35.3%
Life Insurance 8.1 -0.8% 0.5 +27.3%
Others 3.4 +21.0% -0.1 -0.0
FinTech Total 83.7 +14.6% 18.0 +15.7%
再鑑Ohno
17/10/31

20
(JPY mm)
* New system installation cost: JPY 0.8bn
21
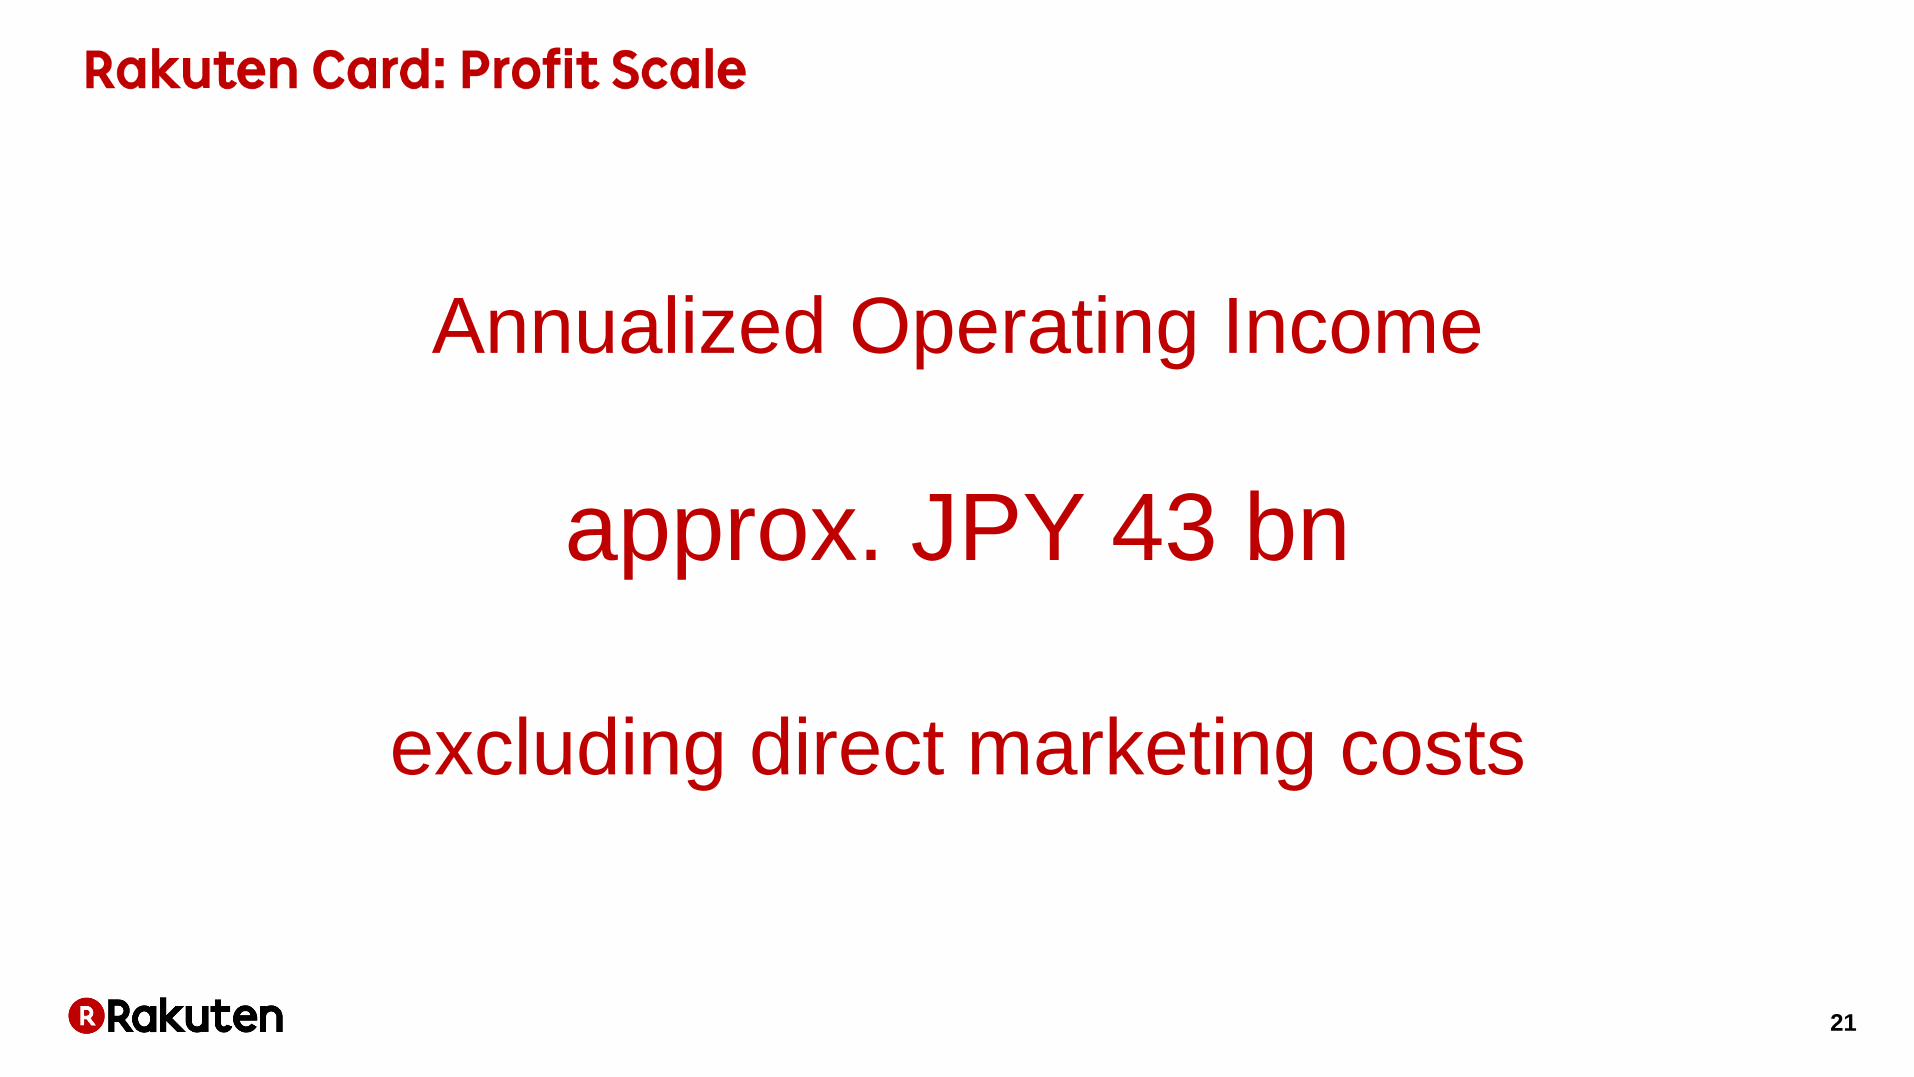
Annualized Operating Income
approx. JPY 43 bn
excluding direct marketing costs

22
* Calculated on a managerial accounting basis, using different definitions from data in the Appendix.
Detailed credit card data is shown in the Appendix. Revolving balance is calculated on a principal basis.
再鑑Ohno
17/10/31
23
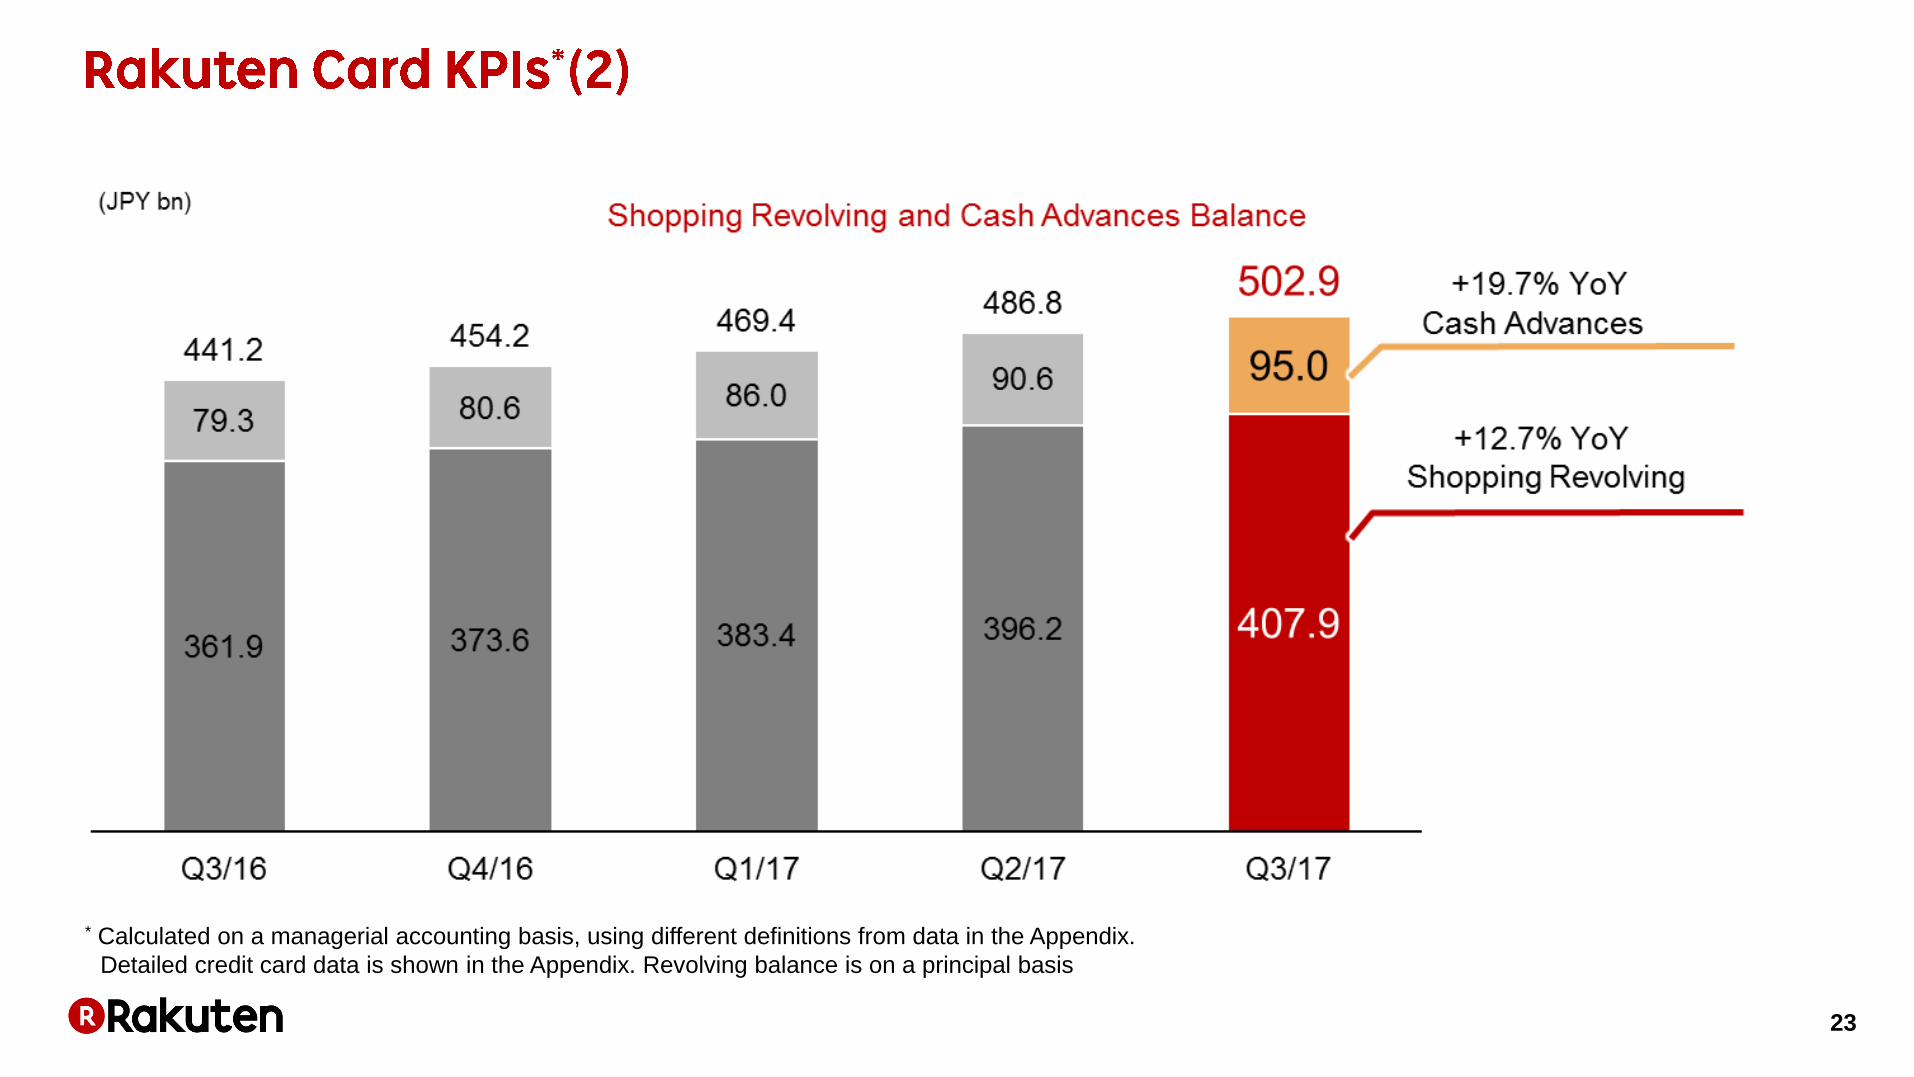
* Calculated on a managerial accounting basis, using different definitions from data in the Appendix.
Detailed credit card data is shown in the Appendix. Revolving balance is on a principal basis
再鑑Ohno
17/10/31
24
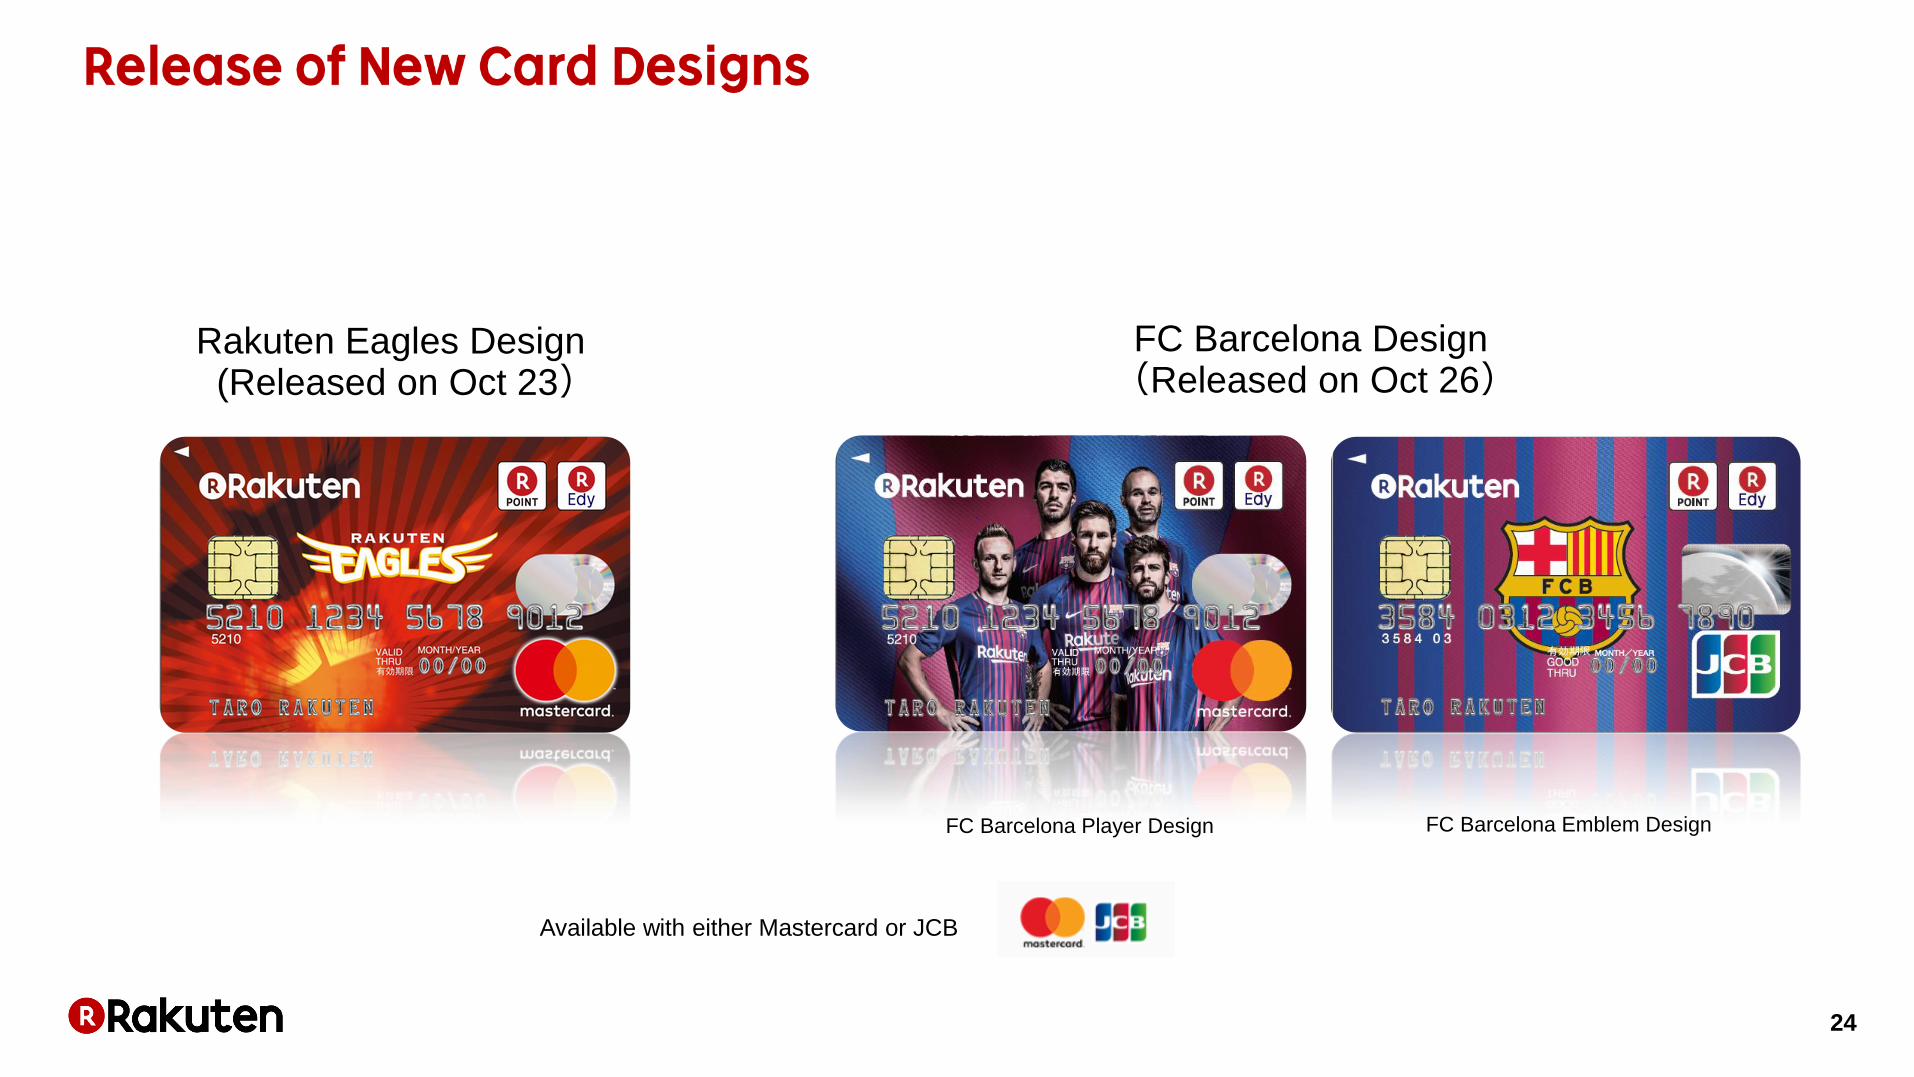
FC Barcelona Design (Released on Oct 26)
Available with either Mastercard or JCB
FC Barcelona Player Design FC Barcelona Emblem Design
Rakuten Eagles Design (Released on Oct 23)
再鑑Ohno
17/10/31

25
*1 Source: Kinzai Institute of Financial Affairs, Inc., Credit Saison, Aeon Financial and Rakuten Card. Data of Sumitomo Mitsui Card is not available.
*2 Credit card issuer basis.
(JPY bn) Rakuten Card
Aeon Financial Service
Credit Saison
Mitsubishi UFJ NICOS

26 26
(JPY mm)
再鑑Ohno
17/10/31

27
Loan receivables and loan customers include foreclosed credit guarantees of Rakuten Card Co., Ltd.
Saikan
Updated
28 28
(JPY mm)
再鑑Ohno
17/10/31
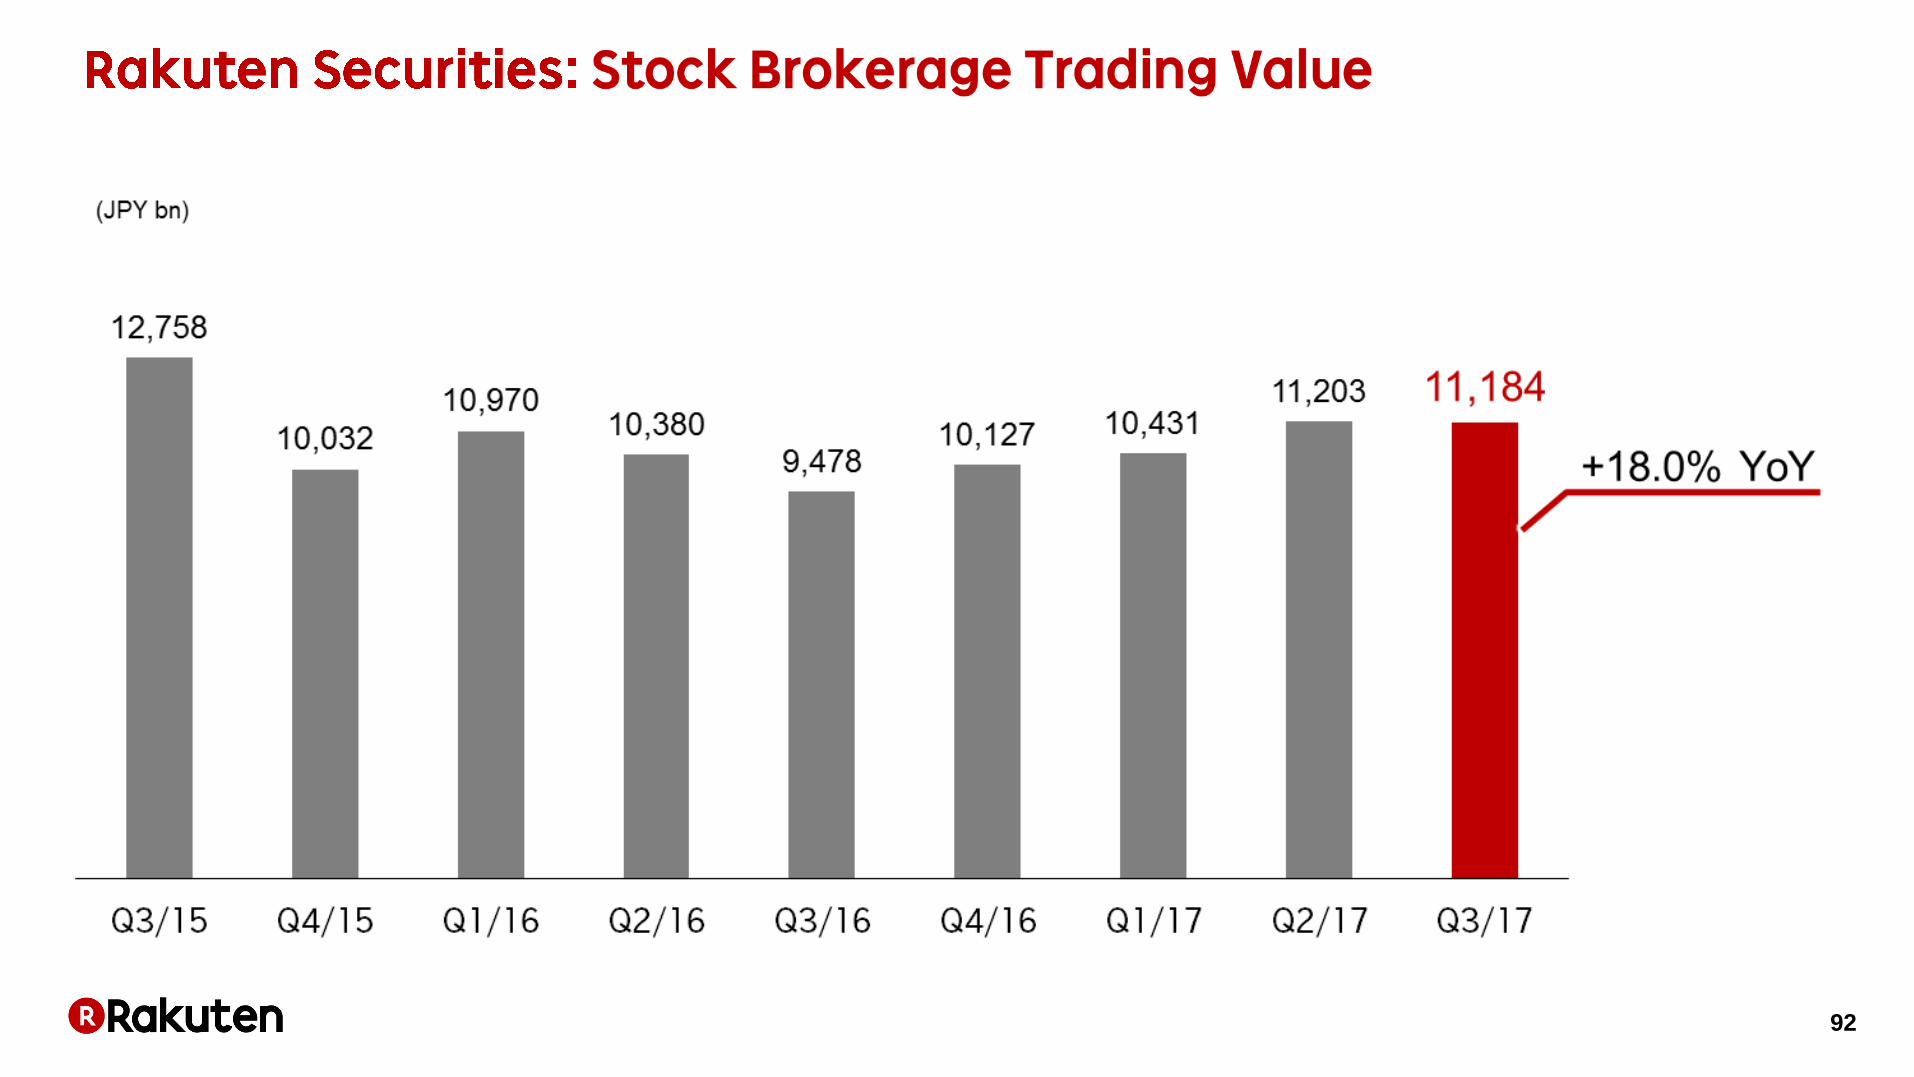
*1: Rakuten Securities acquired FXCM Japan Securities Co. Ltd. in August 2015. *2: Q1/16 IFRS revenue and operating income does not include JPY 3bn from sale of stocks of a minority investment, while it was recorded under J-GAAP.
* *

29 29
Investment Trusts:Purchase with Points (1 yen = 1 Point, minimum purchase with 100 yen)
Rakuten Super Points
Points Granted on
Rakuten Securities Transaction
Rakuten Securities
* Comparison with domestic securities companies as of August 10, 2017 (Rakuten’s research)
再鑑Ohno
17/10/31

30
* From Q1/17, the standard used for calculating insurance policy reserves was changed. This has resulted in retroactive adjustments to consolidated results, but
have not been applied to segment results.
-0.8% YoY +43.7% YoY
Revenue Retroactively Adjusted OI*
(JPY mm) (JPY mm)

31
* Excluding policies of mutual aid association business transferred in 2008, and one-year cancer insurance for eligible Rakuten members which started from Q4/14
再鑑Ohno
17/10/31
32
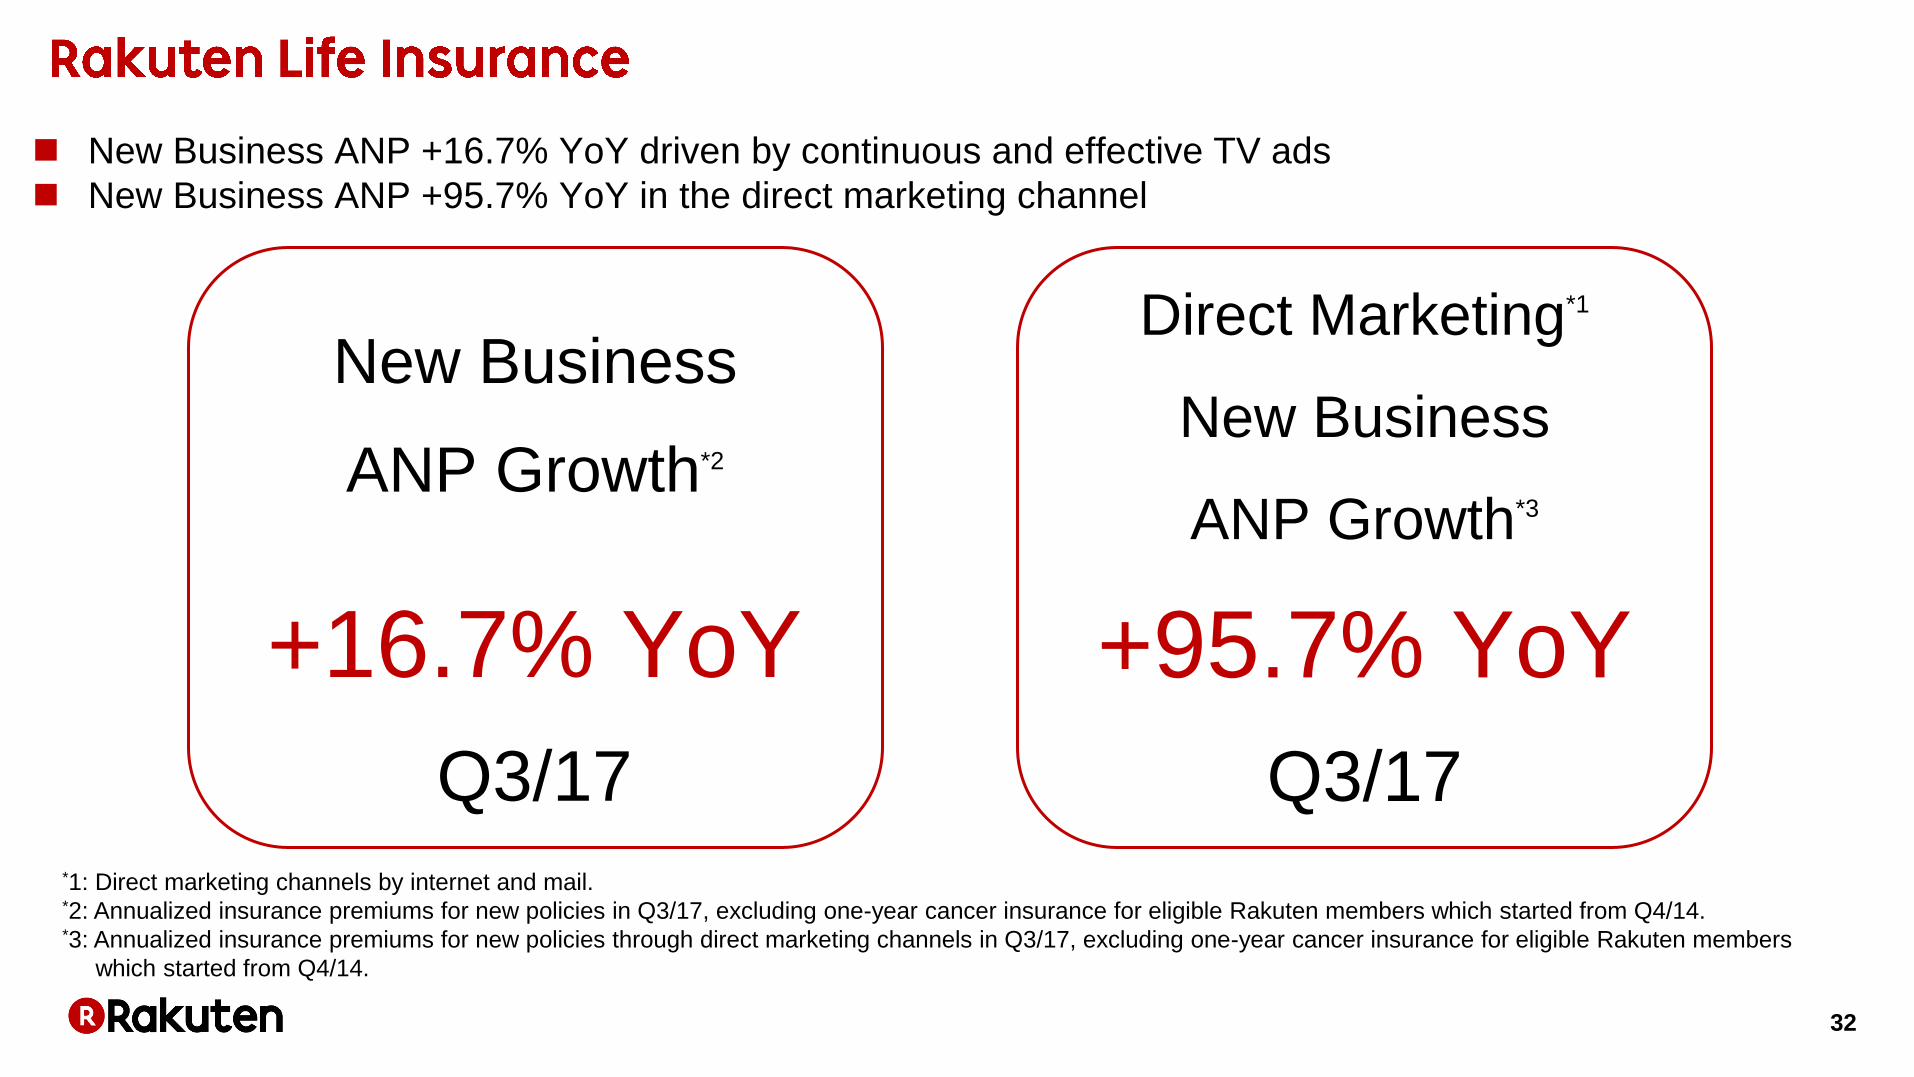
New Business ANP +16.7% YoY driven by continuous and effective TV ads
New Business ANP +95.7% YoY in the direct marketing channel
New Business
ANP Growth*2
+16.7% YoY
Q3/17
Direct Marketing*1
New Business
ANP Growth*3
+95.7% YoY
Q3/17 *1: Direct marketing channels by internet and mail. *2: Annualized insurance premiums for new policies in Q3/17, excluding one-year cancer insurance for eligible Rakuten members which started from Q4/14. *3: Annualized insurance premiums for new policies through direct marketing channels in Q3/17, excluding one-year cancer insurance for eligible Rakuten members
which started from Q4/14.
再鑑Ohno
17/10/31
+16.7% YoY
Q3/17

33

34
+13.7% YoY
(JPY bn)
*1: Domestic E-Commerce GMS includes consumption tax. Consumption tax not included in GMS for businesses not required to pay consumption tax.
GMS comprises Ichiba, Travel GTV on checkout basis, Books, Golf, Ticket, Stylife, Dream businesses, Video streaming, Dining, Beauty, Mart, Delivery,
Rakuten Direct(Soukai Drug, Kenko.com) Energy, Car Life, Rakuten Pay, Coupon, Rakuma, FRIL, Rakubin, Rebates etc. *2: Definition of GMS for first party businesses was revised mainly upon the merger between Soukai Drug and Kenko.com. This has resulted in retroactive adjustments to
Domestic E-Commerce GMS
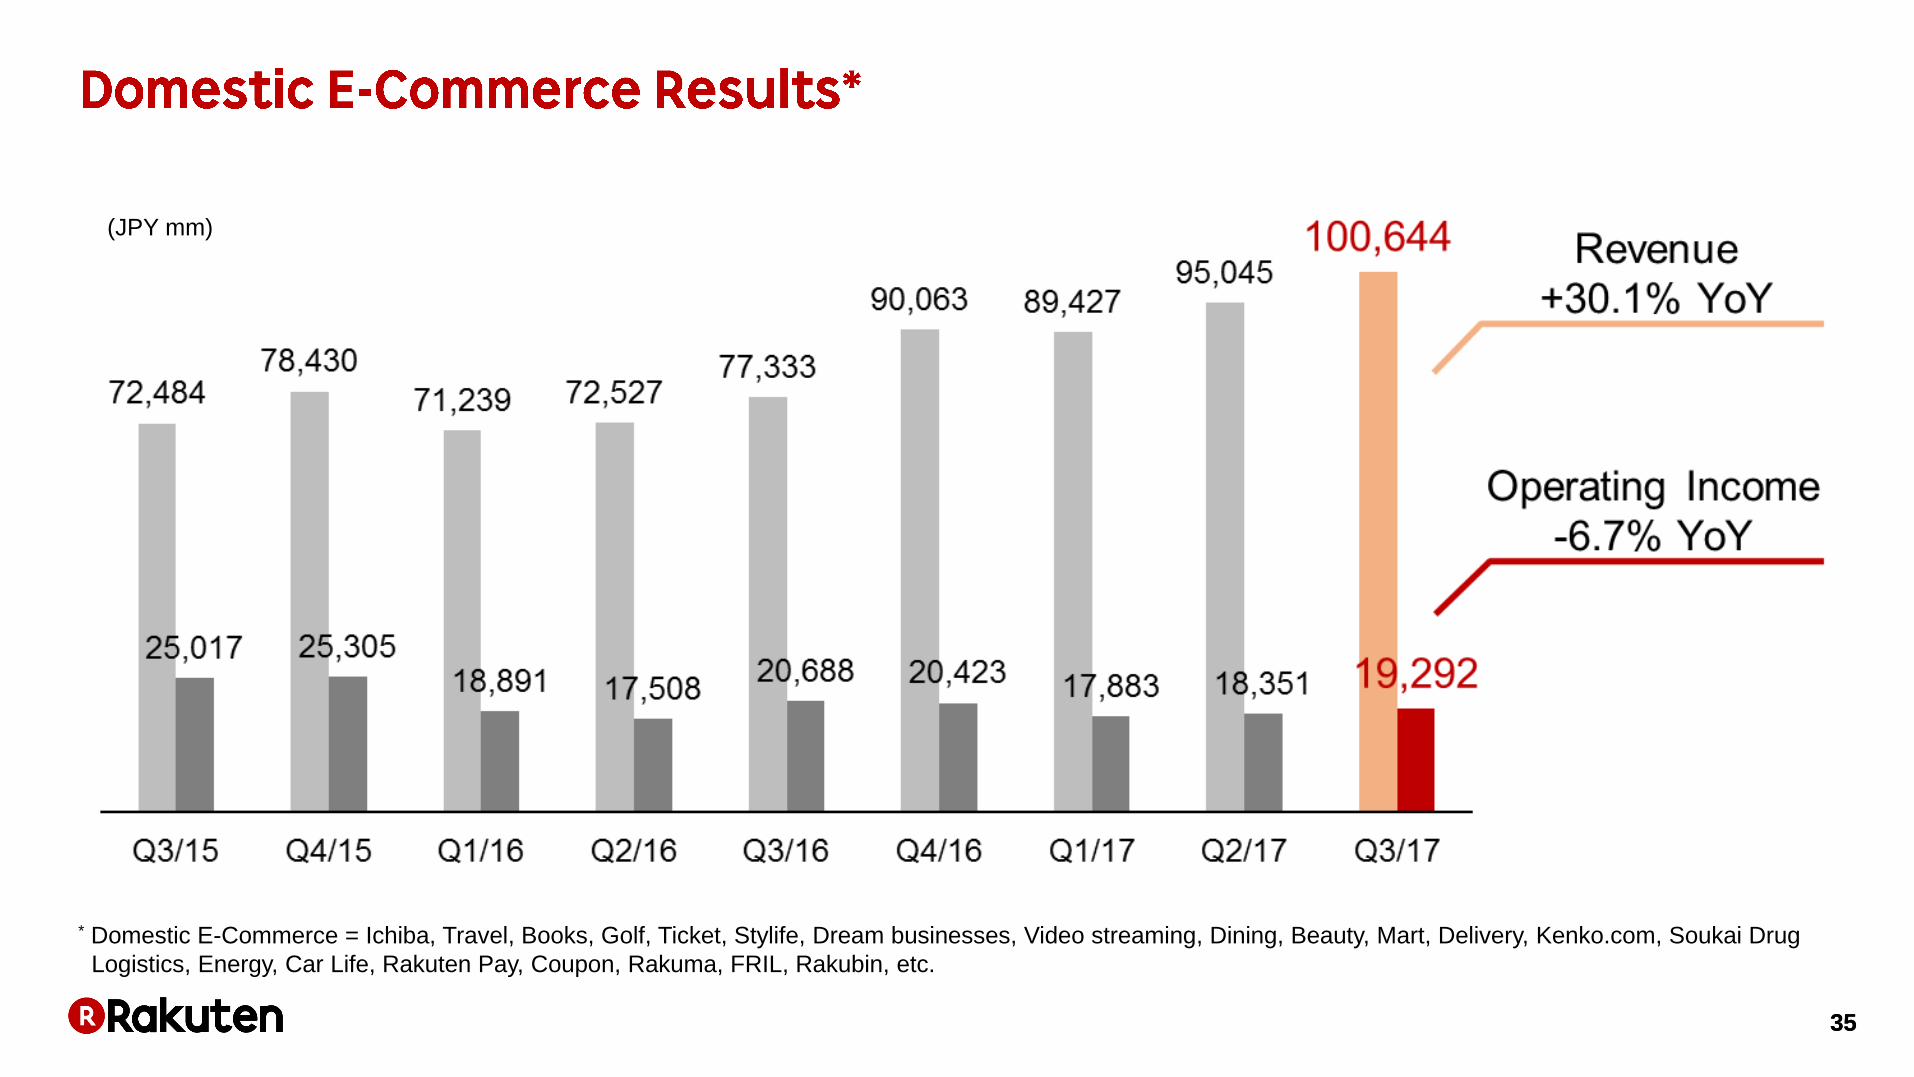
35 35
(JPY mm)
* Domestic E-Commerce = Ichiba, Travel, Books, Golf, Ticket, Stylife, Dream businesses, Video streaming, Dining, Beauty, Mart, Delivery, Kenko.com, Soukai Drug
Logistics, Energy, Car Life, Rakuten Pay, Coupon, Rakuma, FRIL, Rakubin, etc.

36 36
Domestic E-Commerce
Marketplaces
• Soukai Drug consolidation
• Investments in new businesses
* Marketplaces: Ichiba, Travel, Golf, Beauty, Delivery, Rakubin, Mart, Dining
37
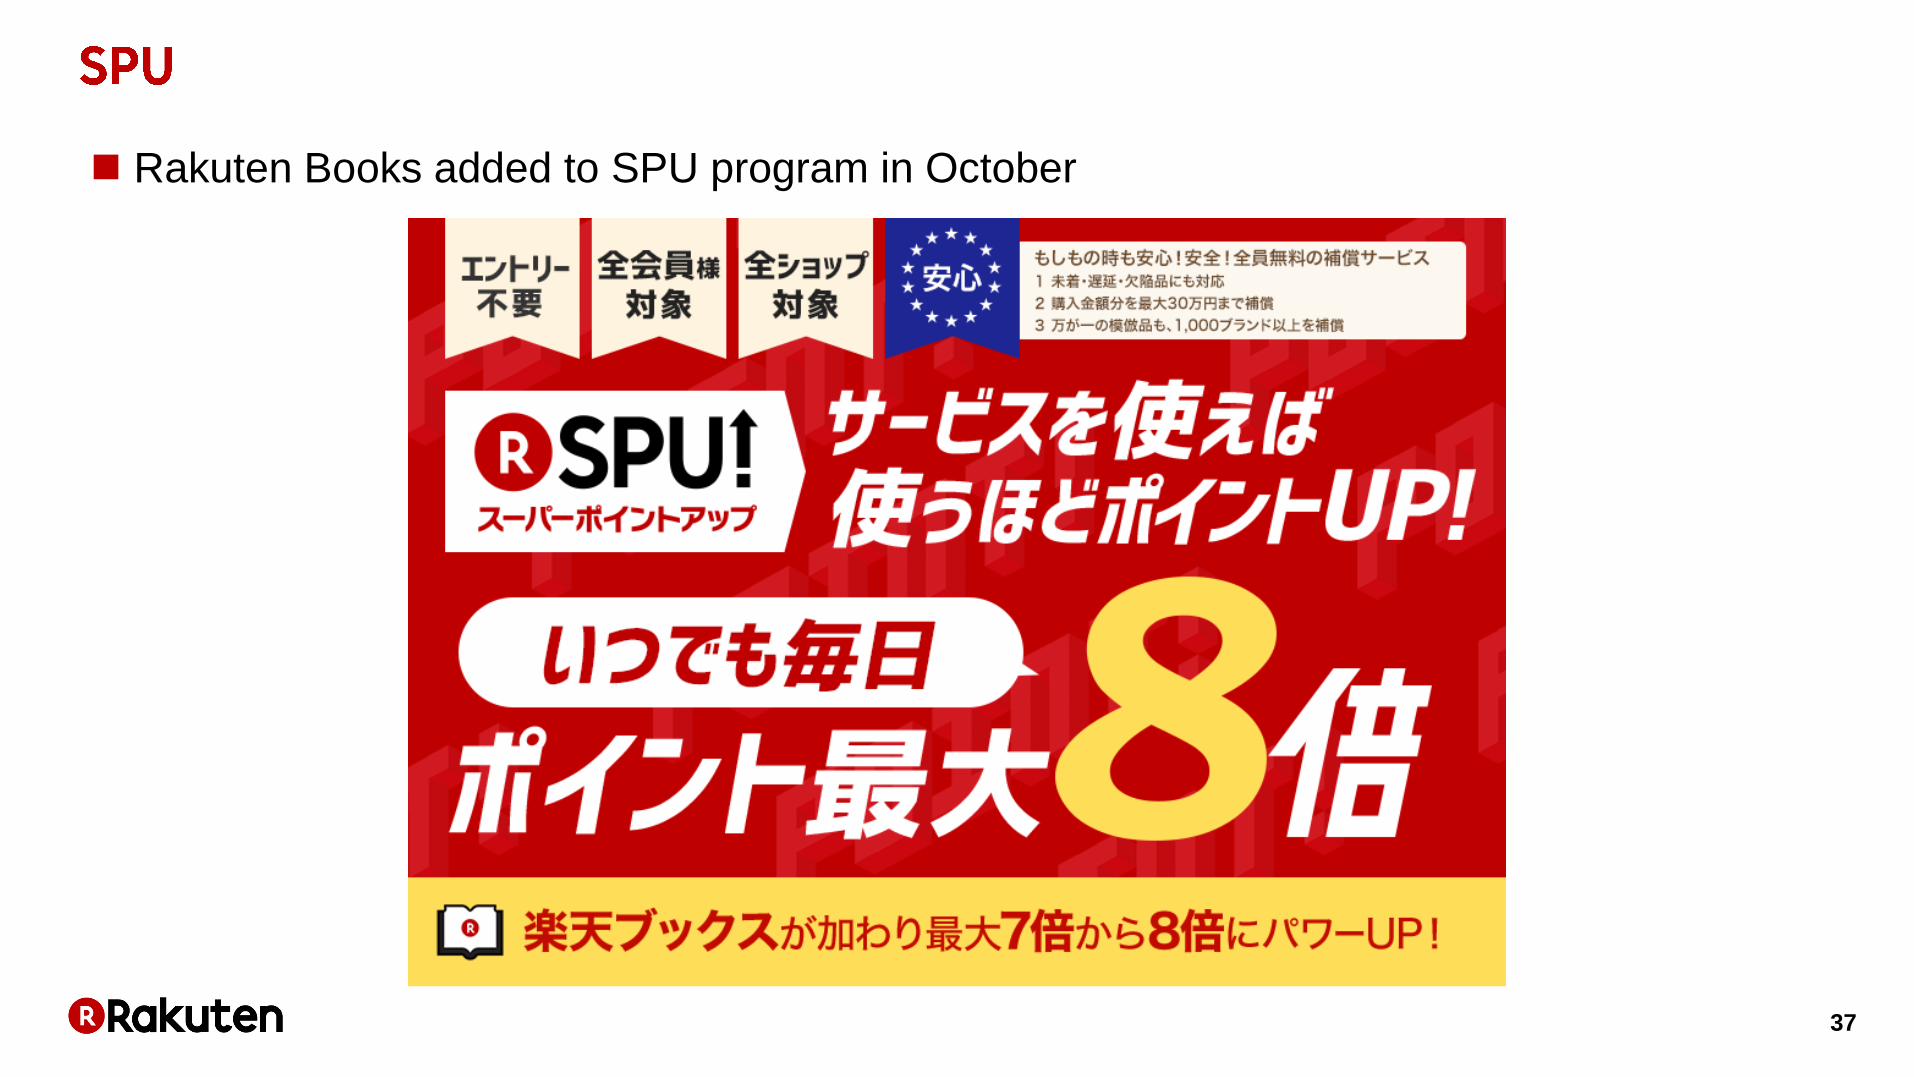
Rakuten Books added to SPU program in October

38
Ichiba orders and purchasers increasing steadily
Unit prices bottoming out
Number of Orders*1
+8.3% YoY
Unique Purchasers*1
+5.3% YoY
*1: As of Q3/17. Unique purchasers is monthly average of July - September *2: Change in average annual spending per user who became a card user during February - April 2016
Spending on Ichiba jumps
+112% after becoming a
Rakuten Card member*2

39
Rakuten Card share of Ichiba GMS is consistently growing
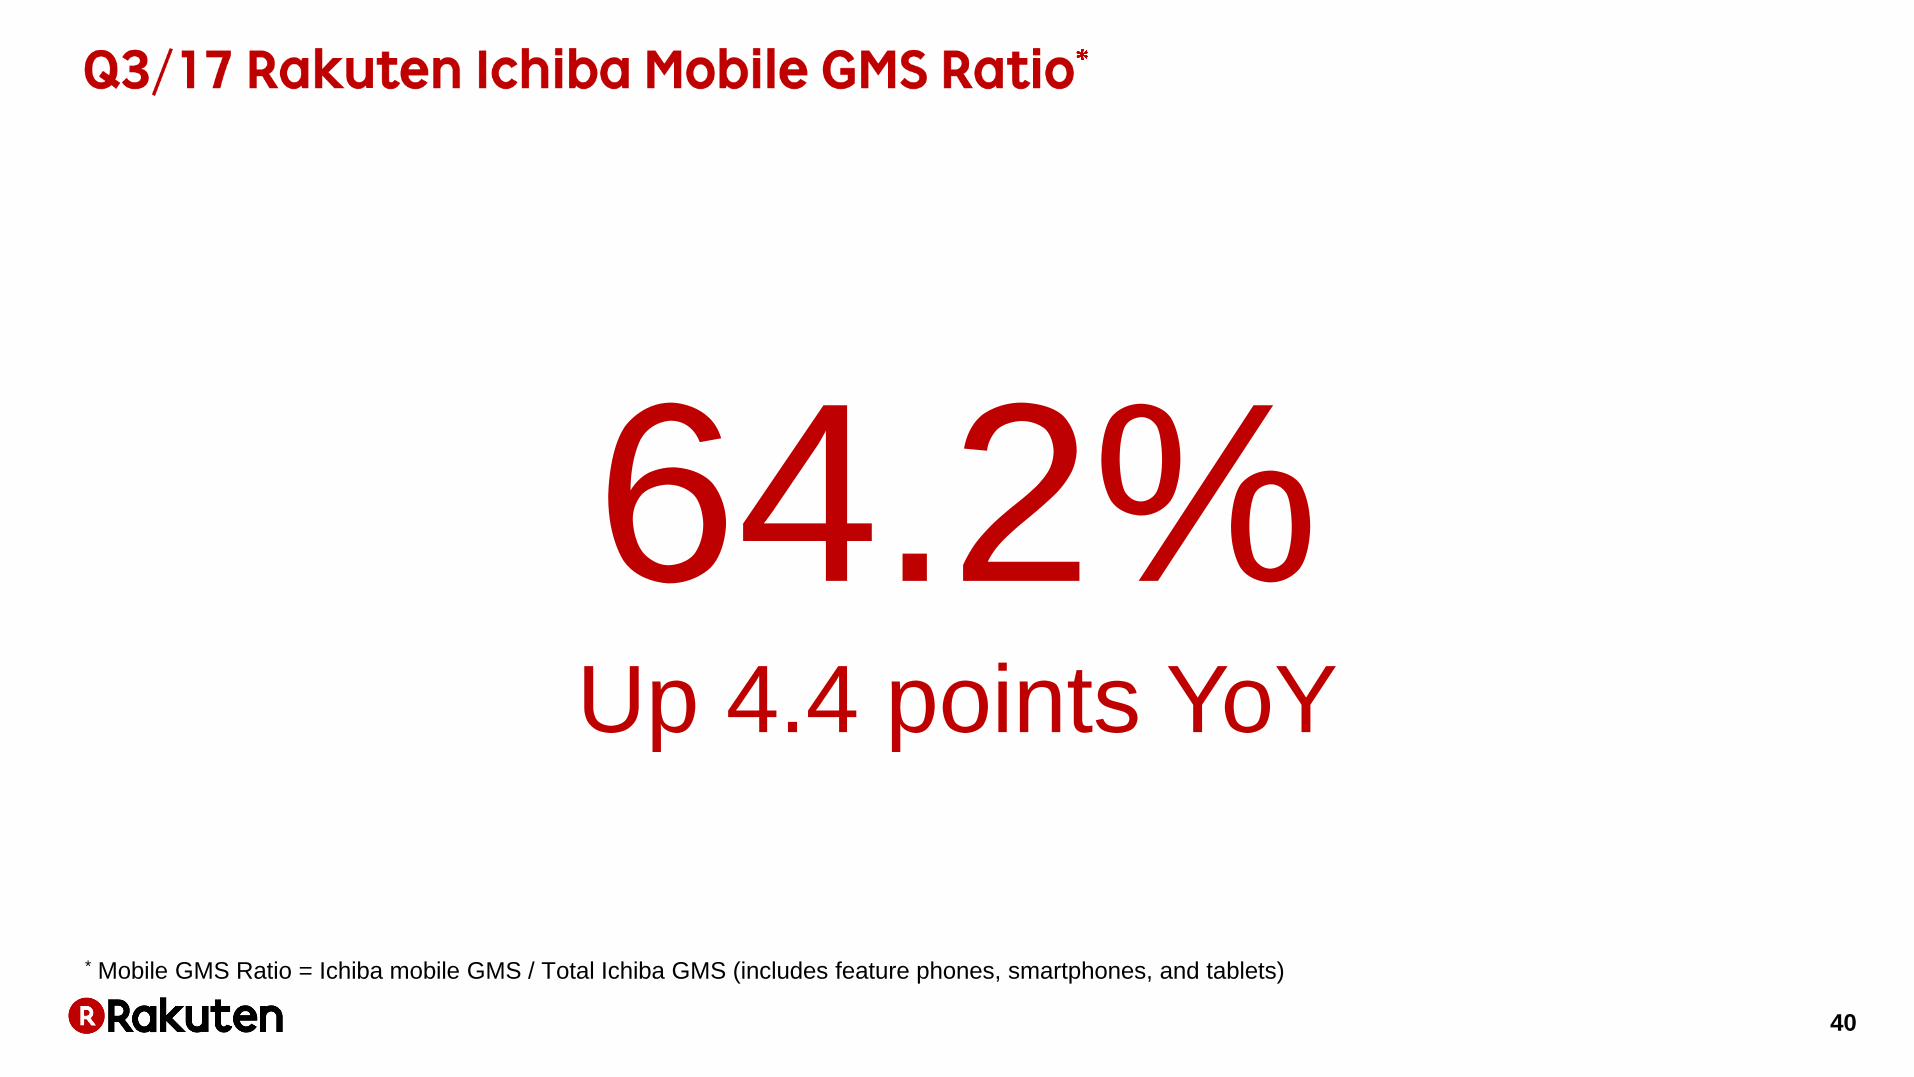
40
* Mobile GMS Ratio = Ichiba mobile GMS / Total Ichiba GMS (includes feature phones, smartphones, and tablets)
64.2% Up 4.4 points YoY

41
Advertising revenue
+10.0% YoY in Q3/17
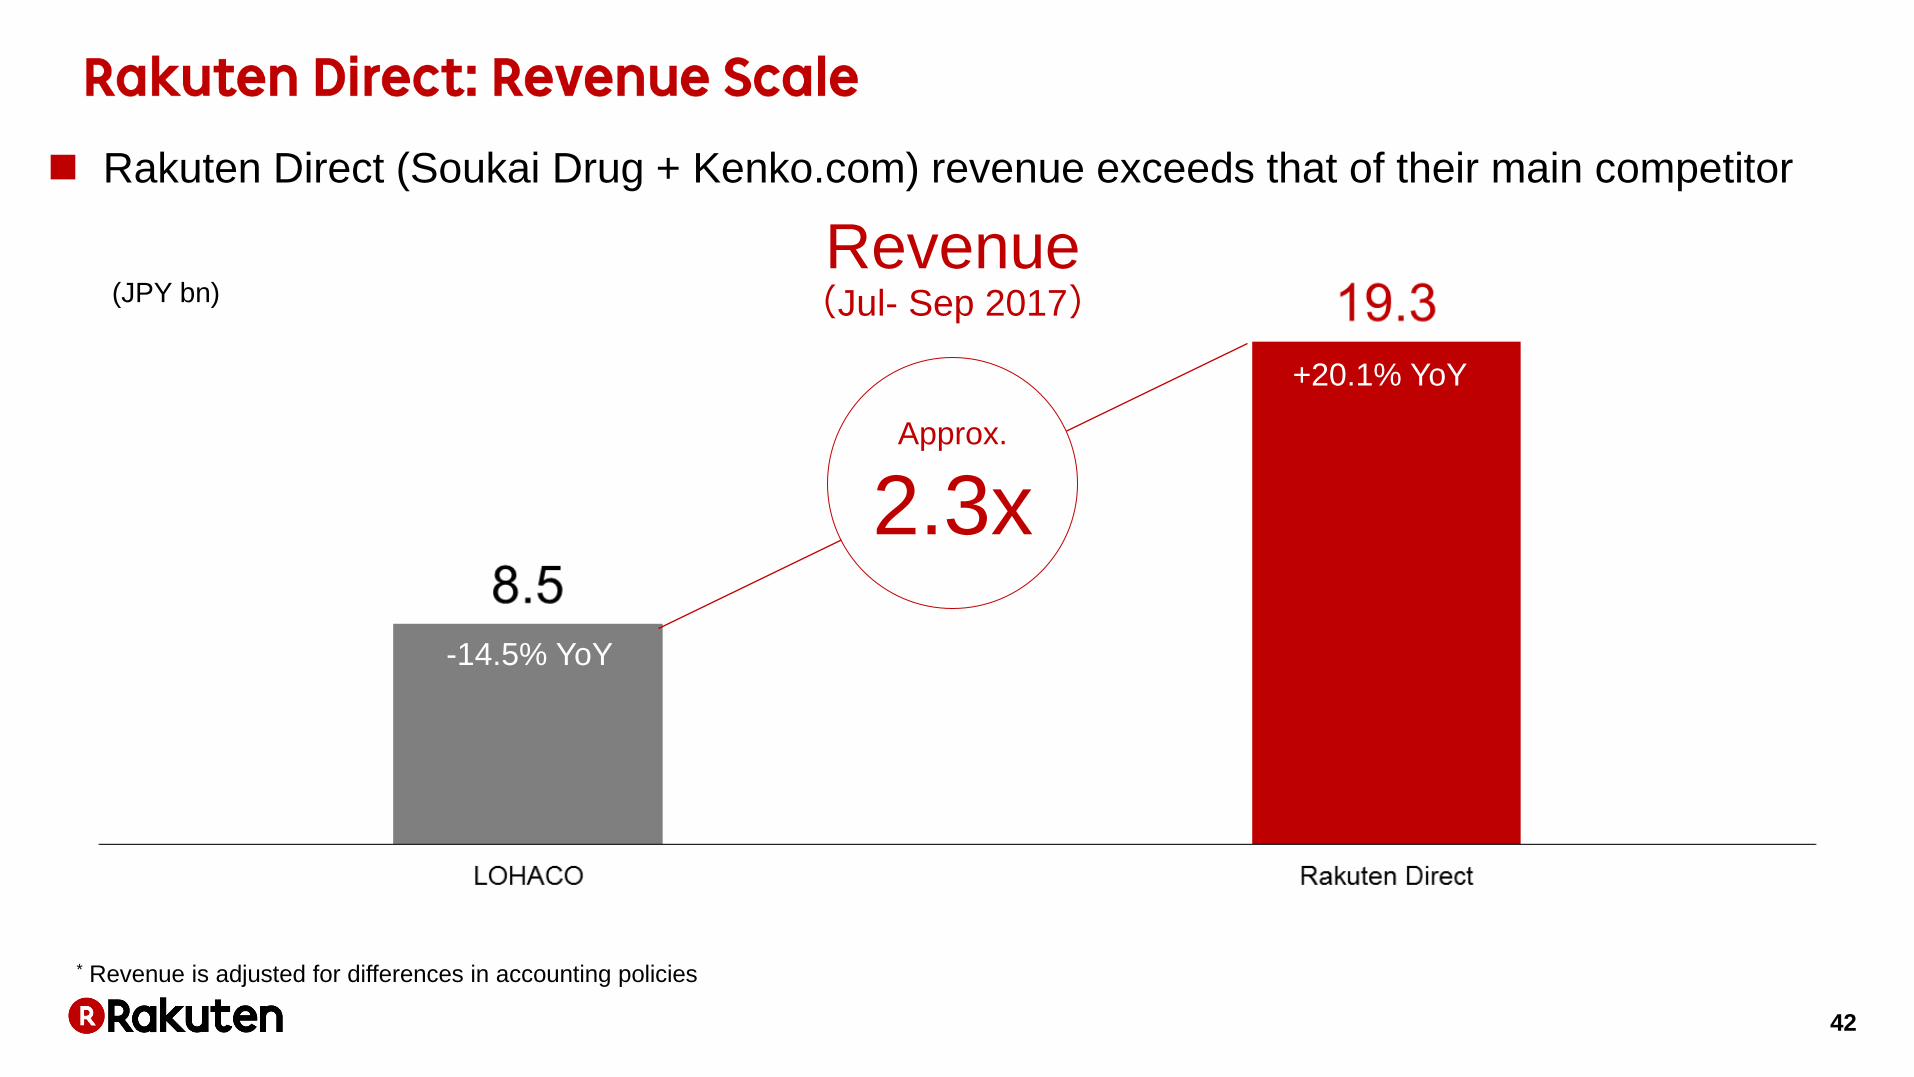
42
Rakuten Direct (Soukai Drug + Kenko.com) revenue exceeds that of their main competitor
Revenue (Jul- Sep 2017)
Approx.
2.3x
(JPY bn)
* Revenue is adjusted for differences in accounting policies
+20.1% YoY
-14.5% YoY
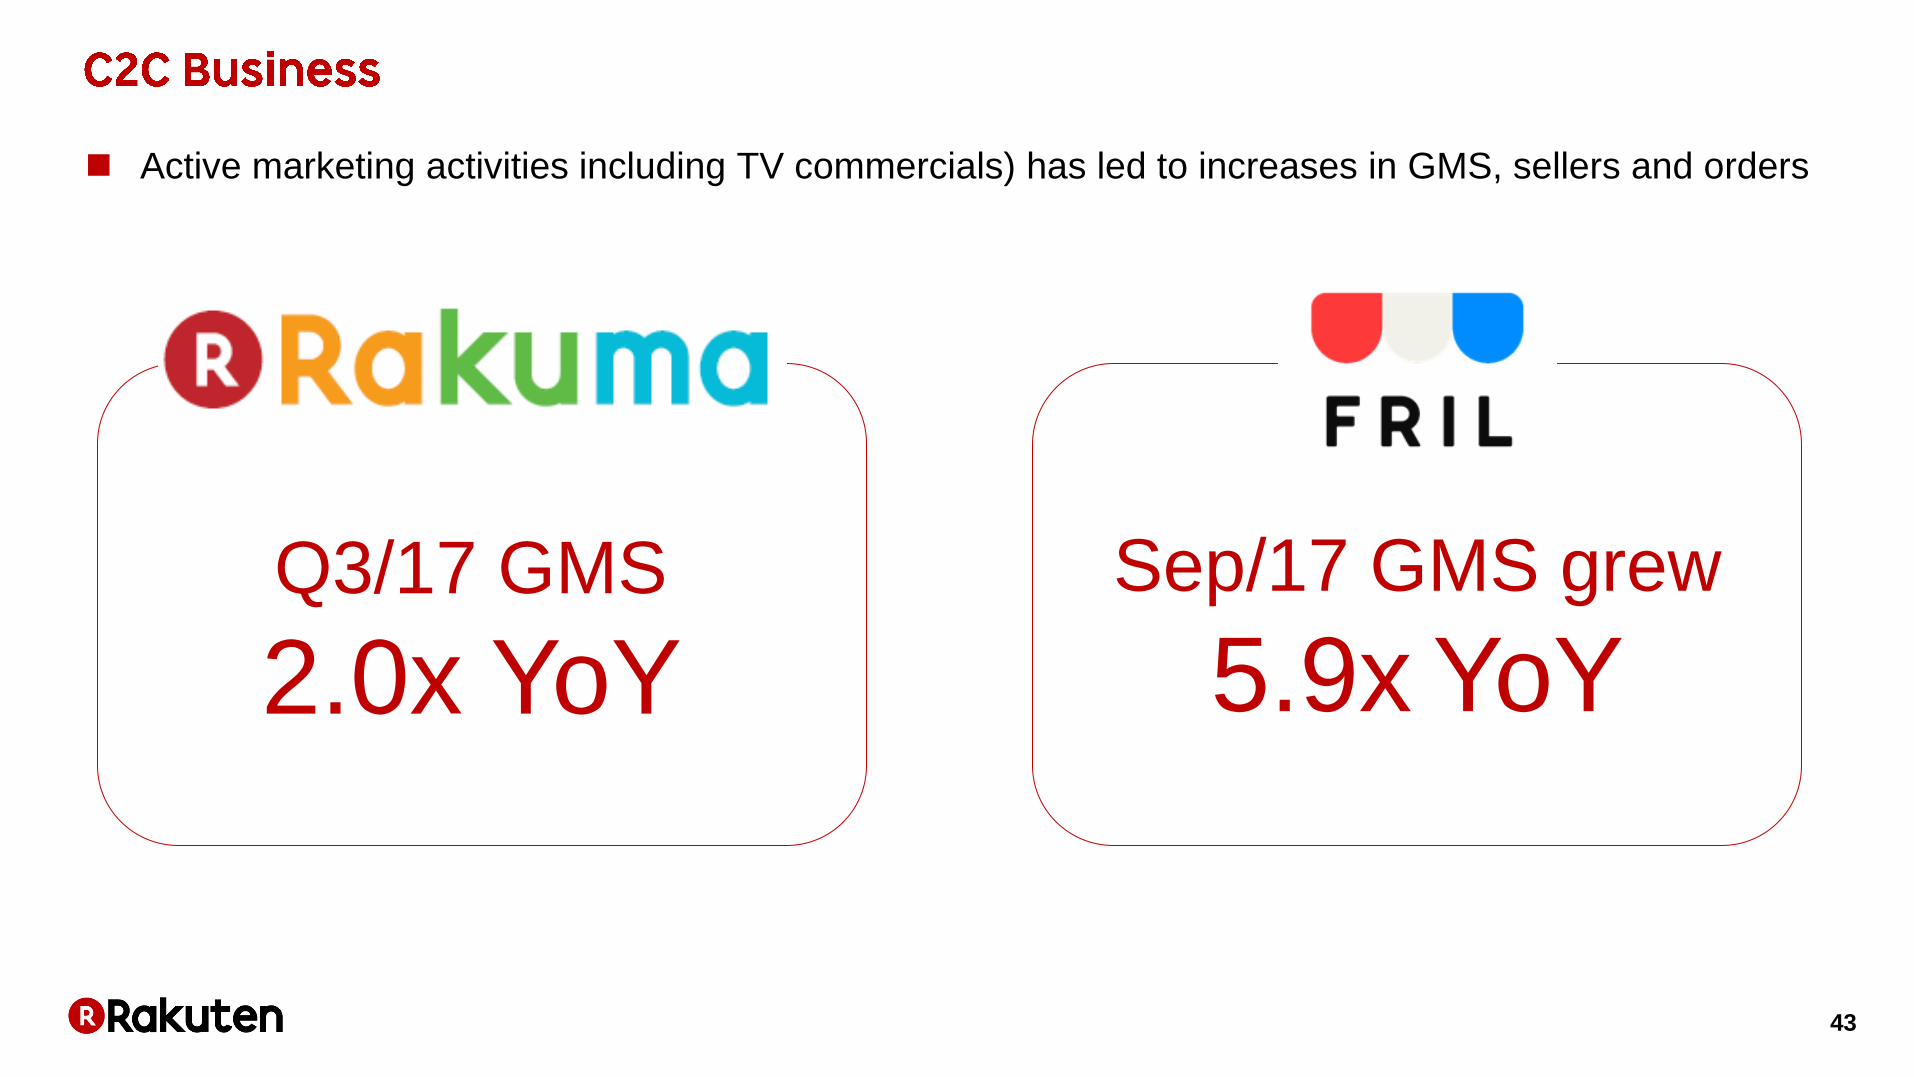
43
Active marketing activities including TV commercials) has led to increases in GMS, sellers and orders
Q3/17 GMS
2.0x YoY Sep/17 GMS grew
5.9x YoY
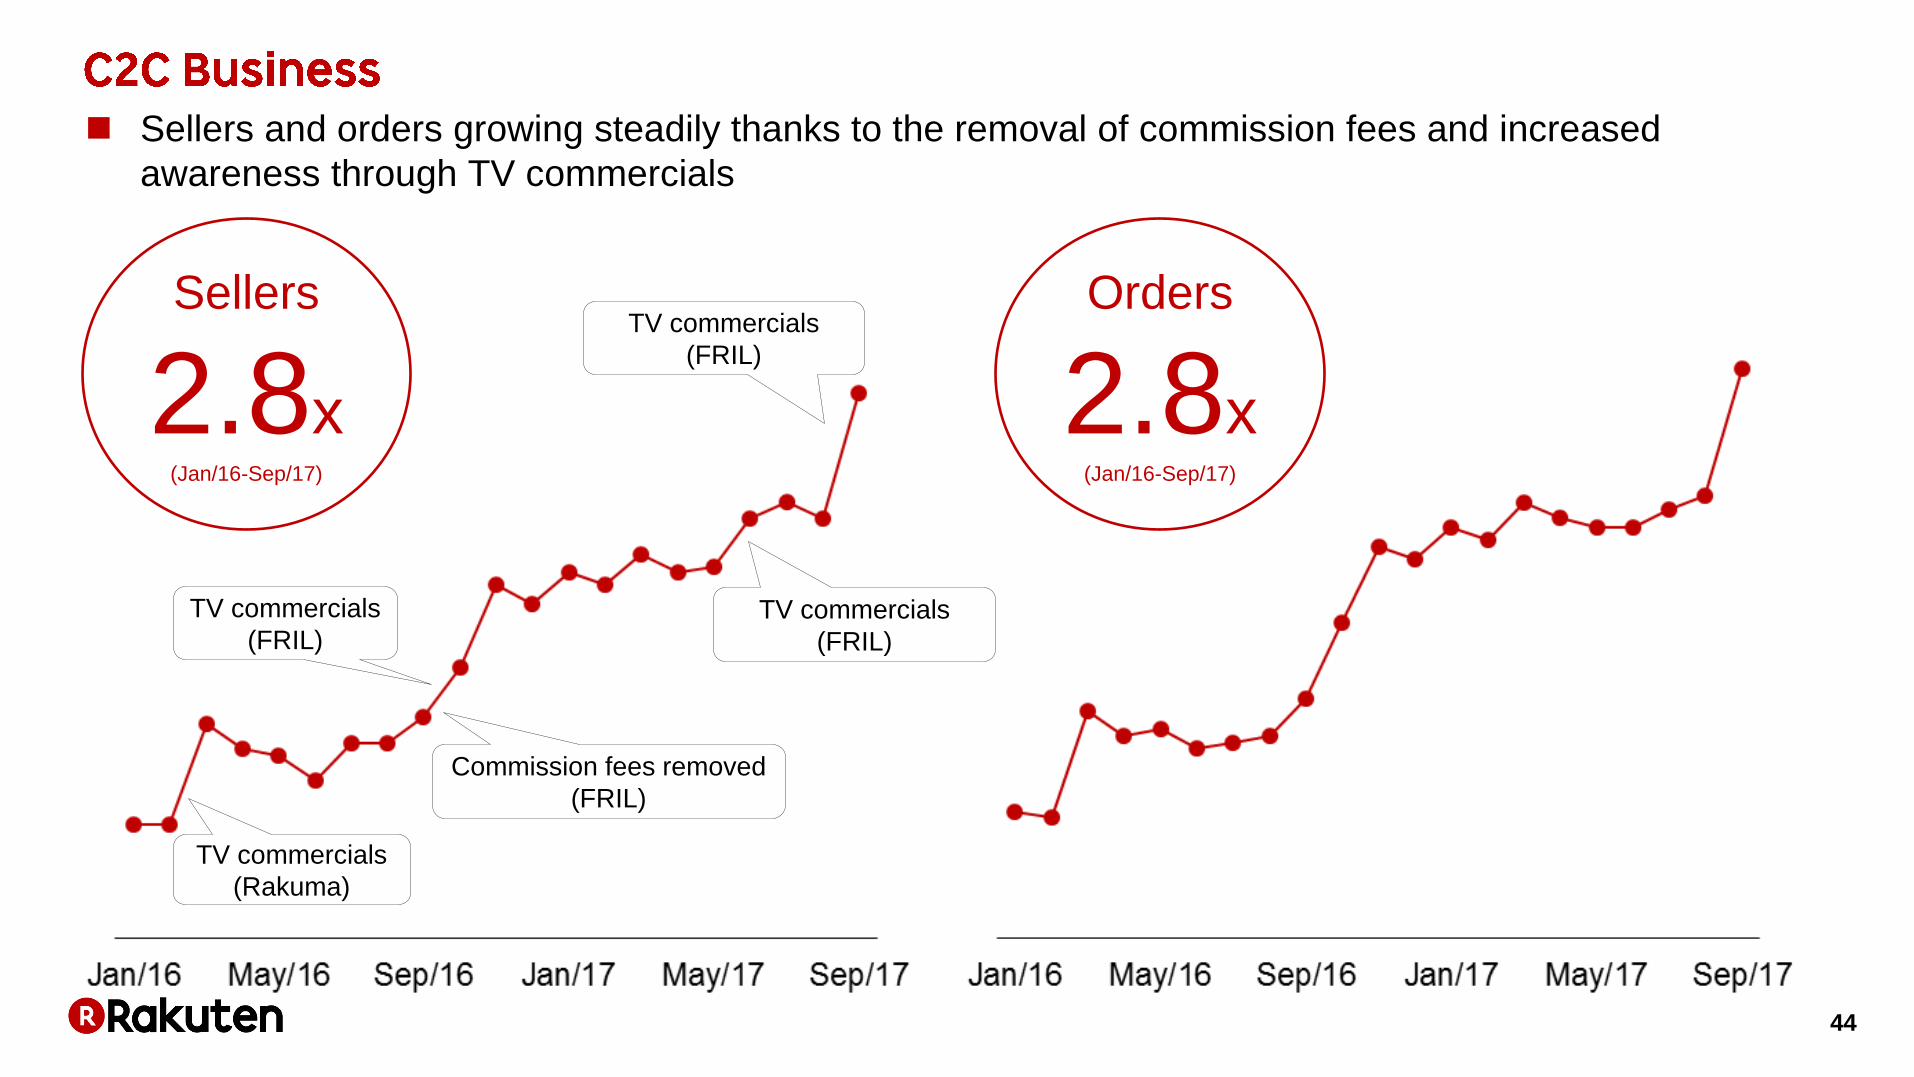
44
Sellers and orders growing steadily thanks to the removal of commission fees and increased
awareness through TV commercials
Sellers
2.8x (Jan/16-Sep/17)
Orders
2.8x (Jan/16-Sep/17)
TV commercials
(Rakuma)
Commission fees removed
(FRIL)
TV commercials
(FRIL) TV commercials
(FRIL)
TV commercials
(FRIL)

45
Surpassed JPY 100bn* annualized GMS
Next target is JPY 200bn
* Based on October 2017 monthly GMS

46
Q3/17 GMS
Over +150% YoY
Q3/17 GMS
Over +250% YoY
Super DEAL

47
* Includes GMS of Cartera acquired in Q1/17 and ShopStyle acquired in Q2/17
*

48
(USD mm)
+17.5 %
YoY

49

50
51 51
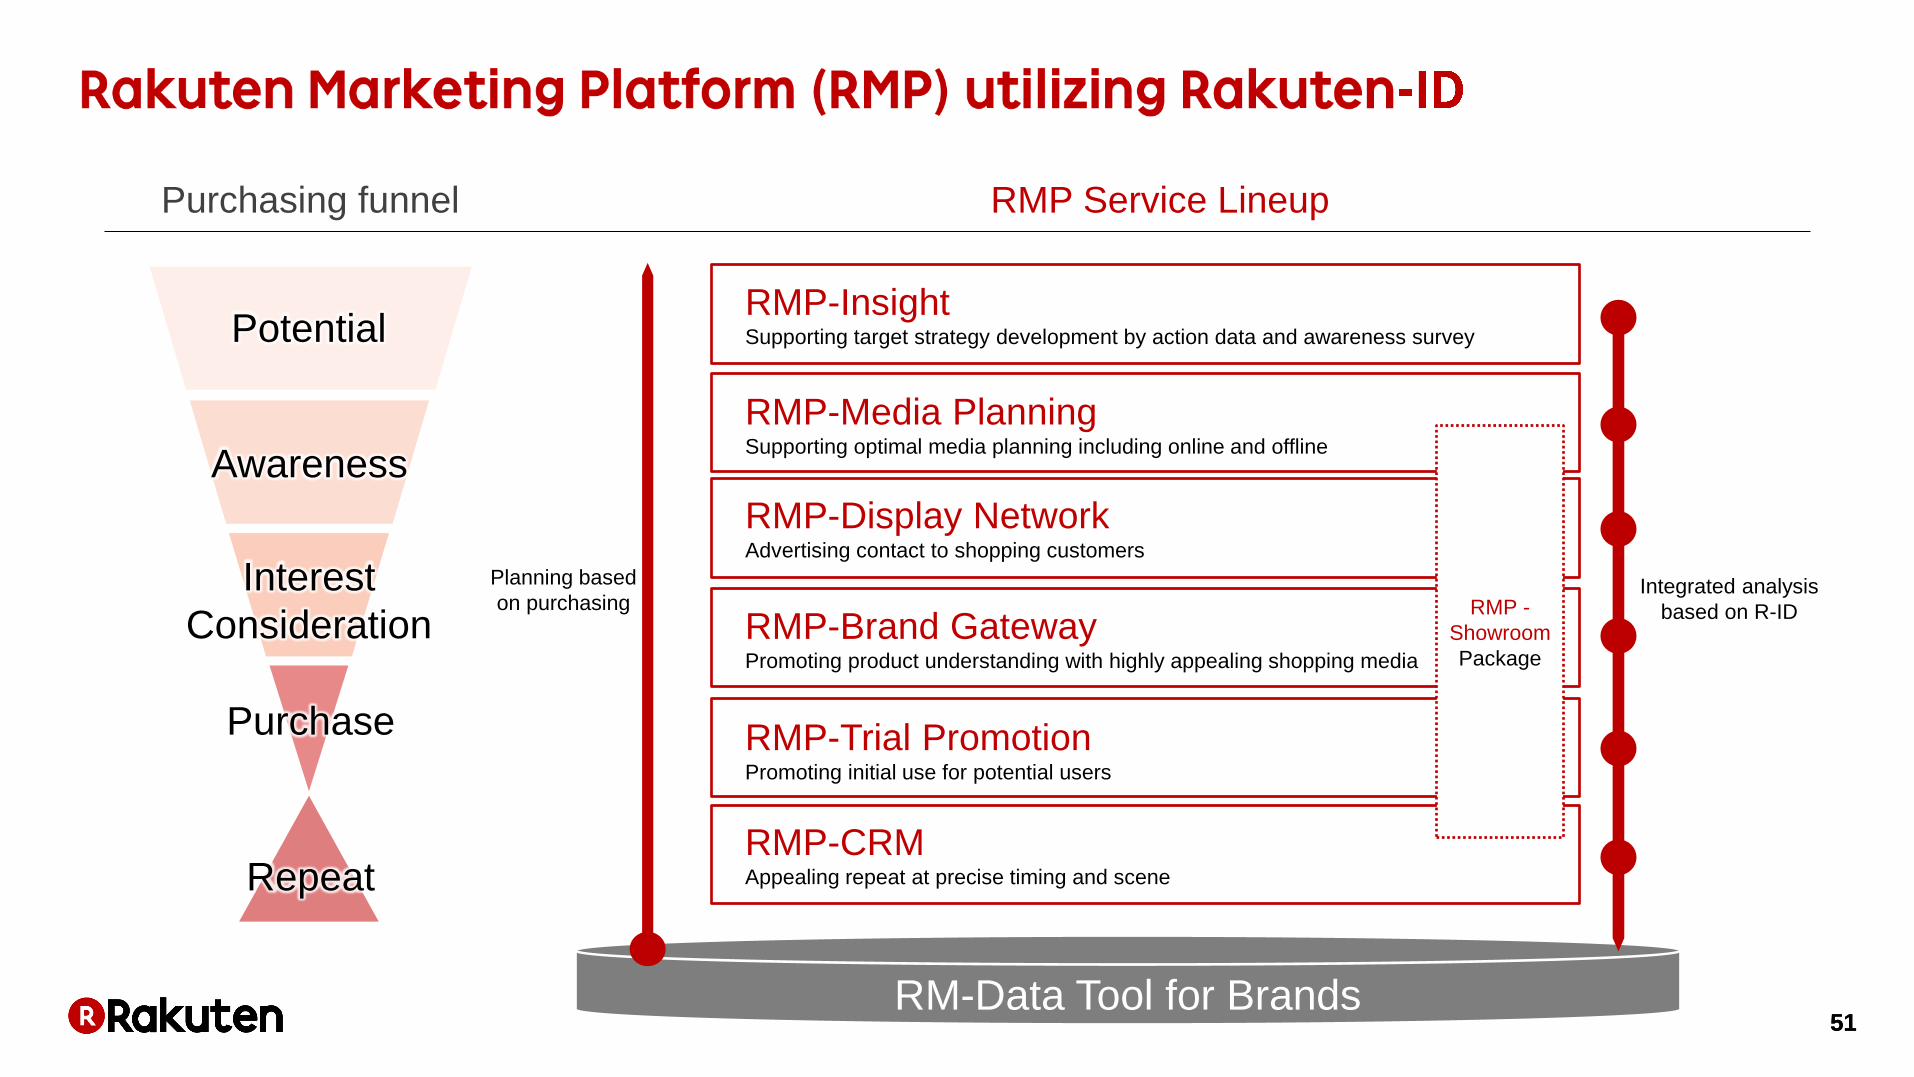
RMP Service Lineup Purchasing funnel
Potential
Awareness
Interest
Consideration
Purchase
Repeat
RM-Data Tool for Brands
RMP-Insight Supporting target strategy development by action data and awareness survey
RMP-Media Planning Supporting optimal media planning including online and offline
RMP-Display Network Advertising contact to shopping customers
RMP-Brand Gateway Promoting product understanding with highly appealing shopping media
RMP-Trial Promotion Promoting initial use for potential users
RMP-CRM Appealing repeat at precise timing and scene
RMP -
Showroom
Package
Planning based
on purchasing Integrated analysis
based on R-ID

52 52
Insight &
Media Planning
Display
Network
Trial
Promotion Brand
Gateway CRM
Other EC site
Real Store
▼Rakuten Group Media Ad
▼Rakuten Mail Ad
Targeting Plan
93MM ID
Analysis
Targeting Reach Understanding Promoting Purchasing
Brand
Tie Up
Page
196seconds
Stay time

53 53
CVR lift effect based on purchase rate of "no contact“
TVCM
+1.1 pt
+3.3 pt
TVCM
TVCM+
Web Ad
TVCM
Rakuten Super Sale (September 2-7, 2017)
Captured contact effect of TV commercials and web advertising for actual purchases on ID basis
Commercials contact
ID
Web Ad contact
Purchase data
connected

54 54
Number of proposals
to advertisers
in October
1.8x vs July
11.0x vs July
Value of proposals
to advertisers
in October

55

56
* Unique IDs: Unique phone numbers excluding deactivations

57
Monetization accelerating on strong growth in both Telco (Viber In/Out) and content
revenue
Total Revenue
+103.9% YoY
* Telco: Viber Out, Viber In. Content: Service messages, ads, stickers and others

58 58
1.4mm
FREETEL SIM
Rakuten Mobile
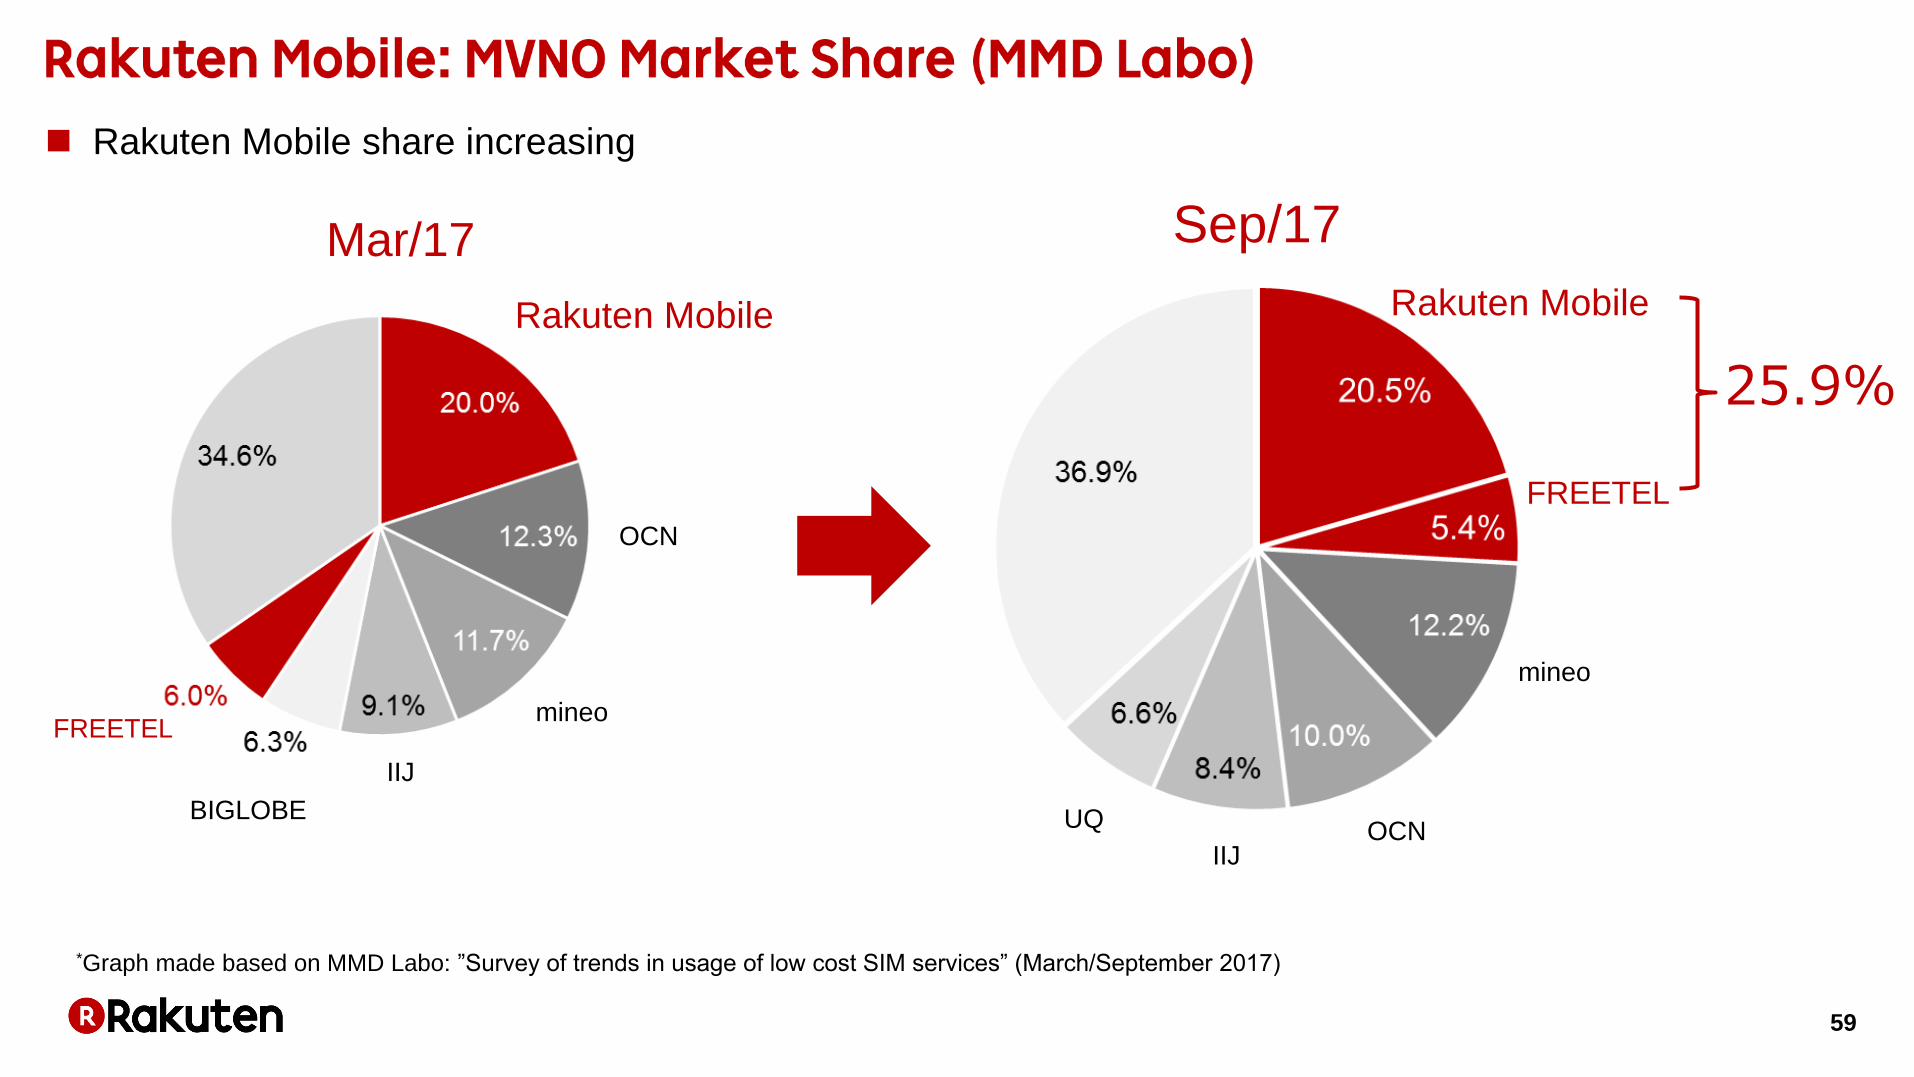
59
*Graph made based on MMD Labo: ”Survey of trends in usage of low cost SIM services” (March/September 2017)
Mar/17 Sep/17
Rakuten Mobile share increasing
Rakuten Mobile Rakuten Mobile
mineo
OCN IIJ
OCN
mineo
IIJ
UQ BIGLOBE
FREETEL
FREETEL
25.9%

60 60
8
1
4
3
2
7
14 29
14 6
1 2
2
11
1
2
3
3 10
13
3 5
1 3
3
2
3 1
1
2
1
2
1
1
3
1
1
1
1
1
1
1
175 No. of shops
(as of Sep 30, 2017):

61 61
As of Nov 2017 From Jan 2018

62 62
Super Hodai (From Sept)
Long Term Contract Discount (From Sept)
New Plans New Service
iPhone (Certified Pre-owned)

64
Group Financial Information
Internet Services
FinTech
Other Information

65

66
(JPY bn, IFRS)
Q3/16 Q3/17 YoY
Non-GAAP Operating Income 30.2 57.8 +91.6%
Amortization of Intangible Assets (PPA) -2.0 -2.1 -0.0
Stock Based Compensation -1.8 -1.8 -0.1
One-off items - -2.4 -2.4
IFRS Operating Income 26.4 51.5 +95.4%

67
*1: Rakuten, Inc., Rakuten Bank, Ltd., Rakuten Card Co., Ltd., Rakuten Securities, Inc. and Rakuten Life Insurance Co., Ltd. are based on IFRS non-consolidated
balance sheets.
*2: Bonds and borrowings = Corporate bonds + CP + Borrowings.
(JPY bn)
Ohno
17/11/6

68 68
*1: Debt from outside financial institutions = Corporate Bonds + CP + Borrowings *2: Debt from Bank of Japan under eligible collateral.
11/6
Onodera

69
Operating CF
(Excl. Tax)
Change in
assets &
liabilities
Increase in cash and
cash equivalents JPY +56.8bn
Increase in cash and
cash equivalents JPY +82.5bn
Balance of cash
Dec 31, 2016 Balance of cash
Sep 30, 2017
Non-Financial Businesses Financial Businesses
Tax
Change in
investment
securities
Other
investing CF
Profit(adjusted)
Operating Investing Financing Investing
Financing Operating
* “M&A and investments” includes “Increase and Decrease in restricted deposits”, “Purchase of investment securities” “Acquisition of investments in associates and
joint ventures” and “Proceeds from sales and redemption of investment securities” of Non-Financial activities in addition to “Acquisition of subsidiaries”
(JPY bn)
Decrease in cash and
cash equivalents
JPY -45.8bn
M&A,
investments*
Tax
Common

70
* Breakdown of financial and non-financial businesses are based on internal estimates and not reviewed by independent auditors
(JPY bn)
Overview of cash flows for nine months ended September 30, 2017 Consolidated Financial Non-Financial Common
Income before income tax 110.8 45.9 64.9 -
Depreciation and amortization 39.0 7.6 31.4 -
Other loss (profit) (23.8) 0.1 (32.6) 8.7
Decrease (Increase) in operating receivables 12.9 0.2 12.7 -
Decrease (Increase) in loans for credit card biz (62.2) (62.2) - -
Increase (Decrease) in deposits for banking biz 248.3 248.3 - -
Decrease (Increase) in call loans for banking biz - - - -
Decrease (Increase) in loans for banking biz (135.0) (135.0) - -
Increase (Decrease) in operating payables (30.4) (26.9) (3.4) -
Decrease (Increase) in financial assets for securities biz (182.4) (182.4) - -
Increase (Decrease) in financial liabilities for securities biz 151.2 151.2 - -
Others (19.9) (21.1) 1.2 -
Income tax paid (21.6) (15.8) (5.8) -
Net cash flows from operating activities 86.9 9.9 68.3 8.7

71
(JPY bn)
* Breakdown of financial and non-financial businesses are based on internal estimates and not reviewed by independent auditors
Overview of cash flows for nine months ended September 30, 2017 Consolidated Financial Non-Financial CommonIncrease in restricted deposits (11.8) - (11.8) -
Decrease in restricted deposits 11.8 - 11.8 -
Increase in time deposits (7.2) (7.1) (0.1) -
Decrease in time deposits 15.4 15.3 0.1 -
Purchase of property, plant and equipment (28.2) (2.4) (25.8) -
Purchase of intangible assets (32.1) (11.1) (21.0) -
Acquisition of subsidiaries (5.8) (0.6) (5.3) -
Acquisition of investments in associates and joint ventures (15.8) (0.2) (15.6) -
Purchase of investment securities for banking biz (235.2) (235.2) - -
Proceeds from sales and redemption of investment securities for banking biz 195.4 195.4 - -
Purchase of investment securities for insurance biz (12.2) (12.2) - -
Proceeds from sales and redemption of investment securities for insurance biz 7.6 7.6 - -
Purchase of investment securities (38.1) (3.4) (34.6) -
Proceeds from sales and redemption of investment securities 9.5 8.6 0.9 -
Other payments (11.3) (0.4) (10.9) -
Other proceeds 7.2 0.7 6.4 -
Net cash flows from investing activities (150.8) (44.9) (105.9) - Net increase (decrease) in short-term borrowings 77.9 43.4 34.6 -
Increase (Decrease) in commercial papers 72.0 10.0 62.0 -
Proceeds from long-term debt 176.6 176.6 0.0 -
Repayment of long-term debt (141.3) (112.6) (28.7) -
Income from bond issuance 99.5 - 99.5 -
Repayment of bonds (30.3) (0.3) (30.0) -
Cash dividends paid (6.4) - (6.4) -
Purchase of treasury stock (89.7) - (89.7) -
Others (1.7) (0.2) (1.5) -
Net cash flows from financing activities 156.7 116.9 39.8 -
Effect of change in exchange rates on cash and cash equivalents 0.8 - - 0.8
Net increase (decrease) in cash and cash equivalents 93.5 81.8 2.2 9.5
Cash and cash equivalents at beginning of the year 548.3 - - -
Cash and cash equivalents at end of September 2017 641.8 - - -

72 72
(JPY mm, IFRS)
GoodwillNon-amortizable
intangible assetsGoodwill
Non-amortizable
intangible assets
305,536 2,938 302,683 3,181
52,895 - 53,012 -
Rakuten Securities, Inc. 10,935 - 10,935 -
Rakuten Bank, Ltd. 32,886 - 32,886 -
Others 9,074 - 9,190 -
358,432 2,938 355,694 3,181
December 31, 2016 September 30, 2017
Internet Services
FinTech
Total
11/6
Onodera
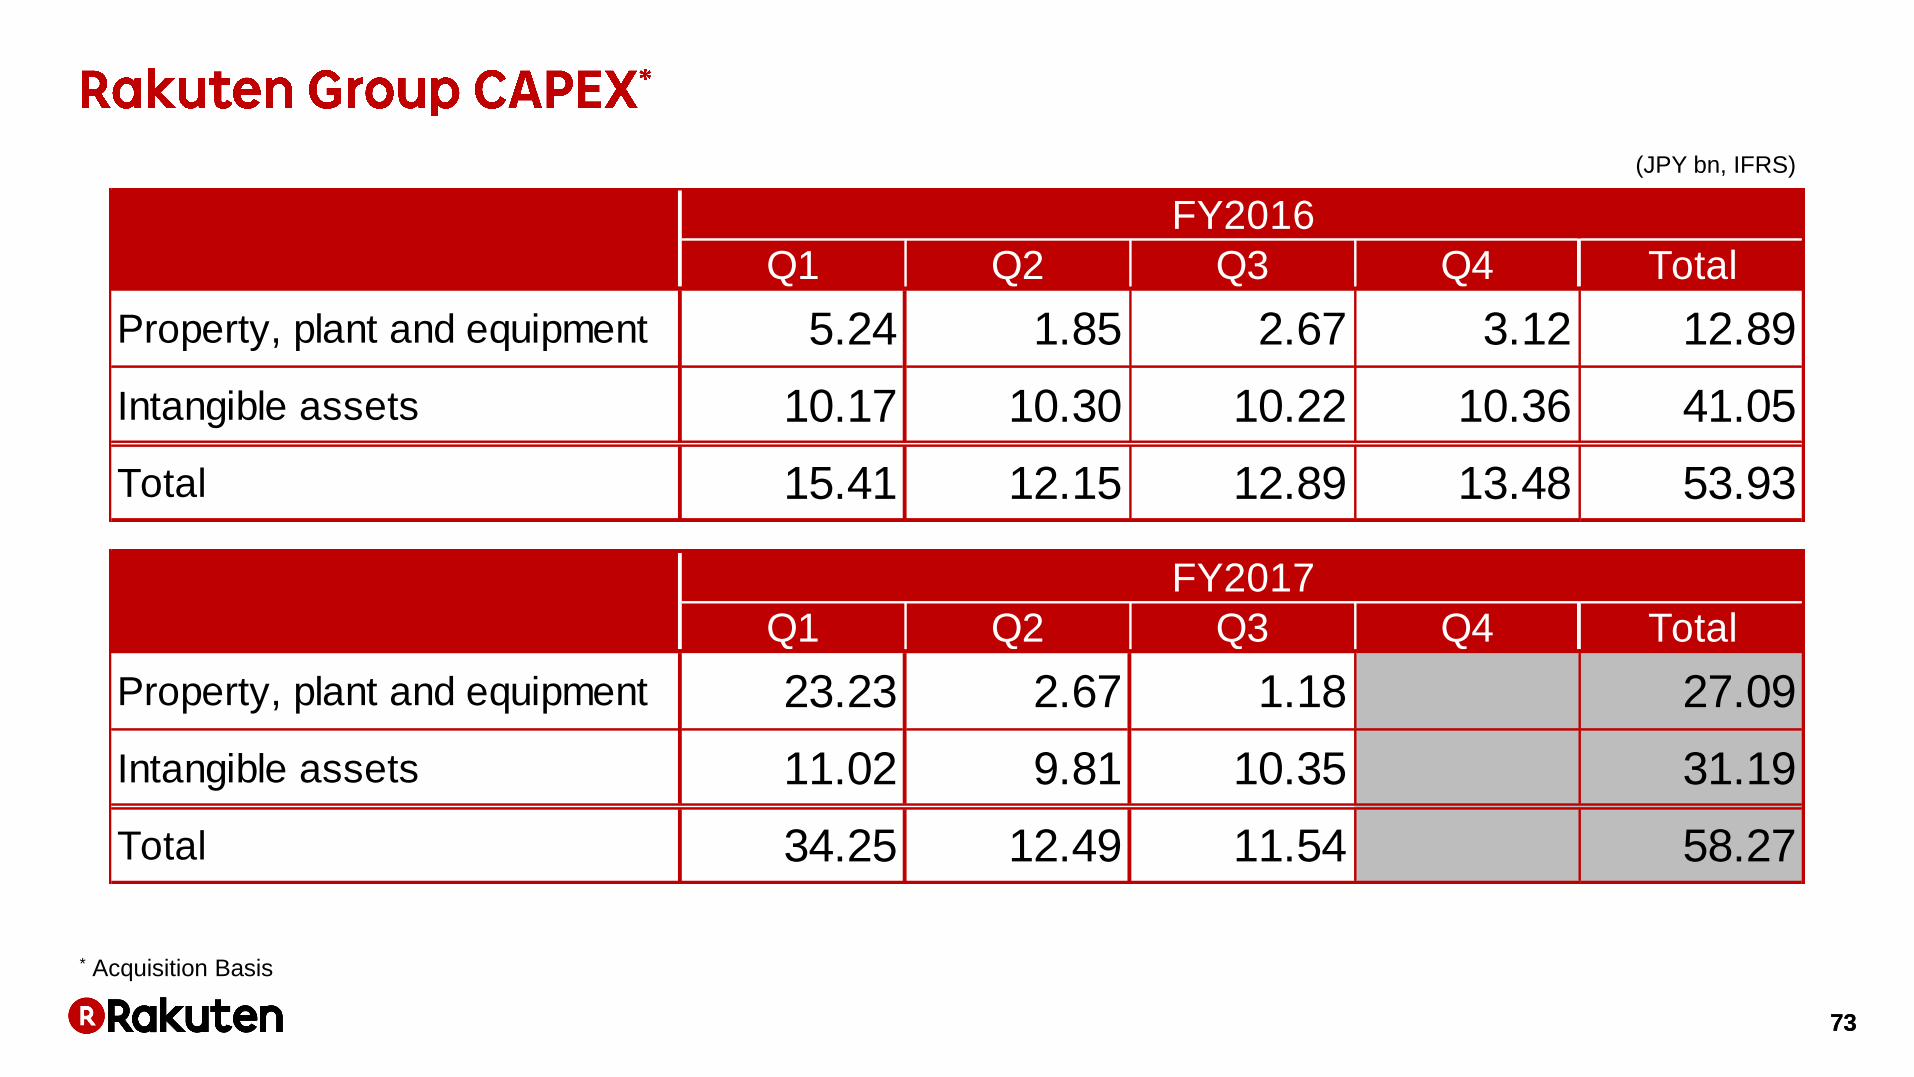
73 73
(JPY bn, IFRS)
* Acquisition Basis
11/6
Onodera
Q1 Q2 Q3 Q4 Total
Property, plant and equipment 5.24 1.85 2.67 3.12 12.89
Intangible assets 10.17 10.30 10.22 10.36 41.05
Total 15.41 12.15 12.89 13.48 53.93
Q1 Q2 Q3 Q4 Total
Property, plant and equipment 23.23 2.67 1.18 27.09
Intangible assets 11.02 9.81 10.35 31.19
Total 34.25 12.49 11.54 58.27
FY2017
FY2016

74 74
(JPY bn, IFRS)
Total assets Sep/17
Cash and cash equivalents 31.8
Accounts receivable - trade 77.2
Property, plant and equipment 15.3
Intangible assets 44.6
Investment securities and financial assets 1,025.3
Other assets 48.8
Total assets 1,243.0
Liabilities and net assets Sep/17
Accounts payable - trade 9.9
Bonds and borrowings 466.5
Other liabilities 215.0
Total liabilities 691.4
Common stock 205.7
Capital surplus 227.8
Retained earnings 210.5
Treasury stock -93.3
Other components of equity 0.9
Total net assets 551.7
Total liabilities and net assets 1,243.0
11/6
Onodera
75

76
Sep/15 Sep/16 Sep/17
Number of Merchants 41,718 42,602 45,519

77
11/1
Updated
Junko
* Including Tolino acquired in Q1/17

78
* Total Checkouts includes e-books, audio books, and videos etc.
11/1
Updated
Junko

79
80
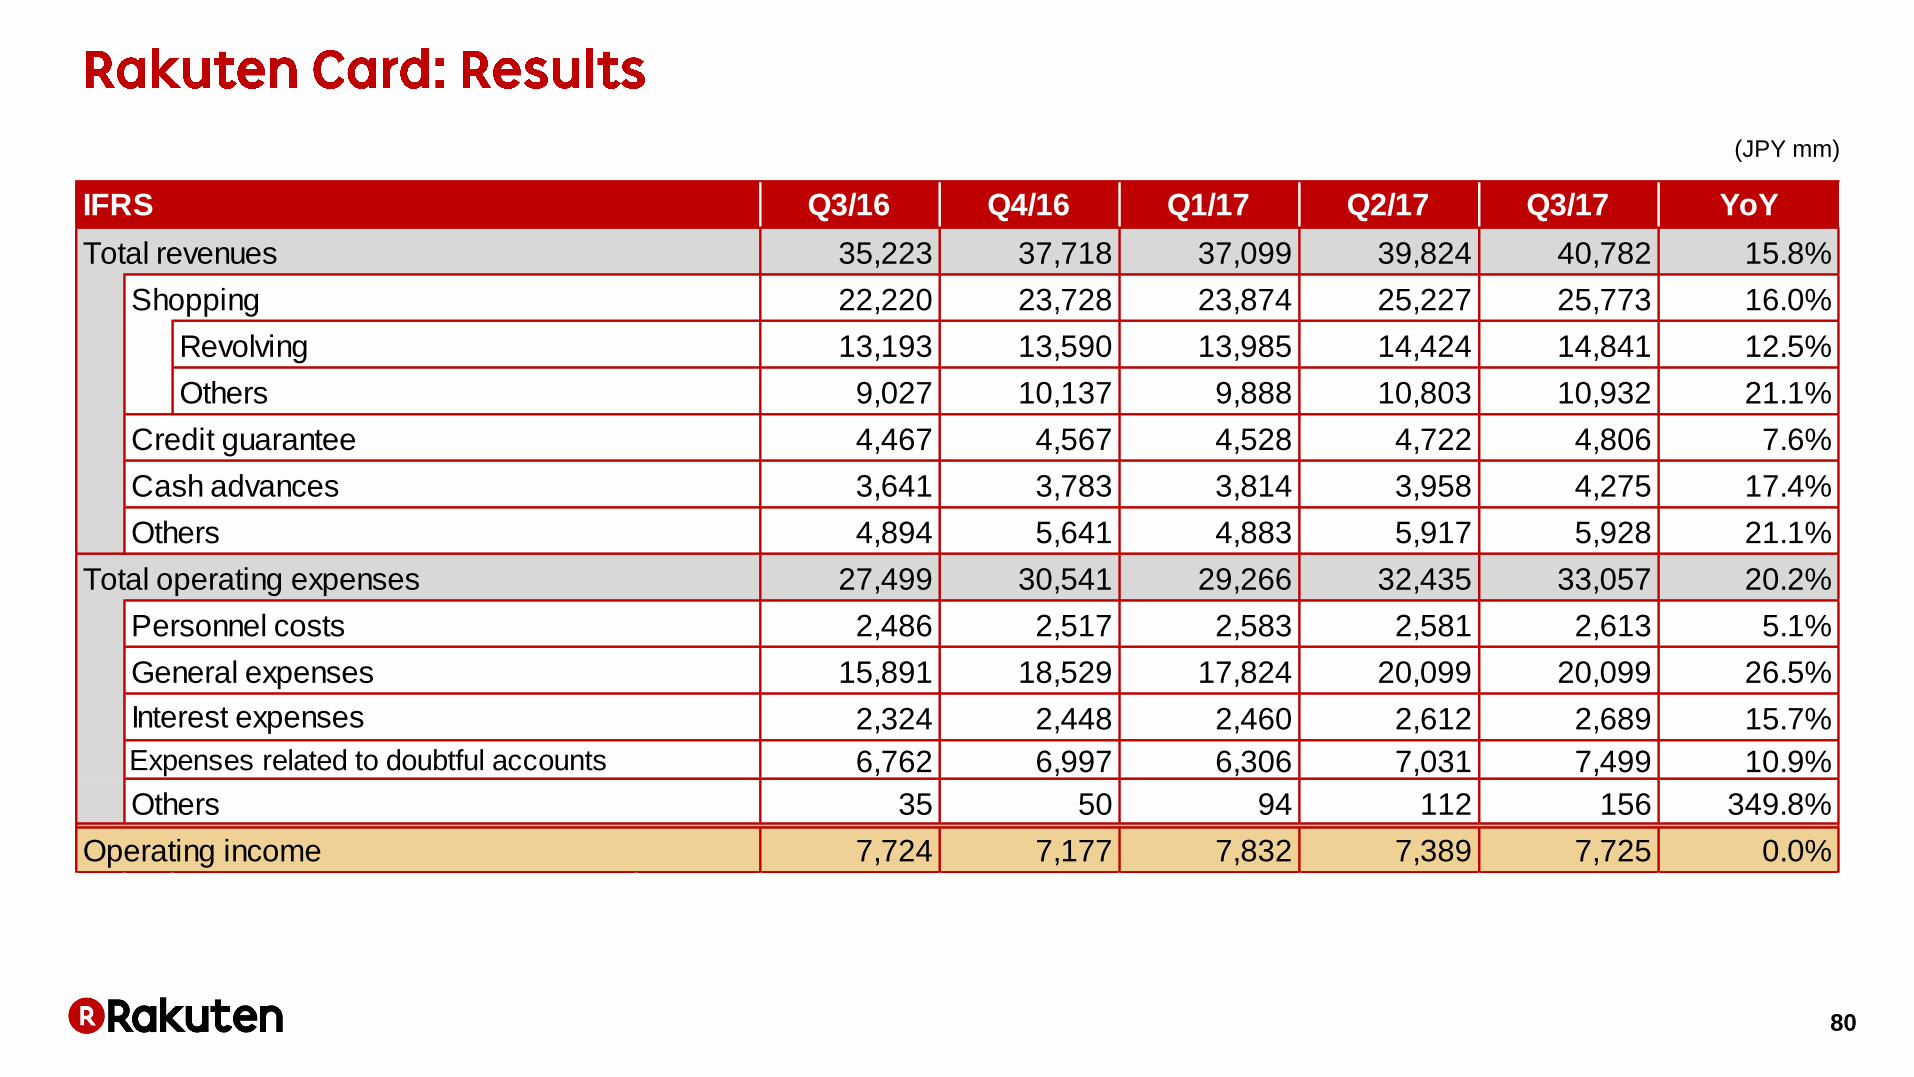
(JPY mm)
10/20
Jenn
再鑑Ohno
17/10/31
Q3/16 Q4/16 Q1/17 Q2/17 Q3/17 YoY
Total revenues 35,223 37,718 37,099 39,824 40,782 15.8%
Shopping 22,220 23,728 23,874 25,227 25,773 16.0%
Revolving 13,193 13,590 13,985 14,424 14,841 12.5%
Others 9,027 10,137 9,888 10,803 10,932 21.1%
Credit guarantee 4,467 4,567 4,528 4,722 4,806 7.6%
Cash advances 3,641 3,783 3,814 3,958 4,275 17.4%
Others 4,894 5,641 4,883 5,917 5,928 21.1%
Total operating expenses 27,499 30,541 29,266 32,435 33,057 20.2%
Personnel costs 2,486 2,517 2,583 2,581 2,613 5.1%
General expenses 15,891 18,529 17,824 20,099 20,099 26.5%
2,324 2,448 2,460 2,612 2,689 15.7%
6,762 6,997 6,306 7,031 7,499 10.9%
Others 35 50 94 112 156 349.8%
Operating income 7,724 7,177 7,832 7,389 7,725 0.0%
IFRS
Expenses related to doubtful accounts
Interest expenses
81
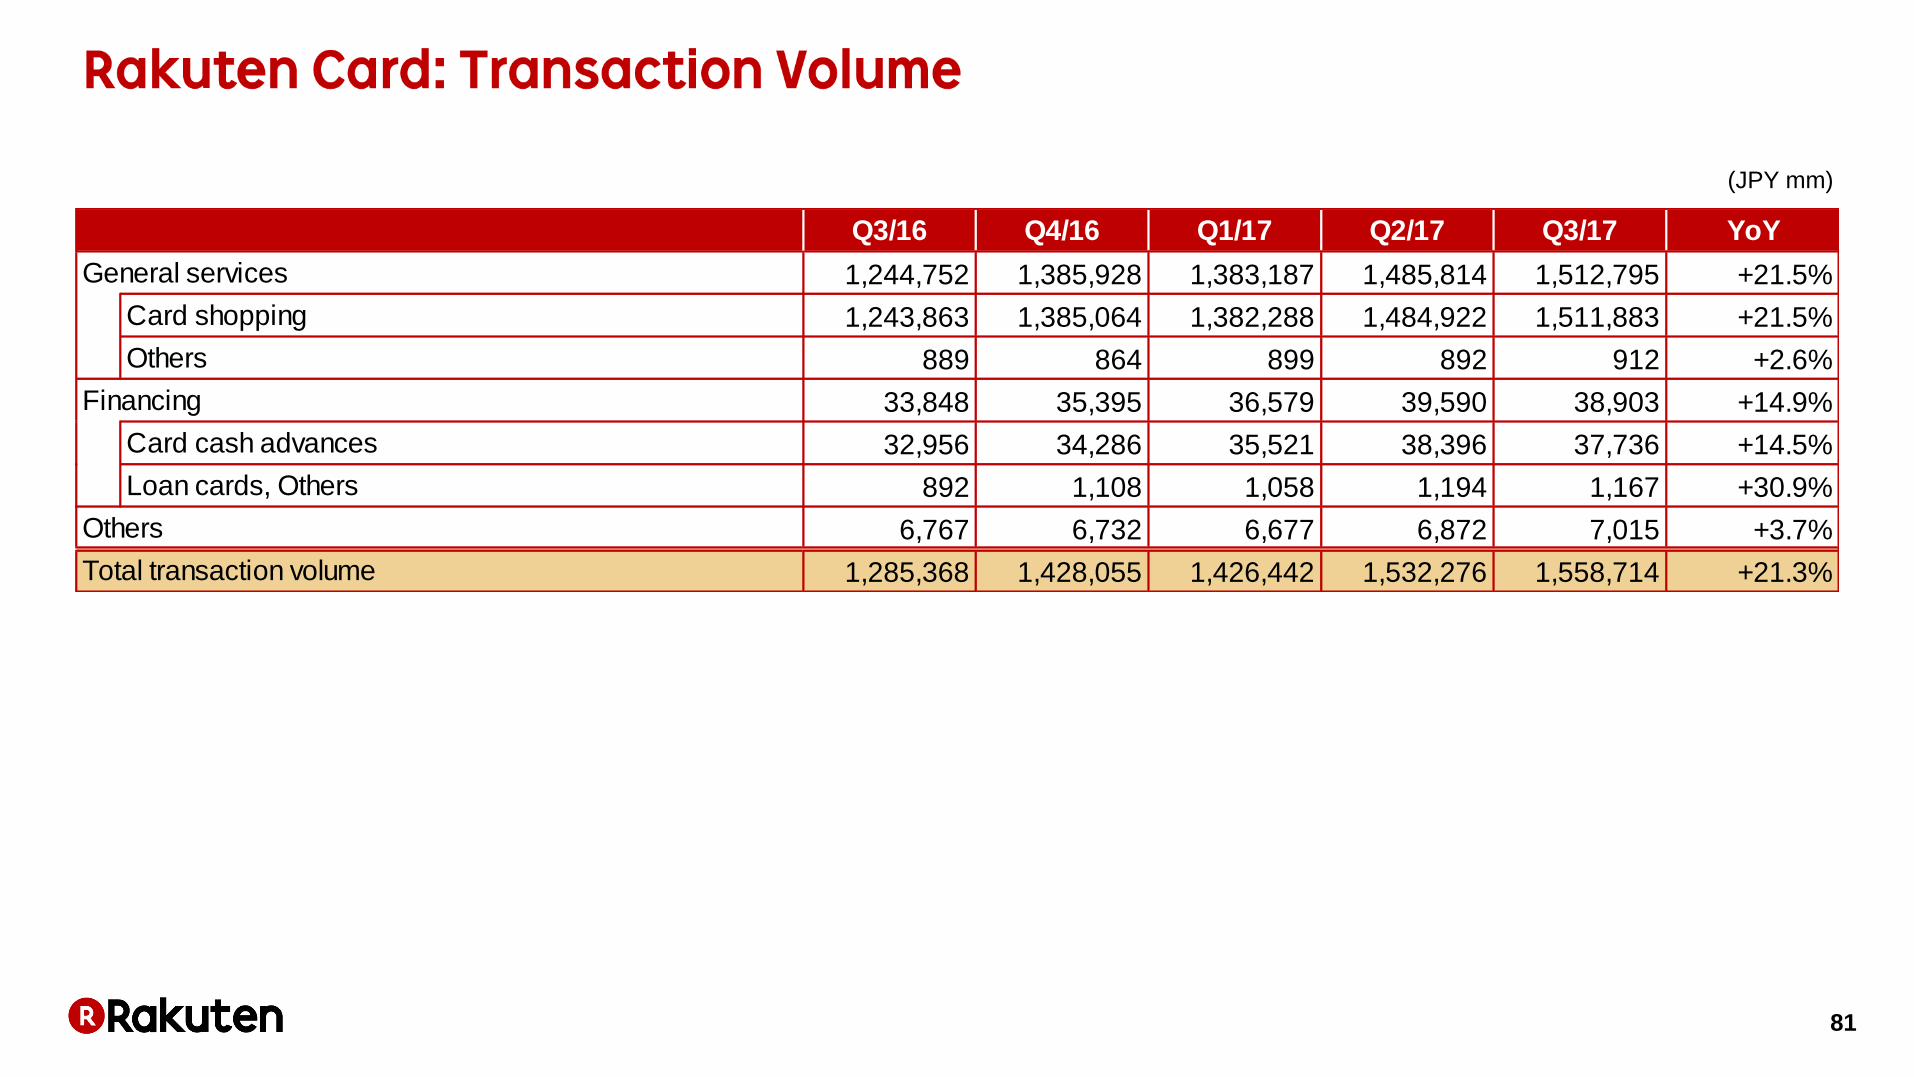
(JPY mm)
10/20
Jenn
Q3/16 Q4/16 Q1/17 Q2/17 Q3/17 YoY
1,244,752 1,385,928 1,383,187 1,485,814 1,512,795 +21.5%
1,243,863 1,385,064 1,382,288 1,484,922 1,511,883 +21.5%
889 864 899 892 912 +2.6%
33,848 35,395 36,579 39,590 38,903 +14.9%
32,956 34,286 35,521 38,396 37,736 +14.5%
892 1,108 1,058 1,194 1,167 +30.9%
6,767 6,732 6,677 6,872 7,015 +3.7%
1,285,368 1,428,055 1,426,442 1,532,276 1,558,714 +21.3%Total transaction volume
Card cash advances
Loan cards, Others
Others
General services
Others
Financing
Card shopping
再鑑Ohno
17/10/31
Q3/16 Q4/16 Q1/17 Q2/17 Q3/17 YoY
1,244,752 1,385,928 1,383,187 1,485,814 1,512,795 +21.5%
1,243,863 1,385,064 1,382,288 1,484,922 1,511,883 +21.5%
889 864 899 892 912 +2.6%
33,848 35,395 36,579 39,590 38,903 +14.9%
32,956 34,286 35,521 38,396 37,736 +14.5%
892 1,108 1,058 1,194 1,167 +30.9%
6,767 6,732 6,677 6,872 7,015 +3.7%
1,285,368 1,428,055 1,426,442 1,532,276 1,558,714 +21.3%
Others
Financing
Card shopping
Total transaction volume
Card cash advances
Loan cards, Others
Others
General services

82
*1: Before deducting allowance for doubtful accounts *2: Balance of Rakuten Bank Super Loans guaranteed by Rakuten Card
(JPY mm)
Jenn
10/20
Q3/16 Q4/16 Q1/17 Q2/17 Q3/17 YoY
788,282 895,264 883,195 911,961 933,309 +18.4%
787,986 894,913 882,885 911,623 932,982 +18.4%
362,076 373,716 383,497 396,305 408,056 +12.7%
296 351 310 338 327 +10.3%
119,973 123,639 130,479 136,631 142,019 +18.4%
79,350 80,611 86,007 90,641 95,009 +19.7%
3,250 3,090 2,936 2,777 2,679 -17.6%
37,373 39,938 41,536 43,213 44,331 +18.6%
27,038 28,520 29,836 31,575 32,810 +21.3%
17 17 18 17 18 +4.7%
935,311 1,047,440 1,043,528 1,080,185 1,108,157 +18.5%
-2,096 -2,304 -2,521 -2,780 -3,018 -
933,215 1,045,137 1,041,008 1,077,405 1,105,138 +18.4%
Differences between J-GAAP and IFRS
Amount reported in IFRS B/S*1
Total balance
Card cash advances
General services
Installments
Loan cards
Others
Foreclosed credit guarantees for Rakuten Bank Super Loans
Card shopping
Financing
Revolving balance (principal)
Others
326,786 329,846 339,820 343,322 347,660 +6.4%Credit Guarantee
*2
for Rakuten Bank super loan (Off-balance)
再鑑Ohno
17/10/31
Q3/16 Q4/16 Q1/17 Q2/17 Q3/17 YoY
788,282 895,264 883,195 911,961 933,309 +18.4%
787,986 894,913 882,885 911,623 932,982 +18.4%
362,076 373,716 383,497 396,305 408,056 +12.7%
296 351 310 338 327 +10.3%
119,973 123,639 130,479 136,631 142,019 +18.4%
79,350 80,611 86,007 90,641 95,009 +19.7%
3,250 3,090 2,936 2,777 2,679 -17.6%
37,373 39,938 41,536 43,213 44,331 +18.6%
27,038 28,520 29,836 31,575 32,810 +21.3%
17 17 18 17 18 +4.7%
935,311 1,047,440 1,043,528 1,080,185 1,108,157 +18.5%
-2,096 -2,304 -2,521 -2,780 -3,018 -
933,215 1,045,137 1,041,008 1,077,405 1,105,138 +18.4%
Revolving balance (principal)
Others
Card cash advances
General services
Installments
Loan cards
Others
Foreclosed credit guarantees for Rakuten Bank Super Loans
Card shopping
Financing
Differences between J-GAAP and IFRS
Amount reported in IFRS B/S*1
Total balance
326,786 329,846 339,820 343,322 347,660 +6.4%Credit Guarantee
*2
for Rakuten Bank super loan (Off-balance)

83
(JPY mm)
*1: Ratio of expenses related to doubtful accounts = (Expenses related to doubtful accounts) / (average of total balance of loan receivables at beginning and end of the period) × 4
*2: Balance of Rakuten Bank Super Loans guaranteed by Rakuten Card
Q3/16 Q4/16 Q1/17 Q2/17 Q3/17 YoY
6,762 6,997 6,306 7,031 7,499 +10.9%
2.16% 2.12% 1.82% 2.00% 2.08% -
Expenses related to doubtful accounts
Ratio of expenses related to doubtful accounts*1
Q3/16 Q4/16 Q1/17 Q2/17 Q3/17 YoY
909,692 1,020,232 1,015,374 1,050,360 1,077,372 +18.4%
891,377 999,707 994,736 1,029,986 1,057,648 +18.7%
18,315 20,525 20,638 20,375 19,724 +7.7%
Secured 1,986 1,916 1,800 1,692 1,656 -16.6%
353,824 358,366 369,656 374,897 380,470 +7.5%
326,786 329,846 339,820 343,322 347,660 +6.4%
27,038 28,520 29,836 31,575 32,810 +21.3%
1,265,503 1,380,514 1,386,830 1,426,950 1,459,498 +15.3%
32,451 34,907 35,523 35,975 35,667 +9.9%
4,179 4,538 5,666 6,609 7,848 +87.8%Write-off for bad debt
Rakuten Bank Super Loans
Normal (Credit guarantees*2)
Doubtful (Foreclosed credit guarantees)
Total balance of loan receivables
Allowance for doubtful accounts
Rakuten Card
Normal
Doubtful (4 months-and-over-delinquent)
再鑑Ohno
17/10/31
Q3/16 Q4/16 Q1/17 Q2/17 Q3/17 YoY
6,762 6,997 6,306 7,031 7,499 +10.9%
2.16% 2.12% 1.82% 2.00% 2.08% -
Expenses related to doubtful accounts
Ratio of expenses related to doubtful accounts*1
Q3/16 Q4/16 Q1/17 Q2/17 Q3/17 YoY
909,692 1,020,232 1,015,374 1,050,360 1,077,372 +18.4%
891,377 999,707 994,736 1,029,986 1,057,648 +18.7%
18,315 20,525 20,638 20,375 19,724 +7.7%
Secured 1,986 1,916 1,800 1,692 1,656 -16.6%
353,824 358,366 369,656 374,897 380,470 +7.5%
326,786 329,846 339,820 343,322 347,660 +6.4%
27,038 28,520 29,836 31,575 32,810 +21.3%
1,265,503 1,380,514 1,386,830 1,426,950 1,459,498 +15.3%
32,451 34,907 35,523 35,975 35,667 +9.9%
4,179 4,538 5,666 6,609 7,848 +87.8%
Rakuten Card
Normal
Doubtful (4 months-and-over-delinquent)
Write-off for bad debt
Rakuten Bank Super Loans
Normal (Credit guarantees*2)
Doubtful (Foreclosed credit guarantees)
Total balance of loan receivables
Allowance for doubtful accounts

84
(JPY mm)
Q3/16 Q4/16 Q1/17 Q2/17 Q3/17 YoY
16,549 17,111 17,923 18,606 19,048 +15.1%
717 791 319 584 610 -14.9%
Ordinary income (J-GAAP) 17,266 17,903 18,241 19,190 19,658 +13.9%
11,470 11,795 11,882 12,740 13,121 +14.4%
5,062 5,308 5,362 5,446 5,470 +8.1%
454 631 623 814 815 +79.5%
155 48 241 67 121 -21.9%
125 122 133 124 130 +4.2%
12,897 12,969 13,009 13,441 14,067 +9.1%
523 505 440 466 475 -9.1%
6,656 6,949 6,914 7,268 7,369 +10.7%
179 260 -293 - - -
5,406 5,151 5,723 5,546 6,038 +11.7%
134 104 226 160 184 +37.9%
4,369 4,934 5,232 5,749 5,592 +28.0%
Differences between J-GAAP and IFRS and etc. 205 158 284 180 194 -
4,163 4,776 4,948 5,569 5,398 +29.7%
Differences between J-GAAP and IFRS, and etc.
Revenue (IFRS)
Operating income (IFRS)
Interest income
Fees and commissions
Other ordinary income
Trust fees
Other ordinary expenses
Ordinary profit (J-GAAP)
Interest expenses
Other income
General and administrative expenses
Other expenses
Fees and commissions payments
Ordinary expenses (J-GAAP)
Q3/16 Q4/16 Q1/17 Q2/17 Q3/17 YoY
16,549 17,111 17,923 18,606 19,048 +15.1%
717 791 319 584 610 -14.9%
Ordinary income (J-GAAP) 17,266 17,903 18,241 19,190 19,658 +13.9%
11,470 11,795 11,882 12,740 13,121 +14.4%
5,062 5,308 5,362 5,446 5,470 +8.1%
454 631 623 814 815 +79.5%
155 48 241 67 121 -21.9%
125 122 133 124 130 +4.2%
12,897 12,969 13,009 13,441 14,067 +9.1%
523 505 440 466 475 -9.1%
6,656 6,949 6,914 7,268 7,369 +10.7%
179 260 -293 - - -
5,406 5,151 5,723 5,546 6,038 +11.7%
134 104 226 160 184 +37.9%
4,369 4,934 5,232 5,749 5,592 +28.0%
Differences between J-GAAP and IFRS and etc. 205 158 284 180 194 -5.7%
4,163 4,776 4,948 5,569 5,398 +29.7%Operating income (IFRS)
Interest income
Fees and commissions
Other ordinary income
Trust fees
Other ordinary expenses
Ordinary profit (J-GAAP)
Interest expenses
Other income
General and administrative expenses
Other expenses
Fees and commissions payments
Ordinary expenses (J-GAAP)
Differences between J-GAAP and IFRS, and etc.
Revenue (IFRS)

85
(JPY bn)
*1: Intercompany elimination on IFRS consolidation *2: Other deposits include deposits in foreign currencies and others
1,750.4
1,120.0
571.1
59.4
190.1
1,940.5
97.1
2,037.6
1,978.4
400.1
389.7
10.4
10.0
743.7
690.1
53.6
142.6
106.3
16.5
19.8
0.0
681.9
360.6
321.3
59.2
2,037.6
Sep/17
Invested assets 2,081.2
Deposits (paid) 443.3
Deposits with the Bank of Japan 431.1
Other deposits 12.2
Call loans 0.0
Securitized loan receivables 766.9
Rakuten Card securitized assets*1 704.9
Others 62.1
Securities 147.7
JGBs, Local Government bonds, Authority bonds 111.7
Short-term bonds 16.5
Corporate bonds, Foreign bonds 19.5
Others 0.0
Loan Receivables 723.2
Rakuten Bank Super Loan 365.8
Others 357.5
Other assets 47.2
Total assets 2,128.3
Assets Sep/17
Deposits (received) 1,824.1
Ordinary Deposits 1,169.6
Time Deposits 594.3
Other Deposits*2 60.2
Other liabilities 203.3
Total Liabilities 2,027.5
Total net assets 100.8
Total liabilities and net assets 2,128.3
Liabilities and Net Assets

86
* Core net business profit = Net business profit - General and administrative expenses - Gains (losses) related to bonds
Net business profit = Net interest income and expenses + Net fees and commissions + Net other ordinary income and expenses + Trust fees
10/31
Jenn

87
*1: Based on IFRS which includes derivatives in structured term deposits. *2: Other deposits include deposits in foreign currencies and others.

88

89
10/18
Jenn
再鑑Ohno
17/10/31

90
11/1 Jenn
91 91
Jenn
10/18
再鑑Ohno
17/10/31
92
10/18
Jenn
再鑑Ohno
17/10/31
93
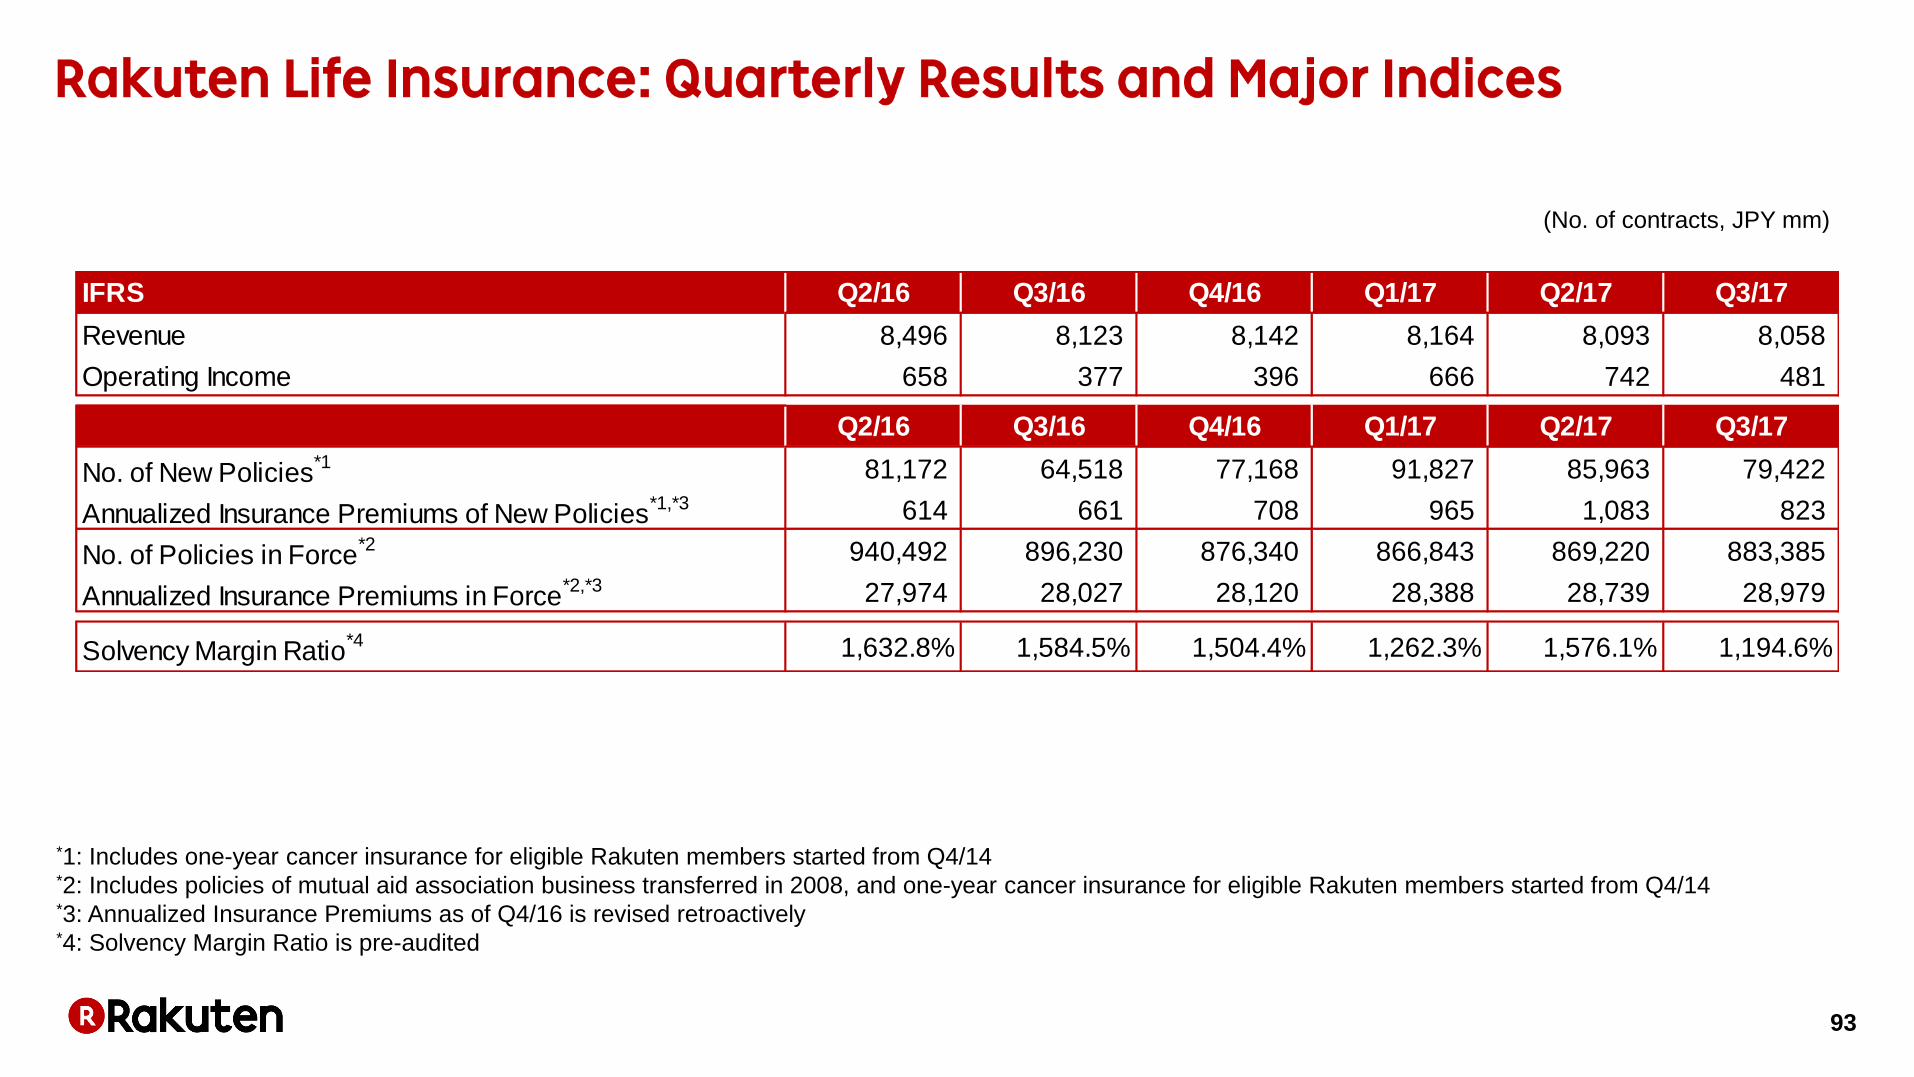
*1: Includes one-year cancer insurance for eligible Rakuten members started from Q4/14 *2: Includes policies of mutual aid association business transferred in 2008, and one-year cancer insurance for eligible Rakuten members started from Q4/14 *3: Annualized Insurance Premiums as of Q4/16 is revised retroactively *4: Solvency Margin Ratio is pre-audited
(No. of contracts, JPY mm)
Q2/16 Q3/16 Q4/16 Q1/17 Q2/17 Q3/17
Revenue 8,496 8,123 8,142 8,164 8,093 8,058
Operating Income 658 377 396 666 742 481
Q2/16 Q3/16 Q4/16 Q1/17 Q2/17 Q3/17
No. of New Policies*1 81,172 64,518 77,168 91,827 85,963 79,422
Annualized Insurance Premiums of New Policies*1,*2 614 661 708 965 1,083 823
No. of Policies in Force*1 940,492 896,230 876,340 866,843 869,220 883,385
Annualized Insurance Premiums in Force*1,*2 27,974 28,027 28,120 28,388 28,739 28,979
1,632.8% 1,584.5% 1,504.4% 1,262.1% 1,576.1% 1,194.5%Solvency Margin Ratio*3
IFRS
再鑑Ohno
17/10/31
Q2/16 Q3/16 Q4/16 Q1/17 Q2/17 Q3/17
Revenue 8,496 8,123 8,142 8,164 8,093 8,058
Operating Income 658 377 396 666 742 481
Q2/16 Q3/16 Q4/16 Q1/17 Q2/17 Q3/17
No. of New Policies*1 81,172 64,518 77,168 91,827 85,963 79,422
Annualized Insurance Premiums of New Policies*1,*2 614 661 708 965 1,083 823
No. of Policies in Force*1 940,492 896,230 876,340 866,843 869,220 883,385
Annualized Insurance Premiums in Force*1,*2 27,974 28,027 28,120 28,388 28,739 28,979
1,632.8% 1,584.5% 1,504.4% 1,262.1% 1,576.1% 1,194.5%Solvency Margin Ratio*3
IFRS
Q2/16 Q3/16 Q4/16 Q1/17 Q2/17 Q3/17
Revenue 8,496 8,123 8,142 8,164 8,093 8,058
Operating Income 658 377 396 666 742 481
Q2/16 Q3/16 Q4/16 Q1/17 Q2/17 Q3/17
No. of New Policies*1 81,172 64,518 77,168 91,827 85,963 79,422
Annualized Insurance Premiums of New Policies*1,*3 614 661 708 965 1,083 823
No. of Policies in Force*2 940,492 896,230 876,340 866,843 869,220 883,385
Annualized Insurance Premiums in Force*2,*3 27,974 28,027 28,120 28,388 28,739 28,979
1,632.8% 1,584.5% 1,504.4% 1,262.3% 1,576.1% 1,194.6%Solvency Margin Ratio*4
IFRS

94
95 95
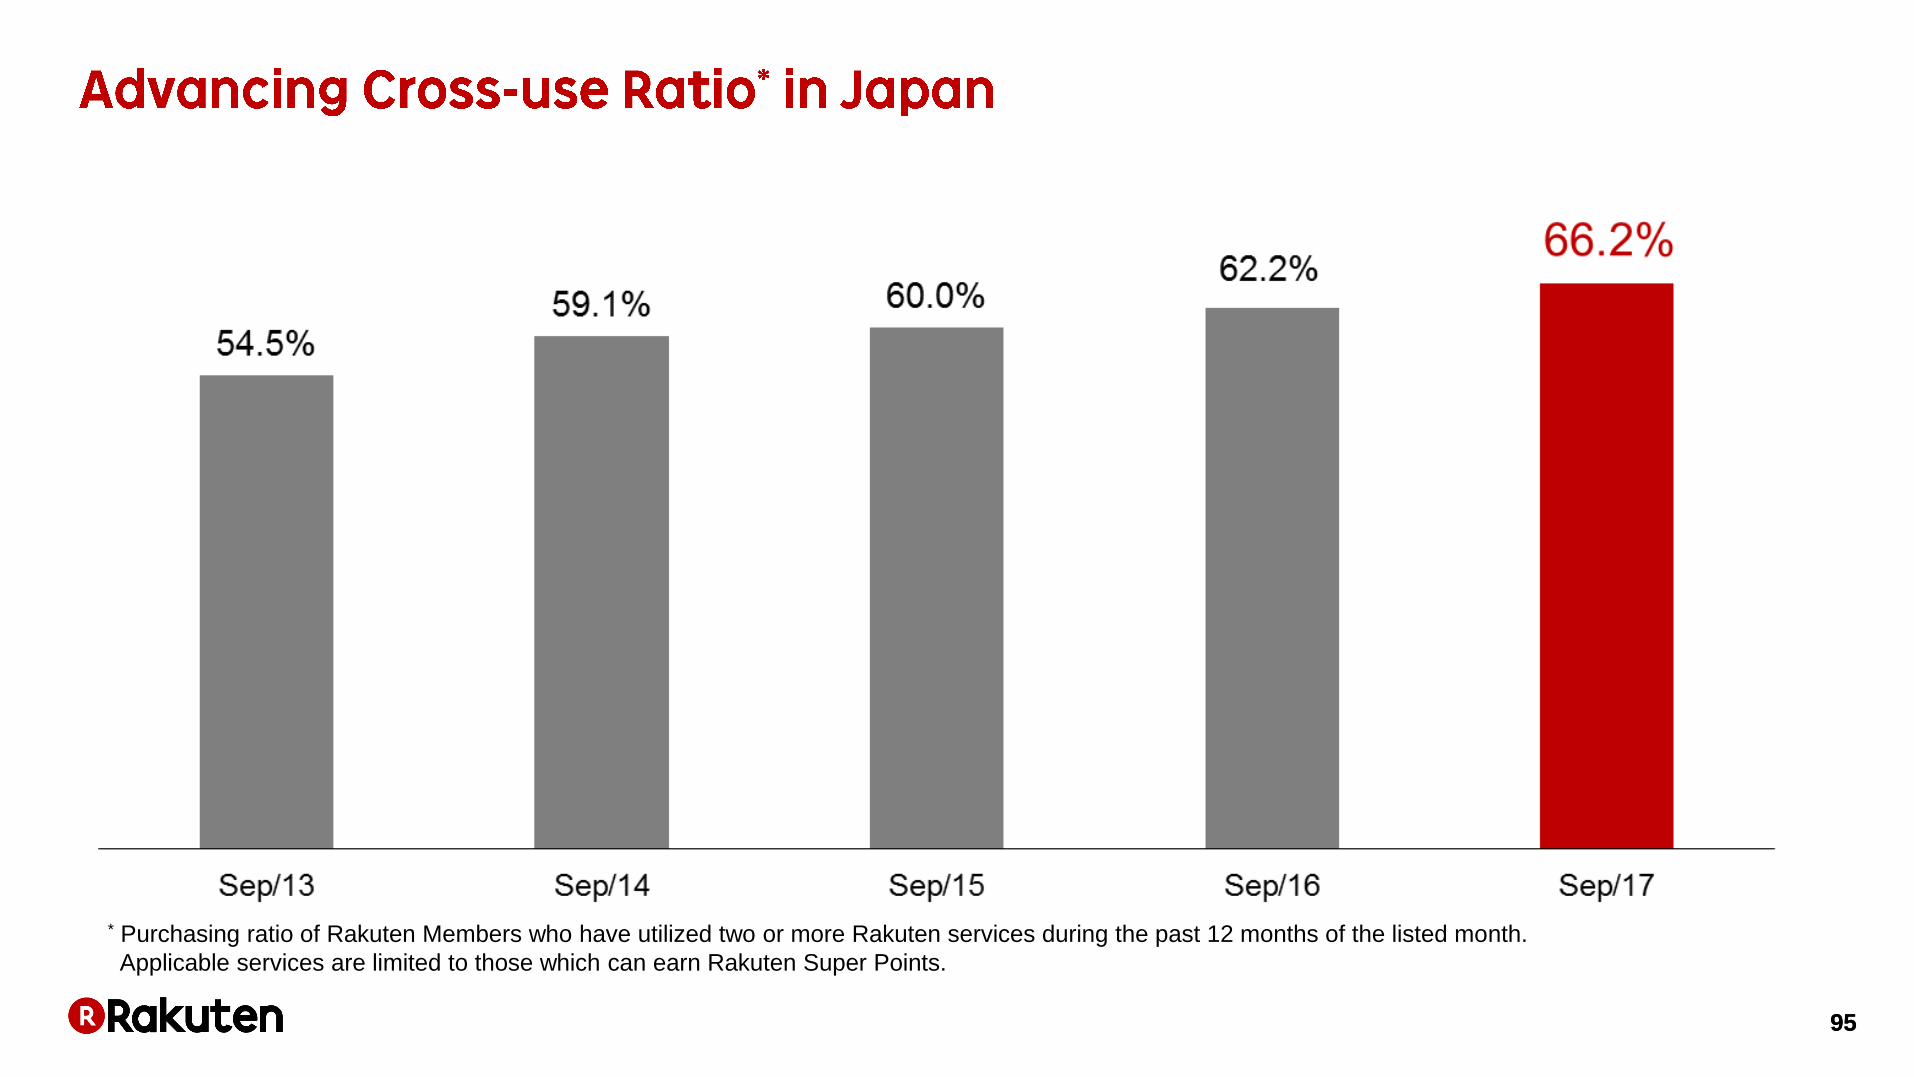
* Purchasing ratio of Rakuten Members who have utilized two or more Rakuten services during the past 12 months of the listed month.
Applicable services are limited to those which can earn Rakuten Super Points.
11/6
Onodera

96 96
* Rakuten IDs where members logged in at least once after membership registration (excluding members who cancelled their membership)
11/6
Onodera
Sep/15 Sep/16 Sep/17 YoY
Rakuten IDs* 76.6 88.3 93.4 +5.8%

97

Related Documents

![[Rakuten TechConf2014] [B-6] Rakuten Travel Architecture and Development Process](https://static.cupdf.com/doc/110x72/5595a1061a28ab00448b46f7/rakuten-techconf2014-b-6-rakuten-travel-architecture-and-development-process.jpg)
![[Rakuten TechConf2014] [D-6] Rakuten BaaS in ROOM & Rakuten Kobo](https://static.cupdf.com/doc/110x72/5595a0fb1a28ab00448b46f2/rakuten-techconf2014-d-6-rakuten-baas-in-room-rakuten-kobo.jpg)