HAL Id: tel-03585530 https://tel.archives-ouvertes.fr/tel-03585530 Submitted on 23 Feb 2022 HAL is a multi-disciplinary open access archive for the deposit and dissemination of sci- entific research documents, whether they are pub- lished or not. The documents may come from teaching and research institutions in France or abroad, or from public or private research centers. L’archive ouverte pluridisciplinaire HAL, est destinée au dépôt et à la diffusion de documents scientifiques de niveau recherche, publiés ou non, émanant des établissements d’enseignement et de recherche français ou étrangers, des laboratoires publics ou privés. Novel function of the ER stress transducer IRE1α in cell migration and invasion of metastatic melanoma cells Celia María Limia León To cite this version: Celia María Limia León. Novel function of the ER stress transducer IRE1α in cell migration and invasion of metastatic melanoma cells. Human health and pathology. Université Rennes 1, 2021. English. NNT : 2021REN1B015. tel-03585530

Welcome message from author
This document is posted to help you gain knowledge. Please leave a comment to let me know what you think about it! Share it to your friends and learn new things together.
Transcript

HAL Id: tel-03585530https://tel.archives-ouvertes.fr/tel-03585530
Submitted on 23 Feb 2022
HAL is a multi-disciplinary open accessarchive for the deposit and dissemination of sci-entific research documents, whether they are pub-lished or not. The documents may come fromteaching and research institutions in France orabroad, or from public or private research centers.
L’archive ouverte pluridisciplinaire HAL, estdestinée au dépôt et à la diffusion de documentsscientifiques de niveau recherche, publiés ou non,émanant des établissements d’enseignement et derecherche français ou étrangers, des laboratoirespublics ou privés.
Novel function of the ER stress transducer IRE1α in cellmigration and invasion of metastatic melanoma cells
Celia María Limia León
To cite this version:Celia María Limia León. Novel function of the ER stress transducer IRE1α in cell migration andinvasion of metastatic melanoma cells. Human health and pathology. Université Rennes 1, 2021.English. �NNT : 2021REN1B015�. �tel-03585530�

THESE DE DOCTORAT DE
L'UNIVERSITE DE RENNES 1
ECOLE DOCTORALE N° 605 Biologie Santé
Spécialité : Cancérologie
Novel function of the ER stress transducer IRE1α in cell migration and invasion of metastatic melanoma cells.
Thèse présentée et soutenue à Rennes, le 8 juin 2021 Unité de recherche : INSERM U1242
Par
Celia María LIMIA-LEÓN
Rapporteurs avant soutenance :
Jacky Goetz Directeur de Recherches, Inserm, Strasbourg Elif Karagöz Group leader, Max Perutz Lab, Vienne
Composition du Jury :
Président : Nathalie Théret Directeur de Recherches, Inserm Examinateurs : Jacky Goetz Directeur de Recherches, Inserm, Strasbourg
Elif Karagöz Group leader, Max Perutz Lab, Vienne
Lise Boussemart PUPH, Univ. Nantes, Nantes
Dir. de thèse : Eric Chevet Directeur de Recherches, Inserm Co-dir. de thèse : Claudio Hetz Professeur, Univ. Chili

To my family

1
1. INDEX.
1. INDEX. 1
2. TABLE OF FIGURES. 4
3. ABBREVIATIONS. 6
4. INTRODUCTION. 10
4.1. Cancer: a public health problem. 10
4.2. Tumorigenesis and metastasis. 11
4.3. Mechanisms and molecular actors of tumor cell migration, invasion and metastasis. 13
4.3.1. Different steps of the migration/invasion process at the cellular and molecular levels. 15
4.4. Endoplasmic Reticulum Stress in Cancer. 19
4.5. Unfolded Protein Response. 21
4.5.1. PERK and ATF6 signaling. 21
4.5.2. IRE1 signaling, stress sensing and activation mechanism. 22
4.6. Connections between IRE1 signaling and cancer progression. 26
4.7. IRE1 in cell migration and metastasis. 28
4.8. FLNA function in cell migration and metastasis. 31
4.9. Melanoma signaling and the UPR. 33
5. HYPOTHESIS. 36
6. GENERAL AIM. 36
7. SPECIFIC AIMS. 36
8. MATERIALS AND METHODS. 37
8.1. Reagents. 37
8.2. Cell culture and generation of the IRE1 Knockout cell lines. 37
8.3. NIH-conditioned medium. 38
8.4. RNA isolation and RT-PCR. 39
8.5. Immunoprecipitations. 39
8.6. Western blot analysis. 40
8.7. Knockdown of IRE1 and FLNA. 41

2
8.8. Cell proliferation assay. 41
8.9. Transwell Migration Assay. 42
8.10. Adhesion Assay. 42
8.11. Actin cytoskeleton analysis. 42
8.12. Cell invasion assay. 43
8.13. Experimental metastasis assay. 44
8.14. Bioinformatic analysis. 46
8.15. Statistical analysis. 48
9. RESULTS. 49
9.1. Activation status of IRE1 during metastasis in melanoma. 49
9.2. Role of IRE1 in migration and invasion of melanoma cells. 54
9.2.1. Role of IRE1 in melanoma cell migration. 55
9.2.2. Regulation of actin cytoskeleton organization by IRE1 in metastatic melanoma cells. 66
9.2.3. Regulation of cell adhesion by IRE1 in metastatic melanoma cells. 70
9.2.4. Effect of IRE1 deficiency in cell invasion of human metastatic melanoma cells. 72
9.3. Role of the IRE1/FLNA pathway in the regulation of cell migration and invasion in melanoma. 75
9.3.1. Role of the IRE1 RNase-RIDD dependent activity in the suppression of melanoma cell migration. 81
9.4. Correlation of IRE1 activity and metastasis in melanoma in vivo. 88
10. DISCUSSION. 94
11. CONCLUSIONS. 109
12. SUPPLEMENTARY FIGURES. 110
13. PUBLICATIONS 119
13.1. IRE1α controls cytoskeleton remodeling and cell migration through a direct interaction with Filamin A. 119
Nat Cell Biol. 2018 Aug;20(8):942-953. 119
13.1.1. Foreword 119
13.1.2. Contribution 119
13.2. Emerging Roles of the Endoplasmic Reticulum Associated Unfolded Protein Response in Cancer Cell Migration and Invasion. 121

3
Cancers (Basel). 2019 May 6;11(5). 121
13.2.1. Foreword 121
13.2.2. Contribution 121
14. CONGRESSES AND FUNDING 123
14.1. Congresses 123
14.2. Funding 123
15. REFERENCES. 124

4
2. TABLE OF FIGURES.
Figure 1. Metastatic cascade. 15
Figure 2. The cellular processes and molecular actors involved in cell
migration/invasion. 18
Figure 3. Secretory protein demand and disruption of endoplasmic reticulum
homeostasis in cancer cells. 20
Figure 4. Unfolded protein response and the hallmarks of cancer. 21
Figure 5. Unfolded protein response. 25
Figure 6. Filamin a structure and regulation. 33
Figure 7. Workflow of the generation of ire1 knockout (ko) human melanoma
cells. 38
Figure 8. Lung metastasis using an experimental tail vein injection model in
immunosuppressed mice. 45
Figure 9. Lung metastasis using an experimental tail vein injection model in
immunocompetent mice. 45
Figure 10. Ire1 activation in mouse melanoma metastasis. 51
Figure 11. Ire1 signaling in human melanoma tumors. 53
Figure 12. Ire1 activation status in human melanoma metastasis. 54
Figure 13. Characterization of human melanoma cell lines. 58
Figure 14. Standardization of the transmigration assay. 59
Figure 15. Ire1 deficiency increases cell migration in human metastatic
melanoma cells. 60
Figure 16. Validation of the generation of ire1 ko in a375-ma2 cells. 62
Figure 17. Characterization the of ire1 ko a375-ma2 clones selected. 63
Figure 18. Ire1 deficiency increases cell migration in human metastatic
melanoma cells. 65
Figure 19. Actin cytoskeleton is not affected by ire1 deficiency in ma2-a375
cells. 67

5
Figure 20. Filopodia formation is independent of ire1 expression. 69
Figure 21. Cell adhesion capacity to fibronectin and matrigel is independent of
ire1 expression in a375-ma2 cells. 71
Figure 22. Silencing of ire1 increases cell invasion in human metastatic
melanoma cells. 72
Figure 23. Ire1 deficiency increases cell invasion in human metastatic
melanoma cells. 74
Figure 24. Silencing of flna expression do not influence cell migration of
metastatic cells. 76
Figure 25. Flna phosphorylation is independent of ire1 expression under
promigratory stimuli. 78
Figure 26. Flna phosphorylation is independent of ire1 expression under er
stress. 80
Figure 27. The mkc-8866 ire1 rnase inhibitor increases cell migration in human
metastatic melanoma cells. 82
Figure 28. Forced xbp1s expression does not influence cell migration of
metastatic melanoma cells. 83
Figure 29. Pipeline of the analysis to identify pro-metastatic genes and putative
ridd-targets in melanoma. 86
Figure 30. Pro-metastatic genes and putative ridd-targets in melanoma. 87
Figure 31. Standardization of a375-ma2 lung metastatic model by tail vein
injection. 89
Figure 32. Lung metastasis is independent of ire1 expression in an
experimental metastatic melanoma model. 91
Figure 33. Frequency distribution of metastatic foci size. 92
Figure 34. Regulation of melanoma cell movement by the ire1 and ridd axis:
proposed model. 108

6
3. ABBREVIATIONS.
ABD : Actin-binding domain
ATF4 : Activating transcription factor 4
ATF6 : Activating transcription factor 6α
ATF6f : Fragment of ATF6
Bcl-2 : B-cell lymphoma 2
Bcl-xL : B-cell lymphoma-extra large
BiP : Immuniglobulin binding protein
BRAF : B-Raf Proto-Oncogene
Cdc42 : Cell division control protein 42 homolog
CHOP : C/EBP homologous protein
CTC : Circulating tumor cells
DCC : Disseminated cancer cells
DMEM : Dulbecco′s Modified Eagle′s
eIF2α : Eukaryotic translation initiation factor 2 alpha
EMC : Extracelular matrix
EMEM : Eagle's Minimum Essential Medium
EMT : Epithelial-mesenchymal transition
ER : Endoplasmic reticulum
ERAD : ER-associated degradation system
F-actin : Actin filaments
FAK : Focal adhesion kinase
FBS : Fetal bovine serum
FGF : Fibroblast growth factor
FGFR : Fibroblast growth factor receptor
FLNA : Filamin A

7
GADD34 : Growth Arrest and DNA Damage-Inducible Protein
GBM : Glioblastoma multiforme
Grp94 : Glucose -regulated protein 94
H&E : Hematoxylin & Eosin
HERPUD1 : Homocysteine-responsive endoplasmic reticulum-resident
ubiquitin-like domain member 1
HIF1α : Hypoxia-inducible factor 1-alpha
IL-6 : Interleukin-6
IL2rɣnull : Null allele of the IL2 receptor common gamma chain
IP : Immunoprecipitations
IRE1α : Inositol-requiring protein 1α
KO : Knockout
MAPK : Mitogen-activated protein kinases
MCM7 : Minichromosome maintenance complex component 7
MLC : Myosin light chain
MLKC : Myosin light-chain kinase
MMP : Metalloproteinases
MT1-MMP : Membrane type 1-matrix metalloproteinase
MTHFD2 : Methylenetetrahydrofolate dehydrogenase (NADP+
Dependent) 2, methenyltetrahydrofolate cyclohydrolase
NIH-CM : NIH- conditioned medium
NNT : NAD(P) transhydrogenase
NSG : NOD/SCID/IL2rɣnull mice
PBST : PBS, 0.1% Tween20
PERK : PKR-like ER kinase
PFA : Paraformaldehyde
PI3Ks : Phosphoinositide 3-kinases
PKCα : Protein kinase C alpha

8
PP1 : Protein phosphatase-1
Rac1 : Ras-related C3 botulinum toxin substrate 1
Rb : Retinoblastoma protein
RIDD : IRE1-dependent decay
RNase : Endoribonuclease
ROBO1 : Roundabout guidance receptor 1
ROCK : Rho-associated serine/threonine kinase
SCID : Severe combined immune deficiency
sgRNAs : Single guide RNAs
siRNA : Small-interfering RNA
SKCM : Skin cutaneous melanoma
SKIV2L2 : Mtr4 exosome RNA helicase
SMC4 : Structural maintenance of chromosomes protein 4
Snail1 : Snail family transcriptional repressor 1
Snail2 : Snail family transcriptional repressor 2
SPARC : Secreted protein acidic and cysteine rich
SPCS3 : Signal peptidase complex subunit 3
Src : Proto-oncogene tyrosine-protein kinase
TARDBP : TAR DNA binding protein
TCF3 : Transcription Factor 3
TM : Tunicamycin
TNBC : Triple-negative breast cance
TRAF2 : TNFR-associated factor 2
uPA : urokinase-type plasminogen activator
UPR : Unfolded protein response
VEGF-A : Vascular endothelial growth factor A
WASP : Wiskott-Aldrich syndrome protein

9
WAVE : WASP-family verprolin-homologous protein
XBP1 : X-box binding protein-1
XBP1s : Spliced form of XBP1
ZEB2 : Zinc Finger E-Box Binding Homeobox 2

10
4. INTRODUCTION.
Cancer: a public health problem.
Cancer is a disease characterized by the uncontrolled growth of abnormal cells
that can originate from most of the human body's cells and organs. The most
accepted theory is that a set of genetic mutations in normal cells allows them to
proliferate, invade tissue, and metastasize autonomously (1). This disease is one of
the leading causes of morbidity and mortality worldwide and is the second leading
cause of death globally. Currently, it causes millions of deaths a year, generating
high economic and social costs (2).
In Chile, malignancies are the second cause of mortality, accounting for 21.8%
of deaths, with approximately 35,000 new cancer cases per year and a rate of 143
per 100,000 inhabitants in 2015 (3, 4). In comparison with other causes of death,
cancer shows an upward trend with increasing mortality. In Chile, the most frequent
tumor locations are stomach, lung and prostate among men and breast, lung and
cervix in women (5). On the other hand, cancer is the leading cause of death in
France, accounting for 185621 deaths, with 467965 new cases in 2020 (6). The
most frequent tumors are prostate, lung and colorectum among men and breast,
colorectum and lungs among women (7).
Importantly, the leading cause of death in patients with cancer is the
dissemination of the tumor cells from the primary site of the tumor to different organs
(8). One of the most metastatic tumors is cutaneous malignant melanoma, in which
incidence and mortality have increased over the past several decades in Chile (9).
Melanoma constitutes between 1 and 4% of skin cancers; however, it is responsible
for most of the deaths related to skin cancer (10). This type of tumor presents a high

11
rate of early metastasis in the disease progression, which can occur even from thin
primary tumors (11). Although substantial progress has been made to understand
the complexity of melanoma metastasis, the identification of new targets is essential
to restrain tumor dissemination from the primary lesion to distant organs.
Tumorigenesis and metastasis.
Tumorigenesis involves (i) the acquisition of genetic alterations by individual
cells and (ii) the subsequent action of natural selection upon this phenotypic
diversity that allows tumor cells to acquire fundamental characteristics that drive the
development of the tumor (12). These distinctive features of tumor cells –collectively
known as the hallmarks of cancer– include sustained proliferative signals, evasion
of cell proliferation control mechanisms, resistance to programmed cell death,
unlimited replicative potential, angiogenesis, reprogrammed energy metabolism,
immune system evasion and tissue invasion and metastasis (12, 13).
The most fundamental traits of tumor cells involves the autocrine stimulation
of cancer cell proliferation and is mediated by: an increased secretion of growth
factors, the induction of the production of these growth factors in the stromal cells
(14, 15) and the negative control of anti-proliferative signals mediated by tumor
suppressor genes such as p53 and retinoblastoma protein (pRb) (16, 17).
Importantly, another relevant feature in tumor cells is the capacity to resist to the
induction of cell death. Tumor cells that have increased expression of anti-
apoptotic regulators, such as B-cell lymphoma 2 (Bcl-2), B-cell lymphoma-extra-
large (Bcl-xL), or enhancing survival signals, through a decrease in the expression
of proapoptotic factors, are positively selected (18). Also, tumor cells have capacity
to induce a process of neo-angiogenesis adding new vessels associated with the

12
tumor to sustain the neoplastic growth (19) through the regulation of vascular
endothelial growth factor A (VEGF-A) and thrombospondin-1 (20, 21). The
generation of new vessels, which give access to the circulation, and the acquisition
of invasive capacities allow tumor cells to migrate from the primary tumor to other
organs and initiate a process known as metastasis.
Metastasis is defined as the movement of tumor cells from a primary site
to progressively colonize distant organs, representing a major contributor to
the death of cancer patients. This ability of tumor cells to metastasize is one of
the most concerning problems in cancer research (22). Indeed, despite the
substantial effort dedicated to the early detection and diagnosis of cancer, most
patients present metastasis at the time of medical care, and approximately 90% die
from metastatic lesions (23, 24). Tumor metastasis generates three mayor medical
problems: (i) resistance to conventional therapeutic treatments, (ii) high invasive
and proliferation rates and (iii) failure of vital organs (25). Metastasis treatment with
drugs such as bevacizumab (VEGF blocking antibody) and dasatinib/saracatenib
(Proto-oncogene tyrosine-protein kinase (Src) kinase inhibitors) have been tested
in cellular and animal models with positive outcomes; however, all efforts to
specifically target metastasis have failed in preclinical models and clinical trials (25);
therefore, a deep understanding of the key molecular pathways involved in this
malignant event is required to design future therapeutic options.
As mentioned, the capacity of tumor cells to invade adjacent tissues and form
distant metastases is one of the most aggressive features of cancer. Most solid
cancers progress to disseminated metastatic disease, leading to secondary tumors
and the invasion of tumor cells from the primary tumor to distant tissues is one of
the early steps in the metastatic cascade (26). One of the best characterized

13
metastatic processes is the metastasis in melanoma, known to exhibit high
migration/invasion properties through a metastatic infiltration process.
Melanoma is developed by the transformation of melanocytes, cells
specialized in the production of melanin, and accounts for approximately 80% of
skin cancer-related deaths (27). The classical model describing melanoma
progression consists in a series of steps, beginning for the formation of a benign
precursor (melanocytic nevus), followed by the generation of a dysplastic nevus,
progression through radial and vertical growth phases, and finally the metastasis
(28, 29). The radial growth phase represents an early stage in the disease, and it is
determined by a horizontal growth in the epidermis. The second phase (vertical
growth phase) represents the first stage of melanoma dissemination, and it is
characterized by a vertical growth that allows the invasion into deeper skin layers.
To progress through all these stages, metastatic cells exhibit common cellular and
molecular features including increased reorganization of actin cytoskeleton,
uncontrolled cellular migration, and an increased capacity of degradation of
extracellular matrix and invasion (30). In the next section, we will provide a brief
overview of the molecular mechanism and actors that regulate cell migration,
invasion, and metastasis in cancer.
Mechanisms and molecular actors of tumor cell migration,
invasion and metastasis.
The process of metastasis has been schematized as a sequence of steps
involving (i) local invasion and intravasation of tumor cells to neighboring blood and
lymphatic vessels, (ii) transit of tumor cells through the lymphatic and blood system,
(iii) extravasation or escape from the vessels to the parenchyma of distant tissues,

14
(iv) the formation of small nodules of tumor cells, denominated micro-metastasis,
and (v) the growth of these lesions into macroscopic tumors (31). A series of
alterations in critical molecular and cellular processes allow tumor cells to rapidly
and effectively complete all these steps (Reviewed in (32)) (Figure 1).
Cell migration is required for multiple biological processes, such as tissue
repair, immune system responses, and organogenesis during development (33).
However, aberrant cell migration promotes the progression of many diseases,
including metastasis (reviewed in (30)). During migration, cells polarize through the
leading edge triggering the formation of focal adhesions and protrusions. Once
adhesions are formed, the rear retracts, allowing the cell body to move forward.
These steps are spatiotemporally regulated by different proteins involved in
signaling pathways that ultimately lead to increased actin and microtubule
dynamics (34, 35). Meanwhile, the invasion occurs when tumor cells acquire the
ability to penetrate the surrounding tissues through the degradation of the
extracellular matrix (ECM) and pass through the basement membrane. An essential
process for tumor cell invasion is the epithelial-mesenchymal transition (EMT), a
cellular process through which epithelial cells undergo morphological and
biochemical changes leading to a more mesenchymal phenotype with enhanced
invasive capabilities (36).
Invasion of tumor cells is initiated by different signaling pathways that control
actin cytoskeleton dynamics, the turnover of cell-cell and cell-matrix junctions, and
remodeling of the tumor environment (30). The remodeling of the tumor
microenvironment can guide tumor cells and induce several types of movement
(13). Moreover, the tumor microenvironment is also involved in the activation of

15
several signaling pathways and cellular processes that lead to the metastatic
process (37).
Figure 1. Metastatic cascade.
Metastasis is a multistep process that has been schematized as a sequence of steps, firstly involving primary tumor detachment and invasion to the surrounding extracellular matrix. This process allows tumor cells to intravasate to blood and lymphatic vessels and enters in the circulation. Tumor cells then attach to endothelial cells, a process that facilitates the extravasation from the blood vessels to the parenchyma of the target organ. The next step is forming small nodules of cancer cells, denominated micro-metastasis, where tumoral cells can remain dormant for a long time before the growth of these lesions into macroscopic tumors. This last step is known as colonization. (Figure modified from: Gómez-Cuadrado, L. et al., 2017).
Different steps of the migration/invasion process at the cellular and
molecular levels.
Tumor cells use similar migration mechanisms to spread within tissues that the
ones used by non-tumor cells during physiological processes. Cell migration
through tissues can be described as a cycle of the five-steps process (Figure 2)
Primary tumor
Invasion
Intravasation
Circulation
Extravasation
MicrometastasisColonization/Metastasis
Target organ
Initial organ Extracellular Matrix
Epithelial cells
Tumor cells
Platelet
Endothelial cells
Blood vessels
Basement membrane

16
(38, 39). In the first step, the moving cells become polarized and elongate with the
generation of protrusions at the leading edge, where little adhesion to the ECM is
required (Figure 2.1). These protrusions are formed by parallel and crosslinked
actin filaments and a group of scaffolding and signaling proteins that allow signal
exchange with the ECM substrates. Cell protrusions during the migratory process
can take several forms, including lamellipodia, filopodia, pseudopods, and
invadopodia (40). The formation of these structures is regulated by the activation of
Rho GTPase family members (35, 41). Of these GTPases, Ras-related C3
botulinum toxin substrate 1 (Rac1) and Cell division control protein 42 homolog
(Cdc42) are required for lamellipodia and filopodia formation. Cdc42 interacts with
the Wiskott-Aldrich syndrome protein (WASP) proteins to induce filopodia formation,
while Rac1 enhances lamellipodia generation by the activation of WASP-family
verprolin-homologous protein (WAVE) proteins (42).
In the second step, cells form focal contacts with the ECM (Figure 2.2).
These contacts are composed of clusters of adhesion proteins, mainly integrins,
transmembrane receptors that recruit adaptor and signaling proteins to form an
initial focal complex, which can grow and stabilize to form a focal contact. The
integrin intracellular domains interact with signaling proteins such as the focal
adhesion kinase (FAK), paxillin, and tensin that together with actin-binding proteins,
like vinculin, paxillin, Filamin A (FLNA) and α-actinin, lead to the activation of Rho
GTPases family and Phosphoinositide 3-kinases (PI3Ks) (43-45).
In a third step, proteases are secreted near to the attachment sites leading to
the degradation of the ECM components like collagen, fibronectin, and laminins
(Figure 2.3). Among these proteases implicated in ECM degradation are surface

17
matrix metalloproteinases (MMP) such as Membrane type 1-matrix
metalloproteinase (MT1-MMP) that cleaves native collagens, along with other
macromolecules, into smaller fragments making them more accessible for secreted
proteases like MMP2 and MMP9 or serine proteases (38, 46). This step is one of
the major drivers of tumor cell invasion. The major structure that orchestrates this
process is the invadopodium, being a hallmark of tumor cells favoring dissemination
and metastasis (38). Invadopodia are dynamic actin-rich protrusions with proteolytic
activities that degrade the ECM. These structures are composed by a complex
network of integrins, signaling proteins, and a local deposition of membrane-bound
or secreted MMPs (47, 48).
The fourth stage of the migration cycle is the cell contraction of actin
filament provided by myosin II, which is the main motor protein in eukaryotic cells
(Figure 2.4). Myosin II controls stress fibers assemble and contraction, and this
process is regulated by the GTPase protein Rho and its downstream effector Rho-
associated serine/threonine kinase (ROCK) (49). On the other side, myosin light-
chain kinase (MLKC) phosphorylates myosin light chain (MLC) and activates myosin
II regulating cortical actin network (50).These two signaling allows cells to control
separately, the contraction in cortical actin dynamic and inner regions.
In the last step, by several mechanisms which are not fully understood, focal
adhesions are disassembly preferentially in the trailing edge of the cells, whereas
the leading edge remains attached allowing to move forward (Figure 2.5). The major
mechanisms that regulate focal contact disassembly at the trailing edge are the actin
filament turnover, the cleavage of focal contact components by the protease calpain,
and focal contact disassembly by FAK (51-53).

18
Figure 2. The cellular processes and molecular actors involved in cell migration/invasion.
During cell migration, cells start the cycle with polarization at the leading edge through the reorganization of the actin cytoskeleton (1) and the generation if new contacts with the extracellular matrix (ECM), known as focal contacts (2). The ECM surrounding the leading edge is degraded by metalloproteinases (MMPs), a process that allows cell movement (3). Finally, cell contractions (4), synchronized with cell-matrix detachments (5), lead the cell body's movement. The molecular partners involved in the different cancer cell migration steps are presented in the associated boxes. (Modified from: Limia, CM et al., 2019).
19
Endoplasmic Reticulum Stress in Cancer.
The cellular factors that drive malignant cell transformation are highly complex
and depend on a combination of oncogenes overexpression, mutations and micro-
environmental factors (54). Among them, alteration in protein homeostasis (also
known as proteostasis) is an emerging feature of cancer cells that drive the
adaptation to adverse and stressful conditions that challenge cancer cell survival
(55).
The generation of a highly efficient secretory pathway, comprising by the
endoplasmic reticulum (ER) and the Golgi apparatus, is one of the essential
adaptive mechanism in tumor cells (55). The ER is the main intracellular
compartment that mediates the synthesis and folding of proteins that traffic through
the secretory pathway. Despite this elaborated system, under intrinsic and extrinsic
perturbations, protein synthesis and folding demand can exceed the ER folding
capacity and unfolded proteins accumulate in the ER lumen, generating a condition
named as ER stress (Figure 3). This condition engages an adaptive response
termed as the unfolded protein response (UPR), an integrated signal
transduction pathway that transmits information about protein folding status
at the ER lumen to the cytoplasm and nucleus. These signaling pathways
regulate transcriptional programs of genes coding for proteins associated with ER
protein folding capacity, quality control, and the ER-associated degradation system
(ERAD) (56, 57). If ER homeostasis cannot be restored, the UPR switches its
signaling toward a pro-apoptotic mode to eliminate irreversibly damaged cells (58).
Tumor cells are exposed to several perturbations such as nutrient deprivation,
hypoxia, low pH, oncogenic addiction and an exacerbated secretory demand,

20
inducing alterations in protein homeostasis in the ER and favoring cell
transformation (Figure 3) (12, 59). During the last decade, this adaptive response
has been described as a pro-oncogenic mechanism, not only because it is an
adaptive pathway that supports tumor progression but has been directly related to
the acquisition of almost all hallmarks of cancer (Figure 4) (60, 61). Interestingly,
fingerprints of UPR activation have been found in several types of primary and
metastatic tumors, including brain, breast, colon, liver, lung, hepatocellular
carcinoma, and skin cancer (reviewed in (62)).
Figure 3. Secretory protein demand and disruption of endoplasmic reticulum homeostasis in cancer cells.
Tumor cells present a great variety of adaptive mechanisms and, among them, the generation of a highly efficient secretory pathway. The amount of secreted proteins is dependent on the demand and the availability of materials. In tumor cells, various intrinsic factors increase protein demand, and proteotoxic extrinsic factors that challenge the homeostasis in the ER by the accumulation of unfolded proteins in the ER lumen, generating a cellular condition known as ER stress. Tumor cells need to adapt to this condition to grow, and for that is activated an adaptive signaling named as Unfolded Protein Response. Abbreviations: N, nucleus; ER, endoplasmic reticulum. (Figure from: Dejeans, N. et al., 2014).

21
Figure 4. Unfolded protein response and the hallmarks of cancer.
The Unfolded Protein Response (UPR) activation has been described in different tumors and multiple cellular and animal models of cancer. In the last years, it has been proposed that UPR signaling can act as a pro-tumoral mechanism, favoring adaptation to stress factors and directly promoting the development of several Hallmark of Cancer. Abbreviations: IRE1⍺, inositol-requiring enzyme 1⍺; PERK, PKR-like ER kinase; ATF6, activating transcription factor 6; ER, endoplasmic reticulum. (Figure from: Urra, H. et al., 2016).
Unfolded Protein Response.
The UPR is composed by three ER-resident transmembrane proteins including
PKR-like ER kinase (PERK); Activating transcription factor 6α (ATF6α) and Inositol-
requiring protein 1α (IRE1α, referred to as IRE1 hereafter), that altogether aim to
restore protein homeostasis (Figure 5) (55, 59, 63-65).
PERK and ATF6 signaling.
Upon ER stress, PERK auto-transphosphorylation leads to its activation and
phosphorylation of the eukaryotic translation initiation factor 2 alpha (eIF2α).
Phosphorylation of eIF2α leads to an inhibition of global protein translation, resulting
in a reduction of ER load (66). Phosphorylated eIF2α, also initiates the selective
UNFOLDEDPROTEINRESPONSE
S ainingP olife a i e ignal
E ading g o hpp e ion
A oiding imm nede c ion
Enabling eplica i eimmo ali
T mo p omo inginflamma ion
Ac i a ing in a ion& me a a i
Ind cingangiogene i
Genome in abili& m a ion
Re i ingcell dea h
De eg la ingcell la ene ge ic
IRE1
ATF6
PERK
UNFOLDEDPROTEINRESPONSE

22
translation of a group of mRNAs that harbors upstream reading frames (67, 68).
One of these selective mRNAs encodes the activating transcription factor 4 (ATF4),
which regulates genes involved in protein folding, antioxidant responses,
autophagy, amino acid metabolism, and apoptosis (55, 59, 69, 70). ATF4 also
regulate cell death through the induction of the C/EBP homologous protein (CHOP),
a transcription factor that upregulates pro-apoptotic members of the Bcl-2 protein
family (71). Growth Arrest and DNA Damage-Inducible Protein (GADD34), a protein
activated downstream CHOP, forms a complex with the protein phosphatase-1
(PP1) to dephosphorylate eIF2α and restore protein translation, resulting in a
negative feedback loop for the PERK signaling pathway (72) (Figure 5).
On the other hand, ATF6 is a type II ER-resident transmembrane protein and
can be found in two isoforms, α and ß, forming homo and heterodimers (73, 74).
Under ER stress conditions, ATF6 is translocated through COPII vesicles to the
Golgi compartment, where is cleaved by S1P and S2P proteases (75, 76). This
proteolysis releases a cytosolic fragment of ATF6 (ATF6f), a potent transcription
factor that regulates genes involved in the ERAD response and ER homeostasis
maintenance (77, 78) (Figure 5).
IRE1 signaling, stress sensing and activation mechanism.
IRE1 is a type I ER-resident transmembrane protein and represents the most
conserved branch of the UPR (66, 79, 80). The cytoplasmic region of IRE1 is
composed of two domains with distinct enzymatic functions, including a
serine/threonine kinase and an endoribonuclease (RNase) activity (Figure 5). Under
ER stress, IRE1 dimerization and/or oligomerization leads to its auto-
transphosphorylation that triggers a conformational change, resulting in the

23
activation of its RNase activity (59, 81). Together with the tRNA ligase RTCB, IRE1
catalyzes the unconventional splicing of X-box binding protein-1 (XBP1) mRNA,
removing a 26-nucleotide intron, shifting its open reading frame and leading to the
translation of a new protein and potent transcription factor termed XBP1s (spliced
form) (82). XBP1s acts as a potent transcription factor and modulates the
expression of several UPR target genes involved in protein folding, glycosylation,
and ERAD (66). In addition, IRE1 RNase activity catalyzes the degradation of
multiple ER-localized mRNAs and microRNAs through a process known as
regulated IRE1-dependent decay (RIDD) that also attenuates the global mRNA
translation (83, 84) (Figure 5). Of note, the molecular mechanism underlying the
regulation of both RNase activities is still controversial and under debate. On the
other hand, the IRE1 kinase domain interacts with the adaptor protein TNFR-
associated factor 2 (TRAF2) and triggers a phosphorylation cascade that leads to
c-Jun N-terminal protein kinase (JNK) and nuclear factor kappa-light-chain-
enhancer of activated B cells (NFkB) pathways activation (85, 86).
The first model that explained IRE1 activation mechanism and ER stress
sensing mechanism proposed that IRE1 is maintained in an inactive form in basal
conditions due to its interaction with the chaperone BiP (Immunoglobulin binding
protein, also known as GRP78) (92). Once unfolded proteins accumulate in the ER,
BiP chaperone dissociates from IRE1 and allow its homodimerization, leading to the
activation of the UPR branches (64, 93). However, this mechanism is still under
debate, and new models to explain the fine-tuning of the ER stress sensors have
been proposed more precisely in the last years. Some studies have strengthened
the role of BiP in ER stress sensing, and the involvement of other molecular partners
have been described. For instance, ERdj4 (also known as DNAJB9) was shown to
24
be necessary for BiP/IRE1 interaction. In this model, ERdj4 binds to IRE1 and
facilitates BiP recruitment to the complex (94). Furthermore, based on an
interactome screening and a functional validation, our lab recently identified the
collagen chaperone HSP47 as a binding partner of IRE1 that promotes the
dissociation of BiP and the subsequent activation of IRE1 signaling (95).
Alternatively, the other two models describing the sensing mechanism of unfolded
proteins in the ER lumen have been described. One suggests that BiP can act as a
UPR sensor, binding to misfolded proteins through its substrate-binding domain and
transduce the information to IRE1 by its ATPase domain, triggering a conformational
change and UPR activation (96). Finally, the direct interaction of the IRE1-luminal
domain with unfolded proteins has been proposed. The structure of the IRE1-
luminal domain showed that yeast IRE1p present an MHC-like groove, and in vitro
studies demonstrated that unfolded proteins can directly bind to IRE1 and induce its
activation (96, 97). This observation leads to the possibility that the UPR
components can act as direct sensors of ER stress. Altogether, this evidence
indicates that the ER stress sensing mechanism is a complex network that
comprises not just the UPR machinery, but also the protein folding system.

25
Figure 5. Unfolded protein response.
The UPR is mediated by three stress sensors localized at the endoplasmic reticulum (ER) membrane: activating transcription factor 6 (ATF6), the PKR-like ER kinase (PERK), and the inositol-requiring enzyme 1⍺ (IRE1). Under basal conditions, the luminal domains of these three sensors are constitutively bound to BiP (also known as GRP78), an essential ER chaperone. When unfolded or misfolded proteins accumulate in the ER, BiP dissociates from the UPR sensors leading to the activation of the UPR branches. PERK activation leads to inhibition of the global protein translation through the phosphorylation of the eukaryotic translation initiation factor (eIF2α), resulting in reduced ER load. Upon ER stress ATF6 is transported to the Golgi apparatus where is processed by S1P and S2P proteases releasing the cytosolic fragment (ATF6f). ATF6f is a potent transcription factor regulating the expression of genes related to ER-associated degradation (ERAD) response and other genes involved in reestablishing ER homeostasis. IRE1 is a kinase and endoribonuclease that catalyzes the unconventional splicing of X-box binding protein-1 (XBP1) mRNA removing a 26-nucleotide intron. This processing event changes the open reading frame of XBP1, leading to the translation of a new protein termed XBP1s (spliced form). XBP1s acts as a potent transcription factor and modulates the expression of several UPR target genes involved in ER folding, glycosylation, and ERAD. Besides, the IRE1α endoribonuclease activity can target other mRNAs and microRNAs through a process termed regulated IRE1-dependent decay (RIDD). (Figure from: Hetz, C. and Papa, FR, 2017).

26
Remarkably, the IRE1 function is also regulated by a complex and dynamic
signaling platform at the ER, termed as the UPRosome. The UPRosome involves
many proteins that interacts with IRE1 and assemble a signaling platform at the ER
membrane that regulate IRE1 activity (reviewed in (87)). During the last years, novel
UPRosome-related physiological functions of IRE1 have been described, such as
regulation of apoptosis, autophagy, protein degradation pathway, and calcium
homeostasis (88-92). Remarkably, we recently discovered a fundamental and new
function of IRE1 in cell migration. Our lab described that IRE1 can enhance cell
migration and regulate actin cytoskeleton remodeling in non-tumor cells
through its interaction with FLNA, an essential protein involved in actin filament
crosslinking (93). Nevertheless, the impact of this novel function of IRE1 in cell
migration has not been tested in tumor cells yet.
Connections between IRE1 signaling and cancer progression.
The three pathways of the UPR have been related to cancer progression; in
fact, fingerprints of UPR activation have been found in different types of primary
tumors (reviewed in (61)). The signaling pathway of IRE1 is the most studied branch
of the UPR in this context, and its association with cancer progression has increased
in the last years (reviewed in (60)). Remarkably, IRE1 has been described as the
fifth human kinase more likely to carry at least one tumor driver mutation,
highlighting the importance of this ER stress sensor in cancer progression (94).
As mentioned, IRE1 has an endoribonuclease activity that leads to XBP1
splicing and RIDD, and both outputs have been associated with oncogenic
processes (59, 62, 95). Several studies have linked IRE1/XBP1s signaling to cancer
progression, enhancing tumor growth and cell survival (96, 97). Importantly,

27
clinical studies in patients with glioblastoma multiforme (GBM) (98), triple-
negative breast cancer (TNBC) (99), multiple myeloma (100), and pre-B acute
lymphoblastic leukemia (101), have demonstrated an indirect association
between XBP1s expression and patient prognosis. Additionally, research in
different tumor cell lines has connected XBP1s expression levels to chemotherapy
resistance, angiogenesis, immune response modulation, invasion, and tumor
survival (99, 102-105). Small molecules that inhibit IRE1 RNase activity have been
evaluated in vivo multiple myeloma, TNBC and GBM showing beneficial effects
(106-109). Some reports also associate the UPR signaling with early stages of
melanoma carcinogenesis and progression, particularly with tumor growth,
resistance to apoptosis and chemoresistance (reviewed in (110)). In addition,
melanoma cells have a constitutive activation of the IRE1 branch, being largely
associated to resistance to ER-stress-induced apoptosis (111-113). However, the
direct impact of IRE1 during melanoma progression has not been fully investigated.
Despite the growing evidence suggesting that IRE1 is an important
regulator of tumor progression and others hallmarks of cancer, its implication
in metastasis is still ambiguous. An exacerbated cell migration capacity and
invasion of surrounding tissues are essential features of cancer progression leading
to tumor expansion and dissemination. As we mentioned before, growing evidence
point UPR pathways as regulators of different hallmarks of cancer, including cell
migration, invasion, and metastasis of tumor cells. Although the three ER stress
sensors have been linked to cell mobility and EMT, the signaling associated to
PERK activation has been recognized to play a critical role in tumor invasion and
metastasis (60, 62, 114-116). On the other hand, the IRE1 axis has been the most
extensively correlated with cancer progression due to the ability to regulate many

28
cancer cells functions, but its ability to regulate metastasis has not been addressed
in depth. However, some studies suggest that IRE1 can regulate the ability of cancer
cells to migrate and invade surrounding tissues (117). We will summarize the main
discoveries about this association in the next section.
IRE1 in cell migration and metastasis.
As previously mentioned, some reports correlate IRE1 activity with actin
cytoskeleton dynamics, cell migration, invasion and metastasis. Currently, it is
known that IRE1 has two major mechanisms to control migration/invasion: the
control of gene expression through its RNase activity (XBP1s and RIDD), and
the modulation of signaling pathways through direct binding with proteins,
such as FLNA.
IRE1/XBP1s axis has been the most extensively correlated with cancer
progression and metastasis. For instance, studies with tumor samples from
patients with colorectal carcinoma, breast cancer, and oral squamous cell
carcinoma, described the overexpression of IRE1 or XBP1 in metastatic samples
compared to the primary tumors (118-121). Also, elevated levels of XBP1s at
primary tumors are associated with the presence of distant metastasis in patients
with esophageal carcinoma, hepatocellular carcinoma, and oral squamous cell
carcinoma (122-124). A role for the IRE1/XBP1s axis in invasion and metastasis
has been proposed (118, 121, 124). Indeed, some studies indicate that XBP1s
increase the metastatic potential of tumor cells by the induction of the expression of
several EMT transcription factors, including Snail family transcriptional repressor 1
(Snail1), Snail family transcriptional repressor 2 (SNAIL2), zinc finger E-box binding
homeobox 2 (ZEB2) and transcription factor 3 (TCF3) (119, 123, 125, 126). Another

29
important process in metastasis is the invasion and degradation of the ECM through
the expression of MMPs (127). In a model of esophageal squamous cell carcinoma,
XBP1s overexpression promoted cell invasion through the upregulation of MMP-9,
one of the MMP most widely associated with cancer progression, and correlated
with increased lymph nodes metastasis (122). Similarly, XBP1 deficiency in oral
squamous cell carcinoma cells impairs cell invasion and leads to a decrease in the
expression of invasion-associated genes: MMP1, MMP3 and urokinase-type
plasminogen activator (uPA) (120). Interestingly, high levels of XBP1s have been
linked to TNBC tumorigenesis, were XBP1s interact with Hypoxia-inducible factor
1-alpha (HIF1α) and enhance the expression of HIF1α-regulated genes. Of note,
this study showed that the silencing of XBP1 decreased the formation of lung
metastases (99).
Interestingly, another study showed that single disseminated cancer cells
(DCC) that develop latent liver metastasis in pancreatic cancer, presented a
decreased IRE1 activity leading to the escape from the immune system response
by inhibiting MHC class I molecules expression. However, restoration of the IRE1
signaling branch or overexpression of XBP1s in DCC, leads to the outgrowth of liver
macro-metastatic lesions (128). These findings suggest that IRE1 activation might
be important for the initial and final steps in metastasis, like tumor cell dissemination
and the formation of macro-metastasis, with a temporary downregulation of IRE1
activity to avoid anti-tumor immune response. Together, these studies suggest that
IRE1/XBP1s signaling contributes to cancer metastasis.
Intriguingly, the IRE1/RIDD axis has been shown to negatively modulate
cell migration and invasion (98, 102, 129-132). In GBM cells, a gene expression
profiling revealed that loss of the enzymatic activity of IRE1 resulted in an

30
upregulation of ECM proteins. In this study, IRE1 signaling was found to
negatively regulate cell migration and invasion of GBM cells through RIDD-
mediated degradation of secreted protein acidic and cysteine rich (SPARC)
mRNA (130). SPARC is a glycoprotein present in the extracellular matrix and its
function is correlated with changes in cell shape and synthesis of ECM promoting
cell migration, invasion and metastasis in a several types of tumors, including
melanoma (133-138). Dejeans et al., found that impairment of IRE1 signaling with
the subsequent increase in SPARC transcriptional expression, enhanced cell
migration, stress fiber formation and focal adhesion number in GBM cells (130).
Also, selective impairment of IRE1 RNase activity increases invasion, vessel co-
option capacity, and mesenchymal features in U87 cells (131). Finally, a recent
study demonstrated antagonistic roles of XBP1 mRNA splicing and RIDD regarding
GBM outcomes. In this study, GBM patients were stratified into four mixed groups
with high or low XBP1s and RIDD activity. XBP1s high/RIDD low tumors were
associated with a more mesenchymal phenotype and invasive properties (139).
On the other hand, a study from our laboratory uncovered a novel mechanism
of cell movement regulation underlying IRE1 function. Using an interactome
screening, FLNA was identified as a major IRE1-binding partner. We found that
IRE1 acts as a scaffold to recruit FLNA and increases its phosphorylation at
serine 2152, enhancing cell migration. Deletion of IRE1 impaired actin
cytoskeleton dynamics at the protruding and retracting areas. The function of FLNA
in cytoskeleton dynamics depends on its phosphorylation at serine 2152 (140). Our
results indicate that IRE1 facilitate FLNA phosphorylation to control actin
cytoskeleton and cell migration. Importantly, the regulation of cytoskeleton
dynamics by IRE1 is independent of its canonical RNase activity (XBP1 and RIDD).

31
Besides fibroblasts, these results were also observed in a panel of tumor cell lines
and in various in vivo models such as zebra fish, drosophila and mouse models,
suggesting a conserved mechanism in evolution (141). Considering this new
function of IRE1 in cell migration of normal cells and that FLNA has been associated
with cancer; we consider that the IRE1/FLNA axis could have an impact in cell
migration and invasion of tumor cells, increasing metastasis.
These observations highlight the complexity of IRE1 signaling and the different
pathways that can exert a regulation on tumor cell migration, invasion and
metastasis. It is essential to understand the role of IRE1 activities in metastasis and
how its arms (XBP1s, RIDD, and FLNA) can favor different outcomes depending on
the type of tumor.
FLNA function in cell migration and metastasis.
FLNA is an actin cross-linking protein that also acts as scaffold for over 90
protein partners including ion channels, signaling proteins, receptors and
transcription factors (142). FLNA (280 kDa) dimerize generating V shape structures
that crosslink actin filaments. This protein has an N-terminal actin-binding domain
(ABD) followed by two Rod domains composed of 24 immunoglobulin-like tandem
repeats and by two hinge structures (Figure 6) (143). FLNA function is regulated
mostly by phosphorylation at different residues mediated by different protein kinases
(144-146). Particularly, serine 2152 phosphorylation is an important event in actin
filaments (F-actin) crosslinking, impacting in various biological processes such as
cell migration (140). FNLA is also regulated through the cleavage by calpains in the
two hinge domains of the C-terminal region, generating a 200 kDa N-terminal and a
90 kDa C-terminal fragments (Figure 6) (147). This cleavage is inhibited by the

32
S2152 phosphorylation (148). It has been described that the 90kDa fragment
translocate to the nucleus and interacts with transcription factors, such as the
androgen receptor, and has been recently associated with novel functions like the
regulation of gene expression (148).
FLNA has been widely related to cancer progression, particularly to cell
invasion and metastasis (reviewed in (149)). Of note, this protein can act either as
a tumor suppressor or an oncogene, depending on its subcellular localization and
its binding partners (reviewed in (150)). In clinical samples of hepatocellular
carcinoma, breast cancer and pancreas adenocarcinoma, high levels of FLNA
have been correlated with increased metastatic potential (151-155).
Furthermore, gain and loss of function approaches in tumor cell lines demonstrated
the implication of FLNA in cancer cell spreading, migration and metastasis (152,
156, 157). For instance, knockdown of FLNA reduces metastasis of melanoma cells
in a xenograft mouse models (152). These findings support the model that FLNA
acts as an oncogene that promotes cancer cells invasion. However, controversial
results suggest that the 90 kDa FLNA might also suppress metastasis (reviewed in
(150)). Recent findings indicate that FLNA negatively regulates cancer cell invasion
promoting MMP9 degradation (158, 159). On the other hand, was also found that
overexpression of FLNA decrease cell invasion and migration through the regulation
of focal adhesions via calpain-dependent mechanism in breast cancer models
(160). Based on this evidence, some authors hypothesize that nuclear fragments of
FLNA suppress cell migration, while cytoplasmic localization of full length FLNA
promotes cancer metastasis. One might speculate that proteins that potentiate
FLNA phosphorylation might also inhibit FLNA proteolysis and thus promote
metastasis.

33
Figure 6. Filamin A structure and regulation.
FLNA is an actin crosslinking protein that can also act as a scaffold for over 90 proteins. FLNA is a 280 kDa protein that dimerizes generating V shape structures that crosslink actin filaments in the N-terminal domain denominated as an actin-binding domain (ABD). This ABD is followed by two Rod domains composed of 24 immunoglobulin-like tandem repeats of ~96 amino acids each and by two hinge structures. The two hinge domains allow a flexible form of FLNA and are susceptible to proteolysis by calpain. FLNA function is mostly regulated by phosphorylation, particularly at serine 2152. However, FNLA is also regulated through the cleavage by calpains in the two hinge domains. This process generates a 90 kDa C-terminal fragment that has been shown to translocate to the nucleus and regulate gene expression. (Figure from: Hartwig, Z. et al., 2010).
Melanoma signaling and the UPR.
As we mentioned before, skin cutaneous melanoma is one of the deadliest
metastatic tumors. At the molecular level, melanoma progression is regulated
mainly by the activation of some signaling pathways, including mitogen-activated
protein kinase (MAPK), PI3K, and Wnt/ β-catenin (27, 161). Mutations in B-Raf
Proto-Oncogene (BRAF) and NRAS genes have been found in the majority of
melanoma tumors, leading to the activation of the MAPK pathway and increasing
proliferation, survival and migration. Interestingly, a link between oncogenic
N N
β-sheet repeat 1Actin-binding
domain
(⍺-actinin domain)
Rod domain 1
Hinge 1
Rod domain 2
Hinge 2
Dimerization domain
Calpain
cleavage sites
C C

34
BRAF activity and a basal UPR induction, mainly ATF6 and IRE1 branch, have
been described in melanoma cells (113, 162). This UPR activation enhances
tumor growth and inhibits cell death induction, promoting tumor progression and
chemoresistance. ATF6 and IRE1 activation in melanoma cells have been
associated with an increase of autophagy contributing to the desensitization
of cells to apoptosis induction (111, 113, 162). Also, inhibition of BRAF or MEK
prevents IRE1 and ATF6 activation, which subsequently increases UPR-induced
apoptosis (162).
Besides, increased levels of BiP have been positively correlated with
progression and poor survival outcome in patients with melanoma (163). On one
hand, high expression levels of BiP have been described as a potential biomarker
for early diagnosis of melanoma (164). On the other hand, a study with different
human melanoma cell lines concluded that chronic UPR activation promotes
melanoma progression by the activation of the fibroblast growth factor (FGF) and
fibroblast growth factor receptor (FGFR) pathways (165). Of note, in this study was
found that activation of PERK and ATF6 pathways, but not IRE1, correlated with
poor overall survival of melanoma patients. On the contrary, high expression of
homocysteine-responsive endoplasmic reticulum-resident ubiquitin-like domain
member 1 (HERPUD1), a downstream target of the IRE1 branch, was associated
with a better prognosis, suggesting that the IRE1 pathway may be a tumor
suppressor in this type of cancer (165).
All this evidence shows a correlation between UPR activation, including IRE1,
and melanoma progression and chemotherapy resistance; however, no evidence
regarding the role of IRE1 in cell migration and invasion in melanoma has
been published. Taking in consideration the highly metastatic potential of

35
melanoma cells, the knowledge of the more relevant molecular pathways that
regulate the transition from the primary tumor to disseminated disease, and the
evidence that links the more common genetics alteration in this cancer to UPR
activation, we decided to test in this tumor the possible role of IRE1 as a regulator
of cell migration, invasion and metastasis and its relationship with FLNA signaling.

36
5. HYPOTHESIS.
IRE1 regulates migration and invasion of melanoma cells by promoting FLNA
phosphorylation and actin cytoskeleton remodeling.
6. GENERAL AIM.
To determine the involvement of IRE1/Filamin A signaling in the migration and
invasion capacity of melanoma cells.
7. SPECIFIC AIMS.
Specific aim 1. To evaluate the activation status of IRE1 during metastasis in
melanoma.
Specific aim 2. To study the contribution of IRE1 in migration and invasion in
melanoma cells.
Specific aim 3. To investigate the possible participation of the IRE1/FLNA pathway
in the regulation of cell migration and invasion in melanoma.
Specific aim 4. To correlate IRE1 function with metastasis in melanoma in vivo.

37
8. MATERIALS AND METHODS.
Reagents.
Tunicamycin (TM) was purchased from Sigma®. Cell culture media, fetal
bovine serum (FBS), and antibiotics were obtained from GibcoTM and ATCC.
Phalloidin, Fluorescein Isothiocyanate Labeled peptide from Amanita phalloides
P5282 was purchased from Sigma®. Corning Matrigel Basement Membrane Matrix
Growth Factor Reduced LDEV-Free was obtained from Corning (cat n. 356230).
The IRE1 RNase activity inhibitor MKC-8866, purity 98.13%, was order in
Selleckchem®. Other reagents used here were Sigma or the highest grade
available.
Cell culture and generation of the IRE1 Knockout cell lines.
The A375, A375-MA2 and A2058 human melanoma cell lines and the B16F10
mouse melanoma cell line, were maintained in Dulbecco’s modified Eagle’s Medium
(DMEM), high glucose (GibcoTM). The SK-MEL5 melanoma human cell line was
maintained in ATCC-formulated Eagle's Minimum Essential Medium (EMEM). All
the mediums were supplemented with 10% FBS, non-essential amino acids and
grown at 37°C and 5% CO2.
Additionally, we generated A375-MA2 and B16F10 IRE1 Knockout (KO) cells
using the double nickase method of CRISPR/CAS9 technology (Figure 7). For this
purpose, we used a double nickase that was targeted to IRE1 or scrambled as a
control (sc-400576-NIC and sc-437281); Santa Cruz). Melanoma cells were
transfected, using Effectene protocol (Cat No./ID: 301425, Qiagen), with 1ug of
plasmids DNA per well in a 6-well plate. After 48 hours of incubation, transfected

38
cells were selected with 2 ug/ml of puromycin for 72 hours and a pool of cells
transfected with the IRE1KO plasmid or Control were obtained. We then proceeded
to isolate individual clones from a pooled population of IRE1KO or Control cells by
limiting dilutions, a protocol that requires a highly diluted cell suspension from which
single cell-derived clones are isolated and further expanded. The pool of cells was
diluted in density of 0.3, 3 or 30 cells per 100 µL aliquots. This requires transferring
100uL aliquots into each well of 96 well plate. The wells with individual clones were
identified and that clones were expanded and checked for IRE1 expression and
activity.
Figure 7. Workflow of the generation of IRE1 knockout (KO) human melanoma cells.
For the generation of A375-MA2 IRE1KO cells, we used the double nickase method of CRISPR/CAS9 technology with commercial plasmids (Santa Cruz Biotechnology). Plasmids containing sgRNAs Control or sgRNAs for IRE1 were transfected in A375-MA2 parental cells. After 48 h, cells transfected were selected with puromycin for 72h, and a pool of cells containing the plasmids was obtained. We then proceeded to isolated individual clonal IRE1KO and Control cells by limiting dilutions. The efficiency of the genetic approach and the identification of IRE1KO clones were evaluated by measuring the level expression of IRE1 protein by western blot and the IRE1 activity using XBP1 mRNA splicing under treatment with tunicamycin.
NIH-conditioned medium.
For the generation of the NIH 3T3- conditioned medium (NIH-CM) 20*106 NIH-
3T3 cells were seeded in a 100 cm2 plate in 30 ml of complete growth medium.
Conditioned medium was gently aspirated after 24 hours in culture. To remove any
Plasmids order
(Double nickase)
Plasmids Transfection
Antibiotic selection
Single cell clones generation
IRE1 Knockout validation
Puromycin Limiting dilutions
xbp1s
xbp1u
IRE1
IRE1 WB and XBP1 mRNA
splicing

39
remaining cells, the medium was centrifugated at 3000 rpm and the cell pellet, if
any, discarded and the medium was then pass through a syringe filter of 0.45 µm.
The media was used immediately or distributed in un 1 ml aliquots and frozen at -
20oC.
RNA isolation and RT-PCR.
RNA isolation was performed using TRIzol™, a ready-to-use reagent,
designed to isolate high-quality total RNA (as well as DNA and proteins) from cell
and tissue samples. The isolation was used based in the protocol
described according to the manufacturer’s instructions (Invitrogene, Catalog
Number 15596026). The cDNA was synthesized with SuperScript III reverse
transcriptase (Life Technologies) using random primers p(dN)6 (Roche). PCR
primers and methods for the XBP-1 mRNA splicing assay were previously described
(166). XBP-1s mRNA was monitored by semi-quantitative time PCR using the
following primers: 5'-AAGAAC ACGCTTGGGAATGG-3' and 5'-
CTGCACCTGCTGCGGAC-3'.
Immunoprecipitations.
Endogenous immunoprecipitations (IP) were performed in SK-MEL5 and
B16F10 cells using a protocol previously described (166). In brief, to
immunoprecipitate IRE1, cells were plated in 10 cm dishes and protein extracts were
lysed by using a lysis buffer (0.5% NP-40, 150–350mM NaCL, 150mM KCl, 50mM
Tris pH7.6, 5% glycerol, 50mM NaF, 1mM Na3VO4, 250mM PMSF, and protease
inhibitors) for 20 minutes at 4°C. Lysates were clarified by centrifugation at 13.200
rpm for 15 min. Protein extracts were incubated overnight at 4°C with 1μg of a high-
affinity anti-IRE1 antibody (Cell signaling, 14C10) per 1mg of protein lysate. Next

40
day protein complexes were incubated for 1 hour at 4°C with 30uL of Protein A
magnetic bead (10002D, Invitrogene), then washed 3 times with 1 ml of Lysis buffer
and then one time in Lysis buffer with 500 mM NaCl. Beads were dried and
resuspended in Sample Buffer 2x. Samples were heated for 5 min at 95°C and
resolved by SDS-PAGE 8% followed by western blot analysis.
Western blot analysis.
Cells were collected and homogenized in RIPA buffer (20 mM Tris pH 8.0, 150
mM NaCl, 0.1% SDS, 0.5% Triton X-100) containing a protease inhibitor cocktail
(Roche, Basel, Switzerland) in presence of 50 mM NaF and 1 mM Na3VO4. After
sonication, protein concentration was determined in all experiments by micro-BCA
assay (Pierce, Rockford, IL), and 25-40 µg of total protein was loaded onto 8-12 %
SDS-PAGE minigels (Bio-Rad Laboratories, Hercules, CA) prior transfer onto
Amersham™ Protran® Premium Western blotting membranes, nitrocellulose pore
size 0.2 μm. The membranes were blocked using PBS, 0.1% Tween20 (PBST)
containing 5% Bovine Serum Albumin for 60 min at room temperature, then
incubated overnight with primary antibodies. The following antibodies diluted in
blocking solution were used: anti-HSP90 (1:1000, sc-69703 Santa Cruz
Biotechnology), anti-filamin A (1:5000, rabbit mAb ab76289 abcam); anti-phospho
S2152 filamin A (1:1000, rabbit mpAb ab51229 Abcam); anti-IRE1α (1:1000, rabbit
mAb 14C10 Cell Signaling Technology); anti-calnexin (1:1000, Novus Biologicals);
anti-GAPDH (1:1000, Santa Cruz Biotechnology). After the incubation with the
primary antibodies the membranes were washed with PBST. Bound antibodies were
detected with peroxidase-coupled secondary antibodies incubated for 1 h at room
temperature and the ECL-Plus system (Thermofisher).

41
Knockdown of IRE1 and FLNA.
We performed transient knockdown of IRE1 in the four human melanoma cell
lines, using a small-interfering RNA (siRNA) targeting IRE1 or a scrambled siRNA
as a control. siRNAs were obtained from Eurofins MWG Operon. Each siRNA (25
nM) was transfected using Lipofectamine RNAiMAX (Invitrogen). Transient
transfections were performed following manufactured instructions. In brief, 2*105
cells were seeded in 6 well plate. After 24 hours, 10 pmol or 30 pmol of siRNA
targeting IRE1, FLNA or Control was transfected diluted in Opti-MEM medium and
together with RNAiMAX reagent for 48 h.
Cell proliferation assay.
Cell proliferation of A375-MA2 cells was evaluated using the WST-1
proliferation assay (Roche, ref: 1 644 807). The protocol was performed following
manufacturer’s instructions. Briefly, 2000 cells were seeded in triplicate in 96 well
plates (200 µL/well), one plate per day. For the quantification, 20 uL of WST-1 was
added per well and incubated for 4 hours at 37°C. The absorbance was readed
using 450 and 595 wavelengths in a microplate reader (The Infinite® 200 PRO
NanoQuant, Tecan). The number of cells was determined for four consecutive days.
On the other hand, the protocol to determine cell proliferation in B16F10 cells
was based in automatic cell counting. Cells (2000 cells/well) were seeded in 96 well
plates (200 µL/well), one plate per day. For the quantification, cells were stained
with Hoechst dye solution (10 mg/ mL, Invitrogen Hoechst 33342) diluted 1/5000 in
complete medium. Cells were incubated with the staining for 15 minutes and
counted on an ArrayScan XTI Live High Content Platform (Thermo Fisher) for 4
consecutive days.

42
Transwell Migration Assay.
Assays were performed in Boyden Chambers (Millipore®, 12 mm diameter, 8
µm pore size) according to the manufacturer’s instructions. Briefly, for the human
cell lines, 50.000 cells resuspended in serum-free medium were plated onto the top
of each chamber insert and NIH-CM was added to the bottom chamber. After 4
hours, inserts were removed, washed and cells that migrated to the bottom side of
the inserts were stained with 0.1% crystal violet in 2% ethanol and counted in an
inverted microscope using a 20X objective lens.
In addition, B16F10 were seeded onto the top of each chamber insert coated
with 2 µg/ml fibronectin and allowed to migrate for 6 hours. Then, inserts were
removed, washed and stained with 0.1% crystal violet in 2% ethanol and counted in
an inverted microscope using a 20X objective lens.
Adhesion Assay.
Cells (20,000) were suspended in serum-free medium and allowed to attach
to fibronectin coated-24 well plates (2 µg/ml) or Matrigel (500 ng/mL) at different
periods of time. Non-adherent cells were removed by washing gently in serum-free
medium and adherent cells were stained with 0.1% crystal violet in 2% ethanol. Cell-
bound dye was eluted with methanol, and the absorbance was measured at 600 nm
in a microplate reader (Tecan® infinite 200Pro).
Actin cytoskeleton analysis.
Cells (20,000) were seeded on non-coated 12-mm coverslips for 48 hours, fixed
with Paraformaldehyde (PFA) 4% per 15 minutes and stained with phalloidin
coupled to FITC, following manufacturer’s instructions (Sigma). Images were taken
43
using a confocal microscope (Leica SP8) with a 40x/1.2 oil-immersion objective at
room temperature. Fluorescence intensity of FITC was quantified from the border of
the cell to the center using the ImageJ software. Stress fibers number and size were
quantified automatically using the plugin Filament detector of the ImageJ software.
Filopodia formation was determine using the software FiloQuant of the ImageJ
software.
Moreover, B16F10 (100,000) cells were seeded onto fibronectin-coated 25-
mm coverslips, transfected with EGFP-Lifeact using Lipofectamine 2000
Transfection Reagent and imaged in HBSS medium supplemented with HEPES
using a confocal microscope (Zeiss LSM 710) with a ×63/1.4 NA oil-immersion
objective lens at 37 °C. Images were acquired every 5s for 10 min using time-lapse
confocal microscopy. To perform a protrusion and retraction analysis, images were
segmented using maximum threshold. Then, subsequent images were merged
assigning the first image as green and the second image as red. The total area of
green (protrusions) and red (retractions) color of merged images was obtained using
ImageJ software. In addition, cells were fixed and stained with phalloidin coupled to
rhodamine and visualized by confocal microscopy. The number and size of stress
fibers and filopofia per cell was determined using the ImageJ software as described
previously (93).
Cell invasion assay.
Invasion assays were performed in Boyden Chambers (Millipore®, 12 mm
diameter, 8 µm pore size). The inside compartment of the chamber was coated with
200 ng/mL of Matrigel and incubated for 1h at 37°C. Cells (30,000) resuspended in
300 µL serum-free medium were plated onto the top of each chamber and 500 µL

44
of NIH-CM was added to the bottom chamber. After 24 hours, inserts were removed,
washed carefully and cells that migrated to the bottom side of the inserts were
stained with 0.1% crystal violet in 2% ethanol and counted in an inverted microscope
using a 20X objective lens.
Experimental metastasis assay.
We evaluated lung metastasis using an experimental tail vein injection model.
Human melanoma metastatic cells were injected through the tail vein in eight-weeks
old NOD/SCID/IL2rɣnull (NSG) mice (Figure 8). NSG mice carry a severe combined
immune deficiency (SCID) and a null allele of the IL2 receptor common gamma
chain (IL2rɣnull). The severe immunodeficiency allows the mice to be humanized
by engraftment of tumors with human origin (167).
The animals were placed in a beaker; the tail was heated in order to dilate the
veins, and then with a syringe of 1 mL (26G), we performed an injection in one lateral
vein of 25,000 cells in 200 µL of PBS. Mice were clinically monitored for four weeks
and sacrificed 28 days after injection. Next, lungs were collected and fixed with
formaldehyde solution at 4%, paraffin-embedded and stained with Hematoxylin &
Eosin (H&E). The number and the surface area of the metastatic nodules were
determined through serial section of H&E staining of lungs through ImageJ software.
To evaluate metastasis using the mouse melanoma cell line B16F10 a similar
protocol was performed (Figure 9). B16F10 cells (200,000) resuspended in 500 μL
of PBS were injected intravenously in the lateral tail vein of 8-12 weeks old C57BL/6
mice. At day 21 post-injection mice were sacrificed, lungs were collected and rinsed
in PBS to remove excess blood. Next, the lungs were placed in a labeled vial
containing 5 ml Fekete's solution and once the lungs were fixed and bleached to

45
and the B16F10 nodules showed up black, pictures of the lungs were taken, and
dissection of the tumor mass was performed. Subsequently, the weight of the total
mass of the metastatic nodules per lung was determined.
Figure 8. Lung metastasis using an experimental tail vein injection model in immunosuppressed mice.
Metastatic cells (15.000) were injected in the tail vein of eight-week-old male NSG mice. Mice were clinically monitored for four weeks and sacrificed 28 days after injection. Next, the lungs were collected, fixed in formaldehyde solution 4%, and paraffin-embedded for histologic analysis after hematoxylin and eosin (H&E) staining. The number of metastasis nodules and the size of the metastatic foci were determined using the ImageJ software and compared between the different conditions.
Figure 9. Lung metastasis using an experimental tail vein injection model in immunocompetent mice.
Mouse metastatic melanoma cells (200.000) were injected in eight-week-old male C57BL/6 mice. Mice were clinically monitored for three weeks and sacrificed 21 days after injection. Next, the lungs
Culture of human metastatic cell lines Tail Vein injection
Mice sacrifice and lungs resection 4 weeks after
injection
Metastasis detection by Histologic analysis
after H&E staining
Culture of mouse metastatic cell lines Tail Vein injection
Mice sacrifice and lungs
resection 21 days after
injection
Bleaching of the
extracted lungs in
Fekete's solution, taking
pictures and
quantification.
C57BL/6 miceB16F10

46
were collected, fixed, and bleached in Fekete's solution, and pictures were taken to quantify the metastatic nodules.
Bioinformatic analysis.
From the TCGA repository, we selected data from 469 tumors classified as
primary or metastatic skin cutaneous melanoma (SKCM). Using this database, we
first divided the samples into tumors presenting high or low IRE1 activity. To do this,
we used an IRE1-dependent gene expression signature previously described by
Lhomond et al. in 2018 (139). This signature was identified using IRE1 dominant-
negative (DN)-expressing U87 cells, an approach that entirely blocks all RNase
outputs of this ER stress sensor (139). The gene expression signature obtained
using this approach was processed through a Bioinfominer pipeline to increase its
functional relevance. This analysis led to the identification of 38 (19 upregulated and
19 downregulated) IRE1-dependent hub genes (139). We used this 38 gene
signature to be confronted with the transcriptome data from the SKCM-TCGA
database.
To evaluate the presence of two populations displaying either high or low IRE1
activity, gene signature scores were quantified, and a quartile scoring method was
used (139). Each gene of the IRE1 signature was assigned to a quartile-oriented
gene score for each patient, based on its complete expression distribution in the
specific cohort. Each gene of the signature was rated with 1 when the z-score was
< = Q1(the first quartile; the 25th item of ordered data); with 2 when the z-score was
>Q1 AND < = Q2 (median); with 3 when the z- score was >Q2 AND < Q3 (the third
quartile; the 75th item of ordered data) and with 4 when the z-score was > = Q3.
After quartile ranking, each patient was assigned an IRE1 score based on the

47
average of gene scores for all the genes included in the signature. Patients were
ordered based on their signature scores, generated in the R environment (R version
3.4.1 for windows).
The same protocol was applied to classify tumors from the TCGA database
with either high or low RIDD and XBP1s activities. XBP1s-dependent or RIDD-
dependent signatures were described in the same study previously mentioned
(139). To identify the XBP1s-dependent signature, a transcriptome profile of U87
cells overexpressing IRE1 WT, which is known to increase IRE1 activity, and two
mutants (P336L and A414T) that were identified in the same study as variants that
exhibited high IRE1 RNase activity, was performed (139). Based on this analysis,
the authors identified 40 genes upregulated in the WT, P336L, and A414T cells and
correlated this regulation with high XBP1s levels (139). On the other hand, they
determined a potential RIDD signature based on the ability of IRE1 to cleave
mRNAs. First, an in vitro cleavage assay was performed (139). A group of 1141
mRNAs susceptible to be cleaved in vitro by IRE1 was identified from this screening.
These genes were then intersected with the set of genes upregulated in IRE1-DN
U87 cells. We used these signatures to stratify melanoma primary and metastatic
tumors in IRE1, XBP1s, and RIDD high or low activity.
To evaluate the correlation of the expression levels of pro-metastatic genes
with XBP1s and RIDD activity, XBP1s and RIDD signatures scores were overlapped
to generate four cohorts: High_XBP1s_High_RIDD, High_XBP1s_Low_RIDD,
Low_XBP1s_High_RIDD, Low_XBP1s_Low_RIDD. Then, the relative expression of
pro-metastatic genes between the four cohorts was compared, and a heatmap was
generated.

48
Statistical analysis.
Statistical analysis was performed using the GraphPad software. Mann-
Whitney test and Kruskal-Wallis test with Dunn’s multiple comparison tests were
used for non-Gaussian distributed data. Student’s t-test was performed for unpaired
or paired groups. When pertinent, two-way ANOVA with Bonferroni’s multiple
comparison test was executed. A p value of < 0.05 was considered significant. In all
plots p values are show as indicated: * p < 0.05, ** p < 0.01, and *** p < 0.001 and
were considered significant. n.s: non-significant.

49
9. RESULTS.
Activation status of IRE1 during metastasis in melanoma.
In this thesis, we decided to study the involvement of IRE1 signaling in
metastasis and we used metastatic cutaneous melanoma as a model. Melanoma
begins with the transformation of melanocytes, pigment-producing cells. Although
this cancer present a low incidence representing about 1% of all malignant skin
tumors, cutaneous melanoma is the most aggressive and deadliest form of skin
cancer (168). Therefore, the identification of molecular targets that regulate the
metastatic process of melanoma tumors is crucial for the development of future
therapies. As mentioned before, IRE1 has been linked to melanoma progression
(111, 162, 169); however, the link with metastasis has not been described yet.
IRE1 activation and XBP1s expression have been associated with cancer
progression in different cancer models and with several hallmarks of cancer (60).
Also, in a previous work from our laboratory we found that IRE1 dimerization, an
indirect measure of activation, is important for the increase of FLNA phosphorylation
and the increase of cell migration (93). Thus, as part of the aim 1 we decided to
determine if IRE1 activation was observed during the metastatic process. With this
aim, we performed an in vivo assay by injecting the C57BL/6-derived B16F10 cell
line, a highly metastatic and well-established model for the study of melanoma
metastasis in C57BL/6 mice. The cells were injected subcutaneously, to form a
primary tumor (300,000 cells), or intravenously in the tail vein to form metastatic foci
at the lungs (200,000 cells). Next, we compared the expression of XBP1s, as a
measure of IRE1 activity, in primary tumor and metastatic nodules in the lungs. For
comparative purpose, adjacent non-tumoral tissue was also incorporated to the

50
analysis. After 21 days, all tissues were dissected, and total RNA was extracted for
PCR analysis. As shown in Figure 10, quantification of XBP1s relative to total XBP1
showed increased levels of XBP1s in metastatic nodules compared with the normal
tissue, and a slight increase compared with the primary tumor (Figure 10, right
panel). This result support that an increase of IRE1/XBP1s signaling could be
important in the development of metastasis. However, a proper comparison
between the level of IRE1 activation in primary tumors and metastasis was not
possible, since just one primary tumor was obtained. Also, this approach had
several limitations. First, the metastatic tumors were not spontaneously derived from
the primary tumor. In addition, the comparison between a primary tumor and
metastatic lesions with different size indicate that the level of hypoxia in each tumor
could be different, and it is known that hypoxia can induce ER stress and UPR
activation (170). Finally, we dissected a fragment of the tumor tissue that could
contain a mixt of melanoma cells and other types of cells present in the tumoral
microenvironment. Thus, tumor cells from metastatic lesions generated
spontaneously from a primary tumor with a similar size and sorted by a melanoma
marker, could be the best alternative to evaluate activation of IRE1 signaling in
metastatic cells and primary tumors compared to normal tissue.

51
Figure 10. IRE1 activation in mouse melanoma metastasis.
For the formation of the primary tumor, B16F10 cells (3×10⁵) were re-suspended in 100 μL saline solution (0.9% NaCl) and injected subcutaneously into the flanks of C57BL/6 mice (8-12 weeks). The appearance of tumors was monitored by palpitation and tumor volume measurement, and at day 16 post-inoculation, the animals were sacrificed, and the tumor was extracted. For the generation of the metastatic nodules, B16F10 cells (2×10⁵) were re-suspended in 300 μL saline solution (0.9% NaCl) and injected intravenously into the tail vein of 8-12 weeks old C57BL/6 mice. On day 21, post-inoculation, lungs were collected. mRNA was extracted from primary tumor tissue, lung metastasis, and non-tumoral adjacent tissue, and IRE1 signaling was evaluated by measuring XBP1 mRNA splicing by PCR. Data represents 1 experiment and the average and standard error of four samples of metastatic tumors and four adjacent tissue samples. Results were statistically compared using two-tailed t-test. (*: p < 0.05). NT: non treated; Tm: treated with tunicamycin; PT: primary tumor; Met: metastatic tissue; AdjT: Tissue adjacent to the metastatic tumor.
Since metastatic cells located in the lungs presented an increased
IRE1/XBP1s activity, we decided to evaluate the activation of IRE1 signaling in
metastatic melanoma tumor by using transcriptome data from human tissues. A
dataset of 469 tumors classified as primary or metastatic SKCM from the TCGA
database was analyzed. Using this data, we first divided tumor samples into two
groups presenting High or Low IRE1 activity. To do this, we used an IRE1 gene
signature previously identified by Lhomond et al. in 2018 through the analysis of
transcriptome data from U87 cells overexpressing a dominant-negative form of IRE1
(139). This signature is composed of 38 genes, which expression is either positively
or negatively regulated by IRE1 activity. An IRE1 score was assigned for each
patient, and patients were clustered according to IRE1 activity as IRE1_High or
IRE1_Low (Figure 11A). To quantify gene signature scores, a z-scoring method was
NT
Tm
Met 1
Met 2
Met 3
AdjT
1
mXBP1s
Actin
PT
mXBP1u
PT Met AdjT 0.0
0.5
1.0
1.5
XB
P1s/X
BP
1t
(fo
ld c
han
ge)
✱
Met 4
AdjT
2A
djT
3A
djT
4

52
used. Once we classified tumors as IRE1_Low or IRE1_High, we compared IRE1
activity between primary and metastatic tumors (Figure 12A). Interestingly, we
observed a decreased activation of IRE1 signaling in metastatic samples compared
to primary tumors (Figure 12A).
To further dissect the contribution of signals downstream of IRE1, we
performed the same analysis using XBP1s (Figure 11B) and RIDD (Figure 11C)
signatures previously published in 2018 (139). The authors determined a list of 40
genes as the hallmark of XBP1s expression by an approach previously explained in
the material and methods section. On the other hand, in the same study, the RIDD
signature was described by the intersection of the list of RNA cleaved by IRE1 in
vitro and that of mRNA whose expression was upregulated in IRE1-DN cells under
basal conditions (139).
Similar to the result observed with IRE1 activity, RIDD activity was
significantly downregulated in human metastatic tumors compared to primary
tumors (Figure 12B). Interestingly, the opposite result was observed for XBP1s
dependent signature, where a small increase was observed in metastatic tumors
compared to primary tumors (Figure 12C).

53
Figure 11. IRE1 signaling in human melanoma tumors.
Data from 469 melanoma tumors was evaluated in order to determine the IRE1 branch activation status. The clustering of patients using the dataset from the TCGA revealed the existence of two populations displaying either High or Low IRE1, RIDD, or XBP1s activity. IRE1 (A), XBP1s (B), and RIDD (C) activities were defined by a previously identified gene expression signature (139). To quantify gene signature scores in TCGA patient data, a quartile scoring method was used. Patients were ordered based on their signature scores generated in the R environment.
IRE1_level
XBP1s_level
RIDD_level
A
B
C

54
Figure 12. IRE1 activation status in human melanoma metastasis.
Data from 469 human melanoma tumors was evaluated to determine IRE1 branch activation status in metastatic tumors (N= 366) compared with primary tumors (N= 103). IRE1 (A), XBP1s (B), and RIDD (C) activities were defined by a previously identified gene expression signature (139). To quantify gene signature scores in TCGA patient data, a quartile scoring method was used. Each tumor sample was assigned an IRE1, XBP1s, or RIDD score based on the average of gene scores for all the genes included in the signature. Results were statistically compared using two-tailed t-test. (**: p < 0.001, ***: p < 0.001). PT: primary tumor; Met: metastasis.
IRE1 activity, particularly related to RIDD, appears to be decreased in the
metastatic lesions, indicating that maybe the inhibition of this pathway could be a
necessary process for developing melanoma metastasis. Considering that in highly
metastatic cells, metastasis suppressors are usually downregulated in comparison
with primary tumor cells, these results could suggest that IRE1 could be acting in
melanoma as a suppressor of the metastatic process. Of note, this is contrary to
what we initially hypothesized. Thus, a comprehensive analysis of all signaling
outputs of IRE1 is necessary to understand the role of IRE1 signaling in the
metastatic process.
Role of IRE1 in migration and invasion of melanoma cells.
As previously mentioned, IRE1 activity has been linked to cell migration and
invasion of tumor cells; however, no evidence regarding its role in melanoma have
been published. Previous work from our laboratory indicates that IRE1 can enhance
HIGH
LOW
A B C
PT Met
-4
-2
0
2
4
Sco
re
✱✱✱
RIDD_ActivityIRE1_Activity
PT Met
-4
-2
0
2
4
Sco
re
✱✱✱
XBP1s_Activity
PT Met
-4
-2
0
2
4
Sco
re
✱✱

55
the migration of non-tumor cells through the specific regulation of the actin
cytoskeleton remodeling (93). We found that IRE1 can acts as a scaffold promoting
FLNA phosphorylation at serine 2152 and potentiate cell migration, independently
of its RNase activity. On the other hand, it is known that XBP1s can regulate the
expression of genes associated with invasion and EMT and some reports indicate
that RIDD may exhibit the opposite effect in certain tumors (102, 118, 119, 121, 130,
132, 139). Thus, the role of IRE1 activity in migration and invasion in cancer and its
implication in the metastatic process is still controversial and more studies are
needed. Based on our findings in non-tumor cells and the discovery of the
IRE1/FLNA axis, we hypothesize that IRE1 could enhance cell migration of
melanoma cells. Thus, as part of our specific aim 2, we decided to evaluate at
different layers the possible contribution of IRE1 to the migration and invasion
process in melanoma cell lines.
Role of IRE1 in melanoma cell migration.
As part of the specific aim 2, we explored the possible impact of IRE1 in
melanoma cell migration. To address this question, we selected as cellular model
one poorly metastatic and three highly metastatic human melanoma cell lines,
described in Figure 10A. All the human cell lines selected contain the BRAF V600E
mutation that is a common feature for melanoma (171, 172). For some
complementary experiments we used the C57BL/6-derived B16F10 cell line, a
highly metastatic and well-established model for the study of melanoma metastasis.
Of note, this cell line does not contain BRAF mutation (Figure 10A) (173).
As part of the characterization of our cellular model, we determined the protein
levels of IRE1 expression in the four human cell lines. We interestingly found that

56
the three metastatic cell lines A375-MA2, A2058, and SK-MEL5 expressed on
average 3, 5, and 7 times more protein levels of IRE1 compare with the non-
metastatic cell line A375, respectively (Figure 13B and 13C, left panel). Taking in
consideration that one of the recently described IRE1 signaling that is associated to
cell migration is through FLNA, we decided to also evaluate the levels of this protein
in our model. We found that the expression levels of FLNA was increased in 1.7 and
2.6 times in the metastatic cell lines A375-MA2 and A2058, respectively, in
comparison with the non-metastatic cell (A375) (Figure 13B and 13C, right panel).
However, SK-MEL5, one of the metastatic cell lines and the one with the higher
protein levels of IRE1, showed the lower expression of FLNA. These results suggest
that the increase in FLNA expression in A375-MA2 and A2058, might not be related
with the metastatic capacity.
Next, we evaluated IRE1 activity by measuring the percentage of XBP1
mRNA splicing by a PCR based assay under ER stress conditions induced with the
N-Glycosylation inhibitor TM. We did not observe a basal activation of IRE1/XBP1s
pathway in any of the cell lines. After ER stress, similar induction of XBP1 mRNA
splicing was observed between all cell lines, with the exception of the SK-MEL5 that
presented the lower percentage of XBP1 mRNA splicing (Figure 13D). The elevated
levels of IRE1 might suggest that IRE1 signaling is relevant for the metastatic
process; however, we were not able to corroborate differences in IRE1/XBP1s
signaling, and probably a more sensitive method such as Real time-PCR is needed
to detect basal activation of this signaling in adherent cells.

57
Once our model was characterized regarding IRE1 expression levels and
activation status, we evaluated transmigration using Boyden chambers, a classical
experiment to determine migratory cell capacity (174). These assays were
performed in the four human melanoma cell lines previously described, and some
complementary experiments were done with the B16F10 mouse cells.
The first step was to establish the best promigratory stimulus for these
melanoma cell lines in the transmigration assays. We tested DMEM with 10% of
FBS, a widely used stimulus for cell migration, and conditioned media from NIH 3T3
fibroblast cells grown in DMEM medium containing 10% FBS for 24 hours, as
possible chemo-attractors (Figure 13, left panel) (175, 176). The number of cells
seeded and the timing where selected based on previous works with this cell lines
(177). As shown in Figure 14, right panel, there was an increase of 6 (A375-MA2),
3 (A2058), and 7 (SK-MEL5) times in the number of migrating cells towards the NIH-
CM in comparison with the FBS migration stimulus. Remarkably, the non-metastatic
cells (A375) had a similar number of migrating cells with both stimuli presenting a
lower migratory capacity compared to metastatic cell lines. NIH-CM was also the
best chemo-attractant for transmigration assays in the mouse metastatic cell line
B16F10 (Supplementary Figure 1). Based on these results, we decided to use for
furthers experiments the NIH-CM as the chemo-attractant for all the melanoma cell
lines.

58
Figure 13. Characterization of human melanoma cell lines.
(A) Main characteristics of four human melanoma cell lines were described. (B) IRE1 and FLNA of A375, A375-MA2, A2058 and SK-MEL5 levels were evaluated by western blot using specific antibodies. (C) IRE1 (Left panel) and FLNA (Right panel) protein levels were quantified by scanning densitometry and normalized to the levels of the housekeeping gene. Data represent the mean ± s.e.m of 3 independent experiments. Results were statistically compared using a two-tailed t-test. (ns: not statistically significant, *: p < 0.05). (D) Left panel: A375, A375-MA2, A2058, and SK-MEL5 cells were treated with 1 µg/mL of Tm for 6h, and then XBP1 mRNA splicing was evaluated by PCR. PCR fragments corresponding to the XBP1u or XBP1s forms of XBP1 mRNA are indicated. Right panel: the percentage of XBP1 mRNA splicing was calculated after densitometric analysis of the XBP1u and XBP1s-related PCR products to quantify the splicing percentage each time point.
xbp1s
xbp1uTm:
A375
- +
A375-MA2 A2058 SK-MEL5
- + - + - +
A
B
D
-280FLNA
A375-MA2
A375
A2058
SK-MEL5
IRE1 -100
kDa
calnexin - 67
C
A37
5
A37
5-M
A2
A20
58
SK-M
EL5
0.0
0.5
1.0
1.5
2.0
FL
NA
pro
tein
exp
ressio
n (
fold
ch
an
ge)
ns
A37
5
A37
5-M
A2
A20
58
SK-M
EL5
0
2
4
6
IRE
1 p
rote
in e
xp
ressio
n (
fold
ch
an
ge)
✱
A37
5
A37
5-M
A2
A20
58
SK-M
EL5
0
20
40
60
80
100
XB
P1s (
%)
Cell line Origin Localization of the tumor BRAF
mutation status
Metastatic
potential
A375 Human Primary solid tumor. V600E Low
A375-MA2 Human
Metastatic cell line derived using an in vivo selection
process of highly metastatic cells from a population of
poorly metastatic tumor cells, A375.
V600E High
A2058 Human Derived from metastatic site: lymph node. V600E High
SK-MEL5 Human Derived from metastatic site: axillary node. V600E High
B16F10 Mouse
Metastatic cell line derived using an in vivo selection
process of highly metastatic cells from a population of
poorly metastatic tumor cells, B16F0.
__ High

59
Figure 14. Standardization of the transmigration assay.
Left panel: Human melanoma cells (5 x 10⁴) were plated on non-coated transwell plates. Transmigration was assessed in the presence of 10% of fetal bovine serum (FBS), or NIH 3T3 conditioned medium (NIH-CM). After 4h, cells that migrated to the lower side of the Boyden chamber were stained with crystal violet, and images were taken. Right panel: The number of cells that
migrated was counted using the ImageJ software. Data represent 1 experiment.
Once the experimental conditions were established, we decided to use a
siRNA to ablate IRE1 expression and evaluate the impact on cell migration in human
melanoma cells. We validated our experimental approach transfecting siRNAs
targeting IRE1 for 48 h and obtained a significant reduction in the protein levels of
IRE1 in the four cell lines upon siRNA transfection (Figure 15A). We then evaluated
the effect of the deficiency of IRE1 expression in the migratory capacity of the
human melanoma cell lines. Unexpectedly, we observed that IRE1 silencing was
associated with an increase in cell migration capacity compared with cells
transfected with the control siRNA. Of note, this was only observed in the metastatic
melanoma cells, since no changes in the migratory capacity was detected in the
non-metastatic melanoma cell line A375 (Figure 15B). These results suggest that,
IRE1 could be acting as a suppressor of migration in melanoma cells, specifically in
cells with high metastatic capacity.
A375 A375-MA2 A2058 SK-MEL5
FB
S 1
0%
NIH
-CM
A37
5
A37
5-M
A2
A20
58
SK-M
EL5
0
5
10
15
20
Tra
nsm
igra
tio
n (
Fo
ld c
han
ge)
FBS
NIH-CM

60
Figure 15. IRE1 deficiency increases cell migration in human metastatic melanoma cells.
(A) Left panel: Human melanoma cells were transiently transfected with 10 pmol of siRNA Control (siCtrl) or a siRNA against IRE1 (siIRE1). After 48h of the transfection, total protein extracts were analyzed by western blot using specific antibodies. Right panel: IRE1 protein levels were quantified by scanning densitometry and normalized to the levels of the housekeeping gene. Data represent the mean ± s.e.m of 3 independent experiments. Results were statistically compared using a two-tailed t-test. (B) Left panel: After 48h, 5 x 10⁴ cells transfected with siCtrl or siIRE1 were seeded on transwell plates, and transmigration was assessed. Transmigration was performed in the presence of conditioned medium of NIH-3T3. After 4h, cells that migrated to the lower side were stained with crystal violet. Images of the lower side of the transwell were taken. Right panel: The number of cells that migrated was counted using the ImageJ software. Data represent the mean ± s.e.m of at least 4 independent experiments. Results were statistically compared using a two-tailed t-test. (ns: not statistically significant, *: p < 0.05, **: p < 0.01).
We then decided to use a genetic approach to ablate IRE1 gene with the aim
to corroborate the impact of this ER stress sensor in cell migration of melanoma
cells. For this purpose, we selected the human metastatic cell line A375-MA2
because (i) this cell line was obtained through an in vivo selection process from a
A375-MA2A375
siIRE: - + - + - + - +
A2058 SK-MEL5
IRE1
GAPDH
-100
- 44
A
B
A37
5
A37
5-M
A2
A20
58
SK-M
EL5
0.0
0.5
1.0
1.5
IRE
1 p
rote
in e
xp
ressio
n (
fold
ch
an
ge)
siIRE1
siCtrl
✱✱ ✱✱ ✱ ✱✱
A37
5
A37
5-M
A2
A20
58
SK-M
EL5
0.0
0.5
1.0
1.5
2.0
Tra
nsm
igra
tio
n (
Fo
ld c
han
ge)
siCtrl
siIRE1
ns ✱✱ ✱ ✱✱
A2058 SK-MEL5A375-MA2A375
siC
trl
siIR
E1

61
population of the poorly metastatic cell line A375, (ii) using an experimental
metastasis approach with all metastatic cell lines we were only able to observe
metastatic lesions with the injection of A375-MA2 cells (Supplementary figure 2)
(178). Therefore, targeting IRE1 expression in A375-MA2 cells will allow us to
evaluate the relevance of IRE1 expression in cell migration, invasion and metastasis
in vivo.
The procedure to obtain IRE1KO cells is described in Figure 7, using the
double nickase method of CRISPR/Cas9 technology. After plasmid transfections
and the selection with puromycin, we obtained a pool of cells transfected with the
IRE1KO plasmid or Control (Figure 7). In order to corroborate the efficiency of this
genetic approach, we decided to evaluate IRE1 activity in these cells measuring the
level of XBP1 mRNA splicing under ER stress induced with TM. We observed that
the pool of cells transfected with the plasmids containing the single guide RNAs
(sgRNAs) that target IRE1 gene showed a decrease of ~40% in the XBP1 mRNA
splicing compared with the cells transfected with the Control, suggesting that a
subpopulation of cells was deficient for IRE1 (Figure 16A). We decided to isolate
individual clones of IRE1KO and Control cells using the limiting dilution approach.
We were able to obtain eleven IRE1KO clones (Figure 16B) that were further
validated using XBP1 mRNA splicing as a measurement of IRE1 activity. Seven
clones obtained from the pool of cells transfected with the Control plasmid were also
evaluated. Remarkably, six IRE1KO clones showed no IRE1 activity under the
presence of TM (Figure 16C). We decided then to use two Control clones, C5 and
C7 (renamed as C1 and C2, respectively) and three IRE1-deficient clones, KO4,
KO5, and KO16 (renamed as KO1, KO2, and KO3, respectively) for the next
experiments. To complement some experiments, we also generated IRE1-deficient

62
B16F10 cells using the same protocol. However, in this case, we did not isolate
individual clones since the pool of IRE1KO cells showed a total reduction of IRE1
expression and activity (Supplementary Figure 3A).
Figure 16. Validation of the generation of IRE1 KO in A375-MA2 cells.
(A) IRE1 activity was evaluated in the pool of cells obtained after transfection with plasmids containing sgRNAs Control or IRE1, and selection with puromycin. Cells were treated with 1 𝜇g/mL of Tm for 6 h, and then XBP1 mRNA splicing was evaluated by RT-PCR. PCR fragments corresponding to the XBP1u or XBP1s forms of XBP1 mRNA are indicated. The percentage of XBP1 mRNA splicing was calculated after the densitometric analysis of the XBP-1u and XBP1s-related PCR products to quantify the splicing percentage in each condition. (B) The level of IRE1 protein was determined in total protein extracts by western blot in the clones obtained after the limiting dilutions performed with the pool of cells IRE1KO mentioned in A. (C) IRE1 activity was determined in seven clones transfected with sgRNA Control, and clones transfected with sgRNAs for IRE1, and that did not present IRE1 expression in B. To evaluate the levels of XBP1 splicing, the same protocol described in A was used. Data represents 1 experiment.
7 17 18 27 30 29 32 34 36 41 42 44 50
IRE1-100
HSP90 - 90
-100
1 2 3 4 5 6 8 9 10 11 12 13 14
IRE1
HSP90- 90
15 16 19 20 21 22 23 24 25 26 28 31 33
-100IRE1
HSP90 - 90
37 43 45 47 48
IRE1 -100
HSP90- 90
C1 C2 C3 C5 C7 C8 C9 KO4 KO5
KO9 KO12 KO16 KO17 KO20 KO22 KO23 KO24 KO47
xbp1s
xbp1u- + Tm: - + - + - + - + - + - + - + - +
- + Tm: - + - + - + - + - + - + - + - +
xbp1s
xbp1u
A
C
B
xbp1s
xbp1u
Control
- +
IRE1KO
- + Tm:
77 40xbp1s (%)
Batch IRE1KO Batch IRE1KO
Batch IRE1KO Batch IRE1KO

63
As part of the characterization of the clones, we performed a WST-1
proliferation assay based on the cleavage of the tetrazolium salts to formazan by
cellular mitochondrial dehydrogenase, that will indicate us the metabolic activity in
live cells and indirectly the proliferation rate (179). For this purpose, we seeded 2000
cells in four 96 well plates and the number of cells was determined for four
consecutive days in a microplate reader according to the manufacturer’s
instructions. Importantly, a similar proliferation capacity was observed between
Control and IRE1 KO clones of A375-MA2 cells (Figure 17B). The same result was
observed in B16F10 using a different protocol based on daily nuclei count the
ArrayScan XTI Live High Content Platform (Supplementary Figure 3B). These
results suggest that IRE1 does not promote proliferation of melanoma cells, contrary
to what has been described for other types of cancer (96, 97).
Figure 17. Characterization the of IRE1 KO A375-MA2 clones selected.
IRE1KO A375-MA2 clones were generated using CRISPR/Cas9 technology. (A) The levels of IRE1 in Control and IRE1KO clones were evaluated using total protein extracts by western blot. (B) The proliferation of Control and IRE1KO clones was evaluated by using the WST-1 assay. Two thousand cells were seeded in four 96 well plates, one for each day, and the number of cells was determined in four consecutive days in a microplate reader. The assay was performed according to the manufacturer’s protocols instructions. Data represent the mean ± s.e.m of 3 independent experiments. Results were statistically compared using two-way ANOVA followed by Bonferroni’s multiple comparisons test. (ns: not statistically significant).
C1 C2 KO1 KO2 KO3
IRE1 -100
HSP90 - 90
Control IRE1 KO
A B
0 1 2 3 4 50
1
2
3
4
Time (d)
Pro
life
rati
on
(O
D 4
50n
m)
C1
C2
KO1
KO2
KO3
ns

64
Once characterized the IREKO and Control clones, we decided to evaluate the
effect of IRE1 deficiency in metastatic melanoma cell migration using the Boyden
chamber assay. Control and IRE1KO A375-MA2 clones were seeded in the
chambers and 4 hours later cells that transmigrated to the lower compartment of the
chamber were fixed and counted. We observed an increased cell migration capacity
in IRE1 deficient melanoma cells (Figure 18A), corroborating our previous results
using siRNAs (Figure 15). Individual analysis of the migratory behavior of each clone
showed that the three IRE1KO clones had an increased migratory capacity
compared to Controls (Figure 18B, left panel). Also, when analyzing the Control
clones and the IRE1KO clones as groups, we observed that IRE1 deficiency
increased cell migration by an average of 40% (Figure 18B, right panel). Since the
three IRE1KO clones had similar behavior, clones IRE1KO1 and KO2 were selected
to further experiments. These experimental approaches showed us that IRE1 could
be acting as a suppressor of cell migration in melanoma cell lines with high
metastatic capacity, which is contrary to our initial hypothesis.
To test if this effects in cell migration could also be observed in mouse
melanoma cells, we evaluated the effect of IRE1 deficiency in cell migration in
B16F10 cells. After performing the transmigration assay, we found not significant
differences in the cell migration of IRE1KO cells compared with Control
(Supplementary Figure 4). Of note, the transmigration assays with the B16F10 cells
were performed using Boyden chambers coated with fibronectin in the bottom,
unlike the ones performed with the human cell lines. Remarkably, it was shown
recently that fibronectin mRNA is enhanced by IRE1 through XBP1s (180). Thus,
using fibronectin might not be the best ECM to perform in vitro experiments. Futures
migration experiments with B16F10 need to be done using the same conditions that

65
the assays performed in human cell lines. Also, it is important to mention that the
human and mouse melanoma cells used in this thesis differ in the presence of BRAF
mutation, a common and relevant mutation in the progression of melanoma, a factor
that was previously described as an inductor of ER stress in melanoma cells (113).
Figure 18. IRE1 deficiency increases cell migration in human metastatic melanoma cells.
(A) Cells from Control and IRE1KO A375-MA2 clones (5 x 10⁴) were seeded on transwell plates, and transmigration was assessed. Transmigration was performed in the presence of NIH-CM. After 4h, cells that migrated to the lower side were stained with crystal violet. Images of the lower side of the transwell were taken. (B) The number of cells that migrated was counted using the ImageJ software. Left panel: Data is represented as fold change migration of individual clones using C1 as reference. Each connector line represents an experimental replica. Right panel: Data is represented as groups using the Control clone group as reference. Data represent the mean ± s.e.m of at least 4 independent experiments. Results were statistically compared using one-way ANOVA using followed by Dunn’s multiple comparison test (Left panel) or two-tailed t-test (Right panel). (*: p < 0.05, **: p < 0.01).
Altogether, our results indicate that the ablation of IRE1 expression using
siRNA or CRISPR/Cas9 approaches led to a significant increase in cell migratory
capacity of human metastatic melanoma cell lines. This evidence suggests that
IRE1 may be an important suppressor of cell migration in metastatic cells, since the
migration of the non-metastatic cells A375 did not rely on IRE1 expression.
A
C1 C2 KO1 KO2 KO3
B
C1 C2 KO1 KO2 KO3
0.0
0.5
1.0
1.5
2.0
2.5
Tra
nsm
igra
tio
n (
Fo
ld c
han
ge)
✱
Ctrl
IRE1K
O
0.0
0.5
1.0
1.5
2.0
Tra
nsm
igra
tio
n (
Fo
ld c
han
ge)
✱✱

66
Regulation of actin cytoskeleton organization by IRE1 in
metastatic melanoma cells.
Actin filaments are the primary cytoskeletal component involved in cell motility.
During migration, F-actin reorganizes toward the cortical area and extends different
protrusions, including membrane ruffling, lamellipodia, filopodia, and invadopodia
(181). As mentioned before, we previously demonstrated that IRE1, through the
engagement of FLNA signaling, enhance actin cytoskeleton remodeling and
increases cell migration of fibroblasts (93). Thus, we decided to evaluate if the
changes observed in IRE1-deficient melanoma cells can be associated to an
alteration of the actin cytoskeleton dynamics. Control and IRE1KO A375-MA2 cells
were plated on coverslips for 48 hours, fixed, stained with phalloidin-coupled to FITC
and visualized using a Leica SP8 confocal microscope. Stained cells showed a
strong signal of polymerized actin, showing structures resembling stress fibers,
lamellipodia and filopodia (Figure 19A, left panel). We decided to analyze the effect
in F-actin distribution upon deficiency of IRE1 expression using the ImageJ software
to evaluate fluorescence intensity of FITC from the borders to the center of the cell.
Using this approach, we did not observed changes associated to IRE1 deficiency in
the distribution of the actin cytoskeleton in this human metastatic melanoma cells
(Figure 19B), suggesting that at least in basal conditions IRE1 signaling could not
play a relevant role in actin cytoskeleton dynamics during cell migration.

67
Figure 19. Actin cytoskeleton is not affected by IRE1 deficiency in MA2-A375 cells.
(A) Controls and IRE1KO A375-MA2 clones were plated onto non-coated slides. After 48 h, cells were fixed and stained with phalloidin coupled to FITC. Pictures were taken using confocal microscopy. (B) Using the ImageJ software, fluorescence intensity was determined from the border to the center of the cell to analyze actin cytoskeleton distribution. Representative lines of the analysis are shown in panel A. The number of Stress Fibers per cell (C) and the Stress fibers size (D) was determined using the plugin Filament detector of the ImageJ software. Data represent the mean ± s.e.m of 3 independent experiments. Results were statistically compared using one-way ANOVA using followed by Dunn’s multiple comparison test. (ns: not statistically significant, **: p < 0.01).
Cell
Cortex
Cell
Center
A
C D
C1
C2
KO1
KO2
0 5 10 15 200
20
40
60
80
100
Flu
ore
scen
ce in
ten
sit
y
C1
C2
KO1
KO2
Distance from cell edge (microns)
ns
C1 C2 KO1 KO20
20
40
60
80
Str
ess F
ibers
siz
e (µ
m)
✱✱
C1 C2 KO1 KO20
10
20
30
40
No
of
Str
ess F
ibers
p
er
cell
ns
B

68
Visualization of actin cytoskeleton in human melanoma cells revealed a high
amount of stress fibers, that constitute essentials elements that act as a contractile
apparatus, and together with focal adhesions, allow cell attachment to the
extracellular matrix through the plasma membrane and promote cell migration (182).
Using the plugin Filament detector of the ImageJ software, we determine the
number of stress fibers and the stress fibers size. As observed in Figure 19C,
targeting IRE1 expression did not present an effect on the number of stress fibers.
However, we found a decrease in the stress fibers length in one of the IRE1KO
clone (clone KO2) (Figure 19D). Of note, this clone showed less increase in cell
migration in the Boyden chamber assays compared to the others IRE1KO clones
(Figure 18B), evidencing some clonal effects of the selection process of
CRISPR/Cas9. Based on this evidence, we hypothesize that this effect in the size
of stress fibers is IRE1-independent and that can be due to a clonal effect. This
result can explain why this clone has a lower migratory capacity compared with the
other IRE1KO clones.
To further characterize the actin cytoskeleton dynamics, we evaluated the
amount of Filopodia, the main protrusions formed during the migration cycle (183).
Using the FiloQuant plugin of the ImageJ software, we were able to segment and
analyze the number of filopodia per cell and filopodia size. This analysis revealed
that IRE1-deficient human metastatic melanoma cells have an equivalent number
and size of filopodia per cell compare with Controls (Figure 20A and 20B). This
indicated that IRE1 do not impact in the regulation of actin cytoskeleton in human
metastatic melanoma cells in basal conditions.

69
Figure 20. Filopodia formation is independent of IRE1 expression.
Controls and IRE1KO A375-MA2 clones were plated onto non-coated slides. After 48 h, cells were fixed and stained with phalloidin coupled to FITC. Pictures were taken using confocal microscopy. The number of Filopodia per cell (A) and Filopodia size (B) was determined using the plugin FiloQuant of the ImageJ software. Data represent the mean ± s.e.m of 3 independent experiments. Results were statistically compared using one-way ANOVA followed by Dunn’s multiple comparison test. (ns: not statistically significant).
In order to corroborate this phenotype, we also evaluated filopodia formation
in the mouse metastatic melanoma cell line B16F10. When we compared WT and
Control cells with IRE1KO B16F10 cells, we observed a tendency to increase the
number filopodia per cell (Supplementary Figure 5A), with no changes in the size
(Supplementary Figure 5B). We also evaluated actin dynamics using a fluorescent
protein to visualize polymerized actin in real-time called Lifeact (184). We transiently
transfected Lifeact in WT, Control and IRE1KO B16F10 cells, seeded on coverslips
coated with 2 µg/mL of fibronectin and recorded every 5 seconds for 10 min using
time-lapse confocal microscopy. As observed in Supplementary Figure 6A,
transfected cells showed structures resembling stress fibers, lamellipodia and
filopodia. To analyze and quantify actin dynamics, we used ADAPT software to
evaluate the changes in protrusion, and retraction velocities based on changes in
cortical actin. We observed that B16F10 cells deficient of IRE1 presented a more
dynamic formation of protrusions (Supplementary Figure 6B) and retractions
A B
C1 C2 KO1 KO20
2
4
6
8
Filo
po
dia
siz
e (µ
m)
ns
C1 C2 KO1 KO20
5
10
15
20
No
of
Filo
po
dia
p
er
cell
ns

70
(Supplementary Figure 6D). Mean protrusion and retraction velocities indicate the
same results (Supplementary Figure 6C and E). Of note, all the experiments with
B16F10 cells were performed in fibronectin-coated plates that could affect the
results based in our previous results (Supplementary Figure 4) and the fact that
IRE1 can affect fibronectin expression (180).
Altogether, these results suggest that in human melanoma cell lines, actin
cytoskeleton is not regulated by IRE1 and that the increased migratory capacity in
IRE1-deficient cells can be independent of the capacity of actin reorganization.
Nevertheless, in the mouse metastatic B16F10 cell line a possible contribution of
IRE1 expression in the formation of protrusions can be observed, this will need
further analysis.
Regulation of cell adhesion by IRE1 in metastatic melanoma
cells.
Cell adhesion is another essential cellular response involved in physiological
processes like cell migration, as well as in the pathology of neoplastic transformation
and metastasis (185, 186). Thus, once we determined that the regulation of cell
migration by IRE1 in human melanoma cells was independent of the actin
cytoskeleton at least in basal conditions, we decided to explore its possible role in
cell adhesion. With this aim, we first performed cell adhesion assays in Control and
IRE1KO A375-MA2 cells platted onto fibronectin-coated plates (2ug/ml) at different
times, followed by staining with crystal violet. Using this approach, we observed that
A375-MA2 IRE1KO cells had similar adhesion capacity that Control cells over
fibronectin (Figure 21A). Next, we evaluate the effect of IRE1 expression in the
adhesion of this metastatic melanoma cells onto Matrigel, a complex basement

71
membrane preparation rich in ECM proteins as collagen, laminin, heparan sulfate
proteoglycans and some growth factors that resembles the extracellular matrix
found in tumor microenvironment. Cell adhesion capacity of IRE1KO and Control
cells were seeded onto Matrigel (500 ng/ml) coated plates was virtually the same
regarding IRE1 deficiency. Nevertheless, we found significant differences in cell
adhesion between the clones that were independent of IRE1 expression, since
clones C2 and KO1 were the ones with the higher percentage of adhesion (Figure
21B). These results indicate that the regulation of cell migration by IRE1 in human
metastatic melanoma cells appears to be independent of the capacity to attach to
extracellular matrixes.
Figure 21. Cell adhesion capacity to Fibronectin and Matrigel is independent of IRE1 expression in A375-MA2 cells.
Control and IRE1 A375-MA2 clones were maintained in suspension and allowed to attach to fibronectin (2 μg/ml) (A) or matrigel (500 ng/ml) (B) coated plates for different times. Adherent cells were stained with crystal violet. Dye was extracted with methanol and the total absorbance was measured. Data represents the mean ± s.e.m of 3 independent experiments. Results were statistically compared using two-way ANOVA followed by Bonferroni's multiple comparisons test. (ns: not statistically significant, **: p < 0.01).
A B
0 20 40 60 800
50
100
150
Time (m)
Fib
ron
ecti
nC
ell A
dh
esio
n (
%)
C1
C2
KO1
KO2
ns
0 20 40 60 800
50
100
150
Time (m)
Matr
igel
Cell A
dh
esio
n (
%)
C1
C2
KO1
KO2
**
✱✱

72
Effect of IRE1 deficiency in cell invasion of human metastatic
melanoma cells.
Aberrant cell migration and invasion are two common cellular processes in
metastatic cells (30). Particularly, invasion allows tumor cells to penetrate the
surrounding tissues through the degradation of the extracellular matrix and pass
through the basement membrane, enabling cell migration (187). Considering that
IRE1 deficiency increase cell migration in human metastatic melanoma cells, we
proposed to determine if IRE1 could also regulate cell invasion. To that end, we
performed invasion experiments with the four human melanoma cell lines
transfected with siRNAs targeting IRE1 expression and Control siRNA (Figure 13A).
To perform the invasion assays, cells were seeded on Boyden chambers coated
with Matrigel (200 ng/ml) in the upper compartment, and NIH-CM was used as a
chemoattractant to allow cells to invade (Figure 22, left panel) (177).
Figure 22. Silencing of IRE1 increases cell invasion in human metastatic melanoma cells.
Human melanoma cells were transiently transfected with siRNA Control (siCtrl) or siRNA against IRE1 (siIRE1). Left panel: After 48h, 3 x 10⁴ cells transfected with siCtrl or siIRE1 were seeded on Matrigel-coated (200 ng/ml) transwell plates, and invasion was assessed. The invasion was evaluated in the presence of NIH-CM. After 24 h, cells that invaded to the lower side were stained with crystal violet. Images of the lower side of the transwell were taken. Right panel: The number of cells that invaded was counted using the ImageJ software. Data represent the mean ± s.e.m of at least 4 independent experiments. Results were statistically compared using a two-tailed t-test. (ns: not statistically significant, *: p < 0.05, **: p < 0.01).
A2058 SK-MEL5A375-MA2A375
siCtrl
siIRE1
A37
5
A37
5-M
A2
A20
58
SK-M
EL5
0
1
2
3
Invasio
n (
Fo
ld c
han
ge)
siCtrl
siIRE1
ns ✱ ns
✱✱

73
Similar to the phenotype observed in cell migration, silencing IRE1 expression
in two metastatic cell lines, A375-MA2 and SK-MEL5, showed an increase in the
number of cells that invaded to the lower compartment and no effect was observed
in the non-metastatic cell line A375 nor the A2058 metastatic cell line (Figure 22,
right panel)
We then corroborated these findings in A375-MA2 Control and IRE1KO
clones. As observed in Figure 23, IRE1KO clones showed an increase in cell
invasion compared with the controls (Figure 23A). However, analyzing cell invasion
capacity between individual clones, a significant increase was only found in the KO1
clone compared with both controls. Nevertheless, in each biological replicate, a
trend can be observed where IRE1-deficient cells presented higher cell migration in
comparison with controls (Figure 23B, left panel). Analysis of control and IRE1KO
clones as two independent groups showed a significant increase in the invasion
capacity of cells deficient of IRE1 (Figure 23B, right panel).
These results indicate that IRE1 could be a regulator of melanoma cell
invasion in metastatic cells. However, further experiments are needed to establish
if IRE1 can directly regulate cell invasion through other mechanism such as
invadopodia formation, a major invasive structure, and ECM degradation
mechanism (48).

74
Figure 23. IRE1 deficiency increases cell invasion in human metastatic melanoma cells.
(A) Cells from Control and IRE1KO A375-MA2 clones (3 x 10⁴) were seeded on Matrigel-coated (200 ng/ml) transwell plates, and invasion was assessed. The invasion was evaluated in the presence of NIH-CM. After 24 h, cells that invaded to the lower side were stained with crystal violet. Images of the lower side of the transwell were taken. (B) The number of cells that invaded was counted using the ImageJ software. Data are represented as fold change migration of individual clones using C1 as reference (Left panel) or groups using Control clones group as reference (Right panel). Data represent the mean ± s.e.m of at least 4 independent experiments. Results were statistically compared using one-way ANOVA followed by Dunn’s multiple comparison test (Left panel) or two-tailed t-test (Right panel). (ns: not statistically significant, *: p < 0.05, **: p < 0.01).
A
B
C1 C2 KO1 KO2
C1 C2 KO1 KO20.0
0.5
1.0
1.5
2.0
Invasio
n (
Fo
ld c
han
ge)
✱
ns
Ctrl
IRE1K
O
0.0
0.5
1.0
1.5
2.0
Invasio
n (
Fo
ld c
han
ge)
✱✱

75
Role of the IRE1/FLNA pathway in the regulation of cell migration
and invasion in melanoma.
The results described until now indicate that IRE1 could act as a suppressor
of cell migration and invasion in melanoma cells with high metastatic capacities.
Previous data from our laboratory revealed an interaction between IRE1 and FLNA
that enhance FLNA phosphorylation in S2152 and promote actin cytoskeleton
dynamics, enhancing migration in non-tumor cells (93). Although FLNA is a protein
that has been extensively recognized as an enhancer of cell migration, some
functions as a suppressor of cell invasion and metastasis have been described (160,
188) Then, as part of the specific aim 3 we explored the possibility that IRE1 could
be suppressing cell migration in melanoma cells through FLNA regulation.
To that end, we first evaluated the effect of FLNA silencing in cell migration by
transfecting with 10 pmol or 30 pmol of siRNA target for FLNA in A375-MA2 parental
cells. Using, this strategy we observed a higher decrease in FLNA protein levels
using the maximum concentration of siRNA (Figure 24A). Then, we evaluated
transmigration capacity in parental A375-MA2 transfected with siRNA for FLNA or
control siRNA (30 pmol). No significant differences were obtained between FLNA-
deficient cells and the Control; nevertheless, a high variation of data was observed
with a trend to increase the migratory capacity in the cells transfected with siFLNA
(Figure 24B). These results suggest that at least in our model, regulation of cell
migration by IRE1 could be independent of FLNA, since targeting this protein does
not show significant effects on cell migration.

76
Figure 24. Silencing of FLNA expression do not influence cell migration of metastatic cells.
(A) A375-MA2 parental cells were transiently transfected with siRNA Control (siCtrl) or siRNA against FLNA (siFLNA) using 10 or 30 pmol. Total protein extracts were analyzed by western blot using specific antibodies. (B) Left panel: After 48h, 5 x 10⁴ cells transfected with 30 pmol of siCtrl or siIRE1 were seeded on transwell plates, and transmigration was assessed. Transmigration was assessed in the presence of NIH-CM. After 4h, cells that migrated to the lower side were stained with crystal violet. Images of the lower side of the transwell were taken. Right panel: The number of cells that migrated was counted using the ImageJ software. Data represent the mean ± s.e.m of 4 independent experiments. Results were statistically compared using a two-tailed t-test. (ns: not statistically significant).
Next, we decided to determine if the IRE1/FLNA signaling described before by
our group in non-tumor cells was also present in melanoma. With this aim we
assessed the endogenous interaction of these proteins in the human cell line SK-
MEL5, since these cells express high protein levels of IRE1, and the mouse cell line
B16F10. Using IP of IRE1 with a high-affinity anti-IRE1 antibody, we were not able
to confirm the interaction between endogenous IRE1 and FLNA at basal levels
(Supplementary Figure 7). Of course, this does not exclude the possibility that both
proteins interact in melanoma cells, since this interaction could be weak or regulated
by a promigratory stimulus. Other complementary studies need to be done to further
explore this possibility.
FLNA -281
HSP90 - 90
siCtrl siFLNA
10 30 pmol
A B
A375-MA2
siC
trl
siF
LN
A
siCtrl
siFLN
A
0.0
0.5
1.0
1.5
2.0
Tra
nsm
igra
tio
n (
Fo
ld c
han
ge)
ns

77
Although we were not able to confirm an interaction between IRE1 and FLNA,
we tested if IRE1 could affect the phosphorylation status of FLNA under
promigratory stimuli. We previously described that in non-tumor cells under
treatments with FBS there is an IRE1-dependent induction of FLNA phosphorylation
in S2152, a critical phosphorylation site for activation of FLNA signaling through the
actin cytoskeleton (93, 140). Thus, we treated melanoma cells with 20% FBS for 1
or 2 hours and analyzed the phosphorylation of FLNA by Western blot. As expected,
an increase in FLNA phosphorylation after 1 hour of stimulation compared with non-
treated parental A375-MA2 cells was observed (Figure 25A). When we performed
the same experiment in Control clone C2 and IRE1KO clone KO2 treated with 20%
of FBS, no significant differences were observed between both groups, suggesting
that the induction of FLNA phosphorylation was independent of IRE1 (Figure 25B).
To validate this result, we treated cells with NIH-CM, a more efficient
promigratory stimulus in melanoma cells. Interestingly, we did not observe a marked
induction in phosphorylation of FLNA at any time of the treatment and no significant
differences between the Control and IRE1KO clones were not obtained (Figure
25C). Since NIH-CM is a powerful promigratory stimulus in melanoma cells, this
data suggests that FLNA phosphorylation may not be relevant during melanoma
migration induced by NIH-CM. These results support our previous results showing
that FLNA may not be relevant for the increase of cell migration in IRE1-deficient
melanoma cells.

78
Figure 25. FLNA phosphorylation is independent of IRE1 expression under promigratory stimuli.
(A) Parental A375-MA2 cells were treated with 20% FSB for 1 and 2 hours. Total protein extracts were analyzed by western blot using specific antibodies for pS2152-Filamin A, Filamin A, and HSP90. (B) Left panel: Control C2 and IRE1KO KO2 were treated with 20% FSB (B) or 20% NIH-CM (C) for different time points. Total protein extracts were analyzed by western blot using specific antibodies for pS2152-Filamin A, Filamin A, and HSP90 (Left panels). Quantification of the levels of Filamin A phosphorylation in cells stimulated with promigratory stimuli was quantified by scanning densitometry and represented as fold change using non-treated control cells as reference (Right panels). Data represent the mean ± s.e.m of 3 independent experiments. Results were statistically compared using two-way ANOVA followed by Bonferroni's multiple comparisons test. (ns: not statistically significant).
0 0.5 1 2 4 0 0.5 1 2 4 FBS (h):
pFLNA
kDa
Control
FLNA
HSP90
IRE1KO
-281
- 90
-281
0 0.5 1 2 4 0 0.5 1 2 4 NIH-CM (h):
pFLNA
kDa
Control
FLNA
HSP90
IRE1KO
-281
- 90
-281
B
C
pFLNA -281
-281
-44
A
1 2
FBS 20%
FLNA
GAPDH
NT
Time (h):
0 1 2 3 40
1
2
3
4
Time (h)
p2152 F
LN
A/ to
tal F
LN
A
(fo
ld c
han
ge)
Ctrl
IRE1KO
ns
0 1 2 3 40.5
1.0
1.5
2.0
Time (h)
p2152 F
LN
A/ to
tal F
LN
A
(fo
ld c
han
ge)
Ctrl
IRE1KO
ns
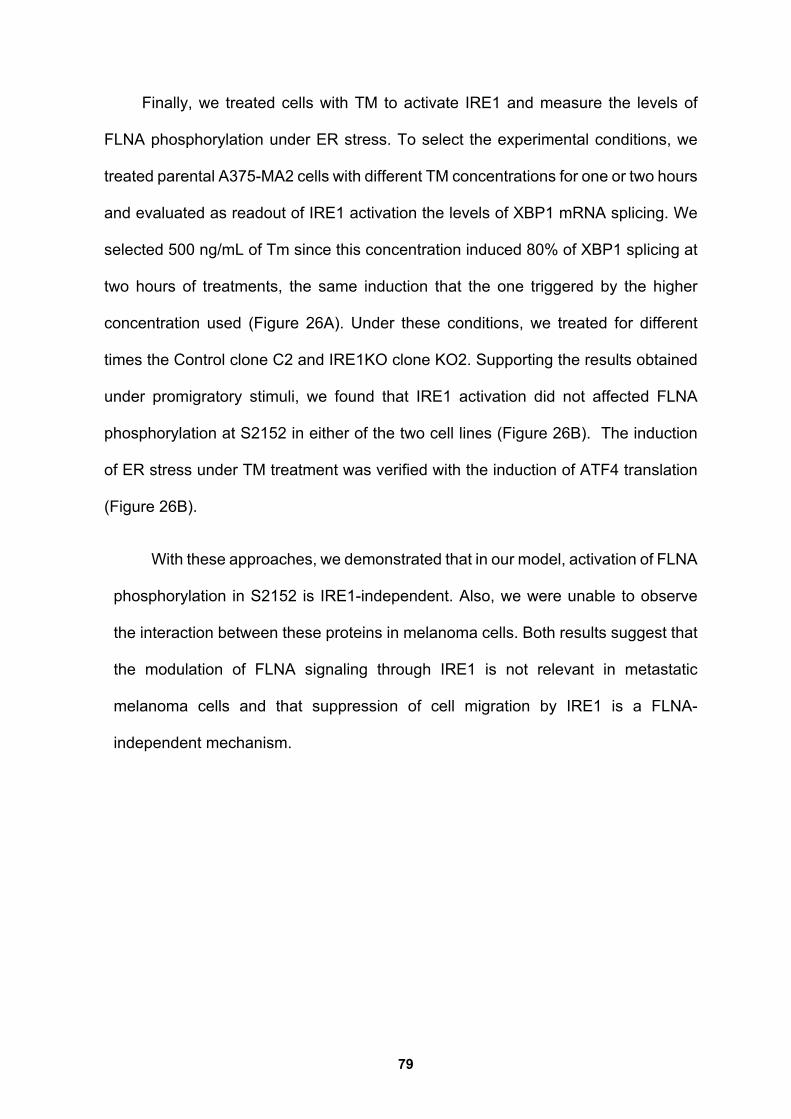
79
Finally, we treated cells with TM to activate IRE1 and measure the levels of
FLNA phosphorylation under ER stress. To select the experimental conditions, we
treated parental A375-MA2 cells with different TM concentrations for one or two hours
and evaluated as readout of IRE1 activation the levels of XBP1 mRNA splicing. We
selected 500 ng/mL of Tm since this concentration induced 80% of XBP1 splicing at
two hours of treatments, the same induction that the one triggered by the higher
concentration used (Figure 26A). Under these conditions, we treated for different
times the Control clone C2 and IRE1KO clone KO2. Supporting the results obtained
under promigratory stimuli, we found that IRE1 activation did not affected FLNA
phosphorylation at S2152 in either of the two cell lines (Figure 26B). The induction
of ER stress under TM treatment was verified with the induction of ATF4 translation
(Figure 26B).
With these approaches, we demonstrated that in our model, activation of FLNA
phosphorylation in S2152 is IRE1-independent. Also, we were unable to observe
the interaction between these proteins in melanoma cells. Both results suggest that
the modulation of FLNA signaling through IRE1 is not relevant in metastatic
melanoma cells and that suppression of cell migration by IRE1 is a FLNA-
independent mechanism.

80
Figure 26. FLNA phosphorylation is independent of IRE1 expression under ER stress.
(A) IRE1 activity induced by different tunicamycin (TM) concentrations was evaluated in A375-MA2 parental cells. Cells were treated with different TM concentrations for 1 and 2 hours, and then XBP1 mRNA splicing was evaluated by RT-PCR. PCR fragments corresponding to the XBP1u or XBP1s forms of XBP1 mRNA are indicated. The percentage of XBP1 mRNA splicing was calculated after the densitometric analysis of the XBP-1u and XBP1s-related PCR products to quantify the splicing percentage in each condition. (B) Left panel: Control C2 and IRE1KO KO2 were treated with 500 ng/mL OF TM for different time points. Total protein extracts were analyzed by western blot using specific antibodies for pS2152-Filamin A, Filamin A, ATF4, and HSP90. Right panel: Quantification of the levels of Filamin A phosphorylation in cells stimulated with an ER stress inducer was quantified by scanning densitometry and represented as fold change using non-treated control cells as a reference. Data represent the mean ± s.e.m of 3 independent experiments. Results were statistically compared using two-way ANOVA followed by Bonferroni's multiple comparisons test. (ns: not statistically significant).
A
B
1 2 1 2 1 2T (h):
xbp1s
xbp1u
Tm (ng/mL): 250 500 1000NT
54 75 40 81 60 80xbp1s (%)
kDa
-281
- 90
-281
- 50
0 0.5 1 2 4 0 0.5 1 2 4 TM (h):
pFLNA
Control
FLNA
HSP90
IRE1 KO
ATF4
0 1 2 3 40
1
2
3
Time (h)
p2152 F
LN
A/ to
tal F
LN
A
(fo
ld c
han
ge)
Ctrl
IRE1KO
ns

81
Role of the IRE1 RNase-RIDD dependent activity in the
suppression of melanoma cell migration.
Another mechanism of IRE1 that has been linked to the regulation of cell
migration in tumor cells is its RNase activity through the regulation of XBP1s or the
degradation of multiple mRNAs through RIDD (117). A role for the IRE1/XBP1s axis
enhancing invasion and metastasis has been proposed through the regulation of
EMT-related genes (118, 121, 124). Nevertheless, some reports indicate that RIDD
activity may exhibit the opposite role through a RIDD-mediated degradation of the
mRNA of SPARC by RIDD (130). SPARC is a non-structural glycoprotein present
in the extracellular matrix and that has been associated with aggressiveness,
invasion and metastasis (133-138). Of note, there are no previous studies
evaluating the role of IRE1 activity in migration and invasion in melanoma.
Thus, we decided to evaluate if the RNase activity of IRE1 could be involved
in the suppression of metastatic melanoma cell migration using human cell lines as
a model. With this aim we first tested MKC-8866, a salicylaldehyde analog, for a
potent and selective pharmacological inhibition of IRE1 RNase activity (189). Dose-
response of the IRE1 inhibitor showed that the treatment of cells with 20 µM of MKC-
8866 inhibits almost completely the activity of IRE1 upon ER stress based on the
percentage of XBP1 mRNA splicing (Figure 27A). Then, A375-MA2 parental cells
were seeded in a 6-well plate and pre-treated with 20uM of MKC-8866 for 48 hours
before the experiment. Transmigration assays were performed using the same
protocol previously described. Supporting our new hypothesis that the RNase
activity of IRE1 could be involved in the regulation of cell migration in melanoma,
we found that inhibition of IRE1 RNase activity with MKC-8866 significantly
increased cell migration of A375-MA2 cells, same phenotype as the one observed

82
in cells deficient of IRE1 expression (Figured 27B). This result is in agreement with
the fact that IRE1 acts as a suppressor of cell migration in metastatic melanoma
cells and indicates that its enzymatic activity could be responsible.
Figure 27. The MKC-8866 IRE1 RNase inhibitor increases cell migration in human metastatic melanoma cells.
(A) IRE1 RNase activity inhibit by different concentrations of MKC-8866 was evaluated in A375-MA2 parental cells co-treated with 1ug/mL of TM for 6 h. XBP1 mRNA splicing was determined by RT-PCR. PCR fragments corresponding to the XBP1u or XBP1s forms of XBP1 mRNA are indicated. The percentage of XBP1 mRNA splicing was calculated after the densitometric analysis of the XBP-1u and XBP1s-related PCR products to quantify the splicing percentage in each condition. (B) Left panel: After 48h, 5 x 10⁴ cells treated with 20 M MKC-8866 were seeded on transwell plates, and transmigration was assessed. Transmigration was assessed in the presence of NIH-CM. After 4h, cells that migrated to the lower side were stained with crystal violet. Images of the lower side of the transwell were taken. Right panel: The number of cells that migrated was counted using the ImageJ software. Data represent the mean ± s.e.m of 6 independent experiments. Results were statistically compared using a two-tailed t-test. (*: p < 0.05).
Based in the previously described function of IRE1 RNase activities, were
XBP1s have been extensively described in a great variety of tumors as an enhancer
of cell migration and invasion (118, 121, 124), we hypothesized that the effects of
IRE1 as a suppressor of cell migration could be mediated by the degradation of a
pro-metastatic gene through the RIDD. To further support this idea we first,
performed gain-of-function assays by transiently transfecting plasmids coding for
XBP1s-GFP or GFP (Mock) retroviral vectors followed by the Boyden chamber
A B
0 0 2.5 5 10 20
xbp1s
xbp1u
MKC-8866:
1 !g/mL 6hTm: - + + + + +
!M
77 21 14 11 4xbp1s (%)
A375-MA2
DM
SO
MK
C-8
866
DM
SO
MKC-8
866
0.0
0.3
0.6
0.9
1.2
1.5
1.8
Tra
nsm
igra
tio
n (
Fo
ld c
han
ge)
✱

83
assay. Total RNA extractions were analyzed to confirm overexpression of XBP1s
by PCR (Figure 28A). Quantification of GFP positive cells that migrated to the lower
chamber indicated that XBP1s overexpression did not affect cell migration
compared with Mock cells (Figure 28B). The same phenotype was observed when
we bypass IRE1 deficiency by the forced expression of XBP1s using the same
experimental setting (Figure 28C). These results indicate that IRE1 negatively
regulates cell migration in metastatic melanoma cell lines through a process
independent of the XBP1s expression.
Figure 28. Forced XBP1s expression does not influence cell migration of metastatic melanoma cells.
(A) A375-MA2 parental cells were transiently transfected with Mock-GFP and mouse XBP1s-GFP plasmids. (A) The levels of XBP1s were evaluated by PCR using specific primers. After 72h transfected A375-MA2 clone Control C1 (B) and clone IRE1KO KO1 (C) were seeded on transwell plates, and transmigration was assessed. Transmigration was assessed in the presence of NIH-CM. After 4h, cells that migrated to the lower side were fixed with PFA 4%. Images of the lower side of the transwell were taken, and the number of cells GFP positive that migrated was counted using the ImageJ software. Data represent the mean ± s.e.m of 3 independent experiments. Results were statistically compared using a two-tailed t-test. (ns: not statistically significant).
B
A
C
Ctrl
MO
CK
XB
P1s
IRE1KO
1: MOCK- GFP
2: mXBP1s- GFP
Ctrl IRE1KO
1 2 1 2
xbp1s (m)
actin
Ctrl
IRE1K
O
0.0
0.5
1.0
1.5
Tra
nsm
igra
ció
n
(exp
resió
n r
ela
tiva)
MOCK
XBP1s
ns ns

84
Next, we evaluated the possibility that IRE1 through RIDD could regulate some
key mRNAs that affect cell migration. To this end, we decided to determine possible
mRNAs of enhancers of cell migration/invasion and metastasis in melanoma that
could be degraded by the IRE1/RIDD activity. Briefly, we selected two lists of genes
that were previously identified as candidates associated with pro-metastatic
capacities in melanoma (190, 191). These candidates were intersected, by using
the program FunRich, with two dataset of genes that have been previously classified
as potential RIDD-targets, by searching in silico the presence of CUGCAG-like
sequences in all human transcriptome (192) or all mRNAs cleaved in vitro by IRE1
recombinant protein (139). This analysis revealed 39 putative RIDD targets with
described pro-migratory and invasive roles in melanoma (Figure 29). Then, to
narrow the list, we selected genes with a negative impact in survival in patients with
melanoma according to the Human Protein Atlas (Figure 29). This analysis shown
that 16 genes that are putative RIDD targets have an impact of melanoma patient
survival.
To corroborate if some of these genes correlates with IRE1 activation status
and RIDD activity, we evaluated the expression levels of these genes in four
populations of melanoma patients displaying either High or Low RIDD activity, and
High or Low XBP1s activity. This analysis was performed using the same database
(TCGA) and protocol previously described in section 11.1.
Remarkably, tumors exhibiting high RIDD activity, independently of XBP1s,
also correlated with a significant decrease in the expression level of nine pro-
metastatic melanoma genes (Figure 30, left panel). A global effect in the expression
levels of these genes mediated by RIDD activity can be more clearly observed in
the heatmap represented in Figure 30, right panel. Between the genes possibly

85
regulated by RIDD we found: Minichromosome Maintenance Complex Component
7 (MCM7), Methylenetetrahydrofolate Dehydrogenase (NADP+ Dependent) 2,
Methenyltetrahydrofolate Cyclohydrolase (MTHFD2), NAD(P) transhydrogenase
(NNT), Nucleoporin 98 And 96 Precursor (NUP98), Protein Kinase C Alpha
(PRKCA), Roundabout Guidance Receptor 1 (ROBO1), Mtr4 Exosome RNA
Helicase (SKIV2L2, also known as MTREX), Structural maintenance of
chromosomes protein 4 (SMC4), Signal Peptidase Complex Subunit 3 (SPCS3),
and TAR DNA Binding Protein (TARDBP). After a gene ontology analysis, we found
that these genes are associated to metabolic pathways, RNA transport, cell cycle,
DNA replication, proteosome and secretory pathway. All of them have been found
to be associated with the metastatic process in melanoma. Interestingly, among
these genes, we found PRKCA that encodes for PKCα, an important mediator of
the IRE1/FLNA signaling (93). The degradation of PKCα by RIDD could explain the
lack of evidence of this signaling in our model.
This data supports the idea that these pro-metastatic genes could be putative
RIDD-targets in melanoma and that the degradation of the mRNA of these genes
could be mediating the suppression of cell migration and invasion in the metastatic
melanoma cell lines. Nevertheless, further experiments are needed to corroborate
this hypothesis in addition to functional test of the impact of this putative RIDD
targets in melanoma cell migration.

86
Figure 29. Pipeline of the analysis to identify pro-metastatic genes and putative RIDD-targets in melanoma.
(A) Interception analysis of a list of genes identified as potential RIDD targets, using two datasets and two lists of genes associated pro-metastatic capacities in melanoma (190, 191). was performed. The two datasets describing possible RIDD targets were based in an in-silico searching of the presence of CUGCAG-like sequences (192) and in an in-vitro cleavage assay by IRE1 recombinant protein (139). This analysis revealed 39 putative RIDD targets with potential pro-migratory and invasive roles in melanoma. From these 39 genes, 16 were identified as candidates significantly associated with poor overall survival in melanoma patients. Survival analysis data were obtained using the Protein Atlas website and the database of human skin cutaneous melanoma from the Cancer Genome Atlas (TCGA) project. The hierarchical clustering of patients using the dataset from the TCGA revealed the existence of four populations displaying either high or low RIDD and XBP1s activities. Correlation of gene expression and IRE1 branch activity was performed.
RIDD targets in vitro assay (1865 genes)
RIDD targets in-silico analysis (853 genes)
Melanoma pro-metastatic genes I (295 genes)
Melanoma pro-metastatic genes II (112 genes)
Consensus siteBright et al, 2015
Metastatic genes IScott et al, 2011
Metastatic genes IIChen et al, 2019
In vitro cleavageLhomond et al, 2018
NNT
TNRC18
MATN2
PDE2A
NUP98
MPO
APOL3
GFRA4
LRIG1
NCAPD2
TARDBP
SESN3
TMEM33
RGL1
MCM7
PRKCA
GSR
IL6R
KIF20A
MPP6
MTHFD2
NUSAP1
ROBO1
SKIV2L2
SMC4
SPCS3
STK3
EPHB6
LAMA3
FGFR2
LIMK1
EPHA4
EFNA3
JUP
CD38
CDH1
COL4A5
TNXB
WNT5A
Negative effect on Melanoma survival
The Human Protein Atlas
NNT
NUP98NCAPD2
TARDBP
MCM7PRKCA
KIF20AMPP6
MTHFD2
NUSAP1ROBO1
SKIV2L2
SMC4SPCS3
JUPTNXB
High_XBP1s_High_RIDD
High_XBP1s_Low_RIDD
Low_XBP1s_High_RIDD
Low_XBP1s_Low_RIDD
Gene expression (TCGA)

87
F
igu
re 3
0. P
ro-m
eta
sta
tic g
en
es a
nd
pu
tativ
e R
IDD
-targ
ets
in m
ela
no
ma.
Mela
nom
a p
atie
nts
were
score
d u
sin
g X
BP
1s a
nd R
IDD
sig
natu
res. L
eft p
an
el: S
ignatu
re s
core
s
were
overla
pped
to
genera
te
4
cohorts
; H
igh_X
BP
1s_H
igh_R
IDD
, H
igh_X
BP
1s_Low
_R
IDD
, Low
_X
BP
1s_H
igh_R
IDD
, Low
_X
BP
1s_Low
_R
IDD
. The s
cale
d e
xpre
ssio
n o
f pro
-meta
sta
tic g
enes
betw
een th
e fo
ur c
ohorts
was c
om
pare
d. R
igh
t pan
el: A
heatm
ap w
as g
enera
ted to
com
pare
the
rela
tive expre
ssio
n of
the pro
-meta
sta
tic genes.
The genes w
ere
clu
ste
red usin
g hie
rarc
hic
al
clu
ste
ring. H
igh a
nd L
ow
RID
D g
roups w
ere
sta
tistic
ally
com
pare
d u
sin
g a
two
-taile
d t-te
st. (*: p
<
0.0
5, **: p
< 0
.01, ***: p
< 0
.001).
**
****
***
******
*****
***
******
******
******
******
*****
******
JU
PK
IF2
0A
MC
M7
MP
P6
MT
HF
D2
NC
AP
D2
NN
TN
UP
98
gene expression
High_XBP1s_High_RIDD
High_XBP1s_Low_RIDD
Low_XBP1s_High_RIDD
Low_XBP1s_Low_RIDD
High_XBP1s_High_RIDD
High_XBP1s_Low_RIDD
Low_XBP1s_High_RIDD
Low_XBP1s_Low_RIDD
High_XBP1s_High_RIDD
High_XBP1s_Low_RIDD
Low_XBP1s_High_RIDD
Low_XBP1s_Low_RIDD
High_XBP1s_High_RIDD
High_XBP1s_Low_RIDD
Low_XBP1s_High_RIDD
Low_XBP1s_Low_RIDD
High_XBP1s_High_RIDD
High_XBP1s_Low_RIDD
Low_XBP1s_High_RIDD
Low_XBP1s_Low_RIDD
High_XBP1s_High_RIDD
High_XBP1s_Low_RIDD
Low_XBP1s_High_RIDD
Low_XBP1s_Low_RIDD
High_XBP1s_High_RIDD
High_XBP1s_Low_RIDD
Low_XBP1s_High_RIDD
Low_XBP1s_Low_RIDD
High_XBP1s_High_RIDD
High_XBP1s_Low_RIDD
Low_XBP1s_High_RIDD
Low_XBP1s_Low_RIDD
NU
SA
P1
PR
KC
AR
OB
O1
SK
IV2
L2
SM
C4
SP
CS
3T
AR
DB
PT
NX
B
gene expression
High_XBP1s_High_RIDD
High_XBP1s_Low_RIDD
Low_XBP1s_High_RIDD
Low_XBP1s_Low_RIDD
High_XBP1s_High_RIDD
High_XBP1s_Low_RIDD
Low_XBP1s_High_RIDD
Low_XBP1s_Low_RIDD
High_XBP1s_High_RIDD
High_XBP1s_Low_RIDD
Low_XBP1s_High_RIDD
Low_XBP1s_Low_RIDD
High_XBP1s_High_RIDD
High_XBP1s_Low_RIDD
Low_XBP1s_High_RIDD
Low_XBP1s_Low_RIDD
High_XBP1s_High_RIDD
High_XBP1s_Low_RIDD
Low_XBP1s_High_RIDD
Low_XBP1s_Low_RIDD
High_XBP1s_High_RIDD
High_XBP1s_Low_RIDD
Low_XBP1s_High_RIDD
Low_XBP1s_Low_RIDD
High_XBP1s_High_RIDD
High_XBP1s_Low_RIDD
Low_XBP1s_High_RIDD
Low_XBP1s_Low_RIDD
High_XBP1s_High_RIDD
High_XBP1s_Low_RIDD
Low_XBP1s_High_RIDD
Low_XBP1s_Low_RIDD

88
Correlation of IRE1 activity and metastasis in melanoma in vivo.
The global analyses of the data obtained in this thesis suggest that IRE1 can
suppress cell migration and invasion of metastatic melanoma cells through its
RNase activity, probably through RIDD. As shown before, RIDD activity appears to
be decreased in metastasis compared with primary tumors (Figure 12B), which
supports the hypothesis that this signaling could be acting as a tumor suppressor
for melanoma metastasis. Base on this, the next step for our research was to
evaluate in vivo, in a more complex and complete process, such as metastasis, the
observations obtained from the in vitro experiments and bioinformatic analysis.
As part of the specific aim 3, we planned an in vivo assay to evaluate the
generation of lung metastasis using the tail vein injection method in eight-weeks old
male NSG mice. NSG mice lack T, B, functional NK cells as well as both alleles of
the IL2 receptor common gamma chain, thus lacking cytokine signaling through
multiple receptors (167). The severe immunodeficiency of NSG mice allows good
engraftment rates of tumors with cell from human origin (167). Thus, the use of this
animal strain is the best model to evaluate metastasis of human cell lines.
To set up the number of cells necessary to perform a pulmonary metastasis
assay, we injected 25.000, 50.000 and 100.000 parental A375-MA2 cells through
the tail vein of immunocompromised mice. The animals were immobilized to
proceed with an injection of 200 µL of a suspension of tumor cells in PBS in the tail
vein. After 28 days of implantation the animals were sacrificed and the lungs were
collected, fixed in PFA 4%, and paraffin-embedded for histologic analysis using H&E
staining (Figure 8). The number of metastatic nodules was determined through the
analysis of the images from serial section of H&E staining of lungs using the ImageJ

89
software. We observed metastatic nodules in all conditions, and the number of the
nodules was proportional to the number of the cell injected. For further experiments,
we decided to use 25,000 cells since we obtained an amount of lung metastasis
easier to analyze and to determine differences between conditions (Figure 31).
Figure 31. Standardization of A375-MA2 lung metastatic model by tail vein injection.
Left panel: Different amounts of A375-MA2 parental cells were re-suspended in 500 μL saline solution (0.9% NaCl) and injected intravenously into eight-week-old male NSG mice. On day 28 post-inoculation, lungs were collected and fixed with PFA 4% and processed for immunohistochemistry and stained with H&E. Right panel: The number of metastatic nodules was quantified using the ImageJ software. Data represents one independent experiment and one mouse per condition.
After we stablished the metastatic assay, we continued using the IRE1
deficient cells. For this, 25,000 Control or IRE1KO cells were injected in
immunocompromised mice, and after 28 days we evaluate the presence of lung
metastasis as described previously. Mice weight was weekly monitored and
analyzed at the end of the experiment. Interestingly, no changes in the weight of the
animals were observed during the experiment (Figure 32A). All the mice injected
with the human metastatic cell lines presented metastatic nodules in the lungs
(Figure 32B, representative images); however, not statistical differences were
obtained between Control and IRE1KO individual clones (Figure 32C, left panel). Of
note, the lungs of mice injected with IRE1KO cells analyzed as a group showed an
25 000 cells 50 000 cells 100 000 cells
25*1
03
50*1
03
100*
103
0
50
100
150
200
No
of
meta
sta
tic f
oci

90
average of 1.3 times more melanoma nodules compare to the Control group, but
still, no significant differences were obtained (Figure 32C, right panel).
The surface area of the metastatic nodules was also determined. When this
data is represented as a histogram of frequency, can be seen that tumors from both
IRE1KO clones have a lower rate in the range that group the smaller tumors (<52
000 µm2), but a higher number of IRE1KO-related metastatic nodules can be
observed in most of the ranges sizes over 52 000 µm2 (Figure 33). Based in this
result we could conclude that IRE1 expression does not play a major role in the
metastatic process in melanoma and that the phenotype observed in cell migration
in vitro, it is not being reproduced in vivo. However, it is important to note that
although this assay it is a common way to experimentally evaluate metastasis in a
in vivo model, is not the best assay since does not reproduce the first stages of the
metastatic process, such as cell migration and invasion.

91
Figure 32. Lung metastasis is independent of IRE1 expression in an experimental metastatic melanoma model.
Controls and IRE1KO A375-MA2 cells (25000) were re-suspended in 500 μL saline solution and injected intravenously into eight-week-old male NSG mice. (A) Mice weight was weakly monitored. (B) At day 28 post-inoculation, lungs were collected and fixed with PFA 4% and processed for immunohistochemistry and stained with H&E. Representative images are shown. (C) The number of metastatic nodules was quantified using the ImageJ software and represented as individual clones (Left panel) or groups (Right panel). Data represent the mean ± s.e.m of at least 1 independent experiment and at least 6 mice per condition. Results were statistically compared using two-way ANOVA followed by Bonferroni's multiple comparisons test (A), one-way ANOVA followed by Dunn’s multiple comparison test (C, Left panel) or two-tailed t-test (C, Right panel). (ns: not statistically significant, p: p value).
B
C
A
5 10 15 20 25 3098
100
102
104
106
108
110
Days post-injection
Bo
dy w
eig
ht
ch
an
ge (
%)
C1
C2
KO1
KO2
ns
C1 C2 KO1 KO20
20
40
60
No
of
meta
sta
tic f
oci
ns
C1
C2
KO1
KO2
Ctrl
IRE1K
O
0
10
20
30
40
50
No
of
meta
sta
tic f
oci
p= 0.1652

92
Figure 33. Frequency distribution of metastatic foci size.
Controls and IRE1KO A375-MA2 cells (25000) were re-suspended in 500 μL saline solution and injected intravenously into eight-week-old male NSG mice. On day 28 post-inoculation, lungs were collected and fixed with PFA 4%, processed for immunohistochemistry, and stained with H&E. The size of metastatic nodules was quantified using the ImageJ software and represented as a relative frequency distribution graph. Data represents 1 independent experiment and at least 6 mice per condition.
The same metastatic assay was used to corroborate the results in a syngeneic
model using the mouse cell line B16F10 in C57BL/6 mice. Standardization of the
number of cells to inject (50,000, 100,000 and 200,000 cells) into 8-12 weeks old
C57BL/6 mice indicates that 100,000 cells is the best amount to visualize tumors
(Supplementary Figure 8). Using this approach, we then 100.000 Control and IRE1
KO B16F10 cells, and at day 21 post-inoculation mice were sacrificed, and the
number of metastatic nodules was quantified in fixed lungs. We observed a trend to
increase the number of metastatic nodules in the mice injected with IRE1KO cells
compared to the control, corroborating the result obtained in the metastatic assay
with human cells, although significant differences were not found (Supplementary
Figure 9).
2 52 102 152 202 252 302 352 402 452
0
20
40
60
80
Metastatic foci area (*103 µm2)
Rela
tive f
req
uen
cy (
%)
C1
C2
KO1
KO2

93
Altogether, we found that IRE1-deficient cells presented a trend to increase
the number of metastatic nodules; however, significant differences were not
observed. Interestingly, analyzing the frequency of the nodules in size ranges, IRE1
deficiency appears to increase the growth of these metastatic lesions. Nevertheless,
the data is not enough to conclude that IRE1 have a role in the metastatic process
of melanoma and further experiments are required. However, these experiments
indicate that the effect of IRE1 in melanoma metastasis is not associated with the
survival of the tumor cells in the circulation, the extravasation, and colonization in
the lungs. Further experiments in models of spontaneous metastasis that include
the first stages of metastasis are needed to corroborate the role of IRE1 in
melanoma metastasis.

94
10. DISCUSSION.
In the last years, the UPR has emerged as a central factor driving malignant
transformation and tumor growth, impacting most hallmarks of cancer (60, 61). IRE1
is the most evolutionary conserved ER stress sensor of the UPR, and its function
on carcinogenesis is still not fully understood. Both endoribonuclease activities,
XBP1 splicing and RIDD, have been associated with tumor progression; however,
the exact impact of each one is still to be uncovered. Also, we recently identified
FLNA as a new IRE1 interactor and revealed a new function of this protein in the
regulation of actin cytoskeleton dynamics, with a significant impact on cell migration.
Despite the growing evidence that indicates that IRE1 is an essential regulator of
tumor progression, the role of the IRE1 branch in metastasis is still ambiguous, and
most of the evidence available is still correlative.
A few reports correlate IRE1 activity with cell migration, invasion and
metastasis. Data from our laboratory indicate that IRE1 can enhance the migratory
capacity of normal cells through the specific regulation of the actin cytoskeleton.
Moreover, IRE1 acts as a scaffold to promote FLNA phosphorylation in S2152
mediated by PKCα and potentiate cell migration, independent of its RNase activity
(93). Nevertheless, some reports indicate that the alternative IRE1 RNase signaling
output, RIDD, may exhibit the opposite effect in certain systems. For instance, in
GBM the IRE1 signaling negatively regulates cell migration and invasion through a
RIDD-mediated mechanism (102, 130, 132, 139). Additionally, it is known that
XBP1s can regulate the expression of genes associated with invasion and EMT
(125, 126). Thus, the role of IRE1 activity in invasion/metastasis is still controversial
and more studies are needed to define its contribution to this process. Altogether

95
IRE1 might impact in cell movement at three different layers: XBP1s, RIDD and
FLNA-dependent mechanisms.
In the initial project, we were particularly interested in elucidating the possible
contribution of the newly described IRE1 signaling through FLNA in cell invasion of
tumor cells and the corresponding effect on metastasis. Therefore, we aimed to
systematically study the role of IRE1 in cell migration and invasion, and the possible
regulation of FLNA function, using in vitro and in vivo approaches. Nevertheless,
our initial hypothesis was refuted based on our findings. Our results support a novel
function of IRE1 as a suppressor of cell movement of human melanoma cell lines
through its RNase activity RIDD.
5.1. IRE1 pathway is activated in melanoma metastasis.
Our purpose in this project was to evaluate the contribution of IRE1 signaling,
initially the IRE1/FLNA axis, in the development of metastasis in melanoma.
Fingerprints of IRE1 branch activation have been found in metastasis of different
types of tumors (118-121); but no report has been described in melanoma.
Therefore, we proposed to evaluate IRE1 activation status in vivo in metastatic
melanoma nodules and human patients’ database. When we performed the in vivo
assay by injecting B16F10 cells in the tail vein or subcutaneously in
immunocompetent mice we observed an increase in XBP1s expression in the
metastatic nodules compared with the adjacent non-tumoral tissue. This is in
agreement with the findings that there is basal IRE1 activation in melanoma cells
(111, 113, 162). However, a comparison between the primary tumor and the
metastatic nodules was not possible since just one primary tumor was obtained.
This approach presented several experimental limitations explained previously. The
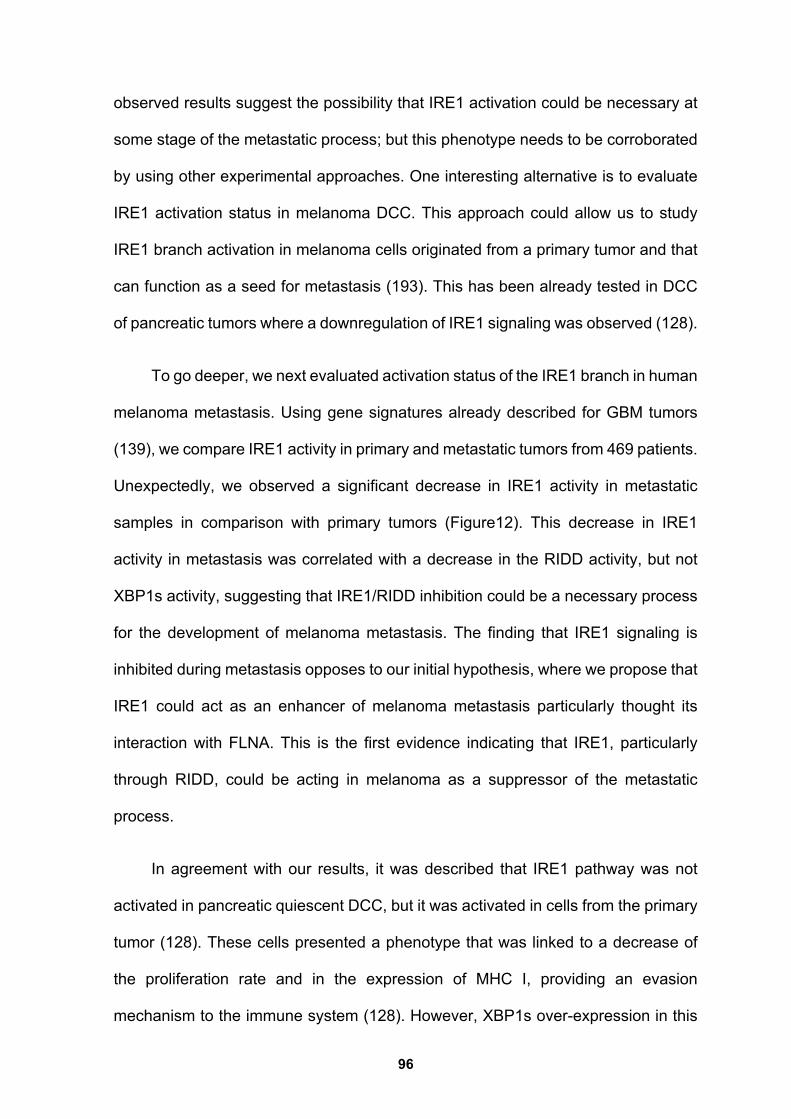
96
observed results suggest the possibility that IRE1 activation could be necessary at
some stage of the metastatic process; but this phenotype needs to be corroborated
by using other experimental approaches. One interesting alternative is to evaluate
IRE1 activation status in melanoma DCC. This approach could allow us to study
IRE1 branch activation in melanoma cells originated from a primary tumor and that
can function as a seed for metastasis (193). This has been already tested in DCC
of pancreatic tumors where a downregulation of IRE1 signaling was observed (128).
To go deeper, we next evaluated activation status of the IRE1 branch in human
melanoma metastasis. Using gene signatures already described for GBM tumors
(139), we compare IRE1 activity in primary and metastatic tumors from 469 patients.
Unexpectedly, we observed a significant decrease in IRE1 activity in metastatic
samples in comparison with primary tumors (Figure12). This decrease in IRE1
activity in metastasis was correlated with a decrease in the RIDD activity, but not
XBP1s activity, suggesting that IRE1/RIDD inhibition could be a necessary process
for the development of melanoma metastasis. The finding that IRE1 signaling is
inhibited during metastasis opposes to our initial hypothesis, where we propose that
IRE1 could act as an enhancer of melanoma metastasis particularly thought its
interaction with FLNA. This is the first evidence indicating that IRE1, particularly
through RIDD, could be acting in melanoma as a suppressor of the metastatic
process.
In agreement with our results, it was described that IRE1 pathway was not
activated in pancreatic quiescent DCC, but it was activated in cells from the primary
tumor (128). These cells presented a phenotype that was linked to a decrease of
the proliferation rate and in the expression of MHC I, providing an evasion
mechanism to the immune system (128). However, XBP1s over-expression in this

97
disseminated cancer cells significantly induced the development of hepatic macro-
metastasis (128). In melanoma models, is well documented the basal activation of
the IRE1 branch and the induction of autophagy in melanoma cells (111, 113, 162).
In addition, fingerprints of activation of the three UPR branches have been described
in melanoma metastatic cells compared to their non-metastatic counterpart (165).
Importantly, regarding IRE1 activity juts downstream targets of the XBP1s axis was
evaluated, supporting our findings that the particular branch of XBP1s could be
activated in metastasis in comparison with primary tumors. GBM tumors is a
particularly interesting example since different axis of IRE1 can actually exert
opposite outcome in the same type of tumor (102, 130, 132, 139).
Altogether this evidence suggests that the IRE1 branch could be a relevant
pathway during the metastatic process, perhaps exerting opposite roles depending
on the stage of the metastatic cascade; however, more experiments are needed to
corroborate this hypothesis.
5.2. IRE1 a novel suppressor of melanoma cell migration and invasion.
Our results involve the comprehensive study of four human cell lines where
the non-metastatic cell line A375 was included for comparative purpose.
Interestingly, the A375-MA2, one of the three highly metastatic cell lines, is derived
from A375 using an in vivo selection process in mice.
Boyden chamber assays in cells showed that IRE1 silencing enhanced cell
migration in metastatic human cell lines. This result was only observed in the
metastatic melanoma cells since no changes were obtained in the non-metastatic
melanoma cell line A375, suggesting that IRE1 alone cannot impact in cell migration
but requires additional components that are present in metastatic cells. To further

98
corroborate our results in metastatic melanoma cells, we generated IRE1KO cells
by using CRISPR/Cas 9 technology in the metastatic cell line A375-MA2 cells.
Under this experimental condition, we observed the same results in Boyden
chambers and invasion assays in presence of matrigel. The effect on cell invasion
was lower than the one observed in cell migration.
These results suggest that IRE1 may be suppressor of a cell
migration/invasion-mechanism relevant only in melanoma metastatic cells. In other
types of cancer, IRE1 deficiency exert the opposite effect in cell migration and
invasion than the one we obtained. For instance, in colorectal cancer, breast cancer
and esophageal squamous cell carcinoma the knockdown of IRE1 or XBP1s impairs
cell migration and invasion through a mechanism XBP1-dependent (118-124). Until
now, only in GMB-derived cell lines, IRE1 have shown to suppress cell invasion.
Importantly, in all this type of tumors high expression or activity of IRE1 correlates
with low overall survival and disease-free survival rates (119-124, 139).
Of note, main cause of death in melanoma patients is the spreading of the
tumor to different organs (194). In a previous study, comparison between non-
metastatic and metastatic patient-derived melanoma cells lines showed an
activation of the three UPR branches in metastatic compared to non-metastatic
cells; however, only the induction of the ATF6 and PERK branches was associated
with poor survival in melanoma patients (165). Interestingly, HERPUD1, a
downstream target of the IRE1, showed better prognosis for melanoma patients
when it was highly-expressed (165). To determine the relevance of IRE1 expression
in melanoma metastasis, we selected an experimental model of metastasis,
consisting of the lateral tail vein injection of human metastatic melanoma cells in
NSG mice or mouse metastatic melanoma cells in immunocompetent mice.

99
Although our in vitro data support that IRE1 can act in the suppression of cell
migration, we did not find significant differences regarding the number of metastatic
nodules in the lungs between the IRE1KO and Control metastatic melanoma cells.
The direct role of IRE1 in the generation of metastasis has been poorly
characterized and there is not data available in melanoma. Only three studies have
demonstrated a correlation between IRE1 activity and metastasis, all of them
showing that IRE1 can acts as an enhancer of metastasis mediated by XBP1s: (i)
in breast cancer cell was observed that orthotopic injection of XBP1 deficient cells
decreased the formation of lung metastasis (99), (ii) IRE1 knockdown in colon
cancer cells significantly inhibited the generation of spontaneous liver metastases
(180) and (iii) overexpression of XBP1s in hepatocellular cancer cells induced an
increase in the number of micrometastatic lesions in the lungs after six weeks of tail
vein injection of the tumor cells (123). Altogether, these reports indicate that the
IRE1/XBP1s branch acts as a promoter of metastasis. Our data suggests that IRE1
could act in melanoma as a suppressor of metastasis, during the first stages of the
metastatic cascade and perhaps by a different branch than XBP1s.
An explanation of the low effect of IRE1 deficiency in metastasis in our
experiments could be that the chosen in vivo model is not adequate to evaluate the
mechanism regulated by IRE1 in melanoma. The chosen experimental model of
metastasis (direct delivery of tumor cells in the circulation) is an excellent strategy
as a first approach, since allows the control of the number of cells delivered,
excluding the effect of primary tumor growth. However, this type of experiment has
a series of limitations such as (i) due to the artificial route of delivery is possible to
evaluate just the capacity of tumor cells to growth in the lungs and (ii) it is not
possible to recapitulate the first steps of the metastatic cascade, such as the initial

100
growth and migration/invasion stages, together with the intravasation into the
circulation (195, 196). A new metastatic model has emerged where orthotopic
transplantation of tumor cells with primary tumor resection allow the formation of
spontaneous metastasis and recapitulate all the steps in the metastatic process.
Nevertheless, the main issue about this new model is that requires a longer time for
the metastatic disease to become evident. For instance, subcutaneous injection of
a melanoma cell line, WM239 require 4-6 month for the formation of visible
metastatic nodules after tumor resection (197). We consider that besides the
complexity of this experimental model, the evaluation of the effect of IRE1 depletion
in a spontaneous metastatic could be relevant to test our hypothesis.
In contrast to most of the literature in several types of tumors where IRE1 acts
as an enhancer of metastasis, our results shown that IRE1 can acts as a suppressor
of cell migration and invasion at least in metastatic melanoma cell lines. Also, we
observed that IRE1 RNase activity, particularly RIDD, is decreased in metastasis
compared with primary tumors. However, further experiments to fully uncover the
role of IRE1 in melanoma metastasis are needed.
5.3. The suppressor effect of IRE1 in cell migration is independent of
Filamin A.
IRE1 has two main mechanisms to control migration/invasion, the control of
gene expression through its RNase activity (XBP1/RIDD), and the modulation of
signaling pathways through direct binding with proteins, like FLNA. As we
mentioned before, we recently described in non-tumor cells that IRE1 acts as a
scaffold protein to recruit FLNA and increases its phosphorylation at serine 2152
mediated by PKCa, enhancing cell migration (93). FLNA is an actin crosslinking

101
protein, and its function is mainly regulated at the S2152 phosphorylation level
(142). Remarkably, FLNA phosphorylation is mediated and regulated by different
protein kinases (144-146). FLNA is also regulated through the cleavage by calpains
generating a 200 kDa N-terminal and a 90 kDa C-terminal fragments (147).
Importantly, this cleavage is inhibited by the serine 2152 phosphorylation (148). The
90kDa fragment translocate to the nucleus and interacts with transcription factors,
such as the androgen receptor, and has been recently associated with novel
functions like the regulation of gene expression (148).
FLNA has been related to tumor progression, particularly to the enhancement
of tumor cell migration capacity and metastasis (198-200). However, this protein can
also act as a tumor suppressor, depending on its subcellular localization and its
binding partners. Some controversial results suggest that proteolytic regulation of
FLNA by calpains and generation of the 90 kDa fragment might suppress metastasis
(reviewed in (150)). Recent findings indicate that FLNA negatively regulates cancer
cell invasion promoting MMP9 degradation (158, 159) and decrease cell invasion
and migration through the regulation of focal adhesions via calpain-dependent
mechanism in breast cancer models (160). Based on this evidence, some authors
hypothesize that proteolysis and nuclear fragment of FLNA suppress cell migration,
while S2152 phosphorylation and cytoplasmic localization of full length FLNA
promotes cancer metastasis.
To rule out the possibility that IRE1 could be suppressing cell migration
through a mechanism FLNA-dependent, we evaluated the effect of FLNA
expression on cell migration in metastatic melanoma cells. Depletion of FLNA by
siRNA showed a non-significant increase of cell migration of parental A375-MA2
cells. In melanoma models, FLNA have been mainly correlated with migration and

102
invasive properties. On one side, depletion of FLNA in melanoma cell lines
significantly reduces migration and invasion in vitro (198-200). On the other side,
using genetic and pharmacological approaches was demonstrated that in
melanoma cells FLNA can mediates transcriptional downregulation of MMP9 by
suppressing constitutive activation of RAS/MAPK signaling pathways (201). Thus,
further experiments are needed in our cellular model to corroborate the role of FLNA
in cell invasion. All this evidence shown that the role of FLNA in cell migration and
invasion in melanoma is still controversial.
In our experimental model we were not able to demonstrate the interaction of
IRE1 and FLNA at basal conditions in human or mouse melanoma cells,
nevertheless additional experiments are required to discard this interaction. In
addition, we also evaluated if FLNA phosphorylation mediated by IRE1 could
suppress cell migration and could be a potential mechanism to explain our
phenotype. To this aim, we evaluated the induction of FLNA phosphorylation in the
presence or absence of IRE1 and pro-migratory stimuli such as FBS or NIH-CM. In
our model, the induction of FLNA phosphorylation by FBS was independent of IRE1
expression. Treatments with NIH-CM and TM failed to induce FLNA phosphorylation
in A375-MA2 cells. Therefore, FLNA phosphorylation at S2152 in melanoma cells
seems to be independent of IRE1 expression. This suggest that the modulation of
FLNA signaling through IRE1 might not be relevant in melanoma cells.
Despite these findings, we decided to evaluate other cellular processes
regulated by FLNA, like actin cytoskeleton dynamics and cell adhesion. Our results
suggest that deficiency of IRE1 did not induce changes in the actin cytoskeleton or
cell adhesion of human metastatic melanoma cells. Of note, our experiments were

103
performed in absence of ECM or any migratory stimulation, thus further experiments
or approaches might be required to really prove this issue.
Altogether our results showed a trend of increased cell migration in FLNA-
deficient cell; however, non-significant differences were observed. Also, we were
not able to demonstrate an interaction between the two proteins and S2152 FLNA
phosphorylation was independent of IRE1 expression that correlates with no
changes in actin cytoskeleton and cell adhesion. Nerveless, based on the previous
data FLNA appears to be an enhancer of cell migration in melanoma. In conclusion,
our findings in human melanoma cell lines indicate that suppression of cell
migration/invasion by IRE1 happens by a mechanism independent of FLNA.
5.4. The RNase activity is required for IRE1-dependent suppression of cell
migration.
Since IRE1 was not regulating melanoma cell migration through the FLNA
axis, we evaluated if the RNase activity of IRE1 was responsible for the phenotype
observed in our model. Using the potent and selective IRE1 RNase inhibitor, MKC-
8866, a significant increase in migration of A375-M2 cells was observed upon full
inhibition of IRE1 RNase activity. These results suggested that IRE1 RNase activity
was responsible for the suppression of metastatic melanoma cell migration.
As mentioned before, both IRE1 RNase activities have been linked to cell
migration and invasion of tumor cell (Reviewed in (117)). This scenario in melanoma
cells open several possibilities. On one side, a role for the IRE1/XBP1s axis as an
enhancer of metastasis has been proposed. XBP1s has been mainly associated
with the induction of the expression of several EMT transcription factors in
colorectal, oral, hepatocellular and breast tumors (118, 119, 121, 123-126). Also,

104
elevated levels of XBP1 at primary tumors correlates with the presence of distant
metastasis in patients with different types of cancer like esophageal carcinoma,
hepatocellular carcinoma, and oral squamous cell carcinoma (122-124). Basal
XBP1s expression has been described in TNBCs and has a key role on
tumorigenicity and tumor dissemination through a heterodimer formed by XBP1s
and HIF1α that promote HIF1α-regulated genes expression by the recruitment of
RNA polymerase II (99). Importantly, it is well documented that HIF1α transcriptional
program play a key role in the metastatic cascade regulating process like EMT,
extravasation and metastatic niche formation (202). In melanoma cells, it was found
that XBP1s acts as a transcription factor that robustly enhances IL-6 expression, a
cytokine that drives melanoma cell motility through p38α-MAPK-dependent
mechanism (203, 204). Supporting this evidence found in other types of cancer, our
results showed that cell migration in human metastatic melanoma cells is
independent of XBP1s expression, thus another mechanism derived by the RNase
domain of IRE1 is responsible for the suppression of cell migration/invasion.
11.4.1 RIDD as a possible mechanism for the increased migration/invasion in
IRE1-deficient melanoma cells.
In contrast with what has been described in most types of tumors, IRE1
negatively modulates cell migration and invasion in GBM, similar to what we
observed in metastatic melanoma cells (98, 102, 129-132). In glioma cells, gene
expression profile revealed that loss of IRE1 activity resulted in the up-regulation of
extracellular matrix proteins (98, 130). One of these proteins was SPARC, a non-
structural glycoprotein present in the extracellular matrix that is associated with
changes in cell shape, synthesis of ECM and cell migration and whose mRNA is a
direct target of RIDD activity (130). Similar to glioblastoma, the degradation of an

105
mRNA that encodes for a cell migration/invasion-enhancer could explain the
mechanism through which IRE1 suppresses cell migration/invasion in metastatic
melanoma cells.
Based on this, we decided to determine possible mRNAs enhancers of cell
migration/invasion and metastasis in melanoma that could be regulated by RIDD in
our model. To this aim, we used a list intersection-base strategy to detect genes
that have been identified as potential RIDD targets and that have been associated
with pro-metastatic capacities in melanoma using different published datasets (139,
192). This analysis identified 39 putative RIDD targets with potential pro-invasive
role in melanoma, but only 16 of them were identified with a negative impact in
survival in patients with melanoma. When we classified the group of patients with
melanoma tumors in different populations displaying either High or Low RIDD and
XBP1s activity we observed interesting findings. A strong correlation between the
low expression levels of these genes in melanoma tumors and a high RIDD activity
was observed, suggesting the possibility that these mRNAs could be RIDD targets.
Tumors exhibiting high RIDD activity correlated with lower expression levels of at
least nine genes associated with melanoma metastasis.
Interestingly, one of these genes was PRKCA that codifies for PKCα. As we
mentioned before, IRE1-dependent FLNA phosphorylation is mediated by PKCα
(93). Thus, the possibility that in metastatic melanoma cells PKCα is degraded by
IRE1/RIDD activity could explain why in our metastatic cell lines we do not observe
an induction of FLNA phosphorylation in S2152 dependent of IRE1 and we have an
increase in cell migration and invasion with IRE1 depletion. Supporting this, another
member of the PKCα family has already been identified as a RIDD target. Oikawa
et al., combining an in vitro cleavage assay with microarray analysis, identified a

106
consensus sequence accompanied by a stem-loop structure present in 13 novel
targets, between them PKCδ (205).
Since the 1980s, PKCα was identified as a protein involved in the
carcinogenesis of skin tumors (206), a connection that has been studied deeply in
the last years. The evidence available indicates that in melanoma progression,
PKCα is mainly implicated with an increase of cell migration, invasiveness, and a
de-differentiation (191, 207-211). For instance, data obtained in melanoma cells
showed that cell motility is derived by a PKCα/JNK-dependent mechanism (207).
Importantly, in another study where PKCα was found as a protein involved in
melanoma metastasis, expression levels of this protein were significantly higher in
metastatic melanoma compared with primary melanoma tumors. The dependence
of PCKα for cell migration/invasion in metastatic melanoma cells could be higher
than in non-metastatic cells (191). These results support our new hypothesis since,
in our model, IRE1 regulates cell migration/invasion only in the metastatic cell lines.
Another interesting target gene that was found in our analysis was ROBO1
that codes for the transmembrane receptor Roundabout receptor (Robo1). Activated
signaling of slit glycoprotein (Slit)/Robo1 plays an important role in angiogenesis
and cell migration, and have been described to be involved in physiological and
pathological processes, including cancer (reviewed in (212). Robo1 is highly
expressed in tumor cells, and its role in metastasis have been documented in
different types of cancer such as colorectal carcinoma, glioblastoma and
hepatocellular carcinoma (213-215). Importantly, analysis of the expression profile
of melanoma tumors identified Robo1 as a marker that predict progression to
metastasis (216).

107
In addition, between the possible RIDD targets we found the TARDBP gene,
that codes for the transactive response DNA-binding protein-43 (TDP-43), a
ribonucleoprotein able to bind DNA and RNA molecules. This protein has been
proposed as a therapeutic target for cancer, since regulates cell proliferation,
migration and invasion of tumor cells (217, 218). Also, TDP-43 have been identified
as an oncogene in melanoma, regulating proliferation and metastasis potentially
through modulation of glucose metabolism (219). Interestingly, mutation of TDP-43
have been associated with alteration in the UPR machinery in affected neurons
(220).
In summary, IRE1, possibly mediated by RIDD, may be an important
suppressor of cell migration and invasion in melanoma cells, and exerts this
effect through a mechanism only relevant in cells with high metastatic potential.
Importantly, the IRE1-dependent suppression of cell migration, and possibly also
invasion, could be mediated by RIDD activity through the degradation of mRNAs of
oncogenes associated with the metastatic process in melanoma, such as PKCα,
Robo1 and TDP-43. However, future experiments are needed to confirm our
candidates.
Our results indicate that IRE1 RNase activity inhibition by specific drugs
increase cell migration. Several reports indicate that targeting IRE1 activity affects
cancer progression in different models of multiple myeloma, breast and ovarian
cancer, and glioblastoma (107, 108, 139, 221-223). This suggests that IRE1
inhibition might be a suitable target for these types of tumors. The first model where
IRE1 activity inhibition was evaluated was multiple myeloma. It is known that
malignant plasma cells depend on IRE1/XBP1 signaling to cope with the high
demand in protein secretion, and treatment with RNase inhibitors like 4μ8C and

108
MKC-2946 have shown to significantly inhibit tumor growth (107, 108). Also, in a
xenograft mouse model of TNBC, inhibition of IRE1 activity by MKC- increased
paclitaxel and tamoxifen-mediated tumor suppression (221, 222). Nevertheless,
based in our results targeting IRE1 RNase activity might not be the best option in
melanoma since it might have adverse effects by promoting migration/invasion and
perhaps metastasis.
Figure 34. Regulation of melanoma cell movement by the IRE1 and RIDD axis: Proposed model.
Tumor cells are exposed to several intrinsic and extrinsic perturbations that can alter the proper functioning of the endoplasmic reticulum (ER), altering protein homeostasis, and engages unfolded protein response (UPR). IRE1 signaling, the most evolutionary conserved sensor from the UPR, presents a basal activation in melanoma cells favoring autophagy and cell death resistance (111, 113). Our results showed that in metastatic melanoma cells, the IRE1 branch, particularly mediated by the RIDD activity, degrade mRNAs that code for oncogenes associated with pro-migratory and pro-invasive properties in melanoma, inhibiting cell movement. However, the role of the IRE1/RIDD axis in the metastatic process in melanoma is still unknown and needs to be evaluated deeper.
IRE1a
ER
Cytosol
Luminal
Kinase
RNAse
P P
RIDD
METASTATIC MELANOMA CELL
mRNAs pro-metastatic genes
FLNA
P P XBP-1 mRNA
intronRTCB
mRNAmiRNA
XBP-1s mRNA
Cell movement
Actin cytoskeleton remodeling
IRE1⍺

109
11. CONCLUSIONS.
This thesis uncovered a novel function of IRE1 in the regulation of human
metastatic melanoma cell migration through an RNase activity-dependent
mechanism. The results obtained are the first evidence showing a role of IRE1 in
metastasis-related processes in melanoma cells, such as cell migration and
invasion. The most relevant results obtained lead us to conclude that:
• By using genetic approaches, we found that deficiency of IRE1 expression
enhances cell migration and invasion of human metastatic melanoma cell lines,
indicating that the IRE1 branch could be acting as a suppressor of cell migration
and invasion in metastatic melanoma cells.
• Opposite to what we initially proposed, our results indicate that regulation of cell
migration and invasion by IRE1 in melanoma cells is a FLNA-independent
process.
• Specific pharmacological inhibition of the IRE1 RNase activity showed that the
RNase activity is required for IRE1-dependent suppression of cell migration in
metastatic melanoma cells. Since overexpression of XBP1s does not affected
cell migration, we postulate RIDD as the mayor mechanism involved in the
suppressor function of IRE1. We identified several pro-metastatic mRNAs that
could be target of RIDD as a possible mechanism for the regulation of migration
and invasion in metastatic melanoma cells.
In summary, this Ph.D. thesis has uncovered a novel role of IRE1 as a
suppressor of cell movement in human metastatic melanoma cells, in vitro, where
the RNase activity mediated by RIDD operates a mechanism that degrades pro-
metastatic genes in melanoma.

110
12. SUPPLEMENTARY FIGURES.
Supplementary Figure 1. Standardization of metastatic lung model by tail vein injection using human metastatic cell lines.
Twenty-five thousand cells of A375-MA2, A2058, or SK-MEL 5 were re-suspended in 500 μL saline solution (0.9% NaCl) and injected intravenously into eight-weeks old male NSG mice. At day 28 post-inoculation, lungs were collected and fixed with PFA 4% and processed for immunohistochemistry and stained with H&E. Pictures represents 1 independent experiment and 1 mouse per condition.
A375-MA2 A2058 SK-MEL 5

111
Supplementary Figure 2. Standardization of the transmigration assay.
B16F10 mouse melanoma cells (2 x 10⁴) were plated on Fibronectin-coated transwell plates. Transmigration was assessed in the presence of FBS, or NIH 3T3 conditioned medium (NIH-CM). After 6h, cells that migrated to the lower side were stained with crystal violet. Images of the lower side of the transwell were taken. Data represent 1 experiment.
3% FBS 10% FBS 20% FBS NIH-CM

112
Supplementary Figure 3. Characterization of IRE1KO B16F10 cells.
IRE1KO B16F10 cells were generated using CRISPR/Cas9 technology. (A) Top panel: The levels of IRE1 in the WT, Control, and IRE1KO B16F10 were evaluated by western blot using a specific antibody against IRE1 and HSP90. Bottom panel: WT, Control, and IRE1 KO B16F10 cells were treated with 500 ng/mL of Tm for 8h, and then XBP1 mRNA splicing was evaluated by RT-PCR. PCR fragments corresponding to the XBP1u or XBP1s forms of XBP1 mRNA are indicated. (B) Viable WT, Control, and IRE1KO B16F10 were counted for four days to generate the growth curves. The cells were stained with 200 ng/mL of Hoechst and counted on an ArrayScan XTI Live High Content Platform. Results were statistically compared using two-way ANOVA followed by Bonferroni's multiple comparisons test. (ns: not statistically significant).
BA
Ctrl
- +
IRE1KO
- + Tm:
xbp1s
xbp1u
IRE1
Hsp90
kDa
- 100
- 90
WT
Ctrl
IRE1K
O
0 1 2 3 40
1×10⁴
2×10⁴
3×10⁴
Time (d)
Pro
life
rati
on
(N
o o
f cells)
WT
Ctrl
IRE1KO
ns

113
Supplementary Figure 4. IRE1 deficiency do not affect cell migration in a mouse metastatic melanoma cell line.
Left panel: Control and IRE1KO B16F10 cells were seeded on fibronectin-coated transwell plates, and transmigration was assessed. The conditioned medium from NIH 3T3 was used as a chemoattractant. After 6h, cells that migrated to the lower side were stained with crystal violet. Images of the lower side of the transwell were taken. Right panel: The number of cells that invaded was counted using the ImageJ software. Data represent the mean ± s.e.m of 6 independent experiments. Results were statistically compared using a two-tailed t-test. (ns: not statistically significant).
B16F10
Ctrl
IRE1KO
0.0
0.5
1.0
1.5
Ctrl
IRE1K
O
Tra
nsm
igra
tio
n (
Fo
ld c
han
ge)
ns

114
Supplementary Figure 5. IRE1 deficiency increase filopodia formation.
WT, Control and IRE1KO B16F10 cells were transiently transfected with a plasmid coding for the fluorescent protein Life-Act. Cells were plated onto fibronectin coated plates and recorded by time-lapse confocal microscopy every 30 s for 5 min. (A) The number of filopodia per cell (B) and the filopodia size (C) was determined using ADAPT software. Data represents the mean ± s.e.m of 2 independent experiments.
BA
WT
Ctrl
IRE1K
O
0.0
0.1
0.2
0.3
0.4
Filo
po
dia
siz
e (µ
m)
WT
Ctrl
IRE1K
O
0
10
20
30
N o
f F
ilo
po
dia
per
cell

115
Supplementary Figure 6. IRE1 deficiency increase actin cytoskeleton dynamics in mouse metastatic melanoma cells.
(A) WT, Control, and IRE1KO B16F10 cells were transiently transfected with a plasmid coding for the fluorescent protein Life-Act. Cells were plated onto fibronectin-coated plates and recorded by time-lapse confocal microscopy every 30 s for 5 min. Representative images are shown. Segmentation was used to obtain protruding areas and retracting areas. The velocity of protrusions (B) and retractions (C) and the average signal overtime of the protruding cell area (D) or the retracting cell area (E) were determined. Data represent the mean ± s.e.m of 2 independent experiments
A B C
D E
WT
Control
IRE1KO
0 200 400 600
-0.225
-0.150
-0.075
0.000
Time (seg)
Retr
acti
on
Velo
cit
y (µ
m/m
in)
WT Ctrl IRE1KO
WT Ctrl IRE1KO
0 200 400 600
0.00
0.05
0.10
0.15
0.20
Time (seg)
Pro
tru
sio
n V
elo
cit
y (µ
m/m
in)
WT
Ctrl
IRE1K
O
0.00
0.05
0.10
0.15
Mean
Pro
tru
sio
n V
elo
cit
y
(um
/min
)
WT Ctrl KO
-0.15
-0.10
-0.05
0.00
Mean
Retr
acti
on
Velo
cit
y
(um
/min
)

116
Supplementary Figure 7. Evaluation of IRE1 and FLNA complexes in melanoma cells.
Endogenous interaction between FLNA and IRE1 was analyzed after IRE1 immunoprecipitation in SK-MEL5 (A) and B16F10 (B) cells. A Rabbit heavy chain Ac (A) or IRE1KO cells (B) were used as controls. IgG is shown as a control for the IP. Data represents the analysis of one independent experiment for each cell line. (A) 1: Rabbit Ac Control; 2: Rabbit Ac anti IRE1. (B) KO: IRE1KO cells; C: IRE1 expressing cells, control.
Inexpecific band
IP: IRE1 Input
KO C KO C
IgG
IP: IRE1
WB: FLNA
FLNA – 280
KDa
IP: IRE1
WB: IRE1
IRE1 – 100
KDaIgG
IP: IRE1
WB: FLNA
FLNA – 280
KDa
IP: IRE1 Input
1 2 1 2
IRE1– 100
KDa
IP: IRE1
WB: IRE1
Inexpecific band
BA

117
Supplementary Figure 8. Standardization of B16F10 metastatic lung model by tail vein injection.
Different amounts of B16F10 parental cells were re-suspended in 500 μL saline solution (0.9% NaCl) and injected intravenously into 8-12 weeks old C57BL/6 mice. At day 21, post-inoculation, lungs were collected and fixed with Fekete´s solution. Pictures of the lungs were taken, and representative images are shown. Data represents 1 independent experiment and 1 mouse per condition.
50.000 cells 100.000 cells 200.000 cells

118
Supplementary Figure 9. The formation of lung metastasis in a metastatic melanoma model is independent of IRE1 expression.
Left panel: Control and IRE1KO B16F10 cells (1×10⁵) were re-suspended in 500 μl saline solution (0.9% NaCl) and injected intravenously in 8-12 weeks old C57BL/6 mice. At day 21, post-inoculation, lungs were collected and fixed with Fekete´s solution. Pictures of the lungs were taken, and representative images are shown. Right panel: The number of metastatic nodules was quantified using the ImageJ software. Data represent the mean ± s.e.m of at least 1 independent experiment and at least 7 mice per condition. Results were statistically compared using a two-tailed t-test. (ns: not statistically significant).
B16F10
Ctrl
IRE1KO
Ctrl
IRE1K
O
0
10
20
30
No
of
meta
sta
tic f
oci
ns

119
13. PUBLICATIONS
IRE1α controls cytoskeleton remodeling and cell migration
through a direct interaction with Filamin A.
Nat Cell Biol. 2018 Aug;20(8):942-953.
Foreword
In this paper, we characterized a novel mechanism underlying IRE1 function,
where this protein acts as a scaffold to recruit FLNA and increases its
phosphorylation at serine 2152, enhancing cell migration. We have used an
interactome screening to identify FLNA as a major IRE1-binding partner. FLNA is
an actin-crosslinking protein involved in cytoskeleton remodeling and cell migration.
The activity of FLNA in cytoskeleton dynamics depends on its phosphorylation at
serine 2152, and our results indicate that IRE1 facilitates FLNA phosphorylation to
control actin cytoskeleton and cell migration through PKCα. Remarkably, this new
IRE1-function in cell migration was independent of IRE1 enzymatic activities but
required its dimerization. Besides fibroblasts, this was also observed in various in
vivo models such as zebrafish, drosophila, and mouse models, suggesting a
conserved mechanism in evolution.
Contribution
The author of this thesis participated in the experimental design, conducted
experiments, and analyzed the data of a siRNA screening that suggested a possible
role of IRE1 in tumor cell migration. This experiment was performed with six cell
lines originated from different types of tumors and cell migration was analyzed by
performing transmigration assays. She also evaluated the contribution of PERK in

120
cell migration by inhibiting its activity with GSK2606414. The results obtained from
this experiment suggested that the effects of IRE1 in cell migration were
independent of PERK signaling. She also collaborated in the execution of other
experiments and the final revision of the manuscript.

ARTICLEShttps://doi.org/10.1038/s41556-018-0141-0
1Biomedical Neuroscience Institute, Faculty of Medicine, University of Chile, Santiago, Chile. 2Center for Geroscience, Brain Health and Metabolism (GERO), Santiago, Chile. 3Program of Cellular and Molecular Biology, Institute of Biomedical Sciences, University of Chile, Santiago, Chile. 4Department of Biology, Faculty of Sciences, University of Chile, Santiago, Chile. 5Program of Anatomy and Developmental Biology, Institute of Biomedical Sciences, University of Chile, Santiago, Chile. 6Center for Genome Regulation, Faculty of Sciences, University of Chile, Santiago, Chile. 7Center for Integrative Biology, Faculty of Sciences, Universidad Mayor, Santiago, Chile. 8Department of Neuroscience, Faculty of Medicine, University of Chile, Santiago, Chile. 9Department of Molecular and Integrative Physiology, Division of Metabolism, Endocrinology and Diabetes, The University of Michigan Medical School, Ann Arbor, MI, USA. 10INSERM U1242 Chemistry, Oncogenesis, Stress and Signaling, University of Rennes 1, Rennes, France. 11Centre de Lutte contre le Cancer Eugène Marquis, Rennes, France. 12Division of Cell Medicine, Department of Life Science, Medical Research Institute, Kanazawa Medical University, Uchinada, Japan. 13The Buck Institute for Research in Aging, Novato, CA, USA. 14Department of Immunology and Infectious Diseases, Harvard School of Public Health, Boston, MA, USA. *e-mail: [email protected]
The ER is the largest intracellular organelle and is involved in protein synthesis, folding and secretion. A series of physio-logical and pathological conditions favour the accumulation
of misfolded proteins at the ER lumen, resulting in a cellular state known as ER stress1. To cope with misfolded proteins, cells engage a dynamic signalling pathway known as the UPR2. In vertebrates, the UPR has evolved towards the establishment of a network of inter-connected signalling cascades initiated by three types of transduc-ers known as inositol-requiring enzyme 1 (IRE1) alpha and beta, activating transcription factor-6 (ATF6) alpha and beta, and pro-tein kinase RNA (PKR)-like ER kinase (PERK). The UPR controls specific transcription factors that feedback to restore proteostasis1 or activate apoptotic programmes3. ER stress is also emerging as a relevant factor driving diverse pathological conditions, including cancer, diabetes, inflammatory diseases and neurodegeneration4,5.
IRE1α is a serine/threonine protein kinase and endoribonuclease that catalyses the unconventional processing of the messenger RNA encoding X-box binding protein 1 (XBP1), resulting in the expres-sion of an active transcription factor (XBP1s) that enforces adap-tation programmes6,7. In addition to the classical role of IRE1α as
an ER stress mediator, a series of novel physiological outputs of the pathway have been reported that are dependent on XBP1s and affect cell differentiation, angiogenesis and energy metabolism2. IRE1α signalling is tightly regulated by the assembly of protein complexes that fine-tune its activity, a platform referred to as the UPRosome8. Thus, defining the IRE1α interactome may reveal unexpected func-tions to delineate the significance of the UPR in cell physiology.
Here, we performed a protein–protein interaction screen and identified filamin A as a major IRE1α binding partner. Filamin A is involved in crosslinking polymerized actin and has a crucial role in adhesion, cell morphology and migration9. We demonstrate that the IRE1α –filamin A axis regulates actin cytoskeleton dynamics and cell movement. Unexpectedly, this function of IRE1α is con-trolled by its dimerization, independent of its canonical signalling as a UPR mediator. We also provide evidence indicating that the regulation of cell migration by IRE1α is disease relevant and evolu-tionarily conserved. Overall, our results reveal an unanticipated site of control of actin cytoskeleton dynamics from the ER, where IRE1α serves as a scaffold to engage filamin A signalling and modulate cell movement.
IRE1α governs cytoskeleton remodelling and cell migration through a direct interaction with filamin AHery Urra1,2,3, Daniel R. Henriquez2,4, José Cánovas1, David Villarroel-Campos2,4, Amado Carreras-Sureda1,2,3, Eduardo Pulgar1,5, Emiliano Molina4,6, Younis M. Hazari1,2,3, Celia M. Limia1,2,3, Sebastián Alvarez-Rojas2,4, Ricardo Figueroa1,3, Rene L. Vidal1,2,7, Diego A. Rodriguez3, Claudia A. Rivera1,2,7, Felipe A. Court2,7, Andrés Couve1,8, Ling Qi9, Eric Chevet10,11, Ryoko Akai12, Takao Iwawaki12, Miguel L. Concha1,2,5, Álvaro Glavic4,6, Christian Gonzalez-Billault2,4 and Claudio Hetz 1,2,3,13,14*
Maintenance of endoplasmic reticulum (ER) proteostasis is controlled by a signalling network known as the unfolded protein response (UPR). Here, we identified filamin A as a major binding partner of the ER stress transducer IRE1α . Filamin A is an actin crosslinking factor involved in cytoskeleton remodelling. We show that IRE1α controls actin cytoskeleton dynamics and affects cell migration upstream of filamin A. The regulation of cytoskeleton dynamics by IRE1α is independent of its canonical role as a UPR mediator, serving instead as a scaffold that recruits and regulates filamin A. Targeting IRE1α expression in mice affected normal brain development, generating a phenotype resembling periventricular heterotopia, a disease linked to the loss of function of filamin A. IRE1α also modulated cell movement and cytoskeleton dynamics in fly and zebrafish models. This study unveils an unanticipated biological function of IRE1α in cell migration, whereby filamin A operates as an interphase between the UPR and the actin cytoskeleton.
Corrected: Publisher Correction
NATURE CELL BIoLoGY | VOL 20 | AUGUST 2018 | 942–953 | www.nature.com/naturecellbiology942

ARTICLESNATURE CELL BIOLOGY
ResultsDirect interaction between filamin A and IRE1α. To identify new IRE1α -interacting proteins we performed a yeast two-hybrid screen using the Matchmaker pretransformed complementary DNA library together with the cytosolic domain of IRE1α (IRE1α -Δ N) as bait. Multiple candidates were found (Supplementary Table 1) to be involved in different biological processes (Supplementary Fig. 1A,B), including COPS5, a known IRE1α binding partner10. Among the top ten candidates selected on the basis of the growth index, filamin A presented the strongest interaction (Fig. 1a). Filamin A is an actin-binding protein involved in the orthogonal crosslinking of polymerized actin9. It is composed of 24 IgG-like repeats, containing several domains including the CH2 domain, Rod1 and Rod2, and an IgG-like 24 repeat involved in filamin A dimerization11. All clones selected corresponded to the carboxy-terminal portion of filamin A (Fig. 1b,c).
To validate our findings, we transfected HEK293T cells with expression vectors for full-length HA (human influenza hemagglutinin)-tagged IRE1α (IRE1α -HA) and a filamin A con-struct fused to green fluorescent protein (GFP) at the C-terminal region (filamin A-GFP). Immunoprecipitation of IRE1α -HA revealed a clear association of filamin A with the cytosolic domain of IRE1α (Fig. 1d). Additionally, we detected an association between IRE1α -HA and endogenous filamin A in IRE1α knockout mouse embryonic fibroblasts (MEFs) reconstituted with physiological levels of IRE1α 12 (Fig. 1e; see controls in Supplementary Fig. 1C). Interestingly, this interaction was enhanced under ER stress induced by tunicamycin, a pharmacological inhibitor of N-linked glycosyl-ation (Fig. 1e), or with fetal bovine serum (FBS), a pro-migratory stimulus (Fig. 1f). We also corroborated the existence of an endog-enous protein complex in Huh7 cells (Fig. 1g). Using individual IgG-like repeats of filamin A, we demonstrated that domains 22–23
e f g
j
h
FLNA
IRE1α
IgG
FLNA
IRE1αInput
IP: IR
E1
α
Huh7
170
130
55
170130
i
FLNA-GFP IRE1α-HA ER
ERC
olo
caliz
ation
FLN
A/IR
E1
α0.6
0.4
0.2
0
Total
** **
FLNA
CH2 Rod1 Rod2 24
Clone 1
Clone 2
Clone 3
Gene nameGrowth
index
No.
clones
Flna 12 3Adnp 12 1Bpgm 11 2Negr1 10 2Arcn1 10 1Msl2 9 1
Cops5 9 1Zmym2-5 9 3
Cnrip1 7 1Eef1a1 6 6
a b dc
Dilution:
(+)
IRE1α∆N
IRE1αΔN/
FLNA-Leu/-Trp -Ade/-His/
-Leu/-Trp/
x-α-Gal
IP: HA
WB: GFP
IP: HA
WB: HA
WB: GFP
Total extract
– – – +–IRE1αΔN-HA:IRE1α-HA:
FLNA-GFP:
+ – + ––
– + + +–
ΔN
FL
170
130
70
130
100
kDa
HEK293T
k
Colo
caliz
ation
FLN
A/E
R
0.6
0.4
0.2
0
*
FLNA
HA
FLNA
Total extract
IP: H
A
+ – +Tm:
170
130
170
+ +IRE1α-HA: –kDa
MEFs
IRE1α KO
1.0Fold: 5.2–
FLNA
Total extract
FLNA
HAIP: H
A
+ – +FBS:
170
130
170
+ +IRE1α-HA: –kDa
MEFs
IRE1α KO
1.0Fold: 2.7–
IRE1α
GST
GST
100
10070
35
55
*
IP: HA
WB: GFP
IP: HA
WB: HA
WB: GFP
Total extract
IRE1α-HA:
FLNA-GFP:
+ + +–
– 19 20–
HEK293T
+ + + +
21 22 23 24
130
40
40
55
20 μm
IRE
1α K
O
+ IR
E1
α-H
AIR
E1
α K
O
+ M
ock FLNA
ER
20 μm
1 10–1
10–2
10–3
1 10–1
10–2
10–3
NIS IR
E1α
kDa kDa
– 19–2
1
20–2
4
kDa
10 μm
FBS: – –+ +
10 μm
Zoom+ FBS
FBS:IRE1α-HA:
–
– –
–+
+
+
+
Fig. 1 | IRE1α physically interacts with filamin A. a, Results of the yeast two-hybrid screen of the cytosolic domain of IRE1α and the Matchmaker
pretransformed cDNA library from adult mouse brain. The yeast growth index and the number of clones obtained are indicated. b, Representation of
the primary structure of filamin A (FLNA) and the clones obtained in a. The CH2, Rod1, Rod2 and the IgG 24 domains are shown. c, Validation of
the yeast two-hybrid assay using IRE1α -Δ N and wild-type filamin A. (+ ), positive control for the assay. Data show one out of three experiments, with
similar results obtained. d, Co-immunoprecipitation (IP) of HA-tagged IRE1α full lenght (FL) or the cytosolic portion of IRE1α (Δ N) and GFP-tagged
filamin A was assessed by western blotting (WB) using HEK293T cells. e, Co-immunoprecipitation of HA-tagged IRE1α and endogenous filamin A
in IRE1α knockout (KO) MEFs reconstituted with an IRE1α -HA expression vector in cells treated with 500 ng ml–1 of tunicamycin (Tm) for 2 h.
f, Co-immunoprecipitation of starved cells described in e treated with 3% FBS for 30 min. g, Co-immunoprecipitation of endogenous filamin A and IRE1α
in Huh7 cells. A non-immune serum (NIS) was used as a control. h, Co-immunoprecipitation of HA-tagged IRE1α and individual domains of GFP-tagged
filamin A spanning IgG repeats from 19 to 24 in HEK293T cells. i, In vitro pull-down of recombinant GST-fused domains of filamin A (19-21 and 21-24)
and recombinant cytosolic IRE1α portion (IRE1α -Δ N) (asterisk indicates nonspecific band). j, Left, immunofluorescence images of MEFs expressing
filamin A-GFP, IRE1α -HA and KDEL-RFP stimulated with 3% FBS for 30 min. Right, colocalization results of IRE1α -HA and filamin A-GFP restricted to the
ER or total area (n = 3 independent experiments, 50 cells in total). k, Left, confocal images of CRISPR–Cas9 IRE1α KO cells or reconstituted with IRE1α -HA
expressing filamin A-GFP and KDEL-RFP, stimulated with 3% FBS for 60 min. Right, colocalization results of filamin A-GFP and KDEL-RFP (n = 3
independent experiments, 50 cells in total). In panels j and k the area with higher magnification is shown (yellow squares). In all panels, data are shown
as the mean ± s.e.m.; one-way ANOVA followed by Tukey’s test. *P < 0.05 and **P < 0.01. Blots represent one out of two (f), three (d,e,g,i) or four (h)
experiments, with similar results obtained.
NATURE CELL BIoLoGY | VOL 20 | AUGUST 2018 | 942–953 | www.nature.com/naturecellbiology 943

ARTICLES NATURE CELL BIOLOGY
account for the interaction with IRE1α (Fig. 1h). These domains are central to the interaction with several signalling proteins, but they are unrelated to its ability to associate with polymerized actin9. Finally, using recombinant proteins, we replicated the direct bind-ing of IRE1α to a fragment of filamin A spanning the 20–24 IgG-like repeat region, but not to the adjacent domain (Fig. 1i).
Quantification of colocalization using the Manders coefficient between IRE1α -HA and filamin A-GFP showed an enhanced asso-ciation after stimulation of cells with FBS. Similar results were obtained when the analysis was confined to the ER (KDEL-RFP sig-nal) (Fig. 1j), suggesting that filamin A relocates to the ER in close proximity to IRE1α . Importantly, the redistribution of filamin A to
the ER was dependent on the expression of IRE1α (Fig. 1k). Taken together, these results indicate that filamin A interacts directly with IRE1α at the ER in multiple cellular systems.
IRE1α controls the dynamics of the actin cytoskeleton. Since filamin A has an active role in modulating morphological changes through local actin cytoskeleton remodelling13, we tested the con-tribution of IRE1α to this process. We monitored actin cytoskel-eton dynamics using LifeAct14. Time-lapse confocal microscopy of IRE1α -deficient cells revealed a reduced number of filopodia and lamellipodial protrusions (lamellipodia index) per cell (Fig. 2a,b; Supplementary Movie 1). In addition, the temporal dynamics
a b d
Actin
bu
nd
les
wid
th (
nm
)
100
200
300
400
– +FBS: +–
***
n.s.
– –IRE1α-HA: ++
h
GTP-Rac1
Total Rac1
– +IRE1α-HA:
WT
IRE1α
KO
–
15
15
c e
f g
KO
– +IRE1α-HA:
WT
–
–0.10
–0.05
0
–0.15
–0.20Re
tra
ctio
n v
elo
city
(µm
min
–1)
KO
*
*
IRE
1α K
O
+ I
RE
1α-H
AIR
E1
α K
O
+ M
ock
IRE
1α W
T
0 5
Time (min)
1 –1
µm min–1
– +Tm: +–
IRE1α KO
– –IRE1α-HA: ++
GTP-Rac1–15
–15
–15
–15Total Rac1
– +FBS: +–
IRE1α KO
– –IRE1α-HA: ++
GTP-Rac1
Total Rac1
IRE
1α K
O
+ I
RE
1α-H
AIR
E1
α K
O
+ M
ock
IRE
1α W
T
30 s 60 s 90 s
120 s 150 s 180 s
30 s 60 s 90 s
120 s 150 s 180 s
30 s 60 s 90 s
120 s 150 s 180 s
IRE
1α K
O
+ I
RE
1α -
HA
IRE
1α K
O
+ M
ock
STV FBS
Actin
Nuclei
IRE
1α K
O
+ I
RE
1α-H
AIR
E1
α
KO
+ M
ock
i
– +IRE1α-HA:
WT
–
15
0
20
25
10
5No
. filo
po
dia
pe
r ce
ll
KO
**
KOL
am
elli
po
dia
ind
ex p
er
ce
ll
4
0
6
8
– +IRE1α-HA:
WT
–
2
**
Pro
tru
din
g
are
a (
%)
0
10
20
40
30
– +IRE1α-HA:
WT
–
**
Re
tra
ctin
g
are
a (
%)
0
10
20
40
30
*
– +IRE1α-HA:
WT KO
–
– +IRE1α-HA:
WT
–
0.06
0
0.08
0.1
0.04
0.02
Pro
tru
sio
n v
elo
city
(µm
min
–1)
KO
**
FBS: – + – +
IRE1α-HA: – – + +
La
me
llip
od
ia
ind
ex p
er
ce
ll
4
0
6
2
*8
GT
P-R
ac1
/
tota
l R
ac1
0.4
0
0.8
1.2
– +IRE1α-HA:
WT KO
–
*
**
20 μm
20 μm 200 nm
STV FBS
kDa kDa
kDa
Fig. 2 | IRE1α regulates actin cytoskeleton dynamics and Rac1 activation. a, WT, IRE1α KO or IRE1α -HA-reconstituted cells were transfected with LifeAct
and time-lapse confocal microscopy recordings were made every 30 s for 5 min. Segmentation was used to obtain protruding area (green) and retracting
areas (red). Regions in dotted white squares are magnified in time-lapse images on the right. b, Top, the number of filopodia per cell was determined using
ADAPT software. Bottom, the number of octants showing lamellipodia was evaluated per cell. c, The average signal over time of the protruding cell area
or the retracting cell area was quantified from experiments presented in a. d, Heatmaps of LifeAct signal distribution along the cell determined by ADAPT
software. e, The velocity of protrusions and retractions. For b–e, n = 5, n = 5 and n = 7 independent experiments were determined for WT, IRE1α KO and
IRE1α -HA, respectively. f, Top, IRE1α KO and IRE1α -HA-reconstituted cells were starved (STV) and then stimulated with 3% FBS for 30 min and stained
with phalloidin-coupled to rodamine. Bottom, quantification of lamellipodia index per cell as described in b (n = 3 independent experiments).
g, Top, electron microscopy sections of cortical actin (bundles) in IRE1α KO and IRE1α -HA-reconstituted cells treated with 3% FBS for 30 min (× 67,000
magnification). Bottom, quantification of width (yellow bars above) of actin bundles (n = 3, 10 cells in total). h, Top, pull-down assay using GST-CRIB
domain followed by western blot analysis to evaluate Rac1 activation of WT, IRE1α KO and IRE1α -HA-reconstituted cells. Bottom, Rac1-GTP levels were
quantified and normalized to total Rac1 (n = 4 independent experiments). i, IRE1α KO and IRE1α -HA-reconstituted cells were treated with 3% FBS for 1 h
(top) or 100 ng ml–1 of Tm for 2 h (bottom). Rac1-GTP levels were evaluated by a pull-down assay using GST-CRIB domain followed by western blot analysis
(data represent one out of three experiments, with similar results obtained). In all panels, data are shown as the mean ± s.e.m.; one-way ANOVA followed
by Tukey’s test. n.s., not significant, *P < 0.05 and **P < 0.01.
NATURE CELL BIoLoGY | VOL 20 | AUGUST 2018 | 942–953 | www.nature.com/naturecellbiology944
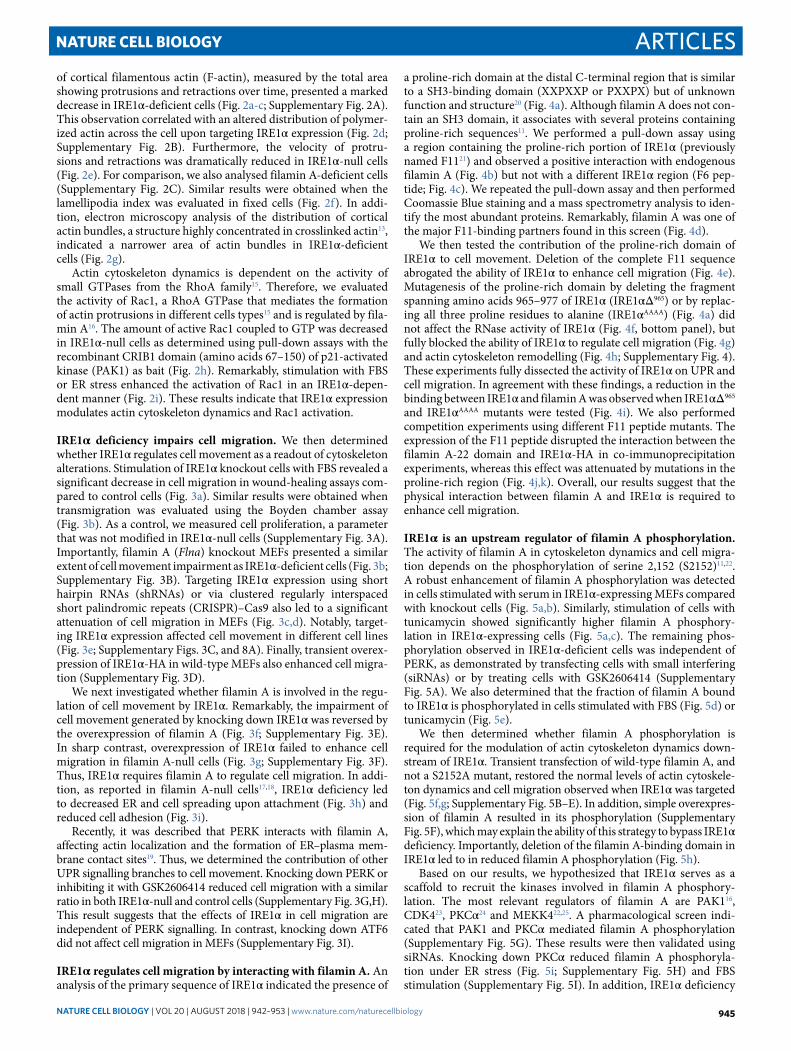
ARTICLESNATURE CELL BIOLOGY
of cortical filamentous actin (F-actin), measured by the total area showing protrusions and retractions over time, presented a marked decrease in IRE1α -deficient cells (Fig. 2a-c; Supplementary Fig. 2A). This observation correlated with an altered distribution of polymer-ized actin across the cell upon targeting IRE1α expression (Fig. 2d; Supplementary Fig. 2B). Furthermore, the velocity of protru-sions and retractions was dramatically reduced in IRE1α -null cells (Fig. 2e). For comparison, we also analysed filamin A-deficient cells (Supplementary Fig. 2C). Similar results were obtained when the lamellipodia index was evaluated in fixed cells (Fig. 2f). In addi-tion, electron microscopy analysis of the distribution of cortical actin bundles, a structure highly concentrated in crosslinked actin13, indicated a narrower area of actin bundles in IRE1α -deficient cells (Fig. 2g).
Actin cytoskeleton dynamics is dependent on the activity of small GTPases from the RhoA family15. Therefore, we evaluated the activity of Rac1, a RhoA GTPase that mediates the formation of actin protrusions in different cells types15 and is regulated by fila-min A16. The amount of active Rac1 coupled to GTP was decreased in IRE1α -null cells as determined using pull-down assays with the recombinant CRIB1 domain (amino acids 67–150) of p21-activated kinase (PAK1) as bait (Fig. 2h). Remarkably, stimulation with FBS or ER stress enhanced the activation of Rac1 in an IRE1α -depen-dent manner (Fig. 2i). These results indicate that IRE1α expression modulates actin cytoskeleton dynamics and Rac1 activation.
IRE1α deficiency impairs cell migration. We then determined whether IRE1α regulates cell movement as a readout of cytoskeleton alterations. Stimulation of IRE1α knockout cells with FBS revealed a significant decrease in cell migration in wound-healing assays com-pared to control cells (Fig. 3a). Similar results were obtained when transmigration was evaluated using the Boyden chamber assay (Fig. 3b). As a control, we measured cell proliferation, a parameter that was not modified in IRE1α -null cells (Supplementary Fig. 3A). Importantly, filamin A (Flna) knockout MEFs presented a similar extent of cell movement impairment as IRE1α -deficient cells (Fig. 3b; Supplementary Fig. 3B). Targeting IRE1α expression using short hairpin RNAs (shRNAs) or via clustered regularly interspaced short palindromic repeats (CRISPR)–Cas9 also led to a significant attenuation of cell migration in MEFs (Fig. 3c,d). Notably, target-ing IRE1α expression affected cell movement in different cell lines (Fig. 3e; Supplementary Figs. 3C, and 8A). Finally, transient overex-pression of IRE1α -HA in wild-type MEFs also enhanced cell migra-tion (Supplementary Fig. 3D).
We next investigated whether filamin A is involved in the regu-lation of cell movement by IRE1α . Remarkably, the impairment of cell movement generated by knocking down IRE1α was reversed by the overexpression of filamin A (Fig. 3f; Supplementary Fig. 3E). In sharp contrast, overexpression of IRE1α failed to enhance cell migration in filamin A-null cells (Fig. 3g; Supplementary Fig. 3F). Thus, IRE1α requires filamin A to regulate cell migration. In addi-tion, as reported in filamin A-null cells17,18, IRE1α deficiency led to decreased ER and cell spreading upon attachment (Fig. 3h) and reduced cell adhesion (Fig. 3i).
Recently, it was described that PERK interacts with filamin A, affecting actin localization and the formation of ER–plasma mem-brane contact sites19. Thus, we determined the contribution of other UPR signalling branches to cell movement. Knocking down PERK or inhibiting it with GSK2606414 reduced cell migration with a similar ratio in both IRE1α -null and control cells (Supplementary Fig. 3G,H). This result suggests that the effects of IRE1α in cell migration are independent of PERK signalling. In contrast, knocking down ATF6 did not affect cell migration in MEFs (Supplementary Fig. 3I).
IRE1α regulates cell migration by interacting with filamin A. An analysis of the primary sequence of IRE1α indicated the presence of
a proline-rich domain at the distal C-terminal region that is similar to a SH3-binding domain (XXPXXP or PXXPX) but of unknown function and structure20 (Fig. 4a). Although filamin A does not con-tain an SH3 domain, it associates with several proteins containing proline-rich sequences11. We performed a pull-down assay using a region containing the proline-rich portion of IRE1α (previously named F1121) and observed a positive interaction with endogenous filamin A (Fig. 4b) but not with a different IRE1α region (F6 pep-tide; Fig. 4c). We repeated the pull-down assay and then performed Coomassie Blue staining and a mass spectrometry analysis to iden-tify the most abundant proteins. Remarkably, filamin A was one of the major F11-binding partners found in this screen (Fig. 4d).
We then tested the contribution of the proline-rich domain of IRE1α to cell movement. Deletion of the complete F11 sequence abrogated the ability of IRE1α to enhance cell migration (Fig. 4e). Mutagenesis of the proline-rich domain by deleting the fragment spanning amino acids 965–977 of IRE1α (IRE1α Δ 965) or by replac-ing all three proline residues to alanine (IRE1α AAAA) (Fig. 4a) did not affect the RNase activity of IRE1α (Fig. 4f, bottom panel), but fully blocked the ability of IRE1α to regulate cell migration (Fig. 4g) and actin cytoskeleton remodelling (Fig. 4h; Supplementary Fig. 4). These experiments fully dissected the activity of IRE1α on UPR and cell migration. In agreement with these findings, a reduction in the binding between IRE1α and filamin A was observed when IRE1α Δ 965 and IRE1α AAAA mutants were tested (Fig. 4i). We also performed competition experiments using different F11 peptide mutants. The expression of the F11 peptide disrupted the interaction between the filamin A-22 domain and IRE1α -HA in co-immunoprecipitation experiments, whereas this effect was attenuated by mutations in the proline-rich region (Fig. 4j,k). Overall, our results suggest that the physical interaction between filamin A and IRE1α is required to enhance cell migration.
IRE1α is an upstream regulator of filamin A phosphorylation. The activity of filamin A in cytoskeleton dynamics and cell migra-tion depends on the phosphorylation of serine 2,152 (S2152)11,22. A robust enhancement of filamin A phosphorylation was detected in cells stimulated with serum in IRE1α -expressing MEFs compared with knockout cells (Fig. 5a,b). Similarly, stimulation of cells with tunicamycin showed significantly higher filamin A phosphory-lation in IRE1α -expressing cells (Fig. 5a,c). The remaining phos-phorylation observed in IRE1α -deficient cells was independent of PERK, as demonstrated by transfecting cells with small interfering (siRNAs) or by treating cells with GSK2606414 (Supplementary Fig. 5A). We also determined that the fraction of filamin A bound to IRE1α is phosphorylated in cells stimulated with FBS (Fig. 5d) or tunicamycin (Fig. 5e).
We then determined whether filamin A phosphorylation is required for the modulation of actin cytoskeleton dynamics down-stream of IRE1α . Transient transfection of wild-type filamin A, and not a S2152A mutant, restored the normal levels of actin cytoskele-ton dynamics and cell migration observed when IRE1α was targeted (Fig. 5f,g; Supplementary Fig. 5B–E). In addition, simple overexpres-sion of filamin A resulted in its phosphorylation (Supplementary Fig. 5F), which may explain the ability of this strategy to bypass IRE1α deficiency. Importantly, deletion of the filamin A-binding domain in IRE1α led to in reduced filamin A phosphorylation (Fig. 5h).
Based on our results, we hypothesized that IRE1α serves as a scaffold to recruit the kinases involved in filamin A phosphory-lation. The most relevant regulators of filamin A are PAK116, CDK423, PKCα 24 and MEKK422,25. A pharmacological screen indi-cated that PAK1 and PKCα mediated filamin A phosphorylation (Supplementary Fig. 5G). These results were then validated using siRNAs. Knocking down PKCα reduced filamin A phosphoryla-tion under ER stress (Fig. 5i; Supplementary Fig. 5H) and FBS stimulation (Supplementary Fig. 5I). In addition, IRE1α deficiency
NATURE CELL BIoLoGY | VOL 20 | AUGUST 2018 | 942–953 | www.nature.com/naturecellbiology 945

ARTICLES NATURE CELL BIOLOGY
rendered cells less sensitive to the inhibition of migration by the PKCα inhibitor Gö6976 (Fig. 5j). In agreement with this result, PKCα activation was decreased in IRE1α -deficient cells upon FBS stimulation (Supplementary Fig. 5J,K). We also detected an interaction between IRE1α , filamin A and PKCα in immunopre-cipitation experiments (Fig. 5k). Using cellular fractionation and colocalization experiments, we observed a relocalization of PKCα to the ER in an IRE1α -dependent manner (Fig. 5l,m; see controls in Supplementary Fig. 5L). Taken together, these data indicate that IRE1α facilitates filamin A phosphorylation, which is mediated by PKCα , to induce actin cytoskeleton remodelling and cell migration.
IRE1α acts as a scaffold to regulate cell migration and filamin A phosphorylation. Since IRE1α is required for cell migration, we explored the contribution of XBP1 to this biological function.
Remarkably, XBP1 deficiency or inhibition of the RNase activity of IRE1α had no impact on cell migration (Fig. 6a; Supplementary Fig. 6A). We also expressed IRE1α carrying different mutations that impair its kinase activity (K599A), kinase and endoribonucle-ase activity (P830L) or its ability to dimerize (D123P)26. Although all three IRE1α mutants lost their ability to catalyse Xbp1 mRNA splicing under ER stress (Fig. 6b; Supplementary Fig. 6B), only the D123P variant impaired the pro-migratory activity of IRE1α (Fig. 6c; Supplementary Fig. 6C). Consistent with these results, the expression of the D123P mutant did not restore actin dynamics in IRE1α -null cells (Fig. 6d; Supplementary Fig. 6D). These findings indicate that IRE1α facilitates cell migration independent of its canonical signalling but requires its dimerization.
We studied IRE1α oligomerization using an IRE1α -GFP construct (IRE1-3F6H-GFP) to visualize IRE1α clustering27.
IRE1α KO
+ IRE1α-HA
IRE1α KO
+ Mock
0 h
16
h
e
Tra
nsm
igra
tio
n
(re
lative
to
co
ntr
ol)
0.5
1.0
1.5
0
**
shRNA:
d
h i
Wo
un
d a
rea
clo
se
d (
%)
0
20
40
60
+ – +FBS: –– – –IRE1α-HA: –
+–++
IRE1α KO
IRE1α
-1
IRE1α
-2
Luc
IRE1α
-1
IRE1α
-2Luc
IRE1α
-HA
**80
**
*
* *
WT
WT
CRIS
PR
Tra
nsm
igra
tio
n
(re
lative
to
co
ntr
ol)
0.5
1.0
1.5
0
*
gf
Tra
nsm
igra
tio
n
(re
lative
to
co
ntr
ol)
0.5
1.0
1.5
0
WT KO
WT
WT
MEF
U2O
S
MDA-2
31
HT22
HELA
HCT11
6
CRIS
PR
WT
CRIS
PR
KO
IRE1α FLNA
* **
IRE1α
HSP90
shRNA:
1.0
0.33
0.08
120
90
kDa
Fold:
Tm: – + – + bp
IRE1α
GAPDH
120
-200
-100
35
kDa
*
Xbp1uXbp1s
20 40 600
Ce
ll sp
rea
din
g
(×1
03
pix
2 p
er
ce
ll)
ER
sp
rea
din
g
(×1
03
pix
2 p
er
ce
ll)
0
25
50
75
100
Time (min)
**
IRE1α KO
+ IRE1α-HAIRE1α KO +
Mock
IRE1α KO + IRE1α-HA
IRE1α KO + Mock
IRE1α KO + IRE1α-HA
IRE1α KO + Mock
IRE1α KO + IRE1α-HA
IRE1α KO + Mock
5 m
in1
5 m
in
Actin
ER
Nuclei
20 40 600
Ce
ll a
dh
esio
n (
%)
0
30
60
90
120
Time (min)
**
* *
20 40 600
0
15
30
45
60
Time (min)
** *
*
0
2
3
1
IRE1α-HA: – + – +
Tra
nsm
igra
tio
n
(re
lative
to
co
ntr
ol)
WT FLNA
KO
*
Tra
nsm
igra
tio
n
(GF
P+ c
ells
pe
r fie
ld)
0
20
40
30
10
FLNA WT: – – +
IRE1αLuc
shRNA
**
Control
IRE1α
a b c
Tra
nsm
igra
tio
n
(re
lative
to
co
ntr
ol)
0
1
0.5
1.5* * **
20 μm
Fig. 3 | IRE1α expression enhances cell migration upstream of filamin A. a, Wound-healing assay results of confluent monolayers of WT, IRE1α KO and
IRE1α -HA-reconstituted cells stimulated with 3% FBS and recorded at 0 and 16 h post-wounding (left) and quantified (right) (n = 5 independent experiments).
b, Transmigration of cells described in a, in addition to filamin A WT and KO MEFs using the Boyden chamber assay. After 4 h, cells were stained and counted
(n = 4 independent experiments). c, Knockdown was confirmed by western blotting in MEFs stably expressing two independent IRE1α shRNAs constructs
or control (Luc). The percentage of IRE1α silencing is indicated. Right, Boyden chamber assay was performed in these cells using fibronectin-coated plates
(n = 3 independent experiments). d, Left, IRE1α KO MEF cells were generated using CRISPR–Cas9, followed by confirmation using western blotting (asterisk
indicates nonspecific band) and Xbp1 mRNA splicing assays (PCR fragments corresponding to the Xbp1u or Xbp1s forms are indicated). Right, Boyden chamber
assay of control and IRE1α CRISPR KO cells (two-tailed t-test, n = 3 independent experiments). e, Boyden chamber assay of indicated cell lines transfected
with siRNA against IRE1α or a control siRNA for 48 h (two-tailed t-test, n = 4). f, Boyden chamber assay of MEFs expressing control or IRE1α shRNA transiently
transfected with a Myc-tagged filamin A vector or an empty vector followed by quantification of the number of GFP-positive cells in the lower chamber
(n = 3 independent experiments). g, Boyden chamber assay of FLNA WT and KO transiently transfected with pEGFP together with an expression vector for
IRE1α -HA followed by quantification of number of GFP-positive cells in the lower chamber (n = 4 independent experiments). h, Indirect immunofluorescence
of IRE1α KO and IRE1α -HA-reconstituted cells stained with anti-KDEL antibody and phalloidin at different time points after seeding. Actin and ER total area
was quantified as a measure of spreading (n = 3 independent experiments, 50 cells in total). i, Cell adhesion assay in fibronectin-coated plates. Cells were
stained with crystal violet and the total absorbance was measured (n = 3 independent experiments). In all panels, data are shown as the mean ± s.e.m of the
indicated number of independent experiments; one-way ANOVA followed by Tukey’s test. *P < 0.05 and **P < 0.01.
NATURE CELL BIoLoGY | VOL 20 | AUGUST 2018 | 942–953 | www.nature.com/naturecellbiology946

ARTICLESNATURE CELL BIOLOGY
IRE1-3F6H-GFP cells were tested in transmigration assays to moni-tor cells in the upper chamber (non-migrating) and cells in the lower chamber (migrating). An analysis of Z-stacks of cells in the lower chamber showed the presence of IRE1α -GFP clusters in ~22% of migrating cells (Fig. 6e). As a control, a D123P mutant was used
in the same experiment to confirm that the signal was due to IRE1α oligomerization.
We then tested whether IRE1α dimerization is needed to inter-act and regulate filamin A. Immunoprecipitation experiments using the K599A, P830L and D123P mutants showed similar
a b
e
Tra
nsm
igra
tio
n
(re
lative
to
co
ntr
ol)
0
1
4
2
3
5 **
Ni-NTA
25015010075
50
37
25
20
kDaFLNA
6×His-F11 pull-down
+ ++
+ +–
– ++
F11-His
Lysate
Spectrin-α
HSP90α
c
Tra
nsm
igra
tio
n
(re
lative
to
co
ntr
ol)
0
4
2
*
6
**
d
f g h
i
HA
Moc
k
IRE1α
WT
IRE1α
∆96
5
IRE1α
AAAA
IRE1α
HSP90
120
90
kDa
120
IRE1α KO:
Tm: – + – + – + – +-200
-100
bp
Xbp1uXbp1s
FLNA
Total extract
WB:His
+ +
– +
+ +Huh7 lysate:
F11-His:
Ni-NTA:
FLNA170
kDa kDa
170
15
FLNA
Total extract
WB:His
FLNA
+ +
– +F11-His:
Ni-NTA:
+ –F6-His:
170
170
15
IP: HA
WB: GFP
IP: HA
WB: HA
WB: GFP
Total extract
– – – +–
IRE1α-HA WT:
FLNA-GFP:
– + + ––
+ – + +–
– – ––
–
–
+
– +
IRE1α-HAΔP965:
IRE1α-HAAAAA:
130
170
170
690–754 915–977
F6 F11
TM S/T kinase RNase
963835835 832
j k
IP: HAWB: GFP
IP: HAWB: HA
WB: GFPTotal extract
WB: MycTotal extract
130
40
40
kDa
kDa
kDa
10
IRE1α-HA WT:
FLNA22-GFP:
F6 WT-Myc: – + ––
+ + +–
+ + +–
F11 WT-Myc: – – +–
– –
+ +
+ +
– –
F11 P3A-Myc: – – –– + –
F11 P6A-Myc: – – –– – +
IP: HAWB: GFP
IP: HAWB: HA
WB: GFPTotal extract
WB: MycTotal extract
IRE1α-HA WT:
FLNA22-GFP:
F11 WT-Myc: – + ––
+ + +–
+ + +–
F11 ΔP-Myc: – – +–
130
40
40
10
Me
an
pro
tru
sio
n
ve
locity (
µm
min
–1)
Me
an
re
tra
ctio
n
ve
locity (
µm
min
–1)
0
0.09
0.03
0.06
*
*–0.09
0
–0.06
–0.03
IRE1α W
T
IRE1α
ΔF11
Moc
k
IRE1α W
T
IRE1α
ΔAAAA
IRE1α
Δ96
5
IRE1α W
T
IRE1α
Δ96
5
IRE1α W
T
IRE1α
Δ96
5
Moc
k
IRE1α W
T
IRE1α
ΔAAAA
IRE1α
Δ96
5
Moc
k
Fig. 4 | A physical interaction between IRE1α and filamin A is required for cell migration. a, Schematic representation of the C terminus of IRE1α
divided into different fragments. The domains serine/threonin protein kinase (S/T kinase) and endoribonuclease (RNAse) are shown. A putative
SH3-binding domain (PPXP) is shown in red and all prolines are highlighted in blue. b, Pull down of purified 6× HIS-F11 using Huh7 cell extracts and
Ni-NTA (nickel-nitrilotriacetic acid) columns followed by western blotting. c, Pull down of purified 6× HIS-F11 or F6. d, Pull down of 6× HIS-F11 analysed
by SDS–PAGE and Coomassie staining. Bands were analysed by mass spectrometry to identify the proteins. Images from the same gel were spliced
together as indicated (see unprocessed gel scans). e, Boyden chamber assay of MEFs transfected with IRE1α WT or a deletion mutant of the F11
domain (Δ F11) (n = 5 independent experiments). f, Top, western blot of IRE1α knockout MEFs stably expressing IRE1α -HA WT, a deletion from amino
acid P975 (Δ 965), or a point mutant replacing PPEP for AAAA. Bottom, Xbp1 mRNA splicing assay (RT-PCR) of indicated cells were treated with
100 ng ml–1 of Tm for 8 h. PCR fragments corresponding to the Xbp1u or Xbp1s forms are indicated. g, Boyden chamber assay of cells described in f
seeded on fibronectin-coated transwell plates (n = 5 independent experiments). h, IRE1α KO cells reconstituted with WT or IRE1α Δ 965 mutant were
transfected with LifeAct and time-lapse confocal microscopy recordings were made. Protrusion and retraction velocity were determined using ADAPT
software (two-tailed t-test; WT, n = 20 and IRE1α Δ965 n = 14 independent experiments). i, Co-immunoprecipitation of IRE1α -HA (WT, Δ 965 and AAAA
mutants) and GFP-tagged filamin A was assessed by western blotting using HEK293T cells. j, Co-immunoprecipitation of IRE1α -HA and GFP-tagged-
filamin A-22 domain in cells expressing F11 WT or a deleted peptide in the proline-rich sequence (F11Δ P) using HEK293T cells. k, Similar experiments
were performed as in j using F11 WT or F11 P3A (proline substitution by alanine in three proline residues), F11 P6A (proline substitution by alanine in
all six proline residues) or control F6 peptide. In all panels, data are shown as the mean ± s.e.m. of the indicated number of independent experiments;
one-way ANOVA followed by Tukey’s test was used unless otherwise indicated. *P < 0.05. Blots represent one out of two (d,i), or three (b,c,j,k)
experiments, with similar results obtained.
NATURE CELL BIoLoGY | VOL 20 | AUGUST 2018 | 942–953 | www.nature.com/naturecellbiology 947

ARTICLES NATURE CELL BIOLOGY
associations with filamin A compared with wild-type IRE1α (Fig. 6f). However, interaction studies using the D123P mutant with the filamin A-22 domain alone indicated reduced binding under resting and ER stress conditions (Fig. 6g,h). Similar results were observed when IRE1α Δ965 and IRE1α AAAA mutants were tested (Fig. 6g). In addition, IRE1α expression favours the forma-tion of dimers and larger order oligomers of filamin A (Fig. 6i). Remarkably, filamin A phosphorylation was abolished in IRE1α knockout cells expressing the D123P dimerization mutant (Fig. 6j). Taken together, these results suggest that IRE1α acts as a scaffold to recruit filamin A at resting conditions, inducing its phosphoryla-tion upon IRE1α dimerization.
IRE1α regulates actin dynamics and cell migration in multi-ple model systems. To explore the physiological relevance of our findings, we used two in vivo models of cell migration coupled with genetic manipulation. We studied Drosophila melanogaster
plasmatocytes (haemocytes), which are motile cells with functions and features similar to that of vertebrate macrophages28. Knocking down fly IRE1α (Ire1) by RNA interference resulted in reduced dis-tance and velocity of movement (Fig. 7a; Supplementary Movie 2). Under these conditions, haemocytes exhibited an elongated mor-phology with reduced lamellipodia (Fig. 7b). Remarkably, overex-pression of Cheerio (the filamin A form in D. melanogaster) fully rescued the migratory impairment triggered by knocking down fly IRE1α (Fig. 7a). To further examine the role of IRE1α in cell migra-tion, we used an insertional Ire1 mutant coupled with a mosaic analysis, whereby only IRE1α -deficient cells are labelled with GFP29 (scheme shown in Supplementary Fig. 7A). Primary cultures from Ire1α mutant cells were smaller in size area and showed reduced number of lamellar extensions (Fig. 7c). Remarkably, knocking down IRE1α led to a reduction of the retrograde flow of actin, reflected in a lower frequency in the velocity maps using the LifeAct reporter (Fig. 7d; Supplementary Movie 3). Taken together, these
b c
2 4 6 80
pS
21
52
-FL
NA
(fo
ld in
cre
ase
)
0
5
10
15
20
** *
*
Tm (h)
a
170
pS2152-
FLNA
FLNA
HA
170
130
– 1 2 4 8 1 2 4 8Tm (h):FBS:
–
– + + + + + – + + + + +
– – kDa
IRE1α KO
+ IRE1α-HA
IRE1α KO
+ Mock
e g hf
ji
1000
Wo
un
d a
rea
clo
se
d (
%)
0
20
40
60
Gö6976 (nM)
50
IP:I
RE
1α
Inp
ut
– + – + – +Tm:
pS2152-
FLNA
FLNA
1.0Fold: 1.2 1.0 2.6 1.1 1.6
170
170
–FBS (min):
IgG
pS2152-
FLNAIRE1α
pS2152-
FLNA
FLNA
170
130
35
170
170
– 1 2Tm (h):
pS2152-
FLNA
IRE1α
IgG
pS2152-
FLNA
FLNA
IP:I
RE
1α
Inp
ut
170
130
35
170
170
– + – + – +Tm:
pS2152-
FLNA
FLNA1.0Fold: 1.9 1.2 1.5 1.3 2.0
d
k ml
FLNA WT: – – + –FLNA S2152A: – – – +
IRE1α
KO
WT
Me
an
pro
tru
sio
n
ve
locity (
µm
min
–1)
0
0.09
0.03
0.06
**
*
Co
loca
liza
tio
n
PK
Cα/E
R
0.6
0.4
0.2
0
*
PKCα
FLNA
HA
PKCα
FLNA
HA
– +IRE1α-HA:IP
:HA
Inp
ut
Me
an
re
tra
ctio
n
ve
locity (
µm
min
–1)
0.09
0
0.06
0.03
** *
FLNA WT: – – + –FLNA S2152A: – – – +
IRE1α
KO
WT
PK
Cα
Tm: +– +–IRE1α-HA: –– ++
Tm: +– +–IRE1α-HA: –– ++
Cyt -70
-170
-70
-130
-170
-70
-130
-70
Cyt
FL
NA
- 180
1.0Fold: 0.9 1.2 1.8
ER
1.0Fold: 0.8 1.1 1.5-180ER
pS
2152-F
LN
A
(fo
ld in
cre
ase
)
0
2
4
6
FBS: – + – +IRE1α-HA: – – + +
*
n.s.
IRE1α KO IRE1α KO + Mock
IRE1α KO + IRE1α-HA*
10
30
Tra
nsm
igra
tio
n
GF
P+ c
ells
pe
r fie
ld
0
20
40
FLNA WT:
**
*
– – + –FLNA S2152A: – – – +
IRE1αLuc
shRNA
lgG
30 60
lgG
Moc
k
IRE1α W
T
IRE1α
∆P96
5
170
170
siCtrl
siPKC
α
LucIRE1α
siPAK1
kDa
kDa
kDa
kDa
kDa
kDa
Fig. 5 | IRE1α regulates filamin A phosphorylation. a–c, Filamin A phosphorylation at S2152 was measured by western blotting in IRE1α KO and
IRE1α -HA-reconstituted MEFs treated with FBS or Tm (a) followed by quantification (b,c) (n = 3 independent experiments). d,e, Co-immunoprecipitation
of endogenous IRE1α and filamin A in cells treated with 3% FBS (d) for 30-60 min or Tm (e) for 1–2 h. f, WT and IRE1α KO cells transfected with LifeAct
and filamin A WT (FLNA-WT) or S2152A mutant filamin A (FLNA S2152A) were recorded by time-lapse confocal microscopy every 30 s for 5 min.
Protrusion and retraction velocity was determined using ADAPT software (WT, n = 20; KO n = 11; KO + filamin A, n = 12; KO + filamin A S2152A, n = 14).
g, Boyden chamber assay of shLuc or shIRE1α MEFs transiently transfected with pEGFP and expression vectors for FLNA-Myc or FLNA S2152A-Myc.
Transmigration was evaluated by quantifying the number of GFP-positive cells in the lower chamber (n = 4 independent experiments). h, Western blot of
total protein extracts of IRE1α KO MEFs reconstituted with IRE1α -HA WT or IRE1α ΔP965 mutant treated with Tm for 2 h. i, Western blot of MEFs transfected
with siRNAs against PKCα (siPKCα ) and PAK1 (siPAK1) for 48 h followed by Tm treatment. j, Wound-healing assay of MEFs transfected with shRNA
against Luc or IRE1α and treated with different concentrations of Gö6976 for 8 h. Slopes are indicated in red and yellow (n = 2 independent experiments).
k, Co-immunoprecipitation of IRE1α -HA with endogenous PKCα and filamin A. l, Subcellular fractionation was performed on IRE1α -deficient or
reconstituted cells treated with Tm for 2 h. Pure microsomal (ER) and cytosolic (Cyt) fractions were analysed by western blotting. m, Colocalization
of PKCα -FLAG and KDEL-RFP in transfected cells treated with Tm for 2 h (two-tailed t-test, n = 3, 20 cells in total). In all panels, data represent the
mean ± s.e.m. of the indicated number of independent experiments; one-way ANOVA followed by Tukey’s test. *P < 0.05. n.s. not significant. Blots
represent one out of two (i,k), or three (d,h,i,l) experiments, with similar results obtained.
NATURE CELL BIoLoGY | VOL 20 | AUGUST 2018 | 942–953 | www.nature.com/naturecellbiology948

ARTICLESNATURE CELL BIOLOGY
results demonstrate a functional role of the IRE1α –filamin A axis in cell migration and actin dynamics in vivo in an invertebrate model.
We then assessed cell migration in zebrafish embryos, which show a well-characterized pattern of morphogenetic cell movements that are dependent on the actin cytoskeleton during gastrulation30.
Three major stereotyped cell movements have been described: epiboly, convergence and extension (scheme shown in Fig. 7e). We blocked the activity of IRE1α during zebrafish development using a dominant-negative form (IRE1α -DN)31,32 (Supplementary Fig. 7B) that also reduced filamin A phosphorylation in vitro
e IRE1-3F6H-GFP
WT
IRE1-3F6H-GFP
D123P
~22% ~0%
Tra
nsm
igra
tio
n
(re
lative
to
co
ntr
ol)
0
1
3
2
IRE1α KO
IRE1α-HA
**
*
b ca
f g
d
– + – + – + – + – + – +
-100
bpTm:
IRE1α W
T
IRE1α W
T
IRE1α
D12
3P
IRE1α W
T
IRE1α
D12
3P
Moc
k
Moc
k
WT
WT
K599A
K599A
P830L
P830L
D12
3P
D12
3P
IRE1α KO
Xbp1uXbp1s
IRE1α-HAD123P:
IP: HA
WB: GFP
IP: HA
WB: HA
WB: GFP
Total extract
– – – +–IRE1α-HAK599A:
IRE1α-HA WT:
FLNA-GFP:
– + + ––
+ – + +–
IRE1α-HAP830L:– – – ––
– – – ––
– –
– ––+ +
– +
+ –
130
170
170
kDa
kDa
kDa
kDapS2152-
FLNA
FLNA
– – – +Tm: + +
170
170
IP: HAWB: GFP
IP: HAWB: HA
WB: GFPTotal extract
IRE1α-HA WT:
FLNA22-GFP:
––
IRE1α-HA D123P: –
–+
–
++
–
++
–
–+
+
–+
+Tm: – – – + – +
130
40
40M
ea
n p
rotr
usio
n
ve
locity (
µm
min
–1)
0
0.09
0.03
0.06
Me
an
re
tra
ctio
n
ve
locity (
µm
min
–1)
–0.09
0
–0.06
–0.03
i jh
IRE1α-HA:
FLNA24-GFP:
––
+ + ++
WB: GFP
-SDS
WB: GFP
WB: GFP
WB: HA
1N
2N3N
HMW
1N
Tm: +– +–
+ +
-180
-180
-130
-100
-70
-55
-40
-40
-130
*
*
IRE1α-HAD123P:
FLNA22-GFP:
IRE1α-HAΔ965:
IRE1α-HAAAAA:
IP: HAWB: GFP
IP: HA
WB: HA
WB: GFP
Total extract
130
40
40
– – +–
IRE1α-HA WT: – + ––
+ + +
– – ––
– – ––
– –
– –
+ +
– +
+ –
1
2
3
0
Tra
nsm
igra
tio
n
(re
lative
to
co
ntr
ol)
KOXBP1: WT
pS
21
52
-FL
NA
(fo
ld in
cre
ase
)
0
1
2
3
4*
*
Mock
20 μm
Moc
kIR
E1α WT
IRE1α KO
IRE1α KO
IRE1α
D12
3P
Moc
kIR
E1α WT
IRE1α
D12
3P
NT
Tm
WT D123P
Fig. 6 | IRE1α dimerization, but not its enzymatic activities, controls cell migration and filamin A phosphorylation. a, Boyden chamber assay of
XBP1-deficient or control MEFs. Transmigration was evaluated as described previously (two-tailed t-test, n = 3) b, Xbp1 mRNA splicing assay of indicated
cells treated with Tm (K599A: kinase dead; P830L: kinase and RNase dead; D123P: non-dimerizing). c, Boyden chamber assay of IRE1α KO cells
stably expressing IRE1α -HA WT, K599A, P830L or D123P mutants (n = 3 independent experiments). d, Retractions and protrusions of IRE1α KO MEFs
reconstituted with IRE1α WT or D123P mutant transfected with LifeAct were recorded by time-lapse confocal microscopy. The protrusion and retraction
velocity were determined using ADAPT software (two-tailed t-test, IRE1α WT n = 20, IRE1α D123P n = 15 independent experiments) e, Top, Z-stacks of
TREX cells expressing IRE1-3F6H-GFP WT or IRE1-3F6H-GFP D123P mutant plated on transwell plates for 6 h and stained with phalloidin coupled to
rhodamine. Lower panel: maximal projection of Z-stacks of cells in the lower chamber of a transwell. Arrowheads indicate IRE1α -GFP-positive foci.
f, Co-immunoprecipitation of IRE1α -HA (WT, K599A, P830L and D123P) and GFP-tagged filamin A in HEK293T cells was assessed by western blotting.
g, Co-immunoprecipitation of IRE1α -HA (WT, D123P, Δ 965 and AAAA) and GFP-tagged filamin A-22 domain in HEK293T cells was analysed by western
blotting. h, Co-immunoprecipitation of HA-tagged IRE1α (WT and D123P) and GFP-tagged filamin A-22 domain treated with Tm for 2 h was analysed
by western blotting. i, Native-PAGE and western blot of HEK293T cells transfected with HA-tagged IRE1α and GFP-tagged filamin A-24 dimerization
domain treated with Tm for 2 h. GFP-tagged filamin A-24 domain monomer (1N), dimer (2N), trimer (3N) and high molecular weight species (HMW)
are indicated. j, Left, filamin A phosphorylation was assessed by western blotting of protein extracts from IRE1α KO cells expressing IRE1α -HA (WT,
D123P or Mock) treated or not treated (NT) with with Tm. Right, quantification of the levels of filamin A phosphorylation in cells stimulated with FBS
(n = 3 independent experiments). In all panels, data represent the mean ± s.e.m. of the indicated number of independent experiments; one-way ANOVA
followed by Tukey’s test was used unless otherwise indicated. *P < 0.05. Blots represent one out of two (g,h), or three (f,i,j) experiments, with similar
results obtained.
NATURE CELL BIoLoGY | VOL 20 | AUGUST 2018 | 942–953 | www.nature.com/naturecellbiology 949

ARTICLES NATURE CELL BIOLOGY
ba
c d
9 hpf
Co
ntr
ol
IRE
1α-D
N
e f
j
g h i
11.5 hpf
Co
ntr
ol
IRE
1α-D
N
12 hpf
Co
ntr
ol
IRE
1α-D
N
Co
ntr
ol
IRE
1α-D
N
40 hpf
140/141
70/83
Epiboly
Convergence
Extension
Dorsal view
Lateral view
IRE
1 R
NA
iC
on
trol
0′ 15′ 30′ 45′
0′ 15′ 30′ 45′
IRE
1 R
NA
iC
on
trol
No
rm. p
ositio
nN
orm
. p
ositio
n
0 2.6(min)
0 2.6(min)
–0.2
0.1
–0.1
0.1
(μm
min
–1)
0 1 2 3–0.2
–0.1
0.0
0.1
Flu
ore
scence
inte
nsity (
AU
)
Time (min)
0 1 2 3–0.2
–0.1
0.0
0.1
Flu
ore
scence
inte
nsity (
AU
)
Time (min)
RN
Ai
Co
ntr
ol
+–
250
0IRE1 mutant
500
0.5
0
Circu
larity
+IRE1 mutant –
1.0
GFP
Actin
GFP
Nuclei
MA
RC
M I
RE
1
mu
tan
t m
acro
ph
ag
es
*
*
400
Bla
sto
de
rm
dis
pla
ce
me
nt
(μm
)
500
600
700 **
0He
ad
–ta
il a
ng
le
50
100
150 **
0
So
mites
wid
th (
μm
)
100
200
300 *
0
Circu
larity
0.5
1.0**
Po
sitio
n a
lon
g
ce
ll co
rte
x (
μm
)
0
4
8
–1
0
1
No
rma
lize
d
fluore
scence
inte
nsity
Control IRE1α-DN
2
0
Ve
locity
(μm
min
–1)
+RNAi: –
4
–+–Cheerio: – ++
100
0To
tal d
ista
nce
(μm
)
200
+RNAi: – –+–Cheerio: – ++
IRE1α-DN0′ 20′
40′ 60′
80′ 100′
Control0′ 20′
40′ 60′
80′ 100′actb1:
mcherry-
utrCH
Control
DN
Con
trol
IRE1α-DN
0
0.5
1.0
1.5
Pers
ista
nce
0
1
2
3
Velo
city
(μm
min
–1)
Co
ntr
ol
IRE
1α-D
N
Tg(sox17::GFP)
Control
RNAi
RNAi + Cheerio
Cheerio
k
**
**
*
*
50 μm
50 μm 50 μm
50 μm
(μm
min
–1)
DN
Con
trol
DN
Con
trol
DN
Con
trol
DN
Con
trol
DN
Con
trol
Are
a (
μm
2)
Fig. 7 | The activity of IRE1α in cell migration and actin dynamics is evolutionarily conserved. a, Cell movement trajectories of D. melanogaster
macrophages expressing control or an IRE1α RNAi under the control of the HmlΔ -Gal4 driver. For rescue experiments, IRE1α RNAi and Cheerio P(EP)
cheerG9093 were-co-expressed. Tracks were plotted (x and y axes correspond from –150 to 150 µ m) (one-way ANOVA followed by Tukey’s test; Control,
n = 3; IRE1α RNAi, n = 4; and Cheerio, n = 3 independent experiments). b, Time-lapse images of macrophages from a. Lamellipodia (red arrows) and
filopodia (yellow arrows) are indicated. c, Images of macrophages from MARCM mutant animals (see Methods). GFP-positive cells (IRE1α mutant)
or negative (control) were stained for F-actin (red) and DNA (blue) (n = 3) d, Actin dynamics were recorded in time-lapse images of macrophages
co-expressing LifeAct-GFP and IRE1α RNAi using the Cg-Gal4 driver (Control, n = 12 and IRE1α RNAi, n = 9). Velocity maps of representative cells for each
condition were generated using the ADAPT tool. e, Schematic representation of the three morphogenetic movements during zebrafish gastrulation.
f, Blastoderm displacement at 9 hpf was determined (broken red bracket). g, The angle formed between the radial lines that intersect the tip of the head
and tail at 11.5 hpf was plotted. h, The width of the first three somites at 12 hpf was calculated (broken green bracket) (n for controls = 9 (f), 19 (g) or 8 (h);
n for IRE1α -DN = 10 (f), 14 (g) or 6 (h)). i, Global phenotypes of embryos at 40 hpf are presented and quantified. j, Cell movement trajectories are shown
of control and IRE1α -DN injected Tg(sox17::GFP) embryos at 7 hpf. The persistence and cell velocity of migrating cells was determined. k, Top, maximum
projections of time-lapse confocal microscopy images of control and IRE1α -DN-injected Tg(actb1:mcherry-utrCH) embryos at 7 hpf. Time lapse images of
higher magnification area is indicated (white square). Bottom, heatmap of normalized fluorescence intensity along the cell cortex of individual cells and
cell circularity (n = 47 for control; n = 61 for IRE1α -DN). In all panels, data represent the mean ± s.e.m. of the indicated number of independent experiments;
two-tailed t-test was used unless otherwise indicated. *P < 0.05 and **P < 0.01. Scale bars, 50 μ m (a,j); 250 μ m (f–h).
NATURE CELL BIoLoGY | VOL 20 | AUGUST 2018 | 942–953 | www.nature.com/naturecellbiology950

ARTICLESNATURE CELL BIOLOGY
(Supplementary Fig. 7C). Remarkably, the vegetal progression of epiboly was delayed in IRE1α -DN embryos compared with control animals (Fig. 7f). Furthermore, this phenotype was associated with an increased head-to-tail angular separation (Fig. 7g) that is indica-tive of reduced anterior–posterior axial movements33. Finally, the width of the first somites at 12 h post fertilization was increased by ∼ 40 % in IRE1α -DN embryos compared with controls (Fig. 7h), suggesting that the paraxial mesoderm suffered defective con-vergence. These alterations resulted in embryos with a shortened anterior–posterior axis at 24 h post fertilization (Fig. 7i), a pheno-type that is suggestive of defective early gastrulation movements34. Importantly, none of these phenotypes were observed in embryos overexpressing wild-type IRE1α (Supplementary Fig. 7D).
We also observed reduced cell movement with single-cell track-ing during the epiboly process (Fig. 7j; Supplementary Movie 4). In addition, using an actin reporter35, we observed that epiblast cells of embryos injected with IRE1α -DN became rounded and
less cohesive during gastrulation, showing reduced filopodial-like activity and increased formation of blebs compared with controls (Fig. 7k; Supplementary Movie 5). Moreover, the cortical distribu-tion of F-actin appeared more homogeneous and less dynamic in IRE1α -DN embryos compared with controls (Fig. 7k; Supplementary Fig. 7E). Together, these experiments indicate that IRE1α expres-sion has a fundamental and evolutionarily conserved activity in controlling actin cytoskeleton function and cell movement in vivo.
IRE1α deficiency alters radial migration of cortical neurons mimicking periventricular nodular heterotopia. Filamin A expression is essential for neuronal migration during brain cortex development, and mutations in the FLNA gene are the main cause of periventricular nodular heterotopia, a syndrome characterized by the abnormal localization of neurons along the walls of the lat-eral ventricle36,37. Full IRE1α deficiency is embryonic lethal, and the reported characterization did not include the study of brain
a
IRE
1α H
et
IRE
1α K
O
Tbr1 NucleiTbr1/Nuclei
MZCP
IZ
VZ
Tbr1/Nuclei *
Trb
1 w
idth
(μm
)
0
40
80
0
200
400
Co
rtic
al w
idth
(μm
)
**
Het KOIRE1α:
shLuc
MZ
II/III
IV/V
VI
IZ
VZ/SVZ
shFLNAshIRE1α
GFPNuclei
b
f
0
10
20
30
FLNA WT:shIRE1α:
+–++
FLNA S2152A: –––+
+
40
50 *
c
0
20
40
60 ***
0
10
30
50
40
20
***
0
50
GF
P+ n
eu
ron
s (
%)
75
100
II/III
IV/V
VI
IZ
VZ/SVZ
shLu
c
***
e
VZ/SVZ
shIRE1α +
Mock
shIRE1α +
FLNA WT
MZ
II/III
IV/V
VI
IZ
shIRE1α +
FLNA S2152A
MycGFPNuclei
0
50
GF
P+ n
eu
ron
s (
%) 100
d
shIR
E1α
shFLN
AG
FP
+ n
eu
ron
s (
%)
GF
P+ n
eu
ron
s (
%)
shLu
c
shIR
E1α
shFLN
A
shLu
c
shIR
E1α
shFLN
A
shLu
c
shIR
E1α
shFLN
A
II/III IV/V VI
GF
P+ n
eu
ron
s (
%)
0
10
20
30
FLNA WT:shIRE1α:
+–++
FLNA S2152A: –––+
+
40
50 * *
GF
P+ n
eu
ron
s (
%)
II/III IV/VPro-migratory
stimulus
Actin cytoskeletonremodelling
Cellmovement
Haemocytesmigration
Epiboly anddevelopment
Brain cortexdevelopment
Cytosol
ER
IRE1α
PKCα
Filamin
A
n nPP
g
100 μm 200 μm
100 μm
100 μm
Fig. 8 | IRE1α is required for neuronal migration during brain cortex development. a, Left, IRE1α heterozygous (Het) or KO embryos were collected at
E14.5 and brain tissue analysed by Trb1 and nuclei staining. MZ, marginal zone, CP, cortical plate; IZ, intermediate zone; VZ, ventricular zone. Global image
is shown on the left, three magnified images are shown on the right. The dotted red lines indicate the area used for quantification. Right, quantification of
Trb1 (two-tailed t-test, n = 3) or cortical thickness (two-tailed t-test, n = 5) (red dotted line). b, Coronal sections were visualized for transfected neurons
(green) and cell nuclei using DAPI (blue). Merged images are shown. c, The percentage of GFP-positive cells was determined in different cortical brain
layers for each mouse (shRNA Luc, n = 19; shRNA IRE1α , n = 9; and shRNA filamin A, n = 7). VZ/subventricular zone (SVZ), IZ, layer VI (VI), layers IV/V
(IV/V) and layers II/III (II/III) are shown. d, Individual dot plots of the analysis by cortical layer are shown for all groups. e, In utero co-electroporation was
performed using shRNA to target IRE1α together with constructs expressing filamin A WT-Myc, filamin A S2152A-Myc or empty vector. Sections were
stained for Myc using specific antibodies and visualized by fluorescence microscopy. f, The percentage of transfected GFP-positive cells was determined
in indicated cortical layers in animals electroporated with shRNA IRE1α (Mock, n = 14; filamin A WT-Myc, n = 11; and filamin A S2152A-Myc, n = 7).
In all panels, the data are shown as the mean ± s.e.m. of the indicated number of independent experiments; one-way ANOVA followed by Tukey’s test was
used unless otherwise indicated. *P < 0.05 and **P < 0.01. g, Working model. The UPR transducer IRE1α signals through an unconventional mechanism
that is independent of its enzymatic activities to control actin cytoskeleton dynamics. Monomeric IRE1α physically interacts with filamin A through a
novel domain located at the distal C-terminal region. A pro-migratory stimulus triggers IRE1α dimerization, increasing the binding of filamin A and the
recruitment of PKCα . Phosphorylation of filamin A at S2152 by PKCα increases actin cytoskeleton remodelling and cell migration in various animal species.
NATURE CELL BIoLoGY | VOL 20 | AUGUST 2018 | 942–953 | www.nature.com/naturecellbiology 951

ARTICLES NATURE CELL BIOLOGY
structures38. Therefore, we generated IRE1α (Ern1)-null animals and examined brain tissue at embryonic day 14.5 (E14.5). An analysis of post-mitotic cells of layer VI of the brain cortex after Tbr1 stain-ing revealed a delay in the formation of this layer in IRE1α knock-out animals compared with heterozygous mice (Fig. 8a). Similar observations were obtained when the width of the cortex was quantified (Fig. 8a).
We defined whether the morphological alterations observed during brain development in IRE1α -deficient animals were due to altered radial cell migration in vivo. We studied animals at E14.5 because high levels of filamin A and IRE1α were detected at that developmental stage (E12.5–14.5) (Supplementary Fig. 8C,D). We then performed in utero brain electroporation to knock down IRE1α in the developing cortex together with GFP at E14.5 to tar-get cortical neural progenitors (strategy in Supplementary Fig. 8B). Normal development of neurons in layers II/III at birth was observed in control brains electroporated with a construct expressing a shRNA against luciferase mRNA (control). In contrast, brains elec-troporated with a shRNA to target IRE1α showed delayed migration (Fig. 8b). Quantification of neuronal distribution in cortical layers demonstrated that knocking down IRE1α resulted in a significant delay of neuronal migration, with cells accumulating at inferior cor-tical layers (Fig. 8c,d; Supplementary Fig. 8E). For comparison, we also knocked down filamin A, which also resulted in altered neuro-nal migration (Fig. 8b–d). Remarkably, electroporation of wild-type filamin A together with the shRNA targeting IRE1α , but not the filamin A S2152 mutant, rescued the detrimental effects of IRE1α deficiency in cortical neuronal migration, leading to a recovery in the percentage of cells reaching layer II/III and IV/V (Fig. 8e,f; Supplementary Fig. 8F,G). Overall, these results demonstrate that the regulation of filamin A by IRE1α plays an essential role in neu-ronal migration during brain cortex development.
DiscussionAlthough IRE1α represents the most conserved UPR signal trans-ducer, its physiological function is still poorly understood. Most studies addressing the biological relevance of IRE1α in tissue homeostasis have been developed in artificial models of ER stress, and only a few reports support the existence of alternative activities of the pathway beyond protein-folding stress. Here, we identified filamin A as a major IRE1α interactor and uncovered a previously unanticipated function of this protein in the regulation of actin cytoskeleton dynamics, with a significant impact on cell migration in various model systems. Remarkably, although many interac-tome studies have been performed to identify novel IRE1α binding partners2, no direct connections between IRE1α and cytoskeleton dynamics have been reported.
We characterized an unconventional signalling mechanism underlying IRE1α function, whereby it serves as a scaffold to recruit filamin A and potentiate the migratory capacity of the cell. We fully dissected the impact of IRE1α in cell migration, which is distinct from its classical role in the UPR and mediated by a previously uncharacterized proline-rich domain. We propose a two-step model whereby filamin A is associated to the ER through direct binding to IRE1α . Then, after stimulation with a pro-migratory stimulus, IRE1α dimerization and oligomerization induces a further recruit-ment of filamin A, scaffolding to PKCα , to increase filamin A dimer-ization and phosphorylation. This mechanism results in increased cytoskeleton dynamics (Fig. 8g). At the molecular level, we provide evidence to indicate that IRE1α increases filamin A phosphoryla-tion at S2152, a specific regulatory event controlling cytoskeleton dynamics. One main question that remains to be addressed is the nature of the signals promoting IRE1α oligomerization during cell migration.
Alterations of filamin A are the underlying cause of periven-tricular nodular heterotopia, a human condition affecting brain
development and is associated with mental retardation and cogni-tive impairment36,37. Our study demonstrates that targeting IRE1α phenocopies the consequences of filamin A deficiency in the devel-oping brain. At least ten different regulators of filamin A are able to modulate neuronal migration39, suggesting that a tight regula-tory network that fine-tunes filamin A function is fundamental for brain development. Fingerprints of UPR activation were reported during the brain development in mouse, Caenorhabditis elegans and D. melanogaster models (reviewed previously40). Interestingly, PERK expression also affects brain development at the level of neurogenesis and the generation of intermediate progenitors and projection neurons of the brain cortex41. Moreover, the alternative activity of IRE1α described here may be relevant in the context of other diseases. FiIamin A has been proposed to contribute to the metastatic potential of cancer42. Thus, the IRE1α –filamin A axis may also enhance the occurrence of metastasis, an activity that may be insensitive to chemotherapy based on IRE1α RNase inhibitors. Overall, our study demonstrates a conserved function of IRE1α in actin cytoskeleton dynamics that is independent of its well-known role as an ER stress transducer, acting as a scaffold that recruits and potentiates filamin A function. Our findings illuminate how fun-damental processes surveilling ER homeostasis are interconnected with the global machinery controlling cell movement.
MethodsMethods, including statements of data availability and any asso-ciated accession codes and references, are available at https://doi.org/10.1038/s41556-018-0141-0.
Received: 21 June 2017; Accepted: 13 June 2018; Published online: 16 July 2018
References 1. Walter, P. & Ron, D. The unfolded protein response: from stress pathway to
homeostatic regulation. Science 334, 1081–1086 (2011). 2. Hetz, C., Chevet, E. & Oakes, S. A. Proteostasis control by the unfolded
protein response. Nat. Cell Biol. 17, 829–838 (2015). 3. Urra, H., Dufey, E., Lisbona, F. & Rojas-Rivera, D. When ER stress reaches a
dead end. Biochim. Biophys. Acta 1833, 3507–3517 (2013). 4. Oakes, S. A. & Papa, F. R. The role of endoplasmic reticulum stress in human
pathology. Annu. Rev. Pathol. 10, 173–194 (2015). 5. Wang, M. & Kaufman, R. J. Protein misfolding in the endoplasmic reticulum
as a conduit to human disease. Nature 529, 326–335 (2016). 6. Calfon, M. et al. IRE1 couples endoplasmic reticulum load to secretory
capacity by processing the XBP-1 mRNA. Nature 415, 92–96 (2002). 7. Lee, K. et al. IRE1-mediated unconventional mRNA splicing and S2P-
mediated ATF6 cleavage merge to regulate XBP1 in signaling the unfolded protein response. Genes Dev. 16, 452–466 (2002).
8. Hetz, C. & Glimcher, L. H. Fine-tuning of the unfolded protein response: Assembling the IRE1alpha interactome. Mol. Cell 35, 551–561 (2009).
9. Feng, Y. & Walsh, C. A. The many faces of filamin: a versatile molecular scaffold for cell motility and signalling. Nat. Cell Biol. 6, 1034–1038 (2004).
10. Oono, K. et al. JAB1 participates in unfolded protein responses by association and dissociation with IRE1. Neurochem. Int. 45, 765–772 (2004).
11. Nakamura, F., Stossel, T. P. & Hartwig, J. H. The filamins: organizers of cell structure and function. Cell Adhes. Migr. 5, 160–169 (2011).
12. Sepulveda, D. et al. Interactome screening identifies the ER luminal chaperone Hsp47 as a regulator of the unfolded protein response transducer IRE1alpha. Mol. Cell 69, 238–252 (2018).
13. Nakamura, F., Osborn, T. M., Hartemink, C. A., Hartwig, J. H. & Stossel, T. P. Structural basis of filamin A functions. J. Cell Biol. 179, 1011–1025 (2007).
14. Riedl, J. et al. Lifeact: a versatile marker to visualize F-actin. Nat. Methods 5, 605–607 (2008).
15. Ridley, A. J. Rho GTPases and cell migration. J. Cell Sci. 114, 2713–2722 (2001). 16. Vadlamudi, R. K. et al. Filamin is essential in actin cytoskeletal assembly
mediated by p21-activated kinase 1. Nat. Cell Biol. 4, 681–690 (2002). 17. Baldassarre, M. et al. Filamins regulate cell spreading and initiation of cell
migration. PLoS ONE 4, e7830 (2009). 18. Lynch, C. D. et al. Filamin depletion blocks endoplasmic spreading and
destabilizes force-bearing adhesions. Mol. Biol. Cell 22, 1263–1273 (2011). 19. van Vliet, A. R. et al. The ER stress sensor PERK coordinates ER-plasma
membrane contact site formation through interaction with filamin-A and F-actin remodeling. Mol. Cell 65, 885–899 (2017).
NATURE CELL BIoLoGY | VOL 20 | AUGUST 2018 | 942–953 | www.nature.com/naturecellbiology952

ARTICLESNATURE CELL BIOLOGY
20. Ali, M. M. et al. Structure of the Ire1 autophosphorylation complex and implications for the unfolded protein response. EMBO J. 30, 894–905 (2011).
21. Bouchecareilh, M., Higa, A., Fribourg, S., Moenner, M. & Chevet, E. Peptides derived from the bifunctional kinase/RNase enzyme IRE1α modulate IRE1α activity and protect cells from endoplasmic reticulum stress. FASEB J. 25, 3115–3129 (2011).
22. Zhou, A.-X., Hartwig, J. H. & Akyürek, L. M. Filamins in cell signaling, transcription and organ development. Trends Cell Biol. 20, 113–123 (2010).
23. Zhong, Z. et al. Cyclin D1/cyclin-dependent kinase 4 interacts with filamin A and affects the migration and invasion potential of breast cancer cells. Cancer Res. 70, 2105–2114 (2010).
24. Tigges, U., Koch, B., Wissing, J., Jockusch, B. M. & Ziegler, W. H. The F-actin cross-linking and focal adhesion protein filamin A is a ligand and in vivo substrate for protein kinase C alpha. J. Biol. Chem. 278, 23561–23569 (2003).
25. Sarkisian, M. R. et al. MEKK4 signaling regulates filamin expression and neuronal migration. Neuron 52, 789–801 (2006).
26. Xue, Z. et al. A conserved structural determinant located at the interdomain region of mammalian inositol-requiring enzyme 1α . J. Biol. Chem. 286, 30859–30866 (2011).
27. Li, H., Korennykh, A. V., Behrman, S. L. & Walter, P. Mammalian endoplasmic reticulum stress sensor IRE1 signals by dynamic clustering. Proc. Natl Acad. Sci. USA 107, 16113–16118 (2010).
28. Wood, W. & Jacinto, A. Drosophila melanogaster embryonic haemocytes: masters of multitasking. Nat. Rev. Mol. Cell Biol. 8, 542–551 (2007).
29. Lee, T. & Luo, L. Mosaic analysis with a repressible cell marker (MARCM) for Drosophila neural development. Trends Neurosci. 24, 251–254 (2001).
30. Solnica-Krezel, L. & Sepich, D. S. Gastrulation: making and shaping germ layers. Annu. Rev. Cell Dev. Biol. 28, 687–717 (2012).
31. Auf, G. et al. Inositol-requiring enzyme 1α is a key regulator of angiogenesis and invasion in malignant glioma. Proc. Natl Acad. Sci. USA 107, 15553–15558 (2010).
32. Nguyen, D. T. et al. Nck-dependent activation of extracellular signal-regulated kinase-1 and regulation of cell survival during endoplasmic reticulum stress. Mol. Biol. Cell 15, 4248–4260 (2004).
33. Hammerschmidt, M. et al. Mutations affecting morphogenesis during gastrulation and tail formation in the zebrafish, Danio rerio. Development 123, 143–151 (1996).
34. Waxman, J. S., Hocking, A. M., Stoick, C. L. & Moon, R. T. Zebrafish Dapper1 and Dapper2 play distinct roles in Wnt-mediated developmental processes. Development 131, 5909–5921 (2004).
35. Behrndt, M. et al. Forces driving epithelial spreading in zebrafish gastrulation. Science 338, 257–260 (2012).
36. Fox, J. W. et al. Mutations in filamin 1 prevent migration of cerebral cortical neurons in human periventricular heterotopia. Neuron 21, 1315–1325 (1998).
37. Sheen, V. L. et al. Mutations in the X-linked filamin 1 gene cause periventricular nodular heterotopia in males as well as in females. Hum. Mol. Genet. 10, 1775–1783 (2001).
38. Iwawaki, T., Akai, R., Yamanaka, S. & Kohno, K. Function of IRE1 alpha in the placenta is essential for placental development and embryonic viability. Proc. Natl Acad. Sci. USA 106, 16657–16662 (2009).
39. Sarkisian, M. R., Bartley, C. M. & Rakic, P. Trouble making the first move: interpreting arrested neuronal migration in the cerebral cortex. Trends Neurosci. 31, 54–61 (2008).
40. Martinez, G., Khatiwada, S., Costa-Mattioli, M. & Hetz, C. ER proteostasis control of neuronal physiology and synaptic function. Trends Neurosci. https://doi.org/10.1016/j.tins.2018.05.009 (2018).
41. Laguesse, S. et al. A dynamic unfolded protein response contributes to the control of cortical neurogenesis. Dev. Cell 35, 553–567 (2015).
42. Savoy, R. M. & Ghosh, P. M. The dual role of filamin A in cancer: can’t live with (too much of) it, can’t live without it. Endocr. Relat. Cancer 20, R341–R356 (2013).
AcknowledgementsWe thank P. Walter for providing IRE1-3F6H-GFP cells and M. P. Sheetz for providing filamin A-deficient cells and expression vectors. In addition, we thank D. Calderwood and D. Iwamoto for providing IgG-like filamin A individual plasmids tagged with GFP or GST. We thank L. Leyton for providing phospho-specific anti-PKC antibodies. This work was funded by the following bodies: FONDECYT no. 3160461 (to H.U.), no. 1140549 and 1180993 (to C.H.), no. 1140325 (to C.G.-B.), no. 1150608 (to R.L.V.); no. 1150766 (to F.C.); no. 3160478 (to E.P.); no. 3150113 (to A.C-S.) and no. 1140522 (to Á.G.); Millennium Institute No. P09-015-F (to C.H., A.C. and M.L.C.); FONDAP 15150012 (to C.H., F.C., C.G.-B. and M.L.C.); FONDAP 15090007 (to Á.G.); ECOS-CONICYT 170032 (to C.H.); PIA-CONICYT ACT1401 (to Á.G.); NIH R01 Gm113188 (L.Q.)and CONICYT ACT1402 (to M.L.C.). We also thank the following organizations: the European Commission R&D MSCA-RISE #734749; The Michael J Fox Foundation for Parkinson’s Research—Target Validation grant No 9277; FONDEF ID16I10223; FONDEF D11E1007; the US Office of Naval Research-Global (ONR-G) N62909-16-1-2003; the US Air Force Office of Scientific Research FA9550-16-1-0384; ALSRP Therapeutic Idea Award AL150111; Muscular Dystrophy Association 382453; and CONICYT-Brazil 441921/2016-7 (to C.H.). T.I. is supported by the Toray Science Foundation. J.C., C.M.L (no. 21160967) and D.R.H. are doctoral fellows supported by a CONICYT fellowship and by a CONICYT research grant.
Author contributionsH.U and C.H. designed the study. H.U., D.R.H., J.C., D.V.-C., A.C.-S., E.C., E.P., E.M., Y.M.H., C.M.L., S.A.-R., R.F., R.L.V., R.A., D.A.R. and C.A:R. participated in experimental designs, performed experiments and analysed the data. R.L.V., F.C., A.C., L.Q., E.C., T.I., M.L.C., Á.G. and C.G.-B. supervised the experiments and participated in the designs. H.U and C.H. wrote or contributed to writing the manuscript. All authors read and approved the final version of the manuscript.
Competing interestsThe authors declare no competing interests.
Additional informationSupplementary information is available for this paper at https://doi.org/10.1038/s41556-018-0141-0.
Reprints and permissions information is available at www.nature.com/reprints.
Correspondence and requests for materials should be addressed to C.H.
Publisher’s note: Springer Nature remains neutral with regard to jurisdictional claims in published maps and institutional affiliations.
NATURE CELL BIoLoGY | VOL 20 | AUGUST 2018 | 942–953 | www.nature.com/naturecellbiology 953

ARTICLES NATURE CELL BIOLOGY
MethodsReagents. Tunicamycin was purchased from Calbiochem EMB Bioscience. Cell culture media, fetal calf serum and antibiotics were obtained from Life Technologies. Fluorescent probes and secondary antibodies coupled to fluorescent markers were purchased from Molecular Probes, Invitrogen. All other reagents used were from Sigma or of the highest grade available.
Cell culture and DNA constructs. All MEFs and HEK cells were maintained in Dulbecco’s modified Eagle’s medium (DMEM) supplemented with 5% FBS, non-essential amino acids and grown at 37 °C and 5% CO2. IRE1α -deficient cells were produced as previously described6. Briefly, retroviral plasmids were transfected using Effectene (Qiagen) into HEK293GPG cells in order to prepare IRE1α -HA expressing retroviruses were generated, as previously described43, in the pMSCV-Hygro vector, whereby the IRE1α contains two tandem HA sequences at the C-terminal domain and a precision enzyme site before the HA tag. pRK5-F6 or F11 plasmids were generated as previously described21. Constructs of pEGFP expressing filamin A were generated as previously described18. Wild-type filamin A or S2152A mutants in pcDNA3.1 plasmids were a gift from J. Blenis (Addgene plasmid # 8982 and # 8983) (Weill Cornell Medicine, New York, NY). Wild-type filamin A or S2152A mutants in pcDNA3.1 plasmids were subcloned into the pCAGIG vector for in utero electroporation experiments44.
Yeast-two hybrid assays. The interaction between the IRE1α Δ N protein and a library of adult mouse cDNA was performed using a Matchmaker Gold Yeast Two-Hybrid System (Clontech) according to the manufacturer’s protocols. Briefly, AH109 yeast cells were transformed with plasmid pGADT7 (bait) encoding the cytoplasmic domain of IRE1α (IRE1α Δ N). The Y187 yeast strain contains the plasmid pGBKT7 (prey) encoding for a Normalized Yeast Two-Hybrid cDNA Library derived from adult mouse brain. Both plasmids encode for four different reporters: HIS3, ADE2, MEL1 and LacZ. AH109 and Y187 were mated for 24 h at 30 °C in YPDA media (common media containing yeast extract, peptone, dextrose and adenine). Mated yeasts were plated in synthetic defined medium SD-Leu/-Trp (DDO), SD-Leu/-Trp/-His (TDO) or SD-Leu/-Trp/-His/-Ade (QDO) for 3–7 days at 30 °C. The positive interactions were re-tested by re-streaking on TDO and QDO media after 3–7 days at 30 °C. Media lacking amino acids were also supplemented with X-α -galactoside (40 μ g ml–1), which changes the colonies that exhibit a positive interaction blue in colour. A growth index was calculated by visual observation (0 to 3 score) of the size and blue colouration of the selected colonies in TDO and QDO media. We used the interaction between pGBKT7-p53 and pGADT7-T as a positive control (Clontech). Plasmids of yeast colonies that showed positive interactions were rescued and transformed into Escherichia coli and then purified. Purified clones were then sequenced, and bioinformatics analysis was performed to identify target sequences.
To validate the interaction between IRE1α and filamin A, AH109 yeast cells were co-transformed with plasmid pGADT7-IRE1α Δ N and pGBKT7-filamin A. Eight microlitres of each suspension and three subsequent tenfold serial dilutions were individually spotted onto a medium SD-Leu/-Trp, SD-Leu/-Trp/-His and SD (-Leu/-Trp/-His/X-α -Gal) plates for selection. Cells were incubated at 30 °C for 2 days.
RNA isolation, RT-PCR and real-time PCR. PCR primers and methods for the Xbp1 mRNA splicing assay have been previously described45. Xbp1s mRNA was monitored by semi-quantitative PCR using the following primers: 5′ -AAGAACACGCTTGGGAATGG-3′ and 5′ -CTGCACCTGCTGCGGAC-3′ . For the analysis of transcription targets and mRNA decay, real-time PCR assays were performed as described previously46 using the following primers: Erdj4: 5′ -CCCCAGTGTCAAACTGTACCAG-3′ and 5′ - AGCGTTTCCAATTTTCCATAAATT-3′ ; β -actin: 5′ -TACCACCAT GTACCCAGGCA-3′ and 5′ -CTCAGGAGGAGCAATGATCTTGAT-3′ ; Blos1: 5′ -TCCCGCCTGCTCAAAGAAC-3′ and 5′ -GAGGTGATCCACCAACGCTT-3′ ; and Rpl19: 5′ -CTGATCAAGGATGGGCTGAT-3′ and 5′ -GCCGCTATGTA CAGACACGA-3′ .
For mRNA analysis of cortex samples, real-time PCR assays were performed using the following primers: Ire1α : 5´-CTCAGGATAATGGTAGCCATGTC-3´ and 5´-ACACCGACCACCGTATCTCA-3´, filamin A: 5´-TGGGATGCTAG TAAGCCTGTG-3´ and 5´-CTGGGGTAATCACCTGAGGAAT-3´ and β -actin: 5´-CTCAGGAGGAGCAATGATCTTGAT-3´ and 5´- TACCACCAT GTACCCAGGCA-3.
Immunoprecipitation assays. HEK cells were co-transfected with different DNA constructs. After 48 h, protein extracts were prepared in lysis buffer (0.5% NP-40, 150–350 mM NaCL, 150 mM KCl, 50 mM Tris pH 7.6, 5% glycerol, 50 mM NaF, 1 mM Na3VO4, 250 mM PMSF, and protease inhibitors). Immunoprecipitation assays were performed as previously described45. In brief, to immunoprecipitate HA-tagged IRE1α , protein extracts were incubated with anti-HA antibody–agarose complexes (Roche) for 4 h at 4 °C, and then washed 3 times with lysis buffer (1 ml) and then once in lysis buffer with 500 mM NaCl. Protein complexes were eluted by heating at 95 °C for 5 min in loading buffer.
IRE1α -deficient MEFs cells stably transduced with retroviral expression vectors for IRE1α -HA or empty vector were incubated in the presence or absence of tunicamycin (500 ng ml–1). Cell lysates were prepared for immunoprecipitation as described above for HEK cells. As a control, to eliminate nonspecific background binding, experiments were performed in parallel in IRE1α knockout cells. Protein complexes were eluted by heating at 95 °C for 5 min in loading buffer. Huh7 cells grown to subconfluency were lysed using 0.5% NP-40, 30 mM Tris-HCl pH 7.5, 150 mM NaCl, and proteases and phosphatases inhibitors (Complete, Phostop; Lysis Buffer) for 20 min at 4 °C, and lysates were clarified by centrifugation at 13,200 r.p.m. for 15 min. Clarified lysates were precleared with Protein A Sepharose beads (or magnetic beads) for 30 min at 4 °C. Precleared lysates were then incubated overnight with 5 µ l ml–1 of lysate of anti-IRE1α antibodies (Santa Cruz Biotechnologies) at 4 °C followed by incubation with Protein A for 30 min at 4 °C. Beads were collected by centrifugation (30 s, 13,200 r.p.m. (rotor FA-45-18-11)) and washed 5 times with Lysis Buffer. Beads were dried and resuspended in sample buffer 2× . Samples were heated for 5 min at 95 °C and resolved by SDS–PAGE 8% followed by western blot analysis.
Expression of recombinant proteins. Expression and purification of the CRIB domain of PAK1 or the FLNA-19–21 and FLNA-21–24 IgG repeats were performed as described previously47. BL21 (DE3) E. coli strains carrying pGEX-glutathione S-transferase (GST)-CRIB were grown overnight at 37 °C in Luria broth media containing ampicillin. Cultures were diluted 1:100 and grown in fresh medium at 37 °C to an optical density at 600 nm of 0.7. Next, IPTG (isopropyl β -D-1-thiogalactopyranoside) was added to a final concentration of 1 mM. The cultures were grown for an additional 2 h and then samples were collected and sonicated in lysis buffer A (50 mM Tris-HCl pH 8.0, 1% Triton X-100, 1 mM EDTA, 150 mM NaCl, 25 mM NaF, 0.5 mM PMSF and protease inhibitor complex (Roche)). Cleared lysates were affinity purified with glutathione-Sepharose beads (Amersham). Loaded beads were washed ten times with lysis buffer B (lysis buffer A with 300 mM NaCl) at 4 °C. GST fusion protein was quantified and visualized in SDS–polyacrylamide gels stained with Coomassie brilliant blue.
Pull-down assays. FLNA-19–21 and FLNA-21–24 GST filamin domains bound to Sepharose-glutathione resin were incubated with 4 µ g of the cytoplasmic domain of GST-tagged IRE1α for 6 h at 4 °C on an end-to-end rotor. After incubation, the mixture was centrifuged at 2,000 r.p.m. for 4 min and the supernatant was discarded. The resin was washed with 400 µ l of lysis buffer at 4 °C for 10 min and subsequently centrifuged. This process was repeated five times. The bound proteins were eluted by boiling in SDS sample buffer at 95 °C for 5 min and analysed by western blotting.
Western blot analysis. Cells were collected and homogenized in RIPA buffer (20 mM Tris pH 8.0, 150 mM NaCl, 0.1% SDS, 0.5% Triton X-100) containing a protease inhibitor cocktail (Roche) in presence of 50 mM NaF and 1 mM Na3VO4. Protein concentrations were determined in all experiments by micro-BCA assay (Pierce), and 20-40 µ g of total protein was loaded onto 8–12 % SDS–PAGE minigels (Bio-Rad Laboratories) before transfer onto polyvinylidene fluoride membranes. Membranes were blocked using PBS, 0.1% Tween20 (PBST) containing 5% milk for 60 min at room temperature then probed overnight with primary antibodies. The following antibodies diluted in blocking solution were used: anti-HSP90 (1:5000); anti-HA (1:1000; Roche); anti-GFP (1:3000; Sigma); anti-filamin A (1:1000); anti-phospho S2152 filamin A (1:1000); and anti-IRE1α (1:1000; Cell Signaling Technology). Bound antibodies were detected with peroxidase-coupled secondary antibodies (incubated for 1 h at room temperature) and an ECL system.
ER fractionation. Subcellular fractionation was performed following a previously described protocol48. In brief, cells were washed and ground in a stainless-steel dounce dura-grind tissue grinder (Wheaton). Cellular integrity was evaluated every five strokes with trypan blue staining. Homogenate was centrifuged 2 times at 640 × g to remove unbroken cells and nuclei. Supernatant was centrifuged twice at 9,000 × g to pellet crude mitochondria. The supernatant was further spun at 20,000 × g for 30 min to obtain a pellet of lysosomes and plasma membrane and a supernatant that, upon further 100,000 × g centrifugation, gave a supernatant (cytosol) and a pellet (ER). Western blot analyses were used to validate each fraction with different antibodies.
Indirect immunofluorescence analysis. IRE1α -HA, PKCα -Flag and KDEL proteins were visualized by immunofluorescence. Cells were fixed for 30 min with 4% paraformaldehyde and permeabilized with 0.5% NP-40 in PBS containing 0.5% bovine serum albumin (BSA) for 10 min. After blocking for 1 h with 10% FBS in PBS containing 0.5% BSA, cells were incubated with anti-HA, anti-Flag or anti-KDEL antibodies overnight at 4 °C. Cells were washed three times in PBS containing 0.5% BSA, and incubated with Alexa-conjugated secondary antibodies (Molecular Probes) for 1 h at 37 °C. Nuclei were stained with Hoechst dye. Coverslips were mounted with Fluoromount G onto slides and visualized by confocal microscopy (Fluoview FV1000).
We used a sensitive method based on a confined displacement analysis algorithm to calculate colocalization coefficients between IRE1α -HA and filamin A-GFP49.
NATURE CELL BIoLoGY | www.nature.com/naturecellbiology

ARTICLESNATURE CELL BIOLOGY
The colocalization of images was performed as previously described49. Briefly, images obtained by confocal microscopy using a × 60 oil objective lens (NA: 1.35) were subjected to Huygens deconvolution software. Each channel used for filamin A-GFP, IRE1α -HA and KDEL RFP (or Flag) was then segmented using a series of filters using IDL software to obtain masked images of each channel. These masked images were used to determine Manders colocalization coefficients and to quantify true and random colocalization between channels. In addition, a specific mask was applied to evaluate colocalization in the ER region (KDEL-RFP) or total cellular area (filamin A-GFP).
Targeting IRE1α in MEFs. We generated stable MEFs with reduced levels of IRE1α using previously described methods50 by targeting IRE1α mRNA with two different shRNAs using the lentiviral expression vector pLKO.1 and puromycin selection. As a control, a shRNA against the luciferase gene was used. Constructs were obtained from The Broad Institute. Targeting sequences used for mouse IRE1α were as follows: GGAATCCTCTACATGGGTAAA and GCTGAACTACTTGAGGAATTA. To generate lentiviruses, HEK cells were transfected using the calcium phosphate protocol with 1 µ g of VSV-G vector, 1 µ g of Δ 8.9 vector and 1 µ g of shRNA vector. After 48 h of transfection, the supernatant was collected and filtered through a 0.45 µ m filter. MEF cells were transduced with a 1:1 dilution of viral supernatant containing 8 µ g ml–1 of polybrene. After 24 h of infection, cells were washed and incubated with 2 µ g ml–1 of puromycin until selection was obtained. The CRISPR line IRE1α CRISPR was generated using the mouse IRE1α Double Nickase system (Santa Cruz Biotechnology) as indicated by the manufacturer.
Cell migration assays. Confluent monolayers of MEF cells were wounded with a 20–200 ml pipette tip. Cells were washed twice with PBS and DMEM with 3% FBS was added as stimuli. Images were acquired using a × 10 objective lens and an inverted microscope at 0 and 16 h of migration. The wounded area was calculated using ImageJ software as previously described51. Transwell assays were performed in Boyden chambers (Transwell Costar, 6.5 mm diameter, 8 µ m pore size) according to the manufacturer’s instructions. Briefly, the bottom of the inserts were coated with 2 µ g ml–1 fibronectin. Cells (3 × 10⁴) re-suspended in serum-free medium were plated onto the top of each chamber insert and serum-free medium was added to the bottom chamber. After 4–6 h, inserts were removed, washed and cells that migrated to the bottom portion of the inserts were stained with 0.1% crystal violet in 2% ethanol and counted using an inverted microscope. In addition, cell-bound dye was eluted with methanol, and the absorbance was measured at 600 nm. For cell adhesion experiments, cells were plated on fibronectin-coated coverslips for different times. Cells were fixed with 4% paraformaldehyde and stained with 0.1% crystal violet in 2% ethanol to evaluate cell adhesion or processed for immunofluorescence to evaluate cell and ER spreading.
In addition, MEFs were co-transfected with different plasmids and pEGFP. Cells were re-seeded onto the top of each chamber insert coated with 2 µ g ml–1 fibronectin and allowed to migrate for 4–6 h. Then, inserts were removed, washed and the number of GFP-positive cells was counted in 8 different fields using a fluorescent inverted microscope and a × 20 objective lens.
Actin cytoskeleton dynamics. MEF cells were seeded onto fibronectin-coated 25-mm coverslips, transfected with EGFP-Lifeact using Lipofectamine 2000 Transfection Reagent and imaged in HBSS medium supplemented with HEPES using a confocal microscope (Zeiss LSM 710) with a × 63/1.4 NA oil-immersion objective lens at 37 °C. Images were acquired every 30 s for 5 min, and the number of lamellipodia per cell was determined manually, as previously described52. In addition, to perform a protrusion and retraction analysis, images were segmented using maximum threshold53. Then, subsequent images were merged assigning the first image as green and the second image as red. The total area of green (protrusions) and red (retractions) colour of merged images was obtained using ImageJ software. In addition, cells were fixed and stained with phalloidin coupled to rodamine and visualized by confocal microscopy. The number of lamellipodia per cell was determined manually as described previously52.
Rac1 activation assays. Purified loaded beads containing the CRIB domain were incubated for 70 min at 4 °C with 1 mg of either MEF lysates using fishing buffer (50 mM Tris-HCl pH 7.5, 10% glycerol, 1% Triton X-100, 200 mM NaCl, 10 mM MgCl2, 25 mM NaF and protease inhibitor complex). The beads were washed three times with washing buffer (50 mM Tris-HCl pH 7.5, 30 mM MgCl2 and 40 mM NaCl) and then re-suspended in SDS–PAGE sample buffer. Bound Rac1-GTP was subjected to immunoblot analysis and quantified with respect to total Rac1 using ImageJ.
IRE1α oligomerization assay. TREX cells expressing IRE1-3F6H-GFP wild-type or D123P were obtained from Cornell University and were generated as previously described27. TREX cells plated and treated with doxycycline (500 ng ml–1) for 48 h. Cells were treated with tunicamycin (1 µ g ml–1) of for different time points and fixed with 4% paraformaldehyde for 30 min. Nuclei were stained with Hoechst dye. Coverslips were mounted with Fluoromount G onto slides and visualized by
confocal microscopy (Fluoview FV1000). The number and size of IRE1α clusters were quantified using segmentation and particle analysis in ImageJ software.
Brain analysis of IRE1α knockout animals. Female and male IRE1α heterozygous mice were mated to obtain IRE1α heterozygous and knockout embryos. Both IRE1α knockout and control embryos at E14.5 were surgically collected from the pregnant IRE1α heterozygous mice. Each tail tip was immediately cut off from the embryonic body and was used for genotyping as previously described38. Then, each embryonic body was rinsed in PBS and then fixed in 4% paraformaldehyde phosphate buffer solution on a reciprocal shaker (50 osc. per min) for 24 h at room temperature. After fixation, each embryonic body was cryoprotected in 30% sucrose PBS on a reciprocal shaker (50 osc. per min) for 24 h at room temperature. Brains were collected and coronal sections were obtained for histological analyses, using anti-Trb1-specific antibodies and nuclei staining with DAPI. Images were obtained using an epifluorescence inverted microscope at × 10 and × 20 magnification. The width of the cortex and layer IV (Trb1 staining) was measured using ImageJ software. The experimental protocol (#2017-51) was approved by the Animal Studies Committees at Kanazawa Medical University and was compliant with all relevant ethical regulations regarding animal research.
In utero electroporation. In utero electroporation was performed as described previously54,55. Uterine horns of timed-pregnant dams were exposed by midline laparotomy after anaesthetization with isoflurane inhalation. A 2- μ l solution containing 4 μ g of DNA plasmid (shRNAs for IRE1α or a luciferase control co-expressed with a GFP-encoding vector at a 1:5 ratio) mixed with 0.02% fast green dye were injected into the lateral ventricles of E14.5 brains and then introduced into ventricular zone cells by delivering five electric pulses at 45 V for 50 ms, with 950 ms intervals, through the uterine wall using a Gene Pulser Xcell (Bio-Rad). After electroporation of all embryos, the uterus was replaced within the abdomen, the cavity was filled with warm sterile saline, and the abdominal muscle and skin incisions were closed with silk sutures. Animals were left to recover in a warm clean cage. Pups were harvested 5 days later (P0), and the position of transfected neurons in coronal sections was analysed by fluorescence microscopy. Cortex layers were identified via the nuclei density among the analysed section. The number of GFP-positive cells and total fluorescence intensity by layer was quantified using ImageJ software in all brain sections. All experiments were performed in accordance with the appropriate institutional guidelines of the Faculty of Medicine of the University of Chile and compliant with all relevant ethical regulations regarding animal research.
D. melanogaster strains and in vivo imaging. The following strains were obtained from the Bloomington Stock Center: Cg-Gal4; HmlΔ -Gal4, 2xEGFP; UAS-mCD8-GFP; Iref02170/TM6B; hsFLP; Tub-Gal4, UAS-GFP/CyO, Act-GFP; Tub-Gal80TS, FRT82B P{EP}cherG9093. UAS-Ire1-IR (v39562) was obtained from the Vienna Drosophila Research Center. All crosses were made at 25 °C. Pupae at 20 ± 2 h after puparium formation were mounted as described previously56. The migration of GFP-labelled macrophages was recorded using a Carl Zeiss LSM710 microscope with a × 40 objective. Movies are Z-projections of 12 1- μ m slices acquired every 60 s for 50 min. Cells trajectories were recorded using the ImageJ Manual Tracking plugin, and their speed calculated using the Chemotaxis Tool plugin. The LifeAct-GFP reporter was expressed in macrophages using the Cg-Gal4 driver (Cg-Gal4 > LifeAct-GFP). After 75 min of culture, movies were recorded every 4 s for ~3 min using a Carl Zeiss LSM710 with a × 63 objective. Individual macrophages were recorded in the plane in which the largest membrane extension was observed. Velocity maps were generated using the ADAPT tool for imageJ as indicated previously57. For mosaic analysis, the following lines were crossed and grown at 25 °C: hsFLP; Tub-Gal4, UAS-GFP/CyO, Act-GFP; Tub-Gal80TS, FRT82B and Iref02170, FRT82B/TM6B. Progeny were subjected to a heat-shock of 1 h at 37 °C at 48, 72 and 96 h. After egg laying29 third-instar larvae containing GFP-expressing macrophages were selected, and macrophage primary cultures were made.
To prepare primary culture coverslips, four third-instar larvae were washed in PBS then rinsed in 70% ethanol and washed once in PBS. Larvae were placed on coverslips with 120 µ l Schneider’s Insect Medium (Sigma-Aldrich), and immediately, a small incision was made in the posterior section of the cuticle using dissecting forceps. The haemolymph was collected for 1 min. Macrophages were allowed to adhere for 1 h and 15 min at 25 °C in a humidity chamber. The coverslip was then transferred to a 12-well plate, medium was removed and washed with PBS. For F-actin staining, cells were fixed in 4% paraformaldehyde for 10 min, permeabilized with PBS-0.1% Triton for 10 min and incubated for 2 h at room temperature with Phalloidin-FITC (50 µ M, Sigma) in PBS-BSA 1%. TO-PRO-3 (10 µ M; Invitrogen) was added in the last 20 min of incubation. Finally, cells were washed three times with PBS for 15 min each and mounted on Vectashield (Vector Laboratories). Imaging of cells was conducted using a Zeiss LSM710 microscope with × 63 objective. The images were processed using the software PHOTOSHOP CS4. All experiments were performed in accordance with the appropriate institutional guidelines of the Faculty of Medicine of the University of Chile and compliant with all relevant ethical regulations regarding animal research.
NATURE CELL BIoLoGY | www.nature.com/naturecellbiology

ARTICLES NATURE CELL BIOLOGY
Zebrafish studies. Wild-type TAB5 and Tg(actb1:mCherry-utrCH) fish lines were used. Embryos were raised in E3 medium, kept at 28 °C and staged according to age (hours post fertilization; hpf). Sixty picograms of capped IRE1α -DN mRNA synthesized using a T7 mMessage mMachine Kit (Ambion) from the pcDNA-IRE1α -DN-DN31,32, was injected into one-cell stage embryos as previously described58 . To calculate the extent of cell movements during gastrulation, embryos were imaged using a stereoscope and the progression of the blastoderm, the head-to-tail angle and width of the first three somites were measured as previously described using Fiji free software at 9, 11.5 and 12 hpf59. For confocal imaging, Tg(actb1:mCherry-utrCH) embryos were placed in custom-made chambers and imaged on a Volocity ViewVox spinning disc (Perkin Elmer) coupled to a Zeiss Axiovert 200 confocal microscope using a Pan-Apochromatic × 40/1.2W objective. Images were deconvolved using Huygens software (Scientific Volume Imaging). To measure circularity and pixel signal intensity, cells were segmented manually using Fiji free software. All experiments were performed in accordance with the appropriate institutional guidelines of the Faculty of Medicine of the University of Chile and compliant with all relevant ethical regulations regarding animal research.
Statistics and reproducibility. For all experiments in cell lines, at least three independent biological experiments were performed. For all colocalization and electron microscopy experiments, we performed three independent biological experiments; however, since analysis was performed in individual cells, data analysis of all cells analysed are indicated in the legends. Results were statistically compared using one-way analysis of variance (ANOVA) for unpaired groups followed by multiple comparison post-tests (Tukey’s multiple comparison test). When pertinent, two-tailed Student’s t-test was performed for unpaired or paired groups. In all plots, P values are show as indicated: *P < 0.05, **P < 0.01 and ***P < 0.001 and were considered significant. All results are presented as the mean ± s.e.m. Analyses were performed using PRISM software.
Reporting Summary. Further information on experimental design is available in the Nature Research Reporting Summary linked to this article.
Data availability. All data supporting the findings of this study are available from the corresponding author on reasonable request.
References 43. Hetz, C. et al. Proapoptotic BAX and BAK modulate the unfolded
protein response by a direct interaction with IRE1alpha. Science 312, 572–576 (2006).
44. Matsuda, T. & Cepko, C. L. Electroporation and RNA interference in the rodent retina in vivo and in vitro. Proc. Natl Acad. Sci. USA 101, 16–22 (2004).
45. Lisbona, F. et al. BAX inhibitor-1 is a negative regulator of the ER stress sensor IRE1alpha. Mol. Cell 33, 679–691 (2009).
46. Rodriguez, D. A. et al. BH3-only proteins are part of a regulatory network that control the sustained signalling of the unfolded protein response sensor IRE1alpha. EMBO J. 31, 2322–2335 (2012).
47. Henriquez, D. R., Bodaleo, F. J., Montenegro-Venegas, C. & Gonzalez-Billault, C. The light chain 1 subunit of the microtubule-associated protein 1B (MAP1B) is responsible for Tiam1 binding and Rac1 activation in neuronal cells. PLoS ONE 7, e53123 (2012).
48. Wieckowski, M. R., Giorgi, C., Lebiedzinska, M., Duszynski, J. & Pinton, P. Isolation of mitochondria-associated membranes and mitochondria from animal tissues and cells. Nat. Protoc. 4, 1582–1590 (2009).
49. Ramirez, O., Garcia, A., Rojas, R., Couve, A. & Hartel, S. Confined displacement algorithm determines true and random colocalization in fluorescence microscopy. J. Microsc. 239, 173–183 (2010).
50. Hetz, C. et al. The proapoptotic BCL-2 family member BIM mediates motoneuron loss in a model of amyotrophic lateral sclerosis. Cell Death Differ. 14, 1386–1389 (2007).
51. Urra, H. et al. Caveolin-1-enhanced motility and focal adhesion turnover require tyrosine-14 but not accumulation to the rear in metastatic cancer cells. PLoS ONE 7, e33085 (2012).
52. Lim, K. B. et al. The Cdc42 effector IRSp53 generates filopodia by coupling membrane protrusion with actin dynamics. J. Biol. Chem. 283, 20454–20472 (2008).
53. Grande-Garcia, A. et al. Caveolin-1 regulates cell polarization and directional migration through Src kinase and Rho GTPases. J. Cell Biol. 177, 683–694 (2007).
54. Fuentes, P., Canovas, J., Berndt, F. A., Noctor, S. C. & Kukuljan, M. CoREST/LSD1 control the development of pyramidal cortical neurons. Cereb. Cortex 22, 1431–1441 (2012).
55. LoTurco, J., Manent, J. B. Sidiqi, F. New and improved tools for in utero electroporation studies of developing cerebral cortex. Cereb. Cortex 19, 20–25 (2009).
56. Moreira, C. G., Regan, J. C., Zaidman-Remy, A., Jacinto, A. & Prag, S. Drosophila hemocyte migration: an in vivo assay for directional cell migration. Methods Mol. Biol. 769, 249–260 (2011).
57. Barry, D.J., Durkin, C.H., Abella, J.V. & Way, M. Open source software for quantification of cell migration, protrusions, and fluorescence intensities. J. Cell Biol. 209, 163–180 (2015).
58. Barth, K. A. & Wilson, S. W. Expression of zebrafish nk2.2 is influenced by sonic hedgehog/vertebrate hedgehog-1 and demarcates a zone of neuronal differentiation in the embryonic forebrain. Development 121, 1755–1768 (1995).
59. Yeh, C. -M. et al. Ptenb mediates gastrulation cell movements via Cdc42/AKT1 in zebrafish. PLoS ONE 6, e18702 (2011).
NATURE CELL BIoLoGY | www.nature.com/naturecellbiology

1
natu
re research | rep
ortin
g su
mm
aryA
pril 2
01
8
Corresponding author(s): Claudio Hetz
Reporting SummaryNature Research wishes to improve the reproducibility of the work that we publish. This form provides structure for consistency and transparency
in reporting. For further information on Nature Research policies, see Authors & Referees and the Editorial Policy Checklist.
Statistical parametersWhen statistical analyses are reported, confirm that the following items are present in the relevant location (e.g. figure legend, table legend, main
text, or Methods section).
n/a Confirmed
The exact sample size (n) for each experimental group/condition, given as a discrete number and unit of measurement
An indication of whether measurements were taken from distinct samples or whether the same sample was measured repeatedly
The statistical test(s) used AND whether they are one- or two-sided
Only common tests should be described solely by name; describe more complex techniques in the Methods section.
A description of all covariates tested
A description of any assumptions or corrections, such as tests of normality and adjustment for multiple comparisons
A full description of the statistics including central tendency (e.g. means) or other basic estimates (e.g. regression coefficient) AND
variation (e.g. standard deviation) or associated estimates of uncertainty (e.g. confidence intervals)
For null hypothesis testing, the test statistic (e.g. F, t, r) with confidence intervals, effect sizes, degrees of freedom and P value noted
Give P values as exact values whenever suitable.
For Bayesian analysis, information on the choice of priors and Markov chain Monte Carlo settings
For hierarchical and complex designs, identification of the appropriate level for tests and full reporting of outcomes
Estimates of effect sizes (e.g. Cohen's d, Pearson's r), indicating how they were calculated
Clearly defined error bars
State explicitly what error bars represent (e.g. SD, SE, CI)
Our web collection on statistics for biologists may be useful.
Software and code
Policy information about availability of computer code
Data collection For co-localization a three step processes was done. First deconvolution of images were done using Huygens Professional software.
Second, segmentation and total and endoplasmic reticulum (ER) masks were done using IDL 7.0. Finally, colocalization between IRE1a/
Filamin A, Filamin A/ER and PKCa/ER was done using Colocalization displacement analysis available in IDL7.0 or Image J software.
All quantifications of number of cell of transmigration assays, area of wound in healing assays, total and ER area of adhesion assays and
width measurement were done using Image J software.
Gene Ontology analysis of proteins obtained in the Yeast-two hybrid screen was done using Toppgene analysis available online
Data analysis Data acquisition and graphs were done in excel files and statistical analysis were done using GraphPad Prism 5 software.
For manuscripts utilizing custom algorithms or software that are central to the research but not yet described in published literature, software must be made available to editors/reviewers
upon request. We strongly encourage code deposition in a community repository (e.g. GitHub). See the Nature Research guidelines for submitting code & software for further information.

2
natu
re research | rep
ortin
g su
mm
aryA
pril 2
01
8
Data
Policy information about availability of data
All manuscripts must include a data availability statement. This statement should provide the following information, where applicable:
- Accession codes, unique identifiers, or web links for publicly available datasets
- A list of figures that have associated raw data
- A description of any restrictions on data availability
All data and materials along with detailed instructions on their use are available from the authors upon request. No raw data have been linked in the manuscript.
Field-specific reportingPlease select the best fit for your research. If you are not sure, read the appropriate sections before making your selection.
Life sciences Behavioural & social sciences Ecological, evolutionary & environmental sciences
For a reference copy of the document with all sections, see nature.com/authors/policies/ReportingSummary-flat.pdf
Life sciences study designAll studies must disclose on these points even when the disclosure is negative.
Sample size All experiments performed in this work were repeated at least three times, unless indicated otherwise in individual figure legends. All repeats
performed resulted in exact agreement or similar results.
No sample size calculation were performed for in vitro experiments and sample sizes were chosen for individual experiments according to pur
previous expertise.
For cellular based-assays we repeat a minimun of 4 experiments in order to perform statistical analysis.
For in vivo experiments using in utero electroporation we define a minimum of experimental animals based on the indications suggested in
"Guidelines for the Care and Use of Mammals in Neuroscience and Behavioral Research" using the following model n=1+2C(s/d)^2 (n is the
number of animals; C is a constant that depend on the power and statistical differences; s is the standard deviation of the measurement and d
is the differences expected in each condition)
Data exclusions No data was excluded from the analysis.
Replication For immunoprecipitation experiments every time we prepared freshly made lysis buffer we stock solutions. For endogenous IP we always
used a 10 cm plate containing around 7x10⁶ cells. For IP using over expression of proteins we transfected 2 well of 6-well plates. Transfection
efficiency was observed every time to be sure to have enough material. Although initial experiments were hard to observe the co-IP, once we
setup the right buffer we always observed the co-IP of Filamin A and IRE1a.
For cell culture experiments, we track the passage of cells in order to used cells in similar passages and used new batch after 10 passages.
Selection of cells was done every two week to always work with cells expressing WT and mutant IRE1a. Wound healing assays, transmigration
and actin cytoskeleton dynamics were done almost at same days or weeks to ensure reproducibility.
Since working with tunicamycin is complicated since freezing cycles affects the stability of the molecule we always used small aliquots that
only have been thawed once in order to ensure reproducibility.
Randomization For in utero electroporation samples were devided in control and the experimental condition based in the position in the uterine horns. Left
side of the uterine horns were injected with control conditions always. The experimental condition was injected in pups in the right side of the
horns.
No randomization was done
Blinding Quantification of actin bundles by EM and the GFP% neurons in the in utero electroporation experiments were done blinded.
Reporting for specific materials, systems and methods

3
natu
re research | rep
ortin
g su
mm
aryA
pril 2
01
8
Materials & experimental systems
n/a Involved in the study
Unique biological materials
Antibodies
Eukaryotic cell lines
Palaeontology
Animals and other organisms
Human research participants
Methods
n/a Involved in the study
ChIP-seq
Flow cytometry
MRI-based neuroimaging
Unique biological materials
Policy information about availability of materials
Obtaining unique materials All unique materials used are available
Antibodies
Antibodies used Antibody Anti-HA High Affinity 3F10
Supplier name: Roche
Catalog number 11867423001
Dilution 1:3000
Used as recommended by manufacturer
Antibody Anti-GFP (B-2)
Supplier name: Santa cruz biotechnology
Catalog number SC-9996
Dilution 1:3000
Used as recommended by manufacturer
Antibody Anti-Filamin A
Supplier name: Cell Signaling Technology
Catalog number 4762
Dilution 1:1000
Used as recommended by manufacturer
3
nature research | reporting summary March 2018
Antibody Anti-pS2152-Filamin A
Supplier name: Cell Signaling Technology
Catalog number 4761
Dilution 1:1000
Used as recommended by manufacturer
Antibody Anti-Filamin A
Supplier name: ABCAM
Catalog number ab76289
Dilution 1:5000
Used as recommended by manufacturer
Antibody Anti-pS2152-Filamin A
Supplier name: ABCAM
Catalog number ab51229
Dilution 1:1000
Used as recommended by manufacturer
Antibody Anti-Glutathione-S-Transferase (GST) antibody produced in rabbit
Supplier name: Santa cruz biotechnology
Catalog number sc-53909
Dilution 1:1000
Used as recommended by manufacturer
Antibody Anti-IRE1a
Supplier name: Cell Signaling Technology
Catalog number 3294S
Dilution 1:1000
Used as recommended by manufacturer
Antibody Anti-Rac1 Clone 102
Supplier name: BD Transduction Laboratories
Catalog number 610650
Dilution 1:5000
Used as recommended by manufacturer

4
natu
re research | rep
ortin
g su
mm
aryA
pril 2
01
8
Antibody Anti-HSP90
Supplier name: Santa cruz biotechnology
Catalog number SC-7947
Dilution 1:5000
Used as recommended by manufacturer
Antibody Anti-KDEL
Supplier name: Enzo Life Sciences
Catalog number SPA-827
Dilution 1:200 (IFI)
Used as recommended by manufacturer
Antibody Anti-HIS
Supplier name: Santa cruz biotechnology
Catalog number sc-803
Dilution 1:1000
Used as recommended by manufacturer
Antibody Anti-Trb1
Supplier name: Abcam
Catalog number ab31940
Dilution 1:200 (IFI)
Used as recommended by manufacturer
Antibody Anti-Myc
Supplier name: Santa cruz biotechnology
Catalog number sc-40
Dilution 1:1000
Used as recommended by manufacturer
Validation For most of endogenous proteins tested we validated the antibody using the WT and Knockout proteins. For the antibodies used
for IP, the antibody was tested using the over expression of tagged proteins.
All antibodies used for indirect inmmunofluorescence we performed primary and secondary antibodies control in addition to
used en knockout cells.
Eukaryotic cell lines
Policy information about cell lines
Cell line source(s) MEF IRE1 WT and knockout cells were provided David Ron. From this cell lines we reconstitute with IRE1a WT and the
different mutants tested in the manuscript. All other cells used including HEK-293 (ATCC), MDA-231, HT22, HELA and HCT116
were obtained from the University of Chile. The cell line U2OS was obtained from Guido Kroemer laboratory.
Authentication Since cell lines were obtained from animals in a previously described publication and their are not commercially available we
did not performed any cell line authentication. We surely perform validation of knockout cells by PCR and western blot of
selected proteins. To evaluate the activity of IRE1a mutants we performed XBP1 mRNA splicing assay as described in
methods.
Mycoplasma contamination All cells were negative for mycoplasma contamination. All cells were routinely tested for mycoplasma contamination using
the EZ-PCR Mycoplasma Test Kit (Biological Industries). In case of any contamination, the cell line was eliminated inmediatly
and a new batch was thawed.
Commonly misidentified lines(See ICLAC register)
No common misidentified cell lines were used
Animals and other organisms
Policy information about studies involving animals; ARRIVE guidelines recommended for reporting animal research
Laboratory animals For in utero electroporation experiments we used pregnant female mice and intervened at E14.5 and at P0.
For the embryo analysis of IRE1 Knockout animals we used Female and male IRE1α Heterozygous (Het) C57BL6 mice
mated to obtain IRE1α Het and KO embryos. Both IRE1α KO and control embryos were surgically collected from the
pregnant IRE1α Het mice at 14.5.
For D. Melanogaster experiments we used several strains obtained from Bloomington stock center: Cg-Gal4; HmlΔ-Gal4, 2xEGFP;
UAS-mCD8-GFP; Iref02170/TM6B; hsFLP; Tub-Gal4, UAS-GFP/CyO, Act-GFP; Tub-Gal80TS. FRT82B P{EP}cherG9093 are from the
Vienna Drosophila Research Center: UAS-Ire1-IR (v39562). For all experiments we used pupae at 20 ±2 h APF (After Puparium
Formation)
For Zebrafish experiments we used several strains available in Miguel Concha's Laboratory including Wild-type TAB5,
Tg(actb1:mCherry-utrCH) and Tg(sox17::GFP). Embryos were used at 1-cell stage embryos to inject mRNAs and then analyzed at

5
natu
re research | rep
ortin
g su
mm
aryA
pril 2
01
8
7, 9, 11.5 and 12 hpf depending on the experiment.
Wild animals The study did not involve wild animals, no animals in the study were collected from the field
Field-collected samples The study did not involve wild animals, no animals in the study were collected from the field

121
Emerging Roles of the Endoplasmic Reticulum Associated
Unfolded Protein Response in Cancer Cell Migration and Invasion.
Cancers (Basel). 2019 May 6;11(5).
Foreword
Tumor cells develop a highly efficient secretory pathway since there is a
group of stressful factors responsible for alterations in the secretory machinery.
These factors can cause the loss of protein homeostasis in the ER by the
accumulation of misfolded proteins, generating a cellular condition known as ER
stress. The stress of ER triggers an adaptive response called unfolded protein
response (UPR). The activation of the UPR has been described in different tumors
and multiple cellular and animal models of cancer. The three pathways of the UPR
have been related to cancer progression and are directly connected to different
hallmarks of cancer. In this review, we covered relevant aspects of the cell migration
and invasion processes. Next, we discuss and summarize state of the art on the
roles of the UPR in the regulation of cell migration, invasion, and metastasis. A
discussion about the therapeutic potential of targeting the different UPR branches
is also included.
Contribution
The author of the present thesis wrote section number 3 that contains a brief
overview of the UPR and discusses the role of UPR in cancer and the connections
with metastasis.

122
She was in constant communication with Tony Avril, who supervised the
construction of the review. She additionally participated in the revision of the figures
and the manuscript on its final form.

cancers
Review
Emerging Roles of the Endoplasmic ReticulumAssociated Unfolded Protein Response in Cancer CellMigration and Invasion
Celia Maria Limia 1,2,3,4,5,†, Chloé Sauzay 1,2,†, Hery Urra 3,4 , Claudio Hetz 3,4,5,6,7,
Eric Chevet 1,2,8 and Tony Avril 1,2,8,*
1 Proteostasis & Cancer Team, Institut National de la Santé Et la Recherche Médicale U1242 Chemistry,
Oncogenesis, Stress and Signaling, Université de Rennes, 35042 Rennes, France;
[email protected] (C.M.L.); [email protected] (C.S.); [email protected] (E.C.)2 Centre Eugène Marquis, 35042 Rennes, France3 Biomedical Neuroscience Institute, University of Chile, 8380453 Santiago, Chile; [email protected] (H.U.);
[email protected] (C.H.)4 Center for Geroscience, Brain Health and Metabolism (GERO), 8380453 Santiago, Chile5 Institute of Biomedical Sciences (ICBM), Faculty of Medicine, University of Chile, 8380453 Santiago, Chile6 The Buck Institute for Research in Aging, Novato, CA 94945, USA7 Department of Immunology and Infectious Diseases, Harvard School of Public Health, Boston, MA 02115, USA8 Rennes Brain Cancer Team (REACT), 35042 Rennes, France
* Correspondence: [email protected]
† Co-first authors.
Received: 9 April 2019; Accepted: 1 May 2019; Published: 6 May 2019�����������������
Abstract: Endoplasmic reticulum (ER) proteostasis is often altered in tumor cells due to intrinsic
(oncogene expression, aneuploidy) and extrinsic (environmental) challenges. ER stress triggers
the activation of an adaptive response named the Unfolded Protein Response (UPR), leading to
protein translation repression, and to the improvement of ER protein folding and clearance capacity.
The UPR is emerging as a key player in malignant transformation and tumor growth, impacting
on most hallmarks of cancer. As such, the UPR can influence cancer cells’ migration and invasion
properties. In this review, we overview the involvement of the UPR in cancer progression. We discuss
its cross-talks with the cell migration and invasion machinery. Specific aspects will be covered
including extracellular matrix (ECM) remodeling, modification of cell adhesion, chemo-attraction,
epithelial-mesenchymal transition (EMT), modulation of signaling pathways associated with cell
mobility, and cytoskeleton remodeling. The therapeutic potential of targeting the UPR to treat cancer
will also be considered with specific emphasis in the impact on metastasis and tissue invasion.
Keywords: cancer; cell invasion; cell migration; ER stress; IRE1; PERK; ATF6
1. Introduction
Cell migration/invasion is one of the cancer hallmarks that drives cancer progression leading
to tumor expansion of the adjacent tissues and/or to tumor dissemination through metastasis.
These properties compromise the efficacy of the anti-cancer therapeutic approaches such as surgery or
irradiation that rely on the existence of defined and limited zones within the tumor site. For instance,
in glioblastoma (GBM), the diffuse infiltration of tumor cells into the cerebral neighboring parenchyma
renders the complete and safe tumor resection as almost impossible. In turn, this leads to the recurrence
of GBM [1,2]. Metastases observed in many tumor types, in concert with anti-cancer drugs tumor
resistance, also largely contribute to most of the curative failures in cancers and in cancer-related
Cancers 2019, 11, 631; doi:10.3390/cancers11050631 www.mdpi.com/journal/cancers

Cancers 2019, 11, 631 2 of 25
mortality [3,4]. Therefore, in recent years, targeting tumor invasion/migration has become an attractive
approach for the development of new types of anti-cancer treatments [2,5].
Cancer cells can adapt to restrictive microenvironmental conditions associated with nutrient and
oxygen deprivation. This occurs by triggering a series of adaptive stress responses that include the
Unfolded Protein Response (UPR). The activation of the UPR allows tumor cells to restore Endoplasmic
Reticulum (ER) proteostasis [6–8]. In the past couple of years, increasing evidence has linked the
UPR to cancer progression due to the ability to regulate many cancer cell functions. However, the
link between the UPR and the ability of cancer cells to migrate and invade has not been addressed
in depth, and only a few examples have been described so far. In this review, after a brief overview
of ER stress signaling, we describe the cellular and molecular aspects of the cell migration and their
relevance to cancer cell migration/invasion, mainly focusing on brain and skin tumors, and how this
can be connected to UPR signaling. Moreover, we discuss the therapeutic perspectives targeting the
UPR/cancer cell migration/invasion links to limit the tumor dissemination.
2. Mechanisms and Molecular Actors of Tumor Cell Migration and Invasion
Increased tumor cell migration/invasion capacity is one of the hallmarks of cancer [9,10] and leads to
tumor dissemination and aggressiveness [11]. To spread within the tissues, tumor cells use migration
mechanisms that are similar to those occurring in physiological processes such as embryonic development
(Figure 1) [12]. Tumor cell invasion/migration involves diverse patterns of interconvertible strategies
including mesenchymal, amoeboid single migration or collective movements (Figure 2).
2.1. Different Steps of the Migration Process at the Cellular and Molecular Levels
2.1.1. Polarization of the Migrating Cell
Cell migration can be described as a five-step process [11,12]. In the first step, the moving cell
becomes polarized and elongated due to the generation of a protrusion at the leading edge (Figure 1,
(1)). These protrusions, composed of parallel and crosslinked actin filaments, take several forms such as
broad lamellipodia, or spike-like filopodia [11,13]. This step is initiated spontaneously or by different
stimuli including chemokines and growth factors leading to the activation of RHO family GTPases such
as RAC1, RHOA and CDC42 [11,12]. RAC1 is a key regulator of migration and localizes to the leading
edge of moving cells [14,15]; together with CDC42, these GTPases are involved in the formation of
filopodia and lamellipodia whereas RHOA is involved in the formation of stress fibers [16].
2.1.2. Dynamic Interactions of the Migrating Cell with ECM
In the second step, the elongated protrusions form focal contacts with adjacent extracellular matrix
(ECM) components which then mature into focal adhesions (Figure 1, (2)). These stable cell-ECM
interactions comprise adhesion molecules, most notably transmembrane receptors of the integrin family,
and other receptors such as CD44 and syndecans [17]. Intracellularly, focal adhesions are composed by
integrin clusters that recruit signaling proteins such as the non-receptor protein tyrosine kinase named
focal adhesion kinase (FAK, also known as PTK2 for protein tyrosine kinase 2) that acts a major player in
the positive regulation of cell migration. Upon integrin-mediated cell adhesion formation, FAK becomes
auto-phosphorylated on Y397 residue leading to its association with SRC and resulting in activation of both
kinases. Through carboxy-terminal proline-rich regions, FAK binds CAS (for Crk-associated substrate), a
scaffold molecule important for regulating cell migration; and paxillin (PXN), another important molecule
for cell spreading and migration events, resulting into more stable and mature focal adhesions [18–20]. In a
third step, specific surface proteins are recruited near substrate attachment sites leading to the cleavage of
ECM components, such as collagen, fibronectin and laminins (Figure 1, (3)). These proteins involved in
ECM degradation comprise secreted metalloproteinases such as MT1-MMP, MMP1 and MMP2 (Figure 1,
(3)) [11,21]. In this step, one of the major driver of tumor cell invasion though ECM is the invadopodium.
Invadopodia are β-actin rich invasive protrusions that degrade the cross-linked networks of EMC which

Cancers 2019, 11, 631 3 of 25
restrict tumor cell motility to cross the epithelia and endothelia cell layers. The capacity of these structures
to degrade ECM is attributed to the presence of membrane-bound MMPs such as MT1-MMP and to the
release of others MMPs, like MMP2 and MMP9 [22,23].
Figure 1. The cellular processes and molecular actors involved in cancer cell migration/invasion and
their links to the Unfolded Protein Response (UPR) sensors. Cancer cells start to polarize via cytoskeleton
reorganization at the leading edge (1) and generate new cell-matrix contacts (2). The proximal extracellular
matrix (ECM) surrounding the leading edge is degraded by metalloproteinases (MMPs) activation to

Cancers 2019, 11, 631 4 of 25
allow cell movement (3). Finally, cell contractions (4) and retractions allowed by cytoskeleton
reorganizations, synchronized with cell-matrix detachments (5), lead the movement of the cell body.
The molecular partners involved in the different cancer cell migration steps are presented in the
associated boxes. The UPR sensors and their down-stream pathways that control the migration
associated molecules are indicated in the green boxes (i.e., direct (solid lines) or indirect (dotted
lines) links).
Figure 2. The migration modes used in cancer cell migration/invasion and their links to the UPR sensors.
Cancer cells migrate either collectively (1) or individually according to the mesenchymal (2) or amoeboid
(3) modes. The latter modes involve cell reprogramming processes including epithelial-to-mesenchymal
(EMT), mesenchymal-to-amoeboid (MAT) and amoeboid-to-mesenchymal (AMT) transitions. Although
less characterized, a collective-to-amoeboid transition (CAT) has been also documented. The molecules
involved in these different cancer cell migration modes are presented in the associated boxes. The UPR
sensors and their down-stream pathways that control the migration associated molecular partners are
indicated in the green boxes.
2.1.3. Cell Contraction and Detachment to ECM Allowing Cell Movement
In the fourth step, intracellular myosin II binds to actin filaments to form actomyosin, thus allowing
cell contraction due to a reorganization of the actin cytoskeleton (Figure 1, (4)). The calcium/calmodulin
dependent enzyme myosin light chain kinase (MLCK) phosphorylates myosin light chains (MLC) to
activate myosin II and generate actomyosin contraction [24]. Dephosphorylation of the myosin light
chain by the MLC phosphatase (MLCP) results in myosin II inactivation. RHOA regulates actomyosin
contraction predominantly through its effector, ROCK (for RHO-associated protein kinase), which

Cancers 2019, 11, 631 5 of 25
phosphorylates and inhibits MLCP [25,26]. In the last, the detachment of the tail occurs through
different actin binding proteins cause actin filament strand breakage thereby promoting filament
turnover. FAK causes focal contact disassembly once phosphorylated by AKT1 [27]. Following
this focal contact disassembly, integrins detach from the substrate and become internalized through
endocytosis for further recycling towards the leading edge (Figure 1, (5)) [11]. Integrin endocytosis is
mediated by clathrin, and its adaptor molecules ARH (for autosomal recessive hypercholesteremia)
and DAG2 (for Disabled-2) [28]. All these steps are sequential and polarized through the cell in order
to induce a positive force that allow cell to move in a specific direction.
2.2. Different Cellular Patterns of Migration
2.2.1. Collective Migration
Collective cell migration is a fundamental process that enables the coordinated movement of
groups of cells that remain connected via cell-cell junctions (Figure 2, (1)) [29]. In this migration
mode, cells remain physically and functionally connected, preserving the integrity of cell-cell junctions
during movement. The connected cells require multicellular polarity and “supra-cellular” organization
of the actin cytoskeleton generating traction and protrusion force for migration and maintaining
cell-cell junctions (Figure 2, (1)). Migrating groups of cells structurally modify the tissue along the
migration path, which may result in the deposition of a basement membrane. All of these processes
are guided by chemical and physical cues including chemokines, such as stromal cell-derived factor 1
(SDF1; also known as CXCL12), and members of the fibroblast growth factor (FGF) and transforming
growth factor-β (TGFβ) families [30]. Cell-cell adhesion is mediated by adherens junction proteins,
including cadherins, other immunoglobulin superfamily members and integrins, all of which directly
or indirectly connect intracellularly to the actin and/or intermediate filament cytoskeleton. Several
mechanisms polarize the cell group into “leader” cells that guide “follower” cells. Leader cells localize
at the front of a moving group, where they receive guidance signals and instruct follower cells, at the
rear, into directional migration through chemical and/or mechanical signaling [31]. This polarity of a
group of cells is probably cell type and tissue/context specific and might result from the differential
expression of surface receptors, extracellular inputs and downstream intracellular signals that define
and maintain leader cells. The key components that induce and regulate collective migration include
the chemokine receptors CXCR4 and CCR7, mitogen-activated protein kinase (MAPK)/extracellular
signal-regulated kinase (ERK), focal adhesion kinase FAK, phosphoinositide-3-kinase (PI3K)/AKT, SRC
kinases, NOTCH and RHO GTPases [29,30,32]. The key point of a collective migration is that moving
cells influence each other bidirectionally between leading cells and follower cells. Follower cells can
also influence the behavior of the leaders to modulate the collective movement. Follower cells can also
engage in cell-substrate traction forces, and transmit forces across a longer distance and multiple cell
bodies within moving cell sheets [29].
2.2.2. Single Cell Migration/Invasion through a Mesenchymal Mode
Mesenchymal cells move via the five-step migration cycle presented above. Mesenchymal
migration can be compared to fibroblast-like motility. Apart from fibroblasts, keratinocytes and
endothelial cells, some tumor cells also use this mode of migration. In mesenchymal migration, cells
adopt an elongated, spindle-like shape and exert traction on their substrates via focal adhesions
associated with actin rich protrusions at the leading edge, such as lamellipodia or filopodia (Figure 2,
(2)) [11,33], where RHO-family small GTPases RAC1 and CDC42 are key players [11,33,34].
RAC1 is activated by DOCK3 (for Dedicated Of Cytokinesis 3) and its adaptor molecule NEDD9
to drive mesenchymal migration [34]. Active RAC1 negatively regulates RHO/ROCK signaling,
inhibiting cell rounding and promoting mesenchymal movement. The mesenchymal mode requires
ECM proteolysis to allow RAC1-dependent actin protrusions to pass through the ECM mesh [34].
Integrins, membrane-type MMPs and other proteases co-localize at fiber binding sites to contribute to

Cancers 2019, 11, 631 6 of 25
ECM degradation. The activation of MMPs and uPA (for urokinase-type plasminogen activator) is
required for maintenance of the phenotype and mesenchymal migration [11].
2.2.3. Single Cell Migration/Invasion through an Amoeboid Mode
Amoeboid-like movement has been described in leukocytes and certain types of tumor cells. In
amoeboid migration, cells adopt round or irregular shapes (Figure 2, (3)). During locomotion these
cells constantly change shape by rapidly protruding and retracting extensions, which allow them to
squeeze through gaps in the ECM [33,35]. These cells are highly deformable, due to their lack of focal
contacts, allowing them to move at 10- to 30-fold higher velocities than cells that use mesenchymal
migration mechanisms [11]. Amoeboid migration involves a range of different sub-modes, such
as bleb-based migration or gliding. Bleb expansion is driven by hydrostatic pressure generated in
the cytoplasm by the contractile actomyosin cortex [36]. In contrast to the mesenchymal mode of
invasion, in the amoeboid-like migration, the contractile polarized actomyosin cytoskeleton is crucial
for the generation of the motive force, promoted by the RHO/ROCK signaling pathway [37]. This
underlines a mutual antagonistic role between RHO-family GTPases RAC1 and RHO/ROCK that
display exclusive functions in mesenchymal and amoeboid-like migration respectively [38–40]. By
modulating these RHO GTPases, several molecules as such FILGAPP and ARHGAP22 control the
mesenchymal/amoeboid switch in cancer cells [34,40,41]. Importantly, the key marker of the amoeboid
invasiveness is its independence from ECM proteolytic degradation [35,36].
2.3. Migration Strategies Used by Tumor Cells at the Cellular and Molecular Levels
The ability of cancer cells to invade adjacent tissues or to form distant metastases is one of the
most life-threatening aspects of cancer. Most solid cancers progress to disseminated metastatic disease,
leading to secondary tumors arising in sites distal to the primary tumor [42]. The local invasion of
tumor cells to tissues adjacent to the primary tumor site is one of the early steps in the metastatic
process and one of the key determinants of the metastatic potential of tumor cells. In order to overcome
the ECM barriers and surrounding cells, tumor cells develop abilities to use and switch between
different migration modes, i.e., collective, mesenchymal and amoeboid (see above) resulting in the
high plasticity of cancer cells. The conversion from epithelial cells to motile individually migrating
cells is an intensively studied phenomenon known as epithelial-mesenchymal transition (EMT) [42].
The amoeboid and mesenchymal types of migration/invasion are mutually interchangeable in processes
named mesenchymal-to-amoeboid transition (MAT) or amoeboid-to-mesenchymal transition (AMT),
respectively (Figure 2) [33]. In the following sections, we describe the tumor migration processes by
mainly focusing on two well characterized tumor types (i.e., melanoma and GBM) known to exhibit
high migration/invasion properties through a metastatic or a tissue infiltration process.
2.3.1. The Metastatic Process in Melanoma
Cutaneous melanoma is a skin cancer derived from melanocytes is considered as one of the most
aggressive malignancies with one of the worst prognoses. The aggressiveness of this malignancy is
due to the complexity and dissemination potential of this disease. Metastatic melanoma accounts
for approximately 80% of skin cancer-related deaths [43]. Malignant melanoma represents a very
relevant model for studying tumor invasion because of its highly metastatic behavior. Melanoma
progression involved radial and vertical growth phases. The radial growth phase (RGP) represents
early-stage disease and encompasses horizontal growth within the epidermis. When the tumor lesion
enters the vertical growth phase (VGP), the repertoire of adhesion molecules changes, the tumor
enters the dermis and acquires the capacity to metastasize [44]. At the cellular level, melanoma
cells invasion results from a combination of several mechanisms: (i) the epithelial-to-mesenchymal
transition, (ii) the loss of cell-to-cell adhesion, (iii) the loss of cell-matrix adhesion, (iv) matrix
degradation, (v) chemo-attraction/repulsion and (vi) migration. At the molecular level, all these cellular
events are closely regulated and tightly interconnected through the activation of select signaling

Cancers 2019, 11, 631 7 of 25
pathways including MAPK, PI3K and WNT/β-catenin [43,45]. Somatic mutations in the BRAF or NRAS
oncogenes are present in the majority of melanoma cells and lead to the spontaneous activation of the
MAPK pathway, promoting cell proliferation, migration and survival [46]. One of the best described
phenomena of cell-cell interactions responsible for melanoma progression is the “cadherin switch” [47]
by replacing E-cadherin to N-cadherin. This switch is mainly regulated by the PI3K/PTEN pathway
through the transcription factors TWIST and SNAI1, two major players of EMT [48]. Loss of E-cadherin
may affect the β-catenin/WNT signaling pathway, resulting in upregulation of genes involved in growth
and metastasis [44]. Moreover, in malignant melanoma, α4/β1 and αv/β3 integrins play a major role in
metastasis dissemination. Indeed the expression of integrin α4/β1 correlates with the development
of metastases and is negatively associated with disease-free and overall survival [49]. Moreover, the
αv/β3 integrin is highly expressed during the transition from RGP to VGP, suggesting a specific role
in melanoma invasion. Indeed, the silencing of integrin αv/β3 in B16 melanoma cells reduces their
migratory capacity in vitro and metastatic potential in vivo [50]. Other important players involved in
melanoma invasion are metalloproteinases. Protein and activation levels of MMP1, 2, 9 and 13 are
upregulated in malignant melanoma [51]. As such, MMP2 cleaves fibronectin into small fragments
to enhance the adhesion and migration of human melanoma cells mediated by αv/β3 integrin [52].
In addition to mesenchymal movement, melanoma cells can also adopt amoeboid motility through
specific effectors of RHOA, namely ROCK and MLC2 [43], stimulated by the TGFβ/SMAD pathway [53].
RAC1 is involved in mesenchymal migration of melanoma cells, through the adaptor protein NEDD9.
NEDD9 gene is amplified in approximately 50% of melanomas [54]. NEDD9 is a member of the CAS
family of proteins that interacts with the guanine nucleotide exchange factor DOCK3 to promote RAC1
activation [55]. Besides, NEDD9 overexpression leads to increased phosphorylation of β3-integrin
on Tyr785 in the cytoplasmic domain promoting the assembly of a signaling complex containing
β3-integrin, SRC, FAK and NEDD9. Altogether, this leads to an increased activation of RAC1, SRC
and FAK and a decreased ROCK signaling that drive an elongated, mesenchymal type invasion [54].
Malignant melanoma represents a very relevant model for studying tumor invasion because of its
highly metastatic behavior.
2.3.2. Tumor Migration in Glioblastoma
If most solid tumors spread by metastasis like melanoma, there are exceptions such as glioblastoma
(GBM) which is characterized by a diffuse invasion of tumor cells within the surrounding brain
parenchyma (referred to as diffuse infiltration hereafter). GBM is the most common primary malignant
brain tumors. Despite the aggressive standard of care currently used, including surgery, chemo-
and radiotherapy, the prognosis remains very poor. One of the central hallmarks of GBM is the
diffuse infiltration of tumor cells throughout the neighboring normal tissues, rendering complete
and safe resection almost impossible [56]. GBM cells mainly appear to invade the surrounding
brain parenchyma using the mesenchymal form of motility in vivo, in contrast, amoeboid invasion of
GBM cells has been only described in vitro [56–58]. GBM cells move along myelinated axon tracks
and disseminate into healthy brain regions along the vascular basement membrane and the glia
limitans externa where fibrous proteins such as collagens, fibronectin, laminins and vitronectin are
expressed [56]. GBM cells secrete ECM proteins into the microenvironment and release MMPs for ECM
remodeling and to promote their own infiltration. In GBM, matrix metalloproteinases are particularly
involved in aggressive tumor cell infiltration [59]. MMP2, MT1-MMP and MT2-MMP activities are
highly increased in GBM tumors compared to normal [60–62]. MMP2 expression levels correlate with
malignant progression in vivo [60,63]. Concomitant with the upregulation of pro-migratory ECM
proteins, elevated expression cell adhesion molecules such as integrins receptors and ICAM1 (for
intercellular adhesion molecule) has been detected in GBM samples. Integrin receptors reported to be
upregulated on glioma cells include α2β1, α5β1, α6β1 and αvβ3. ICAM1 and LFA3 (for lymphocyte
function-associated antigen 3) were distinctive markers of GBM [2,64]. A recent study showed that
β1 and αv integrins represent the primary adhesion systems for glioma cell migration in different

Cancers 2019, 11, 631 8 of 25
migration models [65]. Interestingly, SRC, FYN, and c-YES kinases belonging to the SRC-family kinase
(SFK) are involved in glioma proliferation and motility in vitro [66]. Conversely, LYN, another kinase
of this family, shows anti-tumor effect in a glioma orthotopic xenograft model [66]. Components of the
FAK/SRC tyrosine kinase migration signaling network are upregulated and activated in GBM suggesting
a role of this pathway in tumor invasion [67,68]. The IL6/STAT3 signaling axis is also involved in
GBM cell migration by modulating the expression of metalloproteinases MMP2 and MMP9 [69,70], as
well as GRP1 (for Glioma Pathogenesis-Related 1) that contributes to GBM stem cell migration [71].
STAT3 is also implicated in mesenchymal GBM progression by modulating the mucin-type protein
podoplanin and the EMT-related transcription factors SNAIL and TWIST [72]. Recently we showed
that CD90 (THY1) expression controls tumor cell migration/adhesion mainly through SRC signaling.
In addition, we show that CD90 expression regulates tumor invasive characteristics in a mouse model
and in human tumors [73]. CD90 is a glycophosphatidylinositol anchored glycoprotein considered as a
marker for mesenchymal stromal/stem cells that has been earlier described in glioma/GBM specimens
and immortalized glioma/GBM cell lines [73].
In the past few years, pharmacological approaches aiming at dampening GBM invasiveness showed
promising results in vitro, in mouse models or in clinical trials and targeted metalloproteinases [74–76],
integrins [77], cytoskeleton reorganization [78], or signaling molecules such as FAK [79–81]
and SRC [82–85]. Despite intensive efforts, there has been little improvement in the ability to
treat GBM. Hence, understanding cell migration is a necessary first step in developing new
“anti-migration” therapies.
3. Brief Overview of the Unfolded Protein Response and of the ER Stress Sensors
Cells depend on the production of membrane and secretory proteins to maintain their survival.
The production of these proteins is ensured in part by the early secretory pathway comprising the ER
and the Golgi apparatus [8]. To adapt to the cellular demand and to the challenges imposed by the
surrounding environment, the secretory pathway needs to adjust the associated molecular network
involved in protein biogenesis including chaperones, foldases, glycosylation enzymes, oxidoreductases
and molecules involved in protein quality control [8]. Despite this elaborate system, a proportion of
newly synthesized proteins does not reach the quality criteria and is targeted to the ER Associated
Degradation (ERAD) system. When the protein folding demand outweighs the ER folding capacity,
improperly folded proteins accumulate in the ER lumen resulting in a condition named ER stress.
To combat ER stress and return to a homeostatic situation, an adaptive cellular stress response named
UPR is triggered [6,86]. The UPR is exacerbated in the course of tumor development, when cancer
cells are exposed to intrinsic and extrinsic challenges, i.e., activation of their oncogenic program or
nutrient and oxygen deprivation [6,7].
3.1. UPR Signaling Pathways
The UPR activation is controlled by three ER resident transmembrane proteins that act as
molecular ER stress sensors: the activating transcription factor 6 alpha (ATF6α, referred to as ATF6),
the inositol-requiring enzyme 1 alpha (IRE1α, referred to as IRE1 hereafter) and the protein kinase
RNA-like ER kinase (PERK) [6–8,87]. Herein, we will provide a brief overview of the UPR signaling
pathways and invite the readers to refer to the following reviews on UPR for more details [6–8,86–96].
3.1.1. Activation Mechanisms of the ER Stress Sensors
The current dogma reports that activation of these three sensors is regulated by the ER resident
chaperone GRP78/BiP. Under basal conditions, GRP78 constitutively associates with the luminal
domains of the 3 sensors, thus repressing their activation [7,8,97]. The fine tuning of the ER stress
sensors activation has been more precisely described by different mechanisms but a consensus about
IRE1 and PERK activation is missing. For instance, several key players have been described such as the
importance of the ATPase domain of GRP78 for the interaction with IRE1 [98]; and the involvement of

Cancers 2019, 11, 631 9 of 25
other molecular partners such as the co-chaperone ERDJ4 and the protein disulfide isomerase PDIA6
that participate in the stabilization of the GRP78 and IRE1 interaction [99,100]; and also facilitates
IRE1 dimerization during ER stress induced after disruption of ER calcium homeostasis [100]; the heat
shock protein HSP47 that favors GRP78 release and stabilizes IRE1 dimerization [101]; or misfolded
proteins that can directly interact with IRE1 to trigger IRE1 dimerization/oligomerization [102]. Upon
accumulation of misfolded proteins in the ER lumen, GRP78 is released from the ER stress sensors
which leads to their activation by allowing IRE1 and PERK dimerization/oligomerization and ATF6
export to the Golgi apparatus [87,97]. ATF6, IRE1 and PERK then trigger downstream signaling
pathways to reprogram cells to cope with the stress or to die if the stress cannot be resolved.
3.1.2. ATF6
ATF6 is an ER-localized protein that exists in two isoforms α and ß forming homo- and
heterodimers [103,104]. Compared to the isoform ATF6ß, ATF6α appears to be a very potent
transcription factor [105]. ATF6 is considered as a natively instable protein [106]. Under ER stress,
GRP78 dissociation and disulfide bond modification mediated by the protein disulfide isomerase
PDIA5 [107,108] stabilize ATF6 and promotes its export to the Golgi apparatus. In the Golgi apparatus,
ATF6 is activated by its cleavage mediated by the S1P and S2P proteases [109–111]. This releases an
active membrane-free transcription factor, ATF6f, that translocates to the nucleus and induces the
transcription of genes mainly involved in protein folding and ERAD such as calreticulin, GRP78,
HERPUD1 and SEL1L [7,89,112,113].
3.1.3. IRE1
The cytoplasmic region of IRE1 is composed of two domains with distinct enzymatic functions
including a serine/threonine kinase and an endoribonuclease (RNase). During ER stress, IRE1
dimerization/oligomerization leads its trans-autophosphorylation that prompts a conformation change,
resulting in the activation of its RNase domain [7]. This RNase has the unique ability to proceed with
the excision of 26 nucleotides of a short intronic region of the mRNA of the X-box binding protein XBP1.
Together with the tRNA ligase RTCB, IRE1 catalyzes the unconventional splicing of XBP1 to generate
a new mRNA with a novel open-reading frame encoding for the transcription factor XBP1s. XBP1s
activates expression of genes involved in protein folding, secretion, ERAD and lipid synthesis [7].
When ER stress cannot be resolved, IRE1 RNase also catalyzes the degradation of ER localized mRNA,
ribosomal RNA and microRNAs through a process called Regulated IRE1 Dependent Decay of RNA
(RIDD), participating to the attenuation of the global mRNA translation. The dual IRE1 RNase activity
(XBP1 splicing vs. RIDD) is dependent on IRE1 dimerization/oligomerization state with still debated
models [7,86,87]. On the other hand, once IRE1 is activated, IRE1 kinase domain interacts with the
adaptor protein TRAF2, and triggers a phosphorylation cascade leading to c-Jun N-terminal protein
kinase (JNK) and NFκB activation [114,115]. Upon sustained ER stress, IRE1 activation favors the
activation of cell apoptosis through terminal RIDD that cleaves mRNAs non-specifically.
3.1.4. PERK
Upon ER stress, PERK trans-autophosphorylation leads to its activation and phosphorylation of
the eukaryotic translation initiation factor 2 alpha (eIF2α) and the transcription factor NRF2 [7,8,92,95].
Phosphorylation of eIF2α leads to the attenuation of the global translation, reducing the folding demand
on the ER [7,89,116,117]. Phosphorylation of eIF2α also prompts the translation of the transcription
factor ATF4 through a uORF-dependent mechanism [118,119]. Phosphorylation of cytoplasmic NRF2
leads to its dissociation from KEAP1 and its nuclear import [120]. The transcription factors ATF4 and
NRF2 induce expression of genes involved in protein folding (via HSF1 that regulates HSP genes),
amino-acid metabolism (PHGDH, PSAT1, SHMT2 and SLC genes), antioxidant response (NQO1),
autophagy (ATG genes) and apoptosis (CHOP) [7,8,121,122]. Translation restoration is induced
by eIF2α dephosphorylation which is catalyzed by the GADD34/PP1c complex [123]. GADD34 is

Cancers 2019, 11, 631 10 of 25
activated downstream of CHOP and its expression results in a negative feedback loop for PERK
signaling pathway. If the stress of the ER is maintained, sustained ATF4/CHOP activation leads to the
apoptosis of the cell through induction of pro-apoptotic genes related to BCL2 family such as BIM and
PUMA [124,125].
3.2. Roles of the ER Stress Sensors in Cancer
During tumor development, cancer cells are exposed to several challenges such as acute demands
of protein synthesis due to oncogene expression and drastic extracellular conditions linked to hypoxia
or low nutrient availability. These challenges require efficient UPR allowing the cancer cells to cope
and adapt [88,92,95]. Thus, fingerprints of UPR activation have been found in several types of
primary and metastatic tumors including brain, breast, colon, liver, lung, hepatocellular carcinoma
and skin (reviewed in reference [126]). For instance, GRP78 and ATF6 mRNAs are up-regulated as the
histological grade increases in hepatocellular carcinoma tissues [127]. In human breast carcinomas,
high GRP78 and XBP1 protein levels are found in comparison with normal tissue [128]. High GRP78
expression is associated with metastasis and poor prognosis in breast, colon, esophageal, lung and
skin cancers [129–133]. Moreover, ablation of the UPR sensors leads to a significant reduction in
tumor growth in different types of cancers like colon, pancreatic, breast cancer and GBM [134–137].
In addition to restoring ER proteostasis, a number of studies have demonstrated that tumor cells
hijack the UPR machinery to provide new molecular pathways for supporting tumor development
and aggressiveness associated with microenvironment remodeling of the stroma and resistance to
anti-cancer treatments [88,92,95]. For instance angiogenesis, another important cancer hallmark, is
modulated after hypoxia-induced UPR activation by modulating expression of several proangiogenic
mediators as such VEGF and angiogenic inhibitors including THBS1, CXCL14 and CXCL10 [88,138].
Moreover, UPR activation is also observed in tumor associated cells such as endothelial cells and
infiltrating macrophages, lymphocytes and dendritic cells to increase their ability to support tumor
growth by promoting neo-angiogenesis and by providing important secreted growth factors [90,93].
Currently, many studies are further documenting the involvement of ER stress in cancer hallmarks [9,10].
The following section of this review will be mainly focused on the links between UPR and tumor
migration/invasion.
4. Connections between UPR Signaling and Tumor Cell Migration
Growing evidence suggests that the UPR is an important regulator of different steps of the
tumor migration and metastasis. The three sensors of the UPR have been recently linked to tumor
cell migration/invasion processes such as ECM and actin cytoskeleton remodeling and cytoskeleton
reorganization, modification of cellular adhesion, activation of signaling pathways associated with cell
mobility, and EMT [7,91,94,95].
4.1. Links between UPR Sensors Activation and Cancer Metastasis
The IRE1/XBP1 axis has been the most extensively correlated with cancer progression and
metastasis. Importantly, studies with tumor samples from patients with colorectal carcinoma,
breast cancer and oral squamous cell carcinoma, described the overexpression of IRE1 or XBP1
in metastatic samples compared to the primary tumors [139–142]. In addition, elevated levels of XBP1
at primary tumors are statistically associated to the presence of distant metastasis in patients with
esophageal carcinoma, hepatocellular carcinoma and oral squamous cell carcinoma [143–145]. XBP1s
overexpression at the primary tumor was correlated with intrahepatic invasion and distant metastasis
in hepatocellular carcinoma [144]. In pancreatic cancers, latent liver metastases are developing from
quiescent single disseminated cancer cells (DCCs) that evade to the anti-tumor immune response [146].
Intriguingly, these DCCs shut down IRE1 activity leading to escape from CD8 T cell cytotoxicity
by down-regulating MHC class I molecules expression. Restoration of IRE1 signaling branch by
overexpressing XBP1s in DCCs leads to the outgrowth of liver macro-metastatic lesions [146]. These

Cancers 2019, 11, 631 11 of 25
findings suggest that IRE1 activation might be important for the initial and final steps in metastasis, like
tumor cell dissemination and the formation of macro-metastasis, with a temporary downregulation
for avoiding anti-tumor immune response. Besides IRE1, PERK activation has been also linked to
tumor invasiveness. In triple negative breast cancers (TNBC), PERK activation characterized by a
cancer-specific PERK signaling gene set is associated with distant metastasis [147]. Also, overexpression
of ATF4, a component of PERK pathway, is associated with lymph node metastasis in esophageal
squamous cell carcinoma [148]. In vivo experiments demonstrated that ATF4 induce cell invasion
and metastasis stimulating MMP2 and MMP7 expression [148]. Although more accurate experiments
are required, this evidence shows that UPR activation might be relevant for the development of
metastatic lesions.
4.2. UPR-Dependent Control of ECM Protein Production and ECM Remodeling
ECM remodeling is an important step to allow tumor migration/invasion. ECM degradation is a
key phenomenon in tumor cells migration through the adjacent tissues. In addition, the regulation
of cell/ECM interactions determines the cell ability to migrate, i.e., strong cell adhesion to the ECM
will limit cell invasion [30]. UPR-regulated molecules such as ECM components, i.e., collagens and
fibronectin, enzymes that cleave ECM, i.e., cathepsin and MMPs and adhesion molecules, i.e., integrins,
are involved in this process.
4.2.1. ECM Remodeling by the IRE1/XBP1s Signaling Axis
One important process in metastasis is the invasion allowed by the degradation of the ECM
through the expression of MMPs [149]. In esophageal squamous cell carcinomas, XBP1s overexpression
promotes cell invasion and metastasis through the upregulation of MMP9, one of the MMPs most
widely associated with cancer progression [143]. Similarly, XBP1 deficiency in oral squamous cell
carcinoma cells impairs cell invasion and leads to a decrease in the expression of invasion-associated
genes including MMP1, MMP3 and PLAUR [141]. Intriguingly, in GBM, IRE1 signaling is found to
negatively modulate cell migration and invasion [137,150–153]. Gene expression profiling reveals that
loss of enzymatic IRE1 activity results in an upregulation of ECM proteins, by negatively regulating
the expression of SPARC through the RIDD-mediated degradation of its mRNA, a protein associated
with changes in cell shape, synthesis of ECM and cell migration [151]. In addition, the expression
of genes involved in cancer cell migration including ECM components (i.e., collagens), MMPs and
chemokines is under the control of IRE1 activation in GBM cells [152].
4.2.2. PERK-Dependent Regulation of MMPs in Cancers
As described above for IRE1, PERK is also found to contribute to ECM reorganization in cancer
cells. For instance, in esophageal squamous carcinoma cells, ATF4 directly controls tumor migration
in vitro and in vivo by regulating the expression of the metalloproteinases MMP2 and MMP7 that, in
turn, facilitate this process via the ECM remodeling [148]. Interestingly, ATF4 has been described as a
potential poor prognostic biomarker in this cancer type [148]. In chronic myeloid leukemia, eIF2α is
constitutively phosphorylated and enhances invasive ability of tumor cells but also tumor associated
stromal fibroblasts by modulating ECM remodeling through cathepsin and MMPs expression via the
induction of ATF4 [154]. Interestingly, TRAM2 (for translocation associated membrane protein 2), a
component of the SEC61 translocation channel located at ER, is highly expressed in oral squamous
cell carcinoma and has a main role in metastasis by controlling PERK activation and the expression of
MT1-MMP, MMP2, and MMP9 [155]. Breast cancer cell lines exhibit increased secretion of ECM proteins
that perturbs ER morphology due to the overload in secretory proteins and show a constitutively
activated PERK/eIF2α/ATF4 axis [156].

Cancers 2019, 11, 631 12 of 25
4.2.3. ECM Remodeling upon ATF6 Activation
Little has been described so far on the potential role of ATF6 in modulating tumor cell
migration/invasion. One recent study reports that ATF6 activation, upon ER stress induced by
gemcitabine, leads to the increased expression of PLAU, a serine protease involved in the degradation
of the ECM. Its activation is, in turn, associated with enhanced migration properties of pancreatic
cancer stem cells [157]. Also, ADAM17, a member of the disintegrins and metalloproteases family that
promotes tumor invasiveness and is found to be up-regulated in breast, gastric ovary and prostatic
cancers and is induced by ATF6 in breast cancer cells [158]. Interestingly, PERK/eIF2α/ATF4 UPR arm
also regulates ADAM17 expression as ATF4 binding sites are present in the ADAM17 promoter and
PERK activation induces the ADAM17 protein release [158].
4.3. Involvement of the UPR-Dependent Secretome in Tumor Migration
Tumor cell migration depends on the interaction with the microenvironment, extracellular matrix
adhesion, cell-cell contacts and matrix remodeling. Cytokines and growth factors that are secreted in
the tumor microenvironment regulate all of these processes and therefore control the invasion capacity
of tumor cells. These molecules can be secreted by both the tumor cells (autocrine signals) and by
the surrounding non-tumor cells (paracrine signals), controlling the initial steps for the metastatic
cascade and allowing tumor cell adaptation to environmental changes. The different UPR sensors
have been involved in the production of pro-migratory cytokines and chemokines. IRE1 has been
described to regulate the secretion of several factors that control tumor angiogenesis that can also
affect tumor cell migration. For instance, in GBM, the inhibition of IRE1 decreases the expression of
proangiogenic factors such as VEGFA, IL1β, IL6, and CXCL8 (also named IL8) and leads to a reduction
of angiogenesis [150,151]. Moreover, IRE1 activity affects the adhesion, migration and invasion
properties of GBM tumor cells [150–152] by controlling the production of the chemokines/cytokines
IL6, CXCL8, and CXCL3, all involved in these processes [150,152]. Selective impairment of IRE1
RNase increase invasion, vessel co-option capacity and mesenchymal features in U87 glioma cells [153].
Interestingly, in colorectal cancers high XBP1s expression is associated with metastatic tumors in
patients and with cancer cell invasion in vitro by controlling VEGFR2 expression [139]. In intestinal
cancer cells, early growth response protein 1 (EGR1), an important transcription factor that controls
the expression of chemokines/cytokines involved in tumor metastasis such as CCL2 and CXCL1, is
positively regulated upon activation of PERK and ATF6 [159]. Suppression of PERK or targeting ATF6
decreased EGR1 expression levels as well as EGR1-associated chemokine expression. Interestingly,
ATF3 through a direct interaction with histone deacetylase 1 (HDAC1) mediate EGR1 suppression [159].
PERK activation also increases VEGFA expression in medulloblastoma, which favors tumor migration
through an autocrine manner by interacting with its receptor VEGFR2 [160]. In melanoma, both ATF6
and PERK branches of the UPR are involved in the induction of the fibroblast growth factors FGF1/2
increasing cancer cell migration in vitro [161].
4.4. UPR-Mediated Regulation of EMT in Cancers
In recent years, the EMT and UPR activation mainly through IRE1 and PERK signaling pathways
have been closely linked to cancer progression in many models [7,91,94,156,162]. EMT-like phenotypes
are induced upon UPR activation including cellular morphological changes and modulation of EMT
markers, i.e., E-cadherin and vimentin [140,156,163]. Importantly, the common chemotherapeutic
drugs used in cancers induce ER-stress mediated EMT, independent of the cancer type [164]. PERK
activation is mandatory for tumor cells to invade and metastasize [147]. Furthermore, EMT gene
expression signature has been correlated with ECM protein secretion and ATF4 expression (but not
XBP1) in various cancers including breast and colon [156]. Inhibition of the PERK/eIF2α/ATF4 signaling
axis with acriflavine (an antiseptic agent that also targets HIF1 pathway) prevents EMT at the cellular
and molecular levels (i.e., no change in cellular morphology and no induction of EMT markers as such

Cancers 2019, 11, 631 13 of 25
E-cadherin, vimentin, SNAI1, SPOCK1 and TWIST1); and inhibits the tumor cell migration (Figure 2,
(2)) [165]. However, other studies indicate that XBP1s increases the metastatic potential of tumor cells
by the induction of the expression of several EMT transcription factors, including SNAI1, SNAI2, ZEB2
and TCF3 [140,144,163,166]. The induction of these transcription factors for the IRE1/XBP1s signaling
is dependent of lysyl oxidase-like 2 (LOXL2). Overexpression of LOXL2 induces its accumulation in
the ER and its interaction with GRP78 inducing IRE1/XBP1s branch activation [163]. The inhibition of
the RNase activity of IRE1 using small molecules reduced EMT markers expression patterns in breast
cancer cells [140].
4.5. UPR-Dependent Regulation of Other Molecular Actors of Tumor Cell Migration
4.5.1. Direct Interaction between IRE1 and Filamin A
We have recently uncovered a novel mechanism of cell migration regulation underlying IRE1
function. Using an interactome screening, FLNA is identified as a major IRE1-binding partner in
non-cancer mouse and human cells [167]. FLNA is a 280 kDa actin crosslinking protein involved
in the regulation of cytoskeleton remodeling through a direct phosphorylation at serine 2152 [168].
Remarkably, the regulation of cytoskeleton dynamics by IRE1 is independent of its canonical RNase
activity, but instead IRE1 serves as a scaffold that recruits FLNA, scaffolding to PKCα, to increase
FLNA phosphorylation. Using genetic manipulation, it was determined that deletion of IRE1 impaired
actin cytoskeleton dynamics at the protruding and retracting areas. These finding were corroborated in
zebra fish, drosophila and mouse models. In addition, using a panel of tumor cell lines, IRE1 silencing
decreased tumor cell migration [151,169]. This discovery unveils the possibility of direct interaction
between IRE1 and the cytoskeleton network which could also take place in cancer cells (Figure 1, (1)
and (4)) [167].
4.5.2. HIF1α Regulation by XBP1s
Basal XBP1s expression has been described in TNBCs and has a key role on tumorigenicity and
tumor dissemination [170]. According to genome-wide mapping to determine XBP1s regulatory
network, XBP1s interacts with HIF1α forming a transcriptional complex that enhances the expression
of HIF1α-regulated genes by promoting the recruitment of RNA polymerase II [170]. It is well
documented that the HIF1α transcriptional program plays a key role in critical steps of metastasis like
EMT, extravasation and metastatic niche formation [171]. Furthermore, silencing of XBP1 decreased
the formation of lung metastases in an orthotopic TNBC xenograft mouse model (Figure 2, (2)) [170].
4.5.3. Dual Functions of CREB3L1 Induced by ER Stress on Tumor Migration
CREB3L1 (so called OASIS) is a transcription factor initially described in human astrocytes [172]
and later considered as an ER stress sensor [173]. This protein is located at the ER membrane and
under ER stress, CREB3L1, like ATF6, is exported to the Golgi apparatus and cleaved by S1P and
S2P proteases. The membrane-free cytosolic domain is released and translocates to the nucleus to act
as a transcription factor regulating the expression of several genes including ER chaperones such as
GRP78, and CREB3L1 itself [173]. Using a bioinformatic approach that integrates gene mutations and
DNA methylation changes, CREB3L1 was identified as an important regulatory driver in prostate
cancer [174,175]. In glioma cells, ER stress induces CREB3L1 that, in turn, negatively modulates the
expression of chondroitin sulfate proteoglycan and is associated with increased ability of tumor cell
migration/invasion [176]. Surprisingly, CREB3L1 is lost in metastatic cells from breast and bladder
tumors due to the methylation of its gene (in the promoter region and the first intronic region) leading
to an epigenetic silencing [175,177]. Restoration of CREB3L1 expression in metastatic cells dramatically
reduces their migration/invasion ability [175,177]. Importantly, CREB3L1 is transcriptionally regulated
downstream of PERK via ATF4 induction but this also requires additional signaling molecules from
the EMT pathway such as COL1A1, COL1A2, and FN1 [147]. Remarkably, CREB3L1 expression is

Cancers 2019, 11, 631 14 of 25
a predictive marker for distant metastasis in the mesenchymal subtype of TNBCs [147]. CREB3L1
increases breast tumor migration capacities through ECM production and remodeling, i.e., COL1A2
and FN1. CREB3L1 inhibition also reduces FAK activation, an important kinase that regulates cell/ECM
interaction via its impact on ECM (Figure 1, (2)) [147].
4.5.4. LAMP3 Regulation by PERK Signaling in Cancers
Under hypoxic conditions, the PERK/ATF4 axis is activated and promotes breast tumor cell
migration/invasion through the up-regulation and activation of LAMP3, a lysosomal-associated
membrane protein [178]. PERK-mediated eIF2α phosphorylation also induces LAMP3-dependent
cervix cancer cell migration under hypoxia [179]. Importantly, LAMP3 expression is also associated
with metastasis and poor prognostic in breast, cervix and colorectal cancers and head and neck
squamous carcinomas [178–182]. Although the LAMP family members are described as lysosomal
membrane proteins, their cell surface expression is often observed in cancer cells. The biologic function
of LAMP3 in tumor migration and metastasis needs therefore to be further characterized. As described
with LAMP1, LAMP3 might participate to the membrane ruffles and filopodia in migrating tumor cells
(Figure 1, (1)) [183].
5. Conclusions: UPR Signaling and Cell Migration as Future Targets in Cancer Therapy
Cancer cell migration/invasion has appeared as an important axis to target in the perspectives
of anti-cancer therapies development [2,5]. As described above, tumor cell migration is linked to
UPR signaling, thereby opening new therapeutic avenues. Interestingly, several inhibitors of the
ER stress sensors have been reported to affect tumor migration. For instance, ATF6 inhibitors of
the flavonoid family extracted from plants, i.e., apigenin, baicalein, kaempferol; display a strong
effect on inhibiting tumor migration of the large range of cancer types including brain, breast, liver,
lung, pancreas and skin, however this might be due to off target effects [184–195]. They mainly
modulate MMP2 and MMP9 metalloproteinases expression [184,188,190–192], interfere with the EMT
process through the regulation of SNAI1 and SLUG [187,189,194] and affect the AKT and MAPK
signaling pathways [186,190–192,194,195]. Like flavonoid molecules, another ATF6 inhibitor melatonin
modulates important kinases FAK, SRC and ROCK1 involved in tumor migration [195–197]. IRE1
inhibitors such as quercetin and sunitinib also inhibit tumor migration by modulating the same
molecular actors of the ECM remodeling and intracellular signaling pathways, i.e., metalloproteinases
and kinases, but again, these effects were not yet proven to occur through the inhibition of IRE1 [198–201].
More specific molecules that inhibit the PERK/eIF2α branch also affect tumor migration. The PERK
inhibitor GSK2606414 blocks brain tumor cell migration [160], but this inhibitor is also known to target
RIPK1 and c-KIT [202,203]. Subtoxic doses of eIF2α phosphatase GADD34/PP1c inhibitors guanabenz
or salubrinal reduce breast and bone cancer cell migration/invasion through the reduction of SRC [204]
and RAC1 [204,205] activity and through the modulation of MMP13 expression (for salubrinal) [204].
Altogether, although none of the UPR inhibitors are currently tested on clinical trials for cancer patients,
these findings highlight the need for clarifying the molecular mechanisms occurring under UPR that
control tumor migration/invasion. Better understanding of these mechanisms will allow to more
specifically target the relevant actors to prevent tumor invasion and metastasis; and therefore, improve
current therapeutic approaches for patients with cancer diseases.
Funding: This work was funded by a CONICYT fellowship (21160967) and an ARED international fellowship fromthe Region Bretagne to C.M.L.; by a post-doctoral fellowship from the Plan Cancer to C.S.; by grants from MSCARISE-734749 (INSPIRED) to E.C. and C.H.; by FONDECYT Iniciacion 11180825 to H.U.; and FONDECYT 1140549,FONDAP program 15150012, Millennium Institute P09-015-F, Michael J Fox Foundation for Parkinson’s Research,Target Validation grant 9277, FONDEF ID16I10223, FONDEF D11E1007, US Office of Naval Research-GlobalN62909-16-1-2003, US Air Force Office of Scientific Research FA9550-16-1-0384, ALSRP Therapeutic Idea AwardAL150111, Muscular Dystrophy Association 382453, Seed grant Leading House for the Latin American Region,Switzerland, and CONICYT-Brazil 441921/2016-7 to C.H.; by grants from INSERM, Institut National du Cancer(INCa), Région Bretagne, Rennes Métropole, Fondation pour la Recherche Médicale (FRM), EU H2020 MSCAITN-675448 (TRAINERS) to E.C.; by la Ligue contre le Cancer (Comités 35, 56 et 37) to T.A.

Cancers 2019, 11, 631 15 of 25
Conflicts of Interest: The authors declare no conflict of interest. The funders had no role in the design of thestudy; in the collection, analyses, or interpretation of data; in the writing of the manuscript, or in the decision topublish the results.
References
1. Louis, D.N.; Ohgaki, H.; Wiestler, O.D.; Cavenee, W.K.; Burger, P.C.; Jouvet, A.; Scheithauer, B.W.; Kleihues, P.
The 2007 WHO classification of tumours of the central nervous system. Acta Neuropathol. 2007, 114, 97–109.
[CrossRef] [PubMed]
2. Vehlow, A.; Cordes, N. Invasion as target for therapy of glioblastoma multiforme. Biochim. Biophys. Acta
2013, 1836, 236–244. [CrossRef]
3. Cheung, K.J.; Ewald, A.J. A collective route to metastasis: Seeding by tumor cell clusters. Science 2016, 352,
167–169. [CrossRef]
4. Lawson, D.A.; Kessenbrock, K.; Davis, R.T.; Pervolarakis, N.; Werb, Z. Tumour heterogeneity and metastasis
at single-cell resolution. Nat. Cell Biol. 2018, 20, 1349–1360. [CrossRef]
5. Luo, X.; Zhao, X.; Cheng, C.; Li, N.; Liu, Y.; Cao, Y. The implications of signaling lipids in cancer metastasis.
Exp. Mol. Med. 2018, 50, 127. [CrossRef] [PubMed]
6. Almanza, A.; Carlesso, A.; Chintha, C.; Creedican, S.; Doultsinos, D.; Leuzzi, B.; Luis, A.; McCarthy, N.;
Montibeller, L.; More, S.; et al. Endoplasmic reticulum stress signaling—From basic mechanisms to clinical
applications. FEBS J. 2018, 286, 241–278. [CrossRef] [PubMed]
7. Chevet, E.; Hetz, C.; Samali, A. Endoplasmic reticulum stress-activated cell reprogramming in oncogenesis.
Cancer Discov. 2015, 5, 586–597. [CrossRef]
8. Hetz, C.; Chevet, E.; Oakes, S.A. Proteostasis control by the unfolded protein response. Nat. Cell Rev. 2015,
17, 829–838. [CrossRef] [PubMed]
9. Hanahan, D.; Weinberg, R.A. Hallmarks of cancer: The next generation. Cell 2011, 144, 646–674. [CrossRef]
10. Hanahan, D.; Weinberg, R.A. The hallmarks of cancer. Cell 2000, 100, 57–70. [CrossRef]
11. Friedl, P.; Wolf, K. Tumour-cell invasion and migration: Diversity and escape mechanisms. Nat. Rev. Cancer
2003, 3, 362–374. [CrossRef]
12. Friedl, P.; Wolf, K. Proteolytic interstitial cell migration: A five-step process. Cancer Metastasis Rev. 2009, 28,
129–135. [CrossRef] [PubMed]
13. Ridley, A.J.; Schwartz, M.A.; Burridge, K.; Firtel, R.A.; Ginsberg, M.H.; Borisy, G.; Parsons, J.T.; Horwitz, A.R.
Cell migration: Integrating signals from front to back. Science 2003, 302, 1704–1709. [CrossRef] [PubMed]
14. Kraynov, V.S.; Chamberlain, C.; Bokoch, G.M.; Schwartz, M.A.; Slabaugh, S.; Hahn, K.M. Localized Rac
activation dynamics visualized in living cells. Science 2000, 290, 333–337. [CrossRef]
15. Ridley, A.J. Rho GTPase signalling in cell migration. Curr. Opin. Cell Biol. 2015, 36, 103–112. [CrossRef]
16. Nobes, C.D.; Hall, A. Rho, rac, and cdc42 GTPases regulate the assembly of multimolecular focal complexes
associated with actin stress fibers, lamellipodia, and filopodia. Cell 1995, 81, 53–62. [CrossRef]
17. Roper, J.A.; Williamson, R.C.; Bass, M.D. Syndecan and integrin interactomes: Large complexes in small
spaces. Curr. Opin. Struct. Biol. 2012, 22, 583–590. [CrossRef]
18. Sieg, D.J.; Hauck, C.R.; Schlaepfer, D.D. Required role of focal adhesion kinase (FAK) for integrin-stimulated
cell migration. J. Cell Sci. 1999, 112, 2677–2691. [PubMed]
19. Cary, L.A.; Klinghoffer, R.A.; Sachsenmaier, C.; Cooper, J.A. SRC catalytic but not scaffolding function is
needed for integrin-regulated tyrosine phosphorylation, cell migration, and cell spreading. Mol. Cell. Biol.
2002, 22, 2427–2440. [CrossRef]
20. Zaidel-Bar, R.; Milo, R.; Kam, Z.; Geiger, B. A paxillin tyrosine phosphorylation switch regulates the assembly
and form of cell-matrix adhesions. J. Cell Sci. 2007, 120, 137–148. [CrossRef] [PubMed]
21. Bauvois, B. New facets of matrix metalloproteinases MMP-2 and MMP-9 as cell surface transducers:
Outside-in signaling and relationship to tumor progression. Biochim. Biophys. Acta 2012, 1825, 29–36.
[CrossRef]
22. Eddy, R.J.; Weidmann, M.D.; Sharma, V.P.; Condeelis, J.S. Tumor cell invadopodia: Invasive protrusions that
orchestrate metastasis. Trends Cell Biol. 2017, 27, 595–607. [CrossRef]
23. Jacob, A.; Prekeris, R. The regulation of MMP targeting to invadopodia during cancer metastasis. Front. Cell
Dev. Biol. 2015, 3, 4. [CrossRef]

Cancers 2019, 11, 631 16 of 25
24. Kamm, K.E.; Stull, J.T. Dedicated myosin light chain kinases with diverse cellular functions. J. Biol. Chem.
2001, 276, 4527–4530. [CrossRef]
25. Katoh, K.; Kano, Y.; Amano, M.; Onishi, H.; Kaibuchi, K.; Fujiwara, K. Rho-kinase-mediated contraction of
isolated stress fibers. J. Cell Biol. 2001, 153, 569–584. [CrossRef]
26. Fukata, Y.; Amano, M.; Kaibuchi, K. Rho-Rho-kinase pathway in smooth muscle contraction and cytoskeletal
reorganization of non-muscle cells. Trends Pharmacol. Sci. 2001, 22, 32–39. [CrossRef]
27. Higuchi, M.; Kihara, R.; Okazaki, T.; Aoki, I.; Suetsugu, S.; Gotoh, Y. Akt1 promotes focal adhesion
disassembly and cell motility through phosphorylation of FAK in growth factor-stimulated cells. J. Cell Sci.
2013, 126, 745–755. [CrossRef]
28. Ezratty, E.J.; Bertaux, C.; Marcantonio, E.E.; Gundersen, G.G. Clathrin mediates integrin endocytosis for
focal adhesion disassembly in migrating cells. J. Cell Biol. 2009, 187, 733–747. [CrossRef] [PubMed]
29. Haeger, A.; Wolf, K.; Zegers, M.M.; Friedl, P. Collective cell migration: Guidance principles and hierarchies.
Trends Cell Biol. 2015, 25, 556–566. [CrossRef] [PubMed]
30. Friedl, P.; Gilmour, D. Collective cell migration in morphogenesis, regeneration and cancer. Nat. Rev. Mol.
Cell Biol. 2009, 10, 445–457. [CrossRef] [PubMed]
31. Khalil, A.A.; Friedl, P. Determinants of leader cells in collective cell migration. Integr. Biol. (Camb). 2010, 2,
568–574. [CrossRef] [PubMed]
32. Legler, D.F.; Uetz-von Allmen, E.; Hauser, M.A. CCR7: Roles in cancer cell dissemination, migration and
metastasis formation. Int. J. Biochem. Cell Biol. 2014, 54, 78–82. [CrossRef] [PubMed]
33. Pankova, K.; Rosel, D.; Novotny, M.; Brabek, J. The molecular mechanisms of transition between mesenchymal
and amoeboid invasiveness in tumor cells. Cell. Mol. Life Sci. 2010, 67, 63–71. [CrossRef]
34. Sanz-Moreno, V.; Gadea, G.; Ahn, J.; Paterson, H.; Marra, P.; Pinner, S.; Sahai, E.; Marshall, C.J. Rac activation
and inactivation control plasticity of tumor cell movement. Cell 2008, 135, 510–523. [CrossRef]
35. Lammermann, T.; Sixt, M. Mechanical modes of ‘amoeboid’ cell migration. Curr. Opin. Cell Biol. 2009, 21,
636–644. [CrossRef] [PubMed]
36. Paluch, E.K.; Raz, E. The role and regulation of blebs in cell migration. Curr. Opin. Cell Biol. 2013, 25, 582–590.
[CrossRef]
37. Sahai, E.; Marshall, C.J. Differing modes of tumour cell invasion have distinct requirements for Rho/ROCK
signalling and extracellular proteolysis. Nat. Cell Rev. 2003, 5, 711–719. [CrossRef]
38. Symons, M.; Segall, J.E. Rac and Rho driving tumor invasion: who’s at the wheel? Genome Biol. 2009, 10, 213.
[CrossRef]
39. Parri, M.; Chiarugi, P. Rac and Rho GTPases in cancer cell motility control. Cell Commun. Signal. 2010, 8, 23.
[CrossRef]
40. Lawson, C.D.; Ridley, A.J. Rho GTPase signaling complexes in cell migration and invasion. J. Cell Biol. 2018,
217, 447–457. [CrossRef]
41. Saito, K.; Ozawa, Y.; Hibino, K.; Ohta, Y. FilGAP, a Rho/Rho-associated protein kinase-regulated
GTPase-activating protein for Rac, controls tumor cell migration. Mol. Biol. Cell. 2012, 23, 4739–4750.
[CrossRef] [PubMed]
42. Kopfstein, L.; Christofori, G. Metastasis: Cell-autonomous mechanisms versus contributions by the tumor
microenvironment. Cell. Mol. Life Sci. 2006, 63, 449–468. [CrossRef] [PubMed]
43. Aladowicz, E.; Ferro, L.; Vitali, G.C.; Venditti, E.; Fornasari, L.; Lanfrancone, L. Molecular networks in
melanoma invasion and metastasis. Future Oncol. 2013, 9, 713–726. [CrossRef] [PubMed]
44. McGary, E.C.; Lev, D.C.; Bar-Eli, M. Cellular adhesion pathways and metastatic potential of human melanoma.
Cancer Biol. Ther. 2002, 1, 459–465. [CrossRef]
45. Bonaventure, J.; Domingues, M.J.; Larue, L. Cellular and molecular mechanisms controlling the migration of
melanocytes and melanoma cells. Pigment Cell Melanoma Res. 2013, 26, 316–325. [CrossRef] [PubMed]
46. Omholt, K.; Platz, A.; Kanter, L.; Ringborg, U.; Hansson, J. NRAS and BRAF mutations arise early during
melanoma pathogenesis and are preserved throughout tumor progression. Clin. Cancer Res. 2003, 9,
6483–6488.
47. Wheelock, M.J.; Shintani, Y.; Maeda, M.; Fukumoto, Y.; Johnson, K.R. Cadherin switching. J. Cell Sci. 2008,
121, 727–735. [CrossRef]

Cancers 2019, 11, 631 17 of 25
48. Hao, L.; Ha, J.R.; Kuzel, P.; Garcia, E.; Persad, S. Cadherin switch from E- to N-cadherin in melanoma
progression is regulated by the PI3K/PTEN pathway through twist and snail. Br. J. Dermatol. 2012, 166,
1184–1197. [CrossRef] [PubMed]
49. Schadendorf, D.; Gawlik, C.; Haney, U.; Ostmeier, H.; Suter, L.; Czarnetzki, B.M. Tumour progression and
metastatic behaviour in vivo correlates with integrin expression on melanocytic tumours. J. Pathol. 1993, 170,
429–434. [CrossRef]
50. Nasulewicz-Goldeman, A.; Uszczynska, B.; Szczaurska-Nowak, K.; Wietrzyk, J. siRNA-mediated silencing
of integrin beta3 expression inhibits the metastatic potential of B16 melanoma cells. Oncol. Rep. 2012, 28,
1567–1573. [CrossRef]
51. Nikkola, J.; Vihinen, P.; Vuoristo, M.S.; Kellokumpu-Lehtinen, P.; Kahari, V.M.; Pyrhonen, S. High serum
levels of matrix metalloproteinase-9 and matrix metalloproteinase-1 are associated with rapid progression in
patients with metastatic melanoma. Clin. Cancer Res. 2005, 11, 5158–5166. [CrossRef]
52. Jiao, Y.; Feng, X.; Zhan, Y.; Wang, R.; Zheng, S.; Liu, W.; Zeng, X. Matrix metalloproteinase-2 promotes
alphavbeta3 integrin-mediated adhesion and migration of human melanoma cells by cleaving fibronectin.
PLoS ONE 2012, 7, e41591. [CrossRef] [PubMed]
53. Cantelli, G.; Orgaz, J.L.; Rodriguez-Hernandez, I.; Karagiannis, P.; Maiques, O.; Matias-Guiu, X.; Nestle, F.O.;
Marti, R.M.; Karagiannis, S.N.; Sanz-Moreno, V. TGF-beta-induced transcription sustains amoeboid melanoma
migration and dissemination. Curr. Biol. 2015, 25, 2899–2914. [CrossRef]
54. Ahn, J.; Sanz-Moreno, V.; Marshall, C.J. The metastasis gene NEDD9 product acts through integrin beta3
and Src to promote mesenchymal motility and inhibit amoeboid motility. J. Cell Sci. 2012, 125, 1814–1826.
[CrossRef]
55. Guerrero, M.S.; Parsons, J.T.; Bouton, A.H. Cas and NEDD9 contribute to tumor progression through dynamic
regulation of the cytoskeleton. Genes Cancer 2012, 3, 371–381. [CrossRef] [PubMed]
56. Zhong, J.; Paul, A.; Kellie, S.J.; O’Neill, G.M. Mesenchymal migration as a therapeutic target in glioblastoma.
J. Oncol. 2010, 2010, 430142. [CrossRef]
57. Beadle, C.; Assanah, M.C.; Monzo, P.; Vallee, R.; Rosenfeld, S.S.; Canoll, P. The role of myosin II in glioma
invasion of the brain. Mol. Biol. Cell. 2008, 19, 3357–3368. [CrossRef] [PubMed]
58. Caspani, E.M.; Echevarria, D.; Rottner, K.; Small, J.V. Live imaging of glioblastoma cells in brain tissue shows
requirement of actin bundles for migration. Neuron Glia Biol. 2006, 2, 105–114. [CrossRef]
59. Rao, J.S. Molecular mechanisms of glioma invasiveness: The role of proteases. Nat. Rev. Cancer 2003, 3,
489–501. [CrossRef] [PubMed]
60. Deryugina, E.I.; Bourdon, M.A.; Luo, G.X.; Reisfeld, R.A.; Strongin, A. Matrix metalloproteinase-2 activation
modulates glioma cell migration. J. Cell Sci. 1997, 110, 2473–2482. [PubMed]
61. Nakada, M.; Nakamura, H.; Ikeda, E.; Fujimoto, N.; Yamashita, J.; Sato, H.; Seiki, M.; Okada, Y. Expression
and tissue localization of membrane-type 1, 2, and 3 matrix metalloproteinases in human astrocytic tumors.
Am. J. Pathol. 1999, 154, 417–428. [CrossRef]
62. Yamamoto, M.; Mohanam, S.; Sawaya, R.; Fuller, G.N.; Seiki, M.; Sato, H.; Gokaslan, Z.L.; Liotta, L.A.;
Nicolson, G.L.; Rao, J.S. Differential expression of membrane-type matrix metalloproteinase and its correlation
with gelatinase A activation in human malignant brain tumors in vivo and in vitro. Cancer Res. 1996, 56,
384–392. [PubMed]
63. Lampert, K.; Machein, U.; Machein, M.R.; Conca, W.; Peter, H.H.; Volk, B. Expression of matrix
metalloproteinases and their tissue inhibitors in human brain tumors. Am. J. Pathol. 1998, 153, 429–437.
[CrossRef]
64. Gingras, M.C.; Roussel, E.; Bruner, J.M.; Branch, C.D.; Moser, R.P. Comparison of cell adhesion molecule
expression between glioblastoma multiforme and autologous normal brain tissue. J. Neuroimmunol. 1995, 57,
143–153. [CrossRef]
65. Gritsenko, P.G.; Friedl, P. Adaptive adhesion systems mediate glioma cell invasion in complex environments.
J. Cell Sci. 2018, 131, jcs216382. [CrossRef] [PubMed]
66. Lewis-Tuffin, L.J.; Feathers, R.; Hari, P.; Durand, N.; Li, Z.; Rodriguez, F.J.; Bakken, K.; Carlson, B.;
Schroeder, M.; Sarkaria, J.N.; et al. Src family kinases differentially influence glioma growth and motility.
Mol. Oncol. 2015, 9, 1783–1798. [CrossRef] [PubMed]
67. Natarajan, M.; Hecker, T.P.; Gladson, C.L. FAK signaling in anaplastic astrocytoma and glioblastoma tumors.
Cancer J. 2003, 9, 126–133. [CrossRef] [PubMed]

Cancers 2019, 11, 631 18 of 25
68. Natarajan, M.; Stewart, J.E.; Golemis, E.A.; Pugacheva, E.N.; Alexandropoulos, K.; Cox, B.D.; Wang, W.;
Grammer, J.R.; Gladson, C.L. HEF1 is a necessary and specific downstream effector of FAK that promotes the
migration of glioblastoma cells. Oncogene 2006, 25, 1721–1732. [CrossRef]
69. Liu, Q.; Li, G.; Li, R.; Shen, J.; He, Q.; Deng, L.; Zhang, C.; Zhang, J. IL-6 promotion of glioblastoma cell
invasion and angiogenesis in U251 and T98G cell lines. J. Neuro-Oncol. 2010, 100, 165–176. [CrossRef]
70. Li, R.; Li, G.; Deng, L.; Liu, Q.; Dai, J.; Shen, J.; Zhang, J. IL-6 augments the invasiveness of U87MG human
glioblastoma multiforme cells via up-regulation of MMP-2 and fascin-1. Oncol. rep. 2010, 23, 1553–1559.
[CrossRef]
71. Li, G.H.; Wei, H.; Lv, S.Q.; Ji, H.; Wang, D.L. Knockdown of STAT3 expression by RNAi suppresses growth
and induces apoptosis and differentiation in glioblastoma stem cells. Int. J. Oncol. 2010, 37, 103–110.
72. Priester, M.; Copanaki, E.; Vafaizadeh, V.; Hensel, S.; Bernreuther, C.; Glatzel, M.; Seifert, V.; Groner, B.;
Kogel, D.; Weissenberger, J. STAT3 silencing inhibits glioma single cell infiltration and tumor growth.
Neuro-Oncology 2013, 15, 840–852. [CrossRef]
73. Avril, T.; Etcheverry, A.; Pineau, R.; Obacz, J.; Jegou, G.; Jouan, F.; Le Reste, P.J.; Hatami, M.; Colen, R.R.;
Brett, L.; et al. CD90 expression controls migration and predicts dasatinib response in glioblastoma. Clin.
Cancer Res. 2017, 23, 7360–7374. [CrossRef]
74. Noha, M.; Yoshida, D.; Watanabe, K.; Teramoto, A. Suppression of cell invasion on human malignant glioma
cell lines by a novel matrix-metalloproteinase inhibitor SI-27: In vitro study. J. Neuro-Oncol. 2000, 48, 217–223.
[CrossRef]
75. Tonn, J.C.; Kerkau, S.; Hanke, A.; Bouterfa, H.; Mueller, J.G.; Wagner, S.; Vince, G.H.; Roosen, K. Effect of
synthetic matrix-metalloproteinase inhibitors on invasive capacity and proliferation of human malignant
gliomas in vitro. Int. J. Cancer 1999, 80, 764–772. [CrossRef]
76. Price, A.; Shi, Q.; Morris, D.; Wilcox, M.E.; Brasher, P.M.; Rewcastle, N.B.; Shalinsky, D.; Zou, H.; Appelt, K.;
Johnston, R.N.; et al. Marked inhibition of tumor growth in a malignant glioma tumor model by a novel
synthetic matrix metalloproteinase inhibitor AG3340. Clin. Cancer Res. 1999, 5, 845–854.
77. Yamada, S.; Bu, X.Y.; Khankaldyyan, V.; Gonzales-Gomez, I.; McComb, J.G.; Laug, W.E. Effect of the
angiogenesis inhibitor Cilengitide (EMD 121974) on glioblastoma growth in nude mice. Neurosurgery 2006,
59, 1304–1312. [CrossRef]
78. Yap, C.T.; Simpson, T.I.; Pratt, T.; Price, D.J.; Maciver, S.K. The motility of glioblastoma tumour cells is
modulated by intracellular cofilin expression in a concentration-dependent manner. Cell Motil. Cytoskelet.
2005, 60, 153–165. [CrossRef]
79. Shi, Q.; Hjelmeland, A.B.; Keir, S.T.; Song, L.; Wickman, S.; Jackson, D.; Ohmori, O.; Bigner, D.D.;
Friedman, H.S.; Rich, J.N. A novel low-molecular weight inhibitor of focal adhesion kinase, TAE226,
inhibits glioma growth. Mol. Carcinog. 2007, 46, 488–496. [CrossRef]
80. Golubovskaya, V.M.; Huang, G.; Ho, B.; Yemma, M.; Morrison, C.D.; Lee, J.; Eliceiri, B.P.; Cance, W.G.
Pharmacologic blockade of FAK autophosphorylation decreases human glioblastoma tumor growth and
synergizes with temozolomide. Mol. Cancer Ther. 2013, 12, 162–172. [CrossRef]
81. Schultze, A.; Decker, S.; Otten, J.; Horst, A.K.; Vohwinkel, G.; Schuch, G.; Bokemeyer, C.; Loges, S.; Fiedler, W.
TAE226-mediated inhibition of focal adhesion kinase interferes with tumor angiogenesis and vasculogenesis.
Investig. New Drugs 2010, 28, 825–833. [CrossRef]
82. Lu, K.V.; Zhu, S.; Cvrljevic, A.; Huang, T.T.; Sarkaria, S.; Ahkavan, D.; Dang, J.; Dinca, E.B.; Plaisier, S.B.;
Oderberg, I.; et al. Fyn and SRC are effectors of oncogenic epidermal growth factor receptor signaling in
glioblastoma patients. Cancer Res. 2009, 69, 6889–6898. [CrossRef]
83. Angers-Loustau, A.; Hering, R.; Werbowetski, T.E.; Kaplan, D.R.; Del Maestro, R.F. SRC regulates actin
dynamics and invasion of malignant glial cells in three dimensions. Mol. Cancer Res. 2004, 2, 595–605.
84. Milano, V.; Piao, Y.; LaFortune, T.; de Groot, J. Dasatinib-induced autophagy is enhanced in combination
with temozolomide in glioma. Mol. Cancer Ther. 2009, 8, 394–406. [CrossRef]
85. Huveldt, D.; Lewis-Tuffin, L.J.; Carlson, B.L.; Schroeder, M.A.; Rodriguez, F.; Giannini, C.; Galanis, E.;
Sarkaria, J.N.; Anastasiadis, P.Z. Targeting Src family kinases inhibits bevacizumab-induced glioma cell
invasion. PLoS ONE 2013, 8, e56505. [CrossRef]
86. Rojas-Rivera, D.; Rodriguez, D.A.; Sepulveda, D.; Hetz, C. ER stress sensing mechanism: Putting off the
brake on UPR transducers. Oncotarget 2018, 9, 19461–19462. [CrossRef]

Cancers 2019, 11, 631 19 of 25
87. Hetz, C.; Papa, F.R. The unfolded protein response and cell fate control. Mol. Cell. 2018, 69, 169–181.
[CrossRef]
88. Avril, T.; Vauleon, E.; Chevet, E. Endoplasmic reticulum stress signaling and chemotherapy resistance in
solid cancers. Oncogenesis 2017, 6, e373. [CrossRef] [PubMed]
89. Dejeans, N.; Barroso, K.; Fernandez-Zapico, M.E.; Samali, A.; Chevet, E. Novel roles of the unfolded protein
response in the control of tumor development and aggressiveness. Sem. Cancer Biol. 2015, 33, 67–73.
[CrossRef]
90. Galmiche, A.; Sauzay, C.; Chevet, E.; Pluquet, O. Role of the unfolded protein response in tumor cell
characteristics and cancer outcome. Curr. Opin. Oncol. 2017, 29, 41–47. [CrossRef]
91. Madden, E.; Logue, S.E.; Healy, S.J.; Manie, S.; Samali, A. The role of the unfolded protein response in cancer
progression: From oncogenesis to chemoresistance. Biol. Cell. 2019, 111, 1–17. [CrossRef]
92. Obacz, J.; Avril, T.; Le Reste, P.J.; Urra, H.; Quillien, V.; Hetz, C.; Chevet, E. Endoplasmic reticulum proteostasis
in glioblastoma—From molecular mechanisms to therapeutic perspectives. Sci. Signal. 2017, 10, eaal2323.
[CrossRef] [PubMed]
93. Obacz, J.; Avril, T.; Rubio-Patino, C.; Bossowski, J.P.; Igbaria, A.; Ricci, J.E.; Chevet, E. Regulation of
tumor-stroma interactions by the unfolded protein response. FEBS J. 2017, 286, 279–296. [CrossRef]
[PubMed]
94. Papaioannou, A.; Chevet, E. Driving cancer tumorigenesis and metastasis through UPR signaling. Curr. Top.
Microbiol. Immunol. 2018, 414, 159–192. [PubMed]
95. Urra, H.; Dufey, E.; Avril, T.; Chevet, E.; Hetz, C. Endoplasmic reticulum stress and the hallmarks of cancer.
Trends Cancer 2016, 2, 252–262. [CrossRef] [PubMed]
96. Walter, P.; Ron, D. The unfolded protein response: From stress pathway to homeostatic regulation. Science
2011, 334, 1081–1086. [CrossRef] [PubMed]
97. Bertolotti, A.; Zhang, Y.; Hendershot, L.M.; Harding, H.P.; Ron, D. Dynamic interaction of BiP and ER stress
transducers in the unfolded-protein response. Nat. Cell Rev. 2000, 2, 326–332. [CrossRef]
98. Carrara, M.; Prischi, F.; Nowak, P.R.; Kopp, M.C.; Ali, M.M. Noncanonical binding of BiP ATPase domain to
Ire1 and Perk is dissociated by unfolded protein CH1 to initiate ER stress signaling. eLife 2015, 4, e03522.
[CrossRef]
99. Amin-Wetzel, N.; Saunders, R.A.; Kamphuis, M.J.; Rato, C.; Preissler, S.; Harding, H.P.; Ron, D. A J-protein
co-chaperone recruits BiP to monomerize IRE1 and repress the unfolded protein response. Cell 2017, 171,
1625–1637. [CrossRef]
100. Groenendyk, J.; Peng, Z.; Dudek, E.; Fan, X.; Mizianty, M.J.; Dufey, E.; Urra, H.; Sepulveda, D.; Rojas-Rivera, D.;
Lim, Y.; et al. Interplay between the oxidoreductase PDIA6 and microRNA-322 controls the response to
disrupted endoplasmic reticulum calcium homeostasis. Sci. Signal. 2014, 7, ra54. [CrossRef]
101. Sepulveda, D.; Rojas-Rivera, D.; Rodriguez, D.A.; Groenendyk, J.; Kohler, A.; Lebeaupin, C.; Ito, S.; Urra, H.;
Carreras-Sureda, A.; Hazari, Y.; et al. Interactome screening identifies the ER luminal chaperone Hsp47 as a
regulator of the unfolded protein response transducer IRE1alpha. Mol. Cell 2018, 69, 238–252. [CrossRef]
[PubMed]
102. Karagoz, G.E.; Acosta-Alvear, D.; Nguyen, H.T.; Lee, C.P.; Chu, F.; Walter, P. An unfolded protein-induced
conformational switch activates mammalian IRE1. eLife 2017, 6, e30700. [CrossRef]
103. Haze, K.; Yoshida, H.; Yanagi, H.; Yura, T.; Mori, K. Mammalian transcription factor ATF6 is synthesized as a
transmembrane protein and activated by proteolysis in response to endoplasmic reticulum stress. Mol. Biol.
Cell. 1999, 10, 3787–3799. [CrossRef] [PubMed]
104. Haze, K.; Okada, T.; Yoshida, H.; Yanagi, H.; Yura, T.; Negishi, M.; Mori, K. Identification of the G13
(cAMP-response-element-binding protein-related protein) gene product related to activating transcription
factor 6 as a transcriptional activator of the mammalian unfolded protein response. Biochem. J. 2001, 355,
19–28. [CrossRef] [PubMed]
105. Thuerauf, D.J.; Marcinko, M.; Belmont, P.J.; Glembotski, C.C. Effects of the isoform-specific characteristics of
ATF6 alpha and ATF6 beta on endoplasmic reticulum stress response gene expression and cell viability. J.
Biol. Chem. 2007, 282, 22865–22878. [CrossRef] [PubMed]
106. Shen, J.; Snapp, E.L.; Lippincott-Schwartz, J.; Prywes, R. Stable binding of ATF6 to BiP in the endoplasmic
reticulum stress response. Mol. Cell. Biol. 2005, 25, 921–932. [CrossRef]

Cancers 2019, 11, 631 20 of 25
107. Higa, A.; Taouji, S.; Lhomond, S.; Jensen, D.; Fernandez-Zapico, M.E.; Simpson, J.C.; Pasquet, J.M.;
Schekman, R.; Chevet, E. Endoplasmic reticulum stress-activated transcription factor ATF6alpha requires the
disulfide isomerase PDIA5 to modulate chemoresistance. Mol. Cell. Biol. 2014, 34, 1839–1849. [CrossRef]
108. Nadanaka, S.; Okada, T.; Yoshida, H.; Mori, K. Role of disulfide bridges formed in the luminal domain of
ATF6 in sensing endoplasmic reticulum stress. Mol. Cell. Biol. 2007, 27, 1027–1043. [CrossRef]
109. Shen, J.; Chen, X.; Hendershot, L.; Prywes, R. ER stress regulation of ATF6 localization by dissociation of
BiP/GRP78 binding and unmasking of Golgi localization signals. Dev. Cell 2002, 3, 99–111. [CrossRef]
110. Lu, Y.; Liang, F.X.; Wang, X. A synthetic biology approach identifies the mammalian UPR RNA ligase RtcB.
Mol. Cell 2014, 55, 758–770. [CrossRef]
111. Ye, J.; Rawson, R.B.; Komuro, R.; Chen, X.; Dave, U.P.; Prywes, R.; Brown, M.S.; Goldstein, J.L. ER stress
induces cleavage of membrane-bound ATF6 by the same proteases that process SREBPs. Mol. Cell 2000, 6,
1355–1364. [CrossRef]
112. Yamamoto, K.; Sato, T.; Matsui, T.; Sato, M.; Okada, T.; Yoshida, H.; Harada, A.; Mori, K. Transcriptional
induction of mammalian ER quality control proteins is mediated by single or combined action of ATF6alpha
and XBP1. Dev. Cell 2007, 13, 365–376. [CrossRef] [PubMed]
113. Yoshida, H.; Matsui, T.; Yamamoto, A.; Okada, T.; Mori, K. XBP1 mRNA is induced by ATF6 and spliced
by IRE1 in response to ER stress to produce a highly active transcription factor. Cell 2001, 107, 881–891.
[CrossRef]
114. Urano, F.; Wang, X.; Bertolotti, A.; Zhang, Y.; Chung, P.; Harding, H.P.; Ron, D. Coupling of stress in the
ER to activation of JNK protein kinases by transmembrane protein kinase IRE1. Science 2000, 287, 664–666.
[CrossRef]
115. Tam, A.B.; Mercado, E.L.; Hoffmann, A.; Niwa, M. ER stress activates NF-kappaB by integrating functions of
basal IKK activity, IRE1 and PERK. PLoS ONE 2012, 7, e45078. [CrossRef] [PubMed]
116. Scheuner, D.; Song, B.; McEwen, E.; Liu, C.; Laybutt, R.; Gillespie, P.; Saunders, T.; Bonner-Weir, S.;
Kaufman, R.J. Translational control is required for the unfolded protein response and in vivo glucose
homeostasis. Mol. Cell 2001, 7, 1165–1176. [CrossRef]
117. Harding, H.P.; Zhang, Y.; Bertolotti, A.; Zeng, H.; Ron, D. Perk is essential for translational regulation and
cell survival during the unfolded protein response. Mol. Cell 2000, 5, 897–904. [CrossRef]
118. Lu, P.D.; Harding, H.P.; Ron, D. Translation reinitiation at alternative open reading frames regulates gene
expression in an integrated stress response. J. Cell Biol. 2004, 167, 27–33. [CrossRef]
119. Vattem, K.M.; Wek, R.C. Reinitiation involving upstream ORFs regulates ATF4 mRNA translation in
mammalian cells. Proc. Natl. Acad. Sci. USA 2004, 101, 11269–11274. [CrossRef]
120. Cullinan, S.B.; Zhang, D.; Hannink, M.; Arvisais, E.; Kaufman, R.J.; Diehl, J.A. Nrf2 is a direct PERK substrate
and effector of PERK-dependent cell survival. Mol. Cell. Biol. 2003, 23, 7198–7209. [CrossRef]
121. Harding, H.P.; Zhang, Y.; Zeng, H.; Novoa, I.; Lu, P.D.; Calfon, M.; Sadri, N.; Yun, C.; Popko, B.; Paules, R.;
et al. An integrated stress response regulates amino acid metabolism and resistance to oxidative stress. Mol.
Cell 2003, 11, 619–633. [CrossRef]
122. Ye, J.; Koumenis, C. ATF4, an ER stress and hypoxia-inducible transcription factor and its potential role in
hypoxia tolerance and tumorigenesis. Curr. Mol. Med. 2009, 9, 411–416. [CrossRef]
123. Tsaytler, P.; Harding, H.P.; Ron, D.; Bertolotti, A. Selective inhibition of a regulatory subunit of protein
phosphatase 1 restores proteostasis. Science 2011, 332, 91–94. [CrossRef]
124. Puthalakath, H.; O’Reilly, L.A.; Gunn, P.; Lee, L.; Kelly, P.N.; Huntington, N.D.; Hughes, P.D.; Michalak, E.M.;
McKimm-Breschkin, J.; Motoyama, N.; et al. ER stress triggers apoptosis by activating BH3-only protein Bim.
Cell 2007, 129, 1337–1349. [CrossRef]
125. Galehdar, Z.; Swan, P.; Fuerth, B.; Callaghan, S.M.; Park, D.S.; Cregan, S.P. Neuronal apoptosis induced by
endoplasmic reticulum stress is regulated by ATF4-CHOP-mediated induction of the Bcl-2 homology 3-only
member PUMA. J. Neurosci. 2010, 30, 16938–16948. [CrossRef]
126. Wang, M.; Kaufman, R.J. The impact of the endoplasmic reticulum protein-folding environment on cancer
development. Nat. Rev. Cancer 2014, 14, 581–897. [CrossRef]
127. Shuda, M.; Kondoh, N.; Imazeki, N.; Tanaka, K.; Okada, T.; Mori, K.; Hada, A.; Arai, M.; Wakatsuki, T.;
Matsubara, O. Activation of the ATF6, XBP1 and grp78 genes in human hepatocellular carcinoma: A possible
involvement of the ER stress pathway in hepatocarcinogenesis. J. Hepatol. 2003, 38, 605–614. [CrossRef]

Cancers 2019, 11, 631 21 of 25
128. Scriven, P.; Coulson, S.; Haines, R.; Balasubramanian, S.; Cross, S.; Wyld, L. Activation and clinical significance
of the unfolded protein response in breast cancer. Br. J. Cancer 2009, 101, 1692–1698. [CrossRef]
129. Lizardo, M.M.; Morrow, J.J.; Miller, T.E.; Hong, E.S.; Ren, L.; Mendoza, A.; Halsey, C.H.; Scacheri, P.C.;
Helman, L.J.; Khanna, C. Upregulation of glucose-regulated protein 78 in metastatic cancer cells is necessary
for lung metastasis progression. Neoplasia 2016, 18, 699–710. [CrossRef]
130. Miao, Y.R.; Eckhardt, B.L.; Cao, Y.; Pasqualini, R.; Argani, P.; Arap, W.; Ramsay, R.G.; Anderson, R.L.
Inhibition of established micrometastases by targeted drug delivery via cell surface-associated GRP78. Clin.
Cancer Res. 2013, 19, 2107–2116. [CrossRef]
131. Chang, Y.J.; Chen, W.Y.; Huang, C.Y.; Liu, H.H.; Wei, P.L. Glucose-regulated protein 78 (GRP78) regulates
colon cancer metastasis through EMT biomarkers and the NRF-2/HO-1 pathway. Tumour Biol. 2015, 36,
1859–1869. [CrossRef] [PubMed]
132. Ren, P.; Chen, C.; Yue, J.; Zhang, J.; Yu, Z. High expression of glucose-regulated protein 78 (GRP78) is
associated with metastasis and poor prognosis in patients with esophageal squamous cell carcinoma.
OncoTargets Ther. 2017, 10, 617–625. [CrossRef]
133. Guan, M.; Chen, X.; Ma, Y.; Tang, L.; Guan, L.; Ren, X.; Yu, B.; Zhang, W.; Su, B. MDA-9 and GRP78 as
potential diagnostic biomarkers for early detection of melanoma metastasis. Tumour Biol. 2015, 36, 2973–2982.
[CrossRef] [PubMed]
134. Li, X.X.; Zhang, H.S.; Xu, Y.M.; Zhang, R.J.; Chen, Y.; Fan, L.; Qin, Y.Q.; Liu, Y.; Li, M.; Fang, J. Knockdown
of IRE1alpha inhibits colonic tumorigenesis through decreasing beta-catenin and IRE1alpha targeting
suppresses colon cancer cells. Oncogene 2017, 36, 6738–6746. [CrossRef]
135. Atkins, C.; Liu, Q.; Minthorn, E.; Zhang, S.Y.; Figueroa, D.J.; Moss, K.; Stanley, T.B.; Sanders, B.; Goetz, A.;
Gaul, N.; et al. Characterization of a novel PERK kinase inhibitor with antitumor and antiangiogenic activity.
Cancer Res. 2013, 73, 1993–2002. [CrossRef]
136. Bobrovnikova-Marjon, E.; Grigoriadou, C.; Pytel, D.; Zhang, F.; Ye, J.; Koumenis, C.; Cavener, D.; Diehl, J.A.
PERK promotes cancer cell proliferation and tumor growth by limiting oxidative DNA damage. Oncogene
2010, 29, 3881–3895. [CrossRef]
137. Drogat, B.; Auguste, P.; Nguyen, D.T.; Bouchecareilh, M.; Pineau, R.; Nalbantoglu, J.; Kaufman, R.J.;
Chevet, E.; Bikfalvi, A.; Moenner, M. IRE1 signaling is essential for ischemia-induced vascular endothelial
growth factor-A expression and contributes to angiogenesis and tumor growth in vivo. Cancer Res. 2007, 67,
6700–6707. [CrossRef]
138. Wang, Y.; Alam, G.N.; Ning, Y.; Visioli, F.; Dong, Z.; Nor, J.E.; Polverini, P.J. The unfolded protein response
induces the angiogenic switch in human tumor cells through the PERK/ATF4 pathway. Cancer Res. 2012, 72,
5396–5406. [CrossRef]
139. Mhaidat, N.M.; Alzoubi, K.H.; Abushbak, A. X-box binding protein 1 (XBP-1) enhances colorectal cancer cell
invasion. J. Chemother. 2015, 27, 167–173. [CrossRef]
140. Li, H.; Chen, X.; Gao, Y.; Wu, J.; Zeng, F.; Song, F. XBP1 induces snail expression to promote epithelial-
to-mesenchymal transition and invasion of breast cancer cells. Cell. Signal. 2015, 27, 82–89. [CrossRef]
141. Sun, Y.; Jiang, F.; Pan, Y.; Chen, X.; Chen, J.; Wang, Y.; Zheng, X.; Zhang, J. XBP1 promotes tumor invasion and
is associated with poor prognosis in oral squamous cell carcinoma. Oncol. Rep. 2018, 40, 988–998. [CrossRef]
[PubMed]
142. Jin, C.; Jin, Z.; Chen, N.Z.; Lu, M.; Liu, C.B.; Hu, W.L.; Zheng, C.G. Activation of IRE1alpha-XBP1 pathway
induces cell proliferation and invasion in colorectal carcinoma. Biochem. Biophys. Res. Commun. 2016, 470,
75–81. [CrossRef] [PubMed]
143. Xia, T.; Tong, S.; Fan, K.; Zhai, W.; Fang, B.; Wang, S.H.; Wang, J.J. XBP1 induces MMP-9 expression to
promote proliferation and invasion in human esophageal squamous cell carcinoma. Am. J. Cancer Res. 2016,
6, 2031–2040.
144. Wu, S.; Du, R.; Gao, C.; Kang, J.; Wen, J.; Sun, T. The role of XBP1s in the metastasis and prognosis of
hepatocellular carcinoma. Biochem. Biophys. Res. Commun. 2018, 500, 530–537. [CrossRef]
145. Hsu, H.T.; Hsing, M.T.; Yeh, C.M.; Chen, C.J.; Yang, J.S.; Yeh, K.T. Decreased cytoplasmic X-box binding
protein-1 expression is associated with poor prognosis and overall survival in patients with oral squamous
cell carcinoma. Clin. Chim. Acta 2018, 479, 66–71. [CrossRef]

Cancers 2019, 11, 631 22 of 25
146. Pommier, A.; Anaparthy, N.; Memos, N.; Kelley, Z.L.; Gouronnec, A.; Yan, R.; Auffray, C.; Albrengues, J.;
Egeblad, M.; Lacobuzio-Donahue, C.A.; et al. Unresolved endoplasmic reticulum stress engenders
immune-resistant, latent pancreatic cancer metastases. Science 2018, 360, eaao4908. [CrossRef] [PubMed]
147. Feng, Y.X.; Jin, D.X.; Sokol, E.S.; Reinhardt, F.; Miller, D.H.; Gupta, P.B. Cancer-specific PERK signaling drives
invasion and metastasis through CREB3L1. Nat. Commun. 2017, 8, 1079. [CrossRef]
148. Zhu, H.; Chen, X.; Chen, B.; Chen, B.; Song, W.; Sun, D.; Zhao, Y. Activating transcription factor 4 promotes
esophageal squamous cell carcinoma invasion and metastasis in mice and is associated with poor prognosis
in human patients. PLoS ONE 2014, 9, e103882. [CrossRef]
149. Kessenbrock, K.; Plaks, V.; Werb, Z. Matrix metalloproteinases: Regulators of the tumor microenvironment.
Cell 2010, 141, 52–67. [CrossRef]
150. Auf, G.; Jabouille, A.; Guerit, S.; Pineau, R.; Delugin, M.; Bouchecareilh, M.; Meynard-Cadars, M.;
Bidaud-Meynard, A.; Gentil, C.; Moreau, V.; et al. Inositol-requiring enzyme 1alpha is a key regulator
of angiogenesis and invasion in malignant glioma. Proc. Natl. Acad. Sci. USA 2010, 107, 15553–15558.
[CrossRef]
151. Dejeans, N.; Pluquet, O.; Lhomond, S.; Grise, F.; Bouchecareilh, M.; Juin, A.; Meynard-Cadars, M.;
Bidaud-Meynard, A.; Gentil, C.; Moreau, V.; et al. Autocrine control of glioma cells adhesion and migration
through IRE1alpha-mediated cleavage of SPARC mRNA. J. Cell Sci. 2012, 125, 4278–4287. [CrossRef]
152. Pluquet, O.; Dejeans, N.; Bouchecareilh, M.; Lhomond, S.; Pineau, R.; Higa, A.; Delugin, M.; Combe, C.;
Loriot, S.; Cubel, G.; et al. Posttranscriptional regulation of PER1 underlies the oncogenic function of
IREalpha. Cancer Res. 2013, 73, 4732–4743. [CrossRef]
153. Jabouille, A.; Delugin, M.; Pineau, R.; Dubrac, A.; Soulet, F.; Lhomond, S.; Pallares-Lupon, N.; Prats, H.;
Bikfalvi, A.; Chevet, E.; et al. Glioblastoma invasion and cooption depend on IRE1alpha endoribonuclease
activity. Oncotarget 2015, 6, 24922–24934. [CrossRef]
154. Podszywalow-Bartnicka, P.; Cmoch, A.; Wolczyk, M.; Bugajski, L.; Tkaczyk, M.; Dadlez, M.;
Nieborowska-Skorska, M.; Koromilas, A.E.; Skorski, T.; Piwocka, K. Increased phosphorylation of eIF2alpha
in chronic myeloid leukemia cells stimulates secretion of matrix modifying enzymes. Oncotarget 2016, 7,
79706–79721. [CrossRef]
155. Fukushima, R.; Kasamatsu, A.; Nakashima, D.; Higo, M.; Fushimi, K.; Kasama, H.; Endo-Sakamoto, Y.;
Shiiba, M.; Tanzawa, H.; Uzawa, K. Overexpression of translocation associated membrane protein 2 leading
to cancer-associated matrix metalloproteinase activation as a putative metastatic factor for human oral cancer.
J. Cancer 2018, 9, 3326–3333. [CrossRef]
156. Feng, Y.X.; Sokol, E.S.; Del Vecchio, C.A.; Sanduja, S.; Claessen, J.H.; Proia, T.A.; Jin, D.X.; Reinhardt, F.;
Ploegh, H.L.; Wang, Q.; et al. Epithelial-to-mesenchymal transition activates PERK-eIF2alpha and sensitizes
cells to endoplasmic reticulum stress. Cancer Discov. 2014, 4, 702–715. [CrossRef]
157. Wang, L.; Zhang, Y.; Wang, W.; Zhu, Y.; Chen, Y.; Tian, B. Gemcitabine treatment induces endoplasmic
reticular (ER) stress and subsequently upregulates urokinase plasminogen activator (uPA) to block
mitochondrial-dependent apoptosis in Panc-1 cancer stem-like cells (CSCs). PLoS ONE 2017, 12, e0184110.
[CrossRef]
158. Rzymski, T.; Petry, A.; Kracun, D.; Riess, F.; Pike, L.; Harris, A.L.; Gorlach, A. The unfolded protein response
controls induction and activation of ADAM17/TACE by severe hypoxia and ER stress. Oncogene 2012, 31,
3621–3634. [CrossRef]
159. Park, S.H.; Kim, J.; Do, K.H.; Park, J.; Oh, C.G.; Choi, H.J.; Song, B.G.; Lee, S.J.; Kim, Y.S.; Moon, Y. Activating
transcription factor 3-mediated chemo-intervention with cancer chemokines in a noncanonical pathway
under endoplasmic reticulum stress. J. Biol. Chem. 2014, 289, 27118–27133. [CrossRef]
160. Jamison, S.; Lin, Y.; Lin, W. Pancreatic endoplasmic reticulum kinase activation promotes medulloblastoma
cell migration and invasion through induction of vascular endothelial growth factor A. PLoS ONE 2015, 10,
e0120252. [CrossRef]
161. Eigner, K.; Filik, Y.; Mark, F.; Schutz, B.; Klambauer, G.; Moriggl, R.; Hengstschlager, M.; Stangl, H.; Mikula, M.;
Rohrl, C. The unfolded protein response impacts melanoma progression by enhancing FGF expression and
can be antagonized by a chemical chaperone. Sci. Rep. 2017, 7, 17498. [CrossRef]
162. Zeindl-Eberhart, E.; Brandl, L.; Liebmann, S.; Ormanns, S.; Scheel, S.K.; Brabletz, T.; Kirchner, T.; Jung, A.
Epithelial-mesenchymal transition induces endoplasmic-reticulum-stress response in human colorectal
tumor cells. PLoS ONE 2014, 9, e87386. [CrossRef]

Cancers 2019, 11, 631 23 of 25
163. Cuevas, E.P.; Eraso, P.; Mazon, M.J.; Santos, V.; Moreno-Bueno, G.; Cano, A.; Portillo, F. LOXL2 drives
epithelial-mesenchymal transition via activation of IRE1-XBP1 signalling pathway. Sci. Rep. 2017, 7, 44988.
[CrossRef] [PubMed]
164. Shah, P.P.; Dupre, T.V.; Siskind, L.J.; Beverly, L.J. Common cytotoxic chemotherapeutics induce
epithelial-mesenchymal transition (EMT) downstream of ER stress. Oncotarget 2017, 8, 22625–22639.
[CrossRef]
165. Dekervel, J.; Bulle, A.; Windmolders, P.; Lambrechts, D.; Van Cutsem, E.; Verslype, C.; van Pelt, J. Acriflavine
inhibits acquired drug resistance by blocking the epithelial-to-mesenchymal transition and the unfolded
protein response. Translat. Oncol. 2017, 10, 59–69. [CrossRef]
166. Mo, X.T.; Zhou, W.C.; Cui, W.H.; Li, D.L.; Li, L.C.; Xu, L.; Zhao, P.; Gao, J. Inositol-requiring protein
1—X-box-binding protein 1 pathway promotes epithelial-mesenchymal transition via mediating snail
expression in pulmonary fibrosis. Int. J. Biochem. Cell Biol. 2015, 65, 230–238. [CrossRef]
167. Urra, H.; Henriquez, D.R.; Canovas, J.; Villarroel-Campos, D.; Carreras-Sureda, A.; Pulgar, E.; Molina, E.;
Hazari, Y.M.; Limia, C.M.; Alvarez-Rojas, S.; et al. IRE1alpha governs cytoskeleton remodelling and cell
migration through a direct interaction with filamin A. Nat. Cell Rev. 2018, 20, 942–953.
168. Li, L.; Lu, Y.; Stemmer, P.M.; Chen, F. Filamin A phosphorylation by Akt promotes cell migration in response
to arsenic. Oncotarget 2015, 6, 12009–12019. [CrossRef]
169. Lhomond, S.; Avril, T.; Dejeans, N.; Voutetakis, K.; Doultsinos, D.; McMahon, M.; Pineau, R.; Obacz, J.;
Papadodima, O.; Jouan, F.; et al. Dual IRE1 RNase functions dictate glioblastoma development. EMBO Mol.
Med. 2018, 10, e7929. [CrossRef]
170. Chen, X.; Iliopoulos, D.; Zhang, Q.; Tang, Q.; Greenblatt, M.B.; Hatziapostolou, M.; Lim, E.; Tam, W.L.; Ni, M.;
Chen, Y.; et al. XBP1 promotes triple-negative breast cancer by controlling the HIF1alpha pathway. Nature
2014, 508, 103–107. [CrossRef] [PubMed]
171. Liu, Z.J.; Semenza, G.L.; Zhang, H.F. Hypoxia-inducible factor 1 and breast cancer metastasis. J. Zhejiang
Univ. Sci. B 2015, 16, 32–43. [CrossRef] [PubMed]
172. Honma, Y.; Kanazawa, K.; Mori, T.; Tanno, Y.; Tojo, M.; Kiyosawa, H.; Takeda, J.; Nikaido, T.; Tsukamoto, T.;
Yokoya, S.; et al. Identification of a novel gene, OASIS, which encodes for a putative CREB/ATF family
transcription factor in the long-term cultured astrocytes and gliotic tissue. Brain Res. Mol. Brain Res. 1999, 69,
93–103. [CrossRef]
173. Murakami, T.; Kondo, S.; Ogata, M.; Kanemoto, S.; Saito, A.; Wanaka, A.; Imaizumi, K. Cleavage of the
membrane-bound transcription factor OASIS in response to endoplasmic reticulum stress. J. Neurochem.
2006, 96, 1090–1100. [CrossRef] [PubMed]
174. Dhingra, P.; Martinez-Fundichely, A.; Berger, A.; Huang, F.W.; Forbes, A.N.; Liu, E.M.; Sboner, A.; Tamayo, P.;
Rickman, D.S.; Rubin, M.A.; et al. Identification of novel prostate cancer drivers using RegNetDriver: A
framework for integration of genetic and epigenetic alterations with tissue-specific regulatory network.
Genome Biol. 2017, 18, 141. [CrossRef]
175. Rose, M.; Schubert, C.; Dierichs, L.; Gaisa, N.T.; Heer, M.; Heidenreich, A.; Knuchel, R.; Dahl, E.
OASIS/CREB3L1 is epigenetically silenced in human bladder cancer facilitating tumor cell spreading
and migration in vitro. Epigenetics 2014, 9, 1626–1640. [CrossRef] [PubMed]
176. Vellanki, R.N.; Zhang, L.; Volchuk, A. OASIS/CREB3L1 is induced by endoplasmic reticulum stress in human
glioma cell lines and contributes to the unfolded protein response, extracellular matrix production and cell
migration. PloS ONE 2013, 8, e54060. [CrossRef] [PubMed]
177. Ward, A.K.; Mellor, P.; Smith, S.E.; Kendall, S.; Just, N.A.; Vizeacoumar, F.S.; Sarker, S.; Phillips, Z.; Alvi, R.;
Saxena, A.; et al. Epigenetic silencing of CREB3L1 by DNA methylation is associated with high-grade
metastatic breast cancers with poor prognosis and is prevalent in triple negative breast cancers. Breast Cancer
Res. 2016, 18, 12. [CrossRef] [PubMed]
178. Nagelkerke, A.; Bussink, J.; Mujcic, H.; Wouters, B.G.; Lehmann, S.; Sweep, F.C.; Span, P.N. Hypoxia
stimulates migration of breast cancer cells via the PERK/ATF4/LAMP3-arm of the unfolded protein response.
Breast Cancer Res. 2013, 15, R2. [CrossRef]
179. Mujcic, H.; Nagelkerke, A.; Rouschop, K.M.; Chung, S.; Chaudary, N.; Span, P.N.; Clarke, B.; Milosevic, M.;
Sykes, J.; Hill, R.P.; et al. Hypoxic activation of the PERK/eIF2alpha arm of the unfolded protein response
promotes metastasis through induction of LAMP3. Clin. Cancer Res. 2013, 19, 6126–6137. [CrossRef]
[PubMed]

Cancers 2019, 11, 631 24 of 25
180. Nagelkerke, A.; Mujcic, H.; Bussink, J.; Wouters, B.G.; van Laarhoven, H.W.; Sweep, F.C.; Span, P.N.
Hypoxic regulation and prognostic value of LAMP3 expression in breast cancer. Cancer 2011, 117, 3670–3681.
[CrossRef] [PubMed]
181. Kanao, H.; Enomoto, T.; Kimura, T.; Fujita, M.; Nakashima, R.; Ueda, Y.; Miyatake, T.; Yoshizaki, T.;
Buzard, G.S.; Tanigami, A.; et al. Overexpression of LAMP3/TSC403/DC-LAMP promotes metastasis in
uterine cervical cancer. Cancer Res. 2005, 65, 8640–8645. [CrossRef]
182. Nagelkerke, A.; Sweep, F.C.; Stegeman, H.; Grenman, R.; Kaanders, J.H.; Bussink, J.; Span, P.N. Hypoxic
regulation of the PERK/ATF4/LAMP3-arm of the unfolded protein response in head and neck squamous cell
carcinoma. Head Neck 2015, 37, 896–905. [CrossRef]
183. Garrigues, J.; Anderson, J.; Hellstrom, K.E.; Hellstrom, I. Anti-tumor antibody BR96 blocks cell migration
and binds to a lysosomal membrane glycoprotein on cell surface microspikes and ruffled membranes. J. Cell
Biol. 1994, 125, 129–142. [CrossRef] [PubMed]
184. Santos, B.L.; Oliveira, M.N.; Coelho, P.L.; Pitanga, B.P.; da Silva, A.B.; Adelita, T.; Silva, V.D.; Costa Mde, F.;
El-Bacha, R.S.; Tardy, M.; et al. Flavonoids suppress human glioblastoma cell growth by inhibiting cell
metabolism, migration, and by regulating extracellular matrix proteins and metalloproteinases expression.
Chem. Biol. Interact. 2015, 242, 123–138. [CrossRef]
185. Bauer, D.; Redmon, N.; Mazzio, E.; Soliman, K.F. Apigenin inhibits TNFalpha/IL-1alpha-induced CCL2
release through IKBK-epsilon signaling in MDA-MB-231 human breast cancer cells. PLoS ONE 2017, 12,
e0175558. [CrossRef] [PubMed]
186. Lin, C.H.; Chang, C.Y.; Lee, K.R.; Lin, H.J.; Chen, T.H.; Wan, L. Flavones inhibit breast cancer proliferation
through the Akt/FOXO3a signaling pathway. BMC Cancer 2015, 15, 958. [CrossRef] [PubMed]
187. Qin, Y.; Zhao, D.; Zhou, H.G.; Wang, X.H.; Zhong, W.L.; Chen, S.; Gu, W.G.; Wang, W.; Zhang, C.H.; Liu, Y.R.;
et al. Apigenin inhibits NF-kappaB and snail signaling, EMT and metastasis in human hepatocellular
carcinoma. Oncotarget 2016, 7, 41421–41431. [CrossRef] [PubMed]
188. Cao, H.H.; Chu, J.H.; Kwan, H.Y.; Su, T.; Yu, H.; Cheng, C.Y.; Fu, X.Q.; Guo, H.; Li, T.; Tse, A.K.; et al. Inhibition
of the STAT3 signaling pathway contributes to apigenin-mediated anti-metastatic effect in melanoma. Sci.
Rep. 2016, 6, 21731. [CrossRef]
189. Chung, H.; Choi, H.S.; Seo, E.K.; Kang, D.H.; Oh, E.S. Baicalin and baicalein inhibit transforming growth
factor-beta1-mediated epithelial-mesenchymal transition in human breast epithelial cells. Biochem. Biophys.
Res. Commun. 2015, 458, 707–713. [CrossRef]
190. Wang, L.; Ling, Y.; Chen, Y.; Li, C.L.; Feng, F.; You, Q.D.; Lu, N.; Guo, Q.L. Flavonoid baicalein suppresses
adhesion, migration and invasion of MDA-MB-231 human breast cancer cells. Cancer Lett. 2010, 297, 42–48.
[CrossRef]
191. Lin, C.W.; Chen, P.N.; Chen, M.K.; Yang, W.E.; Tang, C.H.; Yang, S.F.; Hsieh, Y.S. Kaempferol reduces matrix
metalloproteinase-2 expression by down-regulating ERK1/2 and the activator protein-1 signaling pathways
in oral cancer cells. PLoS ONE 2013, 8, e80883. [CrossRef] [PubMed]
192. Chen, K.; Zhang, S.; Ji, Y.; Li, J.; An, P.; Ren, H.; Liang, R.; Yang, J.; Li, Z. Baicalein inhibits the invasion and
metastatic capabilities of hepatocellular carcinoma cells via down-regulation of the ERK pathway. PLoS ONE
2013, 8, e72927. [CrossRef] [PubMed]
193. Wu, B.; Li, J.; Huang, D.; Wang, W.; Chen, Y.; Liao, Y.; Tang, X.; Xie, H.; Tang, F. Baicalein mediates inhibition
of migration and invasiveness of skin carcinoma through Ezrin in A431 cells. BMC Cancer 2011, 11, 527.
[CrossRef]
194. Jo, E.; Park, S.J.; Choi, Y.S.; Jeon, W.K.; Kim, B.C. Kaempferol suppresses transforming growth
factor-beta1-induced epithelial-to-mesenchymal transition and migration of A549 lung cancer cells by
inhibiting Akt1-mediated phosphorylation of Smad3 at Threonine-179. Neoplasia 2015, 17, 525–537. [CrossRef]
[PubMed]
195. Lee, J.; Kim, J.H. Kaempferol inhibits pancreatic cancer cell growth and migration through the blockade of
EGFR-related pathway in vitro. PLoS ONE 2016, 11, e0155264. [CrossRef]
196. Xu, C.S.; Wang, Z.F.; Huang, X.D.; Dai, L.M.; Cao, C.J.; Li, Z.Q. Involvement of ROS-alpha v beta 3
integrin-FAK/Pyk2 in the inhibitory effect of melatonin on U251 glioma cell migration and invasion under
hypoxia. J. Transl. Med. 2015, 13, 95. [CrossRef] [PubMed]

Cancers 2019, 11, 631 25 of 25
197. Borin, T.F.; Arbab, A.S.; Gelaleti, G.B.; Ferreira, L.C.; Moschetta, M.G.; Jardim-Perassi, B.V.; Iskander, A.S.;
Varma, N.R.; Shankar, A.; Coimbra, V.B.; et al. Melatonin decreases breast cancer metastasis by modulating
Rho-associated kinase protein-1 expression. J. Pineal. Res. 2016, 60, 3–15. [CrossRef] [PubMed]
198. Zhang, N.; Ying, M.D.; Wu, Y.P.; Zhou, Z.H.; Ye, Z.M.; Li, H.; Lin, D.S. Hyperoside, a flavonoid compound,
inhibits proliferation and stimulates osteogenic differentiation of human osteosarcoma cells. PLoS ONE 2014,
9, e98973. [CrossRef]
199. Lin, C.W.; Hou, W.C.; Shen, S.C.; Juan, S.H.; Ko, C.H.; Wang, L.M.; Chen, Y.C. Quercetin inhibition of tumor
invasion via suppressing PKC delta/ERK/AP-1-dependent matrix metalloproteinase-9 activation in breast
carcinoma cells. Carcinogenesis 2008, 29, 1807–1815. [CrossRef]
200. Zhao, J.; Fang, Z.; Zha, Z.; Sun, Q.; Wang, H.; Sun, M.; Qiao, B. Quercetin inhibits cell viability, migration and
invasion by regulating miR-16/HOXA10 axis in oral cancer. Eur. J. Pharmacol. 2019, 847, 11–18. [CrossRef]
201. Cao, H.H.; Cheng, C.Y.; Su, T.; Fu, X.Q.; Guo, H.; Li, T.; Tse, A.K.; Kwan, H.Y.; Yu, H.; Yu, Z.L. Quercetin
inhibits HGF/c-Met signaling and HGF-stimulated melanoma cell migration and invasion. Mol. Cancer 2015,
14, 103. [CrossRef] [PubMed]
202. Rojas-Rivera, D.; Delvaeye, T.; Roelandt, R.; Nerinckx, W.; Augustyns, K.; Vandenabeele, P.; Bertrand, M.J.M.
When PERK inhibitors turn out to be new potent RIPK1 inhibitors: Critical issues on the specificity and use
of GSK2606414 and GSK2656157. Cell Death Differ. 2017, 24, 1100–1110. [CrossRef]
203. Mahameed, M.; Wilhelm, T.; Darawshi, O.; Obiedat, A.; Tommy, W.S.; Chintha, C.; Schubert, T.; Samali, A.;
Chevet, E.; Eriksson, L.A.; et al. The unfolded protein response modulators GSK2606414 and KIRA6 are
potent KIT inhibitors. Cell Death Dis. 2019, 10, 300. [CrossRef]
204. Xu, W.; Wan, Q.; Na, S.; Yokota, H.; Yan, J.L.; Hamamura, K. Suppressed invasive and migratory behaviors of
SW1353 chondrosarcoma cells through the regulation of Src, Rac1 GTPase, and MMP13. Cell. Signal. 2015,
27, 2332–2342. [CrossRef]
205. Hamamura, K.; Minami, K.; Tanjung, N.; Wan, Q.; Koizumi, M.; Matsuura, N.; Na, S.; Yokota, H. Attenuation
of malignant phenotypes of breast cancer cells through eIF2alpha-mediated downregulation of Rac1 signaling.
Int. J. Oncol. 2014, 44, 1980–1988. [CrossRef] [PubMed]
© 2019 by the authors. Licensee MDPI, Basel, Switzerland. This article is an open access
article distributed under the terms and conditions of the Creative Commons Attribution
(CC BY) license (http://creativecommons.org/licenses/by/4.0/).

123
14. CONGRESSES AND FUNDING
Congresses
• Annual meeting Cell Biology Society of Chile. 22-26 October, 2018. Puerto Varas.
Chile. (author). Novel function of the ER stress transducer IRE1α in cell
invasion and metastasis.
• Endoplasmic Reticulum_2019 From basic cell biology to translational
approaches: a path to the clinic. Paris, 9-11 October 2019. (author). Novel
function of the ER stress transducer IRE1α in cell migration and invasion
of melanoma cells.
Funding
This work was funded by CONICYT fellowship 21160967 (C.M.L), ARED
international fellowship from the Region Bretagne (C.M.L), Fondo Nacional de
Desarrollo Cientıfico y Tecnológico (FONDECYT) 11180825 (H.U.), FONDECYT
1180186 (C.H.), FONDECYT 3200716 (P.P.) ANID/FONDAP/15150012 (C.H.),
ECOS Comisión Nacional de Investigación Científica y Tecnológica (CONICYT)
Cooperation grant Chile-France ECOS170032 (H.U., C.H.), Millennium Institute
P09-015-F (C.H.) and European Commission R&D MSCA-RISE 734749 (C.H.,
E.C).

124
15. REFERENCES.
1. Sanchez-Tapia C, Wan FY. Fastest time to cancer by loss of tumor suppressor genes. Bull Math Biol. 2014;76(11):2737-84.
2. Global Burden of Disease Cancer C, Fitzmaurice C, Dicker D, Pain A, Hamavid H, Moradi-Lakeh M, et al. The Global Burden of Cancer 2013. JAMA Oncol. 2015;1(4):505-27.
3. Health Mo. National Cancer Strategy. Chile 2016 2016 [
4. Goss PE, Lee BL, Badovinac-Crnjevic T, Strasser-Weippl K, Chavarri-Guerra Y, St Louis J, et al. Planning cancer control in Latin America and the Caribbean. Lancet Oncol. 2013;14(5):391-436.
5. Ministerio de Salud GdC. Plan Nacional de Cáncer 2018-2020 2018 [Available from: https://www.minsal.cl/wp-content/uploads/2019/01/2019.01.23_PLAN-NACIONAL-DE-CANCER_web.pdf.
6. Global Cancer Observatory [Internet]. 2020. Available from: https://gco.iarc.fr/today/data/factsheets/populations/250-france-fact-sheets.pdf.
7. Sung H, Ferlay J, Siegel RL, Laversanne M, Soerjomataram I, Jemal A, et al. Global cancer statistics 2020: GLOBOCAN estimates of incidence and mortality worldwide for 36 cancers in 185 countries. CA Cancer J Clin. 2021.
8. Liu Q, Zhang H, Jiang X, Qian C, Liu Z, Luo D. Factors involved in cancer metastasis: a better understanding to "seed and soil" hypothesis. Molecular cancer. 2017;16(1):176.
9. Zemelman VB, Valenzuela CY, Sazunic I, Araya I. Malignant melanoma in Chile: different site distribution between private and state patients. Biol Res. 2014;47:34.
10. Society AC. Cancer Fact and Figures 2016 2016 [
11. Bedrosian I, Faries MB, Guerry Dt, Elenitsas R, Schuchter L, Mick R, et al. Incidence of sentinel node metastasis in patients with thin primary melanoma (< or = 1 mm) with vertical growth phase. Ann Surg Oncol. 2000;7(4):262-7.
12. Hanahan D, Weinberg RA. Hallmarks of cancer: the next generation. Cell. 2011;144(5):646-74.
13. Friedl P, Alexander S. Cancer invasion and the microenvironment: plasticity and reciprocity. Cell. 2011;147(5):992-1009.
14. Witsch E, Sela M, Yarden Y. Roles for growth factors in cancer progression. Physiology (Bethesda). 2010;25(2):85-101.
15. Cheng N, Chytil A, Shyr Y, Joly A, Moses HL. Transforming growth factor-beta signaling-deficient fibroblasts enhance hepatocyte growth factor signaling in

125
mammary carcinoma cells to promote scattering and invasion. Molecular cancer research : MCR. 2008;6(10):1521-33.
16. Burkhart DL, Sage J. Cellular mechanisms of tumour suppression by the retinoblastoma gene. Nature reviews Cancer. 2008;8(9):671-82.
17. Sherr CJ, McCormick F. The RB and p53 pathways in cancer. Cancer cell. 2002;2(2):103-12.
18. Junttila MR, Evan GI. p53--a Jack of all trades but master of none. Nature reviews Cancer. 2009;9(11):821-9.
19. Hanahan D, Folkman J. Patterns and emerging mechanisms of the angiogenic switch during tumorigenesis. Cell. 1996;86(3):353-64.
20. Carmeliet P. VEGF as a key mediator of angiogenesis in cancer. Oncology. 2005;69 Suppl 3:4-10.
21. Kazerounian S, Yee KO, Lawler J. Thrombospondins in cancer. Cellular and molecular life sciences : CMLS. 2008;65(5):700-12.
22. Senft D, Ronai ZE. Adaptive Stress Responses During Tumor Metastasis and Dormancy. Trends in cancer. 2016;2(8):429-42.
23. Talmadge JE, Fidler IJ. AACR centennial series: the biology of cancer metastasis: historical perspective. Cancer Res. 2010;70(14):5649-69.
24. Chaffer CL, Weinberg RA. A perspective on cancer cell metastasis. Science. 2011;331(6024):1559-64.
25. Steeg PS. Targeting metastasis. Nat Rev Cancer. 2016;16(4):201-18.
26. Kopfstein L, Christofori G. Metastasis: cell-autonomous mechanisms versus contributions by the tumor microenvironment. Cellular and molecular life sciences : CMLS. 2006;63(4):449-68.
27. Aladowicz E, Ferro L, Vitali GC, Venditti E, Fornasari L, Lanfrancone L. Molecular networks in melanoma invasion and metastasis. Future oncology. 2013;9(5):713-26.
28. Clark WH, Jr., Elder DE, Guerry Dt, Braitman LE, Trock BJ, Schultz D, et al. Model predicting survival in stage I melanoma based on tumor progression. Journal of the National Cancer Institute. 1989;81(24):1893-904.
29. Damsky WE, Theodosakis N, Bosenberg M. Melanoma metastasis: new concepts and evolving paradigms. Oncogene. 2014;33(19):2413-22.
30. Fife CM, McCarroll JA, Kavallaris M. Movers and shakers: cell cytoskeleton in cancer metastasis. British journal of pharmacology. 2014;171(24):5507-23.
126
31. Jiang WG, Sanders AJ, Katoh M, Ungefroren H, Gieseler F, Prince M, et al. Tissue invasion and metastasis: Molecular, biological and clinical perspectives. Seminars in cancer biology. 2015;35 Suppl:S244-75.
32. Mehlen P, Puisieux A. Metastasis: a question of life or death. Nature reviews Cancer. 2006;6(6):449-58.
33. Webb DJ, Horwitz AF. New dimensions in cell migration. Nature cell biology. 2003;5(8):690-2.
34. Trepat X, Chen Z, Jacobson K. Cell migration. Compr Physiol. 2012;2(4):2369-92.
35. Ridley AJ, Schwartz MA, Burridge K, Firtel RA, Ginsberg MH, Borisy G, et al. Cell migration: integrating signals from front to back. Science. 2003;302(5651):1704-9.
36. De Craene B, Berx G. Regulatory networks defining EMT during cancer initiation and progression. Nature reviews Cancer. 2013;13(2):97-110.
37. Hui L, Chen Y. Tumor microenvironment: Sanctuary of the devil. Cancer letters. 2015;368(1):7-13.
38. Friedl P, Wolf K. Tumour-cell invasion and migration: diversity and escape mechanisms. Nature reviews Cancer. 2003;3(5):362-74.
39. Friedl P, Wolf K. Proteolytic interstitial cell migration: a five-step process. Cancer Metastasis Rev. 2009;28(1-2):129-35.
40. Carlson B, Soderling SH. Mechanisms of cellular protrusions branch out. Dev Cell. 2009;17(3):307-9.
41. Nobes CD, Hall A. Rho, rac, and cdc42 GTPases regulate the assembly of multimolecular focal complexes associated with actin stress fibers, lamellipodia, and filopodia. Cell. 1995;81(1):53-62.
42. Skoble J, Portnoy DA, Welch MD. Three regions within ActA promote Arp2/3 complex-mediated actin nucleation and Listeria monocytogenes motility. The Journal of cell biology. 2000;150(3):527-38.
43. Sieg DJ, Hauck CR, Schlaepfer DD. Required role of focal adhesion kinase (FAK) for integrin-stimulated cell migration. Journal of cell science. 1999;112 ( Pt 16):2677-91.
44. Cary LA, Klinghoffer RA, Sachsenmaier C, Cooper JA. SRC catalytic but not scaffolding function is needed for integrin-regulated tyrosine phosphorylation, cell migration, and cell spreading. Molecular and cellular biology. 2002;22(8):2427-40.
45. Zaidel-Bar R, Milo R, Kam Z, Geiger B. A paxillin tyrosine phosphorylation switch regulates the assembly and form of cell-matrix adhesions. Journal of cell science. 2007;120(Pt 1):137-48.

127
46. Bauvois B. New facets of matrix metalloproteinases MMP-2 and MMP-9 as cell surface transducers: outside-in signaling and relationship to tumor progression. Biochimica et biophysica acta. 2012;1825(1):29-36.
47. Ferrari R, Martin G, Tagit O, Guichard A, Cambi A, Voituriez R, et al. MT1-MMP directs force-producing proteolytic contacts that drive tumor cell invasion. Nature communications. 2019;10(1):4886.
48. Murphy DA, Courtneidge SA. The 'ins' and 'outs' of podosomes and invadopodia: characteristics, formation and function. Nature reviews Molecular cell biology. 2011;12(7):413-26.
49. Katoh K, Kano Y, Amano M, Onishi H, Kaibuchi K, Fujiwara K. Rho-kinase--mediated contraction of isolated stress fibers. The Journal of cell biology. 2001;153(3):569-84.
50. Totsukawa G, Yamakita Y, Yamashiro S, Hartshorne DJ, Sasaki Y, Matsumura F. Distinct roles of ROCK (Rho-kinase) and MLCK in spatial regulation of MLC phosphorylation for assembly of stress fibers and focal adhesions in 3T3 fibroblasts. The Journal of cell biology. 2000;150(4):797-806.
51. Potter DA, Tirnauer JS, Janssen R, Croall DE, Hughes CN, Fiacco KA, et al. Calpain regulates actin remodeling during cell spreading. The Journal of cell biology. 1998;141(3):647-62.
52. Higuchi M, Kihara R, Okazaki T, Aoki I, Suetsugu S, Gotoh Y. Akt1 promotes focal adhesion disassembly and cell motility through phosphorylation of FAK in growth factor-stimulated cells. Journal of cell science. 2013;126(Pt 3):745-55.
53. Nagano M, Hoshino D, Koshikawa N, Akizawa T, Seiki M. Turnover of focal adhesions and cancer cell migration. International journal of cell biology. 2012;2012:310616.
54. Dejeans N, Manie S, Hetz C, Bard F, Hupp T, Agostinis P, et al. Addicted to secrete - novel concepts and targets in cancer therapy. Trends in molecular medicine. 2014;20(5):242-50.
55. Hetz C, Chevet E, Oakes SA. Proteostasis control by the unfolded protein response. Nat Cell Biol. 2015;17(7):829-38.
56. Wang M, Kaufman RJ. Protein misfolding in the endoplasmic reticulum as a conduit to human disease. Nature. 2016;529(7586):326-35.
57. Ron D, Walter P. Signal integration in the endoplasmic reticulum unfolded protein response. Nature reviews Molecular cell biology. 2007;8(7):519-29.
58. Urra H, Dufey E, Lisbona F, Rojas-Rivera D, Hetz C. When ER stress reaches a dead end. Biochimica et biophysica acta. 2013;1833(12):3507-17.
59. Chevet E, Hetz C, Samali A. Endoplasmic reticulum stress-activated cell reprogramming in oncogenesis. Cancer discovery. 2015;5(6):586-97.

128
60. Urra H, Dufey E, Avril T, Chevet E, Hetz C. Endoplasmic Reticulum Stress and the Hallmarks of Cancer. Trends Cancer. 2016;2(5):252-62.
61. Wang M, Kaufman RJ. The impact of the endoplasmic reticulum protein-folding environment on cancer development. Nature reviews Cancer. 2014;14(9):581-97.
62. Wang M, Kaufman RJ. The impact of the endoplasmic reticulum protein-folding environment on cancer development. Nat Rev Cancer. 2014;14(9):581-97.
63. Schroder M, Kaufman RJ. The mammalian unfolded protein response. Annu Rev Biochem. 2005;74:739-89.
64. Almanza A, Carlesso A, Chintha C, Creedican S, Doultsinos D, Leuzzi B, et al. Endoplasmic reticulum stress signalling - from basic mechanisms to clinical applications. The FEBS journal. 2018.
65. Hetz C, Papa FR. The Unfolded Protein Response and Cell Fate Control. Mol Cell. 2018;69(2):169-81.
66. Walter P, Ron D. The unfolded protein response: from stress pathway to homeostatic regulation. Science. 2011;334(6059):1081-6.
67. Lu PD, Harding HP, Ron D. Translation reinitiation at alternative open reading frames regulates gene expression in an integrated stress response. The Journal of cell biology. 2004;167(1):27-33.
68. Vattem KM, Wek RC. Reinitiation involving upstream ORFs regulates ATF4 mRNA translation in mammalian cells. Proc Natl Acad Sci U S A. 2004;101(31):11269-74.
69. Harding HP, Zhang Y, Zeng H, Novoa I, Lu PD, Calfon M, et al. An integrated stress response regulates amino acid metabolism and resistance to oxidative stress. Mol Cell. 2003;11(3):619-33.
70. Ye J, Koumenis C. ATF4, an ER stress and hypoxia-inducible transcription factor and its potential role in hypoxia tolerance and tumorigenesis. Curr Mol Med. 2009;9(4):411-6.
71. Pihan P, Carreras-Sureda A, Hetz C. BCL-2 family: integrating stress responses at the ER to control cell demise. Cell death and differentiation. 2017;24(9):1478-87.
72. Tsaytler P, Harding HP, Ron D, Bertolotti A. Selective inhibition of a regulatory subunit of protein phosphatase 1 restores proteostasis. Science. 2011;332(6025):91-4.
73. Haze K, Yoshida H, Yanagi H, Yura T, Mori K. Mammalian transcription factor ATF6 is synthesized as a transmembrane protein and activated by proteolysis in response to endoplasmic reticulum stress. Mol Biol Cell. 1999;10(11):3787-99.

129
74. Haze K, Okada T, Yoshida H, Yanagi H, Yura T, Negishi M, et al. Identification of the G13 (cAMP-response-element-binding protein-related protein) gene product related to activating transcription factor 6 as a transcriptional activator of the mammalian unfolded protein response. The Biochemical journal. 2001;355(Pt 1):19-28.
75. Shen J, Chen X, Hendershot L, Prywes R. ER stress regulation of ATF6 localization by dissociation of BiP/GRP78 binding and unmasking of Golgi localization signals. Dev Cell. 2002;3(1):99-111.
76. Ye J, Rawson RB, Komuro R, Chen X, Dave UP, Prywes R, et al. ER stress induces cleavage of membrane-bound ATF6 by the same proteases that process SREBPs. Molecular cell. 2000;6(6):1355-64.
77. Yamamoto K, Sato T, Matsui T, Sato M, Okada T, Yoshida H, et al. Transcriptional induction of mammalian ER quality control proteins is mediated by single or combined action of ATF6alpha and XBP1. Dev Cell. 2007;13(3):365-76.
78. Yoshida H, Matsui T, Yamamoto A, Okada T, Mori K. XBP1 mRNA is induced by ATF6 and spliced by IRE1 in response to ER stress to produce a highly active transcription factor. Cell. 2001;107(7):881-91.
79. Cox JS, Shamu CE, Walter P. Transcriptional induction of genes encoding endoplasmic reticulum resident proteins requires a transmembrane protein kinase. Cell. 1993;73(6):1197-206.
80. Cox JS, Walter P. A novel mechanism for regulating activity of a transcription factor that controls the unfolded protein response. Cell. 1996;87(3):391-404.
81. Zhou J, Liu CY, Back SH, Clark RL, Peisach D, Xu Z, et al. The crystal structure of human IRE1 luminal domain reveals a conserved dimerization interface required for activation of the unfolded protein response. Proc Natl Acad Sci U S A. 2006;103(39):14343-8.
82. Calfon M, Zeng H, Urano F, Till JH, Hubbard SR, Harding HP, et al. IRE1 couples endoplasmic reticulum load to secretory capacity by processing the XBP-1 mRNA. Nature. 2002;415(6867):92-6.
83. Hollien J, Weissman JS. Decay of endoplasmic reticulum-localized mRNAs during the unfolded protein response. Science. 2006;313(5783):104-7.
84. Hollien J, Lin JH, Li H, Stevens N, Walter P, Weissman JS. Regulated Ire1-dependent decay of messenger RNAs in mammalian cells. J Cell Biol. 2009;186(3):323-31.
85. Urano F, Wang X, Bertolotti A, Zhang Y, Chung P, Harding HP, et al. Coupling of stress in the ER to activation of JNK protein kinases by transmembrane protein kinase IRE1. Science. 2000;287(5453):664-6.
86. Tam AB, Mercado EL, Hoffmann A, Niwa M. ER stress activates NF-kappaB by integrating functions of basal IKK activity, IRE1 and PERK. PloS one. 2012;7(10):e45078.

130
87. Woehlbier U, Hetz C. Modulating stress responses by the UPRosome: a matter of life and death. Trends in biochemical sciences. 2011;36(6):329-37.
88. Nguyen DT, Kebache S, Fazel A, Wong HN, Jenna S, Emadali A, et al. Nck-dependent activation of extracellular signal-regulated kinase-1 and regulation of cell survival during endoplasmic reticulum stress. Mol Biol Cell. 2004;15(9):4248-60.
89. Brozzi F, Gerlo S, Grieco FA, Nardelli TR, Lievens S, Gysemans C, et al. A combined "omics" approach identifies N-Myc interactor as a novel cytokine-induced regulator of IRE1 protein and c-Jun N-terminal kinase in pancreatic beta cells. J Biol Chem. 2014;289(30):20677-93.
90. Castillo K, Rojas-Rivera D, Lisbona F, Caballero B, Nassif M, Court FA, et al. BAX inhibitor-1 regulates autophagy by controlling the IRE1alpha branch of the unfolded protein response. The EMBO journal. 2017;36(11):1640.
91. Morita S, Villalta SA, Feldman HC, Register AC, Rosenthal W, Hoffmann-Petersen IT, et al. Targeting ABL-IRE1alpha Signaling Spares ER-Stressed Pancreatic beta Cells to Reverse Autoimmune Diabetes. Cell Metab. 2017;25(4):883-97 e8.
92. Carreras-Sureda A, Jana F, Urra H, Durand S, Mortenson DE, Sagredo A, et al. Non-canonical function of IRE1alpha determines mitochondria-associated endoplasmic reticulum composition to control calcium transfer and bioenergetics. Nat Cell Biol. 2019;21(6):755-67.
93. Urra H, Henriquez DR, Canovas J, Villarroel-Campos D, Carreras-Sureda A, Pulgar E, et al. IRE1alpha governs cytoskeleton remodelling and cell migration through a direct interaction with filamin A. Nat Cell Biol. 2018;20(8):942-53.
94. Greenman C, Stephens P, Smith R, Dalgliesh GL, Hunter C, Bignell G, et al. Patterns of somatic mutation in human cancer genomes. Nature. 2007;446(7132):153-8.
95. Oakes SA. Endoplasmic Reticulum Proteostasis: A Key Checkpoint in Cancer. American journal of physiology Cell physiology. 2016:ajpcell.00266.2016.
96. Romero-Ramirez L, Cao H, Nelson D, Hammond E, Lee AH, Yoshida H, et al. XBP1 is essential for survival under hypoxic conditions and is required for tumor growth. Cancer research. 2004;64(17):5943-7.
97. Bujisic B, De Gassart A, Tallant R, Demaria O, Zaffalon L, Chelbi S, et al. Impairment of both IRE1 expression and XBP1 activation is a hallmark of GCB DLBCL and contributes to tumor growth. Blood. 2017;129(17):2420-8.
98. Pluquet O, Dejeans N, Bouchecareilh M, Lhomond S, Pineau R, Higa A, et al. Posttranscriptional regulation of PER1 underlies the oncogenic function of IREalpha. Cancer Res. 2013;73(15):4732-43.
99. Chen X, Iliopoulos D, Zhang Q, Tang Q, Greenblatt MB, Hatziapostolou M, et al. XBP1 promotes triple-negative breast cancer by controlling the HIF1alpha pathway. Nature. 2014;508(7494):103-7.

131
100. Carrasco DR, Sukhdeo K, Protopopova M, Sinha R, Enos M, Carrasco DE, et al. The differentiation and stress response factor XBP-1 drives multiple myeloma pathogenesis. Cancer cell. 2007;11(4):349-60.
101. Kharabi Masouleh B, Geng H, Hurtz C, Chan LN, Logan AC, Chang MS, et al. Mechanistic rationale for targeting the unfolded protein response in pre-B acute lymphoblastic leukemia. Proc Natl Acad Sci U S A. 2014;111(21):E2219-28.
102. Auf G, Jabouille A, Guerit S, Pineau R, Delugin M, Bouchecareilh M, et al. Inositol-requiring enzyme 1alpha is a key regulator of angiogenesis and invasion in malignant glioma. Proc Natl Acad Sci U S A. 2010;107(35):15553-8.
103. Dejeans N, Glorieux C, Guenin S, Beck R, Sid B, Rousseau R, et al. Overexpression of GRP94 in breast cancer cells resistant to oxidative stress promotes high levels of cancer cell proliferation and migration: implications for tumor recurrence. Free radical biology & medicine. 2012;52(6):993-1002.
104. Cubillos-Ruiz JR, Silberman PC, Rutkowski MR, Chopra S, Perales-Puchalt A, Song M, et al. ER Stress Sensor XBP1 Controls Anti-tumor Immunity by Disrupting Dendritic Cell Homeostasis. Cell. 2015;161(7):1527-38.
105. Urra H, Hetz C. A novel ER stress-independent function of the UPR in angiogenesis. Mol Cell. 2014;54(4):542-4.
106. Maly DJ, Papa FR. Druggable sensors of the unfolded protein response. Nat Chem Biol. 2014;10(11):892-901.
107. Mimura N, Fulciniti M, Gorgun G, Tai YT, Cirstea D, Santo L, et al. Blockade of XBP1 splicing by inhibition of IRE1alpha is a promising therapeutic option in multiple myeloma. Blood. 2012;119(24):5772-81.
108. Papandreou I, Denko NC, Olson M, Van Melckebeke H, Lust S, Tam A, et al. Identification of an Ire1alpha endonuclease specific inhibitor with cytotoxic activity against human multiple myeloma. Blood. 2011;117(4):1311-4.
109. Ri M, Tashiro E, Oikawa D, Shinjo S, Tokuda M, Yokouchi Y, et al. Identification of Toyocamycin, an agent cytotoxic for multiple myeloma cells, as a potent inhibitor of ER stress-induced XBP1 mRNA splicing. Blood cancer journal. 2012;2(7):e79.
110. Sykes EK, Mactier S, Christopherson RI. Melanoma and the Unfolded Protein Response. Cancers. 2016;8(3).
111. Tay KH, Luan Q, Croft A, Jiang CC, Jin L, Zhang XD, et al. Sustained IRE1 and ATF6 signaling is important for survival of melanoma cells undergoing ER stress. Cellular signalling. 2014;26(2):287-94.
112. Ma XH, Piao SF, Dey S, McAfee Q, Karakousis G, Villanueva J, et al. Targeting ER stress-induced autophagy overcomes BRAF inhibitor resistance in melanoma. The Journal of clinical investigation. 2014;124(3):1406-17.

132
113. Corazzari M, Rapino F, Ciccosanti F, Giglio P, Antonioli M, Conti B, et al. Oncogenic BRAF induces chronic ER stress condition resulting in increased basal autophagy and apoptotic resistance of cutaneous melanoma. Cell Death Differ. 2015;22(6):946-58.
114. Chevet E, Hetz C, Samali A. Endoplasmic Reticulum Stress-Activated Cell Reprogramming in Oncogenesis. Cancer discovery. 2015;5(6):586-97.
115. Papaioannou A, Chevet E. Driving Cancer Tumorigenesis and Metastasis Through UPR Signaling. Current topics in microbiology and immunology. 2018;414:159-92.
116. Madden E, Logue SE, Healy SJ, Manie S, Samali A. The role of the unfolded protein response in cancer progression: From oncogenesis to chemoresistance. Biol Cell. 2019;111(1):1-17.
117. Limia CM, Sauzay C, Urra H, Hetz C, Chevet E, Avril T. Emerging Roles of the Endoplasmic Reticulum Associated Unfolded Protein Response in Cancer Cell Migration and Invasion. Cancers. 2019;11(5).
118. Mhaidat NM, Alzoubi KH, Abushbak A. X-box binding protein 1 (XBP-1) enhances colorectal cancer cell invasion. J Chemother. 2015;27(3):167-73.
119. Li H, Chen X, Gao Y, Wu J, Zeng F, Song F. XBP1 induces snail expression to promote epithelial- to-mesenchymal transition and invasion of breast cancer cells. Cellular signalling. 2015;27(1):82-9.
120. Sun Y, Jiang F, Pan Y, Chen X, Chen J, Wang Y, et al. XBP1 promotes tumor invasion and is associated with poor prognosis in oral squamous cell carcinoma. Oncology reports. 2018;40(2):988-98.
121. Jin C, Jin Z, Chen NZ, Lu M, Liu CB, Hu WL, et al. Activation of IRE1alpha-XBP1 pathway induces cell proliferation and invasion in colorectal carcinoma. Biochem Biophys Res Commun. 2016;470(1):75-81.
122. Xia T, Tong S, Fan K, Zhai W, Fang B, Wang SH, et al. XBP1 induces MMP-9 expression to promote proliferation and invasion in human esophageal squamous cell carcinoma. American journal of cancer research. 2016;6(9):2031-40.
123. Wu S, Du R, Gao C, Kang J, Wen J, Sun T. The role of XBP1s in the metastasis and prognosis of hepatocellular carcinoma. Biochemical and biophysical research communications. 2018;500(3):530-7.
124. Hsu HT, Hsing MT, Yeh CM, Chen CJ, Yang JS, Yeh KT. Decreased cytoplasmic X-box binding protein-1 expression is associated with poor prognosis and overall survival in patients with oral squamous cell carcinoma. Clin Chim Acta. 2018;479:66-71.
125. Mo XT, Zhou WC, Cui WH, Li DL, Li LC, Xu L, et al. Inositol-requiring protein 1 - X-box-binding protein 1 pathway promotes epithelial-mesenchymal transition via mediating snail expression in pulmonary fibrosis. The international journal of biochemistry & cell biology. 2015;65:230-8.

133
126. Cuevas EP, Eraso P, Mazon MJ, Santos V, Moreno-Bueno G, Cano A, et al. LOXL2 drives epithelial-mesenchymal transition via activation of IRE1-XBP1 signalling pathway. Scientific reports. 2017;7:44988.
127. Kessenbrock K, Plaks V, Werb Z. Matrix Metalloproteinases: Regulators of the Tumor Microenvironment. Cell. 2010;141(1):52-67.
128. Pommier A, Anaparthy N, Memos N, Kelley ZL, Gouronnec A, Yan R, et al. Unresolved endoplasmic reticulum stress engenders immune-resistant, latent pancreatic cancer metastases. Science. 2018;360(6394).
129. Drogat B, Auguste P, Nguyen DT, Bouchecareilh M, Pineau R, Nalbantoglu J, et al. IRE1 signaling is essential for ischemia-induced vascular endothelial growth factor-A expression and contributes to angiogenesis and tumor growth in vivo. Cancer Res. 2007;67(14):6700-7.
130. Dejeans N, Pluquet O, Lhomond S, Grise F, Bouchecareilh M, Juin A, et al. Autocrine control of glioma cells adhesion and migration through IRE1alpha-mediated cleavage of SPARC mRNA. J Cell Sci. 2012;125(Pt 18):4278-87.
131. Jabouille A, Delugin M, Pineau R, Dubrac A, Soulet F, Lhomond S, et al. Glioblastoma invasion and cooption depend on IRE1alpha endoribonuclease activity. Oncotarget. 2015;6(28):24922-34.
132. Wirthschaft P, Bode J, Soni H, Dietrich F, Kruwel T, Fischer B, et al. RhoA regulates translation of the Nogo-A decoy SPARC in white matter-invading glioblastomas. Acta neuropathologica. 2019;138(2):275-93.
133. Hao L, Ha JR, Kuzel P, Garcia E, Persad S. Cadherin switch from E- to N-cadherin in melanoma progression is regulated by the PI3K/PTEN pathway through Twist and Snail. Br J Dermatol. 2012;166(6):1184-97.
134. Robert G, Gaggioli C, Bailet O, Chavey C, Abbe P, Aberdam E, et al. SPARC represses E-cadherin and induces mesenchymal transition during melanoma development. Cancer research. 2006;66(15):7516-23.
135. Girotti MR, Fernandez M, Lopez JA, Camafeita E, Fernandez EA, Albar JP, et al. SPARC promotes cathepsin B-mediated melanoma invasiveness through a collagen I/alpha2beta1 integrin axis. The Journal of investigative dermatology. 2011;131(12):2438-47.
136. Fenouille N, Tichet M, Dufies M, Pottier A, Mogha A, Soo JK, et al. The epithelial-mesenchymal transition (EMT) regulatory factor SLUG (SNAI2) is a downstream target of SPARC and AKT in promoting melanoma cell invasion. PloS one. 2012;7(7):e40378.
137. Smit DJ, Gardiner BB, Sturm RA. Osteonectin downregulates E-cadherin, induces osteopontin and focal adhesion kinase activity stimulating an invasive melanoma phenotype. International journal of cancer. 2007;121(12):2653-60.
138. Botti G, Scognamiglio G, Marra L, Collina F, Di Bonito M, Cerrone M, et al. SPARC/osteonectin is involved in metastatic process to the lung during melanoma

134
progression. Virchows Archiv : an international journal of pathology. 2014;465(3):331-8.
139. Lhomond S, Avril T, Dejeans N, Voutetakis K, Doultsinos D, McMahon M, et al. Dual IRE1 RNase functions dictate glioblastoma development. EMBO molecular medicine. 2018;10(3).
140. Lynch CD, Sheetz MP. Cellular mechanotransduction: filamin a strains to regulate motility. Curr Biol. 2011;21(22):R916-8.
141. Urra H. Role of IRE1α in cytoskeleton remodeling and cell migration: a new function of IRE1α beyond ER stress [PhD thesis]. Santiago: University of Chile; 2015.
142. Nakamura F, Stossel TP, Hartwig JH. The filamins: organizers of cell structure and function. Cell adhesion & migration. 2011;5(2):160-9.
143. van der Flier A, Sonnenberg A. Structural and functional aspects of filamins. Biochim Biophys Acta. 2001;1538(2-3):99-117.
144. Vadlamudi RK, Li F, Adam L, Nguyen D, Ohta Y, Stossel TP, et al. Filamin is essential in actin cytoskeletal assembly mediated by p21-activated kinase 1. Nature cell biology. 2002;4(9):681-90.
145. Tigges U, Koch B, Wissing J, Jockusch BM, Ziegler WH. The F-actin cross-linking and focal adhesion protein filamin A is a ligand and in vivo substrate for protein kinase C alpha. J Biol Chem. 2003;278(26):23561-9.
146. Ohta Y, Hartwig JH. Phosphorylation of actin-binding protein 280 by growth factors is mediated by p90 ribosomal protein S6 kinase. The Journal of biological chemistry. 1996;271(20):11858-64.
147. Fox JE, Goll DE, Reynolds CC, Phillips DR. Identification of two proteins (actin-binding protein and P235) that are hydrolyzed by endogenous Ca2+-dependent protease during platelet aggregation. J Biol Chem. 1985;260(2):1060-6.
148. Loy CJ, Sim KS, Yong EL. Filamin-A fragment localizes to the nucleus to regulate androgen receptor and coactivator functions. Proceedings of the National Academy of Sciences of the United States of America. 2003;100(8):4562-7.
149. Yue J, Huhn S, Shen Z. Complex roles of filamin-A mediated cytoskeleton network in cancer progression. Cell & bioscience. 2013;3(1):7.
150. Shao QQ, Zhang TP, Zhao WJ, Liu ZW, You L, Zhou L, et al. Filamin A: Insights into its Exact Role in Cancers. Pathology oncology research : POR. 2016;22(2):245-52.
151. Ai J, Huang H, Lv X, Tang Z, Chen M, Chen T, et al. FLNA and PGK1 are two potential markers for progression in hepatocellular carcinoma. Cellular physiology and biochemistry : international journal of experimental cellular physiology, biochemistry, and pharmacology. 2011;27(3-4):207-16.

135
152. Jiang X, Yue J, Lu H, Campbell N, Yang Q, Lan S, et al. Inhibition of filamin-A reduces cancer metastatic potential. International journal of biological sciences. 2013;9(1):67-77.
153. Tian HM, Liu XH, Han W, Zhao LL, Yuan B, Yuan CJ. Differential expression of filamin A and its clinical significance in breast cancer. Oncology letters. 2013;6(3):681-6.
154. Alper O, Stetler-Stevenson WG, Harris LN, Leitner WW, Ozdemirli M, Hartmann D, et al. Novel anti-filamin-A antibody detects a secreted variant of filamin-A in plasma from patients with breast carcinoma and high-grade astrocytoma. Cancer science. 2009;100(9):1748-56.
155. Zhou AX, Toylu A, Nallapalli RK, Nilsson G, Atabey N, Heldin CH, et al. Filamin a mediates HGF/c-MET signaling in tumor cell migration. International journal of cancer. 2011;128(4):839-46.
156. Huang C, Miller RT, Freter CE. Signaling regulation and role of filamin A cleavage in Ca2+-stimulated migration of androgen receptor-deficient prostate cancer cells. Oncotarget. 2016.
157. Li C, Yu S, Nakamura F, Pentikainen OT, Singh N, Yin S, et al. Pro-prion binds filamin A, facilitating its interaction with integrin beta1, and contributes to melanomagenesis. J Biol Chem. 2010;285(39):30328-39.
158. Baldassarre M, Razinia Z, Brahme NN, Buccione R, Calderwood DA. Filamin A controls matrix metalloproteinase activity and regulates cell invasion in human fibrosarcoma cells. J Cell Sci. 2012;125(Pt 16):3858-69.
159. Sun GG, Wei CD, Jing SW, Hu WN. Interactions between filamin A and MMP-9 regulate proliferation and invasion in renal cell carcinoma. Asian Pacific journal of cancer prevention : APJCP. 2014;15(8):3789-95.
160. Xu Y, Bismar TA, Su J, Xu B, Kristiansen G, Varga Z, et al. Filamin A regulates focal adhesion disassembly and suppresses breast cancer cell migration and invasion. The Journal of experimental medicine. 2010;207(11):2421-37.
161. Bonaventure J, Domingues MJ, Larue L. Cellular and molecular mechanisms controlling the migration of melanocytes and melanoma cells. Pigment Cell Melanoma Res. 2013;26(3):316-25.
162. Croft A, Tay KH, Boyd SC, Guo ST, Jiang CC, Lai F, et al. Oncogenic activation of MEK/ERK primes melanoma cells for adaptation to endoplasmic reticulum stress. The Journal of investigative dermatology. 2014;134(2):488-97.
163. Zhuang L, Scolyer RA, Lee CS, McCarthy SW, Cooper WA, Zhang XD, et al. Expression of glucose-regulated stress protein GRP78 is related to progression of melanoma. Histopathology. 2009;54(4):462-70.
164. Guan M, Chen X, Ma Y, Tang L, Guan L, Ren X, et al. MDA-9 and GRP78 as potential diagnostic biomarkers for early detection of melanoma metastasis. Tumour

136
biology : the journal of the International Society for Oncodevelopmental Biology and Medicine. 2015;36(4):2973-82.
165. Eigner K, Filik Y, Mark F, Schutz B, Klambauer G, Moriggl R, et al. The unfolded protein response impacts melanoma progression by enhancing FGF expression and can be antagonized by a chemical chaperone. Scientific reports. 2017;7(1):17498.
166. Lisbona F, Rojas-Rivera D, Thielen P, Zamorano S, Todd D, Martinon F, et al. BAX inhibitor-1 is a negative regulator of the ER stress sensor IRE1alpha. Mol Cell. 2009;33(6):679-91.
167. Maletzki C, Bock S, Fruh P, Macius K, Witt A, Prall F, et al. NSG mice as hosts for oncological precision medicine. Lab Invest. 2020;100(1):27-37.
168. Domingues B, Lopes JM, Soares P, Populo H. Melanoma treatment in review. Immunotargets Ther. 2018;7:35-49.
169. Obiedat A, Seidel E, Mahameed M, Berhani O, Tsukerman P, Voutetakis K, et al. Transcription of the NKG2D ligand MICA is suppressed by the IRE1/XBP1 pathway of the unfolded protein response through the regulation of E2F1. FASEB journal : official publication of the Federation of American Societies for Experimental Biology. 2018:fj201801350RR.
170. Ma Y, Hendershot LM. The role of the unfolded protein response in tumour development: friend or foe? Nat Rev Cancer. 2004;4(12):966-77.
171. Long GV, Menzies AM, Nagrial AM, Haydu LE, Hamilton AL, Mann GJ, et al. Prognostic and clinicopathologic associations of oncogenic BRAF in metastatic melanoma. J Clin Oncol. 2011;29(10):1239-46.
172. Ascierto PA, Kirkwood JM, Grob JJ, Simeone E, Grimaldi AM, Maio M, et al. The role of BRAF V600 mutation in melanoma. Journal of translational medicine. 2012;10:85.
173. Overwijk WW, Restifo NP. B16 as a Mouse Model for Human Melanoma. Current protocols in immunology / edited by John E Coligan [et al]. 2001;CHAPTER:Unit-20.1.
174. Chen HC. Boyden chamber assay. Methods Mol Biol. 2005;294:15-22.
175. Justus CR, Leffler N, Ruiz-Echevarria M, Yang LV. In vitro cell migration and invasion assays. J Vis Exp. 2014(88).
176. Trimmer C, Whitaker-Menezes D, Bonuccelli G, Milliman JN, Daumer KM, Aplin AE, et al. CAV1 inhibits metastatic potential in melanomas through suppression of the integrin/Src/FAK signaling pathway. Cancer research. 2010;70(19):7489-99.
177. Jiang G, Yang CS, Xu D, Sun C, Zheng JN, Lei TC, et al. Potent anti-tumour activity of a novel conditionally replicating adenovirus for melanoma via inhibition of migration and invasion. British journal of cancer. 2014;110(10):2496-505.

137
178. Tiwary S, Preziosi M, Rothberg PG, Zeitouni N, Corson N, Xu L. ERBB3 is required for metastasis formation of melanoma cells. Oncogenesis. 2014;3:e110.
179. Berridge MV, Herst PM, Tan AS. Tetrazolium dyes as tools in cell biology: new insights into their cellular reduction. Biotechnol Annu Rev. 2005;11:127-52.
180. Xie Y, Liu C, Qin Y, Chen J, Fang J. Knockdown of IRE1a suppresses metastatic potential of colon cancer cells through inhibiting FN1-Src/FAK-GTPases signaling. The international journal of biochemistry & cell biology. 2019;114:105572.
181. Ridley AJ. Life at the leading edge. Cell. 2011;145(7):1012-22.
182. Burridge K. Focal adhesions: a personal perspective on a half century of progress. The FEBS journal. 2017;284(20):3355-61.
183. Rottner K, Schaks M. Assembling actin filaments for protrusion. Current opinion in cell biology. 2019;56:53-63.
184. Riedl J, Crevenna AH, Kessenbrock K, Yu JH, Neukirchen D, Bista M, et al. Lifeact: a versatile marker to visualize F-actin. Nat Methods. 2008;5(7):605-7.
185. Winklbauer R. Cell adhesion strength from cortical tension - an integration of concepts. Journal of cell science. 2015;128(20):3687-93.
186. Janiszewska M, Primi MC, Izard T. Cell adhesion in cancer: Beyond the migration of single cells. The Journal of biological chemistry. 2020;295(8):2495-505.
187. Odenthal J, Takes R, Friedl P. Plasticity of tumor cell invasion: governance by growth factors and cytokines. Carcinogenesis. 2016;37(12):1117-28.
188. Savoy RM, Ghosh PM. The dual role of filamin A in cancer: can't live with (too much of) it, can't live without it. Endocrine-related cancer. 2013;20(6):R341-56.
189. Volkmann K, Lucas JL, Vuga D, Wang X, Brumm D, Stiles C, et al. Potent and Selective Inhibitors of the Inositol-requiring Enzyme 1 Endoribonuclease. J Biol Chem. 2011;286(14):12743-55.
190. Scott KL, Nogueira C, Heffernan TP, van Doorn R, Dhakal S, Hanna JA, et al. Proinvasion metastasis drivers in early-stage melanoma are oncogenes. Cancer cell. 2011;20(1):92-103.
191. Chen J, Wu F, Shi Y, Yang D, Xu M, Lai Y, et al. Identification of key candidate genes involved in melanoma metastasis. Molecular medicine reports. 2019;20(2):903-14.
192. Bright MD, Itzhak DN, Wardell CP, Morgan GJ, Davies FE. Cleavage of BLOC1S1 mRNA by IRE1 Is Sequence Specific, Temporally Separate from XBP1 Splicing, and Dispensable for Cell Viability under Acute Endoplasmic Reticulum Stress. Mol Cell Biol. 2015;35(12):2186-202.

138
193. Yang C, Xia BR, Jin WL, Lou G. Circulating tumor cells in precision oncology: clinical applications in liquid biopsy and 3D organoid model. Cancer Cell Int. 2019;19:341.
194. Society AC. Cancer facts and figures 2007 GA, USA2008 [
195. Francia G, Cruz-Munoz W, Man S, Xu P, Kerbel RS. Mouse models of advanced spontaneous metastasis for experimental therapeutics. Nature reviews Cancer. 2011;11(2):135-41.
196. Gomez-Cuadrado L, Tracey N, Ma R, Qian B, Brunton VG. Mouse models of metastasis: progress and prospects. Disease models & mechanisms. 2017;10(9):1061-74.
197. Cruz-Munoz W, Man S, Xu P, Kerbel RS. Development of a preclinical model of spontaneous human melanoma central nervous system metastasis. Cancer research. 2008;68(12):4500-5.
198. Zhang K, Zhu T, Gao D, Zhang Y, Zhao Q, Liu S, et al. Filamin A expression correlates with proliferation and invasive properties of human metastatic melanoma tumors: implications for survival in patients. Journal of cancer research and clinical oncology. 2014;140(11):1913-26.
199. Gawecka JE, Griffiths GS, Ek-Rylander B, Ramos JW, Matter ML. R-Ras regulates migration through an interaction with filamin A in melanoma cells. PloS one. 2010;5(6):e11269.
200. O'Connell MP, Fiori JL, Baugher KM, Indig FE, French AD, Camilli TC, et al. Wnt5A activates the calpain-mediated cleavage of filamin A. The Journal of investigative dermatology. 2009;129(7):1782-9.
201. Zhu TN, He HJ, Kole S, D'Souza T, Agarwal R, Morin PJ, et al. Filamin A-mediated down-regulation of the exchange factor Ras-GRF1 correlates with decreased matrix metalloproteinase-9 expression in human melanoma cells. The Journal of biological chemistry. 2007;282(20):14816-26.
202. Liu ZJ, Semenza GL, Zhang HF. Hypoxia-inducible factor 1 and breast cancer metastasis. Journal of Zhejiang University Science B. 2015;16(1):32-43.
203. Chen C, Zhang X. IRE1alpha-XBP1 pathway promotes melanoma progression by regulating IL-6/STAT3 signaling. Journal of translational medicine. 2017;15(1):42.
204. Linnskog R, Jonsson G, Axelsson L, Prasad CP, Andersson T. Interleukin-6 drives melanoma cell motility through p38alpha-MAPK-dependent up-regulation of WNT5A expression. Molecular oncology. 2014;8(8):1365-78.
205. Oikawa D, Tokuda M, Hosoda A, Iwawaki T. Identification of a consensus element recognized and cleaved by IRE1 alpha. Nucleic acids research. 2010;38(18):6265-73.

139
206. Nishizuka Y. The molecular heterogeneity of protein kinase C and its implications for cellular regulation. Nature. 1988;334(6184):661-5.
207. Chalkiadaki G, Nikitovic D, Katonis P, Berdiaki A, Tsatsakis A, Kotsikogianni I, et al. Low molecular weight heparin inhibits melanoma cell adhesion and migration through a PKCa/JNK signaling pathway inducing actin cytoskeleton changes. Cancer letters. 2011;312(2):235-44.
208. Zhang P, Goodrich C, Fu C, Dong C. Melanoma upregulates ICAM-1 expression on endothelial cells through engagement of tumor CD44 with endothelial E-selectin and activation of a PKCalpha-p38-SP-1 pathway. FASEB journal : official publication of the Federation of American Societies for Experimental Biology. 2014;28(11):4591-609.
209. Dissanayake SK, Wade M, Johnson CE, O'Connell MP, Leotlela PD, French AD, et al. The Wnt5A/protein kinase C pathway mediates motility in melanoma cells via the inhibition of metastasis suppressors and initiation of an epithelial to mesenchymal transition. The Journal of biological chemistry. 2007;282(23):17259-71.
210. Lahn MM, Sundell KL. The role of protein kinase C-alpha (PKC-alpha) in melanoma. Melanoma research. 2004;14(2):85-9.
211. Leotlela PD, Wade MS, Duray PH, Rhode MJ, Brown HF, Rosenthal DT, et al. Claudin-1 overexpression in melanoma is regulated by PKC and contributes to melanoma cell motility. Oncogene. 2007;26(26):3846-56.
212. Koohini Z, Teimourian S. Slit/Robo Signaling Pathway in Cancer; a New Stand Point for Cancer Treatment. Pathol Oncol Res. 2019;25(4):1285-93.
213. Yao Y, Zhou Z, Li L, Li J, Huang L, Qi C, et al. Activation of Slit2/Robo1 Signaling Promotes Tumor Metastasis in Colorectal Carcinoma through Activation of the TGF-β/Smads Pathway. Cells. 2019;8(6).
214. Chen W, Ye L, Wen D, Chen F. MiR-490-5p Inhibits Hepatocellular Carcinoma Cell Proliferation, Migration and Invasion by Directly Regulating ROBO1. Pathol Oncol Res. 2019;25(1):1-9.
215. Mertsch S, Schmitz N, Jeibmann A, Geng JG, Paulus W, Senner V. Slit2 involvement in glioma cell migration is mediated by Robo1 receptor. J Neurooncol. 2008;87(1):1-7.
216. Onken MD, Worley LA, Tuscan MD, Harbour JW. An accurate, clinically feasible multi-gene expression assay for predicting metastasis in uveal melanoma. J Mol Diagn. 2010;12(4):461-8.
217. Guo F, Jiao F, Song Z, Li S, Liu B, Yang H, et al. Regulation of MALAT1 expression by TDP43 controls the migration and invasion of non-small cell lung cancer cells in vitro. Biochem Biophys Res Commun. 2015;465(2):293-8.

140
218. Lin TW, Chen MT, Lin LT, Huang PI, Lo WL, Yang YP, et al. TDP-43/HDAC6 axis promoted tumor progression and regulated nutrient deprivation-induced autophagy in glioblastoma. Oncotarget. 2017;8(34):56612-25.
219. Zeng Q, Cao K, Liu R, Huang J, Xia K, Tang J, et al. Identification of TDP-43 as an oncogene in melanoma and its function during melanoma pathogenesis. Cancer Biol Ther. 2017;18(1):8-15.
220. Tong J, Huang C, Bi F, Wu Q, Huang B, Zhou H. XBP1 depletion precedes ubiquitin aggregation and Golgi fragmentation in TDP-43 transgenic rats. J Neurochem. 2012;123(3):406-16.
221. Ming J, Ruan S, Wang M, Ye D, Fan N, Meng Q, et al. A novel chemical, STF-083010, reverses tamoxifen-related drug resistance in breast cancer by inhibiting IRE1/XBP1. Oncotarget. 2015;6(38):40692-703.
222. Logue SE, McGrath EP, Cleary P, Greene S, Mnich K, Almanza A, et al. Inhibition of IRE1 RNase activity modulates the tumor cell secretome and enhances response to chemotherapy. Nature communications. 2018;9(1):3267.
223. Song M, Sandoval TA, Chae CS, Chopra S, Tan C, Rutkowski MR, et al. IRE1alpha-XBP1 controls T cell function in ovarian cancer by regulating mitochondrial activity. Nature. 2018;562(7727):423-8.

Résumé
Les cellules tumorales sont exposées à plusieurs perturbations intrinsèques et
extrinsèques qui peuvent altérer le bon fonctionnement du réticulum endoplasmique
(RE), une condition cellulaire connue sous le nom de stress ER. Ce stress engage
une réponse adaptative appelée « Unfolded Protein Response » (UPR), une voie de
signalisation qui transmet les informations sur l'état de repliement des protéines dans
la lumière ER vers le noyau en vue de rétablir l’homéostasie protéique. La
signalisation des trois branches de l'UPR a été liée à la progression tumorale. La voie
de signalisation transduite par la protéine IRE1α (appelée ci-après IRE1) est la
branche la plus conservée de l'UPR, et son association avec le développement des
cancers a été documentée au cours des dernières années. L'activation d’IRE1 induit
l'épissage non conventionnel de l'ARNm XBP1 contrôlant l'expression du facteur de
transcription XBP1s et simultanément la dégradation d’ARNm et de microARN par un
processus appelé RIDD. En outre, nous avons décrit qu’IRE1 interagit directement
avec la filamine A (FLNA), une protéine de réticulation de l'actine impliquée dans la
migration cellulaire.
Malgré les preuves croissantes suggérant qu’IRE1 est un régulateur important
de la progression tumorale et d'autres caractéristiques du cancer, son implication dans
l’apparition de métastases et les mécanismes moléculaires sous-jacents restent
ambigus. Plusieurs études ont lié l'activité IRE1 à la migration cellulaire, à l'invasion
et aux métastases dans différents types de tumeurs. Cependant, la plupart des
preuves disponibles sont toujours corrélatives et les mécanismes moléculaires restent
à élucider complètement. L'une des tumeurs les plus métastatiques est le mélanome
cutané malin, dont l'incidence et la mortalité ont augmenté au cours des dernières

décennies. Aucune preuve concernant le rôle de l'IRE1 dans la migration et l'invasion
cellulaires du mélanome n'a été publiée jusqu’ici. Par conséquent, dans cette thèse,
je vise à caractériser la contribution de l'IRE1 dans la migration et l'invasion cellulaires
dans les cellules de mélanome, son impact sur le processus métastatique et sa
relation avec la signalisation de la FLNA.
À cette fin, j’ai sélectionné comme modèle cellulaire quatre lignées cellulaires de
mélanome humain, dont une non métastatique et trois métastatiques. J’ai également
utilisé la lignée cellulaire B16F10 dérivée de C57BL/6 pour des expériences
complémentaires, un modèle hautement métastatique et bien établi pour l'étude des
métastases de mélanome. Fait intéressant, l'ablation génétique de l'expression d'IRE1
a conduit à une augmentation de la capacité de migration et d'invasion cellulaire des
lignées cellulaires de mélanome métastatique humain. Notamment, je n’ai pas pu
corroborer une interaction entre IRE1 et FLNA, ni la phosphorylation IRE1-
dépendante de FLNA sur la sérine S2152 avec ce phénomène. Surtout, les processus
connus pour être régulés par FLNA, comme le cytosquelette d'actine et l'adhésion
cellulaire, ne sont pas affectés par la déplétion de l'IRE1 dans les cellules de
mélanome métastatique humain. Ces résultats suggèrent que la régulation de la
migration / invasion cellulaire par IRE1 est un mécanisme indépendant de la FLNA.
Qui plus est, en utilisant un inhibiteur sélectif de la RNase IRE1 (MKC-8866), une
augmentation significative de la migration des cellules de mélanome métastatique a
aussi été observée. Ainsi, nous avons évalué l'effet de la surexpression de XBP1 sur
la migration cellulaire des cellules de mélanome métastatique humain sur le déficit ou
le contrôle pharmacologique de l’activité d’IRE1. En utilisant cette approche
expérimentale, nous avons observé que XBP1 n'affecte pas la capacité des cellules
de mélanome humain à migrer. Sur cette base, nous avons émis l'hypothèse que

RIDD en aval de l'activité IRE1 RNase pourrait être responsable de l’atténuation de la
migration des cellules de mélanome métastatique.
À l'aide d'analyses bioinformatiques, nous avons ensuite évalué l'état d'activation
de la branche IRE1 (XBP1 ou RIDD) dans les métastases du mélanome humain. En
utilisant les signatures génétiques déjà décrites pour les tumeurs de glioblastomes,
nous avons comparé l'activité IRE1 dans les tumeurs primaires et métastatiques de
469 patients. Nous avons observé une diminution significative de l'activité IRE1 dans
les échantillons métastatiques par rapport aux tumeurs primaires. Cette diminution de
l'activité IRE1 dans les métastases était corrélée à une diminution de l'activité RIDD,
mais pas de l'activité XBP1s, ce qui suggère que l'inhibition IRE1 / RIDD pourrait être
un processus nécessaire pour développer des métastases de mélanome. En utilisant
la même base de données d'expression génique, nous avons constaté que les
tumeurs identifiées avec une activité RIDD élevée présentaient une diminution
significative de l'expression d'au moins neuf gènes impliqués dans les métastases du
mélanome. Un effet totalement indépendant de l'activité XBP1s. Bien que ces cibles
RIDD possibles doivent encore être validées in vitro, nos résultats soutiennent
fortement l'idée qu’IRE1, à travers l'activité RIDD et la dégradation de multiples
ARNm, pourrait agir comme un suppresseur de migration, et peut-être d'invasion,
dans les lignées cellulaires de mélanome humain.
Enfin, pour déterminer la pertinence de l'expression d'IRE1 dans les métastases
de mélanome in vivo, j’ai sélectionné un modèle expérimental de métastase,
consistant en l'injection de veine latérale de la queue de cellules de mélanome
métastatique humain chez des souris NSG ou des cellules de mélanome métastatique
de souris chez des souris immunocompétentes. Bien que les données obtenues in

vitro soutiennent qu’IRE1 peut supprimer la migration cellulaire, je n’ai pas pas trouvé
de différence significative concernant le nombre de nodules métastatiques dans les
poumons entre les cellules de mélanome métastatique IRE1KO et contrôle. Une
explication du faible effet de la déficience IRE1 dans les métastases dans nos
expériences pourrait être que le modèle in vivo choisi n'est pas adéquat pour évaluer
le mécanisme régulé par IRE1 dans le mélanome. Le modèle expérimental de
métastase choisi (injection directe de cellules tumorales dans la circulation) est une
excellente stratégie en première approche car il permet le contrôle du nombre de
cellules injectées, en excluant l'effet de la croissance tumorale primaire. Cependant,
ce type d'expérience a des limites. Je considère qu'outre la complexité de ce modèle,
l'évaluation de l'effet de la déplétion IRE1 dans les métastases spontanées pourrait
être pertinente pour tester mon hypothèse de travail.
Les résultats obtenus dans cette thèse constituent la première analyse de
l'implication d'IRE1 dans les processus liés aux métastases dans le mélanome,
comme la migration et l'invasion cellulaires. Surtout, plusieurs résultats indiquent que
l'inhibition de l'activité IRE1 RNase altère la progression tumorale dans différents
types de cancer. Néanmoins, les résultats obtenus corroborent la complexité et le rôle
tumeur-spécifique de la signalisation IRE1. Les données obtenues au cours de ma
thèse suggèrent que le ciblage de l'activité IRE1 RNase pourrait ne pas être la
meilleure option dans le traitement du mélanome car cela pourrait avoir des effets
indésirables sur l'amélioration de la migration / invasion et peut-être des métastases.

Titre : Une nouvelle fonction du transducteur de stress ER IRE1 dans la migration cellulaire et l'invasion des cellules de mélanome métastatique.
Mots clés : Stress du RE, UPR, IRE1, mélanome, migration cellulaire, métastase.
Résumé : Les cellules tumorales sont exposées à des perturbations intrinsèques et extrinsèques qui altèrent le bon fonctionnement du réticulum endoplasmique (RE); une condition cellulaire connue sous le nom de stress du RE. Cette condition engage une réponse adaptative appelée « Unfolded Protein Response » (UPR). IRE1 est le capteur du stress du RE qui est le plus conservé dans l’évolution. L'activation de l'activité RNase d’IRE1 contrôle l'expression du facteur de transcription XBP1s et la dégradation d’ARNm par un processus appelé RIDD. L'activité IRE1 a été liée à la migration et à l'invasion cellulaires dans différents types de tumeurs. Cependant, aucune preuve concernant le rôle de l'IRE1 dans la migration / l'invasion des cellules de mélanome n'a été publiée jusqu’ici. Il est important de noter qu'en 2018, notre groupe a décrit une nouvelle fonction de l'IRE1 indépendante de son activité catalytique, dans laquelle IRE1 agissait comme un échafaudage favorisant la migration cellulaire via la filamin A (FLNA), une protéine de réticulation de l'actine impliquée dans la migration cellulaire. Cela a été démontré dans des cellules non tumorales. Par conséquent, dans cette thèse, mon objectif initial était de tester et caractériser la contribution de la signalisation IRE1/FLNA dans la migration cellulaire et l'invasion dans les cellules de mélanome, son impact sur le processus métastatique.
En utilisant des approches génétiques et pharmacologiques, j’ai constaté que le déficit d'expression d'IRE1 et/ou l'inhibition de son activité RNase augmentent les propriétés de migration et d'invasion des lignées cellulaires de mélanome métastatique humain, indiquant que la branche IRE1 pourrait agir comme un suppresseur de la migration et de l'invasion dans ces cellules. Notamment, nous n'avons pas été en mesure de corroborer la phosphorylation dépendante d’IRE1 de la FLNA. Surtout, les structures et processus connus pour être régulés par la FLNA comme le cytosquelette d'actine et l'adhésion cellulaire ne sont pas affectés par la déplétion de l'IRE1 dans les cellules de mélanome métastatique humain. Ces résultats suggèrent que la régulation de la migration/invasion par IRE1 est un mécanisme indépendant du FLNA. En analysant une base de données d'expression génique de tumeurs de mélanome, nous avons constaté que les tumeurs identifiées avec une activité RIDD élevée présentaient une diminution significative de l'expression des gènes impliqués dans les métastases du mélanome. Nos résultats suggèrent que IRE1 (via le RIDD) pourrait agir comme un suppresseur de la migration et de l'invasion des cellules de mélanome métastatique. Les résultats obtenus dans cette thèse constituent une première étape dans la caractérisation de l'implication d'IRE1 dans les processus liés aux métastases dans le mélanome.
Title : Novel function of the ER stress transducer IRE1 in cell migration and invasion of metastatic melanoma cells.
Keywords : ER stress, UPR, IRE1, melanoma, cell migration, metastasis.
Abstract : Tumor cells are exposed to cell-intrinsic and extrinsic perturbations that alter the proper functioning of the endoplasmic reticulum (ER); a cellular condition known as ER stress. This condition engages an adaptive response termed as unfolded protein response (UPR). IRE1 is the most evolutionary conserved ER stress sensor of the UPR. Activation of the IRE1 RNase activity controls the expression of the transcription factor XBP1s and the degradation of mRNA through a process termed RIDD. IRE1 activity has been linked to cell migration and invasion in different types of tumors. However, no evidence regarding the role of IRE1 in melanoma cell migration/invasion has been published. Importantly in 2018 our group described a novel function of IRE1 independent of its catalytic activity, where IRE1 acted as a scaffold favoring cell migration through FLNA, an actin crosslinking protein involved in cell migration. This was demonstrated in non-tumoral cells. Therefore, in this thesis, we initially aimed to uncover the contribution of IRE1/FLNA signaling in cell migration and invasion in melanoma cells, its impact on the metastatic process.
By using genetic and pharmacologic approaches, we found that deficiency of IRE1 expression or RNase activity inhibition enhances cell migration and invasion of human metastatic melanoma cell lines, indicating that the IRE1 branch could be acting as a suppressor of cell migration and invasion in metastatic melanoma cells. Notably, we were not able to corroborate the IRE1-dependent phosphorylation of FLNA. Importantly, processes that are known to be regulated by FLNA like actin cytoskeleton and cell adhesion were not affected by IRE1 depletion in human metastatic melanoma cells. These findings suggest that the regulation of cell migration/invasion by IRE1 is an FLNA-independent mechanism. Analyzing a gene expression database of melanoma tumors, we found that tumors identified with high RIDD activity presented a significant decrease in the expression of genes involved in melanoma metastasis. Our findings suggest that IRE1 through RIDD acts as a suppressor of metastatic melanoma cell migration and invasion. The results obtained in this thesis constitute the first approximation on the implication of IRE1 in metastasis-related processes in melanoma, such as cell migration and invasion.
Related Documents