source: https://doi.org/10.7892/boris.89577 | downloaded: 21.7.2022 RESEARCH ARTICLE Open Access Novel equine tissue miRNAs and breed- related miRNA expressed in serum Alicja Pacholewska 1,2* , Núria Mach 3 , Xavier Mata 3 , Anne Vaiman 3 , Laurent Schibler 3 , Eric Barrey 3† and Vincent Gerber 1† Abstract Background: MiRNAs regulate multiple genes at the post-transcriptional level and therefore play an important role in many biological processes. It has been suggested that miRNA exported outside the cells contribute to inter- cellular communication. Consequently, circulating miRNAs are of particular interest and are promising biomarkers for many diseases. The number of miRNAs annotated in the horse genome is much lower compared to model organisms like human and mouse. We therefore aimed to identify novel equine miRNAs for tissue types and breed in serum. Results: We analysed 71 small RNA-seq libraries derived from nine tissues (gluteus medius, platysma, masseter muscle, heart, liver, cartilage, bone, total blood and serum) using miRDeep2 and miRdentify tools. Known miRNAs represented between 2.3 and 62.9 % of the reads in 71 libraries. A total of 683 novel miRNAs were identified. Breed and tissue type affected the number of miRNAs detected and interestingly, affected its average intensity. A total of 50 miRNAs in serum proved to be potential biomarkers to differentiate specific breed types, of which miR-122, miR-200, miR-483 were over-expressed and miR-328 was under-expressed in ponies compared to Warmbloods. The different miRNAs profiles, as well as the differences in their expression levels provide a foundation for more hypotheses based on the novel miRNAs discovered. Conclusions: We identified 683 novel equine miRNAs expressed in seven solid tissues, blood and serum. Additionally, our approach evidenced that such data supported identification of specific miRNAs as markers of functions related to breeds or disease tissues. Keywords: Horse, miRNA, microRNA, miRNome, Serum, sRNA-seq Background MiRNAs are endogenous ~22-nt noncoding RNAs that impact molecular mechanisms through the regulation of mRNA post-transcription and/or translation [1]. Regula- tion of gene expression by miRNAs requires direct inter- action between the mature miRNA and, most often, the 3’ untranslated region of target mRNAs. Changes in the expression pattern of a miRNA can expose novel sets of genes to its regulatory influence [2]. The great current interest in miRNAs reflects their implication in diverse developmental processes and in the pathogenesis of can- cer, cardiac, immune-related, pulmonary and other dis- eases [3]. Moreover, they are more stable, even outside a cell, compared to other long RNA molecules as they are either packed into microparticles, or protected by associ- ated RNA-binding proteins (Argonaute 2) or lipoprotein complexes, which protect them from the RNAses activ- ity [4]. Therefore, circulating miRNAs can be present in serum and other body fluids during the pathogenesis of many disorders [1]. Circulating and whole blood miRNAs (which contains cells that circulate throughout the body) profiles are thus of particular interest as promising non- invasive disease biomarkers [3, 5–8]. Over 700 miRNAs have been identified in the equine genome with distinct subsets of miRNAs differentially expressed in a tissue-specific manner [9, 10]. For example, * Correspondence: [email protected] † Equal contributors 1 Department of Clinical Veterinary Medicine, Swiss Institute of Equine Medicine, Vetsuisse Faculty, University of Bern, and Agroscope, Länggassstrasse 124, 3012 Bern, Switzerland 2 Department of Clinical Research and Veterinary Public Health, Institute of Genetics, Vetsuisse Faculty, University of Bern, Bremgartenstrasse 109A, 3012 Bern, Switzerland Full list of author information is available at the end of the article © The Author(s). 2016 Open Access This article is distributed under the terms of the Creative Commons Attribution 4.0 International License (http://creativecommons.org/licenses/by/4.0/), which permits unrestricted use, distribution, and reproduction in any medium, provided you give appropriate credit to the original author(s) and the source, provide a link to the Creative Commons license, and indicate if changes were made. The Creative Commons Public Domain Dedication waiver (http://creativecommons.org/publicdomain/zero/1.0/) applies to the data made available in this article, unless otherwise stated. Pacholewska et al. BMC Genomics (2016) 17:831 DOI 10.1186/s12864-016-3168-2

Welcome message from author
This document is posted to help you gain knowledge. Please leave a comment to let me know what you think about it! Share it to your friends and learn new things together.
Transcript

source: https://doi.org/10.7892/boris.89577 | downloaded: 21.7.2022
RESEARCH ARTICLE Open Access
Novel equine tissue miRNAs and breed-related miRNA expressed in serumAlicja Pacholewska1,2* , Núria Mach3, Xavier Mata3, Anne Vaiman3, Laurent Schibler3, Eric Barrey3†
and Vincent Gerber1†
Abstract
Background: MiRNAs regulate multiple genes at the post-transcriptional level and therefore play an important rolein many biological processes. It has been suggested that miRNA exported outside the cells contribute to inter-cellular communication. Consequently, circulating miRNAs are of particular interest and are promising biomarkersfor many diseases. The number of miRNAs annotated in the horse genome is much lower compared to modelorganisms like human and mouse. We therefore aimed to identify novel equine miRNAs for tissue types and breedin serum.
Results: We analysed 71 small RNA-seq libraries derived from nine tissues (gluteus medius, platysma, massetermuscle, heart, liver, cartilage, bone, total blood and serum) using miRDeep2 and miRdentify tools. Known miRNAsrepresented between 2.3 and 62.9 % of the reads in 71 libraries. A total of 683 novel miRNAs were identified. Breedand tissue type affected the number of miRNAs detected and interestingly, affected its average intensity. A total of50 miRNAs in serum proved to be potential biomarkers to differentiate specific breed types, of which miR-122, miR-200,miR-483 were over-expressed and miR-328 was under-expressed in ponies compared to Warmbloods. The differentmiRNAs profiles, as well as the differences in their expression levels provide a foundation for more hypotheses basedon the novel miRNAs discovered.
Conclusions: We identified 683 novel equine miRNAs expressed in seven solid tissues, blood and serum. Additionally,our approach evidenced that such data supported identification of specific miRNAs as markers of functions related tobreeds or disease tissues.
Keywords: Horse, miRNA, microRNA, miRNome, Serum, sRNA-seq
BackgroundMiRNAs are endogenous ~22-nt noncoding RNAs thatimpact molecular mechanisms through the regulation ofmRNA post-transcription and/or translation [1]. Regula-tion of gene expression by miRNAs requires direct inter-action between the mature miRNA and, most often, the3’ untranslated region of target mRNAs. Changes in theexpression pattern of a miRNA can expose novel sets ofgenes to its regulatory influence [2]. The great current
interest in miRNAs reflects their implication in diversedevelopmental processes and in the pathogenesis of can-cer, cardiac, immune-related, pulmonary and other dis-eases [3]. Moreover, they are more stable, even outside acell, compared to other long RNA molecules as they areeither packed into microparticles, or protected by associ-ated RNA-binding proteins (Argonaute 2) or lipoproteincomplexes, which protect them from the RNAses activ-ity [4]. Therefore, circulating miRNAs can be present inserum and other body fluids during the pathogenesis ofmany disorders [1]. Circulating and whole blood miRNAs(which contains cells that circulate throughout the body)profiles are thus of particular interest as promising non-invasive disease biomarkers [3, 5–8].Over 700 miRNAs have been identified in the equine
genome with distinct subsets of miRNAs differentiallyexpressed in a tissue-specific manner [9, 10]. For example,
* Correspondence: [email protected]†Equal contributors1Department of Clinical Veterinary Medicine, Swiss Institute of EquineMedicine, Vetsuisse Faculty, University of Bern, and Agroscope,Länggassstrasse 124, 3012 Bern, Switzerland2Department of Clinical Research and Veterinary Public Health, Institute ofGenetics, Vetsuisse Faculty, University of Bern, Bremgartenstrasse 109A, 3012Bern, SwitzerlandFull list of author information is available at the end of the article
© The Author(s). 2016 Open Access This article is distributed under the terms of the Creative Commons Attribution 4.0International License (http://creativecommons.org/licenses/by/4.0/), which permits unrestricted use, distribution, andreproduction in any medium, provided you give appropriate credit to the original author(s) and the source, provide a link tothe Creative Commons license, and indicate if changes were made. The Creative Commons Public Domain Dedication waiver(http://creativecommons.org/publicdomain/zero/1.0/) applies to the data made available in this article, unless otherwise stated.
Pacholewska et al. BMC Genomics (2016) 17:831 DOI 10.1186/s12864-016-3168-2
horse specific miRNA in cartilage and bone have beenalready reported [10] and the existence of hundreds ofhorse specific transcripts may suggest the existence ofmore horse specific miRNAs [11]. Due to their strongsequence conservation, a majority of equine maturemiRNAs have been perfectly matched to human miRNAs[4, 12]. The fact that many human miRNAs have been as-sociated with human diseases indicates the potential ofinvestigating miRNA profiles in equine pathologicconditions. However, the number of miRNAs studiedand annotated in the equine genome is still muchlower (n = 771) compared to human (n = 2,813) ormouse (n = 2,045) genomes, according to miRBase v.21[13]. Moreover, some miRNA may be expressed in abreed-specific manner [14].Current technology, i.e. small RNA sequencing
(sRNA-seq), is able to provide a comprehensive study todetermine the precise extend of miRNA profiles inhorse. Taking into account the specific biogenesis ofmiRNA it is possible to distinguish short sequences thatmay be derived from degraded mRNA and not from truemiRNA sequences [15]. The secondary structure of pre-mature miRNA resembles a hairpin, which is then proc-essed by the endonuclease Dicer to form miRNA du-plexes. MiRNAs in either the 5’ or 3’ end of theirprecursors are loaded into an RNA-induced silencingcomplex, which yields functional miRNAs. The loop andstar sequences are usually degraded and therefore thehighest coverage of the reads is expected within the ma-ture miRNA region [15].In this study we used combined high-throughput se-
quencing and bioinformatics methods to identify equinegenome miRNAs. MiRNA profiles were thoroughly ana-lysed by combining small RNA sequencing for multipletissues to search for novel equine circulating and tissue-specific miRNAs. We prepared a total of 71 sRNA-seqlibraries from six solid tissues, blood and serum fromequine samples. Two different algorithms were appliedto support the authenticity of the identified miRNAs:miRDeep2 [16] and the more stringent, miRdentify [17].Given the miRNA’s fundamental role in transcriptionaland translational regulation in different pathologies, wecompared the expression profile of miRNA derived fromgluteus medius (GM) muscle of healthy horses andhorses affected with polysaccharide storage myopathytype I (PSSM). We also hypothesized that the identifica-tion of differences in the serum miRNA expressionprofile between Warmbloods and ponies could revealunique biomarkers of equine breeds.
ResultsSmall RNA sequencing and mappingWe obtained small RNAs reads derived from 49 (HiSeq)and 22 (SOLiD) libraries. SOLiD samples were prepared
from platysma, masseter and gluteus medius muscles,heart, liver, cartilage, bone and blood of 35 horses.MiRNA from the platysma and masseter muscles, heartand liver were extracted from 15 healthy horses of differ-ent ages and breeds (collected at the slaughterhouse).The HiSeq samples included serum RNA samples from44 Warmbloods horses and five ponies (four Shetlandand one Welsh pony). More details are given in Additionalfile 1: Table S1.After quality filtering for low quality reads and trim-
ming for adaptors sequences (see Methods for details),HiSeq data from serum consisted of a total of 12 Mreads on average with mean per sequence quality of 38in the Phred scale [18] per library. In these libraries, thesize distribution followed the RNA length distributionreported in other equine and bovine serum samples[19, 20], with the majority of the reads (78 %) fallinginto piwi-interacting RNA region (30–32 nt) and witha smaller peak (4 %) in the mature miRNA region(22–23 nt). On the other hand, after removal of low-quality reads, the flanking linker and primer se-quences, SOLiD data comprised 8 M reads on averagewith mean per sequence quality of 27 in the Phred scaleper library. The reads longer than 30 nt were filtered outto exclude short fragments potentially derived from de-graded cellular mRNA (see Methods) and finally the ma-jority of the reads (77 %) were 21–23 nt long.All remaining small RNAs from HiSeq and SOLiD
data (748 M sequencing reads; 11 M on average perlibrary) were aligned to the Equus caballus referencegenome (EquCab2; v2.74) with BowTie [21]. Overall,91 % of reads were mapped, but 336 M (45 %) were fil-tered out due to multiple mapping (more than 5 hits).After collapsing reads that had identical sequence(346 M tags; 46 %), 253,000 unique sequences were ob-tained per library on average (Fig. 1). Only 0.39 % ofreads mapped to exonic regions of the protein-codinggenes (coding DNA sequences; CDSs), 38 % mapped to5’ untranslated regions (UTR), and 18 % mapped to in-trons (Fig. 2). The fraction of reads mapped to repeat el-ements, rRNAs, tRNAs, other noncoding RNA andrepeated-related regions ranged from 12.7–93.4 %.From 2.3 to 62.9 % (18.8 % on average) sequencing
reads per library mapped to the known miRNA genes inagreement with the miRNA biogenesis [15]: most readsmapped mature -3p and -5p sequences of the miRNAs(Additional file 2: Figure S1).
Novel equine miRNA discoveryTwo complementary algorithms were used to identifymiRNAs in equine tissues: i) miRDeep2; and ii) miR-dentify. Briefly, we used equine known mature andhairpin structure and human mature sequences asguidance (miRBase v. 2); and minimum miRDeep
Pacholewska et al. BMC Genomics (2016) 17:831 Page 2 of 15
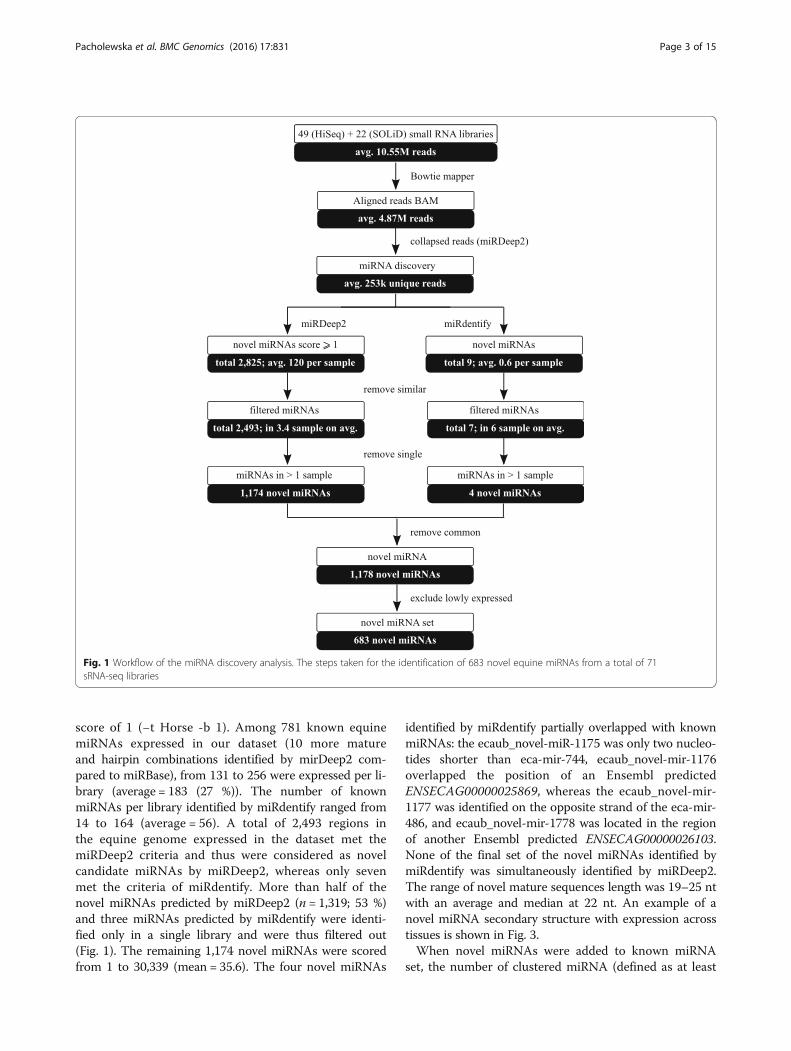
score of 1 (−t Horse -b 1). Among 781 known equinemiRNAs expressed in our dataset (10 more matureand hairpin combinations identified by mirDeep2 com-pared to miRBase), from 131 to 256 were expressed per li-brary (average = 183 (27 %)). The number of knownmiRNAs per library identified by miRdentify ranged from14 to 164 (average = 56). A total of 2,493 regions inthe equine genome expressed in the dataset met themiRDeep2 criteria and thus were considered as novelcandidate miRNAs by miRDeep2, whereas only sevenmet the criteria of miRdentify. More than half of thenovel miRNAs predicted by miRDeep2 (n = 1,319; 53 %)and three miRNAs predicted by miRdentify were identi-fied only in a single library and were thus filtered out(Fig. 1). The remaining 1,174 novel miRNAs were scoredfrom 1 to 30,339 (mean = 35.6). The four novel miRNAs
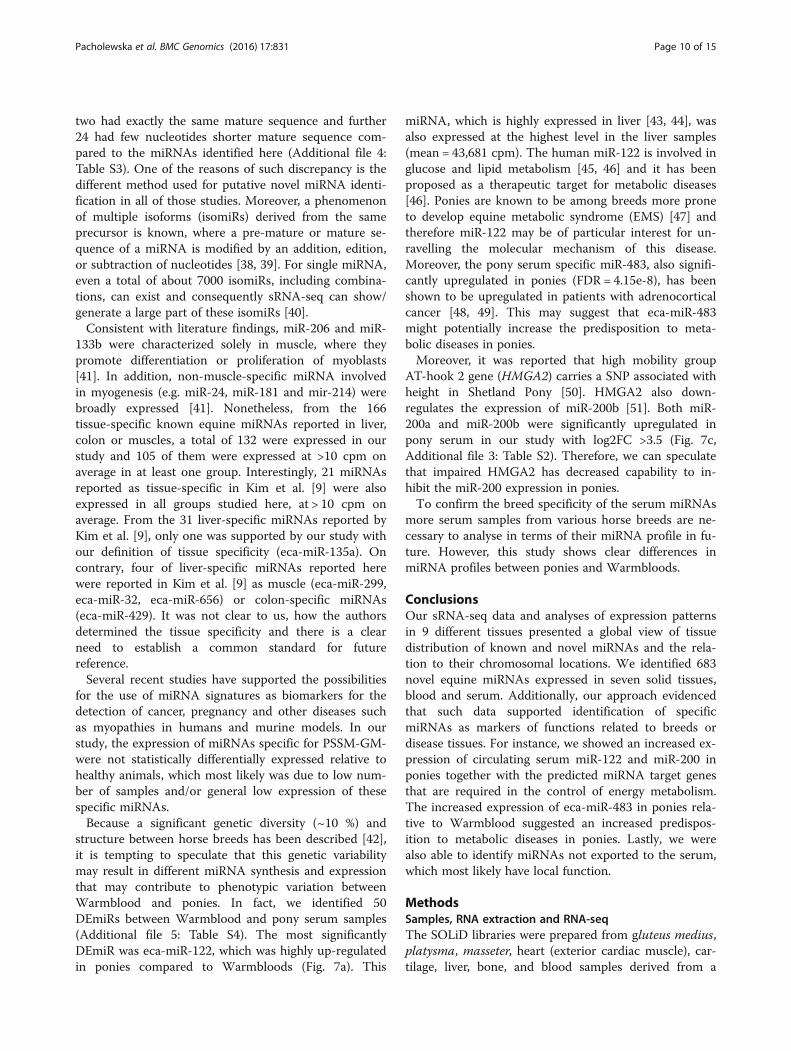
identified by miRdentify partially overlapped with knownmiRNAs: the ecaub_novel-miR-1175 was only two nucleo-tides shorter than eca-mir-744, ecaub_novel-mir-1176overlapped the position of an Ensembl predictedENSECAG00000025869, whereas the ecaub_novel-mir-1177 was identified on the opposite strand of the eca-mir-486, and ecaub_novel-mir-1778 was located in the regionof another Ensembl predicted ENSECAG00000026103.None of the final set of the novel miRNAs identified bymiRdentify was simultaneously identified by miRDeep2.The range of novel mature sequences length was 19–25 ntwith an average and median at 22 nt. An example of anovel miRNA secondary structure with expression acrosstissues is shown in Fig. 3.When novel miRNAs were added to known miRNA
set, the number of clustered miRNA (defined as at least
Fig. 1 Workflow of the miRNA discovery analysis. The steps taken for the identification of 683 novel equine miRNAs from a total of 71sRNA-seq libraries
Pacholewska et al. BMC Genomics (2016) 17:831 Page 3 of 15

2 miRNAs within 3000 distance [22]) increased from 53to 86, from which 15 could be identified among novelmiRNAs separately.
Equine miRNA expressionFor the known and discovered putative miRNAs, we in-vestigated their expression levels in the small RNA li-braries. A total of 2,093 unique combination of matureand hairpin sequences were expressed in our dataset(one mature miRNA may derive from more than onehairpin, also one or two mature miRNA derive from asingle hairpin structure [4]). The mean expression oftrimmed means of M values (TMM) of known (miRBase,release 21) and novel miRNAs ranged from 0 to 140,700count per million (cpm), with an average of 0.64 cpmper miRNA. We then removed lowly expressed miRNAs(<1 cpm in 90 % samples), as they seem to play minorroles in gene expression regulation [23–25]. We detected965 distinct mature miRNAs (280 known and 685 novel)expressed from 951 unique hairpin sequences (268known and 683 novel) by combining the results fromthe two approaches. In total, there were 1,080 uniquecombinations (mature miRNA expressed from hairpin)with variable expression levels (0.20 to 140,700 cpm;median = 1.96 cpm) in at least one small RNA library.Among the 965 mature miRNAs, we observed that
miR-486 was the most abundant, together with a pu-tative novel miRNA identified in the opposite strandof miR-486, which was given here an identifier nameecaub_miR_1177. These two miRNAs were highlyexpressed in serum and blood samples compared toother tissues (false discovery rate (FDR) = 1.05e-59and 3.72e-60, respectively; Additional file 3: Table S2).The highest number of novel miRNAs was identifiedon chromosome 1 (n = 54) and only five novelmiRNA were identified on chromosome 27 (Fig. 4).Among the 683 novel miRNAs, 334 (50 %) were tran-scribed from the sense (+) strand of the DNA (Additionalfile 4: Table S3). After removal of the lowly expressedmiRNAs, the length of the final set of novel maturemiRNAs ranged from 20 to 25 nt with median at22 nt.
Tissue/breed specific miRNAsMiRNAs expression patterns differ for specific tissuesdifferentiation states and health status. Multi-dimensionalscaling MDS showed that samples clustered according tothe tissue (Fig. 5), rather than by individual, thus prefigur-ing a relevant scenario to draw tissue-specific miRNAexpression profiles [26].MiRNAs expressed at moderate to high level (≥10 cpm)
in 90 % of libraries from the same tissue or breed (serum
0.0
0.1
0.2
0.3
0.4
0.5
0.6
0.7
Tota
l tag
per
cen
tag
e
CDS_Exo
ns
p5_UTR_E
xons
p3_UTR_E
xons
Intro
ns
TSS_up_1
kb
TSS_up_5
kb
TSS_up_1
0kb
TES_down_1
kb
TES_down_5
kb
TES_down_1
0kb
Fig. 2 Distribution of reads mapped within 10 kb up- and downstream of the gene coding regions. The percentage of reads per library mappedto coding DNA sequences (CDS), 5’ and 3’ untranslated regions (UTR), introns, and within 1, 5, and 10 kb upstream of the transcription start site(TSS) and downstream of the transcription end site regions of the coding genes is shown across all samples. Known miRNA genes were excludedfrom this analysis
Pacholewska et al. BMC Genomics (2016) 17:831 Page 4 of 15

samples) were considered as expressed in the particulargroup (tissue/breed). From here on, we will refer tomiRNAs expressed in only one group as tissue/breed spe-cific miRNAs. Subsequently, we further explored miRNAsexhibiting differential expression between all muscle tis-sues together, blood and serum together, liver, bone andcartilage. The 562 miRNAs (317 novel mature miRNAs)
expressed at > 10 cpm on average in at least one tissuepresented different expression distribution: almost half ofthe miRNAs were expressed only in one tissue (42 %;44 % novel), 4 % (liver) to 11 % (muscles) were expressedin a single tissue, and about 19 % in all the tissues:muscles, liver, cartilage, bone, and circulating (serum orblood) (Fig. 6a). The number of tissue-specific miRNAs
5' ac g a u g a u g a u
g g u g g u g a a g au g g g
uu
gccuu
uuucuucaucau
aaucaucauuga
ca3'
ecaub_novel-miR-74
acgaugaugaugguggugaagauggguugccuuuuucuucaucauaaucaucauugaca -3'5'-
.((((((((((.((((((((((.(((...)))...)))))))))).))))))))))...
ecaub_novel-mir-74
A
B
C
05
1015
2025
3035
ecaub_novel−miR−74
No
rmal
ized
co
un
ts [
cpm
]
PSSM_GM
blood
bone
carti
lage
health
y_GM
heart
liver
mas
sete
r
platys
ma
seru
m
Fig. 3 An example of novel miRNA structure and expression across tissues. The secondary structure of ecaub_novel-mir-74 predicted withRNAfold in a graphical (a) and Vienna format (b). The mature miRNA sequence is indicated in red. Boxplots represent the expression levels ofecaub_novel-miR-74 across the 10 tissues studied (c)
Pacholewska et al. BMC Genomics (2016) 17:831 Page 5 of 15

discovered was similar and ranged from 23 (liver) to 63(muscles) as shown in Fig. 6a.Among muscles, the heart muscle had the highest
number of specific miRNAs (n = 58) (Fig. 6b). Only 108miRNAs were expressed in all the tissues at the levelof > 10 cpm on average and among those only 14 werenovel miRNAs. The group specific miRNAs expressed at>100 cpm on average are listed in Table 1. As depictedin the Fig. 5, the MDS plot revealed miRNA expression
dissimilarity between healthy GM and PSSM GM. Moreprecisely, we identified five miRNAs expressed at thelevel > 10 cpm solely in PSSM GM muscle: eca-miR-144,eca-miR-20b, ecaub_novel-miR-472, ecaub_novel-miR-568, and ecaub_novel-miR-892. The miR-144 was alsoexpressed at >10 cpm level in bone and eca-miR-20b inbone and liver (Additional file 3: Table S2). However, noneof the miRNAs was significantly up- or down-regulated inPSSM compared to healthy GM even at FDR < 0.1.
Nu
mb
er o
f n
ovel
miR
NA
s
010
2030
4050
chr1
chr2
chr3
chr4
chr5
chr6
chr7
chr8
chr9
chr1
0ch
r11ch
r12ch
r13ch
r14ch
r15ch
r16
chr1
7ch
r18ch
r19ch
r20
chr2
1ch
r22ch
r23
chr2
4ch
r25ch
r26
chr2
7ch
r28ch
r29ch
r30ch
r31
chrX
Unplaced
Fig. 4 Novel miRNA distribution across chromosomes. The number of novel miRNA identified per chromosome. Unplaced scaffolds are shown asone chromosome “Unplaced”
Fig. 5 Multi-dimensional scaling plot of the RNA samples sequenced. The distances correspond to leading average (root-mean-square) of thelargest absolute log-fold-changes between each pair of samples [26]
Pacholewska et al. BMC Genomics (2016) 17:831 Page 6 of 15

Close to one third (n = 69; 33 %) of the miRNAsexpressed in blood were also expressed in serum,whereas 20 miRNAs could be detected only in serum(Fig. 6c). Most of these serum-specific miRNAs wereexpressed in both breeds (Warmbloods and ponies), al-though we identified two miRNAs expressed solely inWarmblood (eca-let-7f, eca-miR-361-5p) and 20 other
solely in ponies (Fig. 6d). Interestingly, among theseserum-specific miRNAs expressed solely in ponies waseca-miR-483 that was expressed at >100 cpm on average(Table 1, Additional file 3: Table S2).
Differentially expressed serum miRNAsMiRNAs that showed strong specificity between Equuscaballus subspecies were determined by comparing theexpression between horse and pony serum. Age and sexdid not have effect on the miRNA expression profile,with no significantly differentially expressed miRNAs(DEmiRs), apart from one miRNA (eca-miR-8908j) thatpassed the lower significance threshold usually suggestedfor DEmiRs (upregulated in males with log 2 fold change(log2FC) = 4.23; FDR = 0.013). The absorbance at 414 nmhad a significant effect on the expression of eca-miR-25(FDR = 4.15e-4) and eca-miR-486-5p (FDR = 0.066) thatwas previously reported as haemolysis dependant [27].
Fig. 6 Tissue and serum breed-specific mature miRNA. The venn diagrams show the number of known mature miRNAs (black) and novel miRNAs(white) moderately or highly expressed (>10 cpm in 90 % group samples) in each condition: a tissue; b muscles; c circulating components;d breed (serum)
Table 1 Tissue-specific miRNAs and their mean expression
Tissue Mature miRNA Mean expression [cpm]
Cartilage ecaub_novel-miR-174 127.47
Cartilage ecaub_novel-miR-27 117.53
Cartilage ecaub_novel-miR-634 106.9
Liver eca-miR-193 254.72
Serum Pony eca-miR-483 247.97
The table presents tissue-specific miRNAs among tissues evaluated in thisstudy with mean expression above 100 cpm
Pacholewska et al. BMC Genomics (2016) 17:831 Page 7 of 15

We identified 50 differentially expressed (DE) miRNAs(42 known and 9 novel) between pony and Warmbloodserum at a stringent significance threshold FDR < 0.001.More than half of them (n = 35; 67 %) were upregulated inponies (range log2FC from 1.58 to 7.05), including 3 novelmiRNAs (Additional file 5: Table S4). The remaining 16miRNAs were down-regulated (range log2FC from −1.31to −6.04), including 6 novel miRNAs (Additional file 5:Table S4). The most significant up- (eca-miR-122) anddown-regulated (eca-miR-328) miRNAs in ponies relatedto Warmblood are shown on Fig. 7a-b.We next selected a total of 177 target-genes of eca-
miR-122 using TargetScan [28] and performed gene setenrichment analysis with GeneCodis [29] to assess theirbiological role. The only significant Kyoto Encyclopediaof Genes and Genomes (KEGG) pathway [30] wasglycolysis/gluconeogenesis (KEGG: 00010, correctedhypergeometric p-value, Hyp* = 0.03), which encompassedfour target genes: pyruvate kinase, muscle (PKM2),glucose-6-phosphatase, catalytic subunit (G6PC), dihydro-lipoamide S-acetyltransferase (DLAT), and aldolase A,fructose-bisphosphate (ALDOA).The downregulated eca-miR-328 had 204 potential tar-
get genes reported by TargetScan and these genes sig-nificantly enriched five KEGG pathways, from which themost significant was the regulation of actin cytoskeleton(KEGG: 04810, Hyp* = 0.01) with seven genes: fibroblastgrowth factor 1 (FGF1) and 11 (FGF11), p21 protein(Cdc42/Rac)-activated kinase 6 (PAK6), integrin alpha 5
(fibronectin receptor, alpha polypeptide) (ITGA5), v-rcksarcoma virus CT10 oncogene homolog (avian) (CRK),WAS protein family member 2 (WASF2), and FYVE,RhoGEF and PH domain containing 1 (FGD1). Theother significant pathways were: pathways in cancer(KEGG: 05200; Hyp* = 0.02); adherens junction (KEGG:04520, Hyp* = 0.02); renal cell carcinoma (KEGG: 05211;Hyp* = 0.03); and Wnt signalling pathway (KEGG:04310; Hyp* = 0.04).
DiscussionDespite high sequence conservation much less is knownabout equine miRNome compared to human or murine.Therefore, in this study we examined the expression ofknown and novel miRNAs in a comprehensive list ofnine horse tissues using 71 small RNA sequencing li-braries derived from 83 horses. The identification ofnovel miRNAs is limited by the fact that huge fractionof small RNA-seq reads is filtered out due to multiplemapping to the reference genome (n > 5 hits). Theseshort sequences with secondary structure (hairpin) areoften overlapping repeat regions [31].As a gold standard has not been established in the
field of miRNA discovery, we decided to use two report-edly well performing tools and combine the results.While 1,174 miRNAs were identified in our study bymiRDeep2, only four were identified by the more strin-gent miRdentify. The miRdentify does not use informa-tion on other species miRNA annotations and usually
Warmbloods Ponies
050
000
1000
0015
0000
2000
00
eca−miR−122
No
rmal
ized
cou
nts
[cp
m]
Warmbloods Ponies
050
010
0015
0020
0025
0030
0035
00
020
4060
8010
012
0
eca−miR−200a
No
rmal
ized
co
un
ts [
cpm
]
Warmbloods Ponies
eca−miR−328
No
rmal
ized
co
un
ts [
cpm
]
******
A B***
C
Fig. 7 Significantly differentially expressed miRNA in the serum of ponies. Normalized expression levels of the most up- (a) and down-regulated (b)miRNA in Pony compared to Warmblood serum as well as eca-miR-200a (c) that is downregulated by HMGA2
Pacholewska et al. BMC Genomics (2016) 17:831 Page 8 of 15

results in lower number of miRNAs predicted [17].Small overlap between those two tools is known and thestringent ten parameters of miRdentify discards 50 % ofhuman annotated miRNAs [17]. Whereas all the fourmiRNAs identified by miRdentify partially overlappedthe known or Ensembl predicted miRNA genes, novelmiRNAs identified by miRDeep2 often spanned unanno-tated regions of the horse genome.After removing lowly expressed miRNAs, our dataset
consisted of 683 novel miRNAs (Fig. 1), from which49 % were transcribed from the sense strand, accordinglyto known equine miRNAs that are annotated equally onboth strands (miRBase, release 21). The highest numberof novel miRNAs was identified on the largest chromo-some one, but also 40 novel miRNAs were identified onunplaced chromosomes (Fig. 4). The unplaced chromo-somes are often neglected, as it is the least annotated re-gion of the horse genome. A future EquCab3 referencegenome is believed to decrease the number of unplacedscaffolds and improve the quality of the reference gen-ome. Interestingly, we identified a putative novel miRNAencoded by the mitochondrial genome that has beenpreviously described in horse [32], however, the mitomiRwas identified only in one heart sample and was ex-cluded from further analysis.Our study aimed to identify tissue-/serum breed-
specific miRNAs and our definition of such miRNAspresumed that specific miRNA can be expressed at lowlevel (<10 cpm) in other tissues but it has to beexpressed at least at the level of 10 cpm in 90 % of thesamples of a particular tissue/breed. This approach dif-fers from other studies that were based on quantitativereverse transcription PCR (RT-qPCR) or microarraydata, where “yes/no” approach was taken. However, wehypothesize that since miRNAs can be exported andtransferred between the cells, they might appear in lowamounts in other tissues that they do not originate fromand where they are not directed to. Moreover, it hasbeen shown that only 200 miRNAs were expressed inmoderate to high levels (>10 cpm) in human brainand most likely the moderately/highly expressedmiRNA play more important role in gene expressionregulation [23–25].With our approach, we identified miRNAs that were
expressed in a tissue- and breed-specific manner(Fig. 6a). We identified a group of 108 miRNAs thatwere universally expressed at >10 cpm in 90 % of librar-ies across all the tissues studied (Fig. 6a). Such a featureidentifies this group of miRNAs as a candidate universalreference to normalize miRNA expression in normalhorse tissues. The expression pattern and tissues distri-bution of these 108 miRNAs suggest that they might beassociated with biological fundamental functions in thecell, such as metabolism. We identified 40 miRNAs that
were expressed in specific tissues with minimal or no ex-pression in other tissues we examined, suggesting morelocal function of these miRNAs that are not exportedoutside the cell. For example, eca-miR-1 and eca-miR-133a were highly expressed primarily in muscles and weobserved very little or no expression of these miRNAsin other tissues. A total of eight serum-specific miRNAs(eca-miR-1307, eca-miR-1379, eca-miR-7177b, eca-miR-9021, ecaub_novel-miR-1145, ecaub_novel-miR-262, ecaub_novel-miR-79, ecaub_novel-miR-932) wereexpressed in a tissue-specific manner, although theymay derive from other tissues not analysed in the presentstudy and therefore have to be treated with caution.The heart tissue had the most specific miRNAs among
all the muscles (Fig. 6b). The cardiac muscle is highlyspecialized tissue and is a different type compared toother skeletal muscles evaluated in this study and there-fore more specific miRNAs were expected to beexpressed in the heart tissue [33]. Moreover, manymiRNAs have been already implicated in the cardiac de-velopment and diseases [34, 35]. For such as limitednumber of libraries per group examined, several miRNAsthat were previously considered as “tissue-specific” inhumans were not detected in our data. For instance, miR-208, miR-302 (a-d), miR-367 were not detected (at>10 cpm on average) in the heart tissue; miR-134 andmiR-208a were not detected in skeletal muscles; miR-483in liver; or miR-483 and miR-377 in bone [36].We also noticed that only less than half of the
miRNAs expressed in blood (33 %) were common withserum miRNAs, suggesting that remaining 67 % ofmiRNAs is expressed in blood cells and are not exportedto serum (Fig. 6c). However, we need to take into ac-count that the serum miRNA set was derived from dif-ferent horse breed and some additional breed specificdifferences may apply as we shown for serum samples inFig. 6d.Our study also provided an opportunity to re-visit and
confirm tissue-specific miRNAs previously reported inhorses. Interestingly only five novel cartilage/bonemiRNAs reported in [10] have been also identified inthis study, however, the mature miRNAs reported herewere slightly longer. Interestingly two of them were notexpressed (at >10 cpm level) in either cartilage or bone,but in blood (Additional file 3: Table S2 and Additionalfile 4: Table S3). From five most abundantly expressednovel putative miRNA reported in equine plasma by Leeet al. [37], only one miRNA was identified in our studyin bone and blood tissues with a mature sequencedshorter by three nucleotides from 5’ end. From the 329novel miRNAs reported by Kim et al. [9] only 11 hadexactly the same mature sequence as novel miRNAs re-ported here. From the 896 putative novel miRNAs in-cluded in the microarrays used by Mach et al. [32] only
Pacholewska et al. BMC Genomics (2016) 17:831 Page 9 of 15
two had exactly the same mature sequence and further24 had few nucleotides shorter mature sequence com-pared to the miRNAs identified here (Additional file 4:Table S3). One of the reasons of such discrepancy is thedifferent method used for putative novel miRNA identi-fication in all of those studies. Moreover, a phenomenonof multiple isoforms (isomiRs) derived from the sameprecursor is known, where a pre-mature or mature se-quence of a miRNA is modified by an addition, edition,or subtraction of nucleotides [38, 39]. For single miRNA,even a total of about 7000 isomiRs, including combina-tions, can exist and consequently sRNA-seq can show/generate a large part of these isomiRs [40].Consistent with literature findings, miR-206 and miR-
133b were characterized solely in muscle, where theypromote differentiation or proliferation of myoblasts[41]. In addition, non-muscle-specific miRNA involvedin myogenesis (e.g. miR-24, miR-181 and mir-214) werebroadly expressed [41]. Nonetheless, from the 166tissue-specific known equine miRNAs reported in liver,colon or muscles, a total of 132 were expressed in ourstudy and 105 of them were expressed at >10 cpm onaverage in at least one group. Interestingly, 21 miRNAsreported as tissue-specific in Kim et al. [9] were alsoexpressed in all groups studied here, at > 10 cpm onaverage. From the 31 liver-specific miRNAs reported byKim et al. [9], only one was supported by our study withour definition of tissue specificity (eca-miR-135a). Oncontrary, four of liver-specific miRNAs reported herewere reported in Kim et al. [9] as muscle (eca-miR-299,eca-miR-32, eca-miR-656) or colon-specific miRNAs(eca-miR-429). It was not clear to us, how the authorsdetermined the tissue specificity and there is a clearneed to establish a common standard for futurereference.Several recent studies have supported the possibilities
for the use of miRNA signatures as biomarkers for thedetection of cancer, pregnancy and other diseases suchas myopathies in humans and murine models. In ourstudy, the expression of miRNAs specific for PSSM-GM-were not statistically differentially expressed relative tohealthy animals, which most likely was due to low num-ber of samples and/or general low expression of thesespecific miRNAs.Because a significant genetic diversity (~10 %) and
structure between horse breeds has been described [42],it is tempting to speculate that this genetic variabilitymay result in different miRNA synthesis and expressionthat may contribute to phenotypic variation betweenWarmblood and ponies. In fact, we identified 50DEmiRs between Warmblood and pony serum samples(Additional file 5: Table S4). The most significantlyDEmiR was eca-miR-122, which was highly up-regulatedin ponies compared to Warmbloods (Fig. 7a). This
miRNA, which is highly expressed in liver [43, 44], wasalso expressed at the highest level in the liver samples(mean = 43,681 cpm). The human miR-122 is involved inglucose and lipid metabolism [45, 46] and it has beenproposed as a therapeutic target for metabolic diseases[46]. Ponies are known to be among breeds more proneto develop equine metabolic syndrome (EMS) [47] andtherefore miR-122 may be of particular interest for un-ravelling the molecular mechanism of this disease.Moreover, the pony serum specific miR-483, also signifi-cantly upregulated in ponies (FDR = 4.15e-8), has beenshown to be upregulated in patients with adrenocorticalcancer [48, 49]. This may suggest that eca-miR-483might potentially increase the predisposition to meta-bolic diseases in ponies.Moreover, it was reported that high mobility group
AT-hook 2 gene (HMGA2) carries a SNP associated withheight in Shetland Pony [50]. HMGA2 also down-regulates the expression of miR-200b [51]. Both miR-200a and miR-200b were significantly upregulated inpony serum in our study with log2FC >3.5 (Fig. 7c,Additional file 3: Table S2). Therefore, we can speculatethat impaired HMGA2 has decreased capability to in-hibit the miR-200 expression in ponies.To confirm the breed specificity of the serum miRNAs
more serum samples from various horse breeds are ne-cessary to analyse in terms of their miRNA profile in fu-ture. However, this study shows clear differences inmiRNA profiles between ponies and Warmbloods.
ConclusionsOur sRNA-seq data and analyses of expression patternsin 9 different tissues presented a global view of tissuedistribution of known and novel miRNAs and the rela-tion to their chromosomal locations. We identified 683novel equine miRNAs expressed in seven solid tissues,blood and serum. Additionally, our approach evidencedthat such data supported identification of specificmiRNAs as markers of functions related to breeds ordisease tissues. For instance, we showed an increased ex-pression of circulating serum miR-122 and miR-200 inponies together with the predicted miRNA target genesthat are required in the control of energy metabolism.The increased expression of eca-miR-483 in ponies rela-tive to Warmblood suggested an increased predispos-ition to metabolic diseases in ponies. Lastly, we werealso able to identify miRNAs not exported to the serum,which most likely have local function.
MethodsSamples, RNA extraction and RNA-seqThe SOLiD libraries were prepared from gluteus medius,platysma, masseter, heart (exterior cardiac muscle), car-tilage, liver, bone, and blood samples derived from a
Pacholewska et al. BMC Genomics (2016) 17:831 Page 10 of 15

total of 35 horses of different age and breed (collected atthe slaughterhouse). Two SOLID libraries were preparedfrom two blood samples collected from one endurancehorse of Arabian breed aged of 10 years-old before andafter 2 h of training exercise at canter, respectively. NineSOLiD libraries were prepared from cartilage and sub-chondral bone explants collected in the middle trochleaof healthy stifle joint from four 6 months old Anglo-Arabian horses [10]. Two cartilage libraries were pre-pared from the same set of three horses, however, de-rived from a different sample collection. The bonelibrary also consist of pooled RNA samples derived fromthree horses. The SOLiD libraries prepared from gluteusmedius, platysma, masseter, heart and liver were derivedfrom 30 horses (12.5 ± 5.6 yo), pooled by three animalsof different breeds 15 Cob Normand, 8 French trotter, 6Selle Français, and 1 Trait du Nord. More details on thesamples can be found in Additional file 1: Table S1. Dif-ferent types of muscles were chosen to better under-stand their roles in the regulation of physiologicalprocesses and metabolism in skeletal muscles. Whilemasseter contains a type I slow oxidative fiber muscle,platysma is enriched in type IIX fast glycolytic fibermuscle and gluteus medius predominantly contains typeIIB fast glycolytic fiber. On the other hand, heart ishighly resistant to fatigue because its high content ofmitochondria, which enables continuous aerobic respir-ation via oxidative phosphorylation. After collection inthe slaughterhouse, 60 mg of tissue samples were cutin small pieces and lysed in 1 ml of Trizol reagent(Invitrogen, Cergy Pontoise, France) with ceramicbeads (Bertin technologies, St Quentin en Yvelines,France). Epiphyseal cartilage and subchondral bonewere obtained from healthy stifle joint (macroscopicalexamination at necropsy). Whole blood was sampledfrom one Arabian horse before the 160 km ride andthen again afterwards.The mirVana™ miRNA Isolation Kit (Ambion, Life
Technologies) was used to extract in parallel Total RNAand small RNA (smRNA) from tissues following themanufacturer’s protocol, whereas total blood RNA wasisolated using a PAXgene Blood RNA Kit (Qiagen),according to the manufacturer’s instructions. TotalRNA was purified using RNeasy Mini Kit (Qiagen,Courtaboeuf, France) according to the manufacturer'srecommendations. Residual genomic DNA was re-moved using DNase digestion with RNase-free DNase IAmp Grade (Invitrogen, Cergy Pontoise, France) followingthe recommended protocol. RNA concentration wasmeasured by using a NanoDrop spectrophotometer(NanoDrop Technologies, Wilmington, USA), and theRNA integrity value (RIN) was assessed by using a2100 Bioanalyzer (Agilent Technologies Inc., Santa-Clara, USA). All samples had an RNA integrity number
(RIN) > 8. For further details on SOLiD samples, prepar-ation and sequencing, see [10, 32].A total of 22 libraries were prepared: five for gluteus
medius muscle; three for heart, liver, masseter, and pla-tysma muscle; two for cartilage and blood, and one forbone. Among the five libraries prepared from gluteusmedius muscle, two were prepared from healthy muscle,three from horses affected by polysaccharide storage my-opathy, type I, PSSM. The PSSM-affected horses werediagnosed based on GYS2 genotype and histologicalexamination of glycogen digestion as described in [52, 53].Within each library, three different horses werepooled to decrease the effect of the individual vari-ability, except for the blood samples where each li-brary comes from the same animal (Additional file 1:Table S1) but the samples come from differentphysiological moments (before and after exercise [32].Approximately 200 ng of mRNA extracted from thedifferent tissues and blood were used for library con-struction following the protocol for the SOLiD TotalRNA-Seq Kit (Applied Biosystems, Life Technologies).Libraries were sequenced with 50 cycles on 5500XLSeries Genetic Analysis System at the Metaquant corefacility (INRA, Jouy-en-Josas, France).The serum samples were collected from 31 Swiss and
13 other European Warmblood horses (22 males and 22females, aged 6–32 years, average = 18 years), and fourShetland and one Welsh pony (three males and two fe-males, aged 5–19 years, average = 12 years). Briefly,blood was collected from jugular vein into sodium-heparin-containing vacutainers [54]. Within 1–6 hserum was separated from cells via centrifugation 1800 gfor 20 min. Serum was then transferred to new tubesand stored in −80 °C until RNA extraction (up to4 years). In order to verify the level of haemolysis inserum samples we used VersaMax ELISA MicroplateReader (Molecular Devices) and SoftMax Pro software(version 3.1.2). The absorbance in 200 μl of serumwas measured at 414 nm wavelength, which is thelength of maximum absorbance for haemoglobin [55, 56].The RNA was extracted from 2 ml of serum usingmiRNeasy serum/plasma kit as described in [20]. Theconcentration of RNA extracted was measured withQubit RNA High Sensitivity kit and ranged from 2 to428 ng/μl (20 ng/μl on average). Twelve samples wererandomly chosen for the small RNA length distribu-tion assay with Bioanalyzer 2100 small RNA chip.The miRNA in small RNA content of these 12 sam-ples ranged from 69 to 89 % (81 % on average). TheRNA was successfully converted into single-end li-braries with NEBNext Multiplex Small RNA LibraryPrep Set for Illumina (New England BioLabs) and se-quenced on an Illumina HiSeq 2500 with 50 sequen-cing cycles.
Pacholewska et al. BMC Genomics (2016) 17:831 Page 11 of 15

Data pre-processingThe raw sequencing reads from each library were checkfor quality with FASTQC v. 0.11.2 [57]. The sequencingdata was processed in the following manner: 1) multipleadapter sequences were trimmed with cutadapt (v. 1.8)with the following options: -c -a ‘adapter sequence’ -m18 -M 30 –trim-n -q 15,10 [58] for SOLiD data; or–trim-n -b ‘sample specific adapter sequence’ -m 15 forHiSeq data; 2) trimmed reads were mapped to the Equuscaballus reference genome EquCab2 v2.74 [59] withBowTie (v. 0.12.9) [21] with the following options: -n1 -l 8 -a -m 5 –best –strata (for colour-space SOLiDreads additional options were used: -c –col-keepends).We required small RNAs to map with one base mis-matches as recommended in [60]. Reads mappingmore than five times to the genome were discarded.The mapping quality and read distribution was ana-lysed with RSeQC (v. 2.6.1) [61]. We inspected theread distribution among: i) known equine genes withoutmiRNA genes (Ensembl, release 81); ii) known equinemiRNA genes; iii) repeating elements annotated in horsegenome (based on RepeatMasker [62, 63]). Known equineand human miRNA mature and hairpin sequences weredownloaded from miRBase, release 21 [64].The pre-processed mapped reads in BAM format were
deposited at the European Nucleotide Archive (http://www.ebi.ac.uk/ena/data/view/PRJEB14485).
miRNA discoveryWe used two different tools for miRNA discovery: (i)miRDeep2 (v. 0.0.7) [15, 16] and (ii) miRdentify (v. 1.0),which is high stringency predictor [17]. The miRNAidentification analysis was performed independently ineach sample to allow for authentic detection of miRNAs.The high-quality sequencing reads were used as inputdata. Briefly, the miRDeep2 algorithm excises the sRNAsequence and computes their secondary RNA structurewith RNAfold [65] to predict miRNA precursors that arelater scored for their likelihood [15]. A total miRDeep2score was designated based on an algorithm incorporat-ing the statistics of read positions, read frequencieswithin stem-loops, and posterior probability that thestem-loop was derived from an authentic miRNA. Toprevent false positive detection of miRNA stem-loops,the signal-to-noise ratios estimated over 100 rounds ofindependent permutations were calculated for differentmiRDeep log-odds score cut-offs from −10 to 10. For aprediction of potential horse specific RNAs, a criterionof miRDeep score of 1 was adopted as a cut-off point.Therefore, all precursors with total miRDeep scoresabove the cut-off point were considered as putativemiRNAs. The miRDeep2 tool allows for guided searchfor novel miRNA with an optional set of miRNAs froma related species. As the miRNA annotations in horse
genome are relatively poor, we used the most compre-hensive set of human miRNAs as guidance. Knownequine miRNAs were obtained from the miRBasedatabase, release 21 [13]. In addition, human knownmiRNAs from miRBase were used as “related species”set of miRNAs. The putative miRNA identified by themiRDeep2 program or miRdentify that did not show asignificant match to miRBase were regarded as novelmiRNAs. The miRdentify tool applies 10 additional pa-rameters: heterogeneity at both 5’ and 3’ ends (low het-erogeneity is expected), 5’ and 3’ arm overhang (twonucleotide 3’ overhangs at both ends), duplex and flank-ing sequence minimal free energy (MFE; lower MFE isdesirable), nucleotide and structural entropy (higherdegree of nucleotide entropy and lower structuralcomplexity of the hairpin are desirable), tailing (highlevel of tailing with adenosine or uridine); and multi-map factors (reads with more than four genomic hitsare discarded) [17].The miRNAs were identified for each sample separ-
ately. MiRNA that differed only by additional two nucle-otides at the start/end position were considered as asingle miRNA and the miRNA that was identified in thehighest number of samples or had a higher miRDeep2score was chosen as a representative and most likely truemiRNA. Novel miRNA identified in one sample onlywere filtered out.We then combined the novel and known miRNA and
the miRNA expression for each sample was determinedwith miRDeep2 quantifier tool [16]. Mature miRNAsexpressed at < 1 cpm in 90 % of samples were filteredout. Then, miRNAs expressed at ≥ 10 cpm in 90 % ofgroup samples were considered as expressed in thegroup analysed (tissue/breed). To analyse whethermiRNAs were ubiquitously expressed among the tar-geted tissues, a Venn diagram was plotted by using“venn.diagram” function from VennDiagram R package.
Differential expression analysis of serum samplesThe MDS plots, which measure the differences be-tween samples and project it into two dimensions,were through the “MDSplot” function of edgeR pack-age. The estimated raw counts of each miRNA frommiRDeep2 output were used for the differential ex-pression analysis using edgeR package. To avoid in-clusion of miRNAs containing too few reads, asrecommended by authors of the package, only maturemiRNAs with the expression > 10 cpm in 90 % of thesamples were kept for the analysis. In order to dis-cover biologically important changes in expression,the TMM normalization method [66] of edgeR pack-age was applied (“calcNormFactors” function) and thedispersions were calculated based on the quantile-ad-justed conditional maximum likelihood (“estimateDisp”
Pacholewska et al. BMC Genomics (2016) 17:831 Page 12 of 15

function). The differentially expressed (DE) genes were de-tected by applying an exact test [67]. The edgeR generateda fold change for each miRNA, P-values and the associ-ated Benjamin-Hochberg false discovery rate (FDR)values. MiRNAs showing a FDR < 0.001 were consideredas DE.
Biological interpretation of the analysisThe potential targets of tissue and serum breed-specificmiRNAs were identified using TargetScan (release 6.2)[28] and subjected for gene set enrichment analysis withGeneCodis [29] to infer the main biological functions as-sociated the different tissues. We used KEGG pathwaysannotated for human, as equine annotations were notavailable.
Additional files
Additional file 1: Table S1. RNA sample description. An Excel tablewith details on RNA samples used for library preparation. For each libraryhorse ID, tissue, breed, age, sex, and absorbance at 414 nm (only serumsamples) are given. (XLSX 17 kb)
Additional file 2: Figure S1. miRNA gene body coverage. The readcoverage of known miRNAs genes per library. On the Y axis coveragemeasured by Pearson’s skewness coefficients. All transcripts were scaledinto 100 nt and the length is denoted on the X axis (RSeQC v.2.6.1).(PDF 33 kb)
Additional file 3: Table S2. Known and novel miRNAs expressionvalues. An Excel table with normalized count per million values (cpm) foreach of the known and novel miRNAs expressed at > 1 cpm in 90 % ofsamples. (XLSX 519 kb)
Additional file 4: Table S3. Novel miRNA characteristics. An Excel tablewith novel miRNAs identified in this study. Mature miRNA sequences,genomic coordinates of the hairpins, strand and miRDeep2 score aregiven. (XLSX 85 kb)
Additional file 5: Table S4. Differentially expressed miRNAs in ponyserum compare to Warmbloods. An Excel table with log 2 fold changesand false discovery rates of genes significantly differentially expressed inserum derived from 4 Shetland and one Welsh pony in comparison to 44Warmbloods. (XLSX 11 kb)
AbbreviationsCDS: Coding DNA sequences; cpm: Count per million; FDR: False discoveryrate; GM: Gluteus medius; Hyp*: Corrected hypergeometric p-value;KEGG: Kyoto Encyclopedia of Genes and Genomes; MDS: Multi-dimensionalscaling; miRNA: Micro RNA; PSSM: Polysaccharide storage myopathy type I;rRNA: Ribosomal RNA; RT-qPCR: Quantitative reverse transcription polymerasechain reaction; sRNA-seq: Small RNA sequencing; TMM: Trimmed means of Mvalues; tRNA: Transfer RNA; UTR: Untranslated region
AcknowledgementsThe authors would like to thank all participating horse owners andveterinarians for their support of this study. We would like to thank also ourcolleagues involved in the sample collection and experimental part of theexperiment: Simone Lanz, Helen Rettmer, Lucia Unger, and Nathalie Fouché.We also appreciate the support of the Next Generation Sequencing Platformof the University of Bern and the Vital-IT high-performance computing centreof the Swiss Institute of Bioinformatics (http://www.vital-it.ch/). We are gratefulto Laurence Wimel from the IFCE experimental station for its help.
FundingThe presented study was funded by Swiss National Science Foundation:grant No. 31003A-162548/1; Swiss Institute of Equine Medicine Research; andAgence Nationale de la Recherche (ANR-09-GENM-006).
Availability of data and materialsThe pre-processed mapped reads in BAM format were deposited at theEuropean Nucleotide Archive (http://www.ebi.ac.uk/ena/data/view/PRJEB14485).
Authors’ contributionsAP, TL, EB, VG conceived and designed the experiments; XM, AV, LS and APperformed the experiments; AP and NM analysed the data; AP, NM, TL, EB,VJ, and VG wrote the manuscript. All authors read and approved the finalmanuscript.
Competing interestsThe authors declare that they have no competing interests.
Consent for publicationNot applicable.
Ethics approvalAll animal experiments were performed according to the local regulationsand with the consent of the horse owners. This study was approved by theAnimal Experimentation Committee of the Canton of Bern, Switzerland(BE33/07, BE58/10 and BE10/13) and by the Animal Care Committee ofVetAgro Sup, which abides by the requirements of the directive 86/609 ofthe European Community Council (number 0964).
Author details1Department of Clinical Veterinary Medicine, Swiss Institute of EquineMedicine, Vetsuisse Faculty, University of Bern, and Agroscope,Länggassstrasse 124, 3012 Bern, Switzerland. 2Department of ClinicalResearch and Veterinary Public Health, Institute of Genetics, Vetsuisse Faculty,University of Bern, Bremgartenstrasse 109A, 3012 Bern, Switzerland. 3AnimalGenetics and Integrative Biology unit (GABI), INRA, AgroParis Tech, Universityof Paris-Saclay, 78350 Jouy-en-Josas, France.
Received: 12 July 2016 Accepted: 18 October 2016
References1. Cortez MA, Bueso-Ramos C, Ferdin J, Lopez-Berestein G, Sood AK, Calin GA.
MicroRNAs in body fluids–the mix of hormones and biomarkers. Nat RevClin Oncol. 2011;8:467–77.
2. Berezikov E. Evolution of microRNA diversity and regulation in animals. NatRev Genet. 2011;12:846–60.
3. Chen X, Ba Y, Ma L, Cai X, Yin Y, Wang K, Guo J, Zhang Y, Chen J, Guo X,Li Q, Li X, Wang W, Zhang Y, Wang J, Jiang X, Xiang Y, Xu C, Zheng P,Zhang J, Li R, Zhang H, Shang X, Gong T, Ning G, Wang J, Zen K,Zhang J, Zhang C-Y. Characterization of microRNAs in serum: a novelclass of biomarkers for diagnosis of cancer and other diseases. Cell Res.2008;18:997–1006.
4. van der Kolk JH, Pacholewska A, Gerber V. The role of microRNAs in equinemedicine: a review. Vet Q. 2015;35:88–96.
5. Liang H, Gong F, Zhang S, Zhang C-Y, Zen K, Chen X. The origin, function,and diagnostic potential of extracellular microRNAs in human body fluids.Wiley Interdiscip Rev RNA. 2014;5:285–300.
6. Brase JC, Wuttig D, Kuner R, Sültmann H. Serum microRNAs as non-invasivebiomarkers for cancer. Mol Cancer. 2010;9:306.
7. Mar-Aguilar F, Mendoza-Ramírez JA, Malagón-Santiago I, Espino-Silva PK,Santuario-Facio SK, Ruiz-Flores P, Rodríguez-Padilla C, Reséndez-Pérez D.Serum circulating microRNA profiling for identification of potential breastcancer biomarkers. Dis Markers. 2013;34:163–9.
8. Alevizos I, Illei GG. MicroRNAs as biomarkers in rheumatic diseases. Nat RevRheumatol. 2010;6:391–8.
9. Kim MC, Lee SW, Ryu DY, Cui FJ, Bhak J, Kim Y. Identification andCharacterization of microRNAs in normal equine tissues by next generationsequencing. PLoS One. 2014;9:e93662.
Pacholewska et al. BMC Genomics (2016) 17:831 Page 13 of 15
10. Desjardin C, Vaiman A, Mata X, Legendre R, Laubier J, Kennedy SP, Laloe D,Barrey E, Jacques C, Cribiu EP, Schibler L. Next-generation sequencingidentifies equine cartilage and subchondral bone miRNAs and suggeststheir involvement in osteochondrosis physiopathology. BMC Genomics.2014;15:798.
11. Pacholewska A, Drögemüller M, Klukowska-Rötzler J, Lanz S, Hamza E,Dermitzakis ET, Marti E, Gerber V, Leeb T, Jagannathan V. The transcriptomeof equine peripheral blood mononuclear cells. PLoS One. 2015;10:e0122011.
12. Buza T, Arick M, Wang H, Peterson DG. Computational prediction of diseasemicroRNAs in domestic animals. BMC Res Notes. 2014;7:403.
13. Griffiths-Jones S, Grocock RJ, van Dongen S, Bateman A, Enright AJ.miRBase: microRNA sequences, targets and gene nomenclature. NucleicAcids Res. 2006;34(Database issue):D140–4.
14. Li J, Chen Z, Zhao J, Fang L, Fang R, Xiao J, Chen X, Zhou A, Zhang Y, Ren L,Hu X, Zhao Y, Zhang S, Li N. Difference in microRNA expression and editingprofile of lung tissues from different pig breeds related to immune responsesto HP-PRRSV. Sci Rep. 2015;5:9549.
15. Friedländer MR, Chen W, Adamidi C, Maaskola J, Einspanier R, Knespel S,Rajewsky N. Discovering microRNAs from deep sequencing data usingmiRDeep. Nat Biotechnol. 2008;26:407–15.
16. Friedländer MR, MacKowiak SD, Li N, Chen W, Rajewsky N. MiRDeep2accurately identifies known and hundreds of novel microRNA genes inseven animal clades. Nucleic Acids Res. 2012;40:37–52.
17. Hansen TB, Venø MT, Kjems J, Damgaard CK. MiRdentify: High stringencymiRNA predictor identifies several novel animal miRNAs. Nucleic Acids Res.2014;42:e124.
18. Ewing B, Green P. Base-calling of automated sequencer traces using phred.II. error probabilities. Genome Res. 1998;8:186–94.
19. Spornraft M, Kirchner B, Haase B, Benes V, Pfaffl MW, Riedmaier I.Optimization of Extraction of Circulating RNAs from Plasma – EnablingSmall RNA Sequencing. PLoS One. 2014;9:e107259.
20. Unger L, Fouché N, Leeb T, Gerber V, Pacholewska A. Optimized methodsfor extracting circulating small RNAs from long-term stored equine samples.Acta Vet Scand. 2016;58:1–5.
21. Langmead B, Trapnell C, Pop M, Salzberg S. Ultrafast and memory-efficientalignment of short DNA sequences to the human genome. Genome Biol.2009;10:R25.
22. Altuvia Y, Landgraf P, Lithwick G, Elefant N, Pfeffer S, Aravin A, Brownstein MJ,Tuschl T, Margalit H. Clustering and conservation patterns of humanmicroRNAs. Nucleic Acids Res. 2005;33:2697–706.
23. Hébert SS, Nelson PT. Studying microRNAs in the brain: Technical lessonslearned from the first ten years. Exp Neurol. 2012;235:397–401.
24. Romao JM, Jin W, He M, McAllister T, Guan LL. MicroRNAs in bovineadipogenesis: genomic context, expression and function. BMC Genomics.2014;15:1–15.
25. Wang Y, Jiang F, Wang H, Song T, Wei Y, Yang M, Zhang J, Kang L.Evidence for the expression of abundant microRNAs in the locust genome.Sci Rep. 2015;5:13608.
26. Robinson MD, McCarthy DJ, Smyth GK. edgeR: a Bioconductor packagefor differential expression analysis of digital gene expression data.Bioinformatics. 2010;26:139–40.
27. Shkurnikov MY, Knyazev EN, Fomicheva KA, Mikhailenko DS, Nyushko KM,Saribekyan EK, Samatov TR, Alekseev BY. Analysis of plasma microRNAassociated with hemolysis. Bull Exp Biol Med. 2016;160:748–50.
28. Lewis BP, Shih IH, Jones-Rhoades MW, Bartel DP, Burge CB. Prediction ofmammalian microRNA targets. Cell. 2003;115:787–98.
29. Tabas-Madrid D, Nogales-Cadenas R, Pascual-Montano A. GeneCodiS4: Anon-redundant and modular enrichment analysis tool for functionalgenomics. Nucleic Acids Res. 2012;40:W478–83.
30. Kanehisa M, Goto S. Kyoto Encyclopedia of Genes and Genomes. NucleicAcids Res. 2000;28:27–30.
31. Valen E, Preker P, Andersen PR, Zhao X, Chen Y, Ender C, Dueck A,Meister G, Sandelin A, Jensen TH. Biogenic mechanisms and utilizationof small RNAs derived from human protein-coding genes. Nat StructMol Biol. 2011;18:1075–82.
32. Mach N, Plancade S, Pacholewska A, Lecardonnel J, Rivière J, Moroldo M,Vaiman A, Morgenthaler C, Beinat M, Nevot A, Robert C, Barrey E. IntegratedmRNA and miRNA expression profiling in blood reveals candidate biomarkersassociated with endurance exercise in the horse. Sci Rep. 2016;6:22932.
33. Levine M, Tjian R. Transcription regulation and animal diversity. Nature.2003;424:147–51.
34. Small EM, Olson EN. Pervasive roles of microRNAs in cardiovascular biology.Nature. 2011;469:336–42.
35. Olson EN. MicroRNAs as therapeutic targets and biomarkers of cardiovasculardisease. Sci Transl Med. 2014;6:239pS4.
36. Guo Z, Maki M, Ding R, Yang Y, Zhang B, Xiong L. Genome-wide survey oftissue-specific microRNA and transcription factor regulatory networks in 12tissues. Sci Rep. 2014;4:5150.
37. Lee S, Hwang S, Yu HJ, Oh D, Choi YJ, Kim MC, Kim Y, Ryu DY. Expression ofmicroRNAs in horse plasma and their characteristic nucleotide composition.PLoS One. 2016;11:e0146374.
38. Ameres SL, Zamore PD. Diversifying microRNA sequence and function. NatRev Mol Cell Biol. 2013;14:475–88.
39. Cloonan N, Wani S, Xu Q, Gu J, Lea K, Heater S, Barbacioru C, Steptoe AL,Martin HC, Nourbakhsh E, Krishnan K, Gardiner B, Wang X, Nones K, Steen JA,Matigan N, Wood DL, Kassahn KS, Waddell N, Shepherd J, Lee C, Ichikawa J,McKernan K, Bramlett K, Kuersten S, Grimmond SM. MicroRNAs and theirisomiRs function cooperatively to target common biological pathways.Genome Biol. 2011;12:R126.
40. Pfaffl MW, Kirchner B. Limitations and Challenges in MicroGenomics. Whatwe can learn from single-cell and exosome expression profiling? In:International Symposium on Microgenomics. 2016.
41. Eisenberg I, Alexander MS, Kunkel LM. miRNAS in normal and diseasedskeletal muscle. J Cell Mol Med. 2009;13:2–11.
42. Petersen JL, Mickelson JR, Cothran EG, Andersson LS, Axelsson J, Bailey E,Bannasch D, Binns MM, Borges AS, Brama P, da Câmara Machado A, Distl O,Felicetti M, Fox-Clipsham L, Graves KT, Guérin G, Haase B, Hasegawa T,Hemmann K, Hill EW, Leeb T, Lindgren G, Lohi H, Lopes MS, McGivney BA,Mikko S, Orr N, Penedo MCT, Piercy RJ, Raekallio M, et al. Genetic diversity inthe modern horse illustrated from genome-wide SNP data. PLoS One.2013;8:e54997.
43. Chang J, Nicolas E, Marks D, Sander C, Lerro A, Buendia MA, Xu C, Mason WS,Moloshok T, Bort R, Zaret KS, Taylor JM. miR-122, a mammalian liver-specificmicroRNA, is processed from hcr mRNA and may downregulate the highaffinity cationic amino acid transporter CAT-1. RNA Biol. 2004;1:106–13.
44. Lagos-Quintana M, Rauhut R, Yalcin A, Meyer J, Lendeckel W, Tuschl T.Identification of tissue-specific MicroRNAs from mouse. Curr Biol.2002;12:735–9.
45. Fong MY, Zhou W, Liu L, Alontaga AY, Chandra M, Ashby J, Chow A,O’Connor ST, Li S, Chin AR, Somlo G, Palomares M, Li Z, Tremblay JR,Tsuyada A, Sun G, Reid MA, Wu X, Swiderski P, Ren X, Shi Y, Kong M,Zhong W, Chen Y, Wang SE. Breast-cancer-secreted miR-122 reprogramsglucose metabolism in premetastatic niche to promote metastasis. NatCell Biol. 2015;17:183–94.
46. Esau C, Davis S, Murray SF, Yu XX, Pandey SK, Pear M, Watts L, Booten SL,Graham M, McKay R, Subramaniam A, Propp S, Lollo BA, Freier S, Bennett CF,Bhanot S, Monia BP. miR-122 regulation of lipid metabolism revealed by invivo antisense targeting. Cell Metab. 2006;3:87–98.
47. Bamford NJ, Potter SJ, Harris PA, Bailey SR. Breed differences in insulinsensitivity and insulinemic responses to oral glucose in horses andponies of moderate body condition score. Domest Anim Endocrinol.2014;47:101–7.
48. Patel D, Boufraqech M, Jain M, Zhang L, He M, Gesuwan K, Gulati N, Nilubol N,Fojo T, Kebebew E. MiR-34a and miR-483-5p are candidate serum biomarkersfor adrenocortical tumors. Surg (United States). 2013;154:1224–9.
49. Chabre O, Libé R, Assie G, Barreau O, Bertherat J, Bertagna X, Feige JJ,Cherradi N. Serum miR-483-5p and miR-195 are predictive of recurrence riskin adrenocortical cancer patients. Endocr Relat Cancer. 2013;20:579–94.
50. Frischknecht M, Jagannathan V, Plattet P, Neuditschko M, Signer-Hasler H,Bachmann I, Pacholewska A, Drögemüller C, Dietschi E, Flury C, Rieder S,Leeb T. A non-synonymous HMGA2 variant decreases height in shetlandponies and other small horses. PLoS One. 2015;10:e0140749.
51. Lin Y, Liu AY, Fan C, Zheng H, Li Y, Zhang C, Wu S, Yu D, Huang Z, Liu F,Luo Q, Yang CJ, Ouyang G. MicroRNA-33b Inhibits Breast Cancer Metastasisby Targeting HMGA2, SALL4 and Twist1. Sci Rep. 2015;5:9995.
52. Barrey E, Mucher E, Jeansoule N, Larcher T, Guigand L, Herszberg B,Chaffaux S, Guérin G, Mata X, Benech P, Canale M, Alibert O, Maltere P,Gidrol X. Gene expression profiling in equine polysaccharide storagemyopathy revealed inflammation, glycogenesis inhibition, hypoxia andmitochondrial dysfunctions. BMC Vet Res. 2009;5:29.
53. Barrey E, Bonnamy B, Barrey EJ, Mata X, Chaffaux S, Guerin G. MuscularmicroRNA expressions in healthy and myopathic horses suffering from
Pacholewska et al. BMC Genomics (2016) 17:831 Page 14 of 15
polysaccharide storage myopathy or recurrent exertional rhabdomyolysis.Equine Vet J. 2010;42 SUPPL 38:303–10.
54. Lanz S, Gerber V, Marti E, Rettmer H, Klukowska-Rötzler J, Gottstein B,Matthews JB, Pirie S, Hamza E. Effect of hay dust extract and cyathostominantigen stimulation on cytokine expression by PBMC in horses withrecurrent airway obstruction. Vet Immunol Immunopathol. 2013;155:229–37.
55. Kirschner MB, Edelman JJB, Kao SCH, Vallely MP, Van Zandwijk N, Reid G.The impact of hemolysis on cell-free microRNA biomarkers. Front Genet.2013;4:94.
56. Kirschner MB, Kao SC, Edelman JJ, Armstrong NJ, Vallely MP, van Zandwijk N,Reid G. Haemolysis during sample preparation alters microRNA content ofplasma. PLoS One. 2011;6:e24145.
57. Andrews S. FastQC: a quality control tool for high throughput sequencedata. 2010. Available online at: http://www.bioinformatics.babraham.ac.uk/projects/fastqc.
58. Martin M. Cutadapt removes adapter sequences from high-throughputsequencing reads. EMBnet J. 2011;17:10.
59. Wade CM, Giulotto E, Sigurdsson S, Zoli M, Gnerre S, Imsland F, Lear TL,Adelson DL, Bailey E, Bellone RR, Blöcker H, Distl O, Edgar RC, Garber M,Leeb T, Mauceli E, MacLeod JN, Penedo MCT, Raison JM, Sharpe T, Vogel J,Andersson L, Antczak DF, Biagi T, Binns MM, Chowdhary BP, Coleman SJ,Della Valle G, Fryc S, Guérin G, et al. Genome sequence, comparative analysis,and population genetics of the domestic horse. Science. 2009;326:865–7.
60. Tam S, Tsao MS, McPherson JD. Optimization of miRNA-seq datapreprocessing. Brief Bioinform. 2015;16:950–63.
61. Wang L, Wang S, Li W. RSeQC: quality control of RNA-seq experiments.Bioinformatics. 2012;28:2184–5.
62. Smit A, Hubley R, Green P. RepeatMasker Open-3.0. 1996-2010. http://www.repeatmasker.org.
63. Jurka J. Repbase Update: A database and an electronic journal of repetitiveelements. Trends Genet. 2000;16:418–20.
64. Griffiths-Jones S, Saini HK, van Dongen S, Enright AJ. miRBase: tools formicroRNA genomics. Nucleic Acids Res. 2008;36:D154–8.
65. Gruber AR, Lorenz R, Bernhart SH, Neubӧck R, Hofacker IL. The Vienna RNAwebsuite. Nucleic Acids Res. 2008;36(Web Server issue):W70–4.
66. Robinson MD, Oshlack A. A scaling normalization method for differentialexpression analysis of RNA-seq data. Genome Biol. 2010;11:R25.
67. Robinson MD, Smyth GK. Moderated statistical tests for assessing differencesin tag abundance. Bioinformatics. 2007;23:2881–7.
• We accept pre-submission inquiries
• Our selector tool helps you to find the most relevant journal
• We provide round the clock customer support
• Convenient online submission
• Thorough peer review
• Inclusion in PubMed and all major indexing services
• Maximum visibility for your research
Submit your manuscript atwww.biomedcentral.com/submit
Submit your next manuscript to BioMed Central and we will help you at every step:
Pacholewska et al. BMC Genomics (2016) 17:831 Page 15 of 15
Related Documents