Novel biomarkers for pre-diabetes identified by metabolomics Rui Wang-Sattler 1,28, *, Zhonghao Yu 1,28 , Christian Herder 2,28 , Ana C Messias 3,28 , Anna Floegel 4 , Ying He 5,6 , Katharina Heim 7 , Monica Campillos 8 , Christina Holzapfel 1,9 , Barbara Thorand 10 , Harald Grallert 1 , Tao Xu 1 , Erik Bader 1 , Cornelia Huth 10 , Kirstin Mittelstrass 1 , Angela Do ¨ ring 11 , Christa Meisinger 10 , Christian Gieger 12 , Cornelia Prehn 13 , Werner Roemisch-Margl 8 , Maren Carstensen 2 , Lu Xie 5 , Hisami Yamanaka-Okumura 14 , Guihong Xing 15 , Uta Ceglarek 16 , Joachim Thiery 16 , Guido Giani 17 , Heiko Lickert 18 , Xu Lin 19 , Yixue Li 5,6 , Heiner Boeing 4 , Hans-Georg Joost 4 , Martin Hrabe ´ de Angelis 13,20 , Wolfgang Rathmann 17 , Karsten Suhre 8,21,22 , Holger Prokisch 7 , Annette Peters 10 , Thomas Meitinger 7,23 , Michael Roden 2,24 , H-Erich Wichmann 11,25 , Tobias Pischon 4,26 , Jerzy Adamski 13,20 and Thomas Illig 1,27 1 Research Unit of Molecular Epidemiology, Helmholtz Zentrum Mu ¨ nchen, Neuherberg, Germany, 2 German Diabetes Center, Institute for Clinical Diabetology, Leibniz Center for Diabetes Research at Heinrich Heine University, Du ¨ sseldorf, Germany, 3 Institute of Structural Biology, Helmholtz Zentrum Mu ¨ nchen, Neuherberg, Germany, 4 Department of Epidemiology, German Institute of Human Nutrition Potsdam-Rehbruecke, Nuthetal, Germany, 5 Shanghai Center for Bioinformation Technology, Shanghai, China, 6 Key Lab of Systems Biology, Bioinformatics Center, Shanghai Institutes for Biological Sciences, Chinese Academy of Sciences, Shanghai, China, 7 Institute of Human Genetics, Helmholtz Zentrum Mu ¨ nchen, Neuherberg, Germany, 8 Institute of Bioinformatics and Systems Biology, Helmholtz Zentrum Mu ¨ nchen, Neuherberg, Germany, 9 Else Kroener-Fresenius-Center for Nutritional Medicine, University Hospital ‘Klinikum rechts der Isar’, Technische Universita ¨t Mu ¨ nchen, Munich, Germany, 10 Institute of Epidemiology II, Helmholtz Zentrum Mu ¨ nchen, Neuherberg, Germany, 11 Institute of Epidemiology I, Helmholtz Zentrum Mu ¨ nchen, Neuherberg, Germany, 12 Institute of Genetic Epidemiology, Helmholtz Zentrum Mu ¨ nchen, Neuherberg, Germany, 13 Genome Analysis Center, Institute of Experimental Genetics, Helmholtz Zentrum Mu ¨ nchen, Neuherberg, Germany, 14 Department of Clinical Nutrition, Institute of Health Biosciences, University of Tokushima Graduate School, Tokushima, Japan, 15 Benxi Diabetes Clinic, Benxi Central Hospital, Benxi, China, 16 Institute of Laboratory Medicine, Clinical Chemistry and Molecular Diagnostics, University Hospital Leipzig, Leipzig, Germany, 17 German Diabetes Center, Institute of Biometrics and Epidemiology, Leibniz Center for Diabetes Research at Heinrich Heine University, Du ¨ sseldorf, Germany, 18 Institute of Diabetes and Regeneration Research, Helmholtz Zentrum Mu ¨ nchen, Neuherberg, Germany, 19 Institute for Nutritional Sciences, Shanghai Institutes for Biological Sciences, Chinese Academy of Sciences, Shanghai, China, 20 Chair of Experimental Genetics, Technische Universita ¨ t Mu ¨ nchen, Munich, Germany, 21 Faculty of Biology, Ludwig-Maximilians-Universita ¨ t, Planegg-Martinsried, Germany, 22 Department of Physiology and Biophysics, Weill Cornell Medical College in Qatar (WCMC-Q), Doha, Qatar, 23 Department of Metabolic Diseases, University Hospital Du ¨ sseldorf, Du ¨ sseldorf, Germany, 24 Klinikum rechts der Isar, Technische Universita ¨ t Mu ¨ nchen, Munich, Germany, 25 Institute of Medical Informatics, Biometry and Epidemiology, Ludwig-Maximilians-Universita ¨ t, Munich, Germany, 26 Molecular Epidemiology Group, Max Delbrueck Center for Molecular Medicine (MDC), Berlin-Buch, Germany and 27 Hannover Unified Biobank, Hannover Medical School, Hannover, Germany 28 These authors contributed equally to this work * Corresponding author. Research Unit of Molecular Epidemiology, Helmholtz Zentrum Mu ¨ nchen, 85764 Munich-Neuherberg, Germany. Tel.: þ 49 89 3187 3978; Fax: þ 49 89 3187 2428; E-mail: [email protected] Received 13.6.12; accepted 15.8.12 Type 2 diabetes (T2D) can be prevented in pre-diabetic individuals with impaired glucose tolerance (IGT). Here, we have used a metabolomics approach to identify candidate biomarkers of pre-diabetes. We quantified 140 metabolites for 4297 fasting serum samples in the population-based Cooperative Health Research in the Region of Augsburg (KORA) cohort. Our study revealed significant metabolic variation in pre-diabetic individuals that are distinct from known diabetes risk indicators, such as glycosylated hemoglobin levels, fasting glucose and insulin. We identified three metabolites (glycine, lysophosphatidylcholine (LPC) (18:2) and acetylcarnitine) that had significantly altered levels in IGT individuals as compared to those with normal glucose tolerance, with P-values ranging from 2.4 10 4 to 2.1 10 13 . Lower levels of glycine and LPC were found to be predictors not only for IGT but also for T2D, and were independently confirmed in the European Prospective Investigation into Cancer and Nutrition (EPIC)-Potsdam cohort. Using metabolite–protein network analysis, we identified seven T2D-related genes that are associated with these three IGT-specific metabolites by multiple interactions with four enzymes. The expression levels of these enzymes correlate with changes in the metabolite concentrations linked to diabetes. Our results may help developing novel strategies to prevent T2D. Molecular Systems Biology 8: 615; published online 25 September 2012; doi:10.1038/msb.2012.43 Subject Categories: metabolic and regulatory networks; molecular biology of disease Keywords: early diagnostic biomarkers; IGT; metabolomics; prediction; T2D Introduction Type 2 diabetes (T2D) is defined by increased blood glucose levels due to pancreatic b-cell dysfunction and insulin resistance without evidence for specific causes, such as autoimmune destruction of pancreatic b-cells (Krebs et al, 2002; Stumvoll et al, 2005; Muoio and Newgard, 2008). A state Molecular Systems Biology 8; Article number 615; doi:10.1038/msb.2012.43 Citation: Molecular Systems Biology 8:615 & 2012 EMBO and Macmillan Publishers Limited All rights reserved 1744-4292/12 www.molecularsystemsbiology.com & 2012 EMBO and Macmillan Publishers Limited Molecular Systems Biology 2012 1

Welcome message from author
This document is posted to help you gain knowledge. Please leave a comment to let me know what you think about it! Share it to your friends and learn new things together.
Transcript
Novel biomarkers for pre-diabetes identified bymetabolomics
Rui Wang-Sattler128 Zhonghao Yu128 Christian Herder228 Ana C Messias328 Anna Floegel4 Ying He56 Katharina Heim7Monica Campillos8 Christina Holzapfel19 Barbara Thorand10 Harald Grallert1 Tao Xu1 Erik Bader1 Cornelia Huth10Kirstin Mittelstrass1 Angela Doring11 Christa Meisinger10 Christian Gieger12 Cornelia Prehn13 Werner Roemisch-Margl8Maren Carstensen2 Lu Xie5 Hisami Yamanaka-Okumura14 Guihong Xing15 Uta Ceglarek16 Joachim Thiery16 Guido Giani17Heiko Lickert18 Xu Lin19 Yixue Li56 Heiner Boeing4 Hans-Georg Joost4 Martin Hrabe de Angelis1320 Wolfgang Rathmann17Karsten Suhre82122 Holger Prokisch7 Annette Peters10 Thomas Meitinger723 Michael Roden224 H-Erich Wichmann1125Tobias Pischon426 Jerzy Adamski1320 and Thomas Illig127
1 Research Unit of Molecular Epidemiology Helmholtz Zentrum Munchen Neuherberg Germany 2 German Diabetes Center Institute for Clinical Diabetology LeibnizCenter for Diabetes Research at Heinrich Heine University Dusseldorf Germany 3 Institute of Structural Biology Helmholtz Zentrum Munchen Neuherberg Germany4 Department of Epidemiology German Institute of Human Nutrition Potsdam-Rehbruecke Nuthetal Germany 5 Shanghai Center for Bioinformation TechnologyShanghai China 6 Key Lab of Systems Biology Bioinformatics Center Shanghai Institutes for Biological Sciences Chinese Academy of Sciences Shanghai China7 Institute of Human Genetics Helmholtz Zentrum Munchen Neuherberg Germany 8 Institute of Bioinformatics and Systems Biology Helmholtz Zentrum MunchenNeuherberg Germany 9 Else Kroener-Fresenius-Center for Nutritional Medicine University Hospital lsquoKlinikum rechts der Isarrsquo Technische Universitat MunchenMunich Germany 10 Institute of Epidemiology II Helmholtz Zentrum Munchen Neuherberg Germany 11 Institute of Epidemiology I Helmholtz Zentrum MunchenNeuherberg Germany 12 Institute of Genetic Epidemiology Helmholtz Zentrum Munchen Neuherberg Germany 13 Genome Analysis Center Institute ofExperimental Genetics Helmholtz Zentrum Munchen Neuherberg Germany 14 Department of Clinical Nutrition Institute of Health Biosciences University ofTokushima Graduate School Tokushima Japan 15 Benxi Diabetes Clinic Benxi Central Hospital Benxi China 16 Institute of Laboratory Medicine Clinical Chemistryand Molecular Diagnostics University Hospital Leipzig Leipzig Germany 17 German Diabetes Center Institute of Biometrics and Epidemiology Leibniz Center forDiabetes Research at Heinrich Heine University Dusseldorf Germany 18 Institute of Diabetes and Regeneration Research Helmholtz Zentrum Munchen NeuherbergGermany 19 Institute for Nutritional Sciences Shanghai Institutes for Biological Sciences Chinese Academy of Sciences Shanghai China 20 Chair of ExperimentalGenetics Technische Universitat Munchen Munich Germany 21 Faculty of Biology Ludwig-Maximilians-Universitat Planegg-Martinsried Germany 22 Department ofPhysiology and Biophysics Weill Cornell Medical College in Qatar (WCMC-Q) Doha Qatar 23 Department of Metabolic Diseases University Hospital DusseldorfDusseldorf Germany 24 Klinikum rechts der Isar Technische Universitat Munchen Munich Germany 25 Institute of Medical Informatics Biometry and EpidemiologyLudwig-Maximilians-Universitat Munich Germany 26 Molecular Epidemiology Group Max Delbrueck Center for Molecular Medicine (MDC) Berlin-Buch Germany and27 Hannover Unified Biobank Hannover Medical School Hannover Germany28These authors contributed equally to this work Corresponding author Research Unit of Molecular Epidemiology Helmholtz Zentrum Munchen 85764 Munich-Neuherberg Germany Tel thorn 49 89 3187 3978Fax thorn 49 89 3187 2428 E-mail ruiwang-sattlerhelmholtz-muenchende
Received 13612 accepted 15812
Type 2 diabetes (T2D) can be prevented in pre-diabetic individuals with impaired glucose tolerance(IGT) Here we have used a metabolomics approach to identify candidate biomarkers of pre-diabetesWe quantified 140 metabolites for 4297 fasting serum samples in the population-based CooperativeHealth Research in the Region of Augsburg (KORA) cohort Our study revealed significant metabolicvariation in pre-diabetic individuals that are distinct from known diabetes risk indicators such asglycosylated hemoglobin levels fasting glucose and insulin We identified three metabolites (glycinelysophosphatidylcholine (LPC) (182) and acetylcarnitine) that had significantly altered levels in IGTindividuals as compared to those with normal glucose tolerance with P-values ranging from 2410 4
to 211013 Lower levels of glycine and LPC were found to be predictors not only for IGT but also forT2D and were independently confirmed in the European Prospective Investigation into Cancer andNutrition (EPIC)-Potsdam cohort Using metabolitendashprotein network analysis we identified sevenT2D-related genes that are associated with these three IGT-specific metabolites by multiple interactionswith four enzymes The expression levels of these enzymes correlate with changes in the metaboliteconcentrations linked to diabetes Our results may help developing novel strategies to prevent T2DMolecular Systems Biology 8 615 published online 25 September 2012 doi101038msb201243Subject Categories metabolic and regulatory networks molecular biology of diseaseKeywords early diagnostic biomarkers IGT metabolomics prediction T2D
Introduction
Type 2 diabetes (T2D) is defined by increased blood glucoselevels due to pancreatic b-cell dysfunction and insulin
resistance without evidence for specific causes such asautoimmune destruction of pancreatic b-cells (Krebs et al2002 Stumvoll et al 2005 Muoio and Newgard 2008) A state
Molecular Systems Biology 8 Article number 615 doi101038msb201243Citation Molecular Systems Biology 8615amp 2012 EMBO and Macmillan Publishers Limited All rights reserved 1744-429212wwwmolecularsystemsbiologycom
amp 2012 EMBO and Macmillan Publishers Limited Molecular Systems Biology 2012 1
of pre-diabetes (ie impaired fasting glucose (IFG) andorimpaired glucose tolerance (IGT)) with only slightly elevatedblood glucose levels may precede T2D for years (McGarry2002 Tabak et al 2012) The development of diabetes in pre-diabetic individuals can be prevented or delayed by dietarychanges and increased physical activity (Tuomilehto et al2001 Knowler et al 2002) However no specific biomarkersthat enable prevention have been reported
Metabolomics studies allow metabolites involved in diseasemechanisms to be discovered by monitoring metabolite levelchanges in predisposed individuals compared with healthyones (Shaham et al 2008 Newgard et al 2009 Zhao et al2010 Pietilainen et al 2011 Rhee et al 2011 Wang et al 2011Cheng et al 2012 Goek et al 2012) Altered metabolite levelsmay serve as diagnostic biomarkers and enable preventiveaction Previous cross-sectional metabolomics studies of T2Dwere either based on small sample sizes (Shaham et al 2008Wopereis et al 2009 Zhao et al 2010 Pietilainen et al 2011) ordid not consider the influence of common risk factors of T2D(Newgard et al 2009) Recently based on prospectivenested casendashcontrol studies with relative large samples (Rheeet al 2011 Wang et al 2011) five branched-chain andaromatic amino acids were identified as predictors of T2D(Wang et al 2011) Here using various comprehensive large-scale approaches we measured metabolite concentrationprofiles (Yu et al 2012) in the population-based (Holle et al2005 Wichmann et al 2005) Cooperative Health Researchin the Region of Augsburg (KORA) baseline (survey 4 (S4))and follow-up (F4) studies (Rathmann et al 2009 Meisingeret al 2010 Jourdan et al 2012) The results of these cross-sectional and prospective studies allowed us to (i) reliablyidentify candidate biomarkers of pre-diabetes and (ii) buildmetabolitendashprotein networks to understand diabetes-relatedmetabolic pathways
Results
Study participants
Individuals with known T2D were identified by physician-validated self-reporting (Rathmann et al 2010) and excludedfrom our analysis to avoid potential influence from anti-diabetic medication with non-fasting participants and indivi-duals with missing values (Figure 1A) Based on both fastingand 2-h glucose values (ie 2 h post oral 75 g glucose load)individuals were defined according to the WHO diagnosticcriteria to have normal glucose tolerance (NGT) isolated IFG(i-IFG) IGT or newly diagnosed T2D (dT2D) (WHO 1999Rathmann et al 2009 Meisinger et al 2010 SupplementaryTable S1) The sample sets include 91 dT2D patients and 1206individuals with non-T2D including 866 participants withNGT 102 with i-IFG and 238 with IGT in the cross-sectionalKORA S4 (Figure 1A study characteristics are shown inTable I) Of the 1010 individuals in a fasting state whoparticipated at baseline and follow-up surveys (Figure 1Bstudy characteristics of the KORA F4 survey are shown inSupplementary Table S2) 876 of them were non-diabetic atbaseline Out of these about 10 developed T2D (ie 91incident T2D) (Figure 1C) From the 641 individuals with NGTat baseline 18 developed IGT (ie 118 incident IGT) 7 years
later (Figure 1D) The study characteristics of the prospectiveKORA S4-F4 are shown in Table II
Analyses strategies
We first screened for significantly differed metabolitesconcentration among four groups (dT2D IGT i-IFG andNGT) for 140 metabolites with cross-sectional studies inKORA S4 and for 131 metabolites in KORA F4 Three IGT-specific metabolites were identified and further investigated inthe prospective KORA S4-F4 cohort to examine whether thebaseline metabolite concentrations can predict incident IGTand T2D and whether they are associated with glucosetolerance 7 years later Our results are based on a prospectivepopulation-based cohort which differed from previous nestedcasendashcontrol study (Wang et al 2011) We also performedanalysis with same study design using our data The obtainedresults provided clues to explain the differences between thetwo sets of biomarkers The three metabolites were alsoreplicated in an independent European Prospective Investiga-tion into Cancer and Nutrition (EPIC)-Potsdam cohort Finallythe relevance of the identified metabolites was furtherinvestigated with our bioinformatical analysis of protein-metabolite interaction networks and gene expression data
Identification of novel pre-diabetes metabolitesdistinct from known T2D risk indicators
To identify metabolites with altered concentrations betweenthe individuals with NGT i-IFG IGT and dT2D we firstexamined five pairwise comparisons (i-IFG IGT and dT2Dversus NGT as well as dT2D versus either i-IFG or IGT) in thecross-sectional KORA S4 Based on multivariate logisticregression analysis 26 metabolite concentrations differedsignificantly (P-valueso3610 4) between two groups inat least one of the five comparisons (Figure 2A odds ratios(ORs) and P-values are shown in Table III) These associationswere independent of age sex body mass index (BMI) physicalactivity alcohol intake smoking systolic blood pressure (BP)and HDL cholesterol (model 1) As expected the level of totalhexose H1 which is mainly represented by glucose (Pearsonrsquoscorrelation coefficient value r between H1 and fasting glucosereached 085 Supplementary Table S3) was significantlydifferent in all five comparisons The significantly changedmetabolite panel differed from NGT to i-IFG or to IGT Most ofthe significantly altered metabolite concentrations were foundbetween individuals with dT2D and IGT as compared withNGT (Supplementary Table S4A)
To investigate whether HbA1c fasting glucose and fastinginsulin levels mediate the shown associations these wereadded as covariates to the regression analysis (model 2) inaddition to model 1 (Figure 2B) We observed that under theseconditions no metabolite differed significantly when compar-ing individuals with dT2D to those with NGT suggestingthat these metabolites are associated with HbA1c fastingglucose and fasting insulin levels (r values are shown inSupplementary Table S3) Only nine metabolite concentrationssignificantly differed between IGTand NGT individuals (Table IIISupplementary Table S4B) These metabolites therefore
Biomarkers of pre-diabetesR Wang-Sattler et al
2 Molecular Systems Biology 2012 amp 2012 EMBO and Macmillan Publishers Limited
represent novel biomarker candidates and are independentfrom the known risk indicators for T2D The logistic regressionanalysis was based on each single metabolite and some ofthese metabolites are expected to correlate with each other Tofurther assess the metabolites as a group we employed twoadditional statistical methods (the non-parametric randomforest and the parametric stepwise selection) to identifyunique and independent biomarker candidates Out of thenine metabolites five molecules (ie glycine LPC (182) LPC(170) LPC (181) and C2) were select after random forest andLPC (170) and LPC (181) were then removed after thestepwise selection Thus three molecules were found tocontain independent information glycine (adjusted ORfrac14 067(054ndash081) Pfrac14 8610 5) LPC (182) (ORfrac14 058 (046ndash072) Pfrac14 2110 6) and acetylcarnitine C2 (ORfrac14 138
(116ndash164) Pfrac14 2410 4) (Figure 2C) Similar results wereobserved in the follow-up KORA F4 study (SupplementaryFigure S1) For instance when 380 IGT individuals werecompared with 2134 NGT participants these three metaboliteswere also found to be highly significantly different (glycineORfrac14 064 (055ndash075) Pfrac14 9310 8 LPC (182) ORfrac14 047(038ndash057) Pfrac14 211013 and C2 ORfrac14 133 (117ndash149)Pfrac14 4910 6) (Supplementary Table S5)
Predict risks of IGT and T2D
To investigate the predictive value for IGTand T2D of the threeidentified metabolites we examined the associations betweenbaseline metabolite concentrations and incident IGT and T2D
Table I Characteristics of the KORA S4 cross-sectional study sample
Clinical and laboratory parameters NGT i-IFG IGT dT2D
N 866 102 238 91Age (years) 635plusmn55 641plusmn52 652plusmn52 659plusmn54Sex (female) () 522 304 449 418BMI (kgm2) 277plusmn41 292plusmn4 296plusmn41 302plusmn39Physical activity ( 41 h per week) 467 353 399 363Alcohol intakea () 202 205 252 242Current smoker () 148 108 109 231Systolic BP (mm Hg) 1317plusmn189 1389plusmn179 1407plusmn198 1468plusmn215HDL cholesterol (mgdl) 605plusmn164 557plusmn159 557plusmn151 500plusmn158LDL cholesterol (mgdl) 1545plusmn398 1521plusmn377 1552plusmn386 1461plusmn446Triglycerides (mgdl) 1207plusmn683 1450plusmn960 1466plusmn800 1706plusmn1071HbA1c () 556plusmn033 562plusmn033 566plusmn039 621plusmn083Fasting glucose (mgdl) 956plusmn71 1142plusmn37 1045plusmn97 1332plusmn3172-h Glucose (mgdl) 1021plusmn210 1093plusmn187 1634plusmn164 2321plusmn637Fasting insulin (mUml) 1048plusmn728 1626plusmn967 1392plusmn953 1770plusmn1261
NGT normal glucose tolerance i-IFG isolated impaired fasting glucose IGT impaired glucose tolerance dT2D newly diagnosed type 2 diabetes BP blood pressureHDL high-density lipoprotein LDL low-density lipoproteinPercentages of individuals or meansplusmnsd are given for each variable and each group (NGT i-IFG IGT and dT2D)aX20 gday for women X40 gday for men
KORA S4 cross-sectional studyn=4261
ExcludedNon-fasting (n=2863)Missing values (n=63)Known T2D (n=38)
A
IGTn=238
NGTn=866
Non-T2D (n=1206)
dT2Dn=91
i-IFGn=102
NGTn=641 NGT
n=471
Incident IGTn=118
Non-T2Dn=876 Non-T2D
n=785
Incident T2Dn=91
7 years
DBaseline S4
Follow-up F4
Overlapped fasting samplesB
Baseline S4
S4n=1335
F4n=2962
n=1010
Follow-up F4
7 years
C
Figure 1 Population description Metabolomics screens in the KORA cohort at baseline S4 (A) overlapped between S4 and F4 (B) and prospective (C D) Participantnumbers are shown Normal glucose tolerance (NGT) isolated impaired fasting glucose (i-IFG) impaired glucose tolerance (IGT) type 2 diabetes mellitus (T2D) andnewly diagnosed T2D (dT2D) Non-T2D individuals include NGT i-IFG and IGT participants
Biomarkers of pre-diabetesR Wang-Sattler et al
amp 2012 EMBO and Macmillan Publishers Limited Molecular Systems Biology 2012 3
using the prospective KORA S4-F4 cohort (Table II) Wecompared baseline metabolite concentrations in 118 incidentIGT individuals with 471 NGT control individuals We foundthat glycine and LPC (182) but not C2 were significantlydifferent at the 5 level in both adjusted model 1 and model 2(Table IV Supplementary Table S6) Significant differenceswere additionally observed for glycine and LPC (182) but notfor C2 at baseline concentrations between the 91 incident T2Dindividuals and 785 participants who remained diabetes free(non-T2D) Each standard deviation (sd) increment of thecombinations of the three metabolites was associated with a
33 decreased risk of future diabetes (ORfrac14 039 (021ndash071)Pfrac14 00002) Individuals in the fourth quartile of the combinedmetabolite concentrations had a three-fold lower chance ofdeveloping diabetes (ORfrac14 033 (021ndash052) Pfrac14 1810 5)compared with those whose serum levels were in the firstquartile (ie combination of glycine LPC (182) and C2)indicating a protective effect from higher concentrations ofglycine and LPC (182) combined with a lower concentrationof C2 With the full adjusted model 2 consistent results wereobtained for LPC (182) but not for glycine (SupplementaryTable S6) When the three metabolites were added to the fully
Table II Characteristics of the KORA S4-F4 prospective study samples
NGT at baseline (nfrac14 589) Non-T2D at baseline (nfrac14 876)
Remained NGTat follow-up
Developed IGTat follow-up
Remained Non-T2Dat follow-up
Developed T2Dat follow-up
N 471 118 785 91Age (years) 624plusmn54 639plusmn55 629plusmn54 655plusmn52Sex (female) () 522 559 508 341BMI (kgm2) 272plusmn38 282plusmn39 279plusmn4 302plusmn36Physical activity ( 41 h per week) 529 432 522 582Alcohol intakea () 199 203 206 198Smoker () 146 93 120 143Systolic BP (mm Hg) 1296plusmn182 1342plusmn187 1324plusmn186 1378plusmn19HDL cholesterol (mgdl) 613plusmn168 589plusmn162 600plusmn165 519plusmn124LDL cholesterol (mgdl) 1539plusmn384 1569plusmn427 1545plusmn395 1577plusmn416Triglycerides (mgdl) 1181plusmn639 1295plusmn790 1250plusmn700 1512plusmn742HbA1c () 554plusmn033 559plusmn034 56plusmn03 58plusmn04Fasting glucose (mgdl) 947plusmn69 966plusmn71 977plusmn88 1061plusmn1012-h Glucose (mgdl) 982plusmn205 1099plusmn168 1093plusmn28 1459plusmn323Fasting insulin (mUml) 991plusmn648 1179plusmn883 110plusmn76 162plusmn96
BP blood pressure HDL high-density lipoprotein LDL low-density lipoproteinPercentages of individuals or meansplusmnsd are given for each variable and each groupaX20 gday for women X40 gday for men
i-IFGn=102
Glycine LPC (182) LPC (170) LPC (180) LPC (181) PC ae C342 PC ae C343 PC ae C362 PC ae C363 PC ae C382
C2 H1 PC aa C321dT2Dn=91
IGTn=238NGT
n=866
H1 IIe PC aa C321
H1 Ala
Glycine LPC (182) LPC (170) LPC (180) LPC (181) PC ae C342 PC ae C362 PC ae C363
H1
H1
dT2Dn=91
NGTn=866
IGTn=238
i-IFGn=102
B
C2
A
ndash02ndash01
00102
ndash03
NGT dT2DIGT
C
SM (OH) C221
Glycine LPC (170) PC ae C343 PC ae C362 PC ae C383 PC ae C403 PC ae C405SM C160 SM C161 SM C202 SM (OH) C141 SM (OH) C161 SM (OH) C221 SM (OH) C222 SM (OH) C241
Mea
n re
sidu
es (
μM)
Glycine LPC (182) C2
Figure 2 Differences in metabolite concentrations from cross-sectional analysis of KORA S4 Plots (A B) show the names of metabolites with significantly differentconcentrations in multivariate logistic regression analyses (after the Bonferroni correction for multiple testing with Po36 10 4) in the five pairwise comparisons ofmodel 1 and model 2 Plot (C) shows the average residues of the concentrations with standard errors of the three metabolites (glycine LPC (182) and acetylcarnitineC2) for the NGT IGT and dT2D groups Plot (A) shows the results with adjustment for model 1 (age sex BMI physical activity alcohol intake smoking systolic BP andHDL cholesterol) whereas plots (B C) have additional adjustments for HbA1c fasting glucose and fasting insulin (model 2) Residuals were calculated from linearregression model (formula T2D statusBmetabolite concentrationthornmodel 2) For further information see Supplementary Table S4
Biomarkers of pre-diabetesR Wang-Sattler et al
4 Molecular Systems Biology 2012 amp 2012 EMBO and Macmillan Publishers Limited
adjusted model 2 the area under the receiver-operating-characteristic curves (AUC) increased 26 (Pfrac14 0015) and1 (Pfrac14 0058) for IGTand T2D respectively (Supplementary
Figure S2 Supplementary Table S7) Thus this provides animproved prediction of IGT and T2D as compared with T2Drisk indicators
Table III Odds ratios (ORs) and P-values in five pairwise comparisons with two adjusted models in the KORA S4
Metabolite Model 1 Model 2
OR (95 CI) per sd P-value OR (95 CI) per sd P-value
238 IGT versus 866 NGTGlycine 065 (053ndash078) 56E-06 067 (054ndash081) 86E-05LPC (182) 058 (047ndash07) 13E-07 058 (046ndash072) 21E-06C2 137 (118ndash159) 38E-05 138 (116ndash164) 24E-04
91 dT2D versus 866 NGTGlycine 047 (033ndash065) 11E-05 044 (022ndash083) 16E-02LPC (182) 062 (044ndash085) 41E-03 061 (032ndash107) 11E-01C2 117 (094ndash145) 15E-01 171 (114ndash252) 68E-03
91 dT2D versus 234 IGTGlycine 081 (061ndash107) 15E-01 076 (051ndash11) 16E-01LPC (182) 091 (069ndash119) 48E-01 084 (057ndash122) 37E-01C2 093 (071ndash12) 59E-01 127 (087ndash186) 22E-01
102 i-IFG versus 866 NGTGlycine 075 (057ndash098) 39E-02 062a 10Ethorn 00LPC (182) 099 (077ndash126) 96E-01 079a 10Ethorn 00C2 12 (099ndash146) 59E-02 018a 10Ethorn 00
91 dT2D versus 102 i-IFGGlycine 062 (043ndash087) 78E-03 062 (04ndash093) 25E-02LPC (182) 062 (043ndash089) 11E-02 054 (033ndash084) 89E-03C2 092 (066ndash127) 62E-01 123 (082ndash185) 31E-01
ORs were calculated with multivariate logistic regression analysis with adjustment for age sex BMI physical activity alcohol intake smoking systolic BP and HDLcholesterol in model 1 model 2 includes those variable in model 1 plus HbA1c fasting glucose and fasting insulin CI denotes confidence intervalaFasting glucose values were added as co-variants to the model 2 resulting in a perfect separation between i-IFG and NGT
Table IV Prediction of IGT and T2D in the KORA cohort
Model Glycine LPC (182) C2 Glycine LPC (182) C2
(A) Metabolite as continuous variable (nfrac14 589)Per sd 075 (058ndash095) 072 (054ndash093) 092 (073ndash114) 036 (020ndash067)P 002 002 050 0001
(B) Metabolite as categorical variable (nfrac14 589)First quartile 10 (reference) 10 (reference) 10 (reference) 10 (reference)Second quartile 10 (080ndash146) 096 (073ndash127) 089 (066ndash123) 054 (030ndash097)Third quartile 10 (074ndash134) 071 (051ndash099) 093 (069ndash126) 066 (037ndash118)Fourth quartile 078 (055ndash106) 078 (054ndash112) 099 (073ndash135) 036 (019ndash069)P for trend 006 005 079 00082
(C) Metabolite as continuous variable (nfrac14 876)Per sd 073 (055ndash097) 070 (051ndash094) 094 (074ndash118) 039 (021ndash071)P 004 002 059 00002
(D) Metabolite as categorical variable (nfrac14 876)1st quartile 10 (reference) 10 (reference) 10 (reference) 10 (reference)2nd quartile 087 (071ndash107) 095 (077ndash117) 105 (085ndash131) 050 (033ndash076)3rd quartile 082 (067ndash101) 070 (056ndash088) 097 (078ndash119) 057 (038ndash088)4th quartile 067 (054ndash084) 068 (054ndash088) 121 (098ndash150) 033 (021ndash052)P for trend 000061 000021 019 18E 05
(E) Linear regression (nfrac14 843)b Estimatesa (95 CI) 247 ( 464 029) 457 ( 690 224) 102 ( 111 315) 423 ( 652 231)P 0026 000013 059 88E 05
Odds ratios (ORs 95 confidence intervals) and P-values of multivariate logistic regression results are shown in (A) and (B) for IGT and in (C) and (D) for T2Drespectively whereas b estimates and P-values from linear regression analysis between metabolite concentration in baseline KORA S4 and 2-h glucose values in follow-up KORA F4 are shown in (E) All models were adjusted for age sex BMI physical activity alcohol intake smoking systolic BP and HDL cholesterolab Estimate indicates the future difference in the glucose tolerance corresponding to the one sd differences in the normalized baseline metabolite concentration
Biomarkers of pre-diabetesR Wang-Sattler et al
amp 2012 EMBO and Macmillan Publishers Limited Molecular Systems Biology 2012 5
Baseline metabolite concentrations correlate withfuture glucose tolerance
We next investigated the associations between baselinemetabolite concentrations and follow-up 2-h glucose valuesafter an oral glucose tolerance test Consistent results wereobserved for the three metabolites glycine and LPC (182) butnot acetylcarnitine C2 levels were found to be significantlyassociated indicating that glycine and LPC (182) predictglucose tolerance Moreover the three metabolites (glycineLPC (182) and C2) revealed high significance even in the fullyadjusted model 2 in the cross-sectional KORA S4 cohort(Supplementary Table S8) As expected a very significantassociation (Pfrac14 1510 22) was observed for hexose H1 inmodel 1 while no significance (Pfrac14 012) was observed for it inthe fully adjusted model 2 (Supplementary Table S8)
Prospective population-based versus nestedcasendashcontrol designs
To investigate the predict value of the five branched-chain andaromatic amino acids (isoleucine leucine valine tyrosine andphenylalanine) (Wang et al 2011) in our study we correlatedthe baseline metabolite concentrations with follow-up 2-hglucose values We found none of them to be associatedsignificantly indicating that the five amino acids cannotpredict risk of IGT (b estimates and P-values are shown inSupplementary Table S9) Furthermore none of these fiveamino acids showed associations with 2-h glucose values inthe cross-sectional KORA S4 study (Supplementary Table S8)
To replicate the identified five branched-chain and aromaticamino acids (Wang et al 2011) we matched our baselinesamples to the 91 incident T2D using the same methoddescribed previously (Wang et al 2011) We replicated four outof the five branched-chain and aromatic amino acids(characteristics of the casendashcontrol and non-T2D samples areshown in Supplementary Table S10 ORs and P-values aregiven in Supplementary Table S11) As expected the threeidentified IGT-specific metabolites did not significantly differ
between the matched case control samples because theselected controls were enriched with individuals accompaniedby high-risk features such as obesity and elevated fastingglucose as described by Wang et al (2011) In fact the 91matched controls include about 50 pre-diabetes individualswhich is significantly higher than the general population(about 15)
Replication in the cross-sectional EPIC-Potsdamcohort
Metabolomics data from serum samples of a randomly drawnEPIC-Potsdam subcohort (nfrac14 2500) were used for replicationGlycine (ORfrac14 060 (047ndash077) Pfrac14 7410 5) and LPC(182) (ORfrac14 079 (063ndash098) Pfrac14 0037) were replicatedwhen 133 T2D patients were compared with 1253 individualswith NGT at baseline (Supplementary Table S12) Howeveracetylcarnitine C2 (ORfrac14 098 (081ndash119) Pfrac14 0858) couldnot be replicated when T2D patients were compared with NGTindividuals since the IGT participants were not available inthe data set The absolute levels of these three metaboliteswere in a similar range with only slight differences that weredue probably to the differences of the two cohorts or topotential batch effects of metabolomics measurements(Supplementary Tables S12 and S15) Thus these datatherefore provide an independent validation of the metabo-lomics study
Metabolitendashprotein interaction networks confirmedby transcription levels
To investigate the underlying molecular mechanism for thethree identified IGT metabolites we studied their associationswith T2D-related genes by analyzing protein-metaboliteinteraction networks (Wishart et al 2009 Szklarczyk et al2011) In all 7 out of the 46 known T2D-related genes (PPARGTCF7L2 HNF1A GCK IGF1 IRS1 and IDE) were linked to thesemetabolites through related enzymes or proteins (Figure 3A
T2D-related gene
Enzyme
Metabolite
Pathway-relatedprotein
Signaling regulation
Physical interactionTranscription
Same pathway
ActivationInhibition
A BCAC
ILMN_1667429CrAT
ILMN_1737992ALAS-H
ILMN_2385647cPLA2
ILMN_1803561
NGT IGT dT2D NGT IGT dT2DNGT IGT dT2D
P=37Endash6 P=00079P=11Endash6 P=00094
Log 2
expr
essi
on
NGT IGT dT2D
LPC (182)Glycine
PPARG IGF1 IRS1 IDE
PPAR-α AOX INS MAPK1 GR
CrAT ALAS-H cPLA2CAC
Acetylcarnitine C2
TCF7L2 HNF1A GCK
60
65
70
75
60
70
80
60
64
68
72
58
62
66
70
Figure 3 Three candidate metabolites for IGT associated with seven T2D-related genes (A) Metabolites (white) enzymes (yellow) pathway-related proteins (gray)and T2D-related genes (blue) are represented with ellipses rectangles polygons and rounded rectangles respectively Arrows next to the ellipses and rectanglesindicate altered metabolite concentrations in persons with IGT as compared with NGT and enzyme activities in individuals with IGT The 21 connections betweenmetabolites enzymes pathway-related proteins and T2D-related genes were divided after visual inspections into four categories physical interaction (purple solid line)transcription (blue dash line) signaling regulation (orange dash line) and same pathway (gray dot and dash line) The activation or inhibition is indicated For furtherinformation see Supplementary Table S12 (B) Log-transformed gene expression results of the probes of CAC CrAT ALAS-H and cPLA2 in 383 individuals with NGT104 with IGT and 26 patients with dT2D are shown from cross-sectional analysis of the KORA S4 survey The P-values were adjusted for sex age BMI physical activityalcohol intake smoking systolic BP HDL cholesterol HbA1c and fasting glucose when IGT individuals were compared with NGT participants
Biomarkers of pre-diabetesR Wang-Sattler et al
6 Molecular Systems Biology 2012 amp 2012 EMBO and Macmillan Publishers Limited
the list of 46 genes is shown in Supplementary Table S13) Tovalidate the networks the links between metabolitesenzymes pathway-related proteins and T2D-related geneswere manually checked for biochemical relevance andclassified into four groups signaling regulation transcriptionphysical interaction and the same pathway (SupplementaryTable S14)
Gene expression analysis in whole-blood samples ofparticipants from the KORA S4 revealed significant variations(P-values ranging from 9410 3 to 1110 6) of transcriptlevels of four enzymes namely carnitineacylcarnitinetranslocase (CAC) carnitine acetyltransferase (CrAT)5-aminolevulinate synthase 1 (ALAS-H) and cytosolic phos-pholipase A2 (cPLA2) which are known to be stronglyassociated with the levels of the three metabolites(Figure 3B) The clear relationship between changes inmetabolites and transcription levels of associated enzymesstrongly suggests that these metabolites are functionallyassociated with T2D genes in established pathways
Discussion
Using a cross-sectional approach (KORA S4 F4) we analyzed140 metabolites and identified three (glycine LPC (182) andC2) which are IGT-specific metabolites with high statisticalsignificance Notably these three metabolites are distinct fromthe currently known T2D risk indicators (eg age BMIsystolic BP HDL cholesterol HbA1c fasting glucose andfasting insulin) A prospective analysis (KORA S4-F4) showsthat low levels of glycine and LPC at baseline predict the risksof developing IGT andor T2D Glycine and LPC especiallywere shown to be strong predictors of glucose tolerance even7 years before disease onset Moreover those two metaboliteswere independently replicated in the EPIC-Potsdam cross-sectional study Finally based on our analysis of interactionnetworks and supported by gene expression profiles wefound that seven T2D-related genes are functionally associatedwith the three IGT candidate metabolites
Different study designs reveal progression of IGTand T2D
From a methodological point of view our study is unique withrespect to the large sample sizes and the availability ofmetabolomics data from two time points This allowed us tocompare results generated with cross-sectional and prospec-tive approaches directly as well as with results fromprospective population-based cohort and nested casendashcontroldesigns We found that individuals with IGT have elevatedconcentrations of the acetylcarnitine C2 as compared withNGT individuals only in the cross-sectional study whereas C2was unable to predict IGT and T2D 7 years before the diseaseonset We speculate that the acetylcarnitine C2 might be anevent with a quick effect
Our analysis could replicate four out of the five branched-chain and aromatic amino acids recently reported to bepredictors of T2D using nestedselected casendashcontrol samples(Wang et al 2011) However the population-based prospectivestudy employed in our study revealed that these five amino
acids are in fact not associated with future 2-h glucose valuesIt should be taken into account however that more pre-diabetes individuals (B50) were in the control group of thatstudy design and that these markers were unable to beextended to the general population (with only 04 improve-ment from the T2D risk indicators as reported in theFramingham Offspring Study) (Wang et al 2011) Most likelychanges in these amino acids happen at a later stage in thedevelopment of T2D (eg from IGT to T2D) indeed similarphenomenon was also observed in our study (SupplementaryFigure S1D) In contrast we found that combined glycine LPC(182) and C2 have 26 and 1 increment in predicting IGTandT2D in addition to the common risk indicators of T2D Thissuggests they are better candidate for early biomarkers andspecifically from NGT to IGT than the five amino acids
IFG and IGT should be considered as two differentphenotypes
By definition (WHO 1999 ADA 2010) individuals with IFG orIGT or both are considered as pre-diabetics Yet we observeddifferent behaviors regarding the change of the metabolitepanel from NGT to i-IFG or to IGT indicating that i-IFG and IGTare two different phenotypes For future studies we thereforesuggest separating IFG from IGT
Glycine
The observed decrease in the serum concentration of glycine inindividuals with IGT and dT2D may result from insulinresistance (Pontiroli et al 2004) It was already reported thatinsulin represses ALAS-H expression (Phillips and Kushner2005) As insulin sensitivity progressively decreases duringdiabetes development (McGarry 2002 Stumvoll et al 2005Faerch et al 2009 Tabak et al 2009) it is expected that theexpression levels of the enzyme increase in individuals withIGT and dT2D since ALAS-H catalyzes the condensation ofglycine and succinyl-CoA into 5-aminolevulinic acid (Bishop1990) This may explain our observation that glycine waslower in both individuals with IGT and those with dT2DHowever the level of fasting insulin in IGTand T2D individualswas higher than in NGT participants in the KORA S4 studysuggesting that yet undetected pathways may also play roleshere
Acetylcarnitine C2
Acetylcarnitine is produced by the mitochondrial matrixenzyme CrAT from carnitine and acetyl-CoA a molecule thatis a product of both fatty acid b-oxidation and glucoseoxidation and can be used by the citric acid cycle for energygeneration We observed higher transcriptional level of CrATin individuals with IGT and T2D most probably due to anactivation of the peroxisome proliferator activated receptoralpha (PPAR-a) pathway in peroxisomes (Horie et al 1981)Higher expression of CrATwould explain the elevated levels ofacetylcarnitine C2 in IGT individuals Although it is not clear ifmitochondrial CrAT is overexpressed when there is increasedfatty acid b-oxidation (eg in diabetes Noland et al 2009) it
Biomarkers of pre-diabetesR Wang-Sattler et al
amp 2012 EMBO and Macmillan Publishers Limited Molecular Systems Biology 2012 7
is expected that additional acetylcarnitine will be formed byCrAT due to increased substrate availability (acetyl-CoA)thereby releasing pyruvate dehydrogenase inhibition byacetyl-CoA and stimulating glucose uptake and oxidationAn increase of acylcarnitines and in particular of acetylcarni-tine C2 is a hallmark in diabetic people (Adams et al 2009)Cellular lipid levels are increased in humans with IGTor overtT2D who also may have altered mitochondrial function(Morino et al 2005 Szendroedi et al 2007) Together thesefindings reflect an important role of increased cellular lipidmetabolites and impaired mitochondrial b-oxidation in thedevelopment of insulin resistance (McGarry 2002 Szendroediet al 2007 Koves et al 2008)
LPC (182)
In our study individuals with IGTand dT2D had lower cPLA2transcription levels suggesting reduced cPLA2 activity As aresult a concomitant decrease in the concentration ofarachidonic acid (AA) a product of cPLA2 activity isexpected AA has been shown to inhibit glucose uptake byadipocytes (Malipa et al 2008) in a mechanism that isprobably insulin independent and that involves the GLUT-1transporter Therefore our findings may point to regulatoryeffects in individuals with IGT since the inhibition of AAproduction would result in an increased glucose uptake
Limitations
While our metabolite profiles provide a snapshot of humanmetabolism more detailed metabolic profile follow-ups withlonger time spans and more time points are necessary tofurther evaluate the development of the novel biomarkersMoreover the influence from long-term dietary habits shouldnot be ignored even though we used only serum from fastingindividuals (Altmaier et al 2011 Primrose et al 2011)Furthermore additional tissue samples (eg muscle andadipocytes) and experimental approaches are needed tocharacterize the causal pathways in detail
Conclusions
Three novel metabolites glycine LPC (182) and C2 wereidentified as pre-diabetes-specific markers Their changesmight precede other branched-chain and aromatic aminoacids markers in the progression of T2D Combined levels ofglycine LPC (182) and C2 can predict risk not only for IGT butalso for T2D Targeting the pathways that involve these newlyproposed potential biomarkers would help to take preventivesteps against T2D at an earlier stage
Materials and methods
Ethics statement
Written informed consent was obtained from each KORA and EPIC-Potsdam participant The KORA and EPIC-Potsdam studies wereapproved by the ethics committee of the Bavarian Medical Associationand the Medical Society of the State of Brandenburg respectively
Sample source and classification
The KORA surveys are population-based studies conducted in the cityof Augsburg and the surrounding towns and villages (Holle et al 2005Wichmann et al 2005) KORA is a research platform in the field ofepidemiology health economics and health-care research Foursurveys were conducted with 18 079 participants recruited from 1984to 2001 The S4 consists of 4261 individuals (aged 25ndash74 years)examined from 1999 to 2001 From 2006 to 2008 3080 participants(with an age range of 32ndash81) took part in an F4 survey Ascertainmentsof anthropometric measurements and personal interviews as well aslaboratory measurements of persons from the KORA S4F4 have beendescribed elsewhere (Rathmann et al 2009 Meisinger et al 2010Jourdan et al 2012)
Sampling
In the KORA cohort blood was drawn into S-Monovettes serum tubes(SARSTEDTAG amp Co Numbrecht Germany) in the morning between0800 and 1030 h after at least 8 h of fasting Tubes were gently invertedtwice followed by 30 min resting at room temperature to obtaincomplete coagulation For serum collection blood was centrifuged at2750 g at 151C for 10 min Serum was filled into synthetic straws whichwere stored in liquid nitrogen until the metabolic analyses wereconducted
Metabolite measurements and exclusion ofmetabolites
For the KORA S4 survey the targeted metabolomics approach wasbased on measurements with the AbsoluteIDQt p180 kit (BIOCRATESLife Sciences AG Innsbruck Austria) This method allows simulta-neous quantification of 188 metabolites using liquid chromatographyand flow injection analysisndashmass spectrometry The assay procedureshave been described previously in detail (Illig et al 2010 Romisch-Margl et al 2011) For each kit plate five references (human plasmapooled material Seralab) and three zero samples (PBS) were measuredin addition to the KORA samples To ensure data quality eachmetabolite had to meet two criteria (1) the coefficient of variance (CV)for the metabolite in the total 110 reference samples had to be smallerthan 25 In total seven outliers were removed because theirconcentrations were larger than the mean plus 5 sd (2) 50 ofall measured sample concentrations for the metabolite should beabove the limit of detection (LOD) which is defined as 3 median ofthe three zero samples In total 140 metabolites passed the qualitycontrols (Supplementary Table S15) one hexose (H1) 21 acylcarni-tines 21 amino acids 8 biogenic amines 13 sphingomyelins (SMs) 33diacyl (aa) phosphatidylcholines (PCs) 35 acyl-alkyl (ae) PCs and 8lysoPCs Concentrations of all analyzed metabolites are reportedin mM
Measurements of the 3080 KORA F4 samples and the involvedcleaning procedure have already been described in detail (Mittelstrasset al 2011 Yu et al 2012)
Gene expression analysis
Peripheral blood was drawn under fasting conditions from 599 KORAS4 individuals at the same time as the serum samples used formetabolic profiling were prepared Blood samples were collecteddirectly in PAXgene (TM) Blood RNA tubes (PreAnalytiX) The RNAextraction was performed using the PAXgene Blood miRNA kit(PreAnalytiX) Purity and integrity of RNA was assessed on theBioanalyzer (Agilent) with the 6000 Nano LabChip reagent set(Agilent) In all 500 ng of RNA was reverse-transcribed into cRNAand biotin-UTP labeled using the Illumina TotalPrep-96 RNAAmplification Kit (Ambion) In all 3000 ng of cRNA was hybridizedto the Illumina HumanHT-12 v3 Expression BeadChip Chips werewashed detected and scanned according to manufacturerrsquos instruc-tions Raw data were exported from the Illumina lsquoGenomeStudiorsquoSoftware to R The data were converted into logarithmic scores andnormalized using the quantile method (Bolstad et al 2003) The
Biomarkers of pre-diabetesR Wang-Sattler et al
8 Molecular Systems Biology 2012 amp 2012 EMBO and Macmillan Publishers Limited
sample sets comprised 383 individuals with NGT 104 with IGTand 26with dT2D The known T2D individuals were removed as had beendone for the metabolomics analysis
Data availability
Metabolite concentrations of Glycine LPC (182) and C2 with T2Dstatus in the KORA S4 and F4 are provided (Supplementary Table S16)Additional data from the KORA S4 and F4 studies including themetabolite concentrations and the gene expression with clinicalphenotypes used in this study are available upon request fromKORA-gen (httpepihelmholtz-muenchendekora-gen) Requestsshould be sent to kora-genhelmholtz-muenchende and are subjectto approval by the KORA board to ensure that appropriate condi-tions are met to preserve patient privacy Formal collaboration andco-authorship with members of the KORA study is not an automaticcondition to obtain access to the data published in the present paperMore general information about KORA including S4 and F4 study designand clinical variables can be found at httpepihelmholtz-muenchendekora-genseitenvariablen_ephp and httphelmholtz-muenchendeenkora-eninformation-for-scientistscurrent-kora-studies
Statistical analysis
Calculations were performed under the R statistical environment(httpwwwr-projectorg)
Multivariate logistic regression and linearregression
In multivariate logistic regression analysis ORs for single metaboliteswere calculated between two groups The concentration of eachmetabolite was scaled to have a mean of zero and an sd of one thusall reported OR values correspond to the change per sd of metaboliteconcentration Various T2D risk factors were added to the logisticregression analysis as covariates To handle false discovery rates frommultiple comparisons the cutoff point for significance was calculatedaccording to the Bonferroni correction at a level of 3610 4 (for atotal use of 140 metabolites at the 5 level) Because the metaboliteswere correlated within well-defined biological groups (eg 8 lysoPCs33 diacyl PCs 35 acyl-alkyl PCs and 13 SMs) this correction wasconservative
Additionally the categorized metabolite concentrations and com-bined scores (see below) were analyzed and the ORs were calculatedacross quartiles To test the trend across quartiles we assigned allindividuals either the median value of the concentrations or thecombined scores and obtained the P-values using the same regressionmodel
For linear regression analyses b estimates were calculated from theconcentration of each metabolite and the 2-h glucose value Theconcentration of each metabolite was log-transformed and normalizedto have a mean of zero and an sd of one Various risk factors in thelogistic regression were added as covariates and the same significancelevel (3610 4) was adopted
Combination of metabolites
To obtain the combined scores of metabolites the scaled metaboliteconcentrations (meanfrac14 0 sdfrac14 1) were first modeled with multi-variate logistic regression containing all confounding variables Thecoefficients of these metabolites from the model were then used tocalculate a weighted sum for each individual In accordance with thedecreasing trend of glycine and LPC (182) we inverted these values asthe combined scores
Residuals of metabolite concentrations
To avoid the influence of other confounding factors when plotting theconcentration of metabolites we used the residuals from a linear
regression model Metabolite concentrations were log-transformedand scaled (meanfrac14 0 sdfrac14 1) and the residuals were then deducedfrom the linear regression that included the corresponding confound-ing factors
Random forest stepwise selection methods andcandidate biomarker selection
To select candidate biomarkers we applied two additional methodsthe random forest selection (Breiman 2001) and the stepwiseselection which assess the metabolites as a group
Between two groups the supervised classification method ofrandom forest was first used to select the metabolites among the 30highest ranking variables of importance score allowing the bestseparation of the individuals from different groups T2D risk indicatorswere also included in this method with all the metabolites
We further selected the metabolites using stepwise selection on thelogistic regression model Metabolites with significantly differentconcentrations between the compared groups in logistic regressionand which were also selected using random forest were used in thismodel along with all the risk indicators Akaikersquos Information Criterion(AIC) was used to evaluate the performance of these subsets ofmetabolites used in the models The model with minimal AIC waschosen The AUC was used to evaluate the models
Network analysis
Metabolitendashprotein interactions from the Human Metabolome Data-base (HMDB Wishart et al 2009) and proteinndashprotein interactions inthe Search Tool for the Retrieval of Interacting GenesProteins(STRING Szklarczyk et al 2011) were used to construct a networkcontaining relationships between metabolites enzymes other pro-teins and T2D-related genes The candidate metabolites were assignedto HMDB IDs using the metaP-Server (Kastenmuller et al 2011) andtheir associated enzymes were derived according to the annotationsprovided by HMDB These enzymes were connected to the 46 T2D-related genes (considered at that point) allowing for 1 intermediateprotein (other proteins) through STRING protein functional interactionand optimized by eliminating edges with a STRING score of o07 andundirected paths The subnetworks were connected by the shortestpath from metabolites to T2D-related genes
Replication
The EPIC-Postdam is part of the multicenter EPIC study (Boeing et al1999 Riboli et al 2002) It was drawn from the general adultpopulation in Potsdam and surrounding areas and consists of 27 548participants recruited from 1994 to 1998 (Boeing et al 1999) Atbaseline participants underwent anthropometric and BP measure-ments completed an interview on prevalent diseases a questionnaireon socioeconomic and lifestyle factors and submitted a validated foodfrequency questionnaire Follow-up questionnaires were administeredevery 2ndash3 years (Bergmann et al 1999)
From the EPIC-Potsdam population a substudy of 2500 participantswas randomly selected from all participants who had provided bloodsamples at baseline (nfrac14 26 444) The substudy had a limited numberof fasting samples available Therefore non-fasting samples were alsoconsidered Out of the substudy 814 participants were excludedbecause of missing information on relevant covariates or missingfasting samples Individuals with NGT and T2D were determinedaccording to HbA1c categories defined by the American DiabetesAssociation in 2010 (ADA 2010)
In the EPIC-Potsdam study 30 ml of blood was drawn by qualifiedmedical staff during the baseline examination immediately fractio-nated into serum plasma buffy coat and erythrocytes and aliquotedinto straws The blood samples were stored in liquid nitrogen(at 1961C) until the metabolic analyses
Metabolite measurements for the EPIC-Potsdam samples wereperformed using the same kit and the same method as for the KORAF4 samples (Floegel et al 2011)
Biomarkers of pre-diabetesR Wang-Sattler et al
amp 2012 EMBO and Macmillan Publishers Limited Molecular Systems Biology 2012 9
Calculations were performed using the Statistical Analysis System(SAS) Version 92 (SAS Institute Inc Cary NC USA)
Supplementary information
Supplementary information is available at the Molecular SystemsBiology website (wwwnaturecommsb)
AcknowledgementsWe express our appreciation to all KORA and EPIC-Potsdam studyparticipants for donating their blood and time We thank the field staffin Augsburg who conducted the KORA studies The KORA groupconsisted of HE Wichmann (speaker) A Peters C Meisinger T IlligR Holle and J John as well as their co-workers and they wereresponsible for the design and conduction of the studies We thank allthe staff of the Institute of Epidemiology Helmholtz ZentrumMunchen and the Genome Analysis Center as well as theMetabolomic Platform who helped in the sample logistics themetabolite profiling assays and the genetic expression analysesespecially A Sabunchi H Chavez B Hochstrat F Scharl N Lindemannand J Scarpa We thank M Sattler W Mewes VA Raker and J Mendesfor comments and suggestions This study was supported in part by agrant from the German Federal Ministry of Education and Research(BMBF) to the German Center for Diabetes Research (DZD eV) Inaddition this work was partly supported by the BMBF projectlsquoMetabolomics of ageingrsquo (FKZ 01DO12030) and Project lsquoSysMBoSystems Biology of Metabotypesrsquo (FKZ 0315494A) Further support forthis study was obtained from the Federal Ministry of Health (BerlinGermany) the Ministry of Innovation Science Research andTechnology of the state North-Rhine Westphalia (Dusseldorf Ger-many) and the Federal Ministry of Education Science Research andTechnology (NGFN-Plus AtheroGenomics01GS0423 Berlin Ger-many) The KORA research platform and the KORA Augsburg studiesare financed by the Helmholtz Zentrum Munchen German ResearchCenter for Environmental Health which is funded by the GermanFederal Ministry of Education Science Research and Technology andby the State of Bavaria The funders had no role in study design datacollection and analysis decision to publish or preparation of themanuscript
Author contributions RWS ZY CHe KS HP AP TM HEW TP JAand TI designed the research RWS CHe CP WRM MC KH and HPperformed the experiments RWS ZY CHe ACM AF YH KH MCCHo BT HG TX EB AD KM HYO YL LX KS AP HP TM MR HEWTP JA and TI analyzed the data RWS ZY CHe ACM AF YH CHo HPTM AP MR TP and JA wrote the paper
Conflict of InterestThe authors declare that they have no conflict of interest
References
ADA (2010) Executive summary standards of medical care indiabetesndash2010 Diabetes Care 33(Suppl 1) S4ndashS10
Adams SH Hoppel CL Lok KH Zhao L Wong SW Minkler PE HwangDH Newman JW Garvey WT (2009) Plasma acylcarnitine profilessuggest incomplete long-chain fatty acid beta-oxidation and alteredtricarboxylic acid cycle activity in type 2 diabetic African-Americanwomen J Nutr 139 1073ndash1081
Altmaier E Kastenmuller G Romisch-Margl W Thorand BWeinberger KM Illig T Adamski J Doring A Suhre K (2011)Questionnaire-based self-reported nutrition habits associate withserum metabolism as revealed by quantitative targetedmetabolomics Eur J Epidemiol 26 145ndash156
Bergmann MM Bussas U Boeing H (1999) Follow-up procedures inEPIC-Germanyndashdata quality aspects European Prospective
Investigation into Cancer and Nutrition Ann Nutr Metab 43225ndash234
Bishop DF (1990) Two different genes encode delta-aminolevulinatesynthase in humans nucleotide sequences of cDNAs for thehousekeeping and erythroid genes Nucleic Acids Res 18 7187ndash7188
Boeing H Wahrendorf J Becker N (1999) EPIC-GermanyndashA source forstudies into diet and risk of chronic diseases EuropeanInvestigation into Cancer and Nutrition Ann Nutr Metab 43195ndash204
Bolstad BM Irizarry RA Astrand M Speed TP (2003) A comparison ofnormalization methods for high density oligonucleotide array databased on variance and bias Bioinformatics 19 185ndash193
Breiman L (2001) Random Forests Machine Learning 45 5ndash32Cheng S Rhee EP Larson MG Lewis GD McCabe EL Shen D Palma
MJ Roberts LD Dejam A Souza AL Deik AA Magnusson M FoxCS OrsquoDonnell CJ Vasan RS Melander O Clish CB Gerszten REWang TJ (2012) Metabolite profiling identifies pathways associatedwith metabolic risk in humans Circulation 125 2222ndash2231
Faerch K Vaag A Holst JJ Hansen T Jorgensen T Borch-Johnsen K(2009) Natural history of insulin sensitivity and insulin secretion inthe progression from normal glucose tolerance to impaired fastingglycemia and impaired glucose tolerance the Inter99 studyDiabetes Care 32 439ndash444
Floegel A Drogan D Wang-Sattler R Prehn C Illig T Adamski J JoostHG Boeing H Pischon T (2011) Reliability of serum metaboliteconcentrations over a 4-month period using a targetedmetabolomic approach PLoS ONE 6 e21103
Goek ON Doring A Gieger C Heier M Koenig W Prehn C Romisch-Margl W Wang-Sattler R Illig T Suhre K Sekula P Zhai G AdamskiJ Kottgen A Meisinger C (2012) Serum metabolite concentrationsand decreased GFR in the general population Am J Kidney Dis 60197ndash206
Holle R Happich M Lowel H Wichmann HE (2005) KORAndasha researchplatform for population based health research Gesundheitswesen67 S19ndashS25
Horie S Ishii H Suga T (1981) Changes in peroxisomal fatty acidoxidation in the diabetic rat liver J Biochem 90 1691ndash1696
Illig T Gieger C Zhai G Romisch-Margl W Wang-Sattler R Prehn CAltmaier E Kastenmuller G Kato BS Mewes HW Meitinger Tde Angelis MH Kronenberg F Soranzo N Wichmann HE Spector TDAdamski J Suhre K (2010) A genome-wide perspective of geneticvariation in human metabolism Nat Genet 42 137ndash141
Jourdan C Petersen AK Gieger C Doring A Illig T Wang-Sattler RMeisinger C Peters A Adamski J Prehn C Suhre K Altmaier EKastenmuller G Romisch-Margl W Theis FJ Krumsiek JWichmann HE Linseisen J (2012) Body fat free mass isassociated with the serum metabolite profile in a population-based study PLoS ONE 7 e40009
Kastenmuller G Romisch-Margl W Wagele B Altmaier E Suhre K(2011) metaP-server a web-based metabolomics data analysis toolJ Biomed Biotechnol 2011 1ndash7 pii 839862
Knowler WC Barrett-Connor E Fowler SE Hamman RF Lachin JMWalker EA Nathan DM (2002) Reduction in the incidence of type 2diabetes with lifestyle intervention or metformin N Engl J Med 346393ndash403
Koves TR Ussher JR Noland RC Slentz D Mosedale M Ilkayeva OBain J Stevens R Dyck JR Newgard CB Lopaschuk GD Muoio DM(2008) Mitochondrial overload and incomplete fatty acid oxida-tion contribute to skeletal muscle insulin resistance Cell Metab7 45ndash56
Krebs M Krssak M Bernroider E Anderwald C Brehm A MeyerspeerM Nowotny P Roth E Waldhausl W Roden M (2002) Mechanismof amino acid-induced skeletal muscle insulin resistance inhumans Diabetes 51 599ndash605
Malipa AC Meintjes RA Haag M (2008) Arachidonic acid and glucoseuptake by freshly isolated human adipocytes Cell Biochem Funct26 221ndash227
McGarry JD (2002) Banting lecture 2001 dysregulation of fatty acidmetabolism in the etiology of type 2 diabetes Diabetes 51 7ndash18
Biomarkers of pre-diabetesR Wang-Sattler et al
10 Molecular Systems Biology 2012 amp 2012 EMBO and Macmillan Publishers Limited
Meisinger C Strassburger K Heier M Thorand B Baumeister SE GianiG Rathmann W (2010) Prevalence of undiagnosed diabetes andimpaired glucose regulation in 35-59-year-old individuals inSouthern Germany the KORA F4 Study Diabet Med 27 360ndash362
Mittelstrass K Ried JS Yu Z Krumsiek J Gieger C Prehn C Roemisch-Margl W Polonikov A Peters A Theis FJ Meitinger T KronenbergF Weidinger S Wichmann HE Suhre K Wang-Sattler R Adamski JIllig T (2011) Discovery of sexual dimorphisms in metabolic andgenetic biomarkers PLoS Genet 7 e1002215
Morino K Petersen KF Dufour S Befroy D Frattini J Shatzkes NNeschen S White MF Bilz S Sono S Pypaert M Shulman GI (2005)Reduced mitochondrial density and increased IRS-1 serinephosphorylation in muscle of insulin-resistant offspring of type 2diabetic parents J Clin Invest 115 3587ndash3593
Muoio DM Newgard CB (2008) Mechanisms of disease molecular andmetabolic mechanisms of insulin resistance and beta-cell failure intype 2 diabetes Nat Rev Mol Cell Biol 9 193ndash205
Newgard CB An J Bain JR Muehlbauer MJ Stevens RD Lien LF HaqqAM Shah SH Arlotto M Slentz CA Rochon J Gallup D Ilkayeva OWenner BR Yancy Jr WS Eisenson H Musante G Surwit RSMillington DS Butler MD et al (2009) A branched-chain amino acid-related metabolic signature that differentiates obese and lean humansand contributes to insulin resistance Cell Metab 9 311ndash326
Noland RC Koves TR Seiler SE Lum H Lust RM Ilkayeva O StevensRD Hegardt FG Muoio DM (2009) Carnitine insufficiency causedby aging and overnutrition compromises mitochondrialperformance and metabolic control J Biol Chem 284 22840ndash22852
Phillips JD Kushner JP (2005) Fast track to the porphyrias Nat Med 111049ndash1050
Pietilainen KH Rog T Seppanen-Laakso T Virtue S Gopalacharyulu PTang J Rodriguez-Cuenca S Maciejewski A Naukkarinen JRuskeepaa AL Niemela PS Yetukuri L Tan CY Velagapudi VCastillo S Nygren H Hyotylainen T Rissanen A Kaprio JYki-Jarvinen H et al (2011) Association of lipidome remodeling inthe adipocyte membrane with acquired obesity in humans PLoSBiol 9 e1000623
Pontiroli AE Pizzocri P Caumo A Perseghin G Luzi L (2004)Evaluation of insulin release and insulin sensitivity through oralglucose tolerance test differences between NGT IFG IGT and type2 diabetes mellitus A cross-sectional and follow-up study ActaDiabetol 41 70ndash76
Primrose S Draper J Elsom R Kirkpatrick V Mathers JC Seal CBeckmann M Haldar S Beattie JH Lodge JK Jenab M Keun HScalbert A (2011) Metabolomics and human nutrition Br J Nutr 1051277ndash1283
Rathmann W Kowall B Heier M Herder C Holle R Thorand BStrassburger K Peters A Wichmann HE Giani G Meisinger C (2010)Prediction models for incident type 2 diabetes mellitusin the olderpopulation KORA S4F4 cohort study Diabet Med 27 1116ndash1123
Rathmann W Strassburger K Heier M Holle R Thorand B Giani GMeisinger C (2009) Incidence of Type 2 diabetes in the elderlyGerman population and the effect of clinical and lifestyle riskfactors KORA S4F4 cohort study Diabet Med 26 1212ndash1219
Rhee EP Cheng S Larson MG Walford GA Lewis GD McCabe EYang E Farrell L Fox CS OrsquoDonnell CJ Carr SA Vasan RSFlorez JC Clish CB Wang TJ Gerszten RE (2011) Lipid profilingidentifies a triacylglycerol signature of insulin resistance and improvesdiabetes prediction in humans J Clin Invest 121 1402ndash1411
Riboli E Hunt KJ Slimani N Ferrari P Norat T Fahey M CharrondiereUR Hemon B Casagrande C Vignat J Overvad K Tjonneland AClavel-Chapelon F Thiebaut A Wahrendorf J Boeing HTrichopoulos D Trichopoulou A Vineis P Palli D et al (2002)European Prospective Investigation into Cancer and Nutrition(EPIC) study populations and data collection Public Health Nutr 51113ndash1124
Romisch-Margl W Prehn C Bogumil R Roehring C Suhre KJA(2012) Procedure for tissue sample preparation and metabolite
extraction for high-throughput targeted metabolomics Metabolomics8 133ndash142
Shaham O Wei R Wang TJ Ricciardi C Lewis GD Vasan RS Carr SAThadhani R Gerszten RE Mootha VK (2008) Metabolic profiling ofthe human response to a glucose challenge reveals distinct axes ofinsulin sensitivity Mol Syst Biol 4 214
Stumvoll M Goldstein BJ van Haeften TW (2005) Type 2 diabetesprinciples of pathogenesis and therapy Lancet 365 1333ndash1346
Szendroedi J Schmid AI Chmelik M Toth C Brehm A Krssak MNowotny P Wolzt M Waldhausl W Roden M (2007) Musclemitochondrial ATP synthesis and glucose transportphosphorylation in type 2 diabetes PLoS Med 4 e154
Szklarczyk D Franceschini A Kuhn M Simonovic M Roth A MinguezP Doerks T Stark M Muller J Bork P Jensen LJ von Mering C(2011) The STRING database in 2011 functional interactionnetworks of proteins globally integrated and scored NucleicAcids Res 39 D561ndashD568
Tabak AG Herder C Rathmann W Brunner EJ Kivimaki M (2012)Prediabetes a high-risk state for diabetes development Lancet 3792279ndash2290
Tabak AG Jokela M Akbaraly TN Brunner EJ Kivimaki M Witte DR(2009) Trajectories of glycaemia insulin sensitivity and insulinsecretion before diagnosis of type 2 diabetes an analysis from theWhitehall II study Lancet 373 2215ndash2221
Tuomilehto J Lindstrom J Eriksson JG Valle TT Hamalainen HIlanne-Parikka P Keinanen-Kiukaanniemi S Laakso M LouherantaA Rastas M Salminen V Uusitupa M (2001) Prevention of type 2diabetes mellitus by changes in lifestyle among subjects withimpaired glucose tolerance N Engl J Med 344 1343ndash1350
Wang TJ Larson MG Vasan RS Cheng S Rhee EP McCabe E LewisGD Fox CS Jacques PF Fernandez C OrsquoDonnell CJ Carr SAMootha VK Florez JC Souza A Melander O Clish CB Gerszten RE(2011) Metabolite profiles and the risk of developing diabetes NatMed 17 448ndash453
WHO (1999) Definition diagnosis and classification of diabetesmellitus and its complications Part 1 diagnosis and classificationof diabetes mellitus Report of a WHO Consultation Geneva pp 59
Wichmann HE Gieger C Illig T (2005) KORA-genndashresource forpopulation genetics controls and a broad spectrum of diseasephenotypes Gesundheitswesen 67(Suppl 1) S26ndashS30
Wishart DS Knox C Guo AC Eisner R Young N Gautam B Hau DDPsychogios N Dong E Bouatra S Mandal R Sinelnikov I Xia J JiaL Cruz JA Lim E Sobsey CA Shrivastava S Huang P Liu P et al(2009) HMDB a knowledgebase for the human metabolomeNucleic Acids Res 37 D603ndashD610
Wopereis S Rubingh CM van Erk MJ Verheij ER van Vliet T CnubbenNH Smilde AK van der Greef J van Ommen B Hendriks HF (2009)Metabolic profiling of the response to an oral glucose tolerance testdetects subtle metabolic changes PLoS ONE 4 e4525
Yu Z Zhai G Singmann P He Y Xu T Prehn C Romisch-Margl WLattka E Gieger C Soranzo N Heinrich J Standl M Thiering EMittelstrass K Wichmann HE Peters A Suhre K Li Y Adamski JSpector TD et al (2012) Human serum metabolic profiles are agedependent Aging Cell (e-pub ahead of print 26 July 2012doi101111j1474-9726201200865x)
Zhao X Fritsche J Wang J Chen J Rittig K Schmitt-Kopplin P FritscheA Haring HU Schleicher ED Xu G Lehmann R (2010)Metabonomic fingerprints of fasting plasma and spot urine revealhuman pre-diabetic metabolic traits Metabolomics 6 362ndash374
Molecular Systems Biology is an open-access journalpublished by European Molecular Biology Organiza-
tion and Nature Publishing Group This work is licensed under aCreative Commons Attribution-Noncommercial-Share Alike 30Unported License
Biomarkers of pre-diabetesR Wang-Sattler et al
amp 2012 EMBO and Macmillan Publishers Limited Molecular Systems Biology 2012 11
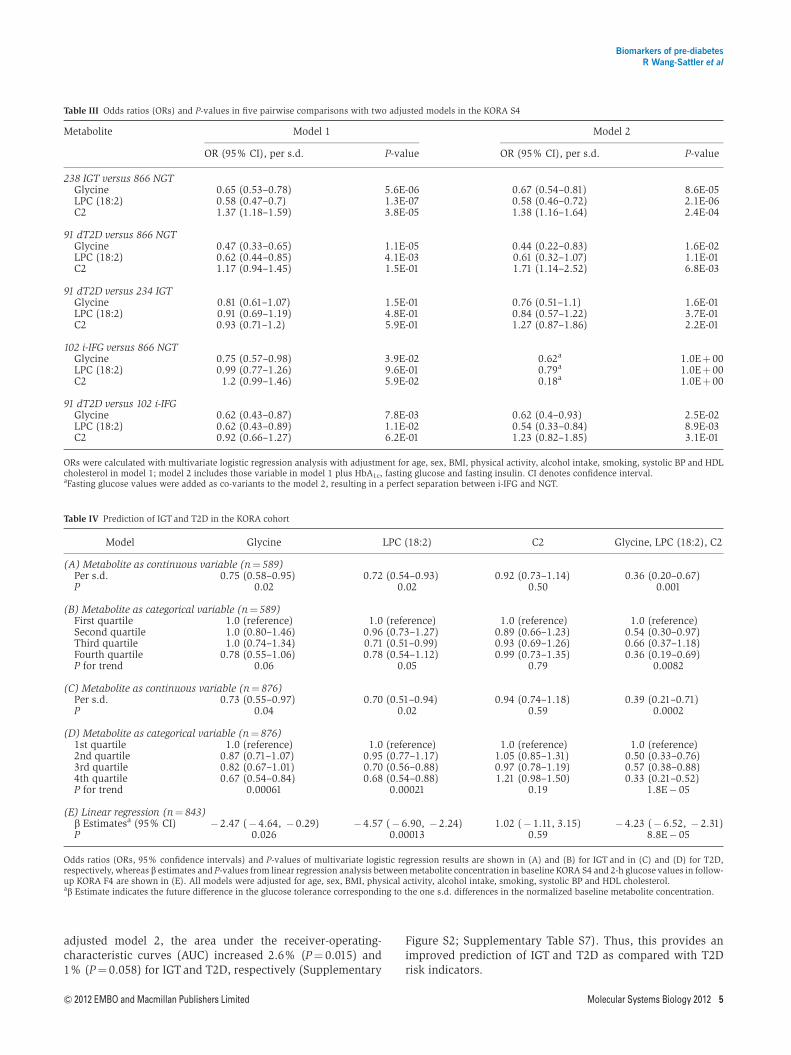
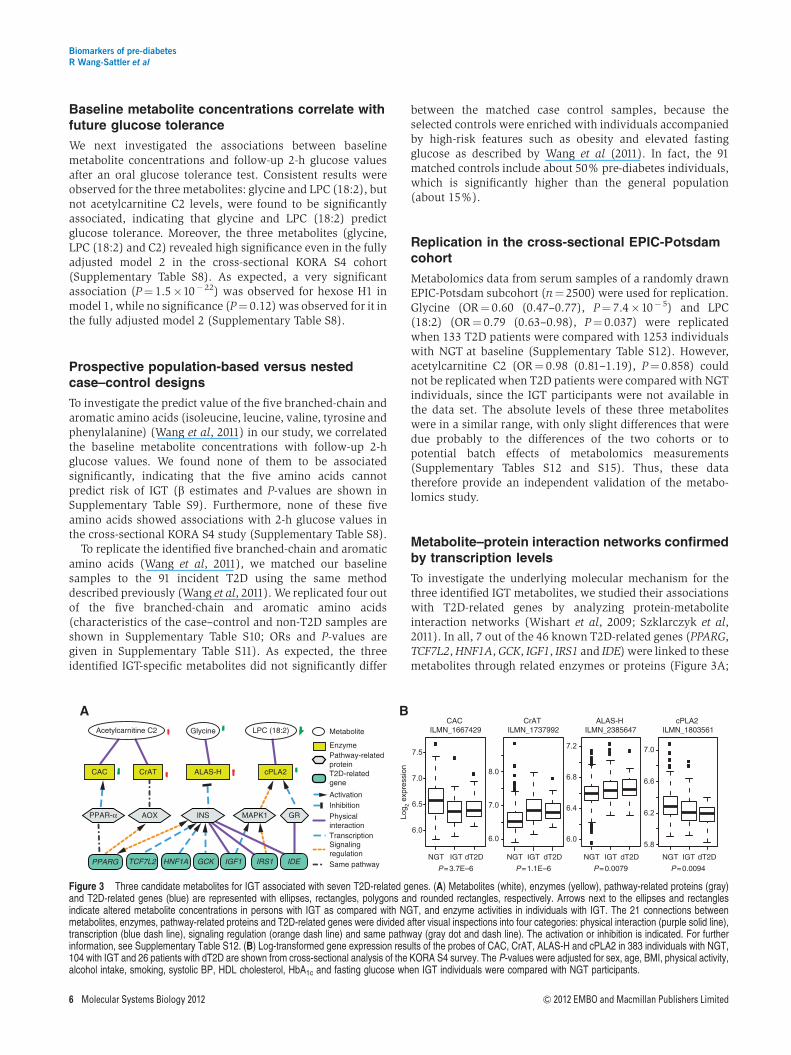
Related Documents