NOVEL APPROACHES TO EVALUATION, MODELLING AND EMULATION OF ADVANCED BOOSTING SYSTEMS Prof. Sam Akehurst Powertrain & Vehicle Research Centre, University of Bath, UK SAE International Powertrains Fuels and Lubricants San Antonio, USA January 22 nd 2019

Welcome message from author
This document is posted to help you gain knowledge. Please leave a comment to let me know what you think about it! Share it to your friends and learn new things together.
Transcript

NOVEL APPROACHES TO EVALUATION, MODELLING AND EMULATION OF ADVANCED BOOSTING SYSTEMS
Prof. Sam Akehurst
Powertrain & Vehicle Research Centre, University of Bath, UK
SAE International Powertrains Fuels and Lubricants
San Antonio, USA January 22nd 2019
SAE INTERNATIONAL
Introduction – Why boost an engine?
2
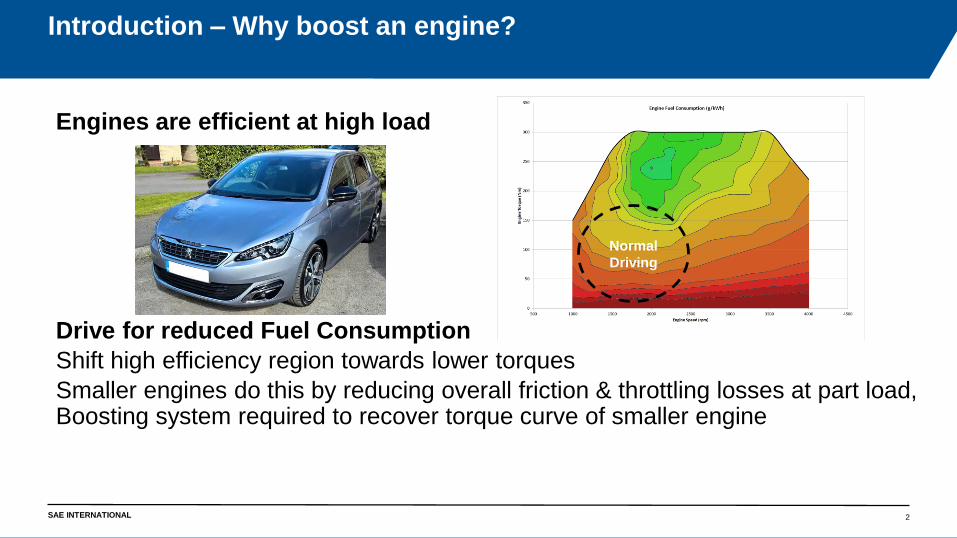
Engines are efficient at high load
Drive for reduced Fuel Consumption
Shift high efficiency region towards lower torques
Smaller engines do this by reducing overall friction & throttling losses at part load, Boosting system required to recover torque curve of smaller engine
Normal
Driving
SAE INTERNATIONAL
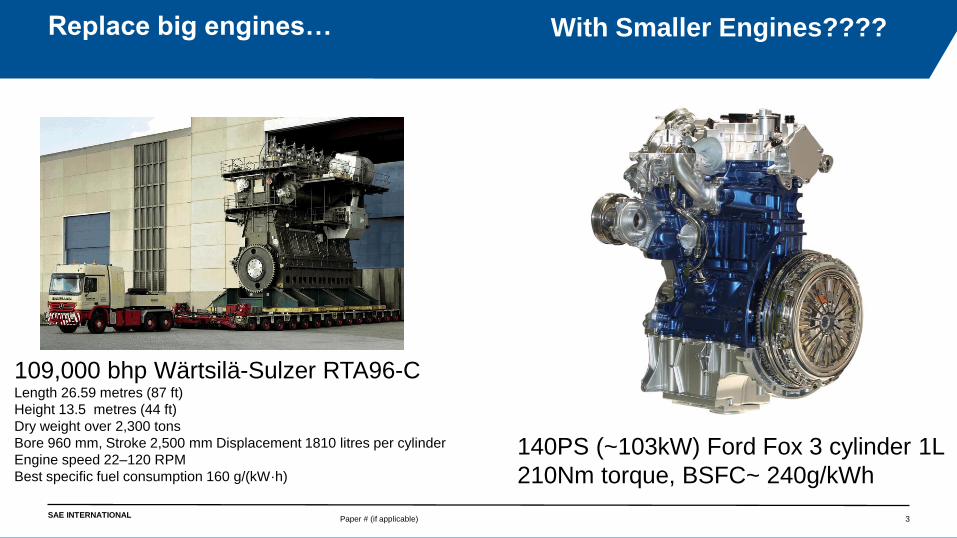
Replace big engines…
Paper # (if applicable) 3
With Smaller Engines????
109,000 bhp Wärtsilä-Sulzer RTA96-CLength 26.59 metres (87 ft)
Height 13.5 metres (44 ft)
Dry weight over 2,300 tons
Bore 960 mm, Stroke 2,500 mm Displacement 1810 litres per cylinder
Engine speed 22–120 RPM
Best specific fuel consumption 160 g/(kW·h)
140PS (~103kW) Ford Fox 3 cylinder 1L
210Nm torque, BSFC~ 240g/kWh
SAE INTERNATIONAL
Boosting Challenges
4
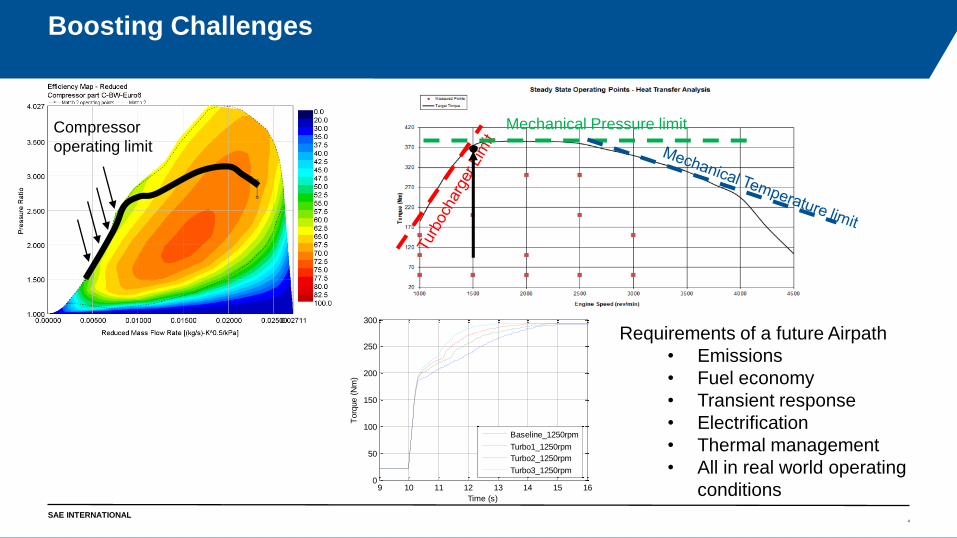
Compressor
operating limit
9 10 11 12 13 14 15 160
50
100
150
200
250
300
Time (s)
Torq
ue (
Nm
)
Baseline_1250rpm
Turbo1_1250rpm
Turbo2_1250rpm
Turbo3_1250rpm
Mechanical Pressure limit
Requirements of a future Airpath
• Emissions
• Fuel economy
• Transient response
• Electrification
• Thermal management
• All in real world operating
conditions
SAE INTERNATIONAL
Contents
Boosting Technology
Modelling techniques
Experimental techniques
Novel Technologies
Conclusions
5

SAE INTERNATIONAL
Contents
Boosting Technology
Modelling techniques
Experimental techniques
Novel Technologies
Conclusions
6
SAE INTERNATIONAL
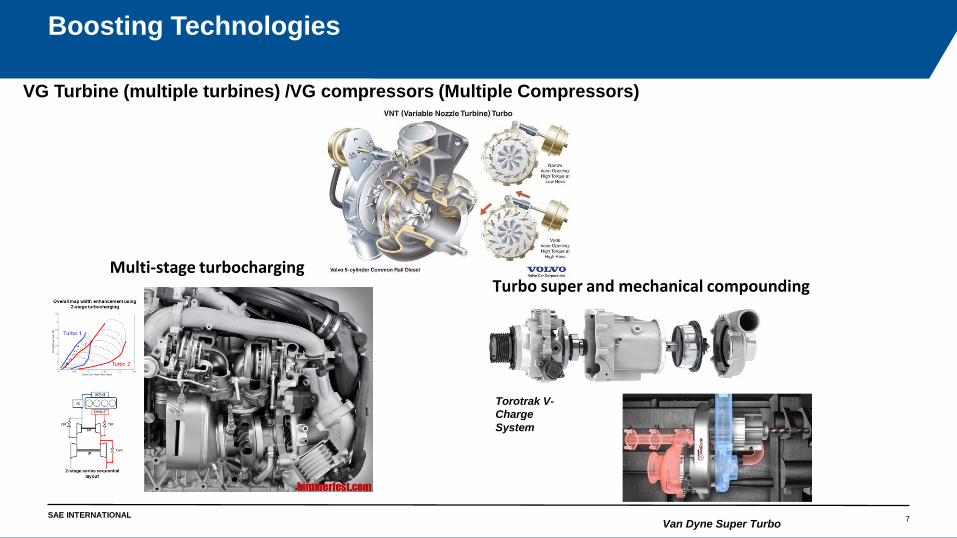
Boosting Technologies
7
VG Turbine (multiple turbines) /VG compressors (Multiple Compressors)
Multi-stage turbochargingTurbo super and mechanical compounding
Van Dyne Super Turbo
Torotrak V-
Charge
System
SAE INTERNATIONAL
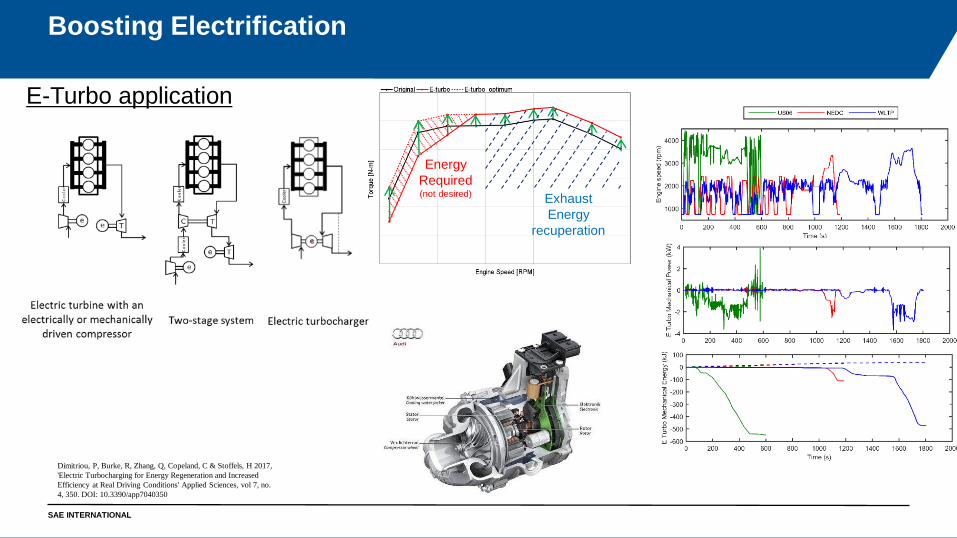
Boosting Electrification
E-Turbo application
Use of larger
turbocharger
Exhaust
Energy
recuperation
Exhaust
Energy
recuperation
Use e-turbo to
make up low
speed torque Exhaust
Energy
recuperation
Energy
Required(not desired)
Dimitriou, P, Burke, R, Zhang, Q, Copeland, C & Stoffels, H 2017,
'Electric Turbocharging for Energy Regeneration and Increased
Efficiency at Real Driving Conditions' Applied Sciences, vol 7, no.
4, 350. DOI: 10.3390/app7040350

SAE INTERNATIONAL
Boosting Electrification
System Opportunities
Offers a low weight option for deployment of electrical energy
Offers the possibility to recuperate exhaust heat
Can improve transient response
Can lead to fuel economy benefits by relaxing transient requirements of other
engine features
System Challenges
Energy flow need to be managed carefully with other systems
Benefits are only apparent with review of full system design (not simply a retrofit)
System needs to be designed and controlled in an optimal way
9
SAE INTERNATIONAL
Contents
Boosting Technology
Modelling techniques
Experimental techniques
Novel Technologies
Conclusions
10
SAE INTERNATIONAL
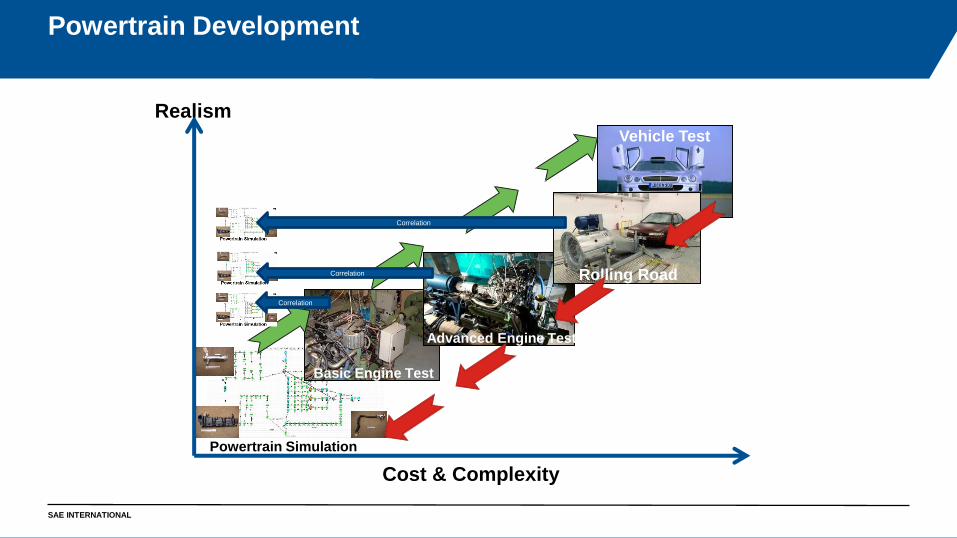
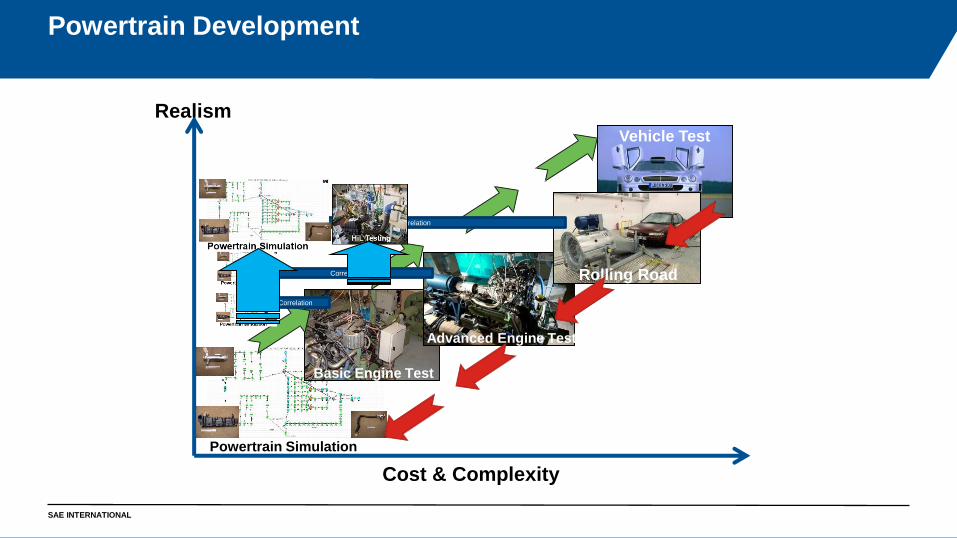
Cost & Complexity
Realism
Vehicle Test
Powertrain Simulation
Basic Engine Test
Powertrain Development
Advanced Engine Test
Rolling Road
Correlation
Correlation
Correlation
SAE INTERNATIONAL
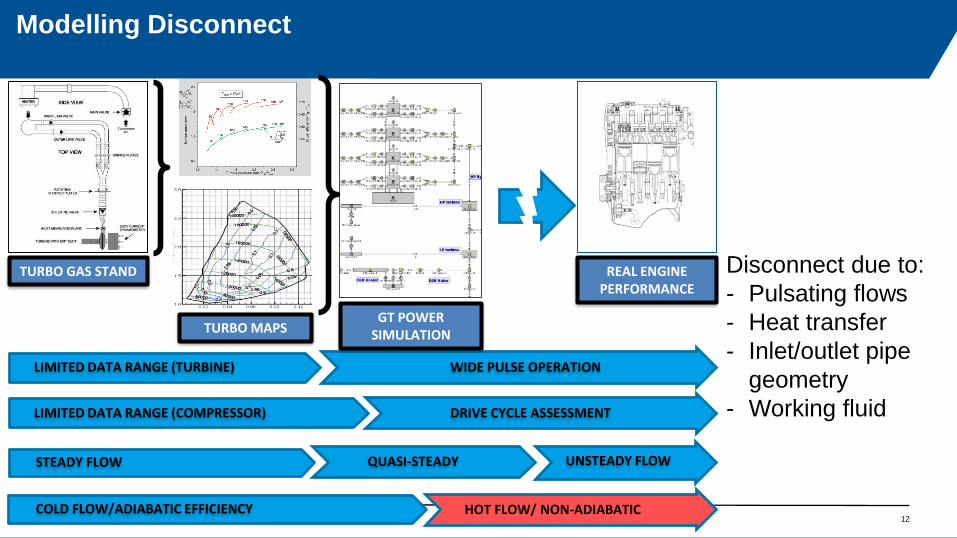
Modelling Disconnect
Paper # (if applicable) 12
REAL ENGINE PERFORMANCE
STEADY FLOW
TURBO GAS STAND
TURBO MAPSGT POWER
SIMULATION
UNSTEADY FLOWQUASI-STEADY
HOT FLOW/ NON-ADIABATIC
LIMITED DATA RANGE (TURBINE) WIDE PULSE OPERATION
COLD FLOW/ADIABATIC EFFICIENCY
LIMITED DATA RANGE (COMPRESSOR) DRIVE CYCLE ASSESSMENT
Disconnect due to:
- Pulsating flows
- Heat transfer
- Inlet/outlet pipe
geometry
- Working fluid

SAE INTERNATIONAL
Turbocharger Heat Transfer
13
Complex Heat transfer in turbochargers affects
accuracy of 1D models in predicting exhaust gas
temperatures and multi stage system performance
Lumped Capacitance Models have
many parameters to be determined Option 1:
Destructive
testing
Campaign
EXPENSIVE
Option 2:
Parameter
prediction by 3D
Simulation
UNCERTAIN
Option 3: Simultaneous transient
characterisation of efficiency and heat
transfer
Status:
- Concept demonstrated for
Compressor in idealised situation
Turbocentre focus:
- Confirmation for compressor in non-
idealised situation
- Application to turbine

SAE INTERNATIONAL
Turbocharger Heat Transfer
14
Understand the problem by experiments and
3D simulationCreate simplified model structure
Integrate with other models
SAE INTERNATIONAL
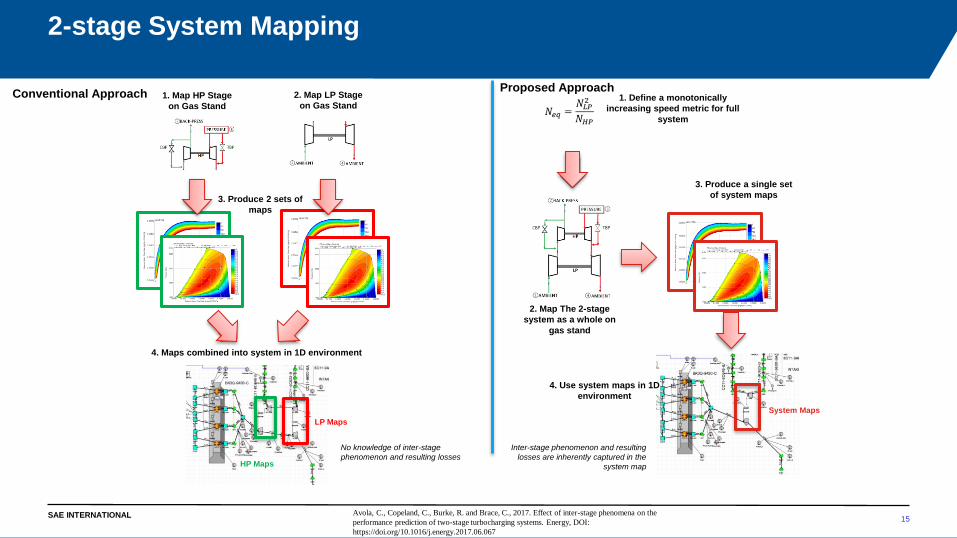
2-stage System Mapping
15
Conventional ApproachProposed Approach
1. Map HP Stage
on Gas Stand
2. Map LP Stage
on Gas Stand
3. Produce 2 sets of
maps
4. Maps combined into system in 1D environment
HP Maps
LP Maps
System Maps
1. Define a monotonically
increasing speed metric for full
system
2. Map The 2-stage
system as a whole on
gas stand
3. Produce a single set
of system maps
4. Use system maps in 1D
environment
No knowledge of inter-stage
phenomenon and resulting losses
Inter-stage phenomenon and resulting
losses are inherently captured in the
system map
Avola, C., Copeland, C., Burke, R. and Brace, C., 2017. Effect of inter-stage phenomena on the
performance prediction of two-stage turbocharging systems. Energy, DOI:
https://doi.org/10.1016/j.energy.2017.06.067
SAE INTERNATIONAL
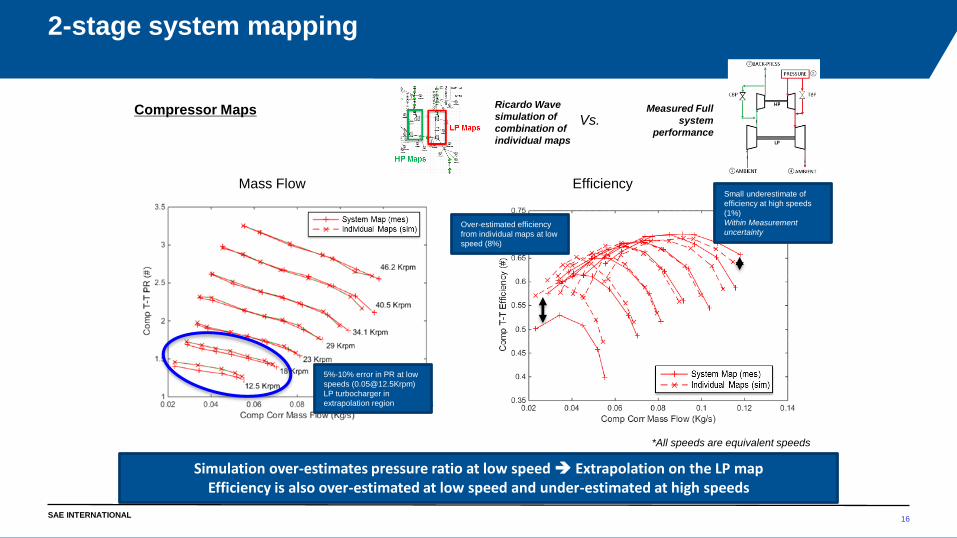
2-stage system mapping
16
Simulation over-estimates pressure ratio at low speed ➔ Extrapolation on the LP mapEfficiency is also over-estimated at low speed and under-estimated at high speeds
Mass Flow Efficiency
Compressor Maps
5%-10% error in PR at low
speeds ([email protected])
LP turbocharger in
extrapolation region
Over-estimated efficiency
from individual maps at low
speed (8%)
Small underestimate of
efficiency at high speeds
(1%)
Within Measurement
uncertainty
Measured Full
system
performanceVs.
*All speeds are equivalent speeds
Ricardo Wave
simulation of
combination of
individual maps
SAE INTERNATIONAL
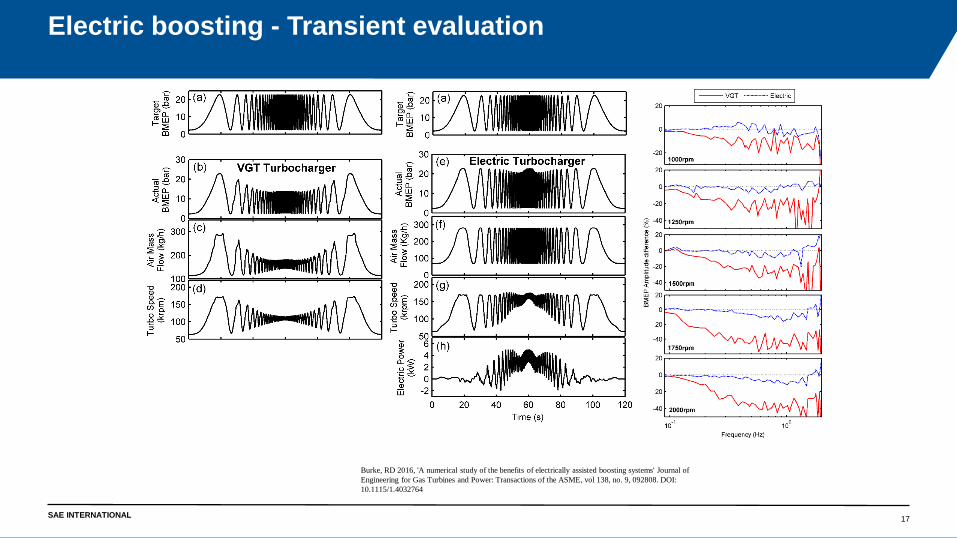
Electric boosting - Transient evaluation
17
Burke, RD 2016, 'A numerical study of the benefits of electrically assisted boosting systems' Journal of
Engineering for Gas Turbines and Power: Transactions of the ASME, vol 138, no. 9, 092808. DOI:
10.1115/1.4032764
SAE INTERNATIONAL
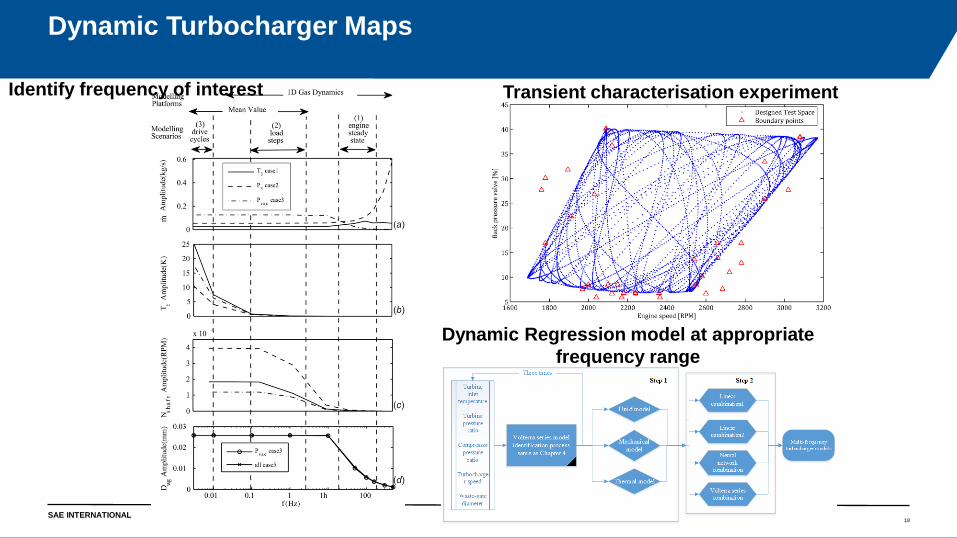
Dynamic Turbocharger Maps
18
Transient characterisation experiment
Dynamic Regression model at appropriate
frequency range
Identify frequency of interest
SAE INTERNATIONAL
Contents
Boosting Technology
Modelling techniques
Experimental techniques
Novel Technologies
Conclusions
19
SAE INTERNATIONAL
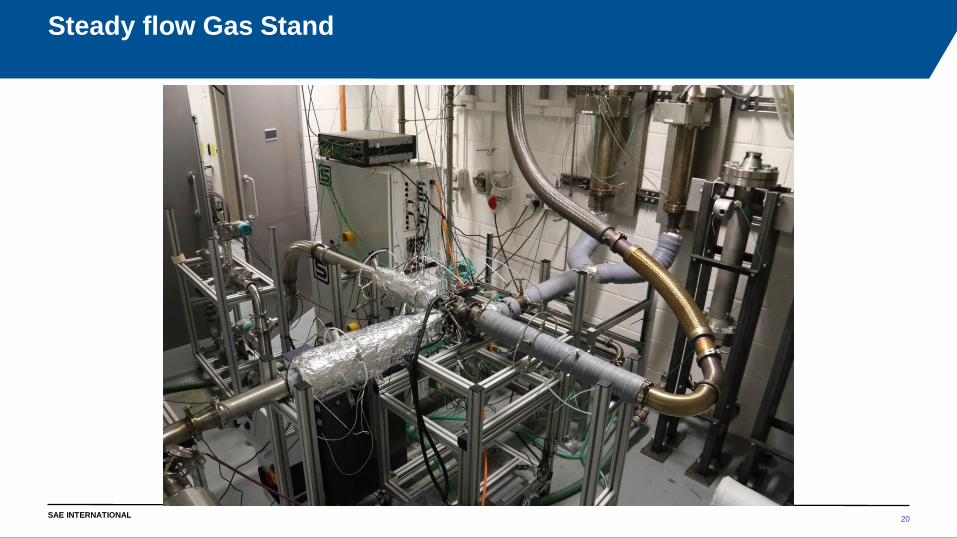
Steady flow Gas Stand
20

SAE INTERNATIONAL
Effect of Pulsations
21
Pulsation flow
at the turbine
inlet
Back pressure
valve at
compressor
outlet
SAE INTERNATIONAL
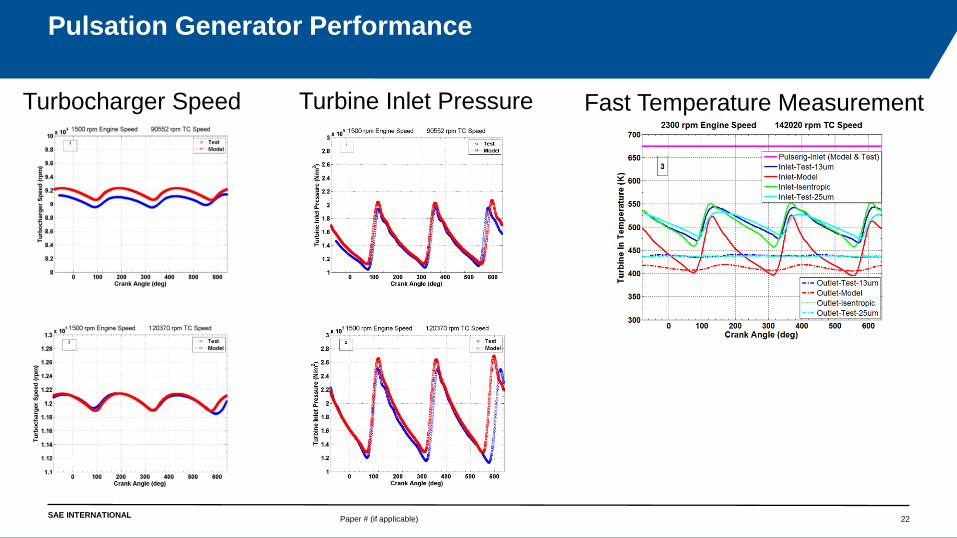
Pulsation Generator Performance
Paper # (if applicable) 22
Turbocharger Speed Turbine Inlet Pressure Fast Temperature Measurement
SAE INTERNATIONAL
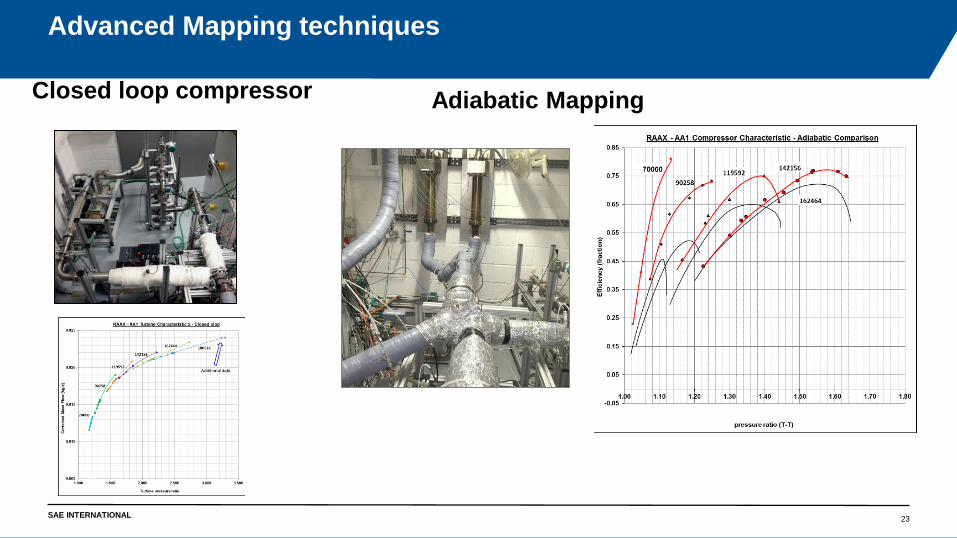
Advanced Mapping techniques
Closed loop compressor
23
Adiabatic Mapping

SAE INTERNATIONAL
X-i-L testing methods – Engine/Airpath
Turbomachinery without engine
Gas Stand, Engine Gas Stand
Engine without boosting hardware
Boost emulation rig
24
Boosting system emulation
Engine Based Gas Stand A
Boost Rig
Exhaust back
pressure valve to
emulate turbine
Boost Rig Comp. back
pressure valve
Test
Piece
Te
st P
iece
Engine Based Gas Stand B
Test Piece
SAE INTERNATIONAL
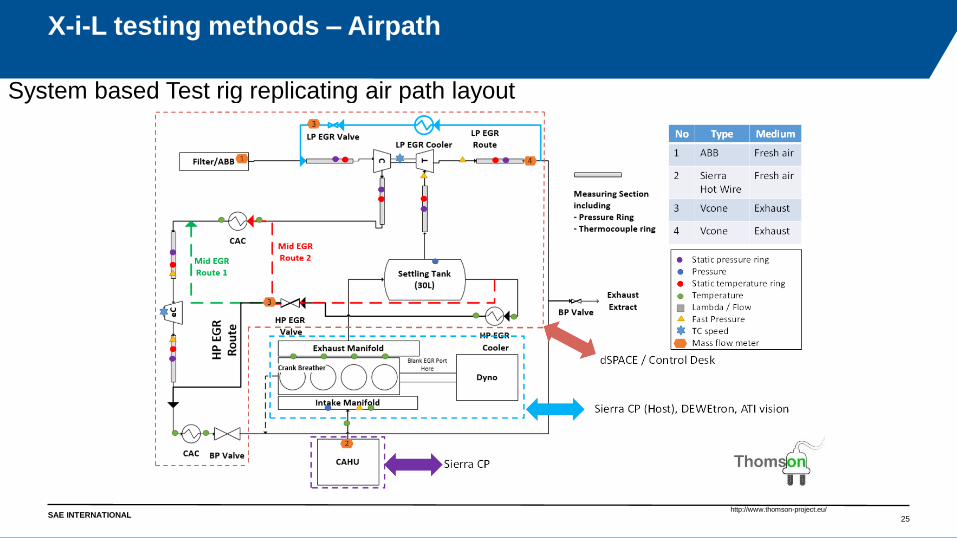
X-i-L testing methods – Airpath
System based Test rig replicating air path layout
25
http://www.thomson-project.eu/

SAE INTERNATIONAL
X-i-L testing methods – Airpath
26
• Built around a 2.2L PUMA Diesel Engine and a Boost rig
• Component level test– Turbocharger turbine & compressor & E-Booster
• Rig successfully commissioned and a range of test data collected
LP EGR to
Compressor Inlet
Settling Tank
Boost rig
(8bar Max)
ABB flow
meter
(0-720kg/h)
2.2L Diesel engineVGT
Turbo
Measuring
Sections
Oil
conditioning
Unit
http://www.thomson-project.eu/

SAE INTERNATIONAL
Experimental Result
Paper # (if applicable) 27
Component level example 1: Turbocharger compressor map
• Steady flow compressor map from the EGS and conventional GS
• Marginally higher PR and lower heat transfer increase compressor efficiency in EGS
SAE INTERNATIONAL
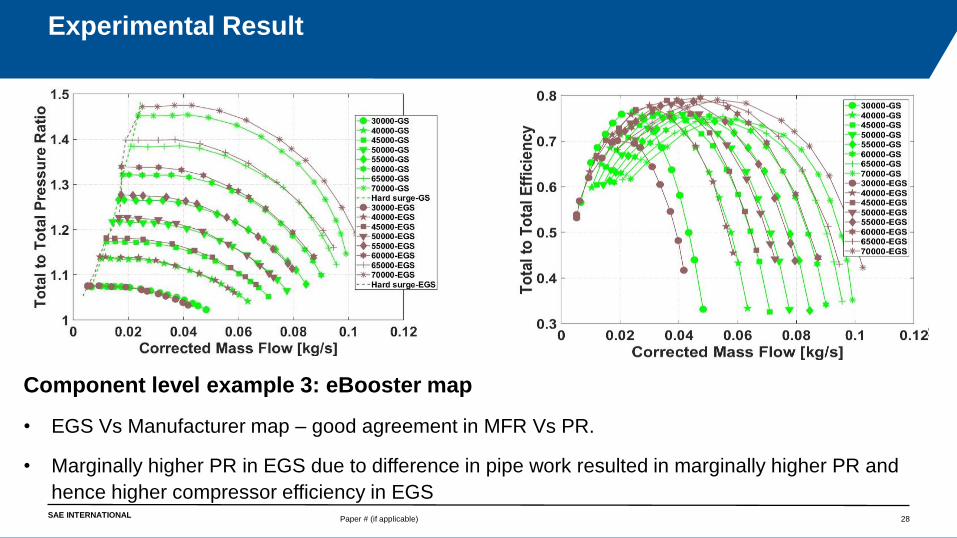
Experimental Result
Paper # (if applicable) 28
Component level example 3: eBooster map
• EGS Vs Manufacturer map – good agreement in MFR Vs PR.
• Marginally higher PR in EGS due to difference in pipe work resulted in marginally higher PR and
hence higher compressor efficiency in EGS
SAE INTERNATIONAL
Contents
Boosting Technology
Modelling techniques
Experimental techniques
Novel Technologies
Conclusions
29
SAE INTERNATIONAL30
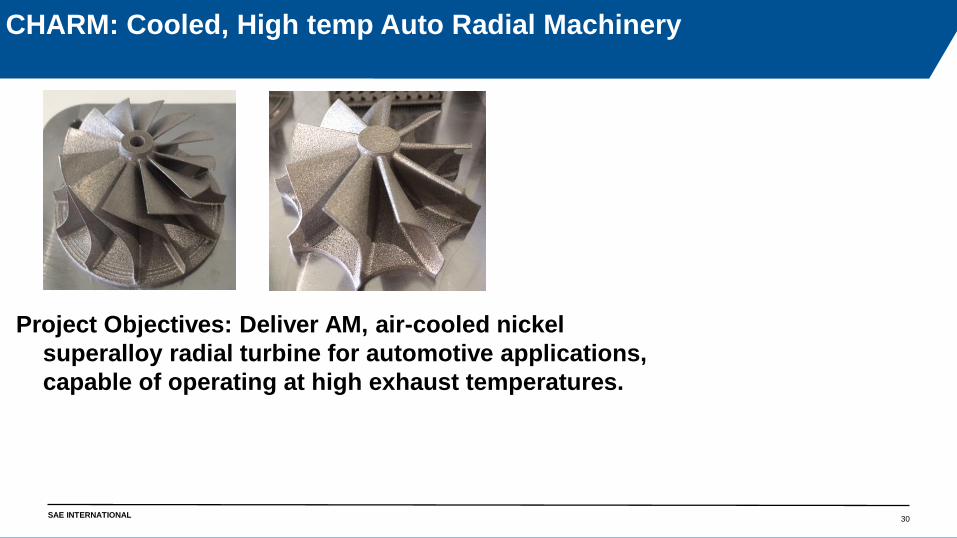
CHARM: Cooled, High temp Auto Radial Machinery
Project Objectives: Deliver AM, air-cooled nickel
superalloy radial turbine for automotive applications,
capable of operating at high exhaust temperatures.

SAE INTERNATIONALPaper # (if applicable) 31
SLM Internally Cooled Turbine Wheel
SAE INTERNATIONAL
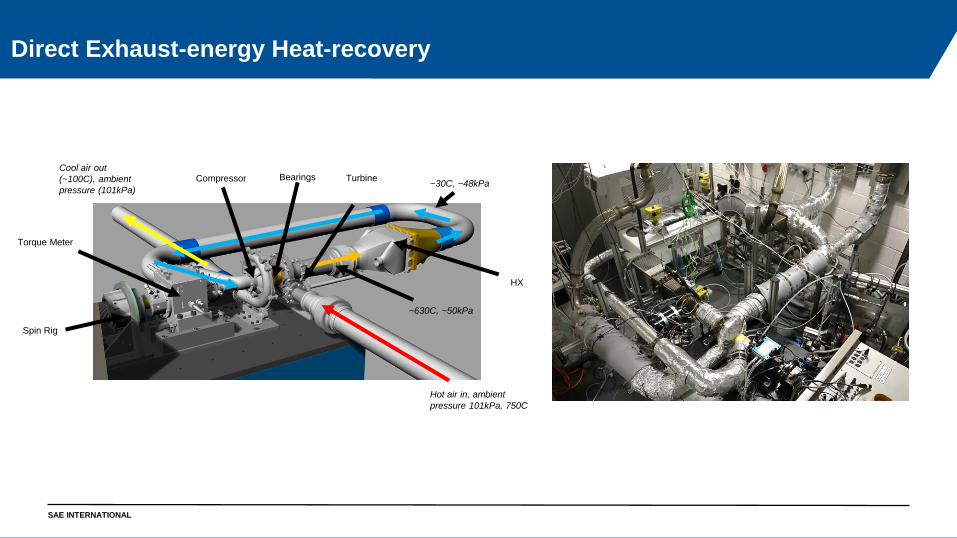
Direct Exhaust-energy Heat-recovery
Hot air in, ambient
pressure 101kPa, 750C
HX
TurbineCompressor Bearings
Torque Meter
Spin Rig
Cool air out
(~100C), ambient
pressure (101kPa)
~630C, ~50kPa
~30C, ~48kPa
SAE INTERNATIONAL
Contents
Boosting Technology
Modelling techniques
Experimental techniques
Novel Technologies
Conclusions
33
SAE INTERNATIONAL
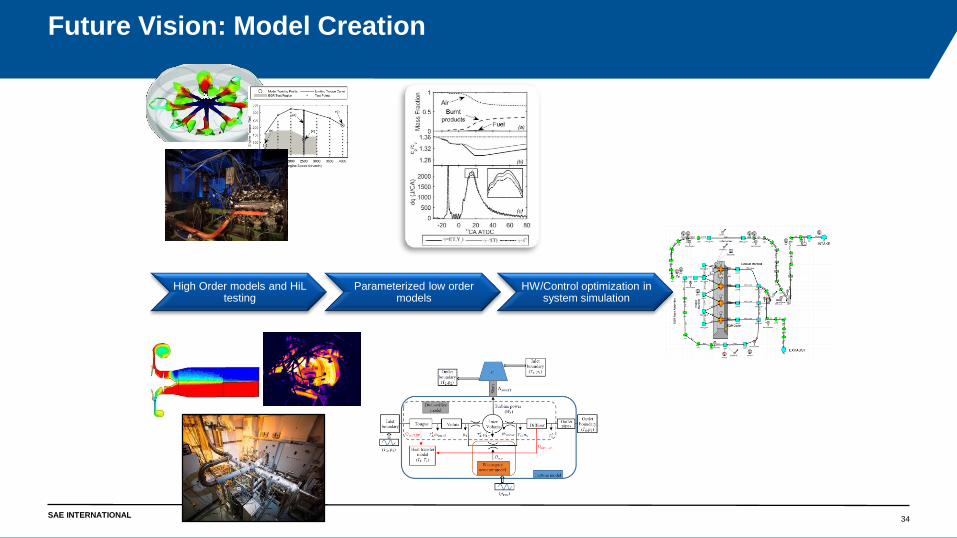
Future Vision: Model Creation
34
High Order models and HiLtesting
Parameterized low order models
HW/Control optimization in system simulation
SAE INTERNATIONAL
Cost & Complexity
Realism
Vehicle Test
Powertrain Simulation
Basic Engine Test
Powertrain Development
Advanced Engine Test
Rolling Road
Correlation
Correlation
Correlation
SAE INTERNATIONAL
Acknowledgements
Paper # (if applicable)
36
Some of this work was conducted with funding from the THOMSON (Mild
Hybrid cost effective solutions for a fast Market penetratiON) project
which has received funding from the European Union’s Horizon 2020
Programme for research, technological development and demonstration
under Agreement no. 724037
Additional work is a part of the Advanced Combustion Turbocharged Inline
Variable valve train Engine (ACTIVE) project (Reference: 39215-287151)
and was developed with the financial support from Advanced
Propulsion Centre (APC). The authors would like to Ford Dunton
Technical Centre (UK), Continental Automotive Trading UK Ltd
SAE INTERNATIONAL
Thank you, Any questions?
Thank you
– Sam Akehurst
– Powertrain & Vehicle Research Centre
– University of Bath
– +44(0)7717363082
Paper # (if applicable) 37
Department of Mechanical Engineering
Powertrain & Vehicle Research Centre
Thanks to my colleagues Dr Richard
Burke, Dr Colin Copeland and many others
Related Documents