Nova Scotia CAP Jens von Bergmann MountainMath Software and Analytics August 20, 2020

Welcome message from author
This document is posted to help you gain knowledge. Please leave a comment to let me know what you think about it! Share it to your friends and learn new things together.
Transcript
Nova Scotia CAP
Jens von Bergmann
MountainMath Software and Analytics
August 20, 2020
1. PROPERTY TAXES
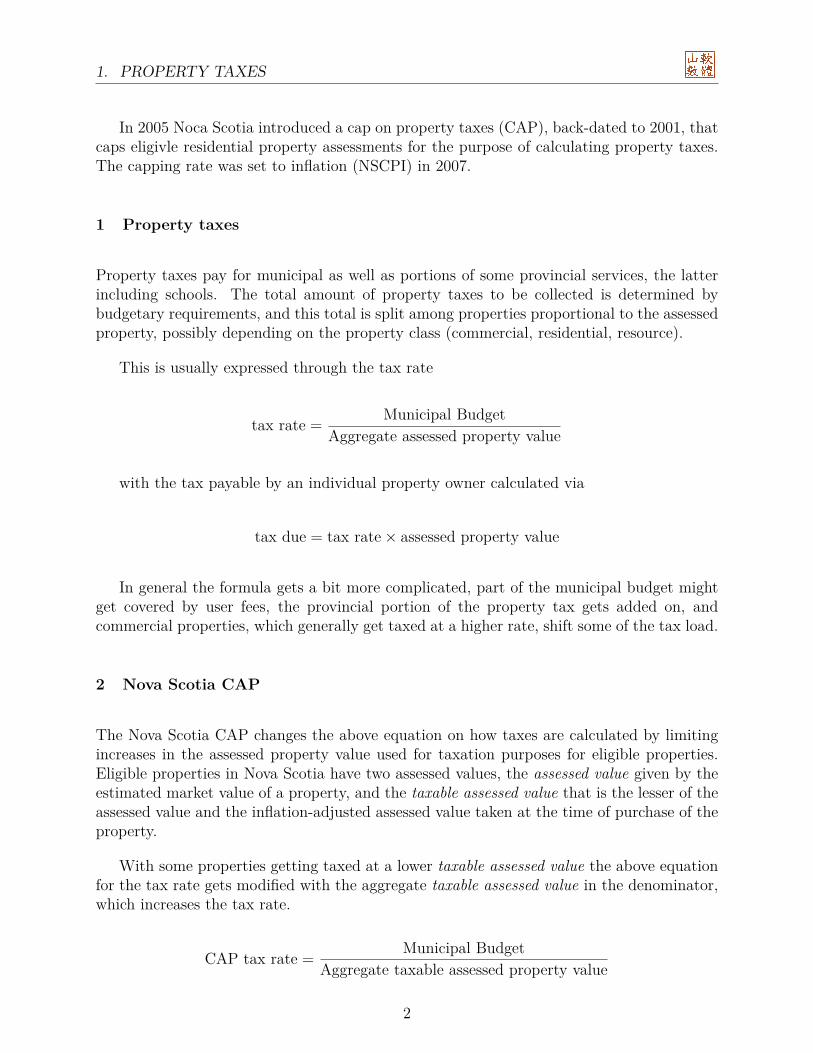
In 2005 Noca Scotia introduced a cap on property taxes (CAP), back-dated to 2001, thatcaps eligivle residential property assessments for the purpose of calculating property taxes.The capping rate was set to inflation (NSCPI) in 2007.
1 Property taxes
Property taxes pay for municipal as well as portions of some provincial services, the latterincluding schools. The total amount of property taxes to be collected is determined bybudgetary requirements, and this total is split among properties proportional to the assessedproperty, possibly depending on the property class (commercial, residential, resource).
This is usually expressed through the tax rate
tax rate = Municipal BudgetAggregate assessed property value
with the tax payable by an individual property owner calculated via
tax due = tax rate × assessed property value
In general the formula gets a bit more complicated, part of the municipal budget mightget covered by user fees, the provincial portion of the property tax gets added on, andcommercial properties, which generally get taxed at a higher rate, shift some of the tax load.
2 Nova Scotia CAP
The Nova Scotia CAP changes the above equation on how taxes are calculated by limitingincreases in the assessed property value used for taxation purposes for eligible properties.Eligible properties in Nova Scotia have two assessed values, the assessed value given by theestimated market value of a property, and the taxable assessed value that is the lesser of theassessed value and the inflation-adjusted assessed value taken at the time of purchase of theproperty.
With some properties getting taxed at a lower taxable assessed value the above equationfor the tax rate gets modified with the aggregate taxable assessed value in the denominator,which increases the tax rate.
CAP tax rate = Municipal BudgetAggregate taxable assessed property value
2
2. NOVA SCOTIA CAP
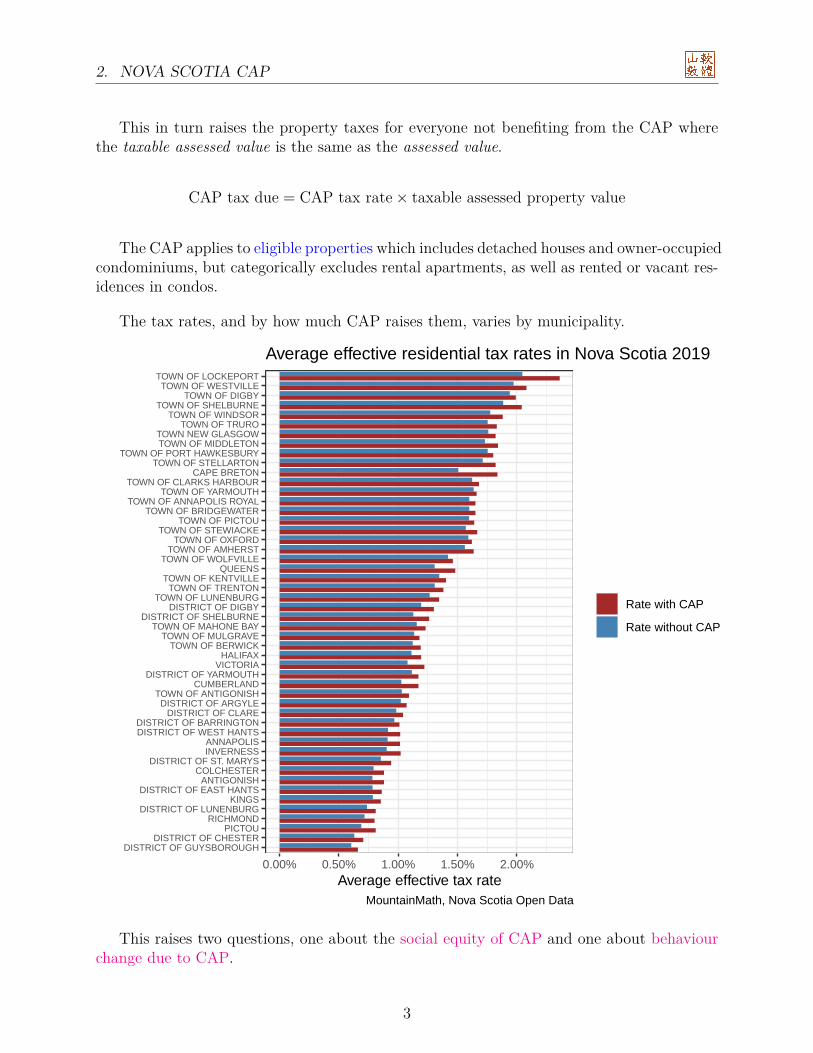
This in turn raises the property taxes for everyone not benefiting from the CAP wherethe taxable assessed value is the same as the assessed value.
CAP tax due = CAP tax rate × taxable assessed property value
The CAP applies to eligible properties which includes detached houses and owner-occupiedcondominiums, but categorically excludes rental apartments, as well as rented or vacant res-idences in condos.
The tax rates, and by how much CAP raises them, varies by municipality.
DISTRICT OF GUYSBOROUGHDISTRICT OF CHESTER
PICTOURICHMOND
DISTRICT OF LUNENBURGKINGS
DISTRICT OF EAST HANTSANTIGONISH
COLCHESTERDISTRICT OF ST. MARYS
INVERNESSANNAPOLIS
DISTRICT OF WEST HANTSDISTRICT OF BARRINGTON
DISTRICT OF CLAREDISTRICT OF ARGYLE
TOWN OF ANTIGONISHCUMBERLAND
DISTRICT OF YARMOUTHVICTORIA
HALIFAXTOWN OF BERWICK
TOWN OF MULGRAVETOWN OF MAHONE BAY
DISTRICT OF SHELBURNEDISTRICT OF DIGBY
TOWN OF LUNENBURGTOWN OF TRENTON
TOWN OF KENTVILLEQUEENS
TOWN OF WOLFVILLETOWN OF AMHERST
TOWN OF OXFORDTOWN OF STEWIACKE
TOWN OF PICTOUTOWN OF BRIDGEWATER
TOWN OF ANNAPOLIS ROYALTOWN OF YARMOUTH
TOWN OF CLARKS HARBOURCAPE BRETON
TOWN OF STELLARTONTOWN OF PORT HAWKESBURY
TOWN OF MIDDLETONTOWN NEW GLASGOW
TOWN OF TRUROTOWN OF WINDSOR
TOWN OF SHELBURNETOWN OF DIGBY
TOWN OF WESTVILLETOWN OF LOCKEPORT
0.00% 0.50% 1.00% 1.50% 2.00%Average effective tax rate
Rate with CAP
Rate without CAP
Average effective residential tax rates in Nova Scotia 2019
MountainMath, Nova Scotia Open Data
This raises two questions, one about the social equity of CAP and one about behaviourchange due to CAP.
3
3. SOCIAL EQUITY OF CAP
3 Social equity of CAP
By design, non-condo homeowners who bought a long time ago, as well as long-time owner-occupying condo owners, profit from CAP through lower property taxes, whereas renters inapartments and condos, as well as recent homeowners, pay higher property taxes. Recentowners pay the higher property taxes directly. Renters pay them indirectly as landlordsare more inclined to raise rents on longtime renters when their expenses increase, as wellas via downward pressure on overall rental supply (and subsequently on rents) by makinginvestment in new rental properties less attractive.
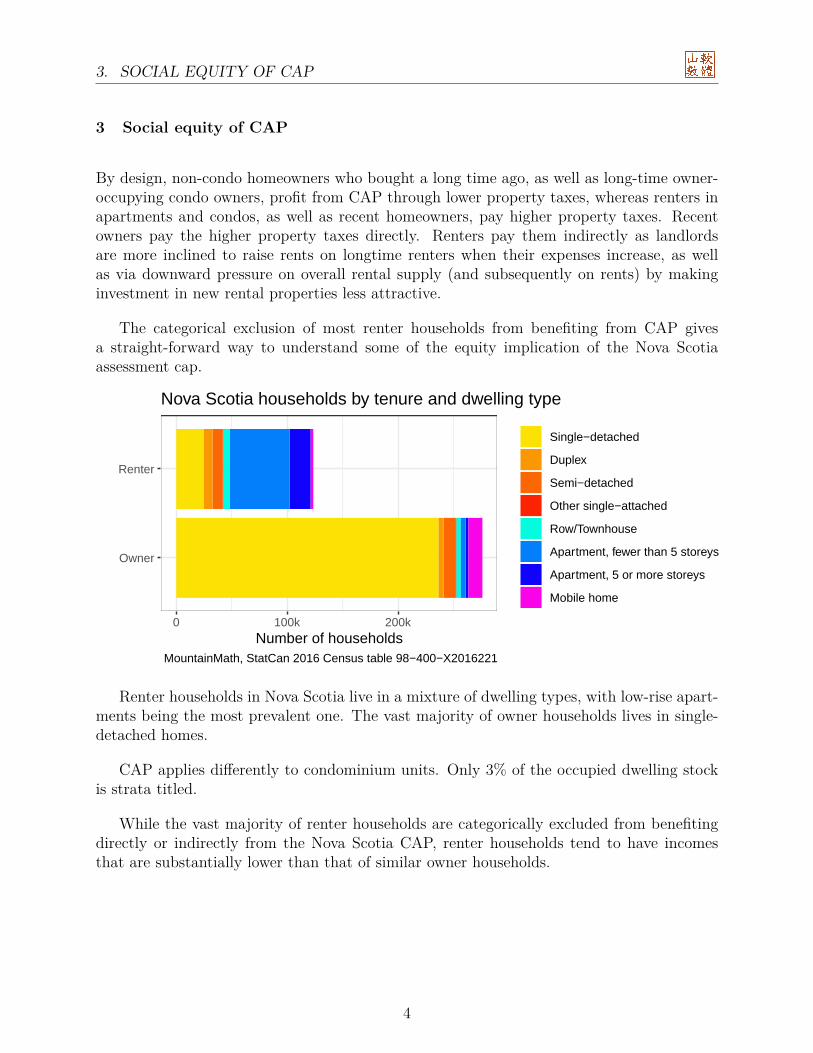
The categorical exclusion of most renter households from benefiting from CAP givesa straight-forward way to understand some of the equity implication of the Nova Scotiaassessment cap.
Owner
Renter
0 100k 200kNumber of households
Single−detached
Duplex
Semi−detached
Other single−attached
Row/Townhouse
Apartment, fewer than 5 storeys
Apartment, 5 or more storeys
Mobile home
Nova Scotia households by tenure and dwelling type
MountainMath, StatCan 2016 Census table 98−400−X2016221
Renter households in Nova Scotia live in a mixture of dwelling types, with low-rise apart-ments being the most prevalent one. The vast majority of owner households lives in single-detached homes.
CAP applies differently to condominium units. Only 3% of the occupied dwelling stockis strata titled.
While the vast majority of renter households are categorically excluded from benefitingdirectly or indirectly from the Nova Scotia CAP, renter households tend to have incomesthat are substantially lower than that of similar owner households.
4
3. SOCIAL EQUITY OF CAP
One person household
Lone parent family
Couple without children
Couple with children
All household types
0 $30k $60k $90kMedian household income
Hou
seho
ld/fa
mily
type
Owner Renter
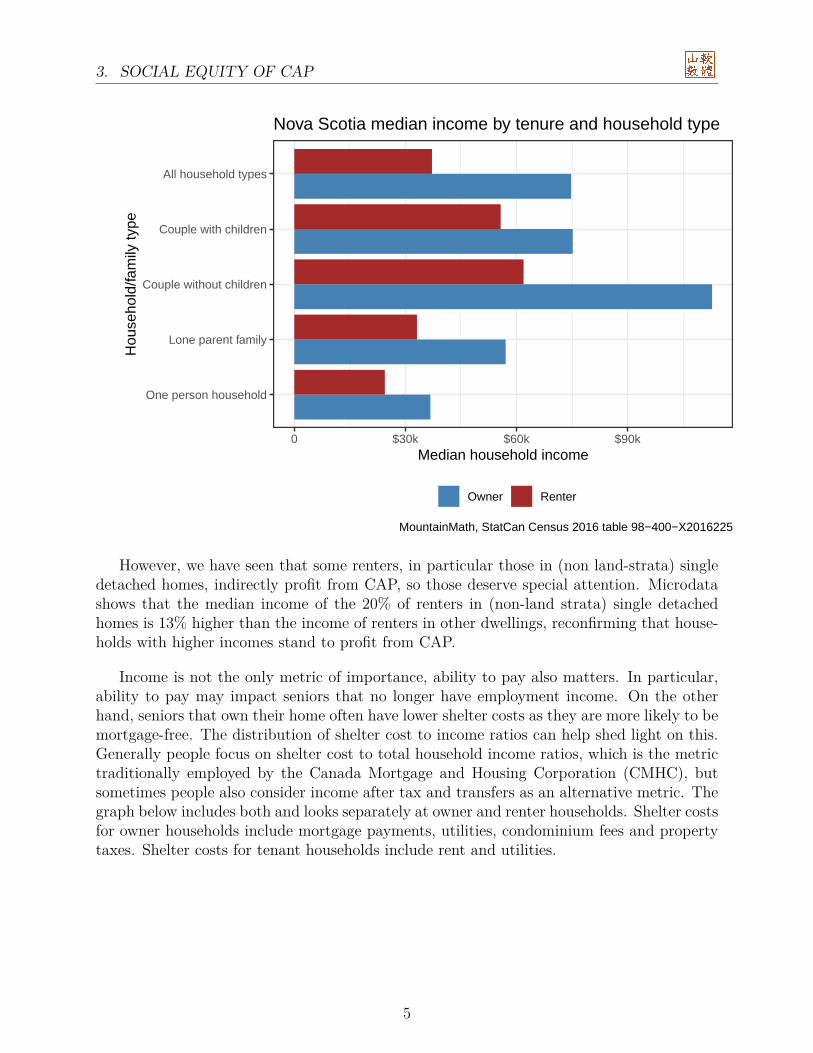
Nova Scotia median income by tenure and household type
MountainMath, StatCan Census 2016 table 98−400−X2016225
However, we have seen that some renters, in particular those in (non land-strata) singledetached homes, indirectly profit from CAP, so those deserve special attention. Microdatashows that the median income of the 20% of renters in (non-land strata) single detachedhomes is 13% higher than the income of renters in other dwellings, reconfirming that house-holds with higher incomes stand to profit from CAP.
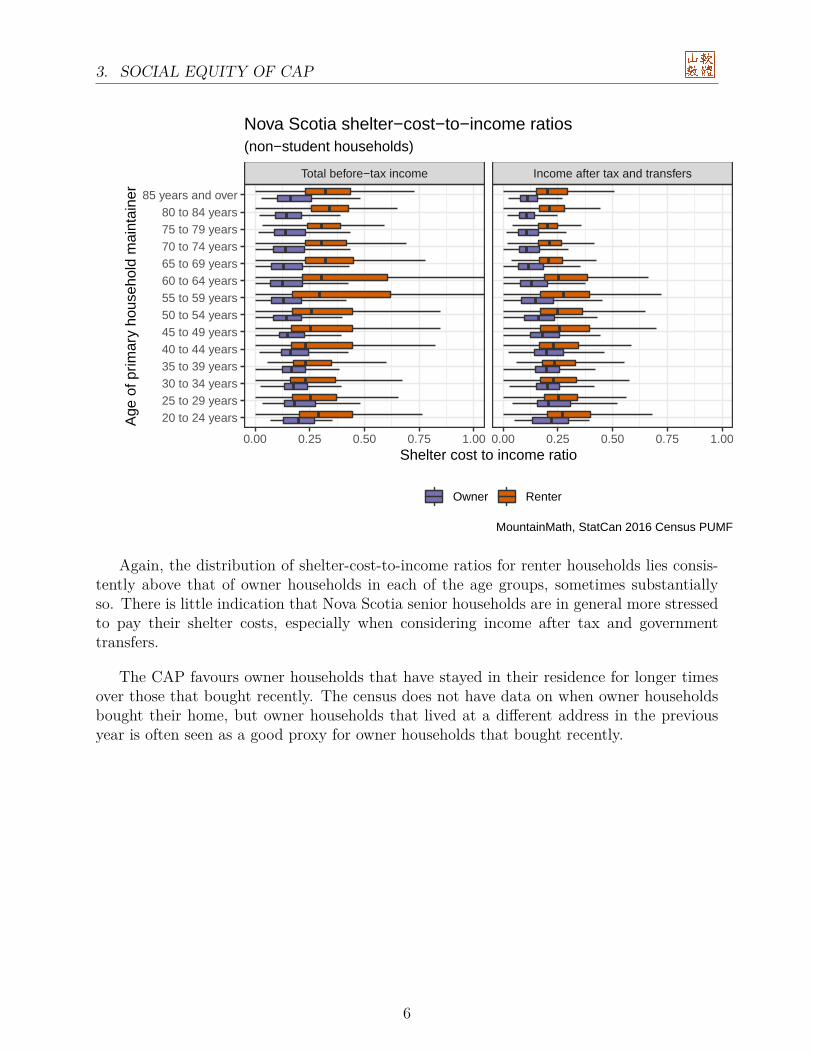
Income is not the only metric of importance, ability to pay also matters. In particular,ability to pay may impact seniors that no longer have employment income. On the otherhand, seniors that own their home often have lower shelter costs as they are more likely to bemortgage-free. The distribution of shelter cost to income ratios can help shed light on this.Generally people focus on shelter cost to total household income ratios, which is the metrictraditionally employed by the Canada Mortgage and Housing Corporation (CMHC), butsometimes people also consider income after tax and transfers as an alternative metric. Thegraph below includes both and looks separately at owner and renter households. Shelter costsfor owner households include mortgage payments, utilities, condominium fees and propertytaxes. Shelter costs for tenant households include rent and utilities.
5
3. SOCIAL EQUITY OF CAP
Total before−tax income Income after tax and transfers
0.00 0.25 0.50 0.75 1.00 0.00 0.25 0.50 0.75 1.00
20 to 24 years25 to 29 years30 to 34 years35 to 39 years40 to 44 years45 to 49 years50 to 54 years55 to 59 years60 to 64 years65 to 69 years70 to 74 years75 to 79 years80 to 84 years
85 years and over
Shelter cost to income ratio
Age
of p
rimar
y ho
useh
old
mai
ntai
ner
Owner Renter
(non−student households)
Nova Scotia shelter−cost−to−income ratios
MountainMath, StatCan 2016 Census PUMF
Again, the distribution of shelter-cost-to-income ratios for renter households lies consis-tently above that of owner households in each of the age groups, sometimes substantiallyso. There is little indication that Nova Scotia senior households are in general more stressedto pay their shelter costs, especially when considering income after tax and governmenttransfers.
The CAP favours owner households that have stayed in their residence for longer timesover those that bought recently. The census does not have data on when owner householdsbought their home, but owner households that lived at a different address in the previousyear is often seen as a good proxy for owner households that bought recently.
6
4. BEHAVIOUR CHANGE
20 to 34 years
35 to 49 years
50 to 64 years
65 years and over
$0 $100,000 $200,000Household income
Age
of p
rimar
y ho
useh
old
mai
ntai
ner
Did not move in past year Moved in past year
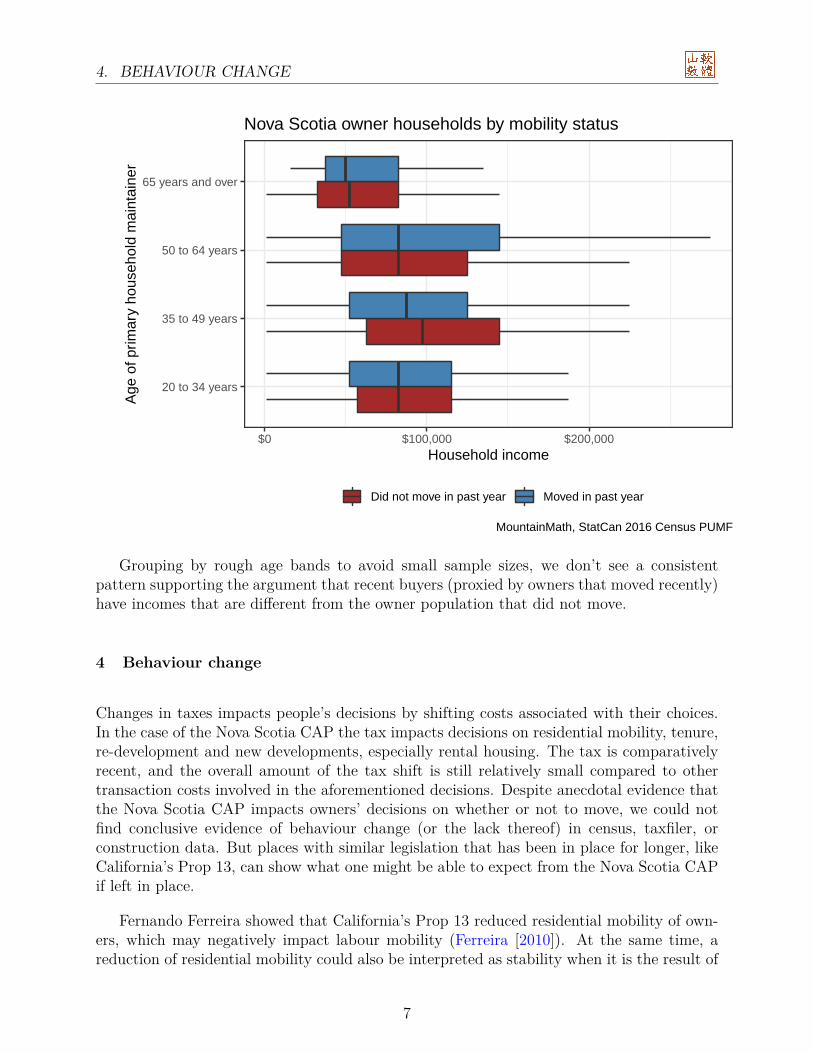
Nova Scotia owner households by mobility status
MountainMath, StatCan 2016 Census PUMF
Grouping by rough age bands to avoid small sample sizes, we don’t see a consistentpattern supporting the argument that recent buyers (proxied by owners that moved recently)have incomes that are different from the owner population that did not move.
4 Behaviour change
Changes in taxes impacts people’s decisions by shifting costs associated with their choices.In the case of the Nova Scotia CAP the tax impacts decisions on residential mobility, tenure,re-development and new developments, especially rental housing. The tax is comparativelyrecent, and the overall amount of the tax shift is still relatively small compared to othertransaction costs involved in the aforementioned decisions. Despite anecdotal evidence thatthe Nova Scotia CAP impacts owners’ decisions on whether or not to move, we could notfind conclusive evidence of behaviour change (or the lack thereof) in census, taxfiler, orconstruction data. But places with similar legislation that has been in place for longer, likeCalifornia’s Prop 13, can show what one might be able to expect from the Nova Scotia CAPif left in place.
Fernando Ferreira showed that California’s Prop 13 reduced residential mobility of own-ers, which may negatively impact labour mobility (Ferreira [2010]). At the same time, areduction of residential mobility could also be interpreted as stability when it is the result of
7
5. CONCLUSION
a reduction in involuntary moves. This question was investigated by Isaac William Martinand Kevin Beck, who analyzed potentially gentrifying areas across several states and foundno measurable impact of property assessment caps on involuntary moves of owners (Martinand Beck [2018]).
While individual implementations of property assessment caps differ across jurisdictions,the experience from places with longer-running property assessment caps are a point ofcaution that the Nova Scotia assessment cap may face increasing negative consequences onresidential mobility in the future without meaningfully reducing involuntary moves.
5 Conclusion
The Nova Scotia CAP is problematic from both the equity perspective, as well as in regardsto the possible impact on behaviour.
By excluding renter households, the Nova Scotia CAP is a regressive tax policy. It system-atically favours higher incomes households, and households with a lower shelter-cost burden.While adverse impacts on residential mobility is mostly anecdotal at this point, experiencefrom other jurisdictions shows that adverse effects on residential mobility may increase tomeasurable levels in the future if the gap between capped and uncapped assessments widens.
Phasing out the Nova Scotia CAP will likely increase overall equity and enhance residen-tial mobility. As with any tax change there will be winners and losers, and phasing out theNova Scotia CAP may in rare cases result in involuntary moves by those currently benefitingfrom the CAP. While these cases are rare, they may pose a concern to policy makers. Aproperty tax deferral program that allows for deferral of the difference of the phased outproperty tax to the capped tax before the phase-out could address those concerns.
Acknowledgement
This report was supported through funding from the Nova Scotia Federations of Munici-palities, Association of Municipal Administrators Nova Scotia, Nova Scotia Association ofRealtors, and Investment Property Owners Association of Nova Scotia.
8
A. APPENDIX
A Appendix
This appendix serves to collect summary statistics of the tax shift due to CAP for eachmunicipality, as well as statistics about the distribution of renter households. An ac-companying interactive map showing the tax shift for individual properties is available athttps://nsfm.ca/cap_map.html.
A.1 Tax shift of dwelling units
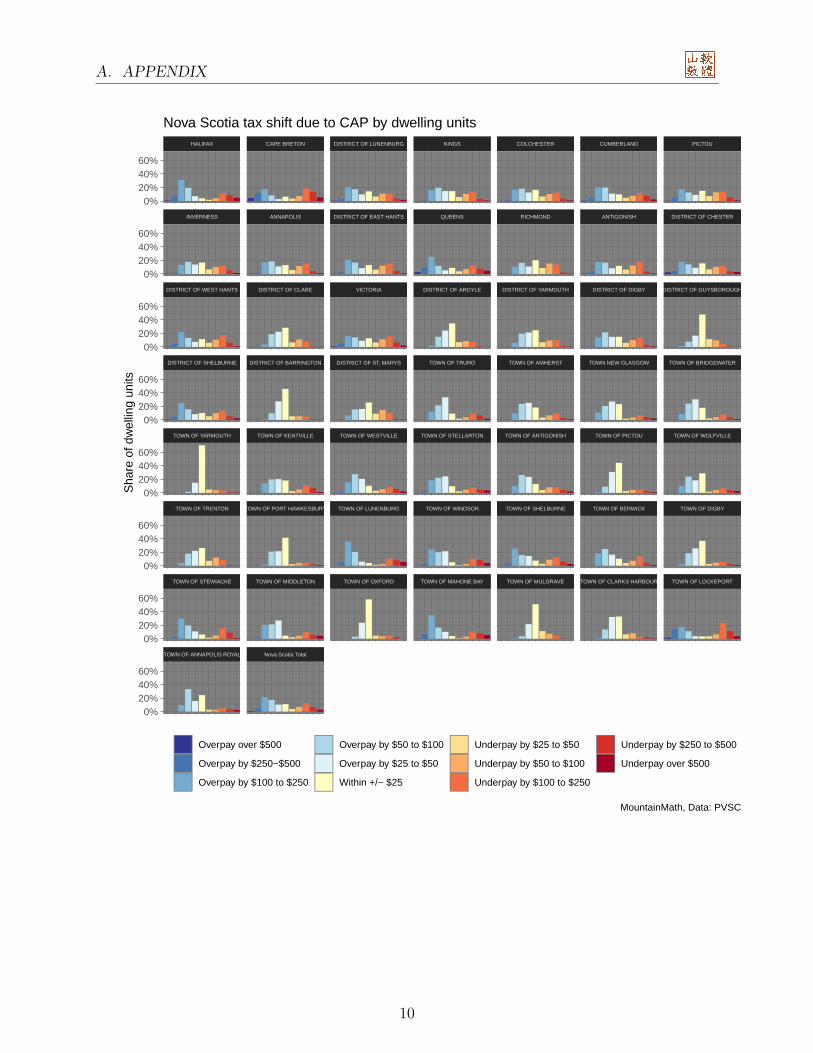
Throughout we have focused on dwelling units instead of properties and have generallydropped properties without a residential component from our consideration. The impact oneach individual dwelling unit in a rental apartment building is not known as taxes are onlyassessed at the entire building level, and we estimate the tax and tax shift for each unit bythe average taxes paid per unit. The following graph depicts the distribution of tax shiftfor each residential unit. If there was a resource component attached to the property that isassessed based on value it was included in the tax shift calculation.
9
A. APPENDIX
TOWN OF ANNAPOLIS ROYAL Nova Scotia Total
TOWN OF STEWIACKE TOWN OF MIDDLETON TOWN OF OXFORD TOWN OF MAHONE BAY TOWN OF MULGRAVE TOWN OF CLARKS HARBOUR TOWN OF LOCKEPORT
TOWN OF TRENTON TOWN OF PORT HAWKESBURY TOWN OF LUNENBURG TOWN OF WINDSOR TOWN OF SHELBURNE TOWN OF BERWICK TOWN OF DIGBY
TOWN OF YARMOUTH TOWN OF KENTVILLE TOWN OF WESTVILLE TOWN OF STELLARTON TOWN OF ANTIGONISH TOWN OF PICTOU TOWN OF WOLFVILLE
DISTRICT OF SHELBURNE DISTRICT OF BARRINGTON DISTRICT OF ST. MARYS TOWN OF TRURO TOWN OF AMHERST TOWN NEW GLASGOW TOWN OF BRIDGEWATER
DISTRICT OF WEST HANTS DISTRICT OF CLARE VICTORIA DISTRICT OF ARGYLE DISTRICT OF YARMOUTH DISTRICT OF DIGBY DISTRICT OF GUYSBOROUGH
INVERNESS ANNAPOLIS DISTRICT OF EAST HANTS QUEENS RICHMOND ANTIGONISH DISTRICT OF CHESTER
HALIFAX CAPE BRETON DISTRICT OF LUNENBURG KINGS COLCHESTER CUMBERLAND PICTOU
0%20%40%60%
0%20%40%60%
0%20%40%60%
0%20%40%60%
0%20%40%60%
0%20%40%60%
0%20%40%60%
0%20%40%60%
Sha
re o
f dw
ellin
g un
its
Overpay over $500
Overpay by $250−$500
Overpay by $100 to $250
Overpay by $50 to $100
Overpay by $25 to $50
Within +/− $25
Underpay by $25 to $50
Underpay by $50 to $100
Underpay by $100 to $250
Underpay by $250 to $500
Underpay over $500
Nova Scotia tax shift due to CAP by dwelling units
MountainMath, Data: PVSC
10
A. APPENDIX
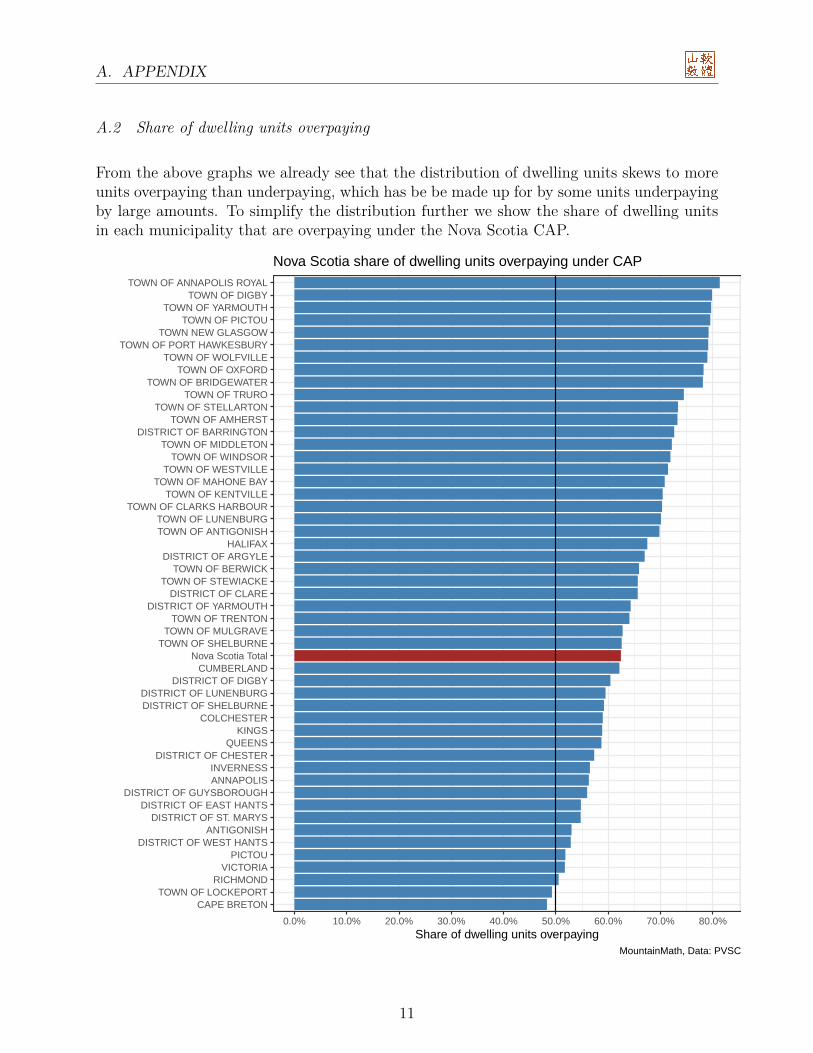
A.2 Share of dwelling units overpaying
From the above graphs we already see that the distribution of dwelling units skews to moreunits overpaying than underpaying, which has be be made up for by some units underpayingby large amounts. To simplify the distribution further we show the share of dwelling unitsin each municipality that are overpaying under the Nova Scotia CAP.
CAPE BRETONTOWN OF LOCKEPORT
RICHMONDVICTORIA
PICTOUDISTRICT OF WEST HANTS
ANTIGONISHDISTRICT OF ST. MARYS
DISTRICT OF EAST HANTSDISTRICT OF GUYSBOROUGH
ANNAPOLISINVERNESS
DISTRICT OF CHESTERQUEENS
KINGSCOLCHESTER
DISTRICT OF SHELBURNEDISTRICT OF LUNENBURG
DISTRICT OF DIGBYCUMBERLAND
Nova Scotia TotalTOWN OF SHELBURNE
TOWN OF MULGRAVETOWN OF TRENTON
DISTRICT OF YARMOUTHDISTRICT OF CLARE
TOWN OF STEWIACKETOWN OF BERWICK
DISTRICT OF ARGYLEHALIFAX
TOWN OF ANTIGONISHTOWN OF LUNENBURG
TOWN OF CLARKS HARBOURTOWN OF KENTVILLE
TOWN OF MAHONE BAYTOWN OF WESTVILLE
TOWN OF WINDSORTOWN OF MIDDLETON
DISTRICT OF BARRINGTONTOWN OF AMHERST
TOWN OF STELLARTONTOWN OF TRURO
TOWN OF BRIDGEWATERTOWN OF OXFORD
TOWN OF WOLFVILLETOWN OF PORT HAWKESBURY
TOWN NEW GLASGOWTOWN OF PICTOU
TOWN OF YARMOUTHTOWN OF DIGBY
TOWN OF ANNAPOLIS ROYAL
0.0% 10.0% 20.0% 30.0% 40.0% 50.0% 60.0% 70.0% 80.0%Share of dwelling units overpaying
Nova Scotia share of dwelling units overpaying under CAP
MountainMath, Data: PVSC
11
A. APPENDIX
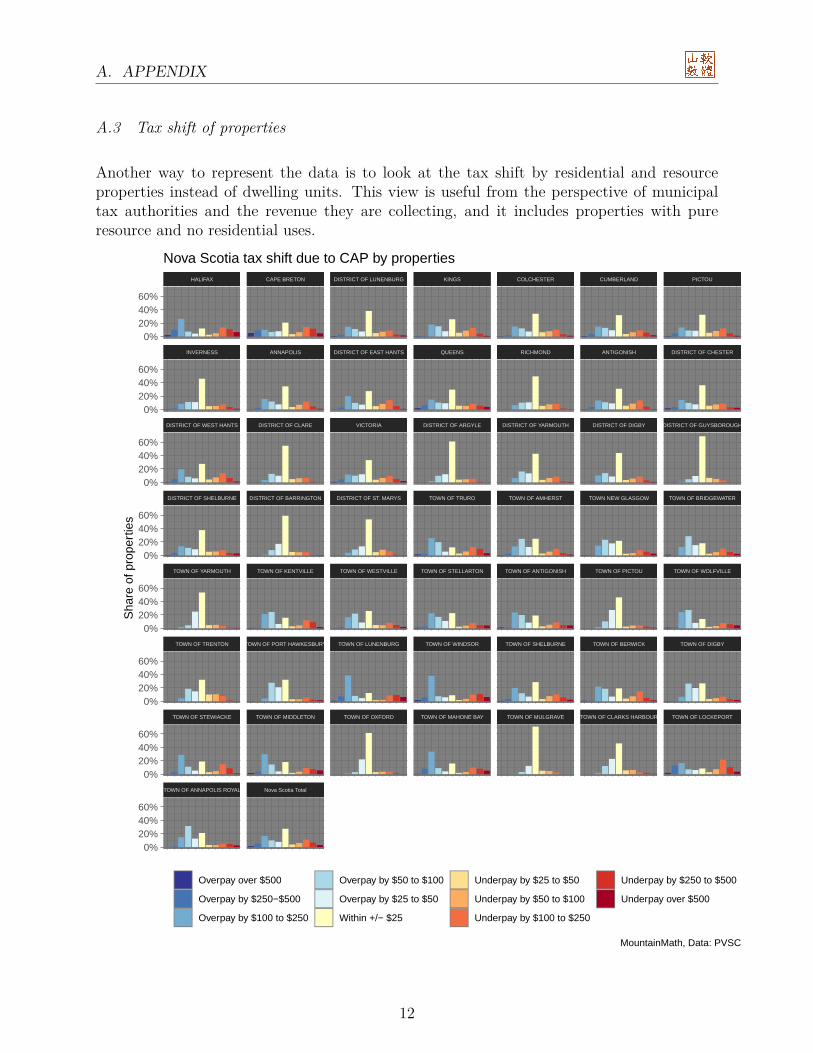
A.3 Tax shift of properties
Another way to represent the data is to look at the tax shift by residential and resourceproperties instead of dwelling units. This view is useful from the perspective of municipaltax authorities and the revenue they are collecting, and it includes properties with pureresource and no residential uses.
TOWN OF ANNAPOLIS ROYAL Nova Scotia Total
TOWN OF STEWIACKE TOWN OF MIDDLETON TOWN OF OXFORD TOWN OF MAHONE BAY TOWN OF MULGRAVE TOWN OF CLARKS HARBOUR TOWN OF LOCKEPORT
TOWN OF TRENTON TOWN OF PORT HAWKESBURY TOWN OF LUNENBURG TOWN OF WINDSOR TOWN OF SHELBURNE TOWN OF BERWICK TOWN OF DIGBY
TOWN OF YARMOUTH TOWN OF KENTVILLE TOWN OF WESTVILLE TOWN OF STELLARTON TOWN OF ANTIGONISH TOWN OF PICTOU TOWN OF WOLFVILLE
DISTRICT OF SHELBURNE DISTRICT OF BARRINGTON DISTRICT OF ST. MARYS TOWN OF TRURO TOWN OF AMHERST TOWN NEW GLASGOW TOWN OF BRIDGEWATER
DISTRICT OF WEST HANTS DISTRICT OF CLARE VICTORIA DISTRICT OF ARGYLE DISTRICT OF YARMOUTH DISTRICT OF DIGBY DISTRICT OF GUYSBOROUGH
INVERNESS ANNAPOLIS DISTRICT OF EAST HANTS QUEENS RICHMOND ANTIGONISH DISTRICT OF CHESTER
HALIFAX CAPE BRETON DISTRICT OF LUNENBURG KINGS COLCHESTER CUMBERLAND PICTOU
0%20%40%60%
0%20%40%60%
0%20%40%60%
0%20%40%60%
0%20%40%60%
0%20%40%60%
0%20%40%60%
0%20%40%60%
Sha
re o
f pro
pert
ies
Overpay over $500
Overpay by $250−$500
Overpay by $100 to $250
Overpay by $50 to $100
Overpay by $25 to $50
Within +/− $25
Underpay by $25 to $50
Underpay by $50 to $100
Underpay by $100 to $250
Underpay by $250 to $500
Underpay over $500
Nova Scotia tax shift due to CAP by properties
MountainMath, Data: PVSC
12
A. APPENDIX
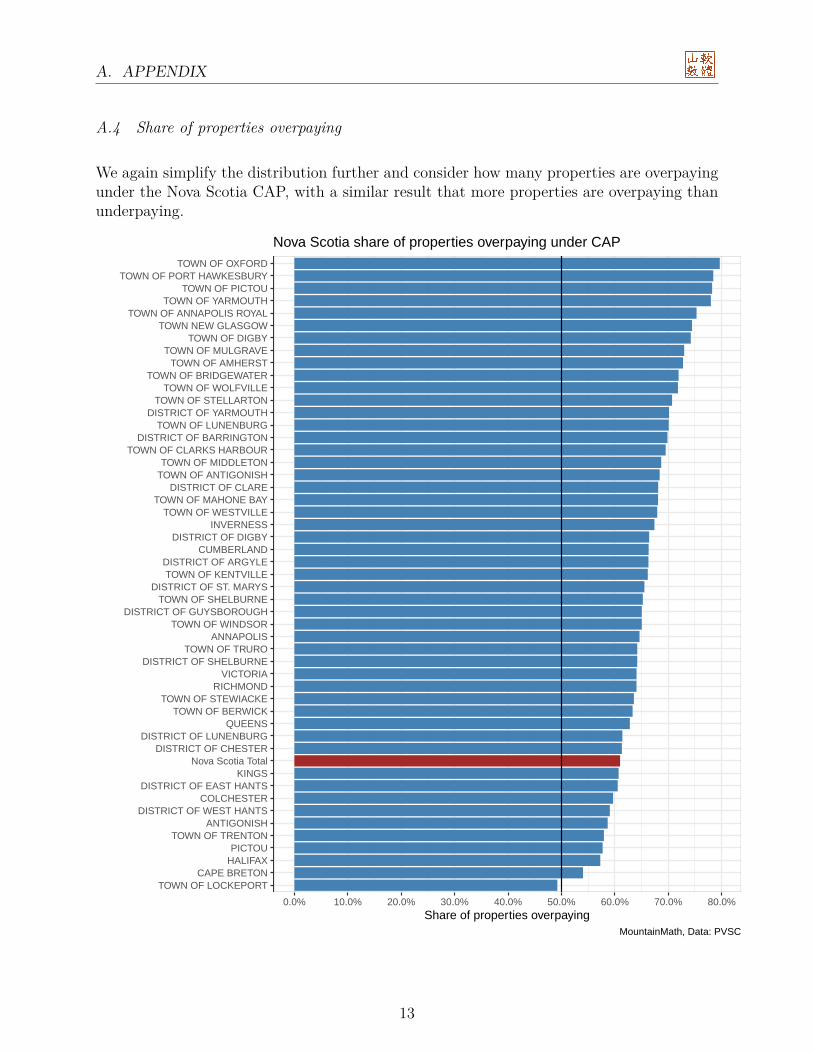
A.4 Share of properties overpaying
We again simplify the distribution further and consider how many properties are overpayingunder the Nova Scotia CAP, with a similar result that more properties are overpaying thanunderpaying.
TOWN OF LOCKEPORTCAPE BRETON
HALIFAXPICTOU
TOWN OF TRENTONANTIGONISH
DISTRICT OF WEST HANTSCOLCHESTER
DISTRICT OF EAST HANTSKINGS
Nova Scotia TotalDISTRICT OF CHESTER
DISTRICT OF LUNENBURGQUEENS
TOWN OF BERWICKTOWN OF STEWIACKE
RICHMONDVICTORIA
DISTRICT OF SHELBURNETOWN OF TRURO
ANNAPOLISTOWN OF WINDSOR
DISTRICT OF GUYSBOROUGHTOWN OF SHELBURNE
DISTRICT OF ST. MARYSTOWN OF KENTVILLE
DISTRICT OF ARGYLECUMBERLAND
DISTRICT OF DIGBYINVERNESS
TOWN OF WESTVILLETOWN OF MAHONE BAY
DISTRICT OF CLARETOWN OF ANTIGONISHTOWN OF MIDDLETON
TOWN OF CLARKS HARBOURDISTRICT OF BARRINGTON
TOWN OF LUNENBURGDISTRICT OF YARMOUTH
TOWN OF STELLARTONTOWN OF WOLFVILLE
TOWN OF BRIDGEWATERTOWN OF AMHERST
TOWN OF MULGRAVETOWN OF DIGBY
TOWN NEW GLASGOWTOWN OF ANNAPOLIS ROYAL
TOWN OF YARMOUTHTOWN OF PICTOU
TOWN OF PORT HAWKESBURYTOWN OF OXFORD
0.0% 10.0% 20.0% 30.0% 40.0% 50.0% 60.0% 70.0% 80.0%Share of properties overpaying
Nova Scotia share of properties overpaying under CAP
MountainMath, Data: PVSC
13
A. APPENDIX
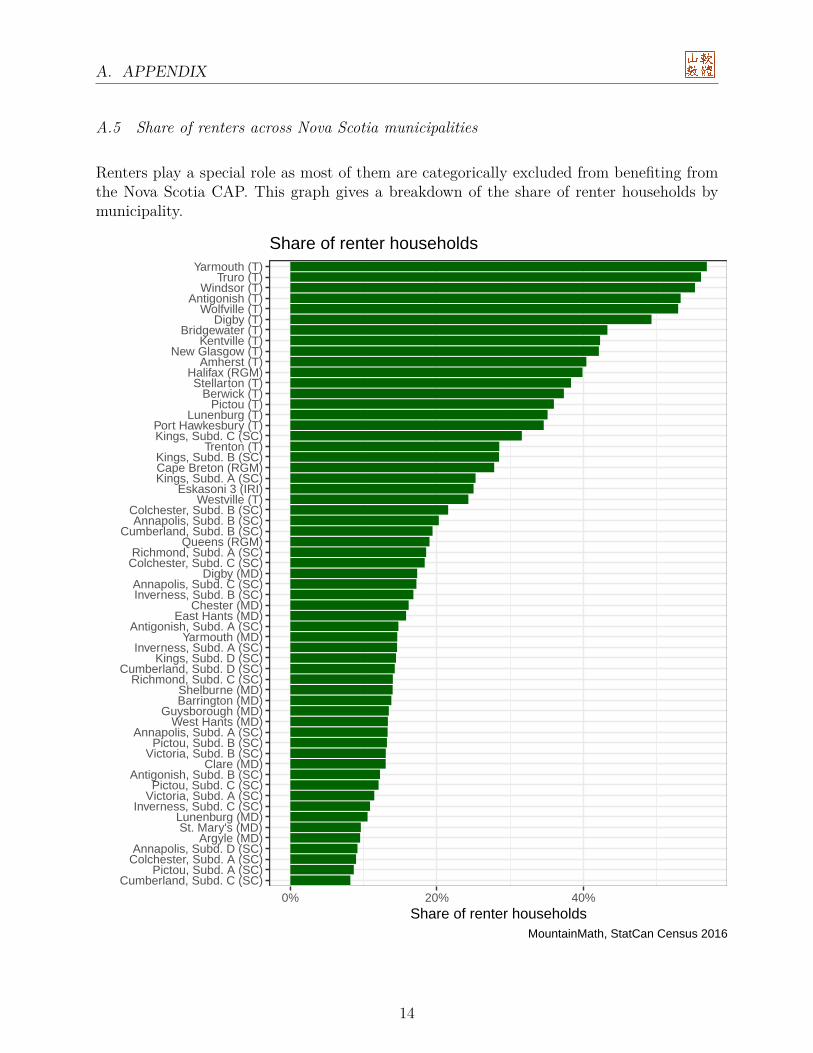
A.5 Share of renters across Nova Scotia municipalities
Renters play a special role as most of them are categorically excluded from benefiting fromthe Nova Scotia CAP. This graph gives a breakdown of the share of renter households bymunicipality.
Cumberland, Subd. C (SC)Pictou, Subd. A (SC)
Colchester, Subd. A (SC)Annapolis, Subd. D (SC)
Argyle (MD)St. Mary's (MD)
Lunenburg (MD)Inverness, Subd. C (SC)
Victoria, Subd. A (SC)Pictou, Subd. C (SC)
Antigonish, Subd. B (SC)Clare (MD)
Victoria, Subd. B (SC)Pictou, Subd. B (SC)
Annapolis, Subd. A (SC)West Hants (MD)
Guysborough (MD)Barrington (MD)Shelburne (MD)
Richmond, Subd. C (SC)Cumberland, Subd. D (SC)
Kings, Subd. D (SC)Inverness, Subd. A (SC)
Yarmouth (MD)Antigonish, Subd. A (SC)
East Hants (MD)Chester (MD)
Inverness, Subd. B (SC)Annapolis, Subd. C (SC)
Digby (MD)Colchester, Subd. C (SC)Richmond, Subd. A (SC)
Queens (RGM)Cumberland, Subd. B (SC)
Annapolis, Subd. B (SC)Colchester, Subd. B (SC)
Westville (T)Eskasoni 3 (IRI)
Kings, Subd. A (SC)Cape Breton (RGM)Kings, Subd. B (SC)
Trenton (T)Kings, Subd. C (SC)Port Hawkesbury (T)
Lunenburg (T)Pictou (T)
Berwick (T)Stellarton (T)
Halifax (RGM)Amherst (T)
New Glasgow (T)Kentville (T)
Bridgewater (T)Digby (T)
Wolfville (T)Antigonish (T)
Windsor (T)Truro (T)
Yarmouth (T)
0% 20% 40%Share of renter households
Share of renter households
MountainMath, StatCan Census 2016
14
REFERENCES
References
Fernando Ferreira. You can take it with you: Proposition 13 tax benefits, residential mobility,and willingness to pay for housing amenities. Journal of Public Economics, 94(9):661 –673, 2010. ISSN 0047-2727. doi: https://doi.org/10.1016/j.jpubeco.2010.04.003. URLhttp://www.sciencedirect.com/science/article/pii/S0047272710000435.
Isaac William Martin and Kevin Beck. Gentrification, property tax limitation, and displace-ment. Urban Affairs Review, 54(1):33–73, 2018. doi: 10.1177/1078087416666959. URLhttps://doi.org/10.1177/1078087416666959.
15
Related Documents