Notice of 2021 Annual Meeting of Shareholders 2021 Proxy Statement and 2020 Annual Report on Form 10-K

Welcome message from author
This document is posted to help you gain knowledge. Please leave a comment to let me know what you think about it! Share it to your friends and learn new things together.
Transcript
Notice of 2021 Annual Meeting of Shareholders
2021 Proxy Statement
and
2020 Annual Report on Form 10-K
SM
Jewelry Stores
Specialty Retailers
Services
Bring it all home.
Supermarkets
Price-Impact Stores
Multi-Department Stores
FAMILYOFCOMPANIES
Fellow Shareholders:
When the pandemic hit last year, our world changed dramatically. What remained constant was people’s need for
food, and Kroger was there to meet that need. Through new channels and formats, we uplifted our customers,
communities, and each other, with a relentless focus on quality, value, and convenience.
We not only met our customers’ immediate needs, but we also used this unique period to accelerate our own
transformation. Thanks to our team’s response, and by leading with our purpose and our values, we converted the
crisis into a catalyst for sustainable growth.
We are committed to delivering consistent and attractive Total Shareholder Return (TSR) of 8 – 11%.
We will deliver this growth by Leading with Fresh and Accelerating with Digital.
• Food is a necessity − and a comfort − and we are positioned to win share of wallet by leading with freshfood.
• We also have a tremendous sales and profit growth opportunity in digital.
• And, as we look at a post-COVID world, we are confident that our strategic moats of Fresh, Seamless,Our Brands, and Personalization will position us to compete and win.
It’s true that the shift to spending more time at home and eating less at restaurants was a tailwind for our industry,
and we believe that retailers who can convert this short-term boost into long-term competitive advantages will
emerge as winners. That is what we are doing – and we have the benefit of our transformation efforts at our backs.
Restock Kroger Transformed Us
Our primary business − food − never goes out of fashion, but in 2017 we were facing continuing challenges from
low margins, new competition, and changes in buying and consuming habits, especially the increasing demand for
a seamless customer experience that we forecasted. We knew we had to build the war chest to remake ourselves
and turn those headwinds into tailwinds.
Through Restock Kroger, we removed more than $3 billion in costs out of the business, freeing up resources to
invest in associates, technology, and pricing. We strengthened our competitive moats. We established a flywheel to
monetize the traffic and data generated by our core business and identify growth opportunities. We improved talent
development at all levels of the business, placing the right people in the right roles. And, we made a series of bold
commitments to advance our Zero Hunger | Zero Waste vision at the center of our Environmental, Social, and
Governance portfolio.
And while not everything went according to plan, we learned and adjusted throughout, transforming our businessmodel, and making changes that allowed us to continue to be there for our customers, associates, andcommunities when COVID-19 began in February 2020.
COVID-19 Changed Us
When the pandemic arrived, we acted quickly to protect our associates and customers and deploy our expertise tomake sure individuals’ need for food − and need to obtain it in evolving ways − were met reliably, safely, and cost-effectively. Indeed, we recognized that in the depths of the crisis, food had become not just a necessity, but a corecomfort. A reminder that life would go on and get better, so we built upon that powerful sentiment to deepen ourconnection with customers.
The pandemic nearly doubled the number of customers using our seamless shopping experience, achievedthrough a focused effort to create the ability for more customers to use our online shopping services – whether bywaiving the pickup fee for all orders for an extended period and accepting SNAP EBT for pickup orders orimproving the user experience on Kroger.com and our mobile app. We now have almost 50,000 associatesdedicated to our e-commerce services. Because of our previous investments and innovations that were part of theRestock Kroger commitment, we were able to support the increased demand for Pickup, Delivery, and Ship.
COVID-19 served as an accelerant to our e-commerce business, helping us achieve triple-digit digital sales growthlast year. As we entered the pandemic and dynamics shifted rapidly, the investments we had already made inbuilding a seamless ecosystem enabled us to respond quickly, reinforcing our competitive advantages.
Knowing that an ounce of prevention is worth a pound of cure, we took immediate steps to safeguard ourassociates and make sure our customers could continue to rely on us for fresh food and essentials despite rapidly
i
changing buying patterns. Since the start of the pandemic, we’ve invested more than $2.5 billion to implement
dozens of safety measures nationwide, reward and uplift our associates, and better secure pensions. Our
investments in these areas continue to make a difference today for our associates and our customers.
COVID-19 and its impact also shined a light on the intersection of food security, health and nutrition, and racial
equity. Given the increased need in 2020, we nearly doubled our charitable giving to the Feeding America network
of food banks and supported key partners like No Kid Hungry to direct meals where they were needed most.
Additionally, our associates continued to rescue surplus food throughout the year despite heavy stocking-up
periods early in the year.
As we look ahead to tomorrow, Kroger Health continues to play a leading role in helping America recover and heal.
Our mission at Kroger Health is to help people live healthier lives. Throughout the pandemic, we’ve been working to
do just that through testing, vaccine administration, and supportive care services. Our health experts, pharmacists,and clinicians have worked tirelessly to turn the tide of the pandemic and offer hope, administering 3.5 milliondoses of the COVID-19 vaccine as of early May, including more than 175,000 to associates. To encourage ourassociates to better protect themselves – and their families and communities – we’re providing a one-time paymentof $100 to every associate once they have been fully vaccinated.
Throughout the pandemic, our team has never lost sight of our goals and remained focused on serving ourcustomers when they needed us most. More than ever, our performance over this past year is owed to them.
Our Associates Guide Us
I’ve been in this business more than 40 years and our nearly half a million associates continue to amaze me.During the past year, we’ve seen associates rise to meet extraordinary challenges and keep Americans nourishedduring a global health crisis.
We often provide people with their first job, with many choosing to stay with the Kroger Family of Companies andmake it their career. To support this choice, we are building a more connected culture of opportunity that embracesspeed, agility, collaboration, and career advancement in part realized by ongoing training and education supportthrough our tuition reimbursement program that covers everything from a GED to PhD. Since inception, thisprogram has benefitted 6,000 associates, with hourly associates making up 87% of those who have takenadvantage of the offering so far.
In addition to our $800 million incremental investment in associate wages and training over the last three yearsthrough Restock Kroger – which raised our average national wage to more than $15.50 per hour – in 2021, we planto invest an additional $350 million more that we expect will increase our average associate wage to $16 per hourby year end.
Alongside our continuing investment in wages and benefits, we are also using technology to provide a morepersonalized associate experience. We want to meet our associates where they are and provide them with toolsand pathways to grow as individuals and with our company because the jobs of the future will grow and evolve justlike our business. Today’s growth-minded associates will deliver tomorrow’s solutions for our customers.
Leading with Fresh and Accelerating with Digital
Kroger is in a position of strength today because of our talent and transformation. We’ve deepened our connectionwith customers and associates. We accelerated digital sales and profitability by several years and identified newcustomer-centric innovations for tomorrow. As a result of the strong foundation we built, we’ve invested in ourassociates and communities, gained share, and delivered record-breaking sales, which enabled us to deliver aboveour Total Shareholder Return model commitments in 2020. We are committed to delivering consistent and attractiveTSR of 8 – 11%, underpinned by a financial model that now includes a higher operating profit base, a clear path todelivering earnings growth of 3-5%, and strong and growing free cash flow to invest in our growth initiatives.
Last year, we more than doubled digital sales to reach and exceed the $10 billion mark and more than doubled thenumber of customers using at least one of our e-commerce services and that includes delivery – whichexperienced a 150% increase over the last year. This change in customer behavior accelerated by COVID-19 was,of course, a major factor in our results last year, but we expect that by the end of 2023, we will double the size ofour digital business using 2020 as a baseline. Concurrently, we will continue to increase the profitability of ourdigital business and plan to double our pass-through profitability rate by the end of 2023.
Digital and Fresh matter to our customers, and we have continued to invest in and grow our capabilities in bothareas, leading to significant share of wallet gains in both digital and total food at home. The evolution of the Kroger
ii
Delivery network and expansion of our partnership with Ocado is an important part of accelerating our cost-
effective seamless ecosystem underpinned by an industry-leading supply chain and our ability to consistently
deliver the freshest food. We are opening two Customer Fulfillment Centers (CFC) this year in Monroe, OH and
Groveland, FL and each will employ more than 400 associates. We have also announced plans to open CFCs in
Dallas, TX; Forest Park, GA (Atlanta); Frederick, MD; Phoenix, AZ; Pleasant Prairie, WI; Romulus, MI (Detroit); and
Pacific Northwest and West regions. As the network expands, we will announce additional locations.
Kroger’s seamless ecosystem is helping us provide what customers need and want in a way that fits the context of
their day – whether it’s coming to our stores, picking it up, delivering to a convenient location, or directly shipping to
their homes. We are providing the right product assortment through these options and the modalities that fit our
customers’ lives. We are also leveraging our mature personalization platform to meet customer needs. In 2020, we
presented nearly 11 billion personalized recommendations every week, or more than half a trillion offered for theyear.
The comprehensive and connected nature of the Kroger experience is a key differentiator. Our seamless customers– which we define as customers who are engaging with us across more than one modality – shop with us morefrequently, spend more than twice as much, and are more loyal. In fact, retention rates for our seamless customershas reached 98%.
Food Innovation and Our Brands Growth
A big part of our fresh approach is helping answer the daily customer dilemma of ‘‘What’s for Dinner?’’ with simple,convenient, and delicious meal solutions. As customers look for food inspiration, we continue to develop newproducts to meet their needs, including ready-to-heat and ready-to eat food. For example, our Home Chef meal kitsubscription platform – which experienced accelerated growth in 2020 and continues to show great momentumgoing into 2021 – is on track to become our next billion-dollar brand.
Our Brands achieved its best year ever in 2020, exceeding $26.2 billion in sales. Our Simple Truth brand alsoachieved a major milestone, exceeding $3 billion in annual sales for the first time. Truth be told, Our Brands isconsumer packaged goods (CPG) tucked inside our business. But, it’s anything but small – it’s a business that’seight times larger than the sales of the largest CPG company selling products in our stores.
This year, we will launch more than 660 exciting, new Our Brands items. Nearly 60% of these will be under theSimple Truth or Private Selection brands. At Kroger, innovation is not limited to Our Brands; innovation is critical toour national brand partnerships as well. We will continue working with national brands to bring innovative, first-to-market items to our shelves that grow our collective businesses.
Live Our Purpose Every Day
This past year, every action we’ve taken has been anchored in Our Purpose, to Feed the Human Spirit. Fromproviding hundreds of thousands of unemployed workers with a new bridge job when the pandemic first hit andfeeding our neighbors most in need, to speaking out against racism and discrimination, to uplifting our associatesand communities after unimaginable natural disasters and tragedies – we strive to live Our Purpose, every day.
Earlier this year, we lost three associates from our distribution center in Oconomowoc, Wisconsin to senselessviolence. And then our world was again turned upside down by another horrific act of violence in our King Soopersstore in Boulder, Colorado. This tragedy resulted in the deaths of ten people, including three of our associates, sixof our customers and a police officer.
Despite the darkness and uncertainty of the past year, we know there is light and hope. I’m incredibly proud of ourassociates who have shown strength and resilience beyond measure. They are the heart and soul of ourorganization, and we will always be here to provide support and a helping hand.
Helping people and the planet is at the core of who we are as a company − and this focus has never been morerelevant. Kroger is acutely focused on advancing Diversity, Equity, and Inclusion within our workplace andneighborhoods and creating communities free of hunger and waste through Zero Hunger | Zero Waste, Kroger’sbold social and environmental impact plan.
Diversity and inclusion are among our longstanding core values. Last October, we introduced a 10-pointFramework for Action plan to accelerate Diversity, Equity, and Inclusion and promote greater change in theworkplace and in our communities. As part of this Framework, we created an internal Advisory Council – comprisedof diverse leaders and associates across the company – to help set priorities and drive meaningful change. TheKroger Co. Foundation also established a $5 million Racial Equity Fund to align philanthropy to our expanded
iii
commitment. To date, the Foundation has directed $3 million in grants to several organizations with innovativeapproaches to building stronger, more equitable communities. It’s also important for me to share that our nomineesfor your board of directors is now 40% women and 30% people of color.
The economic impact of COVID-19 has highlighted not only racial disparities but food inequities as well. We remaindedicated to building a more resilient and equitable food system and global supply chain, using our scale,resources, and platform. Last year, we continued to deliver on the principles of our Zero Hunger | Zero Wastecommitment, focusing on ways to support food-insecure households and reduce waste across our organization. Wehave made considerable progress. In 2020 alone, we directed a record one-year total of 640 million meals to fightincreased food insecurity in the U.S. At the same time, we achieved our highest year ever for waste diversion fromlandfills company-wide − a record 81%, up 1% from the prior year.
We are grateful for the effort of every Zero Hero and our entire community for lifting up Zero Hunger | Zero Waste,which is driving meaningful outcomes in our communities. There are still too many people experiencing hunger inour country. We remain committed to doing our part to create a future with zero hunger and zero waste.
***
As We Look Ahead
It’s been said that hindsight is always 20/20. But for us it is our 138 years of insight that keeps us focused on ourcustomers, associates, and communities. During a year like no other, our team kept its eyes on the future –working, planning, and innovating to be there for our associates, communities, and customers with anything,anytime, anywhere.
With the power of our talent and transformation, Kroger is well-positioned to compete – and win – in a post-COVIDworld. We are stronger today than yesterday. But not as strong as we will be tomorrow. Stay tuned.
Thank you for your partnership,Rodney McMullenChairman and CEO, The Kroger Co.
Safe Harbor Statement
This letter contains ‘‘forward-looking statements’’ within the meaning of the safe harbor provisions of the United
States Private Securities Litigation Reform Act of 1995 about future performance of Kroger, including with respect
to Kroger’s ability to achieve sustainable net earnings growth, strategic capital deployment, strong and attractive
total shareholder return, strong free cash flow and ability to increase the dividend, ability to achieve certain
operational goals, among other statements. These statements are based on management’s assumptions and
beliefs in light of the information currently available to it. These statements are indicated by words such as ‘‘will,’’
‘‘aim,’’ ‘‘aspiration,’’ ‘‘transformation,’’ ‘‘model,’’ ‘‘driving,’’ ‘‘advancing,’’ ‘‘plan,’’ ‘‘continue,’’ ‘‘remain,’’ ‘‘dedicated,’’
‘‘committed,’’ and ‘‘confidence,’’ as well as similar words or phrases. These statements are subject to known and
unknown risks, uncertainties and other important factors that could cause actual results and outcomes to differ
materially from those contained in the forward-looking statements, including the specific risk factors identified in
‘‘Risk Factors’’ in Kroger’s most recent Annual Report on Form 10-K and any subsequent filings with the Securities
and Exchange Commission. Kroger assumes no obligation to update the information contained herein, unless
required to do so by applicable law.
iv
FOOD DONATION HEROES: These are the leading teams across the country that have implemented Kroger’sZero Hunger | Zero Waste Food Rescue program exceptionally well and redirected thousands of pounds of surplusfood to their communities.
Store 224Alaska
Store 673Arizona
Store 359California
Store 755California
Store 059Colorado
Store 263Indiana
Store 970Indiana
Store 537Illinois
Store 015Kansas
Store 392Kentucky
Store 407Kentucky
Store 737Michigan
Store 492Mississippi
Store 341Nevada
Store 891Ohio
Store 671South Carolina
Store 686Tennessee
Store 014Texas
Store 594Texas
Store 501Virginia
Store 857Washington
Mid-South D.C.Supply Chain
Winchester DairyManufacturing
ASSOCIATE FUNDRAISING HEROES: These are the cashiers across the Kroger Family of Companies’ retailfootprint who led the way in activating donations by asking customers to help end hunger by rounding up their orderat checkout to benefit The Kroger Co. Zero Hunger | Zero Waste Foundation.
Jen TudorCincinnati-Dayton Division
Colleen BurrowsColumbus Division
Nick DamicoColumbus Division
Beth TiptonColumbus Division
Candice PetersonDallas Division
Steve PoundsDallas Division
Julie WolffDallas Division
Rockie UblemanDallas Division
Mahin BocaDallas Division
Anatoli BondarchukFred Meyer Division
Sonja SmithFred Meyer Division
Sandy CarmichaelFred Meyer Division
Kelly StandleyFred Meyer Division
Michelle RankinFred Meyer Division
Kim TuckerFred Meyer Division
Patty KuzmaFred Meyer Division
Anton NordbergFred Meyer Division
Debra BilyeuFred Meyer Division
Judith LesliepattonFred Meyer Division
Robin MorrisFred Meyer Division
Debra Van MatreHouston Division
Dee Dee HambyMid-Atlantic Division
Kathy LangeQFC Division
Kurt MincinQFC Division
v

Notice of 2021 Annual Meeting of Shareholders
Fellow Kroger Shareholders:
We are pleased to invite you to join us for Kroger’s 2021 Annual Meeting ofShareholders on June 24, 2021 at 11:00 a.m. eastern time. Due to the public healthimpact of COVID-19, the 2021 Annual Meeting of Shareholders will be a completely virtualmeeting conducted via webcast. You will be able to participate in the virtual meetingonline, vote your shares electronically, and submit questions during the meeting byvisiting www.virtualshareholdermeeting.com/KR2021.
When: Thursday, June 24, 2021, at 11:00 a.m. eastern time.
Where: Webcast at www.virtualshareholdermeeting.com/KR2021
Items of Business: 1. To elect 10 director nominees.
2. To approve our executive compensation, on an advisory basis.
3. To ratify the selection of our independent auditor for fiscal year 2021.
4. To vote on one shareholder proposal, if properly presented at the meeting.
5. To transact other business as may properly come before the meeting.
Who can Vote: Holders of Kroger common shares at the close of business on the record dateApril 26, 2021 are entitled to notice of and to vote at the meeting.
How to Vote: Your vote is important! Please vote your proxy in one of the following ways:
1. Via the internet, by visiting www.proxyvote.com.
2. By telephone, by calling the number on your proxy card, voting instruction form,or notice.
3. By mail, by marking, signing, dating, and mailing your proxy card if you requestedprinted materials, or your voting instruction form. No postage is required if mailedin the United States.
4. By mobile device, by scanning the QR code on your proxy card, notice of internetavailability of proxy materials, or voting instruction form.
5. By voting electronically during the virtual Annual Meeting atwww.virtualshareholdermeeting.com/KR2021.
Attending the Meeting: Shareholders holding shares at the close of business on the record date may attendthe virtual meeting. You will be able to attend the Annual Meeting, vote and submityour questions in advance of and real-time during the meeting via a live audiowebcast by visiting www.virtualshareholdermeeting.com/KR2021. To participate in themeeting, you must have your sixteen-digit control number that is shown on yourNotice of Internet Availability of Proxy Materials or on your proxy card if you receivethe proxy materials by mail. You will not be able to attend the Annual Meeting inperson.
We appreciate your continued confidence in Kroger, and we look forward to your participation in our virtualmeeting.
May 13, 2021Cincinnati, Ohio
By Order of the Board of Directors,Christine S. Wheatley, Secretary

Proxy Statement
May 13, 2021
We are providing this notice, proxy statement, and annual report to the shareholders of The Kroger Co.
(‘‘Kroger’’, ‘‘we’’, ‘‘us’’, ‘‘our’’) in connection with the solicitation of proxies by the Board of Directors of Kroger
(the ‘‘Board’’) for use at the Annual Meeting of Shareholders to be held on June 24, 2021, at 11:00 a.m. eastern
time, and at any adjournments thereof. The Annual Meeting will be held virtually and can be accessed online at
www.virtualshareholdermeeting.com/KR2021. There is no physical location for the Annual Meeting of Shareholders.
Our principal executive offices are located at 1014 Vine Street, Cincinnati, Ohio 45202-1100. Our telephone
number is 513-762-4000. This notice, proxy statement, and annual report, and the accompanying proxy card were
first furnished to shareholders on May 13, 2021.
Why are you holding a virtual meeting?
In light of the COVID-19 pandemic, for the safety of all of our shareholders, associates, and community, our2021 Annual Meeting is being held on a virtual-only basis with no physical location. Our goal for the Annual Meetingis to enable the broadest number of shareholders to participate in the meeting, while providing substantially thesame access and exchange with the Board and Management as an in-person meeting. We believe that we areobserving best practices for virtual shareholder meetings, including by providing a support line for technicalassistance and addressing as many shareholder questions as time allows.
Who can vote?
You can vote if, as of the close of business on April 26, 2021, you were a shareholder of record of Krogercommon shares.
Who is asking for my vote, and who pays for this proxy solicitation?
Your proxy is being solicited by Kroger’s Board of Directors. Kroger is paying the cost of solicitation. We havehired D.F. King & Co., Inc., a proxy solicitation firm, to assist us in soliciting proxies and we will pay them a feeestimated not to exceed $17,500, plus reasonable expenses for the solicitation.
We also will reimburse banks, brokers, nominees, and other fiduciaries for postage and reasonable expensesincurred by them in forwarding the proxy material to beneficial owners of our common shares.
Proxies may be solicited personally, by telephone, electronically via the Internet, or by mail.
Who are the members of the Proxy Committee?
Anne Gates, W. Rodney McMullen, and Ronald L. Sargent, all Kroger Directors, are the members of the ProxyCommittee for our 2021 Annual Meeting.
How do I vote my proxy?
You can vote your proxy in one of the following ways:
1. Via the internet, by visiting www.proxyvote.com.
2. By telephone, by calling the number on your proxy card, voting instruction form, or notice.
3. By mail, by marking, signing, dating, and mailing your proxy card if you requested printed materials, oryour voting instruction form. No postage is required if mailed in the United States.
4. By mobile device, by scanning the QR code on your proxy card, notice of internet availability of proxymaterials, or voting instruction form.
5. By voting electronically during the virtual Annual Meeting at www.virtualshareholdermeeting.com/KR2021.
How can I participate and ask questions at the Annual Meeting?
We are committed to ensuring that our shareholders have substantially the same opportunities to participate inthe virtual Annual Meeting as they would at an in-person meeting. In order to submit a question at the AnnualMeeting, you will need your 16-digit control number that is printed on the Notice or proxy card that you received inthe mail, or via email if you have elected to receive material electronically. You may log in 15 minutes before thestart of the Annual Meeting and submit questions online. You will be able to submit questions during the Annual
1

Meeting as well. We encourage you to submit any question that is relevant to the business of the meeting.
Questions asked during the Annual Meeting will be read and addressed during the meeting. Shareholders are
encouraged to log into the webcast at least 15 minutes prior to the start of the meeting to test their Internet
connectivity. You may also submit questions in advance of the meeting via the internet at www.proxyvote.com when
you vote your shares.
What documentation must I provide to be admitted to the virtual Annual Meeting and how do I attend?
If your shares are registered in your name, you will need to provide your sixteen-digit control number included
on your Notice or your proxy card (if you receive a printed copy of the proxy materials) in order to be able to
participate in the meeting. If your shares are not registered in your name (if, for instance, your shares are held in
‘‘street name’’ for you by your broker, bank or other institution), you must follow the instructions printed on your
Voting Instruction Form. In order to participate in the Annual Meeting, please log on to
www.virtualshareholdermeeting.com/KR2021 at least 15 minutes prior to the start of the Annual Meeting to provide
time to register and download the required software, if needed. The webcast replay will be available at
www.virtualshareholdermeeting.com/KR2021 until the 2022 Annual Meeting of Shareholders. If you access the
meeting but do not enter your control number, you will be able to listen to the proceedings, but you will not be able
to vote or otherwise participate.
What if I have technical or other ‘‘IT’’ problems logging into or participating in the Annual Meetingwebcast?
We have provided a toll-free technical support ‘‘help line’’ that can be accessed by any shareholder who is
having challenges logging into or participating in the virtual Annual Meeting. If you encounter any difficulties
accessing the virtual meeting during the check-in or meeting time, please call the technical support line number that
will be posted on the virtual Annual Meeting login page.
What documentation must I provide to vote online at the Annual Meeting?
If you are a shareholder of record and provide your sixteen-digit control number when you access the meeting,
you may vote all shares registered in your name during the Annual Meeting webcast. If you are not a shareholder
of record as to any of your shares (i.e., instead of being registered in your name, all or a portion of your shares are
registered in ‘‘street name’’ and held by your broker, bank or other institution for your benefit), you must follow the
instructions printed on your Voting Instruction Form.
How do I submit a question at the Annual Meeting?
If you would like to submit a question during the Annual Meeting, once you have logged into the webcast at
www.virtualshareholdermeeting.com/KR2021, simply type your question in the ‘‘ask a question’’ box and click
‘‘submit’’. You may also submit questions in advance of the meeting via the internet at www.proxyvote.com when
you vote your shares.
When should I submit my question at the Annual Meeting?
Each year at the Annual Meeting, we hold a question-and-answer session following the formal business
portion of the meeting during which shareholders may submit questions to us. We anticipate having such a
question-and-answer session at the 2021 Annual Meeting. You can submit a question up to 15 minutes prior to the
start of the Annual Meeting and up until the time we indicate that the question-and-answer session is concluded.
However, we encourage you to submit your questions before or during the formal business portion of the meeting
and our prepared statements, in advance of the question-and-answer session, in order to ensure that there is
adequate time to address questions in an orderly manner. You may also submit questions in advance of the
meeting via the internet at www.proxyvote.com when you vote your shares.
Can I change or revoke my proxy?
The common shares represented by each proxy will be voted in the manner you specified unless your proxy is
revoked before it is exercised. You may change or revoke your proxy by providing written notice to Kroger’s
Secretary at 1014 Vine Street, Cincinnati, Ohio 45202, by executing and sending us a subsequent proxy, or by
voting your shares while logged in and participating in the 2021 Annual Meeting of Shareholders.
2
How many shares are outstanding?
As of the close of business on April 26, 2021, the record date, our outstanding voting securities consisted of757,100,868 common shares.
How many votes per share?
Each common share outstanding on the record date will be entitled to one vote on each of the 10 directornominees and one vote on each other proposal. Shareholders may not cumulate votes in the election of directors.
What voting instructions can I provide?
You may instruct the proxies to vote ‘‘For’’ or ‘‘Against’’ each proposal, or you may instruct the proxies to‘‘Abstain’’ from voting.
What happens if proxy cards or voting instruction forms are returned without instructions?
If you are a registered shareholder and you return your proxy card without instructions, the Proxy Committeewill vote in accordance with the recommendations of the Board.
If you hold shares in street name and do not provide your broker with specific voting instructions onproposals 1, 2, and 4, which are considered non-routine matters, your broker does not have the authority to vote onthose proposals. This is generally referred to as a ‘‘broker non-vote.’’ Proposal 3, ratification of auditors, isconsidered a routine matter and, therefore, your broker may vote your shares according to your broker’s discretion.
The vote required, including the effect of broker non-votes and abstentions for each of the matters presentedfor shareholder vote, is set forth below.
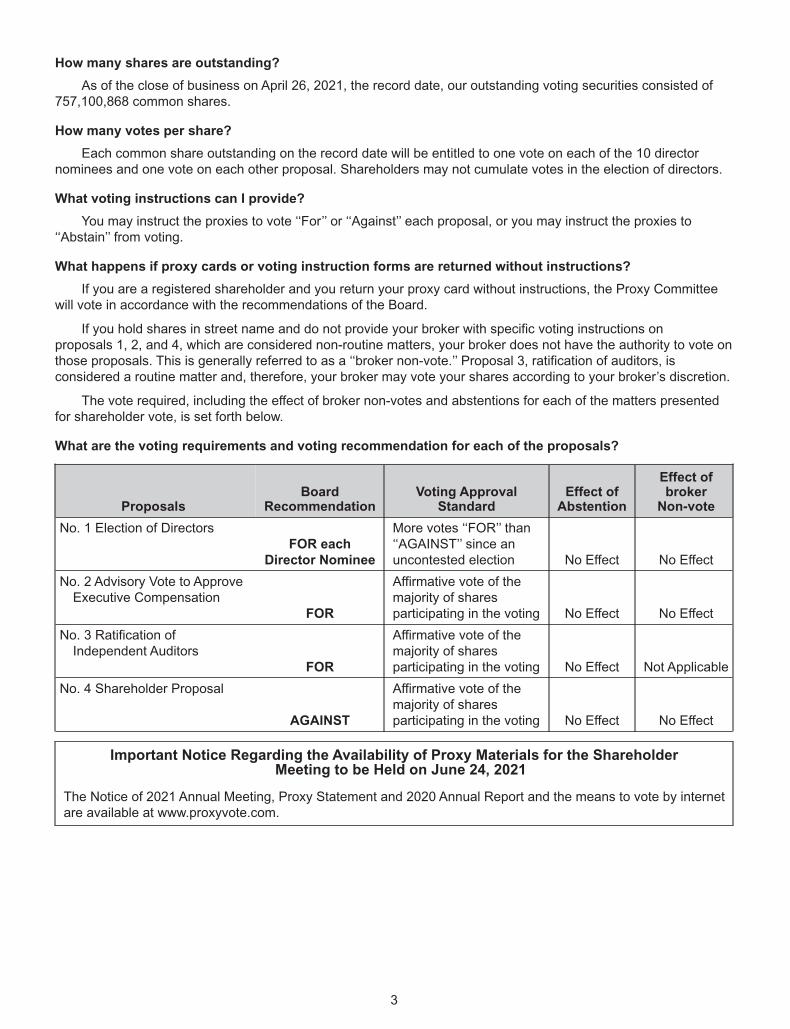
What are the voting requirements and voting recommendation for each of the proposals?
ProposalsBoard
RecommendationVoting Approval
StandardEffect of
Abstention
Effect ofbroker
Non-vote
No. 1 Election of DirectorsFOR each
Director Nominee
More votes ‘‘FOR’’ than‘‘AGAINST’’ since anuncontested election No Effect No Effect
No. 2 Advisory Vote to ApproveExecutive Compensation
FOR
Affirmative vote of themajority of sharesparticipating in the voting No Effect No Effect
No. 3 Ratification ofIndependent Auditors
FOR
Affirmative vote of themajority of sharesparticipating in the voting No Effect Not Applicable
No. 4 Shareholder Proposal
AGAINST
Affirmative vote of themajority of sharesparticipating in the voting No Effect No Effect
Important Notice Regarding the Availability of Proxy Materials for the ShareholderMeeting to be Held on June 24, 2021
The Notice of 2021 Annual Meeting, Proxy Statement and 2020 Annual Report and the means to vote by internetare available at www.proxyvote.com.
3
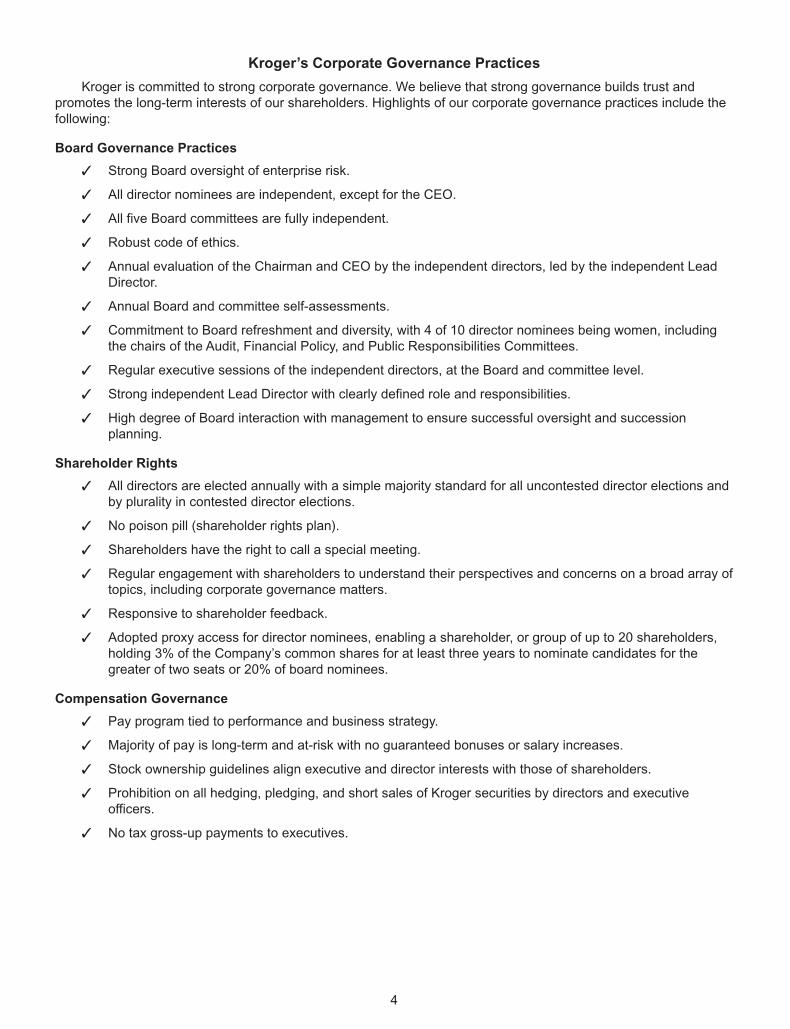
Kroger’s Corporate Governance Practices
Kroger is committed to strong corporate governance. We believe that strong governance builds trust andpromotes the long-term interests of our shareholders. Highlights of our corporate governance practices include thefollowing:
Board Governance Practices
✓ Strong Board oversight of enterprise risk.
✓ All director nominees are independent, except for the CEO.
✓ All five Board committees are fully independent.
✓ Robust code of ethics.
✓ Annual evaluation of the Chairman and CEO by the independent directors, led by the independent LeadDirector.
✓ Annual Board and committee self-assessments.
✓ Commitment to Board refreshment and diversity, with 4 of 10 director nominees being women, includingthe chairs of the Audit, Financial Policy, and Public Responsibilities Committees.
✓ Regular executive sessions of the independent directors, at the Board and committee level.
✓ Strong independent Lead Director with clearly defined role and responsibilities.
✓ High degree of Board interaction with management to ensure successful oversight and successionplanning.
Shareholder Rights
✓ All directors are elected annually with a simple majority standard for all uncontested director elections andby plurality in contested director elections.
✓ No poison pill (shareholder rights plan).
✓ Shareholders have the right to call a special meeting.
✓ Regular engagement with shareholders to understand their perspectives and concerns on a broad array oftopics, including corporate governance matters.
✓ Responsive to shareholder feedback.
✓ Adopted proxy access for director nominees, enabling a shareholder, or group of up to 20 shareholders,holding 3% of the Company’s common shares for at least three years to nominate candidates for thegreater of two seats or 20% of board nominees.
Compensation Governance
✓ Pay program tied to performance and business strategy.
✓ Majority of pay is long-term and at-risk with no guaranteed bonuses or salary increases.
✓ Stock ownership guidelines align executive and director interests with those of shareholders.
✓ Prohibition on all hedging, pledging, and short sales of Kroger securities by directors and executiveofficers.
✓ No tax gross-up payments to executives.
4
Proposals to Shareholders
Item No. 1. Election of Directors
You are being asked to elect 10 director nominees for a one-year term. The Board of Directorsrecommends that you vote FOR the election of all director nominees.
As of the date of this proxy statement, Kroger’s Board of Directors consists of 11 members. All 10 nominees, if
elected at the 2021 Annual Meeting, will serve until the annual meeting in 2022, or until their successors have been
elected by the shareholders or by the Board pursuant to Kroger’s Regulations, and qualified. The Board has not
nominated Susan Kropf for re-election as she has reached her retirement date under the Company’s Guidelines on
Issues of Corporate Governance (the ‘‘Guidelines’’), which includes a policy that a director’s normal retirement
occurs at the Annual Meeting of Shareholders following the year in which the director reaches the age of 72.
Kroger’s Articles of Incorporation provide that the vote required for election of a director nominee by the
shareholders, except in a contested election or when cumulative voting is in effect, is the affirmative vote of a
majority of the votes cast for or against the election of a nominee.
The experience, qualifications, attributes, and skills that led the Corporate Governance Committee and the
Board to conclude that the following individuals should serve as directors are set forth opposite each individual’s
name. The committee memberships stated below are those in effect as of the date of this proxy statement.
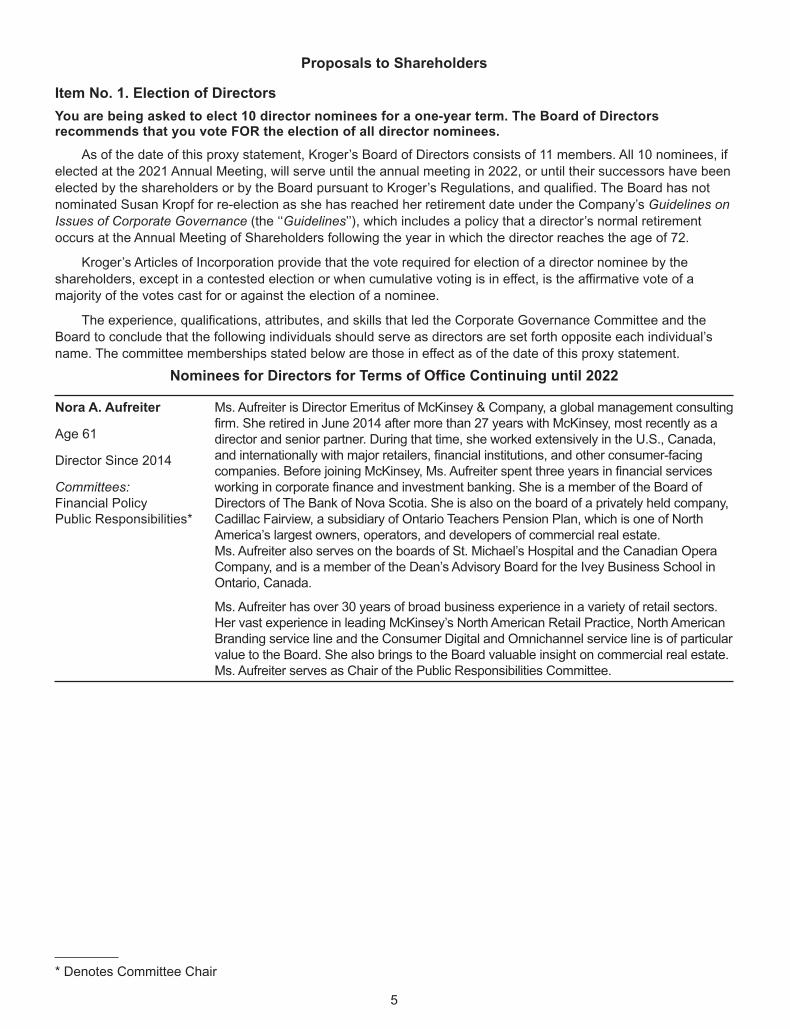
Nominees for Directors for Terms of Office Continuing until 2022
Nora A. Aufreiter
Age 61
Director Since 2014
Committees:
Financial PolicyPublic Responsibilities*
Ms. Aufreiter is Director Emeritus of McKinsey & Company, a global management consultingfirm. She retired in June 2014 after more than 27 years with McKinsey, most recently as adirector and senior partner. During that time, she worked extensively in the U.S., Canada,and internationally with major retailers, financial institutions, and other consumer-facingcompanies. Before joining McKinsey, Ms. Aufreiter spent three years in financial servicesworking in corporate finance and investment banking. She is a member of the Board ofDirectors of The Bank of Nova Scotia. She is also on the board of a privately held company,Cadillac Fairview, a subsidiary of Ontario Teachers Pension Plan, which is one of NorthAmerica’s largest owners, operators, and developers of commercial real estate.Ms. Aufreiter also serves on the boards of St. Michael’s Hospital and the Canadian OperaCompany, and is a member of the Dean’s Advisory Board for the Ivey Business School inOntario, Canada.
Ms. Aufreiter has over 30 years of broad business experience in a variety of retail sectors.Her vast experience in leading McKinsey’s North American Retail Practice, North AmericanBranding service line and the Consumer Digital and Omnichannel service line is of particularvalue to the Board. She also brings to the Board valuable insight on commercial real estate.Ms. Aufreiter serves as Chair of the Public Responsibilities Committee.
* Denotes Committee Chair
5
Kevin M. Brown
Age 58
Director Since 2021
Committees:
AuditPublic Responsibilities
Mr. Brown is the Executive Vice President and Chief Supply Chain Officer at DellTechnologies, a leading global technology company. His previous roles at Dell includesenior leadership roles in procurement, product quality, and manufacturing. Mr. Brownjoined Dell in 1998 and has held roles of increasing responsibility throughout hiscareer, including Chief Procurement Officer and Vice President, ODM Fulfillment &Supply Chain Strategy before being named Chief Supply Chain Officer in 2013.Before Dell, he spent 10 years in the shipbuilding industry, directing U.S. Departmentof Defense projects. Mr. Brown currently serves on the National Committee of theCouncil on Foreign Relations and on the Boards of the Congressional Black CaucusFoundation and the Howard University Center for Supply Chain Excellence. He is alsoa member of the Executive Leadership Council.
Mr. Brown is a global leader with over twenty years of leadership experience andsupply chain innovation experience. His efforts led Dell to be recognized as havingone of the most efficient, sustainable, and innovative supply chains. He brings to theBoard his vast experience in sustainability and circular economic business practices.His deep expertise in all matters related to supply chain, supply chain resilience, andrisk and crisis management are of particular value to the Board.
Anne Gates
Age 61
Director Since 2015
Committees:
Audit*Public Responsibilities
Ms. Gates was President of MGA Entertainment, Inc., a privately-held developer,manufacturer, and marketer of toy and entertainment products for children, from 2014until her retirement in 2017. Ms. Gates held roles of increasing responsibility with TheWalt Disney Company from 1992-2012. Her roles included Executive Vice President,Managing Director, and Chief Financial Officer for Disney Consumer Products, andSenior Vice President of Operations, Planning and Analysis. Prior to joining Disney,Ms. Gates worked for PepsiCo and Bear Stearns. She is currently a director ofTapestry, Inc. and Raymond James Financial, Inc.
Ms. Gates has over 25 years of experience in the retail and consumer productsindustry. She brings to Kroger financial expertise gained while serving as President ofMGA and CFO of a division of The Walt Disney Company. Ms. Gates has a broadbusiness background in finance, marketing, strategy and business development,including international business. Her expertise in toy and entertainment products is ofparticular value to the Board. Ms. Gates has been designated an Audit Committeefinancial expert and serves as Chair of the Audit Committee.
Karen M. Hoguet
Age 64
Director since 2019
Committees:
AuditFinancial Policy*
Ms. Hoguet served as the Chief Financial Officer of Macy’s, Inc. from October 1997until July of 2018 when she became a strategic advisor to the Chief Executive Officeruntil her retirement on February 1, 2019. Ms. Hoguet serves on the Board of Directorsof Nielsen Holdings plc. She also serves on the boards of Hebrew Union College andUCHealth. In the past five years, she also served as a director of The ChubbCorporation.
Ms. Hoguet has over 30 years of retail and commercial experience. Her long tenure asa senior executive of a publicly traded company with financial, audit, strategy, and riskoversight experience is of particular value to the Board as is her public companyexperience, both as a long serving executive, and as a board member. Ms. Hoguethas been designated an Audit Committee financial expert and serves as Chair of theFinancial Policy Committee.
* Denotes Committee Chair
6
W. Rodney McMullenChairman and Chief
Executive Officer
Age 60
Director Since 2003
Mr. McMullen was elected Chairman of the Board in January 2015 and ChiefExecutive Officer of Kroger in January 2014. He served as Kroger’s President andChief Operating Officer from August 2009 to December 2013. Prior to that,Mr. McMullen was elected to various roles at Kroger including Vice Chairman in 2003,Executive Vice President, Strategy, Planning, and Finance in 1999, Senior VicePresident in 1997, Group Vice President and Chief Financial Officer in June 1995, andVice President, Planning and Capital Management in 1989. He is a director of VFCorporation. In the past five years, he also served as a director of Cincinnati FinancialCorporation.
Mr. McMullen has broad experience in the supermarket business, having spent hiscareer spanning over 40 years with Kroger. He has a strong background in finance,operations, and strategic partnerships, having served in a variety of roles with Kroger,including as our CFO, COO, and Vice Chairman. His service as chair of CincinnatiFinancial Corporation’s compensation committee and on its executive and investmentcommittees, as well as his service on the audit and governance and corporateresponsibilities committees of VF Corporation, adds depth to his extensive retailexperience.
Clyde R. Moore
Age 67
Director Since 1997
Committees:
Compensation &Talent Development*Corporate Governance
Mr. Moore was the Chairman of First Service Networks, a national provider of facilityand maintenance repair services, until his retirement in 2015. Prior to his retirement,he was Chairman and Chief Executive Officer of First Service Networks from 2000 to2014.
Mr. Moore has over 30 years of general management experience in public and privatecompanies. He has sound experience as a corporate leader overseeing all aspects ofa facilities management firm and numerous manufacturing companies. Mr. Moore’sexpertise broadens the scope of the Board’s experience to provide oversight toKroger’s facilities, digital, and manufacturing businesses. Additionally, his expertiseand leadership as Chair of the Compensation and Talent Development Committee isof particular value to the Board.
Ronald L. Sargent
Lead Director
Age 65
Director Since 2006
Committees:AuditCorporate Governance*Public Responsibilities
Mr. Sargent was Chairman and Chief Executive Officer of Staples, Inc., a businessproducts retailer, where he was employed from 1989 until his retirement in 2017. Priorto joining Staples, Mr. Sargent spent 10 years with Kroger in various positions. He is adirector of Five Below, Inc. and Wells Fargo & Company. In the past five years, heserved as a director of Staples, Inc.
Mr. Sargent has over 35 years of retail experience, first with Kroger and then withincreasing levels of responsibility and leadership at Staples, Inc. His efforts helpedcarve out a new market niche for the international retailer. His understanding of retailoperations, consumer insights, and e-commerce are of particular value to the Board.Mr. Sargent has been designated an Audit Committee financial expert and serves asChair of the Corporate Governance Committee and Lead Director of the Board.
* Denotes Committee Chair
7
J. Amanda SourryKnox (AmandaSourry)
Age 57
Director Since 2021
Committees:
Compensation & TalentDevelopmentFinancial Policy
Ms. Sourry was President of North America for Unilever, a personal care, foods,refreshment, and home care consumer products company, from 2018 until herretirement in December 2019. She held leadership roles of increasing responsibilityduring her more than 30 years at Unilever, both in the U.S. and Europe, includingpresident of global foods, executive vice president of global hair care, and executivevice president of the firm’s UK and Ireland business. From 2015 to 2017, she servedas President of their Global Foods Category. Ms. Sourry currently serves on the boardfor PVH Corp., where she chairs the Compensation Committee and serves on theNominating, Governance & Management Development Committee. Ms. Sourry hasover thirty years of experience in the CPG and retail industry. She brings to the Boardher extensive global marketing and business experience in consumer packagedgoods as well as customer development, including overseeing Unilever’s digitalefforts.
Ms. Sourry was actively involved in Unilever’s global diversity, gender balance, andsustainable living initiatives which is of particular value to the Board.
Mark S. Sutton
Age 59
Director Since 2017
Committees:
Compensation &Talent DevelopmentFinancial Policy
Mr. Sutton is Chairman and Chief Executive Officer of International Paper, a leadingglobal producer of renewable fiber-based packaging, pulp, and paper products. Priorto becoming CEO in 2014, he served as President and Chief Operating Officer withresponsibility for running the company’s global business. Mr. Sutton joinedInternational Paper in 1984 as an Electrical Engineer. He held roles of increasingresponsibility throughout his career, including Mill Manager, Vice President ofCorrugated Packaging Operations across Europe, the Middle East and Africa, VicePresident of Corporate Strategic Planning, and Senior Vice President of severalbusiness units, including global supply chain. Mr. Sutton is a member of The BusinessCouncil, serves on the American Forest & Paper Association board of directors, theBusiness Roundtable board of directors, and the international advisory board of theMoscow School of Management – Skolkovo. He was appointed chairman of the U.S.Russian Business Council. He also serves on the board of directors of MemphisTomorrow and the board of governors for New Memphis Institute.
Mr. Sutton has over thirty years of leadership experience with increasing levels ofresponsibility and leadership at International Paper. He brings to the Board the criticalthinking that comes with an electrical engineering background as well as hisexperience leading a global company. His strong strategic planning background andmanufacturing and supply chain experience are of particular value to the Board.
Ashok Vemuri
Age 53
Director Since 2019
Committees:
Financial PolicyPublic Responsibilities
Mr. Vemuri was Chief Executive Officer and a Director of Conduent Incorporated, aglobal digital interactions company, since the company’s inception as a result of thespin-off from Xerox Corporation in January 2017, until 2019. He previously served asChief Executive Officer of Xerox Business Services, LLC and as an Executive VicePresident of Xerox Corporation from July 2017 to December 2017. Prior to that, hewas President, Chief Executive Officer, and a member of the Board of Directors ofIGATE Corporation, a New Jersey-based global technology and services companynow part of Capgemini, from 2013 to 2015. Before joining IGATE, Mr. Vemuri spent14 years at Infosys Limited, a multinational consulting and technology servicescompany, in a variety of leadership and business development roles and served onthe board of Infosys from 2011 to 2013. Prior to joining Infosys in 1999, Mr. Vemuriworked in the investment banking industry at Deutsche Bank and Bank of America. Inthe past five years, he served as a director of Conduent Incorporated.
Mr. Vemuri brings to the Board a proven track record of leading technology servicescompanies through growth and corporate transformations. His experience as CEO ofglobal technology companies is of particular value to the Board as he brings a uniqueoperational, financial, and client experience perspective.
8
The Board of Directors Recommends a Vote For Each Director Nominee.
Board Diversity, Succession Planning, and Refreshment Mechanisms
Our director nominees reflect a wide array of experience, skills, and backgrounds. Each director is individually
qualified to make unique and substantial contributions to Kroger. Collectively, our directors’ diverse viewpoints and
independent-mindedness enhance the quality and effectiveness of Board deliberations and decision making. Our
Board is a dynamic group of new and experienced members, providing an appropriate balance of institutional
knowledge and fresh perspectives about Kroger due to the varied length of tenure on the Board. This blend of
qualifications, attributes, and tenure results in highly effective board leadership.
The Corporate Governance Committee considers racial, ethnic, and gender diversity to be important elements
in promoting full, open, and balanced deliberations of issues presented to the Board. The Corporate Governance
Committee considers director candidates who help the Board reflect the diversity of our shareholders, associates,
customers, and the communities in which we operate. Mr. Brown, Ms. Gates, and Mr. Vemuri self-identify as
racially/ethnically diverse. Some consideration is also given to the geographic location of director candidates in
order to provide a reasonable distribution of members from Kroger’s operating areas.
Board succession planning is an ongoing, year-round process. The Corporate Governance Committee
recognizes the importance of thoughtful Board refreshment and engages in a continuing process of identifying
attributes sought for future Board members. The Corporate Governance Committee takes into account the Board
and committee evaluations regarding the specific qualities, skills, and experiences that would contribute to overall
Board and committee effectiveness, as well as the future needs of the Board and its committees in light of Kroger’s
current and long-term business strategies, and the skills and qualifications of directors who are expected to retire in
the future including as a result of our Board retirement policy, which requires directors to retire at the annual
meeting following their 72nd birthday.
9
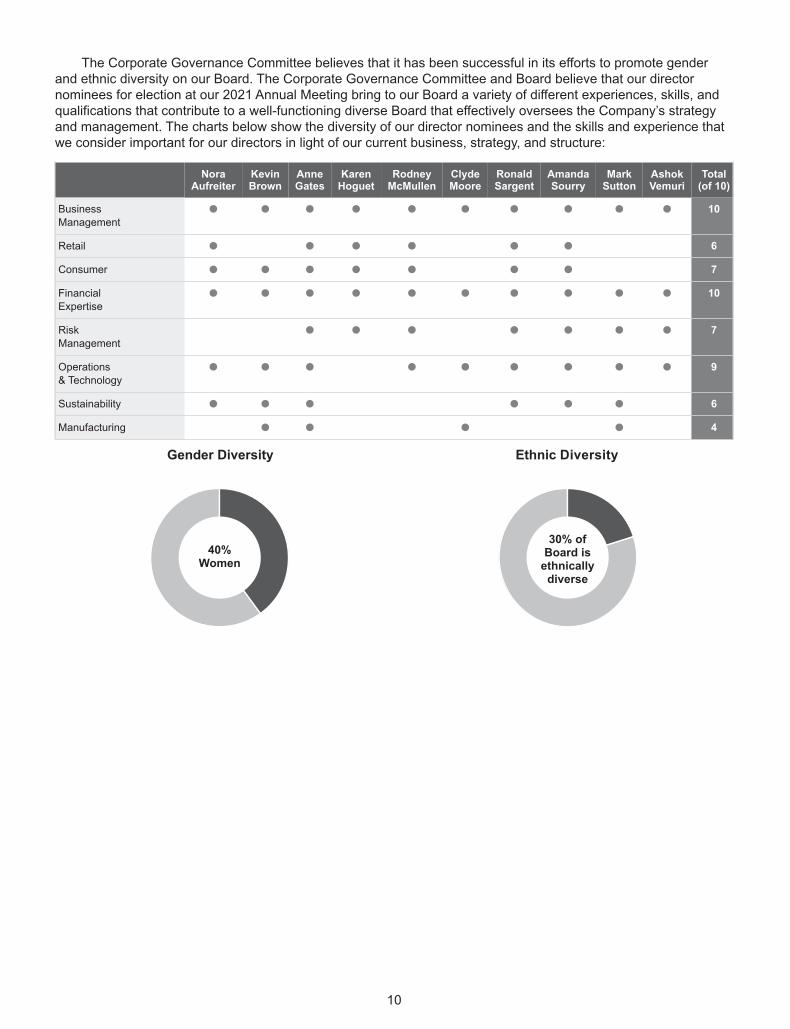
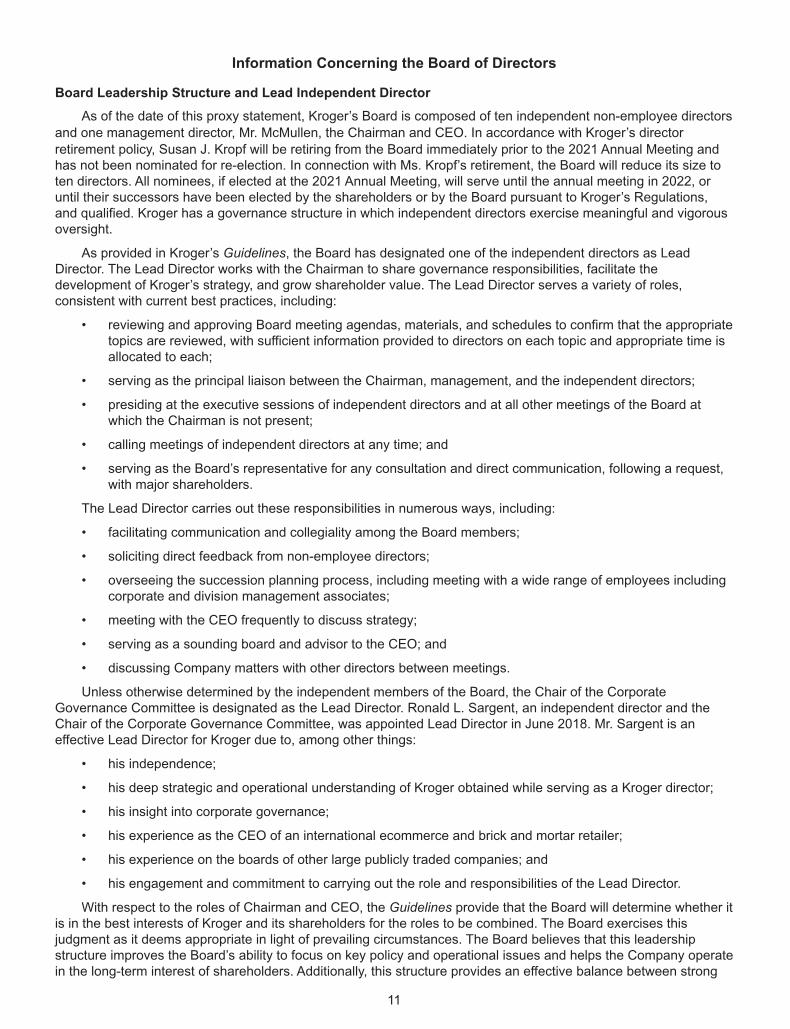
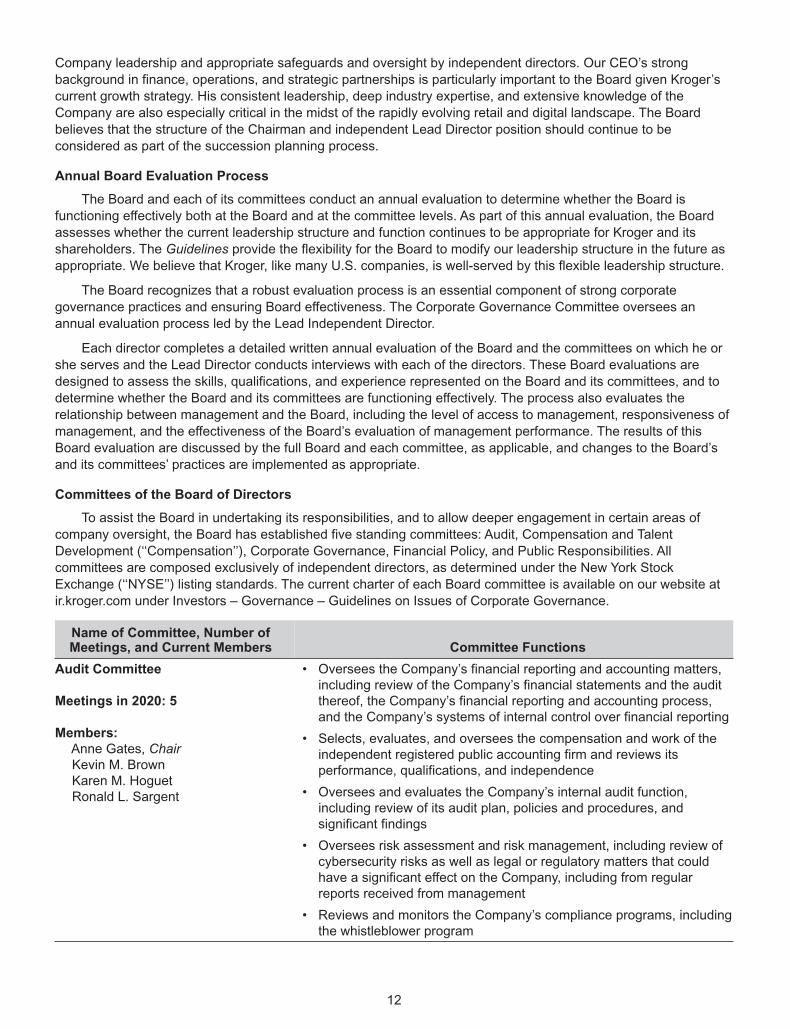
The Corporate Governance Committee believes that it has been successful in its efforts to promote genderand ethnic diversity on our Board. The Corporate Governance Committee and Board believe that our directornominees for election at our 2021 Annual Meeting bring to our Board a variety of different experiences, skills, andqualifications that contribute to a well-functioning diverse Board that effectively oversees the Company’s strategyand management. The charts below show the diversity of our director nominees and the skills and experience thatwe consider important for our directors in light of our current business, strategy, and structure:
NoraAufreiter
KevinBrown
AnneGates
KarenHoguet
RodneyMcMullen
ClydeMoore
RonaldSargent
AmandaSourry
MarkSutton
AshokVemuri
Total(of 10)
Business
Management
● ● ● ● ● ● ● ● ● ● 10
Retail ● ● ● ● ● ● 6
Consumer ● ● ● ● ● ● ● 7
Financial
Expertise
● ● ● ● ● ● ● ● ● ● 10
Risk
Management
● ● ● ● ● ● ● 7
Operations
& Technology
● ● ● ● ● ● ● ● ● 9
Sustainability ● ● ● ● ● ● 6
Manufacturing ● ● ● ● 4
Ethnic DiversityGender Diversity
40%Women
30% ofBoard is
ethnicallydiverse
10
Information Concerning the Board of Directors
Board Leadership Structure and Lead Independent Director
As of the date of this proxy statement, Kroger’s Board is composed of ten independent non-employee directors
and one management director, Mr. McMullen, the Chairman and CEO. In accordance with Kroger’s director
retirement policy, Susan J. Kropf will be retiring from the Board immediately prior to the 2021 Annual Meeting andhas not been nominated for re-election. In connection with Ms. Kropf’s retirement, the Board will reduce its size toten directors. All nominees, if elected at the 2021 Annual Meeting, will serve until the annual meeting in 2022, oruntil their successors have been elected by the shareholders or by the Board pursuant to Kroger’s Regulations,and qualified. Kroger has a governance structure in which independent directors exercise meaningful and vigorousoversight.
As provided in Kroger’s Guidelines, the Board has designated one of the independent directors as LeadDirector. The Lead Director works with the Chairman to share governance responsibilities, facilitate thedevelopment of Kroger’s strategy, and grow shareholder value. The Lead Director serves a variety of roles,consistent with current best practices, including:
• reviewing and approving Board meeting agendas, materials, and schedules to confirm that the appropriatetopics are reviewed, with sufficient information provided to directors on each topic and appropriate time isallocated to each;
• serving as the principal liaison between the Chairman, management, and the independent directors;
• presiding at the executive sessions of independent directors and at all other meetings of the Board atwhich the Chairman is not present;
• calling meetings of independent directors at any time; and
• serving as the Board’s representative for any consultation and direct communication, following a request,with major shareholders.
The Lead Director carries out these responsibilities in numerous ways, including:
• facilitating communication and collegiality among the Board members;
• soliciting direct feedback from non-employee directors;
• overseeing the succession planning process, including meeting with a wide range of employees includingcorporate and division management associates;
• meeting with the CEO frequently to discuss strategy;
• serving as a sounding board and advisor to the CEO; and
• discussing Company matters with other directors between meetings.
Unless otherwise determined by the independent members of the Board, the Chair of the CorporateGovernance Committee is designated as the Lead Director. Ronald L. Sargent, an independent director and theChair of the Corporate Governance Committee, was appointed Lead Director in June 2018. Mr. Sargent is aneffective Lead Director for Kroger due to, among other things:
• his independence;
• his deep strategic and operational understanding of Kroger obtained while serving as a Kroger director;
• his insight into corporate governance;
• his experience as the CEO of an international ecommerce and brick and mortar retailer;
• his experience on the boards of other large publicly traded companies; and
• his engagement and commitment to carrying out the role and responsibilities of the Lead Director.
With respect to the roles of Chairman and CEO, the Guidelines provide that the Board will determine whether itis in the best interests of Kroger and its shareholders for the roles to be combined. The Board exercises thisjudgment as it deems appropriate in light of prevailing circumstances. The Board believes that this leadershipstructure improves the Board’s ability to focus on key policy and operational issues and helps the Company operatein the long-term interest of shareholders. Additionally, this structure provides an effective balance between strong
11
Company leadership and appropriate safeguards and oversight by independent directors. Our CEO’s strong
background in finance, operations, and strategic partnerships is particularly important to the Board given Kroger’s
current growth strategy. His consistent leadership, deep industry expertise, and extensive knowledge of the
Company are also especially critical in the midst of the rapidly evolving retail and digital landscape. The Board
believes that the structure of the Chairman and independent Lead Director position should continue to be
considered as part of the succession planning process.
Annual Board Evaluation Process
The Board and each of its committees conduct an annual evaluation to determine whether the Board is
functioning effectively both at the Board and at the committee levels. As part of this annual evaluation, the Board
assesses whether the current leadership structure and function continues to be appropriate for Kroger and its
shareholders. The Guidelines provide the flexibility for the Board to modify our leadership structure in the future as
appropriate. We believe that Kroger, like many U.S. companies, is well-served by this flexible leadership structure.
The Board recognizes that a robust evaluation process is an essential component of strong corporate
governance practices and ensuring Board effectiveness. The Corporate Governance Committee oversees an
annual evaluation process led by the Lead Independent Director.
Each director completes a detailed written annual evaluation of the Board and the committees on which he or
she serves and the Lead Director conducts interviews with each of the directors. These Board evaluations are
designed to assess the skills, qualifications, and experience represented on the Board and its committees, and to
determine whether the Board and its committees are functioning effectively. The process also evaluates the
relationship between management and the Board, including the level of access to management, responsiveness of
management, and the effectiveness of the Board’s evaluation of management performance. The results of this
Board evaluation are discussed by the full Board and each committee, as applicable, and changes to the Board’s
and its committees’ practices are implemented as appropriate.
Committees of the Board of Directors
To assist the Board in undertaking its responsibilities, and to allow deeper engagement in certain areas of
company oversight, the Board has established five standing committees: Audit, Compensation and Talent
Development (‘‘Compensation’’), Corporate Governance, Financial Policy, and Public Responsibilities. All
committees are composed exclusively of independent directors, as determined under the New York Stock
Exchange (‘‘NYSE’’) listing standards. The current charter of each Board committee is available on our website at
ir.kroger.com under Investors – Governance – Guidelines on Issues of Corporate Governance.
Name of Committee, Number ofMeetings, and Current Members Committee Functions
Audit Committee
Meetings in 2020: 5
Members:Anne Gates, ChairKevin M. BrownKaren M. HoguetRonald L. Sargent
• Oversees the Company’s financial reporting and accounting matters,including review of the Company’s financial statements and the auditthereof, the Company’s financial reporting and accounting process,and the Company’s systems of internal control over financial reporting
• Selects, evaluates, and oversees the compensation and work of theindependent registered public accounting firm and reviews itsperformance, qualifications, and independence
• Oversees and evaluates the Company’s internal audit function,including review of its audit plan, policies and procedures, andsignificant findings
• Oversees risk assessment and risk management, including review ofcybersecurity risks as well as legal or regulatory matters that couldhave a significant effect on the Company, including from regularreports received from management
• Reviews and monitors the Company’s compliance programs, includingthe whistleblower program
12
Name of Committee, Number ofMeetings, and Current Members Committee Functions
Compensation Committee
Meetings in 2020: 6
Members:Clyde R. Moore, ChairSusan J. KropfAmanda SourryMark S. Sutton
• Recommends for approval by the independent directors thecompensation of the CEO and approves the compensation of seniorofficers
• Administers the Company’s executive compensation policies andprograms, including determining grants of equity awards under theplans
• Has sole authority to retain and direct the committee’s compensationconsultant
• Assists the full Board with senior management succession planning
Corporate Governance Committee
Meetings in 2020: 2
Members:Ronald L. Sargent, ChairSusan J. KropfClyde R. Moore
• Oversees the Company’s corporate governance policies andprocedures
• Develops criteria for selecting and retaining directors, includingidentifying and recommending qualified candidates to be directornominees
• Designates membership and Chairs of Board committees
• Reviews the Board’s performance and director independence
• Establishes and reviews the practices and procedures by which theBoard performs its functions
Financial Policy Committee
Meetings in 2020: 4
Members:Karen M. Hoguet, ChairNora A. AufreiterAmanda SourryMark S. SuttonAshok Vemuri
• Reviews and recommends financial policies and practices
• Oversees management of the Company’s financial resources
• Reviews the Company’s annual financial plan, significant capitalinvestments, plans for major acquisitions or sales, issuance of newcommon or preferred stock, dividend policy, creation of additional debtand other capital structure considerations including additional leverageor dilution in ownership
• Monitors the investment management of assets held in pension andprofit sharing plans administered by the Company
Public Responsibilities Committee
Meetings in 2020: 2
Members:Nora A. Aufreiter, ChairKevin M. BrownAnne GatesRonald L. SargentAshok Vemuri
• Reviews the Company’s policies and practices affecting its social andpublic responsibility as a corporate citizen, including: communityrelations, charitable giving, supplier diversity, sustainability,government relations, political action, consumer and media relations,food and pharmacy safety and the safety of customers and employees
• Reviews and examines the Company’s evaluation of and response tochanging public expectations and public issues affecting the business
Director Nominee Selection Process
The Corporate Governance Committee is responsible for recommending to the Board a slate of nominees for
election at each annual meeting of shareholders. The Corporate Governance Committee recruits candidates for
Board membership through its own efforts and through recommendations from other directors and shareholders. In
addition, the Corporate Governance Committee retains an independent search firm to assist in identifying and
recruiting director candidates who meet the criteria established by the Corporate Governance Committee.
These criteria are:
• demonstrated ability in fields considered to be of value to the Board in the deliberation and long-termplanning of the Board and Kroger, including business management, public service, education, science,technology, e-commerce, law, and government;
13
• experience in high growth companies and nominees whose business experience can help the Companyinnovate and derive new value from existing assets;
• highest standards of personal character and conduct;
• willingness to fulfil the obligations of directors and to make the contribution of which he or she is capable,including regular attendance and participation at Board and committee meetings, and preparation for allmeetings, including review of all meeting materials provided in advance of the meeting; and
• ability to understand the perspectives of Kroger’s customers, taking into consideration the diversity of ourcustomers, including regional and geographic differences.
The Corporate Governance Committee also considers the specific experience and abilities of director
candidates in light of our current business, strategy and structure, and the current or expected needs of the Board
in its identification and recruitment of director candidates.
Shareholder Engagement
Maintaining ongoing relationships with our shareholders, and understanding our shareholders’ views, is a
priority for both our Board and management team. We have a longstanding history of engaging with our
shareholders through our investor relations team’s year-round outreach program. At the direction of our Board, we
expanded our shareholder engagement program in 2016 to include outreach to our largest shareholders’
governance teams. In 2020, we requested meetings with shareholders representing 43% of our outstanding shares
during proxy season and off-season engagement and ultimately engaged with shareholders representing 27% of
our outstanding shares.
During these engagements we discussed and solicited feedback on a range of topics, including business
strategy, corporate governance, executive compensation, human capital management, and sustainability. In
addition, we attended virtual industry events to further engage with shareholders and subject matter experts. These
conversations provided valuable insights into our shareholders’ perspectives and their feedback was shared with,
and considered by, our full Board.
Candidates Nominated by Shareholders
The Corporate Governance Committee will consider shareholder recommendations for director nominees for
election to the Board. If shareholders wish to nominate a person or persons for election to the Board at our 2022
annual meeting, written notice must be submitted to Kroger’s Secretary, and received at our executive offices, in
accordance with Kroger’s Regulations, not later than March 29, 2022. Such notice should include the name, age,
business address and residence address of such person, the principal occupation or employment of such person,
the number of Kroger common shares owned of record or beneficially by such person and any other information
relating to the person that would be required to be included in a proxy statement relating to the election of directors.
The Secretary will forward the information to the Corporate Governance Committee for its consideration. The
Corporate Governance Committee will use the same criteria in evaluating candidates submitted by shareholders as
it uses in evaluating candidates identified by the Corporate Governance Committee, as described above. See
‘‘Director Nominee Selection Process.’’
Eligible shareholders have the ability to submit director nominees for inclusion in our proxy statement for the
2022 annual meeting of shareholders. To be eligible, shareholders must have owned at least 3% of our common
shares for at least three years. Up to 20 shareholders are able to aggregate for this purpose. Nominations must be
submitted to our Corporate Secretary at our principal executive offices no earlier than December 14, 2021 and no
later than January 13, 2022.
Corporate Governance Guidelines
The Board has adopted the Guidelines which include copies of the current charters for each of the five
standing committees of the Board. The Guidelines are available on our website at ir.kroger.com under Investors –
Governance – Guidelines on Issues of Corporate Governance. Shareholders may also obtain a copy of the
Guidelines by making a written request to Kroger’s Secretary at our executive offices.
14
Independence
The Board has determined that all of the non-employee directors have no material relationships with Kroger
and satisfy the criteria for independence set forth in Rule 303A.02 of the NYSE Listed Company Manual. Therefore,
all non-employee directors are independent for purposes of the NYSE listing standards. The Board made its
determination based on information furnished by all members regarding their relationships with Kroger and its
management, and other relevant information. The Board considered, among other things, that
• the value of any business transactions between Kroger and entities with which the directors are affiliatedfalls below the thresholds identified by the NYSE listing standards, and
• none had any material relationships with Kroger other than serving on our Board.
Audit Committee Expertise
The Board has determined that Anne Gates, Karen M. Hoguet, and Ronald L. Sargent, independent directors
who are members of the Audit Committee, are ‘‘audit committee financial experts’’ as defined by applicable
Securities and Exchange Commission (‘‘SEC’’) regulations and that all members of the Audit Committee are
‘‘financially literate’’ as that term is used in the NYSE listing standards and are independent in accordance with
Rule 10A-3 of the Securities Exchange Act of 1934.
Code of Ethics
The Board has adopted The Kroger Co. Policy on Business Ethics, applicable to all officers, employees and
directors, including Kroger’s principal executive, financial and accounting officers. The Policy on Business Ethics is
available on our website at ir.kroger.com under Investors – Governance – Policy on Business Ethics. Shareholders
may also obtain a copy of the Policy on Business Ethics by making a written request to Kroger’s Secretary at our
executive offices.
Communications with the Board
The Board has established two separate mechanisms for shareholders and interested parties to communicate
with the Board. Any shareholder or interested party who has concerns regarding accounting, improper use of
Kroger assets, or ethical improprieties may report these concerns via the toll-free hotline (800-689-4609) or website
(ethicspoint.com) established by the Board’s Audit Committee. The concerns are investigated by Kroger’s Vice
President, Chief Ethics and Compliance Officer and the Vice President of Internal Audit and reported to the Audit
Committee as deemed appropriate.
Shareholders or interested parties also may communicate with the Board in writing directed to Kroger’s
Secretary at our executive offices. Communications relating to personnel issues, ordinary business operations, or
companies seeking to do business with us, will be forwarded to the business unit of Kroger that the Secretary
deems appropriate. Other communications will be forwarded to the Chair of the Corporate Governance Committee
for further consideration. The Chair of the Corporate Governance Committee will take such action as he or she
deems appropriate, which may include referral to the full Corporate Governance Committee or the entire Board.
Executive Officer Succession Planning
The Guidelines provide that the Compensation Committee will review Company policies and programs for
talent development and evaluation of executive officers, and will review management succession planning. In
connection with the use of a third-party search firm to identify external candidates for executive officer positions,
including the chief executive officer, the Board and/or the Company, as the case may be, will instruct the third-party
search firm to include in its initial list qualified female and racially/ethnically diverse candidates.
Attendance
The Board held five meetings in fiscal year 2020. During fiscal 2020, all incumbent directors attended at least
75% of the aggregate number of meetings of the Board and committees on which that director served. Members of
the Board are expected to use their best efforts to attend all annual meetings of shareholders. All Board members
attended last year’s virtual annual meeting.
15
Independent Compensation Consultants
The Compensation Committee directly engages a compensation consultant to advise the CompensationCommittee in the design of Kroger’s executive compensation. The Committee retained Korn Ferry Hay (US) (‘‘KornFerry’’) beginning in December 2017. Retained by and reporting directly to the Compensation Committee, KornFerry provided the Committee with assistance in evaluating Kroger’s executive compensation programs andpolicies.
In fiscal 2020, Kroger paid Korn Ferry $479,893 for work performed for the Compensation Committee. Kroger,on management’s recommendation, retained Korn Ferry to provide other services for Kroger in fiscal 2020 forwhich Kroger paid $17,500. These other services primarily related to salary surveys and benchmarking. TheCompensation Committee expressly approved Korn Ferry performing these additional services. After taking intoconsideration the NYSE’s independence standards and the SEC rules, the Compensation Committee determinedthat Korn Ferry was independent, and their work has not raised any conflict of interest.
The Compensation Committee may engage an additional compensation consultant from time to time as itdeems advisable.
Compensation Committee Interlocks and Insider Participation
No member of the Compensation Committee was an officer or employee of Kroger during fiscal 2020, and nomember of the Compensation Committee is a former officer of Kroger or was a party to any related persontransaction involving Kroger required to be disclosed under Item 404 of Regulation S-K. During fiscal 2020, none ofour executive officers served on the board of directors or on the compensation committee of any other entity thathas or had executive officers serving as a member of Kroger’s Board of Directors or Compensation Committee ofthe Board.
Board Oversight of Enterprise Risk
While risk management is primarily the responsibility of Kroger’s management team, the Board is responsiblefor strategic planning and overall supervision of our risk management activities. The Board’s oversight of thematerial risks faced by Kroger occurs at both the full Board level and at the committee level.
The Board receives presentations throughout the year from various department and business unit leaders thatinclude discussion of significant risks as necessary, including newly identified and evolving high priority risks, suchas those presented by the COVID-19 pandemic. At each Board meeting, the CEO addresses matters of particularimportance or concern, including any significant areas of risk that require Board attention. Additionally, throughdedicated sessions focusing entirely on corporate strategy, the full Board reviews in detail Kroger’s short- and long-term strategies, including consideration of significant risks facing Kroger and their potential impact. Theindependent directors, in executive sessions led by the Lead Director, address matters of particular concern,including significant areas of risk, that warrant further discussion or consideration outside the presence of Krogeremployees. At the committee level, reports are given by management subject matter experts to each committee onrisks within the scope of their charters.
The Audit Committee has oversight responsibility not only for financial reporting of Kroger’s major financialexposures and the steps management has taken to monitor and control those exposures, but also for theeffectiveness of management’s processes that monitor and manage key business risks facing Kroger, as well asthe major areas of risk exposure, and management’s efforts to monitor and control the major areas of risk exposureincluding cybersecurity risk. The Audit Committee incorporates its risk oversight function into its regular reports tothe Board and also discusses with management its policies with respect to risk assessment and risk management.
Management provides regular updates throughout the year to the respective Board committees regardingmanagement of the risks they oversee. For example, our Vice President, Chief Ethics and Compliance Officerprovides regular updates to the Audit Committee on our compliance risks and actions taken to mitigate that risk;and our Senior Vice President and Chief Information Officer and our Chief Information Security Officer provideregular updates at least annually and more often as needed on our cybersecurity risks and actions taken tomitigate that risk to the Audit Committee. The Audit Committee reports on risk to the full Board at each regularmeeting of the Board following an Audit Committee meeting.
Throughout 2020, the Board and its Committees oversaw the specific risks associated with COVID-19. TheCOVID-19 pandemic created new risks and brought historically low risks to the forefront. The Company’s businessresilience team began meeting daily in March 2020 to identify new and emerging risks and develop and implementmitigating action plans. Management conducted, and the Audit Committee reviewed and discussed, a COVID-19
16
enterprise risk assessment, which included human capital, supply chain, associate and customer health and safety,legal, regulatory, and other risks. Management and the Board discussed the relative severity of each category ofrisk as well as mitigating actions. In addition to discussing at the five regularly scheduled board meetings, theBoard conducted five additional calls specifically to update the Board on Kroger’s response to the pandemic andthe associated business challenges.
We believe that our approach to risk oversight, as described above, optimizes our ability to assess inter-relationships among the various risks, make informed cost-benefit decisions, and approach emerging risks in aproactive manner for Kroger. We also believe that our risk structure complements our current Board leadershipstructure, as it allows our independent directors, through the five fully independent Board committees, and inexecutive sessions of independent directors led by the Lead Director, to exercise effective oversight of the actionsof management, in identifying risks and implementing effective risk management policies and controls.
Environmental, Sustainability, and Governance Oversight
We are aligned with the desire of our customers, associates, and shareholders that we engage in ourcommunities and reduce our impacts on the environment while continuing to create positive economic value overthe long-term. Given the breadth of topics and their importance to us, most of our Board committees have directoversight of environmental, social and governance (‘‘ESG’’) topics. Among the other key responsibilities for eachcommittee: the Audit Committee oversees risk management and compliance with legal, financial, and regulatoryrequirements; the Public Responsibilities Committee oversees our responsibilities as a corporate citizen and effortsto engage stakeholders and manage issues that affect our business, including sustainability, supplier diversity andfood safety, among other topics; the Corporate Governance Committee oversees our good governance practices;and the Compensation and Talent Development Committee oversees talent development. We discuss theresponsibilities of each committee further above. Throughout the year, Kroger leaders update the PublicResponsibilities Committee on important ESG topics, which may relate to our sustainability initiatives such as ourZero Hunger | Zero Waste campaign, our food safety programs, and community and customer engagement. Ateach Board meeting, Kroger’s CEO addresses matters of particular importance or concern, including anysignificant areas of oversight that require Board attention.
For the past fourteen years, our Company has prepared and produced an annual report describing ourprogress and initiatives regarding sustainability and other ESG matters. For the most recent information regardingour ESG initiatives and related matters, please visit http://sustainability.kroger.com. The information on, oraccessible through, this website is not part of, or incorporated by reference into, this proxy statement.
In addition, our full Board oversees issues related to diversity and inclusion within the Kroger workplace.Diversity and inclusion have been deeply rooted in Kroger’s values for decades. We are committed to fostering anenvironment of inclusion in the workplace, marketplace, and workforce where the diversity of cultures,backgrounds, experiences, perspectives and ideas are valued and appreciated. Kroger’s corporate team and retaildivisions have strategic partnerships with universities, educational institutions, and community partners to improvehow we attract candidates from all backgrounds and ethnicities for jobs at all levels. Diversity and inclusion willcontinue to be a key ingredient in feeding Kroger’s innovation, long-term sustainability, and the human spirit.
The Kroger family of companies provides inclusion training to all management and many hourly associates.Most work locations (stores, plants, distribution centers, and offices) have an inclusion-focused team, called OurPromise team. The teams work on projects that reflect Kroger’s values, offer leaders valuable feedback andsuggestions on improving diversity and inclusion, and facilitate communication to champion business priorities.
17
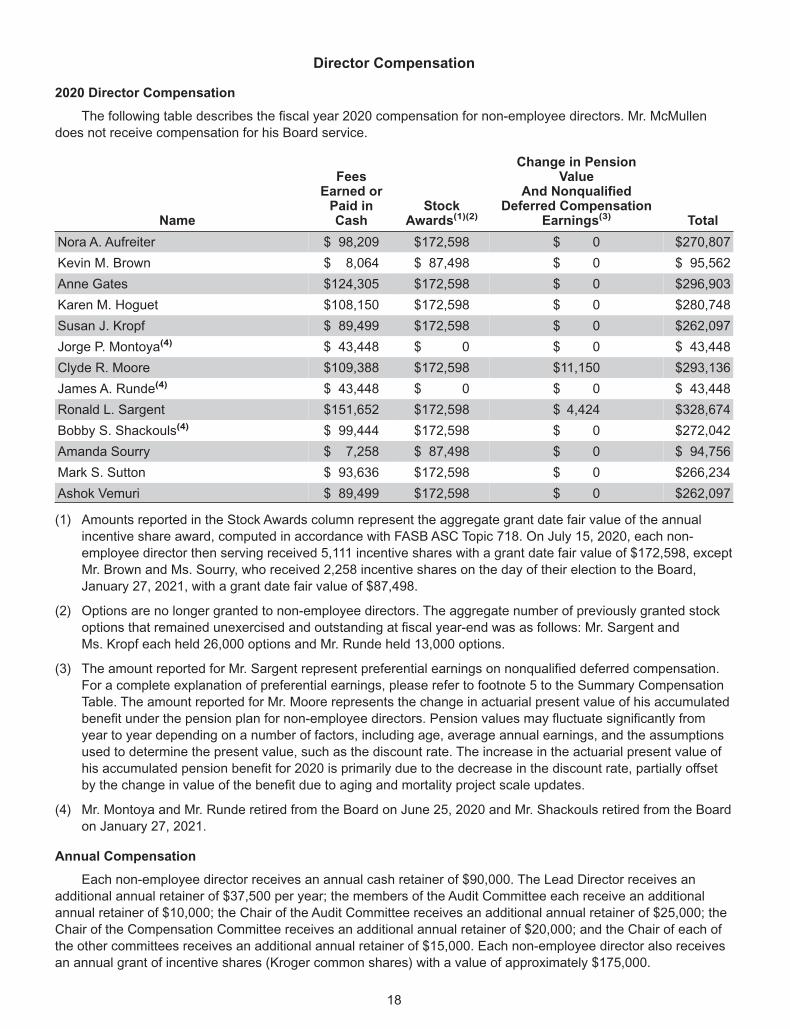
Director Compensation
2020 Director Compensation
The following table describes the fiscal year 2020 compensation for non-employee directors. Mr. McMullen
does not receive compensation for his Board service.
Name
FeesEarned orPaid inCash
StockAwards(1)(2)
Change in PensionValue
And NonqualifiedDeferred Compensation
Earnings(3) Total
Nora A. Aufreiter $ 98,209 $172,598 $ 0 $270,807
Kevin M. Brown $ 8,064 $ 87,498 $ 0 $ 95,562
Anne Gates $124,305 $172,598 $ 0 $296,903
Karen M. Hoguet $108,150 $172,598 $ 0 $280,748
Susan J. Kropf $ 89,499 $172,598 $ 0 $262,097
Jorge P. Montoya(4) $ 43,448 $ 0 $ 0 $ 43,448
Clyde R. Moore $109,388 $172,598 $11,150 $293,136
James A. Runde(4) $ 43,448 $ 0 $ 0 $ 43,448
Ronald L. Sargent $151,652 $172,598 $ 4,424 $328,674
Bobby S. Shackouls(4) $ 99,444 $172,598 $ 0 $272,042
Amanda Sourry $ 7,258 $ 87,498 $ 0 $ 94,756
Mark S. Sutton $ 93,636 $172,598 $ 0 $266,234
Ashok Vemuri $ 89,499 $172,598 $ 0 $262,097
(1) Amounts reported in the Stock Awards column represent the aggregate grant date fair value of the annual
incentive share award, computed in accordance with FASB ASC Topic 718. On July 15, 2020, each non-
employee director then serving received 5,111 incentive shares with a grant date fair value of $172,598, except
Mr. Brown and Ms. Sourry, who received 2,258 incentive shares on the day of their election to the Board,
January 27, 2021, with a grant date fair value of $87,498.
(2) Options are no longer granted to non-employee directors. The aggregate number of previously granted stock
options that remained unexercised and outstanding at fiscal year-end was as follows: Mr. Sargent and
Ms. Kropf each held 26,000 options and Mr. Runde held 13,000 options.
(3) The amount reported for Mr. Sargent represent preferential earnings on nonqualified deferred compensation.
For a complete explanation of preferential earnings, please refer to footnote 5 to the Summary Compensation
Table. The amount reported for Mr. Moore represents the change in actuarial present value of his accumulated
benefit under the pension plan for non-employee directors. Pension values may fluctuate significantly from
year to year depending on a number of factors, including age, average annual earnings, and the assumptions
used to determine the present value, such as the discount rate. The increase in the actuarial present value of
his accumulated pension benefit for 2020 is primarily due to the decrease in the discount rate, partially offset
by the change in value of the benefit due to aging and mortality project scale updates.
(4) Mr. Montoya and Mr. Runde retired from the Board on June 25, 2020 and Mr. Shackouls retired from the Board
on January 27, 2021.
Annual Compensation
Each non-employee director receives an annual cash retainer of $90,000. The Lead Director receives an
additional annual retainer of $37,500 per year; the members of the Audit Committee each receive an additional
annual retainer of $10,000; the Chair of the Audit Committee receives an additional annual retainer of $25,000; the
Chair of the Compensation Committee receives an additional annual retainer of $20,000; and the Chair of each of
the other committees receives an additional annual retainer of $15,000. Each non-employee director also receives
an annual grant of incentive shares (Kroger common shares) with a value of approximately $175,000.
18
The Board has determined that compensation of non-employee directors must be competitive on an ongoingbasis to attract and retain directors who meet the qualifications for service on the Board. Non-employee directorcompensation was adjusted in 2018 and will be reviewed from time to time as the Corporate GovernanceCommittee deems appropriate.
Pension Plan
Non-employee directors first elected prior to July 17, 1997 receive an unfunded retirement benefit equal to theaverage cash compensation for the five calendar years preceding retirement. Only Mr. Moore is eligible for thisbenefit. Benefits begin at the later of actual retirement or age 65.
Nonqualified Deferred Compensation
We also maintain a deferred compensation plan for non-employee directors. Participants may defer up to100% of their cash compensation and/or the receipt of all (and not less than all) of the annual award of incentiveshares.
Cash Deferrals
Cash deferrals are credited to a participant’s deferred compensation account. Participants may elect fromeither or both of the following two alternative methods of determining benefits:
• interest accrues until paid out at the rate of interest determined prior to the beginning of the deferral yearto represent Kroger’s cost of ten-year debt; and/or
• amounts are credited in ‘‘phantom’’ stock accounts and the amounts in those accounts fluctuate with theprice of Kroger common shares.
In both cases, deferred amounts are paid out only in cash, based on deferral options selected by theparticipant at the time the deferral elections are made. Participants can elect to have distributions made in a lumpsum or in quarterly instalments, and may make comparable elections for designated beneficiaries who receivebenefits in the event that deferred compensation is not completely paid out upon the death of the participant.
Incentive Share Deferrals
Participants may also defer the receipt of all (and not less than all) of the annual award of incentive shares.Distributions will be made by delivery of Kroger common shares within 30 days after the date which is six monthsafter the participant’s separation of service.
19
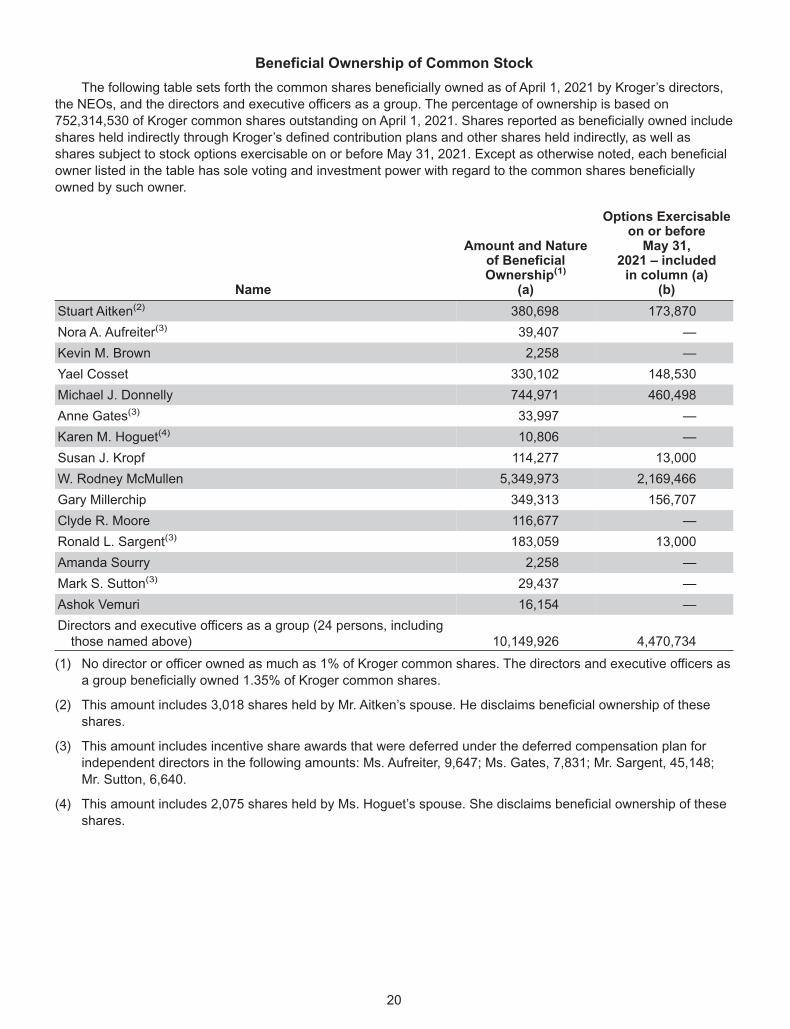
Beneficial Ownership of Common Stock
The following table sets forth the common shares beneficially owned as of April 1, 2021 by Kroger’s directors,
the NEOs, and the directors and executive officers as a group. The percentage of ownership is based on
752,314,530 of Kroger common shares outstanding on April 1, 2021. Shares reported as beneficially owned include
shares held indirectly through Kroger’s defined contribution plans and other shares held indirectly, as well as
shares subject to stock options exercisable on or before May 31, 2021. Except as otherwise noted, each beneficial
owner listed in the table has sole voting and investment power with regard to the common shares beneficially
owned by such owner.
Name
Amount and Natureof BeneficialOwnership(1)
(a)
Options Exercisableon or beforeMay 31,
2021 – includedin column (a)
(b)
Stuart Aitken(2) 380,698 173,870
Nora A. Aufreiter(3) 39,407 —
Kevin M. Brown 2,258 —
Yael Cosset 330,102 148,530
Michael J. Donnelly 744,971 460,498
Anne Gates(3) 33,997 —
Karen M. Hoguet(4) 10,806 —
Susan J. Kropf 114,277 13,000
W. Rodney McMullen 5,349,973 2,169,466
Gary Millerchip 349,313 156,707
Clyde R. Moore 116,677 —
Ronald L. Sargent(3) 183,059 13,000
Amanda Sourry 2,258 —
Mark S. Sutton(3) 29,437 —
Ashok Vemuri 16,154 —
Directors and executive officers as a group (24 persons, includingthose named above) 10,149,926 4,470,734
(1) No director or officer owned as much as 1% of Kroger common shares. The directors and executive officers as
a group beneficially owned 1.35% of Kroger common shares.
(2) This amount includes 3,018 shares held by Mr. Aitken’s spouse. He disclaims beneficial ownership of these
shares.
(3) This amount includes incentive share awards that were deferred under the deferred compensation plan for
independent directors in the following amounts: Ms. Aufreiter, 9,647; Ms. Gates, 7,831; Mr. Sargent, 45,148;
Mr. Sutton, 6,640.
(4) This amount includes 2,075 shares held by Ms. Hoguet’s spouse. She disclaims beneficial ownership of these
shares.
20
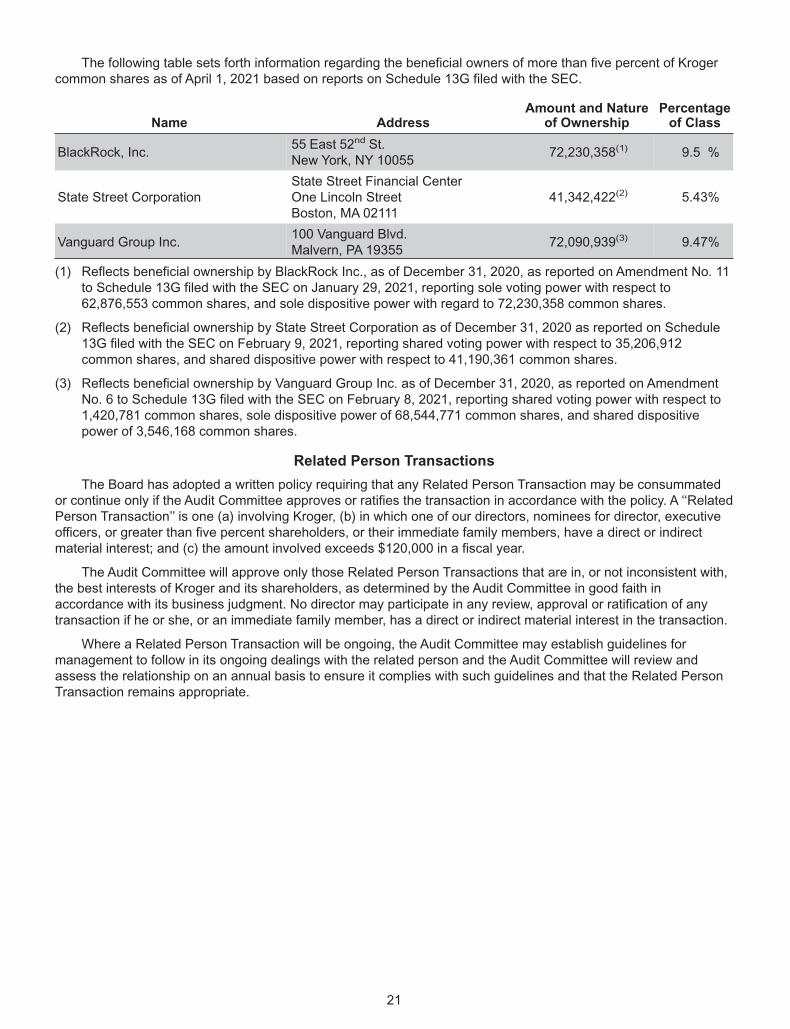
The following table sets forth information regarding the beneficial owners of more than five percent of Krogercommon shares as of April 1, 2021 based on reports on Schedule 13G filed with the SEC.
Name AddressAmount and Nature
of OwnershipPercentageof Class
BlackRock, Inc.55 East 52nd St.New York, NY 10055
72,230,358(1) 9.5 %
State Street CorporationState Street Financial CenterOne Lincoln StreetBoston, MA 02111
41,342,422(2) 5.43%
Vanguard Group Inc.100 Vanguard Blvd.Malvern, PA 19355
72,090,939(3) 9.47%
(1) Reflects beneficial ownership by BlackRock Inc., as of December 31, 2020, as reported on Amendment No. 11to Schedule 13G filed with the SEC on January 29, 2021, reporting sole voting power with respect to62,876,553 common shares, and sole dispositive power with regard to 72,230,358 common shares.
(2) Reflects beneficial ownership by State Street Corporation as of December 31, 2020 as reported on Schedule13G filed with the SEC on February 9, 2021, reporting shared voting power with respect to 35,206,912common shares, and shared dispositive power with respect to 41,190,361 common shares.
(3) Reflects beneficial ownership by Vanguard Group Inc. as of December 31, 2020, as reported on AmendmentNo. 6 to Schedule 13G filed with the SEC on February 8, 2021, reporting shared voting power with respect to1,420,781 common shares, sole dispositive power of 68,544,771 common shares, and shared dispositivepower of 3,546,168 common shares.
Related Person Transactions
The Board has adopted a written policy requiring that any Related Person Transaction may be consummatedor continue only if the Audit Committee approves or ratifies the transaction in accordance with the policy. A ‘‘RelatedPerson Transaction’’ is one (a) involving Kroger, (b) in which one of our directors, nominees for director, executiveofficers, or greater than five percent shareholders, or their immediate family members, have a direct or indirectmaterial interest; and (c) the amount involved exceeds $120,000 in a fiscal year.
The Audit Committee will approve only those Related Person Transactions that are in, or not inconsistent with,the best interests of Kroger and its shareholders, as determined by the Audit Committee in good faith inaccordance with its business judgment. No director may participate in any review, approval or ratification of anytransaction if he or she, or an immediate family member, has a direct or indirect material interest in the transaction.
Where a Related Person Transaction will be ongoing, the Audit Committee may establish guidelines formanagement to follow in its ongoing dealings with the related person and the Audit Committee will review andassess the relationship on an annual basis to ensure it complies with such guidelines and that the Related PersonTransaction remains appropriate.
21
Compensation Discussion and Analysis
Executive Summary
Named Executive Officers
This Compensation Discussion and Analysis provides a discussion and analysis of our compensation program
for our named executive officers (‘‘NEOs’’). For the 2020 fiscal year ended January 30, 2021, the NEOs were:
Name Title
W. Rodney McMullen Chairman and Chief Executive Officer
Gary Millerchip Senior Vice President and Chief Financial Officer
Stuart W. Aitken Senior Vice President and Chief Merchandising & Marketing Officer
Yael Cosset Senior Vice President and Chief Information Officer
Michael J. Donnelly Executive Vice President and Chief Operating Officer
How Our 2020 Compensation Program was Affected by COVID-19
Throughout the pandemic, Kroger's most urgent priority has been to provide a safeguarded environment for
associates and customers, with open stores, stocked shelves, comprehensive digital solutions and an efficiently-
operating supply chain, so that our communities continue to have access to fresh, affordable food and essentials.
We started to see a significant shift in customer behavior during the last few days of February 2020 as shoppersstarted stockpiling food and essentials. Sales sharply accelerated in March with identical sales, excluding fuel(‘‘ID Sales’’) up approximately 30% compared to March 2019. To put this in context, the Company reported full year2019 ID Sales of 2%. Sales remained elevated in April and May, both up approximately 20% compared to the samemonths of 2019. ID Sales for Q1 2020, which ended in late May, were an unprecedented 19% compared toQ1 2019. It was a truly monumental effort across the enterprise to meet the needs of customers in the early monthsof the pandemic.
Because of these extreme circumstances, our Compensation Committee recognized that communicatingmetrics for our annual incentive plan needed to be delayed past March as would be our normal practice. In March,the Company did not know how long the pandemic would last or what the impact on customer behavior would be.The Compensation Committee addressed the unique situation by implementing a two-part plan for 2020: aQ1 Bonus and a Q2 – Q4 2020 Corporate Incentive Plan, and for the executive officers, including the NEOs,modified the normal cash payout to include cash and restricted stock. The plan has a wide eligibility across theenterprise, comprising all or part of annual cash incentive compensation for 53,300 associates, including the NEOs.
• Q1 Bonus. In response to the extraordinary associate effort in supporting the business results thatoccurred in the intense initial months of the coronavirus pandemic, the Compensation Committeedetermined to establish a Q1 Bonus attributable to the first fiscal quarter. The Compensation Committeemade the decision to ring fence, or separately delineate Q1 to ensure the significant overperformance inQ1 due to customer stockpiling did not carry forward and inappropriately influence incentive plan resultsfor the remainder of the year. The Compensation Committee determined the Q1 Bonus to be earned at anamount equal to 200% of the Q1 prorated amount of the eligible associates’ (including NEOs’) annualincentive plan target. This Q1 Bonus was paid out to NEOs in March 2021 in accordance with the normalpayout schedule.
• Q2 – Q4 2020 Corporate Incentive Plan. For the balance of the year, the Compensation Committeeestablished the Q2 – Q4 2020 Corporate Incentive Plan, which measured ID Sales, excluding Fuel, andAdjusted FIFO Operating Profit, including Fuel, for the second through fourth quarters of 2020. The goalsput in place for these two metrics targeted a 100% payout amount based on the Company’s original pre-pandemic Q2 – Q4 quarterly budgets. Based on their understanding of the pandemic’s potential impact onthe business, the Compensation Committee decided to make the goals more rigorous, increasing theQ2 – Q4 ID Sales performance goals that were required for a payout greater than 100%. The results ofthe Q2 – Q4 2020 Corporate Incentive Plan produced a 200% payout, which was applied to the Q2 – Q4prorated amount of the eligible associates’ (including NEOs’) annual incentive plan target. This was paid toNEOs in March 2021 in accordance with the normal payout schedule.
• Cash/Equity Payout. The combined results of the Q1 Bonus and the Q2 – Q4 2020 Corporate IncentivePlan led to a payout at 200% of the eligible participants’, including NEOs’, annual incentive plan target forthe year. The annual incentive plan is typically an all cash plan, however in light of the extraordinary
22
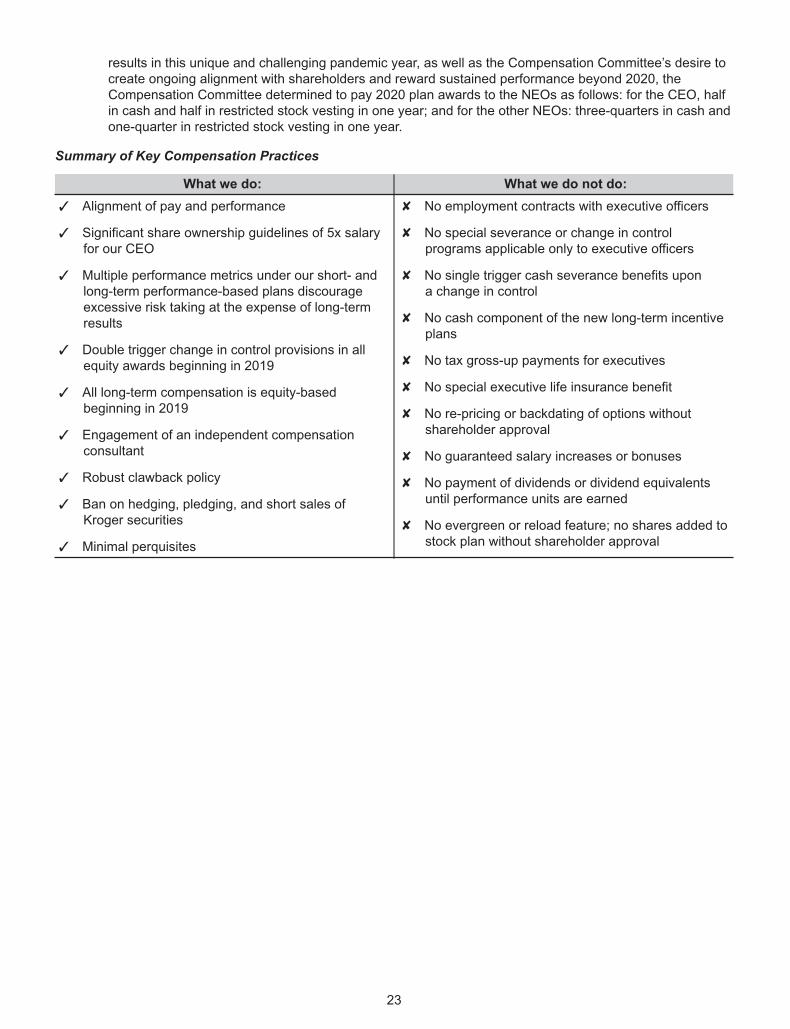
results in this unique and challenging pandemic year, as well as the Compensation Committee’s desire tocreate ongoing alignment with shareholders and reward sustained performance beyond 2020, theCompensation Committee determined to pay 2020 plan awards to the NEOs as follows: for the CEO, halfin cash and half in restricted stock vesting in one year; and for the other NEOs: three-quarters in cash andone-quarter in restricted stock vesting in one year.
Summary of Key Compensation Practices
What we do: What we do not do:
✓ Alignment of pay and performance
✓ Significant share ownership guidelines of 5x salaryfor our CEO
✓ Multiple performance metrics under our short- andlong-term performance-based plans discourageexcessive risk taking at the expense of long-termresults
✓ Double trigger change in control provisions in allequity awards beginning in 2019
✓ All long-term compensation is equity-basedbeginning in 2019
✓ Engagement of an independent compensationconsultant
✓ Robust clawback policy
✓ Ban on hedging, pledging, and short sales ofKroger securities
✓ Minimal perquisites
✘ No employment contracts with executive officers
✘ No special severance or change in controlprograms applicable only to executive officers
✘ No single trigger cash severance benefits upona change in control
✘ No cash component of the new long-term incentiveplans
✘ No tax gross-up payments for executives
✘ No special executive life insurance benefit
✘ No re-pricing or backdating of options withoutshareholder approval
✘ No guaranteed salary increases or bonuses
✘ No payment of dividends or dividend equivalentsuntil performance units are earned
✘ No evergreen or reload feature; no shares added tostock plan without shareholder approval
23
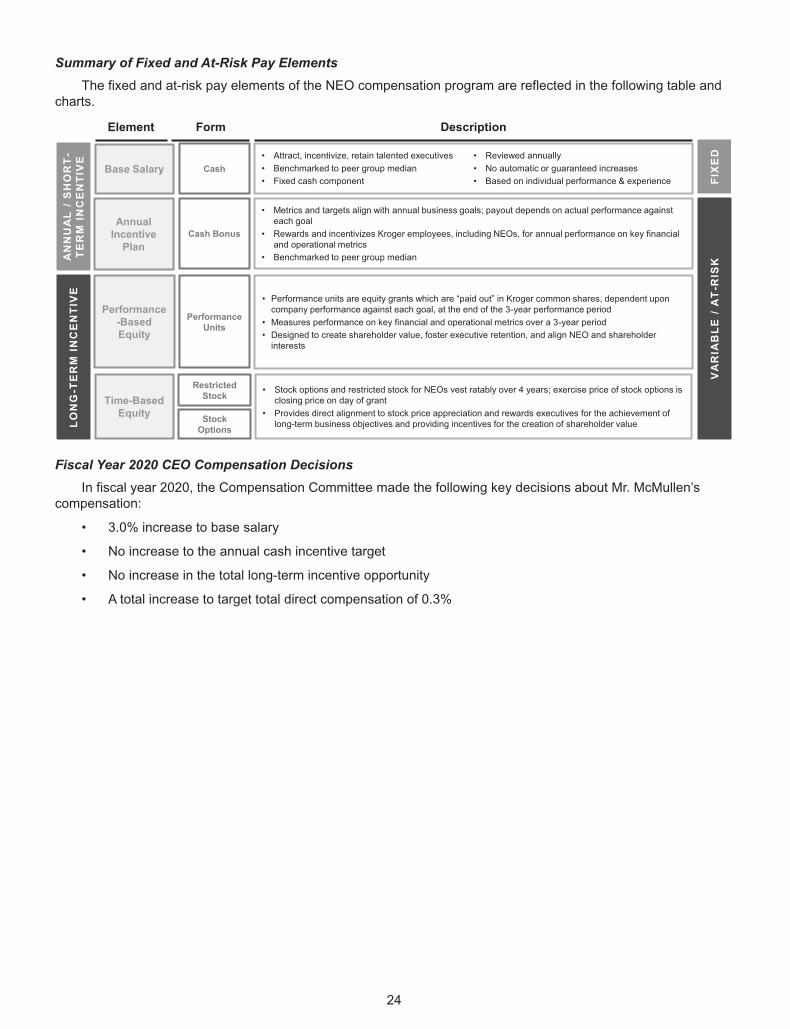
Summary of Fixed and At-Risk Pay Elements
The fixed and at-risk pay elements of the NEO compensation program are reflected in the following table andcharts.
Annual
Incentive
Plan
Cash Bonus
• Metrics and targets align with annual business goals; payout depends on actual performance against
each goal
• Rewards and incentivizes Kroger employees, including NEOs, for annual performance on key financial
and operational metrics
• Benchmarked to peer group median
Base Salary Cash
• Attract, incentivize, retain talented executives
• Benchmarked to peer group median
• Fixed cash component
• Reviewed annually
• No automatic or guaranteed increases
• Based on individual performance & experience
Element Form Description
Performance
-Based
Equity
Performance
Units
• Performance units are equity grants which are “paid out” in Kroger common shares, dependent upon
company performance against each goal, at the end of the 3-year performance period
• Measures performance on key financial and operational metrics over a 3-year period
• Designed to create shareholder value, foster executive retention, and align NEO and shareholder
interests
Time-Based
Equity
Restricted
Stock• Stock options and restricted stock for NEOs vest ratably over 4 years; exercise price of stock options is
closing price on day of grant
• Provides direct alignment to stock price appreciation and rewards executives for the achievement of
long-term business objectives and providing incentives for the creation of shareholder valueStock
Options
LO
NG
-TE
RM
IN
CE
NT
IVE
AN
NU
AL
/ S
HO
RT
-
TE
RM
IN
CE
NT
IVE
VA
RIA
BL
E /
AT
-RIS
KF
IXE
D
Fiscal Year 2020 CEO Compensation Decisions
In fiscal year 2020, the Compensation Committee made the following key decisions about Mr. McMullen’scompensation:
• 3.0% increase to base salary
• No increase to the annual cash incentive target
• No increase in the total long-term incentive opportunity
• A total increase to target total direct compensation of 0.3%
24
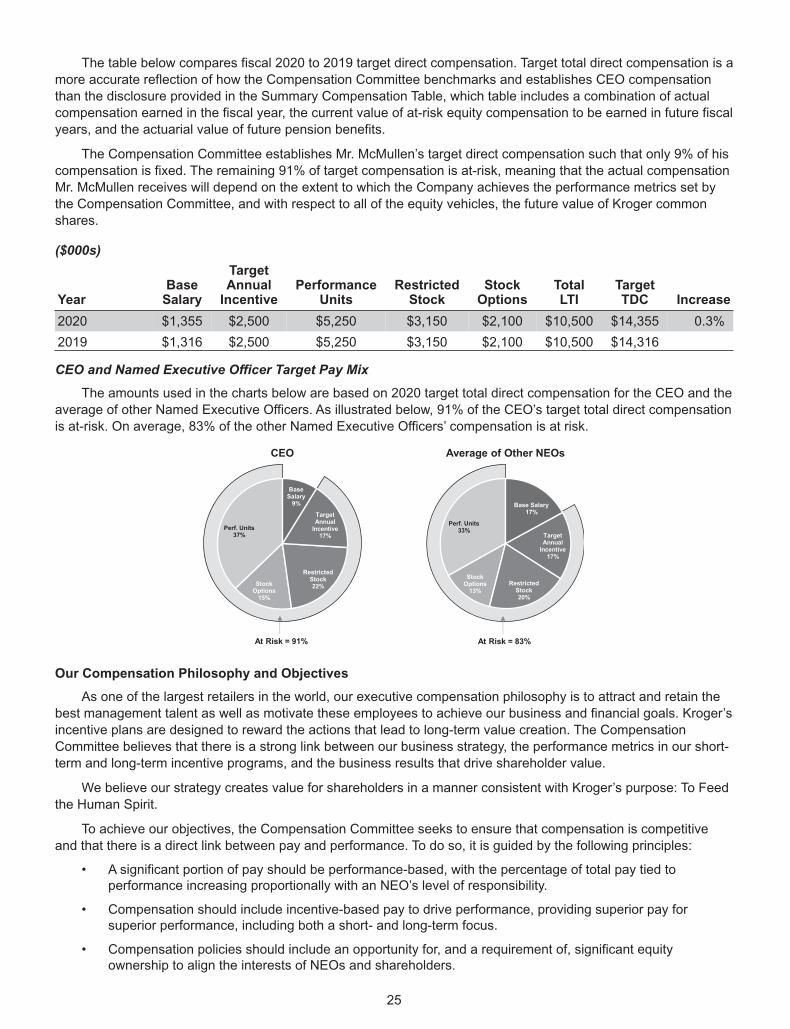
The table below compares fiscal 2020 to 2019 target direct compensation. Target total direct compensation is a
more accurate reflection of how the Compensation Committee benchmarks and establishes CEO compensation
than the disclosure provided in the Summary Compensation Table, which table includes a combination of actual
compensation earned in the fiscal year, the current value of at-risk equity compensation to be earned in future fiscal
years, and the actuarial value of future pension benefits.
The Compensation Committee establishes Mr. McMullen’s target direct compensation such that only 9% of his
compensation is fixed. The remaining 91% of target compensation is at-risk, meaning that the actual compensation
Mr. McMullen receives will depend on the extent to which the Company achieves the performance metrics set by
the Compensation Committee, and with respect to all of the equity vehicles, the future value of Kroger common
shares.
($000s)
YearBaseSalary
TargetAnnualIncentive
PerformanceUnits
RestrictedStock
StockOptions
TotalLTI
TargetTDC Increase
2020 $1,355 $2,500 $5,250 $3,150 $2,100 $10,500 $14,355 0.3%
2019 $1,316 $2,500 $5,250 $3,150 $2,100 $10,500 $14,316
CEO and Named Executive Officer Target Pay Mix
The amounts used in the charts below are based on 2020 target total direct compensation for the CEO and the
average of other Named Executive Officers. As illustrated below, 91% of the CEO’s target total direct compensation
is at-risk. On average, 83% of the other Named Executive Officers’ compensation is at risk.
At Risk = 91%
Base Salary
9%
Target Annual
Incentive17%
Restricted Stock22%Stock
Options15%
Perf. Units37%
CEO
Base Salary17%
Target Annual
Incentive17%
Restricted Stock20%
Stock Options
13%
Perf. Units33%
Average of Other NEOs
At Risk = 83%
Our Compensation Philosophy and Objectives
As one of the largest retailers in the world, our executive compensation philosophy is to attract and retain the
best management talent as well as motivate these employees to achieve our business and financial goals. Kroger’s
incentive plans are designed to reward the actions that lead to long-term value creation. The Compensation
Committee believes that there is a strong link between our business strategy, the performance metrics in our short-
term and long-term incentive programs, and the business results that drive shareholder value.
We believe our strategy creates value for shareholders in a manner consistent with Kroger’s purpose: To Feed
the Human Spirit.
To achieve our objectives, the Compensation Committee seeks to ensure that compensation is competitive
and that there is a direct link between pay and performance. To do so, it is guided by the following principles:
• A significant portion of pay should be performance-based, with the percentage of total pay tied toperformance increasing proportionally with an NEO’s level of responsibility.
• Compensation should include incentive-based pay to drive performance, providing superior pay forsuperior performance, including both a short- and long-term focus.
• Compensation policies should include an opportunity for, and a requirement of, significant equityownership to align the interests of NEOs and shareholders.
25
• Components of compensation should be tied to an evaluation of business and individual performancemeasured against metrics that directly drive our business strategy.
• Compensation plans should provide a direct line of sight to company performance.
• Compensation programs should be aligned with market practices.
• Compensation programs should serve to both motivate and retain talent.
The Compensation Committee has three related objectives regarding compensation:
• First, the Compensation Committee believes that compensation must be designed to attract and retainthose individuals who are best suited to be an executive officer at Kroger.
• Second, a majority of compensation should help align the interests of our NEOs with the interests of ourshareholders.
• Third, compensation should create strong incentives for the NEOs to achieve the annual business plantargets established by the Board, and to achieve Kroger’s long-term strategic objectives.
Components of Executive Compensation at Kroger
For 2020, compensation for our NEOs was comprised of the following:
• Annual Compensation:
○ Salary
○ Q1 Bonus
○ Q2 – Q4 2020 Corporate Incentive Plan
• Long-Term Compensation:
○ Performance units
○ Non-qualified stock options
○ Restricted stock
• Retirement and other benefits
• Minimal perquisites
The annual and long-term performance-based compensation awards described herein were made pursuant to
our 2019 Long-Term Incentive and Cash Bonus Plan, which was approved by our shareholders in June 2019.
Establishing Each Component of Executive Compensation
The Compensation Committee recommends, and the Board determines, each component of the CEO’s
compensation. The CEO recommends, and the Compensation Committee determines, each component of the
remaining NEOs’ compensation. The Compensation Committee and the Board reviewed compensation in March of
2020. Equity awards were granted in March and salary and annual incentive plan increases were effective as ofApril 1, 2020.
The amount of each NEO’s salary, annual cash incentive plan target, and long-term equity compensation isinfluenced by numerous factors including:
• An assessment of individual contribution and performance;
• Benchmarking with comparable positions at peer group companies;
• Level in organization and tenure in role; and
• Relationship to other Kroger executives’ compensation.
The assessment of individual contribution and performance is a qualitative determination, based on thefollowing factors:
• Leadership;
• Contribution to the executive officer group;
26
• Achievement of established objectives;
• Decision-making abilities;
• Performance of the areas or groups directly reporting to the NEO;
• Increased responsibilities;
• Strategic thinking; and
• Promotion of Kroger’s Values: Safety, Honesty, Integrity, Respect, Diversity, and Inclusion.
Annual Compensation – Salary
Our philosophy with respect to salary is to provide a sufficient and stable source of fixed cash compensation.
All of our compensation cannot be at-risk or long-term. It is important to provide a meaningful annual salary to
attract and retain a high caliber leadership team, and to have an appropriate level of cash compensation that is not
variable.
Annual Compensation – Performance-Based Annual Cash Incentive
The NEOs participate in a corporate performance-based annual cash incentive plan. The value of annual cash
incentive awards that the NEOs earn each year is based upon Kroger’s overall company performance compared to
goals established by the Compensation Committee based on the business plan adopted by the Board of Directors.
A minimum level of performance must be achieved before any payouts are earned, while a payout of up to
210% of target incentive potential can be achieved for superior performance on the corporate plan metrics. There
are no guaranteed or minimum payouts; if none of the performance goals are achieved, then none of the incentive
amount is earned and no payout is made.
The annual cash incentive plan is designed to encourage decisions and behavior that drive the annual
operating results and the long-term success of the Company. Kroger’s success is based on a combination of
factors, and accordingly the Compensation Committee believes that it is important to encourage behavior that
supports multiple elements of our business strategy.
2020 Annual Cash Incentive Plan
The corporate annual cash incentive plan is a broad-based plan used across the Kroger enterprise.
Approximately 53,300 associates are eligible to receive incentive payouts based all or in part on the incentive plan
described below.
Because of the unique circumstances created by the pandemic, the Compensation Committee modified the
annual incentive plan in two ways.
First, the 2020 incentive plan was comprised of two parts:
(1) A Q1 Bonus, which was earned at an amount equal to 200% of the Q1 proration of a participant’s annual
incentive target; the actual amounts of Q1 Bonus paid to the NEOs for 2020 are reported in the Summary
Compensation Table in the ‘‘Bonus’’ column; and
(2) The Q2 – Q4 2020 Corporate Incentive Plan, which also paid out at 200% and was applied to the Q2 – Q4
proration of a participant’s annual incentive target. The Q2 – Q4 2020 Corporate Incentive Plan was based
on a grid with two metrics: ID Sales, excluding Fuel, and Adjusted FIFO Operating Profit, including Fuel,
with the opportunity for a 10% ‘‘kicker’’ based on improvement in produce share as described below.
These are the same metrics used for the 2019 annual incentive plan.
Second, the annual incentive plan is typically an all cash plan, however in light of the extraordinary results in
this unique and challenging pandemic year, as well as the Compensation Committee’s desire to create ongoing
alignment with shareholders and reward sustained performance beyond 2020, the Committee determined to pay
2020 plan awards to the NEOs as follows: for the CEO, half in cash and half in restricted stock vesting in one year;
and for the other NEOs: three-quarters in cash and one-quarter in restricted stock vesting in one year.
27
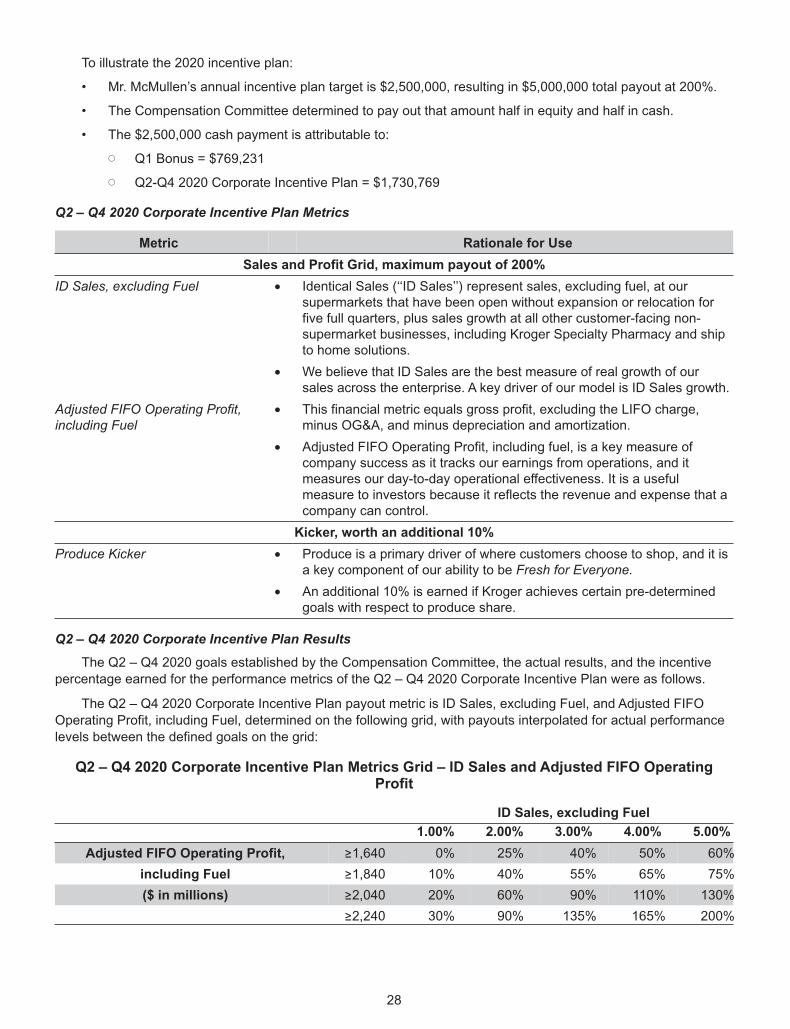
To illustrate the 2020 incentive plan:
• Mr. McMullen’s annual incentive plan target is $2,500,000, resulting in $5,000,000 total payout at 200%.
• The Compensation Committee determined to pay out that amount half in equity and half in cash.
• The $2,500,000 cash payment is attributable to:
○ Q1 Bonus = $769,231
○ Q2-Q4 2020 Corporate Incentive Plan = $1,730,769
Q2 – Q4 2020 Corporate Incentive Plan Metrics
Metric Rationale for Use
Sales and Profit Grid, maximum payout of 200%
ID Sales, excluding Fuel • Identical Sales (‘‘ID Sales’’) represent sales, excluding fuel, at oursupermarkets that have been open without expansion or relocation forfive full quarters, plus sales growth at all other customer-facing non-supermarket businesses, including Kroger Specialty Pharmacy and shipto home solutions.
• We believe that ID Sales are the best measure of real growth of oursales across the enterprise. A key driver of our model is ID Sales growth.
Adjusted FIFO Operating Profit,
including Fuel
• This financial metric equals gross profit, excluding the LIFO charge,minus OG&A, and minus depreciation and amortization.
• Adjusted FIFO Operating Profit, including fuel, is a key measure ofcompany success as it tracks our earnings from operations, and itmeasures our day-to-day operational effectiveness. It is a usefulmeasure to investors because it reflects the revenue and expense that acompany can control.
Kicker, worth an additional 10%
Produce Kicker • Produce is a primary driver of where customers choose to shop, and it isa key component of our ability to be Fresh for Everyone.
• An additional 10% is earned if Kroger achieves certain pre-determinedgoals with respect to produce share.
Q2 – Q4 2020 Corporate Incentive Plan Results
The Q2 – Q4 2020 goals established by the Compensation Committee, the actual results, and the incentive
percentage earned for the performance metrics of the Q2 – Q4 2020 Corporate Incentive Plan were as follows.
The Q2 – Q4 2020 Corporate Incentive Plan payout metric is ID Sales, excluding Fuel, and Adjusted FIFO
Operating Profit, including Fuel, determined on the following grid, with payouts interpolated for actual performance
levels between the defined goals on the grid:
Q2 – Q4 2020 Corporate Incentive Plan Metrics Grid – ID Sales and Adjusted FIFO OperatingProfit
ID Sales, excluding Fuel
1.00% 2.00% 3.00% 4.00% 5.00%
Adjusted FIFO Operating Profit, ≥1,640 0% 25% 40% 50% 60%
including Fuel ≥1,840 10% 40% 55% 65% 75%
($ in millions) ≥2,040 20% 60% 90% 110% 130%
≥2,240 30% 90% 135% 165% 200%
28
Q2 – Q4 2020 Corporate Incentive Plan – Actual Results and Payout Percentages
Performance Metrics ResultPayout
Percentage1
ID Sales/Adjusted FIFO Operating Profit ID Sales = 12.0%/Adjusted FIFO OP = $2,620 million 200%
Produce Kicker2 * 0%
Total Earned 200%
(1) See grid above.
(2) An additional 10% would have been earned if Kroger had achieved a certain goal with respect to produce share. That goal wasestablished by the Compensation Committee but is not disclosed because it is competitively sensitive.
Following the close of the 2020 fiscal year, the Compensation Committee reviewed Kroger’s performance
against each of the metrics outlined above and determined the extent to which Kroger achieved those objectives.
Our performance compared to the goals established by the Compensation Committee resulted in a payout on the
Q2 – Q4 2020 Corporate Incentive Plan of 200% of the participant’s incentive plan target for all of the participants,
including the NEOs.
The Compensation Committee maintains the ability to reduce the annual cash incentive payout for all
executive officers, including the NEOs, and the independent directors retain that discretion for the CEO’s incentive
payout if they determine for any reason that the incentive payouts were not appropriate given their assessment of
Company performance. However, no adjustments were made in 2020. The Compensation Committee and the
independent directors also retained the ability to adjust the goals for each metric under the plan should
unanticipated developments arise during the year – however no adjustments were made to the Q2 – Q4 2020
goals.
As described above, the corporate annual cash incentive payout percentage is applied to each NEO’s
incentive plan target which is determined by the Compensation Committee, and the independent directors in the
case of the CEO. The actual amounts of performance-based annual incentive paid to the NEOs for 2020 are
reported in the Summary Compensation Table in the ‘‘Stock Awards’’ and ‘‘Non-Equity Incentive Plan
Compensation’’ columns and footnotes 2 and 4 to that table.
Long-Term Compensation Program
The Compensation Committee believes in the importance of providing an incentive to the NEOs to achieve the
long-term goals established by the Board. As such, a majority of NEO compensation is dependent on the
achievement of the Company’s long-term goals. Long-term compensation promotes long-term value creation and
discourages the over-emphasis of attaining short-term goals at the expense of long-term growth.
The long-term incentive program is structured to be a combination of performance- and time-based
compensation that reflects elements of financial and common share performance to provide both retention value
and alignment with company performance. As of 2019, in response to feedback from shareholders and market
practices, our Compensation Committee determined that all long-term compensation would be equity-based as
follows; 50% of equity granted under the program would be performance-based and the remaining 50% of equity
would be time-based consisting of 30% in the form of restricted stock and 20% in the form of stock options.
Each year, NEOs receive grants under the long-term compensation program, which is structured as follows:
• Performance-Based (50% of NEO long-term target compensation)
○ Long-term performance-based compensation is provided under a Long-Term Incentive Plan adoptedby the Compensation Committee. The Committee adopts a new plan every year, measuringimprovement on the Company’s long-term goals over successive three-year periods. Accordingly, atany one time there are three plans outstanding, which are summarized below.
○ Under the Long-Term Incentive Plans, NEOs receive grants of equity called performance units, anduntil 2019 received cash ‘‘grants’’ as well. A fixed number of performance units based on level andindividual performance is awarded to each participant at the beginning of the three-year performanceperiod and prior to 2019 a cash incentive target was set as well.
29
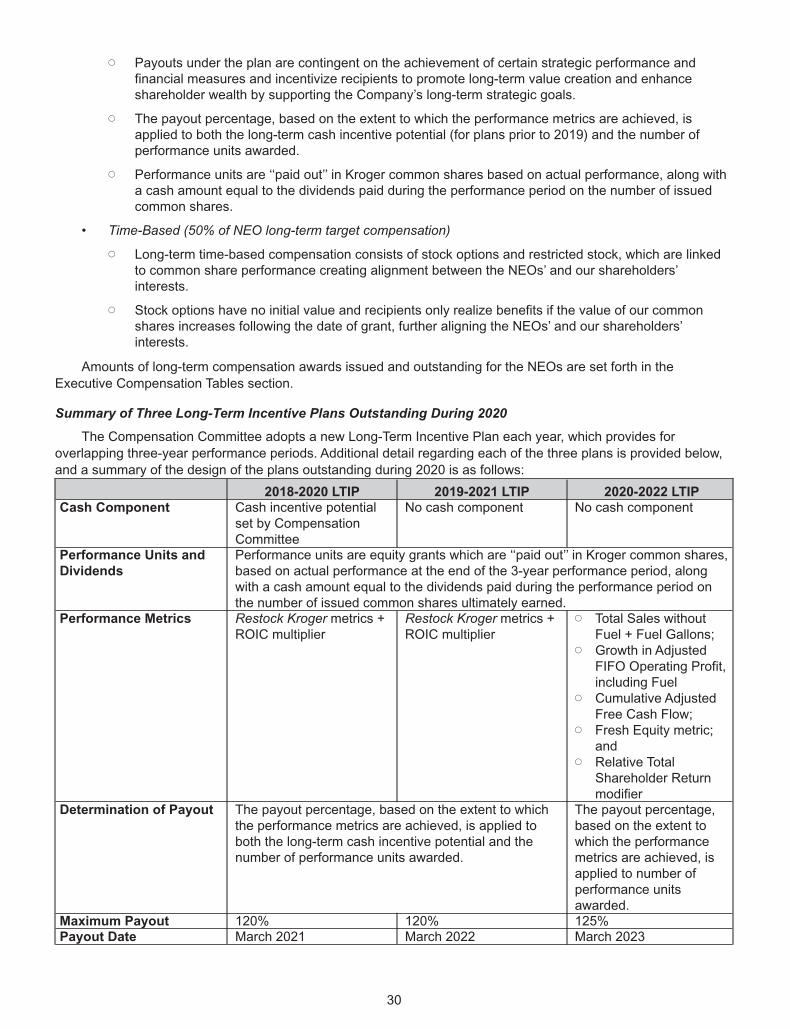
○ Payouts under the plan are contingent on the achievement of certain strategic performance andfinancial measures and incentivize recipients to promote long-term value creation and enhanceshareholder wealth by supporting the Company’s long-term strategic goals.
○ The payout percentage, based on the extent to which the performance metrics are achieved, isapplied to both the long-term cash incentive potential (for plans prior to 2019) and the number ofperformance units awarded.
○ Performance units are ‘‘paid out’’ in Kroger common shares based on actual performance, along witha cash amount equal to the dividends paid during the performance period on the number of issuedcommon shares.
• Time-Based (50% of NEO long-term target compensation)
○ Long-term time-based compensation consists of stock options and restricted stock, which are linkedto common share performance creating alignment between the NEOs’ and our shareholders’interests.
○ Stock options have no initial value and recipients only realize benefits if the value of our commonshares increases following the date of grant, further aligning the NEOs’ and our shareholders’interests.
Amounts of long-term compensation awards issued and outstanding for the NEOs are set forth in the
Executive Compensation Tables section.
Summary of Three Long-Term Incentive Plans Outstanding During 2020
The Compensation Committee adopts a new Long-Term Incentive Plan each year, which provides for
overlapping three-year performance periods. Additional detail regarding each of the three plans is provided below,
and a summary of the design of the plans outstanding during 2020 is as follows:
2018-2020 LTIP 2019-2021 LTIP 2020-2022 LTIPCash Component Cash incentive potential
set by CompensationCommittee
No cash component No cash component
Performance Units andDividends
Performance units are equity grants which are ‘‘paid out’’ in Kroger common shares,based on actual performance at the end of the 3-year performance period, alongwith a cash amount equal to the dividends paid during the performance period onthe number of issued common shares ultimately earned.
Performance Metrics Restock Kroger metrics +ROIC multiplier
Restock Kroger metrics +ROIC multiplier
○ Total Sales withoutFuel + Fuel Gallons;
○ Growth in AdjustedFIFO Operating Profit,including Fuel
○ Cumulative AdjustedFree Cash Flow;
○ Fresh Equity metric;and
○ Relative TotalShareholder Returnmodifier
Determination of Payout The payout percentage, based on the extent to whichthe performance metrics are achieved, is applied toboth the long-term cash incentive potential and thenumber of performance units awarded.
The payout percentage,based on the extent towhich the performancemetrics are achieved, isapplied to number ofperformance unitsawarded.
Maximum Payout 120% 120% 125%Payout Date March 2021 March 2022 March 2023
30
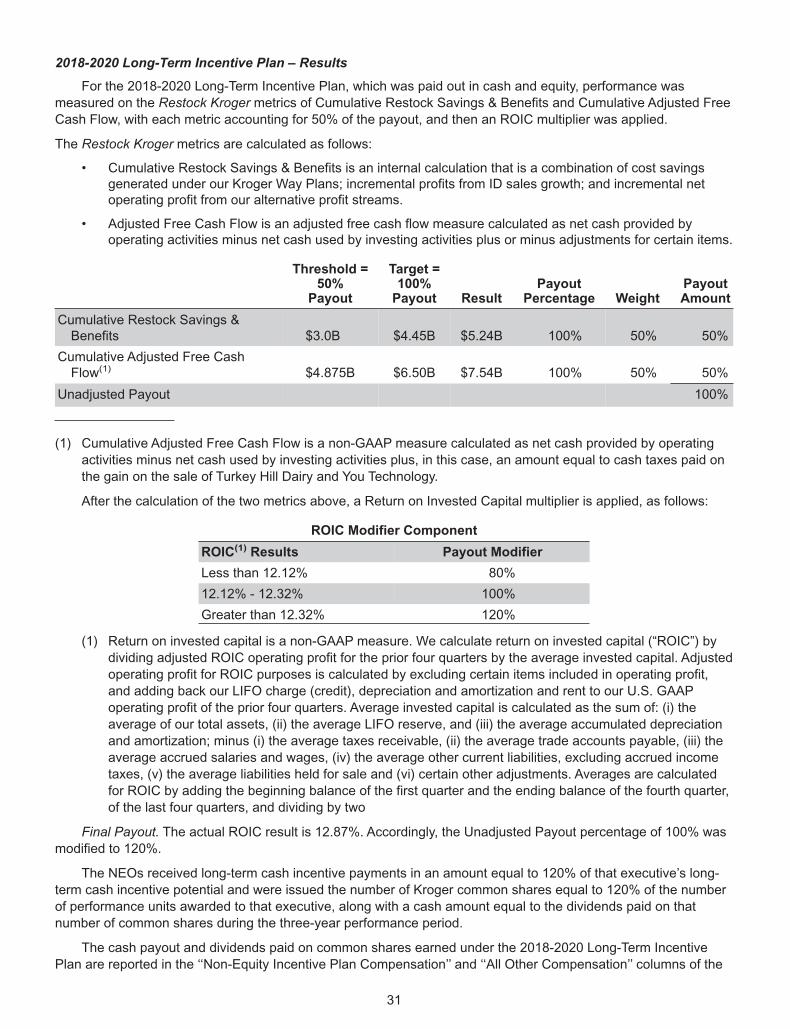
2018-2020 Long-Term Incentive Plan – Results
For the 2018-2020 Long-Term Incentive Plan, which was paid out in cash and equity, performance was
measured on the Restock Kroger metrics of Cumulative Restock Savings & Benefits and Cumulative Adjusted Free
Cash Flow, with each metric accounting for 50% of the payout, and then an ROIC multiplier was applied.
The Restock Kroger metrics are calculated as follows:
• Cumulative Restock Savings & Benefits is an internal calculation that is a combination of cost savingsgenerated under our Kroger Way Plans; incremental profits from ID sales growth; and incremental netoperating profit from our alternative profit streams.
• Adjusted Free Cash Flow is an adjusted free cash flow measure calculated as net cash provided byoperating activities minus net cash used by investing activities plus or minus adjustments for certain items.
Threshold =50%
Payout
Target =100%Payout Result
PayoutPercentage Weight
PayoutAmount
Cumulative Restock Savings &Benefits $3.0B $4.45B $5.24B 100% 50% 50%
Cumulative Adjusted Free CashFlow(1) $4.875B $6.50B $7.54B 100% 50% 50%
Unadjusted Payout 100%
(1) Cumulative Adjusted Free Cash Flow is a non-GAAP measure calculated as net cash provided by operating
activities minus net cash used by investing activities plus, in this case, an amount equal to cash taxes paid on
the gain on the sale of Turkey Hill Dairy and You Technology.
After the calculation of the two metrics above, a Return on Invested Capital multiplier is applied, as follows:
ROIC Modifier Component
ROIC(1) Results Payout Modifier
Less than 12.12% 80%
12.12% - 12.32% 100%
Greater than 12.32% 120%
(1) Return on invested capital is a non-GAAP measure. We calculate return on invested capital (“ROIC”) by
dividing adjusted ROIC operating profit for the prior four quarters by the average invested capital. Adjusted
operating profit for ROIC purposes is calculated by excluding certain items included in operating profit,
and adding back our LIFO charge (credit), depreciation and amortization and rent to our U.S. GAAP
operating profit of the prior four quarters. Average invested capital is calculated as the sum of: (i) the
average of our total assets, (ii) the average LIFO reserve, and (iii) the average accumulated depreciation
and amortization; minus (i) the average taxes receivable, (ii) the average trade accounts payable, (iii) the
average accrued salaries and wages, (iv) the average other current liabilities, excluding accrued income
taxes, (v) the average liabilities held for sale and (vi) certain other adjustments. Averages are calculated
for ROIC by adding the beginning balance of the first quarter and the ending balance of the fourth quarter,
of the last four quarters, and dividing by two
Final Payout. The actual ROIC result is 12.87%. Accordingly, the Unadjusted Payout percentage of 100% was
modified to 120%.
The NEOs received long-term cash incentive payments in an amount equal to 120% of that executive’s long-
term cash incentive potential and were issued the number of Kroger common shares equal to 120% of the number
of performance units awarded to that executive, along with a cash amount equal to the dividends paid on that
number of common shares during the three-year performance period.
The cash payout and dividends paid on common shares earned under the 2018-2020 Long-Term Incentive
Plan are reported in the ‘‘Non-Equity Incentive Plan Compensation’’ and ‘‘All Other Compensation’’ columns of the
31
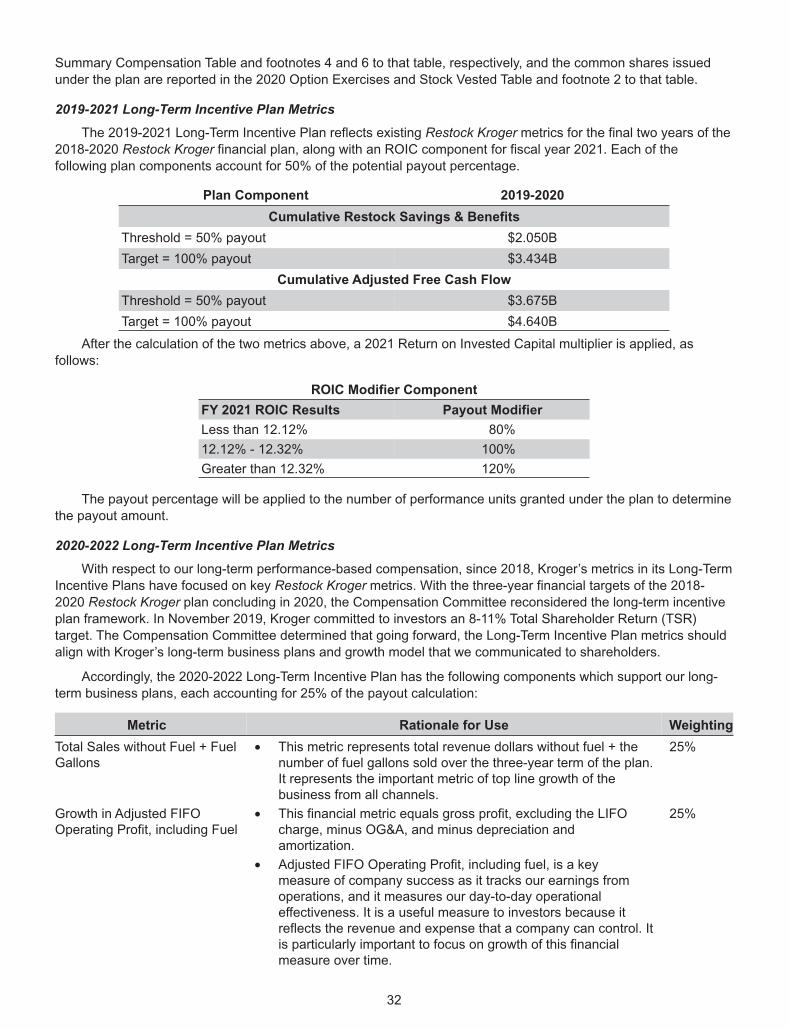
Summary Compensation Table and footnotes 4 and 6 to that table, respectively, and the common shares issued
under the plan are reported in the 2020 Option Exercises and Stock Vested Table and footnote 2 to that table.
2019-2021 Long-Term Incentive Plan Metrics
The 2019-2021 Long-Term Incentive Plan reflects existing Restock Kroger metrics for the final two years of the
2018-2020 Restock Kroger financial plan, along with an ROIC component for fiscal year 2021. Each of the
following plan components account for 50% of the potential payout percentage.
Plan Component 2019-2020
Cumulative Restock Savings & Benefits
Threshold = 50% payout $2.050B
Target = 100% payout $3.434B
Cumulative Adjusted Free Cash Flow
Threshold = 50% payout $3.675B
Target = 100% payout $4.640B
After the calculation of the two metrics above, a 2021 Return on Invested Capital multiplier is applied, as
follows:
ROIC Modifier Component
FY 2021 ROIC Results Payout Modifier
Less than 12.12% 80%
12.12% - 12.32% 100%
Greater than 12.32% 120%
The payout percentage will be applied to the number of performance units granted under the plan to determine
the payout amount.
2020-2022 Long-Term Incentive Plan Metrics
With respect to our long-term performance-based compensation, since 2018, Kroger’s metrics in its Long-Term
Incentive Plans have focused on key Restock Kroger metrics. With the three-year financial targets of the 2018-
2020 Restock Kroger plan concluding in 2020, the Compensation Committee reconsidered the long-term incentive
plan framework. In November 2019, Kroger committed to investors an 8-11% Total Shareholder Return (TSR)
target. The Compensation Committee determined that going forward, the Long-Term Incentive Plan metrics should
align with Kroger’s long-term business plans and growth model that we communicated to shareholders.
Accordingly, the 2020-2022 Long-Term Incentive Plan has the following components which support our long-
term business plans, each accounting for 25% of the payout calculation:
Metric Rationale for Use Weighting
Total Sales without Fuel + FuelGallons
• This metric represents total revenue dollars without fuel + thenumber of fuel gallons sold over the three-year term of the plan.It represents the important metric of top line growth of thebusiness from all channels.
25%
Growth in Adjusted FIFOOperating Profit, including Fuel
• This financial metric equals gross profit, excluding the LIFOcharge, minus OG&A, and minus depreciation andamortization.
25%
• Adjusted FIFO Operating Profit, including fuel, is a keymeasure of company success as it tracks our earnings fromoperations, and it measures our day-to-day operationaleffectiveness. It is a useful measure to investors because itreflects the revenue and expense that a company can control. Itis particularly important to focus on growth of this financialmeasure over time.
32
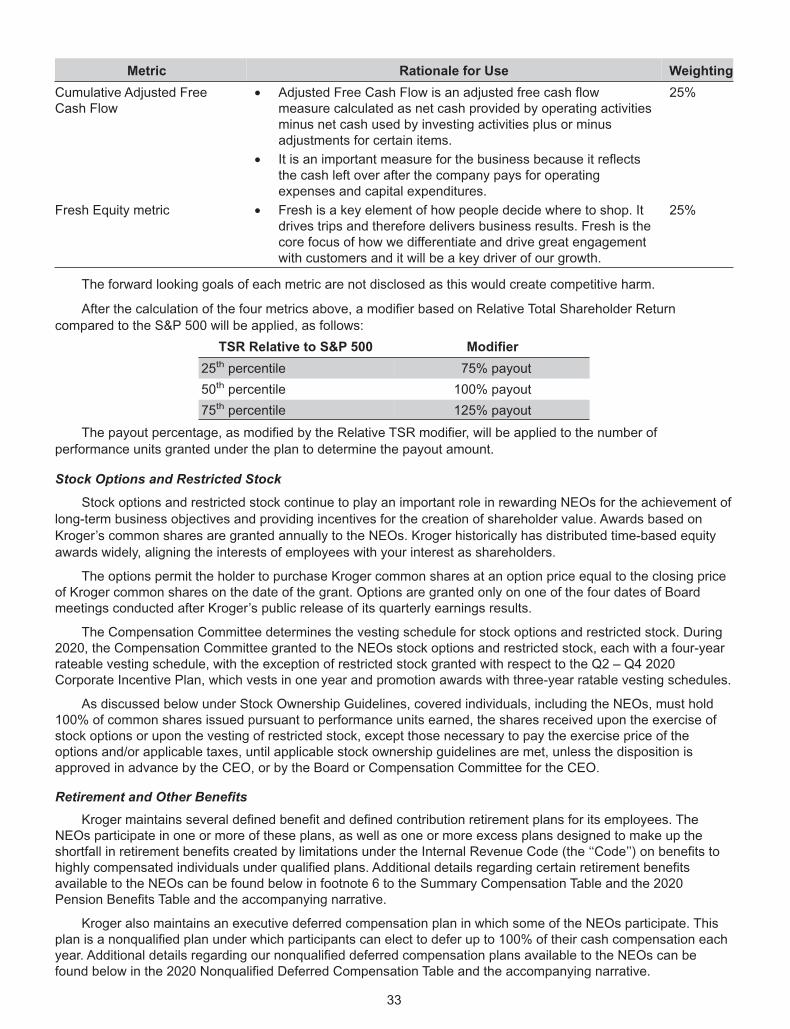
Metric Rationale for Use Weighting
Cumulative Adjusted FreeCash Flow
• Adjusted Free Cash Flow is an adjusted free cash flowmeasure calculated as net cash provided by operating activitiesminus net cash used by investing activities plus or minusadjustments for certain items.
25%
• It is an important measure for the business because it reflectsthe cash left over after the company pays for operatingexpenses and capital expenditures.
Fresh Equity metric • Fresh is a key element of how people decide where to shop. Itdrives trips and therefore delivers business results. Fresh is thecore focus of how we differentiate and drive great engagementwith customers and it will be a key driver of our growth.
25%
The forward looking goals of each metric are not disclosed as this would create competitive harm.
After the calculation of the four metrics above, a modifier based on Relative Total Shareholder Return
compared to the S&P 500 will be applied, as follows:
TSR Relative to S&P 500 Modifier
25th percentile 75% payout
50th percentile 100% payout
75th percentile 125% payout
The payout percentage, as modified by the Relative TSR modifier, will be applied to the number of
performance units granted under the plan to determine the payout amount.
Stock Options and Restricted Stock
Stock options and restricted stock continue to play an important role in rewarding NEOs for the achievement of
long-term business objectives and providing incentives for the creation of shareholder value. Awards based on
Kroger’s common shares are granted annually to the NEOs. Kroger historically has distributed time-based equity
awards widely, aligning the interests of employees with your interest as shareholders.
The options permit the holder to purchase Kroger common shares at an option price equal to the closing priceof Kroger common shares on the date of the grant. Options are granted only on one of the four dates of Boardmeetings conducted after Kroger’s public release of its quarterly earnings results.
The Compensation Committee determines the vesting schedule for stock options and restricted stock. During2020, the Compensation Committee granted to the NEOs stock options and restricted stock, each with a four-yearrateable vesting schedule, with the exception of restricted stock granted with respect to the Q2 – Q4 2020Corporate Incentive Plan, which vests in one year and promotion awards with three-year ratable vesting schedules.
As discussed below under Stock Ownership Guidelines, covered individuals, including the NEOs, must hold100% of common shares issued pursuant to performance units earned, the shares received upon the exercise ofstock options or upon the vesting of restricted stock, except those necessary to pay the exercise price of theoptions and/or applicable taxes, until applicable stock ownership guidelines are met, unless the disposition isapproved in advance by the CEO, or by the Board or Compensation Committee for the CEO.
Retirement and Other Benefits
Kroger maintains several defined benefit and defined contribution retirement plans for its employees. TheNEOs participate in one or more of these plans, as well as one or more excess plans designed to make up theshortfall in retirement benefits created by limitations under the Internal Revenue Code (the ‘‘Code’’) on benefits tohighly compensated individuals under qualified plans. Additional details regarding certain retirement benefitsavailable to the NEOs can be found below in footnote 6 to the Summary Compensation Table and the 2020Pension Benefits Table and the accompanying narrative.
Kroger also maintains an executive deferred compensation plan in which some of the NEOs participate. Thisplan is a nonqualified plan under which participants can elect to defer up to 100% of their cash compensation eachyear. Additional details regarding our nonqualified deferred compensation plans available to the NEOs can befound below in the 2020 Nonqualified Deferred Compensation Table and the accompanying narrative.
33
Kroger also maintains The Kroger Co. Employee Protection Plan (‘‘KEPP’’), which covers all of our
management employees who are classified as exempt under the federal Fair Labor Standards Act and certain
administrative or technical support personnel who are not covered by a collective bargaining agreement, with at
least one year of service. KEPP has a double trigger change in control provision and it provides for severance
benefits and extended Kroger-paid health care, as well as the continuation of other benefits as described in the
plan, when an employee is actually or constructively terminated without cause within two years following a change
in control of Kroger (as defined in KEPP). Participants are entitled to severance pay of up to 24 months’ salary and
annual incentive target. The actual amount is dependent upon pay level and years of service. KEPP can be
amended or terminated by the Board at any time prior to a change in control.
With respect to awards prior to 2019, performance-based long-term cash incentive, performance unit, stock
option, and restricted stock grant agreements with award recipients provide that those awards ‘‘vest,’’ with 50% of
the long-term cash incentive potential being paid, common shares equal to 50% of the performance units being
awarded, options becoming immediately exercisable, and restrictions on restricted stock lapsing upon a change in
control as described in the grant agreements. Grants made in 2019 have double trigger change in control
provisions and the ‘‘vesting’’ described above is only triggered if an employee is actually or constructively
terminated without cause within two years following a change in control of Kroger (as defined in the grant
agreement, and consistent with KEPP).
None of the NEOs are party to an employment agreement.
Perquisites
Our NEOs receive limited perquisites as the Compensation Committee does not believe that it is necessary for
the attraction or retention of management talent to provide executives a substantial amount of compensation in the
form of perquisites.
Process for Establishing Executive Compensation
The Compensation Committee of the Board has the primary responsibility for establishing the compensation of
our executive officers, including the NEOs, with the exception of the CEO. The Compensation Committee’s role
regarding the CEO’s compensation is to make recommendations to the independent members of the Board; those
members of the Board establish the CEO’s compensation.
The Compensation Committee directly engaged Korn Ferry as a compensation consultant to advise the
Compensation Committee in the design of compensation for executive officers and to advise with respect to theunique circumstances of the 2020 compensation cycle.
Korn Ferry conducted an annual competitive assessment of executive positions at Kroger for theCompensation Committee. The assessment is one of several bases, as described above, on which theCompensation Committee determines compensation. The consultant assessed:
• base salary;
• target performance-based annual cash incentive;
• target annual cash compensation (the sum of salary and annual cash incentive potential);
• long-term incentive compensation, comprised of performance units, stock options and restricted stock; and
• total direct compensation (the sum of target annual cash compensation and long-term compensation).
In addition to the factors identified above, the consultant also reviewed actual payout amounts against thetargeted amounts.
The consultant compared these elements against those of other companies in a group of publicly tradedcompanies selected by the Compensation Committee. For 2020, our peer group consisted of:
Best Buy Home Depot Target
Cardinal Health Johnson & Johnson TJX Companies
Costco Wholesale Lowes Wal-Mart
CVS Health Procter & Gamble Walgreens Boots Alliance
Express Scripts Sysco
34
The make-up of the compensation peer group is reviewed annually and modified as circumstances warrant. In
addition, the Compensation Committee considered data from ‘‘general industry’’ companies provided by its
independent compensation consultant, a representation of major publicly-traded companies of similar size and
scope from outside the retail industry. This data provided reference points, particularly for senior executive
positions where competition for talent extends beyond the retail sector. The peer group includes a combination of
food and drug retailers, other large retailers based on revenue size, and large consumer-facing companies. Median
2020 revenue for the peer group was $96 billion, compared to our 2020 revenue of $132 billion.
Considering the size of Kroger in relation to other peer group companies, the Compensation Committee
believes that salaries paid to our NEOs should be competitively positioned relative to amounts paid by peer group
companies for comparable positions. The Compensation Committee also aims to provide an annual cash incentive
potential to our NEOs that, if achieved at superior levels, would cause total cash compensation to be meaningfully
above the median. Actual payouts may be as low as zero if performance does not meet the baselines established
by the Compensation Committee.
The independent members of the Board have the exclusive authority to determine the amount of the CEO’s
compensation. In setting total compensation, the independent directors consider the median compensation of the
peer group’s CEOs. With respect to the annual incentive plan, the independent directors make two determinations:
(1) the annual cash incentive potential that will be multiplied by the corporate annual cash incentive payout
percentage earned that is applicable to the NEOs and (2) the annual cash incentive amount paid to the CEO by
retaining discretion to reduce the annual cash incentive percentage payout the CEO would otherwise receive under
the formulaic plan.
The Compensation Committee performs the same function and exercises the same authority as to the other
NEOs. In its annual review of compensation for the NEOs, the Compensation Committee:
• Conducts an annual review of all components of compensation, quantifying total compensation for theNEOs including a summary for each NEO of salary; performance-based annual cash incentive; long-termperformance-based equity comprised of performance units, stock options and restricted stock.
• Considers internal pay equity at Kroger to ensure that the CEO is not compensated disproportionately.The Compensation Committee has determined that the compensation of the CEO and that of the otherNEOs bears a reasonable relationship to the compensation levels of other executive positions at Krogertaking into consideration performance and differences in responsibilities.
• Reviews a report from the Compensation Committee’s compensation consultant reflecting acomprehensive review of each element of pay mix, both annual and long-term and comparing NEOcompensation with that of other companies, including both our peer group of competitors and a largergeneral industry group, to ensure that the Compensation Committee’s objectives of competitiveness aremet.
• Takes into account a recommendation from the CEO for salary, annual cash incentive potential and long-term compensation awards for each of the senior officers including the other NEOs. The CEO’srecommendation takes into consideration the objectives established by and the reports received by theCompensation Committee as well as his assessment of individual job performance and contribution to ourmanagement team.
The Compensation Committee does not make use of a formula, but both qualitatively and quantitatively
considers each of the factors identified above in setting compensation.
Shareholder Engagement & the 2020 Advisory Vote to Approve Executive Compensation
At the 2020 annual meeting, we held our tenth annual advisory vote on executive compensation. Over 90% of
the votes cast were in favor of the advisory vote in 2020. In 2020, we also requested meetings with shareholders
representing 43% of our outstanding shares during the proxy season and off-season engagement and ultimately
engaged with shareholders representing 27% of our outstanding shares. Conversations with our shareholders in
these meetings included discussions of our compensation program, with our shareholders providing feedback that
they appreciate the pay for performance nature of our program’s structure.
35
Stock Ownership Guidelines
To more closely align the interests of our officers and directors with your interests as shareholders, the Board
has adopted stock ownership guidelines. These guidelines require non-employee directors, executive officers, and
other key executives to acquire and hold a minimum dollar value of Kroger common shares as set forth below:
Position Multiple
Chief Executive Officer 5 times base salary
President and Chief Operating Officer 4 times base salary
Executive Vice Presidents and Senior Vice Presidents 3 times base salary
Group Vice Presidents, Division Presidents, and Other Designated KeyExecutives
2 times base salary
Non-employee Directors 5 times annual base cash retainer
All covered individuals are expected to achieve the target level within five years of appointment to their
positions. Until the requirements are met, covered individuals, including the NEOs, must hold 100% of common
shares issued pursuant to performance units earned, shares received upon the exercise of stock options and uponthe vesting of restricted stock, except those necessary to pay the exercise price of the options and/or applicabletaxes, and must retain all Kroger common shares unless the disposition is approved in advance by the CEO, or bythe Board or Compensation Committee for the CEO.
Executive Compensation Recoupment Policy (Clawback)
Under the 2019 Long-Term Incentive and Cash Bonus Plan (the ‘‘2019 Plan’’), unless an award agreementprovides otherwise, if a participant’s employment or service is terminated for cause, or if after termination theCompensation Committee determines either that (i) prior to termination, the participant engaged in an act oromission that would have warranted termination for cause or (ii) after termination, the participant violates anycontinuing obligation or duty of the participant with respect to Kroger, any gain realized by the participant from theexercise, vesting or payment of any award may be cancelled, forfeited or recouped in the sole discretion of theCommittee. Under the 2019 Plan, any gain realized by the participant from the exercise, vesting or payment of anyaward may also be recouped if, within one year after such exercise, vesting or payment, (i) a participant isterminated for cause, (ii) the Compensation Committee determines that the participant is subject to recoupmentpursuant to any Kroger policy, or (iii) after a participant’s termination for any reason, the Compensation Committeedetermines either that (1) prior to termination the participant engaged in an act or omission that would havewarranted termination for cause, or (2) after termination the participant violates any continuing obligation or duty ofthe participant with respect to Kroger. Unless otherwise defined under 2019 Plan award agreement, ‘‘cause’’ hasthe meaning as defined in The Kroger Co. Employee Protection Plan, as amended from time to time.
Additionally, if an award based on financial statements that are subsequently restated in a way that would decreasethe value of such award, the participant will, to the extent not otherwise prohibited by law, upon the written requestof Kroger, forfeit and repay to Kroger the difference between what was received and what should have beenreceived based on the accounting restatement, which will be repaid in accordance with any applicable Krogerpolicy or applicable law, including Section 954 of the Dodd-Frank Wall Street Reform and Consumer Protection Actand any rules or regulations adopted thereunder.
Kroger also has a recoupment policy, which provides that if a material error of facts results in the payment toan executive officer at the level of Group Vice President or higher of an annual cash incentive or a long-term cashincentive in an amount higher than otherwise would have been paid, as determined by the CompensationCommittee, then the officer, upon demand from the Compensation Committee, will reimburse Kroger for theamounts that would not have been paid if the error had not occurred. This recoupment policy applies to thoseamounts paid by Kroger within 36 months prior to the detection and public disclosure of the error. In enforcing thepolicy, the Compensation Committee will take into consideration all factors that it deems appropriate, including:
• the materiality of the amount of payment involved;
• the extent to which other benefits were reduced in other years as a result of the achievement ofperformance levels based on the error;
• individual officer culpability, if any; and
• other factors that should offset the amount of overpayment.
36
Compensation Policies as They Relate to Risk Management
As part of the Compensation Committee’s review of our compensation practices, the CompensationCommittee considers and analyzes the extent to which risks arise from such practices and their impact on Kroger’sbusiness. As discussed in this Compensation Discussion and Analysis, our policies and practices for compensatingemployees are designed to, among other things, attract and retain high quality and engaged employees. In thisprocess, the Compensation Committee also focuses on minimizing risk through the implementation of certainpractices and policies, such as the executive compensation recoupment policy, which is described above.Accordingly, we do not believe that our compensation practices and policies create risks that are reasonably likelyto have a material adverse effect on Kroger.
Prohibition on Hedging and Pledging
The Board adopted a policy prohibiting Kroger directors and executive officers from engaging, directly orindirectly, in the pledging of, hedging transactions in, or short sales of, Kroger securities.
Section 162(m) of the Internal Revenue Code
Prior to the effective date of the Tax Cuts and Jobs Act of 2017, Section 162(m) of the Code generallydisallowed a federal tax deduction to public companies for compensation greater than $1 million paid in any taxyear to specified executive officers unless the compensation was ‘‘qualified performance-based compensation’’under that section. Pursuant to the Tax Cuts and Jobs Act of 2017, the exception for ‘‘qualified performance-basedcompensation’’ under Section 162(m) of the Code was eliminated with respect to all remuneration in excess of$1 million other than qualified performance-based compensation pursuant to a written binding contract in effect onNovember 2, 2017 or earlier which was not modified in any material respect on or after such date (the legislationproviding for such transition rule, the ‘‘Transition Rule’’).
As a result, performance-based compensation that the Compensation Committee structured with the intent ofqualifying as performance-based compensation under Section 162(m) prior to the change in the law may or maynot be fully deductible, depending on the application of the Transition Rule. In addition, compensationarrangements structured following the change in law will be subject to the Section 162(m) limitation (without anyexception for performance-based compensation). Consistent with its past practice, the Committee will continue toretain flexibility to design compensation programs that are in the best long-term interests of the Company and ourshareholders, with deductibility of compensation being one of a variety of considerations taken into account.
Compensation Committee Report
The Compensation Committee has reviewed and discussed with Kroger’s management the CompensationDiscussion and Analysis contained in this proxy statement. Based on its review and discussions with management,the Compensation Committee has recommended to the Board that the Compensation Discussion and Analysis beincluded in Kroger’s proxy statement and incorporated by reference into its Annual Report on Form 10-K.
Compensation Committee:
Clyde R. Moore, ChairSusan J. KropfAmanda SourryMark Sutton
37
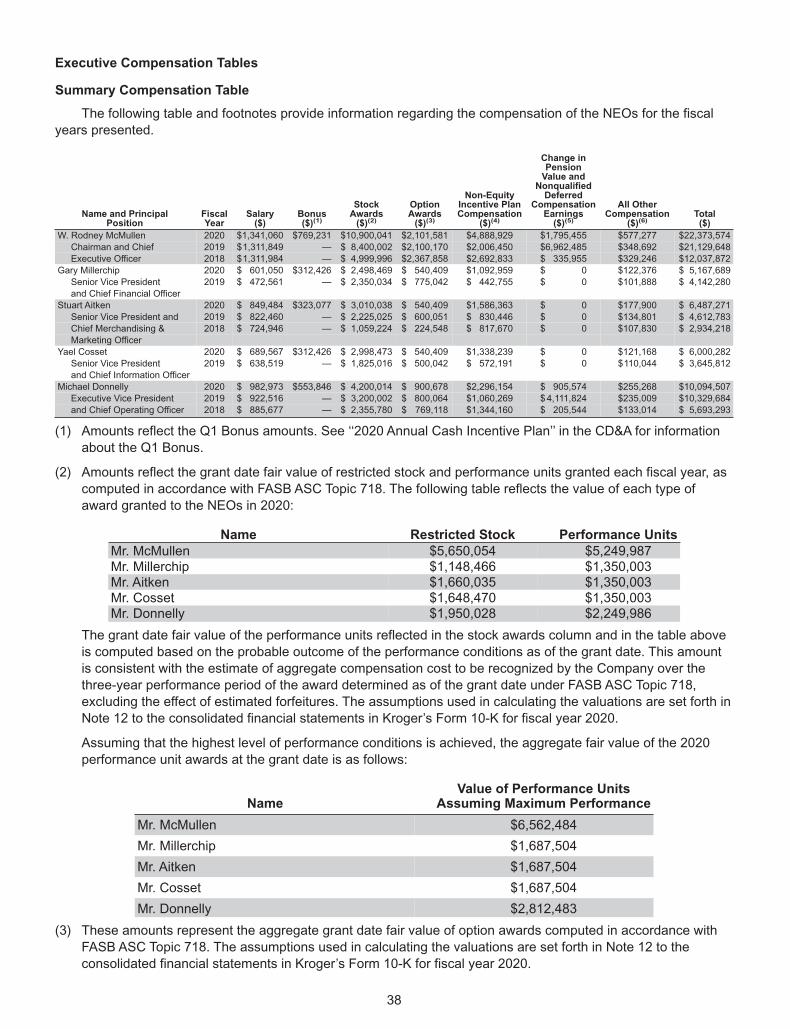
Executive Compensation Tables
Summary Compensation Table
The following table and footnotes provide information regarding the compensation of the NEOs for the fiscal
years presented.
Name and PrincipalPosition
FiscalYear
Salary($)
Bonus($)(1)
StockAwards($)(2)
OptionAwards($)(3)
Non-EquityIncentive PlanCompensation
($)(4)
Change inPensionValue and
NonqualifiedDeferred
CompensationEarnings($)(5)
All OtherCompensation
($)(6)Total($)
W. Rodney McMullen 2020 $1,341,060 $769,231 $10,900,041 $2,101,581 $4,888,929 $1,795,455 $577,277 $22,373,574
Chairman and Chief 2019 $1,311,849 — $ 8,400,002 $2,100,170 $2,006,450 $6,962,485 $348,692 $21,129,648
Executive Officer 2018 $1,311,984 — $ 4,999,996 $2,367,858 $2,692,833 $ 335,955 $329,246 $12,037,872
Gary Millerchip 2020 $ 601,050 $312,426 $ 2,498,469 $ 540,409 $1,092,959 $ 0 $122,376 $ 5,167,689
Senior Vice President 2019 $ 472,561 — $ 2,350,034 $ 775,042 $ 442,755 $ 0 $101,888 $ 4,142,280
and Chief Financial Officer
Stuart Aitken 2020 $ 849,484 $323,077 $ 3,010,038 $ 540,409 $1,586,363 $ 0 $177,900 $ 6,487,271
Senior Vice President and 2019 $ 822,460 — $ 2,225,025 $ 600,051 $ 830,446 $ 0 $134,801 $ 4,612,783
Chief Merchandising & 2018 $ 724,946 — $ 1,059,224 $ 224,548 $ 817,670 $ 0 $107,830 $ 2,934,218
Marketing Officer
Yael Cosset 2020 $ 689,567 $312,426 $ 2,998,473 $ 540,409 $1,338,239 $ 0 $121,168 $ 6,000,282
Senior Vice President 2019 $ 638,519 — $ 1,825,016 $ 500,042 $ 572,191 $ 0 $110,044 $ 3,645,812
and Chief Information Officer
Michael Donnelly 2020 $ 982,973 $553,846 $ 4,200,014 $ 900,678 $2,296,154 $ 905,574 $255,268 $10,094,507
Executive Vice President 2019 $ 922,516 — $ 3,200,002 $ 800,064 $1,060,269 $4,111,824 $235,009 $10,329,684
and Chief Operating Officer 2018 $ 885,677 — $ 2,355,780 $ 769,118 $1,344,160 $ 205,544 $133,014 $ 5,693,293
(1) Amounts reflect the Q1 Bonus amounts. See ‘‘2020 Annual Cash Incentive Plan’’ in the CD&A for information
about the Q1 Bonus.
(2) Amounts reflect the grant date fair value of restricted stock and performance units granted each fiscal year, as
computed in accordance with FASB ASC Topic 718. The following table reflects the value of each type of
award granted to the NEOs in 2020:
Name Restricted Stock Performance UnitsMr. McMullen $5,650,054 $5,249,987Mr. Millerchip $1,148,466 $1,350,003Mr. Aitken $1,660,035 $1,350,003Mr. Cosset $1,648,470 $1,350,003Mr. Donnelly $1,950,028 $2,249,986
The grant date fair value of the performance units reflected in the stock awards column and in the table above
is computed based on the probable outcome of the performance conditions as of the grant date. This amount
is consistent with the estimate of aggregate compensation cost to be recognized by the Company over the
three-year performance period of the award determined as of the grant date under FASB ASC Topic 718,
excluding the effect of estimated forfeitures. The assumptions used in calculating the valuations are set forth in
Note 12 to the consolidated financial statements in Kroger’s Form 10-K for fiscal year 2020.
Assuming that the highest level of performance conditions is achieved, the aggregate fair value of the 2020
performance unit awards at the grant date is as follows:
NameValue of Performance Units
Assuming Maximum Performance
Mr. McMullen $6,562,484
Mr. Millerchip $1,687,504
Mr. Aitken $1,687,504
Mr. Cosset $1,687,504
Mr. Donnelly $2,812,483
(3) These amounts represent the aggregate grant date fair value of option awards computed in accordance with
FASB ASC Topic 718. The assumptions used in calculating the valuations are set forth in Note 12 to the
consolidated financial statements in Kroger’s Form 10-K for fiscal year 2020.
38
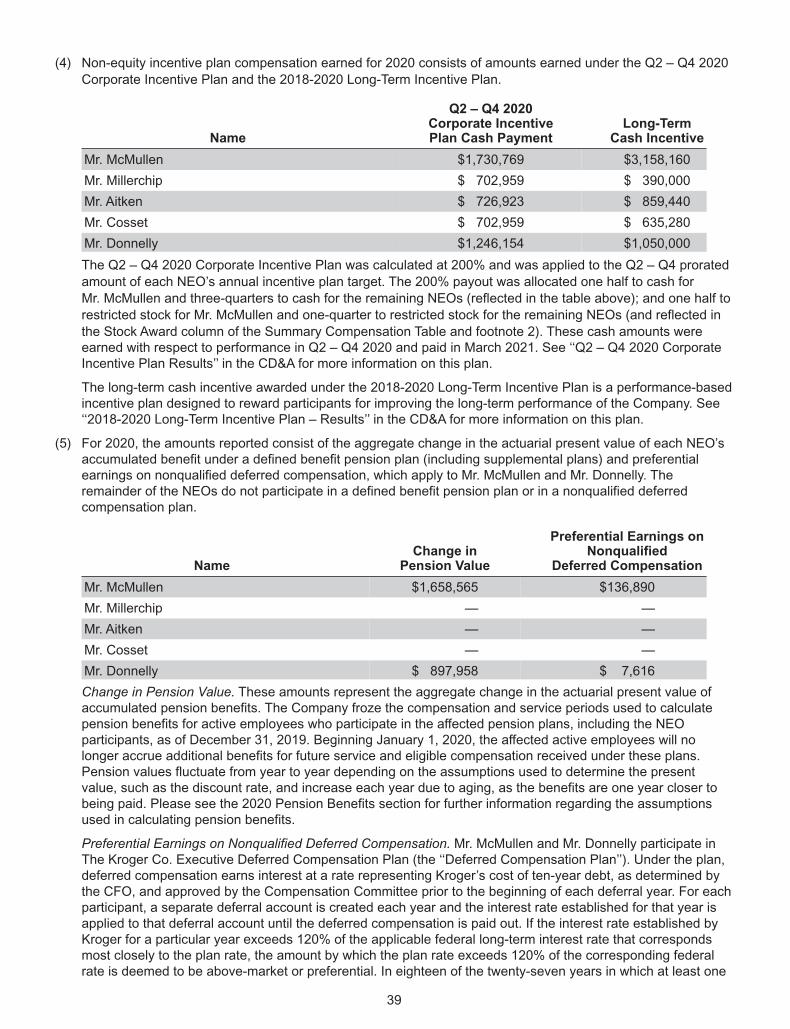
(4) Non-equity incentive plan compensation earned for 2020 consists of amounts earned under the Q2 – Q4 2020
Corporate Incentive Plan and the 2018-2020 Long-Term Incentive Plan.
Name
Q2 – Q4 2020Corporate IncentivePlan Cash Payment
Long-TermCash Incentive
Mr. McMullen $1,730,769 $3,158,160
Mr. Millerchip $ 702,959 $ 390,000
Mr. Aitken $ 726,923 $ 859,440
Mr. Cosset $ 702,959 $ 635,280
Mr. Donnelly $1,246,154 $1,050,000
The Q2 – Q4 2020 Corporate Incentive Plan was calculated at 200% and was applied to the Q2 – Q4 prorated
amount of each NEO’s annual incentive plan target. The 200% payout was allocated one half to cash for
Mr. McMullen and three-quarters to cash for the remaining NEOs (reflected in the table above); and one half to
restricted stock for Mr. McMullen and one-quarter to restricted stock for the remaining NEOs (and reflected in
the Stock Award column of the Summary Compensation Table and footnote 2). These cash amounts wereearned with respect to performance in Q2 – Q4 2020 and paid in March 2021. See ‘‘Q2 – Q4 2020 CorporateIncentive Plan Results’’ in the CD&A for more information on this plan.
The long-term cash incentive awarded under the 2018-2020 Long-Term Incentive Plan is a performance-basedincentive plan designed to reward participants for improving the long-term performance of the Company. See‘‘2018-2020 Long-Term Incentive Plan – Results’’ in the CD&A for more information on this plan.
(5) For 2020, the amounts reported consist of the aggregate change in the actuarial present value of each NEO’saccumulated benefit under a defined benefit pension plan (including supplemental plans) and preferentialearnings on nonqualified deferred compensation, which apply to Mr. McMullen and Mr. Donnelly. Theremainder of the NEOs do not participate in a defined benefit pension plan or in a nonqualified deferredcompensation plan.
NameChange in
Pension Value
Preferential Earnings onNonqualified
Deferred Compensation
Mr. McMullen $1,658,565 $136,890
Mr. Millerchip — —
Mr. Aitken — —
Mr. Cosset — —
Mr. Donnelly $ 897,958 $ 7,616
Change in Pension Value. These amounts represent the aggregate change in the actuarial present value ofaccumulated pension benefits. The Company froze the compensation and service periods used to calculatepension benefits for active employees who participate in the affected pension plans, including the NEOparticipants, as of December 31, 2019. Beginning January 1, 2020, the affected active employees will nolonger accrue additional benefits for future service and eligible compensation received under these plans.Pension values fluctuate from year to year depending on the assumptions used to determine the presentvalue, such as the discount rate, and increase each year due to aging, as the benefits are one year closer tobeing paid. Please see the 2020 Pension Benefits section for further information regarding the assumptionsused in calculating pension benefits.
Preferential Earnings on Nonqualified Deferred Compensation. Mr. McMullen and Mr. Donnelly participate inThe Kroger Co. Executive Deferred Compensation Plan (the ‘‘Deferred Compensation Plan’’). Under the plan,deferred compensation earns interest at a rate representing Kroger’s cost of ten-year debt, as determined bythe CFO, and approved by the Compensation Committee prior to the beginning of each deferral year. For eachparticipant, a separate deferral account is created each year and the interest rate established for that year isapplied to that deferral account until the deferred compensation is paid out. If the interest rate established byKroger for a particular year exceeds 120% of the applicable federal long-term interest rate that correspondsmost closely to the plan rate, the amount by which the plan rate exceeds 120% of the corresponding federalrate is deemed to be above-market or preferential. In eighteen of the twenty-seven years in which at least one
39
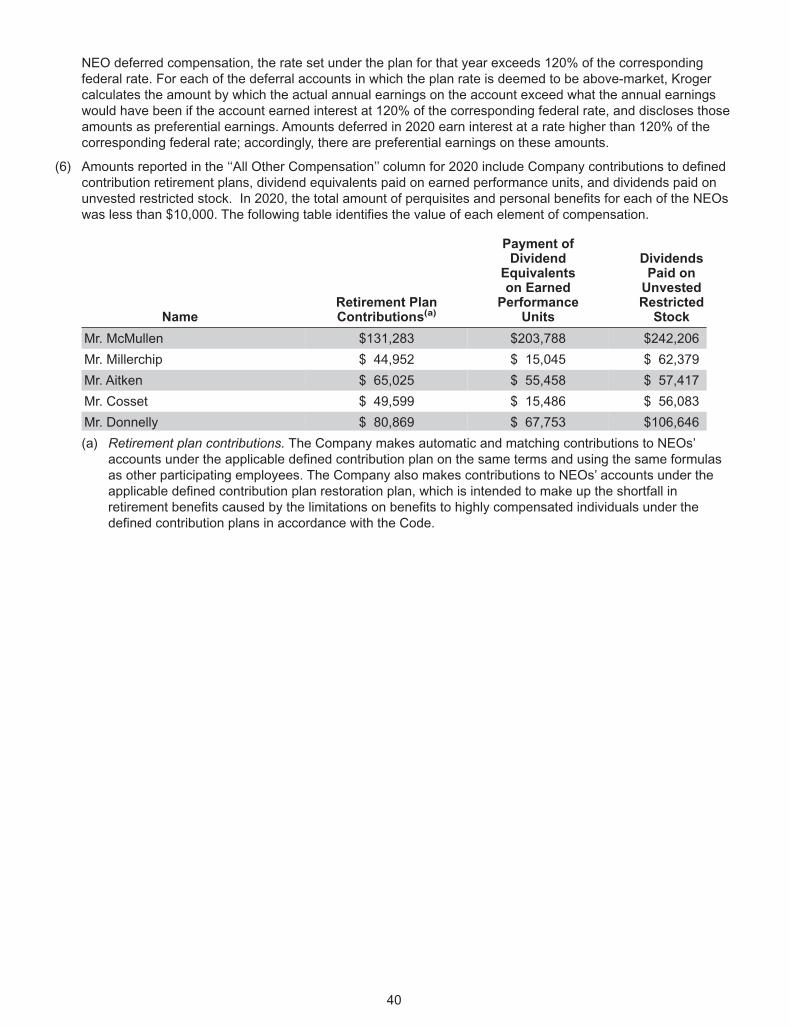
NEO deferred compensation, the rate set under the plan for that year exceeds 120% of the correspondingfederal rate. For each of the deferral accounts in which the plan rate is deemed to be above-market, Krogercalculates the amount by which the actual annual earnings on the account exceed what the annual earningswould have been if the account earned interest at 120% of the corresponding federal rate, and discloses thoseamounts as preferential earnings. Amounts deferred in 2020 earn interest at a rate higher than 120% of thecorresponding federal rate; accordingly, there are preferential earnings on these amounts.
(6) Amounts reported in the ‘‘All Other Compensation’’ column for 2020 include Company contributions to definedcontribution retirement plans, dividend equivalents paid on earned performance units, and dividends paid onunvested restricted stock. In 2020, the total amount of perquisites and personal benefits for each of the NEOswas less than $10,000. The following table identifies the value of each element of compensation.
NameRetirement PlanContributions(a)
Payment ofDividend
Equivalentson Earned
PerformanceUnits
DividendsPaid onUnvestedRestrictedStock
Mr. McMullen $131,283 $203,788 $242,206
Mr. Millerchip $ 44,952 $ 15,045 $ 62,379
Mr. Aitken $ 65,025 $ 55,458 $ 57,417
Mr. Cosset $ 49,599 $ 15,486 $ 56,083
Mr. Donnelly $ 80,869 $ 67,753 $106,646
(a) Retirement plan contributions. The Company makes automatic and matching contributions to NEOs’accounts under the applicable defined contribution plan on the same terms and using the same formulasas other participating employees. The Company also makes contributions to NEOs’ accounts under theapplicable defined contribution plan restoration plan, which is intended to make up the shortfall inretirement benefits caused by the limitations on benefits to highly compensated individuals under thedefined contribution plans in accordance with the Code.
40
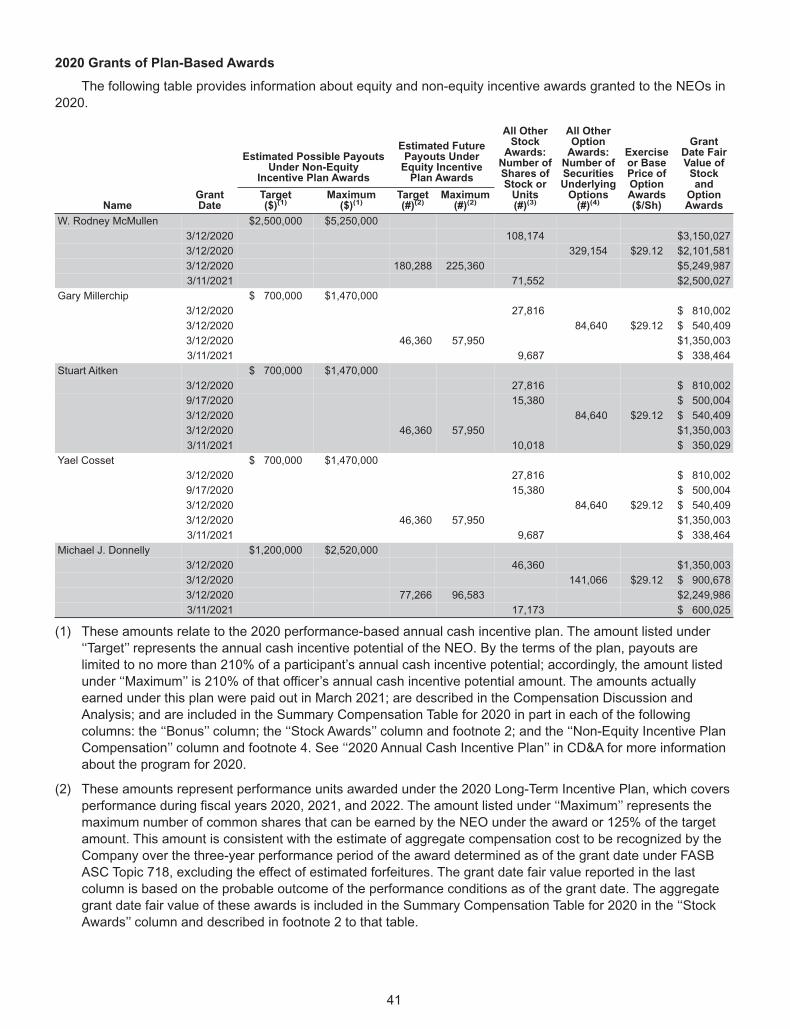
2020 Grants of Plan-Based Awards
The following table provides information about equity and non-equity incentive awards granted to the NEOs in
2020.
NameGrantDate
Estimated Possible PayoutsUnder Non-Equity
Incentive Plan Awards
Estimated FuturePayouts UnderEquity IncentivePlan Awards
All OtherStock
Awards:Number ofShares ofStock orUnits(#)(3)
All OtherOptionAwards:Number ofSecuritiesUnderlyingOptions(#)(4)
Exerciseor BasePrice ofOptionAwards($/Sh)
GrantDate FairValue ofStockand
OptionAwards
Target($)(1)
Maximum($)(1)
Target(#)(2)
Maximum(#)(2)
W. Rodney McMullen $2,500,000 $5,250,000
3/12/2020 108,174 $3,150,027
3/12/2020 329,154 $29.12 $2,101,581
3/12/2020 180,288 225,360 $5,249,987
3/11/2021 71,552 $2,500,027
Gary Millerchip $ 700,000 $1,470,000
3/12/2020 27,816 $ 810,002
3/12/2020 84,640 $29.12 $ 540,409
3/12/2020 46,360 57,950 $1,350,003
3/11/2021 9,687 $ 338,464
Stuart Aitken $ 700,000 $1,470,000
3/12/2020 27,816 $ 810,002
9/17/2020 15,380 $ 500,004
3/12/2020 84,640 $29.12 $ 540,409
3/12/2020 46,360 57,950 $1,350,003
3/11/2021 10,018 $ 350,029
Yael Cosset $ 700,000 $1,470,000
3/12/2020 27,816 $ 810,002
9/17/2020 15,380 $ 500,004
3/12/2020 84,640 $29.12 $ 540,409
3/12/2020 46,360 57,950 $1,350,003
3/11/2021 9,687 $ 338,464
Michael J. Donnelly $1,200,000 $2,520,000
3/12/2020 46,360 $1,350,003
3/12/2020 141,066 $29.12 $ 900,678
3/12/2020 77,266 96,583 $2,249,986
3/11/2021 17,173 $ 600,025
(1) These amounts relate to the 2020 performance-based annual cash incentive plan. The amount listed under
‘‘Target’’ represents the annual cash incentive potential of the NEO. By the terms of the plan, payouts are
limited to no more than 210% of a participant’s annual cash incentive potential; accordingly, the amount listed
under ‘‘Maximum’’ is 210% of that officer’s annual cash incentive potential amount. The amounts actually
earned under this plan were paid out in March 2021; are described in the Compensation Discussion and
Analysis; and are included in the Summary Compensation Table for 2020 in part in each of the following
columns: the ‘‘Bonus’’ column; the ‘‘Stock Awards’’ column and footnote 2; and the ‘‘Non-Equity Incentive Plan
Compensation’’ column and footnote 4. See ‘‘2020 Annual Cash Incentive Plan’’ in CD&A for more information
about the program for 2020.
(2) These amounts represent performance units awarded under the 2020 Long-Term Incentive Plan, which covers
performance during fiscal years 2020, 2021, and 2022. The amount listed under ‘‘Maximum’’ represents the
maximum number of common shares that can be earned by the NEO under the award or 125% of the target
amount. This amount is consistent with the estimate of aggregate compensation cost to be recognized by the
Company over the three-year performance period of the award determined as of the grant date under FASB
ASC Topic 718, excluding the effect of estimated forfeitures. The grant date fair value reported in the last
column is based on the probable outcome of the performance conditions as of the grant date. The aggregate
grant date fair value of these awards is included in the Summary Compensation Table for 2020 in the ‘‘Stock
Awards’’ column and described in footnote 2 to that table.
41
(3) These amounts represent the number of shares of restricted stock granted in 2020. The aggregate grant datefair value reported in the last column is calculated in accordance with FASB ASC Topic 718. The aggregategrant date fair value of these awards is included in the Summary Compensation Table for 2020 in the ‘‘StockAwards’’ column and described in footnote 2 to that table.
(4) These amounts represent the number of stock options granted in 2020. Options are granted with an exerciseprice equal to the closing price of Kroger common shares on the grant date. The aggregate grant date fairvalue reported in the last column is calculated in accordance with FASB ASC Topic 718. The aggregate grantdate fair value of these awards is included in the Summary Compensation Table for 2020 in the ‘‘OptionAwards’’ column.
The Compensation Committee, and the independent members of the Board in the case of the CEO, establishedthe incentive potential amounts for the performance-based annual cash incentive awards (shown in this table as‘‘Target’’) and the number of performance units awarded for the long-term incentive awards (shown in this table as‘‘Target’’). Amounts are payable to the extent that Kroger’s actual performance meets specific performance metricsestablished by the Compensation Committee at the beginning of the performance period. There are no guaranteedor minimum payouts; if none of the performance metrics are achieved, then none of the award is earned and nopayout is made. As described in the CD&A, actual earnings under the performance-based annual cash incentiveplan may exceed the target amount if the Company’s performance exceeds the performance goals, but are limitedto 210% of the target amount. The potential values for performance units awarded under the 2020-2022 Long-TermIncentive Plan are more particularly described in the CD&A.
The annual restricted stock and nonqualified stock options awards granted to the NEOs vest in equal amounts oneach of the first four anniversaries of the grant date, so long as the officer remains a Kroger employee, except that(a) Mr. Aitken’s and Mr. Cosset’s September 2020 award included restricted stock awards of 15,380 shares asspecial awards granted in connection with promotions that each vest in equal amounts on each of the first threeanniversaries of the grant date and (b) the restricted stock granted in March 2021 with respect to a portion of theQ2 – Q4 2020 Corporate Incentive Plan vests on the one year anniversary of the grant date. Any dividendsdeclared on Kroger common shares are payable on unvested restricted stock.
42
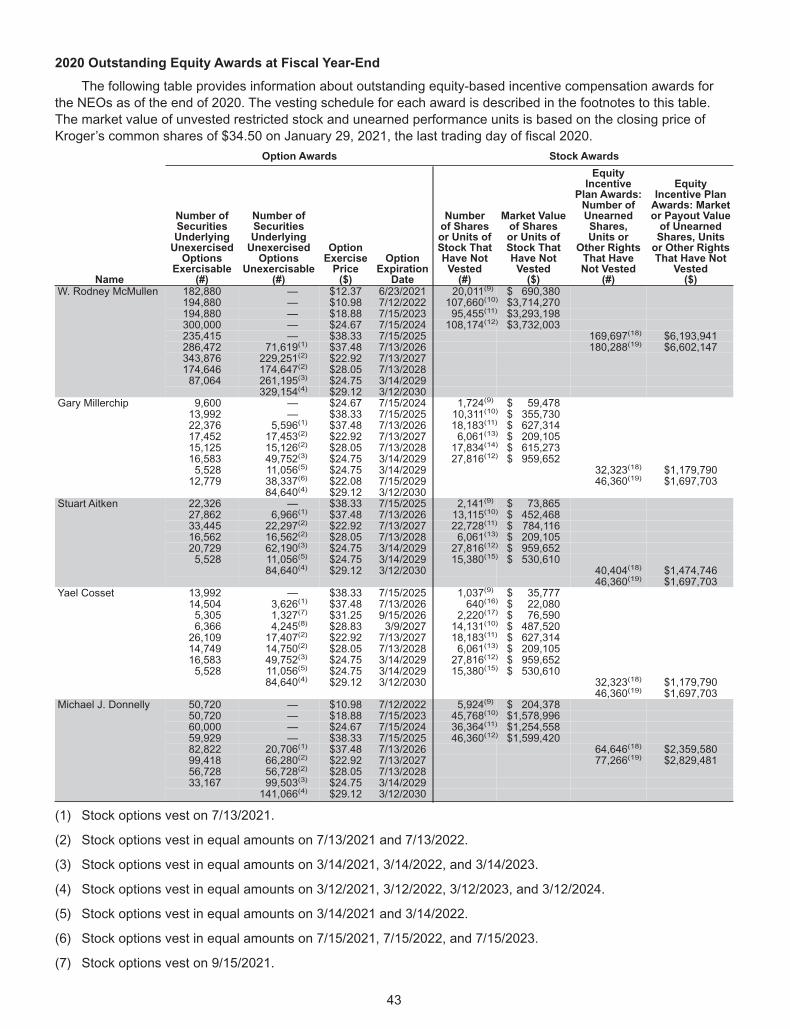
2020 Outstanding Equity Awards at Fiscal Year-End
The following table provides information about outstanding equity-based incentive compensation awards for
the NEOs as of the end of 2020. The vesting schedule for each award is described in the footnotes to this table.
The market value of unvested restricted stock and unearned performance units is based on the closing price of
Kroger’s common shares of $34.50 on January 29, 2021, the last trading day of fiscal 2020.
Option Awards Stock Awards
Name
Number ofSecuritiesUnderlyingUnexercisedOptions
Exercisable(#)
Number ofSecuritiesUnderlyingUnexercisedOptions
Unexercisable(#)
OptionExercisePrice($)
OptionExpiration
Date
Numberof Sharesor Units ofStock ThatHave NotVested(#)
Market Valueof Sharesor Units ofStock ThatHave NotVested($)
EquityIncentive
Plan Awards:Number ofUnearnedShares,Units or
Other RightsThat HaveNot Vested
(#)
EquityIncentive PlanAwards: Marketor Payout Valueof UnearnedShares, Unitsor Other RightsThat Have Not
Vested($)
W. Rodney McMullen 182,880 — $12.37 6/23/2021 20,011(9) $ 690,380194,880 — $10.98 7/12/2022 107,660(10) $3,714,270194,880 — $18.88 7/15/2023 95,455(11) $3,293,198300,000 — $24.67 7/15/2024 108,174(12) $3,732,003235,415 — $38.33 7/15/2025 169,697(18) $6,193,941286,472 71,619(1) $37.48 7/13/2026 180,288(19) $6,602,147343,876 229,251(2) $22.92 7/13/2027174,646 174,647(2) $28.05 7/13/202887,064 261,195(3) $24.75 3/14/2029
329,154(4) $29.12 3/12/2030Gary Millerchip 9,600 — $24.67 7/15/2024 1,724(9) $ 59,478
13,992 — $38.33 7/15/2025 10,311(10) $ 355,73022,376 5,596(1) $37.48 7/13/2026 18,183(11) $ 627,31417,452 17,453(2) $22.92 7/13/2027 6,061(13) $ 209,10515,125 15,126(2) $28.05 7/13/2028 17,834(14) $ 615,27316,583 49,752(3) $24.75 3/14/2029 27,816(12) $ 959,6525,528 11,056(5) $24.75 3/14/2029 32,323(18) $1,179,79012,779 38,337(6) $22.08 7/15/2029 46,360(19) $1,697,703
84,640(4) $29.12 3/12/2030Stuart Aitken 22,326 — $38.33 7/15/2025 2,141(9) $ 73,865
27,862 6,966(1) $37.48 7/13/2026 13,115(10) $ 452,46833,445 22,297(2) $22.92 7/13/2027 22,728(11) $ 784,11616,562 16,562(2) $28.05 7/13/2028 6,061(13) $ 209,10520,729 62,190(3) $24.75 3/14/2029 27,816(12) $ 959,6525,528 11,056(5) $24.75 3/14/2029 15,380(15) $ 530,610
84,640(4) $29.12 3/12/2030 40,404(18) $1,474,74646,360(19) $1,697,703
Yael Cosset 13,992 — $38.33 7/15/2025 1,037(9) $ 35,77714,504 3,626(1) $37.48 7/13/2026 640(16) $ 22,0805,305 1,327(7) $31.25 9/15/2026 2,220(17) $ 76,5906,366 4,245(8) $28.83 3/9/2027 14,131(10) $ 487,52026,109 17,407(2) $22.92 7/13/2027 18,183(11) $ 627,31414,749 14,750(2) $28.05 7/13/2028 6,061(13) $ 209,10516,583 49,752(3) $24.75 3/14/2029 27,816(12) $ 959,6525,528 11,056(5) $24.75 3/14/2029 15,380(15) $ 530,610
84,640(4) $29.12 3/12/2030 32,323(18) $1,179,79046,360(19) $1,697,703
Michael J. Donnelly 50,720 — $10.98 7/12/2022 5,924(9) $ 204,37850,720 — $18.88 7/15/2023 45,768(10) $1,578,99660,000 — $24.67 7/15/2024 36,364(11) $1,254,55859,929 — $38.33 7/15/2025 46,360(12) $1,599,42082,822 20,706(1) $37.48 7/13/2026 64,646(18) $2,359,58099,418 66,280(2) $22.92 7/13/2027 77,266(19) $2,829,48156,728 56,728(2) $28.05 7/13/202833,167 99,503(3) $24.75 3/14/2029
141,066(4) $29.12 3/12/2030
(1) Stock options vest on 7/13/2021.
(2) Stock options vest in equal amounts on 7/13/2021 and 7/13/2022.
(3) Stock options vest in equal amounts on 3/14/2021, 3/14/2022, and 3/14/2023.
(4) Stock options vest in equal amounts on 3/12/2021, 3/12/2022, 3/12/2023, and 3/12/2024.
(5) Stock options vest in equal amounts on 3/14/2021 and 3/14/2022.
(6) Stock options vest in equal amounts on 7/15/2021, 7/15/2022, and 7/15/2023.
(7) Stock options vest on 9/15/2021.
43
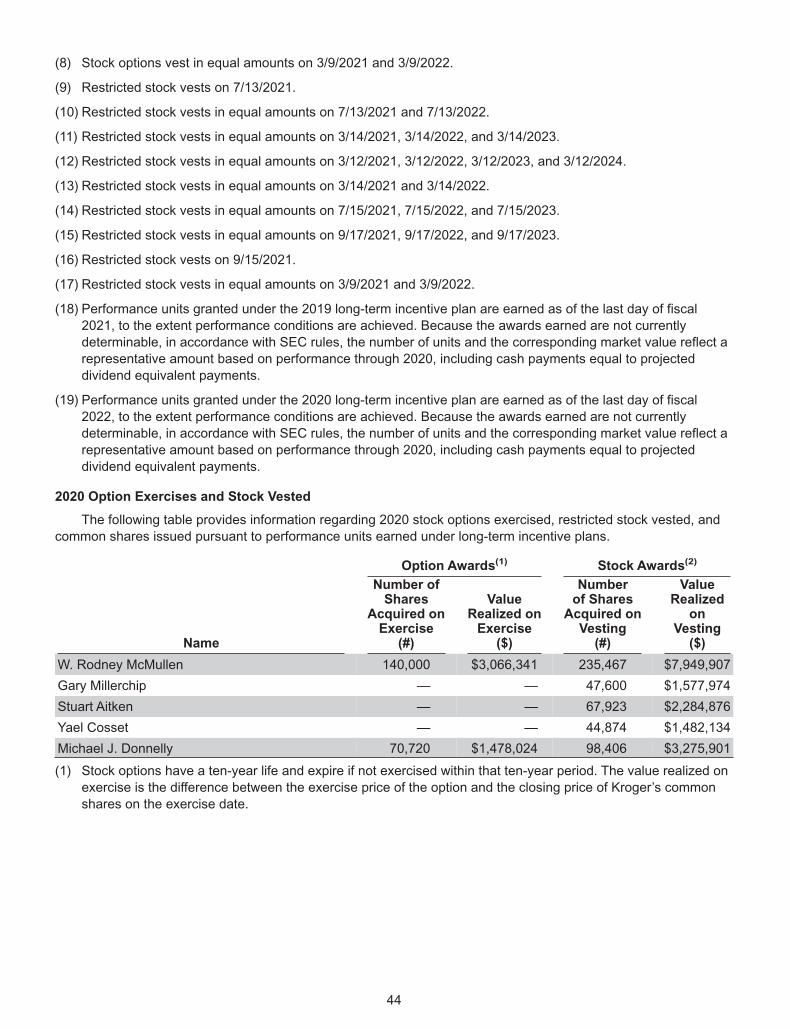
(8) Stock options vest in equal amounts on 3/9/2021 and 3/9/2022.
(9) Restricted stock vests on 7/13/2021.
(10) Restricted stock vests in equal amounts on 7/13/2021 and 7/13/2022.
(11) Restricted stock vests in equal amounts on 3/14/2021, 3/14/2022, and 3/14/2023.
(12) Restricted stock vests in equal amounts on 3/12/2021, 3/12/2022, 3/12/2023, and 3/12/2024.
(13) Restricted stock vests in equal amounts on 3/14/2021 and 3/14/2022.
(14) Restricted stock vests in equal amounts on 7/15/2021, 7/15/2022, and 7/15/2023.
(15) Restricted stock vests in equal amounts on 9/17/2021, 9/17/2022, and 9/17/2023.
(16) Restricted stock vests on 9/15/2021.
(17) Restricted stock vests in equal amounts on 3/9/2021 and 3/9/2022.
(18) Performance units granted under the 2019 long-term incentive plan are earned as of the last day of fiscal
2021, to the extent performance conditions are achieved. Because the awards earned are not currently
determinable, in accordance with SEC rules, the number of units and the corresponding market value reflect a
representative amount based on performance through 2020, including cash payments equal to projected
dividend equivalent payments.
(19) Performance units granted under the 2020 long-term incentive plan are earned as of the last day of fiscal
2022, to the extent performance conditions are achieved. Because the awards earned are not currently
determinable, in accordance with SEC rules, the number of units and the corresponding market value reflect a
representative amount based on performance through 2020, including cash payments equal to projected
dividend equivalent payments.
2020 Option Exercises and Stock Vested
The following table provides information regarding 2020 stock options exercised, restricted stock vested, and
common shares issued pursuant to performance units earned under long-term incentive plans.
Option Awards(1) Stock Awards(2)
Name
Number ofShares
Acquired onExercise
(#)
ValueRealized onExercise
($)
Numberof Shares
Acquired onVesting(#)
ValueRealized
onVesting($)
W. Rodney McMullen 140,000 $3,066,341 235,467 $7,949,907
Gary Millerchip — — 47,600 $1,577,974
Stuart Aitken — — 67,923 $2,284,876
Yael Cosset — — 44,874 $1,482,134
Michael J. Donnelly 70,720 $1,478,024 98,406 $3,275,901
(1) Stock options have a ten-year life and expire if not exercised within that ten-year period. The value realized on
exercise is the difference between the exercise price of the option and the closing price of Kroger’s common
shares on the exercise date.
44
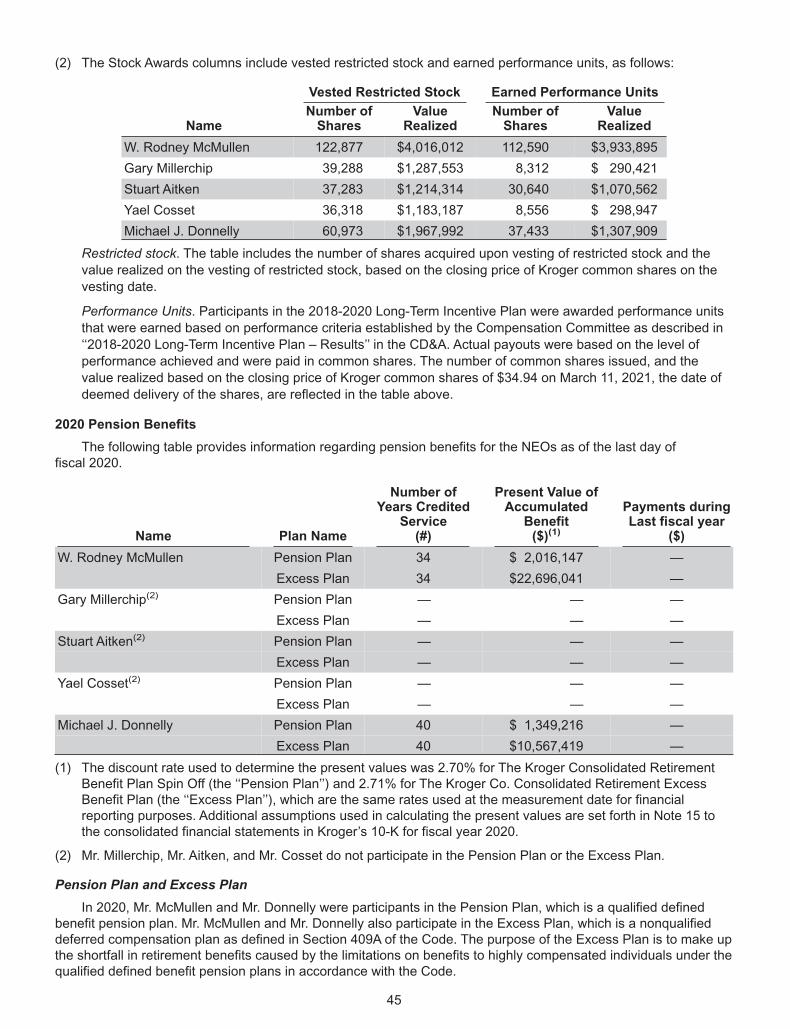
(2) The Stock Awards columns include vested restricted stock and earned performance units, as follows:
Vested Restricted Stock Earned Performance Units
NameNumber ofShares
ValueRealized
Number ofShares
ValueRealized
W. Rodney McMullen 122,877 $4,016,012 112,590 $3,933,895
Gary Millerchip 39,288 $1,287,553 8,312 $ 290,421
Stuart Aitken 37,283 $1,214,314 30,640 $1,070,562
Yael Cosset 36,318 $1,183,187 8,556 $ 298,947
Michael J. Donnelly 60,973 $1,967,992 37,433 $1,307,909
Restricted stock. The table includes the number of shares acquired upon vesting of restricted stock and the
value realized on the vesting of restricted stock, based on the closing price of Kroger common shares on the
vesting date.
Performance Units. Participants in the 2018-2020 Long-Term Incentive Plan were awarded performance units
that were earned based on performance criteria established by the Compensation Committee as described in
‘‘2018-2020 Long-Term Incentive Plan – Results’’ in the CD&A. Actual payouts were based on the level of
performance achieved and were paid in common shares. The number of common shares issued, and the
value realized based on the closing price of Kroger common shares of $34.94 on March 11, 2021, the date of
deemed delivery of the shares, are reflected in the table above.
2020 Pension Benefits
The following table provides information regarding pension benefits for the NEOs as of the last day offiscal 2020.
Name Plan Name
Number ofYears Credited
Service(#)
Present Value ofAccumulated
Benefit($)(1)
Payments duringLast fiscal year
($)
W. Rodney McMullen Pension Plan 34 $ 2,016,147 —
Excess Plan 34 $22,696,041 —
Gary Millerchip(2) Pension Plan — — —
Excess Plan — — —
Stuart Aitken(2) Pension Plan — — —
Excess Plan — — —
Yael Cosset(2) Pension Plan — — —
Excess Plan — — —
Michael J. Donnelly Pension Plan 40 $ 1,349,216 —
Excess Plan 40 $10,567,419 —
(1) The discount rate used to determine the present values was 2.70% for The Kroger Consolidated RetirementBenefit Plan Spin Off (the ‘‘Pension Plan’’) and 2.71% for The Kroger Co. Consolidated Retirement ExcessBenefit Plan (the ‘‘Excess Plan’’), which are the same rates used at the measurement date for financialreporting purposes. Additional assumptions used in calculating the present values are set forth in Note 15 tothe consolidated financial statements in Kroger’s 10-K for fiscal year 2020.
(2) Mr. Millerchip, Mr. Aitken, and Mr. Cosset do not participate in the Pension Plan or the Excess Plan.
Pension Plan and Excess Plan
In 2020, Mr. McMullen and Mr. Donnelly were participants in the Pension Plan, which is a qualified definedbenefit pension plan. Mr. McMullen and Mr. Donnelly also participate in the Excess Plan, which is a nonqualifieddeferred compensation plan as defined in Section 409A of the Code. The purpose of the Excess Plan is to make upthe shortfall in retirement benefits caused by the limitations on benefits to highly compensated individuals under thequalified defined benefit pension plans in accordance with the Code.
45
Although participants generally receive credited service beginning at age 21, certain participants in the
Pension Plan and the Excess Plan who commenced employment prior to 1986, including Mr. McMullen, began to
accrue credited service after attaining age 25 and one year of service. The Pension Plan and the Excess Plan
generally determine accrued benefits using a cash balance formula but retain benefit formulas applicable under
prior plans for certain ‘‘grandfathered participants’’ who were employed by Kroger on December 31, 2000.
Mr. McMullen and Mr. Donnelly are eligible for these grandfathered benefits.
Grandfathered Participants
Benefits for grandfathered participants are determined using formulas applicable under prior plans, including
the Kroger formula covering service to The Kroger Co. and the Dillon formula covering service to Dillon Companies,
Inc. As ‘‘grandfathered participants,’’ Mr. McMullen and Mr. Donnelly will receive benefits under the Pension Plan
and the Excess Plan, determined as follows:
• 11∕2% times years of credited service multiplied by the average of the highest five years of total earnings(base salary and annual cash incentive) during the last ten calendar years of employment, reduced by11∕4% times years of credited service multiplied by the primary social security benefit;
• normal retirement age is 65;
• unreduced benefits are payable beginning at age 62; and
• benefits payable between ages 55 and 62 will be reduced by 1∕3 of 1% for each of the first 24 months andby 1∕2 of 1% for each of the next 60 months by which the commencement of benefits precedes age 62.
In 2018, we announced changes to these company-sponsored pension plans. The Company froze the
compensation and service periods used to calculate pension benefits for active employees who participate in the
affected pension plans, including the NEO participants, as of December 31, 2019. Beginning January 1, 2020, the
affected active employees will no longer accrue additional benefits for future service and eligible compensation
received under these plans.
In the event of a termination of employment other than death or disability, Mr. McMullen and Mr. Donnelly
currently are eligible for a reduced early retirement benefit, as each has attained age 55. If a ‘‘grandfathered
participant’’ becomes disabled while employed by Kroger and after attaining age 55, the participant will receive the
full retirement benefit. If a married ‘‘grandfathered participant’’ dies while employed by Kroger, the surviving spouse
will receive benefits as though a retirement occurred on such date, based on the greater of: actual benefits payable
to the participant if he or she was over age 55, or the benefits that would have been payable to the participant
assuming he or she was age 55 on the date of death.
Offsetting Benefits
Mr. Donnelly also participates in the Dillon Companies, Inc. Employees’ Profit Sharing Plan (the ‘‘Dillon Profit
Sharing Plan’’), which is a qualified defined contribution plan under which Dillon Companies, Inc. and its
participating subsidiaries may choose to make discretionary contributions each year that are allocated to each
participant’s account. Participation in the Dillon Profit Sharing Plan was frozen in 2001 and participants are no
longer able to make employee contributions, but certain participants, including Mr. Donnelly, are still eligible for
employer contributions. Participants elect from among a number of investment options and the amounts in their
accounts are invested and credited with investment earnings in accordance with their elections. Due to offset
formulas contained in the Pension Plan, Mr. Donnelly’s accrued benefits under the Dillon Profit Sharing Plan offset
a portion of the benefit that would otherwise accrue for him under the Pension Plan for his service with Dillon
Companies, Inc. Mr. Donnelly also participates in the Dillon Companies, Inc. Excess Benefit Profit Sharing Plan
(‘‘Dillon Excess Profit Sharing Plan’’) which provides Company contributions in excess of the qualified plan limits.
The Dillon Excess Profit Sharing Plan is offset by Mr. Donnelly’s benefit from the Excess Plan. The offsets are
reflected in the Pension Benefits table above.
46
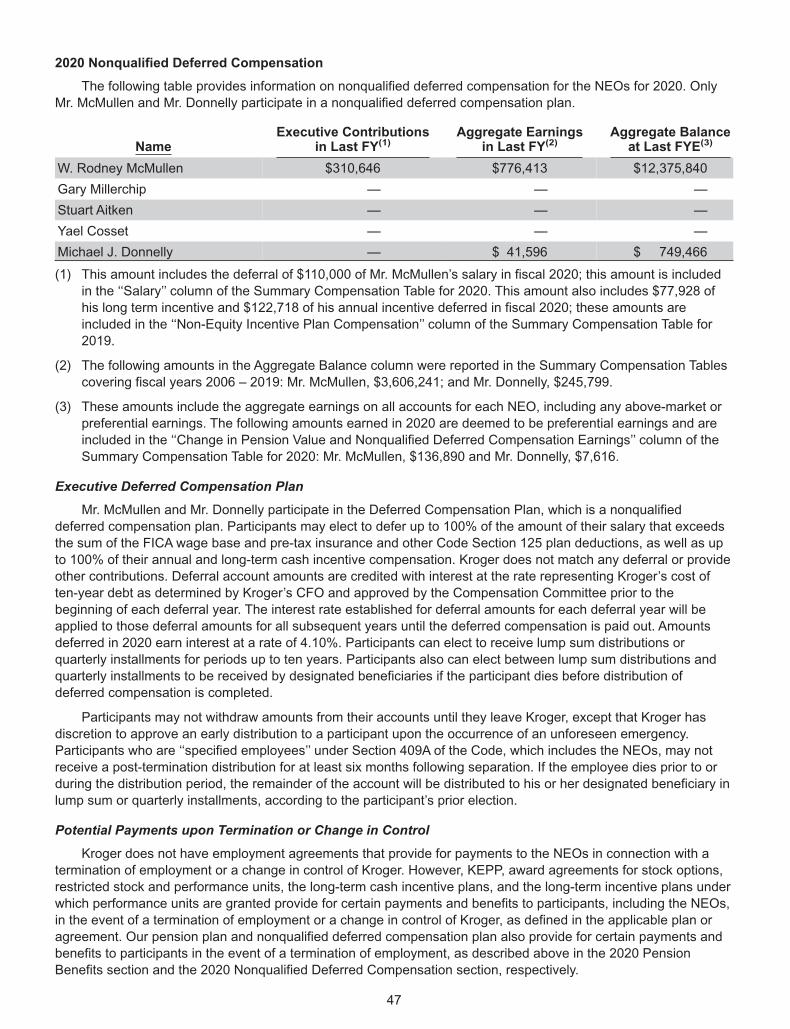
2020 Nonqualified Deferred Compensation
The following table provides information on nonqualified deferred compensation for the NEOs for 2020. Only
Mr. McMullen and Mr. Donnelly participate in a nonqualified deferred compensation plan.
NameExecutive Contributions
in Last FY(1)Aggregate Earnings
in Last FY(2)Aggregate Balance
at Last FYE(3)
W. Rodney McMullen $310,646 $776,413 $12,375,840
Gary Millerchip — — —
Stuart Aitken — — —
Yael Cosset — — —
Michael J. Donnelly — $ 41,596 $ 749,466
(1) This amount includes the deferral of $110,000 of Mr. McMullen’s salary in fiscal 2020; this amount is included
in the ‘‘Salary’’ column of the Summary Compensation Table for 2020. This amount also includes $77,928 of
his long term incentive and $122,718 of his annual incentive deferred in fiscal 2020; these amounts are
included in the ‘‘Non-Equity Incentive Plan Compensation’’ column of the Summary Compensation Table for
2019.
(2) The following amounts in the Aggregate Balance column were reported in the Summary Compensation Tables
covering fiscal years 2006 – 2019: Mr. McMullen, $3,606,241; and Mr. Donnelly, $245,799.
(3) These amounts include the aggregate earnings on all accounts for each NEO, including any above-market or
preferential earnings. The following amounts earned in 2020 are deemed to be preferential earnings and are
included in the ‘‘Change in Pension Value and Nonqualified Deferred Compensation Earnings’’ column of the
Summary Compensation Table for 2020: Mr. McMullen, $136,890 and Mr. Donnelly, $7,616.
Executive Deferred Compensation Plan
Mr. McMullen and Mr. Donnelly participate in the Deferred Compensation Plan, which is a nonqualified
deferred compensation plan. Participants may elect to defer up to 100% of the amount of their salary that exceeds
the sum of the FICA wage base and pre-tax insurance and other Code Section 125 plan deductions, as well as up
to 100% of their annual and long-term cash incentive compensation. Kroger does not match any deferral or provide
other contributions. Deferral account amounts are credited with interest at the rate representing Kroger’s cost of
ten-year debt as determined by Kroger’s CFO and approved by the Compensation Committee prior to the
beginning of each deferral year. The interest rate established for deferral amounts for each deferral year will be
applied to those deferral amounts for all subsequent years until the deferred compensation is paid out. Amounts
deferred in 2020 earn interest at a rate of 4.10%. Participants can elect to receive lump sum distributions or
quarterly installments for periods up to ten years. Participants also can elect between lump sum distributions and
quarterly installments to be received by designated beneficiaries if the participant dies before distribution of
deferred compensation is completed.
Participants may not withdraw amounts from their accounts until they leave Kroger, except that Kroger has
discretion to approve an early distribution to a participant upon the occurrence of an unforeseen emergency.
Participants who are ‘‘specified employees’’ under Section 409A of the Code, which includes the NEOs, may not
receive a post-termination distribution for at least six months following separation. If the employee dies prior to or
during the distribution period, the remainder of the account will be distributed to his or her designated beneficiary in
lump sum or quarterly installments, according to the participant’s prior election.
Potential Payments upon Termination or Change in Control
Kroger does not have employment agreements that provide for payments to the NEOs in connection with a
termination of employment or a change in control of Kroger. However, KEPP, award agreements for stock options,
restricted stock and performance units, the long-term cash incentive plans, and the long-term incentive plans under
which performance units are granted provide for certain payments and benefits to participants, including the NEOs,
in the event of a termination of employment or a change in control of Kroger, as defined in the applicable plan or
agreement. Our pension plan and nonqualified deferred compensation plan also provide for certain payments and
benefits to participants in the event of a termination of employment, as described above in the 2020 Pension
Benefits section and the 2020 Nonqualified Deferred Compensation section, respectively.
47
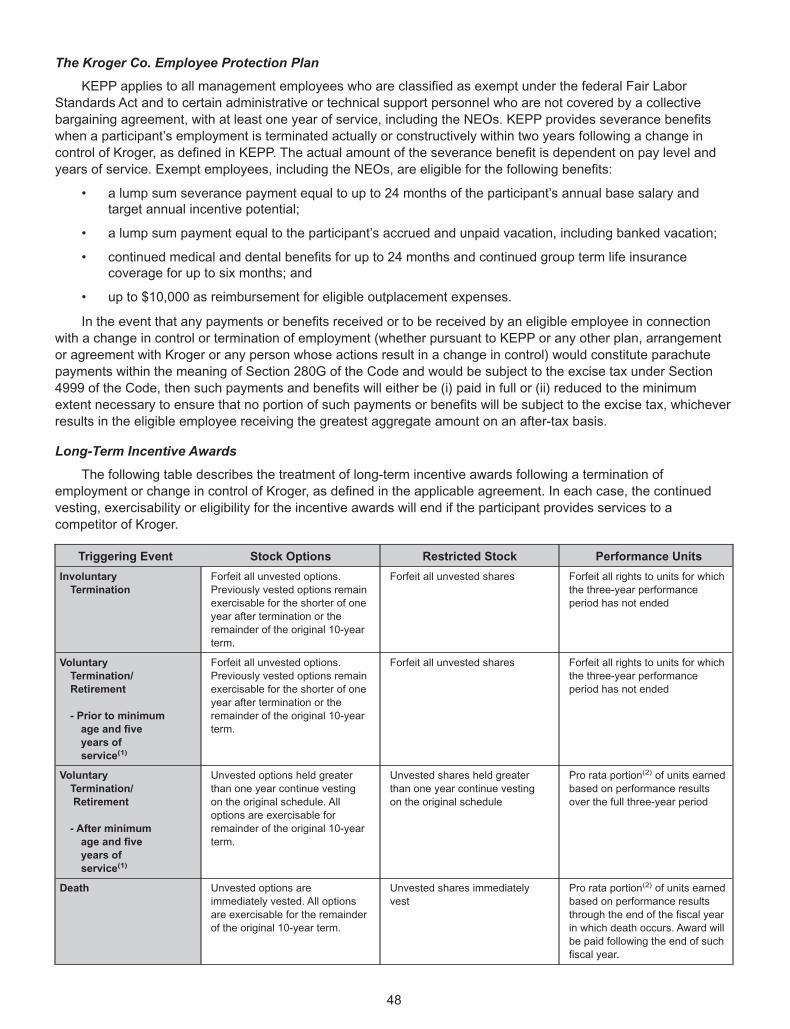
The Kroger Co. Employee Protection Plan
KEPP applies to all management employees who are classified as exempt under the federal Fair Labor
Standards Act and to certain administrative or technical support personnel who are not covered by a collective
bargaining agreement, with at least one year of service, including the NEOs. KEPP provides severance benefits
when a participant’s employment is terminated actually or constructively within two years following a change in
control of Kroger, as defined in KEPP. The actual amount of the severance benefit is dependent on pay level and
years of service. Exempt employees, including the NEOs, are eligible for the following benefits:
• a lump sum severance payment equal to up to 24 months of the participant’s annual base salary andtarget annual incentive potential;
• a lump sum payment equal to the participant’s accrued and unpaid vacation, including banked vacation;
• continued medical and dental benefits for up to 24 months and continued group term life insurancecoverage for up to six months; and
• up to $10,000 as reimbursement for eligible outplacement expenses.
In the event that any payments or benefits received or to be received by an eligible employee in connection
with a change in control or termination of employment (whether pursuant to KEPP or any other plan, arrangement
or agreement with Kroger or any person whose actions result in a change in control) would constitute parachute
payments within the meaning of Section 280G of the Code and would be subject to the excise tax under Section
4999 of the Code, then such payments and benefits will either be (i) paid in full or (ii) reduced to the minimum
extent necessary to ensure that no portion of such payments or benefits will be subject to the excise tax, whichever
results in the eligible employee receiving the greatest aggregate amount on an after-tax basis.
Long-Term Incentive Awards
The following table describes the treatment of long-term incentive awards following a termination of
employment or change in control of Kroger, as defined in the applicable agreement. In each case, the continued
vesting, exercisability or eligibility for the incentive awards will end if the participant provides services to a
competitor of Kroger.
Triggering Event Stock Options Restricted Stock Performance Units
Involuntary
Termination
Forfeit all unvested options.
Previously vested options remain
exercisable for the shorter of one
year after termination or the
remainder of the original 10-year
term.
Forfeit all unvested shares Forfeit all rights to units for which
the three-year performance
period has not ended
Voluntary
Termination/
Retirement
- Prior to minimum
age and five
years of
service(1)
Forfeit all unvested options.
Previously vested options remain
exercisable for the shorter of one
year after termination or the
remainder of the original 10-year
term.
Forfeit all unvested shares Forfeit all rights to units for which
the three-year performance
period has not ended
Voluntary
Termination/
Retirement
- After minimum
age and five
years of
service(1)
Unvested options held greater
than one year continue vesting
on the original schedule. All
options are exercisable for
remainder of the original 10-year
term.
Unvested shares held greater
than one year continue vesting
on the original schedule
Pro rata portion(2) of units earned
based on performance results
over the full three-year period
Death Unvested options are
immediately vested. All options
are exercisable for the remainder
of the original 10-year term.
Unvested shares immediately
vest
Pro rata portion(2) of units earned
based on performance results
through the end of the fiscal year
in which death occurs. Award will
be paid following the end of such
fiscal year.
48
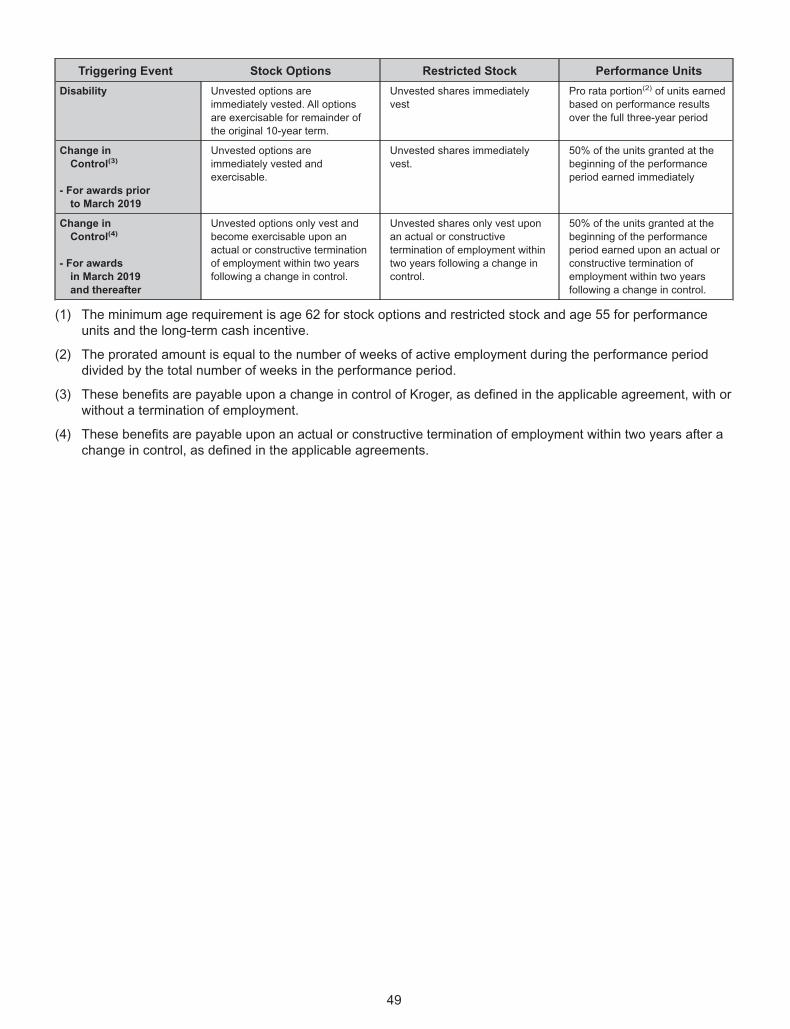
Triggering Event Stock Options Restricted Stock Performance Units
Disability Unvested options are
immediately vested. All options
are exercisable for remainder of
the original 10-year term.
Unvested shares immediately
vest
Pro rata portion(2) of units earned
based on performance results
over the full three-year period
Change in
Control(3)
- For awards prior
to March 2019
Unvested options are
immediately vested and
exercisable.
Unvested shares immediately
vest.
50% of the units granted at the
beginning of the performance
period earned immediately
Change in
Control(4)
- For awards
in March 2019
and thereafter
Unvested options only vest and
become exercisable upon an
actual or constructive termination
of employment within two years
following a change in control.
Unvested shares only vest upon
an actual or constructive
termination of employment within
two years following a change in
control.
50% of the units granted at the
beginning of the performance
period earned upon an actual or
constructive termination of
employment within two years
following a change in control.
(1) The minimum age requirement is age 62 for stock options and restricted stock and age 55 for performanceunits and the long-term cash incentive.
(2) The prorated amount is equal to the number of weeks of active employment during the performance perioddivided by the total number of weeks in the performance period.
(3) These benefits are payable upon a change in control of Kroger, as defined in the applicable agreement, with orwithout a termination of employment.
(4) These benefits are payable upon an actual or constructive termination of employment within two years after achange in control, as defined in the applicable agreements.
49
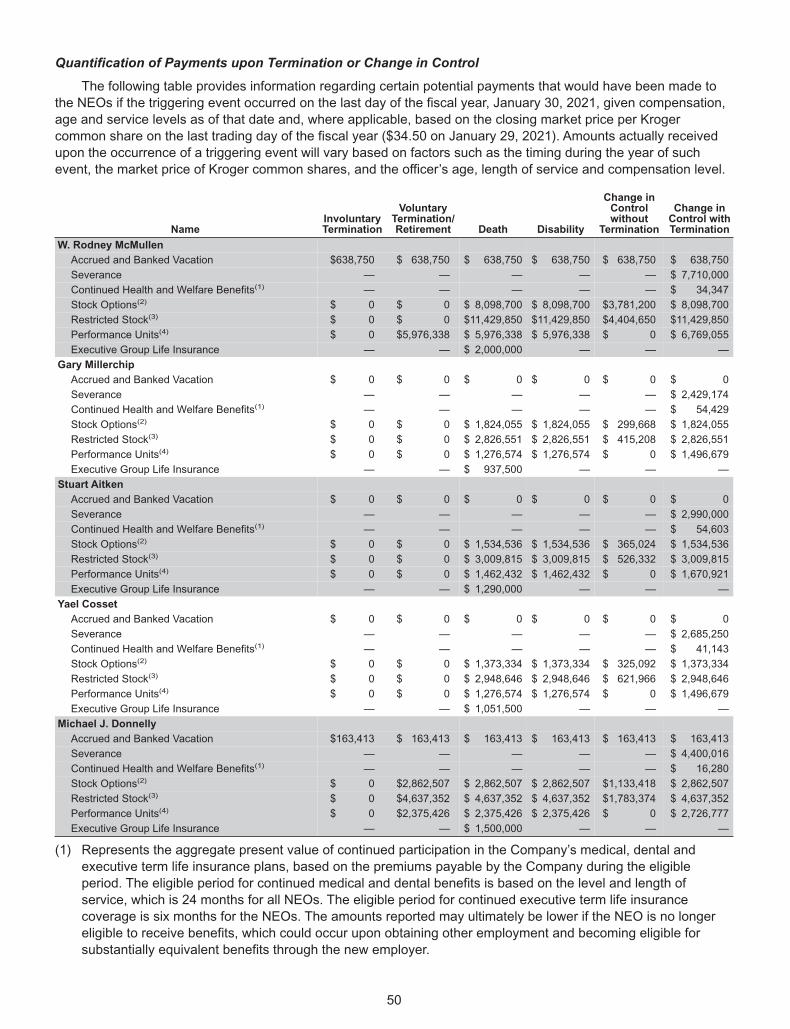
Quantification of Payments upon Termination or Change in Control
The following table provides information regarding certain potential payments that would have been made to
the NEOs if the triggering event occurred on the last day of the fiscal year, January 30, 2021, given compensation,
age and service levels as of that date and, where applicable, based on the closing market price per Kroger
common share on the last trading day of the fiscal year ($34.50 on January 29, 2021). Amounts actually received
upon the occurrence of a triggering event will vary based on factors such as the timing during the year of such
event, the market price of Kroger common shares, and the officer’s age, length of service and compensation level.
NameInvoluntaryTermination
VoluntaryTermination/Retirement Death Disability
Change inControlwithout
Termination
Change inControl withTermination
W. Rodney McMullen
Accrued and Banked Vacation $638,750 $ 638,750 $ 638,750 $ 638,750 $ 638,750 $ 638,750
Severance — — — — — $ 7,710,000
Continued Health and Welfare Benefits(1) — — — — — $ 34,347
Stock Options(2) $ 0 $ 0 $ 8,098,700 $ 8,098,700 $3,781,200 $ 8,098,700
Restricted Stock(3) $ 0 $ 0 $11,429,850 $11,429,850 $4,404,650 $11,429,850
Performance Units(4) $ 0 $5,976,338 $ 5,976,338 $ 5,976,338 $ 0 $ 6,769,055
Executive Group Life Insurance — — $ 2,000,000 — — —
Gary Millerchip
Accrued and Banked Vacation $ 0 $ 0 $ 0 $ 0 $ 0 $ 0
Severance — — — — — $ 2,429,174
Continued Health and Welfare Benefits(1) — — — — — $ 54,429
Stock Options(2) $ 0 $ 0 $ 1,824,055 $ 1,824,055 $ 299,668 $ 1,824,055
Restricted Stock(3) $ 0 $ 0 $ 2,826,551 $ 2,826,551 $ 415,208 $ 2,826,551
Performance Units(4) $ 0 $ 0 $ 1,276,574 $ 1,276,574 $ 0 $ 1,496,679
Executive Group Life Insurance — — $ 937,500 — — —
Stuart Aitken
Accrued and Banked Vacation $ 0 $ 0 $ 0 $ 0 $ 0 $ 0
Severance — — — — — $ 2,990,000
Continued Health and Welfare Benefits(1) — — — — — $ 54,603
Stock Options(2) $ 0 $ 0 $ 1,534,536 $ 1,534,536 $ 365,024 $ 1,534,536
Restricted Stock(3) $ 0 $ 0 $ 3,009,815 $ 3,009,815 $ 526,332 $ 3,009,815
Performance Units(4) $ 0 $ 0 $ 1,462,432 $ 1,462,432 $ 0 $ 1,670,921
Executive Group Life Insurance — — $ 1,290,000 — — —
Yael Cosset
Accrued and Banked Vacation $ 0 $ 0 $ 0 $ 0 $ 0 $ 0
Severance — — — — — $ 2,685,250
Continued Health and Welfare Benefits(1) — — — — — $ 41,143
Stock Options(2) $ 0 $ 0 $ 1,373,334 $ 1,373,334 $ 325,092 $ 1,373,334
Restricted Stock(3) $ 0 $ 0 $ 2,948,646 $ 2,948,646 $ 621,966 $ 2,948,646
Performance Units(4) $ 0 $ 0 $ 1,276,574 $ 1,276,574 $ 0 $ 1,496,679
Executive Group Life Insurance — — $ 1,051,500 — — —
Michael J. Donnelly
Accrued and Banked Vacation $163,413 $ 163,413 $ 163,413 $ 163,413 $ 163,413 $ 163,413
Severance — — — — — $ 4,400,016
Continued Health and Welfare Benefits(1) — — — — — $ 16,280
Stock Options(2) $ 0 $2,862,507 $ 2,862,507 $ 2,862,507 $1,133,418 $ 2,862,507
Restricted Stock(3) $ 0 $4,637,352 $ 4,637,352 $ 4,637,352 $1,783,374 $ 4,637,352
Performance Units(4) $ 0 $2,375,426 $ 2,375,426 $ 2,375,426 $ 0 $ 2,726,777
Executive Group Life Insurance — — $ 1,500,000 — — —
(1) Represents the aggregate present value of continued participation in the Company’s medical, dental and
executive term life insurance plans, based on the premiums payable by the Company during the eligible
period. The eligible period for continued medical and dental benefits is based on the level and length of
service, which is 24 months for all NEOs. The eligible period for continued executive term life insurance
coverage is six months for the NEOs. The amounts reported may ultimately be lower if the NEO is no longer
eligible to receive benefits, which could occur upon obtaining other employment and becoming eligible for
substantially equivalent benefits through the new employer.
50
(2) Amounts reported in the ‘‘Death, ‘‘Disability,’’ and ‘‘Change in Control’’ columns represent the intrinsic value ofthe accelerated vesting of unvested stock options, calculated as the difference between the exercise price ofthe stock option and the closing price per Kroger common share on January 29, 2021. A value of $0 isattributed to stock options with an exercise price greater than the market price on the last day of the fiscal year.In accordance with SEC rules, no amount is reported in the ‘‘Voluntary Termination/Retirement’’ columnbecause vesting is not accelerated, but the options may continue to vest on the original schedule if theconditions described above are met.
(3) Amounts reported in the Death, ‘‘Disability,’’ and ‘‘Change in Control’’ columns represent the aggregate valueof the accelerated vesting of unvested restricted stock. In accordance with SEC rules, no amount is reported inthe ‘‘Voluntary Termination/Retirement’’ column because vesting is not accelerated, but the restricted stockmay continue to vest on the original schedule if the conditions described above are met.
(4) Amounts reported in the ‘‘Voluntary Termination/Retirement,’’ ‘‘Death’’ and ‘‘Disability’’ columns represent theaggregate value of the performance units granted in 2019 and 2020, based on performance through the last day offiscal 2020 and prorated for the portion of the performance period completed. Amounts reported in the change incontrol column represent the aggregate value of 50% of the maximum number of performance units granted in2019 and 2020. Awards under the 2018 Long-Term Incentive Plan were earned as of the last day of 2020 so eachNEO age 55 or over was entitled to receive (regardless of the triggering event) the amount actually earned, which isreported in the Stock Awards column of the 2020 Option Exercises and Stock Vested Table.
CEO Pay Ratio
As required by Section 953(b) of the Dodd-Frank Wall Street Reform and Consumer Protection Act, and Item402(u) of Regulation S-K, we are providing the following information regarding the ratio of the annual totalcompensation of our Chairman and CEO, Mr. McMullen, to the annual total compensation of our median employee.
As reported in the Summary Compensation Table, our CEO had annual total compensation for 2020 of$22,373,574. Using this Summary Compensation Table methodology, the annual total compensation of our medianemployee for 2020 was $24,617. As a result, we estimate that the ratio of our CEO’s annual total compensation tothat of our median employee for fiscal 2020 was 909 to 1.
This pay ratio is a reasonable estimate calculated in a manner consistent with SEC rules based on our payrollrecords and the methodology described below. The SEC rules for identifying the median compensated employeeand calculating the pay ratio based on that employee’s annual total compensation allow companies to adopt avariety of methodologies, to apply certain exclusions, and to make reasonable estimates and assumptions thatreflect their compensation practices. As such, other companies may have different employment and compensationpractices and may utilize different methodologies, exclusions, estimates and assumptions in calculating their ownpay ratios. Therefore, the estimated pay ratio reported above may not be comparable to the pay ratios reported byother companies and should not be used as a basis for comparison between companies.
As required by SEC rules, we identified a new median employee in 2020 (after using the same medianemployee for 2017-2019) based on our employee population on the last day of our 12th fiscal period January 2,2021, which included full-time, part-time, temporary, and seasonal employees who were employed on that date, asthere were no changes in our employee population or compensation arrangements that we believe would havesignificantly affected our pay ratio calculation.
We then determined the median employee’s annual total compensation using the Summary CompensationTable methodology as detailed in Item 402(c)(2)(x) of Regulation S-K and compared it to the annual totalcompensation of Mr. McMullen as detailed in the ‘‘Total’’ column of the Summary Compensation Table for 2020, toarrive at the pay ratio disclosed above.
Item No. 2 Advisory Vote to Approve Executive Compensation
You are being asked to vote, on an advisory basis, to approve the compensation of our NEOs. The Board ofDirectors recommends that you vote FOR the approval of compensation of our NEOs.
The Dodd-Frank Wall Street Reform and Consumer Protection Act, enacted in July 2010, requires that we giveour shareholders the right to approve, on a nonbinding, advisory basis, the compensation of our NEOs as disclosedearlier in this proxy statement in accordance with the SEC’s rules.
As discussed earlier in the CD&A, our compensation philosophy is to attract and retain the best managementtalent and to motivate these associates to achieve our business and financial goals. Our incentive plans aredesigned to reward the actions that lead to long-term value creation. To achieve our objectives, we seek to ensure
51
that compensation is competitive and that there is a direct link between pay and performance. To do so, we are
guided by the following principles:
• A significant portion of pay should be performance-based, with the percentage of total pay tied toperformance increasing proportionally with an executive’s level of responsibility;
• Compensation should include incentive-based pay to drive performance, providing superior pay forsuperior performance, including both a short- and long-term focus;
• Compensation policies should include an opportunity for, and a requirement of, equity ownership to alignthe interests of executives and shareholders; and
• Components of compensation should be tied to an evaluation of business and individual performancemeasured against metrics that directly drive our business strategy.
The vote on this resolution is not intended to address any specific element of compensation. Rather, the vote
relates to the compensation of our NEOs as described in this proxy statement. The vote is advisory. This means
that the vote is not binding on Kroger. The Compensation Committee of the Board is responsible for establishing
executive compensation. In so doing, the Compensation Committee will consider, along with all other relevant
factors, the results of this vote.
We ask our shareholders to vote on the following resolution:
‘‘RESOLVED, that the compensation paid to the Company’s NEOs, as disclosed pursuant to Item 402 of
Regulation S-K, including the Compensation Discussion and Analysis, compensation tables, and the related
narrative discussion, is hereby APPROVED.’’
The next advisory vote will occur at our 2022 Annual Meeting.
The Board of Directors Recommends a Vote For This Proposal.
Item No. 3 Ratification of the Appointment of Kroger’s Independent Auditor
You are being asked to ratify the appointment of Kroger’s independent auditor, PricewaterhouseCoopersLLC. The Board of Directors recommends that you vote FOR the ratification of PricewaterhouseCoopersLLP as our independent registered public accounting firm.
The primary function of the Audit Committee is to assist the Board of Directors in fulfilling its oversightresponsibilities regarding the Company’s financial reporting and accounting practices including the integrity of theCompany’s financial statements; the Company’s compliance with legal and regulatory requirements; theindependent public accountants’ qualifications and independence; the performance of the Company’s internal auditfunction and independent public accountants; and the preparation of the Audit Committee Report. The AuditCommittee performs this work pursuant to a written charter approved by the Board of Directors. The AuditCommittee charter most recently was revised during fiscal 2012 and is available on the Company’s website atir.kroger.com under Investors – Governance – Committee Composition. The Audit Committee has implementedprocedures to assist it during the course of each fiscal year in devoting the attention that is necessary andappropriate to each of the matters assigned to it under the Audit Committee’s charter. The Audit Committee held 5meetings during fiscal year 2020.
Selection of Independent Auditor
The Audit Committee of the Board of Directors is directly responsible for the appointment, compensation,retention, and oversight of Kroger’s independent auditor, as required by law and by applicable NYSE rules. OnMarch 10, 2021, the Audit Committee appointed PricewaterhouseCoopers LLP as Kroger’s independent auditor forthe fiscal year ending January 29, 2022. PricewaterhouseCoopers LLP or its predecessor firm has been theCompany’s independent auditor since 1929.
In determining whether to reappoint the independent auditor, our Audit Committee:
• Reviews PricewaterhouseCoopers LLP’s independence and performance;
• Considers the tenure of the independent registered public accounting firm and safeguards around auditorindependence;
• Reviews, in advance, all non-audit services provided by PricewaterhouseCoopers LLP, specifically withregard to the effect on the firm’s independence;
52
• Conducts an annual assessment of PricewaterhouseCoopers LLP’s performance, including an internalsurvey of their service quality by members of management and the Audit Committee;
• Conducts regular executive sessions with PricewaterhouseCoopers LLP;
• Conducts regular executive sessions with the Vice President of Internal Audit;
• Considers PricewaterhouseCoopers LLP’s familiarity with our operations, businesses, accounting policiesand practices and internal control over financial reporting;
• Reviews candidates for the lead engagement partner in conjunction with the mandated rotation of thepublic accountants’ lead engagement partner;
• Reviews recent Public Company Accounting Oversight Board reports on PricewaterhouseCoopers LLPand its peer firms; and
• Obtains and reviews a report from PricewaterhouseCoopers LLP describing all relationships between theindependent auditor and Kroger at least annually to assess the independence of the internal auditor.
As a result, the members of the Audit Committee believe that the continued retention ofPricewaterhouseCoopers LLP to serve as our independent registered public accounting firm is in the best interestsof our Company and its shareholders.
While shareholder ratification of the selection of PricewaterhouseCoopers LLP as our independent auditor isnot required by Kroger’s Regulations or otherwise, the Board of Directors is submitting the selection ofPricewaterhouseCoopers LLP to shareholders for ratification, as it has in past years, as a good corporategovernance practice. If the shareholders fail to ratify the selection, the Audit Committee may, but is not required to,reconsider whether to retain that firm. Even if the selection is ratified, the Audit Committee in its discretion maydirect the appointment of a different auditor at any time during the year if it determines that such a change would bein the best interests of our Company and our shareholders.
A representative of PricewaterhouseCoopers LLP is expected to participate in the meeting to respond toappropriate questions and to make a statement if he or she desires to do so.
Audit and Non-Audit Fees
The following table presents the aggregate fees billed for professional services performed byPricewaterhouseCoopers LLP for the annual audit and quarterly reviews of our consolidated financial statementsfor fiscal 2020 and 2019, and for audit-related, tax and all other services performed in 2020 and 2019.
Fiscal Year Ended
January 30,2021
February 1,2020
Audit Fees(1) $5,294,700 $5,153,885
Audit-Related Fees $ 0 $ 0
All Other Fees(2) $ 900 $ 900
Total $5,295,600 $5,154,785
(1) Includes annual audit and quarterly reviews of Kroger’s consolidated financial statements, the issuance ofcomfort letters to underwriters, consents, and assistance with review of documents filed with the SEC.
(2) Includes use of accounting research tool.
The Audit Committee requires that it approve in advance all audit and non-audit work performed byPricewaterhouseCoopers LLP. Pursuant to the Audit Committee audit and non-audit service pre-approval policy, theCommittee will annually pre-approve certain defined services that are expected to be provided by the independentauditors. If it becomes appropriate during the year to engage the independent accountant for additional services,the Audit Committee must first approve the specific services before the independent accountant may perform theadditional work.
PricewaterhouseCoopers LLP has advised the Audit Committee that neither the firm, nor any member of thefirm, has any financial interest, direct or indirect, in any capacity in Kroger or its subsidiaries.
The Board of Directors Recommends a Vote For This Proposal.
53
Audit Committee Report
Management of the Company is responsible for the preparation and presentation of the Company’s financialstatements, the Company’s accounting and financial reporting principles and internal controls, and procedures thatare designed to provide reasonable assurance regarding compliance with accounting standards and applicablelaws and regulations. The independent public accountants are responsible for auditing the Company’s financialstatements and expressing opinions as to the financial statements’ conformity with generally accepted accountingprinciples and the effectiveness of the Company’s internal control over financial reporting.
In performing its functions, the Audit Committee:
• Met separately with the Company’s internal auditor and PricewaterhouseCoopers LLP with and withoutmanagement present to discuss the results of the audits, their evaluation and management’s assessmentof the effectiveness of Kroger’s internal controls over financial reporting and the overall quality of theCompany’s financial reporting;
• Met separately with the Company’s Chief Financial Officer or the Company’s General Counsel whenneeded;
• Met regularly in executive sessions;
• Reviewed and discussed with management the audited financial statements included in our AnnualReport;
• Discussed with PricewaterhouseCoopers LLP the matters required to be discussed under the applicablerequirements of the Public Company Accounting Oversight Board and the SEC; and
• Received the written disclosures and the letter from PricewaterhouseCoopers LLP required by theapplicable requirements of the Public Accounting Oversight Board regarding the independent publicaccountant’s communication with the Audit Committee concerning independence and discussed thematters related to their independence.
Based upon the review and discussions described in this report, the Audit Committee recommended to theBoard of Directors that the audited consolidated financial statements be included in the Company’s Annual Reporton Form 10-K for the year ended January 30, 2021, as filed with the SEC.
This report is submitted by the Audit Committee.Anne Gates, ChairKevin M. BrownKaren M. HoguetRonald L. Sargent
54
Item No. 4 Shareholder Proposal – Recyclability of Packaging
We have been notified by two shareholders, the name and shareholdings of which will be furnished promptly to
any shareholder upon written or oral request to Kroger’s Secretary at our executive offices, that it intends to
propose the following resolution at the annual meeting:
‘‘WHEREAS: The ocean plastics crisis continues unabated, fatally impacting more than 800 marine species,
and causing up to $2.5 trillion in damage annually to marine ecosystems. Toxins adhere to plastics consumed by
marine species, which potentially transfer to human diets. There could be more plastic than fish by weight in
oceans by 2050.
Recently, Pew Charitable Trusts released a groundbreaking study, Breaking the Plastic Wave, which
concluded that if all current industry and government commitments were met, ocean plastic deposition would be
reduced by only 7%. Without immediate and sustained new commitments throughout the plastics value chain,
annual flow of plastic into oceans could nearly triple by 2040.
The report finds that improved recycling will not be sufficient to stem the plastic tide, and must be coupled with
upstream activities like reduction in demand, materials redesign, and substitution. ‘‘Brand owners, fast-moving
consumer goods companies and retailers should lead the transition by committing to reduce at least one-third of
plastic demand through elimination, reuse, and new delivery models,’’ the report states, adding that reducing plastic
production is the most attractive solution from environmental, economic, and social perspectives.
More than 250 companies have committed to take a variety of actions through the Ellen MacArthur Foundation
Global Commitment that will reduce plastic pollution. Kroger is notably absent from this historic corporate
coordination. The company is one of the worst performing in packaging data transparency – lacking disclosure of
key data such as tonnage of overall plastic used and the number of units of plastic packaging put into commerce.
Global Commitment signatory Unilever has taken the most significant corporate action to date, agreeing to cut
plastic packaging use overall by 100,000 tons by 2025. Signatory PepsiCo has committed to substitute recycled
content for 35% of virgin plastic in its beverage division. Kroger has no new significant commitment to cut plastic
use, nor a commitment to build a circular economy through incorporation of recycled content plastic.
The company received a score of D in an As You Sow study ranking corporate leadership on plastic pollution.
This ranking demonstrates that Kroger lags in its commitments, specifically on transparent reporting, incorporating
recycled content plastic, and making overall cuts in plastic packaging.
BE IT RESOLVED: Shareholders request that the board of directors issue a report by December 2021 on
plastic packaging, estimating the amount of plastics released to the environment by our use of plastic packaging,
from the manufacture of plastic source materials, through disposal or recycling, and describing any company
strategies or goals to reduce the use of plastic packaging to reduce these impacts.
SUPPORTING STATEMENT: Proponents note that the report should be prepared at reasonable cost, omitting
confidential information, and include an assessment of the reputational, financial, and operational risks associated
with continuing to use substantial amounts of plastic packaging while plastic pollution grows unabated. In the
board’s discretion, the report could also evaluate opportunities for dramatically reducing the amount of plastics
used in our packaging through redesign or substitution.’’
The Board of Directors Recommends a Vote Against This Proposal for the Following Reasons:
As Kroger’s 2020 sustainability goals officially conclude, we are focused on the future and how our company
can continue to create more positive outcomes for people and the planet. To shape our focus in the next decade,
we have set multiple new commitments as well as extended existing commitments to shape our work. In 2020, we
launched new 2030 Sustainable Packaging Goals for all Our Brands products, with the objectives of reducing
packaging pollution, improving end-of-life management for packaging, and driving demand for recycling through our
material choices and customer engagement.
Our 2030 packaging goals can be found here: https://www.thekrogerco.com/wp-content/uploads/2020/06/The-
Kroger-Co_Sustainable-Packaging-Goals_2020.pdf.
55
We will report Kroger’s final progress on our 2020 sustainability goals in our 2021 Environmental, Social &Governance (ESG) report. Key achievements in 2020 are highlighted below:
• Kroger has achieved more than 15 million pounds of reductions in plastic resin in the packaging used inKroger’s manufacturing plants, greatly surpassing our goal to reduce plastic by 10 million pounds since2015. Most recently, we removed more than 20% of the plastic in a portion of our purified drinking waterproducts, equating to more than 2 million pounds of plastic reduced annually.
• In 2020, we transitioned our Simple Truth chicken breasts from an expanded polystyrene (EPS) tray—amaterial with few recycling end markets and of concern to many customers—to a polyethyleneterephthalate (PET) tray, which is more widely recyclable in curbside collection programs. This and otherchanges in progress will benefit our packaging recyclability goals.
• In addition to the plastic film recycling program we offer in the vestibules of our stores, in 2020 Krogerlaunched a new recycling mail-back program in partnership with TerraCycle. This solution allowscustomers to mail flexible plastic packaging for popular Simple Truth® items back to TerraCycle forconvenient, safe, and effective recycling. To date, more than 4,600 collection points have been activatedto mail back plastic packaging like chip bags, snack pouches, and frozen food packaging – all of whichcan’t be recycled in curbside recycling programs.
• Kroger’s Zero Hunger | Zero Waste Foundation is a supporter of the Polypropylene Recycling Coalition,spearheaded by The Recycling Partnership to invest in material recovery facilities (MRF) to facilitateimproved collection capacity for polypropylene plastics.
• We added post-consumer recycled (PCR) content to Simple Truth® product packaging, including 25%PCR content in honey bottles and multiple hair care products. We also added 25% post-consumerrecycled content to water bottles sold in multiple markets.
• We added ‘Please Recycle’ to additional product packages in 2020 – for a total of more than 4,800 itemscurrently showing this message. Kroger also joined the How2Recycle program so that we can providewidely recognized recycling instructions for Our Brands products moving forward.
• As reported in our CDP Forests response in 2020, about 80% of paper products purchased in our plantsare certified to the FSC, SFI and/or PEFC standards. Our final No-Deforestation Commitment reflects ourgoals to achieve this fully across the Our Brands portfolio.
Recognizing that our customers’ interest in sustainable packaging will continue to evolve, in 2019 we becamethe exclusive U.S. grocery retail partner for Loop, an innovative circular packaging platform that aligns withKroger’s zero-waste vision by reducing single-use plastics in the environment. We are working with our CPGpartners and Our Brands team to pilot this new packaging system in select Kroger-operated stores in 2021.
Kroger was also the first major U.S. grocery retailer to commit to phase out the use of single-use plasticgrocery shopping bags across the country by 2025. Recognizing the complexity of finding the right network ofalternative solutions for our customers, Kroger was pleased to join the Beyond the Bag Initiative as the GrocerySector Lead in 2020. In a partnership with other leading retailers convened by Closed Loop Partners, Kroger issupporting the development of alternatives to the single-use plastic grocery bag.
During 2021, we are building on the packaging tracking work we are finalizing for our Kroger Manufactureditems to create a packaging baseline for Kroger’s Our Brands portfolio. In parallel, we continue to exploreopportunities to reduce unnecessary packaging, to increase recycled content and to improve recyclability in ourpackaging—all with the goal of reducing plastic pollution from our packaging.
For the foregoing reasons, we urge you to vote AGAINST this proposal.
56
Shareholder Proposals and Director Nominations – 2022 Annual Meeting
Pursuant to Rule 14a-8 under the Securities Exchange Act of 1934, as amended, shareholder proposalsintended for inclusion in the proxy material relating to Kroger’s annual meeting of shareholders in June 2022 shouldbe addressed to Kroger’s Secretary and must be received at our executive offices not later than January 13, 2022.These proposals must comply with Rule 14a-8 and the SEC’s proxy rules. If a shareholder submits a proposaloutside of Rule 14a-8 for the 2022 annual meeting and such proposal is not delivered within the time framespecified in the Regulations, Kroger’s proxy may confer discretionary authority on persons being appointed asproxies on behalf of Kroger to vote on such proposal.
In addition, Kroger’s Regulations contain an advance notice of shareholder business and director nominationsrequirement, which generally prescribes the procedures that a shareholder of Kroger must follow if the shareholderintends, at an annual meeting, to nominate a person for election to Kroger’s Board of Directors or to propose otherbusiness to be considered by shareholders. These procedures include, among other things, that the shareholdergive timely notice to Kroger’s Secretary of the nomination or other proposed business, that the notice containspecified information, and that the shareholder comply with certain other requirements. In order to be timely, thisnotice must be delivered in writing to Kroger’s Secretary, at our principal executive offices, not later than45 calendar days prior to the date on which our proxy statement for the prior year’s annual meeting of shareholderswas mailed to shareholders. If a shareholder’s nomination or proposal is not in compliance with the procedures setforth in the Regulations, we may disregard such nomination or proposal. Accordingly, if a shareholder intends, atthe 2022 Annual Meeting, to nominate a person for election to the Board of Directors or to propose other business,the shareholder must deliver a notice of such nomination or proposal to Kroger’s Secretary not later than March 29,2022 and comply with the requirements of the Regulations.
Eligible shareholders may also submit director nominees for inclusion in our proxy statement for the 2022annual meeting of shareholders. To be eligible, shareholders must have owned at least three percent of ourcommon shares for at least three years. Up to 20 shareholders will be able to aggregate for this purpose.Nominations must be submitted to our Corporate Secretary at our principal executive offices no earlier thanDecember 14, 2021 and no later than January 13, 2022.
Shareholder proposals, director nominations, including, if applicable pursuant to proxy access, and advancenotices must be addressed in writing, and addressed and delivered timely to: Corporate Secretary, The Kroger Co.,1014 Vine Street, Cincinnati, Ohio 45202-1100.
57
Householding of Proxy Materials
We have adopted a procedure approved by the SEC called ‘‘householding.’’ Under this procedure,shareholders of record who have the same address and last name will receive only one copy of the Notice ofAvailability of Proxy Materials (or proxy materials in the case of shareholders who receive paper copies of suchmaterials) unless one or more of these shareholders notifies us that they wish to continue receiving individualcopies. This procedure will reduce our printing costs and postage fees. Householding will not in any way affectdividend check mailings.
If you are eligible for householding, but you and other shareholders of record with whom you share an addresscurrently receive multiple copies of our Notice of Availability of Proxy Materials (or proxy materials in the case ofshareholders who receive paper copies of such materials), or if you hold in more than one account, and in eithercase you wish to receive only a single copy for your household or if you prefer to receive separate copies of ourdocuments in the future, please contact your bank or broker, or contact Kroger’s Secretary at 1014 Vine Street,Cincinnati, Ohio 45202 or via telephone at 513-762-4000.
Beneficial shareholders can request information about householding from their banks, brokers or other holdersof record.
The management knows of no other matters that are to be presented at the meeting, but, if any should bepresented, the Proxy Committee expects to vote thereon according to its best judgment.
By order of the Board of Directors,Christine S. Wheatley, Secretary
58
2020 ANNUAL REPORT

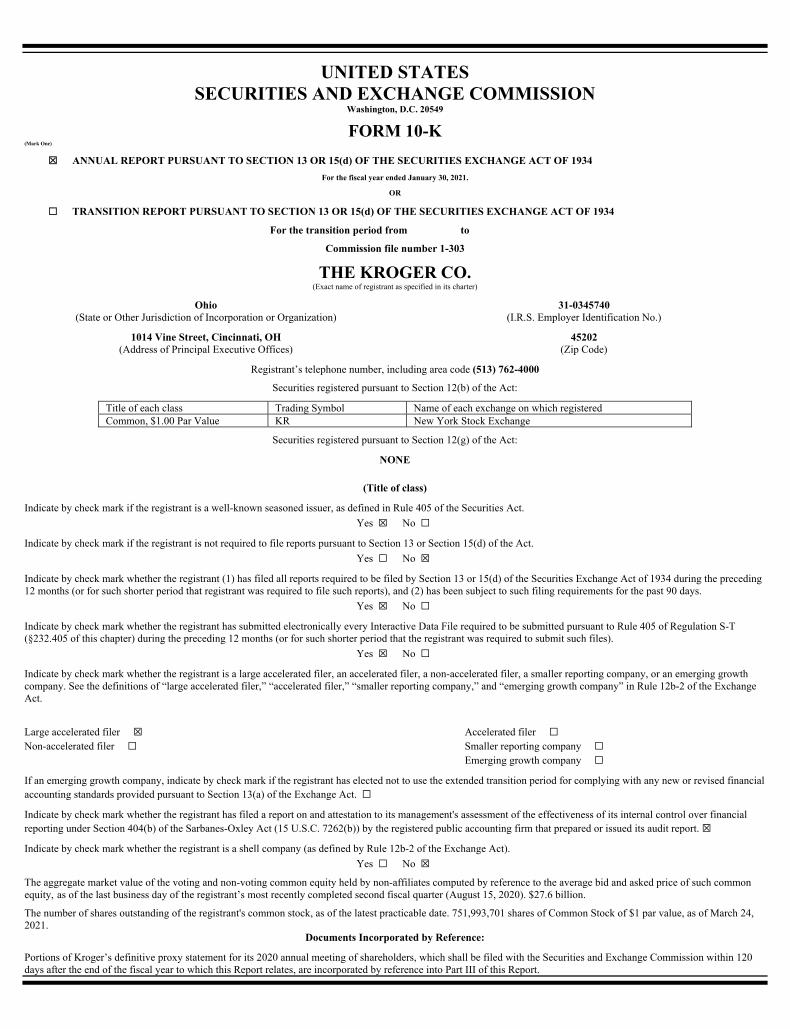
UNITED STATES SECURITIES AND EXCHANGE COMMISSION
Washington, D.C. 20549
FORM 10-K (Mark One)
☒ ANNUAL REPORT PURSUANT TO SECTION 13 OR 15(d) OF THE SECURITIES EXCHANGE ACT OF 1934
For the fiscal year ended January 30, 2021.
OR
☐ TRANSITION REPORT PURSUANT TO SECTION 13 OR 15(d) OF THE SECURITIES EXCHANGE ACT OF 1934
For the transition period from to
Commission file number 1-303
THE KROGER CO. (Exact name of registrant as specified in its charter)
Ohio 31-0345740 (State or Other Jurisdiction of Incorporation or Organization) (I.R.S. Employer Identification No.)
1014 Vine Street, Cincinnati, OH 45202 (Address of Principal Executive Offices) (Zip Code)
Registrant’s telephone number, including area code (513) 762-4000
Securities registered pursuant to Section 12(b) of the Act:
Title of each class Trading Symbol Name of each exchange on which registered Common, $1.00 Par Value KR New York Stock Exchange
Securities registered pursuant to Section 12(g) of the Act:
NONE
(Title of class)
Indicate by check mark if the registrant is a well-known seasoned issuer, as defined in Rule 405 of the Securities Act.
Yes ☒ No ☐
Indicate by check mark if the registrant is not required to file reports pursuant to Section 13 or Section 15(d) of the Act.
Yes ☐ No ☒
Indicate by check mark whether the registrant (1) has filed all reports required to be filed by Section 13 or 15(d) of the Securities Exchange Act of 1934 during the preceding 12 months (or for such shorter period that registrant was required to file such reports), and (2) has been subject to such filing requirements for the past 90 days.
Yes ☒ No ☐
Indicate by check mark whether the registrant has submitted electronically every Interactive Data File required to be submitted pursuant to Rule 405 of Regulation S-T (§232.405 of this chapter) during the preceding 12 months (or for such shorter period that the registrant was required to submit such files).
Yes ☒ No ☐
Indicate by check mark whether the registrant is a large accelerated filer, an accelerated filer, a non-accelerated filer, a smaller reporting company, or an emerging growth company. See the definitions of “large accelerated filer,” “accelerated filer,” “smaller reporting company,” and “emerging growth company” in Rule 12b-2 of the Exchange Act.
Large accelerated filer ☒ Accelerated filer ☐ Non-accelerated filer ☐ Smaller reporting company ☐ Emerging growth company ☐
If an emerging growth company, indicate by check mark if the registrant has elected not to use the extended transition period for complying with any new or revised financial accounting standards provided pursuant to Section 13(a) of the Exchange Act. ☐
Indicate by check mark whether the registrant has filed a report on and attestation to its management's assessment of the effectiveness of its internal control over financial reporting under Section 404(b) of the Sarbanes-Oxley Act (15 U.S.C. 7262(b)) by the registered public accounting firm that prepared or issued its audit report. ☒
Indicate by check mark whether the registrant is a shell company (as defined by Rule 12b-2 of the Exchange Act).
Yes ☐ No ☒
The aggregate market value of the voting and non-voting common equity held by non-affiliates computed by reference to the average bid and asked price of such common equity, as of the last business day of the registrant’s most recently completed second fiscal quarter (August 15, 2020). $27.6 billion.
The number of shares outstanding of the registrant's common stock, as of the latest practicable date. 751,993,701 shares of Common Stock of $1 par value, as of March 24, 2021.
Documents Incorporated by Reference:
Portions of Kroger’s definitive proxy statement for its 2020 annual meeting of shareholders, which shall be filed with the Securities and Exchange Commission within 120 days after the end of the fiscal year to which this Report relates, are incorporated by reference into Part III of this Report.

The Kroger Co. Form 10-K
For the Fiscal Year Ended January 30, 2021
Table of Contents
Page Part I 2 Item 1 Business 3 Item 1A Risk Factors 9 Item 1B Unresolved Staff Comments 16 Item 2 Properties 16 Item 3 Legal Proceedings 16 Item 4 Mine Safety Disclosures 16 Part II 17 Item 5 Market for Registrant’s Common Equity, Related Stockholder Matters and Issuer Purchases of Equity
Securities 17
Item 6 Selected Financial Data 20 Item 7 Management’s Discussion and Analysis of Financial Condition and Results of Operations 21 Item 7A Quantitative and Qualitative Disclosures About Market Risk 43 Item 8 Financial Statements and Supplementary Data 44 Item 9 Changes in and Disagreements with Accountants on Accounting and Financial Disclosure 95 Item 9A Controls and Procedures 95 Item 9B Other Information 95 Part III 96 Item 10 Directors, Executive Officers and Corporate Governance 96 Item 11 Executive Compensation 96 Item 12 Security Ownership of Certain Beneficial Owners and Management and Related Stockholder Matters 96 Item 13 Certain Relationships and Related Transactions, and Director Independence 97 Item 14 Principal Accounting Fees and Services 97 Part IV 98 Item 15 Exhibits, Financial Statement Schedules 98 Item 16 Form 10-K Summary 100
Signatures 101
2
PART I
FORWARD LOOKING STATEMENTS.
This Annual Report on Form 10-K contains forward-looking statements about our future performance. These statements are based on our assumptions and beliefs in light of the information currently available to us. These statements are subject to a number of known and unknown risks, uncertainties and other important factors, including the risks and other factors discussed in “Risk Factors” below, that could cause actual results and outcomes to differ materially from any future results or outcomes expressed or implied by such forward looking statements. Such statements are indicated by words such as “achieve,” “affect,” “believe,” “committed,” “continue,” “could,” “deliver,” “effect,” “estimate,” “expects,” “future,” “growth,” “intends,” “likely,” “may,” “model,” “plan,” “position,” “range,” “result,” “strategy,” “strong,” “trend,” “will” and “would,” and similar words or phrases. Moreover, statements in the sections entitled Risk Factors, Management’s Discussion and Analysis of Financial Condition and Results of Operations (“MD&A”), and elsewhere in this report regarding our expectations, projections, beliefs, intentions or strategies are forward-looking statements within the meaning of Section 21E of the Securities Exchange Act of 1934, as amended.
Various uncertainties and other factors could cause actual results to differ materially from those contained in the
forward-looking statements. These include:
The extent to which our sources of liquidity are sufficient to meet our requirements may be affected by the state of the financial markets and the effect that such condition has on our ability to issue commercial paper at acceptable rates. Our ability to borrow under our committed lines of credit, including our bank credit facilities, could be impaired if one or more of our lenders under those lines is unwilling or unable to honor its contractual obligation to lend to us, or in the event that global pandemics, including the COVID-19 pandemic, natural disasters or weather conditions interfere with the ability of our lenders to lend to us. Our ability to refinance maturing debt may be affected by the state of the financial markets.
Our ability to achieve sales, earnings, incremental FIFO operating profit, and adjusted free cash flow goals may be affected by: COVID-19 related factors, risks and challenges, including among others, the length of time that the pandemic continues, the temporary inability of customers to shop due to illness, quarantine, or other travel restrictions or financial hardship, shifts in demand away from discretionary or higher priced products to lower priced products, or stockpiling or similar pantry-filling activities, reduced workforces which may be caused by, but not limited to, the temporary inability of the workforce to work due to illness, quarantine, or government mandates, temporary store closures due to reduced workforces or government mandates, or the availability and efficacy of a vaccine; labor negotiations or disputes; changes in the types and numbers of businesses that compete with Kroger; pricing and promotional activities of existing and new competitors, including non-traditional competitors, and the aggressiveness of that competition; Kroger's response to these actions; the state of the economy, including interest rates, the inflationary and deflationary trends in certain commodities, changes in tariffs, and the unemployment rate; the effect that fuel costs have on consumer spending; volatility of fuel margins; changes in government-funded benefit programs and the extent and effectiveness of any COVID-19 stimulus packages; manufacturing commodity costs; diesel fuel costs related to Kroger's logistics operations; trends in consumer spending; the extent to which our customers exercise caution in their purchasing in response to economic conditions; the uncertainty of economic growth or recession; changes in inflation or deflation in product and operating costs; stock repurchases; our ability to retain pharmacy sales from third-party payors; consolidation in the healthcare industry, including pharmacy benefit managers; our ability to negotiate modifications to multi-employer pension plans; natural disasters or adverse weather conditions; the effect of public health crises or other significant catastrophic events, including the coronavirus; the potential costs and risks associated with potential cyber-attacks or data security breaches; the success of our future growth plans; the ability to execute our growth strategy and value creation model, including continued cost savings, growth of our alternative profit businesses, and widening and deepening our strategic moats of fresh, Our Brands, personalization, and seamless; and the successful integration of merged companies and new partnerships.
Our ability to achieve these goals may also be affected by our ability to manage the factors identified above. Our ability to execute our financial strategy may be affected by our ability to generate cash flow.
Our effective tax rate may differ from the expected rate due to changes in laws, the status of pending items with various taxing authorities, and the deductibility of certain expenses.
3
We cannot fully foresee the effects of changes in economic conditions on our business. Other factors and assumptions not identified above, including those discussed in Part 1, Item 1A of this Annual
Report, could also cause actual results to differ materially from those set forth in the forward-looking information. Accordingly, actual events and results may vary significantly from those included in, contemplated or implied by forward-looking statements made by us or our representatives. We undertake no obligation to update the forward-looking information contained in this filing. ITEM 1. BUSINESS.
The Kroger Co. (the “Company” or “Kroger”) was founded in 1883 and incorporated in 1902. As of January 30, 2021, we are one of the largest retailers in the world based on annual sales. We also manufacture and process some of the food for sale in our supermarkets. We maintain a web site (www.thekrogerco.com) that includes the Kroger Fact Book and other additional information about the Company. Kroger’s website and any reports or other information made available by Kroger through its website are not part of or incorporated by reference into this Annual Report on Form 10-K. We make available through our web site, free of charge, our annual reports on Form 10-K, our quarterly reports on Form 10-Q, our current reports on Form 8-K and our interactive data files, including amendments. These forms are available as soon as reasonably practicable after we have filed them with, or furnished them electronically to, the SEC.
Our revenues are predominately earned and cash is generated as consumer products are sold to customers in our stores, fuel centers and via our online platforms. We earn income predominantly by selling products at price levels that produce revenues in excess of the costs to make these products available to our customers. Such costs include procurement and distribution costs, facility occupancy and operational costs and overhead expenses. Our fiscal year ends on the Saturday closest to January 31. All references to 2020, 2019 and 2018 are to the fiscal years ended January 30, 2021, February 1, 2020 and February 2, 2019, respectively, unless specifically indicated otherwise. STORES
As of January 30, 2021, Kroger operated, either directly or through its subsidiaries, 2,742 supermarkets under a variety of local banner names, of which 2,255 had pharmacies and 1,596 had fuel centers. We offer Pickup (also referred to as ClickList®) and Harris Teeter ExpressLane™— personalized, order online, pick up at the store services — at 2,223 of our supermarkets and provide home delivery service to substantially all of Kroger households. Approximately 51% of our supermarkets were operated in Company-owned facilities, including some Company-owned buildings on leased land. Our stores operate under a variety of banners that have strong local ties and brand recognition. Fuel sales are an important part of our revenue, net earnings and loyalty offering. Our fuel strategy is to include a fuel center at each of our supermarket locations when it is feasible and it is expected to be profitable. Each fuel center typically includes 5 to 10 islands of fuel dispensers and storage tanks with capacity for 40,000 to 50,000 gallons of fuel. Supermarkets are generally operated under one of the following formats: combination food and drug stores (“combo stores”); multi-department stores; marketplace stores; or price impact warehouses.
The combo store is the primary food store format. They typically draw customers from a 2-2.5 mile radius. We believe this format is successful because the stores are large enough to offer the specialty departments that customers desire for one-stop shopping, including natural food and organic sections, pharmacies, general merchandise, pet centers and high-quality perishables such as fresh seafood and organic produce.
Multi-department stores are significantly larger in size than combo stores. In addition to the departments offered at
a typical combo store, multi-department stores sell a wide selection of general merchandise items such as apparel, home fashion and furnishings, outdoor living, electronics, automotive products and toys.
Marketplace stores are smaller in size than multi-department stores. They offer full-service grocery, pharmacy and
health and beauty care departments as well as an expanded perishable offering and general merchandise area that includes apparel, home goods and toys.
4
Price impact warehouse stores offer a “no-frills, low cost” warehouse format and feature everyday low prices plus promotions for a wide selection of grocery and health and beauty care items. Quality meat, dairy, baked goods and fresh produce items provide a competitive advantage. The average size of a price impact warehouse store is similar to that of a combo store. SEGMENTS
We operate supermarkets and multi-department stores throughout the United States. Our retail operations, which represent 97% of our consolidated sales, is our only reportable segment. We aggregate our operating divisions into one reportable segment due to the operating divisions having similar economic characteristics with similar long-term financial performance. In addition, our operating divisions offer customers similar products, have similar distribution methods, operate in similar regulatory environments, purchase the majority of the merchandise for retail sale from similar (and in many cases identical) vendors on a coordinated basis from a centralized location, serve similar types of customers, and are allocated capital from a centralized location. Our operating divisions are organized primarily on a geographical basis so that the operating division management team can be responsive to local needs of the operating division and can execute company strategic plans and initiatives throughout the locations in their operating division. This geographical separation is the primary differentiation between these retail operating divisions. The geographical basis of organization reflects how the business is managed and how our Chief Executive Officer, who acts as our chief operating decision maker, assesses performance internally. All of our operations are domestic. Revenues, profits and losses and total assets are shown in our Consolidated Financial Statements set forth in Item 8 below. MERCHANDISING AND MANUFACTURING
Our Brands products play an important role in our merchandising strategy. Our supermarkets, on average, stock over 15,000 private label items. Our Brands products are primarily produced and sold in three “tiers.” Private Selection® is one of our premium quality brands, offering customers culinary foods and ingredients that deliver amazing eating experiences. The Kroger® brand, which represents the majority of our private label items, is designed to consistently satisfy and delight customers with quality products that exceed or meet the national brand in taste and efficacy, as well as with unique and differentiated products. Big K®, Check This Out…® and Heritage Farm® are some of our value brands, designed to deliver good quality at a very affordable price. In addition to our three “tiers,” Our Brands offers customers a variety of natural and organic products with Simple Truth® and Simple Truth Organic®. Both Simple Truth and Simple Truth Organic are free from a defined list of artificial ingredients that customers have told us they do not want in their food, and the Simple Truth Organic products are USDA certified organic.
Approximately 29% of Our Brands units and 40% of the grocery category Our Brands units sold in our
supermarkets are produced in our food production plants; the remaining Our Brands items are produced to our strict specifications by outside manufacturers. We perform a “make or buy” analysis on Our Brands products and decisions are based upon a comparison of market-based transfer prices versus open market purchases. As of January 30, 2021, we operated 35 food production plants. These plants consisted of 16 dairies, 9 deli or bakery plants, five grocery product plants, two beverage plants, one meat plant and two cheese plants.
SEASONALITY
The majority of our revenues are generally not seasonal in nature. However, revenues tend to be higher during the major holidays throughout the year. Additionally, certain significant events including inclement weather systems, particularly winter storms, tend to affect our sales trends. HUMAN CAPITAL MANAGEMENT
Our People
We want Kroger to be a place our customers love to shop and associates love to work. This is why we create working environments where associates feel encouraged and supported to be their best selves every day. As of January 30, 2021, Kroger employed approximately 465,000 full- and part-time employees. With these nearly half a million associates serving more than nine million customers every day, our people are essential to our success, and we focus intentionally on attracting, developing and engaging a diverse workforce that represents the communities we serve. We have long been guided by our core values – Honesty, Integrity, Respect, Safety, Diversity and Inclusion.
5
Attracting & Developing Our Talent
We recognize that our people are our most important asset. To deliver on our customers’ experiences, we continually improve how we attract and retain talent. In addition to competitive wages, quality benefits, and a safe work environment, we offer a broad range of employment opportunities for workers of all ages and aspirations. During the past decade, Kroger has added 100,000 new jobs in communities across America. Many supermarket roles offer opportunities to learn new skills, grow and advance careers — inside or outside our family of companies.
Associates at all levels of the Company have access to training and education programs to build their skills and prepare for the roles they want. In 2021, we expect to spend approximately $125 million on training our associates through onboarding, leadership development programs, and programs designed to upskill associates across the Company. We continue to invest in new platforms and applications to make learning more accessible to our associates.
Beyond our own programs, associates can take advantage of our tuition reimbursement benefit, which offers up to $3,500 annually — $21,000 over the course of employment — toward continuing education. These funds can be applied to education programs like certifications, associate or graduate degrees. Kroger has invested more than $15 million in this program since it launched in 2018.
Rewarding Our Associates
We care about our associates’ overall well-being — physical, financial and emotional — and provide wages and benefits that help associates take care of themselves and their families. Between 2018 and 2020, we invested an incremental $800 million in associate wages. Since 2018, Kroger’s average retail hourly wage increased to over $15 per hour. Including benefit equivalents, the average rate surpasses $20 per hour.
Promoting Diversity, Equity & Inclusion
Diversity and inclusion have been among Kroger’s values for decades. We strive to reflect the communities we serve and foster a culture that empowers everyone to be their true self, inspires collaboration, and feeds the human spirit. During the past year, we have taken a very thoughtful and purposeful approach to enact meaningful change and develop what we believe are the right actions to achieve true and lasting equality. Our new Framework for Action: Diversity, Equity & Inclusion plan reflects our desire to redefine, deepen, and advance our commitment, mobilizing our people, passion, scale and resources. The following summarizes our framework: Create a More Inclusive Culture; Develop Diverse Talent; Advance Diverse Partnerships; Advance Equitable Communities; Deeply Listen and Report Progress.
Creating a Safe Environment
Our associates’ safety is a top priority and it is one of our core values. Since March of 2020, we have made significant investments to reward and safeguard our associates and customers. At the onset of the COVID-19 pandemic, we activated our Pandemic Preparedness Plan and Business Resilience Plan to help protect frontline associates, stay open to serve our customers and communities, and anticipate and adapt to critical needs in a rapidly changing situation. Since then, we have enacted more than 30 policy changes to help keep our associates safe, including offering paid emergency leave to those most directly affected by COVID-19, providing personal protective equipment, offering free testing through our COVID-19 at-home test kits, and promoting physical distancing in our locations. We are committed to supporting the health and well-being of our associates by providing a robust range of physical and mental health benefits and offering an incentive to associates who choose to get the COVID-19 vaccine.
Beyond the pandemic, we prioritize providing the right safety training and equipment, safe working conditions and resources to maintain and improve associates’ well-being. Through our strategy to set clear expectations, routine monitoring, and regular communication and engagement, we reduce the number of injuries and accidents that happen in our workplace.
6
We track health and safety metrics centrally for an enterprise-wide view of issues, trends and opportunities and monitor associate injury performance including total injuries, Occupational Safety and Health Administration (“OSHA”) injury rates, and lost-time injuries, as well as customer injury metrics like slip-and-fall injuries. We also track the completion of required training for associates and we regularly share these metrics with leaders and relevant team members to inform management decisions.
Supporting Labor Relations
A majority of our employees are covered by collective bargaining agreements negotiated with local unions affiliated
with one of several different international unions. There are approximately 350 such agreements, usually with terms of three to five years. Our objective in every negotiation is to find a fair and reasonable balance on compensation packages that provide solid wages as well as good quality, affordable health care and retirement benefits while also keeping our family of companies competitive in the market.
INFORMATION ABOUT OUR EXECUTIVE OFFICERS
The following is a list of the names and ages of the executive officers and the positions held by each such person. Except as otherwise noted, each person has held office for at least five years. Each officer will hold office at the discretion of the Board for the ensuing year until removed or replaced.
Name Age Recent Employment History Mary E. Adcock 45 Ms. Adcock was elected Senior Vice President effective May 1, 2019 and is
responsible for retail operations as well as the oversight of several Kroger retail divisions. From June 2016 to April 2019, she served as Group Vice President of Retail Operations. Prior to that, she served as Vice President of Operations for Kroger’s Columbus Division from November 2015 to May 2016 and as Vice President of Merchandising for the Columbus Division from March 2014 to November 2015. From February 2012 to March 2014, Ms. Adcock served as Vice President of Natural Foods Merchandising and from October 2009 to February 2012, she served as Vice President of Deli/Bakery Manufacturing. Prior to that, Ms. Adcock held several leadership positions in the manufacturing department, including human resources manager, general manager and division operations manager. Ms. Adcock joined Kroger in 1999 as human resources assistant manager at the Country Oven Bakery in Bowling Green, Kentucky.
Stuart W. Aitken 49 Mr. Aitken was named Senior Vice President and Chief Merchant and Marketing
Officer in August 2020. He was elected Senior Vice President in February 2019 and served as Group Vice President from June 2015 to February 2019. He is responsible for sales, pricing, promotional and category planning for fresh foods, center store and general merchandise categories, as well as analytics & execution, e-commerce and Digital Merchandising, and Our Brands. Prior to joining Kroger, he served as the chief executive officer of dunnhumby USA, LLC from July 2010 to June 2015. Mr. Aitken has over 15 years of marketing, academic and technical experience across a variety of industries, and held various leadership roles with other companies, including Michaels Stores and Safeway, Inc.
7
Gabriel Arreaga 46 Mr. Arreaga was elected Senior Vice President of Supply Chain in December 2020. He is responsible for the company’s industry-leading Supply Chain organization, Logistics, Inventory & Replenishment, Manufacturing, and Fulfillment Centers. Prior to Kroger, Mr. Arreaga served as senior vice president of Supply Chains for Mondelez, where he was responsible for all operations and functions from field to consumer, internal and external factories, fulfillment centers, direct to store branches, Logistics and product development. He was also global vice president of Operations for Stanley Black and Decker and held numerous leadership roles at Unilever including vice president of Food and Beverage Operations.
Yael Cosset 47 Mr. Cosset was elected Senior Vice President and Chief Information Officer in May
2019 and is responsible for leading Kroger’s digital strategy, focused on building Kroger’s presence in the marketplace in digital channels, personalization and e-commerce. In August 2020, he also assumed responsibility for Kroger’s alternative profit businesses, including Kroger’s data analytics subsidiary, 84.51 ͦ LLC and Kroger Personal Finance. Prior to that, Mr. Cosset served as Group Vice President and Chief Digital Officer from January 2017 to April 2019. Before that, he served as Chief Commercial Officer and Chief Information Officer of 84.51° LLC from April 2015 to December 2016. Prior to joining Kroger, Mr. Cosset served in several leadership roles at dunnhumby USA, LLC from 2009 to 2015, including Executive Vice President of Consumer Markets and Global Chief Information Officer.
Michael J. Donnelly 62 Mr. Donnelly was elected Executive Vice President and Chief Operating Officer in
December 2017. Prior to that, he was Executive Vice President of Merchandising from September 2015 to December 2017, and Senior Vice President of Merchandising from July 2011 to September 2015. Before that, Mr. Donnelly held a variety of key management positions with Kroger, including President of Ralphs Grocery Company, President of Fry’s Food Stores, and Senior Vice President, Drug/GM Merchandising and Procurement. Mr. Donnelly joined Kroger in 1978 as a clerk. Mr. Donnelly has announced his plan to retire in Spring of 2021.
Carin L. Fike 52 Ms. Fike was elected Vice President and Treasurer effective April 2017. Prior to
that, she served as Assistant Treasurer from March 2011 to April 2017. Before that, Ms. Fike served as Director of Investor Relations from December 2003 to March 2011. Ms. Fike began her career with Kroger in 1999 as a manager in the Financial Reporting department after working with PricewaterhouseCoopers from 1995 to 1999, where most recently she was an audit manager.
Todd A. Foley 51 Mr. Foley was elected Vice President and Corporate Controller effective April 2017.
Before that, he served as Vice President and Treasurer from June 2013 to April 2017. Prior to that, Mr. Foley served as Assistant Corporate Controller from March 2006 to June 2013, and Controller of Kroger’s Cincinnati/Dayton division from October 2003 to March 2006. Mr. Foley began his career with Kroger in 2001 as an audit manager in the Internal Audit Department after working for PricewaterhouseCoopers from 1991 to 2001, where most recently he was a senior audit manager.
8
Calvin J. Kaufman 58 Mr. Kaufman was elected Senior Vice President in June 2017, and is responsible for the oversight of several Kroger retail divisions. From July 2013 to June 2017, he served as President of the Louisville division. Prior to that, he served as President of Kroger Manufacturing and Our Brands from June 2008 to June 2013, and Group Vice President of Fred Meyer Logistics from September 2005 to May 2008. Mr. Kaufman held various positions in Logistics after joining Kroger in the Fred Meyer division in September 1994.
Timothy A. Massa 54 Mr. Massa was elected Senior Vice President of Human Resources and Labor
Relations in June 2018. Prior to that, he served as Group Vice President of Human Resources and Labor Relations from June 2014 to June 2018. Mr. Massa joined Kroger in October 2010 as Vice President, Corporate Human Resources and Talent Development. Prior to joining Kroger, he served in various Human Resources leadership roles for 21 years at Procter & Gamble, most recently serving as Global Human Resources Director of Customer Business Development.
Stephen M. McKinney 64 Mr. McKinney was elected Senior Vice President in March 2018, and is responsible
for the oversight of several Kroger retail divisions. From October 2013 to March 2018, he served as President of Kroger’s Fry’s Food Stores division. Prior to that, he served as Vice President of Operations for the Ralphs division from October 2007 to September 2013, and Vice President of Operations for the Southwest division from October 2006 to September 2007. From 1988 to 1998, Mr. McKinney served in various leadership positions in the Fry’s Food Stores division, including store manager, deli director, and executive director of operations. From 1981 to 1998, Mr. McKinney held several roles with Florida Choice Supermarkets, a former Kroger banner, including store manager, buyer, and field representative. He started his career with Kroger in 1981 as a clerk with Florida Choice.
W. Rodney McMullen 60 Mr. McMullen was elected Chairman of the Board effective January 1, 2015, and
Chief Executive Officer effective January 1, 2014. Prior to that, he served as President and Chief Operating Officer from August 2009 to December 2013. Prior to that he was elected Vice Chairman in June 2003, Executive Vice President, Strategy, Planning and Finance in January 2000, Executive Vice President and Chief Financial Officer in May 1999, Senior Vice President in October 1997, and Group Vice President and Chief Financial Officer in June 1995. Before that he was appointed Vice President, Control and Financial Services in March 1993, and Vice President, Planning and Capital Management in December 1989. Mr. McMullen joined Kroger in 1978 as a part-time stock clerk.
Gary Millerchip 49 Mr. Millerchip was elected Senior Vice President and Chief Financial Officer
effective April 2019. Prior to this, he served as Chief Executive Officer for Kroger Personal Finance since joining Kroger in 2008. Before coming to Kroger he was responsible for the Royal Bank of Scotland (RBS) Personal Credit Card business in the United Kingdom. He joined RBS in 1987 and held leadership positions in Sales & Marketing, Finance, Change Management, Retail Banking Distribution Strategy and Branch Operations during his time there.
9
Erin S. Sharp 63 Ms. Sharp has served as Group Vice President of Manufacturing since June 2013. She joined Kroger in 2011 as Vice President of Operations for Kroger’s Manufacturing division. Before joining Kroger, Ms. Sharp served as Vice President of Manufacturing for the Sara Lee Corporation. In that role, she led the manufacturing and logistics operations for the central region of their U.S. Fresh Bakery Division. Ms. Sharp has over 30 years of experience supporting food manufacturing operations. Ms. Sharp has announced her plan to retire in Spring of 2021.
Mark C. Tuffin 61 Mr. Tuffin has served as Senior Vice President since January 2014, and is
responsible for the oversight of several of Kroger’s retail divisions. Prior to that, he served as President of Kroger’s Smith’s division from July 2011 to January 2014. From September 2009 to July 2011, Mr. Tuffin served as Vice President of Transition, where he was responsible for implementing an organizational restructuring initiative for Kroger’s retail divisions. He joined Kroger’s Smith’s division in 1996 and served in a series of leadership roles, including Vice President of Merchandising from September 1999 to September 2009. Mr. Tuffin held various positions with other supermarket retailers before joining Smith’s in 1996.
Christine S. Wheatley 50 Ms. Wheatley was elected Group Vice President, Secretary and General Counsel in
May 2014. She joined Kroger in February 2008 as Corporate Counsel, and became Senior Attorney in 2010, Senior Counsel in 2011, and Vice President in 2012. Before joining Kroger, Ms. Wheatley was engaged in the private practice of law for 11 years, most recently as a partner at Porter Wright Morris & Arthur in Cincinnati.
COMPETITIVE ENVIRONMENT
For the disclosure related to our competitive environment, see Item 1A under the heading “Competitive Environment.” ITEM 1A. RISK FACTORS.
There are risks and uncertainties that can affect our business. The significant risk factors are discussed below. The following information should be read together with “Management’s Discussion and Analysis of Financial Condition and Results of Operations,” which includes forward-looking statements and factors that could cause us not to realize our goals or meet our expectations.
COMPETITIVE ENVIRONMENT
The operating environment for the food retailing industry continues to be characterized by intense price competition,
expansion, increasing fragmentation of retail and online formats, entry of non-traditional competitors and market consolidation. Customer behavior shifted quickly and considerably during the pandemic, including a shift from food away from home to food at home. We see three major trends shaping the industry post-pandemic: e-commerce, cooking at home and prepared foods to go. If we do not appropriately or accurately anticipate customer preferences or fail to quickly adapt to these changing preferences, or if trends shift more quickly to food away from home, our sales and profitability could be adversely affected. If we fail to meet the evolving needs of our customers, our ability to compete and our financial condition, results of operations or cash flows could be adversely affected.
10
We are continuing to enhance the customer connection with investments in our four competitive moats – Seamless, Personalization, Fresh, and Our Brands. Each of these are strategic differentiators and each one is designed to generate customer loyalty and sustainable growth momentum. We believe our plans to deepen and strengthen our competitive moats provide a balanced approach that will enable us to meet the wide-ranging needs and expectations of our customers. If we are unable to continue to enhance the foregoing key elements of our connection with customers, or they fail to strengthen customer loyalty, our ability to compete and our financial condition, results of operations or cash flows could be adversely affected. Our ecosystem monetizes the traffic and data insights generated by our enhanced customer experience. We are using our assets in new ways through these fast-growing, asset-light and margin rich businesses. We may be unsuccessful in implementing our alternative profit strategy, which could adversely affect our market share and business growth, and our financial condition, results of operations or cash flows. The nature and extent to which our competitors respond to the evolving and competitive industry by developing and implementing their competitive strategies could adversely affect our profitability.
In addition, evolving customer preferences and the advancement of online, delivery, ship to home, and mobile
channels in our industry enhance the competitive environment. We must anticipate and meet these evolving customer preferences and continue to implement technology, software and processes to be able to conveniently and cost-effectively fulfill customer orders. Providing flexible fulfillment options and implementing new technology is complex and may not meet customer preferences. If we are not successful in reducing or offsetting the cost of fulfilling orders outside of our traditional in-store channel with efficiencies, cost-savings, expense reductions, or alternative revenues, our financial condition, results of operations or cash flows could be adversely affected.
In addition, if we do not successfully develop and maintain a relevant digital experience for our customers, our
business, financial condition, results of operations or cash flows could be adversely impacted. Digital retailing is rapidly evolving, and we must keep pace with new developments by our competitors as well as the evolving needs and preferences of our customers. Our digital business accelerated significantly during the COVID-19 pandemic including Pickup, Delivery and Ship. We must compete by offering a convenient shopping experience for our customers regardless of how they choose to shop with us, and by investing in, providing and maintaining relevant customer-facing apps and interfaces that have the features customers want that are also reliable and easy to use. The future success of the digital business will also depend on the efficiency and cost effectiveness of fulfilling orders across our modalities, whether in store, in pickup-only locations, and through customer fulfillment centers powered by Ocado. PRODUCT SAFETY
Customers count on Kroger to provide them with safe food and drugs and other merchandise. Concerns regarding
the safety of the products that we sell could cause shoppers to avoid purchasing certain products from us, or to seek alternative sources of supply even if the basis for the concern is outside of our control. Any lost confidence on the part of our customers would be difficult and costly to reestablish. We could be adversely affected by personal injury or project liability claims, product recalls, or other health and safety issues. If we sell products that cause illness or injury to customers, resulting from product contamination or spoilage, the presence of certain substances, or damage caused in handling, storage or transportation, we could be exposed to claims or litigation. Any issue regarding the safety of items whether Our Brands items manufactured by the company or for the company or CPG products we sell, regardless of the cause, could have a substantial and adverse effect on our reputation, financial condition, results of operations or cash flows.
EMPLOYEE MATTERS
A majority of our associates are covered by collective bargaining agreements with unions, and our relationship with
those unions, including a prolonged work stoppage affecting a substantial number of locations, could have a material adverse effect on our financial condition, results of operations or cash flows. We are a party to approximately 350 collective bargaining agreements. Upon the expiration of our collective bargaining agreements, work stoppages by the affected workers could occur if we are unable to negotiate new contracts with labor unions. In addition, changes to national labor policy could affect labor relations with our associates and relationships with unions. Further, if we are unable to control health care, pension and wage costs, or if we have insufficient operational flexibility under our collective bargaining agreements, we may experience increased operating costs and an adverse effect on our financial condition, results of operations or cash flows.
11
We are committed to paying fair wages and providing the benefits that were collectively bargained with the United Food and Commercial Workers (“UFCW”) and other labor unions representing associates. Our ability to control labor and benefit costs is subject to numerous internal and external factors, including regulatory changes, wage rates, and healthcare and other insurance costs. Changes to wage regulations, including further increases in the minimum wage and extra pay ordinances enacted by local governments, could have an impact on our future financial condition, results of operations or cash flows. Our ability to meet our labor needs, while controlling wages and other costs, is subject to numerous external factors, including the available qualified workforce in each area where we are located, unemployment levels within those areas, wage rates, and changes in employment and labor laws.
Our continued success depends on the ongoing contributions of our associates, including members of our senior
management and other key personnel. We must recruit, hire, develop and retain qualified associates with an increasingly large range of skills to meet the needs of our evolving and complex business. We compete with other retail and non-retail businesses for these associates and invest significant resources in training and motivating them. Competition among potential employers could result in increased associate costs, or in our failure to recruit and retain associates. There is no assurance that we will be able to attract or retain sufficient highly qualified associates in the future, which could have a material adverse effect on our business, financial condition, results of operations or cash flows.
DATA AND TECHNOLOGY
Our business is increasingly dependent on information technology systems that are complex and vital to continuing
operations, resulting in an expansion of our technological presence and corresponding risk exposure. If we were to experience difficulties maintaining or operating existing systems or implementing new systems, we could incur significant losses due to disruptions in our operations.
Through our sales and marketing activities, we collect and store some personal information that our customers
provide to us. We also gather and retain information about our associates in the normal course of business. Under certain circumstances, we may share information with vendors that assist us in conducting our business, as required by law, or otherwise in accordance with our privacy policy.
Our technology systems are vulnerable to disruption from circumstances beyond our control, and we regularly
defend against and respond to data security incidents. Cyber-attackers have targeted and accessed, and may in the future again attempt to target and access, information stored in our or our vendors’ systems in order to misappropriate confidential customer or business information. Although we have implemented procedures to protect our information, and require our vendors to do the same, we cannot be certain that our security systems will successfully defend against, or be able to effectively respond to, rapidly evolving, increasingly sophisticated cyber-attacks as they become more difficult to detect and defend against. Further, a Kroger associate, a contractor or other third party with whom we do business may in the future circumvent our security measures in order to obtain information or may inadvertently cause a breach involving information. In addition, hardware, software or applications we may use may have inherent defects, vulnerabilities, or could be inadvertently or intentionally applied or used in a way that could compromise our information security.
12
Our cybersecurity program, continued investment in our information technology systems, and our processes to evaluate and select vendors with reasonable information security controls may not effectively insulate us from potential attacks, data breaches or disruptions to our business operations, which could result in a loss of customers or business information, negative publicity, damage to our reputation, and exposure to claims from customers, financial institutions, regulatory authorities, payment card associations, associates and other persons. Any such events could have an adverse effect on our business, financial condition, results of operations or cash flows and may not be covered by our insurance. In addition, compliance with privacy and information security laws and standards may result in significant expense due to increased investment in technology and the development of new operational processes and may require us to devote significant management resources to address these issues. The costs of attempting to protect against the foregoing risks and the costs of responding to cyber-attacks are significant. Following a cyber-attack, our and/or our vendors’ remediation efforts may not be successful, and a cyber-attack could result in interruptions, delays or cessation of service, and loss of existing or potential customers. In addition, breaches of our and/or our vendors’ security measures and the unauthorized dissemination of sensitive personal information or confidential information about us or our customers could expose our customers’ private information and our customers to the risk of financial or medical identity theft, or expose us or other third parties to a risk of loss or misuse of this information, and result in investigations, regulatory enforcement actions, material fines and penalties, loss of customers and business relationships, litigation or other actions which could have a material adverse effect on our brands, reputation, business, financial condition, results of operations or cash flows.
Data governance failures can adversely affect our reputation and business. Our business depends on our customers’
willingness to entrust us with their personal information. Events that adversely affect that trust, including inadequate disclosure to our customers of our uses of their information, failing to keep our information technology systems and our customers’ sensitive information secure from significant attack, theft, damage, loss or unauthorized disclosure or access, whether as a result of our action or inaction (including human error) or that of our business associates, vendors or other third parties, could adversely affect our brand and reputation and operating results and also could expose and/or has exposed us to mandatory disclosure to the media, litigation (including class action litigation), governmental investigations and enforcement proceedings, material fines, penalties and/or remediation costs, and compensatory, special, punitive and statutory damages, consent orders, and/or injunctive relief, any of which could adversely affect our businesses, financial condition, results of operations or cash flows. Large scale data breaches at other entities, including supply chain security vulnerabilities, increase the challenge we and our vendors face in maintaining the security of our information technology systems and proprietary information and of our customers’ information. There can be no assurance that such failures will not occur, or if any do occur, that we will detect them or that they can be sufficiently remediated.
The use of data by our business and our business associates is highly regulated. Privacy and information-security
laws and regulations change, and compliance with them may result in cost increases due to, among other things, systems changes and the development of new processes. If we or those with whom we share information fail to comply with laws and regulations, such as the California Consumer Privacy Act (CCPA) or the Health Insurance Portability and Accountability Act (HIPAA), our reputation could be damaged, possibly resulting in lost business, and we could be subjected to additional legal risk or financial losses as a result of non-compliance.
PAYMENT SYSTEMS
We accept payments using a variety of methods, including cash and checks, select credit and debit cards, and
Kroger Pay, a mobile payment solution. As we offer new payment options to our customers, we may be subject to additional rules, regulations, compliance requirements, and higher fraud losses. For certain payment methods, we pay interchange and other related acceptance fees, along with additional transaction processing fees. We rely on third parties to provide payment transaction processing services for credit and debit cards. It could disrupt our business if these companies become unwilling or unable to provide these services to us, including due to short term disruption of service. We are also subject to evolving payment card association and network operating rules, including data security rules, certification requirements and rules governing electronic funds transfers. For example, we are subject to Payment Card Industry Data Security Standards (“PCI DSS”), which contain compliance guidelines and standards with regard to our security surrounding the physical and electronic storage, processing and transmission of individual cardholder data. If our payment card terminals or internal systems are breached or compromised, we may be liable for card re-issuance costs and other costs, subject to fines and higher transaction fees, and lose our ability to accept card payments from our members, or if our third-party service providers’ systems are breached or compromised, our business, financial condition, results of operations or cash flows could be adversely affected.
13
INDEBTEDNESS Our indebtedness could reduce our ability to obtain additional financing for working capital, mergers and
acquisitions or other purposes and could make us vulnerable to future economic downturns as well as competitive pressures. If debt markets do not permit us to refinance certain maturing debt, we may be required to dedicate a substantial portion of our cash flow from operations to payments on our indebtedness. Changes in our credit ratings, or in the interest rate environment, could have an adverse effect on our financing costs and structure.
LEGAL PROCEEDINGS AND INSURANCE
From time to time, we are a party to legal proceedings, including matters involving personnel and employment
issues, personal injury, contract disputes, regulatory claims and other proceedings. Other legal proceedings purport to be brought as class actions on behalf of similarly situated parties. Some of these proceedings could result in a substantial loss to Kroger. We estimate our exposure to these legal proceedings and establish accruals for the estimated liabilities, where it is reasonably possible to estimate and where an adverse outcome is probable. Assessing and predicting the outcome of these matters involves substantial uncertainties. Adverse outcomes in these legal proceedings, or changes in our evaluations or predictions about the proceedings, could have a material adverse effect on our financial condition, results of operations or cash flows. Please also refer to the “Litigation” section in Note 13 to the Consolidated Financial Statements.
We use a combination of insurance and self-insurance to provide for potential liability for workers’ compensation,
automobile and general liability, property, director and officers’ liability, cyber risk exposure and associate health care benefits. Any actuarial projection of losses is subject to a high degree of variability. With respect to insured matters, we are liable for retention amounts that vary by the nature of the claim, and some losses may not be covered by insurance. Changes in legal claims, trends and interpretations, variability in inflation rates, changes in the nature and method of claims settlement, benefit level changes due to changes in applicable laws, insolvency of insurance carriers, and changes in discount rates could all affect our financial condition, results of operations or cash flows.
MULTI-EMPLOYER PENSION OBLIGATIONS
As discussed in more detail below in “Management’s Discussion and Analysis of Financial Condition and Results of
Operations-Critical Accounting Policies-Multi-Employer Pension Plans,” Kroger contributes to several multi-employer pension plans based on obligations arising under collective bargaining agreements with unions representing associates covered by those agreements. We believe that the present value of actuarially accrued liabilities in most of these multi-employer plans substantially exceeds the value of the assets held in trust to pay benefits, and we expect that Kroger’s contributions to those funds will increase over the next few years. A significant increase to those funding requirements could adversely affect our financial condition, results of operations or cash flows. Despite the fact that the pension obligations of these funds are not the liability or responsibility of the Company, except as noted below, there is a risk that the agencies that rate our outstanding debt instruments could view the underfunded nature of these plans unfavorably, or adjust their current views unfavorably, when determining their ratings on our debt securities. Any downgrading of our debt ratings likely would adversely affect our cost of borrowing and access to capital.
We also currently bear the investment risk of two multi-employer pension plans in which we participate. In
addition, we have been designated as the named fiduciary of these funds with sole investment authority of the assets of these funds. If investment results fail to meet our expectations, we could be required to make additional contributions to fund a portion of or the entire shortfall, which could have an adverse effect on our business, financial condition, results of operations or cash flows.
14
INTEGRATION OF NEW BUSINESS AND STRATEGIC ALLIANCES We enter into mergers, acquisitions and strategic alliances with expected benefits including, among other things,
operating efficiencies, procurement savings, innovation, sharing of best practices and increased market share that may allow for future growth. Achieving the anticipated or desired benefits may be subject to a number of significant challenges and uncertainties, including, without limitation, whether unique corporate cultures will work collaboratively in an efficient and effective manner, the coordination of geographically separate organizations, the possibility of imprecise assumptions underlying expectations regarding potential synergies, capital requirements, and the integration process, unforeseen expenses and delays, and competitive factors in the marketplace. We could also encounter unforeseen transaction and integration-related costs or other circumstances such as unforeseen liabilities or other issues. Many of these potential circumstances are outside of our control and any of them could result in increased costs, decreased revenue, decreased synergies and the diversion of management time and attention. If we are unable to achieve our objectives within the anticipated time frame, or at all, the expected benefits may not be realized fully or at all, or may take longer to realize than expected, which could have an adverse effect on our business, financial condition, results of operations or cash flows.
FUEL
We sell a significant amount of fuel in our 1,596 fuel centers, which could face increased regulation, including due
to climate change or other environmental concerns, and demand could be affected by concerns about the effect of emissions on the environment as well as retail price increases. We are unable to predict future regulations, environmental effects, political unrest, acts of terrorism, disruptions to the economy, including but not limited to the COVID-19 pandemic, and other matters that may affect the cost and availability of fuel, and how our customers will react to such factors, which could adversely affect our financial condition, results of operations or cash flows.
ECONOMIC CONDITIONS
Our operating results could be materially impacted by changes in overall economic conditions that impact consumer
confidence and spending, including discretionary spending. Future economic conditions affecting disposable consumer income such as employment levels, business conditions, changes in housing market conditions, the availability of credit, interest rates, tax rates and other matters could reduce consumer spending. Increased fuel prices could also have an effect on consumer spending and on our costs of producing and procuring products that we sell. We are unable to predict how the global economy and financial markets will perform. If the global economy and financial markets do not perform as we expect, it could adversely affect our financial condition, results of operations or cash flows.
WEATHER, NATURAL DISASTERS AND OTHER EVENTS
A large number of our stores and distribution facilities are geographically located in areas that are susceptible to
hurricanes, tornadoes, floods, droughts and earthquakes. Weather conditions and natural disasters could disrupt our operations at one or more of our facilities, interrupt the delivery of products to our stores, substantially increase the cost of products, including supplies and materials and substantially increase the cost of energy needed to operate our facilities or deliver products to our facilities. Moreover, the effects of climate change, including those associated with extreme weather events, may affect our ability to procure needed commodities at costs and in quantities that are optimal for us or at all. Adverse weather, natural disasters, geo-political and catastrophic events, such as war, civil unrest, acts of terrorism or other acts of violence, including active shooter situations (which have occurred in the past at our locations), or pandemics, such as the spread of the novel coronavirus, COVID-19, or other future pandemics and other matters that could reduce consumer spending, could materially affect our financial condition, results of operations or cash flows.
15
COVID-19 The global COVID-19 pandemic continues to affect our business. A full year into the pandemic, many factors and
uncertainties remain, including:
the continuing concerns about the health of, and the effect on our associates, and our ability to meet staffing needs in our stores, distribution facilities, corporate offices and other critical functions;
the ultimate duration of the pandemic, including whether there will be additional spikes in the number of COVID-19 cases, future mutations or related strains of the virus;
the duration, degree and effectiveness of governmental measures, such as access to unemployment
compensation, stimulus payments, and other fiscal policy changes;
the timing and availability of, and prevalence of access to and utilization of, effective medical treatments and timely rollout of vaccinations for COVID-19;
evolving macroeconomic factors, including general economic uncertainty, unemployment rates, and
recessionary pressures;
the impact of the pandemic on economic activity and the pace and extent of recovery when the pandemic subsides, which may vary materially over time and among the different regions and markets we serve;
the extent and duration of the effect on consumer confidence, economic well-being, spending, customer
demand, buying patterns and shopping behaviors, including spend on discretionary categories, which often include higher margin products, and increased utilization of online sales channels, both during and after the pandemic; and
the long-term impact of the pandemic on our business, including consumer behaviors.
In addition, we cannot predict with certainty the extent of the impact that COVID-19 will have on our customers,
suppliers, vendors, and other business partners, and each of their financial conditions; however, any material adverse effect on these parties could materially and adversely impact us. To the extent that COVID-19 continues to affect the U.S. and global economy and our business, it may also heighten other risks described in this section, including but not limited to those related to consumer behavior and expectations, competition, implementation of strategic initiatives, cybersecurity threats, payment-related risks, supply chain disruptions, labor availability and cost, litigation and operational risk as a result of regulatory requirements.
GOVERNMENT REGULATION
Our stores are subject to various laws, regulations, and administrative practices that affect our business. We must
comply with numerous provisions regulating, among other things, health and sanitation standards, food labeling and safety, equal employment opportunity, minimum wages, licensing for the sale of food, drugs, and alcoholic beverages, and new provisions relating to the COVID-19 pandemic. We cannot predict future laws, regulations, interpretations, administrative orders, or applications, or the effect they will have on our operations. They could, however, significantly increase the cost of doing business. They also could require the reformulation of some of the products that we sell (or manufacture for sale to third parties) to meet new standards. We also could be required to recall or discontinue the sale of products that cannot be reformulated. These changes could result in additional record keeping, expanded documentation of the properties of certain products, expanded or different labeling, or scientific substantiation. Any or all of these requirements could have an adverse effect on our financial condition, results of operations or cash flows.
16
SUPPLY CHAIN Disruption in our global supply chain could negatively impact our business. The products we sell are sourced from a
wide variety of domestic and international vendors, and any future disruption in our supply chain or inability to find qualified vendors and access products that meet requisite quality and safety standards in a timely and efficient manner could adversely impact our business. The loss or disruption of such supply arrangements for any reason, labor disputes, loss or impairment of key manufacturing sites, acts of war or terrorism, quality control issues, a supplier’s financial distress, natural disasters or health crises, regulatory actions or ethical sourcing issues, trade sanctions or other external factors over which we have no control, could interrupt product supply and, if not effectively managed and remedied, have a material adverse impact on our business, financial condition, results of operations or cash flows. ITEM 1B. UNRESOLVED STAFF COMMENTS.
None.
ITEM 2. PROPERTIES.
As of January 30, 2021, we operated approximately 2,800 owned or leased supermarkets, distribution warehouses and food production plants through divisions, subsidiaries or affiliates. These facilities are located throughout the United States. We generally own store equipment, fixtures and leasehold improvements, as well as processing and food production equipment. The total cost of our owned assets and finance leases at January 30, 2021, was $46.0 billion while the accumulated depreciation was $23.6 billion.
We lease certain store real estate, warehouses, distribution centers, office space and equipment. We operate in
leased facilities in approximately half of our store locations. Lease terms generally range from 10 to 20 years with options to renew for varying terms at our sole discretion. Certain leases also include options to purchase the leased property. Leases with an initial term of 12 months or less are not recorded on the balance sheet. Certain leases include escalation clauses or payment of executory costs such as property taxes, utilities or insurance and maintenance. Rent expense for leases with escalation clauses or other lease concessions are accounted for on a straight-line basis over the lease term. Our lease agreements do not contain any material residual value guarantees or material restrictive covenants. Certain properties or portions thereof are subleased to others for periods generally ranging from one to 20 years. For additional information on lease obligations, see Note 10 to the Consolidated Financial Statements. ITEM 3. LEGAL PROCEEDINGS.
Incorporated by reference herein is information regarding certain legal proceedings in which we are involved as set forth under “Litigation” contained in Note 13 – “Commitments and Contingencies” in the notes to the Consolidated Financial Statements in Item 8 of Part II of this Annual Report. ITEM 4. MINE SAFETY DISCLOSURES.
Not applicable.
17
PART II ITEM 5. MARKET FOR REGISTRANT’S COMMON EQUITY, RELATED STOCKHOLDER MATTERS
AND ISSUER PURCHASES OF EQUITY SECURITIES.
Our common stock is listed on the New York Stock Exchange under the symbol “KR.” As of March 24, 2021, there were 25,973 shareholders of record.
During 2020, we paid two quarterly cash dividends of $0.16 per share and two quarterly cash dividends of $0.18 per
share. During 2019, we paid two quarterly cash dividends of $0.14 per share and two quarterly cash dividends of $0.16 per share. On March 1, 2021, we paid a quarterly cash dividend of $0.18 per share. On March 11, 2021, we announced that our Board of Directors declared a quarterly cash dividend of $0.18 per share, payable on June 1, 2021, to shareholders of record at the close of business on May 14, 2021. We currently expect to continue to pay comparable cash dividends on a quarterly basis, that will increase over time, depending on our earnings and other factors, including approval by our Board.
For information on securities authorized for issuance under our existing equity compensation plans, see Item 12 under the heading “Security Ownership of Certain Beneficial Owners and Management and Related Stockholder Matters.”
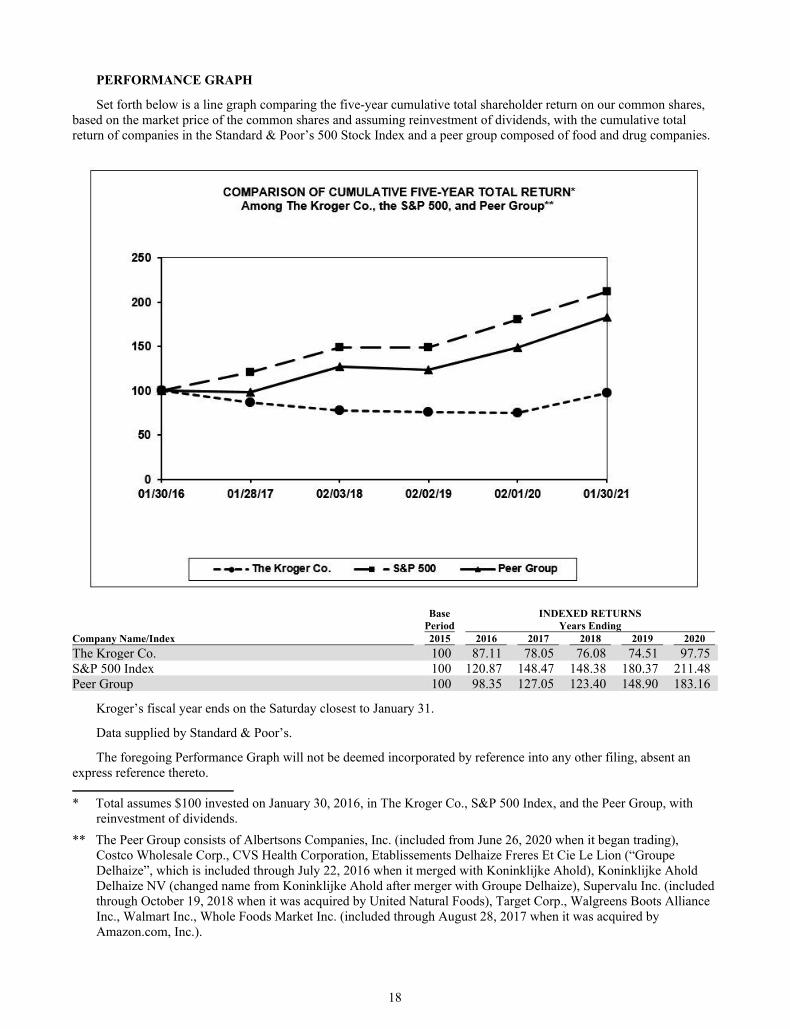
18
PERFORMANCE GRAPH
Set forth below is a line graph comparing the five-year cumulative total shareholder return on our common shares, based on the market price of the common shares and assuming reinvestment of dividends, with the cumulative total return of companies in the Standard & Poor’s 500 Stock Index and a peer group composed of food and drug companies.
Base INDEXED RETURNS Period Years Ending Company Name/Index 2015 2016 2017 2018 2019 2020
The Kroger Co. 100 87.11 78.05 76.08 74.51 97.75 S&P 500 Index 100 120.87 148.47 148.38 180.37 211.48 Peer Group 100 98.35 127.05 123.40 148.90 183.16
Kroger’s fiscal year ends on the Saturday closest to January 31.
Data supplied by Standard & Poor’s.
The foregoing Performance Graph will not be deemed incorporated by reference into any other filing, absent an express reference thereto.
* Total assumes $100 invested on January 30, 2016, in The Kroger Co., S&P 500 Index, and the Peer Group, with
reinvestment of dividends.
** The Peer Group consists of Albertsons Companies, Inc. (included from June 26, 2020 when it began trading), Costco Wholesale Corp., CVS Health Corporation, Etablissements Delhaize Freres Et Cie Le Lion (“Groupe Delhaize”, which is included through July 22, 2016 when it merged with Koninklijke Ahold), Koninklijke Ahold Delhaize NV (changed name from Koninklijke Ahold after merger with Groupe Delhaize), Supervalu Inc. (included through October 19, 2018 when it was acquired by United Natural Foods), Target Corp., Walgreens Boots Alliance Inc., Walmart Inc., Whole Foods Market Inc. (included through August 28, 2017 when it was acquired by Amazon.com, Inc.).
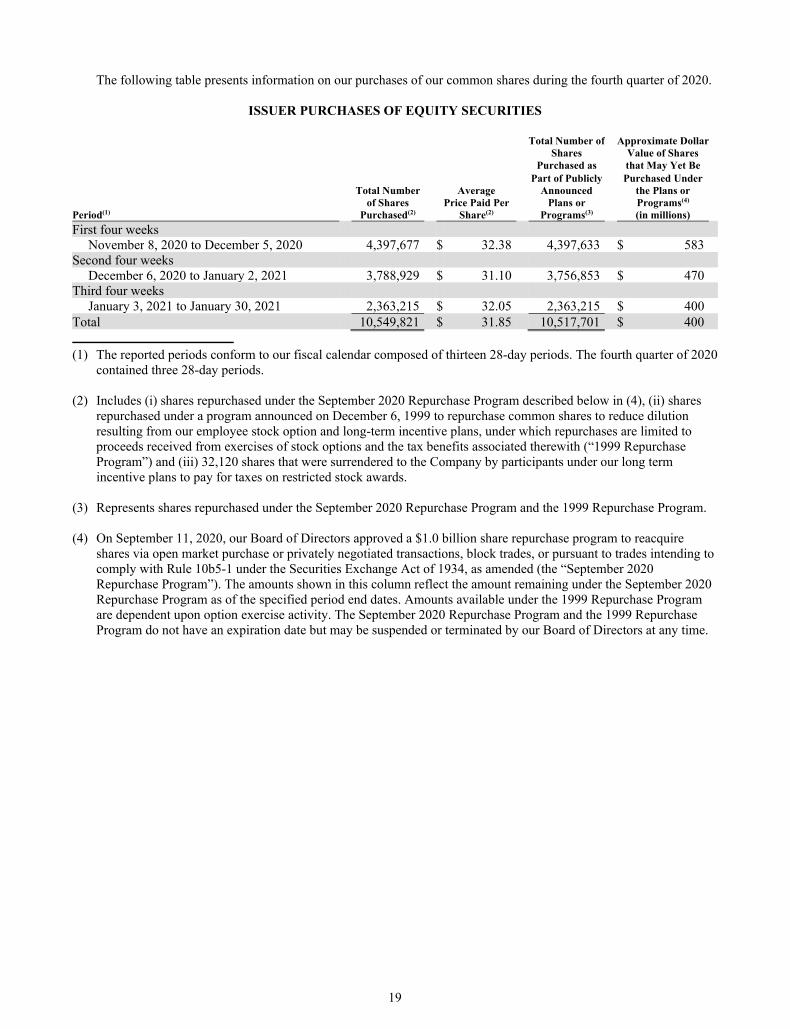
19
The following table presents information on our purchases of our common shares during the fourth quarter of 2020.
ISSUER PURCHASES OF EQUITY SECURITIES
Total Number of Approximate Dollar Shares Value of Shares Purchased as that May Yet Be Part of Publicly Purchased Under Total Number Average Announced the Plans or of Shares Price Paid Per Plans or Programs(4) Period(1) Purchased(2) Share(2) Programs(3) (in millions)
First four weeks November 8, 2020 to December 5, 2020 4,397,677 $ 32.38 4,397,633 $ 583
Second four weeks December 6, 2020 to January 2, 2021 3,788,929 $ 31.10 3,756,853 $ 470
Third four weeks January 3, 2021 to January 30, 2021 2,363,215 $ 32.05 2,363,215 $ 400
Total 10,549,821 $ 31.85 10,517,701 $ 400
(1) The reported periods conform to our fiscal calendar composed of thirteen 28-day periods. The fourth quarter of 2020
contained three 28-day periods. (2) Includes (i) shares repurchased under the September 2020 Repurchase Program described below in (4), (ii) shares
repurchased under a program announced on December 6, 1999 to repurchase common shares to reduce dilution resulting from our employee stock option and long-term incentive plans, under which repurchases are limited to proceeds received from exercises of stock options and the tax benefits associated therewith (“1999 Repurchase Program”) and (iii) 32,120 shares that were surrendered to the Company by participants under our long term incentive plans to pay for taxes on restricted stock awards.
(3) Represents shares repurchased under the September 2020 Repurchase Program and the 1999 Repurchase Program.
(4) On September 11, 2020, our Board of Directors approved a $1.0 billion share repurchase program to reacquire
shares via open market purchase or privately negotiated transactions, block trades, or pursuant to trades intending to comply with Rule 10b5-1 under the Securities Exchange Act of 1934, as amended (the “September 2020 Repurchase Program”). The amounts shown in this column reflect the amount remaining under the September 2020 Repurchase Program as of the specified period end dates. Amounts available under the 1999 Repurchase Program are dependent upon option exercise activity. The September 2020 Repurchase Program and the 1999 Repurchase Program do not have an expiration date but may be suspended or terminated by our Board of Directors at any time.
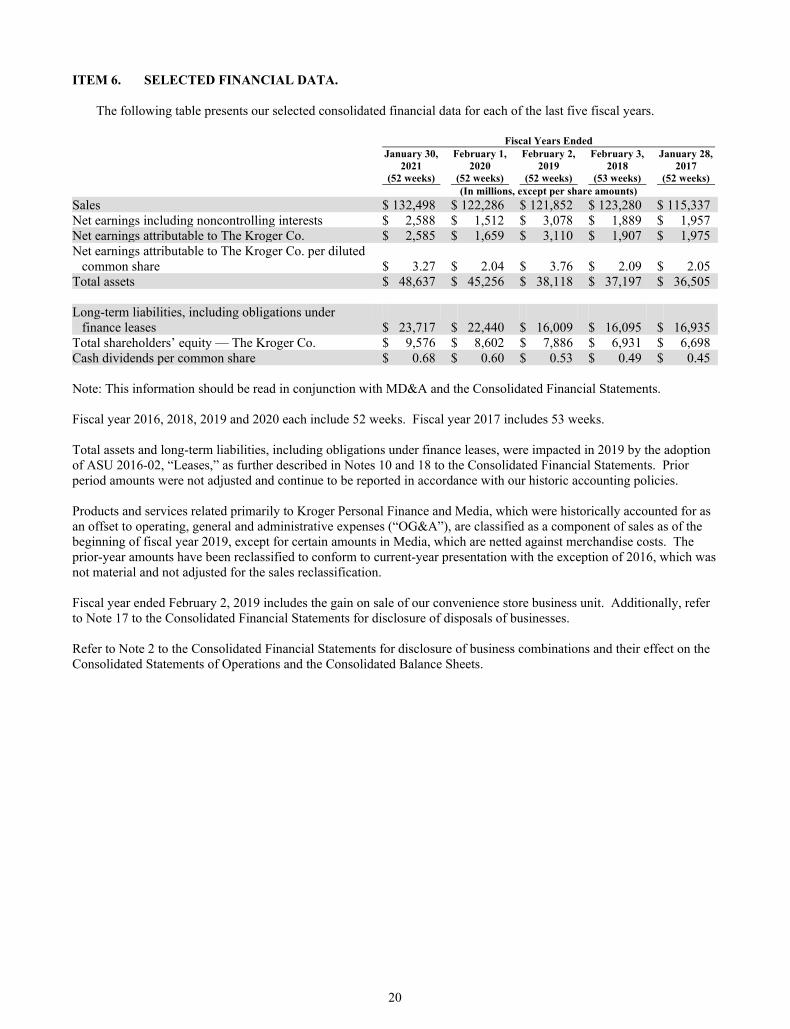
20
ITEM 6. SELECTED FINANCIAL DATA.
The following table presents our selected consolidated financial data for each of the last five fiscal years.
Fiscal Years Ended January 30, February 1, February 2, February 3, January 28, 2021 2020 2019 2018 2017 (52 weeks) (52 weeks) (52 weeks) (53 weeks) (52 weeks) (In millions, except per share amounts)
Sales $ 132,498 $ 122,286 $ 121,852 $ 123,280 $ 115,337 Net earnings including noncontrolling interests $ 2,588 $ 1,512 $ 3,078 $ 1,889 $ 1,957 Net earnings attributable to The Kroger Co. $ 2,585 $ 1,659 $ 3,110 $ 1,907 $ 1,975 Net earnings attributable to The Kroger Co. per diluted
common share $ 3.27 $ 2.04 $ 3.76 $ 2.09 $ 2.05 Total assets $ 48,637 $ 45,256 $ 38,118 $ 37,197 $ 36,505 Long-term liabilities, including obligations under
finance leases $ 23,717 $ 22,440 $ 16,009 $ 16,095 $ 16,935 Total shareholders’ equity — The Kroger Co. $ 9,576 $ 8,602 $ 7,886 $ 6,931 $ 6,698 Cash dividends per common share $ 0.68 $ 0.60 $ 0.53 $ 0.49 $ 0.45 Note: This information should be read in conjunction with MD&A and the Consolidated Financial Statements. Fiscal year 2016, 2018, 2019 and 2020 each include 52 weeks. Fiscal year 2017 includes 53 weeks. Total assets and long-term liabilities, including obligations under finance leases, were impacted in 2019 by the adoption of ASU 2016-02, “Leases,” as further described in Notes 10 and 18 to the Consolidated Financial Statements. Prior period amounts were not adjusted and continue to be reported in accordance with our historic accounting policies. Products and services related primarily to Kroger Personal Finance and Media, which were historically accounted for as an offset to operating, general and administrative expenses (“OG&A”), are classified as a component of sales as of the beginning of fiscal year 2019, except for certain amounts in Media, which are netted against merchandise costs. The prior-year amounts have been reclassified to conform to current-year presentation with the exception of 2016, which was not material and not adjusted for the sales reclassification. Fiscal year ended February 2, 2019 includes the gain on sale of our convenience store business unit. Additionally, refer to Note 17 to the Consolidated Financial Statements for disclosure of disposals of businesses. Refer to Note 2 to the Consolidated Financial Statements for disclosure of business combinations and their effect on the Consolidated Statements of Operations and the Consolidated Balance Sheets.
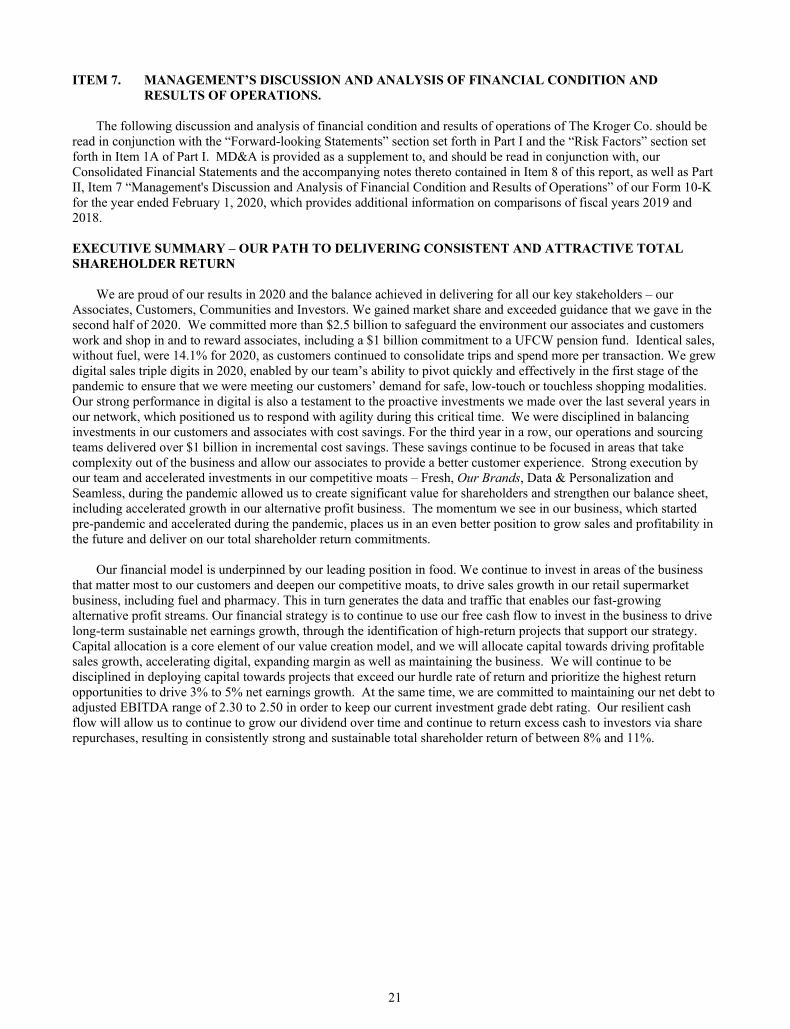
21
ITEM 7. MANAGEMENT’S DISCUSSION AND ANALYSIS OF FINANCIAL CONDITION AND RESULTS OF OPERATIONS.
The following discussion and analysis of financial condition and results of operations of The Kroger Co. should be
read in conjunction with the “Forward-looking Statements” section set forth in Part I and the “Risk Factors” section set forth in Item 1A of Part I. MD&A is provided as a supplement to, and should be read in conjunction with, our Consolidated Financial Statements and the accompanying notes thereto contained in Item 8 of this report, as well as Part II, Item 7 “Management's Discussion and Analysis of Financial Condition and Results of Operations” of our Form 10-K for the year ended February 1, 2020, which provides additional information on comparisons of fiscal years 2019 and 2018. EXECUTIVE SUMMARY – OUR PATH TO DELIVERING CONSISTENT AND ATTRACTIVE TOTAL SHAREHOLDER RETURN
We are proud of our results in 2020 and the balance achieved in delivering for all our key stakeholders – our
Associates, Customers, Communities and Investors. We gained market share and exceeded guidance that we gave in the second half of 2020. We committed more than $2.5 billion to safeguard the environment our associates and customers work and shop in and to reward associates, including a $1 billion commitment to a UFCW pension fund. Identical sales, without fuel, were 14.1% for 2020, as customers continued to consolidate trips and spend more per transaction. We grew digital sales triple digits in 2020, enabled by our team’s ability to pivot quickly and effectively in the first stage of the pandemic to ensure that we were meeting our customers’ demand for safe, low-touch or touchless shopping modalities. Our strong performance in digital is also a testament to the proactive investments we made over the last several years in our network, which positioned us to respond with agility during this critical time. We were disciplined in balancing investments in our customers and associates with cost savings. For the third year in a row, our operations and sourcing teams delivered over $1 billion in incremental cost savings. These savings continue to be focused in areas that take complexity out of the business and allow our associates to provide a better customer experience. Strong execution by our team and accelerated investments in our competitive moats – Fresh, Our Brands, Data & Personalization and Seamless, during the pandemic allowed us to create significant value for shareholders and strengthen our balance sheet, including accelerated growth in our alternative profit business. The momentum we see in our business, which started pre-pandemic and accelerated during the pandemic, places us in an even better position to grow sales and profitability in the future and deliver on our total shareholder return commitments.
Our financial model is underpinned by our leading position in food. We continue to invest in areas of the business
that matter most to our customers and deepen our competitive moats, to drive sales growth in our retail supermarket business, including fuel and pharmacy. This in turn generates the data and traffic that enables our fast-growing alternative profit streams. Our financial strategy is to continue to use our free cash flow to invest in the business to drive long-term sustainable net earnings growth, through the identification of high-return projects that support our strategy. Capital allocation is a core element of our value creation model, and we will allocate capital towards driving profitable sales growth, accelerating digital, expanding margin as well as maintaining the business. We will continue to be disciplined in deploying capital towards projects that exceed our hurdle rate of return and prioritize the highest return opportunities to drive 3% to 5% net earnings growth. At the same time, we are committed to maintaining our net debt to adjusted EBITDA range of 2.30 to 2.50 in order to keep our current investment grade debt rating. Our resilient cash flow will allow us to continue to grow our dividend over time and continue to return excess cash to investors via share repurchases, resulting in consistently strong and sustainable total shareholder return of between 8% and 11%.
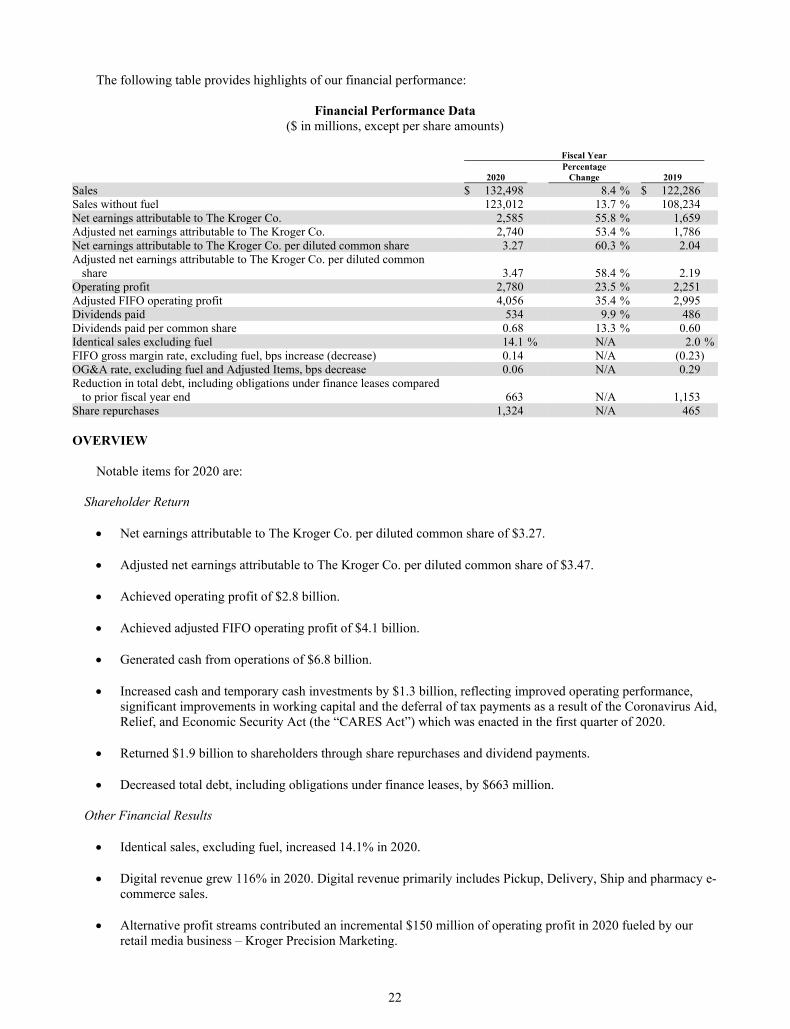
22
The following table provides highlights of our financial performance:
Financial Performance Data ($ in millions, except per share amounts)
Fiscal Year Percentage 2020 Change 2019
Sales $ 132,498 8.4 % $ 122,286 Sales without fuel 123,012 13.7 % 108,234 Net earnings attributable to The Kroger Co. 2,585 55.8 % 1,659 Adjusted net earnings attributable to The Kroger Co. 2,740 53.4 % 1,786 Net earnings attributable to The Kroger Co. per diluted common share 3.27 60.3 % 2.04 Adjusted net earnings attributable to The Kroger Co. per diluted common
share 3.47 58.4 % 2.19 Operating profit 2,780 23.5 % 2,251 Adjusted FIFO operating profit 4,056 35.4 % 2,995 Dividends paid 534 9.9 % 486 Dividends paid per common share 0.68 13.3 % 0.60 Identical sales excluding fuel 14.1 % N/A 2.0 % FIFO gross margin rate, excluding fuel, bps increase (decrease) 0.14 N/A (0.23)OG&A rate, excluding fuel and Adjusted Items, bps decrease 0.06 N/A 0.29 Reduction in total debt, including obligations under finance leases compared
to prior fiscal year end 663 N/A 1,153 Share repurchases 1,324 N/A 465
OVERVIEW
Notable items for 2020 are:
Shareholder Return Net earnings attributable to The Kroger Co. per diluted common share of $3.27.
Adjusted net earnings attributable to The Kroger Co. per diluted common share of $3.47.
Achieved operating profit of $2.8 billion.
Achieved adjusted FIFO operating profit of $4.1 billion.
Generated cash from operations of $6.8 billion.
Increased cash and temporary cash investments by $1.3 billion, reflecting improved operating performance,
significant improvements in working capital and the deferral of tax payments as a result of the Coronavirus Aid, Relief, and Economic Security Act (the “CARES Act”) which was enacted in the first quarter of 2020.
Returned $1.9 billion to shareholders through share repurchases and dividend payments.
Decreased total debt, including obligations under finance leases, by $663 million.
Other Financial Results
Identical sales, excluding fuel, increased 14.1% in 2020.
Digital revenue grew 116% in 2020. Digital revenue primarily includes Pickup, Delivery, Ship and pharmacy e-commerce sales.
Alternative profit streams contributed an incremental $150 million of operating profit in 2020 fueled by our retail media business – Kroger Precision Marketing.
23
Cost savings for 2020 exceeded $1 billion.
Significant Events
During the fourth quarter of 2020, certain of the Company’s associates ratified an agreement with certain UFCW local unions to withdraw from the UFCW International Union-Industry Pension Fund (“National Fund”). We incurred a withdrawal liability charge of $962 million, on a pre-tax basis, to fulfill obligations for past service for associates and retirees in the National Fund. We also made a $27 million commitment to a transition reserve in the new variable annuity pension plan. On an after-tax basis, the withdrawal liability and commitment to the transition reserve total $754 million (collectively, the “National Fund Commitment”). The withdrawal liability will be satisfied by payments to the National Fund over the next three years.
During 2020, we invested over $1.5 billion to support and safeguard associates, customers and communities during the COVID-19 pandemic. These investments primarily relate to items within OG&A such as associate appreciation awards, expanded sick and emergency leave pay and investments in associate and customer safety during the pandemic (collectively, the “COVID-19 Investments”). Supported by our strong performance and cash position, we committed more than $2.5 billion to safeguard the environment our associates and customers work and shop in and to reward associates, including the National Fund Commitment.
During the first quarter of 2020, in addition to the recurring multi-employer pension contributions we make in the normal course of business, we contributed an incremental $236 million, $180 million net of tax, to multi-employer pension plans, helping stabilize future associate benefits (the “First Quarter 2020 Multi-Employer Pension Contribution”).
COVID-19
On March 11, 2020, the World Health Organization announced that infections of COVID-19 had become a
pandemic, and on March 13, the U.S. President announced a National Emergency relating to the disease. The impact on our financial condition, results of operations, and cash flows was material in fiscal year 2020. We expect the ultimate significance will be dictated by the length of time that such circumstances continue, which will depend on the currently unknowable extent and duration of the COVID-19 pandemic and any governmental and public actions taken in response.
Since the beginning of the pandemic, our most urgent priority has been to safeguard our associates and customers. We’ve implemented dozens of new safety and cleanliness processes and procedures in our stores and other facilities, including safety partitions and physical distancing floor decals, implementation of customer capacity limits, and providing personal protective equipment like masks for our associates. All of which are described in our Blueprint for Businesses – an open source guide we created to help other companies navigate the complexities of safely operating during a pandemic.
As the pandemic has evolved, we have experienced unusually strong sales. We continue to see people eat and work more from home and prioritize health and cleanliness. The change in customer behavior caused by COVID-19 was a major factor in our 2020 results. The pandemic brought to the forefront the importance to the customer of fresh and digital. We continued to invest and grow our capabilities in these areas, leading to gains in both digital and total food at home market share. Identical sales, without fuel, were 14.1% for 2020, as customers continued to consolidate trips and spend more per transaction. Digital revenue grew 116% in 2020, enabled by our team’s ability to pivot quickly and effectively in the first stage of the pandemic to ensure that we were meeting our customers’ demand for safe, low-touch or touchless shopping modalities.
Our OG&A expenses include significant incremental costs related to investments in pay and benefits for our associates and measures to safeguard our associates and customers. Supported by our strong performance and cash position, in 2020 we committed more than $2.5 billion to safeguard the environment our associates and customers work and shop in and to reward associates, including committing nearly $1 billion to better secure pensions for over 30,000 associates. This was in addition to paid emergency leave, financial assistance through our Helping Hands program and more. As a percentage of sales, these incremental costs were partially offset by sales leverage resulting from strong sales growth due to the COVID-19 pandemic.
24
On March 18, 2020, we proactively borrowed $1 billion under the revolving credit facility. This was a precautionary measure in order to preserve financial flexibility, reduce reliance on the commercial paper market and maintain liquidity in response to the COVID-19 pandemic. Strong execution by our team and accelerated investments in our competitive moats during the pandemic allowed us to strengthen our balance sheet. During 2020, we fully repaid the $1 billion borrowed under the revolving credit facility and $1.2 billion in outstanding commercial paper obligations, as of year-end 2019, using cash generated by operations.
For additional information about our debt activity in 2020, including the drawdown and repayments under our revolving credit facility, forward-starting interest rate swap agreements and our senior note issuances, see Note 6 to the Consolidated Financial Statements. For additional information about our business results, including the impact of the COVID-19 pandemic, see our Results of Operations and Liquidity and Capital Resources sections within MD&A.
OUR BUSINESS
The Kroger Co. was founded in 1883 and incorporated in 1902. As of January 30, 2021, Kroger is one of the world’s largest retailers, as measured by revenue, operating 2,742 supermarkets under a variety of local banner names in 35 states and the District of Columbia. Of these stores, 2,255 have pharmacies and 1,596 have fuel centers. We offer Pickup (also referred to as ClickList®) and Harris Teeter ExpressLane™ — personalized, order online, pick up at the store services — at 2,223 of our supermarkets and provide home delivery service to substantially all of Kroger households. We also operate an online retailer.
We operate 35 food production plants, primarily bakeries and dairies, which supply approximately 29% of Our Brands units and 40% of the grocery category Our Brands units sold in our supermarkets; the remaining Our Brands items are produced to our strict specifications by outside manufacturers.
Our revenues are predominately earned and cash is generated as consumer products are sold to customers in our
stores, fuel centers and via our online platforms. We earn income predominately by selling products at price levels that produce revenues in excess of the costs we incur to make these products available to our customers. Such costs include procurement and distribution costs, facility occupancy and operational costs, and overhead expenses. Our retail operations, which represent 97% of our consolidated sales, is our only reportable segment.
On January 27, 2020, Lucky’s Market filed a voluntary petition in the Bankruptcy Court seeking relief under the
Bankruptcy Code. Lucky’s Market is included in our Consolidated Statements of Operations in all periods in 2018 and through January 26, 2020. Refer to Note 17 to the Consolidated Financial Statements for additional information.
On April 26, 2019, we completed the sale of our Turkey Hill Dairy business for total proceeds of $225 million.
Turkey Hill Dairy is included in our Consolidated Statements of Operations in all periods in 2018 and through April 25, 2019.
On March 13, 2019, we completed the sale of our You Technology business to Inmar for total consideration of $565
million, including $396 million of cash and $64 million of preferred equity received upon closing. We are also entitled to receive other cash payments of $105 million over five years. The transaction includes a long-term service agreement for Inmar to provide us digital coupon services. You Technology is included in our Consolidated Statements of Operations in all periods in 2018 and through March 12, 2019.
On June 22, 2018, we closed our merger with Home Chef by purchasing 100% of the ownership interest in Home
Chef, for $197 million net of cash and cash equivalents of $30 million, in addition to future earnout payments of up to $500 million over five years that are contingent on achieving certain milestones. Home Chef is included in our ending Consolidated Balance Sheet for 2019 and 2020 and in our Consolidated Statements of Operations from June 22, 2018 through February 2, 2019 and all periods in 2019 and 2020. See Note 2 to the Consolidated Financial Statements for more information related to our merger with Home Chef.
On April 20, 2018, we completed the sale of our convenience store business unit for $2.2 billion. The convenience
store business is included in our Consolidated Statements of Operations through April 19, 2018.
25
USE OF NON-GAAP FINANCIAL MEASURES
The accompanying Consolidated Financial Statements, including the related notes, are presented in accordance with generally accepted accounting principles (“GAAP”). We provide non-GAAP measures, including First-In, First-Out (“FIFO”) gross margin, FIFO operating profit, adjusted net earnings and adjusted net earnings per diluted share because management believes these metrics are useful to investors and analysts. These non-GAAP financial measures should not be considered as an alternative to gross margin, operating profit, net earnings and net earnings per diluted share or any other GAAP measure of performance. These measures should not be reviewed in isolation or considered as a substitute for our financial results as reported in accordance with GAAP.
We calculate FIFO gross margin as FIFO gross profit divided by sales. FIFO gross profit is calculated as sales less
merchandise costs, including advertising, warehousing, and transportation expenses, but excluding the Last-In, First-Out (“LIFO”) charge. Merchandise costs exclude depreciation and rent expenses. FIFO gross margin is an important measure used by management as management believes FIFO gross margin is a useful metric to investors and analysts because it measures our day-to-day merchandising and operational effectiveness.
We calculate FIFO operating profit as operating profit excluding the LIFO charge. FIFO operating profit is an
important measure used by management as management believes FIFO operating profit is a useful metric to investors and analysts because it measures our day-to-day operational effectiveness.
The adjusted net earnings and adjusted net earnings per diluted share metrics are important measures used by management to compare the performance of core operating results between periods. We believe adjusted net earnings and adjusted net earnings per diluted share are useful metrics to investors and analysts because they present more accurate year-over-year comparisons for our net earnings and net earnings per diluted share because adjusted items are not the result of our normal operations. Net earnings for 2020 include the following, which we define as the “2020 Adjusted Items:”
Charges to OG&A of $989 million, $754 million net of tax, for commitments to certain multi-employer pension
funds, $189 million, $141 million net of tax, for the revaluation of Home Chef contingent consideration and $111 million, $81 million net of tax, for transformation costs (the “2020 OG&A Adjusted Items”).
Gains in other income (expense) of $1.1 billion, $821 million net of tax, for the gain on investments (the “2020 Other Income (Expense) Adjusted Item”).
Net earnings for 2019 include the following, which we define as the “2019 Adjusted Items:” Charges to OG&A of $135 million, $104 million net of tax, for obligations related to withdrawal liabilities for
certain multi-employer pension funds; $80 million, $61 million net of tax, for a severance charge and related benefits; $412 million including $305 million attributable to The Kroger Co., $225 million net of tax, for impairment of Lucky’s Market; $52 million, $37 million net of tax, for transformation costs, primarily including 35 planned store closures; and a reduction to OG&A of $69 million, $49 million net of tax, for the revaluation of Home Chef contingent consideration (the “2019 OG&A Adjusted Items”).
Gains in other income (expense) of $106 million, $80 million net of tax, related to the sale of Turkey Hill Dairy; $70 million, $52 million net of tax, related to the sale of You Technology; and $157 million, $119 million net of tax, for the mark to market gain on Ocado Group plc (“Ocado”) securities (the “2019 Other Income (Expense) Adjusted Items”).
Net earnings for 2018 include the following, which we define as the “2018 Adjusted Items:” Charges to OG&A of $155 million, $121 million net of tax, for obligations related to withdrawal liabilities for
certain local unions of the Central States multi-employer pension fund; $33 million, $26 million net of tax, for the revaluation of Home Chef contingent consideration; and $42 million, $33 million net of tax, for an impairment of financial instrument (the “2018 OG&A Adjusted Items”). We had initially received the financial instrument in 2016 with no cash outlay as part of the consideration for entering into agreements with a third party.

26
A reduction to depreciation and amortization expenses of $14 million, $11 million net of tax, related to held for sale assets (the “2018 Depreciation Adjusted Item”).
Gains in other income (expense) of $1.8 billion, $1.4 billion net of tax, related to the sale of our convenience store business unit and $228 million, $174 million net of tax, for the mark to market gain on Ocado securities.
The following table provides a reconciliation of net earnings attributable to The Kroger Co. to adjusted net earnings
attributable to The Kroger Co. and a reconciliation of net earnings attributable to The Kroger Co. per diluted common share to adjusted net earnings attributable to The Kroger Co. per diluted common share, excluding the 2020, 2019 and 2018 Adjusted Items.
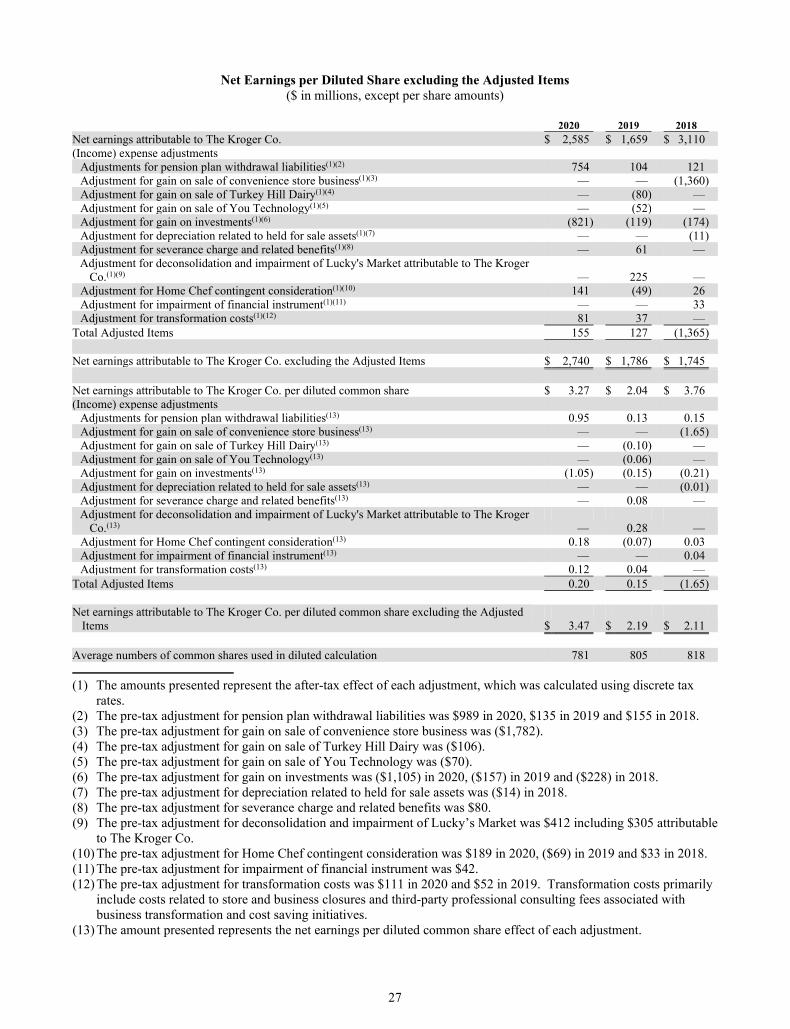
27
Net Earnings per Diluted Share excluding the Adjusted Items ($ in millions, except per share amounts)
2020 2019 2018 Net earnings attributable to The Kroger Co. $ 2,585 $ 1,659 $ 3,110 (Income) expense adjustments
Adjustments for pension plan withdrawal liabilities(1)(2) 754 104 121 Adjustment for gain on sale of convenience store business(1)(3) — — (1,360) Adjustment for gain on sale of Turkey Hill Dairy(1)(4) — (80) — Adjustment for gain on sale of You Technology(1)(5) — (52) — Adjustment for gain on investments(1)(6) (821) (119) (174) Adjustment for depreciation related to held for sale assets(1)(7) — — (11) Adjustment for severance charge and related benefits(1)(8) — 61 — Adjustment for deconsolidation and impairment of Lucky's Market attributable to The Kroger
Co.(1)(9) — 225 — Adjustment for Home Chef contingent consideration(1)(10) 141 (49) 26 Adjustment for impairment of financial instrument(1)(11) — — 33 Adjustment for transformation costs(1)(12) 81 37 —
Total Adjusted Items 155 127 (1,365) Net earnings attributable to The Kroger Co. excluding the Adjusted Items $ 2,740 $ 1,786 $ 1,745 Net earnings attributable to The Kroger Co. per diluted common share $ 3.27 $ 2.04 $ 3.76 (Income) expense adjustments
Adjustments for pension plan withdrawal liabilities(13) 0.95 0.13 0.15 Adjustment for gain on sale of convenience store business(13) — — (1.65) Adjustment for gain on sale of Turkey Hill Dairy(13) — (0.10) — Adjustment for gain on sale of You Technology(13) — (0.06) — Adjustment for gain on investments(13) (1.05) (0.15) (0.21) Adjustment for depreciation related to held for sale assets(13) — — (0.01) Adjustment for severance charge and related benefits(13) — 0.08 — Adjustment for deconsolidation and impairment of Lucky's Market attributable to The Kroger
Co.(13) — 0.28 — Adjustment for Home Chef contingent consideration(13) 0.18 (0.07) 0.03 Adjustment for impairment of financial instrument(13) — — 0.04 Adjustment for transformation costs(13) 0.12 0.04 —
Total Adjusted Items 0.20 0.15 (1.65) Net earnings attributable to The Kroger Co. per diluted common share excluding the Adjusted
Items $ 3.47 $ 2.19 $ 2.11 Average numbers of common shares used in diluted calculation 781 805 818
(1) The amounts presented represent the after-tax effect of each adjustment, which was calculated using discrete tax
rates. (2) The pre-tax adjustment for pension plan withdrawal liabilities was $989 in 2020, $135 in 2019 and $155 in 2018. (3) The pre-tax adjustment for gain on sale of convenience store business was ($1,782). (4) The pre-tax adjustment for gain on sale of Turkey Hill Dairy was ($106). (5) The pre-tax adjustment for gain on sale of You Technology was ($70). (6) The pre-tax adjustment for gain on investments was ($1,105) in 2020, ($157) in 2019 and ($228) in 2018. (7) The pre-tax adjustment for depreciation related to held for sale assets was ($14) in 2018. (8) The pre-tax adjustment for severance charge and related benefits was $80. (9) The pre-tax adjustment for deconsolidation and impairment of Lucky’s Market was $412 including $305 attributable
to The Kroger Co. (10) The pre-tax adjustment for Home Chef contingent consideration was $189 in 2020, ($69) in 2019 and $33 in 2018. (11) The pre-tax adjustment for impairment of financial instrument was $42. (12) The pre-tax adjustment for transformation costs was $111 in 2020 and $52 in 2019. Transformation costs primarily
include costs related to store and business closures and third-party professional consulting fees associated with business transformation and cost saving initiatives.
(13) The amount presented represents the net earnings per diluted common share effect of each adjustment.
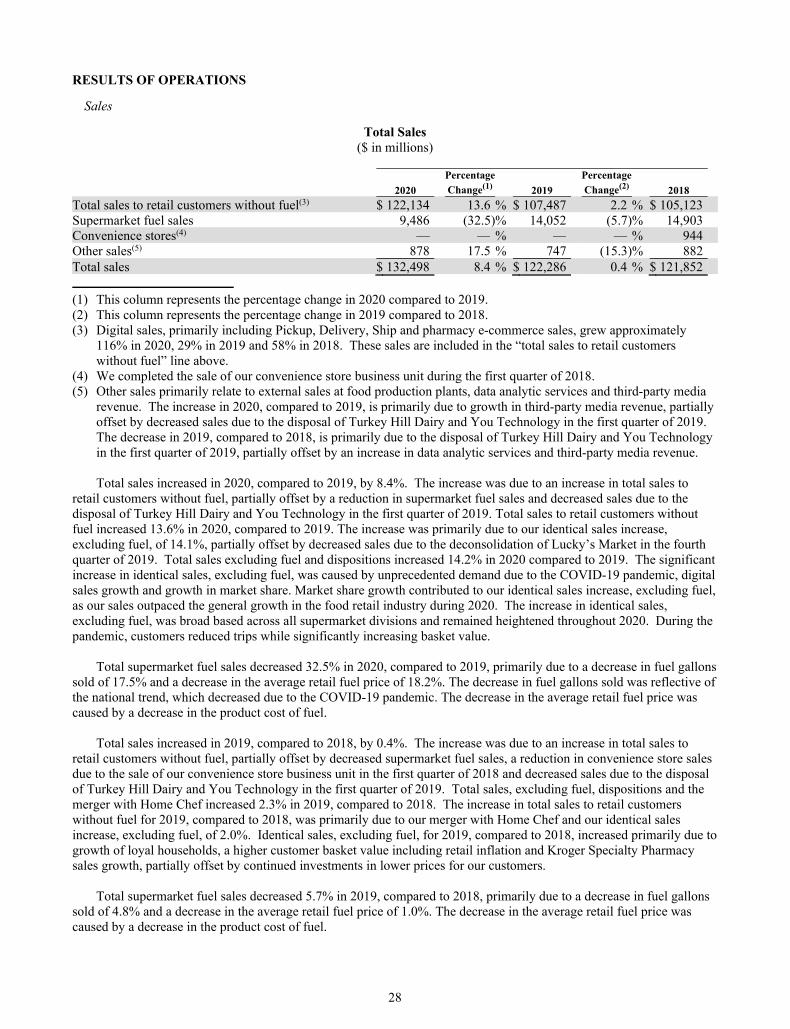
28
RESULTS OF OPERATIONS
Sales
Total Sales ($ in millions)
Percentage Percentage
2020 Change(1) 2019 Change(2) 2018
Total sales to retail customers without fuel(3) $ 122,134 13.6 % $ 107,487 2.2 % $ 105,123 Supermarket fuel sales 9,486 (32.5)% 14,052 (5.7)% 14,903 Convenience stores(4) — — % — — % 944 Other sales(5) 878 17.5 % 747 (15.3)% 882 Total sales $ 132,498 8.4 % $ 122,286 0.4 % $ 121,852
(1) This column represents the percentage change in 2020 compared to 2019. (2) This column represents the percentage change in 2019 compared to 2018. (3) Digital sales, primarily including Pickup, Delivery, Ship and pharmacy e-commerce sales, grew approximately
116% in 2020, 29% in 2019 and 58% in 2018. These sales are included in the “total sales to retail customers without fuel” line above.
(4) We completed the sale of our convenience store business unit during the first quarter of 2018. (5) Other sales primarily relate to external sales at food production plants, data analytic services and third-party media
revenue. The increase in 2020, compared to 2019, is primarily due to growth in third-party media revenue, partially offset by decreased sales due to the disposal of Turkey Hill Dairy and You Technology in the first quarter of 2019. The decrease in 2019, compared to 2018, is primarily due to the disposal of Turkey Hill Dairy and You Technology in the first quarter of 2019, partially offset by an increase in data analytic services and third-party media revenue.
Total sales increased in 2020, compared to 2019, by 8.4%. The increase was due to an increase in total sales to
retail customers without fuel, partially offset by a reduction in supermarket fuel sales and decreased sales due to the disposal of Turkey Hill Dairy and You Technology in the first quarter of 2019. Total sales to retail customers without fuel increased 13.6% in 2020, compared to 2019. The increase was primarily due to our identical sales increase, excluding fuel, of 14.1%, partially offset by decreased sales due to the deconsolidation of Lucky’s Market in the fourth quarter of 2019. Total sales excluding fuel and dispositions increased 14.2% in 2020 compared to 2019. The significant increase in identical sales, excluding fuel, was caused by unprecedented demand due to the COVID-19 pandemic, digital sales growth and growth in market share. Market share growth contributed to our identical sales increase, excluding fuel, as our sales outpaced the general growth in the food retail industry during 2020. The increase in identical sales, excluding fuel, was broad based across all supermarket divisions and remained heightened throughout 2020. During the pandemic, customers reduced trips while significantly increasing basket value.
Total supermarket fuel sales decreased 32.5% in 2020, compared to 2019, primarily due to a decrease in fuel gallons sold of 17.5% and a decrease in the average retail fuel price of 18.2%. The decrease in fuel gallons sold was reflective of the national trend, which decreased due to the COVID-19 pandemic. The decrease in the average retail fuel price was caused by a decrease in the product cost of fuel.
Total sales increased in 2019, compared to 2018, by 0.4%. The increase was due to an increase in total sales to retail customers without fuel, partially offset by decreased supermarket fuel sales, a reduction in convenience store sales due to the sale of our convenience store business unit in the first quarter of 2018 and decreased sales due to the disposal of Turkey Hill Dairy and You Technology in the first quarter of 2019. Total sales, excluding fuel, dispositions and the merger with Home Chef increased 2.3% in 2019, compared to 2018. The increase in total sales to retail customers without fuel for 2019, compared to 2018, was primarily due to our merger with Home Chef and our identical sales increase, excluding fuel, of 2.0%. Identical sales, excluding fuel, for 2019, compared to 2018, increased primarily due to growth of loyal households, a higher customer basket value including retail inflation and Kroger Specialty Pharmacy sales growth, partially offset by continued investments in lower prices for our customers.
Total supermarket fuel sales decreased 5.7% in 2019, compared to 2018, primarily due to a decrease in fuel gallons
sold of 4.8% and a decrease in the average retail fuel price of 1.0%. The decrease in the average retail fuel price was caused by a decrease in the product cost of fuel.
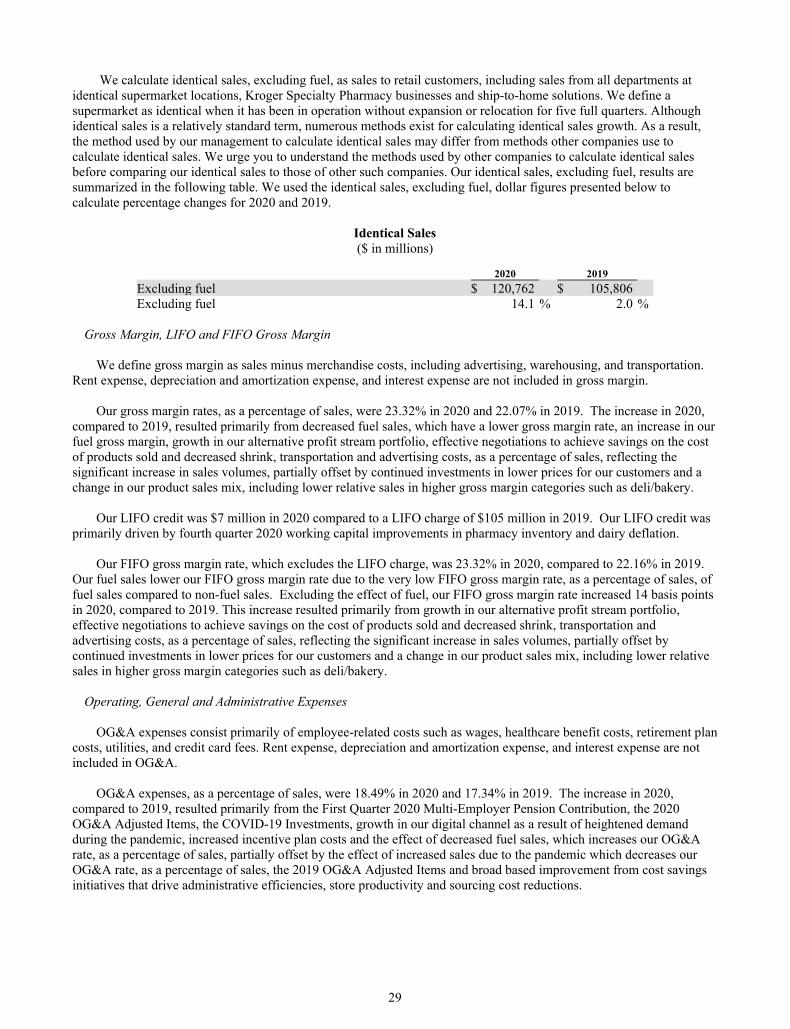
29
We calculate identical sales, excluding fuel, as sales to retail customers, including sales from all departments at identical supermarket locations, Kroger Specialty Pharmacy businesses and ship-to-home solutions. We define a supermarket as identical when it has been in operation without expansion or relocation for five full quarters. Although identical sales is a relatively standard term, numerous methods exist for calculating identical sales growth. As a result, the method used by our management to calculate identical sales may differ from methods other companies use to calculate identical sales. We urge you to understand the methods used by other companies to calculate identical sales before comparing our identical sales to those of other such companies. Our identical sales, excluding fuel, results are summarized in the following table. We used the identical sales, excluding fuel, dollar figures presented below to calculate percentage changes for 2020 and 2019.
Identical Sales ($ in millions)
2020 2019
Excluding fuel $ 120,762 $ 105,806 Excluding fuel 14.1 % 2.0 %
Gross Margin, LIFO and FIFO Gross Margin
We define gross margin as sales minus merchandise costs, including advertising, warehousing, and transportation.
Rent expense, depreciation and amortization expense, and interest expense are not included in gross margin. Our gross margin rates, as a percentage of sales, were 23.32% in 2020 and 22.07% in 2019. The increase in 2020,
compared to 2019, resulted primarily from decreased fuel sales, which have a lower gross margin rate, an increase in our fuel gross margin, growth in our alternative profit stream portfolio, effective negotiations to achieve savings on the cost of products sold and decreased shrink, transportation and advertising costs, as a percentage of sales, reflecting the significant increase in sales volumes, partially offset by continued investments in lower prices for our customers and a change in our product sales mix, including lower relative sales in higher gross margin categories such as deli/bakery.
Our LIFO credit was $7 million in 2020 compared to a LIFO charge of $105 million in 2019. Our LIFO credit was primarily driven by fourth quarter 2020 working capital improvements in pharmacy inventory and dairy deflation.
Our FIFO gross margin rate, which excludes the LIFO charge, was 23.32% in 2020, compared to 22.16% in 2019.
Our fuel sales lower our FIFO gross margin rate due to the very low FIFO gross margin rate, as a percentage of sales, of fuel sales compared to non-fuel sales. Excluding the effect of fuel, our FIFO gross margin rate increased 14 basis points in 2020, compared to 2019. This increase resulted primarily from growth in our alternative profit stream portfolio, effective negotiations to achieve savings on the cost of products sold and decreased shrink, transportation and advertising costs, as a percentage of sales, reflecting the significant increase in sales volumes, partially offset by continued investments in lower prices for our customers and a change in our product sales mix, including lower relative sales in higher gross margin categories such as deli/bakery.
Operating, General and Administrative Expenses
OG&A expenses consist primarily of employee-related costs such as wages, healthcare benefit costs, retirement plan costs, utilities, and credit card fees. Rent expense, depreciation and amortization expense, and interest expense are not included in OG&A.
OG&A expenses, as a percentage of sales, were 18.49% in 2020 and 17.34% in 2019. The increase in 2020,
compared to 2019, resulted primarily from the First Quarter 2020 Multi-Employer Pension Contribution, the 2020 OG&A Adjusted Items, the COVID-19 Investments, growth in our digital channel as a result of heightened demand during the pandemic, increased incentive plan costs and the effect of decreased fuel sales, which increases our OG&A rate, as a percentage of sales, partially offset by the effect of increased sales due to the pandemic which decreases our OG&A rate, as a percentage of sales, the 2019 OG&A Adjusted Items and broad based improvement from cost savings initiatives that drive administrative efficiencies, store productivity and sourcing cost reductions.
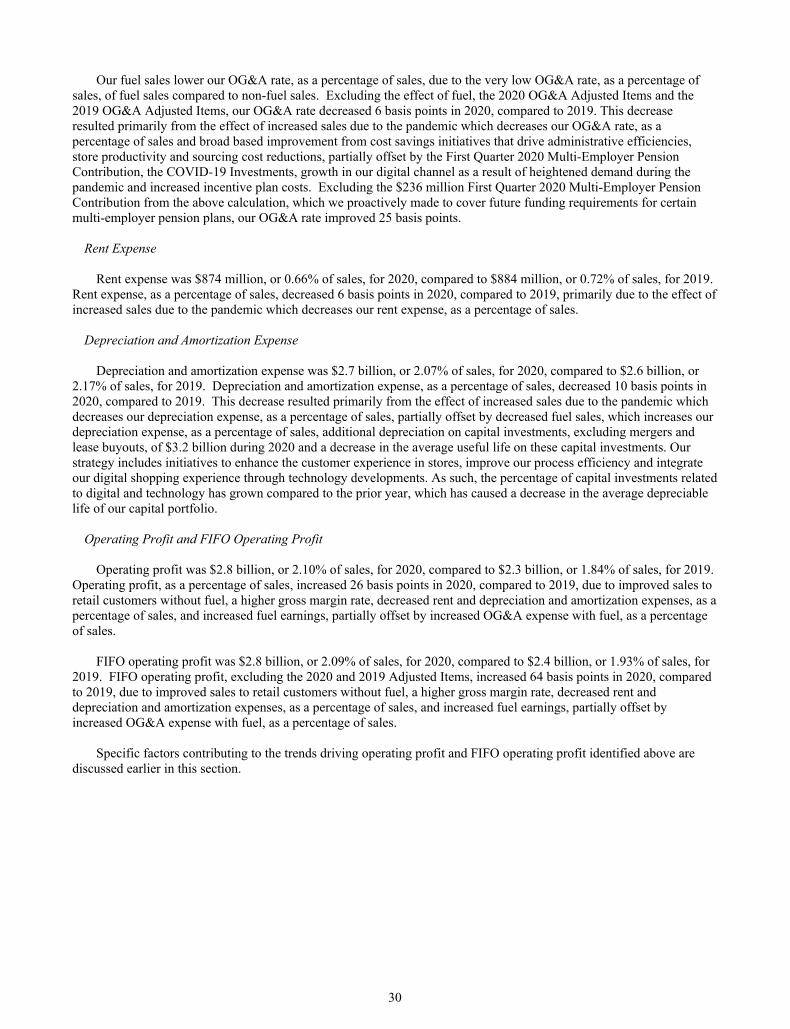
30
Our fuel sales lower our OG&A rate, as a percentage of sales, due to the very low OG&A rate, as a percentage of sales, of fuel sales compared to non-fuel sales. Excluding the effect of fuel, the 2020 OG&A Adjusted Items and the 2019 OG&A Adjusted Items, our OG&A rate decreased 6 basis points in 2020, compared to 2019. This decrease resulted primarily from the effect of increased sales due to the pandemic which decreases our OG&A rate, as a percentage of sales and broad based improvement from cost savings initiatives that drive administrative efficiencies, store productivity and sourcing cost reductions, partially offset by the First Quarter 2020 Multi-Employer Pension Contribution, the COVID-19 Investments, growth in our digital channel as a result of heightened demand during the pandemic and increased incentive plan costs. Excluding the $236 million First Quarter 2020 Multi-Employer Pension Contribution from the above calculation, which we proactively made to cover future funding requirements for certain multi-employer pension plans, our OG&A rate improved 25 basis points.
Rent Expense
Rent expense was $874 million, or 0.66% of sales, for 2020, compared to $884 million, or 0.72% of sales, for 2019.
Rent expense, as a percentage of sales, decreased 6 basis points in 2020, compared to 2019, primarily due to the effect of increased sales due to the pandemic which decreases our rent expense, as a percentage of sales.
Depreciation and Amortization Expense
Depreciation and amortization expense was $2.7 billion, or 2.07% of sales, for 2020, compared to $2.6 billion, or 2.17% of sales, for 2019. Depreciation and amortization expense, as a percentage of sales, decreased 10 basis points in 2020, compared to 2019. This decrease resulted primarily from the effect of increased sales due to the pandemic which decreases our depreciation expense, as a percentage of sales, partially offset by decreased fuel sales, which increases our depreciation expense, as a percentage of sales, additional depreciation on capital investments, excluding mergers and lease buyouts, of $3.2 billion during 2020 and a decrease in the average useful life on these capital investments. Our strategy includes initiatives to enhance the customer experience in stores, improve our process efficiency and integrate our digital shopping experience through technology developments. As such, the percentage of capital investments related to digital and technology has grown compared to the prior year, which has caused a decrease in the average depreciable life of our capital portfolio.
Operating Profit and FIFO Operating Profit
Operating profit was $2.8 billion, or 2.10% of sales, for 2020, compared to $2.3 billion, or 1.84% of sales, for 2019. Operating profit, as a percentage of sales, increased 26 basis points in 2020, compared to 2019, due to improved sales to retail customers without fuel, a higher gross margin rate, decreased rent and depreciation and amortization expenses, as a percentage of sales, and increased fuel earnings, partially offset by increased OG&A expense with fuel, as a percentage of sales.
FIFO operating profit was $2.8 billion, or 2.09% of sales, for 2020, compared to $2.4 billion, or 1.93% of sales, for 2019. FIFO operating profit, excluding the 2020 and 2019 Adjusted Items, increased 64 basis points in 2020, compared to 2019, due to improved sales to retail customers without fuel, a higher gross margin rate, decreased rent and depreciation and amortization expenses, as a percentage of sales, and increased fuel earnings, partially offset by increased OG&A expense with fuel, as a percentage of sales.
Specific factors contributing to the trends driving operating profit and FIFO operating profit identified above are
discussed earlier in this section.
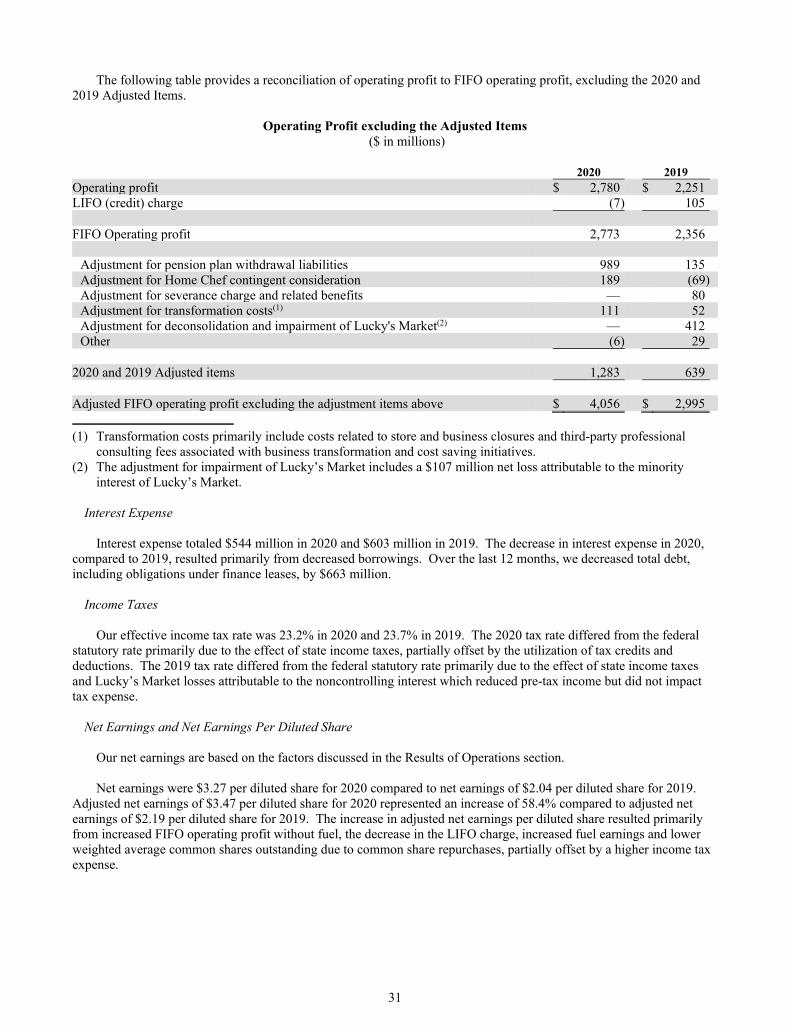
31
The following table provides a reconciliation of operating profit to FIFO operating profit, excluding the 2020 and 2019 Adjusted Items.
Operating Profit excluding the Adjusted Items
($ in millions)
2020 2019 Operating profit $ 2,780 $ 2,251 LIFO (credit) charge (7) 105 FIFO Operating profit 2,773 2,356
Adjustment for pension plan withdrawal liabilities 989 135 Adjustment for Home Chef contingent consideration 189 (69) Adjustment for severance charge and related benefits — 80 Adjustment for transformation costs(1) 111 52 Adjustment for deconsolidation and impairment of Lucky's Market(2) — 412 Other (6) 29
2020 and 2019 Adjusted items 1,283 639 Adjusted FIFO operating profit excluding the adjustment items above $ 4,056 $ 2,995
(1) Transformation costs primarily include costs related to store and business closures and third-party professional
consulting fees associated with business transformation and cost saving initiatives. (2) The adjustment for impairment of Lucky’s Market includes a $107 million net loss attributable to the minority
interest of Lucky’s Market.
Interest Expense
Interest expense totaled $544 million in 2020 and $603 million in 2019. The decrease in interest expense in 2020, compared to 2019, resulted primarily from decreased borrowings. Over the last 12 months, we decreased total debt, including obligations under finance leases, by $663 million.
Income Taxes
Our effective income tax rate was 23.2% in 2020 and 23.7% in 2019. The 2020 tax rate differed from the federal
statutory rate primarily due to the effect of state income taxes, partially offset by the utilization of tax credits and deductions. The 2019 tax rate differed from the federal statutory rate primarily due to the effect of state income taxes and Lucky’s Market losses attributable to the noncontrolling interest which reduced pre-tax income but did not impact tax expense.
Net Earnings and Net Earnings Per Diluted Share
Our net earnings are based on the factors discussed in the Results of Operations section. Net earnings were $3.27 per diluted share for 2020 compared to net earnings of $2.04 per diluted share for 2019.
Adjusted net earnings of $3.47 per diluted share for 2020 represented an increase of 58.4% compared to adjusted net earnings of $2.19 per diluted share for 2019. The increase in adjusted net earnings per diluted share resulted primarily from increased FIFO operating profit without fuel, the decrease in the LIFO charge, increased fuel earnings and lower weighted average common shares outstanding due to common share repurchases, partially offset by a higher income tax expense.
32
COMMON SHARE REPURCHASE PROGRAMS
We maintain share repurchase programs that comply with Rule 10b5-1 of the Securities Exchange Act of 1934 and allow for the orderly repurchase of our common shares, from time to time. The share repurchase programs do not have an expiration date but may be suspended or terminated by our Board of Directors at any time. We made open market purchases of our common shares totaling $1.2 billion in 2020 and $400 million in 2019.
In addition to these repurchase programs, we also repurchase common shares to reduce dilution resulting from our
employee stock option plans. This program is solely funded by proceeds from stock option exercises, and the tax benefit from these exercises. We repurchased approximately $128 million in 2020 and $65 million in 2019 of our common shares under the stock option program.
On November 5, 2019, our Board of Directors approved a $1.0 billion share repurchase program to reacquire shares
via open market purchase or privately negotiated transactions, block trades, or pursuant to trades intending to comply with Rule 10b5-1 under the Securities Exchange Act of 1934, as amended (the “November 2019 Repurchase Program”). On September 11, 2020, our Board of Directors approved a $1.0 billion share repurchase program to reacquire shares via open market purchase or privately negotiated transactions, block trades, or pursuant to trades intending to comply with Rule 10b5-1 under the Securities Exchange Act of 1934, as amended (the “September 2020 Repurchase Program”). The September 2020 Repurchase Program authorization replaced the existing November 2019 Repurchase Program.
The shares repurchased in 2020 were reacquired under the following share repurchase programs: The November 2019 Repurchase Program.
The September 2020 Repurchase Program.
A program announced on December 6, 1999 to repurchase common shares to reduce dilution resulting from our
employee stock option and long-term incentive plans, under which repurchases are limited to proceeds received from exercises of stock options and the tax benefits associated therewith (“1999 Repurchase Program”).
As of January 30, 2021, there was $400 million remaining under the September 2020 Repurchase Program.
During the first quarter through March 24, 2021, we repurchased an additional $36 million of our common shares
under the stock option program and $191 million additional shares under the September 2020 Repurchase Program. As of March 24, 2021, we have $209 million remaining under the September 2020 Repurchase Program. CAPITAL INVESTMENTS
Capital investments, including changes in construction-in-progress payables and excluding mergers and the purchase of leased facilities, totaled $3.2 billion in 2020 and $3.0 billion in 2019. Capital investments for the purchase of leased facilities totaled $58 million in 2020 and $82 million in 2019. The table below shows our supermarket storing activity and our total supermarket square footage:
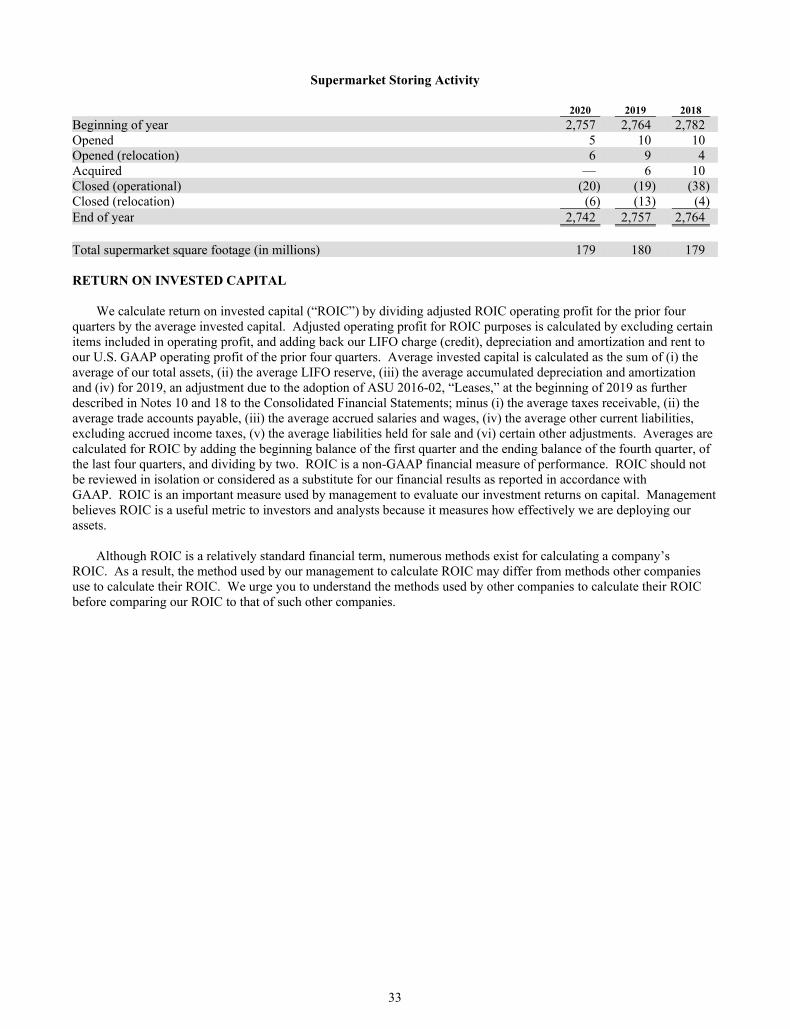
33
Supermarket Storing Activity
2020 2019 2018
Beginning of year 2,757 2,764 2,782 Opened 5 10 10 Opened (relocation) 6 9 4 Acquired — 6 10 Closed (operational) (20) (19) (38) Closed (relocation) (6) (13) (4) End of year 2,742 2,757 2,764 Total supermarket square footage (in millions) 179 180 179 RETURN ON INVESTED CAPITAL
We calculate return on invested capital (“ROIC”) by dividing adjusted ROIC operating profit for the prior four quarters by the average invested capital. Adjusted operating profit for ROIC purposes is calculated by excluding certain items included in operating profit, and adding back our LIFO charge (credit), depreciation and amortization and rent to our U.S. GAAP operating profit of the prior four quarters. Average invested capital is calculated as the sum of (i) the average of our total assets, (ii) the average LIFO reserve, (iii) the average accumulated depreciation and amortization and (iv) for 2019, an adjustment due to the adoption of ASU 2016-02, “Leases,” at the beginning of 2019 as further described in Notes 10 and 18 to the Consolidated Financial Statements; minus (i) the average taxes receivable, (ii) the average trade accounts payable, (iii) the average accrued salaries and wages, (iv) the average other current liabilities, excluding accrued income taxes, (v) the average liabilities held for sale and (vi) certain other adjustments. Averages are calculated for ROIC by adding the beginning balance of the first quarter and the ending balance of the fourth quarter, of the last four quarters, and dividing by two. ROIC is a non-GAAP financial measure of performance. ROIC should not be reviewed in isolation or considered as a substitute for our financial results as reported in accordance with GAAP. ROIC is an important measure used by management to evaluate our investment returns on capital. Management believes ROIC is a useful metric to investors and analysts because it measures how effectively we are deploying our assets.
Although ROIC is a relatively standard financial term, numerous methods exist for calculating a company’s
ROIC. As a result, the method used by our management to calculate ROIC may differ from methods other companies use to calculate their ROIC. We urge you to understand the methods used by other companies to calculate their ROIC before comparing our ROIC to that of such other companies.
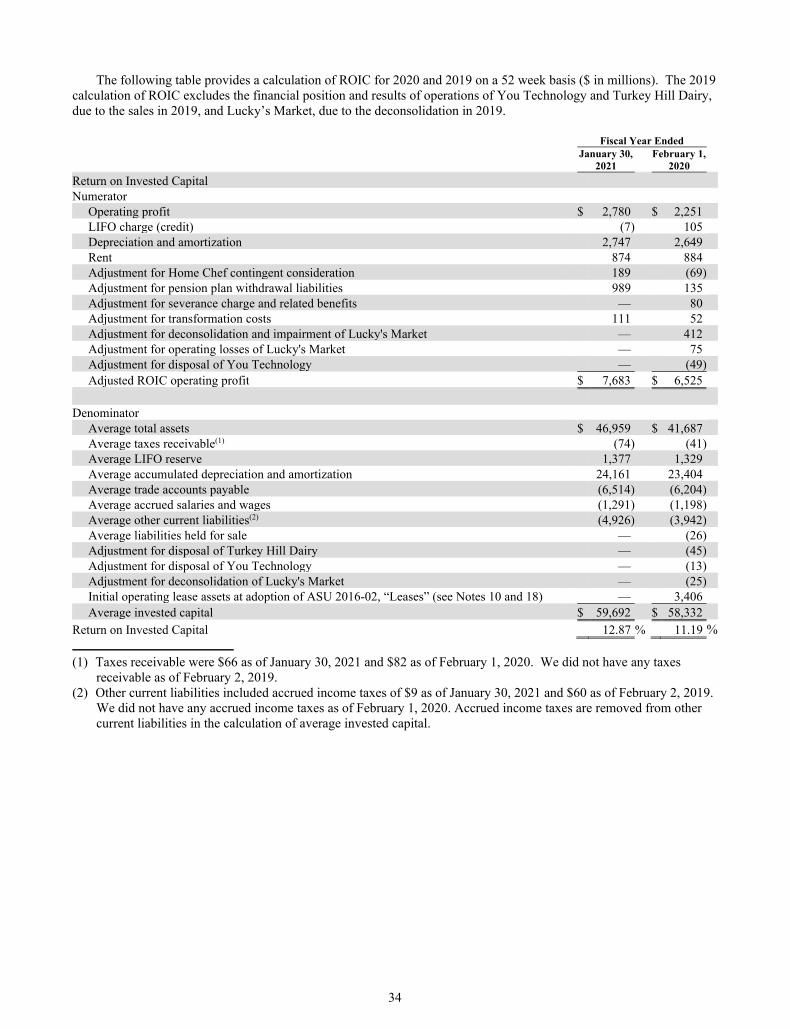
34
The following table provides a calculation of ROIC for 2020 and 2019 on a 52 week basis ($ in millions). The 2019 calculation of ROIC excludes the financial position and results of operations of You Technology and Turkey Hill Dairy, due to the sales in 2019, and Lucky’s Market, due to the deconsolidation in 2019.
Fiscal Year Ended January 30, February 1, 2021 2020
Return on Invested Capital Numerator
Operating profit $ 2,780 $ 2,251 LIFO charge (credit) (7) 105 Depreciation and amortization 2,747 2,649 Rent 874 884 Adjustment for Home Chef contingent consideration 189 (69) Adjustment for pension plan withdrawal liabilities 989 135 Adjustment for severance charge and related benefits — 80 Adjustment for transformation costs 111 52 Adjustment for deconsolidation and impairment of Lucky's Market — 412 Adjustment for operating losses of Lucky's Market — 75 Adjustment for disposal of You Technology — (49) Adjusted ROIC operating profit $ 7,683 $ 6,525
Denominator
Average total assets $ 46,959 $ 41,687 Average taxes receivable(1) (74) (41) Average LIFO reserve 1,377 1,329 Average accumulated depreciation and amortization 24,161 23,404 Average trade accounts payable (6,514) (6,204) Average accrued salaries and wages (1,291) (1,198) Average other current liabilities(2) (4,926) (3,942) Average liabilities held for sale — (26) Adjustment for disposal of Turkey Hill Dairy — (45) Adjustment for disposal of You Technology — (13) Adjustment for deconsolidation of Lucky's Market — (25) Initial operating lease assets at adoption of ASU 2016-02, “Leases” (see Notes 10 and 18) — 3,406 Average invested capital $ 59,692 $ 58,332
Return on Invested Capital 12.87 % 11.19 %
(1) Taxes receivable were $66 as of January 30, 2021 and $82 as of February 1, 2020. We did not have any taxes
receivable as of February 2, 2019. (2) Other current liabilities included accrued income taxes of $9 as of January 30, 2021 and $60 as of February 2, 2019.
We did not have any accrued income taxes as of February 1, 2020. Accrued income taxes are removed from other current liabilities in the calculation of average invested capital.
35
CRITICAL ACCOUNTING POLICIES
We have chosen accounting policies that we believe are appropriate to report accurately and fairly our operating results and financial position, and we apply those accounting policies in a consistent manner. Our significant accounting policies are summarized in Note 1 to the Consolidated Financial Statements.
The preparation of financial statements in conformity with GAAP requires us to make estimates and assumptions that affect the reported amounts of assets, liabilities, revenues, and expenses, and related disclosures of contingent assets and liabilities. We base our estimates on historical experience and other factors we believe to be reasonable under the circumstances, the results of which form the basis for making judgments about the carrying values of assets and liabilities that are not readily apparent from other sources. Actual results could differ from those estimates.
We believe the following accounting policies are the most critical in the preparation of our financial statements because they involve the most difficult, subjective or complex judgments about the effect of matters that are inherently uncertain.
Impairments of Long-Lived Assets
We monitor the carrying value of long-lived assets for potential impairment each quarter based on whether certain
triggering events have occurred. These events include current period losses combined with a history of losses or a projection of continuing losses or a significant decrease in the market value of an asset. When a triggering event occurs, we perform an impairment calculation, comparing projected undiscounted cash flows, utilizing current cash flow information and expected growth rates related to specific stores, to the carrying value for those stores. If we identify impairment for long-lived assets to be held and used, we compare the assets’ current carrying value to the assets’ fair value. Fair value is determined based on market values or discounted future cash flows. We record impairment when the carrying value exceeds fair market value. With respect to owned property and equipment held for disposal, we adjust the value of the property and equipment to reflect recoverable values based on our previous efforts to dispose of similar assets and current economic conditions. We recognize impairment for the excess of the carrying value over the estimated fair market value, reduced by estimated direct costs of disposal.
We recorded asset impairments in the normal course of business totaling $70 million in 2020. In 2019, we
recognized an impairment charge related to Lucky’s Market totaling $238 million. The Lucky’s Market impairment charge consisted of property, plant and equipment of $200 million; goodwill of $19 million; operating lease assets of $11 million; and other charges of $8 million. Additionally, we recorded asset impairments totaling $120 million in 2019, including $70 million of operating lease assets. This 2019 impairment charge included the 35 planned store closures across our footprint in 2020 related to our transformation efforts. We record costs to reduce the carrying value of long-lived assets in the Consolidated Statements of Operations as OG&A expense.
The factors that most significantly affect the impairment calculation are our estimates of future cash flows. Our cash flow projections look several years into the future and include assumptions on variables such as inflation, the economy and market competition. Application of alternative assumptions and definitions, such as reviewing long-lived assets for impairment at a different level, could produce significantly different results.
Business Combinations
We account for business combinations using the acquisition method of accounting. All the assets acquired,
liabilities assumed and amounts attributable to noncontrolling interests are recorded at their respective fair values at the date of acquisition once we obtain control of an entity. The determination of fair values of identifiable assets and liabilities involves estimates and the use of valuation techniques when market value is not readily available. We use various techniques to determine fair value in such instances, including the income approach. Significant estimates used in determining fair value include, but are not limited to, the amount and timing of future cash flows, growth rates, discount rates and useful lives. The excess of the purchase price over fair values of identifiable assets and liabilities is recorded as goodwill. See Note 3 for further information about goodwill.
36
Goodwill
Our goodwill totaled $3.1 billion as of January 30, 2021. We review goodwill for impairment in the fourth quarter of each year, and also upon the occurrence of triggering events. We perform reviews of each of our operating divisions and other consolidated entities (collectively, “reporting units”) that have goodwill balances. Generally, fair value is determined using a multiple of earnings, or discounted projected future cash flows, and we compare fair value to the carrying value of a reporting unit for purposes of identifying potential impairment. We base projected future cash flows on management’s knowledge of the current operating environment and expectations for the future. We recognize goodwill impairment for any excess of a reporting unit's carrying value over its fair value, not to exceed the total amount of goodwill allocated to the reporting unit.
Our annual evaluation of goodwill is performed for our reporting units during the fourth quarter. The 2020 fair
value of our Kroger Specialty Pharmacy reporting unit was estimated using multiple valuation techniques: a discounted cash flow model (income approach), a market multiple model and a comparable mergers and acquisition model (market approaches), with each method weighted in the calculation. The income approach relies on management’s projected future cash flows, estimates of revenue growth rates, margin assumptions and an appropriate discount rate. The market approaches require the determination of an appropriate peer group, which is utilized to derive estimated fair values based on selected market multiples. The annual evaluation of goodwill performed in 2020, 2019 and 2018 did not result in impairment for any of our reporting units. Based on current and future expected cash flows, we believe additional goodwill impairments are not reasonably likely. A 10% reduction in fair value of our reporting units would not indicate a potential for impairment of our goodwill balance.
For additional information relating to our results of the goodwill impairment reviews performed during 2020, 2019 and 2018, see Note 3 to the Consolidated Financial Statements.
The impairment review requires the extensive use of management judgment and financial estimates. Application of alternative estimates and assumptions could produce significantly different results. The cash flow projections embedded in our goodwill impairment reviews can be affected by several factors such as inflation, business valuations in the market, the economy, market competition and our ability to successfully integrate recently acquired businesses.
Multi-Employer Pension Plans
We contribute to various multi-employer pension plans based on obligations arising from collective bargaining agreements. These multi-employer pension plans provide retirement benefits to participants based on their service to contributing employers. The benefits are paid from assets held in trust for that purpose. Trustees are appointed in equal number by employers and unions. The trustees typically are responsible for determining the level of benefits to be provided to participants as well as for such matters as the investment of the assets and the administration of the plans.
We recognize expense in connection with these plans as contributions are funded or when commitments are
probable and reasonably estimable, in accordance with GAAP. We made cash contributions to these plans of $619 million in 2020, $461 million in 2019 and $358 million in 2018. The increase in 2020, compared to 2019 and 2018 is due to the First Quarter 2020 Multi-Employer Pension Contribution.
We continue to evaluate and address our potential exposure to under-funded multi-employer pension plans as it
relates to our associates who are beneficiaries of these plans. These under-fundings are not our liability. When an opportunity arises that is economically feasible and beneficial to us and our associates, we may negotiate the restructuring of under-funded multi-employer pension plan obligations to help stabilize associates’ future benefits and become the fiduciary of the restructured multi-employer pension plan. The commitments from these restructurings do not change our debt profile as it relates to our credit rating since these off-balance sheet commitments are typically considered in our investment grade debt rating. We are currently designated as the named fiduciary of the UFCW Consolidated Pension Plan and the International Brotherhood of Teamsters (“IBT”) Consolidated Pension Fund and have sole investment authority over these assets. Significant effects of these restructuring agreements recorded in our Consolidated Financial Statements are:
In 2020, we incurred a $989 million charge, $754 million net of tax, for commitments to certain multi-employer pension funds.
37
In 2019, we incurred a $135 million charge, $104 million net of tax, for obligations related to withdrawal liabilities for certain multi-employer pension funds.
In 2018, we incurred a $155 million charge, $121 million net of tax, for obligations related to withdrawal
liabilities for certain local unions of the Central States multi-employer pension fund.
As we continue to work to find solutions to under-funded multi-employer pension plans, it is possible we could incur withdrawal liabilities for certain funds.
Based on the most recent information available to us, we believe that the present value of actuarially accrued liabilities in most of the multi-employer plans to which we contribute substantially exceeds the value of the assets held in trust to pay benefits. We have attempted to estimate the amount by which these liabilities exceed the assets, (i.e., the amount of underfunding), as of December 31, 2020. Because we are only one of a number of employers contributing to these plans, we also have attempted to estimate the ratio of our contributions to the total of all contributions to these plans in a year as a way of assessing our “share” of the underfunding. Nonetheless, the underfunding is not a direct obligation or liability of ours or of any employer.
As of December 31, 2020, we estimate our share of the underfunding of multi-employer pension plans to which we
contribute was approximately $1.7 billion, $1.3 billion net of tax. This represents a decrease in the estimated amount of underfunding of approximately $600 million, $500 million net of tax, as of December 31, 2020, compared to December 31, 2019. The decrease in the amount of underfunding is primarily attributable to higher expected returns on assets in the funds during 2020, restructuring of the National Fund and the First Quarter 2020 Multi-Employer Pension Contribution. Our estimate is based on the most current information available to us including actuarial evaluations and other data (that include the estimates of others), and such information may be outdated or otherwise unreliable.
We have made and disclosed this estimate not because, except as noted above, this underfunding is a direct liability of ours. Rather, we believe the underfunding is likely to have important consequences. In the event we were to exit certain markets or otherwise cease making contributions to these plans, we could trigger a substantial withdrawal liability. Any adjustment for withdrawal liability will be recorded when it is probable that a liability exists and can be reasonably estimated, in accordance with GAAP.
The amount of underfunding described above is an estimate and could change based on contract negotiations,
returns on the assets held in the multi-employer pension plans, benefit payments or future restructuring agreements. The amount could decline, and our future expense would be favorably affected, if the values of the assets held in the trust significantly increase or if further changes occur through collective bargaining, trustee action or favorable legislation. On the other hand, our share of the underfunding could increase and our future expense could be adversely affected if the asset values decline, if employers currently contributing to these funds cease participation or if changes occur through collective bargaining, trustee action or adverse legislation. We continue to evaluate our potential exposure to under-funded multi-employer pension plans. Although these liabilities are not a direct obligation or liability of ours, any commitments to fund certain multi-employer pension plans will be expensed when our commitment is probable and an estimate can be made.
See Note 16 to the Consolidated Financial Statements for more information relating to our participation in these multi-employer pension plans. NEW ACCOUNTING STANDARDS
Refer to Note 18 and Note 19 to the Consolidated Financial Statements for recently adopted accounting standards and recently issued accounting standards not yet adopted as of January 30, 2021.
38
LIQUIDITY AND CAPITAL RESOURCES
Cash Flow Information
Net cash provided by operating activities
We generated $6.8 billion of cash from operations in 2020 compared to $4.7 billion in 2019. Net earnings including noncontrolling interests, adjusted for non-cash items and other impacts, generated approximately $5.3 billion of operating cash flow in 2020 compared to $5.0 billion in 2019. Cash provided (used) by operating activities for changes in operating assets and liabilities, including working capital, net of effects from mergers and disposals of businesses was $1.5 billion in 2020 compared to ($312) million in 2019. The increase in cash provided by operating activities for changes in operating assets and liabilities, including working capital, net of effects from mergers and disposals of businesses, was primarily due to the following:
A decrease in FIFO inventory at the end of 2020 due to accelerated timing of inventory sell-through resulting from elevated demand for our products during the pandemic;
An increase in accrued expenses at the end of 2020 primarily due to the following:
o An increase in the current portion of the deferral of the employer portion of social security tax payments as a result of the CARES Act;
o An increase in accrued incentive plan costs at the end of 2020; and
o An increase in the current portion of our commitments due to the National Fund; and
An increase in long-term liabilities at the end of 2020, primarily due to the following:
o An increase in the noncurrent portion of the deferral of the employer portion of social security tax
payments as a result of the CARES Act; and
o An increase in the noncurrent portion of our commitments due to the National Fund; Partially offset by an increase in prepaid and other current assets due to escrow deposits related to the
restructuring of multi-employer pension plans; and
Proceeds from a contract associated with the sale of a business that benefited 2019.
Cash paid for taxes decreased in 2020, compared to 2019, primarily due to the payment of taxes on the gain on sale of the You Technology and Turkey Hill Dairy businesses in 2019.
Cash paid for interest increased in 2020, compared to 2019, primarily due to the timing of certain semi-annual
senior note interest payments that were paid during the first quarter of 2020 which were accrued as of the end of fiscal year 2019.
Net cash used by investing activities
Investing activities used cash of $2.8 billion in 2020 compared to $2.6 billion in 2019. The amount of cash used by
investing activities increased in 2020, compared to 2019, primarily due to the following:
Decreased proceeds from the sale of assets in 2020 compared to 2019; and
Proceeds from the sale of businesses that benefited 2019, partially offset by Payments for property and equipment continued at a slower pace in 2020 due to disruptions from the
pandemic. However, increased purchase activity near the end of the year resulted in an increase in construction-in-progress payables as of year-end 2020 compared to 2019.
39
Net cash used by financing activities
We used $2.7 billion of cash for financing activities in 2020 compared to $2.1 billion during 2019. The amount of cash used for financing activities for 2020, compared to 2019, increased primarily due to increased payments on commercial paper and share repurchases, partially offset by increased proceeds from the issuance of long-term debt and decreased payments on long-term debt.
Debt Management
Total debt, including both the current and long-term portions of obligations under finance leases, decreased $663
million to $13.4 billion as of year-end 2020 compared to 2019. The decrease in 2020, compared to 2019, resulted primarily from net payments on commercial paper borrowings of $1.2 billion and payment of $700 million of senior notes bearing an interest rate of 3.30%, partially offset by the issuance of $500 million of senior notes bearing an interest rate of 2.20%, the issuance of $500 million of senior notes bearing an interest rate of 1.70% and a net increase in obligations under finance leases of $183 million.
Dividends
The following table provides dividend information ($ in millions, except per share amounts):
2020 2019
Cash dividends paid $ 534 $ 486 Cash dividends paid per common share $ 0.68 $ 0.60
Liquidity Needs
Based on current operating trends, we believe that cash flows from operating activities and other sources of
liquidity, including borrowings under our commercial paper program and bank credit facility, will be adequate to meet our liquidity needs for the next twelve months and for the foreseeable future beyond the next twelve months. Our liquidity needs include anticipated requirements for working capital, capital investments, pension plan commitments, interest payments and scheduled principal payments of debt and commercial paper, offset by cash and temporary cash investments on hand at the end of 2020. We generally operate with a working capital deficit due to our efficient use of cash in funding operations and because we have consistent access to the capital markets. We have approximately $800 million of senior notes maturing in the next twelve months, $311 million of the employer portion of social security tax payments we have deferred under the CARES act that is required to be paid by December 31, 2021 and expect to pay approximately $307 million in the first half of 2021 to satisfy a portion of the National Fund commitment. We expect to satisfy these obligations using cash generated from operations, temporary cash investments on hand, or through the issuance of additional senior notes or commercial paper. We believe we have adequate coverage of our debt covenants to continue to maintain our current investment grade debt ratings and to respond effectively to competitive conditions.
We held cash and temporary cash investments of $1.7 billion as of the end of 2020 which reflects our elevated operating performance and significant improvements in working capital. We remain committed to our dividend and share repurchase program and we will evaluate the optimal use of any excess free cash flow, consistent with our previously stated capital allocation strategy.
The CARES Act, which was enacted on March 27, 2020, includes measures to assist companies in response to the COVID-19 pandemic. These measures include deferring the due dates of tax payments and other changes to income and non-income-based tax laws. As permitted under the CARES Act, we are deferring the remittance of the employer portion of the social security tax. The social security tax provision requires that the deferred employment tax be paid over two years, with half of the amount required to be paid by December 31, 2021 and the other half by December 31, 2022. During 2020, we deferred the employer portion of social security tax of $622 million. Of the total, $311 million is included in “Other current liabilities” and $311 million is included in “Other long-term liabilities” in our Consolidated Balance Sheets.
For additional information about our debt activity in 2020, including the drawdown and repayments under our revolving credit facility, forward-starting interest rate swap agreements and our senior notes issuances, see Note 6 to the Consolidated Financial Statements.
40
Factors Affecting Liquidity
We can currently borrow on a daily basis approximately $2.75 billion under our commercial paper program. At January 30, 2021, we had no outstanding commercial paper. Commercial paper borrowings are backed by our credit facility and reduce the amount we can borrow under the credit facility. If our short-term credit ratings fall, the ability to borrow under our current commercial paper program could be adversely affected for a period of time and increase our interest cost on daily borrowings under our commercial paper program. This could require us to borrow additional funds under the credit facility, under which we believe we have sufficient capacity. However, in the event of a ratings decline, we do not anticipate that our borrowing capacity under our commercial paper program would be any lower than $500 million on a daily basis. Although our ability to borrow under the credit facility is not affected by our credit rating, the interest cost and applicable margin on borrowings under the credit facility could be affected by a downgrade in our Public Debt Rating. “Public Debt Rating” means, as of any date, the rating that has been most recently announced by either S&P or Moody’s, as the case may be, for any class of non-credit enhanced long-term senior unsecured debt issued by the Company. As of March 24, 2021, we had no commercial paper borrowings outstanding.
Our credit facility requires the maintenance of a Leverage Ratio and a Fixed Charge Coverage Ratio (our “financial covenants”). A failure to maintain our financial covenants would impair our ability to borrow under the credit facility. These financial covenants are described below:
Our Leverage Ratio (the ratio of Net Debt to Adjusted EBITDA, as defined in the credit facility) was 1.63 to 1 as of January 30, 2021. If this ratio were to exceed 3.50 to 1, we would be in default of our credit facility and our ability to borrow under the facility would be impaired.
Our Fixed Charge Coverage Ratio (the ratio of Adjusted EBITDA plus Consolidated Rental Expense to
Consolidated Cash Interest Expense plus Consolidated Rental Expense, as defined in the credit facility) was 5.37 to 1 as of January 30, 2021. If this ratio fell below 1.70 to 1, we would be in default of our credit facility and our ability to borrow under the facility would be impaired.
Our credit facility is more fully described in Note 6 to the Consolidated Financial Statements. We were in
compliance with our financial covenants at year-end 2020.
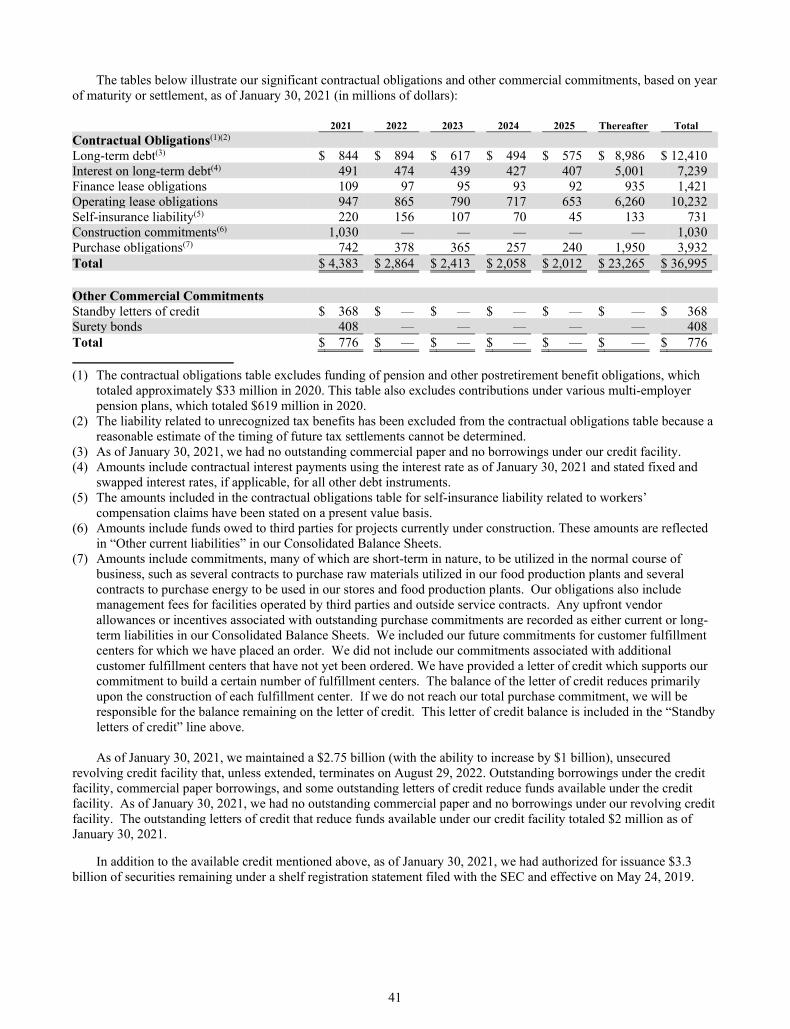
41
The tables below illustrate our significant contractual obligations and other commercial commitments, based on year of maturity or settlement, as of January 30, 2021 (in millions of dollars):
2021 2022 2023 2024 2025 Thereafter Total
Contractual Obligations(1)(2) Long-term debt(3) $ 844 $ 894 $ 617 $ 494 $ 575 $ 8,986 $ 12,410 Interest on long-term debt(4) 491 474 439 427 407 5,001 7,239 Finance lease obligations 109 97 95 93 92 935 1,421 Operating lease obligations 947 865 790 717 653 6,260 10,232 Self-insurance liability(5) 220 156 107 70 45 133 731 Construction commitments(6) 1,030 — — — — — 1,030 Purchase obligations(7) 742 378 365 257 240 1,950 3,932 Total $ 4,383 $ 2,864 $ 2,413 $ 2,058 $ 2,012 $ 23,265 $ 36,995 Other Commercial Commitments Standby letters of credit $ 368 $ — $ — $ — $ — $ — $ 368 Surety bonds 408 — — — — — 408 Total $ 776 $ — $ — $ — $ — $ — $ 776
(1) The contractual obligations table excludes funding of pension and other postretirement benefit obligations, which
totaled approximately $33 million in 2020. This table also excludes contributions under various multi-employer pension plans, which totaled $619 million in 2020.
(2) The liability related to unrecognized tax benefits has been excluded from the contractual obligations table because a reasonable estimate of the timing of future tax settlements cannot be determined.
(3) As of January 30, 2021, we had no outstanding commercial paper and no borrowings under our credit facility. (4) Amounts include contractual interest payments using the interest rate as of January 30, 2021 and stated fixed and
swapped interest rates, if applicable, for all other debt instruments. (5) The amounts included in the contractual obligations table for self-insurance liability related to workers’
compensation claims have been stated on a present value basis. (6) Amounts include funds owed to third parties for projects currently under construction. These amounts are reflected
in “Other current liabilities” in our Consolidated Balance Sheets. (7) Amounts include commitments, many of which are short-term in nature, to be utilized in the normal course of
business, such as several contracts to purchase raw materials utilized in our food production plants and several contracts to purchase energy to be used in our stores and food production plants. Our obligations also include management fees for facilities operated by third parties and outside service contracts. Any upfront vendor allowances or incentives associated with outstanding purchase commitments are recorded as either current or long-term liabilities in our Consolidated Balance Sheets. We included our future commitments for customer fulfillment centers for which we have placed an order. We did not include our commitments associated with additional customer fulfillment centers that have not yet been ordered. We have provided a letter of credit which supports our commitment to build a certain number of fulfillment centers. The balance of the letter of credit reduces primarily upon the construction of each fulfillment center. If we do not reach our total purchase commitment, we will be responsible for the balance remaining on the letter of credit. This letter of credit balance is included in the “Standby letters of credit” line above. As of January 30, 2021, we maintained a $2.75 billion (with the ability to increase by $1 billion), unsecured
revolving credit facility that, unless extended, terminates on August 29, 2022. Outstanding borrowings under the credit facility, commercial paper borrowings, and some outstanding letters of credit reduce funds available under the credit facility. As of January 30, 2021, we had no outstanding commercial paper and no borrowings under our revolving credit facility. The outstanding letters of credit that reduce funds available under our credit facility totaled $2 million as of January 30, 2021.
In addition to the available credit mentioned above, as of January 30, 2021, we had authorized for issuance $3.3 billion of securities remaining under a shelf registration statement filed with the SEC and effective on May 24, 2019.
42
We also maintain surety bonds related primarily to our self-insured workers’ compensation claims. These bonds are required by most states in which we are self-insured for workers’ compensation and are placed with predominately third-party insurance providers to insure payment of our obligations in the event we are unable to meet our claim payment obligations up to our self-insured retention levels. These bonds do not represent liabilities of ours, as we already have reserves on our books for the claims costs. Market changes may make the surety bonds more costly and, in some instances, availability of these bonds may become more limited, which could affect our costs of, or access to, such bonds. Although we do not believe increased costs or decreased availability would significantly affect our ability to access these surety bonds, if this does become an issue, we would issue letters of credit, in states where allowed, against our credit facility to meet the state bonding requirements. This could increase our cost and decrease the funds available under our credit facility.
We also are contingently liable for leases that have been assigned to various third parties in connection with facility closings and dispositions. We could be required to satisfy obligations under the leases if any of the assignees are unable to fulfill their lease obligations. Due to the wide distribution of our assignments among third parties, and various other remedies available to us, we believe the likelihood that we will be required to assume a material amount of these obligations is remote. We have agreed to indemnify certain third-party logistics operators for certain expenses, including multi-employer pension plan obligations and withdrawal liabilities.
In addition to the above, we enter into various indemnification agreements and take on indemnification obligations in the ordinary course of business. Such arrangements include indemnities against third-party claims arising out of agreements to provide services to us; indemnities related to the sale of our securities; indemnities of directors, officers and employees in connection with the performance of their work; and indemnities of individuals serving as fiduciaries on benefit plans. While our aggregate indemnification obligation could result in a material liability, we are not aware of any current matter that could result in a material liability.
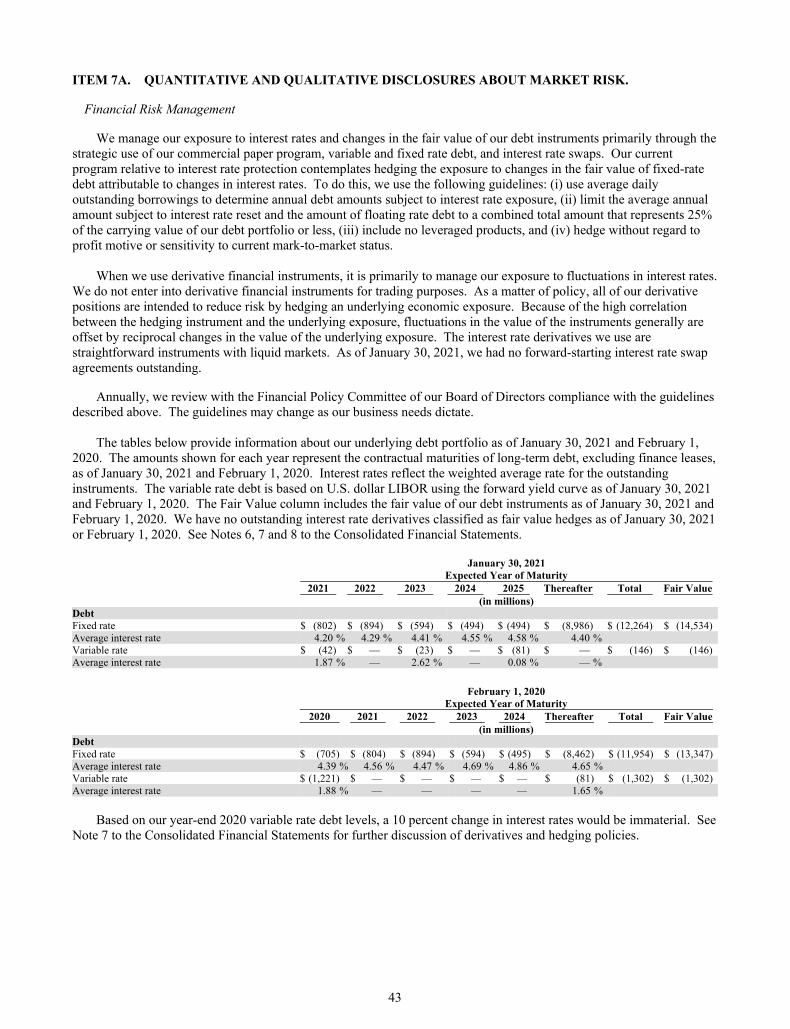
43
ITEM 7A. QUANTITATIVE AND QUALITATIVE DISCLOSURES ABOUT MARKET RISK.
Financial Risk Management
We manage our exposure to interest rates and changes in the fair value of our debt instruments primarily through the strategic use of our commercial paper program, variable and fixed rate debt, and interest rate swaps. Our current program relative to interest rate protection contemplates hedging the exposure to changes in the fair value of fixed-rate debt attributable to changes in interest rates. To do this, we use the following guidelines: (i) use average daily outstanding borrowings to determine annual debt amounts subject to interest rate exposure, (ii) limit the average annual amount subject to interest rate reset and the amount of floating rate debt to a combined total amount that represents 25% of the carrying value of our debt portfolio or less, (iii) include no leveraged products, and (iv) hedge without regard to profit motive or sensitivity to current mark-to-market status.
When we use derivative financial instruments, it is primarily to manage our exposure to fluctuations in interest rates.
We do not enter into derivative financial instruments for trading purposes. As a matter of policy, all of our derivative positions are intended to reduce risk by hedging an underlying economic exposure. Because of the high correlation between the hedging instrument and the underlying exposure, fluctuations in the value of the instruments generally are offset by reciprocal changes in the value of the underlying exposure. The interest rate derivatives we use are straightforward instruments with liquid markets. As of January 30, 2021, we had no forward-starting interest rate swap agreements outstanding.
Annually, we review with the Financial Policy Committee of our Board of Directors compliance with the guidelines described above. The guidelines may change as our business needs dictate.
The tables below provide information about our underlying debt portfolio as of January 30, 2021 and February 1,
2020. The amounts shown for each year represent the contractual maturities of long-term debt, excluding finance leases, as of January 30, 2021 and February 1, 2020. Interest rates reflect the weighted average rate for the outstanding instruments. The variable rate debt is based on U.S. dollar LIBOR using the forward yield curve as of January 30, 2021 and February 1, 2020. The Fair Value column includes the fair value of our debt instruments as of January 30, 2021 and February 1, 2020. We have no outstanding interest rate derivatives classified as fair value hedges as of January 30, 2021 or February 1, 2020. See Notes 6, 7 and 8 to the Consolidated Financial Statements.
January 30, 2021 Expected Year of Maturity 2021 2022 2023 2024 2025 Thereafter Total Fair Value (in millions) Debt Fixed rate $ (802) $ (894) $ (594) $ (494) $ (494) $ (8,986) $ (12,264) $ (14,534) Average interest rate 4.20 % 4.29 % 4.41 % 4.55 % 4.58 % 4.40 % Variable rate $ (42) $ — $ (23) $ — $ (81) $ — $ (146) $ (146) Average interest rate 1.87 % — 2.62 % — 0.08 % — %
February 1, 2020 Expected Year of Maturity 2020 2021 2022 2023 2024 Thereafter Total Fair Value (in millions) Debt Fixed rate $ (705) $ (804) $ (894) $ (594) $ (495) $ (8,462) $ (11,954) $ (13,347) Average interest rate 4.39 % 4.56 % 4.47 % 4.69 % 4.86 % 4.65 % Variable rate $ (1,221) $ — $ — $ — $ — $ (81) $ (1,302) $ (1,302) Average interest rate 1.88 % — — — — 1.65 %
Based on our year-end 2020 variable rate debt levels, a 10 percent change in interest rates would be immaterial. See
Note 7 to the Consolidated Financial Statements for further discussion of derivatives and hedging policies.
44
ITEM 8. FINANCIAL STATEMENTS AND SUPPLEMENTARY DATA
Consolidated Financial Statements of The Kroger Co. For the Fiscal Year Ended January 30, 2021
Table of Contents
Page Report of Independent Registered Public Accounting Firm 45 Consolidated Balance Sheets 48 Consolidated Statements of Operations 49 Consolidated Statements of Comprehensive Income 50 Consolidated Statements of Cash Flows 51 Consolidated Statements of Changes in Shareholders’ Equity 52 Notes to Consolidated Financial Statements 53
45
Report of Independent Registered Public Accounting Firm To the Board of Directors and Shareholders of The Kroger Co.
Opinions on the Financial Statements and Internal Control over Financial Reporting We have audited the accompanying consolidated balance sheets of The Kroger Co. and its subsidiaries (the “Company”) as of January 30, 2021 and February 1, 2020, and the related consolidated statements of operations, of comprehensive income, of changes in shareholders' equity and of cash flows for each of the three years in the period ended January 30, 2021, including the related notes (collectively referred to as the “consolidated financial statements”). We also have audited the Company's internal control over financial reporting as of January 30, 2021 based on criteria established in Internal Control - Integrated Framework (2013) issued by the Committee of Sponsoring Organizations of the Treadway Commission (COSO).
In our opinion, the consolidated financial statements referred to above present fairly, in all material respects, the financial position of the Company as of January 30, 2021 and February 1, 2020, and the results of its operations and its cash flows for each of the three years in the period ended January 30, 2021 in conformity with accounting principles generally accepted in the United States of America. Also in our opinion, the Company maintained, in all material respects, effective internal control over financial reporting as of January 30, 2021, based on criteria established in Internal Control - Integrated Framework (2013) issued by the COSO.
Changes in Accounting Principles As discussed in Note 18 to the consolidated financial statements, the Company changed the manner in which it accounts for leases in 2019 and the manner in which it accounts for revenues from contracts with customers in 2018.
Basis for Opinions The Company's management is responsible for these consolidated financial statements, for maintaining effective internal control over financial reporting, and for its assessment of the effectiveness of internal control over financial reporting, included in Management’s Report on Internal Control Over Financial Reporting appearing under Item 9A. Our responsibility is to express opinions on the Company’s consolidated financial statements and on the Company's internal control over financial reporting based on our audits. We are a public accounting firm registered with the Public Company Accounting Oversight Board (United States) (PCAOB) and are required to be independent with respect to the Company in accordance with the U.S. federal securities laws and the applicable rules and regulations of the Securities and Exchange Commission and the PCAOB.
We conducted our audits in accordance with the standards of the PCAOB. Those standards require that we plan and perform the audits to obtain reasonable assurance about whether the consolidated financial statements are free of material misstatement, whether due to error or fraud, and whether effective internal control over financial reporting was maintained in all material respects.
Our audits of the consolidated financial statements included performing procedures to assess the risks of material misstatement of the consolidated financial statements, whether due to error or fraud, and performing procedures that respond to those risks. Such procedures included examining, on a test basis, evidence regarding the amounts and disclosures in the consolidated financial statements. Our audits also included evaluating the accounting principles used and significant estimates made by management, as well as evaluating the overall presentation of the consolidated financial statements. Our audit of internal control over financial reporting included obtaining an understanding of internal control over financial reporting, assessing the risk that a material weakness exists, and testing and evaluating the design and operating effectiveness of internal control based on the assessed risk. Our audits also included performing such other procedures as we considered necessary in the circumstances. We believe that our audits provide a reasonable basis for our opinions.
46
Definition and Limitations of Internal Control over Financial Reporting A company’s internal control over financial reporting is a process designed to provide reasonable assurance regarding the reliability of financial reporting and the preparation of financial statements for external purposes in accordance with generally accepted accounting principles. A company’s internal control over financial reporting includes those policies and procedures that (i) pertain to the maintenance of records that, in reasonable detail, accurately and fairly reflect the transactions and dispositions of the assets of the company; (ii) provide reasonable assurance that transactions are recorded as necessary to permit preparation of financial statements in accordance with generally accepted accounting principles, and that receipts and expenditures of the company are being made only in accordance with authorizations of management and directors of the company; and (iii) provide reasonable assurance regarding prevention or timely detection of unauthorized acquisition, use, or disposition of the company’s assets that could have a material effect on the financial statements.
Because of its inherent limitations, internal control over financial reporting may not prevent or detect misstatements. Also, projections of any evaluation of effectiveness to future periods are subject to the risk that controls may become inadequate because of changes in conditions, or that the degree of compliance with the policies or procedures may deteriorate.
Critical Audit Matters The critical audit matter communicated below is a matter arising from the current period audit of the consolidated financial statements that was communicated or required to be communicated to the audit committee and that (i) relates to accounts or disclosures that are material to the consolidated financial statements and (ii) involved our especially challenging, subjective, or complex judgments. The communication of critical audit matters does not alter in any way our opinion on the consolidated financial statements, taken as a whole, and we are not, by communicating the critical audit matter below, providing a separate opinion on the critical audit matter or on the accounts or disclosures to which it relates. Goodwill Impairment Assessment – Kroger Specialty Pharmacy (“KSP”) Reporting Unit As described in Notes 1 and 3 to the consolidated financial statements, the Company’s consolidated goodwill balance was $3.1 billion as of January 30, 2021, a portion of which is allocated to the KSP reporting unit. Management reviews goodwill annually for impairment in the fourth quarter of each year, and also upon the occurrence of triggering events. The fair value of a reporting unit is compared to its carrying value for purposes of identifying potential impairment. Goodwill impairment is recognized for any excess of the reporting unit’s carrying value over its fair value, not to exceed the total amount of goodwill allocated to the reporting unit. As disclosed by management, the fair value of the Company's KSP reporting unit was estimated using multiple valuation techniques, a discounted cash flow model (income approach), a market multiple model and comparable mergers and acquisition model (market approaches), with each method weighted in the calculation. The income approach relies on management’s estimates of revenue growth rates, margin assumptions, and discount rate to estimate future cash flows. The market approaches require the determination of an appropriate peer group, which is utilized to derive estimated fair values based on selected market multiples. The principal considerations for our determination that performing procedures relating to the goodwill impairment assessment of the KSP reporting unit is a critical audit matter are (i) the significant judgment by management when developing the fair value measurement of the reporting unit; (ii) the high degree of auditor judgment, subjectivity, and effort in performing procedures to evaluate management’s cash flow projections and significant assumptions related to revenue growth rates, margin assumptions, discount rate, peer group determination, and market multiple selection; and (iii) the audit effort involved the use of professionals with specialized skill and knowledge.
47
Addressing the matter involved performing procedures and evaluating audit evidence in connection with forming our overall opinion on the consolidated financial statements. These procedures included testing the effectiveness of controls relating to management’s goodwill impairment assessment, including controls over the valuation of the Company’s KSP reporting unit. These procedures also included, among others, testing management’s process for developing the fair value estimate, evaluating the appropriateness of the income and market approach models, testing the completeness and accuracy of the underlying data used in the models and evaluating the reasonableness of significant assumptions used by management related to the revenue growth rates, margin assumptions, discount rate, peer group determination, and market multiple selection. Evaluating management’s assumptions relating to revenue growth rates and margin assumptions involved evaluating whether the assumptions used by management were reasonable considering (i) the current and past performance of the reporting unit, (ii) the consistency with external market and industry data, and (iii) whether these assumptions were consistent with evidence obtained in other areas of the audit. Evaluating the Company’s peer group determinations included evaluating the appropriateness of the identified peer companies. Professionals with specialized skill and knowledge were used to assist in evaluating the appropriateness of the discounted cash flow and market models and evaluating the reasonableness of certain significant assumptions related to the discount rate, peer group determination, and market multiples. /s/ PricewaterhouseCoopers LLP Cincinnati, Ohio March 30, 2021 We have served as the Company’s auditor since 1929.
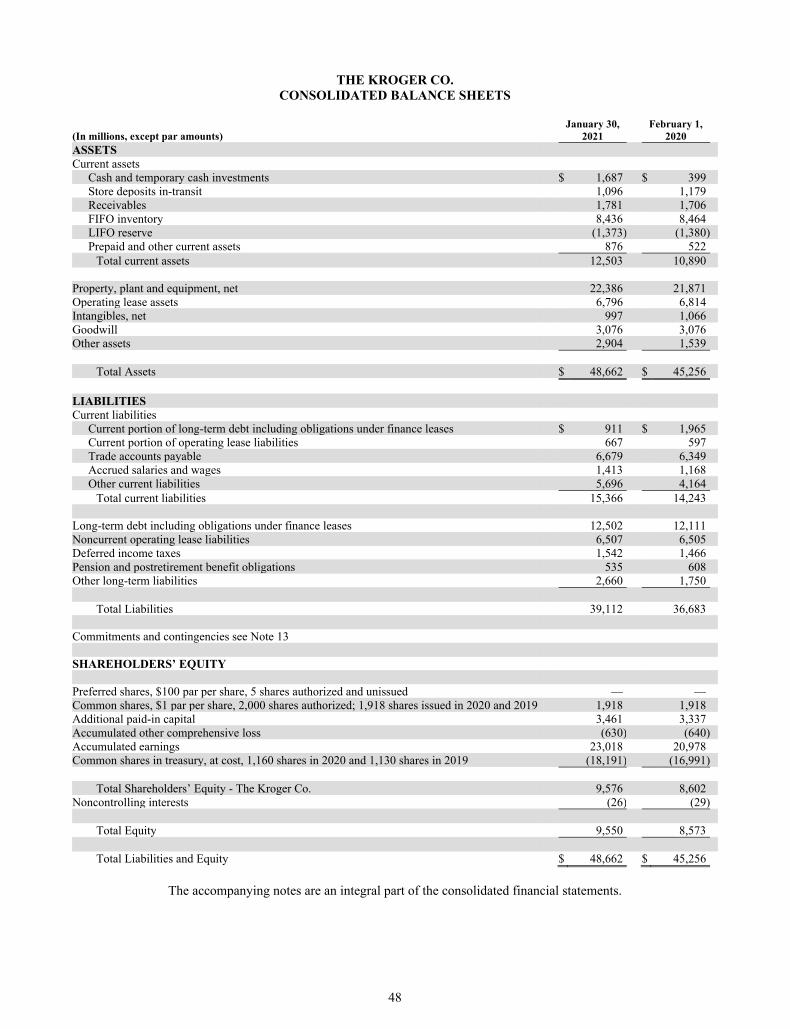
48
THE KROGER CO. CONSOLIDATED BALANCE SHEETS
January 30, February 1, (In millions, except par amounts) 2021 2020 ASSETS Current assets
Cash and temporary cash investments $ 1,687 $ 399 Store deposits in-transit 1,096 1,179 Receivables 1,781 1,706 FIFO inventory 8,436 8,464 LIFO reserve (1,373) (1,380) Prepaid and other current assets 876 522
Total current assets 12,503 10,890 Property, plant and equipment, net 22,386 21,871 Operating lease assets 6,796 6,814 Intangibles, net 997 1,066 Goodwill 3,076 3,076 Other assets 2,904 1,539
Total Assets $ 48,662 $ 45,256 LIABILITIES Current liabilities
Current portion of long-term debt including obligations under finance leases $ 911 $ 1,965 Current portion of operating lease liabilities 667 597 Trade accounts payable 6,679 6,349 Accrued salaries and wages 1,413 1,168 Other current liabilities 5,696 4,164
Total current liabilities 15,366 14,243 Long-term debt including obligations under finance leases 12,502 12,111 Noncurrent operating lease liabilities 6,507 6,505 Deferred income taxes 1,542 1,466 Pension and postretirement benefit obligations 535 608 Other long-term liabilities 2,660 1,750
Total Liabilities 39,112 36,683 Commitments and contingencies see Note 13 SHAREHOLDERS’ EQUITY Preferred shares, $100 par per share, 5 shares authorized and unissued — — Common shares, $1 par per share, 2,000 shares authorized; 1,918 shares issued in 2020 and 2019 1,918 1,918 Additional paid-in capital 3,461 3,337 Accumulated other comprehensive loss (630) (640) Accumulated earnings 23,018 20,978 Common shares in treasury, at cost, 1,160 shares in 2020 and 1,130 shares in 2019 (18,191) (16,991)
Total Shareholders’ Equity - The Kroger Co. 9,576 8,602 Noncontrolling interests (26) (29)
Total Equity 9,550 8,573
Total Liabilities and Equity $ 48,662 $ 45,256
The accompanying notes are an integral part of the consolidated financial statements.
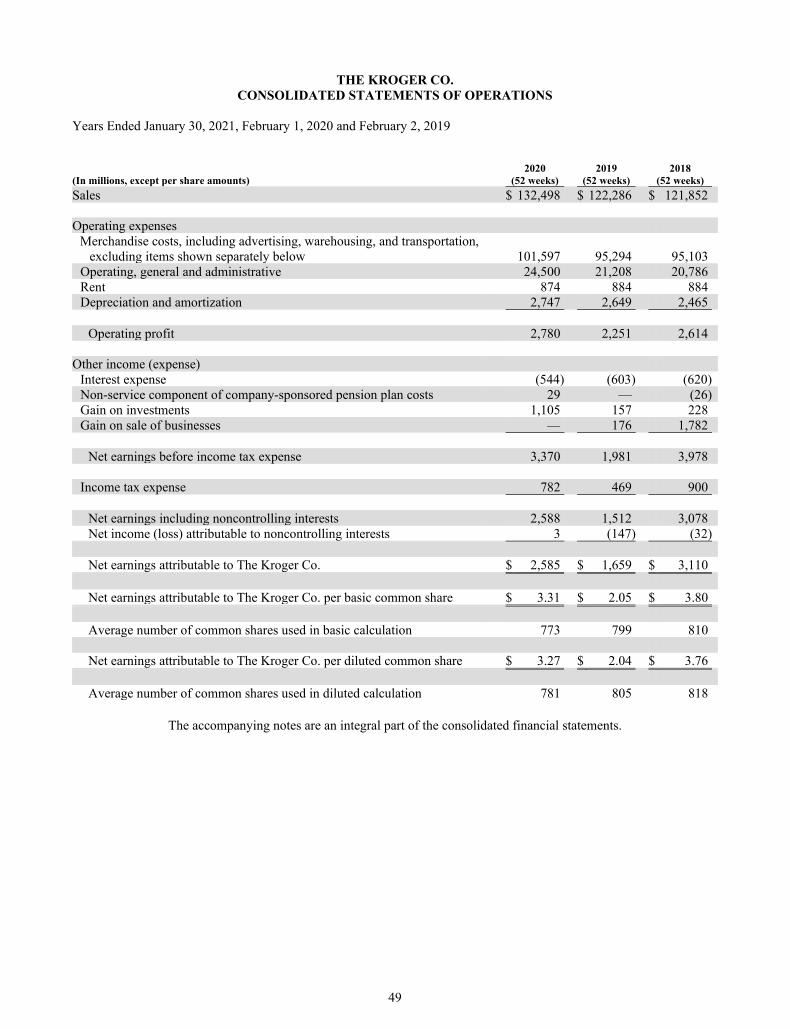
49
THE KROGER CO. CONSOLIDATED STATEMENTS OF OPERATIONS
Years Ended January 30, 2021, February 1, 2020 and February 2, 2019
2020 2019 2018 (In millions, except per share amounts) (52 weeks) (52 weeks) (52 weeks)
Sales $ 132,498 $ 122,286 $ 121,852 Operating expenses
Merchandise costs, including advertising, warehousing, and transportation, excluding items shown separately below 101,597 95,294 95,103
Operating, general and administrative 24,500 21,208 20,786 Rent 874 884 884 Depreciation and amortization 2,747 2,649 2,465
Operating profit 2,780 2,251 2,614
Other income (expense) Interest expense (544) (603) (620) Non-service component of company-sponsored pension plan costs 29 — (26) Gain on investments 1,105 157 228 Gain on sale of businesses — 176 1,782
Net earnings before income tax expense 3,370 1,981 3,978
Income tax expense 782 469 900
Net earnings including noncontrolling interests 2,588 1,512 3,078 Net income (loss) attributable to noncontrolling interests 3 (147) (32)
Net earnings attributable to The Kroger Co. $ 2,585 $ 1,659 $ 3,110
Net earnings attributable to The Kroger Co. per basic common share $ 3.31 $ 2.05 $ 3.80
Average number of common shares used in basic calculation 773 799 810
Net earnings attributable to The Kroger Co. per diluted common share $ 3.27 $ 2.04 $ 3.76
Average number of common shares used in diluted calculation 781 805 818
The accompanying notes are an integral part of the consolidated financial statements.
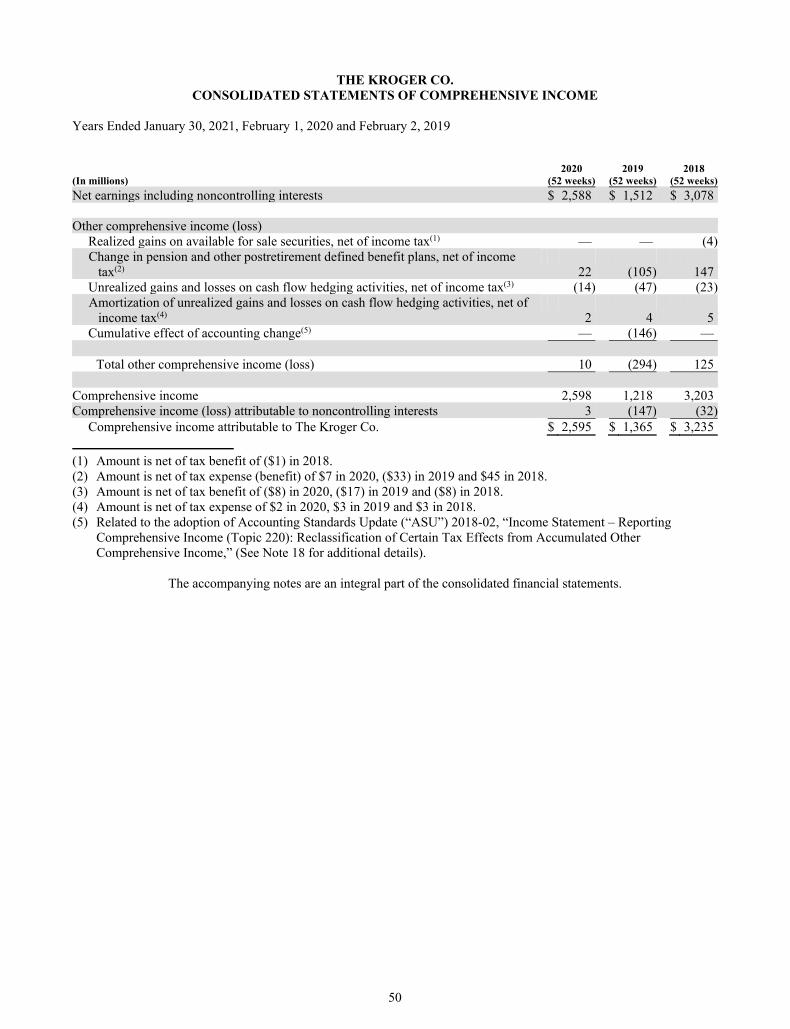
50
THE KROGER CO. CONSOLIDATED STATEMENTS OF COMPREHENSIVE INCOME
Years Ended January 30, 2021, February 1, 2020 and February 2, 2019
2020 2019 2018 (In millions) (52 weeks) (52 weeks) (52 weeks)
Net earnings including noncontrolling interests $ 2,588 $ 1,512 $ 3,078 Other comprehensive income (loss)
Realized gains on available for sale securities, net of income tax(1) — — (4)Change in pension and other postretirement defined benefit plans, net of income
tax(2) 22 (105) 147 Unrealized gains and losses on cash flow hedging activities, net of income tax(3) (14) (47) (23)Amortization of unrealized gains and losses on cash flow hedging activities, net of
income tax(4) 2 4 5 Cumulative effect of accounting change(5) — (146) —
Total other comprehensive income (loss) 10 (294) 125
Comprehensive income 2,598 1,218 3,203 Comprehensive income (loss) attributable to noncontrolling interests 3 (147) (32)
Comprehensive income attributable to The Kroger Co. $ 2,595 $ 1,365 $ 3,235
(1) Amount is net of tax benefit of ($1) in 2018. (2) Amount is net of tax expense (benefit) of $7 in 2020, ($33) in 2019 and $45 in 2018. (3) Amount is net of tax benefit of ($8) in 2020, ($17) in 2019 and ($8) in 2018. (4) Amount is net of tax expense of $2 in 2020, $3 in 2019 and $3 in 2018. (5) Related to the adoption of Accounting Standards Update (“ASU”) 2018-02, “Income Statement – Reporting
Comprehensive Income (Topic 220): Reclassification of Certain Tax Effects from Accumulated Other Comprehensive Income,” (See Note 18 for additional details).
The accompanying notes are an integral part of the consolidated financial statements.
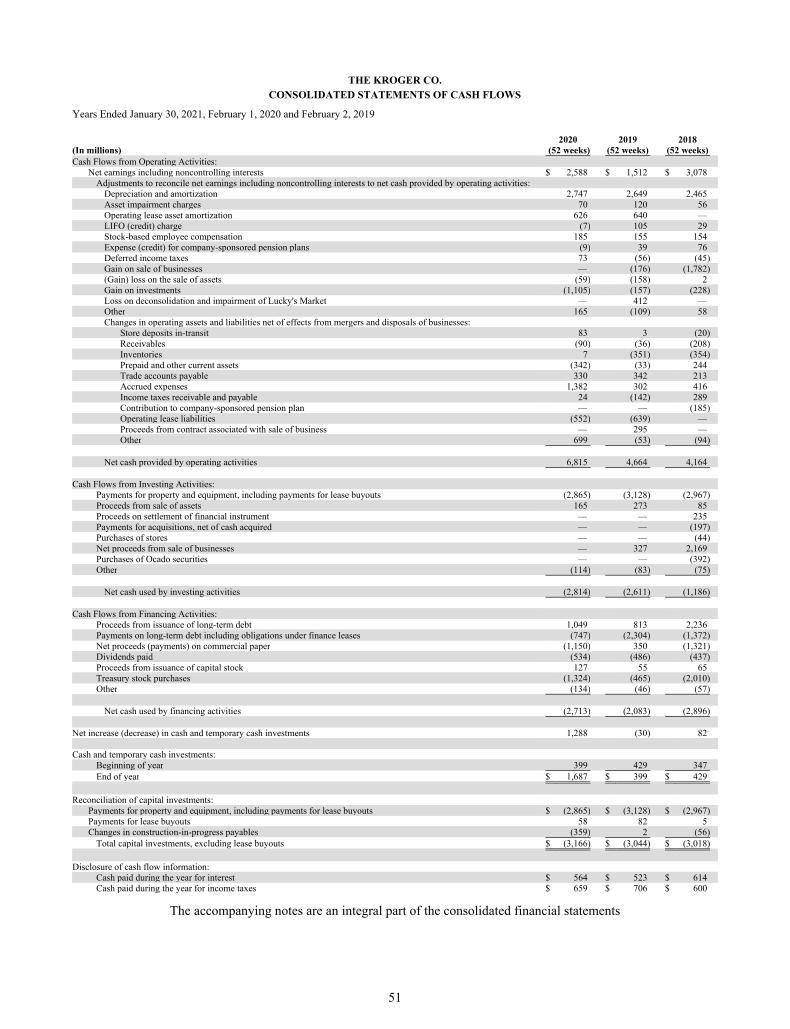
51
THE KROGER CO. CONSOLIDATED STATEMENTS OF CASH FLOWS
Years Ended January 30, 2021, February 1, 2020 and February 2, 2019
2020 2019 2018 (In millions) (52 weeks) (52 weeks) (52 weeks) Cash Flows from Operating Activities:
Net earnings including noncontrolling interests $ 2,588 $ 1,512 $ 3,078 Adjustments to reconcile net earnings including noncontrolling interests to net cash provided by operating activities:
Depreciation and amortization 2,747 2,649 2,465 Asset impairment charges 70 120 56 Operating lease asset amortization 626 640 — LIFO (credit) charge (7) 105 29 Stock-based employee compensation 185 155 154 Expense (credit) for company-sponsored pension plans (9) 39 76 Deferred income taxes 73 (56) (45) Gain on sale of businesses — (176) (1,782) (Gain) loss on the sale of assets (59) (158) 2 Gain on investments (1,105) (157) (228) Loss on deconsolidation and impairment of Lucky's Market — 412 — Other 165 (109) 58 Changes in operating assets and liabilities net of effects from mergers and disposals of businesses:
Store deposits in-transit 83 3 (20) Receivables (90) (36) (208) Inventories 7 (351) (354) Prepaid and other current assets (342) (33) 244 Trade accounts payable 330 342 213 Accrued expenses 1,382 302 416 Income taxes receivable and payable 24 (142) 289 Contribution to company-sponsored pension plan — — (185) Operating lease liabilities (552) (639) — Proceeds from contract associated with sale of business — 295 — Other 699 (53) (94)
Net cash provided by operating activities 6,815 4,664 4,164
Cash Flows from Investing Activities: Payments for property and equipment, including payments for lease buyouts (2,865) (3,128) (2,967) Proceeds from sale of assets 165 273 85 Proceeds on settlement of financial instrument — — 235 Payments for acquisitions, net of cash acquired — — (197) Purchases of stores — — (44) Net proceeds from sale of businesses — 327 2,169 Purchases of Ocado securities — — (392) Other (114) (83) (75)
Net cash used by investing activities (2,814) (2,611) (1,186)
Cash Flows from Financing Activities: Proceeds from issuance of long-term debt 1,049 813 2,236 Payments on long-term debt including obligations under finance leases (747) (2,304) (1,372) Net proceeds (payments) on commercial paper (1,150) 350 (1,321) Dividends paid (534) (486) (437) Proceeds from issuance of capital stock 127 55 65 Treasury stock purchases (1,324) (465) (2,010) Other (134) (46) (57)
Net cash used by financing activities (2,713) (2,083) (2,896)
Net increase (decrease) in cash and temporary cash investments 1,288 (30) 82
Cash and temporary cash investments: Beginning of year 399 429 347 End of year $ 1,687 $ 399 $ 429
Reconciliation of capital investments: Payments for property and equipment, including payments for lease buyouts $ (2,865) $ (3,128) $ (2,967) Payments for lease buyouts 58 82 5 Changes in construction-in-progress payables (359) 2 (56)
Total capital investments, excluding lease buyouts $ (3,166) $ (3,044) $ (3,018)
Disclosure of cash flow information: Cash paid during the year for interest $ 564 $ 523 $ 614 Cash paid during the year for income taxes $ 659 $ 706 $ 600
The accompanying notes are an integral part of the consolidated financial statements
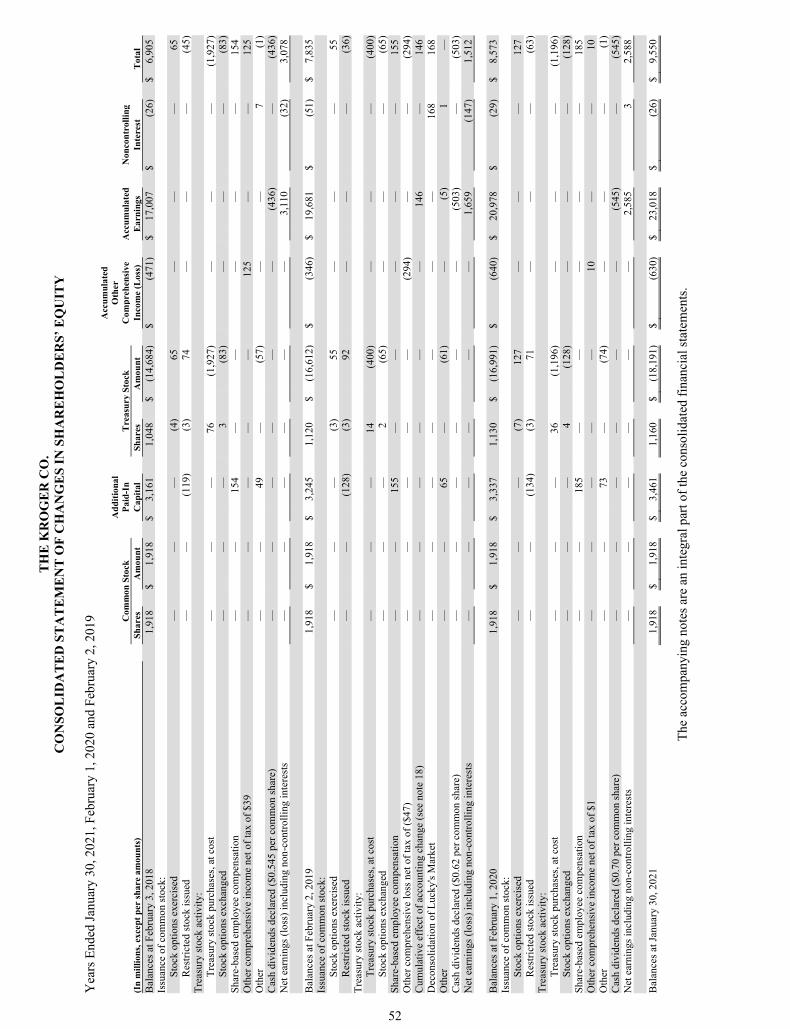
TH
E K
RO
GE
R C
O.
CO
NS
OL
IDA
TE
D S
TA
TE
ME
NT
OF
CH
AN
GE
S IN
SH
AR
EH
OL
DE
RS’
EQ
UIT
Y
Yea
rs E
nded
Jan
uary
30,
202
1, F
ebru
ary
1, 2
020
and
Feb
ruar
y 2,
201
9
Acc
um
ulat
ed
Ad
diti
onal
O
ther
C
omm
on S
tock
Pai
d-I
n T
reas
ury
Sto
ckC
ompr
ehen
sive
A
ccu
mul
ated
N
onco
ntr
olli
ng
(I
n m
illi
ons,
exc
e pt
per
sha
re a
mou
nts)
S
har
es
Am
ount
C
apit
al
Sh
ares
A
mou
nt
Inco
me
(Los
s)
Ear
ning
s
Inte
rest
T
otal
B
alan
ces
at F
ebru
ary
3, 2
018
1,9
18
$ 1
,918
$
3,16
1 1
,048
$
(14
,684
) $
(47
1)
$ 1
7,00
7 $
(26
) $
6,9
05
Issu
ance
of
com
mon
sto
ck:
Sto
ck o
ptio
ns e
xerc
ised
—
—
—
(
4) 6
5 —
—
—
6
5 R
estr
icte
d st
ock
issu
e d—
—
(
119)
(3)
74
—
—
—
(45
)T
reas
ury
stoc
k ac
tivi
ty:
Tre
asur
y st
ock
purc
hase
s, a
t cos
t —
—
—
76
(1,
927)
—
—
—
(
1,92
7)S
tock
opt
ions
exc
hang
ed
—
—
—
3 (
83)
— —
—
(
83)
Sha
re- b
ased
em
ploy
ee c
ompe
nsat
ion
—
—
154
—
—
—
—
—
154
O
ther
com
preh
ensi
ve in
com
e ne
t of
tax
of $
39
—
—
—
— —
125
—
—
1
25
Oth
e r
—
—
49
— (
57)
— —
7
(
1)C
ash
divi
dend
s de
clar
ed (
$0.5
45 p
er c
omm
on s
hare
) —
—
—
—
—
— (
436)
—
(43
6)N
et e
arni
ngs
(los
s) in
clud
ing
non-
cont
roll
ing
inte
rest
s —
—
—
—
—
— 3
,110
(
32)
3,0
78
Bal
ance
s at
Feb
ruar
y 2,
201
9 1
,918
$
1,9
18
$ 3
,245
1
,120
$
(16
,612
) $
(34
6)
$ 1
9,68
1 $
(51
) $
7,8
35
Issu
ance
of
com
mon
sto
ck:
Sto
ck o
ptio
ns e
xerc
ised
—
—
—
(
3) 5
5 —
—
—
5
5 R
estr
icte
d st
ock
issu
ed
—
—
(12
8) (
3) 9
2 —
—
—
(
36)
Tre
asur
y st
ock
acti
vity
: T
reas
ury
stoc
k pu
rcha
ses,
at c
ost
—
—
—
14
(40
0)
— —
—
(
400)
Sto
ck o
ptio
ns e
xcha
nge d
—
—
—
2
(65
) —
—
—
(65
)S
hare
-bas
ed e
mpl
oyee
com
pens
atio
n —
—
1
55
— —
—
—
—
1
55
Oth
er c
ompr
ehen
sive
loss
net
of
tax
of (
$47)
—
—
—
—
—
(29
4)
— —
(
294)
Cum
ulat
ive
effe
ct o
f ac
coun
ting
cha
nge
(see
not
e 18
) —
—
—
—
—
—
146
—
1
46
Dec
onso
lida
tion
of
Luc
ky's
Mar
ket
—
—
—
— —
—
—
168
1
68
Oth
er
—
—
65
— (
61)
—
(5)
1 —
C
ash
divi
dend
s de
clar
ed (
$0.6
2 pe
r co
mm
on s
hare
) —
—
—
—
—
—
(50
3)
— (
503)
Net
ear
ning
s (l
oss)
incl
udin
g no
n-co
ntro
llin
g in
tere
sts
—
—
—
— —
—
1
,659
(
147)
1
,512
Bal
ance
s at
Feb
ruar
y 1,
202
0 1
,918
$
1,9
18
$ 3
,337
1
,130
$
(16
,991
) $
(64
0)
$ 2
0,97
8 $
(29
) $
8,5
73
Issu
ance
of
com
mon
sto
ck:
Sto
ck o
ptio
ns e
xerc
ised
—
—
—
(
7) 1
27
—
—
—
127
R
estr
icte
d st
ock
issu
ed—
—
(
134)
(3)
71
—
—
—
(63
)T
reas
ury
stoc
k ac
tivi
ty:
Tre
asur
y st
ock
purc
hase
s, a
t cos
t —
—
—
36
(1,
196)
—
—
—
(
1,19
6)S
tock
opt
ions
exc
hang
ed
—
—
—
4 (
128)
—
—
—
(12
8)S
hare
- bas
ed e
mpl
oyee
com
pens
atio
n —
—
1
85
— —
— —
—
1
85
Oth
er c
ompr
ehen
sive
inco
me
net o
f ta
x of
$1
—
—
—
— —
10
—
—
10
Oth
er
—
—
73
— (
74)
— —
—
(
1)C
ash
divi
dend
s de
clar
ed (
$0.7
0 pe
r co
mm
on s
hare
) —
—
—
—
—
— (
545)
—
(54
5)N
et e
arni
ngs
incl
udin
g no
n-co
ntro
llin
g in
tere
sts
—
—
—
— —
—
2,5
85
3
2,5
88
Bal
ance
s at
Jan
uary
30,
202
1 1
,918
$
1,9
18
$ 3
,461
1
,160
$
(18
,191
) $
(63
0)
$ 2
3,01
8 $
(26
) $
9,5
50
The
acc
ompa
nyin
g no
tes
are
an in
tegr
al p
art o
f th
e co
nsol
idat
ed f
inan
cial
sta
tem
ents
.
52
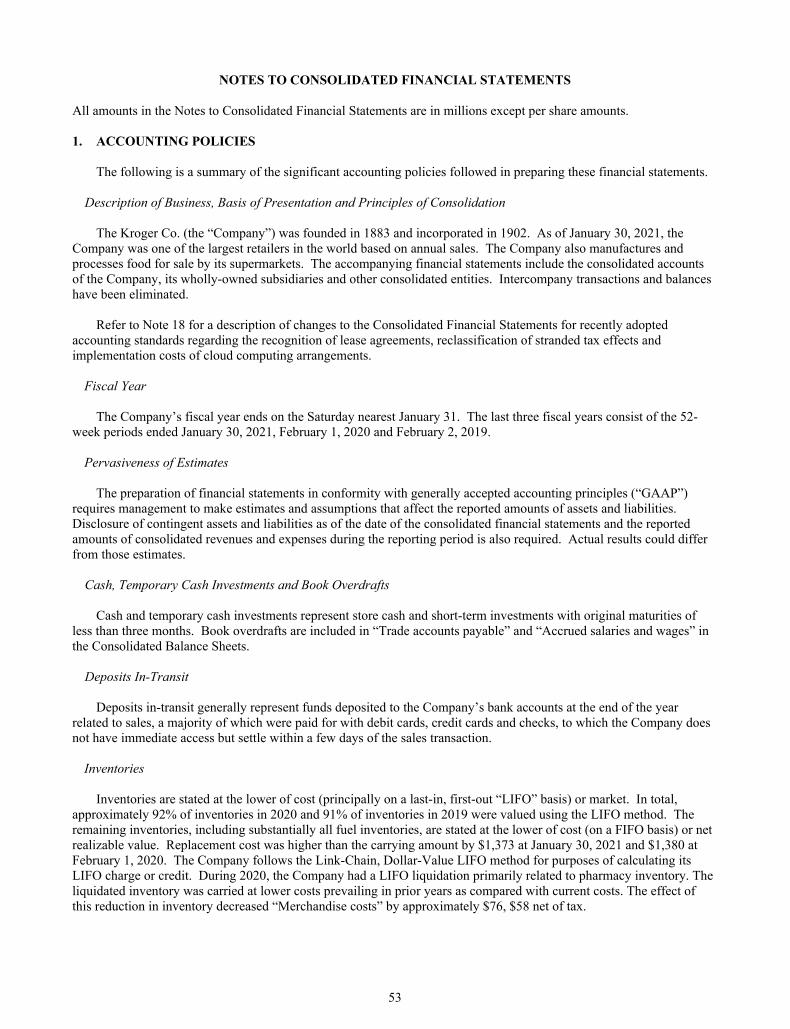
53
NOTES TO CONSOLIDATED FINANCIAL STATEMENTS
All amounts in the Notes to Consolidated Financial Statements are in millions except per share amounts. 1. ACCOUNTING POLICIES
The following is a summary of the significant accounting policies followed in preparing these financial statements.
Description of Business, Basis of Presentation and Principles of Consolidation
The Kroger Co. (the “Company”) was founded in 1883 and incorporated in 1902. As of January 30, 2021, the Company was one of the largest retailers in the world based on annual sales. The Company also manufactures and processes food for sale by its supermarkets. The accompanying financial statements include the consolidated accounts of the Company, its wholly-owned subsidiaries and other consolidated entities. Intercompany transactions and balances have been eliminated.
Refer to Note 18 for a description of changes to the Consolidated Financial Statements for recently adopted accounting standards regarding the recognition of lease agreements, reclassification of stranded tax effects and implementation costs of cloud computing arrangements.
Fiscal Year
The Company’s fiscal year ends on the Saturday nearest January 31. The last three fiscal years consist of the 52-week periods ended January 30, 2021, February 1, 2020 and February 2, 2019.
Pervasiveness of Estimates
The preparation of financial statements in conformity with generally accepted accounting principles (“GAAP”) requires management to make estimates and assumptions that affect the reported amounts of assets and liabilities. Disclosure of contingent assets and liabilities as of the date of the consolidated financial statements and the reported amounts of consolidated revenues and expenses during the reporting period is also required. Actual results could differ from those estimates.
Cash, Temporary Cash Investments and Book Overdrafts
Cash and temporary cash investments represent store cash and short-term investments with original maturities of
less than three months. Book overdrafts are included in “Trade accounts payable” and “Accrued salaries and wages” in the Consolidated Balance Sheets.
Deposits In-Transit
Deposits in-transit generally represent funds deposited to the Company’s bank accounts at the end of the year
related to sales, a majority of which were paid for with debit cards, credit cards and checks, to which the Company does not have immediate access but settle within a few days of the sales transaction.
Inventories
Inventories are stated at the lower of cost (principally on a last-in, first-out “LIFO” basis) or market. In total, approximately 92% of inventories in 2020 and 91% of inventories in 2019 were valued using the LIFO method. The remaining inventories, including substantially all fuel inventories, are stated at the lower of cost (on a FIFO basis) or net realizable value. Replacement cost was higher than the carrying amount by $1,373 at January 30, 2021 and $1,380 at February 1, 2020. The Company follows the Link-Chain, Dollar-Value LIFO method for purposes of calculating its LIFO charge or credit. During 2020, the Company had a LIFO liquidation primarily related to pharmacy inventory. The liquidated inventory was carried at lower costs prevailing in prior years as compared with current costs. The effect of this reduction in inventory decreased “Merchandise costs” by approximately $76, $58 net of tax.
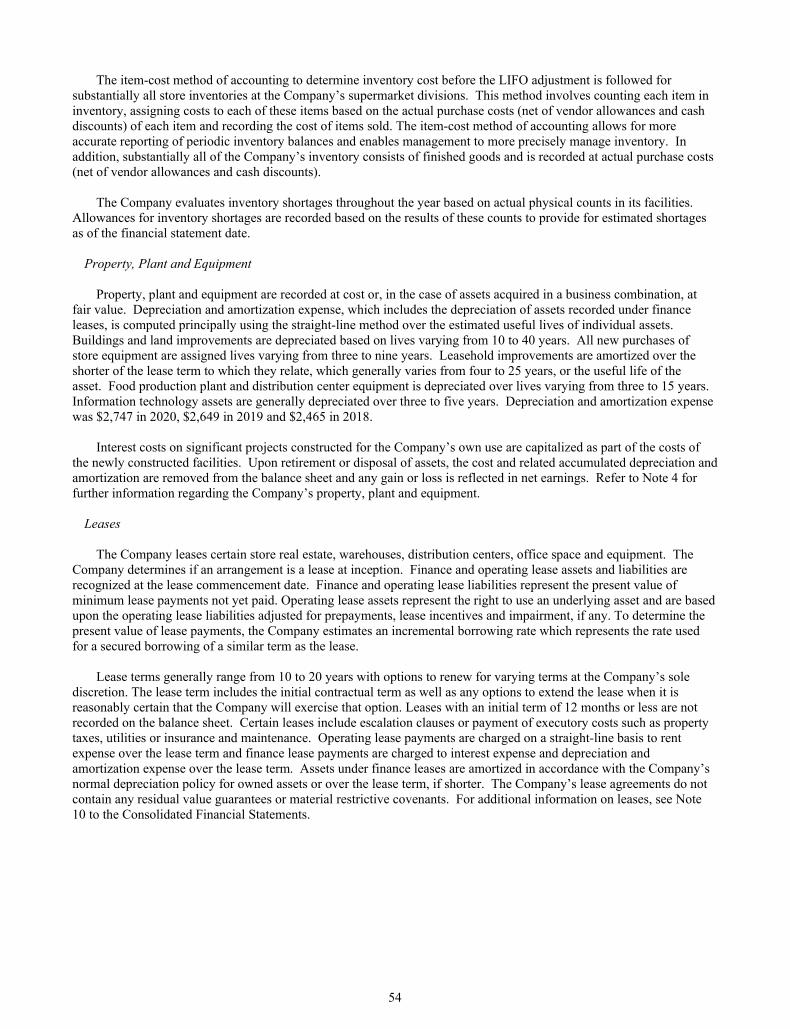
54
The item-cost method of accounting to determine inventory cost before the LIFO adjustment is followed for substantially all store inventories at the Company’s supermarket divisions. This method involves counting each item in inventory, assigning costs to each of these items based on the actual purchase costs (net of vendor allowances and cash discounts) of each item and recording the cost of items sold. The item-cost method of accounting allows for more accurate reporting of periodic inventory balances and enables management to more precisely manage inventory. In addition, substantially all of the Company’s inventory consists of finished goods and is recorded at actual purchase costs (net of vendor allowances and cash discounts).
The Company evaluates inventory shortages throughout the year based on actual physical counts in its facilities. Allowances for inventory shortages are recorded based on the results of these counts to provide for estimated shortages as of the financial statement date.
Property, Plant and Equipment
Property, plant and equipment are recorded at cost or, in the case of assets acquired in a business combination, at fair value. Depreciation and amortization expense, which includes the depreciation of assets recorded under finance leases, is computed principally using the straight-line method over the estimated useful lives of individual assets. Buildings and land improvements are depreciated based on lives varying from 10 to 40 years. All new purchases of store equipment are assigned lives varying from three to nine years. Leasehold improvements are amortized over the shorter of the lease term to which they relate, which generally varies from four to 25 years, or the useful life of the asset. Food production plant and distribution center equipment is depreciated over lives varying from three to 15 years. Information technology assets are generally depreciated over three to five years. Depreciation and amortization expense was $2,747 in 2020, $2,649 in 2019 and $2,465 in 2018.
Interest costs on significant projects constructed for the Company’s own use are capitalized as part of the costs of the newly constructed facilities. Upon retirement or disposal of assets, the cost and related accumulated depreciation and amortization are removed from the balance sheet and any gain or loss is reflected in net earnings. Refer to Note 4 for further information regarding the Company’s property, plant and equipment.
Leases
The Company leases certain store real estate, warehouses, distribution centers, office space and equipment. The Company determines if an arrangement is a lease at inception. Finance and operating lease assets and liabilities are recognized at the lease commencement date. Finance and operating lease liabilities represent the present value of minimum lease payments not yet paid. Operating lease assets represent the right to use an underlying asset and are based upon the operating lease liabilities adjusted for prepayments, lease incentives and impairment, if any. To determine the present value of lease payments, the Company estimates an incremental borrowing rate which represents the rate used for a secured borrowing of a similar term as the lease.
Lease terms generally range from 10 to 20 years with options to renew for varying terms at the Company’s sole discretion. The lease term includes the initial contractual term as well as any options to extend the lease when it is reasonably certain that the Company will exercise that option. Leases with an initial term of 12 months or less are not recorded on the balance sheet. Certain leases include escalation clauses or payment of executory costs such as property taxes, utilities or insurance and maintenance. Operating lease payments are charged on a straight-line basis to rent expense over the lease term and finance lease payments are charged to interest expense and depreciation and amortization expense over the lease term. Assets under finance leases are amortized in accordance with the Company’s normal depreciation policy for owned assets or over the lease term, if shorter. The Company’s lease agreements do not contain any residual value guarantees or material restrictive covenants. For additional information on leases, see Note 10 to the Consolidated Financial Statements.
55
Goodwill
The Company reviews goodwill for impairment during the fourth quarter of each year, and also upon the occurrence of a triggering event. The Company performs reviews of each of its operating divisions and other consolidated entities (collectively, “reporting units”) that have goodwill balances. Generally, fair value is determined using a market multiple model, or discounted projected future cash flows, and is compared to the carrying value of a reporting unit for purposes of identifying potential impairment. Projected future cash flows are based on management’s knowledge of the current operating environment and expectations for the future. Goodwill impairment is recognized for any excess of the reporting unit’s carrying value over its fair value, not to exceed the total amount of goodwill allocated to the reporting unit. Results of the goodwill impairment reviews performed during 2020, 2019 and 2018 are summarized in Note 3.
Impairment of Long-Lived Assets
The Company monitors the carrying value of long-lived assets for potential impairment each quarter based on whether certain triggering events have occurred. These events include current period losses combined with a history of losses or a projection of continuing losses or a significant decrease in the market value of an asset. When a triggering event occurs, an impairment calculation is performed, comparing projected undiscounted future cash flows, utilizing current cash flow information and expected growth rates related to specific stores, to the carrying value for those stores. If the Company identifies impairment for long-lived assets to be held and used, the Company compares the assets’ current carrying value to the assets’ fair value. Fair value is based on current market values or discounted future cash flows. The Company records impairment when the carrying value exceeds fair market value. With respect to owned property and equipment held for disposal, the value of the property and equipment is adjusted to reflect recoverable values based on previous efforts to dispose of similar assets and current economic conditions. Impairment is recognized for the excess of the carrying value over the estimated fair market value, reduced by estimated direct costs of disposal. The Company recorded asset impairments totaling $70, $120 and $56 in 2020, 2019 and 2018, respectively. The increase in the 2019 impairment charge, compared to 2020 and 2018, related to the 35 planned store closures in 2020. Costs to reduce the carrying value of long-lived assets for each of the years presented have been included in the Consolidated Statements of Operations as Operating, general and administrative (“OG&A”) expense.
Accounts Payable Financing Arrangement
The Company has an agreement with a third party to provide an accounts payable tracking system which facilitates participating suppliers’ ability to finance payment obligations from the Company with designated third-party financial institutions. Participating suppliers may, at their sole discretion, make offers to finance one or more payment obligations of the Company prior to their scheduled due dates at a discounted price to participating financial institutions. The Company’s obligations to its suppliers, including amounts due and scheduled payment dates, are not affected by suppliers’ decisions to finance amounts under this arrangement. These obligations are included in “Other current liabilities” in the Consolidated Balance Sheets.
Contingent Consideration
The Company’s Home Chef business combination involves potential payment of future consideration that is contingent upon the achievement of certain performance milestones. The Company recorded contingent consideration at fair value at the date of acquisition based on the consideration expected to be transferred, estimated as the probability-weighted future cash flows, discounted back to present value using a discount rate determined in accordance with accepted valuation methods. The liability for contingent consideration is remeasured to fair value at each reporting period using Level 3 inputs, and the change in fair value, including accretion for the passage of time, is recognized in earnings until the contingency is resolved. In 2020 and 2018, adjustments to increase the contingent consideration liability as of year-end were recorded for $189 and $33, respectively, in OG&A expense. In 2019, an adjustment to decrease the contingent consideration liability as of year-end 2019 was recorded for ($69) in OG&A expense.
56
Store Closing Costs
The Company regularly evaluates the performance of its stores and periodically closes those stores that are underperforming. Related liabilities arise, such as severance, contractual obligations and other accruals associated with store closings. The Company records a liability for costs associated with an exit or disposal activity when the liability is incurred, usually in the period the store closes. Adjustments to closed store liabilities primarily relate to actual exit costs differing from original estimates. Adjustments are made for changes in estimates in the period in which the change becomes known.
Owned stores held for disposal are reduced to their estimated net realizable value. Costs to reduce the carrying values of property, plant, equipment and operating lease assets are accounted for in accordance with the Company’s policy on impairment of long-lived assets. Inventory write-downs, if any, in connection with store closings, are classified in the Consolidated Statements of Operations as “Merchandise costs.” Costs to transfer inventory and equipment from closed stores are expensed as incurred.
Interest Rate Risk Management
The Company uses derivative instruments primarily to manage its exposure to changes in interest rates. The Company’s current program relative to interest rate protection and the methods by which the Company accounts for its derivative instruments are described in Note 7.
Benefit Plans and Multi-Employer Pension Plans
The Company recognizes the funded status of its retirement plans on the Consolidated Balance Sheets. Actuarial gains or losses, prior service costs or credits and transition obligations that have not yet been recognized as part of net periodic benefit cost are required to be recorded as a component of Accumulated Other Comprehensive Income (“AOCI”). The Company has elected to measure defined benefit plan assets and obligations as of January 31, which is the month-end that is closest to its fiscal year-ends, which were January 30, 2021 for fiscal 2020 and February 1, 2020 for fiscal 2019.
The determination of the obligation and expense for company-sponsored pension plans and other post-retirement benefits is dependent on the selection of assumptions used by actuaries and the Company in calculating those amounts. Those assumptions are described in Note 15 and include, among others, the discount rate, the expected long-term rate of return on plan assets, mortality and the rates of increase in compensation and health care costs. Actual results that differ from the assumptions are accumulated and amortized over future periods and, therefore, generally affect the recognized expense and recorded obligation in future periods. While the Company believes that the assumptions are appropriate, significant differences in actual experience or significant changes in assumptions may materially affect the pension and other post-retirement obligations and future expense.
The Company also participates in various multi-employer plans for substantially all union employees. Pension expense for these plans is recognized as contributions are funded or when commitments are probable and reasonably estimable, in accordance with GAAP. Refer to Note 16 for additional information regarding the Company’s participation in these various multi-employer pension plans.
The Company administers and makes contributions to the employee 401(k) retirement savings accounts. Contributions to the employee 401(k) retirement savings accounts are expensed when contributed or over the service period in the case of automatic contributions. Refer to Note 15 for additional information regarding the Company’s benefit plans.
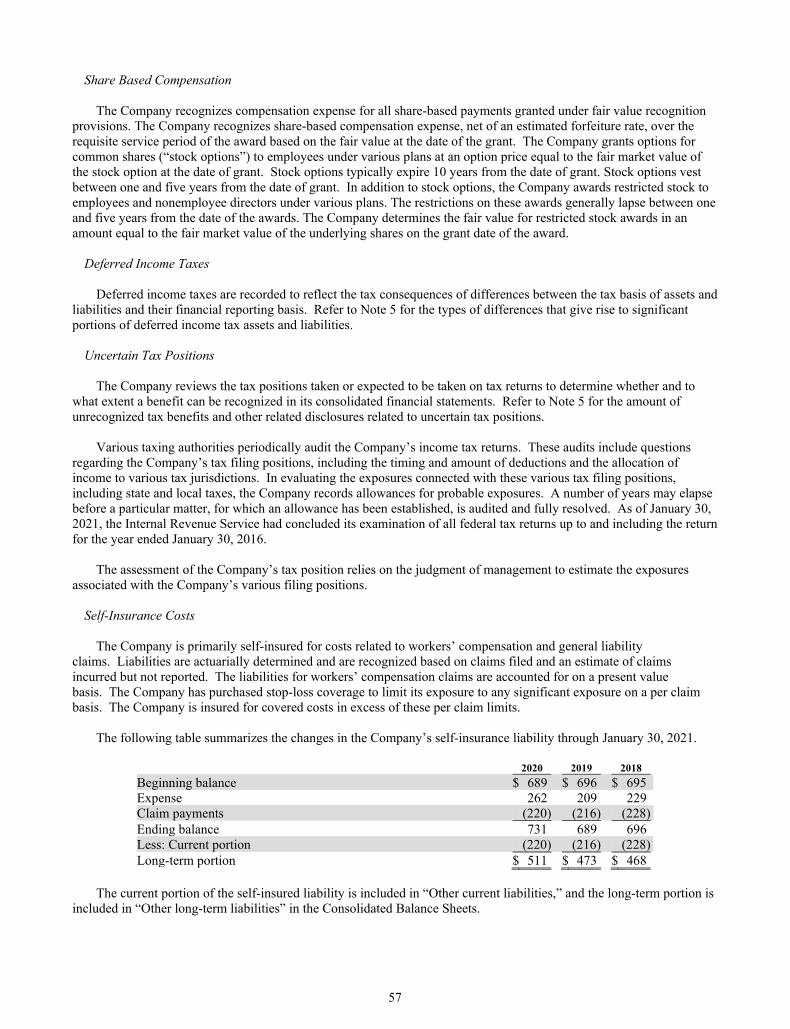
57
Share Based Compensation
The Company recognizes compensation expense for all share-based payments granted under fair value recognition provisions. The Company recognizes share-based compensation expense, net of an estimated forfeiture rate, over the requisite service period of the award based on the fair value at the date of the grant. The Company grants options for common shares (“stock options”) to employees under various plans at an option price equal to the fair market value of the stock option at the date of grant. Stock options typically expire 10 years from the date of grant. Stock options vest between one and five years from the date of grant. In addition to stock options, the Company awards restricted stock to employees and nonemployee directors under various plans. The restrictions on these awards generally lapse between one and five years from the date of the awards. The Company determines the fair value for restricted stock awards in an amount equal to the fair market value of the underlying shares on the grant date of the award.
Deferred Income Taxes
Deferred income taxes are recorded to reflect the tax consequences of differences between the tax basis of assets and
liabilities and their financial reporting basis. Refer to Note 5 for the types of differences that give rise to significant portions of deferred income tax assets and liabilities.
Uncertain Tax Positions
The Company reviews the tax positions taken or expected to be taken on tax returns to determine whether and to
what extent a benefit can be recognized in its consolidated financial statements. Refer to Note 5 for the amount of unrecognized tax benefits and other related disclosures related to uncertain tax positions.
Various taxing authorities periodically audit the Company’s income tax returns. These audits include questions
regarding the Company’s tax filing positions, including the timing and amount of deductions and the allocation of income to various tax jurisdictions. In evaluating the exposures connected with these various tax filing positions, including state and local taxes, the Company records allowances for probable exposures. A number of years may elapse before a particular matter, for which an allowance has been established, is audited and fully resolved. As of January 30, 2021, the Internal Revenue Service had concluded its examination of all federal tax returns up to and including the return for the year ended January 30, 2016.
The assessment of the Company’s tax position relies on the judgment of management to estimate the exposures associated with the Company’s various filing positions.
Self-Insurance Costs
The Company is primarily self-insured for costs related to workers’ compensation and general liability claims. Liabilities are actuarially determined and are recognized based on claims filed and an estimate of claims incurred but not reported. The liabilities for workers’ compensation claims are accounted for on a present value basis. The Company has purchased stop-loss coverage to limit its exposure to any significant exposure on a per claim basis. The Company is insured for covered costs in excess of these per claim limits.
The following table summarizes the changes in the Company’s self-insurance liability through January 30, 2021.
2020 2019 2018
Beginning balance $ 689 $ 696 $ 695 Expense 262 209 229 Claim payments (220) (216) (228) Ending balance 731 689 696 Less: Current portion (220) (216) (228) Long-term portion $ 511 $ 473 $ 468
The current portion of the self-insured liability is included in “Other current liabilities,” and the long-term portion is
included in “Other long-term liabilities” in the Consolidated Balance Sheets.
58
The Company maintains surety bonds related to self-insured workers’ compensation claims. These bonds are required by most states in which the Company is self-insured for workers’ compensation and are placed with third-party insurance providers to insure payment of the Company’s obligations in the event the Company is unable to meet its claim payment obligations up to its self-insured retention levels. These bonds do not represent liabilities of the Company, as the Company has recorded reserves for the claim costs.
The Company also maintains insurance coverages for some risks, including cyber exposure and property-related losses. The Company’s insurance coverage begins for these exposures ranging from $25 to $50.
Revenue Recognition
Sales The Company recognizes revenues from the retail sale of products, net of sales taxes, at the point of sale. Pharmacy
sales are recorded when the product is provided to the customer. Digital channel originated sales are recognized either upon pickup in store or upon delivery to the customer. Amounts billed to a customer related to shipping and delivery represent revenues earned for the goods provided and are classified as sales. When shipping is discounted, it is recorded as an adjustment to sales. Discounts provided to customers by the Company at the time of sale, including those provided in connection with loyalty cards, are recognized as a reduction in sales as the products are sold. Discounts provided by vendors, usually in the form of coupons, are not recognized as a reduction in sales provided the coupons are redeemable at any retailer that accepts coupons. The Company records a receivable from the vendor for the difference in sales price and cash received. For merchandise sold in one of the Company’s stores or online, tender is accepted at the point of sale. The Company acts as principal in certain vendor arrangements where the purchase and sale of inventory are virtually simultaneous. The Company records revenue and related costs on a gross basis for these arrangements. For pharmacy sales, collection of third-party receivables is typically expected within three months or less from the time of purchase. The third-party receivables from pharmacy sales are recorded in Receivables in the Company’s Consolidated Balance Sheets and were $672 as of January 30, 2021 and $646 as of February 1, 2020.
Gift Cards and Gift Certificates The Company does not recognize a sale when it sells its own gift cards and gift certificates (collectively “gift
cards”). Rather, it records a deferred revenue liability equal to the amount received. A sale is then recognized when the gift cards are redeemed to purchase the Company’s products. The Company’s gift cards do not expire. While gift cards are generally redeemed within 12 months, some are never fully redeemed. The Company recognizes gift card breakage under the proportional method, where recognition of breakage income is based upon the historical run-off rate of unredeemed gift cards. The Company’s gift card deferred revenue liability was $160 as of January 30, 2021 and $114 as of February 1, 2020.
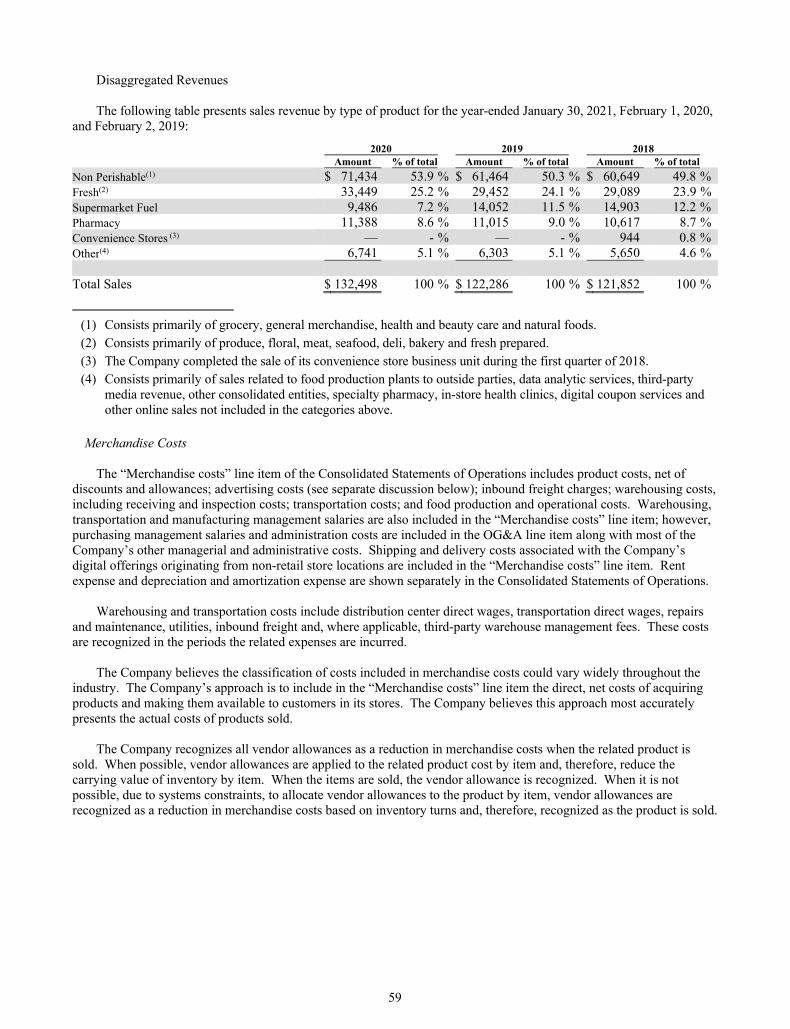
59
Disaggregated Revenues The following table presents sales revenue by type of product for the year-ended January 30, 2021, February 1, 2020,
and February 2, 2019:
2020 2019 2018 Amount % of total Amount % of total Amount % of total
Non Perishable(1) $ 71,434 53.9 % $ 61,464 50.3 % $ 60,649 49.8 % Fresh(2) 33,449 25.2 % 29,452 24.1 % 29,089 23.9 % Supermarket Fuel 9,486 7.2 % 14,052 11.5 % 14,903 12.2 % Pharmacy 11,388 8.6 % 11,015 9.0 % 10,617 8.7 % Convenience Stores (3) — - % — - % 944 0.8 % Other(4) 6,741 5.1 % 6,303 5.1 % 5,650 4.6 % Total Sales $ 132,498 100 % $ 122,286 100 % $ 121,852 100 %
(1) Consists primarily of grocery, general merchandise, health and beauty care and natural foods. (2) Consists primarily of produce, floral, meat, seafood, deli, bakery and fresh prepared. (3) The Company completed the sale of its convenience store business unit during the first quarter of 2018. (4) Consists primarily of sales related to food production plants to outside parties, data analytic services, third-party
media revenue, other consolidated entities, specialty pharmacy, in-store health clinics, digital coupon services and other online sales not included in the categories above.
Merchandise Costs
The “Merchandise costs” line item of the Consolidated Statements of Operations includes product costs, net of
discounts and allowances; advertising costs (see separate discussion below); inbound freight charges; warehousing costs, including receiving and inspection costs; transportation costs; and food production and operational costs. Warehousing, transportation and manufacturing management salaries are also included in the “Merchandise costs” line item; however, purchasing management salaries and administration costs are included in the OG&A line item along with most of the Company’s other managerial and administrative costs. Shipping and delivery costs associated with the Company’s digital offerings originating from non-retail store locations are included in the “Merchandise costs” line item. Rent expense and depreciation and amortization expense are shown separately in the Consolidated Statements of Operations.
Warehousing and transportation costs include distribution center direct wages, transportation direct wages, repairs
and maintenance, utilities, inbound freight and, where applicable, third-party warehouse management fees. These costs are recognized in the periods the related expenses are incurred.
The Company believes the classification of costs included in merchandise costs could vary widely throughout the industry. The Company’s approach is to include in the “Merchandise costs” line item the direct, net costs of acquiring products and making them available to customers in its stores. The Company believes this approach most accurately presents the actual costs of products sold.
The Company recognizes all vendor allowances as a reduction in merchandise costs when the related product is sold. When possible, vendor allowances are applied to the related product cost by item and, therefore, reduce the carrying value of inventory by item. When the items are sold, the vendor allowance is recognized. When it is not possible, due to systems constraints, to allocate vendor allowances to the product by item, vendor allowances are recognized as a reduction in merchandise costs based on inventory turns and, therefore, recognized as the product is sold.
60
Advertising Costs
The Company’s advertising costs are recognized in the periods the related expenses are incurred and are included in the “Merchandise costs” line item of the Consolidated Statements of Operations. The Company’s advertising costs totaled $888 in 2020, $854 in 2019 and $752 in 2018. The Company does not record vendor allowances for co-operative advertising as a reduction of advertising expense.
Operating, General and Administrative Expenses
OG&A expenses consist primarily of employee-related costs such as wages, healthcare benefit costs, retirement plan
costs, utilities, and credit card fees. Shipping and delivery costs associated with the Company's digital offerings originating from retail store locations, including third-party delivery fees, are included in the “OG&A” line item of the Consolidated Statements of Operations. Rent expense, depreciation and amortization expense and interest expense are shown separately in the Consolidated Statement of Operations.
Consolidated Statements of Cash Flows
For purposes of the Consolidated Statements of Cash Flows, the Company considers all highly liquid debt instruments purchased with an original maturity of three months or less to be temporary cash investments.
Segments
The Company operates supermarkets and multi-department stores throughout the United States. The Company’s retail operations, which represent 97% of the Company’s consolidated sales, are its only reportable segment. The Company aggregated its operating divisions into one reportable segment due to the operating divisions having similar economic characteristics with similar long-term financial performance. In addition, the Company’s operating divisions offer customers similar products, have similar distribution methods, operate in similar regulatory environments, purchase the majority of the merchandise for retail sale from similar (and in many cases identical) vendors on a coordinated basis from a centralized location, serve similar types of customers, and are allocated capital from a centralized location. Operating divisions are organized primarily on a geographical basis so that the operating division management team can be responsive to local needs of the operating division and can execute company strategic plans and initiatives throughout the locations in their operating division. This geographical separation is the primary differentiation between these retail operating divisions. The geographical basis of organization reflects how the business is managed and how the Company’s Chief Executive Officer, who acts as the Company’s chief operating decision maker, assesses performance internally. All of the Company’s operations are domestic.
2. PARTNERSHIP AGREEMENTS
On May 17, 2018, the Company entered into a Partnership Framework Agreement with Ocado International Holdings Limited and Ocado Group plc (“Ocado”). The Partnership Framework Agreement was amended in 2020. Under this agreement, Ocado will partner exclusively with the Company in the U.S., enhancing the Company’s digital and robotics capabilities in its distribution networks. As part of the agreement, the Company provided a letter of credit which supports its commitment to contract with Ocado to build a number of fulfilment centers. The balance of the letter of credit was $207 as of January 30, 2021 and will reduce primarily upon the construction of each fulfillment center.
In addition, on May 17, 2018, the Company entered into a Share Subscription Agreement with Ocado, pursuant to
which the Company agreed to purchase 33.1 million ordinary shares of Ocado for an aggregate purchase price of $243. The Company completed the purchase of these 33.1 million shares on May 29, 2018. This is in addition to 8.1 million Ocado shares purchased earlier in the first quarter of 2018, and 6.5 million additional shares purchased in the second quarter of 2018. Fair value adjustments in equity of Ocado flow through “Gain on investments” in the Company’s Consolidated Statements of Operations. The fair value of all shares owned, which is measured using Level 1 inputs, was $1,808 as of January 30, 2021 and $776 as of February 1, 2020 and is included in “Other assets” in the Company’s Consolidated Balance Sheets. The Company recorded an unrealized gain of $1,032 in 2020, $157 in 2019 and $228 in 2018, none of which was realized during the period as the Company did not sell any Ocado securities.
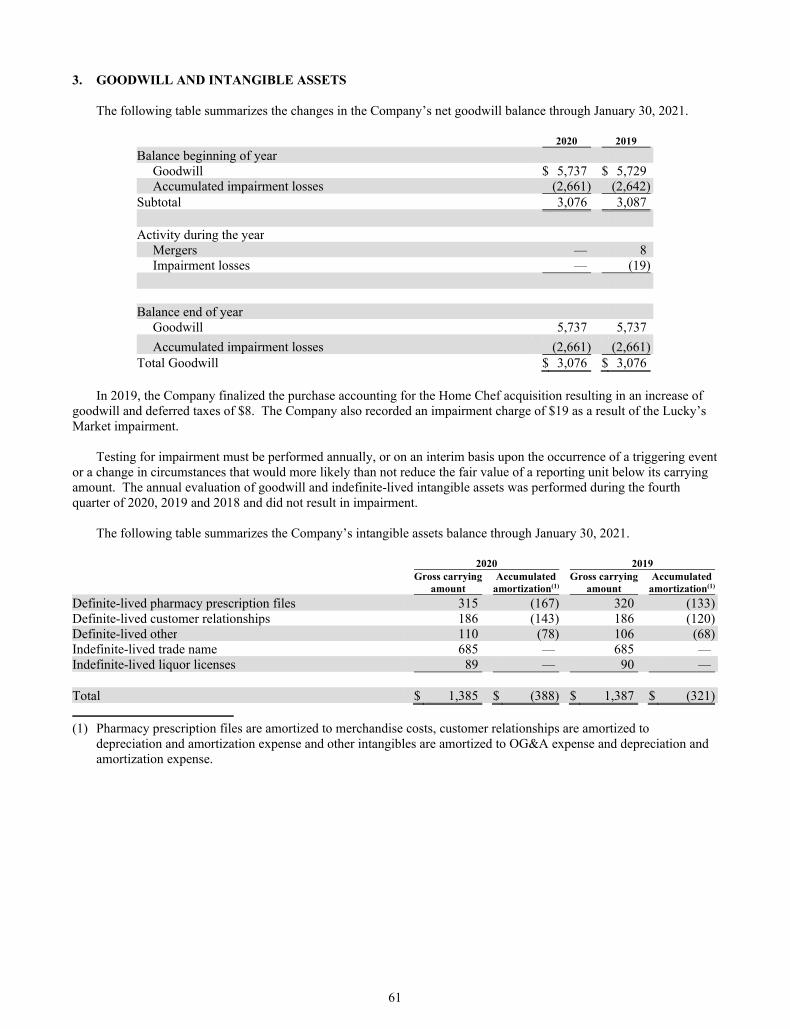
61
3. GOODWILL AND INTANGIBLE ASSETS
The following table summarizes the changes in the Company’s net goodwill balance through January 30, 2021.
2020 2019
Balance beginning of year Goodwill $ 5,737 $ 5,729 Accumulated impairment losses (2,661) (2,642)
Subtotal 3,076 3,087 Activity during the year
Mergers — 8 Impairment losses — (19)
Balance end of year
Goodwill 5,737 5,737
Accumulated impairment losses (2,661) (2,661) Total Goodwill $ 3,076 $ 3,076
In 2019, the Company finalized the purchase accounting for the Home Chef acquisition resulting in an increase of
goodwill and deferred taxes of $8. The Company also recorded an impairment charge of $19 as a result of the Lucky’s Market impairment.
Testing for impairment must be performed annually, or on an interim basis upon the occurrence of a triggering event or a change in circumstances that would more likely than not reduce the fair value of a reporting unit below its carrying amount. The annual evaluation of goodwill and indefinite-lived intangible assets was performed during the fourth quarter of 2020, 2019 and 2018 and did not result in impairment.
The following table summarizes the Company’s intangible assets balance through January 30, 2021.
2020 2019 Gross carrying Accumulated Gross carrying Accumulated amount amortization(1) amount amortization(1)
Definite-lived pharmacy prescription files 315 (167) 320 (133) Definite-lived customer relationships 186 (143) 186 (120) Definite-lived other 110 (78) 106 (68) Indefinite-lived trade name 685 — 685 — Indefinite-lived liquor licenses 89 — 90 — Total $ 1,385 $ (388) $ 1,387 $ (321)
(1) Pharmacy prescription files are amortized to merchandise costs, customer relationships are amortized to
depreciation and amortization expense and other intangibles are amortized to OG&A expense and depreciation and amortization expense.
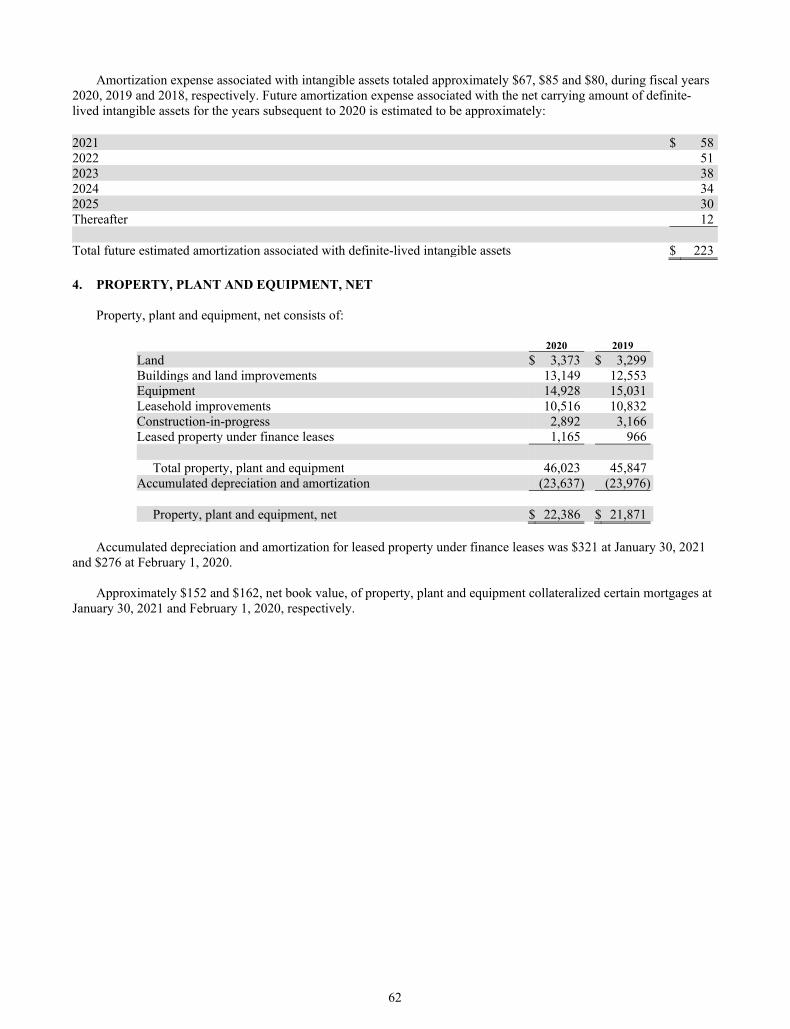
62
Amortization expense associated with intangible assets totaled approximately $67, $85 and $80, during fiscal years 2020, 2019 and 2018, respectively. Future amortization expense associated with the net carrying amount of definite-lived intangible assets for the years subsequent to 2020 is estimated to be approximately:
2021 $ 58 2022 51 2023 38 2024 34 2025 30 Thereafter 12 Total future estimated amortization associated with definite-lived intangible assets $ 223
4. PROPERTY, PLANT AND EQUIPMENT, NET
Property, plant and equipment, net consists of:
2020 2019
Land $ 3,373 $ 3,299 Buildings and land improvements 13,149 12,553 Equipment 14,928 15,031 Leasehold improvements 10,516 10,832 Construction-in-progress 2,892 3,166 Leased property under finance leases 1,165 966
Total property, plant and equipment 46,023 45,847 Accumulated depreciation and amortization (23,637) (23,976)
Property, plant and equipment, net $ 22,386 $ 21,871
Accumulated depreciation and amortization for leased property under finance leases was $321 at January 30, 2021 and $276 at February 1, 2020.
Approximately $152 and $162, net book value, of property, plant and equipment collateralized certain mortgages at
January 30, 2021 and February 1, 2020, respectively.
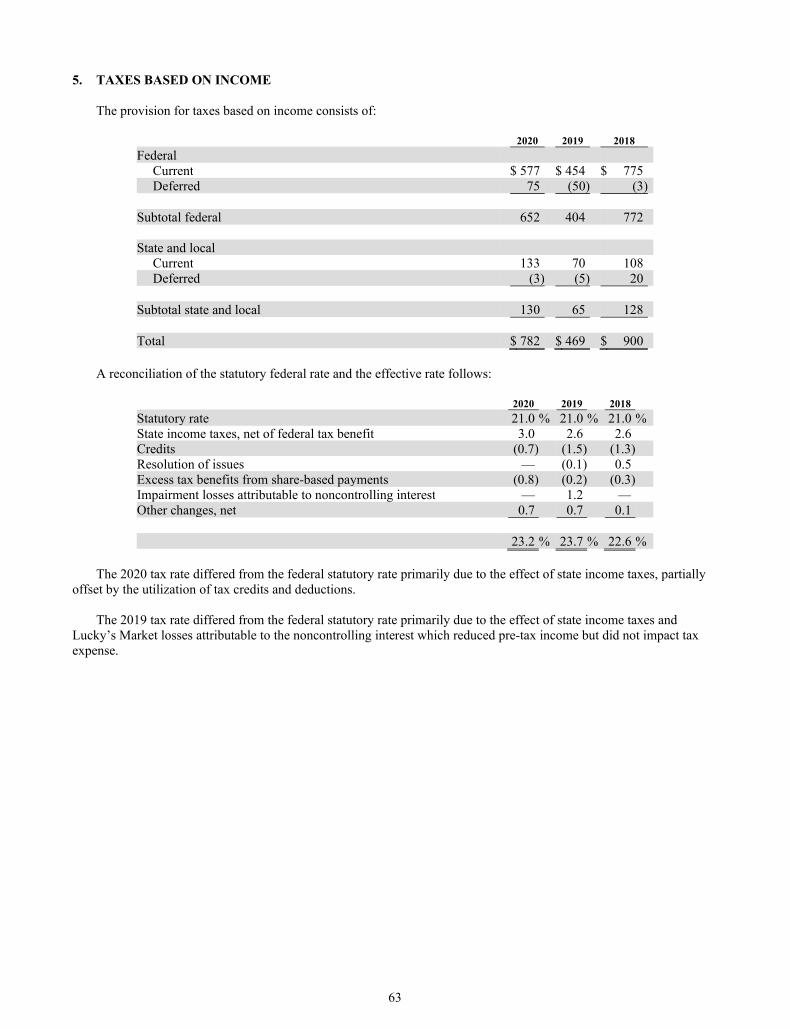
63
5. TAXES BASED ON INCOME
The provision for taxes based on income consists of:
2020 2019 2018
Federal Current $ 577 $ 454 $ 775 Deferred 75 (50) (3)
Subtotal federal 652 404 772 State and local
Current 133 70 108 Deferred (3) (5) 20
Subtotal state and local 130 65 128 Total $ 782 $ 469 $ 900
A reconciliation of the statutory federal rate and the effective rate follows:
2020 2019 2018
Statutory rate 21.0 % 21.0 % 21.0 % State income taxes, net of federal tax benefit 3.0 2.6 2.6 Credits (0.7) (1.5) (1.3) Resolution of issues — (0.1) 0.5 Excess tax benefits from share-based payments (0.8) (0.2) (0.3) Impairment losses attributable to noncontrolling interest — 1.2 — Other changes, net 0.7 0.7 0.1 23.2 % 23.7 % 22.6 %
The 2020 tax rate differed from the federal statutory rate primarily due to the effect of state income taxes, partially
offset by the utilization of tax credits and deductions. The 2019 tax rate differed from the federal statutory rate primarily due to the effect of state income taxes and
Lucky’s Market losses attributable to the noncontrolling interest which reduced pre-tax income but did not impact tax expense.
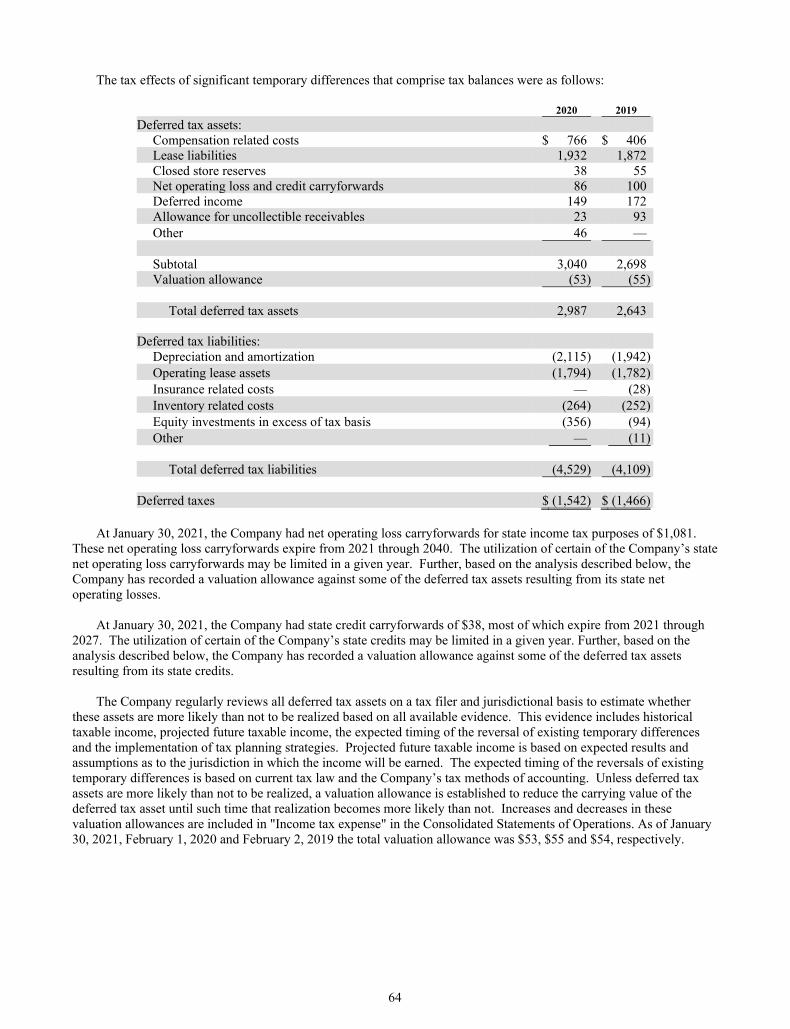
64
The tax effects of significant temporary differences that comprise tax balances were as follows:
2020 2019
Deferred tax assets: Compensation related costs $ 766 $ 406 Lease liabilities 1,932 1,872 Closed store reserves 38 55 Net operating loss and credit carryforwards 86 100 Deferred income 149 172 Allowance for uncollectible receivables 23 93 Other 46 —
Subtotal 3,040 2,698 Valuation allowance (53) (55)
Total deferred tax assets 2,987 2,643
Deferred tax liabilities:
Depreciation and amortization (2,115) (1,942) Operating lease assets (1,794) (1,782) Insurance related costs — (28) Inventory related costs (264) (252) Equity investments in excess of tax basis (356) (94) Other — (11)
Total deferred tax liabilities (4,529) (4,109)
Deferred taxes $ (1,542) $ (1,466)
At January 30, 2021, the Company had net operating loss carryforwards for state income tax purposes of $1,081.
These net operating loss carryforwards expire from 2021 through 2040. The utilization of certain of the Company’s state net operating loss carryforwards may be limited in a given year. Further, based on the analysis described below, the Company has recorded a valuation allowance against some of the deferred tax assets resulting from its state net operating losses.
At January 30, 2021, the Company had state credit carryforwards of $38, most of which expire from 2021 through
2027. The utilization of certain of the Company’s state credits may be limited in a given year. Further, based on the analysis described below, the Company has recorded a valuation allowance against some of the deferred tax assets resulting from its state credits.
The Company regularly reviews all deferred tax assets on a tax filer and jurisdictional basis to estimate whether these assets are more likely than not to be realized based on all available evidence. This evidence includes historical taxable income, projected future taxable income, the expected timing of the reversal of existing temporary differences and the implementation of tax planning strategies. Projected future taxable income is based on expected results and assumptions as to the jurisdiction in which the income will be earned. The expected timing of the reversals of existing temporary differences is based on current tax law and the Company’s tax methods of accounting. Unless deferred tax assets are more likely than not to be realized, a valuation allowance is established to reduce the carrying value of the deferred tax asset until such time that realization becomes more likely than not. Increases and decreases in these valuation allowances are included in "Income tax expense" in the Consolidated Statements of Operations. As of January 30, 2021, February 1, 2020 and February 2, 2019 the total valuation allowance was $53, $55 and $54, respectively.
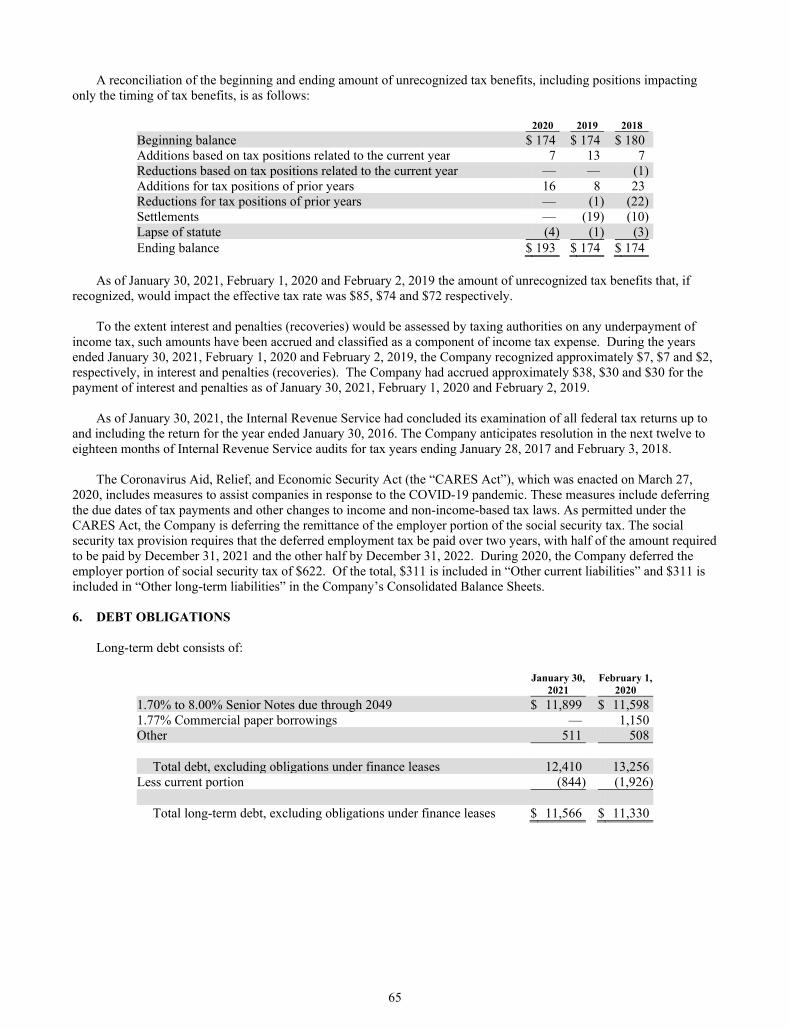
65
A reconciliation of the beginning and ending amount of unrecognized tax benefits, including positions impacting only the timing of tax benefits, is as follows:
2020 2019 2018
Beginning balance $ 174 $ 174 $ 180 Additions based on tax positions related to the current year 7 13 7 Reductions based on tax positions related to the current year — — (1) Additions for tax positions of prior years 16 8 23 Reductions for tax positions of prior years — (1) (22) Settlements — (19) (10) Lapse of statute (4) (1) (3) Ending balance $ 193 $ 174 $ 174
As of January 30, 2021, February 1, 2020 and February 2, 2019 the amount of unrecognized tax benefits that, if
recognized, would impact the effective tax rate was $85, $74 and $72 respectively. To the extent interest and penalties (recoveries) would be assessed by taxing authorities on any underpayment of
income tax, such amounts have been accrued and classified as a component of income tax expense. During the years ended January 30, 2021, February 1, 2020 and February 2, 2019, the Company recognized approximately $7, $7 and $2, respectively, in interest and penalties (recoveries). The Company had accrued approximately $38, $30 and $30 for the payment of interest and penalties as of January 30, 2021, February 1, 2020 and February 2, 2019.
As of January 30, 2021, the Internal Revenue Service had concluded its examination of all federal tax returns up to and including the return for the year ended January 30, 2016. The Company anticipates resolution in the next twelve to eighteen months of Internal Revenue Service audits for tax years ending January 28, 2017 and February 3, 2018.
The Coronavirus Aid, Relief, and Economic Security Act (the “CARES Act”), which was enacted on March 27,
2020, includes measures to assist companies in response to the COVID-19 pandemic. These measures include deferring the due dates of tax payments and other changes to income and non-income-based tax laws. As permitted under the CARES Act, the Company is deferring the remittance of the employer portion of the social security tax. The social security tax provision requires that the deferred employment tax be paid over two years, with half of the amount required to be paid by December 31, 2021 and the other half by December 31, 2022. During 2020, the Company deferred the employer portion of social security tax of $622. Of the total, $311 is included in “Other current liabilities” and $311 is included in “Other long-term liabilities” in the Company’s Consolidated Balance Sheets. 6. DEBT OBLIGATIONS
Long-term debt consists of:
January 30, February 1, 2021 2020
1.70% to 8.00% Senior Notes due through 2049 $ 11,899 $ 11,598 1.77% Commercial paper borrowings — 1,150 Other 511 508
Total debt, excluding obligations under finance leases 12,410 13,256 Less current portion (844) (1,926)
Total long-term debt, excluding obligations under finance leases $ 11,566 $ 11,330
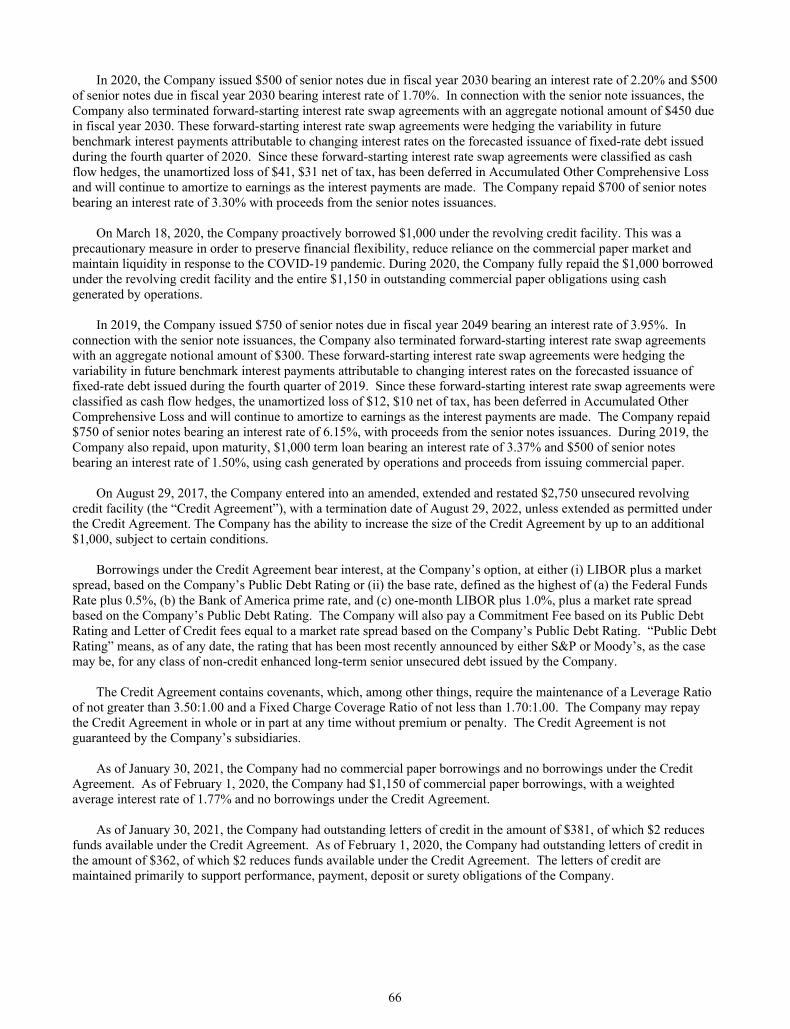
66
In 2020, the Company issued $500 of senior notes due in fiscal year 2030 bearing an interest rate of 2.20% and $500 of senior notes due in fiscal year 2030 bearing interest rate of 1.70%. In connection with the senior note issuances, the Company also terminated forward-starting interest rate swap agreements with an aggregate notional amount of $450 due in fiscal year 2030. These forward-starting interest rate swap agreements were hedging the variability in future benchmark interest payments attributable to changing interest rates on the forecasted issuance of fixed-rate debt issued during the fourth quarter of 2020. Since these forward-starting interest rate swap agreements were classified as cash flow hedges, the unamortized loss of $41, $31 net of tax, has been deferred in Accumulated Other Comprehensive Loss and will continue to amortize to earnings as the interest payments are made. The Company repaid $700 of senior notes bearing an interest rate of 3.30% with proceeds from the senior notes issuances.
On March 18, 2020, the Company proactively borrowed $1,000 under the revolving credit facility. This was a
precautionary measure in order to preserve financial flexibility, reduce reliance on the commercial paper market and maintain liquidity in response to the COVID-19 pandemic. During 2020, the Company fully repaid the $1,000 borrowed under the revolving credit facility and the entire $1,150 in outstanding commercial paper obligations using cash generated by operations.
In 2019, the Company issued $750 of senior notes due in fiscal year 2049 bearing an interest rate of 3.95%. In
connection with the senior note issuances, the Company also terminated forward-starting interest rate swap agreements with an aggregate notional amount of $300. These forward-starting interest rate swap agreements were hedging the variability in future benchmark interest payments attributable to changing interest rates on the forecasted issuance of fixed-rate debt issued during the fourth quarter of 2019. Since these forward-starting interest rate swap agreements were classified as cash flow hedges, the unamortized loss of $12, $10 net of tax, has been deferred in Accumulated Other Comprehensive Loss and will continue to amortize to earnings as the interest payments are made. The Company repaid $750 of senior notes bearing an interest rate of 6.15%, with proceeds from the senior notes issuances. During 2019, the Company also repaid, upon maturity, $1,000 term loan bearing an interest rate of 3.37% and $500 of senior notes bearing an interest rate of 1.50%, using cash generated by operations and proceeds from issuing commercial paper.
On August 29, 2017, the Company entered into an amended, extended and restated $2,750 unsecured revolving
credit facility (the “Credit Agreement”), with a termination date of August 29, 2022, unless extended as permitted under the Credit Agreement. The Company has the ability to increase the size of the Credit Agreement by up to an additional $1,000, subject to certain conditions.
Borrowings under the Credit Agreement bear interest, at the Company’s option, at either (i) LIBOR plus a market
spread, based on the Company’s Public Debt Rating or (ii) the base rate, defined as the highest of (a) the Federal Funds Rate plus 0.5%, (b) the Bank of America prime rate, and (c) one-month LIBOR plus 1.0%, plus a market rate spread based on the Company’s Public Debt Rating. The Company will also pay a Commitment Fee based on its Public Debt Rating and Letter of Credit fees equal to a market rate spread based on the Company’s Public Debt Rating. “Public Debt Rating” means, as of any date, the rating that has been most recently announced by either S&P or Moody’s, as the case may be, for any class of non-credit enhanced long-term senior unsecured debt issued by the Company.
The Credit Agreement contains covenants, which, among other things, require the maintenance of a Leverage Ratio
of not greater than 3.50:1.00 and a Fixed Charge Coverage Ratio of not less than 1.70:1.00. The Company may repay the Credit Agreement in whole or in part at any time without premium or penalty. The Credit Agreement is not guaranteed by the Company’s subsidiaries.
As of January 30, 2021, the Company had no commercial paper borrowings and no borrowings under the Credit
Agreement. As of February 1, 2020, the Company had $1,150 of commercial paper borrowings, with a weighted average interest rate of 1.77% and no borrowings under the Credit Agreement.
As of January 30, 2021, the Company had outstanding letters of credit in the amount of $381, of which $2 reduces
funds available under the Credit Agreement. As of February 1, 2020, the Company had outstanding letters of credit in the amount of $362, of which $2 reduces funds available under the Credit Agreement. The letters of credit are maintained primarily to support performance, payment, deposit or surety obligations of the Company.
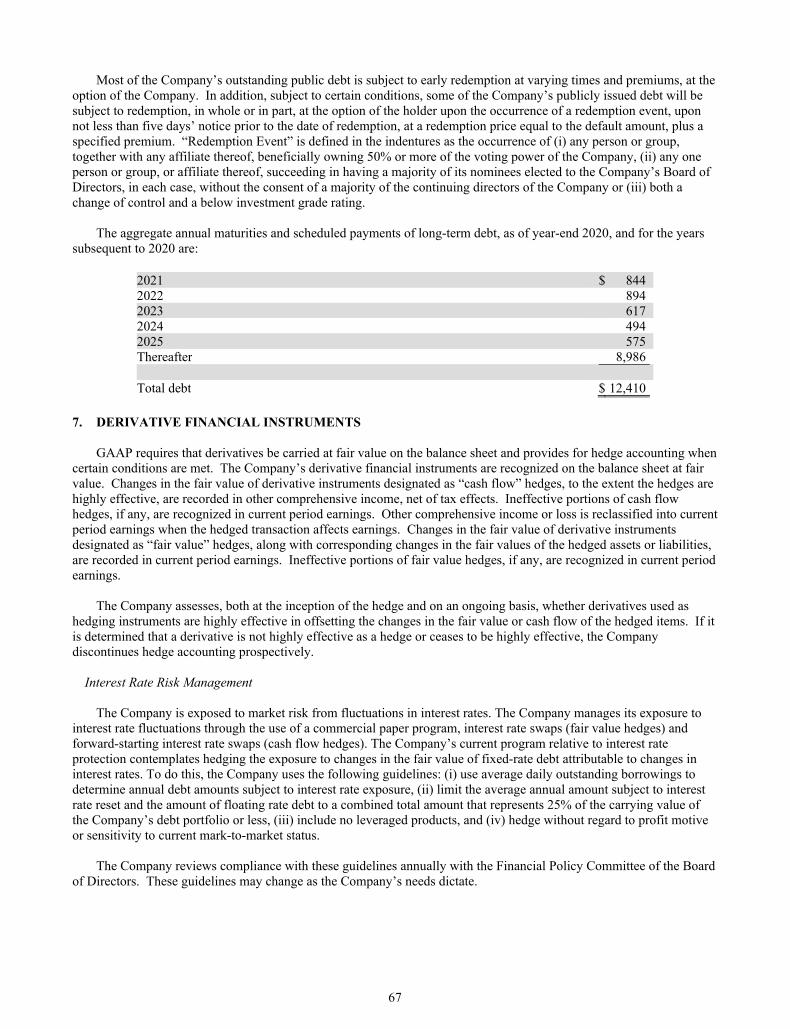
67
Most of the Company’s outstanding public debt is subject to early redemption at varying times and premiums, at the option of the Company. In addition, subject to certain conditions, some of the Company’s publicly issued debt will be subject to redemption, in whole or in part, at the option of the holder upon the occurrence of a redemption event, upon not less than five days’ notice prior to the date of redemption, at a redemption price equal to the default amount, plus a specified premium. “Redemption Event” is defined in the indentures as the occurrence of (i) any person or group, together with any affiliate thereof, beneficially owning 50% or more of the voting power of the Company, (ii) any one person or group, or affiliate thereof, succeeding in having a majority of its nominees elected to the Company’s Board of Directors, in each case, without the consent of a majority of the continuing directors of the Company or (iii) both a change of control and a below investment grade rating.
The aggregate annual maturities and scheduled payments of long-term debt, as of year-end 2020, and for the years subsequent to 2020 are:
2021 $ 844 2022 894 2023 617 2024 494 2025 575 Thereafter 8,986 Total debt $ 12,410
7. DERIVATIVE FINANCIAL INSTRUMENTS
GAAP requires that derivatives be carried at fair value on the balance sheet and provides for hedge accounting when certain conditions are met. The Company’s derivative financial instruments are recognized on the balance sheet at fair value. Changes in the fair value of derivative instruments designated as “cash flow” hedges, to the extent the hedges are highly effective, are recorded in other comprehensive income, net of tax effects. Ineffective portions of cash flow hedges, if any, are recognized in current period earnings. Other comprehensive income or loss is reclassified into current period earnings when the hedged transaction affects earnings. Changes in the fair value of derivative instruments designated as “fair value” hedges, along with corresponding changes in the fair values of the hedged assets or liabilities, are recorded in current period earnings. Ineffective portions of fair value hedges, if any, are recognized in current period earnings.
The Company assesses, both at the inception of the hedge and on an ongoing basis, whether derivatives used as hedging instruments are highly effective in offsetting the changes in the fair value or cash flow of the hedged items. If it is determined that a derivative is not highly effective as a hedge or ceases to be highly effective, the Company discontinues hedge accounting prospectively.
Interest Rate Risk Management
The Company is exposed to market risk from fluctuations in interest rates. The Company manages its exposure to interest rate fluctuations through the use of a commercial paper program, interest rate swaps (fair value hedges) and forward-starting interest rate swaps (cash flow hedges). The Company’s current program relative to interest rate protection contemplates hedging the exposure to changes in the fair value of fixed-rate debt attributable to changes in interest rates. To do this, the Company uses the following guidelines: (i) use average daily outstanding borrowings to determine annual debt amounts subject to interest rate exposure, (ii) limit the average annual amount subject to interest rate reset and the amount of floating rate debt to a combined total amount that represents 25% of the carrying value of the Company’s debt portfolio or less, (iii) include no leveraged products, and (iv) hedge without regard to profit motive or sensitivity to current mark-to-market status.
The Company reviews compliance with these guidelines annually with the Financial Policy Committee of the Board
of Directors. These guidelines may change as the Company’s needs dictate.
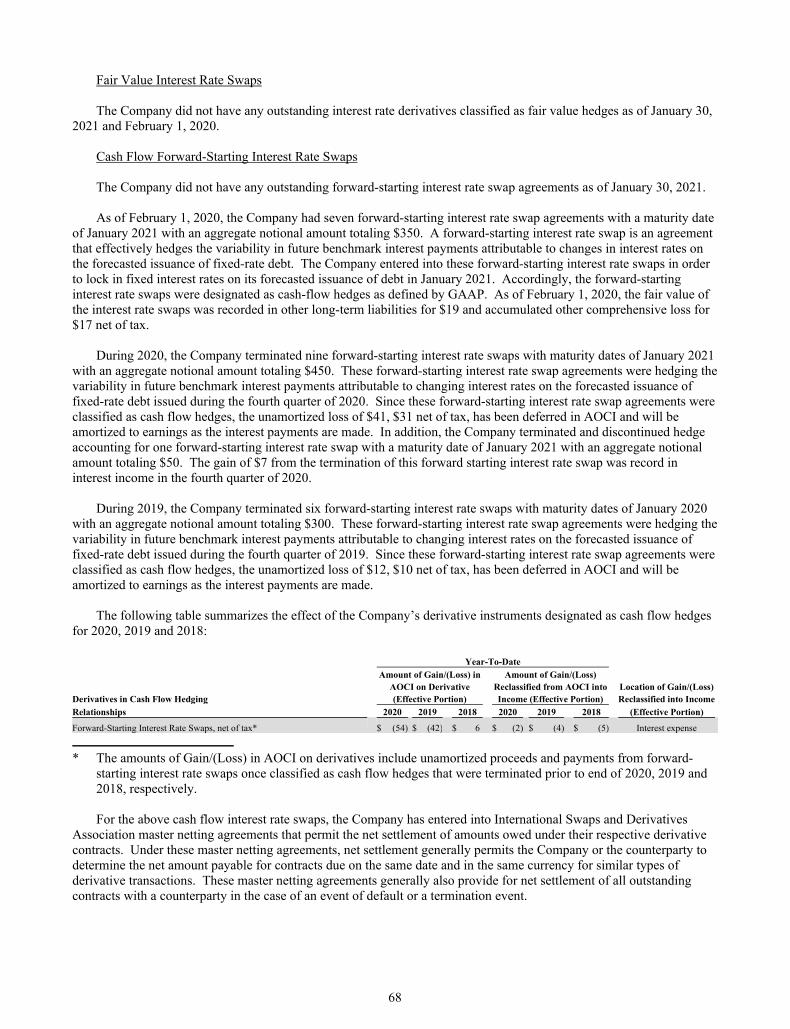
68
Fair Value Interest Rate Swaps
The Company did not have any outstanding interest rate derivatives classified as fair value hedges as of January 30, 2021 and February 1, 2020.
Cash Flow Forward-Starting Interest Rate Swaps The Company did not have any outstanding forward-starting interest rate swap agreements as of January 30, 2021. As of February 1, 2020, the Company had seven forward-starting interest rate swap agreements with a maturity date
of January 2021 with an aggregate notional amount totaling $350. A forward-starting interest rate swap is an agreement that effectively hedges the variability in future benchmark interest payments attributable to changes in interest rates on the forecasted issuance of fixed-rate debt. The Company entered into these forward-starting interest rate swaps in order to lock in fixed interest rates on its forecasted issuance of debt in January 2021. Accordingly, the forward-starting interest rate swaps were designated as cash-flow hedges as defined by GAAP. As of February 1, 2020, the fair value of the interest rate swaps was recorded in other long-term liabilities for $19 and accumulated other comprehensive loss for $17 net of tax.
During 2020, the Company terminated nine forward-starting interest rate swaps with maturity dates of January 2021
with an aggregate notional amount totaling $450. These forward-starting interest rate swap agreements were hedging the variability in future benchmark interest payments attributable to changing interest rates on the forecasted issuance of fixed-rate debt issued during the fourth quarter of 2020. Since these forward-starting interest rate swap agreements were classified as cash flow hedges, the unamortized loss of $41, $31 net of tax, has been deferred in AOCI and will be amortized to earnings as the interest payments are made. In addition, the Company terminated and discontinued hedge accounting for one forward-starting interest rate swap with a maturity date of January 2021 with an aggregate notional amount totaling $50. The gain of $7 from the termination of this forward starting interest rate swap was record in interest income in the fourth quarter of 2020.
During 2019, the Company terminated six forward-starting interest rate swaps with maturity dates of January 2020 with an aggregate notional amount totaling $300. These forward-starting interest rate swap agreements were hedging the variability in future benchmark interest payments attributable to changing interest rates on the forecasted issuance of fixed-rate debt issued during the fourth quarter of 2019. Since these forward-starting interest rate swap agreements were classified as cash flow hedges, the unamortized loss of $12, $10 net of tax, has been deferred in AOCI and will be amortized to earnings as the interest payments are made.
The following table summarizes the effect of the Company’s derivative instruments designated as cash flow hedges for 2020, 2019 and 2018:
Year-To-Date Amount of Gain/(Loss) in Amount of Gain/(Loss) AOCI on Derivative Reclassified from AOCI into Location of Gain/(Loss) Derivatives in Cash Flow Hedging (Effective Portion) Income (Effective Portion) Reclassified into Income Relationships 2020 2019 2018 2020 2019 2018 (Effective Portion)
Forward-Starting Interest Rate Swaps, net of tax* $ (54) $ (42) $ 6 $ (2) $ (4) $ (5) Interest expense
* The amounts of Gain/(Loss) in AOCI on derivatives include unamortized proceeds and payments from forward-
starting interest rate swaps once classified as cash flow hedges that were terminated prior to end of 2020, 2019 and 2018, respectively.
For the above cash flow interest rate swaps, the Company has entered into International Swaps and Derivatives
Association master netting agreements that permit the net settlement of amounts owed under their respective derivative contracts. Under these master netting agreements, net settlement generally permits the Company or the counterparty to determine the net amount payable for contracts due on the same date and in the same currency for similar types of derivative transactions. These master netting agreements generally also provide for net settlement of all outstanding contracts with a counterparty in the case of an event of default or a termination event.
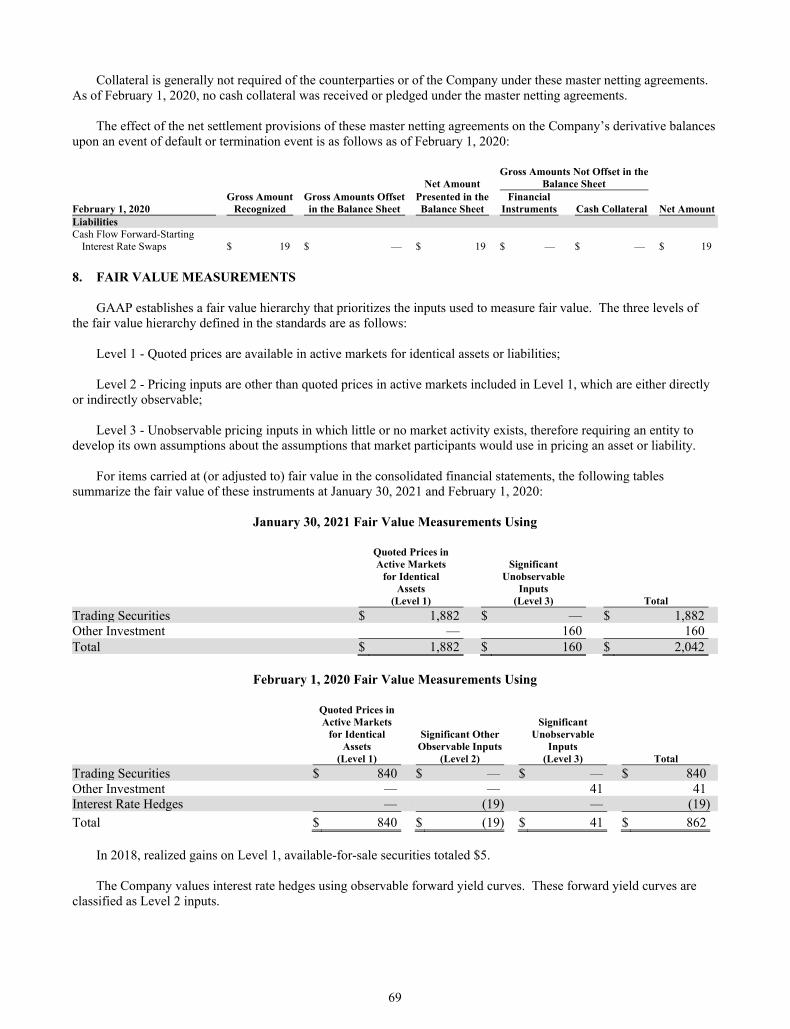
69
Collateral is generally not required of the counterparties or of the Company under these master netting agreements. As of February 1, 2020, no cash collateral was received or pledged under the master netting agreements.
The effect of the net settlement provisions of these master netting agreements on the Company’s derivative balances
upon an event of default or termination event is as follows as of February 1, 2020:
Gross Amounts Not Offset in the Net Amount Balance Sheet Gross Amount Gross Amounts Offset Presented in the Financial February 1, 2020 Recognized in the Balance Sheet Balance Sheet Instruments Cash Collateral Net Amount Liabilities Cash Flow Forward-Starting
Interest Rate Swaps $ 19 $ — $ 19 $ — $ — $ 19
8. FAIR VALUE MEASUREMENTS
GAAP establishes a fair value hierarchy that prioritizes the inputs used to measure fair value. The three levels of the fair value hierarchy defined in the standards are as follows:
Level 1 - Quoted prices are available in active markets for identical assets or liabilities;
Level 2 - Pricing inputs are other than quoted prices in active markets included in Level 1, which are either directly or indirectly observable;
Level 3 - Unobservable pricing inputs in which little or no market activity exists, therefore requiring an entity to develop its own assumptions about the assumptions that market participants would use in pricing an asset or liability.
For items carried at (or adjusted to) fair value in the consolidated financial statements, the following tables summarize the fair value of these instruments at January 30, 2021 and February 1, 2020:
January 30, 2021 Fair Value Measurements Using
Quoted Prices in Active Markets Significant for Identical Unobservable Assets Inputs (Level 1) (Level 3) Total
Trading Securities $ 1,882 $ — $ 1,882 Other Investment — 160 160 Total $ 1,882 $ 160 $ 2,042
February 1, 2020 Fair Value Measurements Using
Quoted Prices in Active Markets Significant for Identical Significant Other Unobservable Assets Observable Inputs Inputs (Level 1) (Level 2) (Level 3) Total
Trading Securities $ 840 $ — $ — $ 840 Other Investment — — 41 41 Interest Rate Hedges — (19) — (19)
Total $ 840 $ (19) $ 41 $ 862
In 2018, realized gains on Level 1, available-for-sale securities totaled $5. The Company values interest rate hedges using observable forward yield curves. These forward yield curves are
classified as Level 2 inputs.
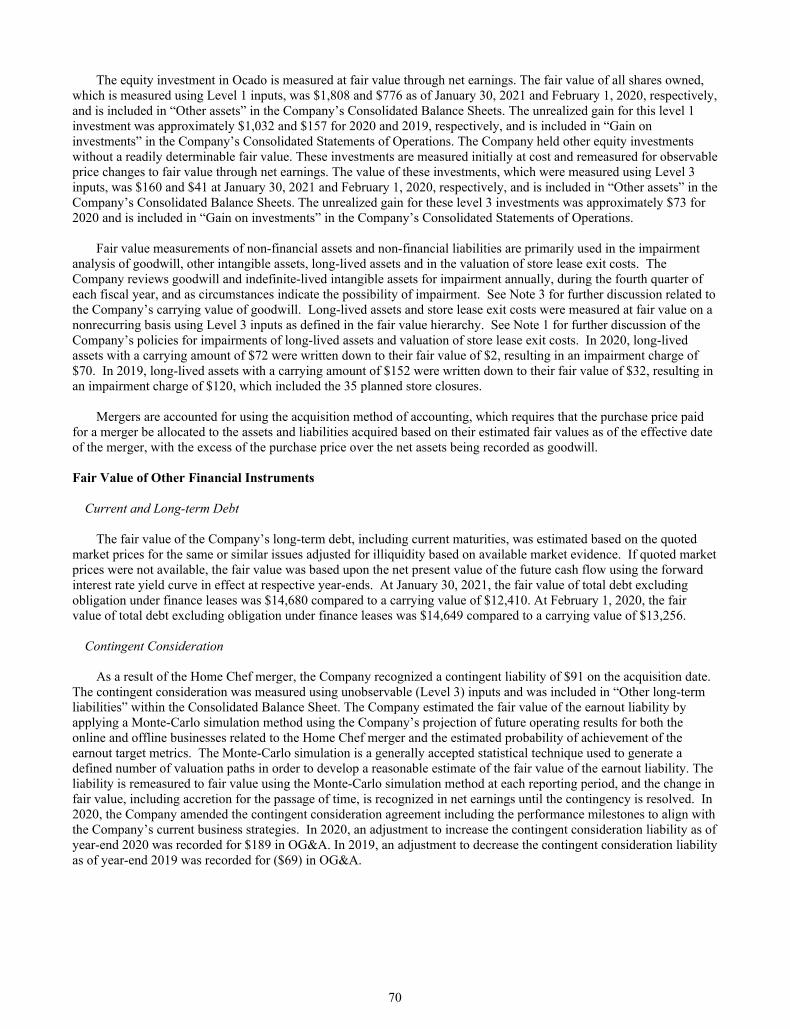
70
The equity investment in Ocado is measured at fair value through net earnings. The fair value of all shares owned, which is measured using Level 1 inputs, was $1,808 and $776 as of January 30, 2021 and February 1, 2020, respectively, and is included in “Other assets” in the Company’s Consolidated Balance Sheets. The unrealized gain for this level 1 investment was approximately $1,032 and $157 for 2020 and 2019, respectively, and is included in “Gain on investments” in the Company’s Consolidated Statements of Operations. The Company held other equity investments without a readily determinable fair value. These investments are measured initially at cost and remeasured for observable price changes to fair value through net earnings. The value of these investments, which were measured using Level 3 inputs, was $160 and $41 at January 30, 2021 and February 1, 2020, respectively, and is included in “Other assets” in the Company’s Consolidated Balance Sheets. The unrealized gain for these level 3 investments was approximately $73 for 2020 and is included in “Gain on investments” in the Company’s Consolidated Statements of Operations.
Fair value measurements of non-financial assets and non-financial liabilities are primarily used in the impairment
analysis of goodwill, other intangible assets, long-lived assets and in the valuation of store lease exit costs. The Company reviews goodwill and indefinite-lived intangible assets for impairment annually, during the fourth quarter of each fiscal year, and as circumstances indicate the possibility of impairment. See Note 3 for further discussion related to the Company’s carrying value of goodwill. Long-lived assets and store lease exit costs were measured at fair value on a nonrecurring basis using Level 3 inputs as defined in the fair value hierarchy. See Note 1 for further discussion of the Company’s policies for impairments of long-lived assets and valuation of store lease exit costs. In 2020, long-lived assets with a carrying amount of $72 were written down to their fair value of $2, resulting in an impairment charge of $70. In 2019, long-lived assets with a carrying amount of $152 were written down to their fair value of $32, resulting in an impairment charge of $120, which included the 35 planned store closures.
Mergers are accounted for using the acquisition method of accounting, which requires that the purchase price paid
for a merger be allocated to the assets and liabilities acquired based on their estimated fair values as of the effective date of the merger, with the excess of the purchase price over the net assets being recorded as goodwill. Fair Value of Other Financial Instruments
Current and Long-term Debt
The fair value of the Company’s long-term debt, including current maturities, was estimated based on the quoted market prices for the same or similar issues adjusted for illiquidity based on available market evidence. If quoted market prices were not available, the fair value was based upon the net present value of the future cash flow using the forward interest rate yield curve in effect at respective year-ends. At January 30, 2021, the fair value of total debt excluding obligation under finance leases was $14,680 compared to a carrying value of $12,410. At February 1, 2020, the fair value of total debt excluding obligation under finance leases was $14,649 compared to a carrying value of $13,256.
Contingent Consideration
As a result of the Home Chef merger, the Company recognized a contingent liability of $91 on the acquisition date. The contingent consideration was measured using unobservable (Level 3) inputs and was included in “Other long-term liabilities” within the Consolidated Balance Sheet. The Company estimated the fair value of the earnout liability by applying a Monte-Carlo simulation method using the Company’s projection of future operating results for both the online and offline businesses related to the Home Chef merger and the estimated probability of achievement of the earnout target metrics. The Monte-Carlo simulation is a generally accepted statistical technique used to generate a defined number of valuation paths in order to develop a reasonable estimate of the fair value of the earnout liability. The liability is remeasured to fair value using the Monte-Carlo simulation method at each reporting period, and the change in fair value, including accretion for the passage of time, is recognized in net earnings until the contingency is resolved. In 2020, the Company amended the contingent consideration agreement including the performance milestones to align with the Company’s current business strategies. In 2020, an adjustment to increase the contingent consideration liability as of year-end 2020 was recorded for $189 in OG&A. In 2019, an adjustment to decrease the contingent consideration liability as of year-end 2019 was recorded for ($69) in OG&A.

71
Cash and Temporary Cash Investments, Store Deposits In-Transit, Receivables, Prepaid and Other Current Assets, Trade Accounts Payable, Accrued Salaries and Wages and Other Current Liabilities
The carrying amounts of these items approximated fair value.
Other Assets
The fair values of certain investments recorded in “Other assets” within the Consolidated Balance Sheets were estimated based on quoted market prices for those or similar investments, or estimated cash flows, if appropriate. Other assets include other long-term investments of $280 and $261 as of January 30, 2021 and February 1, 2020, respectively. Other assets include notes receivable of $240 and $210 as of January 30, 2021 and February 1, 2020, respectively. Other assets also include prepaid deposits under certain contractual arrangements of $186 and $111 as of January 30, 2021 and February 1, 2020. The carrying value for these assets approximates fair value.
9. ACCUMULATED OTHER COMPREHENSIVE INCOME (LOSS)
The following table represents the changes in AOCI by component for the years ended January 30, 2021 and February 1, 2020:
Pension and Cash Flow Postretirement Hedging Defined Benefit
Activities(1) Plans(1) Total(1)
Balance at February 2, 2019 $ 6 $ (352) $ (346)Cumulative effect of accounting change(2) (5) (141) (146)OCI before reclassifications(3) (47) (134) (181)Amounts reclassified out of AOCI(4) 4 29 33 Net current-period OCI (48) (246) (294)Balance at February 1, 2020 $ (42) $ (598) $ (640) Balance at February 1, 2020 $ (42) $ (598) $ (640)OCI before reclassifications(3) (14) 8 (6)Amounts reclassified out of AOCI(4) 2 14 16 Net current-period OCI (12) 22 10 Balance at January 30, 2021 $ (54) $ (576) $ (630)
(1) All amounts are net of tax. (2) Related to the adoption of ASU 2018-02, “Income Statement – Reporting Comprehensive Income (Topic 220):
Reclassification of Certain Tax Effects from Accumulated Other Comprehensive Income,” (see Note 18 for additional details).
(3) Net of tax of ($17) and ($42) for cash flow hedging activities and pension and postretirement defined benefit plans, respectively, as of February 1, 2020. Net of tax of ($8) and $2 for cash flow hedging activities and pension and postretirement defined benefit plans, respectively, as of January 30, 2021.
(4) Net of tax of $9 and $3 for pension and postretirement defined benefit plans and cash flow hedging activities, respectively, as of February 1, 2020. Net of tax of $5 and $2 for pension and postretirement defined benefit plans and cash flow hedging activities, respectively, as of January 30, 2021.
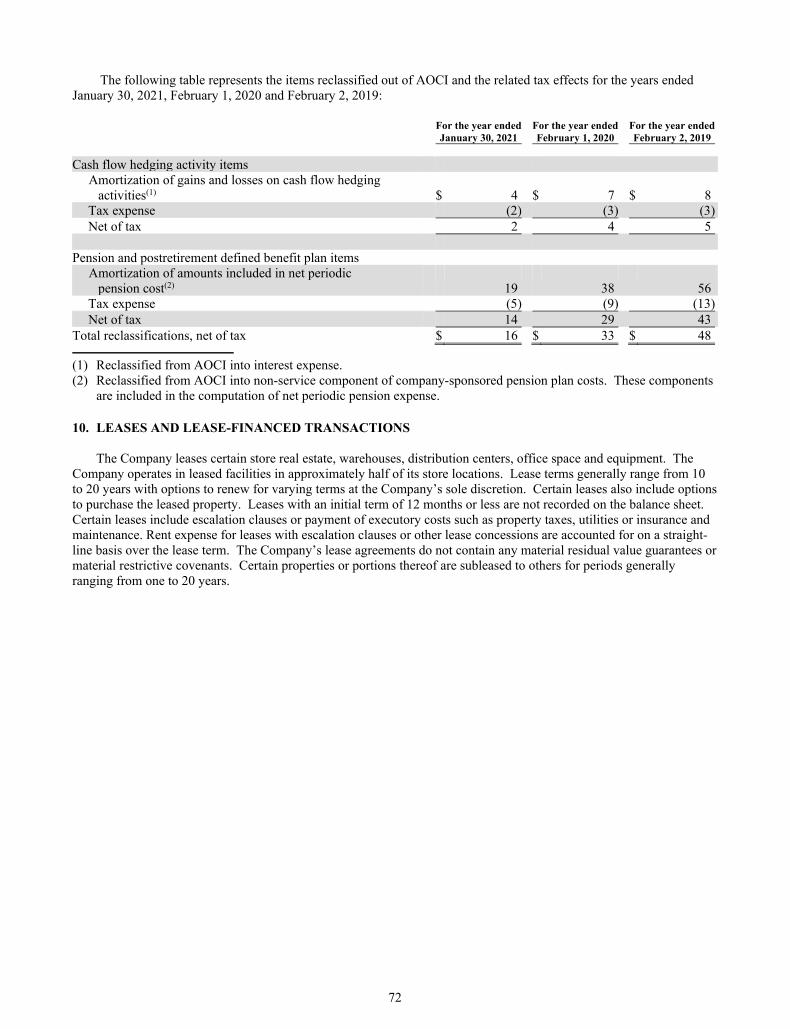
72
The following table represents the items reclassified out of AOCI and the related tax effects for the years ended January 30, 2021, February 1, 2020 and February 2, 2019:
For the year ended For the year ended For the year ended
January 30, 2021 February 1, 2020 February 2, 2019
Cash flow hedging activity items
Amortization of gains and losses on cash flow hedging
activities(1)
$ 4 $ 7 $ 8 Tax expense
(2) (3) (3) Net of tax
2 4 5
Pension and postretirement defined benefit plan items
Amortization of amounts included in net periodic
pension cost(2)
19 38 56 Tax expense
(5) (9) (13) Net of tax
14 29 43 Total reclassifications, net of tax
$ 16 $ 33 $ 48
(1) Reclassified from AOCI into interest expense. (2) Reclassified from AOCI into non-service component of company-sponsored pension plan costs. These components
are included in the computation of net periodic pension expense.
10. LEASES AND LEASE-FINANCED TRANSACTIONS
The Company leases certain store real estate, warehouses, distribution centers, office space and equipment. The Company operates in leased facilities in approximately half of its store locations. Lease terms generally range from 10 to 20 years with options to renew for varying terms at the Company’s sole discretion. Certain leases also include options to purchase the leased property. Leases with an initial term of 12 months or less are not recorded on the balance sheet. Certain leases include escalation clauses or payment of executory costs such as property taxes, utilities or insurance and maintenance. Rent expense for leases with escalation clauses or other lease concessions are accounted for on a straight-line basis over the lease term. The Company’s lease agreements do not contain any material residual value guarantees or material restrictive covenants. Certain properties or portions thereof are subleased to others for periods generally ranging from one to 20 years.
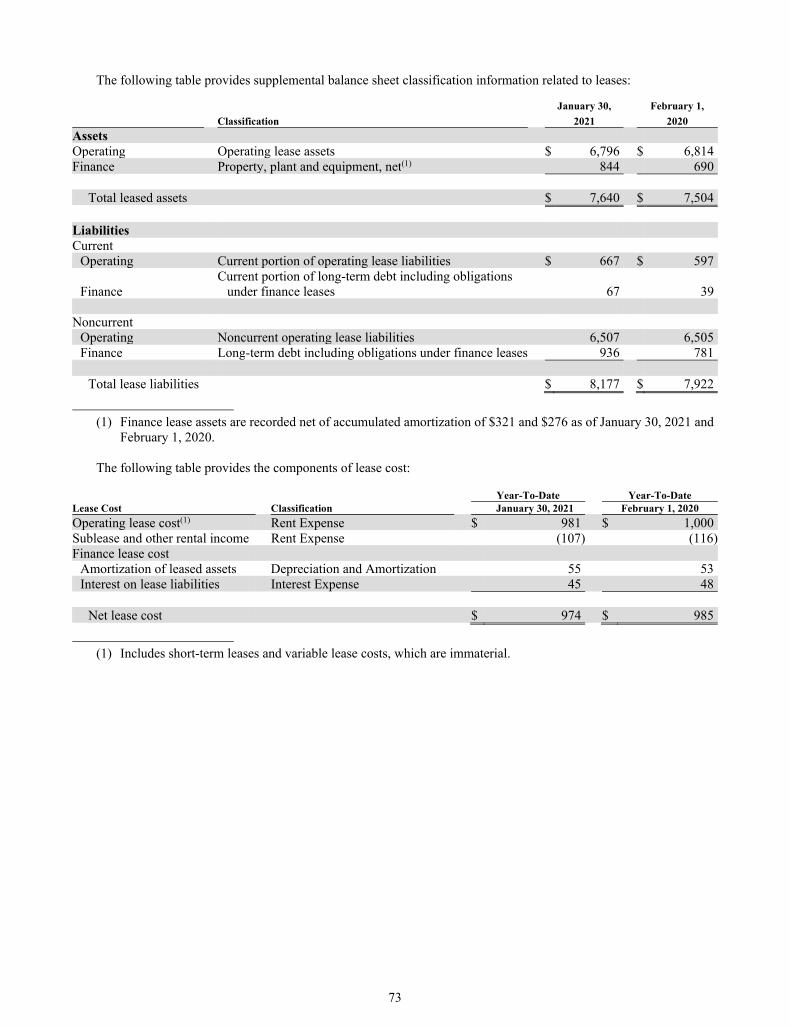
73
The following table provides supplemental balance sheet classification information related to leases:
January 30, February 1,
Classification 2021 2020
Assets Operating Operating lease assets $ 6,796 $ 6,814 Finance Property, plant and equipment, net(1) 844 690
Total leased assets $ 7,640 $ 7,504 Liabilities Current
Operating Current portion of operating lease liabilities $ 667 $ 597
Finance Current portion of long-term debt including obligations
under finance leases 67 39 Noncurrent
Operating Noncurrent operating lease liabilities 6,507 6,505 Finance Long-term debt including obligations under finance leases 936 781
Total lease liabilities $ 8,177 $ 7,922
(1) Finance lease assets are recorded net of accumulated amortization of $321 and $276 as of January 30, 2021 and
February 1, 2020.
The following table provides the components of lease cost:
Year-To-Date Year-To-Date Lease Cost Classification January 30, 2021 February 1, 2020
Operating lease cost(1) Rent Expense $ 981 $ 1,000 Sublease and other rental income Rent Expense (107) (116)Finance lease cost
Amortization of leased assets Depreciation and Amortization 55 53 Interest on lease liabilities Interest Expense 45 48
Net lease cost $ 974 $ 985
(1) Includes short-term leases and variable lease costs, which are immaterial.
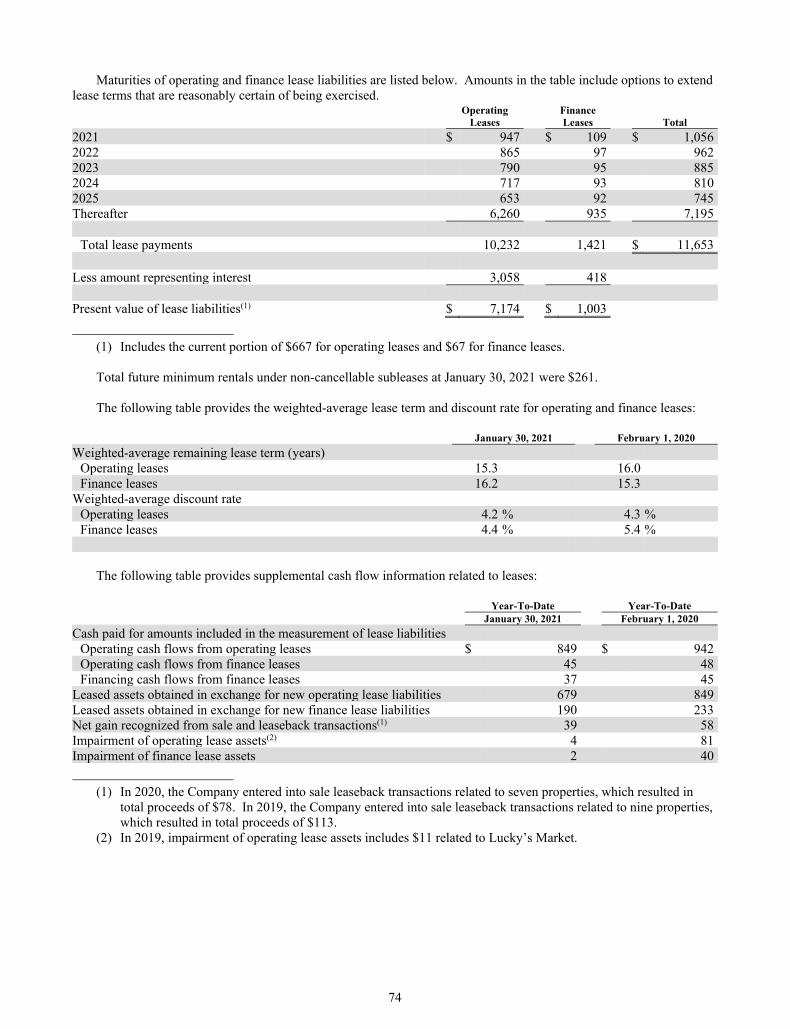
74
Maturities of operating and finance lease liabilities are listed below. Amounts in the table include options to extend lease terms that are reasonably certain of being exercised.
Operating Finance Leases Leases Total
2021 $ 947 $ 109 $ 1,056 2022 865 97 962 2023 790 95 885 2024 717 93 810 2025 653 92 745 Thereafter 6,260 935 7,195
Total lease payments 10,232 1,421 $ 11,653 Less amount representing interest 3,058 418 Present value of lease liabilities(1) $ 7,174 $ 1,003
(1) Includes the current portion of $667 for operating leases and $67 for finance leases. Total future minimum rentals under non-cancellable subleases at January 30, 2021 were $261. The following table provides the weighted-average lease term and discount rate for operating and finance leases:
January 30, 2021 February 1, 2020
Weighted-average remaining lease term (years) Operating leases 15.3 16.0 Finance leases 16.2 15.3
Weighted-average discount rate Operating leases 4.2 % 4.3 % Finance leases 4.4 % 5.4 %
The following table provides supplemental cash flow information related to leases:
Year-To-Date Year-To-Date January 30, 2021 February 1, 2020
Cash paid for amounts included in the measurement of lease liabilities Operating cash flows from operating leases $ 849 $ 942 Operating cash flows from finance leases 45 48 Financing cash flows from finance leases 37 45
Leased assets obtained in exchange for new operating lease liabilities 679 849 Leased assets obtained in exchange for new finance lease liabilities 190 233 Net gain recognized from sale and leaseback transactions(1) 39 58 Impairment of operating lease assets(2) 4 81 Impairment of finance lease assets 2 40
(1) In 2020, the Company entered into sale leaseback transactions related to seven properties, which resulted in
total proceeds of $78. In 2019, the Company entered into sale leaseback transactions related to nine properties, which resulted in total proceeds of $113.
(2) In 2019, impairment of operating lease assets includes $11 related to Lucky’s Market.
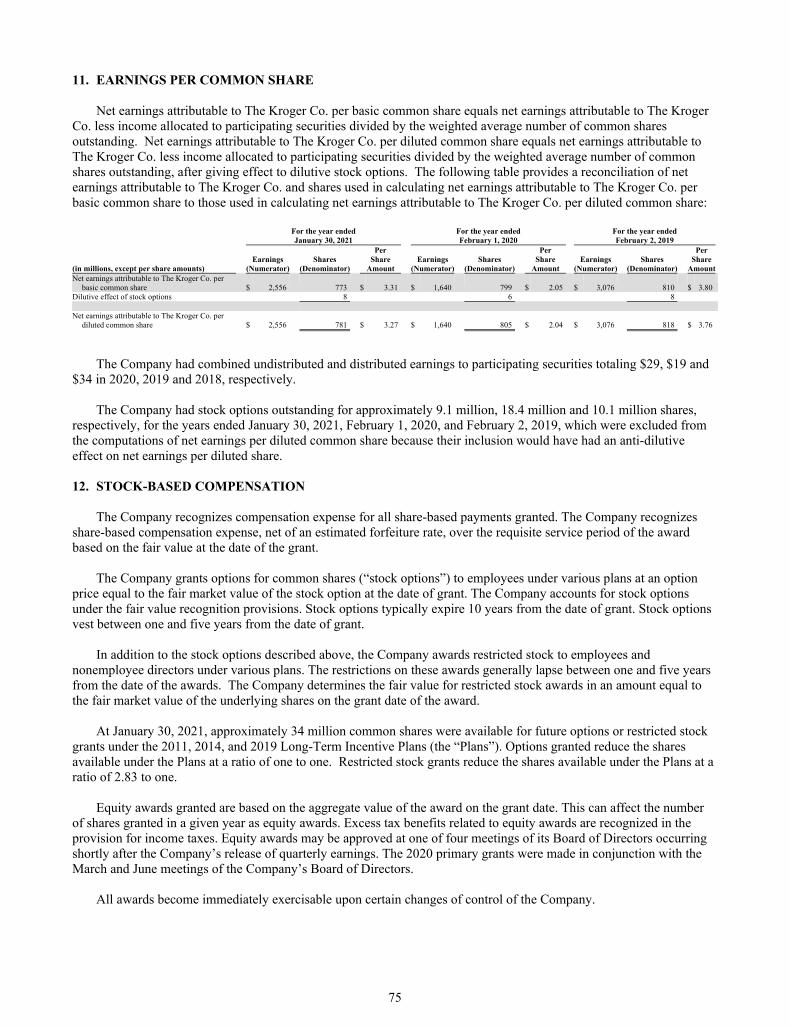
75
11. EARNINGS PER COMMON SHARE
Net earnings attributable to The Kroger Co. per basic common share equals net earnings attributable to The Kroger Co. less income allocated to participating securities divided by the weighted average number of common shares outstanding. Net earnings attributable to The Kroger Co. per diluted common share equals net earnings attributable to The Kroger Co. less income allocated to participating securities divided by the weighted average number of common shares outstanding, after giving effect to dilutive stock options. The following table provides a reconciliation of net earnings attributable to The Kroger Co. and shares used in calculating net earnings attributable to The Kroger Co. per basic common share to those used in calculating net earnings attributable to The Kroger Co. per diluted common share:
For the year ended For the year ended For the year ended January 30, 2021 February 1, 2020 February 2, 2019 Per Per Per Earnings Shares Share Earnings Shares Share Earnings Shares Share (in millions, except per share amounts) (Numerator) (Denominator) Amount (Numerator) (Denominator) Amount (Numerator) (Denominator) Amount Net earnings attributable to The Kroger Co. per
basic common share $ 2,556 773 $ 3.31 $ 1,640 799 $ 2.05 $ 3,076 810 $ 3.80 Dilutive effect of stock options 8 6 8 Net earnings attributable to The Kroger Co. per
diluted common share $ 2,556 781 $ 3.27 $ 1,640 805 $ 2.04 $ 3,076 818 $ 3.76
The Company had combined undistributed and distributed earnings to participating securities totaling $29, $19 and
$34 in 2020, 2019 and 2018, respectively. The Company had stock options outstanding for approximately 9.1 million, 18.4 million and 10.1 million shares,
respectively, for the years ended January 30, 2021, February 1, 2020, and February 2, 2019, which were excluded from the computations of net earnings per diluted common share because their inclusion would have had an anti-dilutive effect on net earnings per diluted share. 12. STOCK-BASED COMPENSATION
The Company recognizes compensation expense for all share-based payments granted. The Company recognizes share-based compensation expense, net of an estimated forfeiture rate, over the requisite service period of the award based on the fair value at the date of the grant.
The Company grants options for common shares (“stock options”) to employees under various plans at an option
price equal to the fair market value of the stock option at the date of grant. The Company accounts for stock options under the fair value recognition provisions. Stock options typically expire 10 years from the date of grant. Stock options vest between one and five years from the date of grant.
In addition to the stock options described above, the Company awards restricted stock to employees and
nonemployee directors under various plans. The restrictions on these awards generally lapse between one and five years from the date of the awards. The Company determines the fair value for restricted stock awards in an amount equal to the fair market value of the underlying shares on the grant date of the award.
At January 30, 2021, approximately 34 million common shares were available for future options or restricted stock
grants under the 2011, 2014, and 2019 Long-Term Incentive Plans (the “Plans”). Options granted reduce the shares available under the Plans at a ratio of one to one. Restricted stock grants reduce the shares available under the Plans at a ratio of 2.83 to one.
Equity awards granted are based on the aggregate value of the award on the grant date. This can affect the number
of shares granted in a given year as equity awards. Excess tax benefits related to equity awards are recognized in the provision for income taxes. Equity awards may be approved at one of four meetings of its Board of Directors occurring shortly after the Company’s release of quarterly earnings. The 2020 primary grants were made in conjunction with the March and June meetings of the Company’s Board of Directors.
All awards become immediately exercisable upon certain changes of control of the Company.
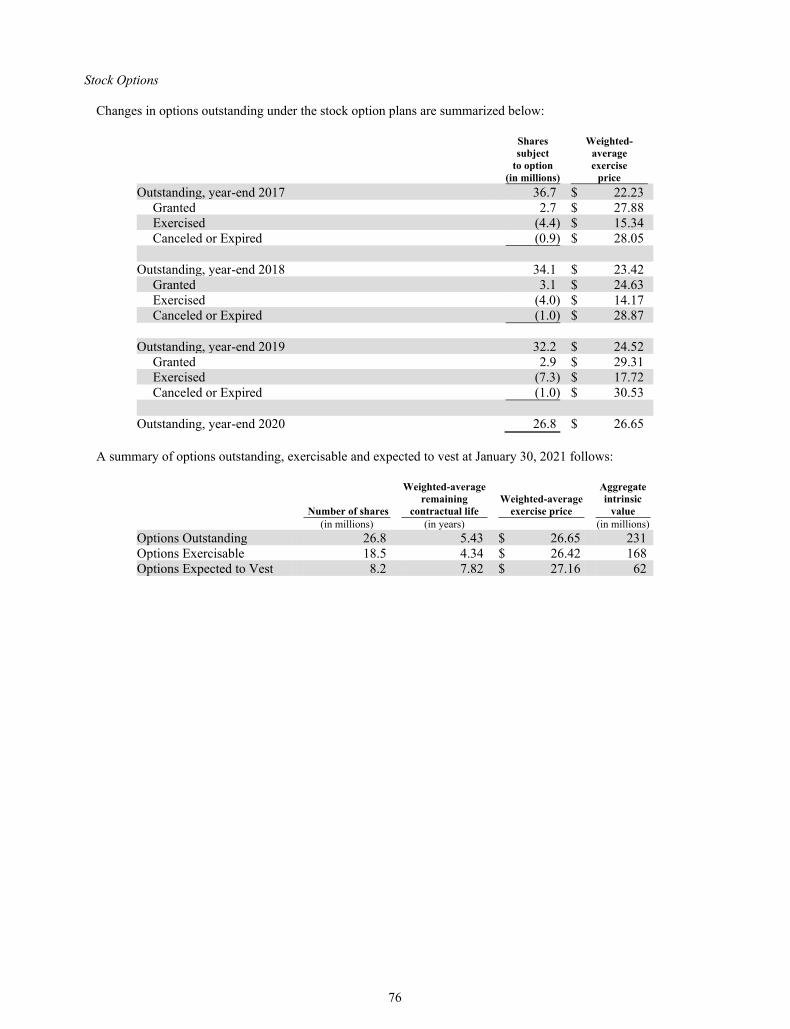
76
Stock Options
Changes in options outstanding under the stock option plans are summarized below:
Shares Weighted- subject average to option exercise (in millions) price
Outstanding, year-end 2017 36.7 $ 22.23 Granted 2.7 $ 27.88 Exercised (4.4) $ 15.34 Canceled or Expired (0.9) $ 28.05
Outstanding, year-end 2018 34.1 $ 23.42
Granted 3.1 $ 24.63 Exercised (4.0) $ 14.17 Canceled or Expired (1.0) $ 28.87
Outstanding, year-end 2019 32.2 $ 24.52
Granted 2.9 $ 29.31 Exercised (7.3) $ 17.72 Canceled or Expired (1.0) $ 30.53
Outstanding, year-end 2020 26.8 $ 26.65
A summary of options outstanding, exercisable and expected to vest at January 30, 2021 follows:
Weighted-average Aggregate remaining Weighted-average intrinsic Number of shares contractual life exercise price value (in millions) (in years) (in millions)
Options Outstanding 26.8 5.43 $ 26.65 231 Options Exercisable 18.5 4.34 $ 26.42 168 Options Expected to Vest 8.2 7.82 $ 27.16 62
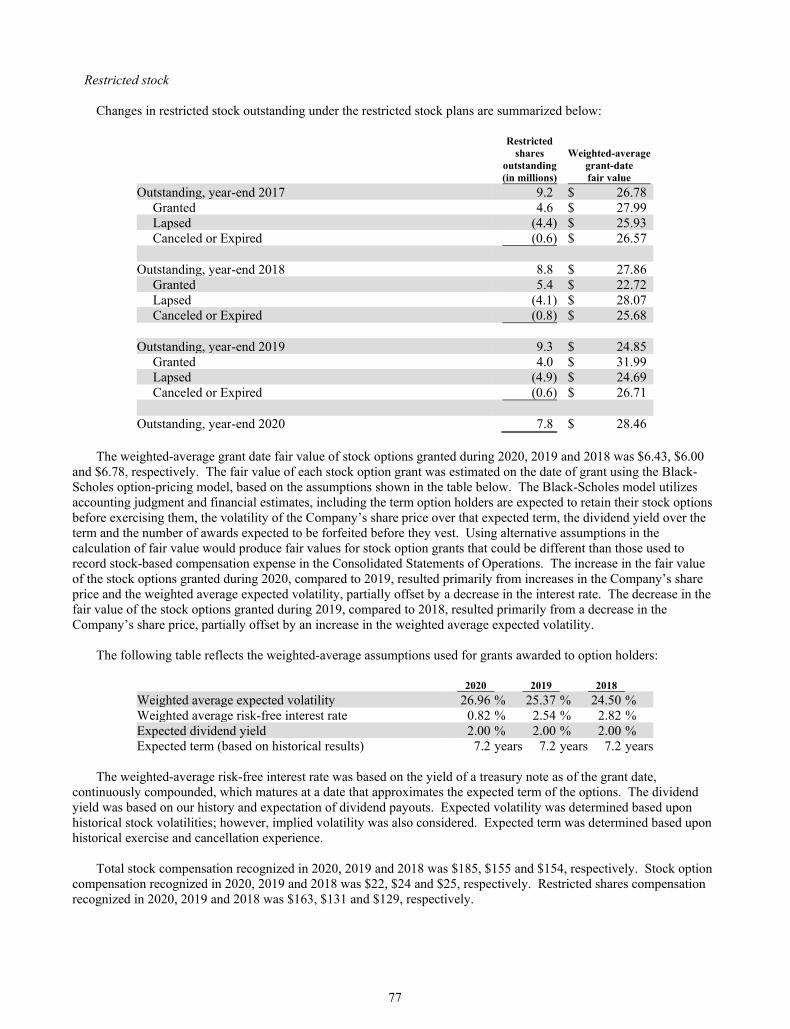
77
Restricted stock
Changes in restricted stock outstanding under the restricted stock plans are summarized below:
Restricted shares Weighted-average outstanding grant-date (in millions) fair value
Outstanding, year-end 2017 9.2 $ 26.78 Granted 4.6 $ 27.99 Lapsed (4.4) $ 25.93 Canceled or Expired (0.6) $ 26.57
Outstanding, year-end 2018 8.8 $ 27.86
Granted 5.4 $ 22.72 Lapsed (4.1) $ 28.07 Canceled or Expired (0.8) $ 25.68
Outstanding, year-end 2019 9.3 $ 24.85
Granted 4.0 $ 31.99 Lapsed (4.9) $ 24.69 Canceled or Expired (0.6) $ 26.71
Outstanding, year-end 2020 7.8 $ 28.46
The weighted-average grant date fair value of stock options granted during 2020, 2019 and 2018 was $6.43, $6.00
and $6.78, respectively. The fair value of each stock option grant was estimated on the date of grant using the Black-Scholes option-pricing model, based on the assumptions shown in the table below. The Black-Scholes model utilizes accounting judgment and financial estimates, including the term option holders are expected to retain their stock options before exercising them, the volatility of the Company’s share price over that expected term, the dividend yield over the term and the number of awards expected to be forfeited before they vest. Using alternative assumptions in the calculation of fair value would produce fair values for stock option grants that could be different than those used to record stock-based compensation expense in the Consolidated Statements of Operations. The increase in the fair value of the stock options granted during 2020, compared to 2019, resulted primarily from increases in the Company’s share price and the weighted average expected volatility, partially offset by a decrease in the interest rate. The decrease in the fair value of the stock options granted during 2019, compared to 2018, resulted primarily from a decrease in the Company’s share price, partially offset by an increase in the weighted average expected volatility.
The following table reflects the weighted-average assumptions used for grants awarded to option holders:
2020 2019 2018
Weighted average expected volatility 26.96 % 25.37 % 24.50 % Weighted average risk-free interest rate 0.82 % 2.54 % 2.82 % Expected dividend yield 2.00 % 2.00 % 2.00 % Expected term (based on historical results) 7.2 years 7.2 years 7.2 years
The weighted-average risk-free interest rate was based on the yield of a treasury note as of the grant date,
continuously compounded, which matures at a date that approximates the expected term of the options. The dividend yield was based on our history and expectation of dividend payouts. Expected volatility was determined based upon historical stock volatilities; however, implied volatility was also considered. Expected term was determined based upon historical exercise and cancellation experience.
Total stock compensation recognized in 2020, 2019 and 2018 was $185, $155 and $154, respectively. Stock option compensation recognized in 2020, 2019 and 2018 was $22, $24 and $25, respectively. Restricted shares compensation recognized in 2020, 2019 and 2018 was $163, $131 and $129, respectively.
78
The total intrinsic value of stock options exercised was $115, $51 and $58 in 2020, 2019 and 2018, respectively. The total amount of cash received in 2020 by the Company from the exercise of stock options granted under share-based payment arrangements was $127. As of January 30, 2021, there was $201 of total unrecognized compensation expense remaining related to non-vested share-based compensation arrangements granted under Plans. This cost is expected to be recognized over a weighted-average period of approximately two years. The total fair value of options that vested was $23, $26 and $30 in 2020, 2019 and 2018, respectively.
Shares issued as a result of stock option exercises may be newly issued shares or reissued treasury shares. Proceeds received from the exercise of options, and the related tax benefit, may be utilized to repurchase the Company’s common shares under a stock repurchase program adopted by the Company’s Board of Directors. During 2020, the Company repurchased approximately four million common shares in such a manner. 13. COMMITMENTS AND CONTINGENCIES
The Company continuously evaluates contingencies based upon the best available evidence. The Company believes that allowances for loss have been provided to the extent necessary and that its assessment of
contingencies is reasonable. To the extent that resolution of contingencies results in amounts that vary from the Company’s estimates, future earnings will be charged or credited.
The principal contingencies are described below: Insurance — The Company’s workers’ compensation risks are self-insured in most states. In addition, other
workers’ compensation risks and certain levels of insured general liability risks are based on retrospective premium plans, deductible plans, and self-insured retention plans. The liability for workers’ compensation risks is accounted for on a present value basis. Actual claim settlements and expenses incident thereto may differ from the provisions for loss. Property risks have been underwritten by a subsidiary and are all reinsured with unrelated insurance companies. Operating divisions and subsidiaries have paid premiums, and the insurance subsidiary has provided loss allowances, based upon actuarially determined estimates.
Litigation — Various claims and lawsuits arising in the normal course of business, including personal injury,
contract disputes, employment discrimination, wage and hour and other regulatory claims are pending against the Company. Some of these suits purport or have been determined to be class actions and/or seek substantial damages. Although it is not possible at this time to evaluate the merits of all of these claims and lawsuits, nor their likelihood of success, the Company is of the belief that any resulting liability will not have a material effect on the Company’s financial position, results of operations, or cash flows.
The Company continually evaluates its exposure to loss contingencies arising from pending or threatened litigation
and believes it has made provisions where it is reasonably possible to estimate and when an adverse outcome is probable. Nonetheless, assessing and predicting the outcomes of these matters involves substantial uncertainties. Management currently believes that the aggregate range of loss for the Company’s exposure is not material to the Company. It remains possible that despite management’s current belief, material differences in actual outcomes or changes in management’s evaluation or predictions could arise that could have a material adverse effect on the Company’s financial condition, results of operations, or cash flows.
Assignments — The Company is contingently liable for leases that have been assigned to various third parties in connection with facility closings and dispositions. The Company could be required to satisfy the obligations under the leases if any of the assignees is unable to fulfill its lease obligations. Due to the wide distribution of the Company’s assignments among third parties, and various other remedies available, the Company believes the likelihood that it will be required to assume a material amount of these obligations is remote.
79
14. STOCK
Preferred Shares
The Company has authorized five million shares of voting cumulative preferred shares; two million shares were available for issuance at January 30, 2021. The shares have a par value of $100 per share and are issuable in series.
Common Shares
The Company has authorized two billion common shares, $1 par value per share.
Common Stock Repurchase Program
The Company maintains stock repurchase programs that comply with Rule 10b5-1 of the Securities Exchange Act of 1934 to allow for the orderly repurchase of The Kroger Co. common shares, from time to time. The Company made open market purchases totaling $1,196, $400 and $727 under these repurchase programs in 2020, 2019 and 2018, respectively.
On April 20, 2018 the Company entered and funded a $1,200 accelerated stock repurchase (“ASR”) program to
reacquire shares in privately negotiated transactions. The final delivery under the ASR program occurred during the second quarter of 2018, which included the settlement of the remaining 2.3 million Kroger Common shares. In total, the Company invested $1,200 to repurchase 46.3 million Kroger common shares at an average price of $25.91 per share.
In addition to these repurchase programs, in December 1999, the Company began a program to repurchase common
shares to reduce dilution resulting from its employee stock option plans. This program is solely funded by proceeds from stock option exercises and the related tax benefit. The Company repurchased approximately $128, $65 and $83 under the stock option program during 2020, 2019 and 2018, respectively. 15. COMPANY- SPONSORED BENEFIT PLANS
The Company administers non-contributory defined benefit retirement plans for some non-union employees and union-represented employees as determined by the terms and conditions of collective bargaining agreements. These include several qualified pension plans (the “Qualified Plans”) and non-qualified pension plans (the “Non-Qualified Plans”). The Non-Qualified Plans pay benefits to any employee that earns in excess of the maximum allowed for the Qualified Plans by Section 415 of the Internal Revenue Code. The Company only funds obligations under the Qualified Plans. Funding for the company-sponsored pension plans is based on a review of the specific requirements and on evaluation of the assets and liabilities of each plan.
In addition to providing pension benefits, the Company provides certain health care benefits for retired employees.
Based on employee’s age, years of service and position with the Company, the employee may be eligible for retiree health care benefits. Funding of retiree health care benefits occurs as claims or premiums are paid.
The Company recognizes the funded status of its retirement plans on the Consolidated Balance Sheets. Actuarial
gains or losses, prior service costs or credits and transition obligations that have not yet been recognized as part of net periodic benefit cost are required to be recorded as a component of AOCI. The Company has elected to measure defined benefit plan assets and obligations as of January 31, which is the month-end that is closest to its fiscal year-ends, which were January 30, 2021 for fiscal 2020 and February 1, 2020 for fiscal 2019.
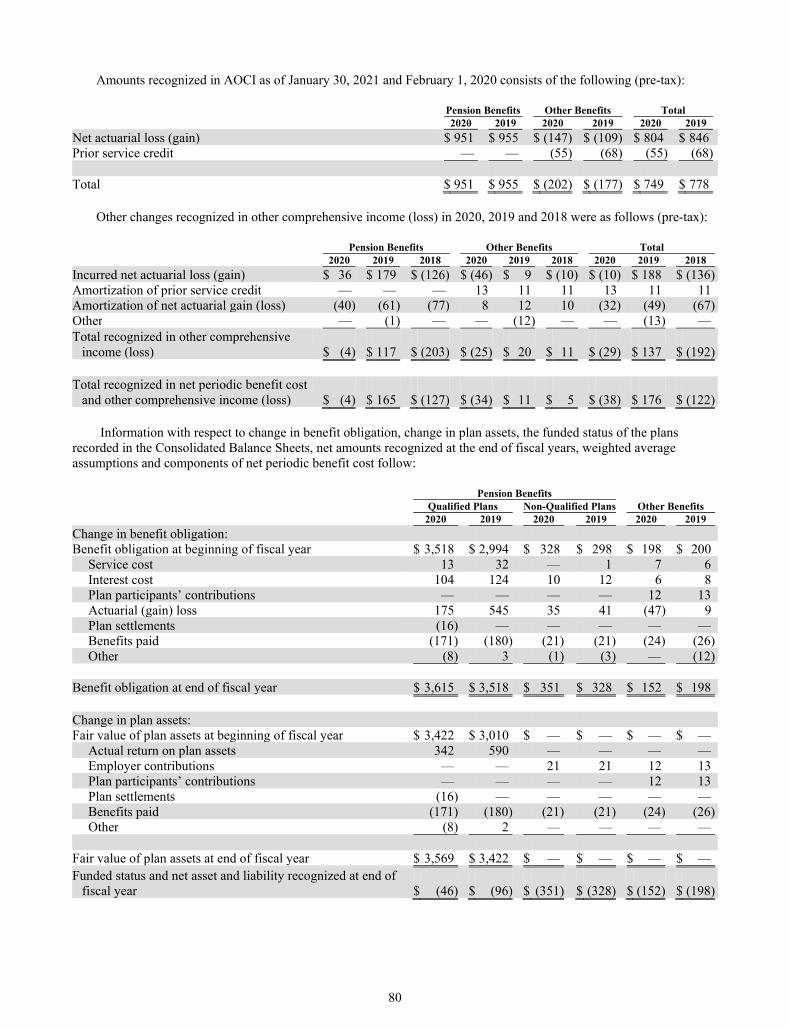
80
Amounts recognized in AOCI as of January 30, 2021 and February 1, 2020 consists of the following (pre-tax):
Pension Benefits Other Benefits Total 2020 2019 2020 2019 2020 2019
Net actuarial loss (gain) $ 951 $ 955 $ (147) $ (109) $ 804 $ 846 Prior service credit — — (55) (68) (55) (68) Total $ 951 $ 955 $ (202) $ (177) $ 749 $ 778
Other changes recognized in other comprehensive income (loss) in 2020, 2019 and 2018 were as follows (pre-tax):
Pension Benefits Other Benefits Total 2020 2019 2018 2020 2019 2018 2020 2019 2018
Incurred net actuarial loss (gain) $ 36 $ 179 $ (126) $ (46) $ 9 $ (10) $ (10) $ 188 $ (136) Amortization of prior service credit — — — 13 11 11 13 11 11 Amortization of net actuarial gain (loss) (40) (61) (77) 8 12 10 (32) (49) (67) Other — (1) — — (12) — — (13) — Total recognized in other comprehensive
income (loss) $ (4) $ 117 $ (203) $ (25) $ 20 $ 11 $ (29) $ 137 $ (192) Total recognized in net periodic benefit cost
and other comprehensive income (loss) $ (4) $ 165 $ (127) $ (34) $ 11 $ 5 $ (38) $ 176 $ (122)
Information with respect to change in benefit obligation, change in plan assets, the funded status of the plans recorded in the Consolidated Balance Sheets, net amounts recognized at the end of fiscal years, weighted average assumptions and components of net periodic benefit cost follow:
Pension Benefits Qualified Plans Non-Qualified Plans Other Benefits 2020 2019 2020 2019 2020 2019
Change in benefit obligation: Benefit obligation at beginning of fiscal year $ 3,518 $ 2,994 $ 328 $ 298 $ 198 $ 200
Service cost 13 32 — 1 7 6 Interest cost 104 124 10 12 6 8 Plan participants’ contributions — — — — 12 13 Actuarial (gain) loss 175 545 35 41 (47) 9 Plan settlements (16) — — — — — Benefits paid (171) (180) (21) (21) (24) (26) Other (8) 3 (1) (3) — (12)
Benefit obligation at end of fiscal year $ 3,615 $ 3,518 $ 351 $ 328 $ 152 $ 198 Change in plan assets: Fair value of plan assets at beginning of fiscal year $ 3,422 $ 3,010 $ — $ — $ — $ —
Actual return on plan assets 342 590 — — — — Employer contributions — — 21 21 12 13 Plan participants’ contributions — — — — 12 13 Plan settlements (16) — — — — — Benefits paid (171) (180) (21) (21) (24) (26) Other (8) 2 — — — —
Fair value of plan assets at end of fiscal year $ 3,569 $ 3,422 $ — $ — $ — $ — Funded status and net asset and liability recognized at end of
fiscal year $ (46) $ (96) $ (351) $ (328) $ (152) $ (198)
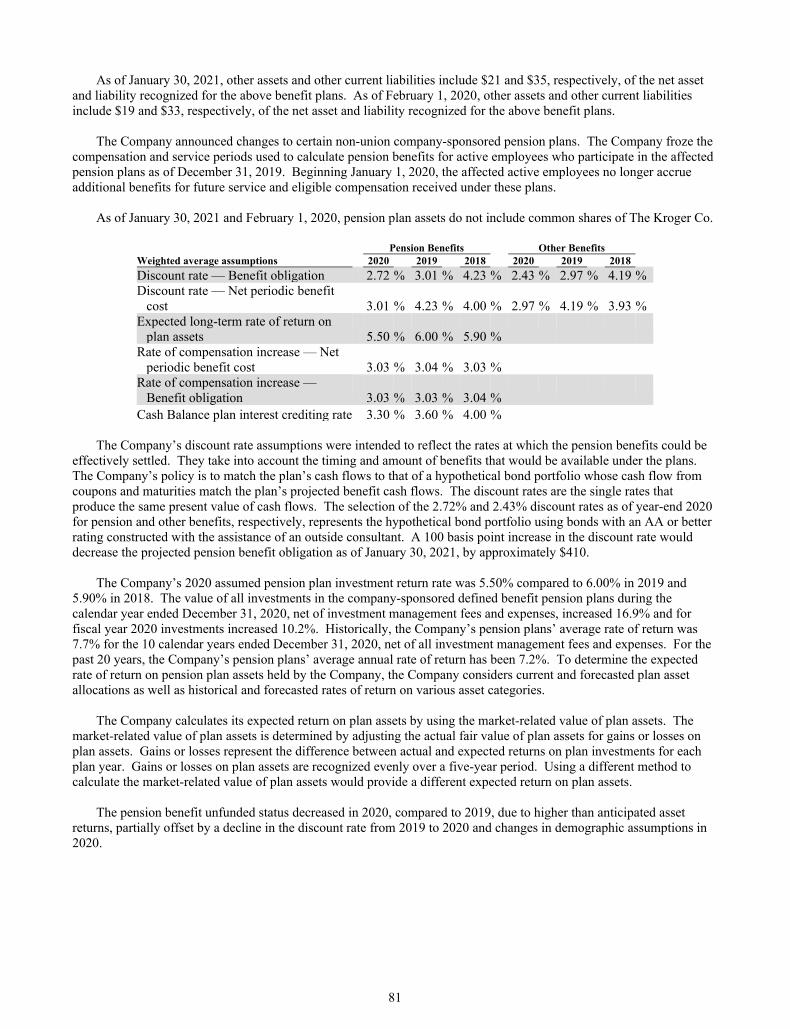
81
As of January 30, 2021, other assets and other current liabilities include $21 and $35, respectively, of the net asset and liability recognized for the above benefit plans. As of February 1, 2020, other assets and other current liabilities include $19 and $33, respectively, of the net asset and liability recognized for the above benefit plans.
The Company announced changes to certain non-union company-sponsored pension plans. The Company froze the
compensation and service periods used to calculate pension benefits for active employees who participate in the affected pension plans as of December 31, 2019. Beginning January 1, 2020, the affected active employees no longer accrue additional benefits for future service and eligible compensation received under these plans.
As of January 30, 2021 and February 1, 2020, pension plan assets do not include common shares of The Kroger Co.
Pension Benefits Other Benefits Weighted average assumptions 2020 2019 2018 2020 2019 2018
Discount rate — Benefit obligation 2.72 % 3.01 % 4.23 % 2.43 % 2.97 % 4.19 % Discount rate — Net periodic benefit
cost 3.01 % 4.23 % 4.00 % 2.97 % 4.19 % 3.93 % Expected long-term rate of return on
plan assets 5.50 % 6.00 % 5.90 % Rate of compensation increase — Net
periodic benefit cost 3.03 % 3.04 % 3.03 % Rate of compensation increase —
Benefit obligation 3.03 % 3.03 % 3.04 % Cash Balance plan interest crediting rate 3.30 % 3.60 % 4.00 %
The Company’s discount rate assumptions were intended to reflect the rates at which the pension benefits could be
effectively settled. They take into account the timing and amount of benefits that would be available under the plans. The Company’s policy is to match the plan’s cash flows to that of a hypothetical bond portfolio whose cash flow from coupons and maturities match the plan’s projected benefit cash flows. The discount rates are the single rates that produce the same present value of cash flows. The selection of the 2.72% and 2.43% discount rates as of year-end 2020 for pension and other benefits, respectively, represents the hypothetical bond portfolio using bonds with an AA or better rating constructed with the assistance of an outside consultant. A 100 basis point increase in the discount rate would decrease the projected pension benefit obligation as of January 30, 2021, by approximately $410.
The Company’s 2020 assumed pension plan investment return rate was 5.50% compared to 6.00% in 2019 and
5.90% in 2018. The value of all investments in the company-sponsored defined benefit pension plans during the calendar year ended December 31, 2020, net of investment management fees and expenses, increased 16.9% and for fiscal year 2020 investments increased 10.2%. Historically, the Company’s pension plans’ average rate of return was 7.7% for the 10 calendar years ended December 31, 2020, net of all investment management fees and expenses. For the past 20 years, the Company’s pension plans’ average annual rate of return has been 7.2%. To determine the expected rate of return on pension plan assets held by the Company, the Company considers current and forecasted plan asset allocations as well as historical and forecasted rates of return on various asset categories.
The Company calculates its expected return on plan assets by using the market-related value of plan assets. The
market-related value of plan assets is determined by adjusting the actual fair value of plan assets for gains or losses on plan assets. Gains or losses represent the difference between actual and expected returns on plan investments for each plan year. Gains or losses on plan assets are recognized evenly over a five-year period. Using a different method to calculate the market-related value of plan assets would provide a different expected return on plan assets.
The pension benefit unfunded status decreased in 2020, compared to 2019, due to higher than anticipated asset
returns, partially offset by a decline in the discount rate from 2019 to 2020 and changes in demographic assumptions in 2020.
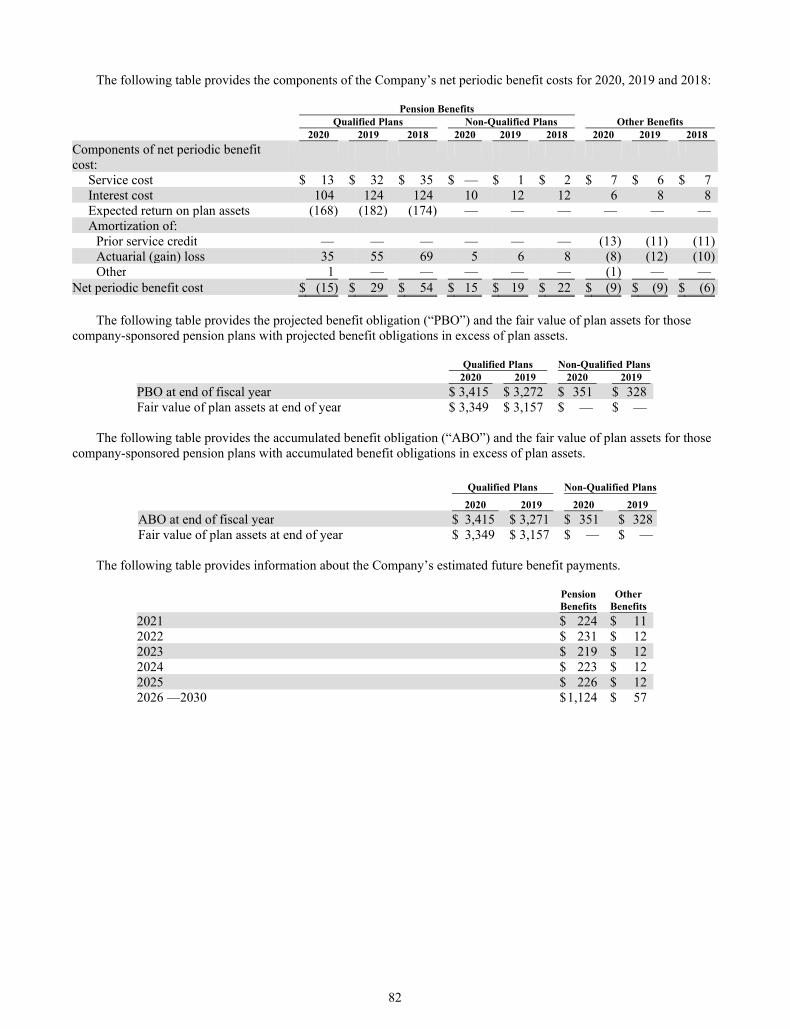
82
The following table provides the components of the Company’s net periodic benefit costs for 2020, 2019 and 2018:
Pension Benefits Qualified Plans Non-Qualified Plans Other Benefits 2020 2019 2018 2020 2019 2018 2020 2019 2018
Components of net periodic benefit cost:
Service cost $ 13 $ 32 $ 35 $ — $ 1 $ 2 $ 7 $ 6 $ 7 Interest cost 104 124 124 10 12 12 6 8 8 Expected return on plan assets (168) (182) (174) — — — — — — Amortization of:
Prior service credit — — — — — — (13) (11) (11) Actuarial (gain) loss 35 55 69 5 6 8 (8) (12) (10) Other 1 — — — — — (1) — —
Net periodic benefit cost $ (15) $ 29 $ 54 $ 15 $ 19 $ 22 $ (9) $ (9) $ (6)
The following table provides the projected benefit obligation (“PBO”) and the fair value of plan assets for those company-sponsored pension plans with projected benefit obligations in excess of plan assets.
Qualified Plans Non-Qualified Plans 2020 2019 2020 2019
PBO at end of fiscal year $ 3,415 $ 3,272 $ 351 $ 328 Fair value of plan assets at end of year $ 3,349 $ 3,157 $ — $ —
The following table provides the accumulated benefit obligation (“ABO”) and the fair value of plan assets for those
company-sponsored pension plans with accumulated benefit obligations in excess of plan assets.
Qualified Plans Non-Qualified Plans
2020 2019 2020 2019
ABO at end of fiscal year $ 3,415 $ 3,271 $ 351 $ 328 Fair value of plan assets at end of year $ 3,349 $ 3,157 $ — $ —
The following table provides information about the Company’s estimated future benefit payments.
Pension Other Benefits Benefits
2021 $ 224 $ 11 2022 $ 231 $ 12 2023 $ 219 $ 12 2024 $ 223 $ 12 2025 $ 226 $ 12 2026 —2030 $ 1,124 $ 57
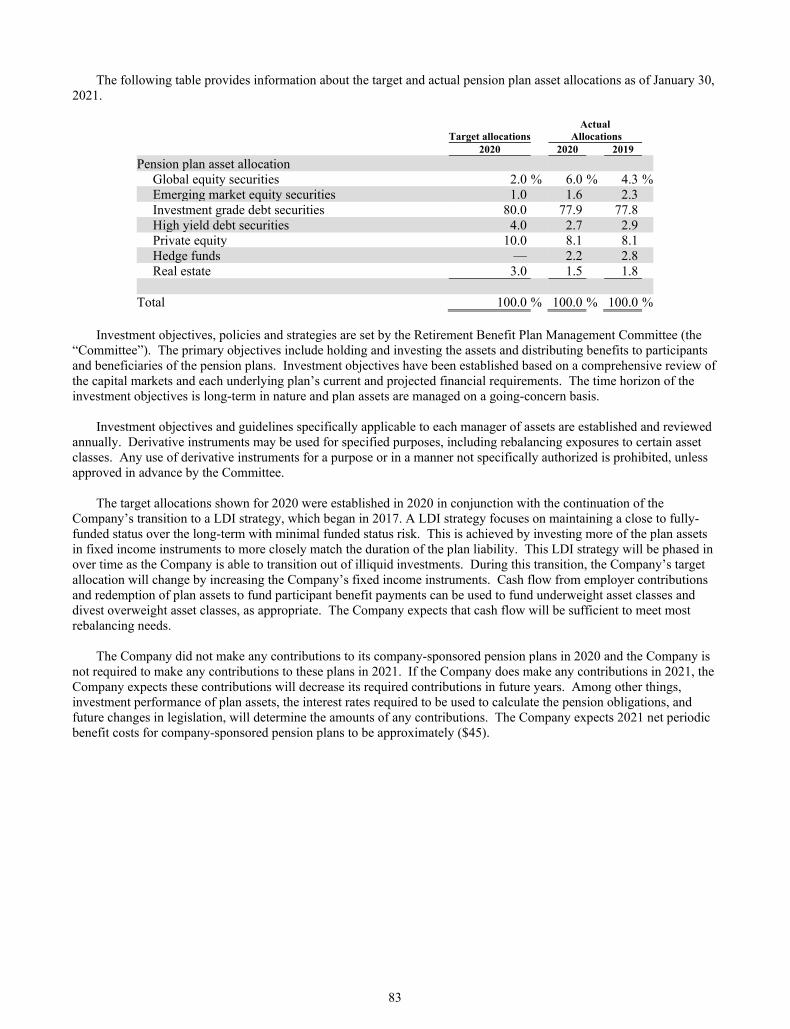
83
The following table provides information about the target and actual pension plan asset allocations as of January 30, 2021.
Actual Target allocations Allocations 2020 2020 2019
Pension plan asset allocation Global equity securities 2.0 % 6.0 % 4.3 % Emerging market equity securities 1.0 1.6 2.3 Investment grade debt securities 80.0 77.9 77.8 High yield debt securities 4.0 2.7 2.9 Private equity 10.0 8.1 8.1 Hedge funds — 2.2 2.8 Real estate 3.0 1.5 1.8
Total 100.0 % 100.0 % 100.0 %
Investment objectives, policies and strategies are set by the Retirement Benefit Plan Management Committee (the
“Committee”). The primary objectives include holding and investing the assets and distributing benefits to participants and beneficiaries of the pension plans. Investment objectives have been established based on a comprehensive review of the capital markets and each underlying plan’s current and projected financial requirements. The time horizon of the investment objectives is long-term in nature and plan assets are managed on a going-concern basis.
Investment objectives and guidelines specifically applicable to each manager of assets are established and reviewed annually. Derivative instruments may be used for specified purposes, including rebalancing exposures to certain asset classes. Any use of derivative instruments for a purpose or in a manner not specifically authorized is prohibited, unless approved in advance by the Committee.
The target allocations shown for 2020 were established in 2020 in conjunction with the continuation of the
Company’s transition to a LDI strategy, which began in 2017. A LDI strategy focuses on maintaining a close to fully-funded status over the long-term with minimal funded status risk. This is achieved by investing more of the plan assets in fixed income instruments to more closely match the duration of the plan liability. This LDI strategy will be phased in over time as the Company is able to transition out of illiquid investments. During this transition, the Company’s target allocation will change by increasing the Company’s fixed income instruments. Cash flow from employer contributions and redemption of plan assets to fund participant benefit payments can be used to fund underweight asset classes and divest overweight asset classes, as appropriate. The Company expects that cash flow will be sufficient to meet most rebalancing needs.
The Company did not make any contributions to its company-sponsored pension plans in 2020 and the Company is
not required to make any contributions to these plans in 2021. If the Company does make any contributions in 2021, the Company expects these contributions will decrease its required contributions in future years. Among other things, investment performance of plan assets, the interest rates required to be used to calculate the pension obligations, and future changes in legislation, will determine the amounts of any contributions. The Company expects 2021 net periodic benefit costs for company-sponsored pension plans to be approximately ($45).
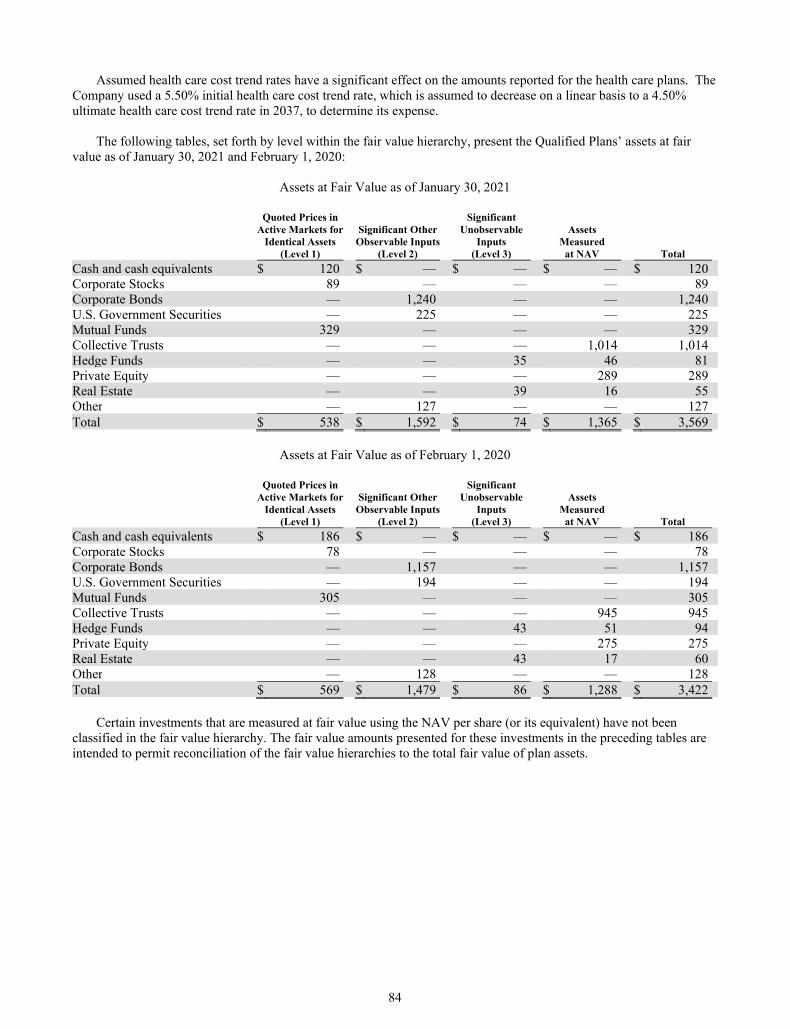
84
Assumed health care cost trend rates have a significant effect on the amounts reported for the health care plans. The Company used a 5.50% initial health care cost trend rate, which is assumed to decrease on a linear basis to a 4.50% ultimate health care cost trend rate in 2037, to determine its expense.
The following tables, set forth by level within the fair value hierarchy, present the Qualified Plans’ assets at fair
value as of January 30, 2021 and February 1, 2020:
Assets at Fair Value as of January 30, 2021
Quoted Prices in Significant Active Markets for Significant Other Unobservable Assets Identical Assets Observable Inputs Inputs Measured (Level 1) (Level 2) (Level 3) at NAV Total
Cash and cash equivalents $ 120 $ — $ — $ — $ 120 Corporate Stocks 89 — — — 89 Corporate Bonds — 1,240 — — 1,240 U.S. Government Securities — 225 — — 225 Mutual Funds 329 — — — 329 Collective Trusts — — — 1,014 1,014 Hedge Funds — — 35 46 81 Private Equity — — — 289 289 Real Estate — — 39 16 55 Other — 127 — — 127 Total $ 538 $ 1,592 $ 74 $ 1,365 $ 3,569
Assets at Fair Value as of February 1, 2020
Quoted Prices in Significant Active Markets for Significant Other Unobservable Assets Identical Assets Observable Inputs Inputs Measured (Level 1) (Level 2) (Level 3) at NAV Total
Cash and cash equivalents $ 186 $ — $ — $ — $ 186 Corporate Stocks 78 — — — 78 Corporate Bonds — 1,157 — — 1,157 U.S. Government Securities — 194 — — 194 Mutual Funds 305 — — — 305 Collective Trusts — — — 945 945 Hedge Funds — — 43 51 94 Private Equity — — — 275 275 Real Estate — — 43 17 60 Other — 128 — — 128 Total $ 569 $ 1,479 $ 86 $ 1,288 $ 3,422
Certain investments that are measured at fair value using the NAV per share (or its equivalent) have not been classified in the fair value hierarchy. The fair value amounts presented for these investments in the preceding tables are intended to permit reconciliation of the fair value hierarchies to the total fair value of plan assets.
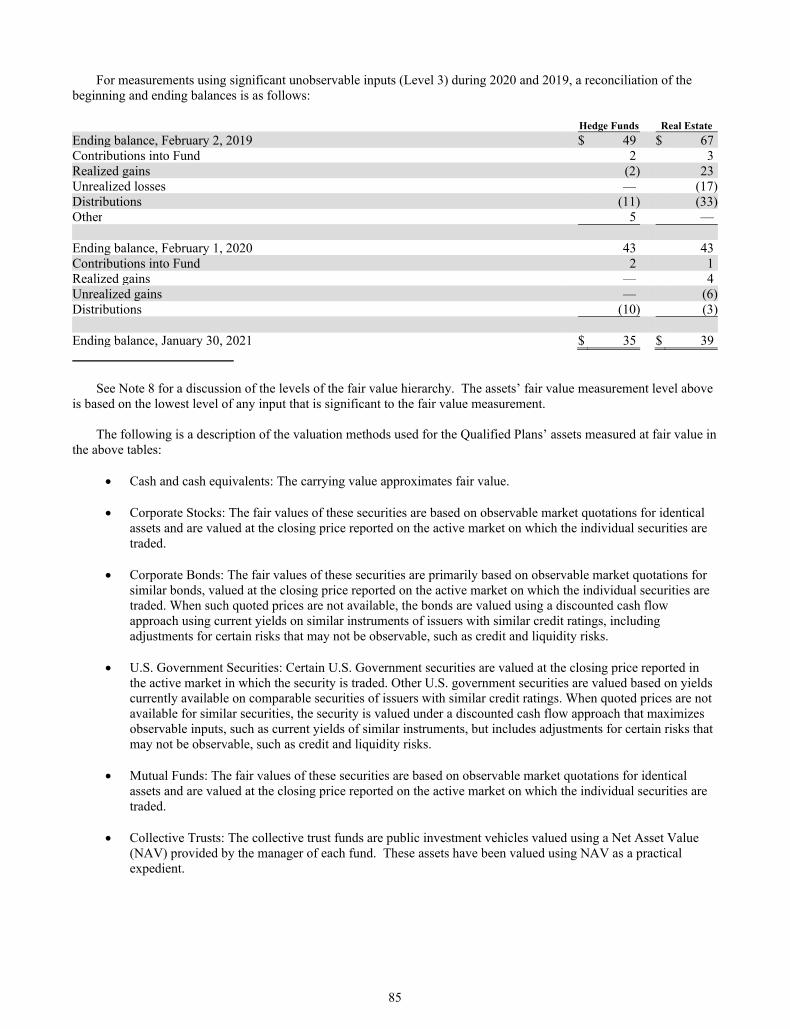
85
For measurements using significant unobservable inputs (Level 3) during 2020 and 2019, a reconciliation of the beginning and ending balances is as follows:
Hedge Funds Real Estate
Ending balance, February 2, 2019 $ 49 $ 67 Contributions into Fund 2 3 Realized gains (2) 23 Unrealized losses — (17)Distributions (11) (33)Other 5 — Ending balance, February 1, 2020 43 43 Contributions into Fund 2 1 Realized gains — 4 Unrealized gains — (6)Distributions (10) (3) Ending balance, January 30, 2021 $ 35 $ 39
See Note 8 for a discussion of the levels of the fair value hierarchy. The assets’ fair value measurement level above
is based on the lowest level of any input that is significant to the fair value measurement. The following is a description of the valuation methods used for the Qualified Plans’ assets measured at fair value in
the above tables:
Cash and cash equivalents: The carrying value approximates fair value. Corporate Stocks: The fair values of these securities are based on observable market quotations for identical
assets and are valued at the closing price reported on the active market on which the individual securities are traded.
Corporate Bonds: The fair values of these securities are primarily based on observable market quotations for
similar bonds, valued at the closing price reported on the active market on which the individual securities are traded. When such quoted prices are not available, the bonds are valued using a discounted cash flow approach using current yields on similar instruments of issuers with similar credit ratings, including adjustments for certain risks that may not be observable, such as credit and liquidity risks.
U.S. Government Securities: Certain U.S. Government securities are valued at the closing price reported in the active market in which the security is traded. Other U.S. government securities are valued based on yields currently available on comparable securities of issuers with similar credit ratings. When quoted prices are not available for similar securities, the security is valued under a discounted cash flow approach that maximizes observable inputs, such as current yields of similar instruments, but includes adjustments for certain risks that may not be observable, such as credit and liquidity risks.
Mutual Funds: The fair values of these securities are based on observable market quotations for identical
assets and are valued at the closing price reported on the active market on which the individual securities are traded.
Collective Trusts: The collective trust funds are public investment vehicles valued using a Net Asset Value
(NAV) provided by the manager of each fund. These assets have been valued using NAV as a practical expedient.
86
Hedge Funds: The Hedge funds classified as Level 3 include investments that are not readily tradeable and have valuations that are not based on readily observable data inputs. The fair value of these assets is estimated based on information provided by the fund managers or the general partners. Therefore, these assets are classified as Level 3. Certain other hedge funds are private investment vehicles valued using a NAV provided by the manager of each fund. These assets have been valued using NAV as a practical expedient.
Private Equity: Private Equity investments are valued based on the fair value of the underlying securities
within the fund, which include investments both traded on an active market and not traded on an active market. For those investments that are traded on an active market, the values are based on the closing price reported on the active market on which those individual securities are traded. For investments not traded on an active market, or for which a quoted price is not publicly available, a variety of unobservable valuation methodologies, including discounted cash flow, market multiple and cost valuation approaches, are employed by the fund manager to value investments. Fair values of all investments are adjusted annually, if necessary, based on audits of the private equity fund financial statements; such adjustments are reflected in the fair value of the plan’s assets.
Real Estate: Real estate investments include investments in real estate funds managed by a fund manager.
These investments are valued using a variety of unobservable valuation methodologies, including discounted cash flow, market multiple and cost valuation approaches. The valuations for these investments are not based on readily observable inputs and are classified as Level 3 investments. Certain other real estate investments are valued using a NAV provided by the manager of each fund. These assets have been valued using NAV as a practical expedient.
The methods described above may produce a fair value calculation that may not be indicative of net realizable value
or reflective of future fair values. Furthermore, while the Company believes its valuation methods are appropriate and consistent with other market participants, the use of different methodologies or assumptions to determine the fair value of certain financial instruments could result in a different fair value measurement.
The Company contributed and expensed $294, $264 and $263 to employee 401(k) retirement savings accounts in
2020, 2019 and 2018, respectively. The 401(k) retirement savings account plans provide to eligible employees both matching contributions and automatic contributions from the Company based on participant contributions, compensation as defined by the plan and length of service.
In 2019, the Company approved and implemented a plan to reorganize certain portions of its division management structure. This reorganization increased operational effectiveness and reduced overhead costs while maintaining a high quality customer experience. The Company recorded a charge for severance and related benefits of $80, $61 net of tax, in 2019, which is included in the OG&A caption within the Consolidated Statements of Operations. Of the total charge, $42 was unpaid as of February 1, 2020 and was included in Other Current Liabilities within the Consolidated Balance Sheet and the remaining balance was paid in 2020.
16. MULTI-EMPLOYER PENSION PLANS
The Company contributes to various multi-employer pension plans based on obligations arising from collective bargaining agreements. These multi-employer pension plans provide retirement benefits to participants based on their service to contributing employers. The benefits are paid from assets held in trust for that purpose. Trustees are appointed in equal number by employers and unions. The trustees typically are responsible for determining the level of benefits to be provided to participants as well as for such matters as the investment of the assets and the administration of the plans.
The Company recognizes expense in connection with these plans as contributions are funded or when commitments
are probable and reasonably estimable, in accordance with GAAP. The Company made cash contributions to these plans of $619 in 2020, $461 in 2019 and $358 in 2018. The increase in 2020, compared to 2019 and 2018, is primarily due to incremental contributions of $236, $180 net of tax, to multi-employer pension plans, helping stabilize future associate benefits.
87
The Company continues to evaluate and address potential exposure to under-funded multi-employer pension plans as it relates to the Company’s associates who are beneficiaries of these plans. These under-fundings are not a liability of the Company. When an opportunity arises that is economically feasible and beneficial to the Company and its associates, the Company may negotiate the restructuring of under-funded multi-employer pension plan obligations to help stabilize associates’ future benefits and become the fiduciary of the restructured multi-employer pension plan. The commitments from these restructurings do not change the Company’s debt profile as it relates to its credit rating since these off balance sheet commitments are typically considered in the Company’s investment grade debt rating.
The Company is currently designated as the named fiduciary of the United Food and Commercial Workers (“UFCW”) Consolidated Pension Plan and the International Brotherhood of Teamsters (“IBT”) Consolidated Pension Fund and has sole investment authority over these assets. Due to opportunities arising, the Company has restructured certain multi-employer pension plans. The significant effects of these restructuring agreements recorded in our Consolidated Financial Statements are:
In 2020, certain of the Company’s associates ratified an agreement with certain UFCW local unions to
withdraw from the UFCW International Union-Industry Pension Fund (“National Fund”). Due to the ratification of the agreement, the Company incurred a withdrawal liability charge of $962, on a pre-tax basis, to fulfill obligations for past service for associates and retirees in the National Fund. The Company also incurred an additional $27 commitment to a transition reserve in the new variable annuity pension plan. On an after-tax basis, the withdrawal liability and commitment to the transition reserve totaled $754. The current portion of the commitment of $523 is included in “Other current liabilities” and the long-term portion of the commitment of $466 is included in “Other long-term liabilities” in the Company’s Consolidated Balance Sheets. These commitments will be satisfied by payments to the National Fund over the next three years. The long-term portion is included in “Other” within “Changes in operating assets and liabilities net of effects from mergers and disposals of businesses” in the Company’s Consolidated Statements of Cash Flows.
In 2019, the Company incurred a $135 charge, $104 net of tax, for obligations related to withdrawal
liabilities for certain multi-employer pension plan funds.
In 2018, the Company incurred a $155 charge, $121 net of tax, for obligations related to withdrawal liabilities for certain local unions of the Central States multi-employer pension plan fund.
The risks of participating in multi-employer pension plans are different from the risks of participating in single-
employer pension plans in the following respects: a. Assets contributed to the multi-employer plan by one employer may be used to provide benefits to employees
of other participating employers. b. If a participating employer stops contributing to the plan, the unfunded obligations of the plan allocable to such
withdrawing employer may be borne by the remaining participating employers. c. If the Company stops participating in some of its multi-employer pension plans, the Company may be required
to pay those plans an amount based on its allocable share of the unfunded vested benefits of the plan, referred to as a withdrawal liability.
The Company’s participation in multi-employer plans is outlined in the following tables. The EIN / Pension Plan
Number column provides the Employer Identification Number (“EIN”) and the three-digit pension plan number. The most recent Pension Protection Act Zone Status available in 2020 and 2019 is for the plan’s year-end at December 31, 2019 and December 31, 2018, respectively. Among other factors, generally, plans in the red zone are less than 65 percent funded, plans in the yellow zone are less than 80 percent funded and plans in the green zone are at least 80 percent funded. The FIP/RP Status Pending / Implemented Column indicates plans for which a funding improvement plan (“FIP”) or a rehabilitation plan (“RP”) is either pending or has been implemented. Unless otherwise noted, the information for these tables was obtained from the Forms 5500 filed for each plan’s year-end at December 31, 2019 and December 31, 2018. The multi-employer contributions listed in the table below are the Company’s multi-employer contributions made in fiscal years 2020, 2019 and 2018.
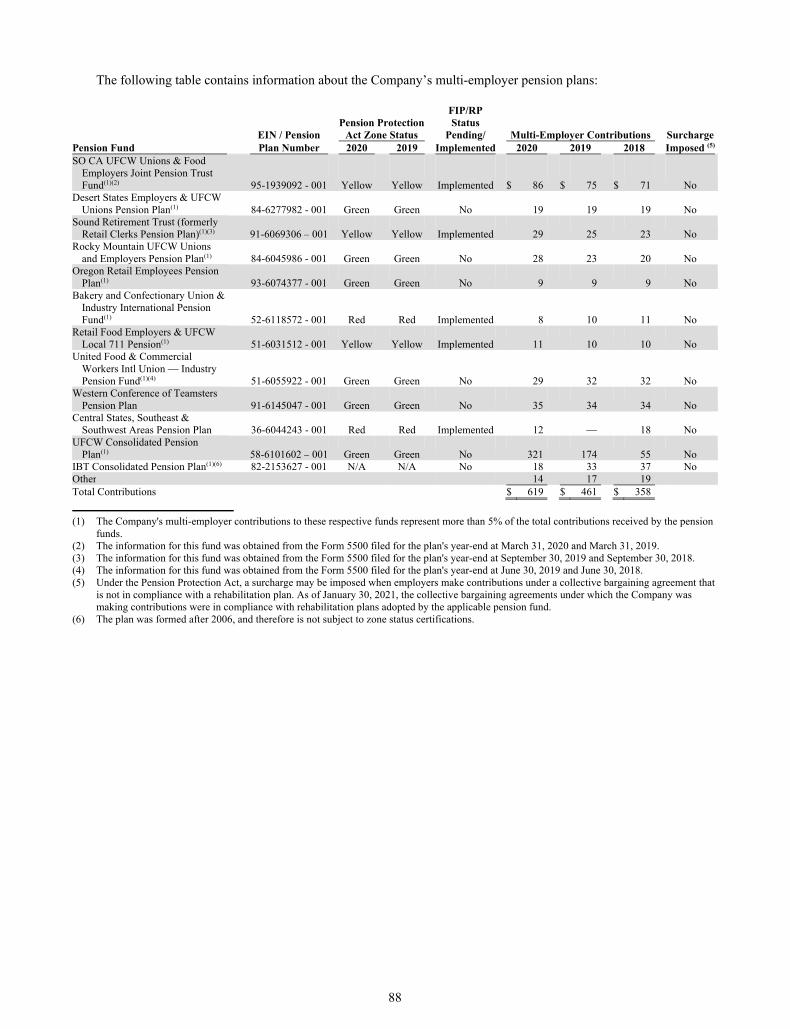
88
The following table contains information about the Company’s multi-employer pension plans:
FIP/RP Pension Protection Status EIN / Pension Act Zone Status Pending/ Multi-Employer Contributions Surcharge Pension Fund Plan Number 2020 2019 Implemented 2020 2019 2018 Imposed (5) SO CA UFCW Unions & Food
Employers Joint Pension Trust Fund(1)(2) 95-1939092 - 001 Yellow Yellow Implemented $ 86 $ 75 $ 71 No
Desert States Employers & UFCW Unions Pension Plan(1) 84-6277982 - 001 Green Green No 19 19 19 No
Sound Retirement Trust (formerly Retail Clerks Pension Plan)(1)(3) 91-6069306 – 001 Yellow Yellow Implemented 29 25 23 No
Rocky Mountain UFCW Unions and Employers Pension Plan(1) 84-6045986 - 001 Green Green No 28 23 20 No
Oregon Retail Employees Pension Plan(1) 93-6074377 - 001 Green Green No 9 9 9 No
Bakery and Confectionary Union & Industry International Pension Fund(1) 52-6118572 - 001 Red Red Implemented 8 10 11 No
Retail Food Employers & UFCW Local 711 Pension(1) 51-6031512 - 001 Yellow Yellow Implemented 11 10 10 No
United Food & Commercial Workers Intl Union — Industry Pension Fund(1)(4) 51-6055922 - 001 Green Green No 29 32 32 No
Western Conference of Teamsters Pension Plan 91-6145047 - 001 Green Green No 35 34 34 No
Central States, Southeast & Southwest Areas Pension Plan 36-6044243 - 001 Red Red Implemented 12 — 18 No
UFCW Consolidated Pension Plan(1) 58-6101602 – 001 Green Green No 321 174 55 No
IBT Consolidated Pension Plan(1)(6) 82-2153627 - 001 N/A N/A No 18 33 37 No Other 14 17 19 Total Contributions $ 619 $ 461 $ 358
(1) The Company's multi-employer contributions to these respective funds represent more than 5% of the total contributions received by the pension
funds. (2) The information for this fund was obtained from the Form 5500 filed for the plan's year-end at March 31, 2020 and March 31, 2019. (3) The information for this fund was obtained from the Form 5500 filed for the plan's year-end at September 30, 2019 and September 30, 2018. (4) The information for this fund was obtained from the Form 5500 filed for the plan's year-end at June 30, 2019 and June 30, 2018. (5) Under the Pension Protection Act, a surcharge may be imposed when employers make contributions under a collective bargaining agreement that
is not in compliance with a rehabilitation plan. As of January 30, 2021, the collective bargaining agreements under which the Company was making contributions were in compliance with rehabilitation plans adopted by the applicable pension fund.
(6) The plan was formed after 2006, and therefore is not subject to zone status certifications.
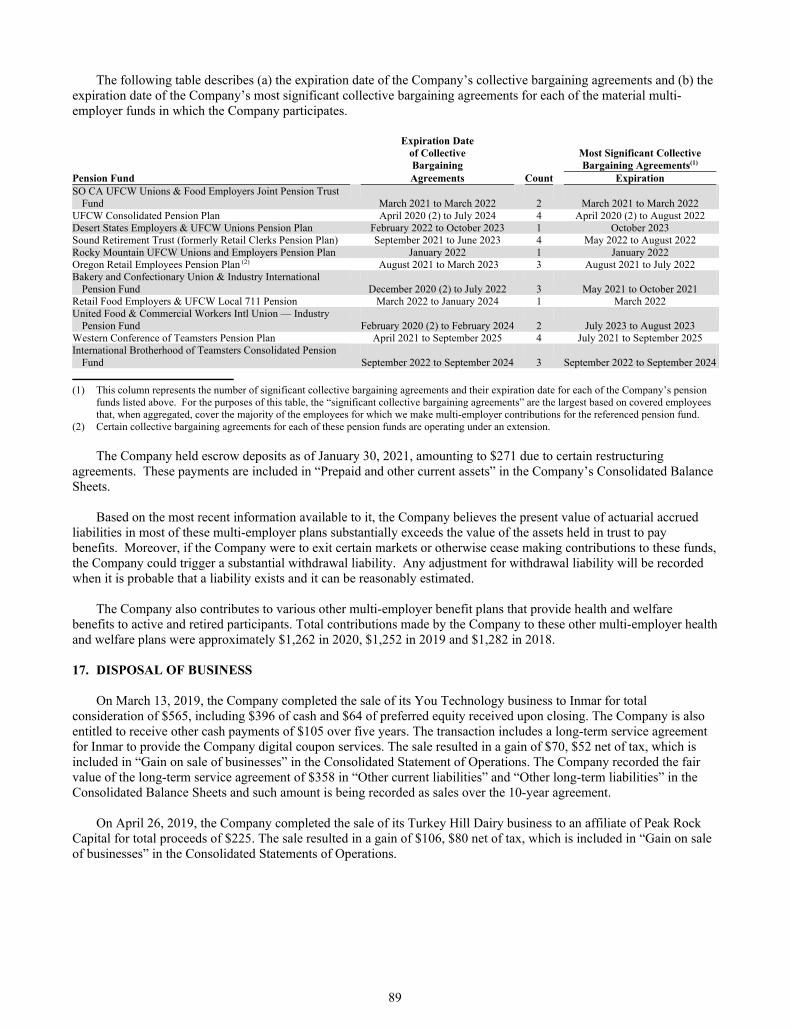
89
The following table describes (a) the expiration date of the Company’s collective bargaining agreements and (b) the expiration date of the Company’s most significant collective bargaining agreements for each of the material multi-employer funds in which the Company participates.
Expiration Date of Collective Most Significant Collective Bargaining Bargaining Agreements(1) Pension Fund Agreements Count Expiration SO CA UFCW Unions & Food Employers Joint Pension Trust
Fund March 2021 to March 2022 2 March 2021 to March 2022 UFCW Consolidated Pension Plan April 2020 (2) to July 2024 4 April 2020 (2) to August 2022 Desert States Employers & UFCW Unions Pension Plan February 2022 to October 2023 1 October 2023 Sound Retirement Trust (formerly Retail Clerks Pension Plan) September 2021 to June 2023 4 May 2022 to August 2022 Rocky Mountain UFCW Unions and Employers Pension Plan January 2022 1 January 2022 Oregon Retail Employees Pension Plan (2) August 2021 to March 2023 3 August 2021 to July 2022 Bakery and Confectionary Union & Industry International
Pension Fund December 2020 (2) to July 2022 3 May 2021 to October 2021 Retail Food Employers & UFCW Local 711 Pension March 2022 to January 2024 1 March 2022 United Food & Commercial Workers Intl Union — Industry
Pension Fund February 2020 (2) to February 2024 2 July 2023 to August 2023 Western Conference of Teamsters Pension Plan April 2021 to September 2025 4 July 2021 to September 2025 International Brotherhood of Teamsters Consolidated Pension
Fund September 2022 to September 2024 3 September 2022 to September 2024
(1) This column represents the number of significant collective bargaining agreements and their expiration date for each of the Company’s pension
funds listed above. For the purposes of this table, the “significant collective bargaining agreements” are the largest based on covered employees that, when aggregated, cover the majority of the employees for which we make multi-employer contributions for the referenced pension fund.
(2) Certain collective bargaining agreements for each of these pension funds are operating under an extension.
The Company held escrow deposits as of January 30, 2021, amounting to $271 due to certain restructuring
agreements. These payments are included in “Prepaid and other current assets” in the Company’s Consolidated Balance Sheets.
Based on the most recent information available to it, the Company believes the present value of actuarial accrued
liabilities in most of these multi-employer plans substantially exceeds the value of the assets held in trust to pay benefits. Moreover, if the Company were to exit certain markets or otherwise cease making contributions to these funds, the Company could trigger a substantial withdrawal liability. Any adjustment for withdrawal liability will be recorded when it is probable that a liability exists and it can be reasonably estimated.
The Company also contributes to various other multi-employer benefit plans that provide health and welfare
benefits to active and retired participants. Total contributions made by the Company to these other multi-employer health and welfare plans were approximately $1,262 in 2020, $1,252 in 2019 and $1,282 in 2018.
17. DISPOSAL OF BUSINESS
On March 13, 2019, the Company completed the sale of its You Technology business to Inmar for total consideration of $565, including $396 of cash and $64 of preferred equity received upon closing. The Company is also entitled to receive other cash payments of $105 over five years. The transaction includes a long-term service agreement for Inmar to provide the Company digital coupon services. The sale resulted in a gain of $70, $52 net of tax, which is included in “Gain on sale of businesses” in the Consolidated Statement of Operations. The Company recorded the fair value of the long-term service agreement of $358 in “Other current liabilities” and “Other long-term liabilities” in the Consolidated Balance Sheets and such amount is being recorded as sales over the 10-year agreement.
On April 26, 2019, the Company completed the sale of its Turkey Hill Dairy business to an affiliate of Peak Rock
Capital for total proceeds of $225. The sale resulted in a gain of $106, $80 net of tax, which is included in “Gain on sale of businesses” in the Consolidated Statements of Operations.
90
In the third quarter of 2019, as a result of a portfolio review, the Company decided to divest its interest in Lucky’s Market. The Company recognized an impairment charge of $238 in the third quarter of 2019, which is included in OG&A in the Consolidated Statements of Operations. The impairment charge consists of property, plant and equipment of $200, which includes $40 of finance lease assets; goodwill of $19; operating lease assets of $11; and other charges of $8. The amount of the impairment charge attributable to The Kroger Co. is $131, $100 net of tax, with the remaining amount attributable to the minority interest. Subsequently, the decision was made by Lucky’s Market to file for bankruptcy in January 2020, which led the Company to fully write off the value of its investment and deconsolidate Lucky’s Market from the consolidated financial statements. This resulted in an additional non-cash charge of $174, $125 net of tax, in the fourth quarter of 2019, which is included in OG&A in the Consolidated Statements of Operations. The amount of the total 2019 charge attributable to The Kroger Co. is $305, $225 net of tax. The Company maintains liabilities associated with certain property related guarantees that will result in the Company making payments to settle these over time. 18. RECENTLY ADOPTED ACCOUNTING STANDARDS
On February 4, 2018, the Company adopted ASU 2014-09, “Revenue from Contracts with Customers (Topic 606)” which superseded previous revenue recognition guidance. Topic 606 is a comprehensive new revenue recognition model that requires a company to recognize revenue when goods and services are transferred to the customer in an amount that is proportionate to what has been delivered at that point and that reflects the consideration to which the company expects to be entitled for those goods or services. The Company adopted the standard using a modified retrospective approach with the adoption primarily involving the evaluation of whether the Company acts as principal or agent in certain vendor arrangements where the purchase and sale of inventory are virtually simultaneous. The Company will continue to record revenue and related costs on a gross basis for the arrangements. The adoption of the standard did not have a material effect on the Company’s Consolidated Statements of Operations, Consolidated Balance Sheets or Consolidated Statements of Cash Flows.
On February 3, 2019, the Company adopted ASU 2016-02, “Leases,” which provides guidance for the recognition
of lease agreements. The Company adopted the standard using the modified retrospective approach, which provides a method for recording existing leases at adoption that approximates the results of a full retrospective approach. In addition, the Company elected the transition package of practical expedients permitted within the standard, which allowed it to carry forward the historical lease classification, and applied the transition option which does not require application of the guidance to comparative periods in the year of adoption.
The adoption of the standard resulted in the recognition of operating lease assets and operating lease liabilities of approximately $6,800 and $7,000, respectively, as of February 3, 2019. Included in the measurement of the new lease assets is the reclassification of certain balances including those historically recorded as prepaid or deferred rent and favorable and unfavorable leasehold interests. Several other asset and liability line items in the Consolidated Balance Sheets were also impacted by immaterial amounts. The adoption of this standard also resulted in a change in naming convention for leases classified historically as capital leases. These leases are now referred to as finance leases. The adoption of this standard did not materially affect the Company’s consolidated net earnings or cash flows.
In February 2018, the Financial Accounting Standards Board (“FASB”) issued ASU 2018-02, "Income Statement—Reporting Comprehensive Income (Topic 220): Reclassification of Certain Tax Effects from Accumulated Other Comprehensive Income." This amendment allows companies to reclassify stranded tax effects resulting from the Tax Act from accumulated other comprehensive income (AOCI) to retained earnings. The Company adopted ASU 2018-02 on February 3, 2019, which resulted in a decrease to AOCI and an increase to accumulated earnings of $146, primarily related to deferred taxes previously recorded for pension and other postretirement benefits and cash flow hedges. The adoption of this standard did not have an effect on the Company’s consolidated results of operations or cash flows.
91
In August 2018, the FASB issued ASU 2018-15, “Intangibles – Goodwill and Other – Internal-Use Software: Customer’s Accounting for Implementation Costs Incurred in a Cloud Computing Arrangement That Is a Service Contract.” Under the new standard, implementation costs related to a cloud computing arrangement will be deferred or expensed as incurred, in accordance with the existing internal-use software guidance for similar costs. The new standard also prescribes the balance sheet, income statement, and cash flow classification of the capitalized implementation costs and related amortization expense. The Company adopted this guidance on a prospective basis in the first quarter of 2020. Capitalized implementation costs of $81, net of accumulated amortization of $2, are included in “Other assets” in the Company’s Consolidated Balance Sheets as of January 30, 2021. The corresponding cash flows related to these arrangements are included in “Net cash provided by operating activities” in the Company’s Consolidated Statements of Cash Flows. 19. RECENTLY ISSUED ACCOUNTING STANDARDS
In March 2020, the FASB issued ASU 2020-04, “Reference Rate Reform (Topic 848): Facilitation of the Effects of Reference Rate Reform on Financial Reporting.” This standard provides optional expedients and exceptions for applying GAAP to certain contract modifications and hedging relationships that reference LIBOR or other reference rates expected to be discontinued. This guidance is effective upon issuance and can be applied through December 31, 2022. The Company may elect to apply the amendments for contract modifications by Topic or Industry Subtopic as of any date from the beginning of an interim period that includes or is subsequent to March 12, 2020. The Company is currently evaluating the effect of this standard on its Consolidated Financial Statements.
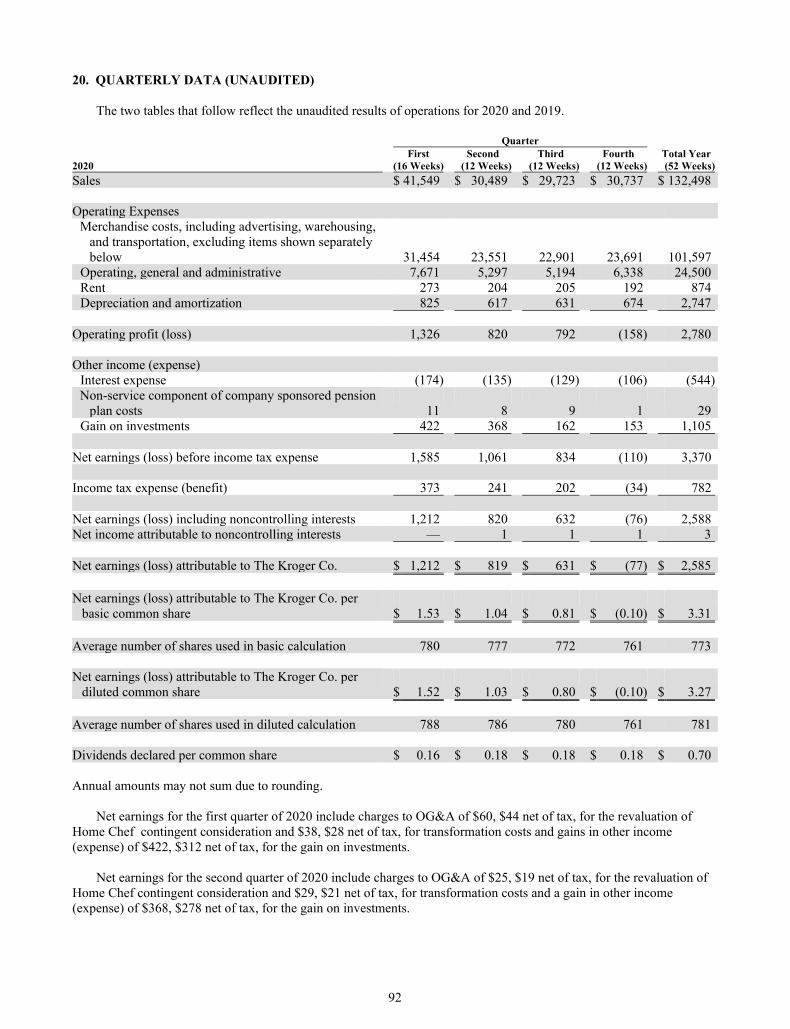
92
20. QUARTERLY DATA (UNAUDITED)
The two tables that follow reflect the unaudited results of operations for 2020 and 2019.
Quarter First Second Third Fourth Total Year 2020 (16 Weeks) (12 Weeks) (12 Weeks) (12 Weeks) (52 Weeks)
Sales $ 41,549 $ 30,489 $ 29,723 $ 30,737 $ 132,498 Operating Expenses
Merchandise costs, including advertising, warehousing, and transportation, excluding items shown separately below 31,454 23,551 22,901 23,691 101,597
Operating, general and administrative 7,671 5,297 5,194 6,338 24,500 Rent 273 204 205 192 874 Depreciation and amortization 825 617 631 674 2,747
Operating profit (loss) 1,326 820 792 (158) 2,780 Other income (expense)
Interest expense (174) (135) (129) (106) (544) Non-service component of company sponsored pension
plan costs 11 8 9 1 29 Gain on investments 422 368 162 153 1,105
Net earnings (loss) before income tax expense 1,585 1,061 834 (110) 3,370 Income tax expense (benefit) 373 241 202 (34) 782 Net earnings (loss) including noncontrolling interests 1,212 820 632 (76) 2,588 Net income attributable to noncontrolling interests — 1 1 1 3 Net earnings (loss) attributable to The Kroger Co. $ 1,212 $ 819 $ 631 $ (77) $ 2,585 Net earnings (loss) attributable to The Kroger Co. per
basic common share $ 1.53 $ 1.04 $ 0.81 $ (0.10) $ 3.31 Average number of shares used in basic calculation 780 777 772 761 773 Net earnings (loss) attributable to The Kroger Co. per
diluted common share $ 1.52 $ 1.03 $ 0.80 $ (0.10) $ 3.27 Average number of shares used in diluted calculation 788 786 780 761 781 Dividends declared per common share $ 0.16 $ 0.18 $ 0.18 $ 0.18 $ 0.70 Annual amounts may not sum due to rounding.
Net earnings for the first quarter of 2020 include charges to OG&A of $60, $44 net of tax, for the revaluation of Home Chef contingent consideration and $38, $28 net of tax, for transformation costs and gains in other income (expense) of $422, $312 net of tax, for the gain on investments.
Net earnings for the second quarter of 2020 include charges to OG&A of $25, $19 net of tax, for the revaluation of Home Chef contingent consideration and $29, $21 net of tax, for transformation costs and a gain in other income (expense) of $368, $278 net of tax, for the gain on investments.
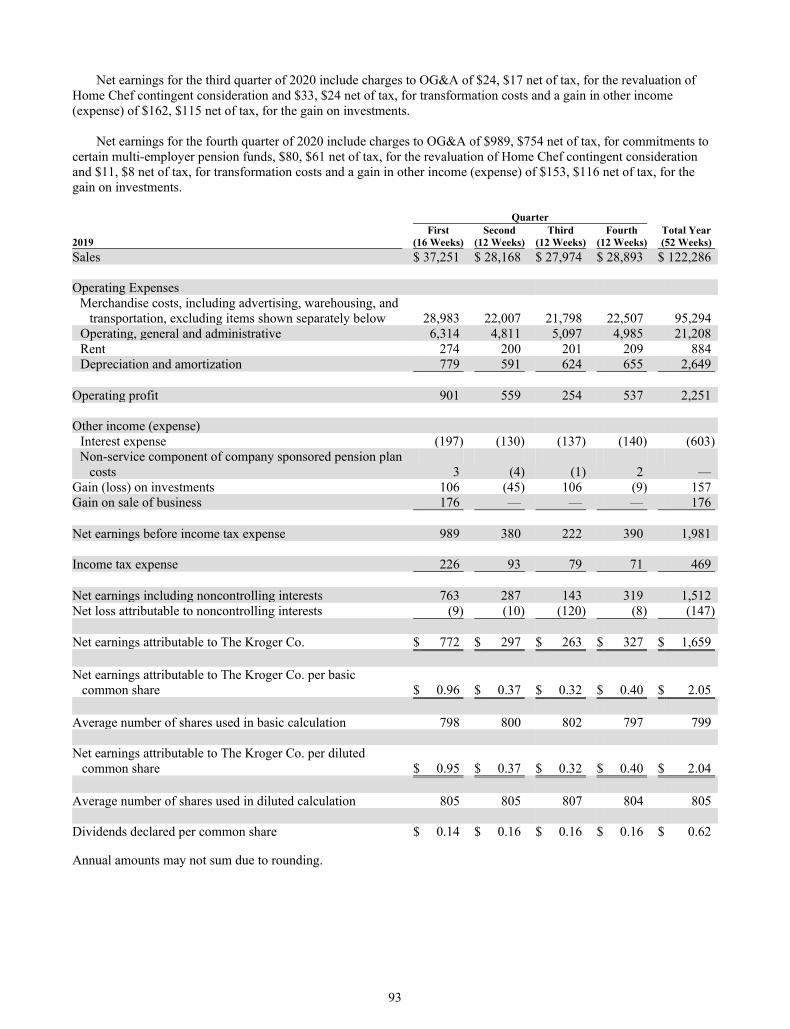
93
Net earnings for the third quarter of 2020 include charges to OG&A of $24, $17 net of tax, for the revaluation of Home Chef contingent consideration and $33, $24 net of tax, for transformation costs and a gain in other income (expense) of $162, $115 net of tax, for the gain on investments.
Net earnings for the fourth quarter of 2020 include charges to OG&A of $989, $754 net of tax, for commitments to
certain multi-employer pension funds, $80, $61 net of tax, for the revaluation of Home Chef contingent consideration and $11, $8 net of tax, for transformation costs and a gain in other income (expense) of $153, $116 net of tax, for the gain on investments.
Quarter First Second Third Fourth Total Year 2019 (16 Weeks) (12 Weeks) (12 Weeks) (12 Weeks) (52 Weeks)
Sales $ 37,251 $ 28,168 $ 27,974 $ 28,893 $ 122,286 Operating Expenses
Merchandise costs, including advertising, warehousing, and transportation, excluding items shown separately below 28,983 22,007 21,798 22,507 95,294
Operating, general and administrative 6,314 4,811 5,097 4,985 21,208 Rent 274 200 201 209 884 Depreciation and amortization 779 591 624 655 2,649
Operating profit 901 559 254 537 2,251 Other income (expense)
Interest expense (197) (130) (137) (140) (603) Non-service component of company sponsored pension plan
costs 3 (4) (1) 2 — Gain (loss) on investments 106 (45) 106 (9) 157 Gain on sale of business 176 — — — 176 Net earnings before income tax expense 989 380 222 390 1,981 Income tax expense 226 93 79 71 469 Net earnings including noncontrolling interests 763 287 143 319 1,512 Net loss attributable to noncontrolling interests (9) (10) (120) (8) (147) Net earnings attributable to The Kroger Co. $ 772 $ 297 $ 263 $ 327 $ 1,659 Net earnings attributable to The Kroger Co. per basic
common share $ 0.96 $ 0.37 $ 0.32 $ 0.40 $ 2.05 Average number of shares used in basic calculation 798 800 802 797 799 Net earnings attributable to The Kroger Co. per diluted
common share $ 0.95 $ 0.37 $ 0.32 $ 0.40 $ 2.04 Average number of shares used in diluted calculation 805 805 807 804 805 Dividends declared per common share $ 0.14 $ 0.16 $ 0.16 $ 0.16 $ 0.62 Annual amounts may not sum due to rounding.
94
Net earnings for the first quarter of 2019 include charges to OG&A expenses of $59, $44 net of tax, for obligations related to withdrawal liabilities for certain local unions of the Central States multi-employer pension fund and a reduction to OG&A of $24, $18 net of tax, for the revaluation of Home Chef contingent consideration and gains in other income of $106, $80 net of tax, related to the sale of Turkey Hill Dairy, $70, $52 net of tax, related to the sale of You Technology and $106, $80 net of tax, for the mark to market gain on Ocado.
Net earnings for the second quarter of 2019 include charges to OG&A of $27, $22 net of tax, for obligations related to withdrawal liabilities for a certain multi-employer pension fund and $2, $2 net of tax, for the revaluation of Home Chef contingent consideration, and a charge in other income (expense) of $45, $36 net of tax, for the mark to market loss on Ocado securities.
Net earnings for the third quarter of 2019 include a charge to OG&A of $45, $35 net of tax, for obligations related
to withdrawal liabilities for a certain multi-employer pension fund, $80, $61 net of tax, for a severance charge and related benefits, $238 including $131 attributable to the Kroger Co., $100 net of tax, for impairment of Lucky’s Market and $4, $3 net of tax, for the revaluation of Home Chef contingent consideration and gain in other income of $106, $81 net of tax, for the mark to market gain on Ocado securities.
Net earnings for the fourth quarter of 2019 include charges to OG&A of $4, $3 net of tax, for obligations related to
withdrawal liabilities for certain multi-employer pension funds, $174, $125 net of tax, for deconsolidation and impairment of Lucky’s Market, $52, $37 net of tax, for transformation costs, primarily including 35 planned store closures and a reduction to OG&A of $51, $36 net of tax, for the revaluation of Home Chef contingent consideration and a loss in other income (expense) of $9, $6 net of tax, for the mark to market loss on Ocado securities.
95
ITEM 9. CHANGES IN AND DISAGREEMENTS WITH ACCOUNTANTS ON ACCOUNTING AND FINANCIAL DISCLOSURE.
None.
ITEM 9A. EVALUATION OF DISCLOSURE CONTROLS AND PROCEDURES.
As of January 30, 2021, our Chief Executive Officer and Chief Financial Officer, together with a disclosure review committee appointed by the Chief Executive Officer, evaluated the Company’s disclosure controls and procedures. Based on that evaluation, our Chief Executive Officer and Chief Financial Officer concluded that the Company’s disclosure controls and procedures were effective as of January 30, 2021. CHANGES IN INTERNAL CONTROL OVER FINANCIAL REPORTING
There was no change in our internal control over financial reporting during the fiscal quarter ended January 30, 2021 that has materially affected, or is reasonably likely to materially affect, our internal control over financial reporting. MANAGEMENT’S REPORT ON INTERNAL CONTROL OVER FINANCIAL REPORTING
Management is responsible for establishing and maintaining adequate internal control over financial reporting for the Company. With the participation of the Chief Executive Officer and the Chief Financial Officer, our management conducted an evaluation of the effectiveness of our internal control over financial reporting based on the framework and criteria established in Internal Control — Integrated Framework (2013), issued by the Committee of Sponsoring Organizations of the Treadway Commission. Based on the evaluation, management has concluded that the Company’s internal control over financial reporting was effective as of January 30, 2021.
The effectiveness of the Company’s internal control over financial reporting as of January 30, 2021, has been audited by PricewaterhouseCoopers LLP, an independent registered public accounting firm, as stated in their report, which can be found in Item 8 of this Form 10-K. ITEM 9B. OTHER INFORMATION.
None.
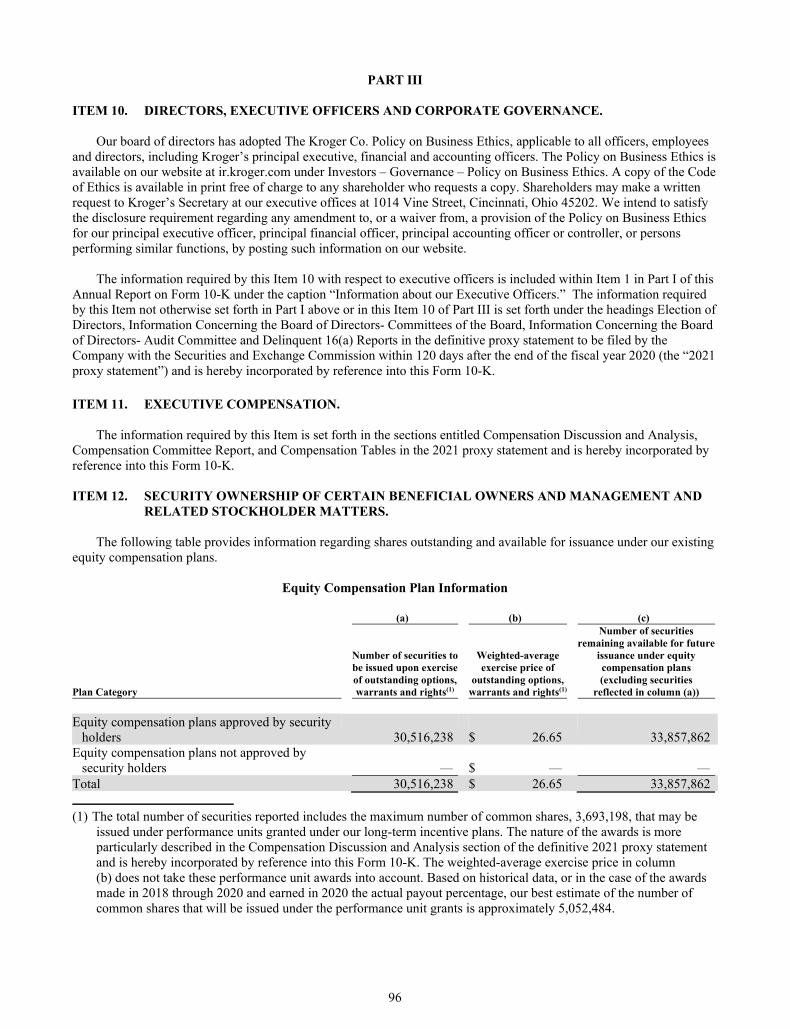
96
PART III ITEM 10. DIRECTORS, EXECUTIVE OFFICERS AND CORPORATE GOVERNANCE.
Our board of directors has adopted The Kroger Co. Policy on Business Ethics, applicable to all officers, employees and directors, including Kroger’s principal executive, financial and accounting officers. The Policy on Business Ethics is available on our website at ir.kroger.com under Investors – Governance – Policy on Business Ethics. A copy of the Code of Ethics is available in print free of charge to any shareholder who requests a copy. Shareholders may make a written request to Kroger’s Secretary at our executive offices at 1014 Vine Street, Cincinnati, Ohio 45202. We intend to satisfy the disclosure requirement regarding any amendment to, or a waiver from, a provision of the Policy on Business Ethics for our principal executive officer, principal financial officer, principal accounting officer or controller, or persons performing similar functions, by posting such information on our website.
The information required by this Item 10 with respect to executive officers is included within Item 1 in Part I of this
Annual Report on Form 10-K under the caption “Information about our Executive Officers.” The information required by this Item not otherwise set forth in Part I above or in this Item 10 of Part III is set forth under the headings Election of Directors, Information Concerning the Board of Directors- Committees of the Board, Information Concerning the Board of Directors- Audit Committee and Delinquent 16(a) Reports in the definitive proxy statement to be filed by the Company with the Securities and Exchange Commission within 120 days after the end of the fiscal year 2020 (the “2021 proxy statement”) and is hereby incorporated by reference into this Form 10-K.
ITEM 11. EXECUTIVE COMPENSATION.
The information required by this Item is set forth in the sections entitled Compensation Discussion and Analysis, Compensation Committee Report, and Compensation Tables in the 2021 proxy statement and is hereby incorporated by reference into this Form 10-K. ITEM 12. SECURITY OWNERSHIP OF CERTAIN BENEFICIAL OWNERS AND MANAGEMENT AND
RELATED STOCKHOLDER MATTERS.
The following table provides information regarding shares outstanding and available for issuance under our existing equity compensation plans.
Equity Compensation Plan Information
(a) (b) (c) Number of securities remaining available for future Number of securities to Weighted-average issuance under equity be issued upon exercise exercise price of compensation plans of outstanding options, outstanding options, (excluding securities Plan Category warrants and rights(1) warrants and rights(1) reflected in column (a))
Equity compensation plans approved by security
holders 30,516,238 $ 26.65 33,857,862 Equity compensation plans not approved by
security holders — $ — — Total 30,516,238 $ 26.65 33,857,862
(1) The total number of securities reported includes the maximum number of common shares, 3,693,198, that may be
issued under performance units granted under our long-term incentive plans. The nature of the awards is more particularly described in the Compensation Discussion and Analysis section of the definitive 2021 proxy statement and is hereby incorporated by reference into this Form 10-K. The weighted-average exercise price in column (b) does not take these performance unit awards into account. Based on historical data, or in the case of the awards made in 2018 through 2020 and earned in 2020 the actual payout percentage, our best estimate of the number of common shares that will be issued under the performance unit grants is approximately 5,052,484.
97
The remainder of the information required by this Item is set forth in the section entitled Beneficial Ownership of Common Stock in the 2021 proxy statement and is hereby incorporated by reference into this Form 10-K. ITEM 13. CERTAIN RELATIONSHIPS AND RELATED TRANSACTIONS, AND DIRECTOR
INDEPENDENCE.
This information required by this Item is set forth in the sections entitled Related Person Transactions and Information Concerning the Board of Directors-Independence in the 2021 proxy statement and is hereby incorporated by reference into this Form 10-K.
ITEM 14. PRINCIPAL ACCOUNTING FEES AND SERVICES.
The information required by this Item is set forth in the section entitled Ratification of the Appointment of Kroger’s Independent Auditor in the 2021 proxy statement and is hereby incorporated by reference into this Form 10-K.
98
PART IV ITEM 15. EXHIBITS, FINANCIAL STATEMENT SCHEDULES. (a)1. Financial Statements: Report of Independent Registered Public Accounting Firm Consolidated Balance Sheets as of January 30, 2021 and February 1, 2020 Consolidated Statements of Operations for the years ended January 30, 2021, February 1, 2020 and
February 2, 2019 Consolidated Statements of Comprehensive Income for the years ended January 30, 2021, February 1, 2020
and February 2, 2019 Consolidated Statements of Cash Flows for the years ended January 30, 2021, February 1, 2020 and February 2, 2019
Consolidated Statement of Changes in Shareholders’ Equity for the years ended January 30, 2021, February 1, 2020 and February 2, 2019
Notes to Consolidated Financial Statements (a)2. Financial Statement Schedules: There are no Financial Statement Schedules included with this filing for the reason that they are not
applicable or are not required or the information is included in the financial statements or notes thereto. (a)3.(b) Exhibits 3.1 Amended Articles of Incorporation are hereby incorporated by reference to Exhibit 3.1 of the Company’s
Quarterly Report on Form 10-Q for the quarter ended May 22, 2010, as amended by the Amendment to Amended Articles of Incorporation, which is hereby incorporated by reference to Exhibit 3.1 of the Company’s Quarterly Report on Form 10-Q for the quarter ended May 23, 2015.
3.2 The Company’s Regulations are hereby incorporated by reference to Exhibit 3.1 of the Company’s Current
Report on Form 8-K filed with the SEC on June 27, 2019.
4.1 Instruments defining the rights of holders of long-term debt of the Company and its subsidiaries are not
filed as Exhibits because the amount of debt under each instrument is less than 10% of the consolidated assets of the Company. The Company undertakes to file these instruments with the SEC upon request.
4.2 Description of Securities. Incorporated by reference to Exhibit 4.2 of the Company’s Annual Report on
Form 10-K for the fiscal year ended February 1, 2020.. 10.1* The Kroger Co. Deferred Compensation Plan for Independent Directors. Incorporated by reference to
Exhibit 10.2 of the Company’s Annual Report on Form 10-K for the fiscal year ended January 30, 2016.
10.2* The Kroger Co. Executive Deferred Compensation Plan. Incorporated by reference to Exhibit 10.4 of the
Company’s Annual Report on Form 10-K for the fiscal year ended January 29, 2005.
10.3* The Kroger Co. 401(k) Retirement Savings Account Restoration Plan. Incorporated by reference to
Exhibit 10.4 of the Company’s Annual Report on Form 10-K for the fiscal year ended February 3, 2007.
10.4* The Kroger Co. Supplemental Retirement Plans for Certain Retirement Benefit Plan Participants.
Incorporated by reference to Exhibit 10.6 of the Company’s Annual Report on Form 10-K for the fiscal year ended February 3, 2007.
10.5* The Kroger Co. Employee Protection Plan dated January 13, 2017. Incorporated by reference to
Exhibit 10.5 of the Company’s Annual Report on Form 10-K for the fiscal year ended January 28, 2017.
10.6 Amended and Restated Credit Agreement dated August 29, 2017, among The Kroger Co., the initial lenders
named therein, and Bank of America, N.A. and Wells Fargo Bank National Association, as co-administrative agents, Citibank, N.A., as syndication agent, and Mizuho Bank, Ltd. and U.S. Bank National Association, as co-documentation agents, incorporated by reference to Exhibit 10.1 of the Company’s Current Report on Form 8-K filed with the SEC on August 29, 2017.
99
10.7* The Kroger Co. 2008 Long-Term Incentive and Cash Bonus Plan. Incorporated by reference to Exhibit 4.2 of the Company’s Form S-8 filed with the SEC on June 26, 2008.
10.8* The Kroger Co. 2011 Long-Term Incentive and Cash Bonus Plan. Incorporated by reference to Exhibit 4.2
of the Company’s Form S-8 filed with the SEC on June 23, 2011.
10.9* The Kroger Co. 2014 Long-Term Incentive and Cash Bonus Plan. Incorporated by reference to Exhibit 4.2
of the Company’s Form S-8 filed with the SEC on July 29, 2014.
10.10* The Kroger Co. 2019 Long-Term Incentive Plan. Incorporated by reference to Exhibit 99.1 of the
Company’s Form S-8 filed with the SEC on June 28, 2019. 10.11* Form of Restricted Stock Grant Agreement under Long-Term Incentive Cash Bonus Plans. Incorporated by
reference to Exhibit 10.11 of the Company’s Annual Report on Form 10-K for the fiscal year ended February 1, 2020.
10.12* Form of Restricted Stock Grant Agreement under Long-Term Incentive and Cash Bonus Plans. Incorporated
by reference to Exhibit 10.9 of the Company’s Annual Report on Form 10-K for the fiscal year ended February 3, 2007.
10.13* Form of Non-Qualified Stock Option Grant Agreement under Long-Term Incentive and Cash Bonus Plan.
Incorporated by reference to Exhibit 10.13 of the Company’s Annual Report on Form 10-K for the fiscal year ended February 1, 2020.
10.14* Form of Non-Qualified Stock Option Grant Agreement under Long-Term Incentive and Cash Bonus Plans.
Incorporated by reference to Exhibit 10.1 of the Company’s Quarterly Report on Form 10-Q for the quarter ended May 24, 2008.
10.15* Form of Performance Unit Award Agreement under Long-Term Incentive and Cash Bonus Plans.
Incorporated by reference to Exhibit 10.15 of the Company’s Annual Report on Form 10-K for the fiscal year ended February 1, 2020.
10.16*† Form of Restricted Stock Grant Agreement under Long-Term Incentive and Cash Bonus Plans. 21.1 Subsidiaries of the Registrant.
23.1 Consent of Independent Registered Public Accounting Firm.
24.1 Powers of Attorney.
31.1 Rule 13a-14(a)/15d-14(a) Certification.
31.2 Rule 13a-14(a)/15d-14(a) Certification.
32.1 Section 1350 Certifications.
101.INS XBRL Instance Document - the instance document does not appear in the Interactive Data File because its
XBRL tags are embedded within the Inline XBRL document. 101.SCH XBRL Taxonomy Extension Schema Document. 101.CAL XBRL Taxonomy Extension Calculation Linkbase Document. 101.DEF XBRL Taxonomy Extension Definition Linkbase Document. 101.LAB XBRL Taxonomy Extension Label Linkbase Document. 101.PRE XBRL Taxonomy Extension Presentation Linkbase Document.

100
104 Cover Page Interactive Data File - The cover page interactive data file does not appear in the Interactive Data File because its XBRL tags are embedded within the Inline XBRL document.
* Management contract or compensatory plan or arrangement. † Filed herewith.
ITEM 16. FORM 10-K SUMMARY Not Applicable.
101
SIGNATURES
Pursuant to the requirements of Section 13 or 15(d) of the Securities Exchange Act of 1934, the Company has duly caused this report to be signed on its behalf by the undersigned, thereunto duly authorized.
THE KROGER CO. Dated: March 30, 2021 /s/ W. Rodney McMullen W. Rodney McMullen Chairman of the Board and Chief Executive Officer (principal executive officer)
Pursuant to the requirements of the Securities Exchange Act of 1934, this report has been signed below by the following persons on behalf of the Company and in the capacities indicated on the 30th March 2021.
/s/ Gary Millerchip Senior Vice President and Chief Financial Officer Gary Millerchip (principal financial officer) /s/ Todd A. Foley Vice President & Corporate Controller Todd A Foley (principal accounting officer)
* Director Nora A. Aufreiter * Director Kevin M. Brown * Director Anne Gates * Director Karen M. Hoguet * Director Susan J. Kropf * Chairman of the Board and Chief Executive Officer W. Rodney McMullen * Director Clyde R. Moore * Director Ronald L. Sargent * Director J. Amanda Sourry Knox * Director Mark S. Sutton
* Director Ashok Vemuri * By: /s/ Christine S. Wheatley Christine S. Wheatley Attorney-in-fact
____________________________________________________________________________________
SHAREHOLDERS: EQ Shareowner Services is Registrar and Transfer Agent for Kroger’s common shares. For questions concerning payment of dividends, changes of address, etc., individual shareholders should contact:
EQ Shareowner Services P. O. Box 64854
Saint Paul, MN 55164-0854 Toll Free 1-855-854-1369
Shareholder questions and requests for forms available on the Internet should be directed to: www.shareowneronline.com. FINANCIAL INFORMATION: Call (513) 762-1220 (option “1”) to request printed financial information, including Kroger’s most recent report on Form 10-Q or 10-K, or press release. Written inquiries should be addressed to Shareholder Relations, The Kroger Co., 1014 Vine Street, Cincinnati, Ohio 45202-1100. Information also is available on Kroger’s corporate website at ir.kroger.com. ____________________________________________________________________________________
Kroger has a variety of plans under which employees may acquire common shares of Kroger. Employees of Kroger and its subsidiaries own shares through a profit sharing plan, as well as 401(k) plans and a payroll deduction plan called the Kroger Stock Exchange. If employees have questions concerning their shares in the Kroger Stock Exchange, or if they wish to sell shares they have purchased through this plan, they should contact:
Computershare Plan Managers
PO Box 505039 Louisville, KY 40233-5039
Phone 800 872 3307
Questions regarding Kroger’s 401(k) plans should be directed to the employee’s Human Resources Department or 1-800-2KROGER. Questions concerning any of the other plans should be directed to the employee’s Human Resources Department. ____________________________________________________________________________________

E X E C U T I V E O F F I C E R S
Mary Ellen Adcock Senior Vice President Stuart Aitken Senior Vice President Gabriel Arreaga Senior Vice President Yael Cosset Senior Vice President and Chief Information Officer Carin L. Fike Vice President and Treasurer
Todd A. Foley Vice President and Controller Calvin J. Kaufman Senior Vice President Timothy A. Massa Senior Vice President Stephen M. McKinney Senior Vice President W. Rodney McMullen Chairman of the Board and Chief Executive Officer
Gary Millerchip Senior Vice President and Chief Financial Officer Mark C. Tuffin Senior Vice President Christine S. Wheatley Group Vice President, Secretary and General Counsel
O P E R A T I N G U N I T H E A D S
Chris Albi QFC Rodney C. Antolock Harris Teeter Timothy F. Brown Atlanta Division Steve Burnham King Soopers/City Market Ken DeLuca Michigan Division Steve Dreher Dillons Food Stores Monica Garnes Fry’s Food & Drug Dennis R. Gibson Fred Meyer Stores
Paula Ginnett Mid-Atlantic Division Scott Hays Cincinnati Division Sonya Hostetler Nashville Division Colleen Juergensen Central Division Bryan H. Kaltenbach Food 4 Less Joe Kelley Houston Division Kenneth C. Kimball Smith’s Colleen R. Lindholz Kroger Health
Michael Marx Roundy’s Thomas L. Schwilke Ralphs Ann M. Reed Louisville Division Adam Wampler Dallas Division Victor Smith Delta Division Nicholas Tranchina Murray’s Cheese Kate Ward Kroger Personal Finance Dana Zurcher Columbus Division
www.thekrogerco.com
The Kroger Co.
1014 Vine Street · Cincinnati, Ohio 45202 · 513-762-4000
Related Documents