214 Encompassing Our Diversity People’s Leasing & Finance PLC Annual Report 2012/13 Overview | Corporate Stewardship | Operational Review | Corporate Governance | Financial Information | Additional Information Notes to the Financial Statements Company Group For the year ended 31st March 2013 2012 2013 2012 Rs. Rs. Rs. Rs. 4. Net Interest Income Interest income Finance lease & hire-purchase 12,257,008,185 10,399,988,482 13,533,096,641 11,356,420,455 Loans and other advances 930,638,480 567,955,940 1,161,952,464 582,495,594 Interest on overdue rentals 1,359,058,934 949,243,518 1,515,681,394 1,041,208,388 Interest income from bank deposits & government securities 70,464,845 48,389,225 463,939,653 292,207,480 Profit from Islamic finance 9,380,891 36,314,688 810,605,763 610,062,020 Total interest income 14,626,551,335 12,001,891,853 17,485,275,915 13,882,393,937 Interest expenses Interest on overdraft 147,199,376 118,651,943 148,293,284 118,651,943 Interest on short term borrowings 4,215,245,093 2,821,295,593 4,215,277,898 2,882,723,672 Interest on assets backed securities 1,692,896,214 1,578,129,670 1,692,966,801 1,578,132,927 Interest on long term borrowings 1,789,226,991 1,350,144,872 2,136,702,684 1,357,824,378 Interest on debentures 260,968,313 257,616,670 260,968,313 257,616,670 Interest on deposits 213,945,529 - 1,476,158,527 795,347,088 Profit distribution on Mudarabah 887,012 7,941,502 240,475,903 252,918,548 Interest on redeemable preference shares 137,416,667 168,083,333 137,416,667 168,083,333 Total interest expenses 8,457,785,195 6,301,863,583 10,308,260,077 7,411,298,559 Net interest income 6,168,766,140 5,700,028,270 7,177,015,838 6,471,095,378 5. Net Earned Premiums Gross written premium - - 2,944,487,069 2,414,788,213 Less: Premium ceded to reinsurers - - 306,657,434 242,802,340 - - 2,637,829,635 2,171,985,873 Less: Change in reserve for unearned premiums - - 189,588,504 694,014,787 Net earned premiums - - 2,448,241,131 1,477,971,086 6. Net Fee and Commission Income Service charges 390,544,564 404,875,608 166,840,364 264,633,336 Other fees recovered 350,099,090 213,096,848 350,376,211 219,824,912 Total 740,643,654 617,972,456 517,216,575 484,458,248 7. Net Trading Income/(Expenses) Foreign exchange from others customers - - 459,375 - Equities 10,142,141 590,426 29,886,221 (17,965,032) Total 10,142,141 590,426 30,345,596 (17,965,032)

Welcome message from author
This document is posted to help you gain knowledge. Please leave a comment to let me know what you think about it! Share it to your friends and learn new things together.
Transcript

214 Encompassing Our DiversityPeople’s Leasing & Finance PLC
Annual Report 2012/13
Overview | Corporate Stewardship | Operational Review | Corporate Governance | Financial Information | Additional Information
Notes to the Financial Statements
Company GroupFor the year ended 31st March 2013 2012 2013 2012 Rs. Rs. Rs. Rs.
4. Net Interest Income
Interest incomeFinance lease & hire-purchase 12,257,008,185 10,399,988,482 13,533,096,641 11,356,420,455Loans and other advances 930,638,480 567,955,940 1,161,952,464 582,495,594Interest on overdue rentals 1,359,058,934 949,243,518 1,515,681,394 1,041,208,388Interest income from bank deposits & government securities 70,464,845 48,389,225 463,939,653 292,207,480Profit from Islamic finance 9,380,891 36,314,688 810,605,763 610,062,020Total interest income 14,626,551,335 12,001,891,853 17,485,275,915 13,882,393,937
Interest expensesInterest on overdraft 147,199,376 118,651,943 148,293,284 118,651,943Interest on short term borrowings 4,215,245,093 2,821,295,593 4,215,277,898 2,882,723,672Interest on assets backed securities 1,692,896,214 1,578,129,670 1,692,966,801 1,578,132,927Interest on long term borrowings 1,789,226,991 1,350,144,872 2,136,702,684 1,357,824,378Interest on debentures 260,968,313 257,616,670 260,968,313 257,616,670Interest on deposits 213,945,529 - 1,476,158,527 795,347,088Profit distribution on Mudarabah 887,012 7,941,502 240,475,903 252,918,548Interest on redeemable preference shares 137,416,667 168,083,333 137,416,667 168,083,333Total interest expenses 8,457,785,195 6,301,863,583 10,308,260,077 7,411,298,559Net interest income 6,168,766,140 5,700,028,270 7,177,015,838 6,471,095,378
5. Net Earned Premiums
Gross written premium - - 2,944,487,069 2,414,788,213Less: Premium ceded to reinsurers - - 306,657,434 242,802,340 - - 2,637,829,635 2,171,985,873Less: Change in reserve for unearned premiums - - 189,588,504 694,014,787Net earned premiums - - 2,448,241,131 1,477,971,086
6. Net Fee and Commission Income
Service charges 390,544,564 404,875,608 166,840,364 264,633,336Other fees recovered 350,099,090 213,096,848 350,376,211 219,824,912Total 740,643,654 617,972,456 517,216,575 484,458,248
7. Net Trading Income/(Expenses)
Foreign exchange from others customers - - 459,375 -Equities 10,142,141 590,426 29,886,221 (17,965,032)Total 10,142,141 590,426 30,345,596 (17,965,032)
215Encompassing Our DiversityPeople’s Leasing & Finance PLCAnnual Report 2012/13
Overview | Corporate Stewardship | Operational Review | Corporate Governance | Financial Information | Additional Information Overview | Corporate Stewardship | Operational Review | Corporate Governance | Financial Information | Additional Information
Company GroupFor the year ended 31st March 2013 2012 2013 2012 Rs. Rs. Rs. Rs.
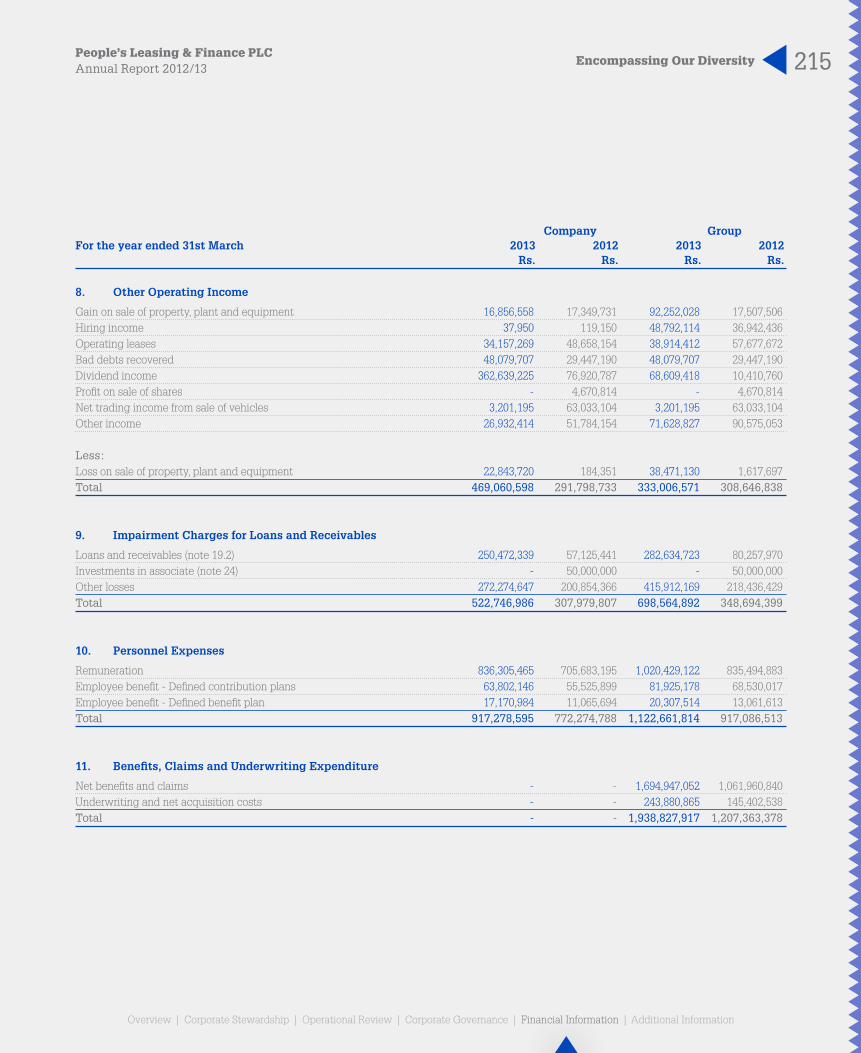
8. Other Operating Income
Gain on sale of property, plant and equipment 16,856,558 17,349,731 92,252,028 17,507,506Hiring income 37,950 119,150 48,792,114 36,942,436Operating leases 34,157,269 48,658,154 38,914,412 57,677,672Bad debts recovered 48,079,707 29,447,190 48,079,707 29,447,190Dividend income 362,639,225 76,920,787 68,609,418 10,410,760Profit on sale of shares - 4,670,814 - 4,670,814Net trading income from sale of vehicles 3,201,195 63,033,104 3,201,195 63,033,104Other income 26,932,414 51,784,154 71,628,827 90,575,053
Less:Loss on sale of property, plant and equipment 22,843,720 184,351 38,471,130 1,617,697Total 469,060,598 291,798,733 333,006,571 308,646,838
9. Impairment Charges for Loans and Receivables
Loans and receivables (note 19.2) 250,472,339 57,125,441 282,634,723 80,257,970Investments in associate (note 24) - 50,000,000 - 50,000,000Other losses 272,274,647 200,854,366 415,912,169 218,436,429Total 522,746,986 307,979,807 698,564,892 348,694,399
10. Personnel Expenses
Remuneration 836,305,465 705,683,195 1,020,429,122 835,494,883Employee benefit - Defined contribution plans 63,802,146 55,525,899 81,925,178 68,530,017Employee benefit - Defined benefit plan 17,170,984 11,065,694 20,307,514 13,061,613Total 917,278,595 772,274,788 1,122,661,814 917,086,513
11. Benefits, Claims and Underwriting Expenditure
Net benefits and claims - - 1,694,947,052 1,061,960,840Underwriting and net acquisition costs - - 243,880,865 145,402,538Total - - 1,938,827,917 1,207,363,378
216 Encompassing Our DiversityPeople’s Leasing & Finance PLC
Annual Report 2012/13
Overview | Corporate Stewardship | Operational Review | Corporate Governance | Financial Information | Additional Information
Company GroupFor the year ended 31st March 2013 2012 2013 2012 Rs. Rs. Rs. Rs.
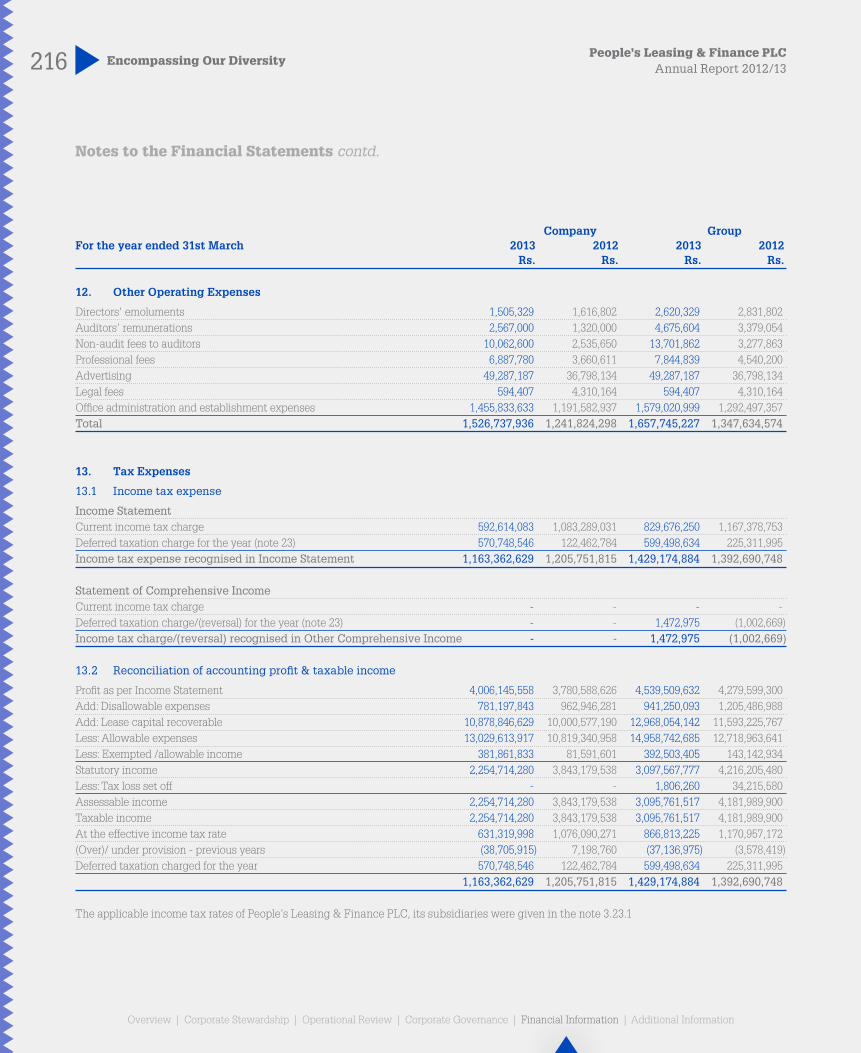
12. Other Operating Expenses
Directors' emoluments 1,505,329 1,616,802 2,620,329 2,831,802Auditors' remunerations 2,567,000 1,320,000 4,675,604 3,379,054Non-audit fees to auditors 10,062,600 2,535,650 13,701,862 3,277,863Professional fees 6,887,780 3,660,611 7,844,839 4,540,200Advertising 49,287,187 36,798,134 49,287,187 36,798,134Legal fees 594,407 4,310,164 594,407 4,310,164Office administration and establishment expenses 1,455,833,633 1,191,582,937 1,579,020,999 1,292,497,357Total 1,526,737,936 1,241,824,298 1,657,745,227 1,347,634,574
13. Tax Expenses
13.1 Income tax expense
Income StatementCurrent income tax charge 592,614,083 1,083,289,031 829,676,250 1,167,378,753Deferred taxation charge for the year (note 23) 570,748,546 122,462,784 599,498,634 225,311,995Income tax expense recognised in Income Statement 1,163,362,629 1,205,751,815 1,429,174,884 1,392,690,748
Statement of Comprehensive IncomeCurrent income tax charge - - - -Deferred taxation charge/(reversal) for the year (note 23) - - 1,472,975 (1,002,669)Income tax charge/(reversal) recognised in Other Comprehensive Income - - 1,472,975 (1,002,669)
13.2 Reconciliation of accounting profit & taxable income
Profit as per Income Statement 4,006,145,558 3,780,588,626 4,539,509,632 4,279,599,300Add: Disallowable expenses 781,197,843 962,946,281 941,250,093 1,205,486,988Add: Lease capital recoverable 10,878,846,629 10,000,577,190 12,968,054,142 11,593,225,767Less: Allowable expenses 13,029,613,917 10,819,340,958 14,958,742,685 12,718,963,641Less: Exempted /allowable income 381,861,833 81,591,601 392,503,405 143,142,934Statutory income 2,254,714,280 3,843,179,538 3,097,567,777 4,216,205,480Less: Tax loss set off - - 1,806,260 34,215,580Assessable income 2,254,714,280 3,843,179,538 3,095,761,517 4,181,989,900Taxable income 2,254,714,280 3,843,179,538 3,095,761,517 4,181,989,900At the effective income tax rate 631,319,998 1,076,090,271 866,813,225 1,170,957,172(Over)/ under provision - previous years (38,705,915) 7,198,760 (37,136,975) (3,578,419)Deferred taxation charged for the year 570,748,546 122,462,784 599,498,634 225,311,995 1,163,362,629 1,205,751,815 1,429,174,884 1,392,690,748
The applicable income tax rates of People’s Leasing & Finance PLC, its subsidiaries were given in the note 3.23.1
Notes to the Financial Statements contd.
217Encompassing Our DiversityPeople’s Leasing & Finance PLCAnnual Report 2012/13
Overview | Corporate Stewardship | Operational Review | Corporate Governance | Financial Information | Additional Information Overview | Corporate Stewardship | Operational Review | Corporate Governance | Financial Information | Additional Information
Company GroupFor the year ended 31st March 2013 2012 2013 2012 Rs. Rs. Rs. Rs.
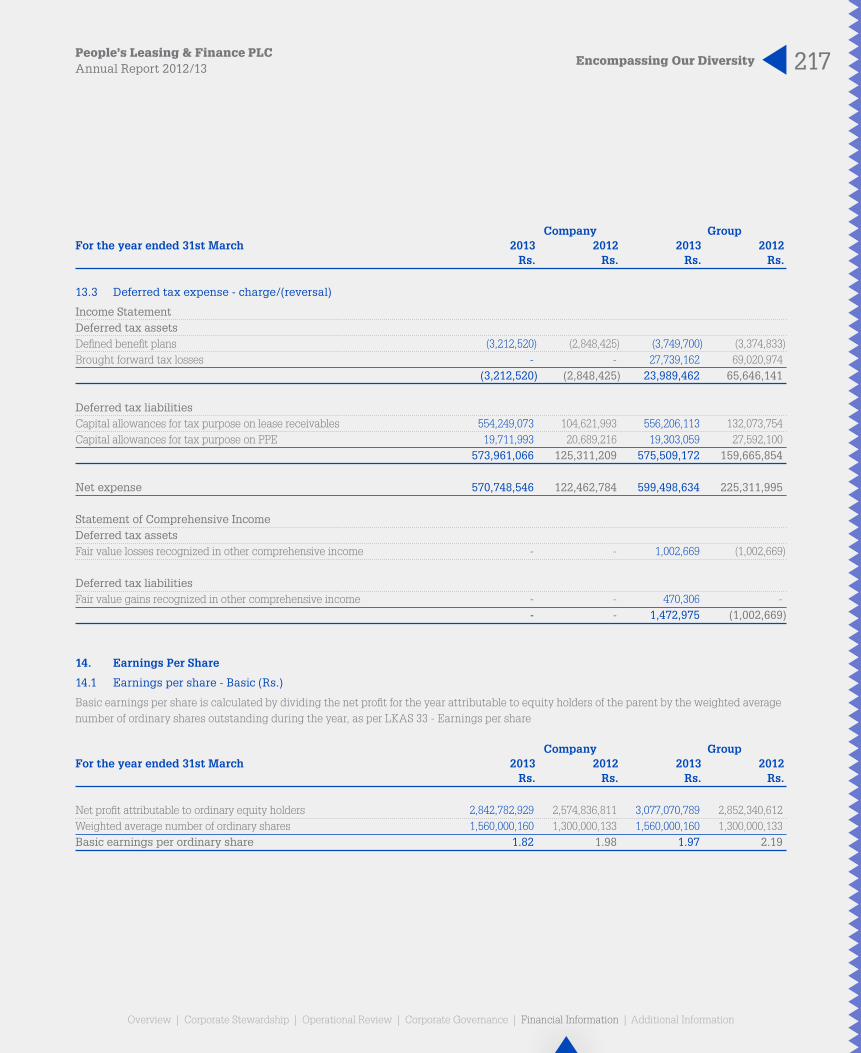
13.3 Deferred tax expense - charge/(reversal)
Income StatementDeferred tax assetsDefined benefit plans (3,212,520) (2,848,425) (3,749,700) (3,374,833)Brought forward tax losses - - 27,739,162 69,020,974 (3,212,520) (2,848,425) 23,989,462 65,646,141
Deferred tax liabilitiesCapital allowances for tax purpose on lease receivables 554,249,073 104,621,993 556,206,113 132,073,754Capital allowances for tax purpose on PPE 19,711,993 20,689,216 19,303,059 27,592,100 573,961,066 125,311,209 575,509,172 159,665,854
Net expense 570,748,546 122,462,784 599,498,634 225,311,995
Statement of Comprehensive IncomeDeferred tax assetsFair value losses recognized in other comprehensive income - - 1,002,669 (1,002,669)
Deferred tax liabilitiesFair value gains recognized in other comprehensive income - - 470,306 - - - 1,472,975 (1,002,669)
14. Earnings Per Share
14.1 Earnings per share - Basic (Rs.)
Basic earnings per share is calculated by dividing the net profit for the year attributable to equity holders of the parent by the weighted average number of ordinary shares outstanding during the year, as per LKAS 33 - Earnings per share
Company GroupFor the year ended 31st March 2013 2012 2013 2012 Rs. Rs. Rs. Rs.
Net profit attributable to ordinary equity holders 2,842,782,929 2,574,836,811 3,077,070,789 2,852,340,612Weighted average number of ordinary shares 1,560,000,160 1,300,000,133 1,560,000,160 1,300,000,133Basic earnings per ordinary share 1.82 1.98 1.97 2.19
218 Encompassing Our DiversityPeople’s Leasing & Finance PLC
Annual Report 2012/13
Overview | Corporate Stewardship | Operational Review | Corporate Governance | Financial Information | Additional Information
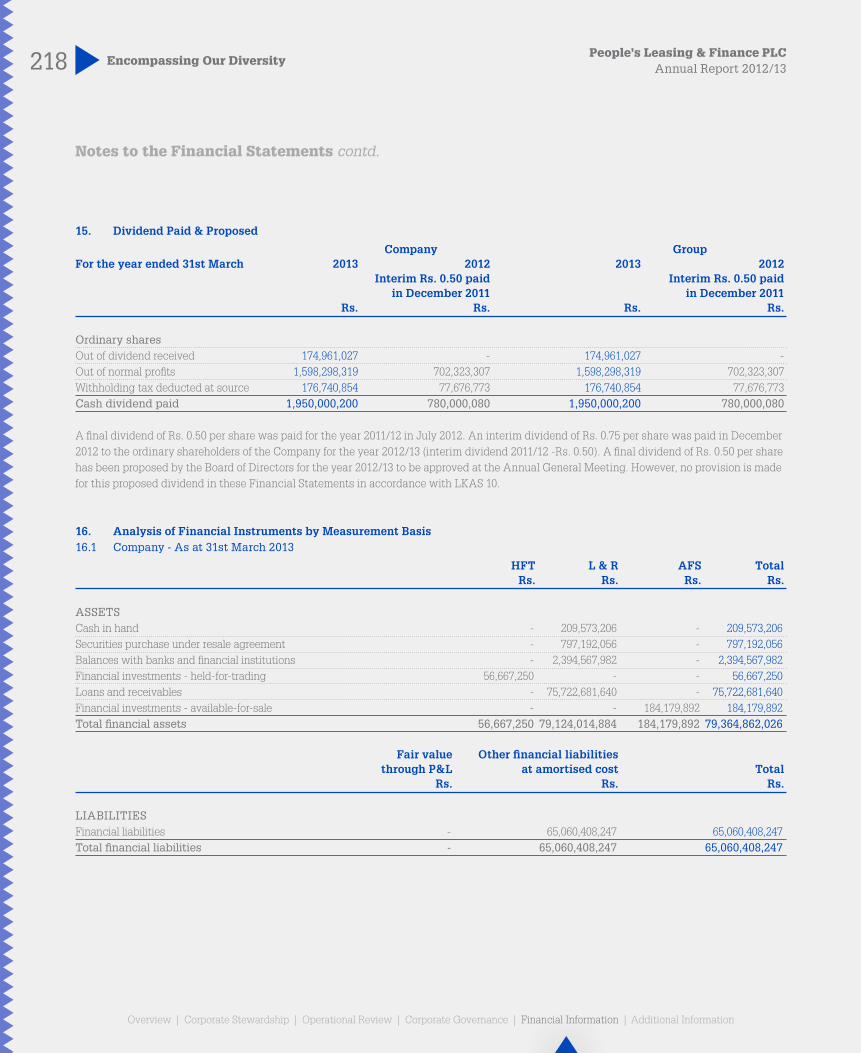
15. Dividend Paid & Proposed
Company GroupFor the year ended 31st March 2013 2012 2013 2012 Interim Rs. 0.50 paid Interim Rs. 0.50 paid in December 2011 in December 2011 Rs. Rs. Rs. Rs.
Ordinary sharesOut of dividend received 174,961,027 - 174,961,027 -Out of normal profits 1,598,298,319 702,323,307 1,598,298,319 702,323,307Withholding tax deducted at source 176,740,854 77,676,773 176,740,854 77,676,773Cash dividend paid 1,950,000,200 780,000,080 1,950,000,200 780,000,080
A final dividend of Rs. 0.50 per share was paid for the year 2011/12 in July 2012. An interim dividend of Rs. 0.75 per share was paid in December 2012 to the ordinary shareholders of the Company for the year 2012/13 (interim dividend 2011/12 -Rs. 0.50). A final dividend of Rs. 0.50 per share has been proposed by the Board of Directors for the year 2012/13 to be approved at the Annual General Meeting. However, no provision is made for this proposed dividend in these Financial Statements in accordance with LKAS 10.
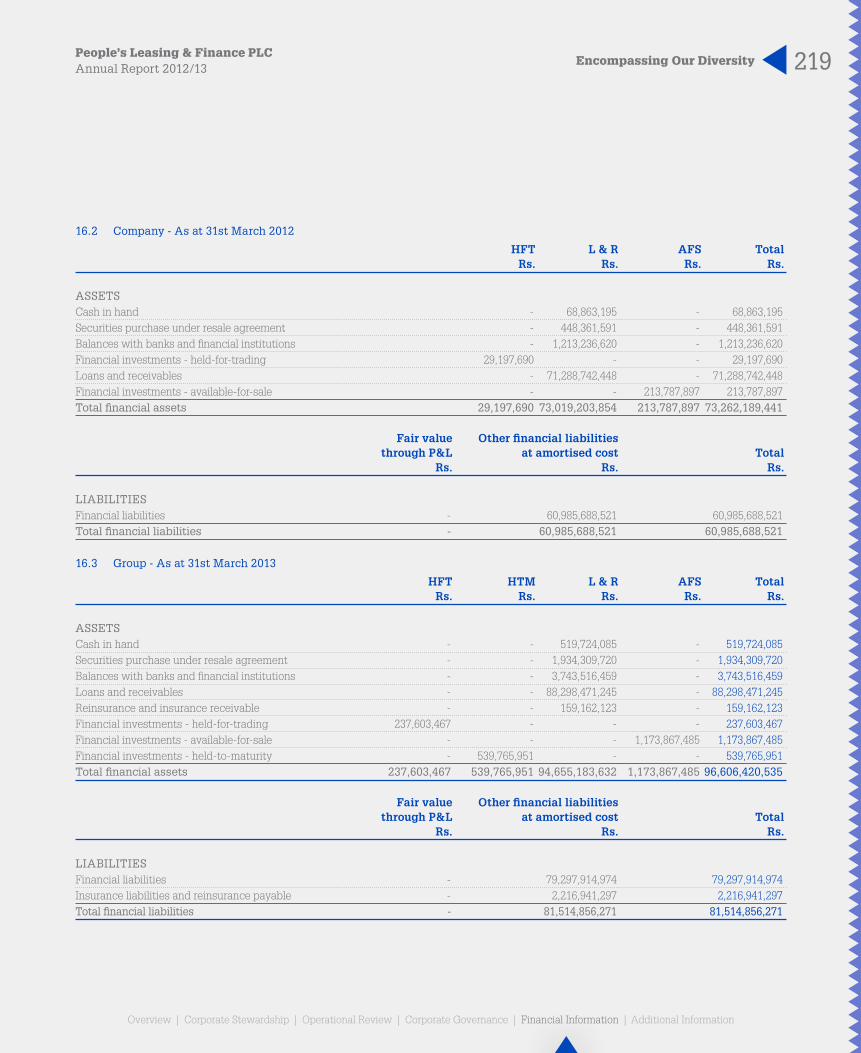
16. Analysis of Financial Instruments by Measurement Basis16.1 Company - As at 31st March 2013
HFT L & R AFS Total Rs. Rs. Rs. Rs.
ASSETSCash in hand - 209,573,206 - 209,573,206Securities purchase under resale agreement - 797,192,056 - 797,192,056Balances with banks and financial institutions - 2,394,567,982 - 2,394,567,982Financial investments - held-for-trading 56,667,250 - - 56,667,250Loans and receivables - 75,722,681,640 - 75,722,681,640Financial investments - available-for-sale - - 184,179,892 184,179,892Total financial assets 56,667,250 79,124,014,884 184,179,892 79,364,862,026
Fair value Other financial liabilities through P&L at amortised cost Total Rs. Rs. Rs.
LIABILITIESFinancial liabilities - 65,060,408,247 65,060,408,247Total financial liabilities - 65,060,408,247 65,060,408,247
Notes to the Financial Statements contd.
219Encompassing Our DiversityPeople’s Leasing & Finance PLCAnnual Report 2012/13
Overview | Corporate Stewardship | Operational Review | Corporate Governance | Financial Information | Additional Information Overview | Corporate Stewardship | Operational Review | Corporate Governance | Financial Information | Additional Information
16.2 Company - As at 31st March 2012
HFT L & R AFS Total Rs. Rs. Rs. Rs.
ASSETSCash in hand - 68,863,195 - 68,863,195Securities purchase under resale agreement - 448,361,591 - 448,361,591Balances with banks and financial institutions - 1,213,236,620 - 1,213,236,620Financial investments - held-for-trading 29,197,690 - - 29,197,690Loans and receivables - 71,288,742,448 - 71,288,742,448Financial investments - available-for-sale - - 213,787,897 213,787,897Total financial assets 29,197,690 73,019,203,854 213,787,897 73,262,189,441
Fair value Other financial liabilities through P&L at amortised cost Total Rs. Rs. Rs.
LIABILITIESFinancial liabilities - 60,985,688,521 60,985,688,521Total financial liabilities - 60,985,688,521 60,985,688,521
16.3 Group - As at 31st March 2013
HFT HTM L & R AFS Total Rs. Rs. Rs. Rs. Rs.
ASSETSCash in hand - - 519,724,085 - 519,724,085Securities purchase under resale agreement - - 1,934,309,720 - 1,934,309,720Balances with banks and financial institutions - - 3,743,516,459 - 3,743,516,459Loans and receivables - - 88,298,471,245 - 88,298,471,245Reinsurance and insurance receivable - - 159,162,123 - 159,162,123Financial investments - held-for-trading 237,603,467 - - - 237,603,467Financial investments - available-for-sale - - - 1,173,867,485 1,173,867,485Financial investments - held-to-maturity - 539,765,951 - - 539,765,951Total financial assets 237,603,467 539,765,951 94,655,183,632 1,173,867,485 96,606,420,535
Fair value Other financial liabilities through P&L at amortised cost Total Rs. Rs. Rs.
LIABILITIESFinancial liabilities - 79,297,914,974 79,297,914,974Insurance liabilities and reinsurance payable - 2,216,941,297 2,216,941,297Total financial liabilities - 81,514,856,271 81,514,856,271
220 Encompassing Our DiversityPeople’s Leasing & Finance PLC
Annual Report 2012/13
Overview | Corporate Stewardship | Operational Review | Corporate Governance | Financial Information | Additional Information
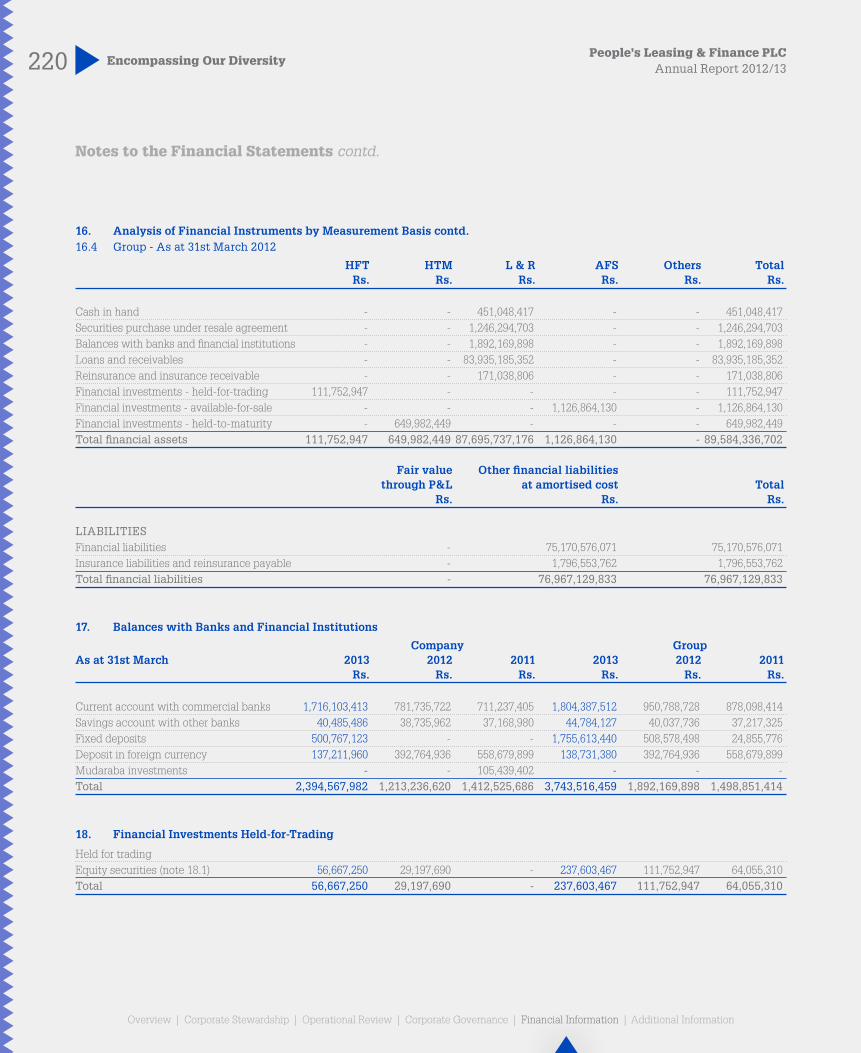
16. Analysis of Financial Instruments by Measurement Basis contd.16.4 Group - As at 31st March 2012
HFT HTM L & R AFS Others Total Rs. Rs. Rs. Rs. Rs. Rs.
Cash in hand - - 451,048,417 - - 451,048,417Securities purchase under resale agreement - - 1,246,294,703 - - 1,246,294,703Balances with banks and financial institutions - - 1,892,169,898 - - 1,892,169,898Loans and receivables - - 83,935,185,352 - - 83,935,185,352Reinsurance and insurance receivable - - 171,038,806 - - 171,038,806Financial investments - held-for-trading 111,752,947 - - - - 111,752,947Financial investments - available-for-sale - - - 1,126,864,130 - 1,126,864,130Financial investments - held-to-maturity - 649,982,449 - - - 649,982,449Total financial assets 111,752,947 649,982,449 87,695,737,176 1,126,864,130 - 89,584,336,702
Fair value Other financial liabilities through P&L at amortised cost Total Rs. Rs. Rs.
LIABILITIESFinancial liabilities - 75,170,576,071 75,170,576,071Insurance liabilities and reinsurance payable - 1,796,553,762 1,796,553,762Total financial liabilities - 76,967,129,833 76,967,129,833
17. Balances with Banks and Financial Institutions
Company GroupAs at 31st March 2013 2012 2011 2013 2012 2011 Rs. Rs. Rs. Rs. Rs. Rs.
Current account with commercial banks 1,716,103,413 781,735,722 711,237,405 1,804,387,512 950,788,728 878,098,414Savings account with other banks 40,485,486 38,735,962 37,168,980 44,784,127 40,037,736 37,217,325Fixed deposits 500,767,123 - - 1,755,613,440 508,578,498 24,855,776Deposit in foreign currency 137,211,960 392,764,936 558,679,899 138,731,380 392,764,936 558,679,899Mudaraba investments - - 105,439,402 - - -Total 2,394,567,982 1,213,236,620 1,412,525,686 3,743,516,459 1,892,169,898 1,498,851,414
18. Financial Investments Held-for-Trading
Held for tradingEquity securities (note 18.1) 56,667,250 29,197,690 - 237,603,467 111,752,947 64,055,310Total 56,667,250 29,197,690 - 237,603,467 111,752,947 64,055,310
Notes to the Financial Statements contd.

221Encompassing Our DiversityPeople’s Leasing & Finance PLCAnnual Report 2012/13
Overview | Corporate Stewardship | Operational Review | Corporate Governance | Financial Information | Additional Information Overview | Corporate Stewardship | Operational Review | Corporate Governance | Financial Information | Additional Information
18.1 Equity securities 31st March 2013 31st March 2012 31st March 2011 No. of Cost of Market No. of Cost of Market No. of Cost of MarketQuoted Shares Shares Investment Value Shares Investment Value Shares Investment Value Rs. Rs. Rs. Rs. Rs. Rs.
CompanyBank, Finance & InsuranceNations Trust Bank PLC 120,100 6,758,773 7,326,100 80,100 4,535,842 4,557,690 - - -Commercial Bank of Ceylon PLC - Voting 203,550 20,582,970 23,001,150 200,000 20,222,342 20,000,000 - - -Commercial Bank of Ceylon PLC - Non voting 100,000 7,482,880 9,690,000 58,000 4,235,166 4,640,000 - - - 423,650 34,824,623 40,017,250 338,100 28,993,350 29,197,690 - - -
ManufacturingDistilleries Company of Sri Lanka PLC 100,000 12,133,315 16,650,000 - - - - - -
Total 46,957,938 56,667,250 28,993,350 29,197,690 - - -Mark to market gain 9,709,312 204,340 - 56,667,250 29,197,690 -
GroupBank, Finance & InsuranceNations Trust Bank PLC 912,971 55,704,934 54,191,231 539,400 37,247,205 30,695,360 309,900 23,873,558 23,645,370Commercial Bank of Ceylon PLC - Voting 413,247 41,020,596 44,929,161 324,104 30,136,310 29,707,012 15,000 2,454,706 3,987,000Commercial Bank of Ceylon PLC - Non voting 301,915 23,388,142 28,566,739 90,348 6,885,691 7,874,800 - - -Hatton National Bank PLC - Non voting 224,271 24,366,108 25,427,019 76,400 7,904,696 6,468,350 - - -People's Finance PLC 29,800 1,130,016 1,028,100 18,900 888,524 674,730 - - -Seylan Bank PLC - Voting 91,033 6,056,378 5,496,511 58,333 3,974,182 3,912,978 25,000 1,504,583 1,880,000Seylan Bank PLC - Non voting 368,643 11,298,532 13,026,826 168,333 5,928,810 4,971,657 25,000 960,640 982,500 162,964,706 172,665,587 92,965,418 84,304,887 28,793,487 30,494,870
Diversified HoldingsAitken Spence PLC 82,800 16,286,605 9,902,880 82,800 16,286,605 9,331,560 82,800 16,286,605 13,438,440John Keells Holdings PLC 60,000 13,605,487 14,820,000 60,000 13,605,487 12,360,000 45,000 13,605,487 12,852,000Hemas Holdings PLC 25,000 1,108,695 675,000 25,000 1,108,695 657,500 25,000 1,108,695 1,150,000 31,000,787 25,397,880 31,000,787 22,349,060 31,000,787 27,440,440
ManufacturingTokyo Cement Company (Lanka) PLC 100,000 4,649,785 1,750,000 100,000 4,649,785 2,700,000 100,000 4,649,785 4,400,000Distilleries Company of Sri Lanka PLC 200,000 24,133,315 33,250,000 - - - - - - 28,783,100 35,000,000 4,649,785 2,700,000 4,649,785 4,400,000
OtherHorana Plantation PLC 20,000 768,000 490,000 5,000 389,312 189,000 - - -Valllibel One PLC 100,000 2,196,350 1,600,000 50,000 1,488,510 950,000 - - -Keells Hotels PLC - - - 100,000 2,000,873 1,260,000 100,000 2,000,873 1,720,000John Keells Hotels PLC 100,000 2,000,873 1,320,000 - - - - - -Mackwoods Energy PLC 100,000 1,400,000 1,130,000 - - - - - - 6,365,223 4,540,000 3,878,695 2,399,000 2,000,873 1,720,000Total 229,113,816 237,603,467 132,494,685 111,752,947 66,444,932 64,055,310Mark to market gain 8,489,651 (20,741,738) (2,389,622) 237,603,467 111,752,947 64,055,310

222 Encompassing Our DiversityPeople’s Leasing & Finance PLC
Annual Report 2012/13
Overview | Corporate Stewardship | Operational Review | Corporate Governance | Financial Information | Additional Information
19. Loans and Receivables
Company GroupAs at 31st March 2013 2012 2011 2013 2012 2011 Rs. Rs. Rs. Rs. Rs. Rs.
Loans and receivables ( note 19.1) 76,435,957,166 71,751,545,635 51,284,370,658 89,140,194,039 84,494,273,423 57,575,603,625LessIndividual impairment charges (note 19.2) 50,296,996 61,147,855 50,095,797 67,956,340 94,644,028 83,591,970Collective impairment charges (note 19.2) 662,978,530 401,655,332 355,581,949 773,766,454 464,444,043 395,238,131Net loans and receivables 75,722,681,640 71,288,742,448 50,878,692,912 88,298,471,245 83,935,185,352 57,096,773,524
19.1 Analysis19.1.1 By productLease/Ijhara receivables 40,583,416,965 36,208,080,195 22,361,203,523 46,900,785,464 42,660,991,493 25,000,480,209Hire-Purchase/ BBA receivables 27,439,499,909 30,968,699,009 25,662,101,852 31,963,197,873 36,025,109,920 28,912,742,024Term Loan 7,815,998,673 4,096,793,831 3,062,317,119 9,936,484,380 5,486,754,131 3,495,054,011Staff loans 248,695,402 253,426,883 148,007,634 282,344,987 277,516,913 154,715,428Related party receivables (note 19.1.1.1) 341,446,871 214,689,926 50,740,530 50,481,989 34,045,175 12,611,953Margin trading receivables 6,899,346 9,855,791 - 6,899,346 9,855,791 -Gross total 76,435,957,166 71,751,545,635 51,284,370,658 89,140,194,039 84,494,273,423 57,575,603,625
19.1.1.1 Related party receivablesAs at 31st MarchPeople’s Finance PLC - 3,133,380 1,095,215 - -People’s Leasing Property Development Limited 340,517,795 211,077,128 37,866,829 - - -People’s Leasing Fleet Management Limited 297,663 - - - -People’s Leasing Havelock Properties Limited - - 10,679,559 - - -People’s Microfinance Limited 1,400 96,325 1,098,927 - - -People’s Insurance Limited 630,013 383,093 - - - -People’s Bank - - - 50,481,989 34,045,175 12,611,953Total 341,446,871 214,689,926 50,740,530 50,481,989 34,045,175 12,611,953
19.1.2 By currencySri Lankan Rupee 76,435,957,166 71,751,545,635 51,284,370,658 89,140,194,039 84,494,273,423 57,575,603,625Gross total 76,435,957,166 71,751,545,635 51,284,370,658 89,140,194,039 84,494,273,423 57,575,603,625
19.1.3 By industryAgriculture and fishing 2,134,986,515 2,323,553,954 1,692,651,236 2,555,809,481 2,838,935,030 1,843,813,499Manufacturing 18,932,374 - - 148,013,172 149,004,089 112,893,229Tourism 379,218,189 450,114,443 328,222,959 402,751,992 482,624,995 348,843,576Transport 15,758,619,719 15,471,807,316 12,459,066,399 16,828,852,637 16,575,326,462 13,088,251,942Construction 4,074,609,602 3,416,126,780 2,127,424,603 3,907,800,119 3,609,922,121 2,209,964,707Traders 18,920,299,940 18,315,917,086 13,108,771,959 23,392,803,804 22,930,646,640 14,833,142,198Services 32,163,905,059 29,534,965,673 20,224,587,262 35,563,629,581 33,557,761,127 21,772,327,756Industry 1,111,580,449 685,823,910 580,337,144 1,159,096,376 695,010,835 580,337,144Financial Services 97,782,973 - - - - -Others 1,776,022,346 1,553,236,473 763,309,097 5,181,436,877 3,655,042,124 2,786,029,574Gross total 76,435,957,166 71,751,545,635 51,284,370,659 89,140,194,039 84,494,273,423 57,575,603,625
Notes to the Financial Statements contd.

223Encompassing Our DiversityPeople’s Leasing & Finance PLCAnnual Report 2012/13
Overview | Corporate Stewardship | Operational Review | Corporate Governance | Financial Information | Additional Information Overview | Corporate Stewardship | Operational Review | Corporate Governance | Financial Information | Additional Information
19.2 Movement in Individual and collective impairment charges during the year
Impairment allowance for loans and advances to customersA reconciliation of the allowance for impairment losses for loans and advances, by class, is as follows:
Hire Term Re-finance Trading Lease Purchase Ijhara Loans loans BBA Muraba Total Rs. Rs. Rs. Rs. Rs. Rs. Rs. Rs.
CompanyAt 1st April 2011 121,357,715 164,842,976 4,169,297 88,425,449 3,196,604 8,380,093 15,305,612 405,677,746Charge/(Reversal) for the year 89,528,382 88,524,097 (2,432,632) 23,158,809 (2,417,268) (4,228,660) (421,802) 191,710,926Less amounts written off 55,906,632 72,729,665 - 5,949,188 - - - 134,585,485At 31st March 2012 154,979,465 180,637,408 1,736,665 105,635,070 779,336 4,151,433 14,883,810 462,803,187
Individual impairment 10,850,859 - - 36,853,842 - - 13,443,154 61,147,855Collective impairment 144,128,606 180,637,408 1,736,665 68,781,228 779,336 4,151,433 1,440,656 401,655,332 154,979,465 180,637,408 1,736,665 105,635,070 779,336 4,151,433 14,883,810 462,803,187Gross amount of loans individually determined to be impaired, before deducting the individually assessed impairment allowance 10,850,859 - - 36,853,842 - - 13,443,154 61,147,855
At 1st April 2012 154,979,465 180,637,408 1,736,665 105,635,070 779,336 4,151,433 14,883,810 462,803,187Charge/(Reversal) for the year 149,972,108 142,537,661 (671,835) 55,894,161 153,268 (934,681) 80,766 347,031,448Less amounts written off 24,212,439 39,153,344 - 33,193,326 - - - 96,559,109At 31st March 2013 280,739,134 284,021,725 1,064,830 128,335,905 932,604 3,216,752 14,964,576 713,275,526
Individual impairment - - - 36,853,842 - - 13,443,154 50,296,996Collective impairment 280,739,134 284,021,725 1,064,830 91,482,063 932,604 3,216,752 1,521,422 662,978,530 280,739,134 284,021,725 1,064,830 128,335,905 932,604 3,216,752 14,964,576 713,275,526Gross amount of loans individually determined to be impaired,before deducting the individually assessed impairment allowance - - - 36,853,842 - - 13,443,154 50,296,996
GroupAt 1st April 2011 158,508,223 173,422,052 5,076,198 114,440,693 3,196,604 8,845,721 15,340,610 478,830,101Charge/(Reversal) for the year 100,530,200 96,295,009 (1,922,132) 25,964,223 (2,417,268) (3,346,974) (259,603) 214,843,455Less amounts written off 55,906,632 72,729,665 - 5,949,188 - - - 134,585,485At 31st March 2012 203,131,791 196,987,396 3,154,066 134,455,728 779,336 5,498,747 15,081,007 559,088,071
Individual impairment 29,225,453 - - 51,975,421 - - 13,443,154 94,644,028Collective impairment 173,906,338 196,987,396 3,154,066 82,480,307 779,336 5,498,747 1,637,853 464,444,043 203,131,791 196,987,396 3,154,066 134,455,728 779,336 5,498,747 15,081,007 559,088,071Gross amount of loans individually determined to be impaired,before deducting the individually assessed impairment allowance 29,225,453 - - 51,975,421 - - 13,443,154 94,644,028
At 1st April 2012 203,131,791 196,987,396 3,154,066 134,455,728 779,336 5,498,747 15,081,007 559,088,071Charge/(Reversal) for the year 155,174,380 152,656,611 2,033,291 56,502,226 153,268 10,786,118 1,887,938 379,193,832Less amounts written off 24,212,439 39,153,344 - 33,193,326 - - - 96,559,109At 31st March 2013 334,093,732 310,490,663 5,187,357 157,764,628 932,604 16,284,865 16,968,945 841,722,794
Individual impairment - - - 47,349,693 - 7,163,493 13,443,154 67,956,340Collective impairment 334,093,732 310,490,663 5,187,357 110,414,935 932,604 9,121,372 3,525,791 773,766,454 334,093,732 310,490,663 5,187,357 157,764,628 932,604 16,284,865 16,968,945 841,722,794Gross amount of loans individually determined to be impaired,before deducting the individually assessed impairment allowance - - - 47,349,693 - 7,163,493 13,443,154 67,956,340
224 Encompassing Our DiversityPeople’s Leasing & Finance PLC
Annual Report 2012/13
Overview | Corporate Stewardship | Operational Review | Corporate Governance | Financial Information | Additional Information
Company GroupAs at 31st March 2013 2012 2011 2013 2012 2011 Rs. Rs. Rs. Rs. Rs. Rs.
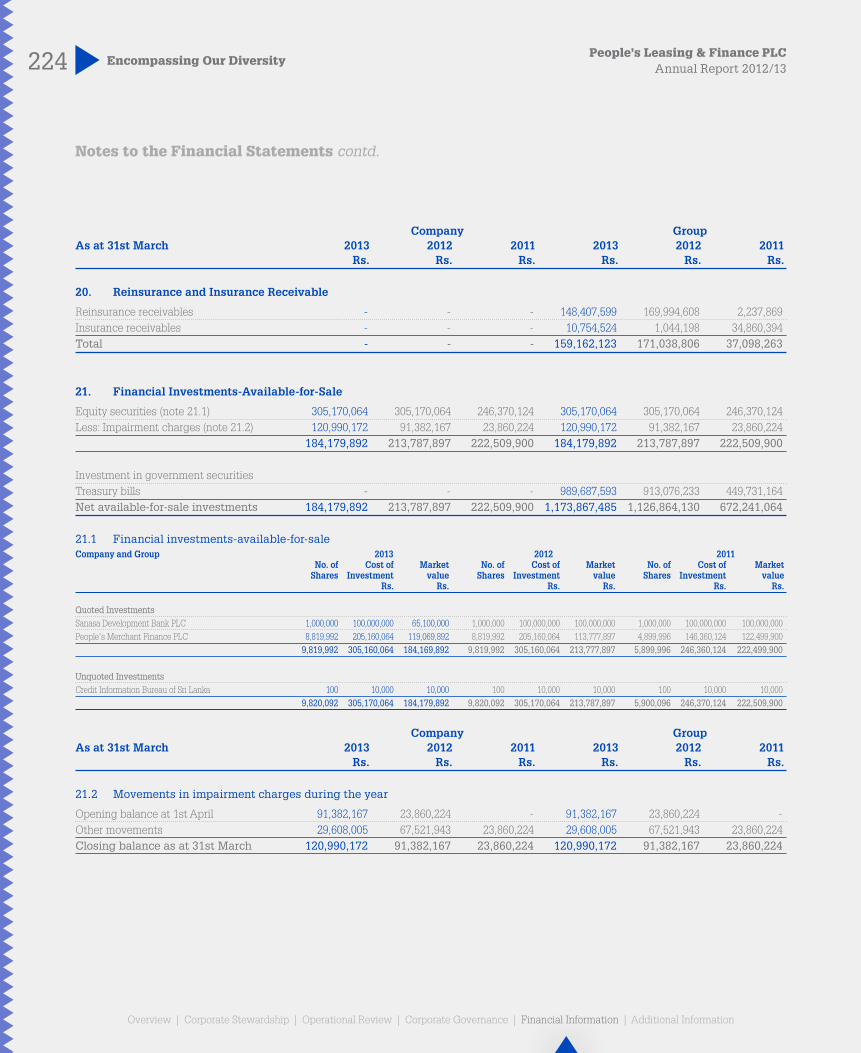
20. Reinsurance and Insurance Receivable
Reinsurance receivables - - - 148,407,599 169,994,608 2,237,869Insurance receivables - - - 10,754,524 1,044,198 34,860,394Total - - - 159,162,123 171,038,806 37,098,263
21. Financial Investments-Available-for-Sale
Equity securities (note 21.1) 305,170,064 305,170,064 246,370,124 305,170,064 305,170,064 246,370,124Less: Impairment charges (note 21.2) 120,990,172 91,382,167 23,860,224 120,990,172 91,382,167 23,860,224 184,179,892 213,787,897 222,509,900 184,179,892 213,787,897 222,509,900
Investment in government securitiesTreasury bills - - - 989,687,593 913,076,233 449,731,164Net available-for-sale investments 184,179,892 213,787,897 222,509,900 1,173,867,485 1,126,864,130 672,241,064
21.1 Financial investments-available-for-saleCompany and Group 2013 2012 2011 No. of Cost of Market No. of Cost of Market No. of Cost of Market Shares Investment value Shares Investment value Shares Investment value Rs. Rs. Rs. Rs. Rs. Rs.
Quoted InvestmentsSanasa Development Bank PLC 1,000,000 100,000,000 65,100,000 1,000,000 100,000,000 100,000,000 1,000,000 100,000,000 100,000,000People's Merchant Finance PLC 8,819,992 205,160,064 119,069,892 8,819,992 205,160,064 113,777,897 4,899,996 146,360,124 122,499,900 9,819,992 305,160,064 184,169,892 9,819,992 305,160,064 213,777,897 5,899,996 246,360,124 222,499,900
Unquoted InvestmentsCredit Information Bureau of Sri Lanka 100 10,000 10,000 100 10,000 10,000 100 10,000 10,000 9,820,092 305,170,064 184,179,892 9,820,092 305,170,064 213,787,897 5,900,096 246,370,124 222,509,900
Company GroupAs at 31st March 2013 2012 2011 2013 2012 2011 Rs. Rs. Rs. Rs. Rs. Rs.
21.2 Movements in impairment charges during the year
Opening balance at 1st April 91,382,167 23,860,224 - 91,382,167 23,860,224 -Other movements 29,608,005 67,521,943 23,860,224 29,608,005 67,521,943 23,860,224Closing balance as at 31st March 120,990,172 91,382,167 23,860,224 120,990,172 91,382,167 23,860,224
Notes to the Financial Statements contd.

225Encompassing Our DiversityPeople’s Leasing & Finance PLCAnnual Report 2012/13
Overview | Corporate Stewardship | Operational Review | Corporate Governance | Financial Information | Additional Information Overview | Corporate Stewardship | Operational Review | Corporate Governance | Financial Information | Additional Information
Company Group 2013 2012 2011 2013 2012 2011 Rs. Rs. Rs. Rs. Rs. Rs.
22. Financial Investments – Held-to-Maturity
Held to MaturityTreasury bills - - - 516,301,936 626,771,528 308,324,000Treasury bonds - - - 23,464,015 23,210,921 36,509,302Total - - - 539,765,951 649,982,449 344,833,302
23. Investments in Subsidiaries
Quoted equity shares (note 23.1) 1,707,687,562 1,643,184,304 965,250,254 - - -Unquoted equity shares (note 23.2) 1,475,000,000 1,475,000,000 840,000,000 - - -Less: Impairment charges - - - - - -Total 3,182,687,562 3,118,184,304 1,805,250,254 - - -
Details of subsidiaries
Company GroupAs at 31st March Holding 2013 2012 2011 2013 2012 2011 % Rs. Rs. Rs. Rs. Rs. Rs.
23.1 Quoted equity shares
People’s Finance PLC 91.12 1,707,687,562 1,643,184,304 965,250,254 - - -
Sub total 1,707,687,562 1,643,184,304 965,250,254 - - -
23.2 Unquoted equity shares
People’s Leasing Fleet Management Limited 100.00 75,000,000 75,000,000 75,000,000 - - -
People’s Leasing Property Development Limited 100.00 550,000,000 550,000,000 200,000,000 - - -
People’s Leasing Havelock Properties Limited 100.00 200,000,000 200,000,000 200,000,000 - - -
People’s Microfinance Limited 100.00 50,000,000 50,000,000 15,000,000 - - -
People’s Insurance Limited 100.00 600,000,000 600,000,000 350,000,000 - - -
Sub total 1,475,000,000 1,475,000,000 840,000,000 - - -
Total 3,182,687,562 3,118,184,304 1,805,250,254 - - -
226 Encompassing Our DiversityPeople’s Leasing & Finance PLC
Annual Report 2012/13
Overview | Corporate Stewardship | Operational Review | Corporate Governance | Financial Information | Additional Information
Company Group 2013 2012 2011 2013 2012 2011 Rs. Rs. Rs. Rs. Rs. Rs.
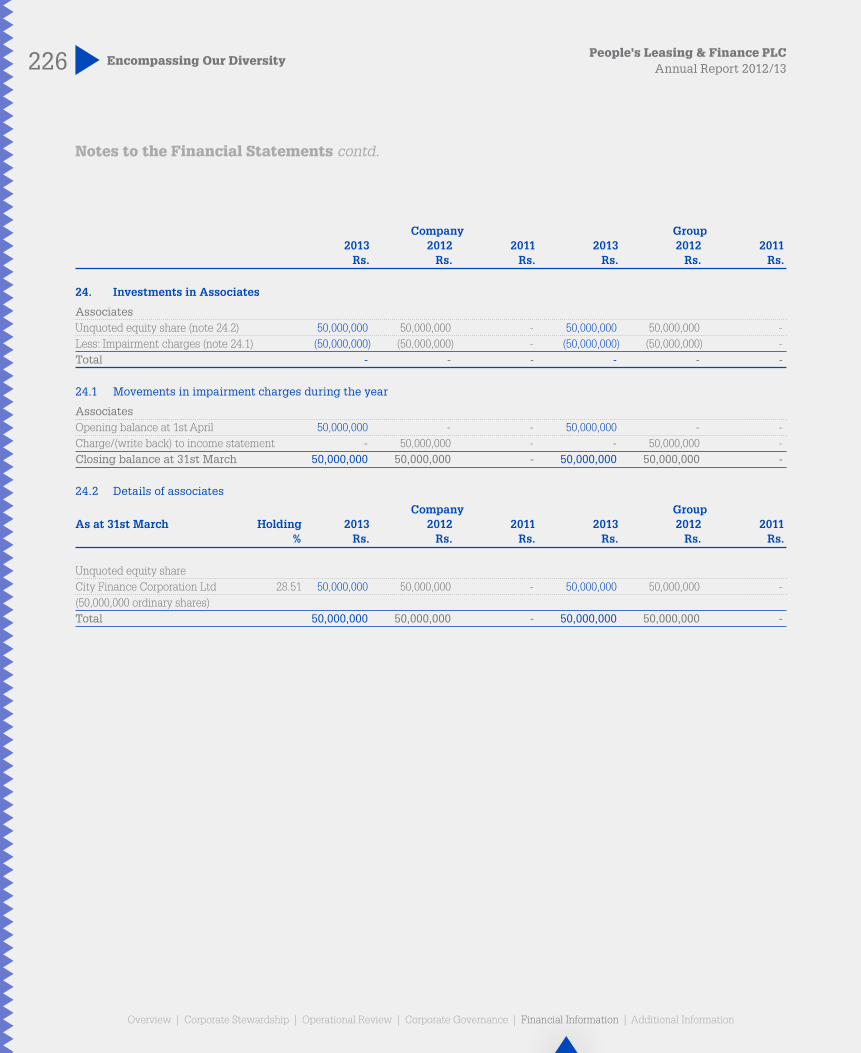
24. Investments in Associates
Associates Unquoted equity share (note 24.2) 50,000,000 50,000,000 - 50,000,000 50,000,000 -Less: Impairment charges (note 24.1) (50,000,000) (50,000,000) - (50,000,000) (50,000,000) -Total - - - - - -
24.1 Movements in impairment charges during the year
AssociatesOpening balance at 1st April 50,000,000 - - 50,000,000 - -Charge/(write back) to income statement - 50,000,000 - - 50,000,000 -Closing balance at 31st March 50,000,000 50,000,000 - 50,000,000 50,000,000 -
24.2 Details of associates
Company GroupAs at 31st March Holding 2013 2012 2011 2013 2012 2011 % Rs. Rs. Rs. Rs. Rs. Rs.
Unquoted equity shareCity Finance Corporation Ltd 28.51 50,000,000 50,000,000 - 50,000,000 50,000,000 -(50,000,000 ordinary shares)Total 50,000,000 50,000,000 - 50,000,000 50,000,000 -
Notes to the Financial Statements contd.

227Encompassing Our DiversityPeople’s Leasing & Finance PLCAnnual Report 2012/13
Overview | Corporate Stewardship | Operational Review | Corporate Governance | Financial Information | Additional Information Overview | Corporate Stewardship | Operational Review | Corporate Governance | Financial Information | Additional Information
25. Goodwill and Intangible Assets
Company Group Computer Computer Customer software Total software list Goodwill Total Rs. Rs. Rs. Rs. Rs. Rs.
2012/2013(Current year)Cost/fair valueOpening balance at 1st April 2012 86,183,489 86,183,489 89,119,479 6,033,738 308,545,249 403,698,466Additions 10,656,173 10,656,173 25,333,795 - - 25,333,795Disposals - - - - - -Closing balance at 31st March 2013 96,839,662 96,839,662 114,453,274 6,033,738 308,545,249 429,032,261
Less: Accumulated depreciationOpening balance at 1st April 2012 49,442,763 49,442,763 49,799,453 3,419,137 - 53,218,590Charge for the year 12,094,283 12,094,283 16,325,134 1,206,756 - 17,531,890Disposals - - - - - -Closing balance at 31st March 2013 61,537,046 61,537,046 66,124,587 4,625,893 - 70,750,480Less: Impairment charges - - - - - -Net book value at 31st March 2013 35,302,616 35,302,616 48,328,687 1,407,845 308,545,249 358,281,781
2011/2012 (Previous year)Cost/fair valueOpening balance at 1st April 2011 57,712,350 57,712,350 59,336,918 6,033,738 308,545,249 373,915,905Additions 28,471,139 28,471,139 29,782,561 - - 29,782,561Disposals - - - - - -Closing balance at 31st March 2012 86,183,489 86,183,489 89,119,479 6,033,738 308,545,249 403,698,466
Less: Accumulated depreciationOpening balance at 1st April 2011 38,751,621 38,751,621 38,894,042 2,212,381 - 41,106,423Charge for the year 10,691,142 10,691,142 10,905,411 1,206,756 - 12,112,167Disposals - - - - - -Closing balance at 31st March 2012 49,442,763 49,442,763 49,799,453 3,419,137 - 53,218,590Less: Impairment charges - - - - - -Net book value at 31st March 2012 36,740,726 36,740,726 39,320,026 2,614,601 308,545,249 350,479,876
228 Encompassing Our DiversityPeople’s Leasing & Finance PLC
Annual Report 2012/13
Overview | Corporate Stewardship | Operational Review | Corporate Governance | Financial Information | Additional Information
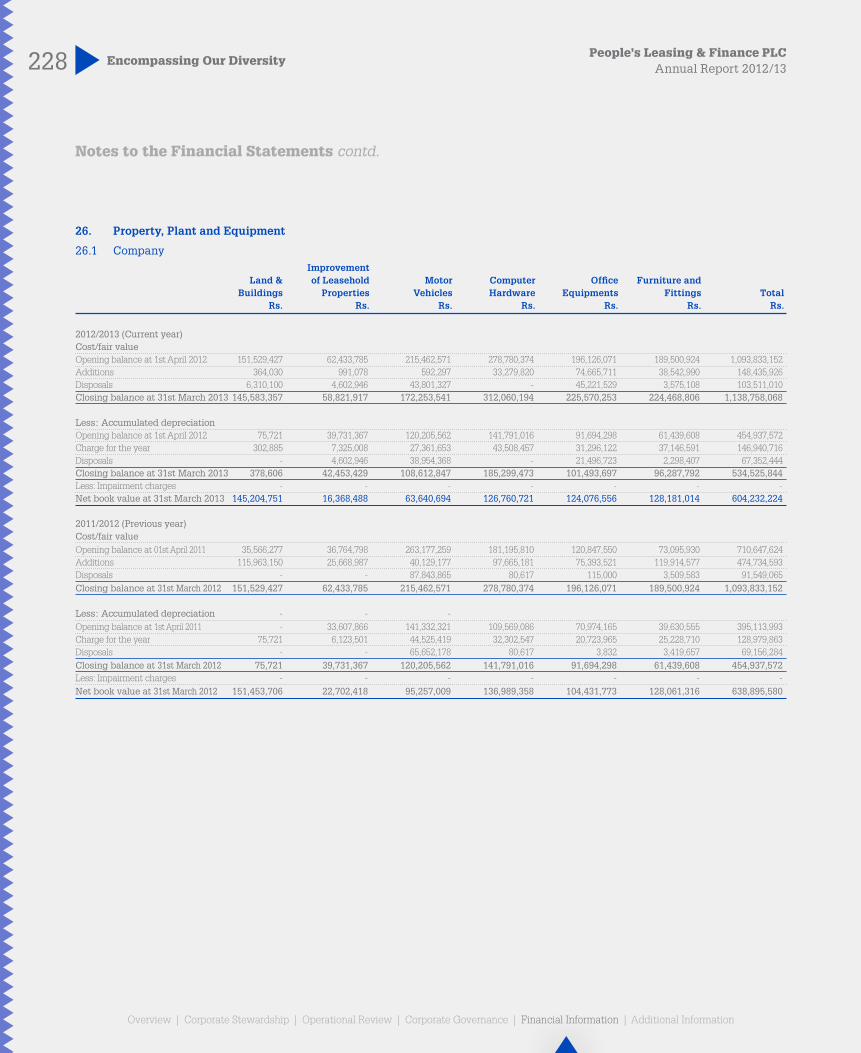
26. Property, Plant and Equipment
26.1 Company Improvement Land & of Leasehold Motor Computer Office Furniture and Buildings Properties Vehicles Hardware Equipments Fittings Total Rs. Rs. Rs. Rs. Rs. Rs. Rs.
2012/2013 (Current year)Cost/fair valueOpening balance at 1st April 2012 151,529,427 62,433,785 215,462,571 278,780,374 196,126,071 189,500,924 1,093,833,152Additions 364,030 991,078 592,297 33,279,820 74,665,711 38,542,990 148,435,926Disposals 6,310,100 4,602,946 43,801,327 - 45,221,529 3,575,108 103,511,010Closing balance at 31st March 2013 145,583,357 58,821,917 172,253,541 312,060,194 225,570,253 224,468,806 1,138,758,068
Less: Accumulated depreciationOpening balance at 1st April 2012 75,721 39,731,367 120,205,562 141,791,016 91,694,298 61,439,608 454,937,572Charge for the year 302,885 7,325,008 27,361,653 43,508,457 31,296,122 37,146,591 146,940,716Disposals - 4,602,946 38,954,368 - 21,496,723 2,298,407 67,352,444Closing balance at 31st March 2013 378,606 42,453,429 108,612,847 185,299,473 101,493,697 96,287,792 534,525,844Less: Impairment charges - - - - - - -Net book value at 31st March 2013 145,204,751 16,368,488 63,640,694 126,760,721 124,076,556 128,181,014 604,232,224
2011/2012 (Previous year)Cost/fair valueOpening balance at 01st April 2011 35,566,277 36,764,798 263,177,259 181,195,810 120,847,550 73,095,930 710,647,624Additions 115,963,150 25,668,987 40,129,177 97,665,181 75,393,521 119,914,577 474,734,593Disposals - - 87,843,865 80,617 115,000 3,509,583 91,549,065Closing balance at 31st March 2012 151,529,427 62,433,785 215,462,571 278,780,374 196,126,071 189,500,924 1,093,833,152
Less: Accumulated depreciation - - -Opening balance at 1st April 2011 - 33,607,866 141,332,321 109,569,086 70,974,165 39,630,555 395,113,993Charge for the year 75,721 6,123,501 44,525,419 32,302,547 20,723,965 25,228,710 128,979,863Disposals - - 65,652,178 80,617 3,832 3,419,657 69,156,284Closing balance at 31st March 2012 75,721 39,731,367 120,205,562 141,791,016 91,694,298 61,439,608 454,937,572Less: Impairment charges - - - - - - -Net book value at 31st March 2012 151,453,706 22,702,418 95,257,009 136,989,358 104,431,773 128,061,316 638,895,580
Notes to the Financial Statements contd.

229Encompassing Our DiversityPeople’s Leasing & Finance PLCAnnual Report 2012/13
Overview | Corporate Stewardship | Operational Review | Corporate Governance | Financial Information | Additional Information Overview | Corporate Stewardship | Operational Review | Corporate Governance | Financial Information | Additional Information
26.2 Group Improvement Land & of Leasehold Motor Computer Office Furniture & Work in Buildings Properties Vehicles Hardware Equipments Fitting Progress Total Rs. Rs. Rs. Rs. Rs. Rs. Rs. Rs.
2012/2013 (Current year)Cost/fair valueOpening balance at 1st April 2012 1,612,281,131 62,433,783 413,533,965 378,836,738 415,643,398 249,863,294 304,720,106 3,437,312,415Additions 263,058,890 991,078 81,398,231 53,122,592 102,114,609 62,966,082 84,372,550 648,024,032Disposals 174,628,375 4,602,946 81,893,483 21,226,916 45,261,531 25,064,156 360,980,803 713,658,210Closing balance at 31st March 2013 1,700,711,646 58,821,915 413,038,713 410,732,414 472,496,476 287,765,220 28,111,853 3,371,678,237
Less: Accumulated depreciationOpening balance at 1st April 2012 14,997,840 39,731,367 169,015,608 185,115,237 113,225,937 86,142,932 - 608,228,921Charge for the year 21,875,261 7,325,008 45,045,080 62,235,983 57,313,165 49,599,889 - 243,394,386Disposals - 4,602,946 58,570,120 20,784,816 21,536,723 15,583,082 - 121,077,687Closing balance at 31st March 2013 36,873,101 42,453,429 155,490,568 226,566,404 149,002,379 120,159,739 - 730,545,620Less: Impairment charges - - - - - - - -Net book value at 31st March 2013 1,663,838,545 16,368,486 257,548,145 184,166,010 323,494,097 167,605,481 28,111,853 2,641,132,617
2011/2012 (Previous year)Cost/fair valueOpening balance at 01st April 2011 491,050,647 36,764,796 411,074,421 242,845,102 139,320,478 108,258,034 648,080,785 2,077,394,263Additions 1,121,230,484 25,668,987 103,081,067 136,072,253 279,219,313 145,114,843 824,542,147 2,634,929,094Disposals - - 100,621,523 80,617 2,896,393 3,509,580 1,167,902,826 1,275,010,939Closing balance at 31st March 2012 1,612,281,131 62,433,783 413,533,965 378,836,738 415,643,398 249,863,297 304,720,106 3,437,312,418
Less: Accumulated depreciationOpening balance at 1st April 2011 788,000 33,607,866 144,048,681 136,714,379 74,965,465 55,380,433 - 445,504,824Charge for the year 14,209,840 6,123,501 66,342,701 48,481,475 39,373,112 34,182,156 - 208,712,785Disposals - 41,375,774 80,617 1,112,641 3,419,657 - 45,988,689Closing balance at 31st March 2012 14,997,840 39,731,367 169,015,608 185,115,237 113,225,936 86,142,932 - 608,228,920Less: Impairment charges - - - - - - - -Net book value at 31st March 2012 1,597,283,291 22,702,416 244,518,357 193,721,501 302,417,462 163,720,365 304,720,106 2,829,083,498

230 Encompassing Our DiversityPeople’s Leasing & Finance PLC
Annual Report 2012/13
Overview | Corporate Stewardship | Operational Review | Corporate Governance | Financial Information | Additional Information
Company GroupAs at 31st March 2013 2012 2011 2013 2012 2011 Rs. Rs. Rs. Rs. Rs. Rs.
27. Investment Property
At the beginning of the year 56,000,000 56,000,000 43,651,580 - - -Net gain from fair value adjustments - - 12,348,420 - - -At the end of the year 56,000,000 56,000,000 56,000,000 - - -
28. Deferred Tax Assets and Liabilities
ASSETSDeferred Tax AssetsCarry forward tax losses - - - - - 98,122,340Fair value losses recognise in other comprehensive income - - - - 1,002,669 -Defined benefit plan liability - - - - 222,058 1,435,035 - - - - 1,224,727 99,557,375
Deferred Tax LiabilityAccelerated depreciation allowance for tax purpose (Rentals receivable) - - - - - 63,271,199Accelerated depreciation allowance for tax purpose (Property, plant & equipment) - - - - 381,813 7,144,863 - - - - 381,813 70,416,062Net deferred tax assets - - - - 842,914 29,141,313
LIABILITYDeferred Tax AssetsCarry forward tax losses - - - 3,800,202 31,539,364 2,437,998Defined benefit plan liability 13,576,299 10,363,779 7,515,354 16,121,670 12,149,911 7,562,101 13,576,299 10,363,779 7,515,354 19,921,872 43,689,275 10,000,099
Deferred Tax LiabilityAccelerated depreciation allowance for tax purpose (Rentals receivable) 1,070,753,817 516,504,744 411,882,751 1,161,831,623 606,366,297 411,882,751Accelerated depreciation allowance for tax purpose (Property, plant & equipment) 48,112,361 28,400,368 7,711,152 67,397,223 46,971,563 11,755,006Fair value losses recognised in other comprehensive income - - - 470,306 - - 1,118,866,178 544,905,112 419,593,903 1,229,699,152 653,337,860 423,637,757Net deferred tax liabilities 1,105,289,879 534,541,333 412,078,549 1,209,777,280 609,648,585 413,637,658
Deferred tax assets/liabilities have been calculated at the rate of 28%.
Notes to the Financial Statements contd.

231Encompassing Our DiversityPeople’s Leasing & Finance PLCAnnual Report 2012/13
Overview | Corporate Stewardship | Operational Review | Corporate Governance | Financial Information | Additional Information Overview | Corporate Stewardship | Operational Review | Corporate Governance | Financial Information | Additional Information
Company GroupAs at 31st March 2013 2012 2011 2013 2012 2011 Rs. Rs. Rs. Rs. Rs. Rs.
29. Other Assets
Advance payments 148,975,703 99,431,034 99,120,408 608,491,147 272,639,528 259,660,040VAT/VAT on financial services recoverable 114,388,066 921,542,232 635,992,283 242,182,054 1,252,935,385 665,997,981Income tax receivables 74,403,384 - - 74,403,384 - -Vehicles and real estates inventory 69,990,420 169,105,286 246,550,925 69,990,420 169,105,286 246,550,925Consumables 7,622,726 7,773,645 4,972,086 9,669,558 9,317,010 6,425,877Other receivables 227,822,082 348,324,129 1,189,819,383 533,889,772 693,998,751 1,452,787,325Total 643,202,381 1,546,176,326 2,176,455,085 1,538,626,335 2,397,995,960 2,631,422,148
30. Financial Liabilities
Overdraft 774,688,112 2,073,089,207 1,168,595,180 960,786,766 2,308,921,888 1,358,945,476Short term loans 22,921,160,664 27,009,083,944 19,774,220,081 23,662,540,664 27,010,311,108 19,819,637,302Debentures (note 30.2) 7,882,843,130 2,014,929,988 1,778,138,690 7,782,843,130 2,014,929,988 1,778,138,690Long term loans 10,878,434,017 13,354,556,605 11,109,609,679 12,211,617,212 15,563,869,236 11,708,650,882Asset backed securities 12,202,921,982 13,356,320,359 7,821,662,140 12,202,921,982 13,356,320,359 7,821,662,140Deposits 6,830,482,112 - - 18,709,869,092 11,307,887,149 6,192,012,209Redeemable preference shares (note 30.1) 724,791,667 931,875,000 1,087,041,667 724,791,667 931,875,000 1,087,041,667Creditors 2,845,086,563 2,244,376,086 4,694,641,544 3,042,544,461 2,676,461,343 5,041,042,732Related party payables (note 30.3) - 1,457,332 307,040 - - -Total 65,060,408,247 60,985,688,521 47,434,216,021 79,297,914,974 75,170,576,071 54,807,131,098
30.1 Redeemable preference shares
Redeemable preference shares 700,000,000 900,000,000 1,050,000,000 700,000,000 900,000,000 1,050,000,000Interest payable 24,791,667 31,875,000 37,041,667 24,791,667 31,875,000 37,041,667Total 724,791,667 931,875,000 1,087,041,667 724,791,667 931,875,000 1,087,041,667
30.2 Debentures
Not listed debentures (note 30.2.1) 1,945,105,112 2,014,929,988 1,788,138,690 1,945,105,112 2,014,929,988 1,788,138,690Listed debentures (note 30.2.2) 5,937,738,018 - - 5,837,738,018 - -Total 7,882,843,130 2,014,929,988 1,788,138,690 7,782,843,130 2,014,929,988 1,788,138,690
30.2.1 Not listed debentures
Redeemable debentures 1,945,105,112 2,014,929,988 1,788,138,690 1,945,105,112 2,014,929,988 1,788,138,690Total 1,945,105,112 2,014,929,988 1,788,138,690 1,945,105,112 2,014,929,988 1,788,138,690
232 Encompassing Our DiversityPeople’s Leasing & Finance PLC
Annual Report 2012/13
Overview | Corporate Stewardship | Operational Review | Corporate Governance | Financial Information | Additional Information
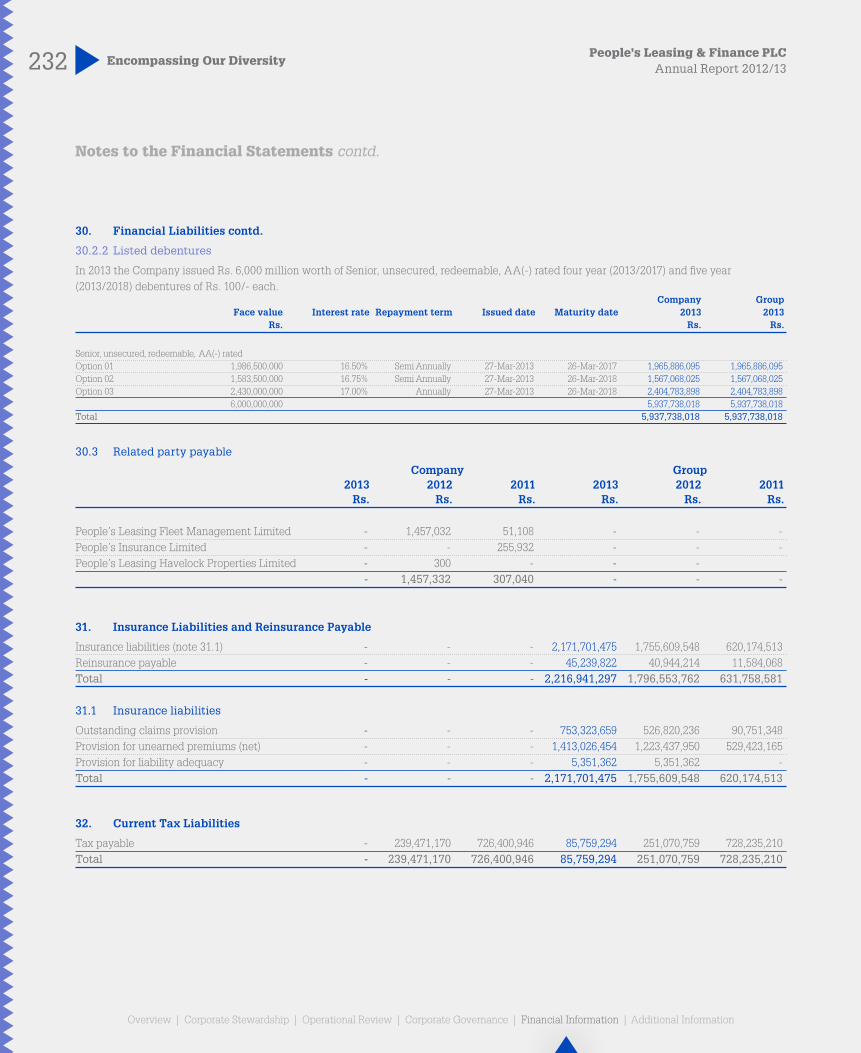
30. Financial Liabilities contd.
30.2.2 Listed debentures
In 2013 the Company issued Rs. 6,000 million worth of Senior, unsecured, redeemable, AA(-) rated four year (2013/2017) and five year (2013/2018) debentures of Rs. 100/- each. Company Group Face value Interest rate Repayment term Issued date Maturity date 2013 2013 Rs. Rs. Rs.
Senior, unsecured, redeemable, AA(-) ratedOption 01 1,986,500,000 16.50% Semi Annually 27-Mar-2013 26-Mar-2017 1,965,886,095 1,965,886,095Option 02 1,583,500,000 16.75% Semi Annually 27-Mar-2013 26-Mar-2018 1,567,068,025 1,567,068,025Option 03 2,430,000,000 17.00% Annually 27-Mar-2013 26-Mar-2018 2,404,783,898 2,404,783,898 6,000,000,000 5,937,738,018 5,937,738,018Total 5,937,738,018 5,937,738,018
30.3 Related party payable
Company Group 2013 2012 2011 2013 2012 2011 Rs. Rs. Rs. Rs. Rs. Rs.
People’s Leasing Fleet Management Limited - 1,457,032 51,108 - - -People’s Insurance Limited - - 255,932 - - -People’s Leasing Havelock Properties Limited - 300 - - - - 1,457,332 307,040 - - -
31. Insurance Liabilities and Reinsurance Payable
Insurance liabilities (note 31.1) - - - 2,171,701,475 1,755,609,548 620,174,513Reinsurance payable - - - 45,239,822 40,944,214 11,584,068Total - - - 2,216,941,297 1,796,553,762 631,758,581
31.1 Insurance liabilities
Outstanding claims provision - - - 753,323,659 526,820,236 90,751,348Provision for unearned premiums (net) - - - 1,413,026,454 1,223,437,950 529,423,165Provision for liability adequacy - - - 5,351,362 5,351,362 -Total - - - 2,171,701,475 1,755,609,548 620,174,513
32. Current Tax Liabilities
Tax payable - 239,471,170 726,400,946 85,759,294 251,070,759 728,235,210Total - 239,471,170 726,400,946 85,759,294 251,070,759 728,235,210
Notes to the Financial Statements contd.
233Encompassing Our DiversityPeople’s Leasing & Finance PLCAnnual Report 2012/13
Overview | Corporate Stewardship | Operational Review | Corporate Governance | Financial Information | Additional Information Overview | Corporate Stewardship | Operational Review | Corporate Governance | Financial Information | Additional Information
Company Group 2013 2012 2011 2013 2012 2011 Rs. Rs. Rs. Rs. Rs. Rs.
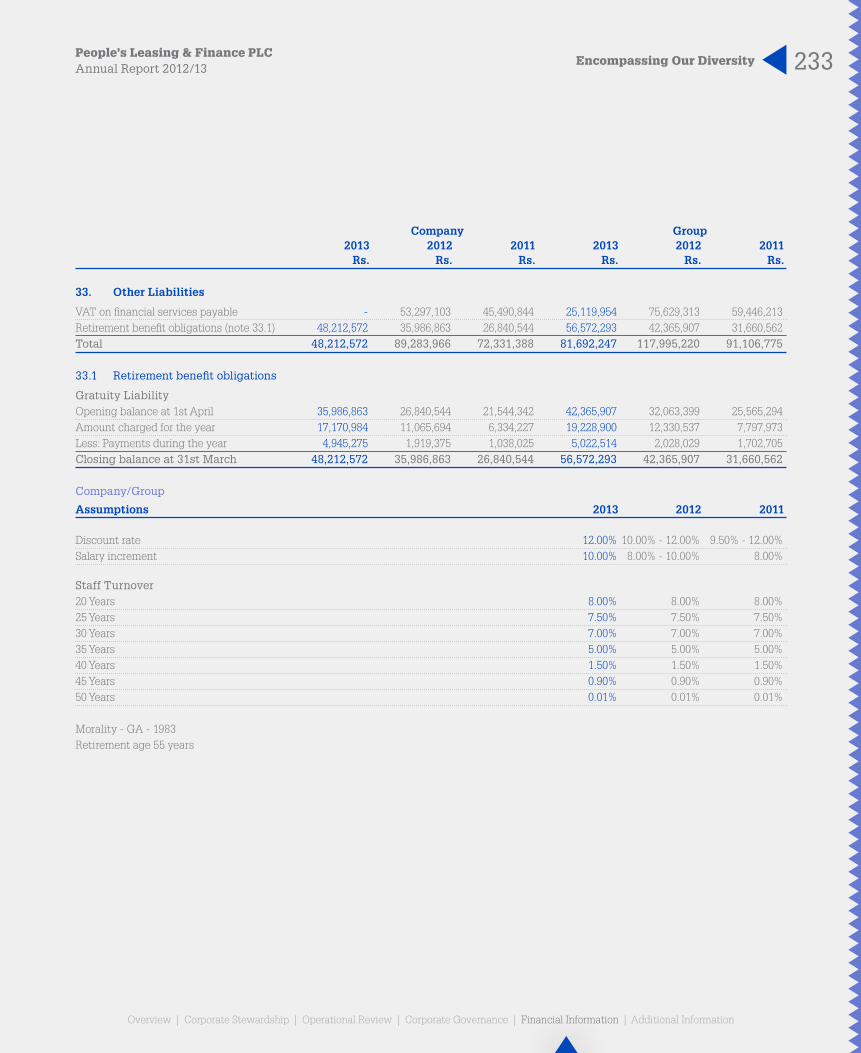
33. Other Liabilities
VAT on financial services payable - 53,297,103 45,490,844 25,119,954 75,629,313 59,446,213Retirement benefit obligations (note 33.1) 48,212,572 35,986,863 26,840,544 56,572,293 42,365,907 31,660,562Total 48,212,572 89,283,966 72,331,388 81,692,247 117,995,220 91,106,775
33.1 Retirement benefit obligations
Gratuity LiabilityOpening balance at 1st April 35,986,863 26,840,544 21,544,342 42,365,907 32,063,399 25,565,294Amount charged for the year 17,170,984 11,065,694 6,334,227 19,228,900 12,330,537 7,797,973Less: Payments during the year 4,945,275 1,919,375 1,038,025 5,022,514 2,028,029 1,702,705Closing balance at 31st March 48,212,572 35,986,863 26,840,544 56,572,293 42,365,907 31,660,562
Company/Group
Assumptions 2013 2012 2011
Discount rate 12.00% 10.00% - 12.00% 9.50% - 12.00%Salary increment 10.00% 8.00% - 10.00% 8.00%
Staff Turnover20 Years 8.00% 8.00% 8.00%25 Years 7.50% 7.50% 7.50%30 Years 7.00% 7.00% 7.00%35 Years 5.00% 5.00% 5.00%40 Years 1.50% 1.50% 1.50%45 Years 0.90% 0.90% 0.90%50 Years 0.01% 0.01% 0.01%
Morality - GA - 1983Retirement age 55 years

234 Encompassing Our DiversityPeople’s Leasing & Finance PLC
Annual Report 2012/13
Overview | Corporate Stewardship | Operational Review | Corporate Governance | Financial Information | Additional Information
2013 2012 2011 Number Rs. Number Rs. Number Rs.
34. Capital
Capital 1,560,000,160 12,258,000,800 1,560,000,160 12,058,000,800 50,000,008 800,000,080 1,560,000,160 12,258,000,800 1,560,000,160 12,058,000,800 50,000,008 800,000,080
34.1 Stated capital
Fully paid ordinary shares 1,560,000,160 11,608,000,800 1,560,000,160 11,608,000,800 50,000,008 500,000,080Transfer from preference shares on redemption - 650,000,000 - 450,000,000 - 300,000,000Capital 1,560,000,160 12,258,000,800 1,560,000,160 12,058,000,800 50,000,008 800,000,080Fully paid cumulative redeemable preference shares 135,000,000 1,350,000,000 135,000,000 1,350,000,000 135,000,000 1,350,000,000Transfer to ordinary shares on redemption (65,000,000) (650,000,000) (45,000,000) (450,000,000) (30,000,000) (300,000,000)Preference shares 70,000,000 700,000,000 90,000,000 900,000,000 105,000,000 1,050,000,000
Stated capital 12,958,000,800 12,958,000,800 1,850,000,080
Company Group 2013 2012 2011 2013 2012 2011 Rs. Rs. Rs. Rs. Rs. Rs.
35. Statutory Reserve Fund
Opening balance at 1st April 565,142,012 354,776,240 225,785,756 659,361,626 379,912,608 229,549,552Transfers during the period 142,139,146 210,365,772 128,990,484 200,918,650 279,449,018 150,363,056Closing balance at 31st March 707,281,158 565,142,012 354,776,240 860,280,276 659,361,626 379,912,608
People’s Leasing & Finance PLCIn accordance with the Finance Companies (Capital Funds) Direction No.1 of 2003 issued by the Central Bank of Sri Lanka, 5% of the net profit for the year has been transferred to the Statutory Reserve Fund.
People’s Finance PLC In accordance with the Finance Companies (Capital Funds) Direction No.1 of 2003 issued by the Central Bank of Sri Lanka, 20% of the net profit for the year has been transferred to the Statutory Reserve Fund.
Notes to the Financial Statements contd.

235Encompassing Our DiversityPeople’s Leasing & Finance PLCAnnual Report 2012/13
Overview | Corporate Stewardship | Operational Review | Corporate Governance | Financial Information | Additional Information Overview | Corporate Stewardship | Operational Review | Corporate Governance | Financial Information | Additional Information
Company Group 2013 2012 2011 2013 2012 2011 Rs. Rs. Rs. Rs. Rs. Rs.
36. Retained Earnings
Opening balance at 1st April 3,360,177,586 6,755,997,457 4,743,052,140 3,443,771,661 6,660,556,321 4,684,863,770Profit for the year 2,842,782,929 2,574,836,811 2,579,809,680 3,077,070,789 2,852,340,612 2,590,216,640Less:Transfers to other reserves 430,384,032 656,991,363 199,628,049 509,476,018 752,000,783 221,000,621Dividend 1,950,000,200 855,000,080 267,236,314 1,950,000,200 855,000,080 289,949,953Disposal of changes in holding - - - 17,833,542 - -Redemption of preference shares 200,000,000 150,000,000 100,000,000 200,000,000 150,000,000 100,000,000Share issue expenses - 220,665,239 - - 224,124,409 3,573,515Capitalisation of reserves - 4,088,000,000 - - 4,088,000,000 -Closing balance at 31st March 3,622,576,283 3,360,177,586 6,755,997,457 3,843,532,690 3,443,771,661 6,660,556,321
37. Other Reservesa. Company - Current year (2012/2013)
Opening Closing balance at Movement/ balance at 01.04.2012 transfers 31.03.2013 Rs. Rs. Rs.
General reserve 300,000,000 - 300,000,000Tax equalization reserve fund 100,000,000 - 100,000,000Investment fund reserve 517,263,156 288,244,886 805,508,042Available for sale reserve (91,382,167) (29,608,005) (120,990,172)Total 825,880,989 258,636,881 1,084,517,870
b. Company - Previous year (2011/2012)
Opening Closing balance at Movement/ balance at 01.04.2011 transfers 31.03.2012 Rs. Rs. Rs.
General reserve 300,000,000 - 300,000,000Tax equalization reserve fund 100,000,000 - 100,000,000Investment fund reserve 70,637,565 446,625,591 517,263,156Available for sale reserve (23,860,224) (67,521,943) (91,382,167)Total 446,777,341 379,103,648 825,880,989

236 Encompassing Our DiversityPeople’s Leasing & Finance PLC
Annual Report 2012/13
Overview | Corporate Stewardship | Operational Review | Corporate Governance | Financial Information | Additional Information
37. Other Reserves contd.
c. Group - Current year (2012/2013)
Opening Closing balance at Movement/ balance at 01.04.2012 transfers 31.03.2013 Rs. Rs. Rs.
General reserve 300,000,000 - 300,000,000Tax equalization reserve fund 100,000,000 - 100,000,000Investment fund reserve 543,189,330 308,557,368 851,746,698Available-for-sale reserve (94,963,126) (24,347,380) (119,310,506)Total 848,226,204 284,209,988 1,132,436,192
d. Group - Previous year (2011/2012)
Opening Closing balance at Movement/ balance at 01.04.2011 transfers 31.03.2012 Rs. Rs. Rs.
General reserve 300,000,000 - 300,000,000Tax equalization reserve fund 100,000,000 - 100,000,000Investment fund reserve 70,637,565 472,551,765 543,189,330Available-for-sale reserve (24,058,591) (70,904,535) (94,963,126)Total 446,578,974 401,647,230 848,226,204
General ReserveGeneral Reserve represents the amounts set aside by the Directors for general application.
Tax Equalization Reserve FundTax equalization fund comprises an amount set aside by the Directors to meet any tax liabilities that may arise in the future.
Investment Fund ReserveThe reserve is created in accordance with the Central Bank guidelines issued to create an Investment Fund Reserve. 8% of the profits liable for VAT on Financial Services and 5% of the profits before tax calculated for payment of income taxes are transferred to this reserve when the payment of VAT on Financial Services and the self assessment payment of Income Tax for the period become due.
Notes to the Financial Statements contd.

237Encompassing Our DiversityPeople’s Leasing & Finance PLCAnnual Report 2012/13
Overview | Corporate Stewardship | Operational Review | Corporate Governance | Financial Information | Additional Information Overview | Corporate Stewardship | Operational Review | Corporate Governance | Financial Information | Additional Information
38. Non - Controlling Interest
Group 2013 2012 Rs. Rs.
Opening balance as at 1st April 207,534,262 99,766,344Profit applicable for the year 33,263,959 34,567,940Disposal and changes in holding (46,720,138) 82,988,787Less: Dividend paid 35,951,865 9,788,809Closing balance at 31st March 158,126,218 207,534,262
39. Contingent Liabilities and Commitments
Company Group 2013 2012 2011 2013 2012 2011 Rs. Rs. Rs. Rs. Rs. Rs.
Contingent liabilities (note 39.1) 1,794,154,540 352,378,937 302,470,326 1,803,104,540 56,286,766 302,470,326Commitments (note 39.2) 227,131,154 478,617,374 865,500,000 1,602,103,224 1,726,861,310 1,556,052,507Total 2,021,285,694 830,996,311 1,167,970,326 3,405,207,764 1,783,148,076 1,858,522,833
39.1 Contingent liabilities
In the normal course of business, the Group makes various irrecoverable commitments and incurs certain contingent liabilities with legal recourse to its customers and would be a party to litigation due to its operations. Even though these obligations may not be recognised in the Statement of Financial Position, They do contain operational risk and therefore form a part of the overall risk profile of the Group. However no material losses are anticipated as a result of these transactions.
Company Group 2013 2012 2011 2013 2012 2011 Rs. Rs. Rs. Rs. Rs. Rs.
Accidents of leased out vehicles 61,028,683 31,577,000 102,206,858 61,028,683 31,577,000 102,206,858Guarantees - Related parties 1,700,000,000 - - 1,700,000,000 - -Guarantees - Others - - - 8,950,000 9,550,000 -Pending bill retirements 33,125,857 320,801,937 200,263,468 33,125,857 15,159,766 200,263,468Total 1,794,154,540 352,378,937 302,470,326 1,803,104,540 56,286,766 302,470,326

238 Encompassing Our DiversityPeople’s Leasing & Finance PLC
Annual Report 2012/13
Overview | Corporate Stewardship | Operational Review | Corporate Governance | Financial Information | Additional Information
39.2 Commitments
The Group has Commitments for acquisition of property, plant and equipment and intangible assets incidental to the ordinary course of business as at 31st March as follows: Company Group 2013 2012 2011 2013 2012 2011 Rs. Rs. Rs. Rs. Rs. Rs.
Capital CommitmentsApproved and contracted for - - 42,342,839 481,768,413 708,243,936 298,518,876Approved but not contracted for 220,000,000 475,937,020 823,157,161 1,113,203,657 1,015,937,020 1,257,533,631 220,000,000 475,937,020 865,500,000 1,594,972,070 1,724,180,956 1,556,052,507
Un-utilised facilitiesMargin trading 7,131,154 2,680,354 - 7,131,154 2,680,354 - 7,131,154 2,680,354 - 7,131,154 2,680,354 -
Total 227,131,154 478,617,374 865,500,000 1,602,103,224 1,726,861,310 1,556,052,507
Company Group 2013 2012 2013 2012 Rs. Rs. Rs. Rs.
40. Non-Cash items included in Profit Before Tax
Depreciation of property, plant and equipment 146,940,716 128,979,863 243,394,386 208,712,785Amortisation of intangible assets 12,094,284 10,691,142 17,531,890 12,112,167Impairment losses on loans and advances 522,746,986 257,979,807 698,564,892 298,694,399Charge for defined benefit plans 17,170,984 11,065,694 19,228,900 12,330,537(Gain)/loss on foreign exchange 1,717,478 (599,861) 1,258,102 (599,861)Profit on sale of shares - (4,670,814) - (4,670,814)Gain/(loss) on sale of property, plant and equipment 5,987,162 (17,165,380) (53,780,897) (15,889,809)Gain/(loss) on equities (10,142,141) (590,426) (29,886,221) 17,965,032Total 696,515,469 385,690,025 896,311,052 528,654,436
Notes to the Financial Statements contd.

239Encompassing Our DiversityPeople’s Leasing & Finance PLCAnnual Report 2012/13
Overview | Corporate Stewardship | Operational Review | Corporate Governance | Financial Information | Additional Information Overview | Corporate Stewardship | Operational Review | Corporate Governance | Financial Information | Additional Information
Company Group 2013 2012 2013 2012 Rs. Rs. Rs. Rs.
41. Change in Operating Assets
Net increase in loans and receivable (4,684,411,531) (20,467,174,977) (4,645,920,616) (26,918,669,798)Net increase in reinsurance and insurance receivable - - (125,850,520) (47,697,637)Change in other assets 824,687,640 630,650,999 869,851,585 229,377,798Total (3,859,723,891) (19,836,523,978) (3,901,919,551) (26,736,989,637)
42. Change in Operating Liabilities
Change in deposits, asset back securities, short & long term loans and other financial liabilities (658,659,540) 12,814,184,589 (778,620,849) 19,486,682,880Net increase in insurance liabilities and reinsurance payable - - 420,387,536 1,164,795,181Change in other liabilities (48,154,727) 11,785,911 (43,386,306) 21,721,778Total (706,814,267) 12,825,970,500 (401,619,620) 20,673,199,839
240 Encompassing Our DiversityPeople’s Leasing & Finance PLC
Annual Report 2012/13
Overview | Corporate Stewardship | Operational Review | Corporate Governance | Financial Information | Additional Information
43. Related Party Disclosure
43.1 Parent and ultimate controlling party
The immediate Parent of the Company is People’s Bank which is a Government owned entity.
43.2 Transactions with Key Management Personnel (KMP) and their Family Members
As per the Lanka Accounting Standard (LKAS -24 ) - “Related Party Disclosures”, the KMPs include those who are having authority and responsibility for planning, directing and controlling the activities of the Company. Accordingly, the Board of Directors and members of the Corporate Management of the Company have been classified as KMPs of the Company.
43.2.1 Transactions with Key Management Personnel and their Close Family Members
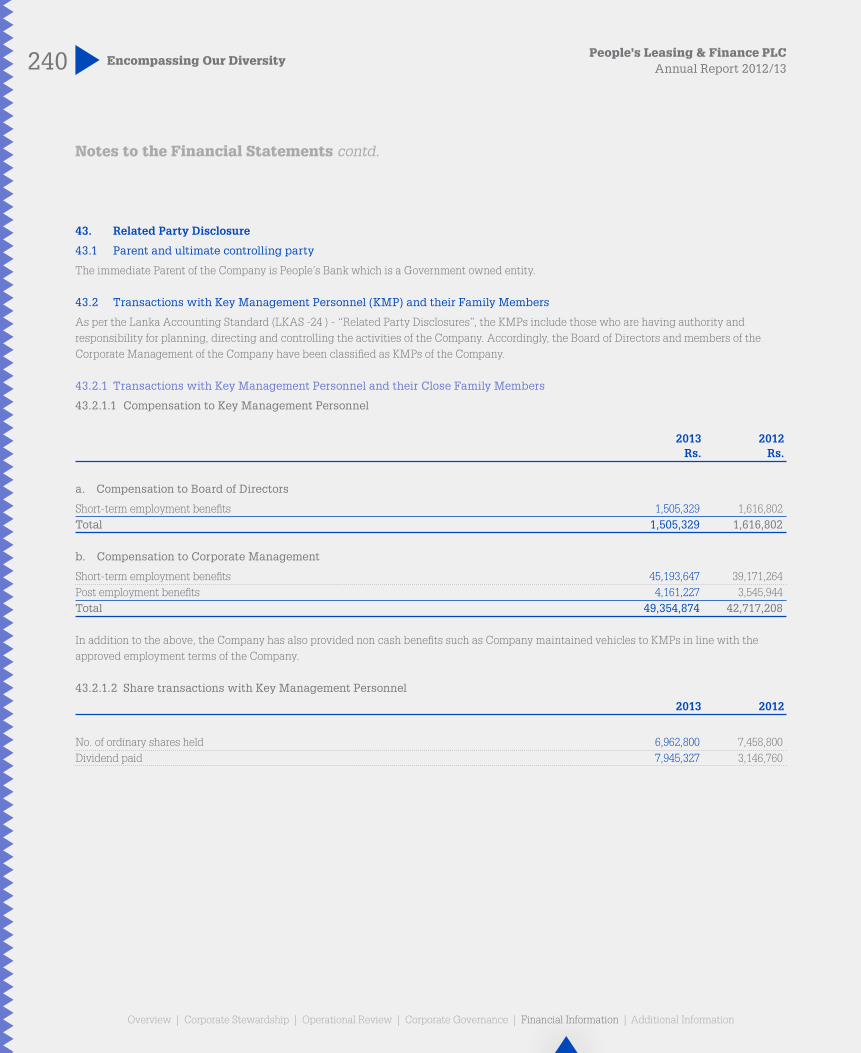
43.2.1.1 Compensation to Key Management Personnel
2013 2012 Rs. Rs.
a. Compensation to Board of Directors
Short-term employment benefits 1,505,329 1,616,802Total 1,505,329 1,616,802
b. Compensation to Corporate Management
Short-term employment benefits 45,193,647 39,171,264Post employment benefits 4,161,227 3,545,944Total 49,354,874 42,717,208
In addition to the above, the Company has also provided non cash benefits such as Company maintained vehicles to KMPs in line with the approved employment terms of the Company.
43.2.1.2 Share transactions with Key Management Personnel
2013 2012
No. of ordinary shares held 6,962,800 7,458,800Dividend paid 7,945,327 3,146,760
Notes to the Financial Statements contd.

241Encompassing Our DiversityPeople’s Leasing & Finance PLCAnnual Report 2012/13
Overview | Corporate Stewardship | Operational Review | Corporate Governance | Financial Information | Additional Information Overview | Corporate Stewardship | Operational Review | Corporate Governance | Financial Information | Additional Information
43.2.2 Transactions, arrangements and agreements involving Key Management Personnel (KMPs), their Close Family Members (CFMs) and other Related Entities
KMPs & CFMs 2013 2012 Rs. Rs.
a. Items in Income Statement
Interest expense 694,904 92,934
b. Items in Statement of Financial Position
LiabilitiesPromissory notes 3,502,529 2,980,015Fixed deposits 2,326,780 -Total 5,829,309 2,980,015
43.3 Transactions with Related Entities
43.3.1 Transactions with Government of Sri Lanka and Government Related entities
The immediate Parent of the Company is People’s Bank which is a Government owned entity. The Company enters into transactions, arrangements and agreements with Government of Sri Lanka and its related entities. The significant financial dealings during the year and as at the statement of financial position date are as follows,
Company Group 2013 2013 Rs. Rs.
a. Items in Income Statement
Interest income on lease facilities granted 2,906,307 11,939,506Interest income on loans granted 637,454 637,454Interest expense on loans obtained 7,682,870 20,157,668Interest expense on commercial paper issued 129,984,926 129,984,926 141,211,557 162,719,554
242 Encompassing Our DiversityPeople’s Leasing & Finance PLC
Annual Report 2012/13
Overview | Corporate Stewardship | Operational Review | Corporate Governance | Financial Information | Additional Information
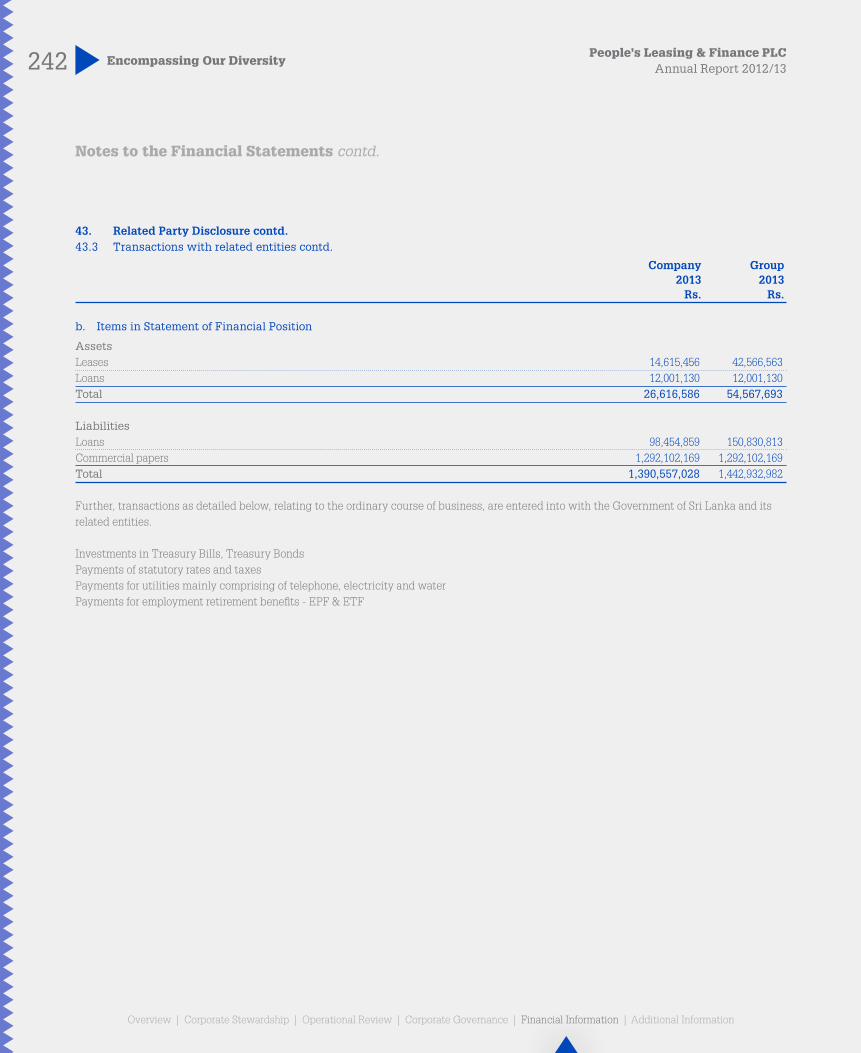
43. Related Party Disclosure contd.43.3 Transactions with related entities contd.
Company Group 2013 2013 Rs. Rs.
b. Items in Statement of Financial Position
AssetsLeases 14,615,456 42,566,563Loans 12,001,130 12,001,130Total 26,616,586 54,567,693
LiabilitiesLoans 98,454,859 150,830,813Commercial papers 1,292,102,169 1,292,102,169Total 1,390,557,028 1,442,932,982
Further, transactions as detailed below, relating to the ordinary course of business, are entered into with the Government of Sri Lanka and its related entities.
Investments in Treasury Bills, Treasury BondsPayments of statutory rates and taxesPayments for utilities mainly comprising of telephone, electricity and waterPayments for employment retirement benefits - EPF & ETF
Notes to the Financial Statements contd.

243Encompassing Our DiversityPeople’s Leasing & Finance PLCAnnual Report 2012/13
Overview | Corporate Stewardship | Operational Review | Corporate Governance | Financial Information | Additional Information Overview | Corporate Stewardship | Operational Review | Corporate Governance | Financial Information | Additional Information
43.3.2 Transactions with other related entities
43.3.2.1 Company
The Company had the undermentioned financial dealings during the financial year with the following related entities.
Immediate Parent Subsidiaries Affiliates 2013 2012 2013 2012 2013 2012 Rs. Rs. Rs. Rs. Rs. Rs.
a. Items in Income Statement
Interest expense on term loans & bank overdraft 808,073,405 627,116,855 74,314,972 129,853,854 - -Building rent expense 18,600,000 15,000,000 228,229,932 138,356,125 - -Shared fee income - - 83,765,369 53,277,368 - -Interest income on deposits 11,435,114 17,569,644 3,229,245 6,703,815 - -Interest income on repo investments 38,767,268 7,784,948 - - - -Dividend income - - 330,288,786 67,920,787 - -Expense on vehicle services & hiring - - 37,930,294 44,139,110 - -Insurance premium paid in respect of own policies - - 37,064,367 13,645,246 - -Insurance premium paid in respect of customers introduced by People’s Leasing & Finance PLC - - 2,242,328,174 1,593,548,750 - -Service charges received - - 246,851,436 160,185,250 - -Interest expense on commercial papers - - 4,133,013 - - -Agency commission income 168,045 5,783,816 - - - -Income on lease 32,896,777 38,777,430 - - - -
b. Items in Statement of Financial Position
Term loans & bank overdraft 4,724,028,459 6,506,711,214 99,624,175 259,598,681 - -Shared fee - - 1,474,944 473,932 - -Deposits 137,211,960 392,789,147 53,353,536 79,014,550 - -Repo investments 797,192,056 448,361,591 - - - -Vehicle hiring & service sales - - 2,928,490 - - -Amount due from - - 341,614,588 213,232,893 - -Insurance premium receivable in respect of own policies - - 108,493,218 86,561,257 - -Debentures - - 100,000,000 - - -Commercial papers - - 81,038,842 - - -Building rent 3,100,000 - - - - -Agency commission - 231,817 - - - -Lease rental 193,170,564 314,403,794 - - - -Investment in shares - - 3,182,687,562 3,118,184,304 205,160,064 205,160,064
c. Off- Balance Sheet Items
Guarantees - - 1,700,000,000 - - -

244 Encompassing Our DiversityPeople’s Leasing & Finance PLC
Annual Report 2012/13
Overview | Corporate Stewardship | Operational Review | Corporate Governance | Financial Information | Additional Information
43. Related Party Disclosure contd.43.3 Transactions with related entities contd.
43.3.2.2 Group
The Group had the undermentioned financial dealings during the financial year with the following related entities.
Immediate Parent Affiliates 2013 2012 2013 2012 Rs. Rs. Rs. Rs.
a. Items in Income Statement
Interest expense on term loans & bank overdraft 808,073,405 627,116,855 - -Building rent income 49,285,710 33,515,471 - -Interest income on deposits 11,435,114 17,569,644 - -Interest income on treasury investments 72,370,420 24,128,483 - -Income on vehicle hiring & service sales 48,754,165 36,875,721 - -Service charges paid 84,244,436 34,322,220 - -Agency commission income 168,045 5,783,816 - -Income on lease 32,896,777 38,777,430 - -Building project income 26,929,342 8,988,234 - -
b. Items in Statement of Financial Position
Term loans & bank overdraft 4,724,028,459 6,506,711,214 - -Deposits 137,211,960 392,789,147 - -Treasury investments 1,208,913,343 819,395,650 - -Vehicle hiring & service sales 14,187,689 6,680,619 - -Amounts due from 222,927,911 247,770,344 - -Building rent 3,100,000 - - -Agency commission - 231,817 - -Lease rental 193,170,564 314,403,794 - -Investment in shares - - 205,160,064 205,160,064Building project 492,035,728 284,494,296 - -
c. Off-Balance Sheet Items
Guarantees 2,500,000 - - -Undrawn facilities 50,000,000 - - -
Notes to the Financial Statements contd.

245Encompassing Our DiversityPeople’s Leasing & Finance PLCAnnual Report 2012/13
Overview | Corporate Stewardship | Operational Review | Corporate Governance | Financial Information | Additional Information Overview | Corporate Stewardship | Operational Review | Corporate Governance | Financial Information | Additional Information
43.3.3 Net accommodation as a % of capital funds
2013 2012
People’s Bank 1.15% 2.10%People’s Finance PLC 0.01% 0.02%People’s Leasing Fleet Management Ltd 0.61% 1.07%People’s Leasing Property Development Ltd 2.02% 1.41%People’s Insurance Ltd 0.65% 0.58%People’s Microfinance Ltd 0.59% 0.00%People’s Leasing Havelock Properties Ltd 0.00% 0.00%
44. Fair Value of Financial Instruments
Financial instruments recorded at fair value
The following is a description of how fair values are determined for financial instruments that are recorded at fair value using valuation techniques. These incorporate the Group’s estimate of assumptions that a market participant would make when valuing the instruments.
Financial investments – Available for sale
Available for sale financial assets valued using valuation techniques or pricing models primarily consist of quoted investment securities. These quoted investment securities are valued using quoted market price in an active market of each security.
Financial assets at fair value through profit or loss - Held for trading
Held for trading financial assets valued using valuation techniques primarily consist of quoted investments. These quoted assets are valued using quoted market price in an active market of each security.
Determination of fair value and fair value hierarchy
The Group uses the following hierarchy for determining and disclosing the fair value of financial instruments by valuation technique:
Level 1: quoted (unadjusted) prices in active markets for identical assets or liabilities.
Level 2: other techniques for which all inputs which have a significant effect on the recorded fair value are observable, either directly or indirectly.
Level 3: techniques which use inputs that have a significant effect on the recorded fair value that are not based on observable market data.
246 Encompassing Our DiversityPeople’s Leasing & Finance PLC
Annual Report 2012/13
Overview | Corporate Stewardship | Operational Review | Corporate Governance | Financial Information | Additional Information
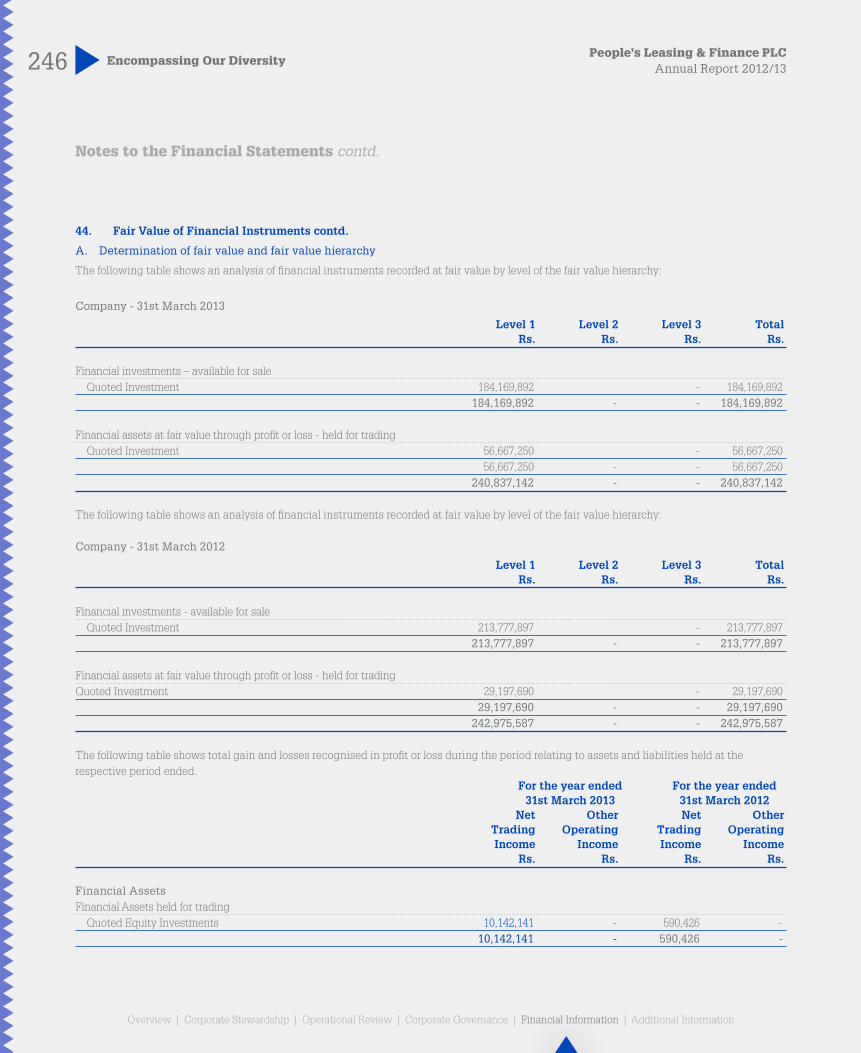
44. Fair Value of Financial Instruments contd.
A. Determination of fair value and fair value hierarchy
The following table shows an analysis of financial instruments recorded at fair value by level of the fair value hierarchy:
Company - 31st March 2013
Level 1 Level 2 Level 3 Total Rs. Rs. Rs. Rs.
Financial investments – available for sale Quoted Investment 184,169,892 - 184,169,892 184,169,892 - - 184,169,892
Financial assets at fair value through profit or loss - held for trading Quoted Investment 56,667,250 - 56,667,250 56,667,250 - - 56,667,250 240,837,142 - - 240,837,142
The following table shows an analysis of financial instruments recorded at fair value by level of the fair value hierarchy:
Company - 31st March 2012
Level 1 Level 2 Level 3 Total Rs. Rs. Rs. Rs.
Financial investments - available for sale Quoted Investment 213,777,897 - 213,777,897 213,777,897 - - 213,777,897
Financial assets at fair value through profit or loss - held for tradingQuoted Investment 29,197,690 - 29,197,690 29,197,690 - - 29,197,690 242,975,587 - - 242,975,587
The following table shows total gain and losses recognised in profit or loss during the period relating to assets and liabilities held at the respective period ended. For the year ended For the year ended 31st March 2013 31st March 2012 Net Other Net Other Trading Operating Trading Operating Income Income Income Income Rs. Rs. Rs. Rs.
Financial AssetsFinancial Assets held for trading Quoted Equity Investments 10,142,141 - 590,426 - 10,142,141 - 590,426 -
Notes to the Financial Statements contd.

247Encompassing Our DiversityPeople’s Leasing & Finance PLCAnnual Report 2012/13
Overview | Corporate Stewardship | Operational Review | Corporate Governance | Financial Information | Additional Information Overview | Corporate Stewardship | Operational Review | Corporate Governance | Financial Information | Additional Information
The following table shows an analysis of financial instruments recorded at fair value by level of the fair value hierarchy:
Group - 31st March 2013
Level 1 Level 2 Level 3 Total Rs. Rs. Rs. Rs.
Financial investments – Available for sale Quoted investment 184,169,892 - - 184,169,892 Treasury bills 989,687,593 - - 989,687,593 1,173,857,485 - - 1,173,857,485
Financial assets at fair value through profit or loss - Held For Trading Quoted investment 237,603,467 - - 237,603,467 237,603,467 - - 237,603,467 1,411,460,952 - - 1,411,460,952
The following table shows an analysis of financial instruments recorded at fair value by level of the fair value hierarchy:
Group - 31st March 2012
Level 1 Level 2 Level 3 Total Rs. Rs. Rs. Rs.
Financial investments – Available for sale Quoted investment 213,777,897 - - 213,777,897 Treasury bills 913,076,233 - - 913,076,233 1,126,854,130 - - 1,126,854,130
Financial assets at fair value through profit or loss - Held For Trading Quoted Investment 111,752,947 - - 111,752,947 111,752,947 - - 111,752,947 1,238,607,077 - - 1,238,607,077
The following table shows total gain and losses recognised in profit or loss during the period relating to assets and liabilities held at the respective period ended. For the year ended For the year ended 31st March 2013 31st March 2012 Net Other Net Other Trading Operating Trading Operating Income Income Income Income Rs. Rs. Rs. Rs.
Financial AssetsFinancial Assets held for trading Quoted Equity Investments 29,886,221 - (17,965,032) - 29,886,221 - (17,965,032) -

248 Encompassing Our DiversityPeople’s Leasing & Finance PLC
Annual Report 2012/13
Overview | Corporate Stewardship | Operational Review | Corporate Governance | Financial Information | Additional Information
A. Determination of fair value and fair value hierarchy contd.
Company
Set out below is a comparison, by class, of the carrying amount and fair values of the Company's financial instruments that are not carried at fair value in the financial statements. This table does not include the fair value of non-financial assets and non-financial liabilities.
31st March 2013 31st March 2012 Carrying Fair Carrying Fair amount value amount value Rs. Rs. Rs. Rs.
Financial AssetsCash in hand 209,573,206 209,573,206 68,863,195 68,863,195Securities purchase under resale agreement 797,192,056 797,192,056 448,361,591 448,361,591Balances with banks & financial institutions 2,394,567,982 2,394,567,982 1,213,236,620 1,213,236,620Loans and receivables 75,722,681,640 69,600,367,026 71,288,742,448 62,044,057,144 79,124,014,884 73,001,700,270 73,019,203,854 63,774,518,550
Financial LiabilitiesOverdraft 774,688,112 774,688,112 2,073,089,207 2,073,089,207Short term loans 22,921,160,664 23,110,386,776 27,009,083,944 26,901,920,366Debentures 7,882,843,130 7,465,624,704 2,014,929,988 1,900,989,165Long term loans 10,878,434,017 9,861,097,257 13,354,556,605 11,892,402,873Asset backed securities 12,202,921,982 10,066,046,435 13,356,320,359 12,684,979,213Deposits 6,830,482,112 6,272,560,938 - -Redeemable preference shares 724,791,667 917,439,125 931,875,000 702,556,256Creditors and accrued expenses 2,845,086,563 2,845,086,563 2,244,376,086 2,244,376,086Related party payables - - 1,457,332 1,457,332 65,060,408,247 61,312,929,910 60,985,688,521 58,401,770,498
Notes to the Financial Statements contd.

249Encompassing Our DiversityPeople’s Leasing & Finance PLCAnnual Report 2012/13
Overview | Corporate Stewardship | Operational Review | Corporate Governance | Financial Information | Additional Information Overview | Corporate Stewardship | Operational Review | Corporate Governance | Financial Information | Additional Information
Group
Set out below is a comparison, by class, of the carrying amount and fair values of the Group's financial instruments that are not carried at fair value in the financial statements. This table does not include the fair value of non-financial assets and non-financial liabilities.
31st March 2013 31st March 2012 Carrying Fair Carrying Fair amount value amount value Rs. Rs. Rs. Rs.
Financial AssetsCash in hand 519,724,085 519,724,085 451,048,417 451,048,417Securities purchase under resale agreement 1,934,309,720 1,934,309,720 1,246,294,703 1,246,294,703Balances with banks & financial institutions 3,743,516,459 3,743,516,459 1,892,169,898 1,892,169,898Loans and receivables 88,298,471,245 81,909,911,282 83,935,185,352 74,176,176,339Financial investments – Held-to-maturity 539,765,951 542,234,503 649,982,449 667,582,755 95,035,787,460 88,649,696,049 88,174,680,819 78,433,272,112
Financial LiabilitiesOverdraft 960,786,766 960,786,766 2,308,921,888 2,308,921,888 Short term loans 23,662,540,664 23,850,353,214 27,010,311,108 27,961,212,746 Debentures 7,782,843,130 7,465,624,704 2,014,929,988 2,082,056,872 Long term loans 12,211,617,212 9,913,848,750 15,563,869,236 11,892,402,873 Asset backed securities 12,202,921,982 10,066,046,435 13,356,320,359 12,684,979,213 Deposits 18,709,869,092 18,315,486,858 11,307,887,149 11,345,143,480 Redeemable preference shares 724,791,667 917,439,125 931,875,000 702,556,256 Creditors and accrued expenses 3,042,544,461 2,845,086,563 2,676,461,343 2,244,376,087 79,297,914,974 74,334,672,415 75,170,576,071 71,221,649,415
Fair value of financial assets and liabilities not carried at fair valueThe following describes the methodologies and assumptions used to determine fair values for those financial instruments which are not already recorded at fair value in the financial statements:
Assets for which fair value approximates carrying valueFor financial assets and financial liabilities that have a short term maturity (less than three months) it is assumed that the carrying amounts approximate their fair value. This assumption is also applied to demand deposits, and savings accounts without a specific maturity.
Fixed rate financial instrumentsCarrying amounts are considered as fair value for short term credit facilities. Loans & receivables with fixed interest rates were fair valued using market rates at which fresh loans were granted during the fourth quarter of the reporting year. Conversely short term loans, long term loans asset back securities and deposits with original tenors above one year and interest paid at maturity discounted using current market interest rates offered to customers and offered by lenders during the fourth quarter of the reporting period.
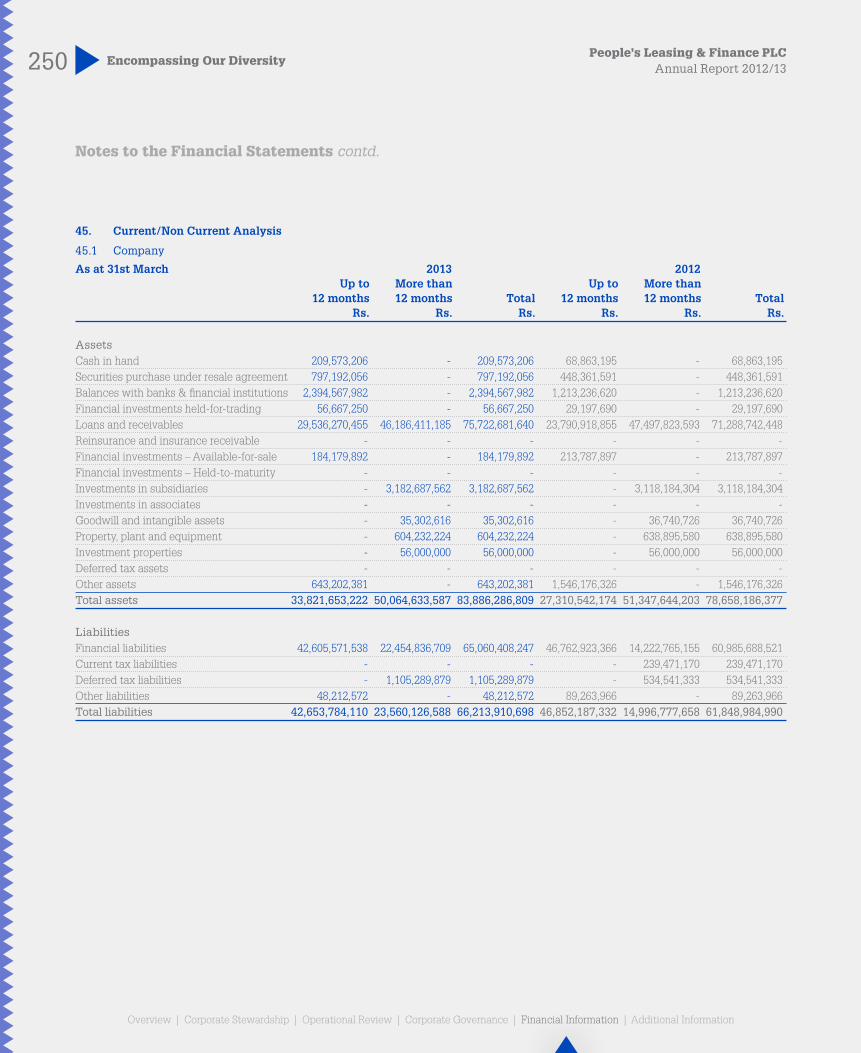
250 Encompassing Our DiversityPeople’s Leasing & Finance PLC
Annual Report 2012/13
Overview | Corporate Stewardship | Operational Review | Corporate Governance | Financial Information | Additional Information
45. Current/Non Current Analysis
45.1 Company
As at 31st March 2013 2012 Up to More than Up to More than 12 months 12 months Total 12 months 12 months Total Rs. Rs. Rs. Rs. Rs. Rs.
AssetsCash in hand 209,573,206 - 209,573,206 68,863,195 - 68,863,195Securities purchase under resale agreement 797,192,056 - 797,192,056 448,361,591 - 448,361,591Balances with banks & financial institutions 2,394,567,982 - 2,394,567,982 1,213,236,620 - 1,213,236,620Financial investments held-for-trading 56,667,250 - 56,667,250 29,197,690 - 29,197,690Loans and receivables 29,536,270,455 46,186,411,185 75,722,681,640 23,790,918,855 47,497,823,593 71,288,742,448Reinsurance and insurance receivable - - - - - -Financial investments – Available-for-sale 184,179,892 - 184,179,892 213,787,897 - 213,787,897Financial investments – Held-to-maturity - - - - - -Investments in subsidiaries - 3,182,687,562 3,182,687,562 - 3,118,184,304 3,118,184,304Investments in associates - - - - - -Goodwill and intangible assets - 35,302,616 35,302,616 - 36,740,726 36,740,726Property, plant and equipment - 604,232,224 604,232,224 - 638,895,580 638,895,580Investment properties - 56,000,000 56,000,000 - 56,000,000 56,000,000Deferred tax assets - - - - - -Other assets 643,202,381 - 643,202,381 1,546,176,326 - 1,546,176,326Total assets 33,821,653,222 50,064,633,587 83,886,286,809 27,310,542,174 51,347,644,203 78,658,186,377
LiabilitiesFinancial liabilities 42,605,571,538 22,454,836,709 65,060,408,247 46,762,923,366 14,222,765,155 60,985,688,521Current tax liabilities - - - - 239,471,170 239,471,170Deferred tax liabilities - 1,105,289,879 1,105,289,879 - 534,541,333 534,541,333Other liabilities 48,212,572 - 48,212,572 89,263,966 - 89,263,966Total liabilities 42,653,784,110 23,560,126,588 66,213,910,698 46,852,187,332 14,996,777,658 61,848,984,990
Notes to the Financial Statements contd.
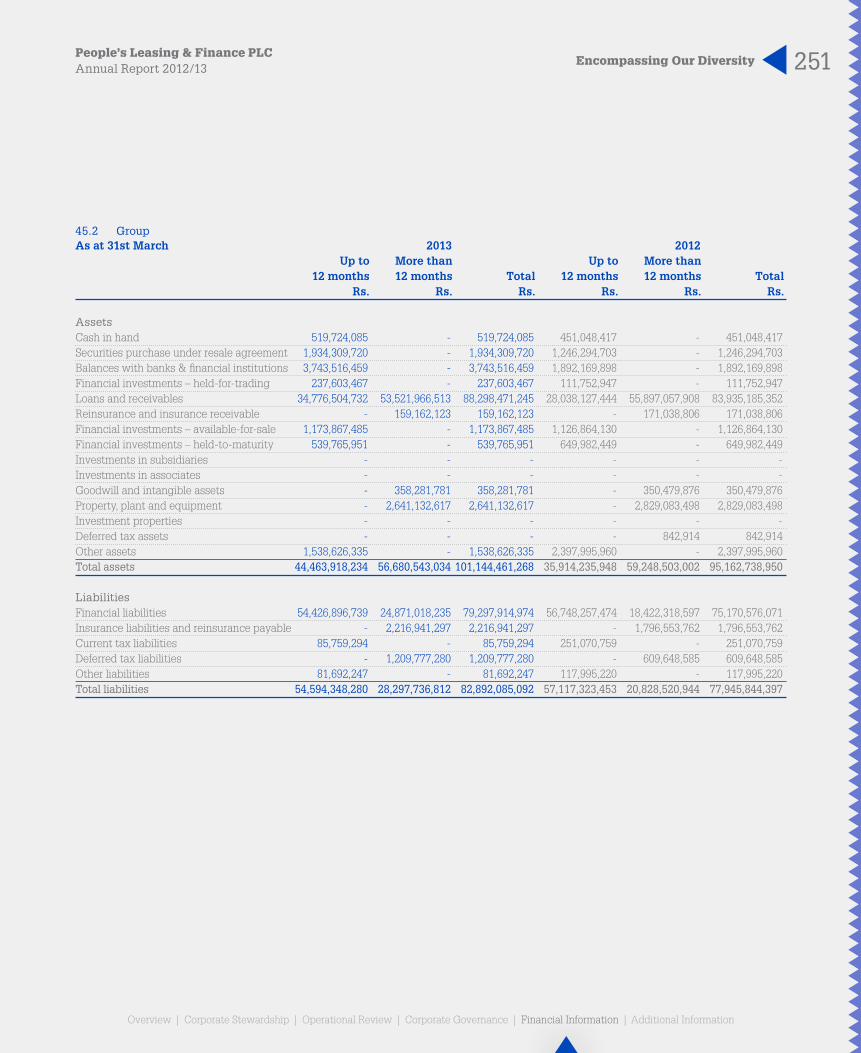
251Encompassing Our DiversityPeople’s Leasing & Finance PLCAnnual Report 2012/13
Overview | Corporate Stewardship | Operational Review | Corporate Governance | Financial Information | Additional Information Overview | Corporate Stewardship | Operational Review | Corporate Governance | Financial Information | Additional Information
45.2 GroupAs at 31st March 2013 2012 Up to More than Up to More than 12 months 12 months Total 12 months 12 months Total Rs. Rs. Rs. Rs. Rs. Rs.
AssetsCash in hand 519,724,085 - 519,724,085 451,048,417 - 451,048,417Securities purchase under resale agreement 1,934,309,720 - 1,934,309,720 1,246,294,703 - 1,246,294,703Balances with banks & financial institutions 3,743,516,459 - 3,743,516,459 1,892,169,898 - 1,892,169,898Financial investments – held-for-trading 237,603,467 - 237,603,467 111,752,947 - 111,752,947Loans and receivables 34,776,504,732 53,521,966,513 88,298,471,245 28,038,127,444 55,897,057,908 83,935,185,352Reinsurance and insurance receivable - 159,162,123 159,162,123 - 171,038,806 171,038,806Financial investments – available-for-sale 1,173,867,485 - 1,173,867,485 1,126,864,130 - 1,126,864,130Financial investments – held-to-maturity 539,765,951 - 539,765,951 649,982,449 - 649,982,449Investments in subsidiaries - - - - - -Investments in associates - - - - - -Goodwill and intangible assets - 358,281,781 358,281,781 - 350,479,876 350,479,876Property, plant and equipment - 2,641,132,617 2,641,132,617 - 2,829,083,498 2,829,083,498Investment properties - - - - - -Deferred tax assets - - - - 842,914 842,914Other assets 1,538,626,335 - 1,538,626,335 2,397,995,960 - 2,397,995,960Total assets 44,463,918,234 56,680,543,034 101,144,461,268 35,914,235,948 59,248,503,002 95,162,738,950
LiabilitiesFinancial liabilities 54,426,896,739 24,871,018,235 79,297,914,974 56,748,257,474 18,422,318,597 75,170,576,071Insurance liabilities and reinsurance payable - 2,216,941,297 2,216,941,297 - 1,796,553,762 1,796,553,762Current tax liabilities 85,759,294 - 85,759,294 251,070,759 - 251,070,759Deferred tax liabilities - 1,209,777,280 1,209,777,280 - 609,648,585 609,648,585Other liabilities 81,692,247 - 81,692,247 117,995,220 - 117,995,220Total liabilities 54,594,348,280 28,297,736,812 82,892,085,092 57,117,323,453 20,828,520,944 77,945,844,397

252 Encompassing Our DiversityPeople’s Leasing & Finance PLC
Annual Report 2012/13
Overview | Corporate Stewardship | Operational Review | Corporate Governance | Financial Information | Additional Information
46. Financial Reporting by Segment
As per the provision of Sri Lanka Financial Reporting Standard (SLFRS) 8, the operating segment of the Group has been identified based on the product and services offered by the group of which level of risk and rewards are significantly different from one another.
Top management of the Group considers the operating results and condition of its business segments in their decision making process and performance evaluation.
Types of products and services from which each operating segment derives its revenues are described as follows.
Leasing and advancesThis segment includes Leasing, Hire Purchase, Ijarah, Murahba, Trading Murabha and Loan product offered to the customers.
Insurance businessInsurance business segment includes general insurance.
Other businessThis segment includes all other business activities that the Group engages in other than above two segments.
Lease & Advances Insurance Other Eliminations Group
2013 2012 2013 2012 2013 2012 2013 2012 2013 2012
RS. 000 RS. 000 RS. 000 RS. 000 RS. 000 RS. 000 RS. 000 RS. 000 RS. 000 RS. 000
Interest income 17,127,014,949 13,721,823,630 - - 470,395,734 302,477,403 (112,134,767) (141,907,096) 17,485,275,915 13,882,393,937
Net earned premiums - - 2,448,241,131 1,477,971,086 - - - - 2,448,241,131 1,477,971,086
Net fee and commission income 688,952,195 636,329,188 15,176,732 17,839,962 414,396,455 195,247,254 (601,308,807) (364,958,155) 517,216,575 484,458,248
Net trading income - - - - 30,345,596 (17,965,032) - - 30,345,596 (17,965,032)
Other operating income 48,079,707 29,447,190 - - 613,090,352 398,642,803 (328,163,489) (119,443,155) 333,006,571 308,646,838
Total revenue 17,864,046,852 14,387,600,006 2,463,417,863 1,495,811,048 1,528,228,137 878,402,428 (1,041,607,063) (626,308,407) 20,814,085,788 16,135,505,077
Profit from operation 3,896,112,161 3,816,004,682 537,266,408 396,732,044 333,303,438 232,977,548 (227,172,375) (166,114,975) 4,539,509,632 4,279,599,300
Income tax expenses (1,429,174,884) (1,392,690,748)
Non-controlling interest (33,263,959) (34,567,940)
Profit attributable to equity holder 3,077,070,789 2,852,340,612
Segment Assets 99,585,309,508 93,989,465,565 3,418,942,380 2,590,449,761 2,593,100,417 2,477,106,644 (4,452,891,037) (3,894,283,020) 101,144,461,268 95,162,738,950
Total Assets 99,585,309,508 93,989,465,565 3,418,942,380 2,590,449,761 2,593,100,417 2,477,106,644 (4,452,891,037) (3,894,283,020) 101,144,461,268 95,162,738,950
Segment Liabilities 80,067,338,478 75,290,141,582 2,555,640,143 1,954,835,694 1,635,444,608 1,616,891,812 (1,366,338,137) (916,024,691) 82,892,085,092 77,945,844,397
Total Liability 80,067,338,478 75,290,141,582 2,555,640,143 1,954,835,694 1,635,444,608 1,616,891,812 (1,366,338,137) (916,024,691) 82,892,085,092 77,945,844,397
Notes to the Financial Statements contd.
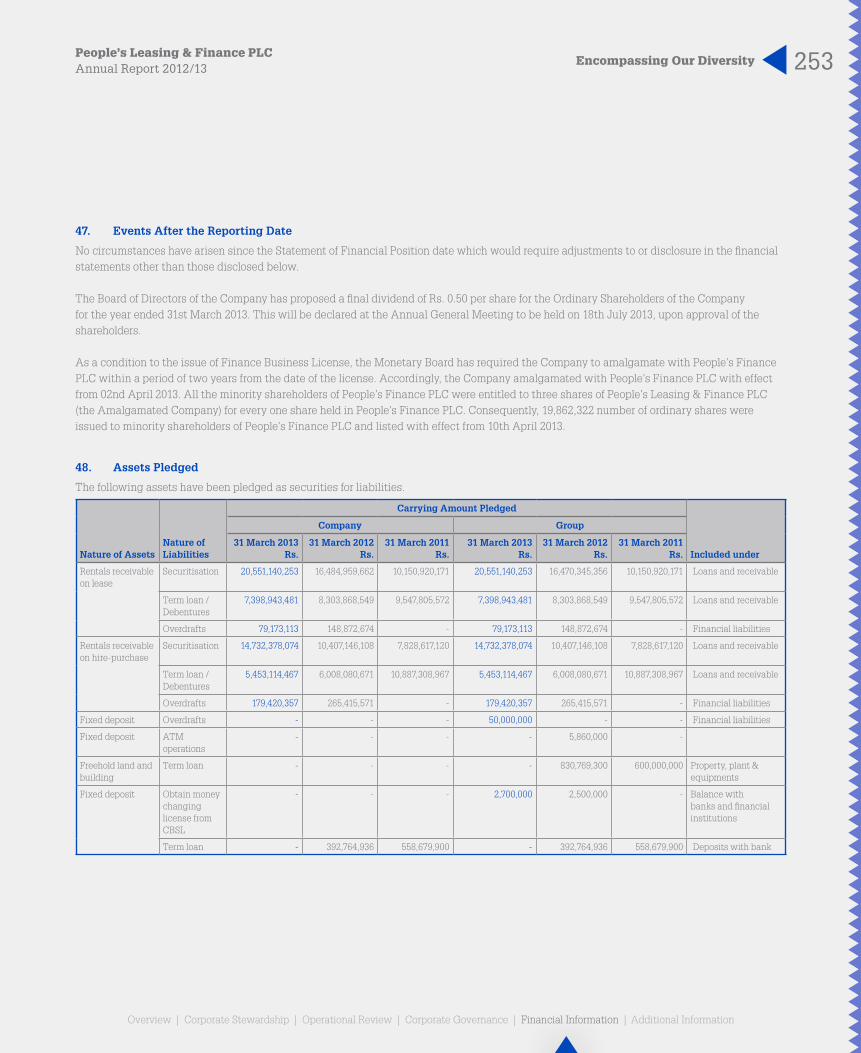
253Encompassing Our DiversityPeople’s Leasing & Finance PLCAnnual Report 2012/13
Overview | Corporate Stewardship | Operational Review | Corporate Governance | Financial Information | Additional Information Overview | Corporate Stewardship | Operational Review | Corporate Governance | Financial Information | Additional Information
47. Events After the Reporting Date
No circumstances have arisen since the Statement of Financial Position date which would require adjustments to or disclosure in the financial statements other than those disclosed below.
The Board of Directors of the Company has proposed a final dividend of Rs. 0.50 per share for the Ordinary Shareholders of the Company for the year ended 31st March 2013. This will be declared at the Annual General Meeting to be held on 18th July 2013, upon approval of the shareholders.
As a condition to the issue of Finance Business License, the Monetary Board has required the Company to amalgamate with People’s Finance PLC within a period of two years from the date of the license. Accordingly, the Company amalgamated with People’s Finance PLC with effect from 02nd April 2013. All the minority shareholders of People’s Finance PLC were entitled to three shares of People’s Leasing & Finance PLC (the Amalgamated Company) for every one share held in People’s Finance PLC. Consequently, 19,862,322 number of ordinary shares were issued to minority shareholders of People’s Finance PLC and listed with effect from 10th April 2013.
48. Assets Pledged
The following assets have been pledged as securities for liabilities.
Nature of Assets Nature of Liabilities
Carrying Amount Pledged
Included under
Company Group
31 March 2013Rs.
31 March 2012 Rs.
31 March 2011 Rs.
31 March 2013Rs.
31 March 2012 Rs.
31 March 2011 Rs.
Rentals receivable on lease
Securitisation 20,551,140,253 16,484,959,662 10,150,920,171 20,551,140,253 16,470,345,356 10,150,920,171 Loans and receivable
Term loan / Debentures
7,398,943,481 8,303,868,549 9,547,805,572 7,398,943,481 8,303,868,549 9,547,805,572 Loans and receivable
Overdrafts 79,173,113 148,872,674 - 79,173,113 148,872,674 - Financial liabilities
Rentals receivable on hire-purchase
Securitisation 14,732,378,074 10,407,146,108 7,828,617,120 14,732,378,074 10,407,146,108 7,828,617,120 Loans and receivable
Term loan / Debentures
5,453,114,467 6,008,080,671 10,887,308,967 5,453,114,467 6,008,080,671 10,887,308,967 Loans and receivable
Overdrafts 179,420,357 265,415,571 - 179,420,357 265,415,571 - Financial liabilities
Fixed deposit Overdrafts - - - 50,000,000 - - Financial liabilities
Fixed deposit ATM operations
- - - - 5,860,000 -
Freehold land and building
Term loan - - - - 830,769,300 600,000,000 Property, plant & equipments
Fixed deposit Obtain money changing license from CBSL
- - - 2,700,000 2,500,000 - Balance with banks and financial institutions
Term loan - 392,764,936 558,679,900 - 392,764,936 558,679,900 Deposits with bank

254 Encompassing Our DiversityPeople’s Leasing & Finance PLC
Annual Report 2012/13
Overview | Corporate Stewardship | Operational Review | Corporate Governance | Financial Information | Additional Information
49. Risk Management
49.1 Introduction
Risk is inherent in the Company’s activities, but is managed through a process of ongoing identification, measurement and monitoring, subject to risk limits and other controls. This process of risk management is critical to the Company’s continuing profitability and each individual within the Company is accountable for the risk exposures relating to his or her responsibilities. The Company is primarily exposed to credit risk, liquidity risk and market risk. It is also subject to various operating risks.
Risk management structure
The Board of Directors is responsible for the overall risk management approach and for approving the risk management strategies and principles.
The Board has appointed a sub committee, Integrated Risk Management (IRM) Committee, which has the responsibility to monitor the overall risk process within the Company.
The IRM Committee has the overall responsibility for the development of the risk strategy and implementing principles, frameworks, policies and limits. The IRM Committee is responsible for managing risk decisions and monitoring risk levels and reports on a periodical basis to the Board.
The Risk Management & Control Unit is responsible for monitoring compliance with risk principles, policies and limits across the Company.
49.2 Credit risk
Credit risk is the risk that the Company will incur a loss because its customers or counterparties fail to discharge their contractual obligations. The Company manages and controls credit risk by setting limits on the amount of risk it is willing to accept for individual counterparties and group and by monitoring exposures in relation to such limits.
Impairment assessment
For accounting purposes, the Company uses a collective and individual model for the recognition of losses on impaired financial assets.
Individually assessed allowances
The Company determines the allowances appropriate for each individually significant leases, hire purchase and loans on an individual basis, including any overdue payments of interests or credit rating downgrades. Factors considered when determining allowance amounts include the sustainability of the counterparty’s business plan, its ability to improve performance in a financial difficulty, projected receipts and the availability of other financial support, the realisable value of collateral and the timing of the expected cash flows. Impairment allowances are evaluated at each reporting date.
Collectively assessed allowances
Allowances are assessed collectively for losses on leases, hire purchase and loans and for held to maturity debt investments that are not individually significant and for individually significant loans and advances that have been assessed individually and found not to be impaired.
The Company generally bases its analysis on historical experience. However, when there are significant market developments, regional and/or global, the Company would include macro-economic factors within its assessments. These factors include, depending on the characteristics of the individual or collective assessment: unemployment rates, current levels of bad debts, changes in laws, changes in regulations, bankruptcy trends, and other consumer data. The Company may use the aforementioned factors as appropriate to adjust the impairment allowances.
Allowances are evaluated separately at each reporting date with each portfolio.
Notes to the Financial Statements contd.
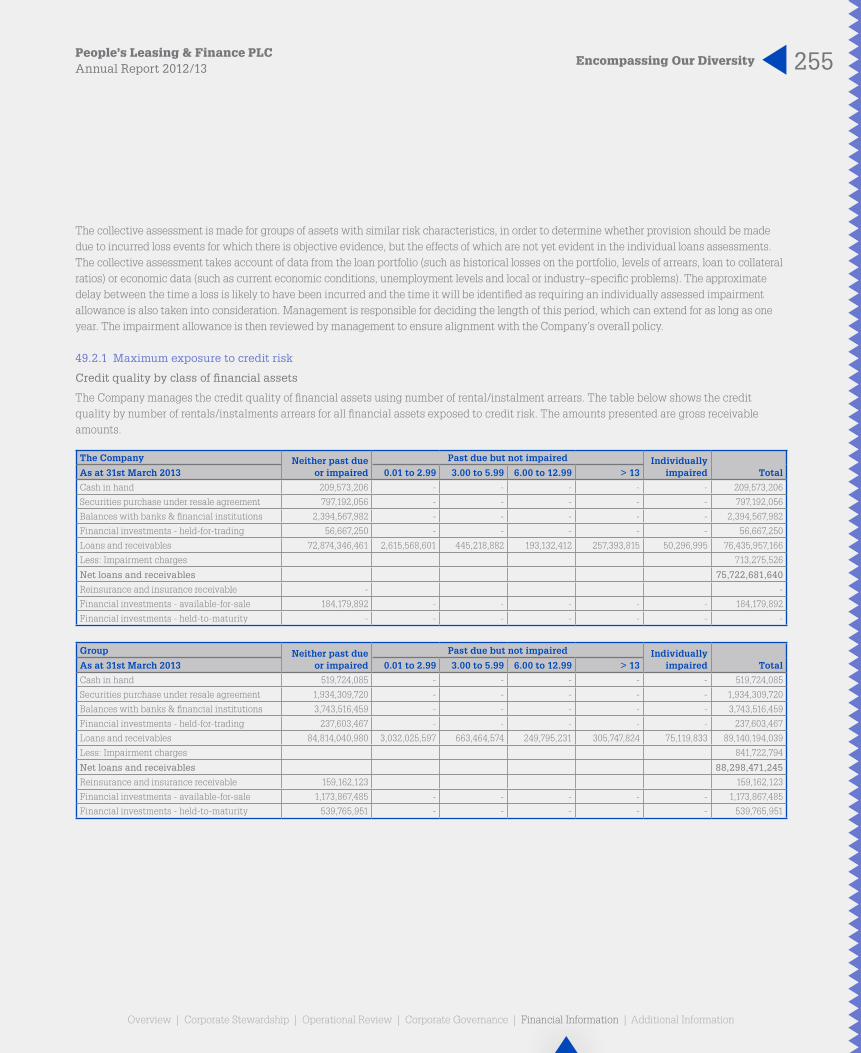
255Encompassing Our DiversityPeople’s Leasing & Finance PLCAnnual Report 2012/13
Overview | Corporate Stewardship | Operational Review | Corporate Governance | Financial Information | Additional Information Overview | Corporate Stewardship | Operational Review | Corporate Governance | Financial Information | Additional Information
The collective assessment is made for groups of assets with similar risk characteristics, in order to determine whether provision should be made due to incurred loss events for which there is objective evidence, but the effects of which are not yet evident in the individual loans assessments. The collective assessment takes account of data from the loan portfolio (such as historical losses on the portfolio, levels of arrears, loan to collateral ratios) or economic data (such as current economic conditions, unemployment levels and local or industry–specific problems). The approximate delay between the time a loss is likely to have been incurred and the time it will be identified as requiring an individually assessed impairment allowance is also taken into consideration. Management is responsible for deciding the length of this period, which can extend for as long as one year. The impairment allowance is then reviewed by management to ensure alignment with the Company’s overall policy.
49.2.1 Maximum exposure to credit risk
Credit quality by class of financial assets
The Company manages the credit quality of financial assets using number of rental/instalment arrears. The table below shows the credit quality by number of rentals/instalments arrears for all financial assets exposed to credit risk. The amounts presented are gross receivable amounts.
The Company Neither past due or impaired
Past due but not impaired Individually impaired TotalAs at 31st March 2013 0.01 to 2.99 3.00 to 5.99 6.00 to 12.99 > 13
Cash in hand 209,573,206 - - - - - 209,573,206
Securities purchase under resale agreement 797,192,056 - - - - - 797,192,056
Balances with banks & financial institutions 2,394,567,982 - - - - - 2,394,567,982
Financial investments - held-for-trading 56,667,250 - - - - - 56,667,250
Loans and receivables 72,874,346,461 2,615,568,601 445,218,882 193,132,412 257,393,815 50,296,995 76,435,957,166
Less: Impairment charges 713,275,526
Net loans and receivables 75,722,681,640
Reinsurance and insurance receivable - -
Financial investments - available-for-sale 184,179,892 - - - - - 184,179,892
Financial investments - held-to-maturity - - - - - - -
Group Neither past due or impaired
Past due but not impaired Individually impaired TotalAs at 31st March 2013 0.01 to 2.99 3.00 to 5.99 6.00 to 12.99 > 13
Cash in hand 519,724,085 - - - - - 519,724,085
Securities purchase under resale agreement 1,934,309,720 - - - - - 1,934,309,720
Balances with banks & financial institutions 3,743,516,459 - - - - - 3,743,516,459
Financial investments - held-for-trading 237,603,467 - - - - - 237,603,467
Loans and receivables 84,814,040,980 3,032,025,597 663,464,574 249,795,231 305,747,824 75,119,833 89,140,194,039
Less: Impairment charges 841,722,794
Net loans and receivables 88,298,471,245
Reinsurance and insurance receivable 159,162,123 159,162,123
Financial investments - available-for-sale 1,173,867,485 - - - - - 1,173,867,485
Financial investments - held-to-maturity 539,765,951 - - - - - 539,765,951

256 Encompassing Our DiversityPeople’s Leasing & Finance PLC
Annual Report 2012/13
Overview | Corporate Stewardship | Operational Review | Corporate Governance | Financial Information | Additional Information
49.2.2 Analysis of risk concentration
The Company’s concentrations of risk are managed by client/counterparty, by industry sector. The maximum credit exposure to any client or counterparty as of 31 March 2013 was Rs.250.00 million, before taking account of collateral or other credit enhancements and Rs. 190 million net of such protection.
Industry analysis
The following table shows the risk concentration by industry for the components of the statement of financial position.
Company
31st March 2013 Financial Services Agriculture Manufacturing Tourism Transport Construction Traders Services Industry Others Total
Cash in hand 209,573,206 - - - - - - - - - 209,573,206
Securities purchase under resale agreement 797,192,056 - - - - - - - - - 797,192,056
Balances with Banks & financial institutions 2,394,567,982 - - - - - - - - - 2,394,567,982
Financial investments - held-for-trading 56,667,250 - - - - - - - - - 56,667,250
Loans and receivable 97,782,973 2,134,986,515 18,932,374 379,218,189 15,758,619,719 4,074,609,602 18,920,299,940 32,163,905,059 1,111,580,449 1,776,022,346 76,435,957,166
- Impairment charges - - - - - - - - - - (713,275,526)
Net loans and receivables - - - - - - - - - - 75,722,681,640
Reinsurance and insurance receivable - - - - - - - - - - -
Financial investments - available-for-sale 184,179,892 - - - - - - - - - 184,179,892
Financial investments - held-to-maturity - - - - - - - - - - -
Group
31st March 2013 Financial Services Agriculture Manufacturing Tourism Transport Construction Traders Services Industry Others Total
Cash in hand 519,724,085 - - - - - - - - - 519,724,085
Securities purchase under resale agreement 1,934,309,720 - - - - - - - - - 1,934,309,720
Balances with Banks & financial institutions 3,743,516,459 - - - - - - - - - 3,743,516,459
Financial investments - held-for-trading 161,834,690 - - - - - - - - 75,768,777 237,603,467
Loans and receivable - 2,555,809,481 148,013,172 402,751,992 16,828,852,637 3,907,800,119 23,392,803,804 35,563,629,581 1,159,096,376 5,181,436,877 89,140,194,039
- Impairment charges - - - - - - - - - - (841,722,794)
Net loans and receivables - - - - - - - - - - 88,298,471,245
Reinsurance and insurance receivable - - - - - - - - - 159,162,123 159,162,123
Financial investments - Available-for-sale 1,173,867,485 - - - - - - - - - 1,173,867,485
Financial investments - Held-to-maturity 539,765,950 - - - - - - - - - 539,765,951
Notes to the Financial Statements contd.

257Encompassing Our DiversityPeople’s Leasing & Finance PLCAnnual Report 2012/13
Overview | Corporate Stewardship | Operational Review | Corporate Governance | Financial Information | Additional Information Overview | Corporate Stewardship | Operational Review | Corporate Governance | Financial Information | Additional Information
49.2.2 Analysis of risk concentration
The Company’s concentrations of risk are managed by client/counterparty, by industry sector. The maximum credit exposure to any client or counterparty as of 31 March 2013 was Rs.250.00 million, before taking account of collateral or other credit enhancements and Rs. 190 million net of such protection.
Industry analysis
The following table shows the risk concentration by industry for the components of the statement of financial position.
Company
31st March 2013 Financial Services Agriculture Manufacturing Tourism Transport Construction Traders Services Industry Others Total
Cash in hand 209,573,206 - - - - - - - - - 209,573,206
Securities purchase under resale agreement 797,192,056 - - - - - - - - - 797,192,056
Balances with Banks & financial institutions 2,394,567,982 - - - - - - - - - 2,394,567,982
Financial investments - held-for-trading 56,667,250 - - - - - - - - - 56,667,250
Loans and receivable 97,782,973 2,134,986,515 18,932,374 379,218,189 15,758,619,719 4,074,609,602 18,920,299,940 32,163,905,059 1,111,580,449 1,776,022,346 76,435,957,166
- Impairment charges - - - - - - - - - - (713,275,526)
Net loans and receivables - - - - - - - - - - 75,722,681,640
Reinsurance and insurance receivable - - - - - - - - - - -
Financial investments - available-for-sale 184,179,892 - - - - - - - - - 184,179,892
Financial investments - held-to-maturity - - - - - - - - - - -
Group
31st March 2013 Financial Services Agriculture Manufacturing Tourism Transport Construction Traders Services Industry Others Total
Cash in hand 519,724,085 - - - - - - - - - 519,724,085
Securities purchase under resale agreement 1,934,309,720 - - - - - - - - - 1,934,309,720
Balances with Banks & financial institutions 3,743,516,459 - - - - - - - - - 3,743,516,459
Financial investments - held-for-trading 161,834,690 - - - - - - - - 75,768,777 237,603,467
Loans and receivable - 2,555,809,481 148,013,172 402,751,992 16,828,852,637 3,907,800,119 23,392,803,804 35,563,629,581 1,159,096,376 5,181,436,877 89,140,194,039
- Impairment charges - - - - - - - - - - (841,722,794)
Net loans and receivables - - - - - - - - - - 88,298,471,245
Reinsurance and insurance receivable - - - - - - - - - 159,162,123 159,162,123
Financial investments - Available-for-sale 1,173,867,485 - - - - - - - - - 1,173,867,485
Financial investments - Held-to-maturity 539,765,950 - - - - - - - - - 539,765,951

258 Encompassing Our DiversityPeople’s Leasing & Finance PLC
Annual Report 2012/13
Overview | Corporate Stewardship | Operational Review | Corporate Governance | Financial Information | Additional Information
49.3 Liquidity risk and funding management
Liquidity risk is defined as the risk that the Company will encounter difficulty in meeting obligations associated with financial liabilities that are settled by delivering cash or another financial asset. Liquidity risk arises because of the possibility that the Company might be unable to meet its payment obligations when they fall due under both normal and stressed circumstances. To limit this risk, management has arranged diversified funding sources in addition to its deposit base, and adopted a policy of managing assets with liquidity in mind and monitoring future cash flows and liquidity on a daily basis.
The Company maintains a portfolio of marketable and assets that are assumed to be liquidated in the event of an unforeseen interruption of cash flow. In addition, the Company maintains the liquid asset requirement with the Central Bank of Sri Lanka equal to 10 % of time deposits and certificate of deposits and 15% of savings deposits.
The Company stresses the importance of savings accounts as sources of funds to finance lending to customers. They are monitored using the advances to deposit ratio , which compares loans and advances to customers as a percentage of customer savings accounts and fixed deposits.
The ratios as at the end of the year were as follows:
Company - As at 31st March 2013
Liquidity ratios Company Group
Advances to deposit ratios (times) 10.97 4.69
Liquid assets to deposit (%) 50 36
49.3.1 Analysis of financial assets and liabilities by remaining contractual maturities
The table below summarises the maturity profile of the undiscounted cash flows of the Company’s financial assets and liabilities as at 31st March 2013.
Repayments which are subject to notice are treated as if notice were to be given immediately. However, the Company expects that many customers will not request repayment on the earliest date the Company could be required to pay and the table does not reflect the expected cash flows indicated by the Company’s deposit retention history.
Notes to the Financial Statements contd.
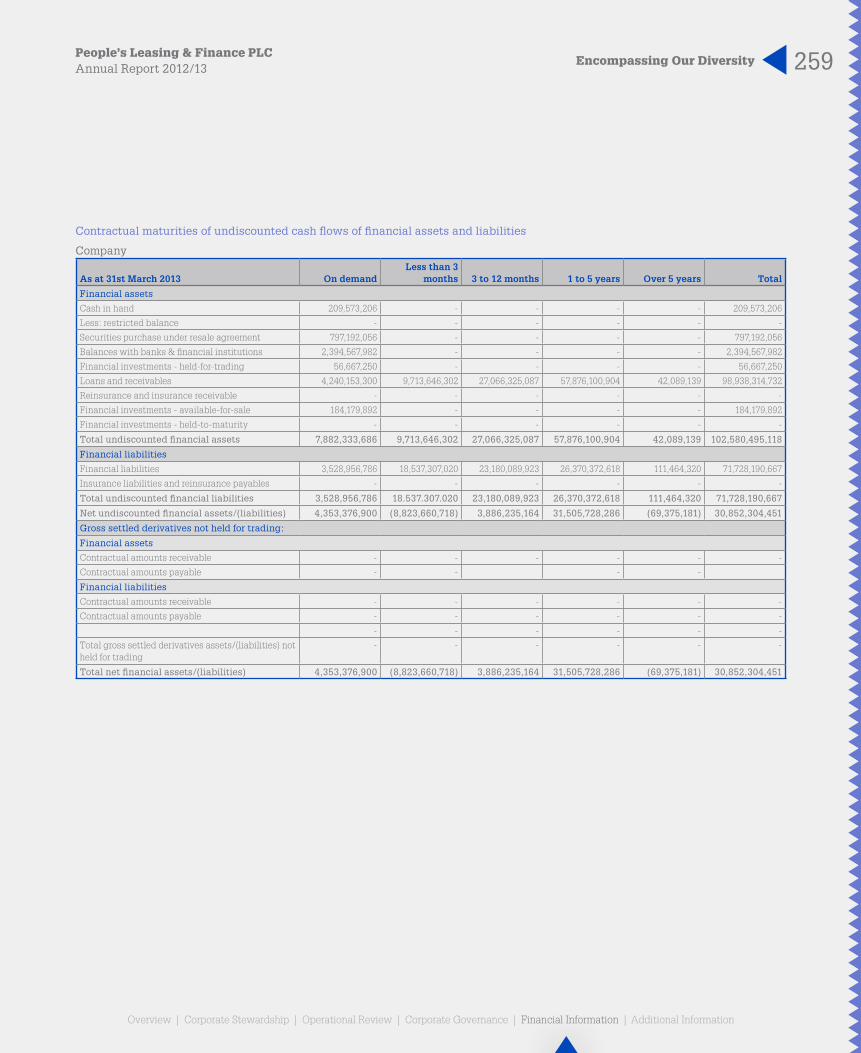
259Encompassing Our DiversityPeople’s Leasing & Finance PLCAnnual Report 2012/13
Overview | Corporate Stewardship | Operational Review | Corporate Governance | Financial Information | Additional Information Overview | Corporate Stewardship | Operational Review | Corporate Governance | Financial Information | Additional Information
Contractual maturities of undiscounted cash flows of financial assets and liabilities
Company
As at 31st March 2013 On demandLess than 3
months 3 to 12 months 1 to 5 years Over 5 years Total
Financial assets
Cash in hand 209,573,206 - - - - 209,573,206
Less: restricted balance - - - - - -
Securities purchase under resale agreement 797,192,056 - - - - 797,192,056
Balances with banks & financial institutions 2,394,567,982 - - - - 2,394,567,982
Financial investments - held-for-trading 56,667,250 - - - - 56,667,250
Loans and receivables 4,240,153,300 9,713,646,302 27,066,325,087 57,876,100,904 42,089,139 98,938,314,732
Reinsurance and insurance receivable - - - - - -
Financial investments - available-for-sale 184,179,892 - - - - 184,179,892
Financial investments - held-to-maturity - - - - - -
Total undiscounted financial assets 7,882,333,686 9,713,646,302 27,066,325,087 57,876,100,904 42,089,139 102,580,495,118
Financial liabilities
Financial liabilities 3,528,956,786 18,537,307,020 23,180,089,923 26,370,372,618 111,464,320 71,728,190,667
Insurance liabilities and reinsurance payables - - - - - -
Total undiscounted financial liabilities 3,528,956,786 18.537.307.020 23,180,089,923 26,370,372,618 111,464,320 71,728,190,667
Net undiscounted financial assets/(liabilities) 4,353,376,900 (8,823,660,718) 3,886,235,164 31,505,728,286 (69,375,181) 30,852,304,451
Gross settled derivatives not held for trading:
Financial assets
Contractual amounts receivable - - - - - -
Contractual amounts payable - - - -
Financial liabilities
Contractual amounts receivable - - - - - -
Contractual amounts payable - - - - - -
- - - - - -
Total gross settled derivatives assets/(liabilities) not held for trading
- - - - - -
Total net financial assets/(liabilities) 4,353,376,900 (8,823,660,718) 3,886,235,164 31,505,728,286 (69,375,181) 30,852,304,451
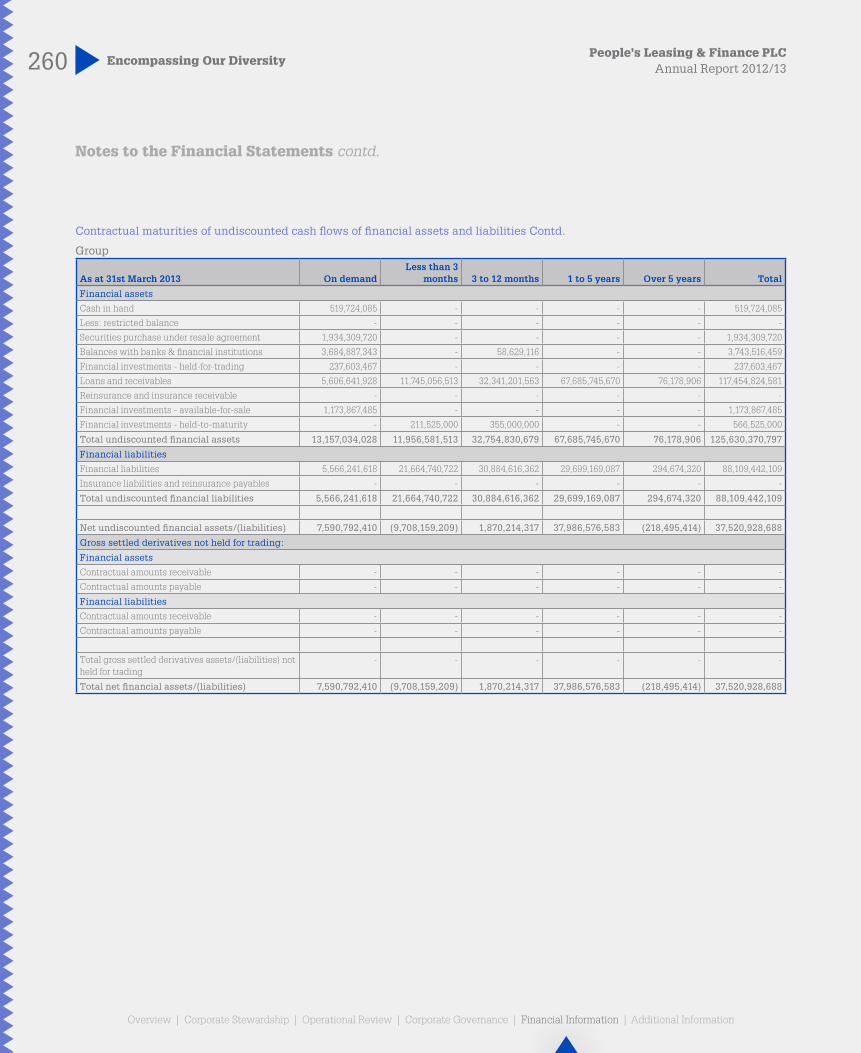
260 Encompassing Our DiversityPeople’s Leasing & Finance PLC
Annual Report 2012/13
Overview | Corporate Stewardship | Operational Review | Corporate Governance | Financial Information | Additional Information
Contractual maturities of undiscounted cash flows of financial assets and liabilities Contd.
Group
As at 31st March 2013 On demandLess than 3
months 3 to 12 months 1 to 5 years Over 5 years Total
Financial assets
Cash in hand 519,724,085 - - - - 519,724,085
Less: restricted balance - - - - - -
Securities purchase under resale agreement 1,934,309,720 - - - - 1,934,309,720
Balances with banks & financial institutions 3,684,887,343 - 58,629,116 - - 3,743,516,459
Financial investments - held-for-trading 237,603,467 - - - - 237,603,467
Loans and receivables 5,606,641,928 11,745,056,513 32,341,201,563 67,685,745,670 76,178,906 117,454,824,581
Reinsurance and insurance receivable - - - - - -
Financial investments - available-for-sale 1,173,867,485 - - - - 1,173,867,485
Financial investments - held-to-maturity - 211,525,000 355,000,000 - - 566,525,000
Total undiscounted financial assets 13,157,034,028 11,956,581,513 32,754,830,679 67,685,745,670 76,178,906 125,630,370,797
Financial liabilities
Financial liabilities 5,566,241,618 21,664,740,722 30,884,616,362 29,699,169,087 294,674,320 88,109,442,109
Insurance liabilities and reinsurance payables - - - - - -
Total undiscounted financial liabilities 5,566,241,618 21,664,740,722 30,884,616,362 29,699,169,087 294,674,320 88,109,442,109
Net undiscounted financial assets/(liabilities) 7,590,792,410 (9,708,159,209) 1,870,214,317 37,986,576,583 (218,495,414) 37,520,928,688
Gross settled derivatives not held for trading:
Financial assets
Contractual amounts receivable - - - - - -
Contractual amounts payable - - - - - -
Financial liabilities
Contractual amounts receivable - - - - - -
Contractual amounts payable - - - - - -
Total gross settled derivatives assets/(liabilities) not held for trading
- - - - - -
Total net financial assets/(liabilities) 7,590,792,410 (9,708,159,209) 1,870,214,317 37,986,576,583 (218,495,414) 37,520,928,688
Notes to the Financial Statements contd.

261Encompassing Our DiversityPeople’s Leasing & Finance PLCAnnual Report 2012/13
Overview | Corporate Stewardship | Operational Review | Corporate Governance | Financial Information | Additional Information Overview | Corporate Stewardship | Operational Review | Corporate Governance | Financial Information | Additional Information
49.3.2 Commitments and guarantees
The table below shows the contractual expiry by maturity of the Company’s contingent liabilities and commitments.
Each undrawn loan commitment is included in the time band containing the earliest date it can be drawn down.
For issued financial guarantee contracts, the maximum amount of the guarantee is allocated to the earliest period in which the guarantee could be called.
Company
As at 31st March 2013On
DemandLess than3 months
3 to 12months
1 to 5years
Over5 years Total
Guarantees - 1,475,000,000 - 225,000,000 - 1,700,000,000
Pending bill retirements 5,655,432 15,908,125 11,562,300 - - 33,125,857
Accidents of leased out vehicles - - - 61,028,683 - 61,028,683
Capital commitment - - 227,131,154 - - 227,131,154
Total commitments and guarantees 5,655,432 1,490,908,125 238,693,454 286,028,683 - 2,021,285,694
Group
As at 31st March 2013On
DemandLess than3 months
3 to 12months
1 to 5years
Over5 years Total
Guarantees 1,650,000 1,475,100,000 7,200,000 225,000,000 - 1,708,950,000
Pending bill retirements 5,655,432 15,908,125 11,562,300 - - 33,125,857
Accidents of leased out vehicles - - - 61,028,683 - 61,028,683
Capital commitment - - 574,103,224 135,000,000 893,000,000 1,602,103,224
Total commitments and guarantees 7,305,432 1,491,008,125 592,865,524 421,028,683 893,000,000 3,405,207,764
The Company expects that not all of the contingent liabilities or commitments will be drawn before expiry of the commitments.

262 Encompassing Our DiversityPeople’s Leasing & Finance PLC
Annual Report 2012/13
Overview | Corporate Stewardship | Operational Review | Corporate Governance | Financial Information | Additional Information
49.4 Market risk
Market risk is the risk that the fair value or future cash flows of financial instruments will fluctuate due to changes in market variables such as interest rates, foreign exchange rates and equity prices. The Company classifies exposures to market risk into either trading or non–trading portfolios and manages each of those portfolios separately.
Interest rate risk
Interest rate risk arises from the possibility that changes in interest rates will affect future cash flows or the fair values of financial instruments.
49.4.2 Interest rate risk exposure on financial asset and liabilities
The table below analyses the Company’s interest rate risk exposure on non–trading financial assets and liabilities. The Company’s assets and liabilities are included at carrying amount and categorised by the earlier of contractual re–pricing or maturity dates.
Company
As at 31st March 2013Carrying
amount On demandLess than 3
months 3 to 12 months 1 to 5 years Over 5 yearsNon–interest
bearing
Assets
Cash in hand 209,573,206 - - - - - 209,573,206
Securities purchase under resale agreement 797,192,056 797,192,056 - - - - -
Balances with banks & financial institutions 2,394,567,982 40,485,486 637,979,083 - - - 1,716,103,413
Financial investments - held for trading 56,667,250 - - - - - 56,667,250
Loans and receivable 76,435,957,166 4,304,893,344 6,645,395,720 18,866,624,918 46,580,020,039 39,023,145 -
Less: Impairment charges 713,275,526
Net loans and receivables 75,722,681,640
Reinsurance and insurance receivable -
Financial investments – available for sale 184,179,892 - - - - - 184,179,892
Financial investments – held-to-maturity
Total 80,078,137,552 5,142,570,886 7,283,374,803 18,866,624,918 46,580,020,039 39,023,145 2,166,523,761
Liabilities
Financial Liabilities 65,060,408,247 775,166,491 26,295,443,244 18,138,789,894 16,832,089,548 173,832,507 2,845,086,564
Insurance liabilities and reinsurance payables - - - - - - -
Total 65,060,408,247 775,166,491 26,295,443,244 18,138,789,894 16,832,089,548 173,832,507 2,845,086,564
Total interest sensitivity gap 15,017,729,305 4,367,404,395 (19,012,068,441) 727,835,024 29,747,930,491 (134,809,362) (678,562,802)
Notes to the Financial Statements contd.

263Encompassing Our DiversityPeople’s Leasing & Finance PLCAnnual Report 2012/13
Overview | Corporate Stewardship | Operational Review | Corporate Governance | Financial Information | Additional Information Overview | Corporate Stewardship | Operational Review | Corporate Governance | Financial Information | Additional Information
Group
As at 31st March 2013Carrying amount On demand
Less than 3 months 3 to 12 months 1 to 5 years Over 5 years
Non–interest bearing
Assets
Cash in hand 519,724,085 - - - - 519,724,085
Securities purchase under resale agreement 1,934,309,720 1,934,309,720 - - - - -
Balances with banks & financial institutions 3,743,516,459 1,242,520,748 637,979,083 58,629,116 - - 1,804,387,512
Financial investments - held for trading 237,603,467 - - - - - 237,603,467
Loans and receivable 89,140,194,039 4,978,838,201 7,852,786,114 22,579,579,462 53,661,948,876 67,041,386 -
Less: Impairment charges 841,722,794
Net loans and receivables 88,298,471,245
Reinsurance and insurance receivable 159,162,123 159,162,123 - - - - -
Financial investments – available for sale 1,173,867,485 - 85,504,345 904,183,248 - - 184,179,892
Financial investments – held-to-maturity 539,765,951 - 201,672,625 338,093,326
Total 97,448,143,329 8,314,830,792 8,777,942,167 23,880,485,152 53,661,948,876 67,041,386 2,745,894,956
Liabilities
Financial Liabilities 79,297,914,974 1,429,848,264 29,849,679,409 25,236,114,948 19,382,685,385 357,042,507 3,042,544,462
Insurance liabilities and reinsurance payables 2,216,941,297 - - - - - 2,216,941,297
Total 81,514,856,271 1,429,848,264 29,849,679,409 25,236,114,948 19,382,685,385 357,042,507 5,259,485,759
Total interest sensitivity gap 15,933,287,058 6,884,982,528 (21,071,737,242) (1,355,629,796) 34,279,263,491 (290,001,121) (2,513,590,803)
Currency risk
Currency risk is the risk that the value of a financial instrument will fluctuate due to changes in foreign exchange rates.
The only currency risk faced by the Company is from the funds borrowed in USD. This exposure has been effectively managed by investing the USD borrowings in a fixed deposit. Therefore, currency risk to the Company is minimal.
Equity price risk
Equity price risk is the risk that the fair value of equities decreases as the result of changes in the level of equity indices and individual stocks. The non–trading equity price risk exposure arises from equity securities classified as available for sale. A 10 percent increase in the value of the Company’s available for sale equities at 31st March 2013 would have increased equity by Rs. 24.08 million. An equivalent decrease would have resulted in an equivalent but opposite impact and would cause a potential impairment, which would reduce profit before tax by approximately Rs. 24.08 million.

264 Encompassing Our DiversityPeople’s Leasing & Finance PLC
Annual Report 2012/13
Overview | Corporate Stewardship | Operational Review | Corporate Governance | Financial Information | Additional Information
49.5 Operational risk
Operational risk is the risk of loss arising from systems failure, human error, fraud or external events. When controls fail to operate effectively, operational risks can cause damage to reputation, have legal or regulatory implications, or lead to financial losses.
49.6 Insurance risks
People’s Insurance Limited (PIL) is a fully owned subsidiary of the Company whose principle line of business is carrying out general insurance business. The following are the risks and their management arising from PIL for its statutory year ended 31st December.
49.6.1 Regulatory framework
Regulators are primarily interested in protecting the rights of policyholders and monitor them closely to ensure that the PIL is satisfactorily managing affairs for policyholders’ benefit. At the same time, regulators are also interested in ensuring that the PIL maintains an appropriate solvency position to meet unforeseen liabilities arising from economic shocks or natural disasters.
As an insurer, the operations of the PIL are subject to regulatory supervision of the Insurance Board of Sri Lanka (IBSL). PIL has taken necessary action to comply with and complied with applicable regulations throughout the year.
49.6.2 Nature and extent of risks arising from insurance contracts
Objectives, policies and processes for managing risks arising from insurance contractsPIL willingly assumes risks of other organisations as its prime value creation activity. This is the core of the insurance business and there is no perfect way of measuring the potential impact on insured risk. For non-life insurance business, most significant risks arise from climate changes, natural disasters and terrorist activities.
The above risk exposure is mitigated by diversification across a large portfolio of insurance contracts and geographical areas. PIL’s risk management framework focuses on strategic risk, assumed risks and the potential risks. PIL identifies and categorises risks in terms of their source, their impact on PIL and preferred strategies for dealing with them.
Notes to the Financial Statements contd.

265Encompassing Our DiversityPeople’s Leasing & Finance PLCAnnual Report 2012/13
Overview | Corporate Stewardship | Operational Review | Corporate Governance | Financial Information | Additional Information Overview | Corporate Stewardship | Operational Review | Corporate Governance | Financial Information | Additional Information
Method used to manage risksRisk appetite and risk tolerancePIL has made a strategic decision to maintain a risk appetite moderately above the average of the insurance market, since it allows the best potential for creating shareholder value at an acceptable risk level. PIL manages the volatility and potential downward risk through diversification.
Identification of shock lossesThere are three areas of risk which have the potential to materially damage economic value that PIL identified at present as having the greatest potential for shock losses. They are catastrophe, reserving and equity investment risk. PIL manages the risk of shock losses by setting limits on the tolerance for specific risks and on the amount of capital that PIL is willing to expose.
The table below sets out the concentration of non-life insurance contract liabilities by type of contract.
31 December 2012 31 December 2011 Gross Reinsurance Net Gross Reinsurance Net liabilities receivable liabilities liabilities receivable liabilities
Motor 434,572,224 6,097,170 428,475,054 269,681,980 - 269,681,980Marine 14,123,678 1,625,396 12,498,282 1,348,555 86,978 1,261,577Fire 119,481,360 71,755,384 47,725,976 180,819,902 164,055,145 16,764,757Miscellaneous 185,146,397 57,844,363 127,302,034 74,969,799 5,852,485 69,117,314Total 753,323,659 137,322,313 616,001,346 526,820,236 169,994,608 356,825,628

266 Encompassing Our DiversityPeople’s Leasing & Finance PLC
Annual Report 2012/13
Overview | Corporate Stewardship | Operational Review | Corporate Governance | Financial Information | Additional Information
Claims development tableThe following tables show the estimates of cumulative incurred claims for each quarter, together with cumulative payments to date.
Gross non- life insurance contract outstanding claims provision for 2012 of PIL.Rs. 000’AccidentPeriod
Development Period
2010 Q1 2010 Q2 2010 Q3 2010 Q4 2011 Q1 2011 Q2 2011 Q3 2011 Q4 2012 Q1 2012 Q2 2012 Q3 2012 Q4 Total
2012 Q4 (60) 67 1,023 940 (344) 61,976 (190) 5,720 (55,206) (36,313) (87,480) 664,924
2012 Q3 50 (1,538) (334) (3,390) (886) (62,462) (2,465) (38,633) 11,266 (23,199) 673,686 -
2012 Q2 - 1,659 (86) 5,476 1,480 2,945 361 (62,895) 74,405 428,668 - -
2012 Q1 (11) 177 (169) 420 2,851 (2,651) (42,538) 79,027 392,184 - - -
2011 Q4 30 (273) 619 1,278 2,360 (45,833) 67,234 439,598 - - - -
2011 Q3 141 273 (712) 6,604 (24,514) (174,650) 335,263 - - - - -
2011 Q2 (63) (297) (2,479) (14,654) 33,484 585,381 - - - - - -
2011 Q1 50 445 (5,856) 17,655 178,613 - - - - - - -
2010 Q4 92 (282) (1,664) 111,155 - - - - - - - -
2010 Q3 94 (4,264) 72,186 - - - - - - - - -
2010 Q2 (814) 33,388 - - - - - - - - - -
2010 Q1 3,762 - - - - - - - - - - -
Current estimate of cumulative claims incurred
3,271 29,355 62,528 125,484 193,044 364,706 357,665 422,817 422,649 369,156 586,206 664,924 3,601,805
Rs. 000’AccidentPeriod
Development Period
2010 Q1 2010 Q2 2010 Q3 2010 Q4 2011 Q1 2011 Q2 2011 Q3 2011 Q4 2012 Q1 2012 Q2 2012 Q3 2012 Q4 Total
2012 Q4 - (46) (3) (484) (316) (783) (1,502) (9,357) (12,203) (5,023) (88,665) (313,342)
2012 Q3 - (26) (38) (638) (1,825) (1,595) (4,657) (22,541) (15,170) (93,896) (324,685) -
2012 Q2 - (5) (19) (3,058) (1,864) (27,756) 616 (13,938) (146,926) (246,174) - -
2012 Q1 (19) (2) (321) (495) (6,763) (32,163) (28,859) (158,460) (219,499) - - -
2011 Q4 - (668) (331) 2,694 (5,097) (10,704) (127,396) (195,737) - - - -
2011 Q3 (141) (297) (502) (10,432) (11,150) (95,481) (181,098) - - - - -
2011 Q2 - (232) (468) (7,710) (59,982) (125,395) - - - - - -
2011 Q1 (215) (1,538) (3,469) (48,920) (81,575) - - - - - - -
2010 Q4 (319) (2,245) (28,676) (52,889) - - - - - - - -
2010 Q3 (29) (11,230) (25,985) - - - - - - - - -
2010 Q2 (1,736) (10,981) - - - - - - - - - -
2010 Q1 (812) - - - - - - - - - - -
Cumulative payments to date
(3,271) (27,270) (59,812) (121,932) (168,572) (293,877) (342,896) (400,033) (393,798) (345,093) (413,350) (313,342) (2,883,246)
Total gross claims outstanding
- 2,085 2,716 3,552 24,472 70,829 14,769 22,784 28,851 24,063 172,856 351,582 718,559
Notes to the Financial Statements contd.

267Encompassing Our DiversityPeople’s Leasing & Finance PLCAnnual Report 2012/13
Overview | Corporate Stewardship | Operational Review | Corporate Governance | Financial Information | Additional Information Overview | Corporate Stewardship | Operational Review | Corporate Governance | Financial Information | Additional Information
Net non-life insurance contract outstanding claims provision for 2012 of PIL.Rs. (000)Accidentquarter
Development Period
2010 Q1 2010 Q2 2010 Q3 2010 Q4 2011 Q1 2011 Q2 2011 Q3 2011 Q4 2012 Q1 2012 Q2 2012 Q3 2012 Q4 Total
2012 Q4 (60) 189 905 932 (412) 2,930 (139) 4,408 1,514 (34,491) (86,842) 656,765
2012 Q3 50 (1,662) (217) (3,361) (810) (1,900) (4,028) 3,925 (46,215) (23,560) 624,161
2012 Q2 - 1,659 (82) 5,471 1,498 1,423 2,634 (63,125) 74,288 425,308
2012 Q1 (11) 177 (176) 425 5,180 4,725 (42,396) 70,572 385,496
2011 Q4 30 1,033 (685) 1,298 3,321 (52,215) 65,544 392,485
2011 Q3 141 411 (624) 6,821 (24,839) 27,765 333,024
2011 Q2 (63) (388) (844) (14,715) 31,561 275,046
2011 Q1 51 (1,044) (5,014) 18,213 172,394
2010 Q4 (68) (634) (3,256) 109,385
2010 Q3 94 (4,113) 71,742
2010 Q2 (814) 33,034
2010 Q1 3,762
Current estimate of cumulative claims Incurred
3,112 28,662 61,749 124,469 187,893 257,774 354,639 408,265 415,083 367,257 537,319 656,765 3,402,987
Rs. (000)Accidentquarter
Development Period
2010 Q1 2010 Q2 2010 Q3 2010 Q4 2011 Q1 2011 Q2 2011 Q3 2011 Q4 2012 Q1 2012 Q2 2012 Q3 2012 Q4 Total
2012 Q4 - (46) (3) (484) (313) (783) (1,502) (8,018) (12,033) (5,023) (88,308) (312,489)
2012 Q3 - (22) (38) (618) (1,825) (1,593) (4,643) (10,031) (14,962) (93,878) (322,749)
2012 Q2 - (5) (19) (3,058) (1,864) (2,740) 712 (13,656) (146,659) (244,350)
2012 Q1 (19) (2) (314) (495) (6,782) (10,429) (26,833) (158,460) (217,021)
2011 Q4 - (668) (331) 2,695 (5,077) (10,468) (126,800) (195,489)
2011 Q3 (141) (297) (502) (10,431) (11,149) (95,174) (180,867)
2011 Q2 - (232) (468) (7,710) (59,843) (124,942)
2011 Q1 (215) (1,217) (3,469) (48,920) (80,276)
2010 Q4 (159) (2,081) (28,348) (51,904)
2010 Q3 (30) (11,216) (25,541)
2010 Q2 (1,736) (10,791)
2010 Q1 (812)
Cumulative payments to date
(3,112) (26,577) (59,033) (120,925) (167,129) (246,129) (339,933) (385,654) (390,675) (343,251) (411,057) (312,489) (2,805,964)
Total net claims outstanding
- 2,085 2,716 3,544 20,764 11,645 14,706 22,611 24,408 24,006 126,262 344,276 597,023
Related Documents


![LKAS - GS 7 - Evangelische Studierendengemeinde Tübingen¤nde/LKAS-GS007-ES… · [7] Gabriele Malsch, Das Schlatterhaus und die Evangelische Studentengemeinde 1945 bis 1976, in:](https://static.cupdf.com/doc/110x72/606132fc3b0e8e6c744d53e3/lkas-gs-7-evangelische-studierendengemeinde-tbingen-ndelkas-gs007-es-7.jpg)


