Chapter 11 Chapter 11 Inferential Inferential Statistics Statistics

Nossi ch 11
May 18, 2015
Contemporary math chapter 11 Power Point.
Welcome message from author
This document is posted to help you gain knowledge. Please leave a comment to let me know what you think about it! Share it to your friends and learn new things together.
Transcript

Chapter 11Chapter 11
Inferential StatisticsInferential Statistics
Section 11.1Section 11.1
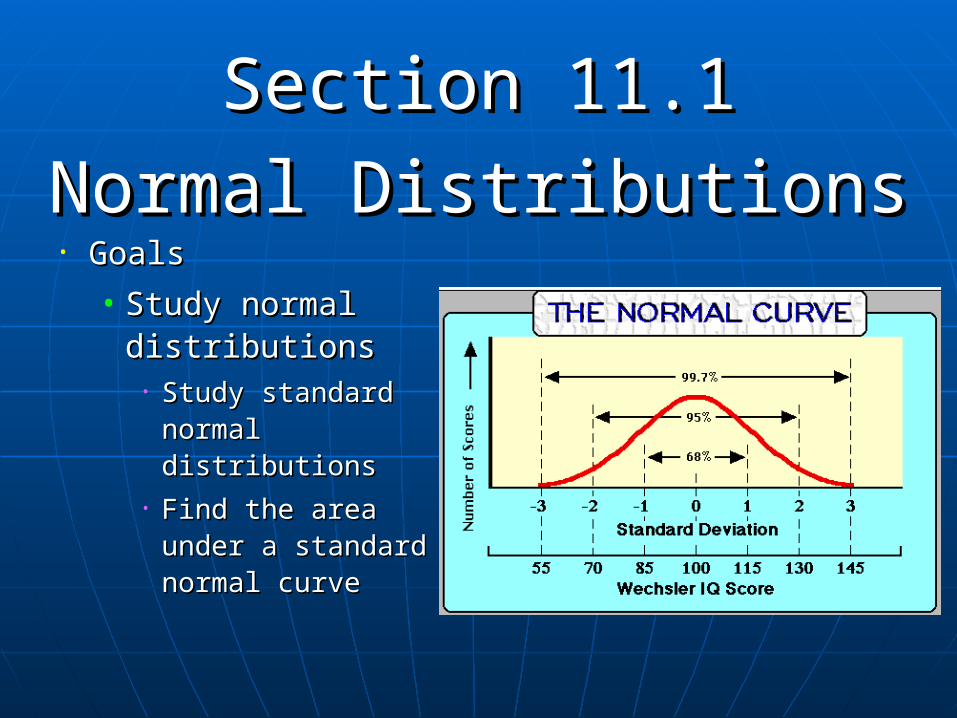
Normal DistributionsNormal Distributions• GoalsGoals
• Study normal Study normal distributionsdistributions
• Study standard Study standard normal normal distributionsdistributions
• Find the area Find the area under a standard under a standard normal curvenormal curve
11.1 Initial Problem11.1 Initial Problem
• A class of 90 students had a mean test A class of 90 students had a mean test score of 74, with a standard deviation of score of 74, with a standard deviation of 8.8.
• If the professor curves the scores, how If the professor curves the scores, how many students will get As and how many many students will get As and how many will get Fs? will get Fs? • The solution will be given at the end of the section.The solution will be given at the end of the section.

Statistical InferenceStatistical Inference
• The process of making predictions The process of making predictions about an entire population based on about an entire population based on information from a sample is called information from a sample is called statistical inferencestatistical inference. .
Data DistributionsData Distributions
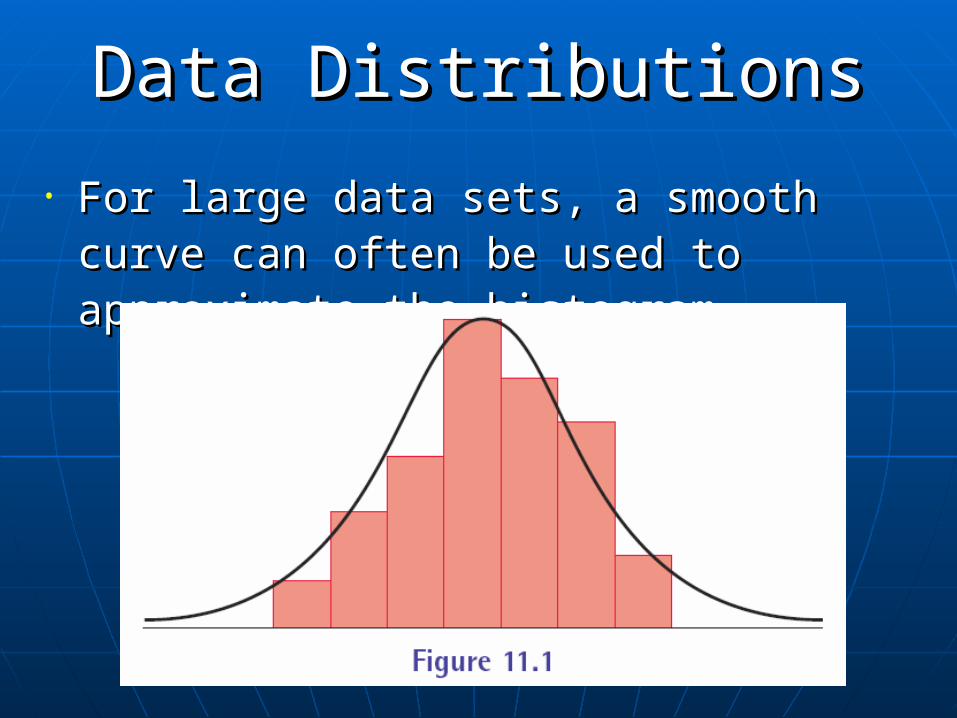
• For large data sets, a smooth curve can For large data sets, a smooth curve can often be used to approximate the histogram. often be used to approximate the histogram.
Data DistributionsData Distributions
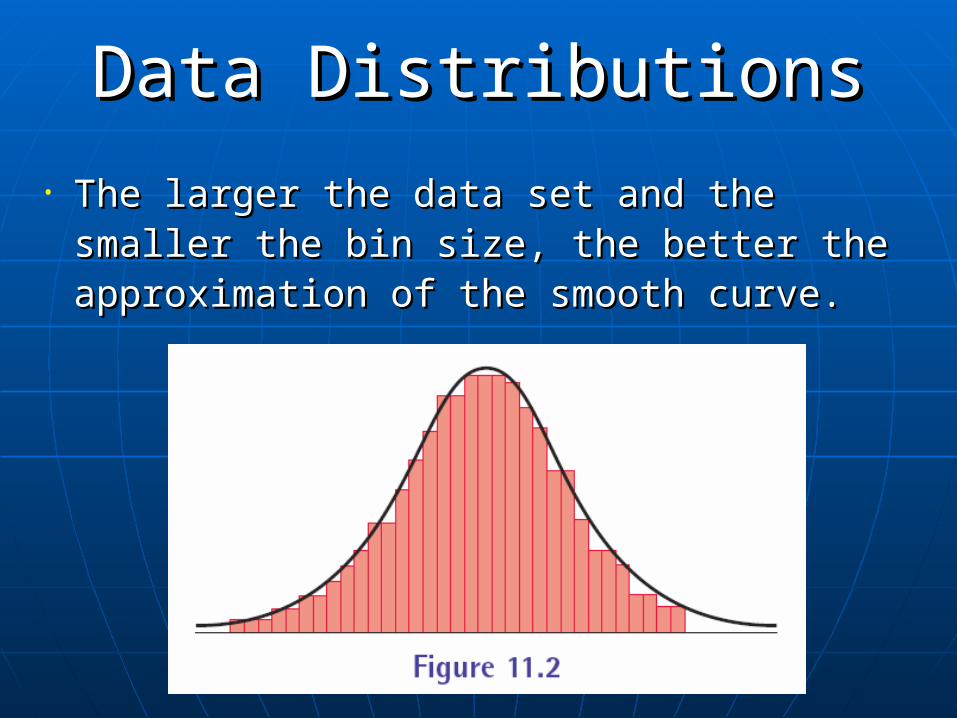
• The larger the data set and the smaller the The larger the data set and the smaller the bin size, the better the approximation of the bin size, the better the approximation of the smooth curve. smooth curve.
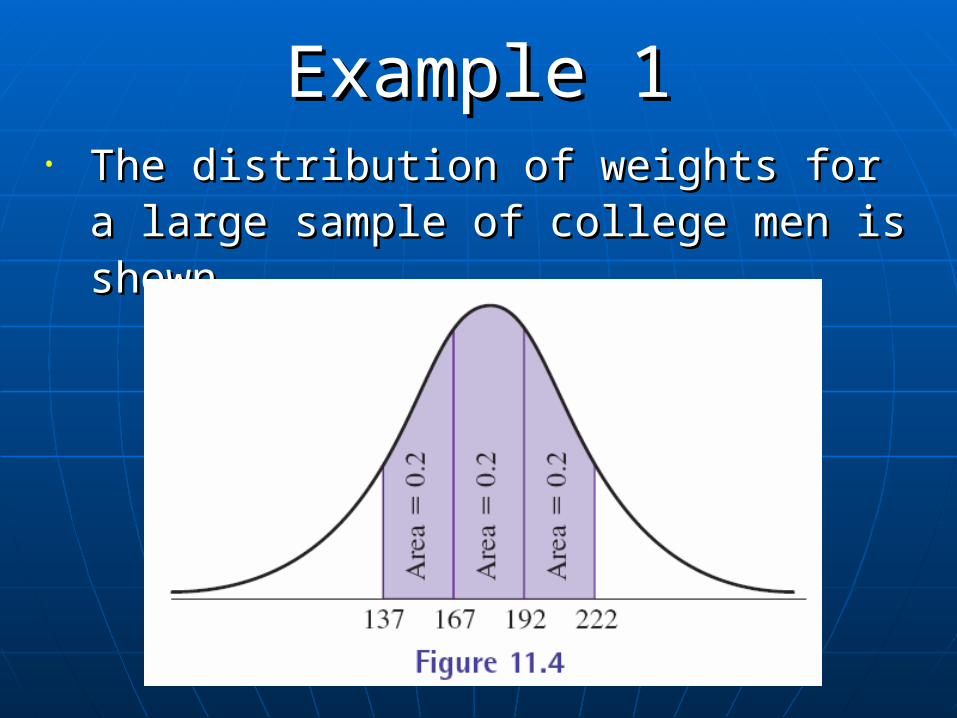
Example 1Example 1• The distribution of weights for a large The distribution of weights for a large
sample of college men is shown.sample of college men is shown.

Example 1Example 1• What percent of the men have weights between:What percent of the men have weights between:
a)a) 167 and 192 pounds?167 and 192 pounds?
b)b) 137 and 192 pounds?137 and 192 pounds?
c)c) 137 and 222 pounds?137 and 222 pounds?

Example 1Example 1
• Solution:Solution:
a)a)167 and 192 pounds?167 and 192 pounds?
• The area under the curve is 0.2, so 20% The area under the curve is 0.2, so 20% of the men are in this weight range.of the men are in this weight range.
Example 1Example 1
• Solution:Solution:
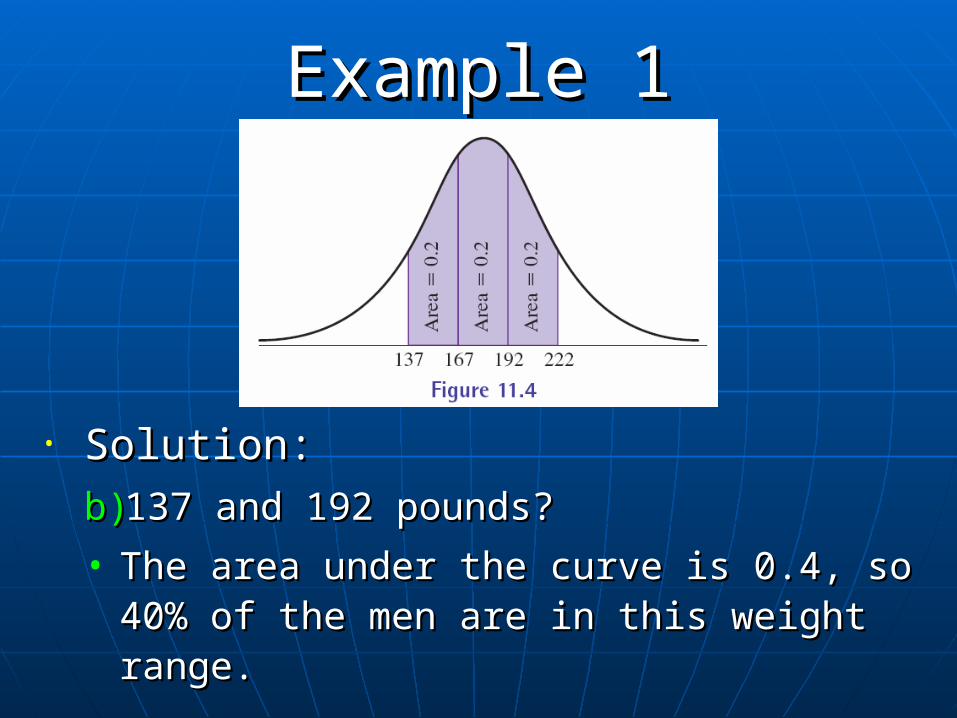
b)b)137 and 192 pounds?137 and 192 pounds?
• The area under the curve is 0.4, so 40% The area under the curve is 0.4, so 40% of the men are in this weight range.of the men are in this weight range.
Example 1Example 1
• Solution:Solution:
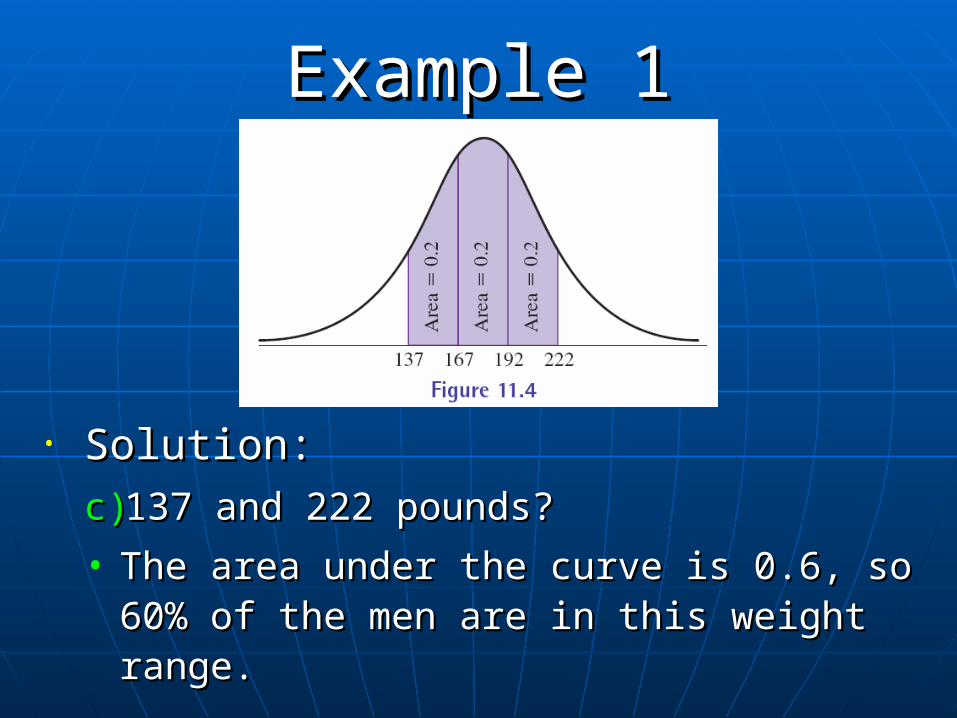
c)c) 137 and 222 pounds?137 and 222 pounds?
• The area under the curve is 0.6, so 60% The area under the curve is 0.6, so 60% of the men are in this weight range.of the men are in this weight range.
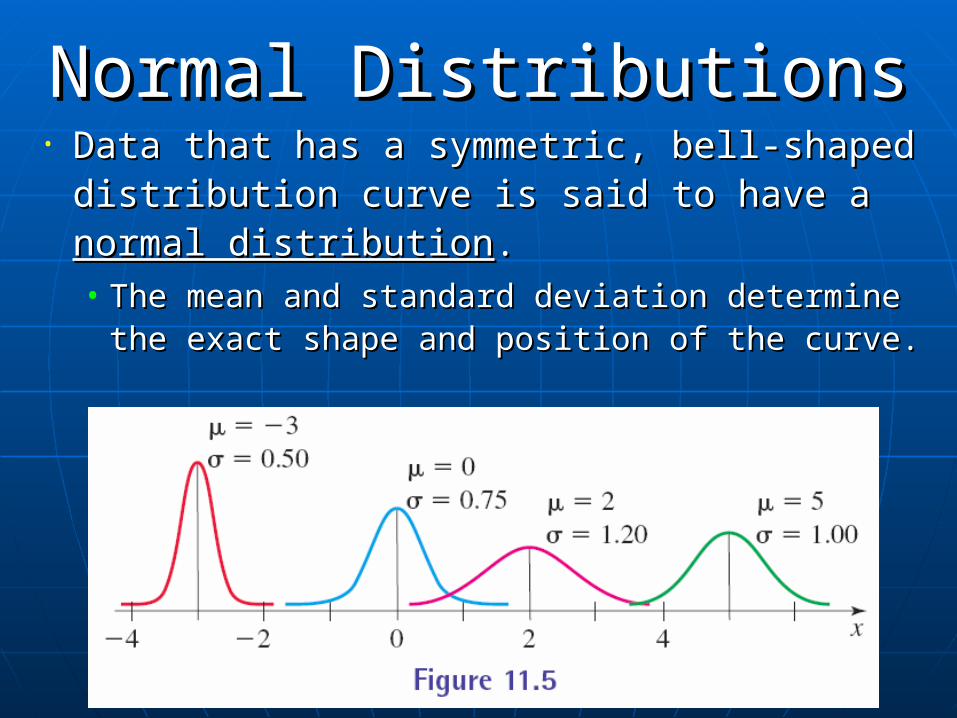
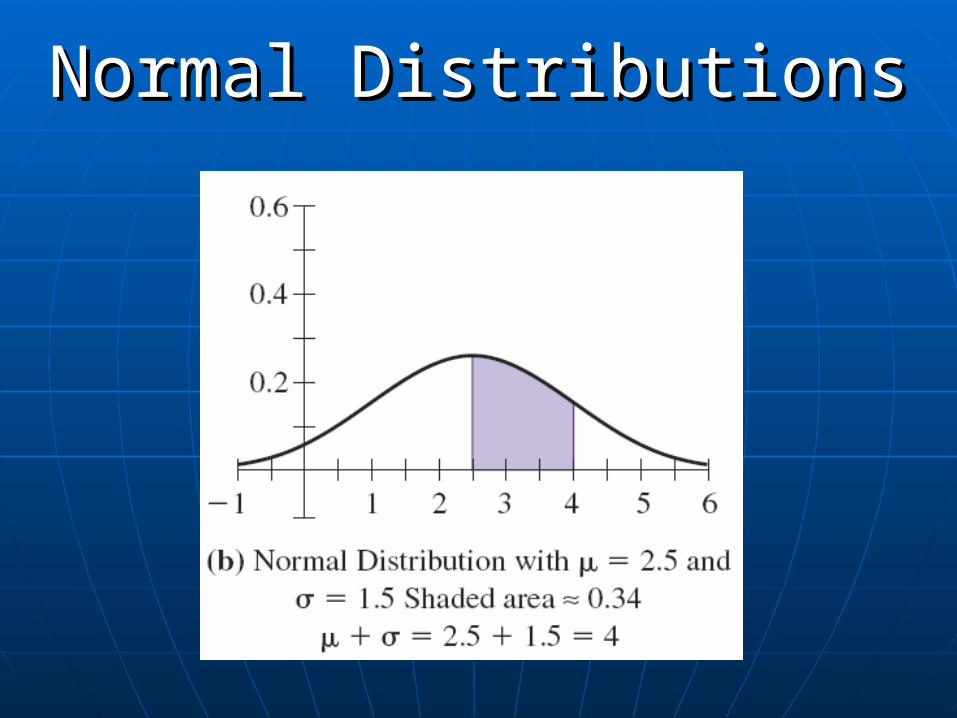
Normal DistributionsNormal Distributions• Data that has a symmetric, bell-shaped Data that has a symmetric, bell-shaped
distribution curve is said to have a distribution curve is said to have a normal normal distributiondistribution..• The mean and standard deviation determine the The mean and standard deviation determine the
exact shape and position of the curve.exact shape and position of the curve.

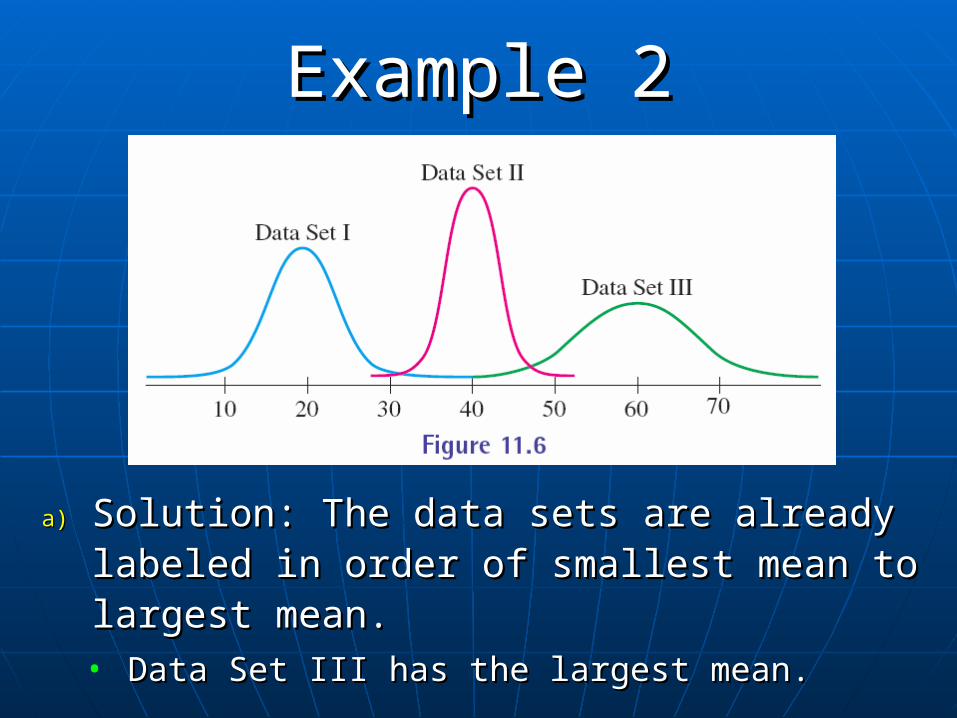
Example 2Example 2
a)a) Which normal curve has the largest mean?Which normal curve has the largest mean?
b)b) Which normal curve has the largest Which normal curve has the largest standard deviation? standard deviation?
Example 2Example 2
a)a) Solution: The data sets are already labeled Solution: The data sets are already labeled in order of smallest mean to largest mean.in order of smallest mean to largest mean.• Data Set III has the largest mean.Data Set III has the largest mean.
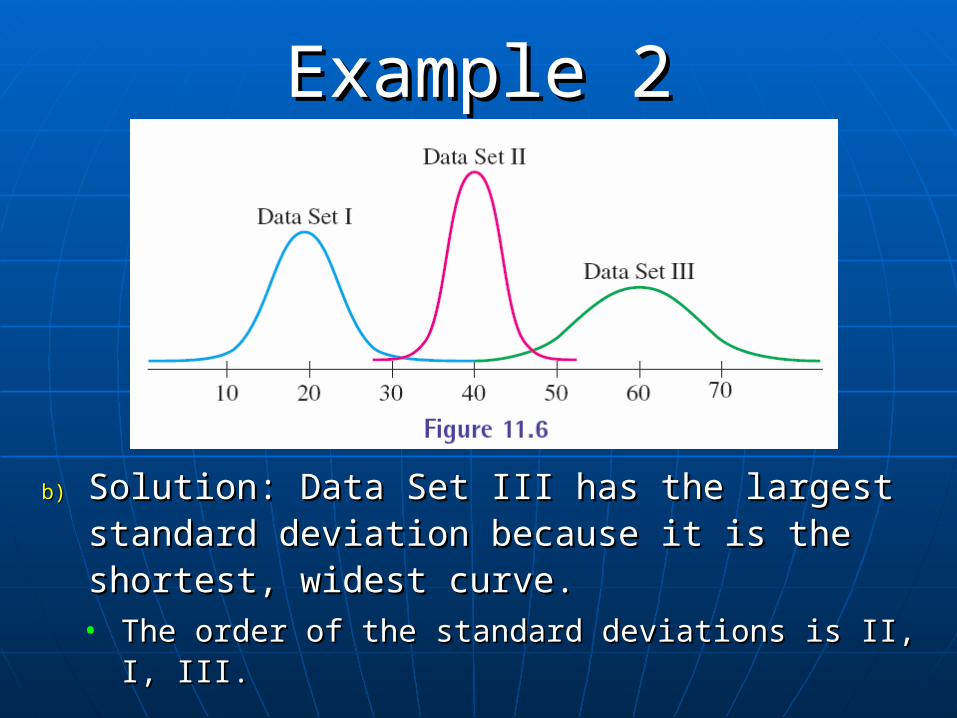
Example 2Example 2
b)b) Solution: Data Set III has the largest Solution: Data Set III has the largest standard deviation because it is the standard deviation because it is the shortest, widest curve.shortest, widest curve.• The order of the standard deviations is II, I, III.The order of the standard deviations is II, I, III.
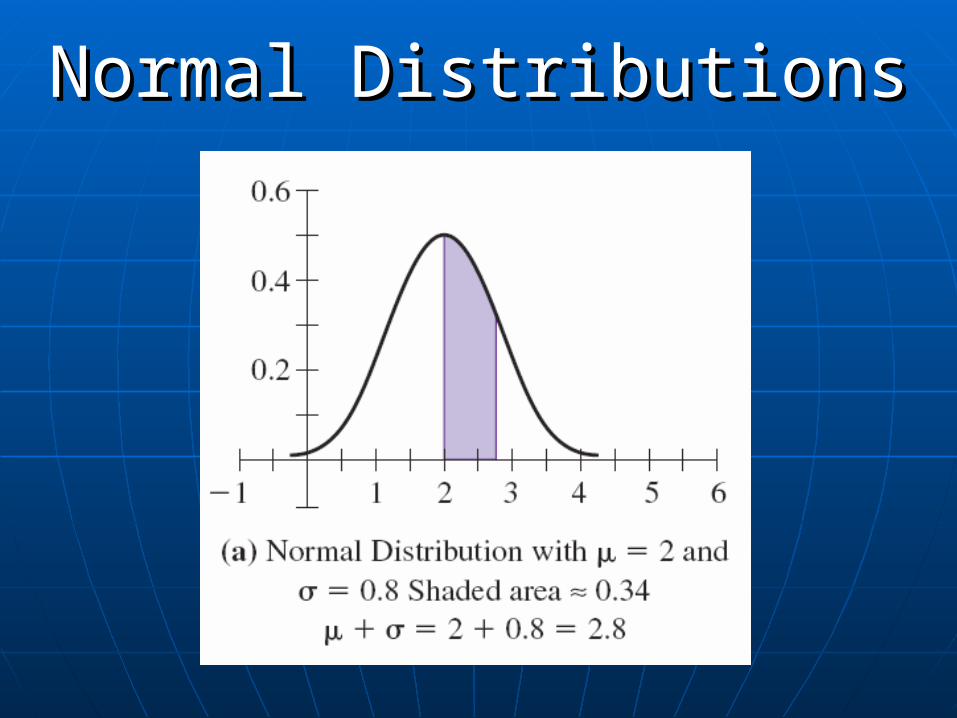
Normal DistributionsNormal Distributions
• Normal distributions with various means Normal distributions with various means and standard deviations are shown on and standard deviations are shown on the following slides.the following slides.
Normal DistributionsNormal Distributions
Normal DistributionsNormal Distributions

Normal DistributionsNormal Distributions
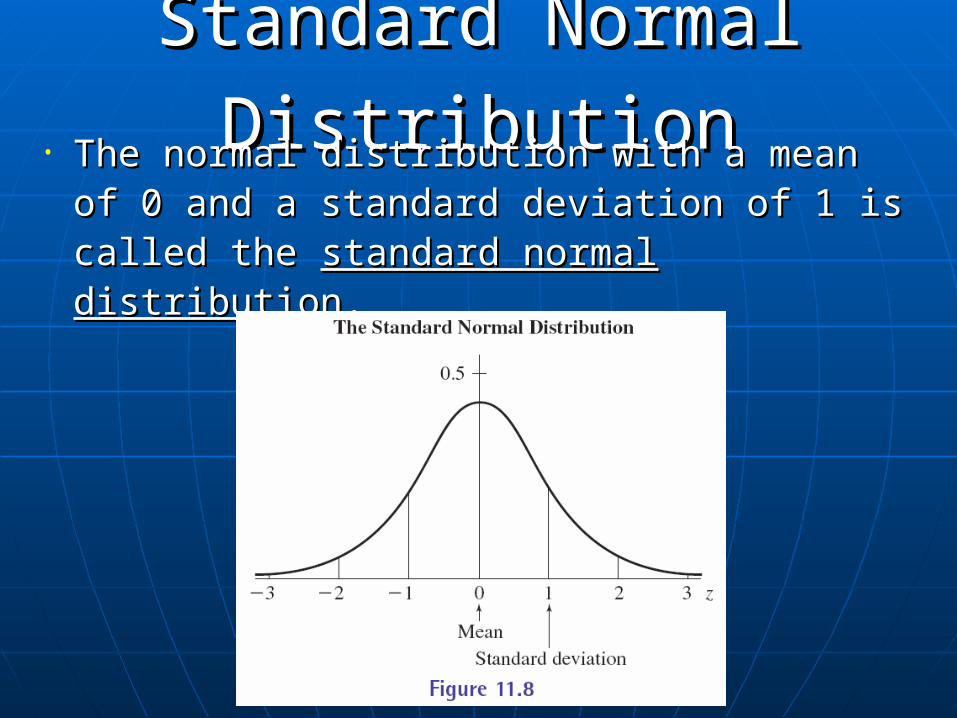
Standard Normal DistributionStandard Normal Distribution• The normal distribution with a mean of 0 and The normal distribution with a mean of 0 and
a standard deviation of 1 is called the a standard deviation of 1 is called the standard normal distributionstandard normal distribution. .
Standard Normal DistributionStandard Normal Distribution
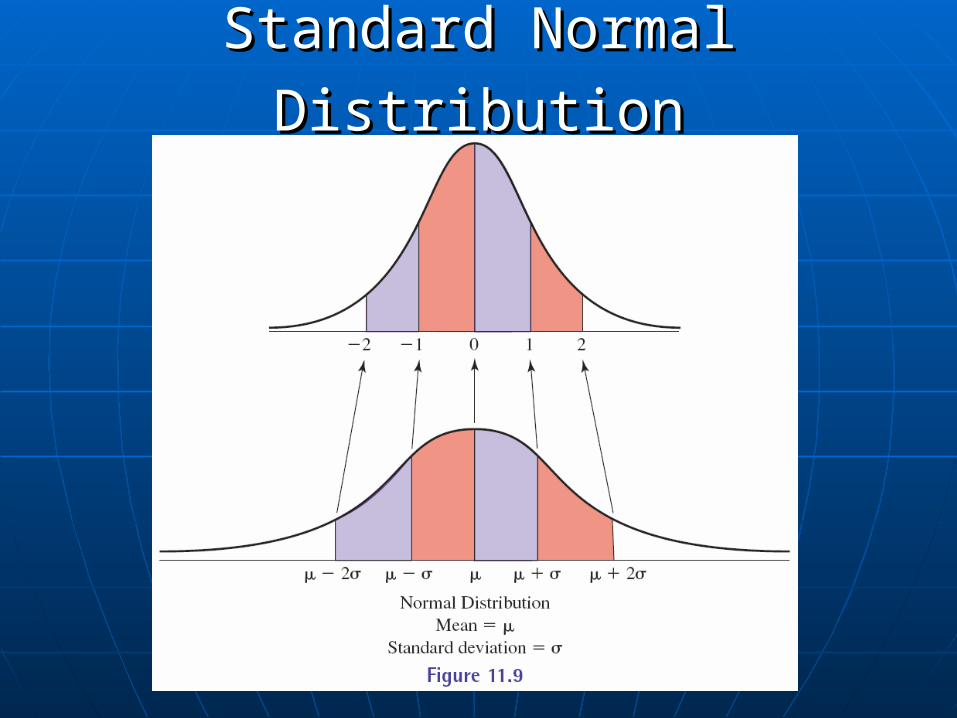
• The areas under any normal distribution The areas under any normal distribution can be compared to the areas under can be compared to the areas under the standard normal distribution, as the standard normal distribution, as shown in the figure on the next slide. shown in the figure on the next slide.
Standard Normal DistributionStandard Normal Distribution
AreaArea
• One way to find the area under a region One way to find the area under a region of the standard normal curve is to use a of the standard normal curve is to use a table.table.• Tables of values for the standard normal Tables of values for the standard normal
curve are printed in textbooks to eliminate curve are printed in textbooks to eliminate the need to do repeated complicated the need to do repeated complicated calculations. calculations.
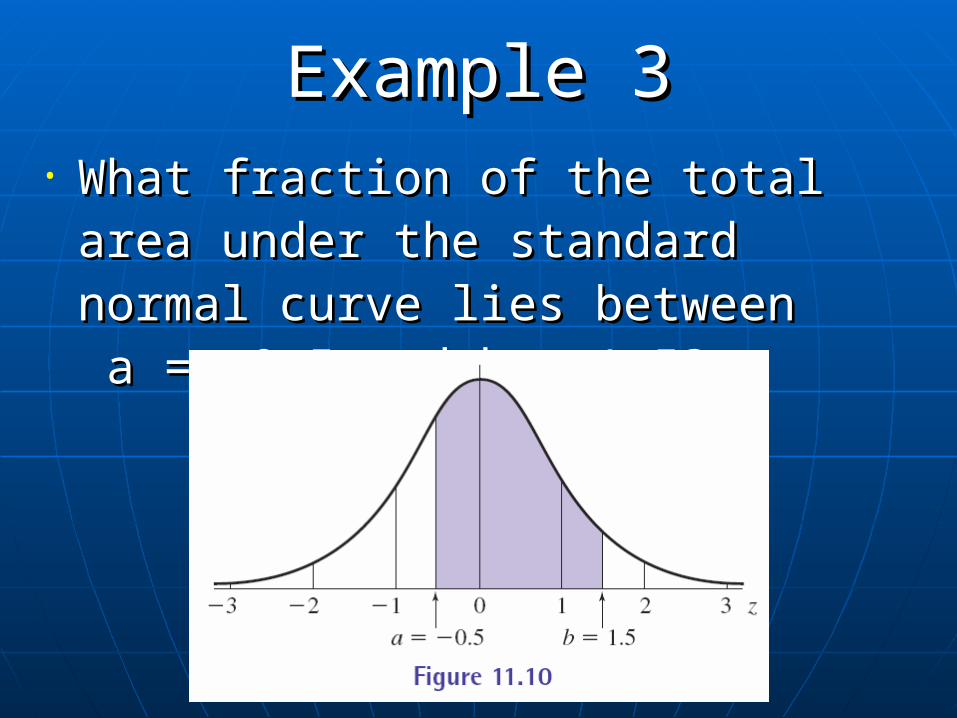
Example 3Example 3• What fraction of the total area under the What fraction of the total area under the
standard normal curve lies between standard normal curve lies between a = -0.5 and b = 1.5? a = -0.5 and b = 1.5?
Example 3Example 3
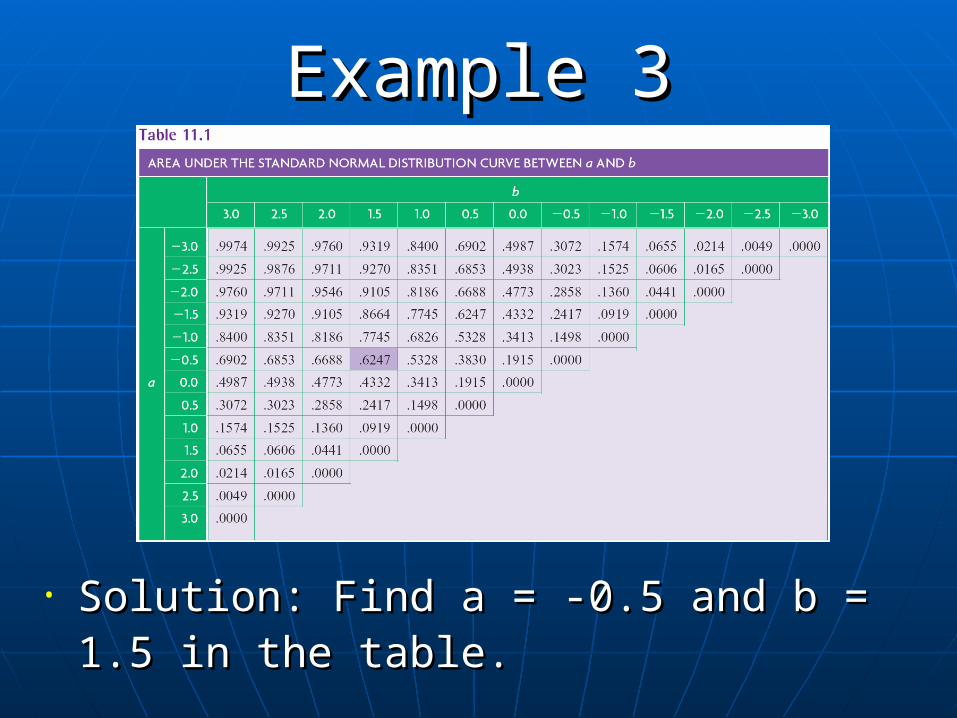
• Solution: Find a = -0.5 and b = 1.5 in the Solution: Find a = -0.5 and b = 1.5 in the table.table.
Example 3Example 3• The value in the table is 0.6247.The value in the table is 0.6247.
• A total of 62.47% of the area is shaded.A total of 62.47% of the area is shaded.
• In any normal distribution, 62.47% of the data In any normal distribution, 62.47% of the data lies between 0.5 standard deviations below lies between 0.5 standard deviations below the mean and 1.5 standard deviations above the mean and 1.5 standard deviations above the mean.the mean.
• The probability a randomly selected data The probability a randomly selected data value will lie between -0.5 and 1.5 is 62.47%value will lie between -0.5 and 1.5 is 62.47%
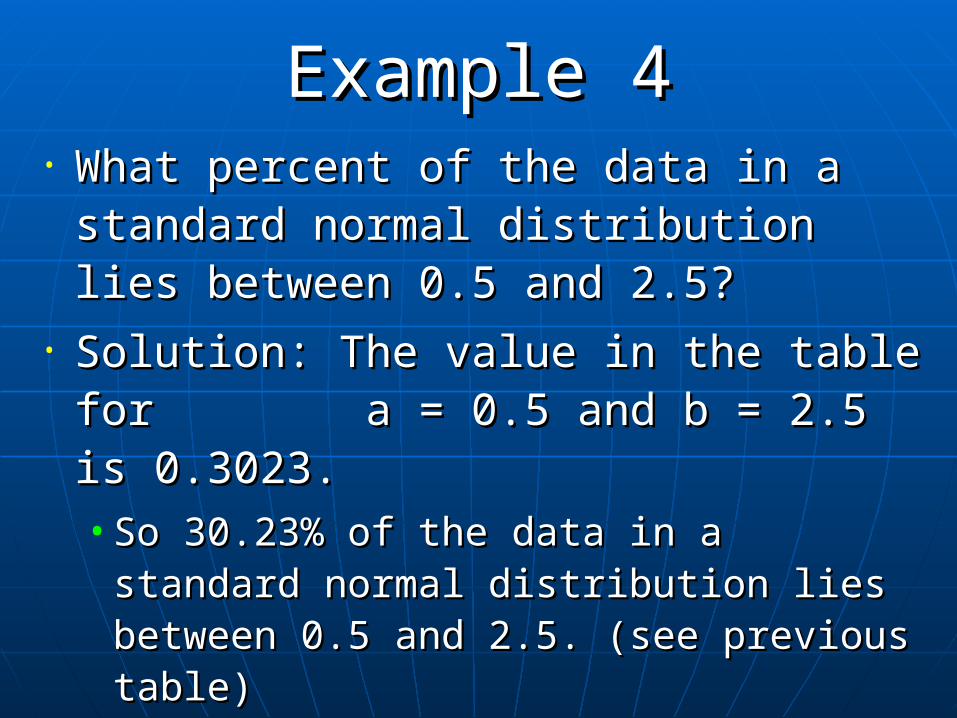
Example 4Example 4• What percent of the data in a standard What percent of the data in a standard
normal distribution lies between 0.5 and normal distribution lies between 0.5 and 2.5? 2.5?
• Solution: The value in the table for Solution: The value in the table for a = 0.5 and b = 2.5 is 0.3023.a = 0.5 and b = 2.5 is 0.3023.• So 30.23% of the data in a standard So 30.23% of the data in a standard
normal distribution lies between 0.5 and normal distribution lies between 0.5 and 2.5. (see previous table)2.5. (see previous table)

AreasAreas
• Because the normal curve is Because the normal curve is symmetric, the areas in the previous symmetric, the areas in the previous table are repeated. table are repeated.
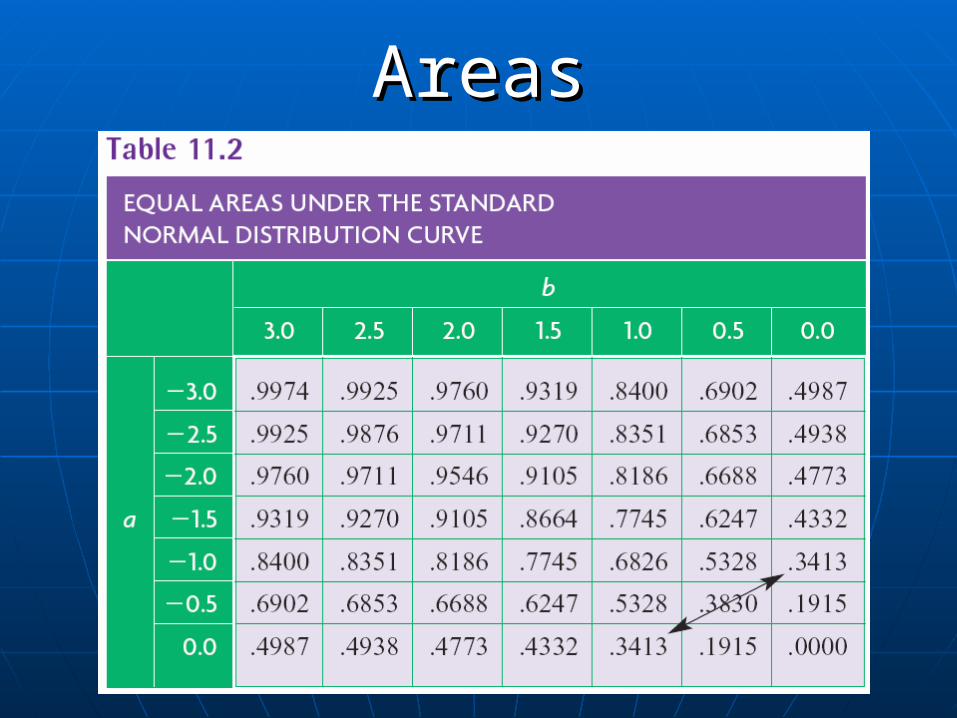
AreasAreas
• Figure Figure 11.11 11.11 and and table table 11.211.2

AreaArea• A more common type of table:A more common type of table:
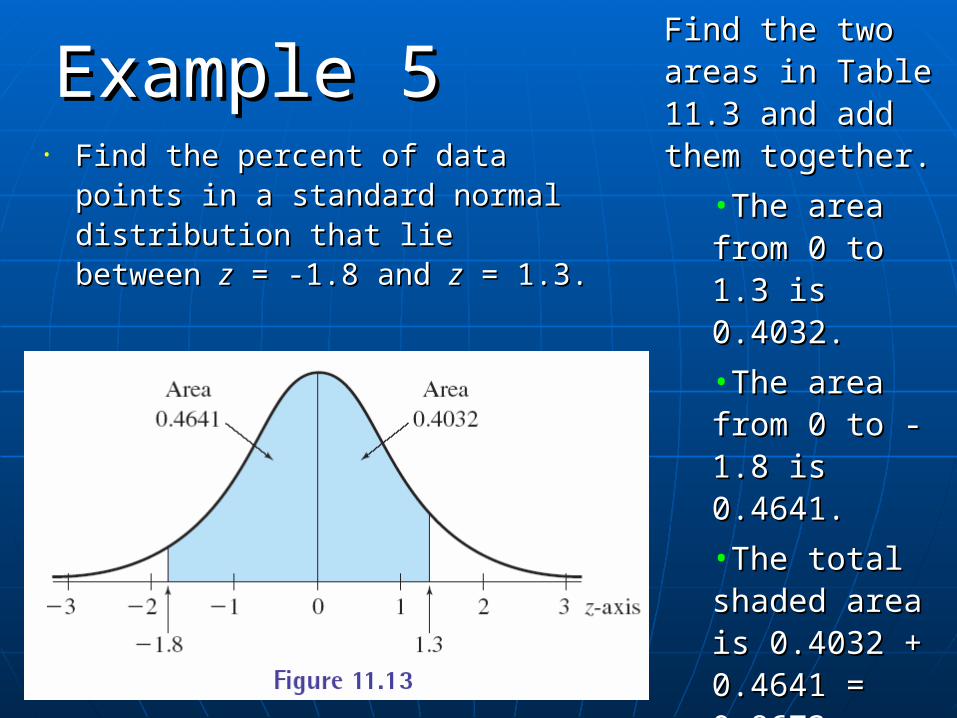
Example 5Example 5• Find the percent of data points in a Find the percent of data points in a
standard normal distribution that lie standard normal distribution that lie between between zz = -1.8 and = -1.8 and zz = 1.3. = 1.3.
Find the two areas Find the two areas in Table 11.3 and in Table 11.3 and add them together.add them together.
•The area from The area from 0 to 1.3 is 0 to 1.3 is 0.4032.0.4032.
•The area from The area from 0 to -1.8 is 0 to -1.8 is 0.4641.0.4641.
•The total The total shaded area is shaded area is 0.4032 + 0.4032 + 0.4641 = 0.4641 = 0.8673. 0.8673.

Example 6Example 6• Find the percent of data Find the percent of data
points in a standard normal points in a standard normal distribution that lie between distribution that lie between zz = 1.2 and = 1.2 and zz = 1.7. = 1.7.
Find the two areas Find the two areas in Table 11.3 and in Table 11.3 and subtract them.subtract them.
•The area from The area from 0 to 1.2 is 0 to 1.2 is 0.3849.0.3849.
•The area from The area from 0 to 1.7 is 0 to 1.7 is 0.4554.0.4554.
•The total The total shaded area is shaded area is 0.4554 - 0.3849 0.4554 - 0.3849 = 0.0705. = 0.0705.

11.1 Initial Problem Solution11.1 Initial Problem Solution
• A class of 90 students had a mean test score A class of 90 students had a mean test score of 74 with a standard deviation of 8 points.of 74 with a standard deviation of 8 points.
• The test will be curved so that all students The test will be curved so that all students whose scores are at least 1.5 standard whose scores are at least 1.5 standard deviations above or below the mean will deviations above or below the mean will receive As and Fs, respectively.receive As and Fs, respectively.
• How many students will get As and how many How many students will get As and how many will get Fs? will get Fs?
Initial Problem SolutionInitial Problem Solution• Because the class is large, it is likely the Because the class is large, it is likely the
scores have a normal distribution.scores have a normal distribution.• If the scores are curved:If the scores are curved:
• The mean of 74 will correspond to a score of 0 in The mean of 74 will correspond to a score of 0 in the standard normal distribution.the standard normal distribution.
• A score that is 1.5 standard deviations above the A score that is 1.5 standard deviations above the mean will correspond to a score of +1.5 in the mean will correspond to a score of +1.5 in the standard normal distribution, while a score that is standard normal distribution, while a score that is 1.5 standard deviations below the mean will 1.5 standard deviations below the mean will correspond to a score of -1.5.correspond to a score of -1.5.
Initial Problem SolutionInitial Problem Solution
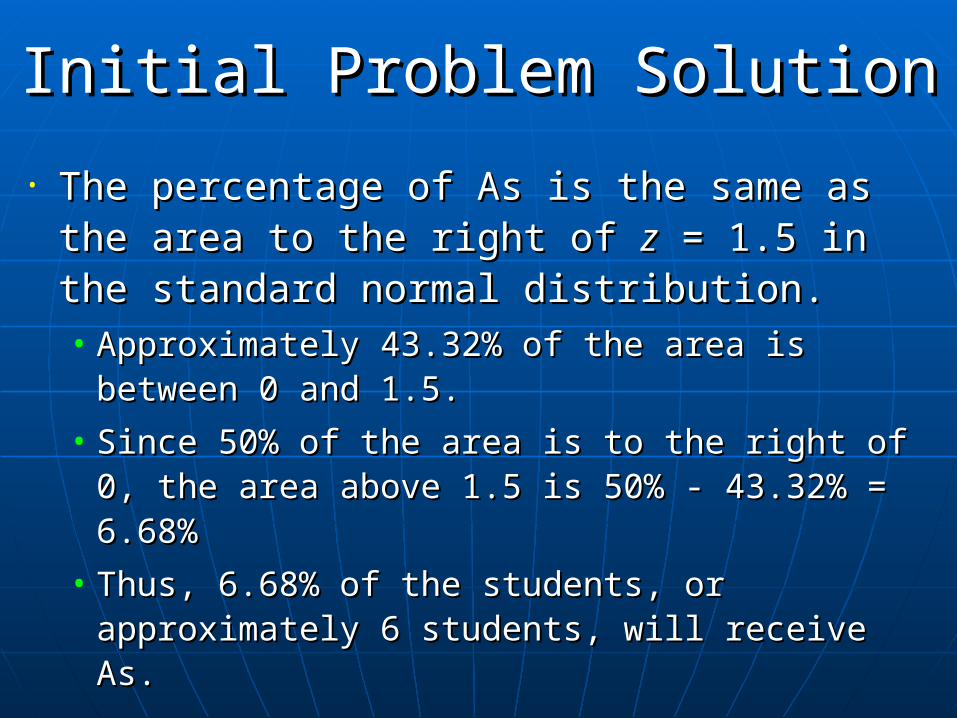
• The percentage of As is the same as the area The percentage of As is the same as the area to the right of to the right of zz = 1.5 in the standard normal = 1.5 in the standard normal distribution.distribution.• Approximately 43.32% of the area is between 0 Approximately 43.32% of the area is between 0
and 1.5.and 1.5.
• Since 50% of the area is to the right of 0, the Since 50% of the area is to the right of 0, the area above 1.5 is 50% - 43.32% = 6.68%area above 1.5 is 50% - 43.32% = 6.68%
• Thus, 6.68% of the students, or approximately 6 Thus, 6.68% of the students, or approximately 6 students, will receive As. students, will receive As.
Initial Problem SolutionInitial Problem Solution
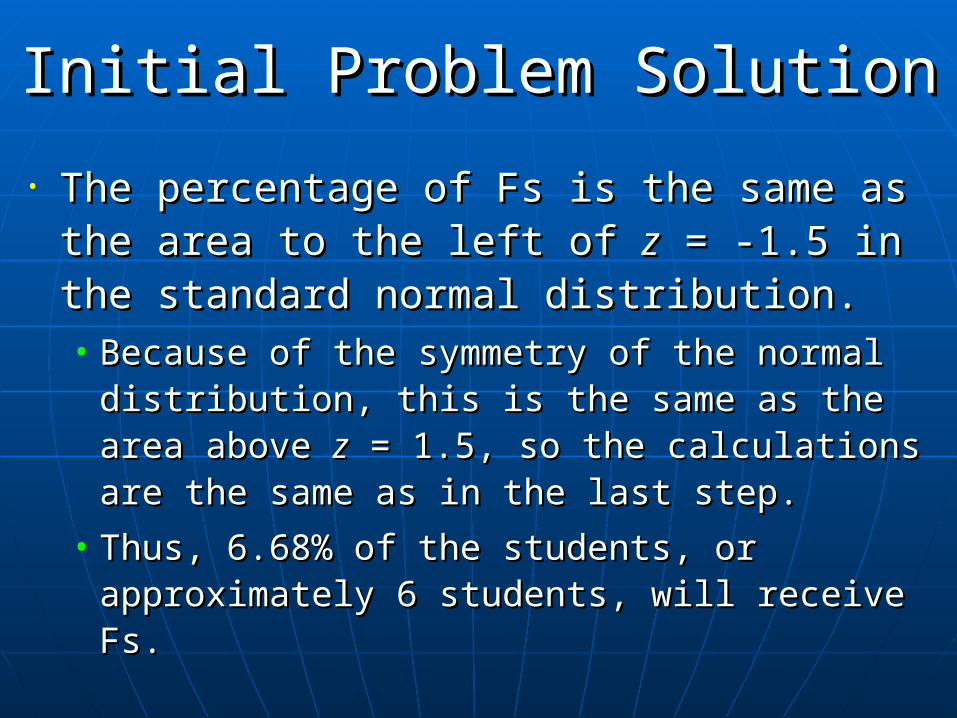
• The percentage of Fs is the same as the area The percentage of Fs is the same as the area to the left of to the left of zz = -1.5 in the standard normal = -1.5 in the standard normal distribution.distribution.• Because of the symmetry of the normal Because of the symmetry of the normal
distribution, this is the same as the area above distribution, this is the same as the area above zz = 1.5, so the calculations are the same as in the = 1.5, so the calculations are the same as in the last step.last step.
• Thus, 6.68% of the students, or approximately 6 Thus, 6.68% of the students, or approximately 6 students, will receive Fs. students, will receive Fs.
Section 11.2Section 11.2
Applications of Normal Applications of Normal
DistributionsDistributions
• GoalsGoals
• Study normal distribution applicationsStudy normal distribution applications• Use the 68-95-99.7 RuleUse the 68-95-99.7 Rule• Use the population Use the population zz-score-score

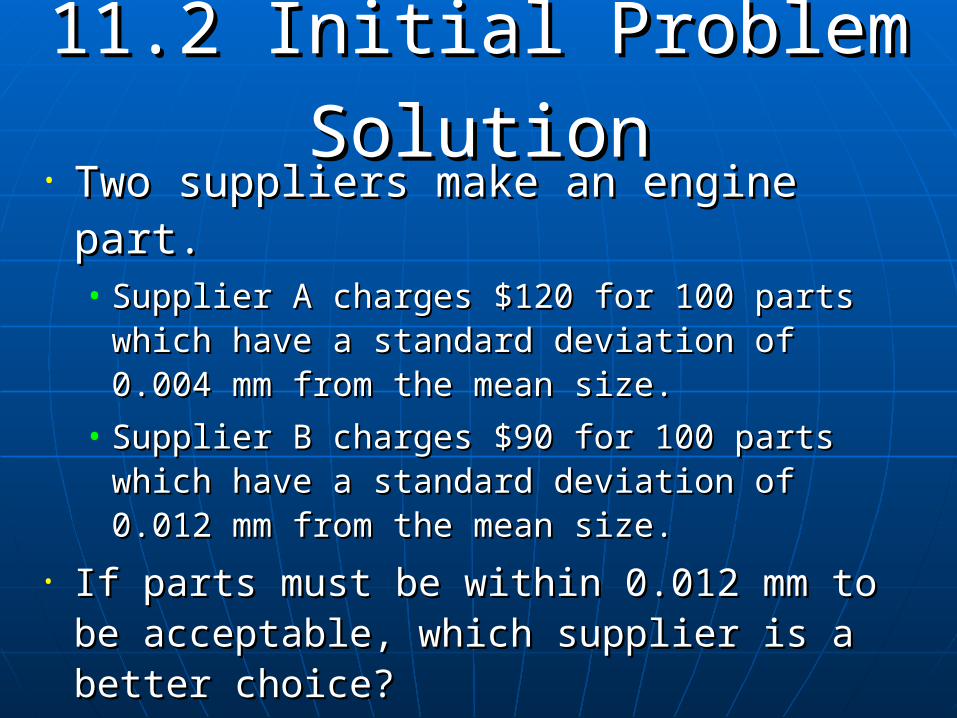
11.2 Initial Problem11.2 Initial Problem• Two suppliers make an engine part.Two suppliers make an engine part.
• Supplier A charges $120 for 100 parts which Supplier A charges $120 for 100 parts which have a standard deviation of 0.004 mm from have a standard deviation of 0.004 mm from the mean size.the mean size.
• Supplier B charges $90 for 100 parts which Supplier B charges $90 for 100 parts which have a standard deviation of 0.012 mm from have a standard deviation of 0.012 mm from the mean size.the mean size.
• Which supplier is a better choice?Which supplier is a better choice?• The solution will be given at the end of the The solution will be given at the end of the
section.section.
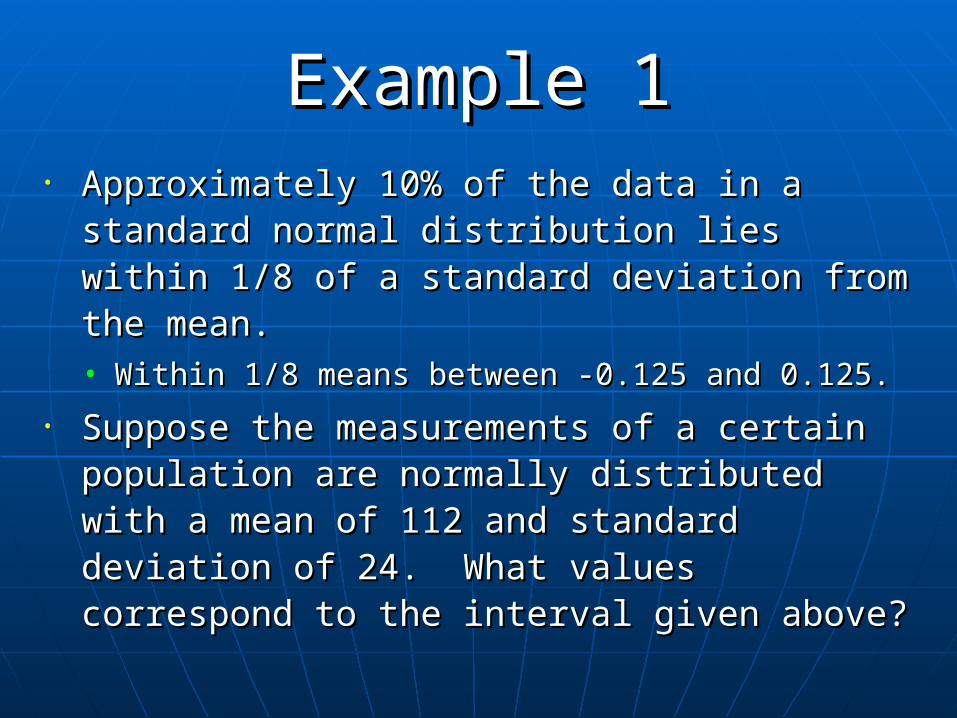
Example 1Example 1• Approximately 10% of the data in a Approximately 10% of the data in a
standard normal distribution lies within 1/8 standard normal distribution lies within 1/8 of a standard deviation from the mean.of a standard deviation from the mean.• Within 1/8 means between -0.125 and 0.125.Within 1/8 means between -0.125 and 0.125.
• Suppose the measurements of a certain Suppose the measurements of a certain population are normally distributed with a population are normally distributed with a mean of 112 and standard deviation of 24. mean of 112 and standard deviation of 24. What values correspond to the interval What values correspond to the interval given above?given above?
Example 1Example 1
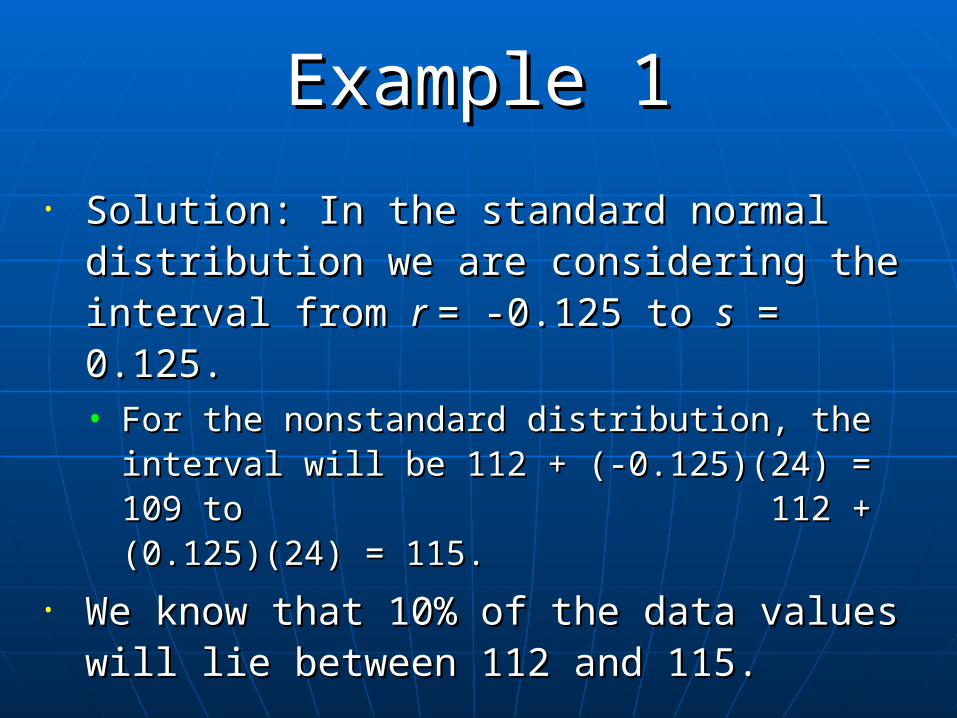
• Solution: In the standard normal distribution Solution: In the standard normal distribution we are considering the interval from we are considering the interval from r r = -= -0.125 to 0.125 to ss = 0.125. = 0.125.• For the nonstandard distribution, the interval will For the nonstandard distribution, the interval will
be 112 + (-0.125)(24) = 109 to be 112 + (-0.125)(24) = 109 to 112 + (0.125)(24) = 115.112 + (0.125)(24) = 115.
• We know that 10% of the data values will lie We know that 10% of the data values will lie between 112 and 115.between 112 and 115.
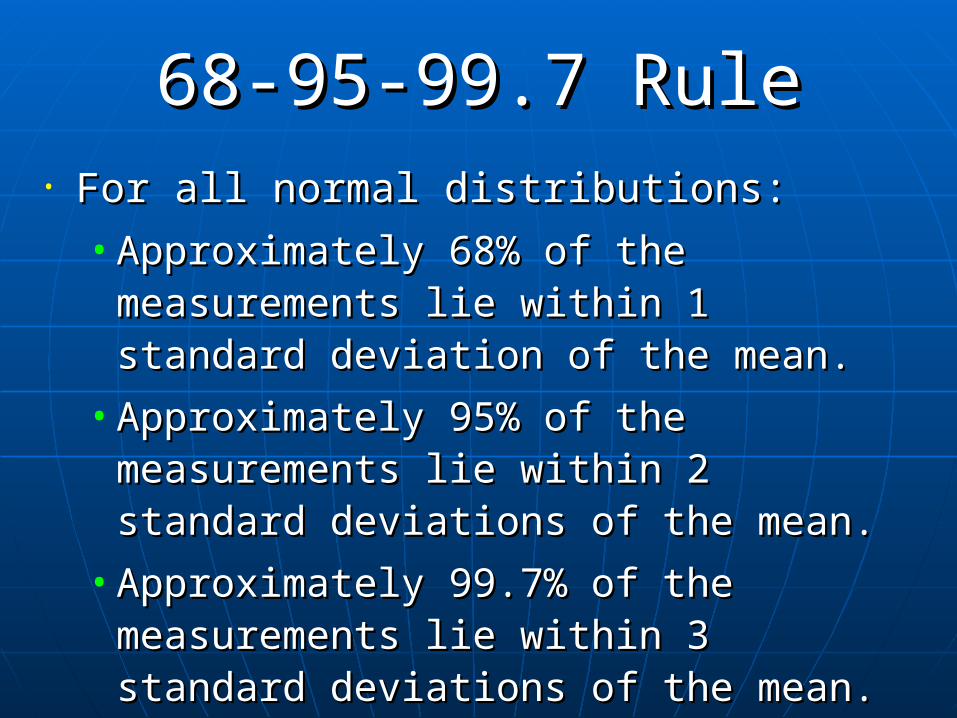
68-95-99.7 Rule68-95-99.7 Rule• For all normal distributions:For all normal distributions:
• Approximately 68% of the measurements Approximately 68% of the measurements lie within 1 standard deviation of the mean.lie within 1 standard deviation of the mean.
• Approximately 95% of the measurements Approximately 95% of the measurements lie within 2 standard deviations of the lie within 2 standard deviations of the mean.mean.
• Approximately 99.7% of the measurements Approximately 99.7% of the measurements lie within 3 standard deviations of the lie within 3 standard deviations of the mean.mean.

68-95-99.7 Rule68-95-99.7 Rule
Example 2Example 2
• The HDL cholesterol levels for a group of The HDL cholesterol levels for a group of women are approximately normally women are approximately normally distributed with a mean of 64 mg/dL and a distributed with a mean of 64 mg/dL and a standard deviation of 15 mg/dL.standard deviation of 15 mg/dL.
• Determine the percentage of these women Determine the percentage of these women that have HDL cholesterol levels between that have HDL cholesterol levels between 19 and 109 mg/dL. 19 and 109 mg/dL.
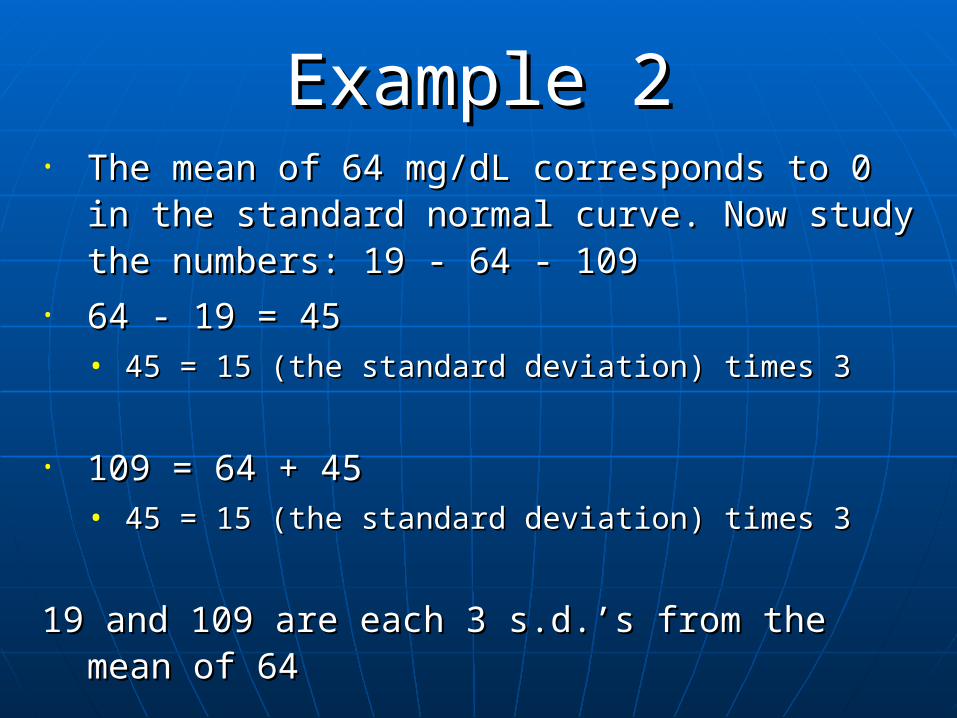
Example 2Example 2• The mean of 64 mg/dL corresponds to 0 in the The mean of 64 mg/dL corresponds to 0 in the
standard normal curve. Now study the numbers: standard normal curve. Now study the numbers: 19 - 64 - 10919 - 64 - 109
• 64 - 19 = 4564 - 19 = 45• 45 = 15 (the standard deviation) times 345 = 15 (the standard deviation) times 3
• 109 = 64 + 45109 = 64 + 45• 45 = 15 (the standard deviation) times 345 = 15 (the standard deviation) times 3
19 and 109 are each 3 s.d.’s from the mean of 6419 and 109 are each 3 s.d.’s from the mean of 64

Example 2Example 2• The area under the The area under the
standard normal standard normal curve between curve between zz = -3 = -3 and and zz = 3 is found: = 3 is found:
• From 0 to 3, there From 0 to 3, there is 49.85% of the is 49.85% of the area.area.
• From 0 to -3, there From 0 to -3, there is also 49.85%.is also 49.85%.
• Approximately, Approximately, 2(49.85%) = 99.7% 2(49.85%) = 99.7% of the women will of the women will have a HDL level have a HDL level between 19 and between 19 and 109 mg/dL. 109 mg/dL.
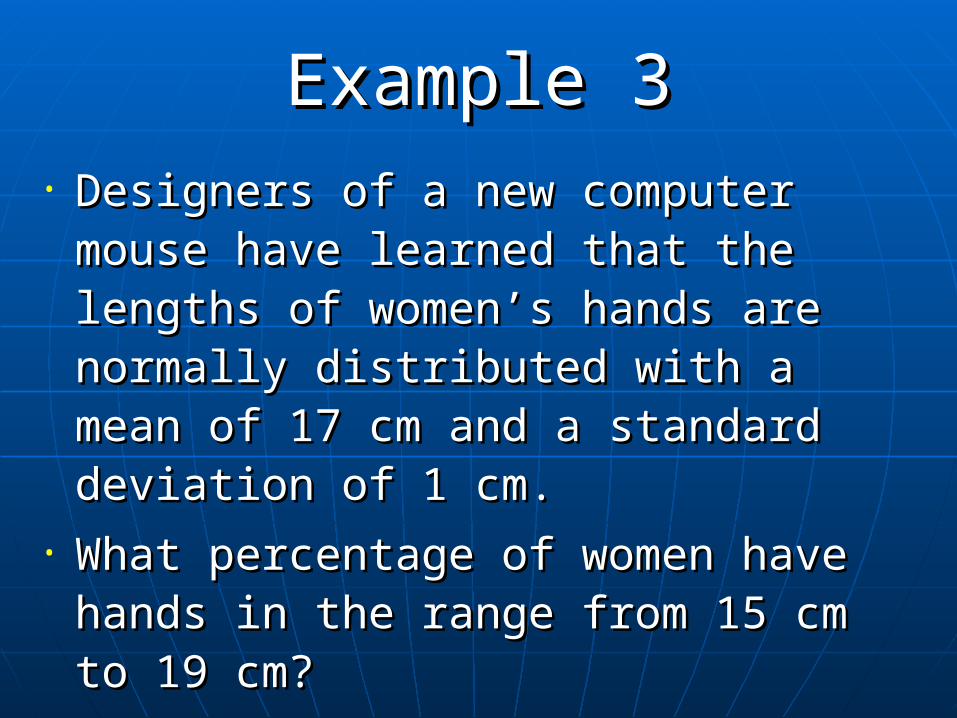
Example 3Example 3• Designers of a new computer mouse Designers of a new computer mouse
have learned that the lengths of have learned that the lengths of women’s hands are normally women’s hands are normally distributed with a mean of 17 cm and a distributed with a mean of 17 cm and a standard deviation of 1 cm.standard deviation of 1 cm.
• What percentage of women have What percentage of women have hands in the range from 15 cm to 19 hands in the range from 15 cm to 19 cm? cm?

Example 3Example 3• Solution: Solution:
• A length of 15 cm is 2 standard deviations A length of 15 cm is 2 standard deviations below the mean of 17 cm.below the mean of 17 cm.
• A length of 19 cm is 2 standard deviations A length of 19 cm is 2 standard deviations above the mean of 17 cm.above the mean of 17 cm.
• According to the 68-95-99.7 Rule, the According to the 68-95-99.7 Rule, the percent of women whose hands are within percent of women whose hands are within 2 standard deviations of the mean length 2 standard deviations of the mean length is 95%. is 95%.

Population Population zz-scores-scores• The formula for converting a normal The formula for converting a normal
distribution value to a standard normal distribution value to a standard normal distribution value is called a distribution value is called a population population zz-score-score..
• The population The population zz-score of a -score of a measurement, measurement, xx, is given by:, is given by:
xz
μσ−
=
Example 5Example 5
• Suppose a normal distribution has a Suppose a normal distribution has a mean of 4 and a standard deviation of mean of 4 and a standard deviation of 3. 3.
• Find the Find the zz-scores of the measurements -scores of the measurements -1, 2, 3, 5, and 9. -1, 2, 3, 5, and 9.
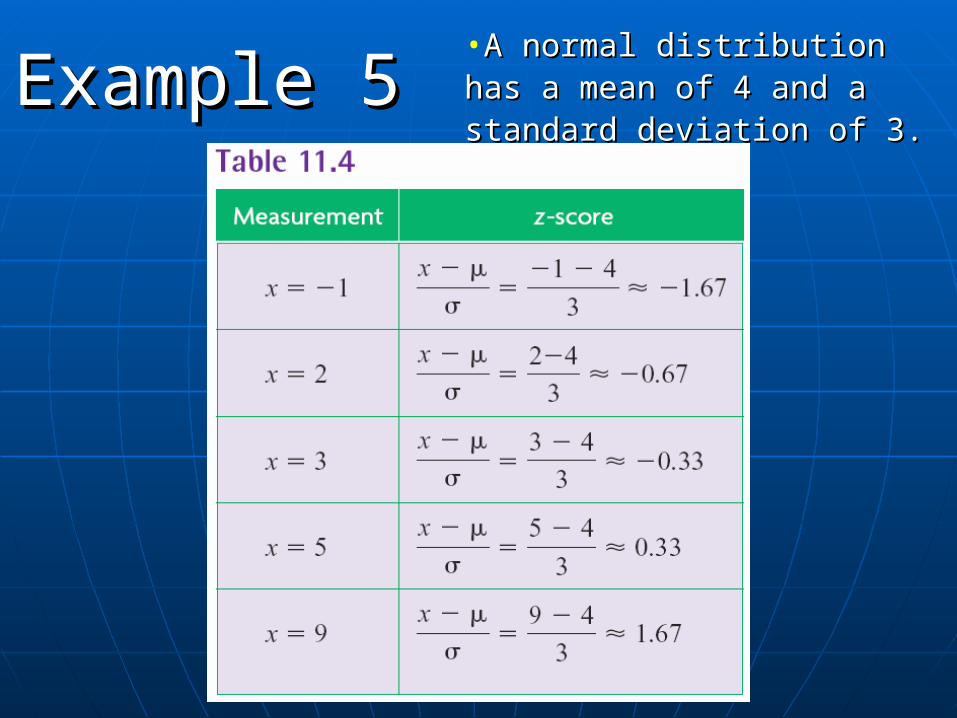
Example 5Example 5•A normal distribution has a A normal distribution has a mean of 4 and a standard mean of 4 and a standard deviation of 3. deviation of 3.
Example 5Example 5
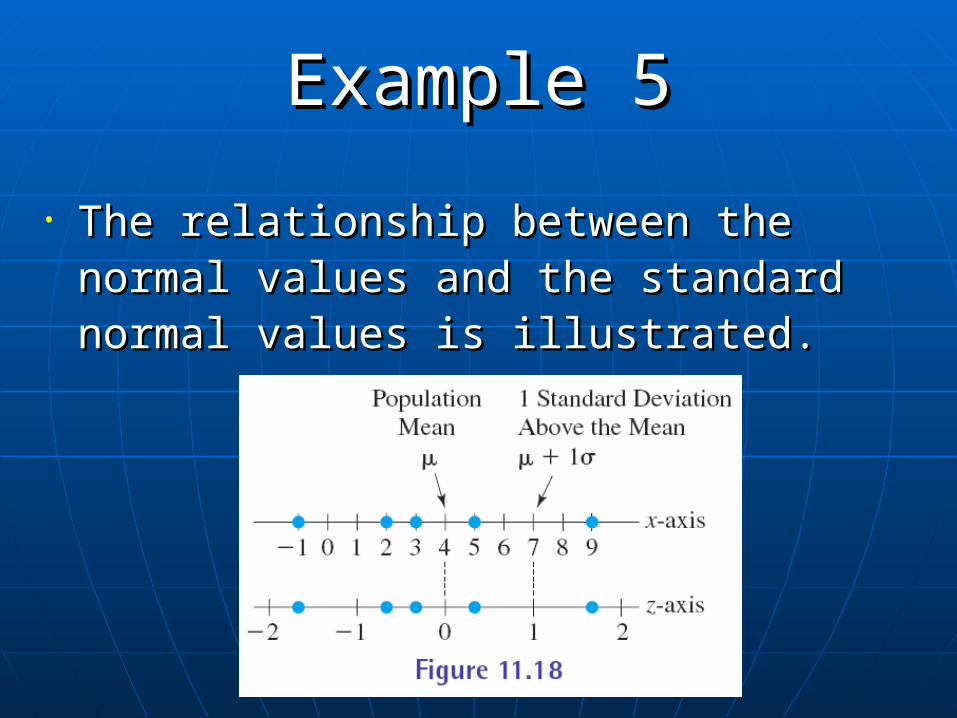
• The relationship between the normal values The relationship between the normal values and the standard normal values is and the standard normal values is illustrated. illustrated.

Example 6Example 6
• In 1996, the finishing times for the New York In 1996, the finishing times for the New York City Marathon were approximately normal, City Marathon were approximately normal, with a mean of 260 minutes and a standard with a mean of 260 minutes and a standard deviation of about 50 minutes.deviation of about 50 minutes.
• What percentage of the finishers that year What percentage of the finishers that year had times between 285 minutes and 335 had times between 285 minutes and 335 minutes.minutes.
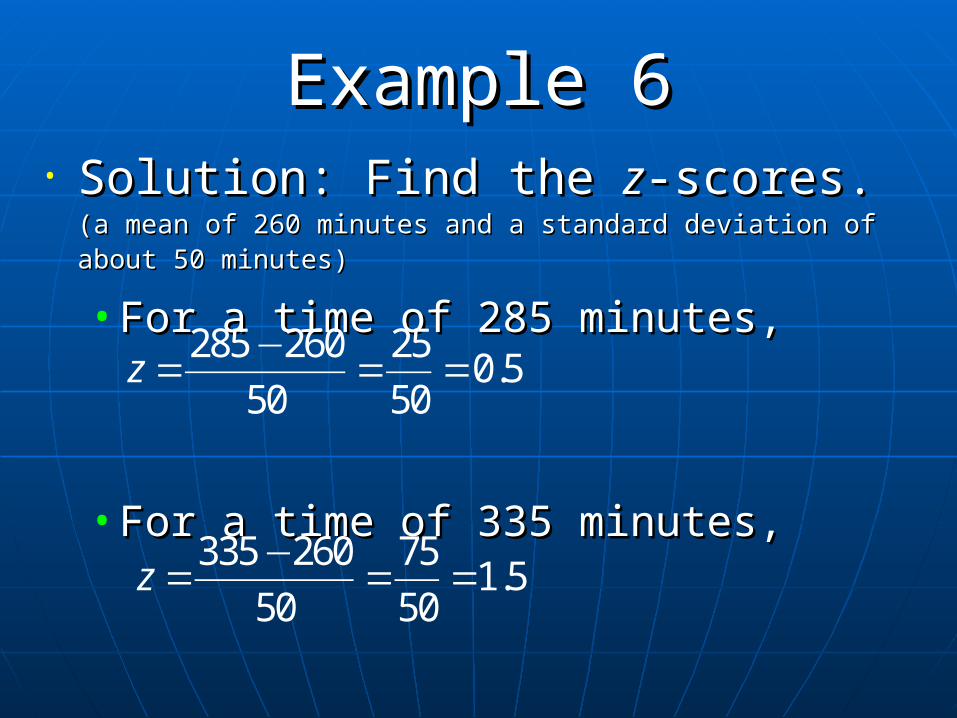
Example 6Example 6• Solution: Find the Solution: Find the zz-scores. -scores. (a mean of 260 (a mean of 260
minutes and a standard deviation of about 50 minutes)minutes and a standard deviation of about 50 minutes)
• For a time of 285 minutes,For a time of 285 minutes,
• For a time of 335 minutes,For a time of 335 minutes,
285 260 250.5
50 50z
−= = =
335 260 751.5
50 50z
−= = =
Example 6Example 6
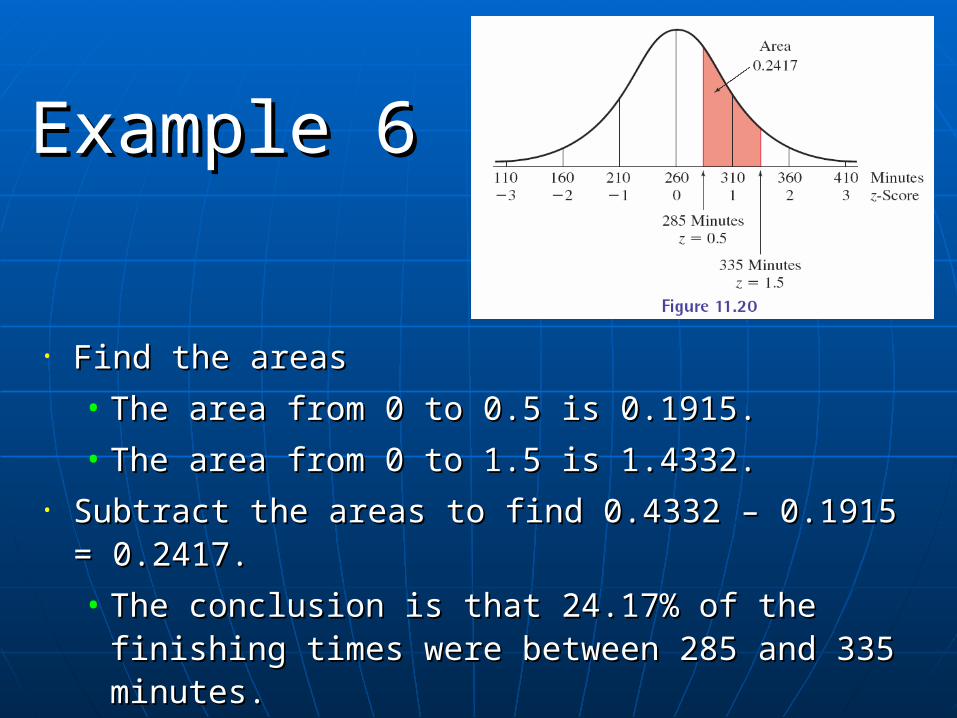
• Find the areasFind the areas
• The area from 0 to 0.5 is 0.1915.The area from 0 to 0.5 is 0.1915.
• The area from 0 to 1.5 is 1.4332.The area from 0 to 1.5 is 1.4332.• Subtract the areas to find 0.4332 – 0.1915 = Subtract the areas to find 0.4332 – 0.1915 =
0.2417.0.2417.
• The conclusion is that 24.17% of the finishing The conclusion is that 24.17% of the finishing times were between 285 and 335 minutes. times were between 285 and 335 minutes.

Example 7Example 7
• Recall the distribution of HDL cholesterol Recall the distribution of HDL cholesterol levels from the previous example, with a levels from the previous example, with a mean of 64 mg/dL and a standard deviation mean of 64 mg/dL and a standard deviation of 15 mg/dL.of 15 mg/dL.
• If an HDL level of If an HDL level of 40 mg/dL or below40 mg/dL or below signals signals an increased risk for coronary heart an increased risk for coronary heart disease, what percentage of the women disease, what percentage of the women studied are at increased risk? studied are at increased risk?
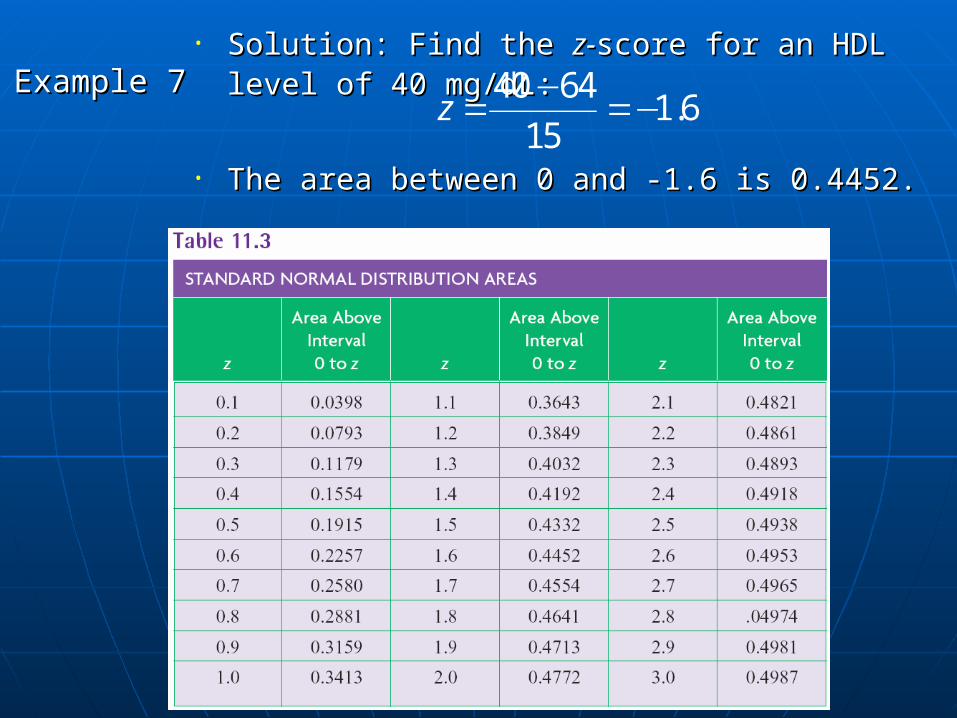
Example 7Example 7• Solution: Find the Solution: Find the z-z-score for an HDL level of 40 score for an HDL level of 40
mg/dL: mg/dL:
• The area between 0 and -1.6 is 0.4452.The area between 0 and -1.6 is 0.4452.
40 641.6
15z
−= =−
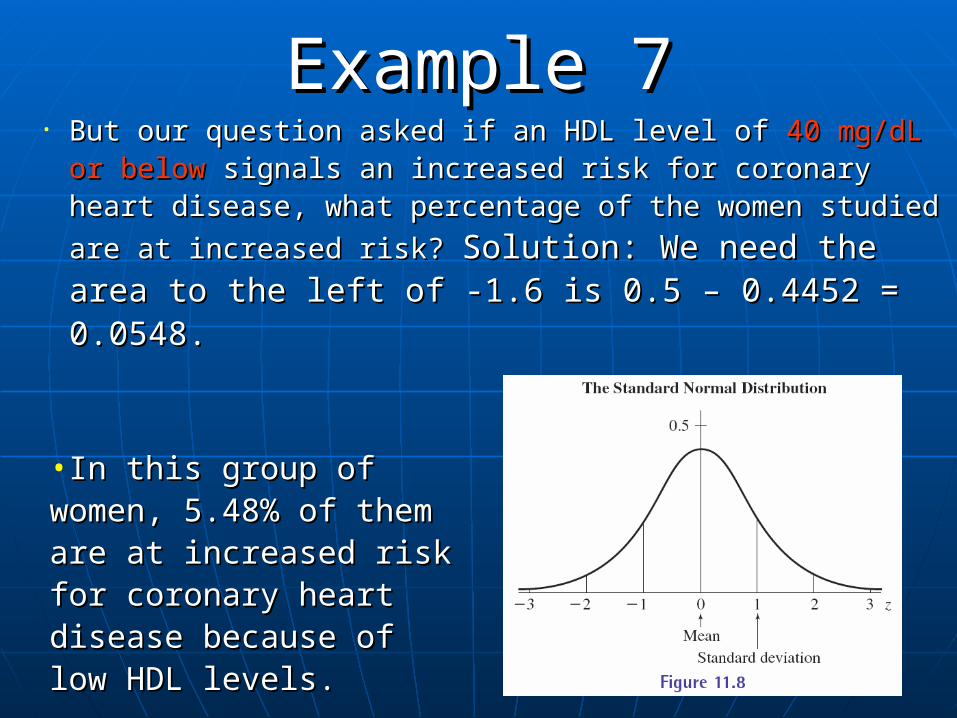
Example 7Example 7• But our question asked if an HDL level of But our question asked if an HDL level of 40 mg/dL or 40 mg/dL or
belowbelow signals an increased risk for coronary heart signals an increased risk for coronary heart disease, what percentage of the women studied are at disease, what percentage of the women studied are at
increased risk? increased risk? Solution: We need the area to Solution: We need the area to the left of -1.6 is 0.5 – 0.4452 = 0.0548.the left of -1.6 is 0.5 – 0.4452 = 0.0548.
•In this group of women, In this group of women, 5.48% of them are at 5.48% of them are at increased risk for coronary increased risk for coronary heart disease because of low heart disease because of low HDL levels.HDL levels.
11.2 Initial Problem Solution11.2 Initial Problem Solution• Two suppliers make an engine part.Two suppliers make an engine part.
• Supplier A charges $120 for 100 parts which Supplier A charges $120 for 100 parts which have a standard deviation of 0.004 mm from have a standard deviation of 0.004 mm from the mean size.the mean size.
• Supplier B charges $90 for 100 parts which Supplier B charges $90 for 100 parts which have a standard deviation of 0.012 mm from have a standard deviation of 0.012 mm from the mean size.the mean size.
• If parts must be within 0.012 mm to be If parts must be within 0.012 mm to be acceptable, which supplier is a better acceptable, which supplier is a better choice?choice?
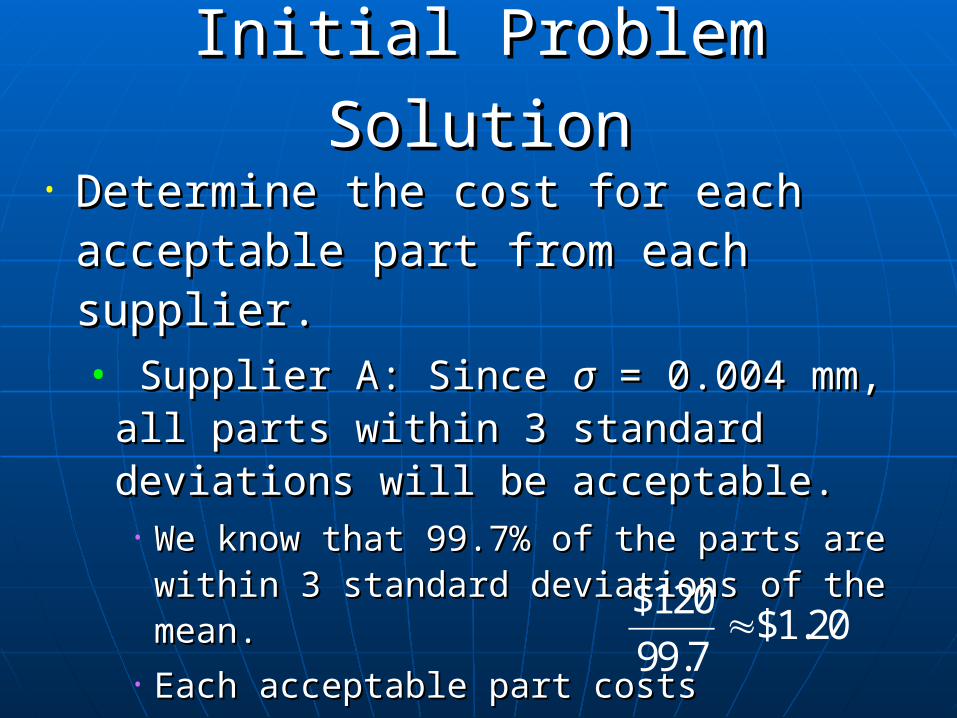
Initial Problem SolutionInitial Problem Solution
• Determine the cost for each acceptable Determine the cost for each acceptable part from each supplier.part from each supplier.• Supplier A: Since Supplier A: Since σσ = 0.004 mm, all parts = 0.004 mm, all parts
within 3 standard deviations will be within 3 standard deviations will be acceptable.acceptable.
• We know that 99.7% of the parts are within 3 We know that 99.7% of the parts are within 3 standard deviations of the mean.standard deviations of the mean.
• Each acceptable part costs Each acceptable part costs $120$1.20
99.7≈

Initial Problem SolutionInitial Problem Solution
• Determine the cost for each acceptable Determine the cost for each acceptable part from each supplier.part from each supplier.• Supplier B: Since Supplier B: Since σσ = 0.012 mm, all parts = 0.012 mm, all parts
within 1 standard deviation will be within 1 standard deviation will be acceptable.acceptable.
• We know that 68% of the parts are within 1 We know that 68% of the parts are within 1 standard deviation of the mean.standard deviation of the mean.
• Each acceptable part costs Each acceptable part costs $90$1.32
68≈
Initial Problem SolutionInitial Problem Solution
• Overall each part from supplier B costs Overall each part from supplier B costs less than each part from supplier A, but less than each part from supplier A, but more parts from B will have to be more parts from B will have to be thrown away.thrown away.
• Each acceptable part from supplier B Each acceptable part from supplier B costs more than each acceptable part costs more than each acceptable part from supplier A.from supplier A.
• They should choose supplier A. They should choose supplier A.
Section 11.3Section 11.3
Confidence IntervalsConfidence Intervals• GoalsGoals
• Study proportionsStudy proportions• Study population proportionsStudy population proportions• Study sample proportionsStudy sample proportions
• Study confidence intervalsStudy confidence intervals• Study margin of errorStudy margin of error
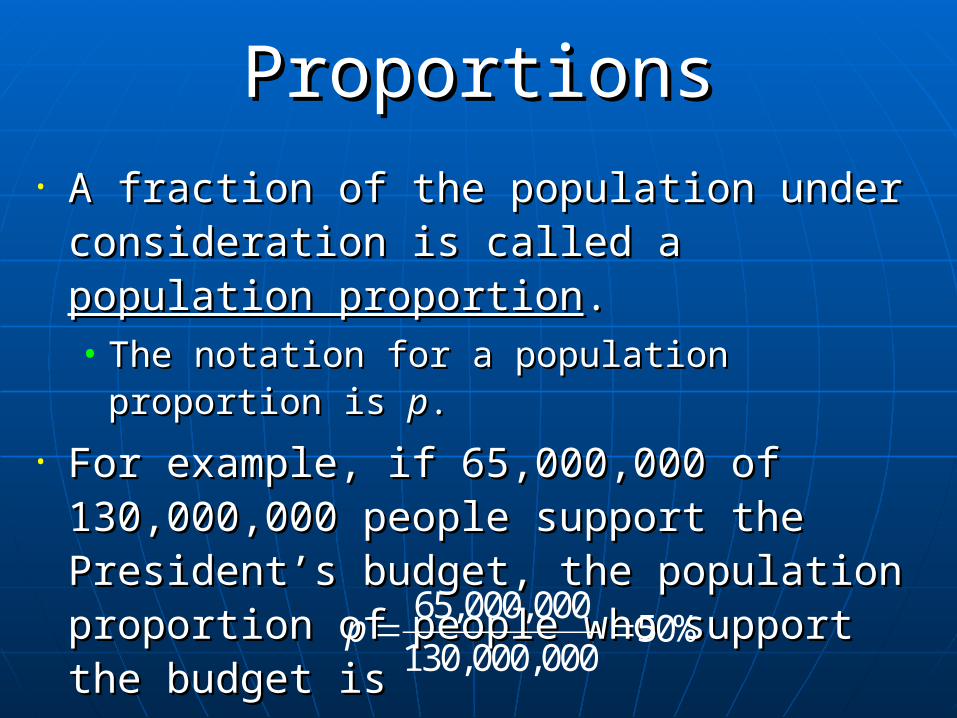
ProportionsProportions• A fraction of the population under A fraction of the population under
consideration is called a consideration is called a population population proportionproportion..• The notation for a population proportion is The notation for a population proportion is pp..
• For example, if 65,000,000 of 130,000,000 For example, if 65,000,000 of 130,000,000 people support the President’s budget, the people support the President’s budget, the population proportion of people who support population proportion of people who support the budget isthe budget is 65,000,000
50%130,000,000
p = =
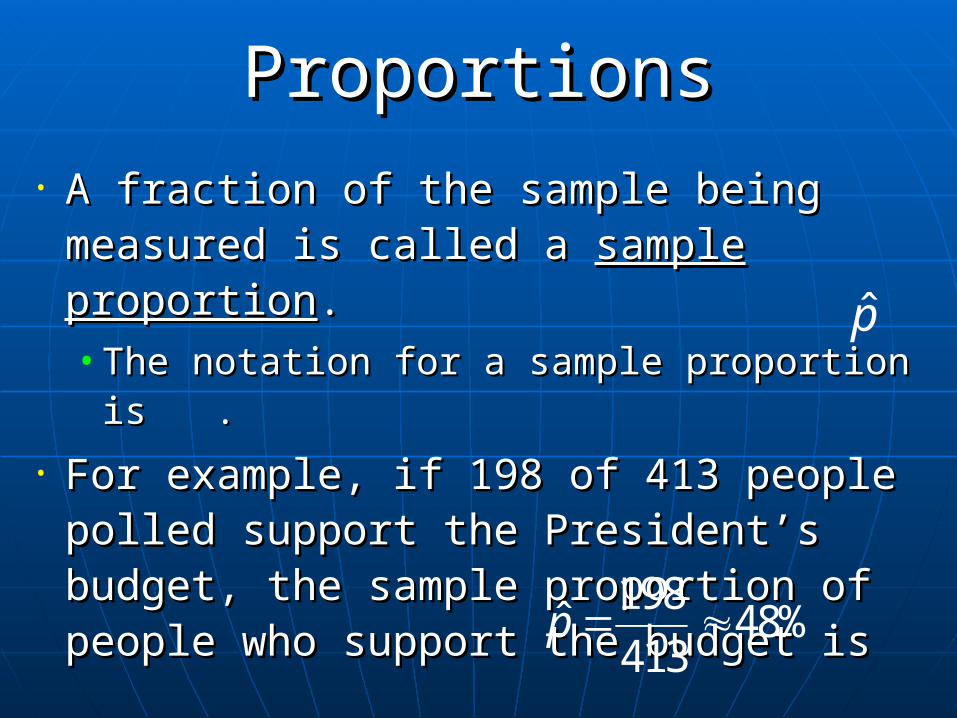
ProportionsProportions
• A fraction of the sample being A fraction of the sample being measured is called a measured is called a sample proportionsample proportion..• The notation for a sample proportion is .The notation for a sample proportion is .
• For example, if 198 of 413 people polled For example, if 198 of 413 people polled support the President’s budget, the support the President’s budget, the sample proportion of people who sample proportion of people who support the budget issupport the budget is 198
ˆ 48%413
p = ≈
p̂
Example 1Example 1
• A college has 3520 freshman, of which 1056 have A college has 3520 freshman, of which 1056 have consumed an alcoholic beverage in the last 30 consumed an alcoholic beverage in the last 30 days.days.
• Of the 50 students surveyed in a health class, 11 Of the 50 students surveyed in a health class, 11 say they have had an alcoholic beverage in the last say they have had an alcoholic beverage in the last 30 days.30 days.
• What are the population proportion and the sample What are the population proportion and the sample proportion?proportion?
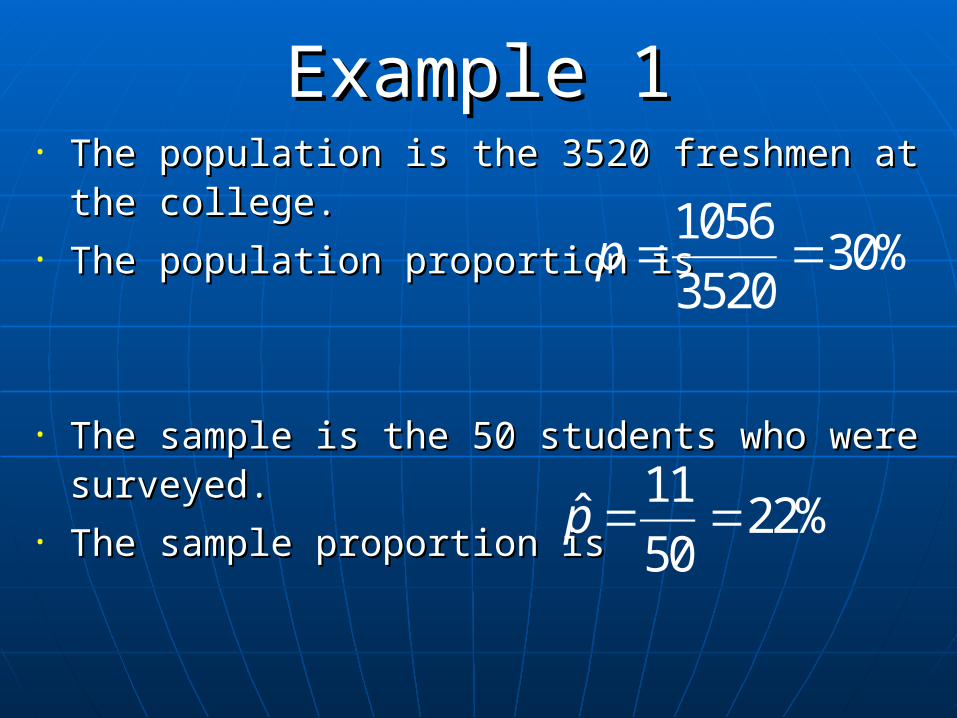
Example 1Example 1• The population is the 3520 freshmen at the college.The population is the 3520 freshmen at the college.• The population proportion is The population proportion is
• The sample is the 50 students who were surveyed.The sample is the 50 students who were surveyed.• The sample proportion is The sample proportion is
105630%
3520p = =
11ˆ 22%
50p = =
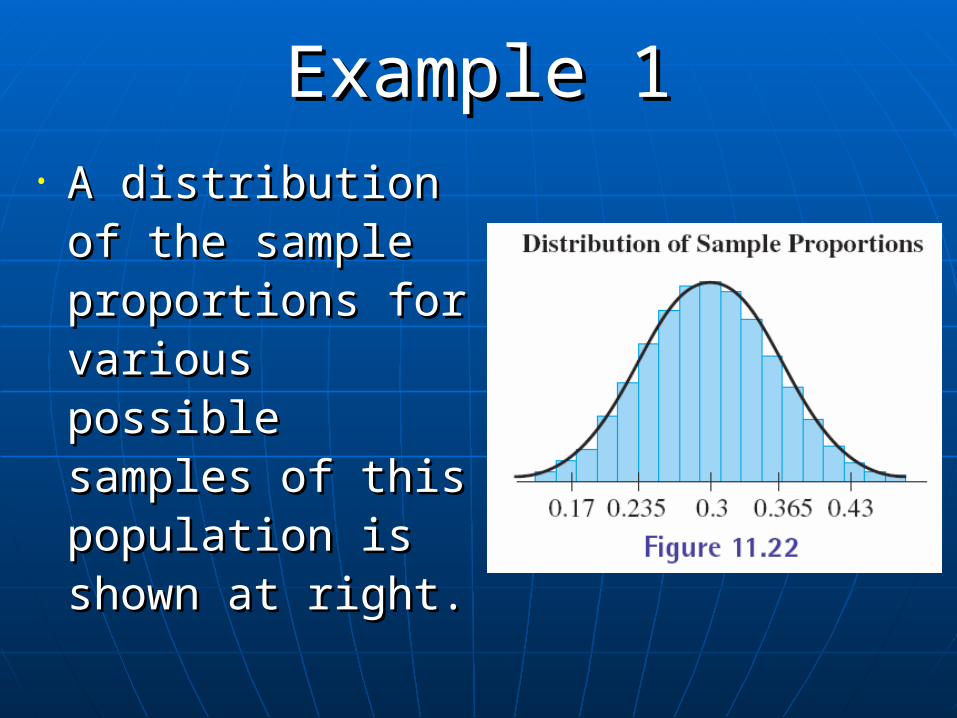
Example 1Example 1• A distribution of A distribution of
the sample the sample proportions for proportions for various possible various possible samples of this samples of this population is population is shown at right.shown at right.

Sample Proportions DistributionSample Proportions Distribution
• If samples of size If samples of size nn are taken from a are taken from a population having a population population having a population proportion proportion pp, then the set of all sample , then the set of all sample proportions has a mean and standard proportions has a mean and standard deviation of:deviation of:•
•
pμ =
( )1p p
nσ
−=
Example 2Example 2
• Suppose the population proportion of a Suppose the population proportion of a group is 0.4, and we choose a simple group is 0.4, and we choose a simple random sample of size 30.random sample of size 30.
• Find the mean and standard deviation Find the mean and standard deviation of the set of all sample proportions.of the set of all sample proportions.

Example 2Example 2
• Solution: In this case, Solution: In this case, • pp = 0.4 and = 0.4 and nn = 30. = 30.
• The mean is The mean is
• The standard deviation is The standard deviation is
0.4pμ = =
( ) ( )1 0.4 1 0.40.09
30
p p
nσ
− −= = ≈
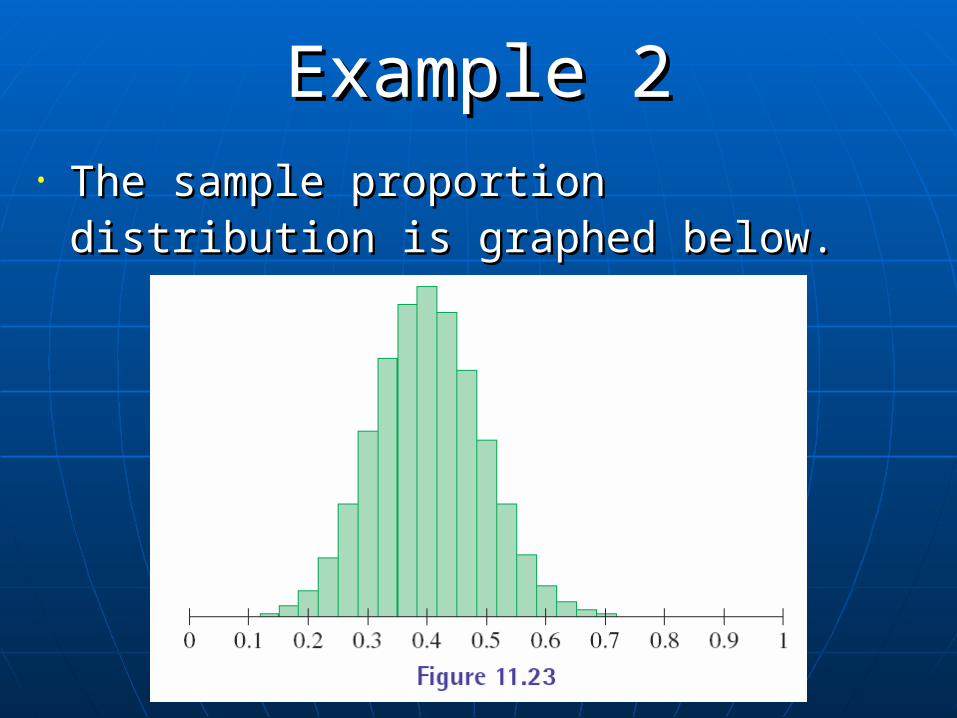
Example 2Example 2• The sample proportion distribution is graphed The sample proportion distribution is graphed
below.below.

Example 3Example 3
• Fox News asked 900 registered voters whether or Fox News asked 900 registered voters whether or not they would take a smallpox vaccine.not they would take a smallpox vaccine.
• Suppose it is known that 60% of all Americans Suppose it is known that 60% of all Americans would take the vaccine. What is the approximate would take the vaccine. What is the approximate percentage of samples for which between 58% and percentage of samples for which between 58% and 62% of voters in the sample would take the shot? 62% of voters in the sample would take the shot?

Example 3Example 3
• Solution: We know that Solution: We know that pp = 0.6, so the mean = 0.6, so the mean of the sample proportion distribution is 0.6.of the sample proportion distribution is 0.6.
• The sample size is The sample size is nn = 900, so the standard = 900, so the standard deviation is deviation is
( ) ( )1 0.6 1 0.60.02
900
p p
nσ
− −= = ≈
Example 3Example 3
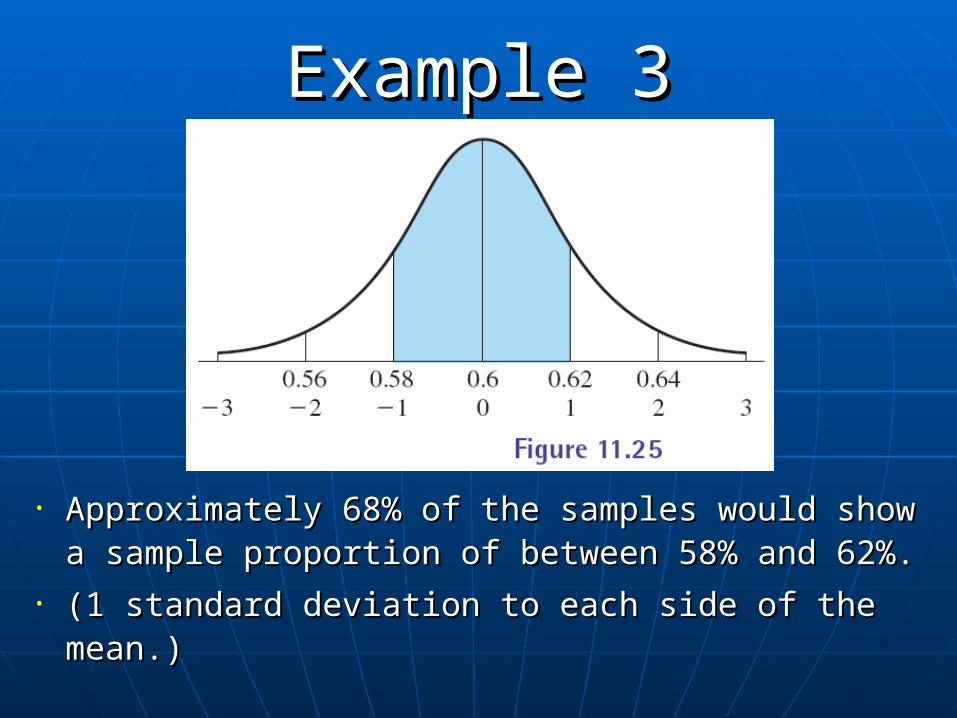
• Approximately 68% of the samples would show a Approximately 68% of the samples would show a sample proportion of between 58% and 62%. sample proportion of between 58% and 62%.
• (1 standard deviation to each side of the mean.)(1 standard deviation to each side of the mean.)
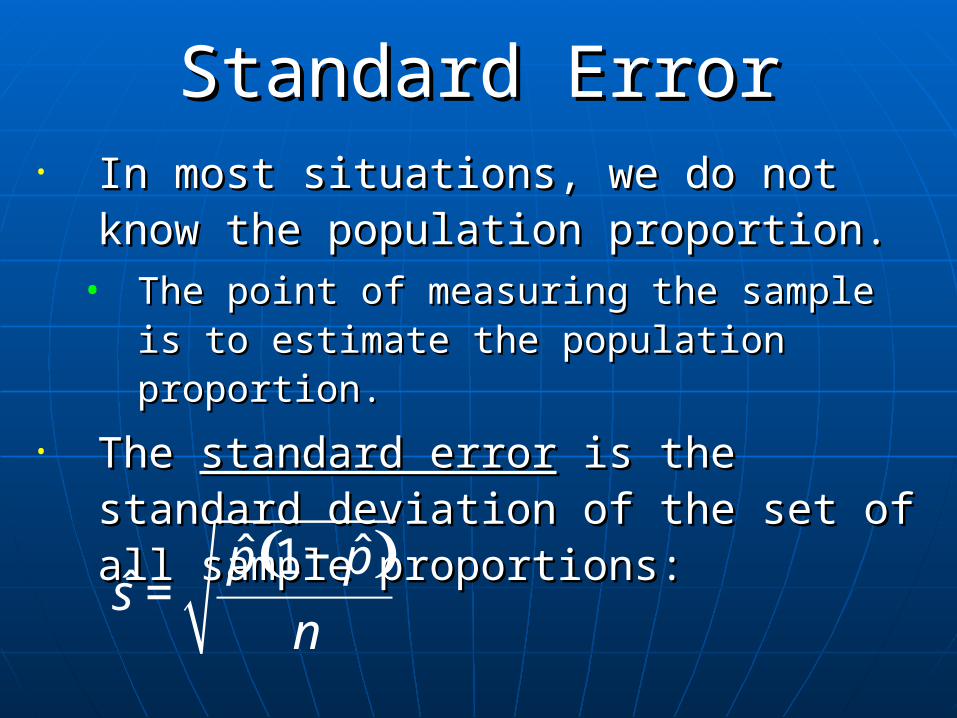
Standard ErrorStandard Error• In most situations, we do not know the In most situations, we do not know the
population proportion.population proportion.• The point of measuring the sample is to The point of measuring the sample is to
estimate the population proportion.estimate the population proportion.
• The The standard errorstandard error is the standard deviation is the standard deviation of the set of all sample proportions:of the set of all sample proportions:
( )ˆ ˆ1ˆ
p ps
n
−=
Example 4Example 4
• What is the standard error in a sample What is the standard error in a sample of size 400 if the sample proportion in of size 400 if the sample proportion in one sample is 35%?one sample is 35%?

Example 4Example 4
• Solution: Use the formula from the Solution: Use the formula from the previous slide:previous slide:
( ) ( )ˆ ˆ1 0.35 1 0.35ˆ 0.024
400
p ps
n
− −= = ≈
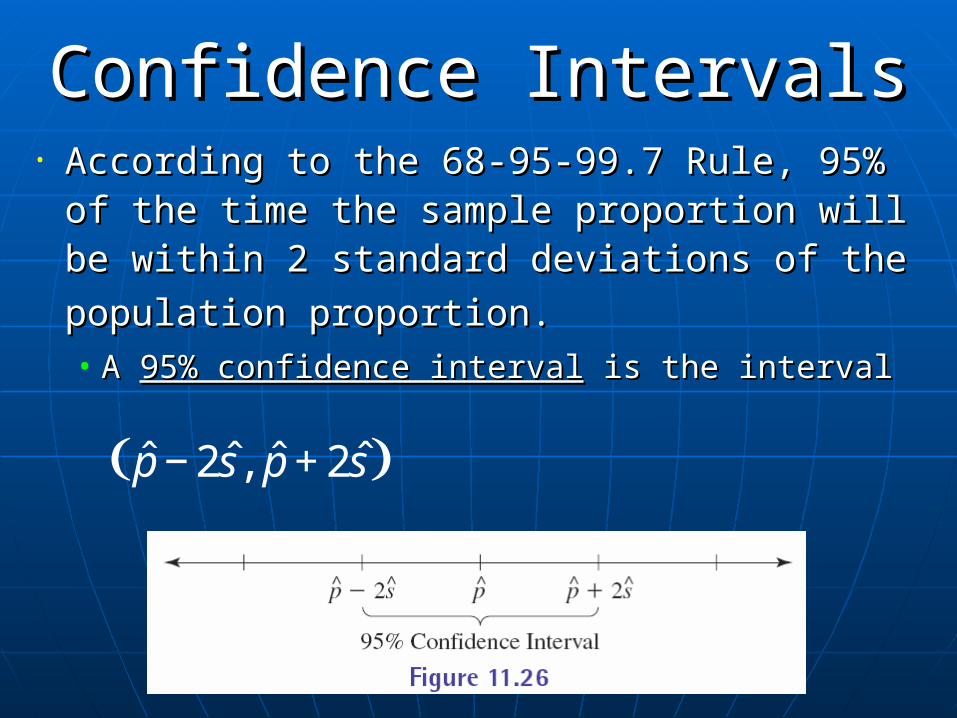
Confidence IntervalsConfidence Intervals• According to the 68-95-99.7 Rule, 95% of the According to the 68-95-99.7 Rule, 95% of the
time the sample proportion will be within 2 time the sample proportion will be within 2 standard deviations of the population standard deviations of the population
proportion.proportion. • A A 95% confidence interval95% confidence interval is the interval is the interval
( )ˆ ˆ ˆ ˆ2 , 2p s p s− +
Confidence IntervalsConfidence Intervals
• For a 95% confidence interval, the For a 95% confidence interval, the margin of errormargin of error is is
• s is called the standard error and is s is called the standard error and is calculated the same way as standard calculated the same way as standard deviation.deviation.
ˆ2s±
Example 5Example 5
• Determine the 95% confidence interval Determine the 95% confidence interval and the margin of error for a sample and the margin of error for a sample size of 400 with a sample proportion of size of 400 with a sample proportion of 35%.35%.
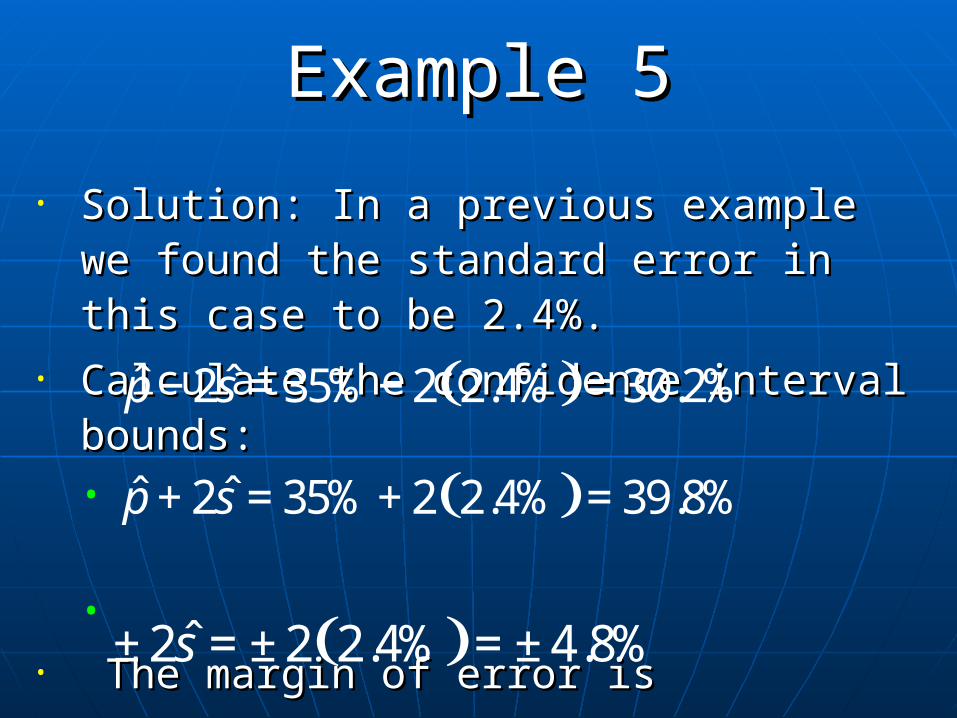
Example 5Example 5
• Solution: In a previous example we found Solution: In a previous example we found the standard error in this case to be 2.4%.the standard error in this case to be 2.4%.
• Calculate the confidence interval bounds:Calculate the confidence interval bounds:•
•
• The margin of error is The margin of error is
( )ˆ ˆ2 35% 2 2.4% 30.2%p s− = − =
( )ˆ ˆ2 35% 2 2.4% 39.8%p s+ = + =
( )ˆ2 2 2.4% 4.8%s± = ± = ±
Example 6Example 6
• In a sample of 600 U.S. citizens, 362 In a sample of 600 U.S. citizens, 362 people say they drive an American-built people say they drive an American-built car.car.
• Find the 95% confidence interval and Find the 95% confidence interval and the margin of error for the proportion of the margin of error for the proportion of the population that drive an American-the population that drive an American-built car. built car.

Example 6Example 6
• Solution: The sample proportion is: Solution: The sample proportion is:
• The standard error is:The standard error is:
362ˆ 0.603
600p = =
( ) ( )ˆ ˆ1 0.603 1 0.603ˆ 0.020
600
p ps
n
− −= = ≈
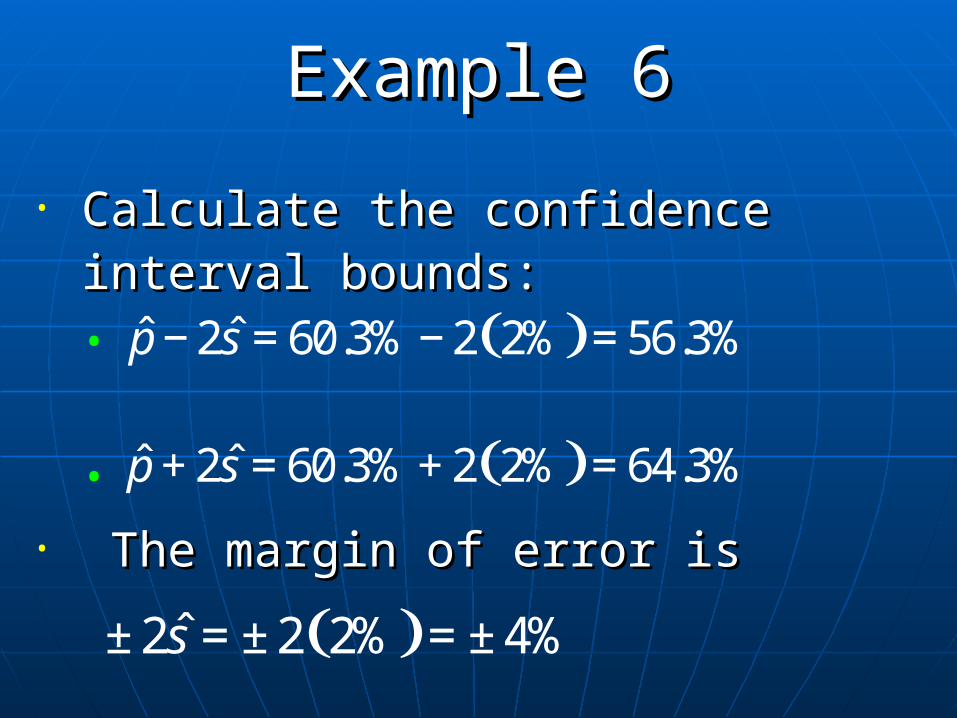
Example 6Example 6
• Calculate the confidence interval Calculate the confidence interval bounds:bounds:•
•
• The margin of error is The margin of error is
( )ˆ ˆ2 60.3% 2 2% 56.3%p s− = − =
( )ˆ2 2 2% 4%s± = ± = ±
( )ˆ ˆ2 60.3% 2 2% 64.3%p s+ = + =
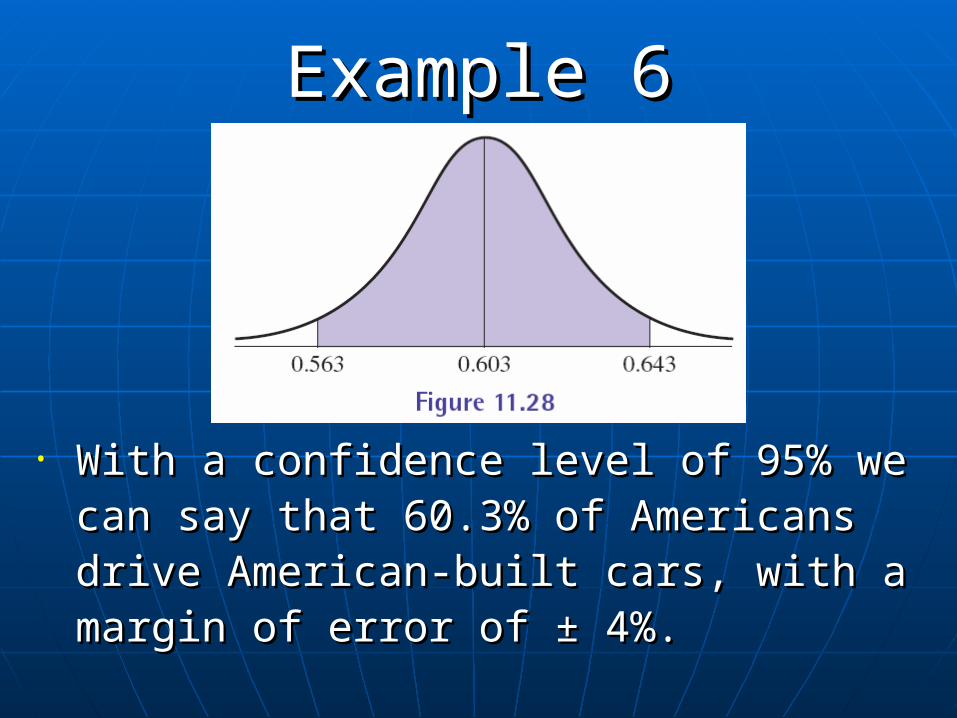
Example 6Example 6
• With a confidence level of 95% we can With a confidence level of 95% we can say that 60.3% of Americans drive say that 60.3% of Americans drive American-built cars, with a margin of American-built cars, with a margin of error of error of ± 4%.± 4%.
Chapter 11 Assignment
• Section 11.1 pg 711 (3-6, 11,12,17-22,31,32)
• Section 11.2 pg 723 (3a,b,4a,b,10a,b,11,15,23)
• Section 11.3 pg 738 (3,5,9,23,29,33)
Related Documents