! ! ! ! ! ! ! ! ! ! ! ! ! ! ! ! ! ! ! ! ! ! ! ! ! ! ! ! ! ! A Strategic Plan for Economic Development for the Northwest Alabama Economic Development District prepared by the Northwest Alabama Council of Local Governments (NACOLG) Northwest Alabama Comprehensive Economic Development Strategy 2012

Welcome message from author
This document is posted to help you gain knowledge. Please leave a comment to let me know what you think about it! Share it to your friends and learn new things together.
Transcript
!
!
!
!
!
! !
!
!
!
!
!
!
!
!
!
!
!
!!!
!
!
! !
!!
!
!
!
A Strategic Plan for Economic Development for the Northwest
Alabama Economic Development District
prepared by the Northwest Alabama Council of Local
Governments (NACOLG)
Northwest Alabama Comprehensive Economic Development Strategy
2012

Sect
ion
1.0:
Intr
oduc
tion:
Pur
pose
, Pro
cess
and
Org
aniz
atio
n
1
1.0 Introduction: Purpose, Process and Organization
1.1. Comprehensive Economic Development Strategy & Purpose
The Comprehensive Economic Development Strategy (CEDS) is a five‐year strategy for economic
development in northwest Alabama. It brings together private and public interests to create a guide to
economic development for the five‐county region of northwest Alabama that includes Lauderdale,
Colbert, Franklin, Marion, and Winston Counties. The CEDS is designed as a regional comprehensive
plan. It involves development district partners, including local government representatives, workforce
training providers, non‐profit Chambers of Commerce, local economic development authorities; it
encompasses a broad range of important initiatives in order to define the economic development
landscape of northwest Alabama and direct the Northwest Alabama Council of Local Governments
(NACOLG), which is the regional Planning Organization designated by the Economic Development
Administration of the U.S. Chamber of Commerce.
Through analysis of the region’s unique characteristics, the CEDS provides an opportunity to
analyze the human and physical capital of the region and establish priorities for investment and funding
leading to job creation and retention. The CEDS is the outcome of an on‐going, diverse and inclusive
planning process involving both private and public partners. This process allows the formation of a
strategy representing the widest possible constituency and presenting the viewpoints of laypeople and
professionals as to the direction and character of economic growth in the region. This understanding of
economic development priorities allows for targeted investment into economic development initiatives
with the broadest support and greatest likelihood of success.
In addition to the broad‐based planning components of the CEDS, the document is required to
qualify for federal investments under the Public Works and Economic Development Act of 1965. EDA
investments are intended to promote and complement private sector investment in economic
development in areas suffering from economic dislocation due to changes in global competitiveness,
acute historic economic hardship, or sudden and severe job loss. The document is prepared by a
Planning Organization, which is responsible for appointing a Strategy, submitting a compliant CEDS
document (see 13 CFR 303.7), updating or revising the CEDS, and reporting the CEDS to other entities.
The Planning Organization charged with managing the CEDS process for Region I in Alabama is the
Northwest Alabama Council of Local Governments.
1.2 The Planning Organization, CEDS Committee, and CEDS Content
The Northwest Alabama Council of Local Governments (NACOLG) represents the five counties
and 32 municipalities of northwest Alabama. Founded in 1967, NACOLG houses numerous planning and
governmental service functions, including Aging Services, Transit, Metropolitan and Rural Transportation
Planning, and a staff of grant‐writers and planners. Since 2002, the five‐county NACOLG region has
been an Economic Development District, the regional designation used by the Economic Development
Administration to administer public works assistance, economic adjustment planning aid, and technical
assistance. The NACOLG Board of Directors has also served as the Economic Development District
Board.
2
Regulations require that the Board name a Strategy Committee to oversee the development and
review of the CEDS. This committee is composed of representatives of public and private organizations
including major regional employers, governments, workforce development representatives, labor
groups and minority groups. The broadly representative body must be constituted by a majority of
private sector representatives chosen from the executive and managerial level employees of for‐profit
enterprises. Remaining members represent non‐profit sectors, governments, and higher education.
Regulations also mandate a portion of the content of the CEDS. An acceptable document must
include an overview of the economic geography and economic conditions of the region, to include:
economy, population, geography, workforce development and use, transportation access, resources,
environment and other pertinent data. The document provides an in‐depth analysis of the strengths,
weaknesses, opportunities, and threats in the economic development of the region and identifies the
topmost regional priorities for implementation.
As a Planning Organization with a number of additional functions, NACOLG encourages CEDS
participation on the part of the public, private interests and individuals as a means of identifying
priorities for investment. Although inclusion in the CEDS is a requirement for certain federal funding
opportunities, NACOLG strongly promotes the CEDS plan and planning process as an opportunity for
coordinating additional efforts, such as MPO, RPO and other implementation opportunities. The
incorporation of wide regional projects (both short and long term) into one document and into a process
of continuous review maintains awareness and increases leverage and opportunity for implementing
these projects. The multi‐jurisdictional nature of the CEDS includes in its planning process opportunities
for implementation from a comprehensive variety of sources, including local, state and federal agencies
and actors and representing private and public sources of investment and implementation resources.
1.3 The CEDS Planning Process: Planning for Partnership
A broad understanding of the direction and long‐term goals of economic development activities
is necessary for crafting the strategic building blocks of economic and community development. Under
the planning framework for the Northwest Alabama CEDS, the implementation of one or several
strategies accomplishes an objective; several related objectives realize a particular goal. From this
perspective, the CEDS takes on both short‐ and long‐range significance as the centerpiece economic
planning and as the central economic priority‐setting mechanism for the activities of the region’s
economic development district. Whether resulting from private or public sources or located within a
local, regional or statewide scale, the CEDS’ comprehensive nature is designed to coordinate investment
and implementation opportunities and direct these toward the region’s highest identified priorities to
sustain economic growth.
Foremost, the CEDS process is meant to be a private‐public partnership with the goal of creating
a viable short‐, intermediate‐ and long‐range economic development plan. To this end, the CEDS Strategy Committee met in May нлмн. A second essential eleƳent of the CEDS review process involved public participation, discussion and feedback. To accomplish this, local level public
meetings were held in July and August 2012 in the five counties of the NACOLG region.
3
1.3.1 Plan Development
The process of developing the plan, which is interactive, exploratory, and informative, is the
heart of any plan. The final document plays an important role, encapsulating the discoveries made
along the way, but never fully encompasses the significance of planning in terms of capacity‐building
and networking. To facilitate this process, NACOLG engaged the development community at four
distinct levels: the executive‐level elected officials of the region, represented on the NACOLG/EDD
Board; the Strategy Committee, made up of public‐ and private‐sector representatives; development
partners identified from the regional community; and the general public. Of these groups, the CEDS
Committee, development partners, and the highest elected officials of the various local governments
were specifically targeted to encourage the greatest input and feedback. The NACOLG/EDD Board was
involved through participation in local level public meetings, particularly in the latter discussions related
to specific strategies, and through oversight and adoption of the final CEDS document. Throughout the
process, the general public was kept informed through media coverage and Internet publications found
at the NACOLG website.
The development of the plan began in January 2012 when a strategy was adopted for producing
an economic audit, reviewing existing development efforts (strategies from previous CEDS and the
strategic plans of partners and multi‐jurisdictional agencies), and garnering feedback. Data‐gathering
began for the conduct of the economic audit portion of the plan (See Section 3) as did the development
of the Strategy Committee and partnership structures. Two phases of public meetings and discussions
were agreed upon, with the first encompassing the visioning and goal‐setting portion of the plan and the
latter to provide an opportunity to review and comment upon specific project proposals to be included
as strategies for implementing the plan. The meetings were divided between local‐level public
meetings meant to obtain input and review of the plan at the county level and meetings of the Strategy
Committee, which was represented the region as a whole and incorporated local initiatives into a
broader framework for economic development.
1.3.2 Vision, Goals, and Objectives
The final stage of establishing a framework for economic planning was synthesizing feedback
from various meetings and previous planning actions into an ongoing and adaptive framework to plan
for economic growth. This was accomplished by establishing a planning framework classifying planning
priorities in terms of priorities and time horizons for achievement. These planning activities produced a
framework stating goals, objectives, and strategies representing development priorities with different
time requirements. All planning activities outlined in the CEDS represent methods of achieving an
overall Economic Vision in the following planning framework:
Vision: Statement of the priority or highest accomplishment of the plan.
Goals: What is to be accomplished in categorical terms.
Objectives: What must be done to meet goals, expressed in more specific terms.
4
Strategic Projects, Programs and Activities: Specific work items for implementing the plan, which
are divided into suggested projects and vital projects.
To fill in the layers of this framework, both abstract, value‐oriented positions and concrete,
project‐oriented approaches were considered. The Economic Vision was established, which represented
the highest order economic values for the region, by reference to the longstanding Vision Statement of
the Comprehensive Economic Development Strategy, which was reviewed and very slightly revised in
the current five‐year plan. From the various feedback gained, the Economic Vision endorsed by the
Board and the CEDS Committee was the following:
Northwest Alabama will continue to be a regional community defined by a distinctive and
recognizable identity, high quality of life, strong leadership and public participation, resilience, and
unity in pursuit of a sustainable, globally and regionally competitive economy.
Next, the assets and weaknesses were examined for insight into the goals of regional
development. These goals were designed to be comprehensive‐ that is, encompassing the broadest
range of priorities for economic and community development necessary for economic growth and
prosperity. From conversations, feedback, and responses it became obvious that the goals of economic
development could not be neatly segregated away from community development objectives. In other
words, to support economic development and to provide the employment, wage and industrial
opportunities needed, the region must also consider the quality and content of its community
development agenda. This meant that regional and local actors must provide for workforce, housing,
education, neighborhood and infrastructure developments that were conducive to producing economic
opportunities.
Three related goals surfaced this process. These were discussed and endorsed by the Strategy
Committee and the EDD Board because of their broad support and repeated iteration in planning
meetings. Although prioritized differently at each of the four local levels, Infrastructure (Transportation
and Community Facilities), Support for Business and Industry (Workforce Development, Recruitment
and Retention), and Community Capacity Development (Planning and Capacity Building) were
categories of activities that seemed to capture the essence of much of the interrelated actions needed
for regional economic development. These categorical statements were expanded into broader
statements and incorporated as development priorities in the CEDS plan. They are described more fully
in Section 4.0.
Next, working from concrete proposals to fill in the gaps in the planning framework, strategic
projects and activities were examined. These were categorized as either suggested projects, which are
important but not directly related to jobs and private investment, or vital projects related directly to
economic development through the creation of jobs and private investment. Examining the ways in
which these strategic projects tended to cluster provided a framework for establishing the middle tier
objectives, or benchmarks, for the CEDS. A summary of Vision, Goals and Objectives is presented below.
A review of strategic projects is presented in Section 7.0 CEDS Plan of Action.
5
Summary
The vision, goals and objectives of the Northwest Alabama Comprehensive Economic
Development Strategy are as follows:
Northwest Alabama will continue to be a regional community defined by a distinctive and
recognizable identity, high quality of life, strong leadership and public participation, resilience, and
unity in pursuit of a sustainable, globally and regionally competitive economy.
Goal I: Infrastructure (Transportation and Community Facilities)‐ Improve the quality of infrastructure
in northwest Alabama’s counties, cities, and communities.
Objective (a): Identify and remedy dangerous transportation patterns throughout the region.
Objective (b): Improve regional and local surface transportation networks to increase access to
goods, services, markets, and employment opportunities.
Objective (c): Identify and complete improvements to the region’s multi‐modal transportation
network to improve local and regional access to goods, services, markets, and employment
opportunities.
Objective (d): Identify and complete improvements to infrastructure systems and community
facilities that allow for a continued high quality of life by municipal and county residents.
Objective (e): Foster sharing of municipal services and public infrastructure where beneficial to
area municipalities and counties.
Objective (f): Seek funding for housing initiatives and neighborhood redevelopment fostering
compact commercial and residential forms.
Goal II: Support for Business and Industry (Workforce Development, Recruitment and Retention) ‐
Establish strategies that coordinate public agencies and private entities in a cooperative effort to
attract and retain business and industry.
Objective (a): Expand access to and understanding of technology in the region, including
communications and workforce/workplace technology required for advanced manufacturing and
other business needs.
Objective (b): Identify opportunities to expand workforce development opportunities by
coordinating agencies and industries/businesses and implementing appropriate
educational/skills development and recruitment programs.
Objective (c): Promote strategies that prepare the region to attract new business and industries,
including appropriate workforce and infrastructure initiatives, as a means of attracting higher‐
skill and higher‐wage employment opportunities.
6
Objective (d): Support the retention and expansion of existing businesses through programs to
attract and enhance financial and human resources.
Goal III: Community Capacity Building (Planning and Capacity Building) ‐ Promote quality of life and
community identity necessary to leverage the economic benefits of physical and human capital.
Objective (a): Explore the application of asset based economic development principles to the
development programs of the region.
Objective (b): Improve resident and visitor recreational and cultural opportunities as a means of
facilitating population growth, retention, and increased economic opportunity.
Objective (c): Initiate an urban and neighborhood planning process that provides master plans
and infrastructure improvement assessments for municipalities and counties within the NACOLG
region.
Objective (d): Promote community resiliency and preparedness for disasters and severe economic
shocks, including the preparation of communities and the continuing recovery efforts of
communities affected by the April 27, 2011 tornadoes.
1.4 Implementation and Performance Measurement
The CEDS is designed to be a results‐oriented plan that guides the regional planning and
development efforts of the Planning Organization in the short term, while establishing practices,
policies, and initiatives that will lead to long‐term, transformative development in northwest Alabama.
Responsibility for implementing the CEDS rests with the Planning Organization in conjunction with
member governments and regional partners. Progress and Performance are defined and measured
separately. Progress will be measured with respect to action items included in Section 6.0 and described
more fully in Section 7.0. Performance will be measured with respect to the objective criteria found in
Section 8.0.
Another significant change to the format of the CEDS has been the separation of strategies into
Vital and Suggested Strategies and the choice to further describe these as Action or Awareness items. In
order to hold the Planning Organization accountable, the Strategy Committee and EDD Board of
Directors chose to identify strategic priorities beyond the authority or direct control of the Planning
Organization and to focus instead on accountability for actions within the scope of the agency’s
resources and authority. As mentioned above, progress will be measured with reference to the Vital
and Suggested Projects while Performance will be measured objectively with reference to the metrics
found in Section 8.0.
1.5 Document Organization
The remainder of the CEDS document describes the background for economic planning in
Northwest Alabama, including a description of the political and geographic environment (Section 2.0) as
well as an economic audit of the region (Section 3.0). Both the background information and the
7

economic audit are designed to provide relevant, timely material to economic developers throughout
the region. The broad array of information, in particular the statistical information of Section 3.0, is
meant to be a foundation for further inquiries undertaken by Planning Organization staff and other
economic developers. These statements do not represent the definitive conclusions of the Planning
Organization or its partners; instead, they are a point of reference and a beginning point for a
continuous process of inquiry designed to provide greater understanding of the economic climate, its
components, and its effects and the residents of Northwest Alabama. Then, in Section 4.0 the planning
framework of the CEDS is reviewed and the goals and objectives of the plan are described in greater
detail before presenting the specific project‐oriented strategies included in the 2012 CEDS. The
collaborative planning framework of the CEDS is described in Section 5.0, which details the agency’s
efforts to develop the CEDS through community partnerships and outreach. Section 6.0 presents the
strategic projects, priorities, and activities of the CEDS; and Section 7.0 presents a detailed plan of
action. Section 8.0 contains a review of specific, objective performance metrics that will be used to
evaluate the Planning Organization’s performance in addition to progress.
8

Sect
ion
2.0:
Bac
kgro
und
9
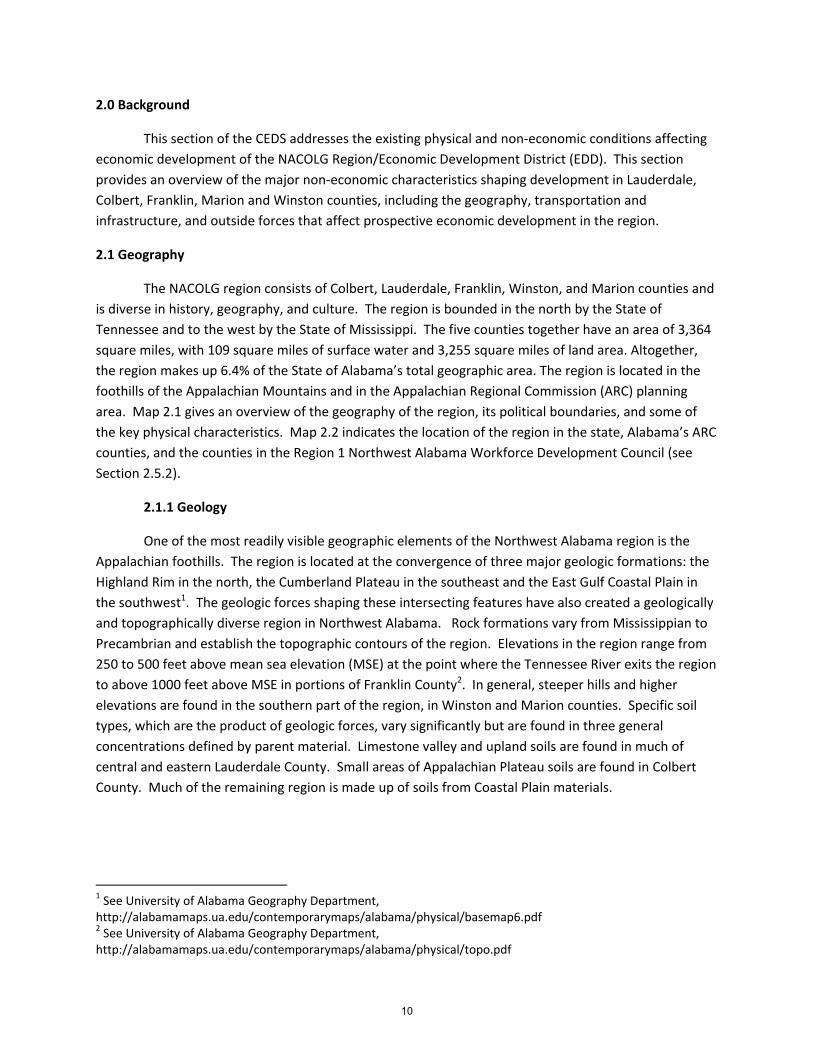
2.0 Background
This section of the CEDS addresses the existing physical and non‐economic conditions affecting
economic development of the NACOLG Region/Economic Development District (EDD). This section
provides an overview of the major non‐economic characteristics shaping development in Lauderdale,
Colbert, Franklin, Marion and Winston counties, including the geography, transportation and
infrastructure, and outside forces that affect prospective economic development in the region.
2.1 Geography
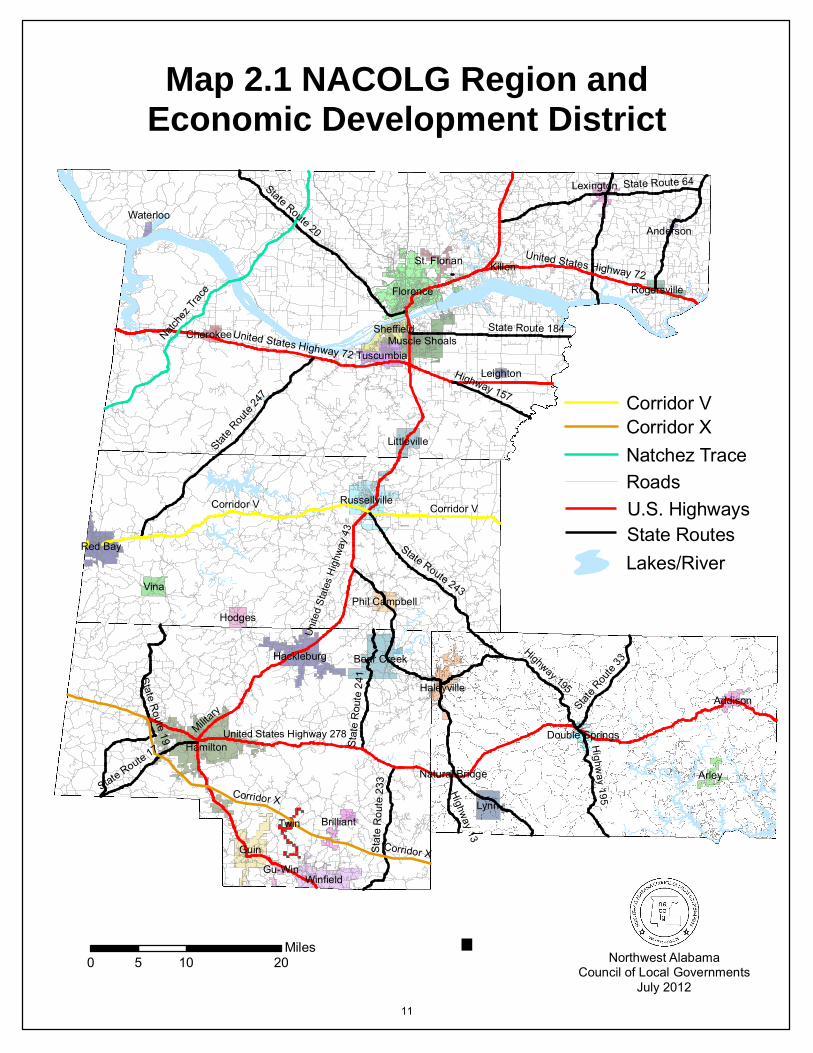
The NACOLG region consists of Colbert, Lauderdale, Franklin, Winston, and Marion counties and
is diverse in history, geography, and culture. The region is bounded in the north by the State of
Tennessee and to the west by the State of Mississippi. The five counties together have an area of 3,364
square miles, with 109 square miles of surface water and 3,255 square miles of land area. Altogether,
the region makes up 6.4% of the State of Alabama’s total geographic area. The region is located in the
foothills of the Appalachian Mountains and in the Appalachian Regional Commission (ARC) planning
area. Map 2.1 gives an overview of the geography of the region, its political boundaries, and some of
the key physical characteristics. Map 2.2 indicates the location of the region in the state, Alabama’s ARC
counties, and the counties in the Region 1 Northwest Alabama Workforce Development Council (see
Section 2.5.2).
2.1.1 Geology
One of the most readily visible geographic elements of the Northwest Alabama region is the
Appalachian foothills. The region is located at the convergence of three major geologic formations: the
Highland Rim in the north, the Cumberland Plateau in the southeast and the East Gulf Coastal Plain in
the southwest1. The geologic forces shaping these intersecting features have also created a geologically
and topographically diverse region in Northwest Alabama. Rock formations vary from Mississippian to
Precambrian and establish the topographic contours of the region. Elevations in the region range from
250 to 500 feet above mean sea elevation (MSE) at the point where the Tennessee River exits the region
to above 1000 feet above MSE in portions of Franklin County2. In general, steeper hills and higher
elevations are found in the southern part of the region, in Winston and Marion counties. Specific soil
types, which are the product of geologic forces, vary significantly but are found in three general
concentrations defined by parent material. Limestone valley and upland soils are found in much of
central and eastern Lauderdale County. Small areas of Appalachian Plateau soils are found in Colbert
County. Much of the remaining region is made up of soils from Coastal Plain materials.
1 See University of Alabama Geography Department, http://alabamamaps.ua.edu/contemporarymaps/alabama/physical/basemap6.pdf 2 See University of Alabama Geography Department, http://alabamamaps.ua.edu/contemporarymaps/alabama/physical/topo.pdf
10
Corridor V Corridor V
United States Highway 72
United States Highway 72
WaterlooH
ighway 195
Highway 13
Highway 195
Florence
Killen
Lexington
St. Florian
Rogersville
Anderson
State Route 20
Hamilton
Guin
Winfield
Hackleburg Bear Creek
Brilliant
Gu-Win
Haleyville
Lynn
Arley
Addison
Double Springs
Natural Bridge
Muscle ShoalsSheffield
Tuscumbia
Littleville
Cherokee
Leighton
Russellville
Red Bay
Vina
HodgesPhil Campbell
Twin
State Route 64
State Route 184
Highway 157
State R
oute
247
Natche
z Tra
ce
State Route 243
Military
Stat
e R
oute
241
Stat
e R
oute
233
State Route 19
State Route 17
Corridor X
Corridor X
State R
oute
33
Lakes/River
Corridor X
U.S. HighwaysRoads
State Routes
Natchez Trace
Corridor V
·0 10 205Miles
Northwest AlabamaCouncil of Local Governments
July 2012
Map 2.1 NACOLG Region andEconomic Development District
United States Highway 278
Uni
ted
Stat
es H
ighw
ay 4
3
11

Baldwin
Clarke
Mobile
Lee
Dallas
Pike
Hale
Bibb
Jackson
Wilcox
Clay
Monroe
Perry
Butler
Sumter
Dale
Jefferson
Tuscaloosa
Walker
ShelbyPickens
Barbour
Marion
Marengo
DeKalb
Choctaw
Blount
Coosa
Covington
Chilton
Coffee
Madison
Escambia
Lamar
Cullman
HenryWashington
Macon
Greene
Conecuh
Elmore
Colbert
Russell
Bullock
Fayette St. Clair
Lowndes
Franklin Morgan
Winston
Talladega
Etowah
Lawrence
Marshall
Geneva
Calhoun
Houston
Tallapoosa
Autauga
Lauderdale
Montgomery
Cherokee
Cleburne
Crenshaw
Limestone
Randolph
Chambers
·0 40 8020
Miles
Northwest AlabamaCouncil of Local Governments
July 2012Appalachian Counties
NACOLG Counties
Map 2.2: NACOLG Region, ARC Counties, Region 1 Workforce Development Council
Boundaires
Region 1 Workforce Development Council
2.1.2 Rivers
Northwest Alabama is divided by topography into two major river systems3. In the northwest,
the Tennessee River serves as the boundary between Colbert and Lauderdale Counties and is one of the
region’s most readily apparent features. Colbert, Lauderdale and most of Franklin counties are in the
Tennessee River watershed and the Tennessee River serves as source of freshwater for numerous north
Alabama communities as well as an inter‐state shipping lane for river traffic. Numerous tributaries are
the source of freshwater and recreation throughout the region. The second major river system in
Northwest Alabama, the Sypsey/Warrior basin, is located in Marion and Winston County. The Sypsey
River and its tributaries are largely contained within Winston County and drain much of the Bankhead
National Forest. The Sypsey flows southeast before converging into the Black Warrior River. The Sypsey
River and the surrounding national forest are a vital natural resource for the region.
The region is home to numerous reservoirs and lakes, providing recreation and power to the
area. Pickwick, Wilson, and Wheeler Lakes are reservoirs to power producing TVA dams and are among
the more popular recreational destinations in the region. Lewis Smith Lake, an Alabama Power
Company reservoir located partly in Winston County, is another sizeable recreational lake and source of
power. The Bear Creek Lakes in Franklin and Marion counties are likewise popular for outdoor
recreation. Marion County also is home to a public fishing lake located between Guin and Hamilton
near the future I‐22 corridor.
Much of the region’s fresh water for consumption by business, industry and residences is
supplied through wells and groundwater sources. The region’s various geologic formations, largely karst
formations, transmit precipitation to wellheads areas. The Alabama Department of Environmental
Management (ADEM) has identified and mapped recharge areas for these wellheads and has begun
encouraging development patterns that are sensitive to the dangers, including health risks and extreme
infrastructure costs, associated with polluting these water sources.
The region’s natural resources and recreational tourism assets were among the greatest strengths
identified by stakeholders. Lakes and access to water for recreation, power, and public water supply
were strengths.
2.2 Climate, Severe Weather, and Environmental Features
2.2.1 Climate and Precipitation
The area has a moderate climate with long summers and mild winters. Normal average
temperatures range from 80.4 Fahrenheit in July to 41.0 Fahrenheit in January, as measured by the
National Weather Service at the Muscle Shoals Regional Airport4. Some variation in the extreme ranges,
up to a normal high of 90.9 in August and down to a normal low of 31.3 in January, are to be expected.
3 See University of Alabama Geography Department, http://alabamamaps.ua.edu/contemporarymaps/alabama/physical/basemap5.pdf 4 See NOAA. Muscle Shoals Alabama Climatology http://www.srh.noaa.gov/hun/?n=muscleshoalsnormalsandextremesdatabase
13

Monthly precipitation is consistent throughout the year, with a normal average monthly rainfall of 4.33
inches, an increase in spring and a decline in summer months. Snows are negligible and inconsistent in
the winter months. Because of the favorable climate the region has a long growing season and few lost
working days due to inclement weather, making it a favorable location for agriculture and industry. The
region’s potential for crop production is limited primarily by soil types, which vary in fertility and
suitability for agricultural production throughout the region.
2.2.2 Water Quality
Based on Section 303(d) of the Clean Water Act (CWA) the five county region of Northwest
Alabama has 20 impaired water bodies and streams totaling approximately 17384 acres and 59 miles,
respectively. Colbert County contains approximately 28 miles of impaired streams, or 45% of the
regional total. Franklin County contains the most impaired water bodies in the region at ~10500 acres,
over 50% of the regional total. Total, the northwest Alabama region made up 8.8% (20/227) of all water
bodies on the 2012 CWA 303(d) list of Impaired Alabama water bodies.
The total mileage of impaired streams and the total acreage of impaired water bodies shown
may be higher than the actual impaired stream mileage and the actual acreage of impaired water bodies
due to the repetition of some water bodies in two or more counties.
2.2.3 Air Quality
The northwest Alabama region has little information available concerning Air Quality. There is
currently one EPA testing site in the region in Muscle Shoals, Colbert County (located at Wilson Dam Rd And 2nd St.). The testing station gathers data for Ozone and PM2.5. According to EPA data, no NW
Alabama counties are currently on nonattainment status. Colbert and Lauderdale counties were last on
the nonattainment list in 1992. The three remaining counties in the region, (Franklin, Marion, Winston),
have never been on the list. The Alabama Department of Environmental Management (ADEM) shows
the Muscle Shoals stations average Ozone between 2009‐2011 to be approximately 65 ppb, and annual
PM2.5 data between 10.3 and 11.3, all of which are well below recommended standards of <75ppb and
<15ug/m3, respectively. Generally, the Northwest Alabama region has good air quality.
2.2.4 Severe Weather
The threat of severe weather is a genuine concern for the region. Severe thunderstorms are
frequent and tornadoes are not uncommon. The destructiveness of these natural hazards places them
among the most significant sources of economic disruption in the region. The April 27, 2011 tornadoes
that struck the State of Alabama had a devastating impact on communities in northwest Alabama (see
sidebar discussions of Hackleburg, Phil Campbell, Haleyville, Marion County, and Franklin County).
Though no more of a threat than in other locations, natural hazards were identified as events
with an extreme potential to disrupt the economic stability of the region. Community resilience to
natural disasters was a primary concern. Activities including mitigation, preparedness, improved
14
response and recovery; business planning; government mitigation efforts and planning were priorities
established for the region.
2.3 Demographic Overview
2.3.1 Total Population Trends
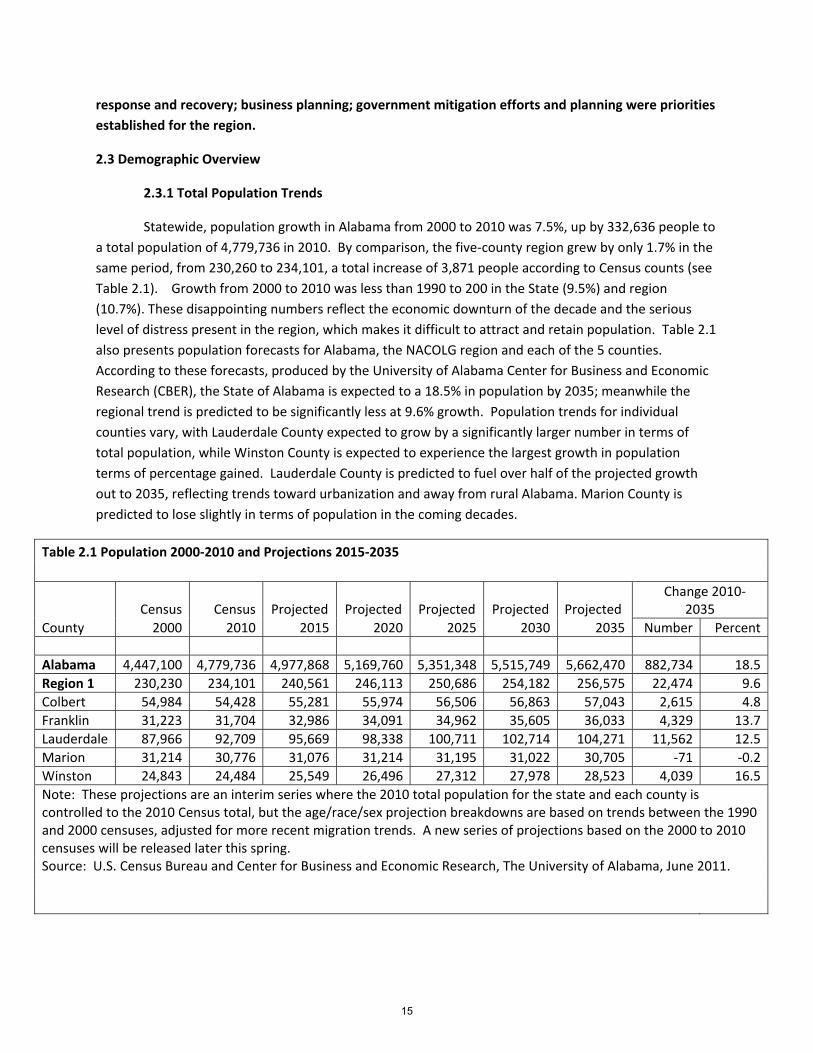
Statewide, population growth in Alabama from 2000 to 2010 was 7.5%, up by 332,636 people to
a total population of 4,779,736 in 2010. By comparison, the five‐county region grew by only 1.7% in the
same period, from 230,260 to 234,101, a total increase of 3,871 people according to Census counts (see
Table 2.1). Growth from 2000 to 2010 was less than 1990 to 200 in the State (9.5%) and region
(10.7%). These disappointing numbers reflect the economic downturn of the decade and the serious
level of distress present in the region, which makes it difficult to attract and retain population. Table 2.1
also presents population forecasts for Alabama, the NACOLG region and each of the 5 counties.
According to these forecasts, produced by the University of Alabama Center for Business and Economic
Research (CBER), the State of Alabama is expected to a 18.5% in population by 2035; meanwhile the
regional trend is predicted to be significantly less at 9.6% growth. Population trends for individual
counties vary, with Lauderdale County expected to grow by a significantly larger number in terms of
total population, while Winston County is expected to experience the largest growth in population
terms of percentage gained. Lauderdale County is predicted to fuel over half of the projected growth
out to 2035, reflecting trends toward urbanization and away from rural Alabama. Marion County is
predicted to lose slightly in terms of population in the coming decades.
Table 2.1 Population 2000‐2010 and Projections 2015‐2035
Census Census Projected Projected Projected Projected Projected Change 2010‐
2035
County 2000 2010 2015 2020 2025 2030 2035 Number Percent
Alabama 4,447,100 4,779,736 4,977,868 5,169,760 5,351,348 5,515,749 5,662,470 882,734 18.5
Region 1 230,230 234,101 240,561 246,113 250,686 254,182 256,575 22,474 9.6
Colbert 54,984 54,428 55,281 55,974 56,506 56,863 57,043 2,615 4.8
Franklin 31,223 31,704 32,986 34,091 34,962 35,605 36,033 4,329 13.7
Lauderdale 87,966 92,709 95,669 98,338 100,711 102,714 104,271 11,562 12.5
Marion 31,214 30,776 31,076 31,214 31,195 31,022 30,705 ‐71 ‐0.2
Winston 24,843 24,484 25,549 26,496 27,312 27,978 28,523 4,039 16.5
Note: These projections are an interim series where the 2010 total population for the state and each county is controlled to the 2010 Census total, but the age/race/sex projection breakdowns are based on trends between the 1990 and 2000 censuses, adjusted for more recent migration trends. A new series of projections based on the 2000 to 2010 censuses will be released later this spring. Source: U.S. Census Bureau and Center for Business and Economic Research, The University of Alabama, June 2011.
15
2.3.2 Age Profile and Trends
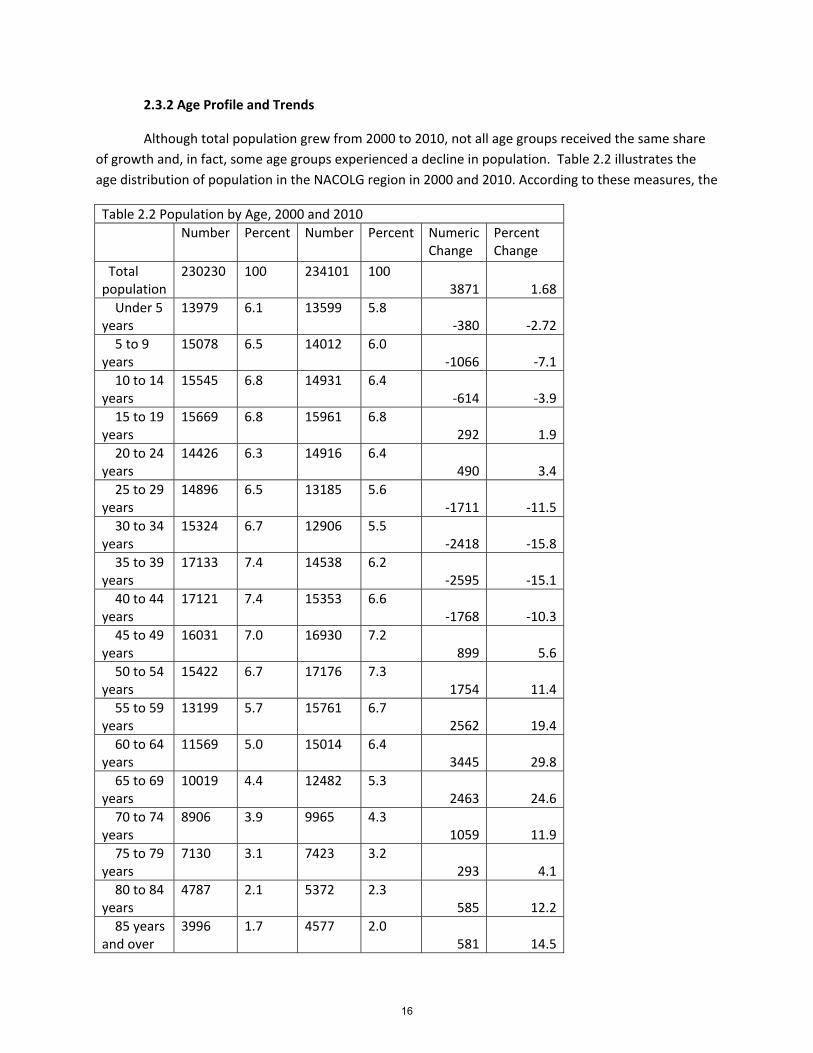
Although total population grew from 2000 to 2010, not all age groups received the same share
of growth and, in fact, some age groups experienced a decline in population. Table 2.2 illustrates the
age distribution of population in the NACOLG region in 2000 and 2010. According to these measures, the
Table 2.2 Population by Age, 2000 and 2010
Number Percent Number Percent Numeric Change
Percent Change
Total population
230230 100 234101 100 3871 1.68
Under 5 years
13979 6.1 13599 5.8 ‐380 ‐2.72
5 to 9 years
15078 6.5 14012 6.0 ‐1066 ‐7.1
10 to 14 years
15545 6.8 14931 6.4 ‐614 ‐3.9
15 to 19 years
15669 6.8 15961 6.8 292 1.9
20 to 24 years
14426 6.3 14916 6.4 490 3.4
25 to 29 years
14896 6.5 13185 5.6 ‐1711 ‐11.5
30 to 34 years
15324 6.7 12906 5.5 ‐2418 ‐15.8
35 to 39 years
17133 7.4 14538 6.2 ‐2595 ‐15.1
40 to 44 years
17121 7.4 15353 6.6 ‐1768 ‐10.3
45 to 49 years
16031 7.0 16930 7.2 899 5.6
50 to 54 years
15422 6.7 17176 7.3 1754 11.4
55 to 59 years
13199 5.7 15761 6.7 2562 19.4
60 to 64 years
11569 5.0 15014 6.4 3445 29.8
65 to 69 years
10019 4.4 12482 5.3 2463 24.6
70 to 74 years
8906 3.9 9965 4.3 1059 11.9
75 to 79 years
7130 3.1 7423 3.2 293 4.1
80 to 84 years
4787 2.1 5372 2.3 585 12.2
85 years and over
3996 1.7 4577 2.0 581 14.5
16
largest growth occurred among individuals age 60 to 64, which grew by 29.8% between 2000 and 2010.
These statistics also indicate a growth in the overall population of individuals aged 65 and older, which
will produce changes in economic climate in future years (see Table 2.2). Meanwhile, between 2000
and 2010 population declined for critical age groups between 25 and 44 years, which represented the
mid‐career worker in the regional economy.
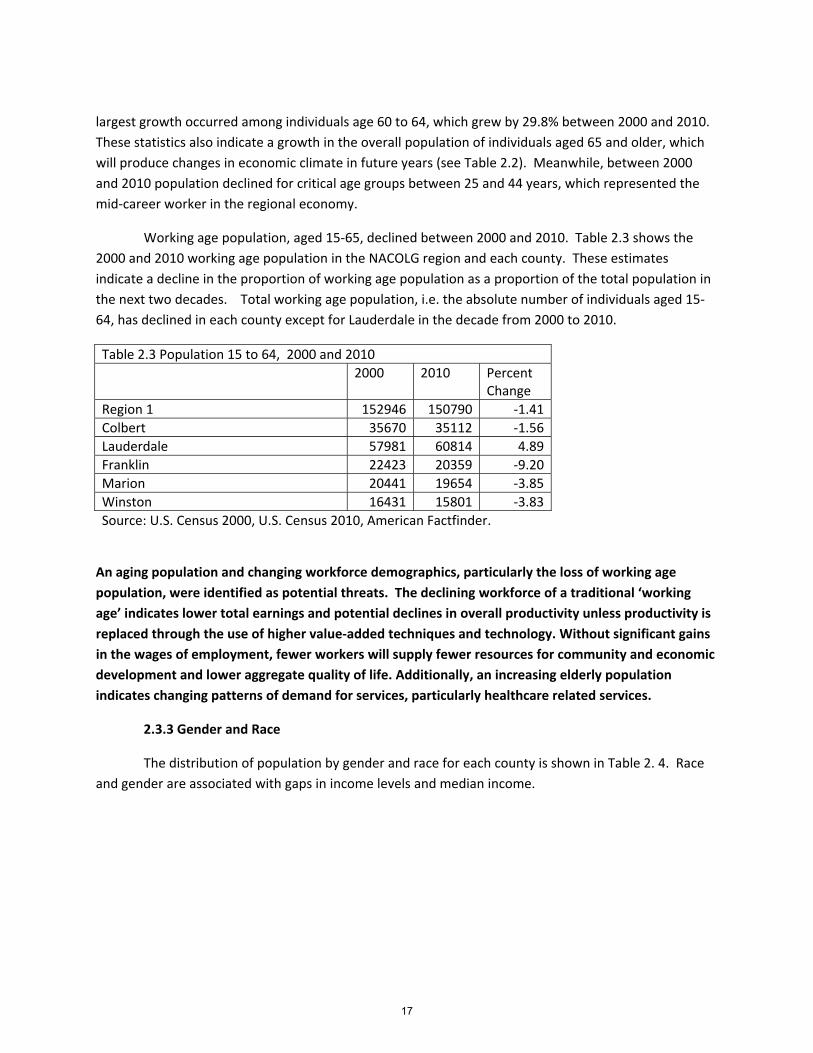
Working age population, aged 15‐65, declined between 2000 and 2010. Table 2.3 shows the
2000 and 2010 working age population in the NACOLG region and each county. These estimates
indicate a decline in the proportion of working age population as a proportion of the total population in
the next two decades. Total working age population, i.e. the absolute number of individuals aged 15‐
64, has declined in each county except for Lauderdale in the decade from 2000 to 2010.
Table 2.3 Population 15 to 64, 2000 and 2010
2000 2010 Percent Change
Region 1 152946 150790 ‐1.41
Colbert 35670 35112 ‐1.56
Lauderdale 57981 60814 4.89
Franklin 22423 20359 ‐9.20
Marion 20441 19654 ‐3.85
Winston 16431 15801 ‐3.83
Source: U.S. Census 2000, U.S. Census 2010, American Factfinder.
An aging population and changing workforce demographics, particularly the loss of working age
population, were identified as potential threats. The declining workforce of a traditional ‘working
age’ indicates lower total earnings and potential declines in overall productivity unless productivity is
replaced through the use of higher value‐added techniques and technology. Without significant gains
in the wages of employment, fewer workers will supply fewer resources for community and economic
development and lower aggregate quality of life. Additionally, an increasing elderly population
indicates changing patterns of demand for services, particularly healthcare related services.
2.3.3 Gender and Race
The distribution of population by gender and race for each county is shown in Table 2. 4. Race
and gender are associated with gaps in income levels and median income.
17

Table 2.4 Gender, Race and Hispanic Origin
Male Female White
Black or African American
American Indian or Alaska Native Other
Hispanic or Latino
Alabama 2320188 2459548 3275394 1251311 28218 224813 185602
48.5 51.5 68.5 26.2 0.6 4.7 3.9
Region 1 113875.5 120625.5202262.
8 20585.811085.86
1 10566.5
1 9177.16
4
48.6 51.4 86.3 8.8 0.5 4.5 3.9
Colbert 26159 28269 43789 8768 267 1604 1093
48.1 51.9 80.5 16.1 0.5 2.9 2.0
Franklin 15828 15876 26320 1228 215 3941 4710
49.9 50.1 83.0 3.9 0.7 12.4 14.9
Lauderdale 44379 48330 80112 9257 338 3002 2082
47.9 52.1 86.4 10.0 0.4 3.2 2.2
Marion 15293 15483 28291 1184 101 1200 632
49.7 50.3 91.9 3.8 0.3 3.9 2.1
Winston 12021 12463 23409 115 163 797 639
49.1 50.9 95.6 0.5 0.7 3.3 2.6
Source: U.S. Census 2010, American Factfinder.
2.3.4 Migration
Table 2.5 displays data on migration patterns in the previous year for the Nation, Alabama and
the counties of the region. As shown, the number of residents estimated to reside in the same house in
the prior year was very similar across all areas. Movement within the county was also very similar. In
migration into Colbert and Lauderdale counties from other parts of the state of Alabama was slightly
Table 2.5 Migration in the past year
United States
Alabama Colbert County, Alabama
Franklin County, Alabama
Lauderdale County, Alabama
Marion County, Alabama
Winston County, Alabama
Estimate Estimate Estimate Estimate Estimate Estimate Estimate
Same house 1 year ago: 84.23% 84.26% 84.97% 84.56% 84.89% 87.78% 84.39% Moved within same county: 9.41% 9.38% 8.46% 10.87% 7.91% 7.43% 8.97% Moved from different county within same state: 3.32% 3.31% 4.13% 3.30% 4.17% 3.45% 5.36% Moved from different state: 2.43% 2.69% 2.36% 1.14% 2.81% 1.34% 1.29% Moved from abroad: 0.61% 0.35% 0.09% 0.13% 0.23% 0.00% 0.00%Source: U.S. Census Bureau, American Communities Survey, 2010
higher than the nation, state or other county estimates. Winston County experienced the highest in‐
migration from other parts of the state, likely in response to the presence of Smith Lake as a popular
location for new homes. Movement from a different state was slightly lower in Franklin and Marion
18
Counties than in other geographic areas studied. Movement from abroad was lower in Alabama and
each of the counties of the region than in the nation at large.
2.3.4 Education
A prepared workforce is a critical element for economic development. Educational attainment is
a primary characteristic of workforce readiness. Educational opportunities and workforce education
levels are among the most basic indicators of economic health. These are reviewed by potential new
businesses and provide strong indicators of the overall well‐being of the regional economy. The region
possesses a number of strong educational assets, from public school systems to community colleges and
a university.
Table 2.5 displays information on educational attainment in the United States and the study
areas. This table illustrates the overall performance gaps between the region and the nation, as well as
between different counties within the region. The distribution of population having less than a high
school education is higher across the region than in the nation; the estimate of those possessing a high
school or high school equivalency is higher, however, this figure is offset by a lower number possessing
college education. Underperformance in the arena of higher education, as indicated by estimates of
“some college” or higher, is particularly acute in Marion, Franklin, and Winston Counties.
Education and skills for workforce and to create a higher quality of life were central to the feedback
received in the course of developing the CEDS. Workforce development, in terms of matching skills to
employer needs, was a top priority. Conversations were mixed with regard to the ability of the
region, or a county within the region, to use educational offerings to shape the type of employer
locating in the region. Some observed that this type of skills‐clustering was potentially an important
tool, while others observed that local economies are shaped in large part by externalities and that
concentrating on particular skills could lead to lost opportunities.
19
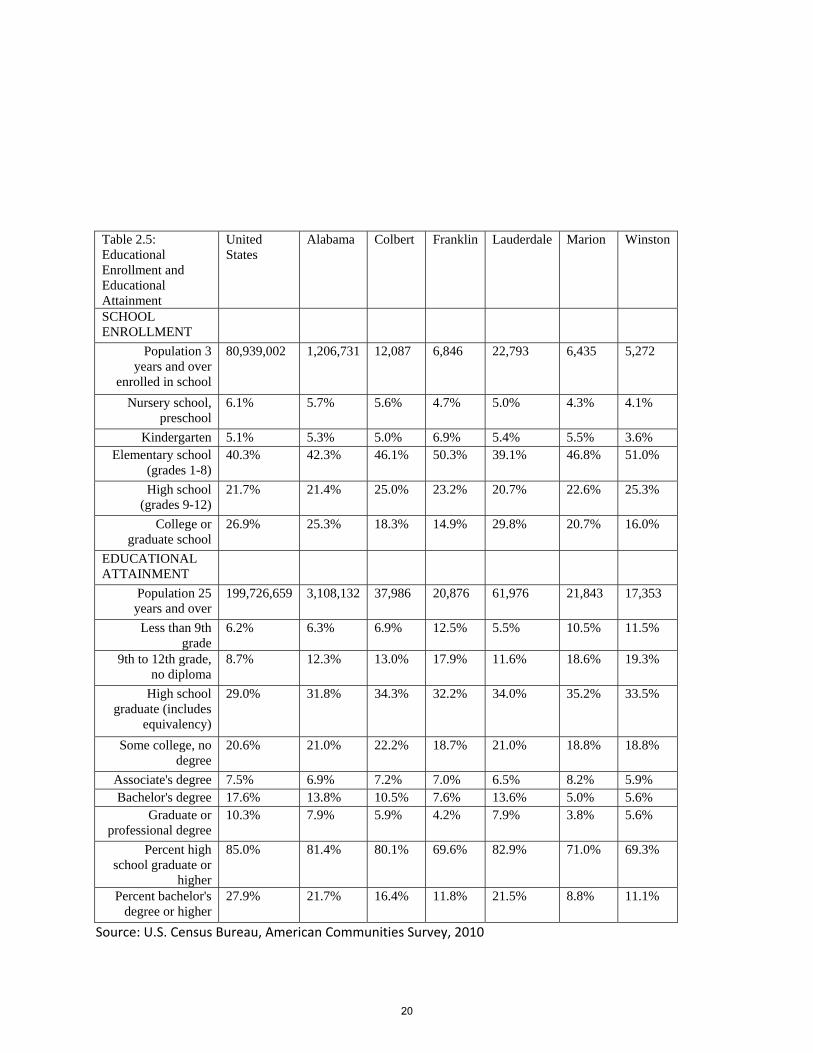
Table 2.5: Educational Enrollment and Educational Attainment
United States
Alabama Colbert Franklin Lauderdale Marion Winston
SCHOOL ENROLLMENT
Population 3 years and over
enrolled in school
80,939,002 1,206,731 12,087 6,846 22,793 6,435 5,272
Nursery school, preschool
6.1% 5.7% 5.6% 4.7% 5.0% 4.3% 4.1%
Kindergarten 5.1% 5.3% 5.0% 6.9% 5.4% 5.5% 3.6% Elementary school
(grades 1-8) 40.3% 42.3% 46.1% 50.3% 39.1% 46.8% 51.0%
High school (grades 9-12)
21.7% 21.4% 25.0% 23.2% 20.7% 22.6% 25.3%
College or graduate school
26.9% 25.3% 18.3% 14.9% 29.8% 20.7% 16.0%
EDUCATIONAL ATTAINMENT
Population 25 years and over
199,726,659 3,108,132 37,986 20,876 61,976 21,843 17,353
Less than 9th grade
6.2% 6.3% 6.9% 12.5% 5.5% 10.5% 11.5%
9th to 12th grade, no diploma
8.7% 12.3% 13.0% 17.9% 11.6% 18.6% 19.3%
High school graduate (includes
equivalency)
29.0% 31.8% 34.3% 32.2% 34.0% 35.2% 33.5%
Some college, no degree
20.6% 21.0% 22.2% 18.7% 21.0% 18.8% 18.8%
Associate's degree 7.5% 6.9% 7.2% 7.0% 6.5% 8.2% 5.9% Bachelor's degree 17.6% 13.8% 10.5% 7.6% 13.6% 5.0% 5.6%
Graduate or professional degree
10.3% 7.9% 5.9% 4.2% 7.9% 3.8% 5.6%
Percent high school graduate or
higher
85.0% 81.4% 80.1% 69.6% 82.9% 71.0% 69.3%
Percent bachelor's degree or higher
27.9% 21.7% 16.4% 11.8% 21.5% 8.8% 11.1%
Source: U.S. Census Bureau, American Communities Survey, 2010
20
2.4 Infrastructure Capacity and Resources
2.4.1 Transportation System
The transportation system of the region varies from county to county with respect to access to
adequate highway, rail, air, and water infrastructure for moving freight and people.
Highways
The Shoals area is the crossroads for two major regional arterials, U.S. Highways 72 and 43, and
numerous state highways; however, interstate access is not readily available. Interstate 65 to the east is
the closest interstate highway. The recent elimination of the “Memphis to Atlanta Corridor” from the
Alabama Department of Transportation’s long range plans reflects increasing constraints on the long‐
term financial outlook of ALDOT. As monies grow increasingly tighter, large capacity projects move
further out, eventually moving beyond the planning horizon. Maintaining a focus on bringing the project
back into a ‘fiscally constrained’ long‐range transportation plan will be a priority. One bright spot is the
future I‐22 linkage to the south, which is nearing completion; but it will not be accessible to most
residents and businesses except through long two‐lane routes. In the Shoals area, long‐term goals
include access to interstate highways. With the completion of Highway 157 to Cullman and I‐65, north
to south linkages are intermediate and long term priorities in order to more efficiently move goods and
services.
Franklin County is crossed from north to south by Highway 43 and from east to west by Highway
24 (Appalachian Corridor “V”), both of which are major regional arterials. Minor arterials include
Highway 247 which connects Red Bay to Highway 72 (in Colbert County) and Highway 13 leading
southeast to Winston County. The Highway 13 corridor, aka ‘the Haleyville Bypass’ continues to be a
high priority for Franklin County residents interested in better access to I‐22.
Marion County is crossed by Highway 43 from north to south and by Highway 78 (soon‐to‐be
U.S. Interstate 22) from east to west. Only the costly project underway north of Birmingham, which will
connect the route to I‐65, remains. Once completed, the route will have official designation as interstate
Highway 22. Traffic increases are highly anticipated. Preparing for this growth is a near term priority for
the region. As a result of regional developments (the location of a Toyota manufacturing facility near
Tupelo, Mississippi), industrial development in the region has the potential to radiate outward from I‐22
along major arterials, affecting virtually every community in the region. Additionally, Highway 278 runs
west to east through Hamilton to Double Springs and continues east to Cullman, Alabama. Finally,
Highway 19 connects Red Bay to Hamilton.
Winston County is the most isolated county of the region in terms of transportation
infrastructure. The county is traversed north and south by Highway 13, which passes through Haleyville,
Natural Bridge, and Lynn. Highway 195 passes north and south through Haleyville and Double Springs
before exiting the county. Finally, highway 278 passes east and west through Winston County from
Marion County, through Natural Bridge, Double Springs and Addison. There are no four‐lane highways
21
in the county. The Highway 13 corridor connection to I‐22 remains a priority from the “Haleyville
Bypass” in the north to the stretch from the Winston/Walker County line to the Interstate.
Transportation infrastructure has improved in the region in recent years in certain areas. In others, it
has remained stagnant for many decades. The completion of Highway 157 between the Shoals and I‐
65 was a major accomplishment, but much remains to be done on U.S. Highway 43. Corridor V in
Franklin County is nearing completion, but dead ends at the Mississippi State line, beyond the direct
influence of local and state officials. Marion County has had the greatest success with the near
completion of I‐22 opening up tremendous opportunities for new development. Winston County,
however, has languished for decades with isolation and two‐lane roads continuing to be a significant
barrier to new development.
Rivers
River access is more abundant in the Shoals than in other parts of the region. Both Colbert and
Lauderdale Counties have potential access to river transportation via the Tennessee River. The only port
facility in the Shoals is currently the Port of Florence, which is located along the riverfront south of
downtown. The capacity of this facility to receive barges is limited and discussions have included
numerous improvements to the facility5. Colbert County has recently discussed activating a port
authority in order to improve access to the Tennessee River. From Wilson and Pickwick Lakes on the
Tennessee River, to the Bear Creek recreational lakes in Franklin and Marion Counties, to Smith Lake
and the Sypsey River basin in Winston County, significant recreational waters are present region‐wide.
These waters are important economic generators. However, outside of the Shoals area there is a lack of
access to navigable waters for transportation purposes.
Rails
A major Norfolk Southern line traverses Colbert County and a spur line connects Florence
Industrial Park to Columbia, Tennessee. At one time these routes connected across the Tennessee River
railroad bridge, but since the railroad bridge was discontinued the alternative routes north from Colbert
County lead west through Memphis, Tennessee and east through Decatur, Alabama. A second Norfolk
Southern line runs south from Muscle Shoals through Franklin County, northeast Marion County,
through Winston County and southeast to Birmingham, Alabama.
Airports
The Northwest Alabama Regional Airport in Muscle Shoals is the region’s only commercial
airport. The airport is owned by Colbert and Lauderdale Counties and provides passenger flights to over
580 destinations through Memphis on Northwest Airlines. The airport also provides private aircraft
facilities and air freight services. The Rankin Fite Airport in Hamilton provides private air service to
Marion County.
5 See Port of Florence Master Plan, prepared for Florence‐Lauderdale County Port authority, W.R. Cole and Associates, January 2004, pgs. 21‐47.
22
Improvements to the airports are underway to improve passenger and freight movement and
connectivity to industrial properties.
2.4.2 Water Systems
A comprehensive water system analysis is not available for the region at this time; however,
planning for water system improvements should be coordinated on a regional basis from at least the
county level, rather than in ad hoc projects in response to increases in demand. Particular attention is
needed in the areas of drainage and recharge system integrity and provisions for adequate future source
waters, in addition to common infrastructure improvements associated with economic development
proposals. Mapping and GIS projects are underway in the counties of the region to provide an adequate
picture of the system infrastructure. Maps have been completed in Franklin County and Winston County
and are complete or underway in other locations.
2.4.3 Electrical Systems
A complete electrical system inventory and analysis is not available for the region at this time;
however, both Alabama Power and the Tennessee Valley Authority are regional power suppliers in the
area. Both entities are involved in economic development in the region and assist direct suppliers at the
local level in meeting the needs of industry, commerce, and residences. Local planning initiatives should
contain capital facilities planning sufficient to forecast projected electrical demand resulting from
growth and to meet this demand.
2.4.4 Natural Gas Systems
A complete gas distribution inventory and analysis is not available for the region at this time. An
inventory of major transmission pipelines should be accompanied by planning for local natural gas
utilities, which should begin with an inventory of these local suppliers. Eventually demand and
infrastructure requirements for these utilities should be incorporated into local and regional planning
initiatives.
2.4.5 Telecommunications
A telecommunications system inventory and analysis is not available for the region at this time.
Local planning initiatives should contain capital facilities requirements sufficient to improve access to
telephone, cable, and wireless technologies.
2.4.6 Solid Waste Disposal
An inventory and analysis of solid waste disposal and landfill operations is not available for the
region at this time; however, these facilities should be inventoried and incorporated into local planning
initiatives in order to meet demand resulting from growth and development. By state law, the regional
planning organization is involved in the review process for all solid waste permits or alterations to solid
waste management plans. Presently, all local plans call for municipal solid waste to be transferred out of
23
the region to regional landfill facilities. Local construction and demolition landfills continue operations at
various locations through the region.
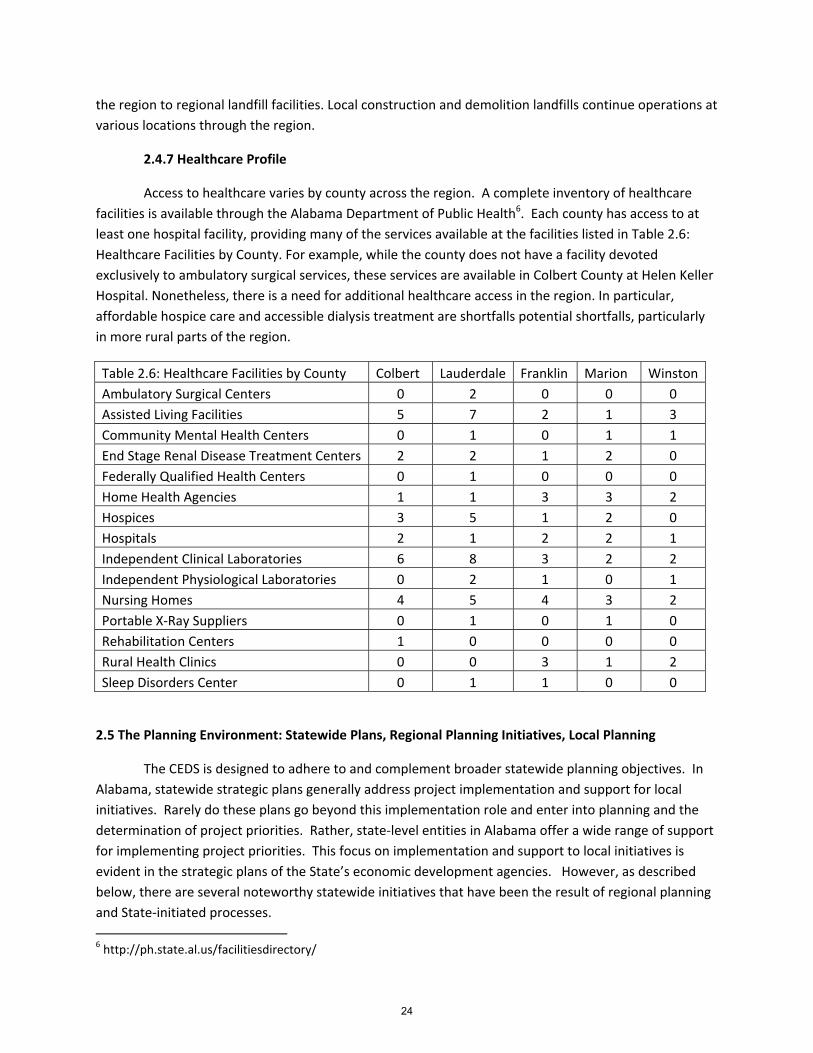
2.4.7 Healthcare Profile
Access to healthcare varies by county across the region. A complete inventory of healthcare
facilities is available through the Alabama Department of Public Health6. Each county has access to at
least one hospital facility, providing many of the services available at the facilities listed in Table 2.6:
Healthcare Facilities by County. For example, while the county does not have a facility devoted
exclusively to ambulatory surgical services, these services are available in Colbert County at Helen Keller
Hospital. Nonetheless, there is a need for additional healthcare access in the region. In particular,
affordable hospice care and accessible dialysis treatment are shortfalls potential shortfalls, particularly
in more rural parts of the region.
Table 2.6: Healthcare Facilities by County Colbert Lauderdale Franklin Marion Winston
Ambulatory Surgical Centers 0 2 0 0 0
Assisted Living Facilities 5 7 2 1 3
Community Mental Health Centers 0 1 0 1 1
End Stage Renal Disease Treatment Centers 2 2 1 2 0
Federally Qualified Health Centers 0 1 0 0 0
Home Health Agencies 1 1 3 3 2
Hospices 3 5 1 2 0
Hospitals 2 1 2 2 1
Independent Clinical Laboratories 6 8 3 2 2
Independent Physiological Laboratories 0 2 1 0 1
Nursing Homes 4 5 4 3 2
Portable X‐Ray Suppliers 0 1 0 1 0
Rehabilitation Centers 1 0 0 0 0
Rural Health Clinics 0 0 3 1 2
Sleep Disorders Center 0 1 1 0 0
2.5 The Planning Environment: Statewide Plans, Regional Planning Initiatives, Local Planning
The CEDS is designed to adhere to and complement broader statewide planning objectives. In
Alabama, statewide strategic plans generally address project implementation and support for local
initiatives. Rarely do these plans go beyond this implementation role and enter into planning and the
determination of project priorities. Rather, state‐level entities in Alabama offer a wide range of support
for implementing project priorities. This focus on implementation and support to local initiatives is
evident in the strategic plans of the State’s economic development agencies. However, as described
below, there are several noteworthy statewide initiatives that have been the result of regional planning
and State‐initiated processes.
6 http://ph.state.al.us/facilitiesdirectory/
24
2.5.1 Alabama Planning
The State of Alabama has not had a long history of statewide strategic planning. The Alabama
Association of Regional Councils (AARC) led in this area by consolidating the regional CEDS of the ten
economic development districts7. The Consolidated CEDS analyzed the goals, priorities, vital projects,
and performance benchmarks of each of the regional CEDS in order to distill commonalities across the
state. In contrast to the regional CEDS, the State CEDS was designed to indicate needs of statewide
relevance that were derived from a local and regional context. The finished product identified four
common areas of statewide importance as Transportation Infrastructure, Industrial Infrastructure,
Community Infrastructure, and Education and Workforce Development and Other Projects. Likewise,
the State CEDS provided an inventory and analysis of common benchmarks for the regional CEDS
statewide. These indicators of performance have been incorporated into the Northwest Alabama
Comprehensive Economic Development Strategy.
In addition to AARC efforts, the recently created Alabama Economic Development Alliance
developed the first ever state‐sponsored statewide economic development strategic plan in 2011. The
plan was released in early 2012 and calls for targeted recruitment of industries in 11 specific business
types associated with Advanced Manufacturing, Technology, Distribution/Logistics, and Corporate
Operations. In addition, the plan offers general economic development strategies around the subject
areas of Recruitment, Retention, and Renewal. The strategies align substantially with local and regional
efforts of the region and are incorporated as part of the Northwest Alabama Comprehensive Economic
Development Strategy.
2.5.2 Regional Planning
Regional Planning Commissions
In contrast to statewide planning initiatives, the state has a number of planning tools available
at the regional level. The first of these are the Regional Planning Commissions, which are organizations
with a broad mandate to provide administrative, technical and planning support and services to local
communities. The RPCs serve 12 regions statewide. Through communication, planning, policymaking,
coordination, advocacy and technical assistance, the Commissions serve member governments and
citizens of the region. They also provide a forum for member government representatives to discuss
and resolve common problems, especially those that transcend political boundaries. Although not all
RPCs are recognized as Economic Development Districts, NACOLG is recognized as both the RPC and the
EDD for the five‐counties of Northwest Alabama.
Regional Workforce Development Councils
In order to connect the needs of local industries and businesses to the workforce system of
Alabama, the state has established regional workforce development councils. The workforce councils
are part of the state review process for funding projects workforce providers, largely colleges of the
7 http://ceds.alabama.gov/
25
Alabama Community College System. The regional workforce councils are charged with drafting and
maintaining a strategic plan for workforce investments in the region. Funding requests originate with
workforce providers and are reviewed and prioritized by the regional workforce council before
submission to the Alabama Department of Post‐Secondary Education. Upon receipt, applications are
reviewed by a state Proposal Review Committee made up of representatives/chairpersons of the
regional workforce development councils. Recommendations for funding are forwarded to the Alabama
Workforce Training Council, which consists of State executive department heads, which makes final
recommendations to the Alabama State Board of Education. In northwest Alabama, NACOLG serves as
the administrator of the Region 1 Workforce Development Council, which serves Lauderdale, Colbert,
Franklin, Marion, Winston, and Lawrence Counties. Although outside of the typical NACOLG service
area, Lawrence County was added to the Region 1 Workforce Development Council in 2011. The region
has a strategic plan, which aligns with the CEDS and other statewide plans. The process has facilitated
hundreds of thousands of dollars for workforce training in the past 4 years.
Transportation Planning
Two types of planning bodies are active at the regional level in transportation planning
statewide, the Metropolitan Planning Organizations (MPOs) and the recently established Rural Planning
Organizations (RPOs). The MPOs coordinate transportation improvements within Metropolitan
Statistical Areas, as recognized by the U.S. Census Bureau and required by the Federal Highway
Administration. These bodies are responsible for reviewing all proposed projects within the respective
MPO area. Within northwest Alabama, the Florence‐Muscle Shoals MPO includes much of Colbert and
Lauderdale Counties. For remaining nonmetropolitan areas, the Rural Planning Organizations provide an
opportunity for feedback and discussion of transportation related issues and questions.
26

Sect
ion
3.0:
Eco
nom
ic P
rofil
e
27
3.0 Economic Profile
The five‐county study area consists of Lauderdale, Colbert, Franklin, Marion, and Winston
Counties in Northwest Alabama. These counties are interconnected by geography, culture, politics, and
economics. An analysis of existing economic trends and conditions provides a useful frame for the
discussion of economic development needs and opportunities in the region. Indicators such as
employment, unemployment, personal income, and industry employment and wages are useful for
determining in the overall health of the economy, its vitality and diversity and, when viewed in a
historical context, revealing clues about likely future trends. This sort of analysis also serves an
important function, allowing judgment about the strengths and weaknesses of the local economy over
time. This analysis reviews performance indicators based on county level data and comparisons to
national and statewide data. In addition, the analysis reviews some business cycle trends and major
industrial sectors in order to evaluate performance during different parts of the economic cycle and the
identification of key sectors or potential clusters.
3.1 Labor Profile: Employment and Unemployment
3.1.1 Employment8
Employment, or the capacity of an economy to produce new jobs and new economic
opportunities for a population, is one indicator of the economic health and vitality of a region.
Primarily, a growth in employment opportunities is essential to provide jobs, income and quality of life
to those entering the workforce. Steady employment growth is also necessary in order to buttress the
overall economy against downturns, layoffs, and job losses in particular industries and sectors at various
times in the business cycle. Ideally, healthy growth in employment opportunities is associated with
lower unemployment and underemployment, as more workers find employment and higher incomes as
vacancies in lower paying positions create demand for workers to fill those positions. In contrast,
however, overly rapid employment growth may create labor shortages in some sectors, leading to
inflated wages, lost profitability and business closures. Thus, employment growth in an economy must
be viewed in relation to other indicators of economic health, such as population trends, unemployment
and wages, and judged with regard to the effect of new jobs on the greater economy.
Everywhere there was consensus that more jobs were needed and that jobs should be matched with
skills leading to higher quality jobs. In some places, quality was expressed primarily in terms of pay
scale, while others discussed “blue collar” and “white collar/professional” opportunities. Many
observed a disjoint between the skills encouraged in the workforce and the skills recruited to the
area. There was consensus that skills and training should be tied to job‐creation efforts in a
coordinated way.
Table 3.1: Employment Growth presents employment data for the five‐county region alongside
comparable data for the nation, and the state (see also Section 3.3, which addresses employment by
8 Source: U.S. Department of Commerce, Bureau of Labor Statistics, various sources. Available online http://www.bls.gov/lau/home.htm
28
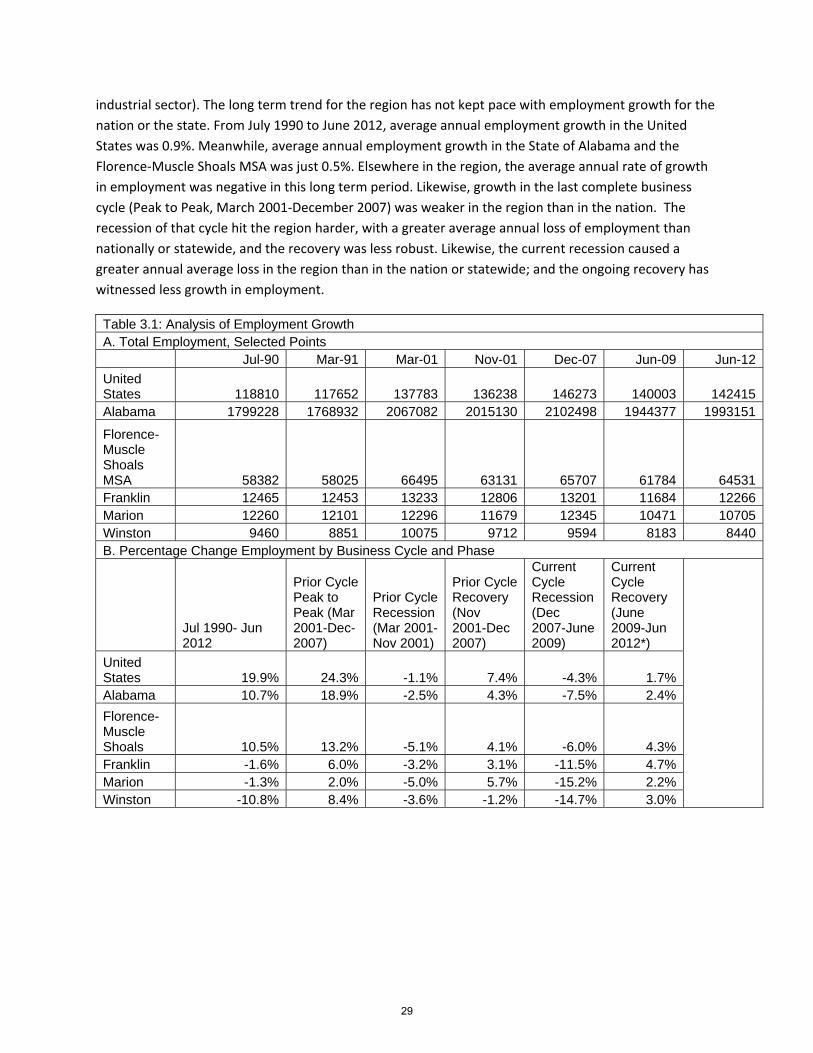
industrial sector). The long term trend for the region has not kept pace with employment growth for the
nation or the state. From July 1990 to June 2012, average annual employment growth in the United
States was 0.9%. Meanwhile, average annual employment growth in the State of Alabama and the
Florence‐Muscle Shoals MSA was just 0.5%. Elsewhere in the region, the average annual rate of growth
in employment was negative in this long term period. Likewise, growth in the last complete business
cycle (Peak to Peak, March 2001‐December 2007) was weaker in the region than in the nation. The
recession of that cycle hit the region harder, with a greater average annual loss of employment than
nationally or statewide, and the recovery was less robust. Likewise, the current recession caused a
greater annual average loss in the region than in the nation or statewide; and the ongoing recovery has
witnessed less growth in employment.
Table 3.1: Analysis of Employment Growth A. Total Employment, Selected Points
Jul-90 Mar-91 Mar-01 Nov-01 Dec-07 Jun-09 Jun-12
United States 118810 117652 137783 136238 146273 140003 142415Alabama 1799228 1768932 2067082 2015130 2102498 1944377 1993151
Florence-Muscle Shoals MSA 58382 58025 66495 63131 65707 61784 64531Franklin 12465 12453 13233 12806 13201 11684 12266Marion 12260 12101 12296 11679 12345 10471 10705Winston 9460 8851 10075 9712 9594 8183 8440B. Percentage Change Employment by Business Cycle and Phase
Jul 1990- Jun 2012
Prior Cycle Peak to Peak (Mar 2001-Dec-2007)
Prior Cycle Recession (Mar 2001-Nov 2001)
Prior Cycle Recovery (Nov 2001-Dec 2007)
Current Cycle Recession (Dec 2007-June 2009)
Current Cycle Recovery (June 2009-Jun 2012*)
United States 19.9% 24.3% -1.1% 7.4% -4.3% 1.7%Alabama 10.7% 18.9% -2.5% 4.3% -7.5% 2.4%
Florence-Muscle Shoals 10.5% 13.2% -5.1% 4.1% -6.0% 4.3%Franklin -1.6% 6.0% -3.2% 3.1% -11.5% 4.7%Marion -1.3% 2.0% -5.0% 5.7% -15.2% 2.2%Winston -10.8% 8.4% -3.6% -1.2% -14.7% 3.0%
29

C. Average Annual Rate of Employment by Business Cycle
Jul 1990- Jun 2012
Prior Cycle Peak to Peak (Mar 2001-Dec-2007)
Prior Cycle Recession (Mar 2001-Nov 2001)
Prior Cycle Recovery (Nov 2001-Dec 2007)
Current Cycle Recession (Dec 2007-June 2009)
Current Cycle Recovery (June 2009-Jun 2012*)
United States 0.9% 3.6% -1.7% 1.2% -2.9% 0.6%Alabama 0.5% 2.8% -3.8% 0.7% -5.0% 0.8%
Florence-Muscle Shoals 0.5% 2.0% -7.6% 0.7% -4.0% 1.4%Franklin -0.1% 0.9% -4.8% 0.5% -7.7% 1.6%Marion -0.6% 0.3% -7.5% 0.9% -10.1% 0.7%Winston -0.5% 1.2% -5.4% -0.2% -9.8% 1.0%
3.1.2 Unemployment9
Unemployment is a rough measure of the number of individuals lacking jobs in an economy.
Unemployment statistics suffer from limitations due to their collection, and an understanding of these
limitations is important to understanding the usefulness of the statistic as a measure of economic
health. First, unemployment statistics represent only individuals actively seeking employment through
government placement agencies and receiving unemployment compensation. Thus, they do not
represent individuals lacking work who are seeking employment on their own, nor do they represent
individuals who have surpassed allowable periods for unemployment compensation and are no longer
appearing in government unemployment records. Unemployment measures do not account for
discouraged workers, who are individuals who have given up the search for work but are without jobs.
Additionally, unemployment statistics are subject to fluctuations in population‐ that is, as the population
increases or decreases (often as a result of the availability of jobs), unemployment rates change. The
measure of unemployment, however, does not account for any gain or loss in population. Thus, while
an area may experience slight population loss and maintain low unemployment rates, the reason for the
low rate may be a loss of population due to a lack of employment opportunities in the region. Finally,
unemployment statistics do not account for the incidence of underemployment, whereby a worker
9 Source: U.S. Department of Commerce, Bureau of Labor Statistics, various sources. Available online Source: U.S. Department of Commerce, Bureau of Labor Statistics, various sources. Available online http://www.bls.gov/lau/home.htm.
30
receives too few hours or too little compensation relative to skills, training or standard of living.
Therefore, unemployment is a complicated measure and must be viewed in relation to other factors
such as population growth and total employment.
In contrast to meetings held in 2007, the view of unemployment has changed significantly in the
region. In previous periods of higher job creation, unemployment was mentioned less frequently than
underemployment and population lost due to inadequate job opportunities as a source of economic
hardship. In today’s economy, unemployment and the need for quality jobs were cited as paramount.
Jobs of not only sufficient number but also sufficient wages are needed in order to rebound from the
losses of the recent recession.
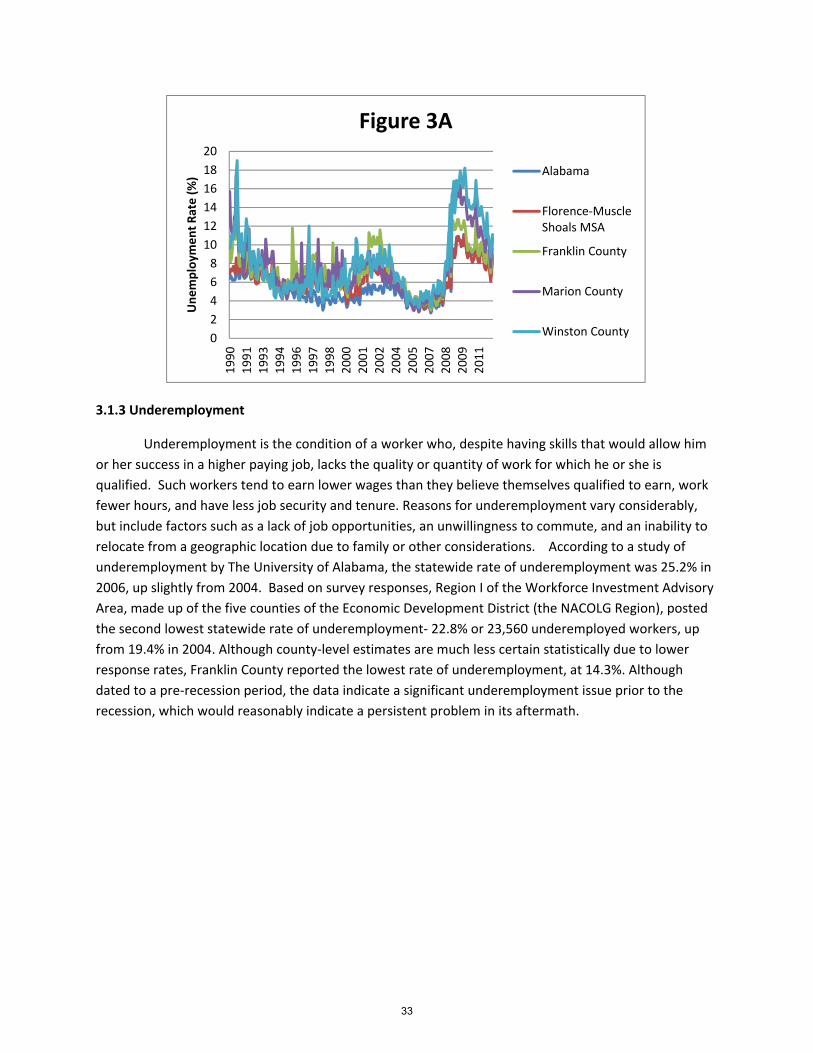
Table 3.2: Analysis of Unemployment displays unemployment data for each of the geographies
of the five‐county region, the nation, and the State. The data, reported monthly from July 1990 to June
2012, encompass the past two business cycles, peak to peak, the most recent recession and the start of
the current recovery period. Figure 3A presents a monthly graph of the geographies in the study area.
From these figures, it is clear that employment trends deteriorated significantly following the ‘Great
Recession’ and have tracked the recovery since it began in 2009. Beginning at a level significantly higher
than the national average in July 1990, unemployment rates cycled downward to a low that was below
the national average in 2007, spiked in 2008 and began a slow recovery.
The early 1990s, in particular, saw a dislocation of workers in the five‐county region, which was
slow to correct. Even as national unemployment trends improved, the five‐county region continued to
experience higher rates and recovered later than much of the nation. Significant progress was made
through the decade, but the respite was short‐lived, as unemployment rates rose again, in keeping with
national trends, to spike in 2002. From 2002‐2007, rates steadily declined region‐wide. At one point,
unemployment in the local economy was not a significant negative factor; in fact, by the common “rule
of thumb” that 3% unemployment is as low as the indicator is likely to ever go, it appeared that the
region was at or near full employment. This was a significant achievement for the five‐county region
considering the double‐digit unemployment rates of 1990 and the prolonged dislocation of the region.
The Great Recession reversed these gains. Unemployment skyrocketed during the recessionary
period, again reaching double digits in each county of the region. Since 2009, the road to recovery has
been slow and painful for the region. Unemployment in the region and state have tracked with the
national trend, although at higher levels; but the improvement has not been rapid, as in prior recovery
periods. Trends indicate that the slow and arduous task of reducing unemployment will continue to be a
top priority for the foreseeable future.
31
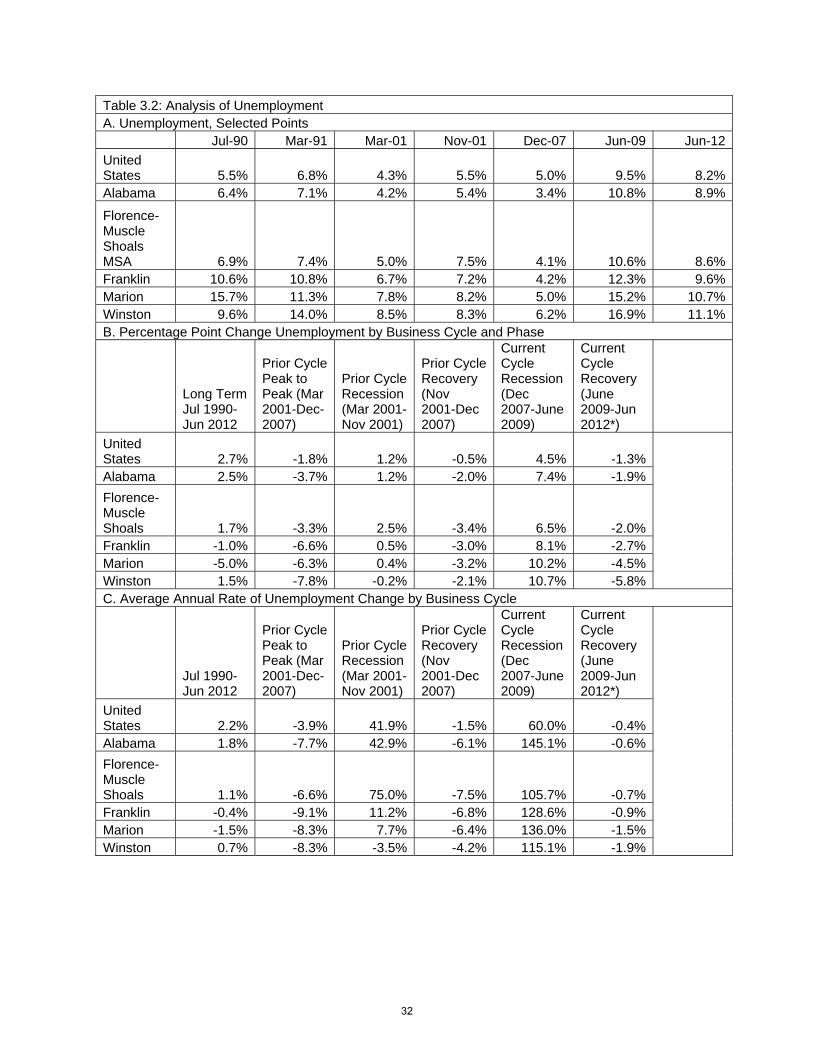
Table 3.2: Analysis of Unemployment A. Unemployment, Selected Points
Jul-90 Mar-91 Mar-01 Nov-01 Dec-07 Jun-09 Jun-12
United States 5.5% 6.8% 4.3% 5.5% 5.0% 9.5% 8.2%Alabama 6.4% 7.1% 4.2% 5.4% 3.4% 10.8% 8.9%
Florence-Muscle Shoals MSA 6.9% 7.4% 5.0% 7.5% 4.1% 10.6% 8.6%Franklin 10.6% 10.8% 6.7% 7.2% 4.2% 12.3% 9.6%Marion 15.7% 11.3% 7.8% 8.2% 5.0% 15.2% 10.7%Winston 9.6% 14.0% 8.5% 8.3% 6.2% 16.9% 11.1%B. Percentage Point Change Unemployment by Business Cycle and Phase
Long Term Jul 1990- Jun 2012
Prior Cycle Peak to Peak (Mar 2001-Dec-2007)
Prior Cycle Recession (Mar 2001-Nov 2001)
Prior Cycle Recovery (Nov 2001-Dec 2007)
Current Cycle Recession (Dec 2007-June 2009)
Current Cycle Recovery (June 2009-Jun 2012*)
United States 2.7% -1.8% 1.2% -0.5% 4.5% -1.3% Alabama 2.5% -3.7% 1.2% -2.0% 7.4% -1.9%
Florence-Muscle Shoals 1.7% -3.3% 2.5% -3.4% 6.5% -2.0% Franklin -1.0% -6.6% 0.5% -3.0% 8.1% -2.7% Marion -5.0% -6.3% 0.4% -3.2% 10.2% -4.5% Winston 1.5% -7.8% -0.2% -2.1% 10.7% -5.8% C. Average Annual Rate of Unemployment Change by Business Cycle
Jul 1990- Jun 2012
Prior Cycle Peak to Peak (Mar 2001-Dec-2007)
Prior Cycle Recession (Mar 2001-Nov 2001)
Prior Cycle Recovery (Nov 2001-Dec 2007)
Current Cycle Recession (Dec 2007-June 2009)
Current Cycle Recovery (June 2009-Jun 2012*)
United States 2.2% -3.9% 41.9% -1.5% 60.0% -0.4% Alabama 1.8% -7.7% 42.9% -6.1% 145.1% -0.6%
Florence-Muscle Shoals 1.1% -6.6% 75.0% -7.5% 105.7% -0.7% Franklin -0.4% -9.1% 11.2% -6.8% 128.6% -0.9% Marion -1.5% -8.3% 7.7% -6.4% 136.0% -1.5% Winston 0.7% -8.3% -3.5% -4.2% 115.1% -1.9%
32
3.1.3 Underemployment
Underemployment is the condition of a worker who, despite having skills that would allow him
or her success in a higher paying job, lacks the quality or quantity of work for which he or she is
qualified. Such workers tend to earn lower wages than they believe themselves qualified to earn, work
fewer hours, and have less job security and tenure. Reasons for underemployment vary considerably,
but include factors such as a lack of job opportunities, an unwillingness to commute, and an inability to
relocate from a geographic location due to family or other considerations. According to a study of
underemployment by The University of Alabama, the statewide rate of underemployment was 25.2% in
2006, up slightly from 2004. Based on survey responses, Region I of the Workforce Investment Advisory
Area, made up of the five counties of the Economic Development District (the NACOLG Region), posted
the second lowest statewide rate of underemployment‐ 22.8% or 23,560 underemployed workers, up
from 19.4% in 2004. Although county‐level estimates are much less certain statistically due to lower
response rates, Franklin County reported the lowest rate of underemployment, at 14.3%. Although
dated to a pre‐recession period, the data indicate a significant underemployment issue prior to the
recession, which would reasonably indicate a persistent problem in its aftermath.
0
2
4
6
8
10
12
14
16
18
20
1990
1991
1993
1994
1996
1997
1998
2000
2001
2002
2004
2005
2007
2008
2009
2011
Unemploym
ent Rate (%)
Figure 3A
Alabama
Florence‐MuscleShoals MSA
Franklin County
Marion County
Winston County
33

Underem
expressed
earnings a
ployment wa
d concern tha
and populati
as cited as a s
at employme
on loss.
significant an
ent opportuni
nd growing co
ities were lim
oncern throug
mited for skill
ghout the reg
ed workers,
gion. Individ
leading to low
duals
wer
34
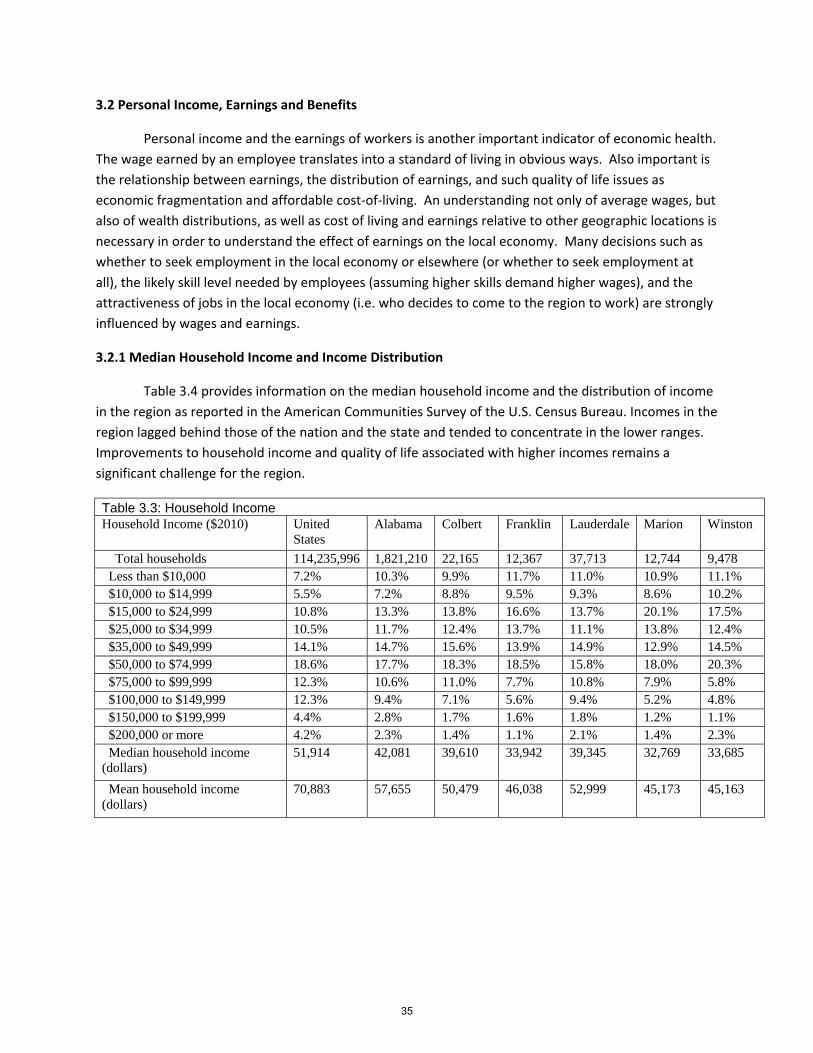
3.2 Personal Income, Earnings and Benefits
Personal income and the earnings of workers is another important indicator of economic health.
The wage earned by an employee translates into a standard of living in obvious ways. Also important is
the relationship between earnings, the distribution of earnings, and such quality of life issues as
economic fragmentation and affordable cost‐of‐living. An understanding not only of average wages, but
also of wealth distributions, as well as cost of living and earnings relative to other geographic locations is
necessary in order to understand the effect of earnings on the local economy. Many decisions such as
whether to seek employment in the local economy or elsewhere (or whether to seek employment at
all), the likely skill level needed by employees (assuming higher skills demand higher wages), and the
attractiveness of jobs in the local economy (i.e. who decides to come to the region to work) are strongly
influenced by wages and earnings.
3.2.1 Median Household Income and Income Distribution
Table 3.4 provides information on the median household income and the distribution of income
in the region as reported in the American Communities Survey of the U.S. Census Bureau. Incomes in the
region lagged behind those of the nation and the state and tended to concentrate in the lower ranges.
Improvements to household income and quality of life associated with higher incomes remains a
significant challenge for the region.
Table 3.3: Household Income Household Income ($2010) United
States Alabama Colbert Franklin Lauderdale Marion Winston
Total households 114,235,996 1,821,210 22,165 12,367 37,713 12,744 9,478 Less than $10,000 7.2% 10.3% 9.9% 11.7% 11.0% 10.9% 11.1% $10,000 to $14,999 5.5% 7.2% 8.8% 9.5% 9.3% 8.6% 10.2% $15,000 to $24,999 10.8% 13.3% 13.8% 16.6% 13.7% 20.1% 17.5% $25,000 to $34,999 10.5% 11.7% 12.4% 13.7% 11.1% 13.8% 12.4% $35,000 to $49,999 14.1% 14.7% 15.6% 13.9% 14.9% 12.9% 14.5% $50,000 to $74,999 18.6% 17.7% 18.3% 18.5% 15.8% 18.0% 20.3% $75,000 to $99,999 12.3% 10.6% 11.0% 7.7% 10.8% 7.9% 5.8% $100,000 to $149,999 12.3% 9.4% 7.1% 5.6% 9.4% 5.2% 4.8% $150,000 to $199,999 4.4% 2.8% 1.7% 1.6% 1.8% 1.2% 1.1% $200,000 or more 4.2% 2.3% 1.4% 1.1% 2.1% 1.4% 2.3% Median household income (dollars)
51,914 42,081 39,610 33,942 39,345 32,769 33,685
Mean household income (dollars)
70,883 57,655 50,479 46,038 52,999 45,173 45,163
35
3.2.2 Personal Income
Table 3.4 displays total personal income for the United States, the Southeast, Alabama, the
regional study areas, and regional comparison areas for various components of wealth for 2010 and
change from 2005‐2010. The following statistics from Table 3.4 are referenced in the discussion that
follows:
Gross earnings by place of work is a measure of the total value of all incomes produced in a particular
geographic location‐ regardless of the place of residence of the worker.
Net earnings of residents is a measure of the total earnings of all residents of the geographic area after
withholding for contributions to SSI and commuting.
Commuting adjustment is the difference between earnings of residents working in different locations
and the earnings of non‐residents employed locally; thus it represents the difference in incomes
“brought home” by residents and that “sent out” with non‐resident workers.
Unearned income represents payments from sources other than working‐ either investments, savings
(including pensions) and properties (dividend interest and rent) or social security, government
retirement, unemployment or disability (transfers). This is a particularly important measure of income
since net wealth is usually tied to income producing investments of various types. Therefore, this source
of income is a measure of the approximate net value of the value of investments in various forms‐ from
property to savings.
Per capita personal income is an indicator of community earnings, equalized by total population. Note:
Per capita personal income does not measure the probable earnings or wage per worker.
36
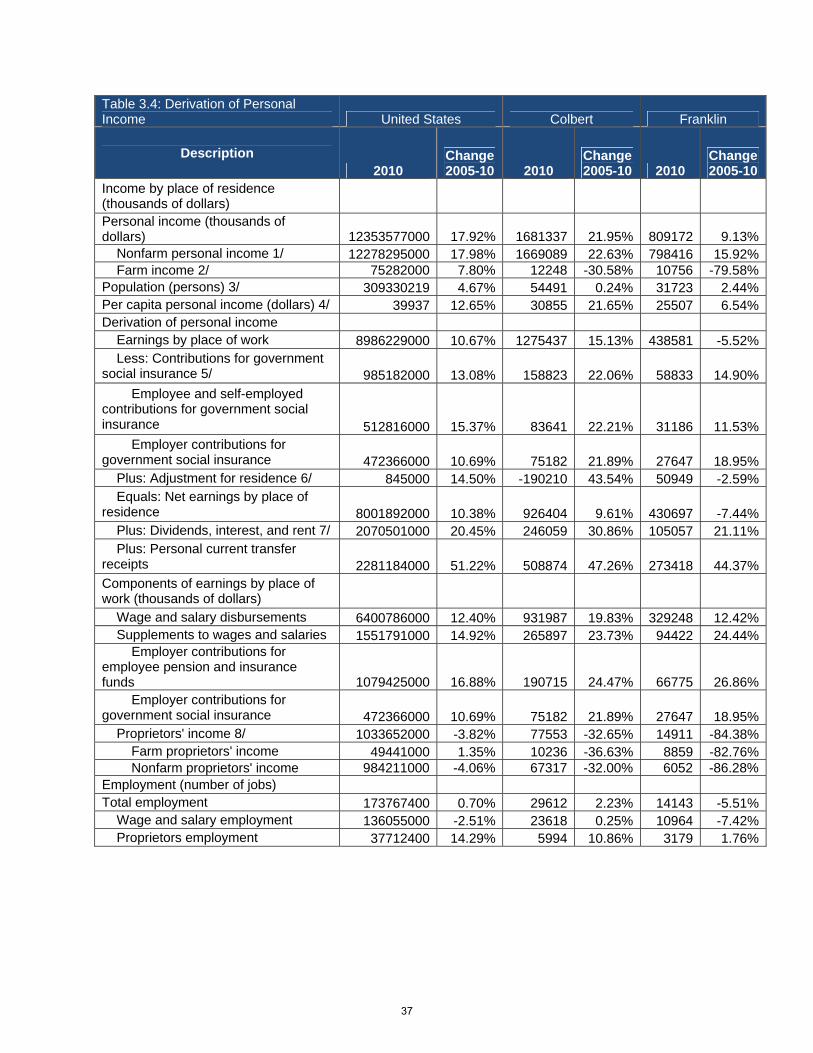
Table 3.4: Derivation of Personal Income United States Colbert Franklin
Description 2010
Change 2005-10 2010
Change 2005-10 2010
Change 2005-10
Income by place of residence (thousands of dollars) Personal income (thousands of dollars) 12353577000 17.92% 1681337 21.95% 809172 9.13% Nonfarm personal income 1/ 12278295000 17.98% 1669089 22.63% 798416 15.92% Farm income 2/ 75282000 7.80% 12248 -30.58% 10756 -79.58%Population (persons) 3/ 309330219 4.67% 54491 0.24% 31723 2.44%Per capita personal income (dollars) 4/ 39937 12.65% 30855 21.65% 25507 6.54%Derivation of personal income Earnings by place of work 8986229000 10.67% 1275437 15.13% 438581 -5.52% Less: Contributions for government social insurance 5/ 985182000 13.08% 158823 22.06% 58833 14.90% Employee and self-employed contributions for government social insurance 512816000 15.37% 83641 22.21% 31186 11.53% Employer contributions for government social insurance 472366000 10.69% 75182 21.89% 27647 18.95% Plus: Adjustment for residence 6/ 845000 14.50% -190210 43.54% 50949 -2.59% Equals: Net earnings by place of residence 8001892000 10.38% 926404 9.61% 430697 -7.44% Plus: Dividends, interest, and rent 7/ 2070501000 20.45% 246059 30.86% 105057 21.11% Plus: Personal current transfer receipts 2281184000 51.22% 508874 47.26% 273418 44.37%Components of earnings by place of work (thousands of dollars) Wage and salary disbursements 6400786000 12.40% 931987 19.83% 329248 12.42% Supplements to wages and salaries 1551791000 14.92% 265897 23.73% 94422 24.44% Employer contributions for employee pension and insurance funds 1079425000 16.88% 190715 24.47% 66775 26.86% Employer contributions for government social insurance 472366000 10.69% 75182 21.89% 27647 18.95% Proprietors' income 8/ 1033652000 -3.82% 77553 -32.65% 14911 -84.38% Farm proprietors' income 49441000 1.35% 10236 -36.63% 8859 -82.76% Nonfarm proprietors' income 984211000 -4.06% 67317 -32.00% 6052 -86.28%Employment (number of jobs) Total employment 173767400 0.70% 29612 2.23% 14143 -5.51% Wage and salary employment 136055000 -2.51% 23618 0.25% 10964 -7.42% Proprietors employment 37712400 14.29% 5994 10.86% 3179 1.76%
37
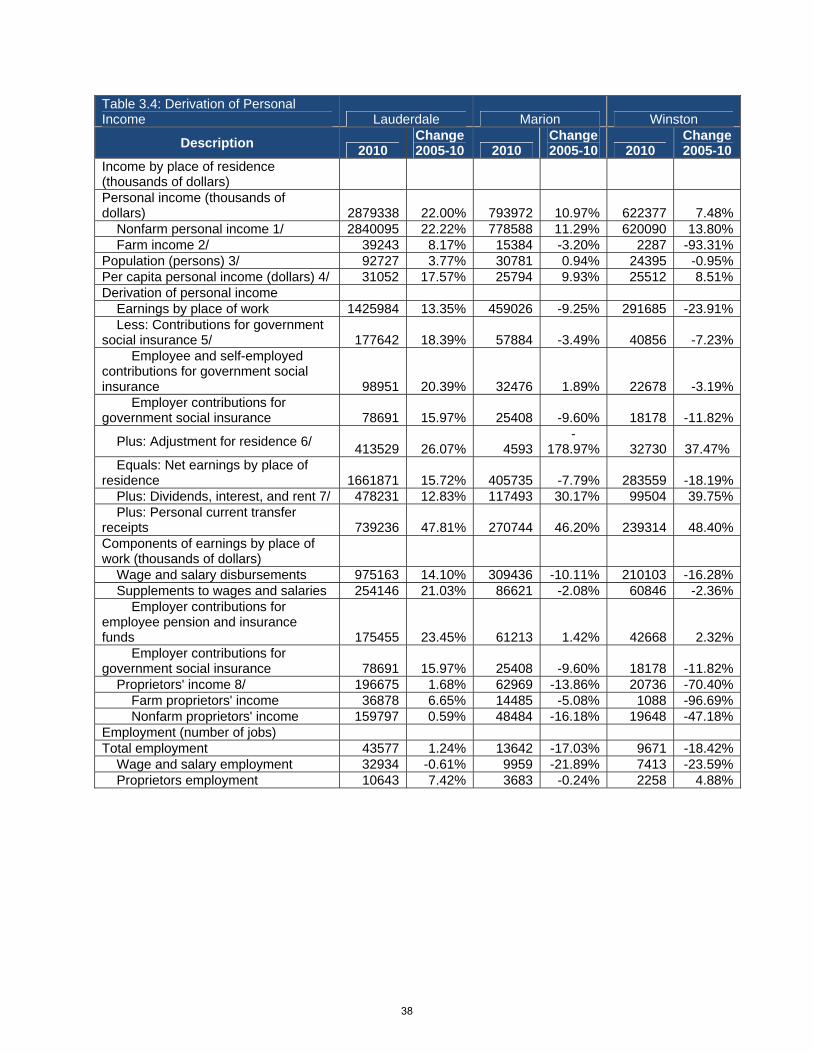
Table 3.4: Derivation of Personal Income Lauderdale Marion Winston
Description 2010
Change 2005-10 2010
Change 2005-10 2010
Change 2005-10
Income by place of residence (thousands of dollars) Personal income (thousands of dollars) 2879338 22.00% 793972 10.97% 622377 7.48% Nonfarm personal income 1/ 2840095 22.22% 778588 11.29% 620090 13.80% Farm income 2/ 39243 8.17% 15384 -3.20% 2287 -93.31%Population (persons) 3/ 92727 3.77% 30781 0.94% 24395 -0.95%Per capita personal income (dollars) 4/ 31052 17.57% 25794 9.93% 25512 8.51%Derivation of personal income Earnings by place of work 1425984 13.35% 459026 -9.25% 291685 -23.91% Less: Contributions for government social insurance 5/ 177642 18.39% 57884 -3.49% 40856 -7.23% Employee and self-employed contributions for government social insurance 98951 20.39% 32476 1.89% 22678 -3.19% Employer contributions for government social insurance 78691 15.97% 25408 -9.60% 18178 -11.82%
Plus: Adjustment for residence 6/ 413529 26.07% 4593
-178.97% 32730 37.47%
Equals: Net earnings by place of residence 1661871 15.72% 405735 -7.79% 283559 -18.19% Plus: Dividends, interest, and rent 7/ 478231 12.83% 117493 30.17% 99504 39.75% Plus: Personal current transfer receipts 739236 47.81% 270744 46.20% 239314 48.40%Components of earnings by place of work (thousands of dollars) Wage and salary disbursements 975163 14.10% 309436 -10.11% 210103 -16.28% Supplements to wages and salaries 254146 21.03% 86621 -2.08% 60846 -2.36% Employer contributions for employee pension and insurance funds 175455 23.45% 61213 1.42% 42668 2.32% Employer contributions for government social insurance 78691 15.97% 25408 -9.60% 18178 -11.82% Proprietors' income 8/ 196675 1.68% 62969 -13.86% 20736 -70.40% Farm proprietors' income 36878 6.65% 14485 -5.08% 1088 -96.69% Nonfarm proprietors' income 159797 0.59% 48484 -16.18% 19648 -47.18%Employment (number of jobs) Total employment 43577 1.24% 13642 -17.03% 9671 -18.42% Wage and salary employment 32934 -0.61% 9959 -21.89% 7413 -23.59% Proprietors employment 10643 7.42% 3683 -0.24% 2258 4.88%
38
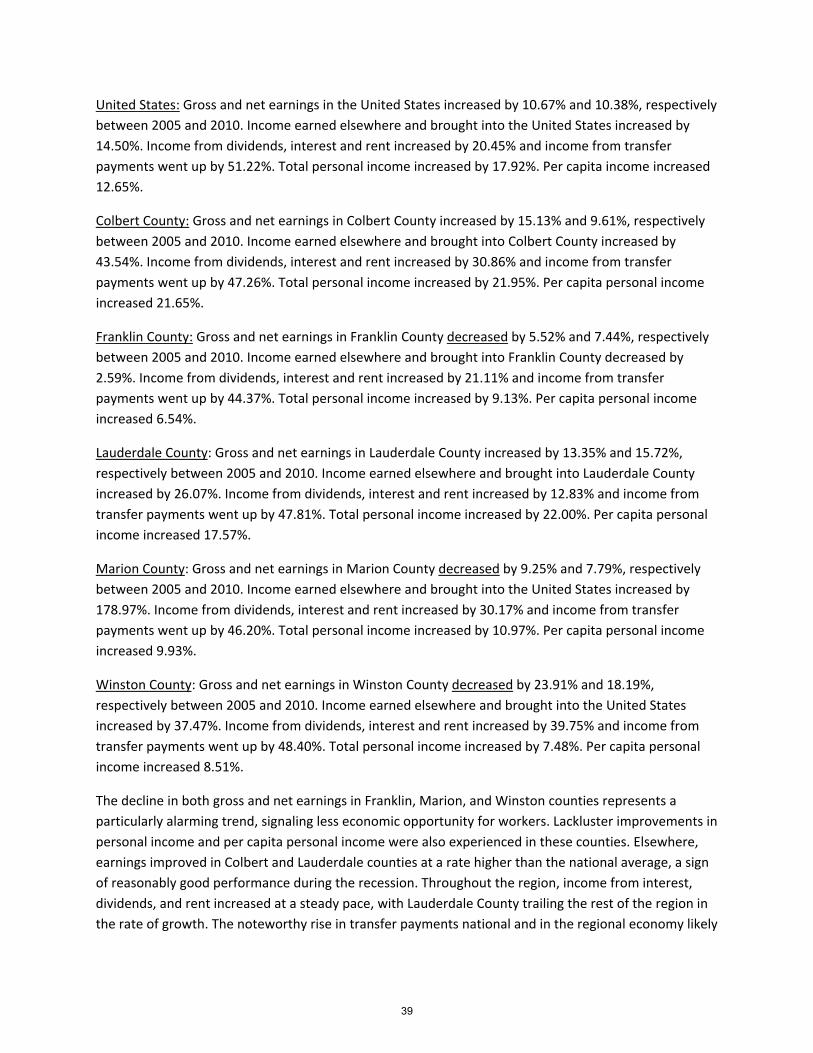
United States: Gross and net earnings in the United States increased by 10.67% and 10.38%, respectively
between 2005 and 2010. Income earned elsewhere and brought into the United States increased by
14.50%. Income from dividends, interest and rent increased by 20.45% and income from transfer
payments went up by 51.22%. Total personal income increased by 17.92%. Per capita income increased
12.65%.
Colbert County: Gross and net earnings in Colbert County increased by 15.13% and 9.61%, respectively
between 2005 and 2010. Income earned elsewhere and brought into Colbert County increased by
43.54%. Income from dividends, interest and rent increased by 30.86% and income from transfer
payments went up by 47.26%. Total personal income increased by 21.95%. Per capita personal income
increased 21.65%.
Franklin County: Gross and net earnings in Franklin County decreased by 5.52% and 7.44%, respectively
between 2005 and 2010. Income earned elsewhere and brought into Franklin County decreased by
2.59%. Income from dividends, interest and rent increased by 21.11% and income from transfer
payments went up by 44.37%. Total personal income increased by 9.13%. Per capita personal income
increased 6.54%.
Lauderdale County: Gross and net earnings in Lauderdale County increased by 13.35% and 15.72%,
respectively between 2005 and 2010. Income earned elsewhere and brought into Lauderdale County
increased by 26.07%. Income from dividends, interest and rent increased by 12.83% and income from
transfer payments went up by 47.81%. Total personal income increased by 22.00%. Per capita personal
income increased 17.57%.
Marion County: Gross and net earnings in Marion County decreased by 9.25% and 7.79%, respectively
between 2005 and 2010. Income earned elsewhere and brought into the United States increased by
178.97%. Income from dividends, interest and rent increased by 30.17% and income from transfer
payments went up by 46.20%. Total personal income increased by 10.97%. Per capita personal income
increased 9.93%.
Winston County: Gross and net earnings in Winston County decreased by 23.91% and 18.19%,
respectively between 2005 and 2010. Income earned elsewhere and brought into the United States
increased by 37.47%. Income from dividends, interest and rent increased by 39.75% and income from
transfer payments went up by 48.40%. Total personal income increased by 7.48%. Per capita personal
income increased 8.51%.
The decline in both gross and net earnings in Franklin, Marion, and Winston counties represents a
particularly alarming trend, signaling less economic opportunity for workers. Lackluster improvements in
personal income and per capita personal income were also experienced in these counties. Elsewhere,
earnings improved in Colbert and Lauderdale counties at a rate higher than the national average, a sign
of reasonably good performance during the recession. Throughout the region, income from interest,
dividends, and rent increased at a steady pace, with Lauderdale County trailing the rest of the region in
the rate of growth. The noteworthy rise in transfer payments national and in the regional economy likely
39
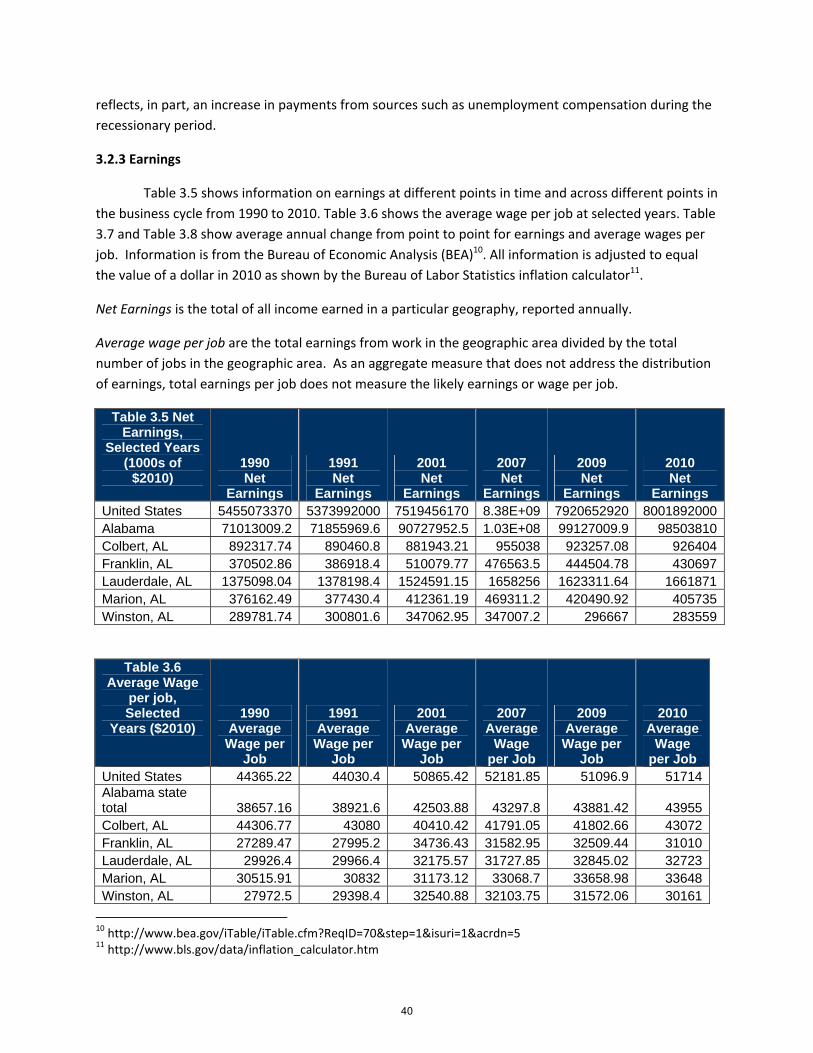
reflects, in part, an increase in payments from sources such as unemployment compensation during the
recessionary period.
3.2.3 Earnings
Table 3.5 shows information on earnings at different points in time and across different points in
the business cycle from 1990 to 2010. Table 3.6 shows the average wage per job at selected years. Table
3.7 and Table 3.8 show average annual change from point to point for earnings and average wages per
job. Information is from the Bureau of Economic Analysis (BEA)10. All information is adjusted to equal
the value of a dollar in 2010 as shown by the Bureau of Labor Statistics inflation calculator11.
Net Earnings is the total of all income earned in a particular geography, reported annually.
Average wage per job are the total earnings from work in the geographic area divided by the total
number of jobs in the geographic area. As an aggregate measure that does not address the distribution
of earnings, total earnings per job does not measure the likely earnings or wage per job.
Table 3.5 Net Earnings,
Selected Years (1000s of
$2010)
1990 Net
Earnings
1991 Net
Earnings
2001 Net
Earnings
2007 Net
Earnings
2009 Net
Earnings
2010 Net
Earnings United States 5455073370 5373992000 7519456170 8.38E+09 7920652920 8001892000Alabama 71013009.2 71855969.6 90727952.5 1.03E+08 99127009.9 98503810Colbert, AL 892317.74 890460.8 881943.21 955038 923257.08 926404Franklin, AL 370502.86 386918.4 510079.77 476563.5 444504.78 430697Lauderdale, AL 1375098.04 1378198.4 1524591.15 1658256 1623311.64 1661871Marion, AL 376162.49 377430.4 412361.19 469311.2 420490.92 405735Winston, AL 289781.74 300801.6 347062.95 347007.2 296667 283559
Table 3.6 Average Wage
per job, Selected
Years ($2010)
1990 Average Wage per
Job
1991 Average Wage per
Job
2001 Average Wage per
Job
2007 Average
Wage per Job
2009 Average Wage per
Job
2010 Average
Wage per Job
United States 44365.22 44030.4 50865.42 52181.85 51096.9 51714Alabama state total 38657.16 38921.6 42503.88 43297.8 43881.42 43955Colbert, AL 44306.77 43080 40410.42 41791.05 41802.66 43072Franklin, AL 27289.47 27995.2 34736.43 31582.95 32509.44 31010Lauderdale, AL 29926.4 29966.4 32175.57 31727.85 32845.02 32723Marion, AL 30515.91 30832 31173.12 33068.7 33658.98 33648Winston, AL 27972.5 29398.4 32540.88 32103.75 31572.06 30161
10 http://www.bea.gov/iTable/iTable.cfm?ReqID=70&step=1&isuri=1&acrdn=5 11 http://www.bls.gov/data/inflation_calculator.htm
40
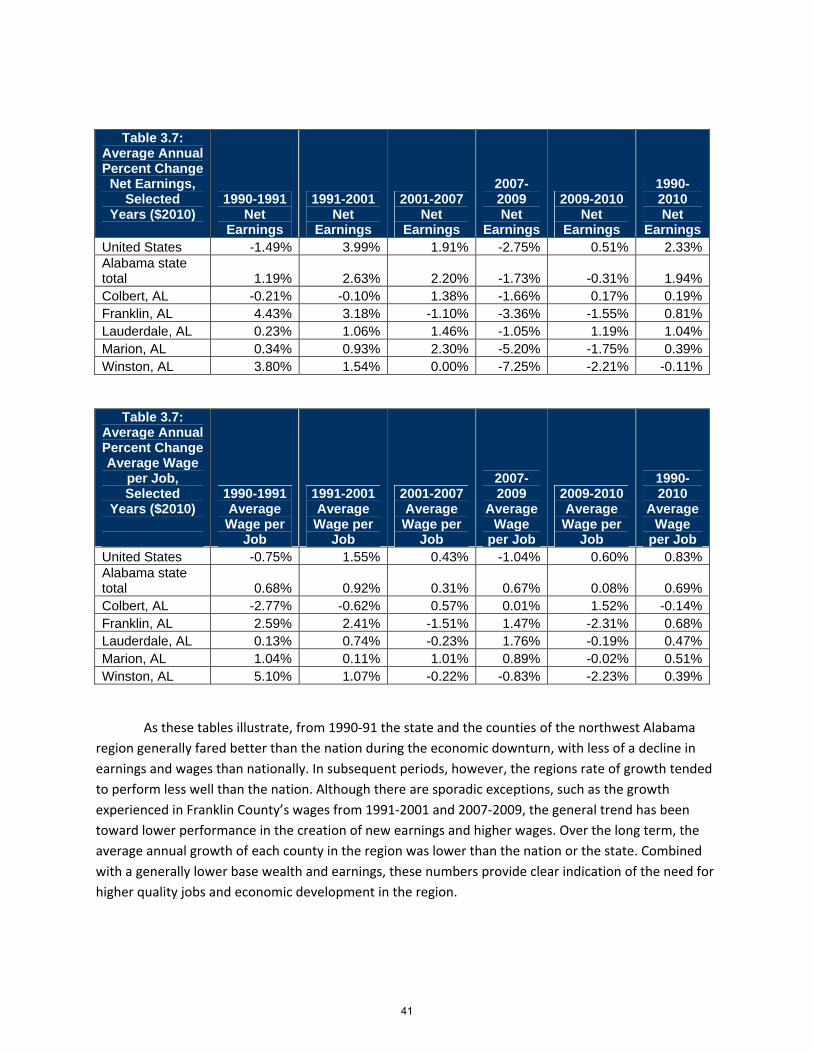
Table 3.7: Average Annual Percent Change
Net Earnings, Selected
Years ($2010)
1990-1991 Net
Earnings
1991-2001 Net
Earnings
2001-2007 Net
Earnings
2007-2009 Net
Earnings
2009-2010 Net
Earnings
1990-2010 Net
Earnings United States -1.49% 3.99% 1.91% -2.75% 0.51% 2.33%Alabama state total 1.19% 2.63% 2.20% -1.73% -0.31% 1.94%Colbert, AL -0.21% -0.10% 1.38% -1.66% 0.17% 0.19%Franklin, AL 4.43% 3.18% -1.10% -3.36% -1.55% 0.81%Lauderdale, AL 0.23% 1.06% 1.46% -1.05% 1.19% 1.04%Marion, AL 0.34% 0.93% 2.30% -5.20% -1.75% 0.39%Winston, AL 3.80% 1.54% 0.00% -7.25% -2.21% -0.11%
Table 3.7: Average Annual Percent Change Average Wage
per Job, Selected
Years ($2010)
1990-1991 Average Wage per
Job
1991-2001 Average Wage per
Job
2001-2007 Average Wage per
Job
2007-2009
Average Wage
per Job
2009-2010 Average Wage per
Job
1990-2010
Average Wage
per Job United States -0.75% 1.55% 0.43% -1.04% 0.60% 0.83%Alabama state total 0.68% 0.92% 0.31% 0.67% 0.08% 0.69%Colbert, AL -2.77% -0.62% 0.57% 0.01% 1.52% -0.14%Franklin, AL 2.59% 2.41% -1.51% 1.47% -2.31% 0.68%Lauderdale, AL 0.13% 0.74% -0.23% 1.76% -0.19% 0.47%Marion, AL 1.04% 0.11% 1.01% 0.89% -0.02% 0.51%Winston, AL 5.10% 1.07% -0.22% -0.83% -2.23% 0.39%
As these tables illustrate, from 1990‐91 the state and the counties of the northwest Alabama
region generally fared better than the nation during the economic downturn, with less of a decline in
earnings and wages than nationally. In subsequent periods, however, the regions rate of growth tended
to perform less well than the nation. Although there are sporadic exceptions, such as the growth
experienced in Franklin County’s wages from 1991‐2001 and 2007‐2009, the general trend has been
toward lower performance in the creation of new earnings and higher wages. Over the long term, the
average annual growth of each county in the region was lower than the nation or the state. Combined
with a generally lower base wealth and earnings, these numbers provide clear indication of the need for
higher quality jobs and economic development in the region.
41
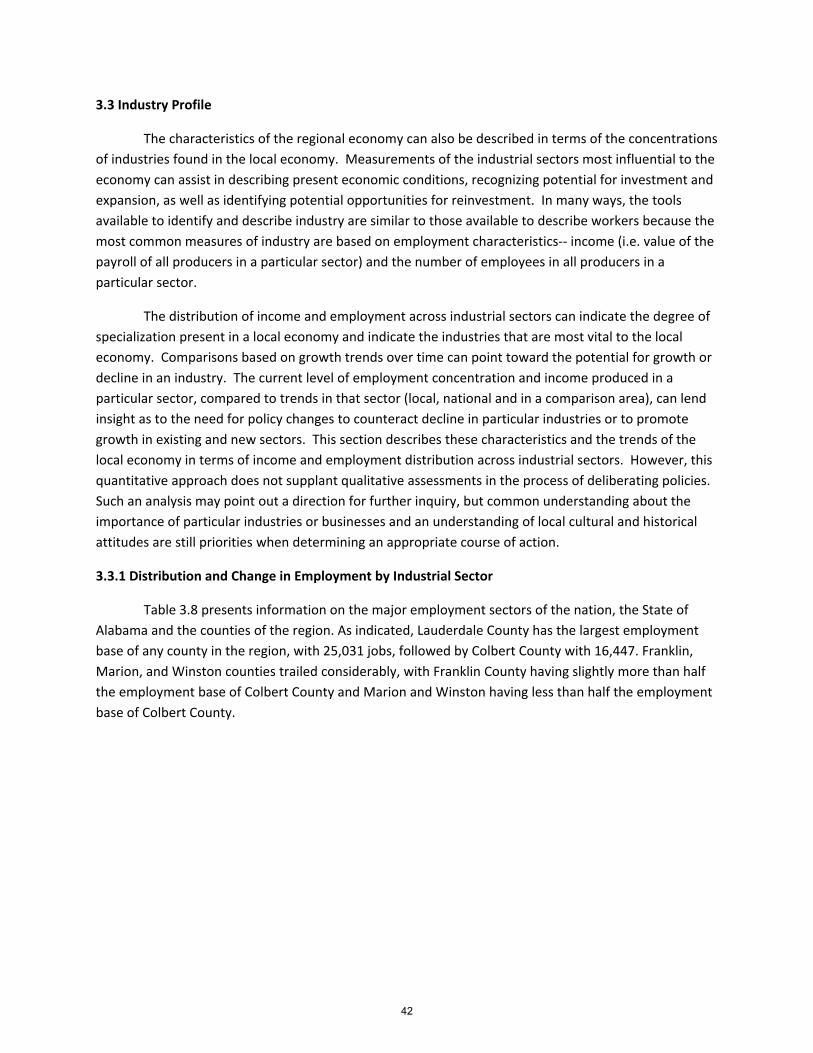
3.3 Industry Profile
The characteristics of the regional economy can also be described in terms of the concentrations
of industries found in the local economy. Measurements of the industrial sectors most influential to the
economy can assist in describing present economic conditions, recognizing potential for investment and
expansion, as well as identifying potential opportunities for reinvestment. In many ways, the tools
available to identify and describe industry are similar to those available to describe workers because the
most common measures of industry are based on employment characteristics‐‐ income (i.e. value of the
payroll of all producers in a particular sector) and the number of employees in all producers in a
particular sector.
The distribution of income and employment across industrial sectors can indicate the degree of
specialization present in a local economy and indicate the industries that are most vital to the local
economy. Comparisons based on growth trends over time can point toward the potential for growth or
decline in an industry. The current level of employment concentration and income produced in a
particular sector, compared to trends in that sector (local, national and in a comparison area), can lend
insight as to the need for policy changes to counteract decline in particular industries or to promote
growth in existing and new sectors. This section describes these characteristics and the trends of the
local economy in terms of income and employment distribution across industrial sectors. However, this
quantitative approach does not supplant qualitative assessments in the process of deliberating policies.
Such an analysis may point out a direction for further inquiry, but common understanding about the
importance of particular industries or businesses and an understanding of local cultural and historical
attitudes are still priorities when determining an appropriate course of action.
3.3.1 Distribution and Change in Employment by Industrial Sector
Table 3.8 presents information on the major employment sectors of the nation, the State of
Alabama and the counties of the region. As indicated, Lauderdale County has the largest employment
base of any county in the region, with 25,031 jobs, followed by Colbert County with 16,447. Franklin,
Marion, and Winston counties trailed considerably, with Franklin County having slightly more than half
the employment base of Colbert County and Marion and Winston having less than half the employment
base of Colbert County.
42
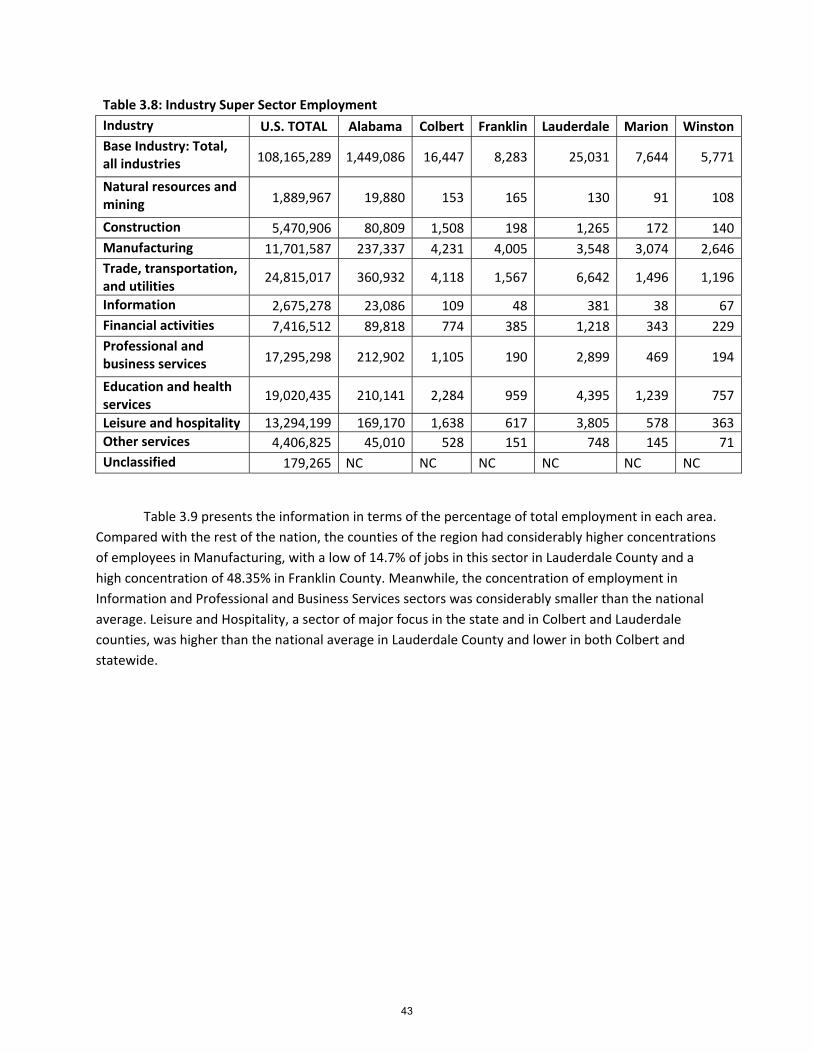
Table 3.8: Industry Super Sector Employment
Industry U.S. TOTAL Alabama Colbert Franklin Lauderdale Marion Winston
Base Industry: Total, all industries 108,165,289 1,449,086 16,447 8,283 25,031 7,644 5,771
Natural resources and mining 1,889,967 19,880 153 165 130 91 108
Construction 5,470,906 80,809 1,508 198 1,265 172 140
Manufacturing 11,701,587 237,337 4,231 4,005 3,548 3,074 2,646
Trade, transportation, and utilities
24,815,017 360,932 4,118 1,567 6,642 1,496 1,196
Information 2,675,278 23,086 109 48 381 38 67
Financial activities 7,416,512 89,818 774 385 1,218 343 229
Professional and business services 17,295,298 212,902 1,105 190 2,899 469 194
Education and health services
19,020,435 210,141 2,284 959 4,395 1,239 757
Leisure and hospitality 13,294,199 169,170 1,638 617 3,805 578 363
Other services 4,406,825 45,010 528 151 748 145 71
Unclassified 179,265 NC NC NC NC NC NC
Table 3.9 presents the information in terms of the percentage of total employment in each area.
Compared with the rest of the nation, the counties of the region had considerably higher concentrations
of employees in Manufacturing, with a low of 14.7% of jobs in this sector in Lauderdale County and a
high concentration of 48.35% in Franklin County. Meanwhile, the concentration of employment in
Information and Professional and Business Services sectors was considerably smaller than the national
average. Leisure and Hospitality, a sector of major focus in the state and in Colbert and Lauderdale
counties, was higher than the national average in Lauderdale County and lower in both Colbert and
statewide.
43
Table 3.9: Industry Super Sector Employment Concentrations
Industry U.S. TOTAL
Alabama
Colbert Franklin Lauderdal
e Marion
Winston
Base Industry: Total, all industries 100.00% 100.00%
100.00%
100.00%
100.00% 100.00
%100.00
%
Natural resources and mining 1.75% 1.37% 0.93% 1.99% 0.52% 1.19% 1.87%
Construction 5.06% 5.58% 9.17% 2.39% 5.05% 2.25% 2.43%
Manufacturing 10.82% 16.38% 25.73% 48.35% 14.17% 40.21% 45.85%
Trade, transportation, and utilities
22.94% 24.91% 25.04% 18.92% 26.54% 19.57% 20.72%
Information 2.47% 1.59% 0.66% 0.58% 1.52% 0.50% 1.16%
Financial activities 6.86% 6.20% 4.71% 4.65% 4.87% 4.49% 3.97%
Professional and business services 15.99% 14.69% 6.72% 2.29% 11.58% 6.14% 3.36%
Education and health services 17.58% 14.50% 13.89% 11.58% 17.56% 16.21% 13.12%
Leisure and hospitality
12.29% 11.67% 9.96% 7.45% 15.20% 7.56% 6.29%
Other services 4.07% 3.11% 3.21% 1.82% 2.99% 1.90% 1.23%
Unclassified 0.17% NC NC NC NC NC NC
Table 3.10 presents employment data as location quotients, which are a numerical comparison
of the concentration of employment in the study area to the concentration of employment in the
comparison area (in this case, nationally). The more heavily a sector is concentrated within the local
economy, the higher the value of its location quotient. A value less than 1 represents a smaller
concentration of employment in that sector than nationally. A value greater than 1 indicates that
employment is more heavily concentrated in that sector within the study area than within the
comparison area. Such concentration is typically referred to as a specialization, a term which recognizes
the skills and knowledge of the local economy that are likely to be present along with a larger than
average number of employees being in that sector. Typically, specializations are noted as strengths to
the local economy, depending on the growth or decline in the national competitiveness of that sector.
For the State of Alabama and each county, the concentration of employment in manufacturing
represented a strong area of specialization. Weaker location quotients varied by county across the
region.
44

Table 3.10: Industry Super Sector Location Quotient
Industry Alabama Colbert Franklin Lauderdale Marion Winston
Base Industry: Total, all industries
1 1 1 1 1 1
Natural resources and mining 0.79 0.53 1.14 0.3 0.68 1.07
Construction 1.1 1.81 0.47 1 0.44 0.48
Manufacturing 1.51 2.38 4.47 1.31 3.72 4.24
Trade, transportation, and utilities
1.09 1.09 0.82 1.16 0.85 0.9
Information 0.64 0.27 0.23 0.62 0.2 0.47
Financial activities
0.9 0.69 0.68 0.71 0.65 0.58
Professional and business services 0.92 0.42 0.14 0.72 0.38 0.21
Education and health services 0.82 0.79 0.66 1 0.92 0.75
Leisure and hospitality 0.95 0.81 0.61 1.24 0.62 0.51
Other services 0.76 0.79 0.45 0.73 0.47 0.3
Unclassified NC NC NC NC NC NC
Table 3.11 displays information on the annual average rate of change, growth or decline, in
industry sector employment from 2009‐2011. In terms of total employment, Colbert, Franklin, and
Lauderdale counties have experienced job growth at a rate faster than the national average. Winston
County’s job growth was slightly below the national average and in line with the State of Alabama’s
performance for the same period. Marion County, however, experienced significantly worse job creation
than nationally or in other counties in the period from 2009‐2011. When viewed by industry sector,
Manufacturing growth was particularly evident in Colbert and Franklin counties, followed by strong
performance in Lauderdale and Winston. Again, Marion County produced negative rates. In the
Information sector, only Colbert County experienced growth in the period studied.
45
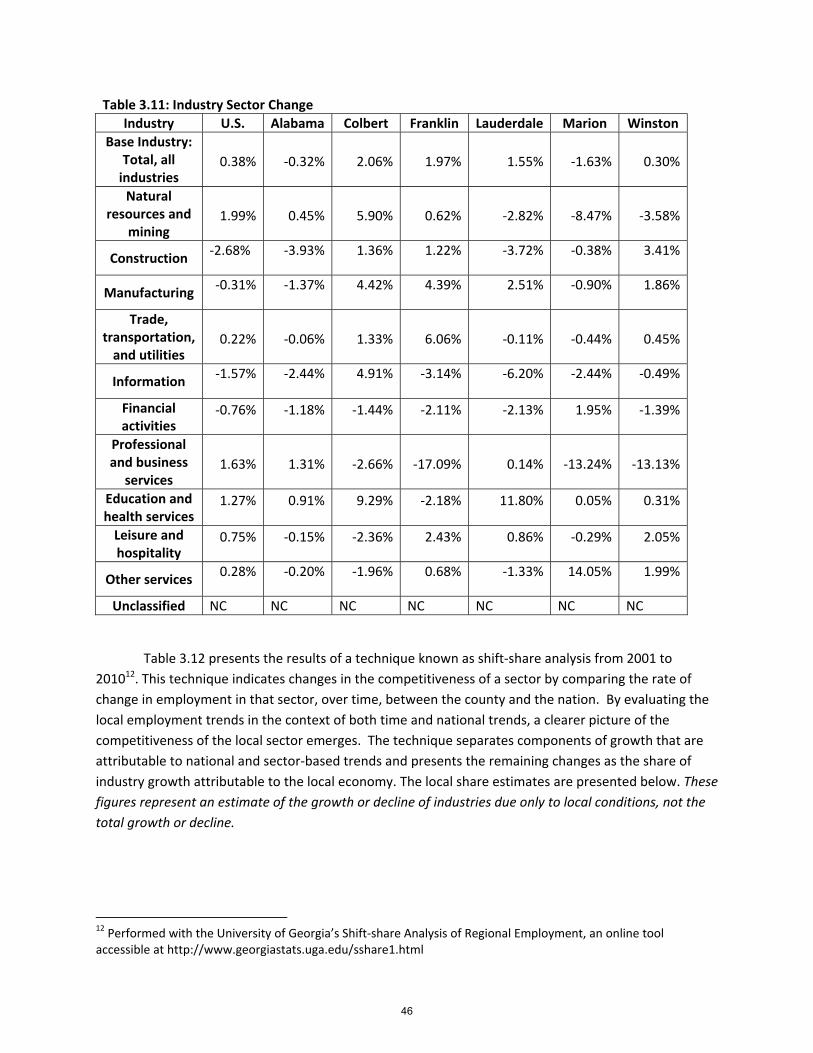
Table 3.11: Industry Sector Change
Industry U.S. Alabama Colbert Franklin Lauderdale Marion Winston
Base Industry: Total, all industries
0.38% ‐0.32% 2.06% 1.97% 1.55% ‐1.63% 0.30%
Natural resources and
mining 1.99% 0.45% 5.90% 0.62% ‐2.82% ‐8.47% ‐3.58%
Construction ‐2.68% ‐3.93% 1.36% 1.22% ‐3.72% ‐0.38% 3.41%
Manufacturing ‐0.31% ‐1.37% 4.42% 4.39% 2.51% ‐0.90% 1.86%
Trade, transportation, and utilities
0.22% ‐0.06% 1.33% 6.06% ‐0.11% ‐0.44% 0.45%
Information ‐1.57% ‐2.44% 4.91% ‐3.14% ‐6.20% ‐2.44% ‐0.49%
Financial activities
‐0.76% ‐1.18% ‐1.44% ‐2.11% ‐2.13% 1.95% ‐1.39%
Professional and business
services 1.63% 1.31% ‐2.66% ‐17.09% 0.14% ‐13.24% ‐13.13%
Education and health services
1.27% 0.91% 9.29% ‐2.18% 11.80% 0.05% 0.31%
Leisure and hospitality
0.75% ‐0.15% ‐2.36% 2.43% 0.86% ‐0.29% 2.05%
Other services 0.28% ‐0.20% ‐1.96% 0.68% ‐1.33% 14.05% 1.99%
Unclassified NC NC NC NC NC NC NC
Table 3.12 presents the results of a technique known as shift‐share analysis from 2001 to
201012. This technique indicates changes in the competitiveness of a sector by comparing the rate of
change in employment in that sector, over time, between the county and the nation. By evaluating the
local employment trends in the context of both time and national trends, a clearer picture of the
competitiveness of the local sector emerges. The technique separates components of growth that are
attributable to national and sector‐based trends and presents the remaining changes as the share of
industry growth attributable to the local economy. The local share estimates are presented below. These
figures represent an estimate of the growth or decline of industries due only to local conditions, not the
total growth or decline.
12 Performed with the University of Georgia’s Shift‐share Analysis of Regional Employment, an online tool accessible at http://www.georgiastats.uga.edu/sshare1.html
46
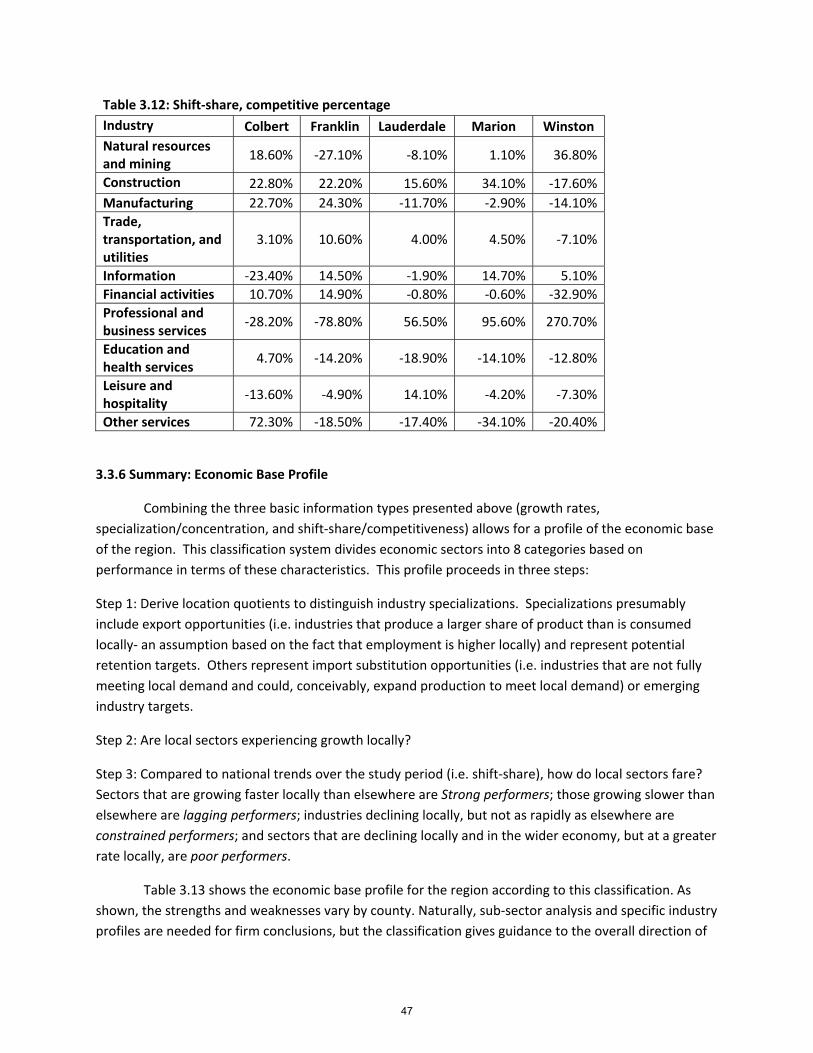
Table 3.12: Shift‐share, competitive percentage
Industry Colbert Franklin Lauderdale Marion Winston
Natural resources and mining
18.60% ‐27.10% ‐8.10% 1.10% 36.80%
Construction 22.80% 22.20% 15.60% 34.10% ‐17.60%
Manufacturing 22.70% 24.30% ‐11.70% ‐2.90% ‐14.10%
Trade, transportation, and utilities
3.10% 10.60% 4.00% 4.50% ‐7.10%
Information ‐23.40% 14.50% ‐1.90% 14.70% 5.10%
Financial activities 10.70% 14.90% ‐0.80% ‐0.60% ‐32.90%
Professional and business services
‐28.20% ‐78.80% 56.50% 95.60% 270.70%
Education and health services
4.70% ‐14.20% ‐18.90% ‐14.10% ‐12.80%
Leisure and hospitality
‐13.60% ‐4.90% 14.10% ‐4.20% ‐7.30%
Other services 72.30% ‐18.50% ‐17.40% ‐34.10% ‐20.40%
3.3.6 Summary: Economic Base Profile
Combining the three basic information types presented above (growth rates,
specialization/concentration, and shift‐share/competitiveness) allows for a profile of the economic base
of the region. This classification system divides economic sectors into 8 categories based on
performance in terms of these characteristics. This profile proceeds in three steps:
Step 1: Derive location quotients to distinguish industry specializations. Specializations presumably
include export opportunities (i.e. industries that produce a larger share of product than is consumed
locally‐ an assumption based on the fact that employment is higher locally) and represent potential
retention targets. Others represent import substitution opportunities (i.e. industries that are not fully
meeting local demand and could, conceivably, expand production to meet local demand) or emerging
industry targets.
Step 2: Are local sectors experiencing growth locally?
Step 3: Compared to national trends over the study period (i.e. shift‐share), how do local sectors fare?
Sectors that are growing faster locally than elsewhere are Strong performers; those growing slower than
elsewhere are lagging performers; industries declining locally, but not as rapidly as elsewhere are
constrained performers; and sectors that are declining locally and in the wider economy, but at a greater
rate locally, are poor performers.
Table 3.13 shows the economic base profile for the region according to this classification. As
shown, the strengths and weaknesses vary by county. Naturally, sub‐sector analysis and specific industry
profiles are needed for firm conclusions, but the classification gives guidance to the overall direction of
47
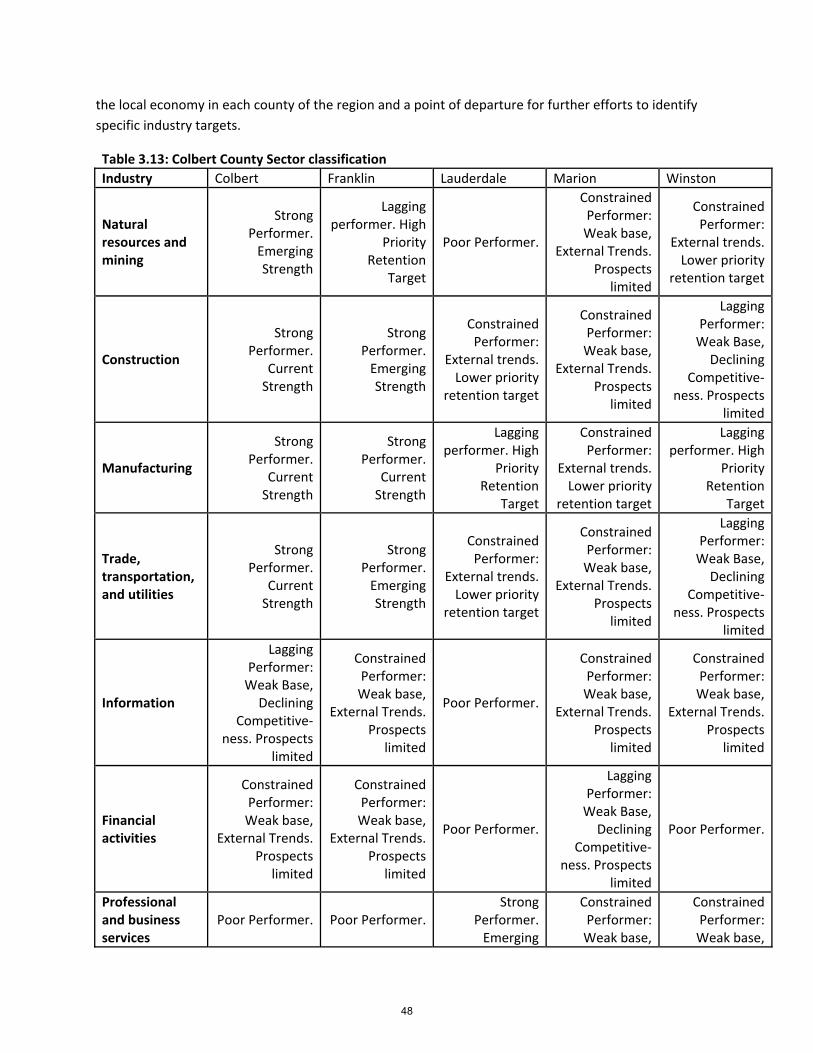
the local economy in each county of the region and a point of departure for further efforts to identify
specific industry targets.
Table 3.13: Colbert County Sector classification
Industry Colbert Franklin Lauderdale Marion Winston
Natural resources and mining
Strong Performer. Emerging Strength
Lagging performer. High
Priority Retention
Target
Poor Performer.
Constrained Performer: Weak base,
External Trends. Prospects
limited
Constrained Performer:
External trends. Lower priority
retention target
Construction
Strong Performer.
Current Strength
Strong Performer. Emerging Strength
Constrained Performer:
External trends. Lower priority
retention target
Constrained Performer: Weak base,
External Trends. Prospects
limited
Lagging Performer: Weak Base, Declining
Competitive‐ness. Prospects
limited
Manufacturing
Strong Performer.
Current Strength
Strong Performer.
Current Strength
Lagging performer. High
Priority Retention
Target
Constrained Performer:
External trends. Lower priority
retention target
Lagging performer. High
Priority Retention
Target
Trade, transportation, and utilities
Strong Performer.
Current Strength
Strong Performer. Emerging Strength
Constrained Performer:
External trends. Lower priority
retention target
Constrained Performer: Weak base,
External Trends. Prospects
limited
Lagging Performer: Weak Base, Declining
Competitive‐ness. Prospects
limited
Information
Lagging Performer: Weak Base, Declining
Competitive‐ness. Prospects
limited
Constrained Performer: Weak base,
External Trends. Prospects
limited
Poor Performer.
Constrained Performer: Weak base,
External Trends. Prospects
limited
Constrained Performer: Weak base,
External Trends. Prospects
limited
Financial activities
Constrained Performer: Weak base,
External Trends. Prospects
limited
Constrained Performer: Weak base,
External Trends. Prospects
limited
Poor Performer.
Lagging Performer: Weak Base, Declining
Competitive‐ness. Prospects
limited
Poor Performer.
Professional and business services
Poor Performer. Poor Performer.Strong
Performer. Emerging
Constrained Performer: Weak base,
Constrained Performer: Weak base,
48
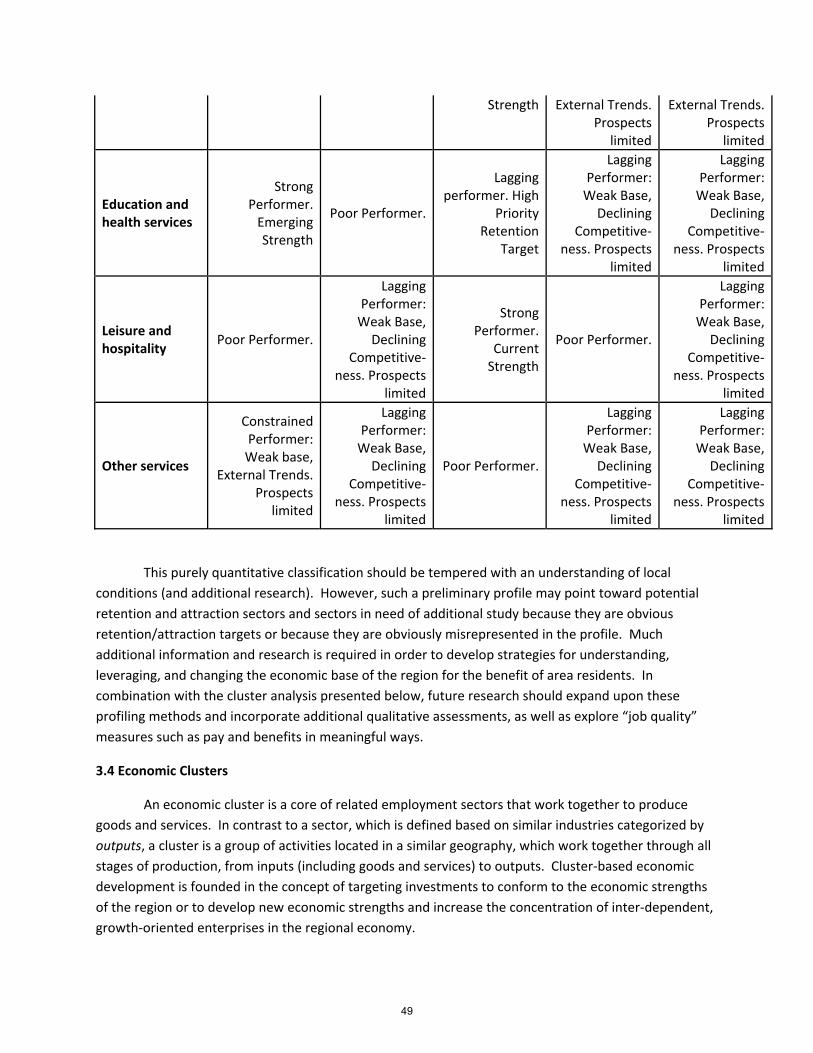
Strength External Trends. Prospects
limited
External Trends. Prospects
limited
Education and health services
Strong Performer. Emerging Strength
Poor Performer.
Lagging performer. High
Priority Retention
Target
Lagging Performer: Weak Base, Declining
Competitive‐ness. Prospects
limited
Lagging Performer: Weak Base, Declining
Competitive‐ness. Prospects
limited
Leisure and hospitality
Poor Performer.
Lagging Performer: Weak Base, Declining
Competitive‐ness. Prospects
limited
Strong Performer.
Current Strength
Poor Performer.
Lagging Performer: Weak Base, Declining
Competitive‐ness. Prospects
limited
Other services
Constrained Performer: Weak base,
External Trends. Prospects
limited
Lagging Performer: Weak Base, Declining
Competitive‐ness. Prospects
limited
Poor Performer.
Lagging Performer: Weak Base, Declining
Competitive‐ness. Prospects
limited
Lagging Performer: Weak Base, Declining
Competitive‐ness. Prospects
limited
This purely quantitative classification should be tempered with an understanding of local
conditions (and additional research). However, such a preliminary profile may point toward potential
retention and attraction sectors and sectors in need of additional study because they are obvious
retention/attraction targets or because they are obviously misrepresented in the profile. Much
additional information and research is required in order to develop strategies for understanding,
leveraging, and changing the economic base of the region for the benefit of area residents. In
combination with the cluster analysis presented below, future research should expand upon these
profiling methods and incorporate additional qualitative assessments, as well as explore “job quality”
measures such as pay and benefits in meaningful ways.
3.4 Economic Clusters
An economic cluster is a core of related employment sectors that work together to produce
goods and services. In contrast to a sector, which is defined based on similar industries categorized by
outputs, a cluster is a group of activities located in a similar geography, which work together through all
stages of production, from inputs (including goods and services) to outputs. Cluster‐based economic
development is founded in the concept of targeting investments to conform to the economic strengths
of the region or to develop new economic strengths and increase the concentration of inter‐dependent,
growth‐oriented enterprises in the regional economy.
49
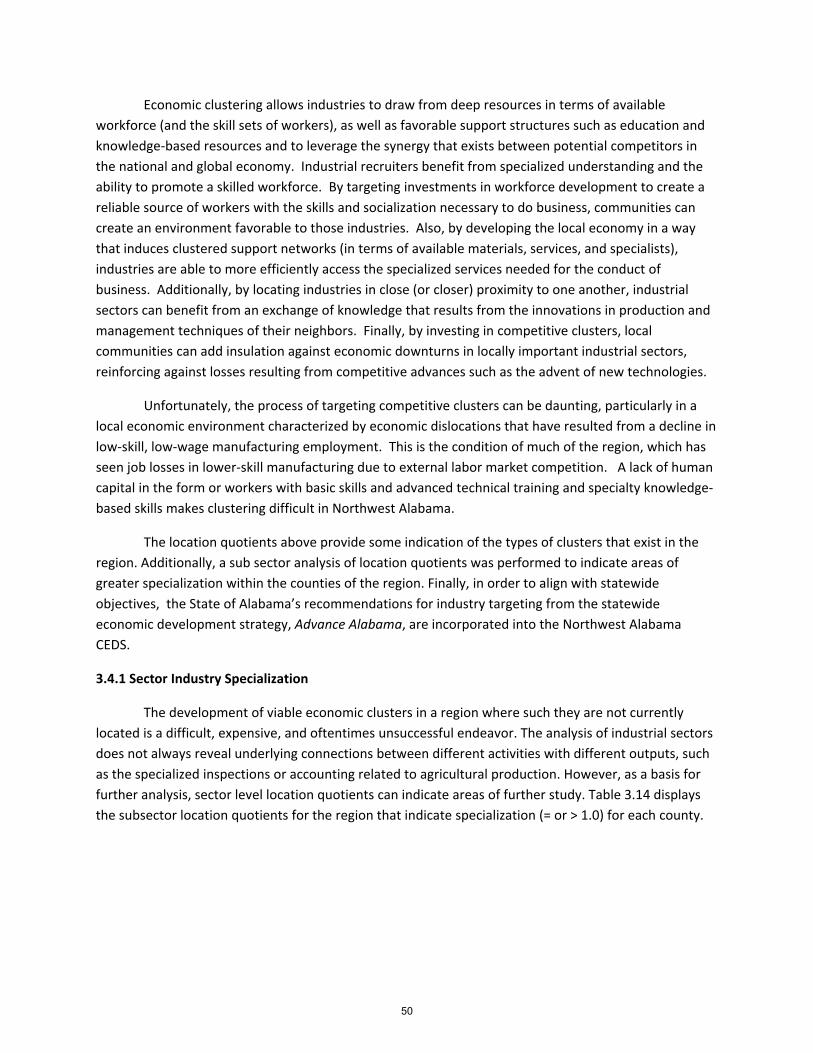
Economic clustering allows industries to draw from deep resources in terms of available
workforce (and the skill sets of workers), as well as favorable support structures such as education and
knowledge‐based resources and to leverage the synergy that exists between potential competitors in
the national and global economy. Industrial recruiters benefit from specialized understanding and the
ability to promote a skilled workforce. By targeting investments in workforce development to create a
reliable source of workers with the skills and socialization necessary to do business, communities can
create an environment favorable to those industries. Also, by developing the local economy in a way
that induces clustered support networks (in terms of available materials, services, and specialists),
industries are able to more efficiently access the specialized services needed for the conduct of
business. Additionally, by locating industries in close (or closer) proximity to one another, industrial
sectors can benefit from an exchange of knowledge that results from the innovations in production and
management techniques of their neighbors. Finally, by investing in competitive clusters, local
communities can add insulation against economic downturns in locally important industrial sectors,
reinforcing against losses resulting from competitive advances such as the advent of new technologies.
Unfortunately, the process of targeting competitive clusters can be daunting, particularly in a
local economic environment characterized by economic dislocations that have resulted from a decline in
low‐skill, low‐wage manufacturing employment. This is the condition of much of the region, which has
seen job losses in lower‐skill manufacturing due to external labor market competition. A lack of human
capital in the form or workers with basic skills and advanced technical training and specialty knowledge‐
based skills makes clustering difficult in Northwest Alabama.
The location quotients above provide some indication of the types of clusters that exist in the
region. Additionally, a sub sector analysis of location quotients was performed to indicate areas of
greater specialization within the counties of the region. Finally, in order to align with statewide
objectives, the State of Alabama’s recommendations for industry targeting from the statewide
economic development strategy, Advance Alabama, are incorporated into the Northwest Alabama
CEDS.
3.4.1 Sector Industry Specialization
The development of viable economic clusters in a region where such they are not currently
located is a difficult, expensive, and oftentimes unsuccessful endeavor. The analysis of industrial sectors
does not always reveal underlying connections between different activities with different outputs, such
as the specialized inspections or accounting related to agricultural production. However, as a basis for
further analysis, sector level location quotients can indicate areas of further study. Table 3.14 displays
the subsector location quotients for the region that indicate specialization (= or > 1.0) for each county.
50
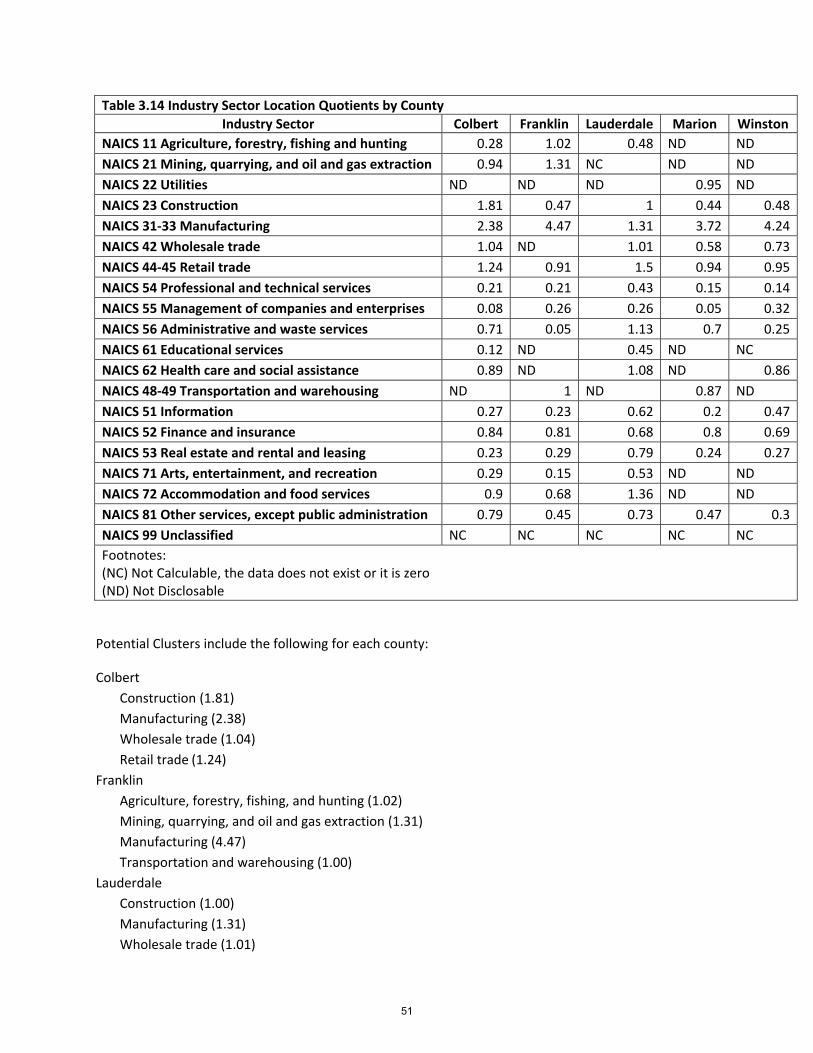
Table 3.14 Industry Sector Location Quotients by County
Industry Sector Colbert Franklin Lauderdale Marion Winston
NAICS 11 Agriculture, forestry, fishing and hunting 0.28 1.02 0.48 ND ND
NAICS 21 Mining, quarrying, and oil and gas extraction 0.94 1.31 NC ND ND
NAICS 22 Utilities ND ND ND 0.95 ND
NAICS 23 Construction 1.81 0.47 1 0.44 0.48
NAICS 31‐33 Manufacturing 2.38 4.47 1.31 3.72 4.24
NAICS 42 Wholesale trade 1.04 ND 1.01 0.58 0.73
NAICS 44‐45 Retail trade 1.24 0.91 1.5 0.94 0.95
NAICS 54 Professional and technical services 0.21 0.21 0.43 0.15 0.14
NAICS 55 Management of companies and enterprises 0.08 0.26 0.26 0.05 0.32
NAICS 56 Administrative and waste services 0.71 0.05 1.13 0.7 0.25
NAICS 61 Educational services 0.12 ND 0.45 ND NC
NAICS 62 Health care and social assistance 0.89 ND 1.08 ND 0.86
NAICS 48‐49 Transportation and warehousing ND 1 ND 0.87 ND
NAICS 51 Information 0.27 0.23 0.62 0.2 0.47
NAICS 52 Finance and insurance 0.84 0.81 0.68 0.8 0.69
NAICS 53 Real estate and rental and leasing 0.23 0.29 0.79 0.24 0.27
NAICS 71 Arts, entertainment, and recreation 0.29 0.15 0.53 ND ND
NAICS 72 Accommodation and food services 0.9 0.68 1.36 ND ND
NAICS 81 Other services, except public administration 0.79 0.45 0.73 0.47 0.3
NAICS 99 Unclassified NC NC NC NC NC
Footnotes: (NC) Not Calculable, the data does not exist or it is zero (ND) Not Disclosable
Potential Clusters include the following for each county:
Colbert
Construction (1.81)
Manufacturing (2.38)
Wholesale trade (1.04)
Retail trade (1.24)
Franklin
Agriculture, forestry, fishing, and hunting (1.02)
Mining, quarrying, and oil and gas extraction (1.31)
Manufacturing (4.47)
Transportation and warehousing (1.00)
Lauderdale
Construction (1.00)
Manufacturing (1.31)
Wholesale trade (1.01)
51
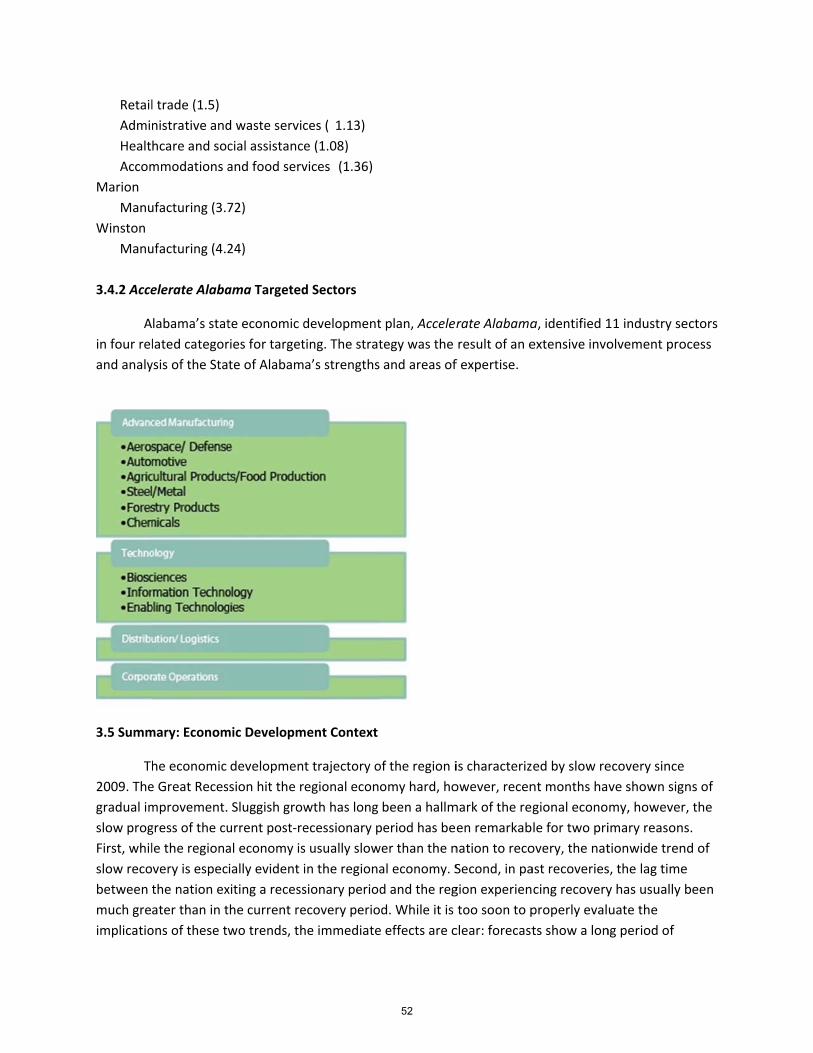
Retail
Admin
Healt
Accom
Marion
Manu
Winston
Manu
3.4.2 Acce
A
in four rel
and analy
3.5 Summ
Th
2009. The
gradual im
slow prog
First, whil
slow reco
between t
much gre
implicatio
l trade (1.5)
nistrative and
hcare and soc
mmodations a
ufacturing (3.7
ufacturing (4.2
elerate Alaba
labama’s stat
lated categor
ysis of the Sta
mary: Econom
he economic
e Great Reces
mprovement.
gress of the cu
le the regiona
very is espec
the nation ex
ater than in t
ons of these tw
d waste servic
cial assistance
and food serv
72)
24)
ama Targeted
te economic d
ries for target
te of Alabam
mic Developm
developmen
ssion hit the r
Sluggish grow
urrent post‐re
al economy is
ially evident i
xiting a recess
the current re
wo trends, th
ces ( 1.13)
e (1.08)
vices (1.36)
d Sectors
development
ting. The strat
a’s strengths
ment Context
t trajectory o
egional econo
wth has long
ecessionary p
s usually slow
in the regiona
sionary period
ecovery perio
he immediate
t plan, Acceler
tegy was the
and areas of
of the region i
omy hard, ho
been a hallm
period has be
wer than the n
al economy. S
d and the reg
d. While it is
e effects are c
rate Alabama
result of an e
f expertise.
is characteriz
owever, recen
mark of the reg
en remarkab
nation to reco
Second, in pa
gion experien
too soon to p
clear: forecast
a, identified 1
extensive invo
ed by slow re
nt months ha
gional econo
le for two pri
overy, the nat
ast recoveries
cing recovery
properly eval
ts show a lon
11 industry se
olvement pro
ecovery since
ve shown sig
my, however
imary reasons
tionwide tren
s, the lag time
y has usually
uate the
ng period of
ectors
ocess
ns of
r, the
s.
nd of
e
been
52

recovery in order to regain ground that was conquered, in terms of employment and unemployment
rates, prior to the recession. While the Great Recession seemingly wiped out progress that was achieved
over many decades, the current recovery is aided by longstanding efforts to prepare for growth. It is
guided by a comprehensive strategy, which is reviewed in the section that follows.
53

Sect
ion
4.0:
Eco
nom
ic D
evel
opm
ent P
riorit
ies
in N
orth
wes
t Ala
bam
a G
oals
, Obj
ectiv
es a
nd S
trat
egie
s
54
4.0 Economic Development Priorities in Northwest Alabama‐ Goals, Objectives and Strategies
The Comprehensive Economic Development Strategy (CEDS) is a five‐year strategy for economic
development in northwest Alabama. It brings together private and public interests to create a guide to
economic development for the five‐county region of northwest Alabama that includes Lauderdale,
Colbert, Franklin, Marion, and Winston Counties. The CEDS is designed as a regional strategic plan. It
involves development district partners, including local government representatives, workforce training
providers, non‐profit Chambers of Commerce, local economic development authorities; it encompasses
a broad range of important initiatives in order to define the economic development landscape of
northwest Alabama and direct the Northwest Alabama Council of Local Governments (NACOLG), which
is the regional Planning Organization designated by the Economic Development Administration of the
U.S. Department of Commerce.
4.1 Vision, goals, and objectives
The vision, goals and objectives of the Northwest Alabama Comprehensive Economic
Development Strategy are as follows:
Northwest Alabama will continue to be a regional community defined by a distinctive and
recognizable identity, high quality of life, strong leadership and public participation, resilience, and
unity in pursuit of a sustainable, globally and regionally competitive economy.
Goal I: Infrastructure (Transportation and Community Facilities)‐ Improve the quality of infrastructure
in northwest Alabama’s counties, cities, and communities.
Objective (a): Identify and remedy dangerous transportation patterns throughout the region.
Objective (b): Improve regional and local surface transportation networks to increase access to
goods, services, markets, and employment opportunities.
Objective (c): Identify and complete improvements to the region’s multi‐modal transportation
network to improve local and regional access to goods, services, markets, and employment
opportunities.
Objective (d): Identify and complete improvements to infrastructure systems and community
facilities that allow for a continued high quality of life by municipal and county residents.
Objective (e): Foster sharing of municipal services and public infrastructure where beneficial to
area municipalities and counties.
Objective (f): Seek funding for housing initiatives and neighborhood redevelopment fostering
compact commercial and residential forms.
55
Goal II: Support for Business and Industry (Workforce Development, Recruitment and Retention) ‐
Establish strategies that coordinate public agencies and private entities in a cooperative effort to
attract and retain business and industry.
Objective (a): Expand access to and understanding of technology in the region, including
communications and workforce/workplace technology required for advanced manufacturing and
other business needs.
Objective (b): Identify opportunities to expand workforce development opportunities by
coordinating agencies and industries/businesses and implementing appropriate
educational/skills development and recruitment programs.
Objective (c): Promote strategies that prepare the region to attract new business and industries,
including appropriate workforce and infrastructure initiatives, as a means of attracting higher‐
skill and higher‐wage employment opportunities.
Objective (d): Support the retention and expansion of existing businesses through programs to
attract and enhance financial and human resources.
Goal III: Community Capacity Building (Planning and Capacity Building) ‐ Promote quality of life and
community identity necessary to leverage the economic benefits of physical and human capital.
Objective (a): Explore the application of asset based economic development principles to the
development programs of the region.
Objective (b): Improve resident and visitor recreational and cultural opportunities as a means of
facilitating population growth, retention, and increased economic opportunity.
Objective (c): Initiate an urban and neighborhood planning process that provides master plans
and infrastructure improvement assessments for municipalities and counties within the NACOLG
region.
Objective (d): Promote community resiliency and preparedness for disasters and severe economic
shocks, including the preparation of communities and the continuing recovery efforts of
communities affected by the April 27, 2011 tornadoes.
4.2 Action Plan: Goals, Strategies, Vital and Suggested Projects
The following section summarizes the action plan of the Comprehensive Economic Development
Strategy (CEDS). The Action Plan presents goals and related strategies, which are divided into vital and
suggested projects. Vital projects are defined as those leading to direct private investment and jobs,
while suggested projects are those that are needed to provide basic support to economic development
activities of the region.
56

Goal Strategy Vital Projects Suggested Projects
Goal I: Infrastructure (Transportation and Community Facilities)‐ Improve the quality of infrastructure in northwest Alabama’s counties, cities, and communities.
Improve community infrastructure
Provide infrastructure to industrial sites
Continue community development programs assisting member governments and utilities with improvement, rehabilitation, and expansion of infrastructure and community facilities
Muscle Shoals Regional Airport Master Plan Implementation
Port of Florence Infrastructure
Upgrade equipment for containerization
Acquire property for expansion
Explore cooperative agreement for regional port authority Implement the FLCPA Master Development Plan
U.S. Highway 43 Corridor Improvements
Widen from Killen to Tennessee State line
Improve State Route 133 from U.S. 157 to Avalon Avenue
Connect 157 to U.S. 43 along 3 Mile Lane Widen from Highway 13 in Phil Campbell to Hackleburg
Widen south of Hackleburg to Hamilton, replacing North Fork Creek bridge
Complete four lane section from Hamilton to future I‐22
Complete widening from future I‐22 to Guin
Corridor study for access management, streetscaping and land use
57
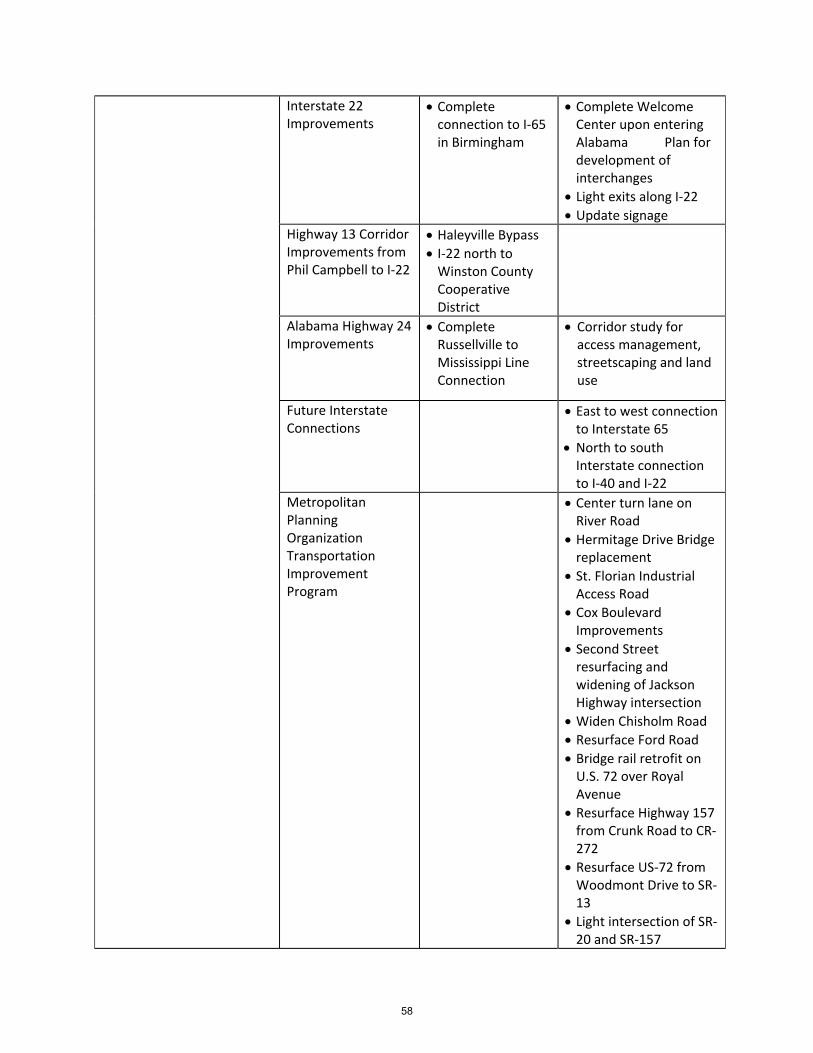
Interstate 22 Improvements
Complete connection to I‐65 in Birmingham
Complete Welcome Center upon entering Alabama Plan for development of interchanges
Light exits along I‐22 Update signage
Highway 13 Corridor Improvements from Phil Campbell to I‐22
Haleyville Bypass I‐22 north to Winston County Cooperative District
Alabama Highway 24 Improvements
Complete Russellville to Mississippi Line Connection
Corridor study for access management, streetscaping and land use
Future Interstate Connections
East to west connection to Interstate 65
North to south Interstate connection to I‐40 and I‐22
Metropolitan Planning Organization Transportation Improvement Program
Center turn lane on River Road
Hermitage Drive Bridge replacement
St. Florian Industrial Access Road
Cox Boulevard Improvements
Second Street resurfacing and widening of Jackson Highway intersection
Widen Chisholm Road
Resurface Ford Road Bridge rail retrofit on U.S. 72 over Royal Avenue
Resurface Highway 157 from Crunk Road to CR‐272
Resurface US‐72 from Woodmont Drive to SR‐13
Light intersection of SR‐20 and SR‐157
58
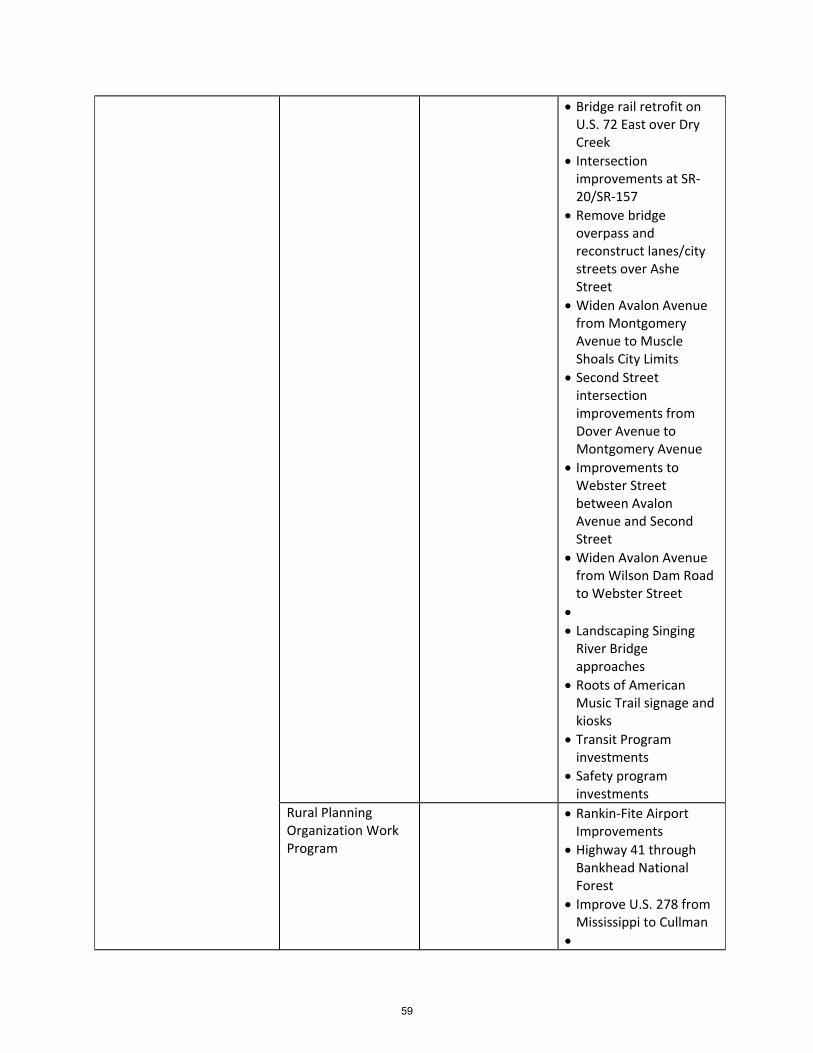
Bridge rail retrofit on U.S. 72 East over Dry Creek
Intersection improvements at SR‐20/SR‐157
Remove bridge overpass and reconstruct lanes/city streets over Ashe Street
Widen Avalon Avenue from Montgomery Avenue to Muscle Shoals City Limits
Second Street intersection improvements from Dover Avenue to Montgomery Avenue
Improvements to Webster Street between Avalon Avenue and Second Street
Widen Avalon Avenue from Wilson Dam Road to Webster Street
Landscaping Singing River Bridge approaches
Roots of American Music Trail signage and kiosks
Transit Program investments
Safety program investments
Rural Planning Organization Work Program
Rankin‐Fite Airport Improvements
Highway 41 through Bankhead National Forest
Improve U.S. 278 from Mississippi to Cullman
59
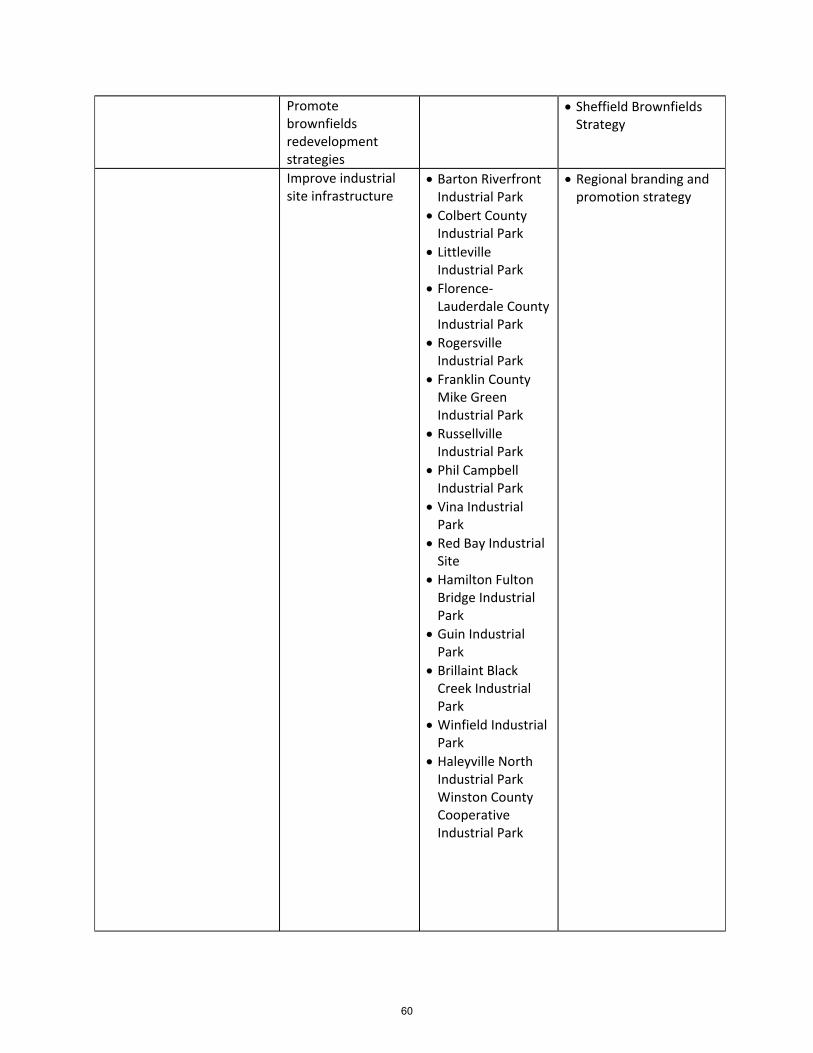
Promote brownfields redevelopment strategies
Sheffield Brownfields Strategy
Improve industrial site infrastructure
Barton Riverfront Industrial Park
Colbert County Industrial Park
Littleville Industrial Park
Florence‐Lauderdale County Industrial Park
Rogersville Industrial Park
Franklin County Mike Green Industrial Park
Russellville Industrial Park
Phil Campbell Industrial Park
Vina Industrial Park
Red Bay Industrial Site
Hamilton Fulton Bridge Industrial Park
Guin Industrial Park
Brillaint Black Creek Industrial Park
Winfield Industrial Park
Haleyville North Industrial Park Winston County Cooperative Industrial Park
Regional branding and promotion strategy
60
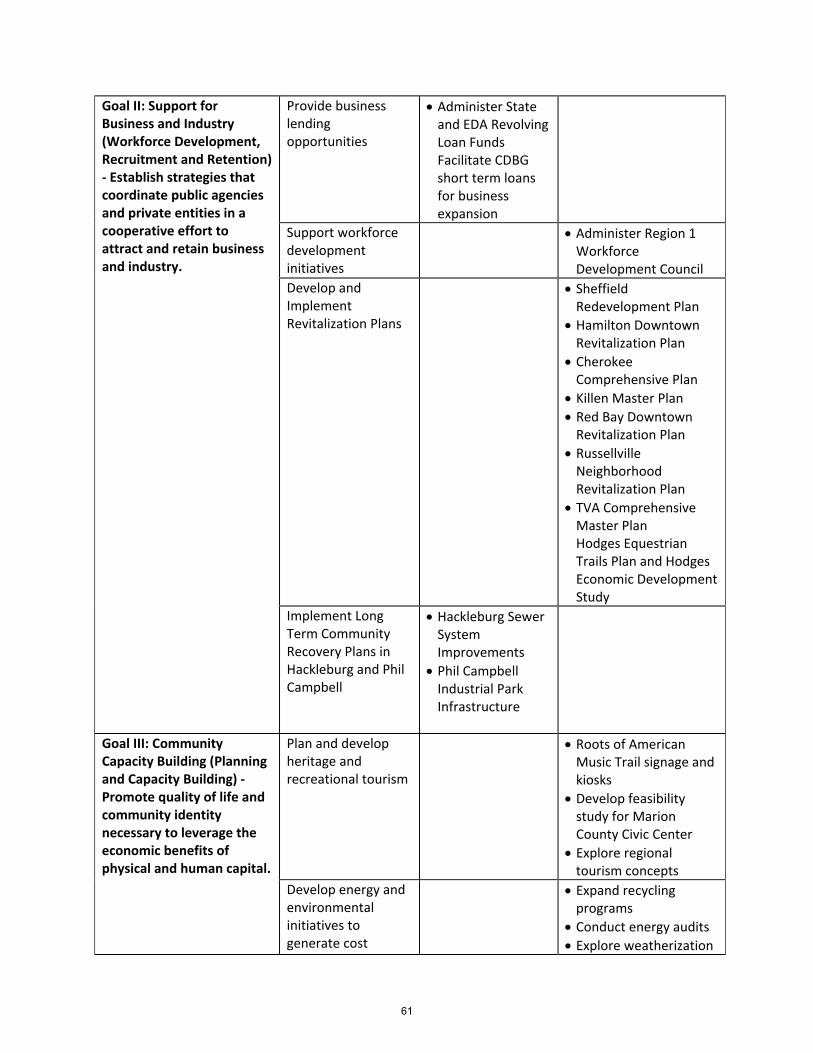
Goal II: Support for Business and Industry (Workforce Development, Recruitment and Retention) ‐ Establish strategies that coordinate public agencies and private entities in a cooperative effort to attract and retain business and industry.
Provide business lending opportunities
Administer State and EDA Revolving Loan Funds Facilitate CDBG short term loans for business expansion
Support workforce development initiatives
Administer Region 1 Workforce Development Council
Develop and Implement Revitalization Plans
Sheffield Redevelopment Plan
Hamilton Downtown Revitalization Plan
Cherokee Comprehensive Plan
Killen Master Plan
Red Bay Downtown Revitalization Plan
Russellville Neighborhood Revitalization Plan
TVA Comprehensive Master Plan Hodges Equestrian Trails Plan and Hodges Economic Development Study
Implement Long Term Community Recovery Plans in Hackleburg and Phil Campbell
Hackleburg Sewer System Improvements
Phil Campbell Industrial Park Infrastructure
Goal III: Community Capacity Building (Planning and Capacity Building) ‐ Promote quality of life and community identity necessary to leverage the economic benefits of physical and human capital.
Plan and develop heritage and recreational tourism
Roots of American Music Trail signage and kiosks
Develop feasibility study for Marion County Civic Center
Explore regional tourism concepts
Develop energy and environmental initiatives to generate cost
Expand recycling programs
Conduct energy audits Explore weatherization
61
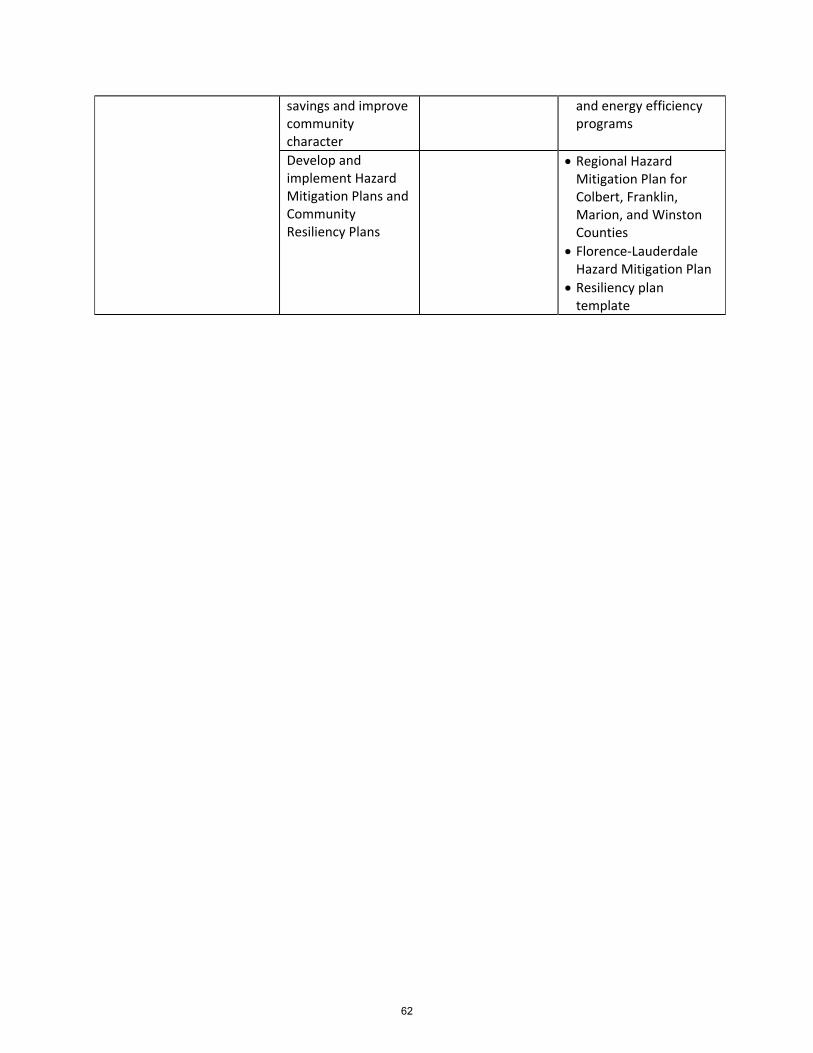
savings and improve community character
and energy efficiency programs
Develop and implement Hazard Mitigation Plans and Community Resiliency Plans
Regional Hazard Mitigation Plan for Colbert, Franklin, Marion, and Winston Counties
Florence‐Lauderdale Hazard Mitigation Plan
Resiliency plan template
62

Sect
ion
5.0:
Impl
emen
tatio
n an
d Pe
rfor
man
ce
63

5.0 Implementation and Performance
As stated in the Introduction, the CEDS is intended to be comprehensive, participatory, and
effective, which means not only should it identify elements necessary for economic development in the
region, but it should also identify the means available for implementing planned initiatives and for
measuring the success of the plan. Implementing a comprehensive plan requires a similarly
comprehensive approach, therefore, the CEDS includes information from a variety of sources‐ not simply
those available through the Economic Development Administration, although these are an important
resource. The CEDS should be closely allied with the comprehensive range of economic development
activities of the EDD Planning Organization (NACOLG) and should be introduced and distributed to
agencies as well. By promoting the CEDS in the full range of activities undertaken by the Planning
Organization and interacting with public and private partners for implementation and performance
review, NACOLG strengthens the role of the CEDS and the EDD behind a consolidated, comprehensive
system of prioritization for economic development.
Also, the CEDS includes suggestions for monitoring the success of implementation efforts by
including recommendations for follow‐up activities designed to increase regional understanding of
which projects are, or may develop as, priorities. Additionally, a key characteristic of the CEDS
implementation recommendations is increased communication between economic developers
throughout the region, including communication between stakeholders for individual projects as well as
communication regarding regional development activities and successes.
Throughout the CEDS process there was widespread recognition that community development‐ that
is, the development of sustainable policies for how communities will grow and expand in the physical
environment, are integral to economic development; and also community development proceeds
alongside and interdependently with economic development so that any attempt to artificially
separate community development programs from the economic development context, or vice versa,
would be detrimental to both.
5.1 Implementation
Implementation of the CEDS will require a variety of resources and commitments from multi‐
jurisdictional sources. The tools for implementation are disbursed widely among local, regional, state,
and federal entities, each possessing different areas of expertise, resources, and capacity for specific
projects. The following section provides an overview of the tools available for implementing the CEDS
and offers recommendations for utilizing these tools with respect to many of the objectives and
strategies contained in the plan.
5.1.1 Local Implementation Techniques
Effective implementation begins and ends in local communities. Identifying and capitalizing
upon local community capacity is therefore necessary to economic development. Positive and negative
externalities affect development opportunities—for example, changes in fiscal policy leading to greater
competition for grants or increased international labor competition damaging heretofore stable
64
industries. These events establish a framework of challenges and opportunities, however, it is local
activity that overcomes or succumbs to these challenges. Outside assistance may come; or it may not.
But with consistent commitment to a community‐driven development program, communities are more
likely to help themselves and, not coincidentally, are more likely to demonstrate the resolve and efficacy
necessary for outside recognition. To a large extent, successful economic development requires an
understanding of the tools, or assets, available for implementation, which begin locally with connections
among individuals having shared goals and priorities and then grow to encompass others in a network
that connects various capacities to an effective, motivated and mobilized local constituency.
5.1.2 Implementation Techniques Available to the Planning Organization
A number of regional planning initiatives were identified and discussed as part of the
background for the CEDS plan. These agencies and organizations possess resources and capacities that
can be utilized to effectively implement economic development projects. The Northwest Alabama
Council of Local Governments is involved in many of these activities and will continue to endorse CEDS
planning priorities in the agency’s interactions through these forums. In this way, the agencies activities
and network of contacts and partners will be leveraged to implement the goals, objectives, and
strategies produced of the comprehensive economic plan.
Agency implementation activities take on a variety of forms. Foremost, the agency possesses
expertise available to assist local governments identifying local capacity and developing networks
among and between local actors and between local and regional, state, and federal actors. NACOLG is
heavily involved in workforce development as a coordinator for the Region I Workforce Development
Council. The Government Services Department offers assistance identifying and completing grant
applications for a variety of programs, including Community Development Block Grants (CDBG),
Appalachian Regional Commission (ARC), Economic Development Administration (EDA), as well as
Transportation Enhancement Grants, in conjunction with the Transportation Planning Department.
Additionally, NACOLG and the Government Services Department administer and operate the Revolving
Loan Fund, which makes gap financing available to spur private investments. The Community and
Regional Planning Department offers services and technical assistance for community planning and the
development of programs for public involvement and implementation through both public and private
resources. Finally, the Transportation Planning Department offers planning services through the
Metropolitan Planning Organization and the Rural Planning Organization. Each of these activities will
carry forward the CEDS plan by endorsing and designing program elements to meet the identified needs
of the region.
5.2 Performance Measures
Performance will be measured against two distinct benchmarks. First, progress will be reported
by activity toward implementing the vital and suggested projects of the CEDS. These targeted activities
are necessary for the achievement of the goals of the CEDS and are targets to be tracked and measured
in order to judge success. Progress reporting will reflect the following format:
65
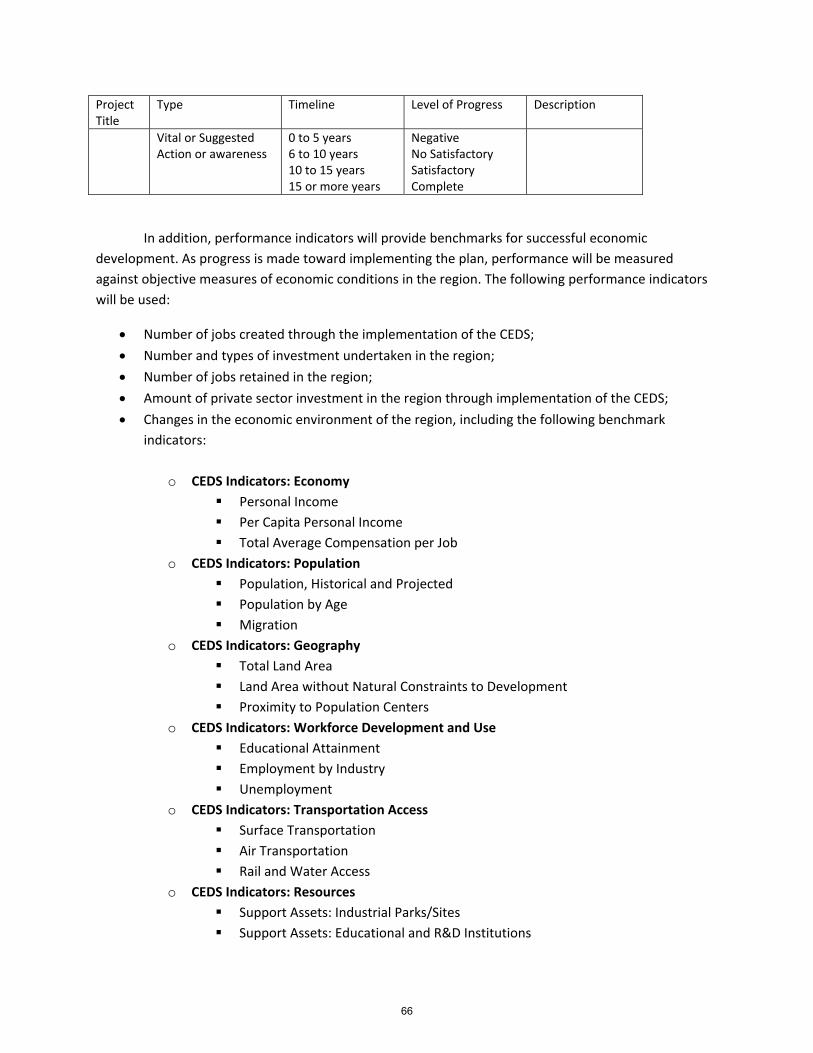
Project Title
Type Timeline Level of Progress Description
Vital or Suggested Action or awareness
0 to 5 years6 to 10 years 10 to 15 years 15 or more years
NegativeNo Satisfactory Satisfactory Complete
In addition, performance indicators will provide benchmarks for successful economic
development. As progress is made toward implementing the plan, performance will be measured
against objective measures of economic conditions in the region. The following performance indicators
will be used:
Number of jobs created through the implementation of the CEDS;
Number and types of investment undertaken in the region;
Number of jobs retained in the region;
Amount of private sector investment in the region through implementation of the CEDS;
Changes in the economic environment of the region, including the following benchmark
indicators:
o CEDS Indicators: Economy
Personal Income
Per Capita Personal Income
Total Average Compensation per Job
o CEDS Indicators: Population
Population, Historical and Projected
Population by Age
Migration
o CEDS Indicators: Geography
Total Land Area
Land Area without Natural Constraints to Development
Proximity to Population Centers
o CEDS Indicators: Workforce Development and Use
Educational Attainment
Employment by Industry
Unemployment
o CEDS Indicators: Transportation Access
Surface Transportation
Air Transportation
Rail and Water Access
o CEDS Indicators: Resources
Support Assets: Industrial Parks/Sites
Support Assets: Educational and R&D Institutions
66

o CEDS Indicators: Environment
Air Quality: Air Pollution Non‐Attainment
Water Quality: Streams listed on 303(d) list
Land Development: Land Cover
67
Related Documents