Northeast Cooperative Research Fishery Data & Real Time Oceanographic Products --- “Fishermen, “Choke Species” and surviving endangered species act listings. Presented by John J. Hoey, Ph.D. Director, Cooperative Research Program NMFS - Northeast Fisheries Science Center Woods Hole, Mass. & 2012 MARACOOS Meeting Baltimore, MD

Welcome message from author
This document is posted to help you gain knowledge. Please leave a comment to let me know what you think about it! Share it to your friends and learn new things together.
Transcript

Northeast Cooperative Research
Fishery Data & Real Time Oceanographic Products --- “Fishermen, “Choke Species”
and surviving endangered species act listings.
Presented by John J. Hoey, Ph.D. Director, Cooperative Research Program NMFS - Northeast Fisheries Science Center Woods Hole, Mass. & Narragansett, RI
2012 MARACOOS Meeting Baltimore, MD
2
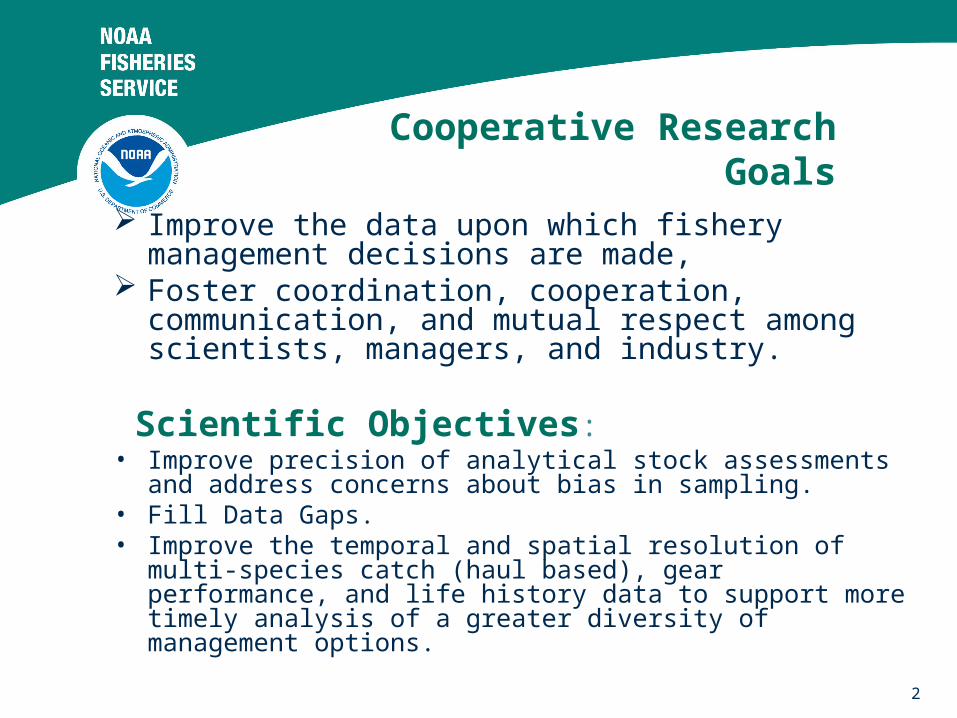
Cooperative Research Goals
Improve the data upon which fishery management decisions are made,
Foster coordination, cooperation, communication, and mutual respect among scientists, managers, and industry.
Scientific Objectives:• Improve precision of analytical stock assessments and address
concerns about bias in sampling.• Fill Data Gaps.• Improve the temporal and spatial resolution of multi-species
catch (haul based), gear performance, and life history data to support more timely analysis of a greater diversity of management options.
3
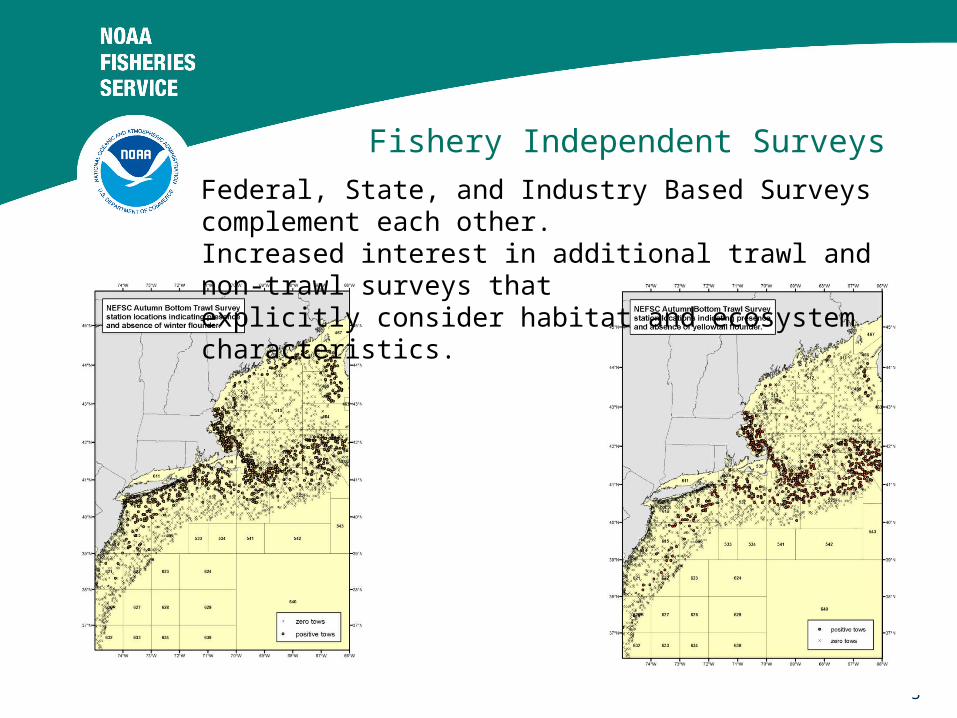
Fishery Independent Surveys
Federal, State, and Industry Based Surveys complement each other. Increased interest in additional trawl and non-trawl surveys thatexplicitly consider habitat and ecosystem characteristics.
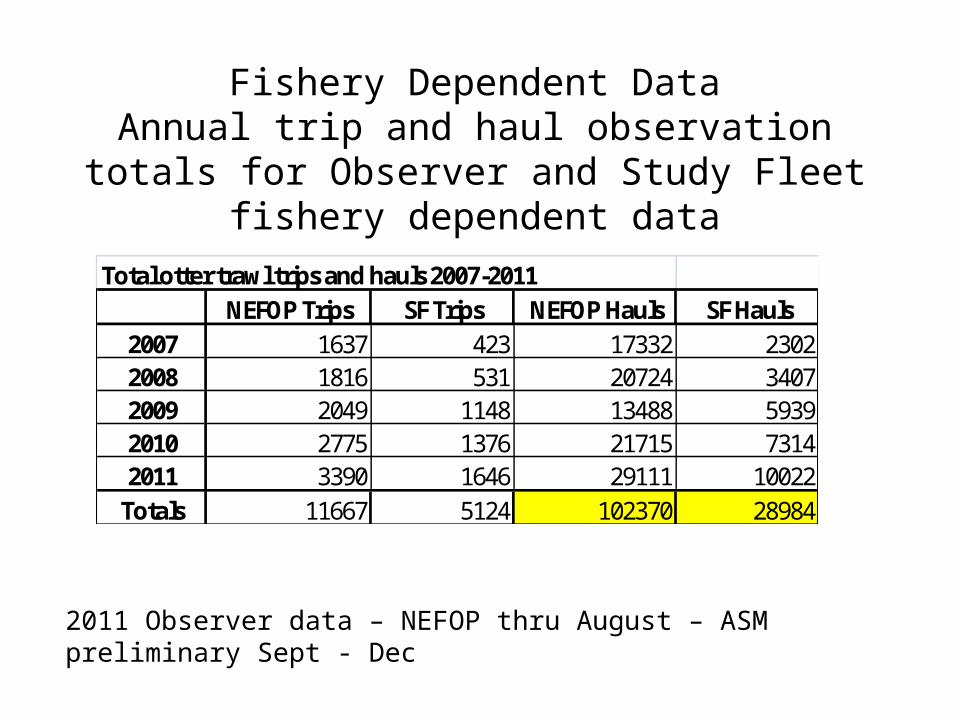
Fishery Dependent DataAnnual trip and haul observation totals for Observer
and Study Fleet fishery dependent data
Total otter trawl trips and hauls 2007-2011NEFOP Trips SF Trips NEFOP Hauls SF Hauls
2007 1637 423 17332 23022008 1816 531 20724 34072009 2049 1148 13488 59392010 2775 1376 21715 73142011 3390 1646 29111 10022
Totals 11667 5124 102370 28984
2011 Observer data – NEFOP thru August – ASM preliminary Sept - Dec
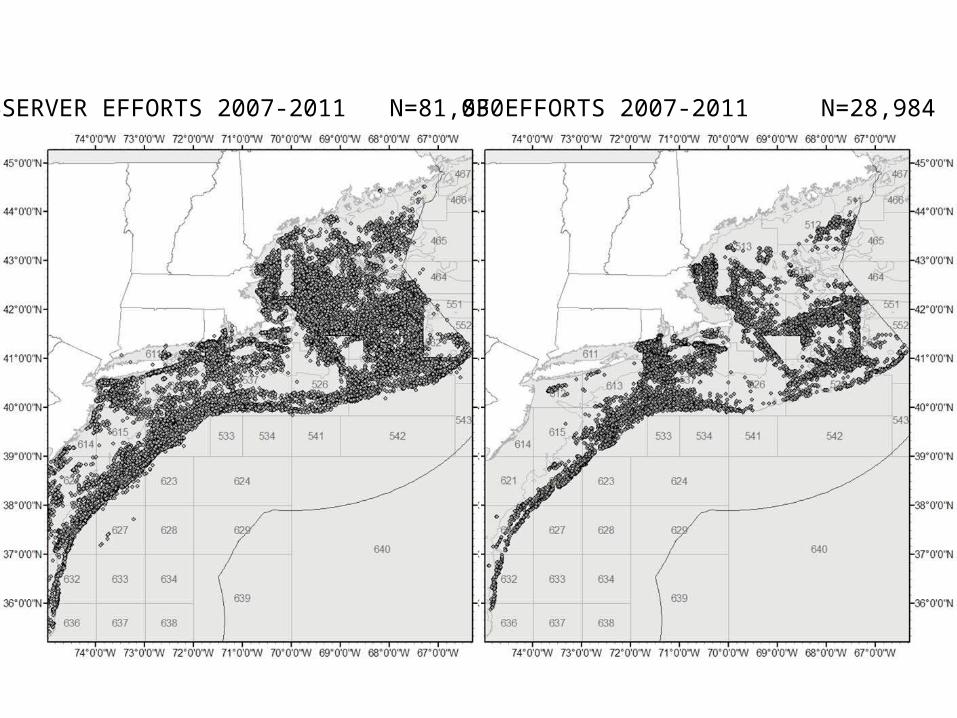
SF EFFORTS 2007-2011 N=28,984OBSERVER EFFORTS 2007-2011 N=81,030
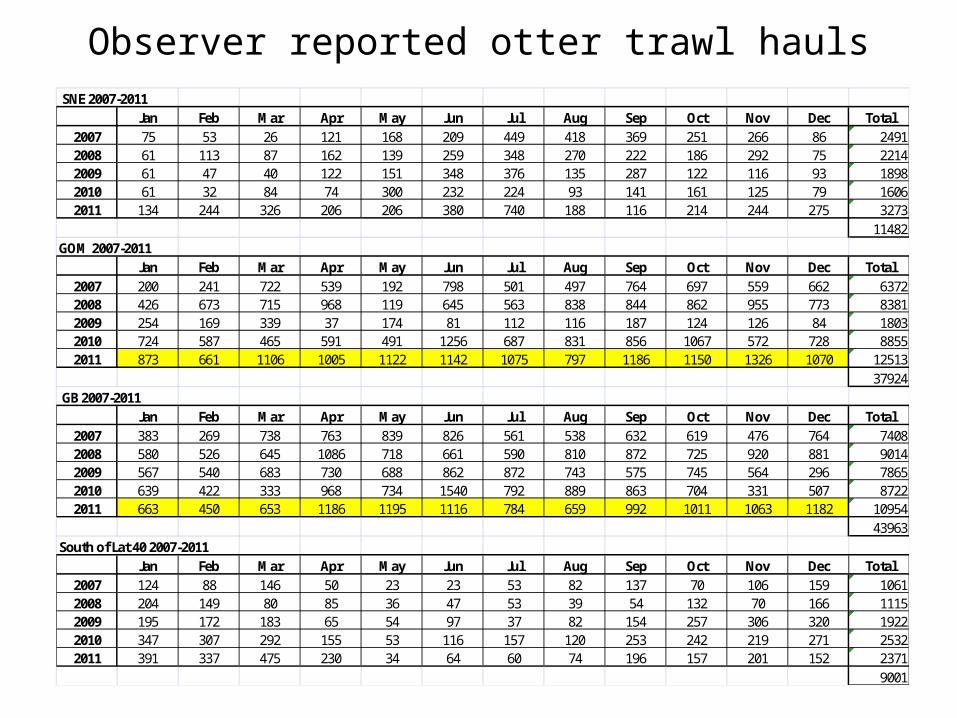
Observer reported otter trawl hauls SNE 2007-2011
Jan Feb Mar Apr May Jun Jul Aug Sep Oct Nov Dec Total2007 75 53 26 121 168 209 449 418 369 251 266 86 24912008 61 113 87 162 139 259 348 270 222 186 292 75 22142009 61 47 40 122 151 348 376 135 287 122 116 93 18982010 61 32 84 74 300 232 224 93 141 161 125 79 16062011 134 244 326 206 206 380 740 188 116 214 244 275 3273
11482GOM 2007-2011
Jan Feb Mar Apr May Jun Jul Aug Sep Oct Nov Dec Total2007 200 241 722 539 192 798 501 497 764 697 559 662 63722008 426 673 715 968 119 645 563 838 844 862 955 773 83812009 254 169 339 37 174 81 112 116 187 124 126 84 18032010 724 587 465 591 491 1256 687 831 856 1067 572 728 88552011 873 661 1106 1005 1122 1142 1075 797 1186 1150 1326 1070 12513
37924 GB 2007-2011
Jan Feb Mar Apr May Jun Jul Aug Sep Oct Nov Dec Total2007 383 269 738 763 839 826 561 538 632 619 476 764 74082008 580 526 645 1086 718 661 590 810 872 725 920 881 90142009 567 540 683 730 688 862 872 743 575 745 564 296 78652010 639 422 333 968 734 1540 792 889 863 704 331 507 87222011 663 450 653 1186 1195 1116 784 659 992 1011 1063 1182 10954
43963South of Lat 40 2007-2011
Jan Feb Mar Apr May Jun Jul Aug Sep Oct Nov Dec Total2007 124 88 146 50 23 23 53 82 137 70 106 159 10612008 204 149 80 85 36 47 53 39 54 132 70 166 11152009 195 172 183 65 54 97 37 82 154 257 306 320 19222010 347 307 292 155 53 116 157 120 253 242 219 271 25322011 391 337 475 230 34 64 60 74 196 157 201 152 2371
9001
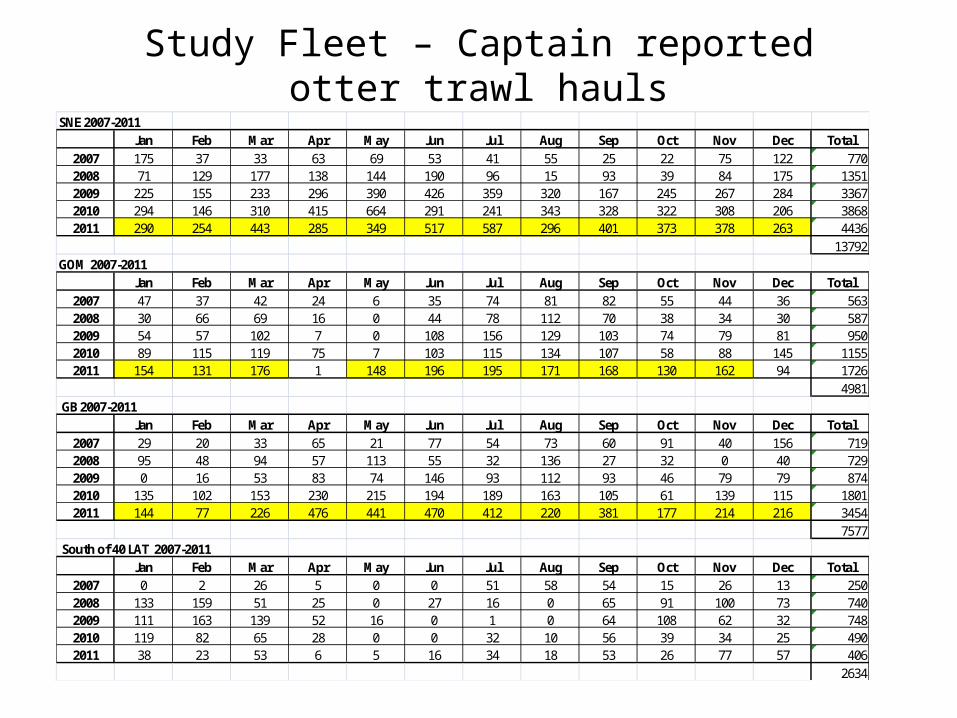
Study Fleet – Captain reported otter trawl haulsSNE 2007-2011
Jan Feb Mar Apr May Jun Jul Aug Sep Oct Nov Dec Total2007 175 37 33 63 69 53 41 55 25 22 75 122 7702008 71 129 177 138 144 190 96 15 93 39 84 175 13512009 225 155 233 296 390 426 359 320 167 245 267 284 33672010 294 146 310 415 664 291 241 343 328 322 308 206 38682011 290 254 443 285 349 517 587 296 401 373 378 263 4436
13792GOM 2007-2011
Jan Feb Mar Apr May Jun Jul Aug Sep Oct Nov Dec Total2007 47 37 42 24 6 35 74 81 82 55 44 36 5632008 30 66 69 16 0 44 78 112 70 38 34 30 5872009 54 57 102 7 0 108 156 129 103 74 79 81 9502010 89 115 119 75 7 103 115 134 107 58 88 145 11552011 154 131 176 1 148 196 195 171 168 130 162 94 1726
4981 GB 2007-2011
Jan Feb Mar Apr May Jun Jul Aug Sep Oct Nov Dec Total2007 29 20 33 65 21 77 54 73 60 91 40 156 7192008 95 48 94 57 113 55 32 136 27 32 0 40 7292009 0 16 53 83 74 146 93 112 93 46 79 79 8742010 135 102 153 230 215 194 189 163 105 61 139 115 18012011 144 77 226 476 441 470 412 220 381 177 214 216 3454
7577 South of 40 LAT 2007-2011
Jan Feb Mar Apr May Jun Jul Aug Sep Oct Nov Dec Total2007 0 2 26 5 0 0 51 58 54 15 26 13 2502008 133 159 51 25 0 27 16 0 65 91 100 73 7402009 111 163 139 52 16 0 1 0 64 108 62 32 7482010 119 82 65 28 0 0 32 10 56 39 34 25 4902011 38 23 53 6 5 16 34 18 53 26 77 57 406
2634

NEFSC Study Fleet Phase III - Electronic Reporting System
PC laptop computer
•FLDRS software
•Timeserver application
•VMS software
•T-D probe software
Temperature-depth (T-D) probe
Global Positioning System (GPS)
Oracle database (NEFSC)
Vessel Monitoring System (VMS)
NEFSC E-mail account ([email protected])
4-port serial-USB hub
12 VDC power supply
120 VAC power supply
Satellite transmission
Power connection
Data connection
Satellite connection
53
60
68
75
71
66
60
49
60
x =
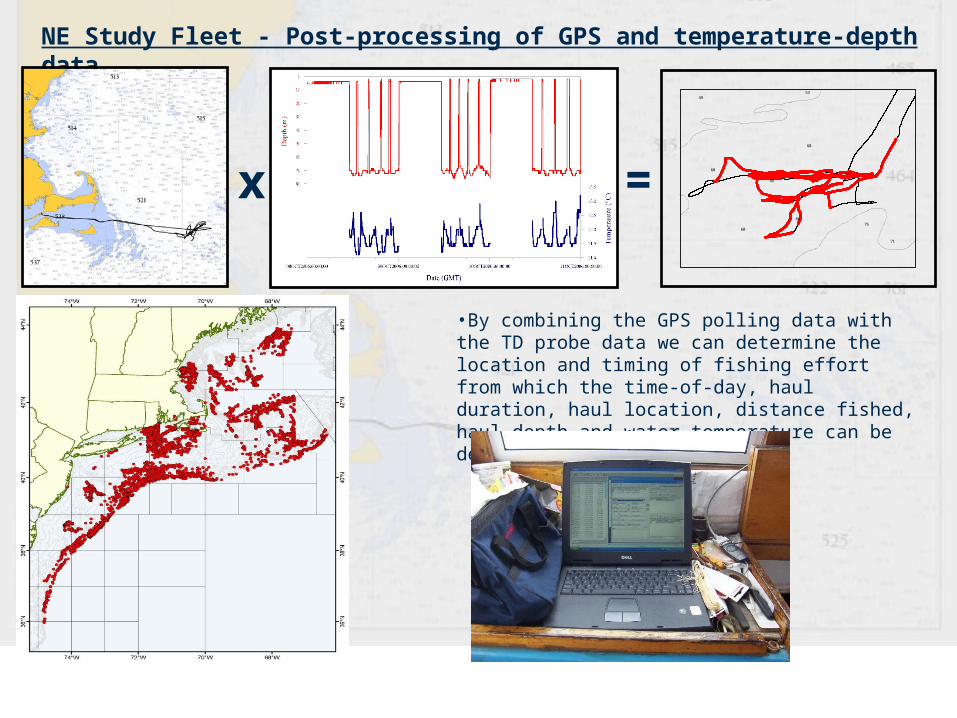
NE Study Fleet - Post-processing of GPS and temperature-depth data
•By combining the GPS polling data with the TD probe data we can determine the location and timing of fishing effort from which the time-of-day, haul duration, haul location, distance fished, haul depth and water temperature can be determined.

Feedback - industry data access -
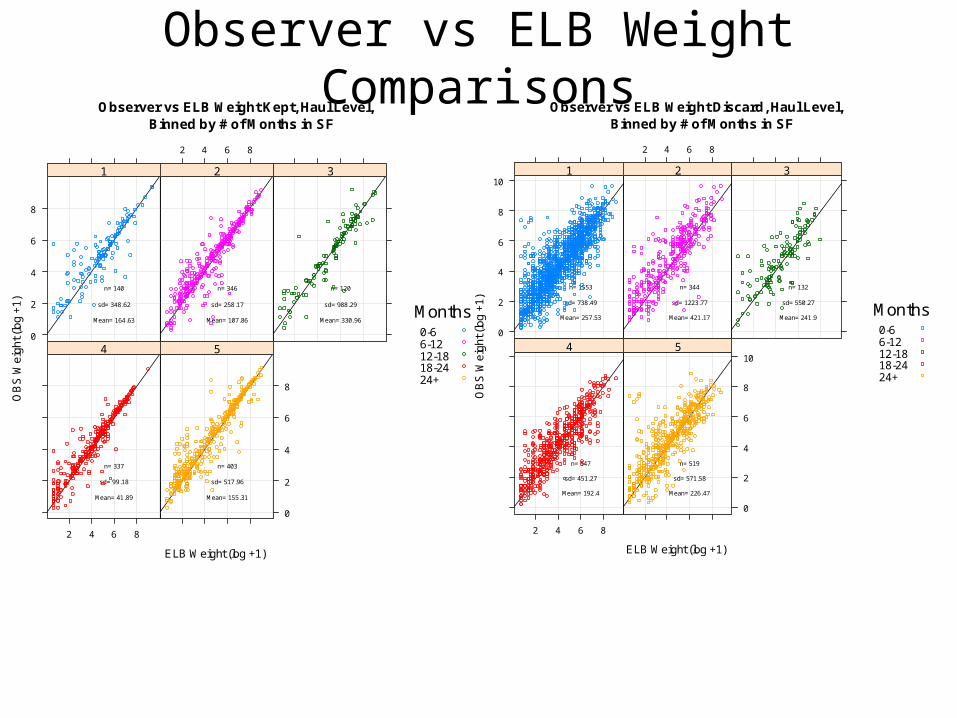
Observer vs ELB Weight ComparisonsObserver vs ELB Weight Discard, Haul Level,
Binned by # of Months in SF
ELB Weight (log +1)
OB
S W
eig
ht (
log
+1
)
0
2
4
6
8
10
n= 1553
sd= 738.49
Mean= 257.53
1
2 4 6 8
n= 344
sd= 1223.77
Mean= 421.17
2
n= 132
sd= 550.27
Mean= 241.9
3
2 4 6 8
n= 547
sd= 451.27
Mean= 192.4
4
0
2
4
6
8
10
n= 519
sd= 571.58
Mean= 226.47
5
Months0-66-1212-1818-2424+
Observer vs ELB Weight Kept, Haul Level, Binned by # of Months in SF
ELB Weight (log +1)
OB
S W
eig
ht (
log
+1
)
0
2
4
6
8
n= 140
sd= 348.62
Mean= 164.63
1
2 4 6 8
n= 346
sd= 258.17
Mean= 107.86
2
n= 120
sd= 988.29
Mean= 330.96
3
2 4 6 8
n= 337
sd= 99.18
Mean= 41.89
4
0
2
4
6
8
n= 403
sd= 517.96
Mean= 155.31
5
Months0-66-1212-1818-2424+

Data Confidentiality Restrictions
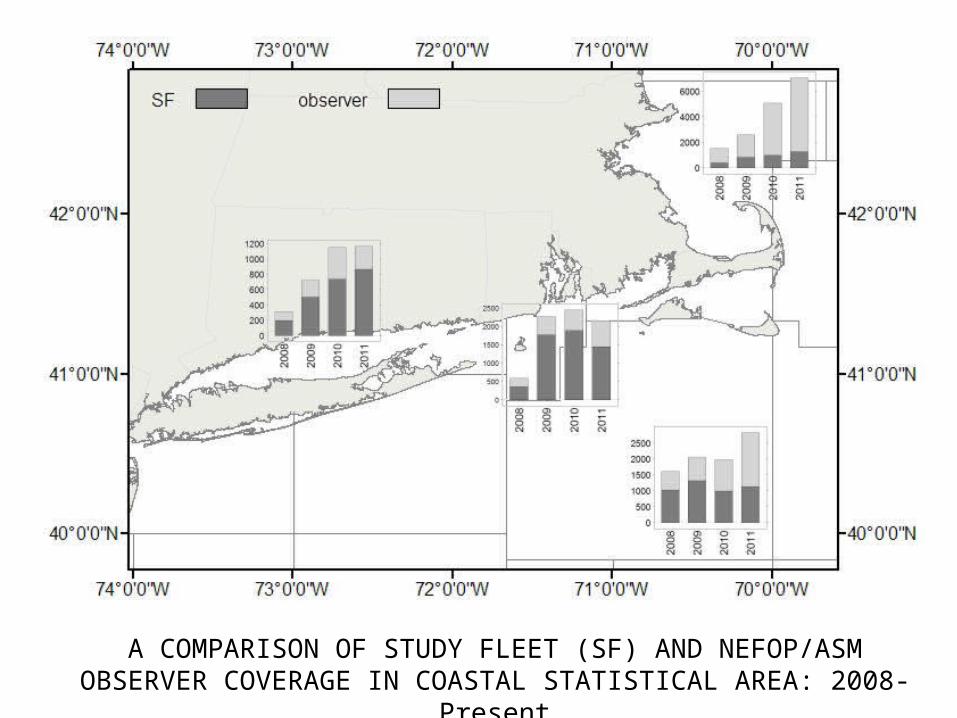
A COMPARISON OF STUDY FLEET (SF) AND NEFOP/ASM OBSERVER COVERAGE IN COASTAL STATISTICAL AREA: 2008-
Present

Comparison of total Study Fleet otter trawl hauls to Study Fleet hauls with Yellowtail flounder catch 2009.
All study fleet hauls 2009 SNE & GEB
Positive YTF hauls 2009 SNE& GEB
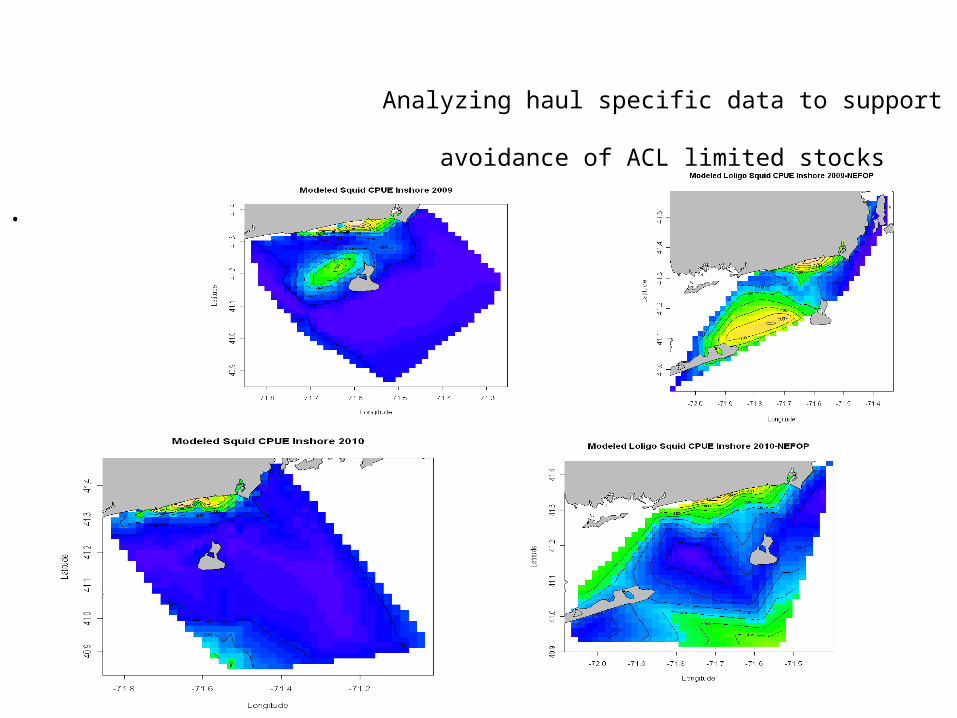
•
Analyzing haul specific data to support avoidance of ACL limited stocks
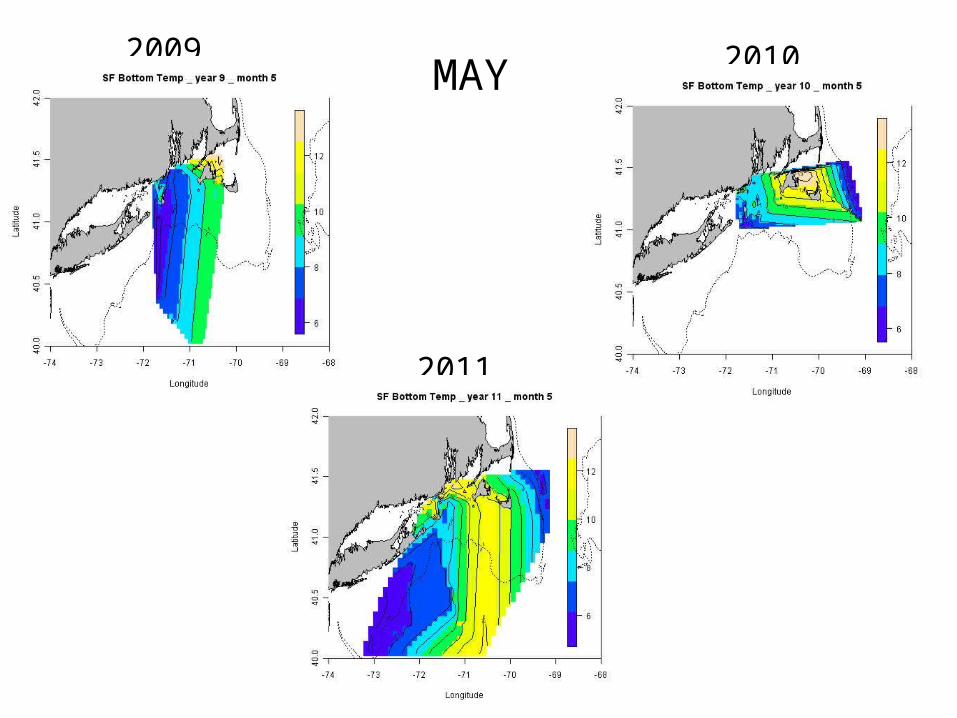
2009 2010
2011
MAY

JUNE2009 2010
2011

2009 2010
2011
JULY
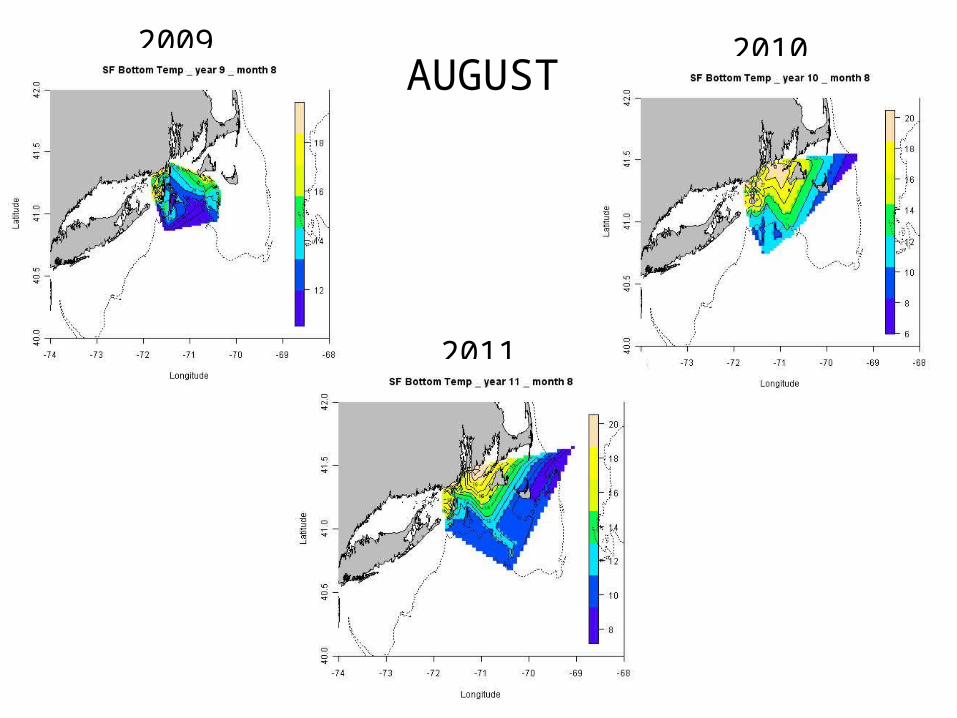
AUGUST2009 2010
2011
Thoughts for consideration
• Accuracy in terms of time and location provide leveraging opportunities for ecosystem data (tides, lunar cycles, etc.) which can improve the utility of maps and may better reflect fishermen’s local ecological - operational knowledge.
1. Observer data – Begin set – End haul – bottom temp observations are rare.
2. Study Fleet data – GPS polling and TD probes joined at 90 second intervals.
3. Data acquisition and QA/QC delays can be very significant.
4. Electronic logbooks can capture large volumes of haul specific data rapidly.
• Turn-around time and map detail are critical system design issues.
• More detailed information will support more detailed maps and other uses (e.g. discard estimation, Fishery dependent CPUE, sub-stock structure). Self-reported data quality must be verified.
• A critical limitation or challenge for existing systems includes greater gear detail – relative to discard rates for new nets (accountability).
• Industry likely interested in bottom temp forecasts at nautical sq mile spatial scales so that decisions on locations can avoid predicted hot spots for quota limited stocks.
Related Documents