THE LATE QUATERNARY SURFICIAL GEOLOGY AND GEOMORPHOLOGY OF THE LOWER SEYMOUR VALLEY, NORTH VANCOUVER, BRITISH COLUMBIA Olav Benneth Lian B.Sc. (physics), Simon Fraser University, 1988 THESIS SUBMITTED IN PARTIAL FULFILLMENT OF THE REQUIREMENTS FOR THE DEGREE OF MASTER OF SCIENCE in the Department of Geography 0 Olav Benneth Lian, 1991 Simon Fraser University December, 199 1 All rights reserved. This work may not be reproduced in whole or in part, by photocopy or other means, without permission of the author.

Welcome message from author
This document is posted to help you gain knowledge. Please leave a comment to let me know what you think about it! Share it to your friends and learn new things together.
Transcript
THE LATE QUATERNARY SURFICIAL GEOLOGY AND GEOMORPHOLOGY
OF THE LOWER SEYMOUR VALLEY, NORTH VANCOUVER, BRITISH COLUMBIA
Olav Benneth Lian B.Sc. (physics), Simon Fraser University, 1988
THESIS SUBMITTED IN PARTIAL FULFILLMENT OF THE REQUIREMENTS FOR THE DEGREE OF
MASTER OF SCIENCE
in the Department of
Geography
0 Olav Benneth Lian, 1991 Simon Fraser University
December, 199 1
All rights reserved. This work may not be reproduced in whole or in part, by photocopy
or other means, without permission of the author.
APPROVAL
Name:
Degree:
Title of Thesis:
Examining Committee:
Chair:
Olav Benneth Lian
Master of Science
The Late Quaternary Surficial Geology And Geomorphology Of The Lower Seymour Valley, North Vancouver, British Columbia
R.D. Moore, Assistant Professor r ,-
- . . // &J~&C Professor Senior Supervisor
Professor M.C.
, - v - 1 / v
~ i6ne l Jackson , I
Adjunct Professor External Examiner
PARTIAL COPYRIGHT LICENSE
I hereby grant to Simon Fraser University the right to lend my thesis, project or
extended essay (the title of which is shown below) to users of the Simon Fraser
University Library, and to make partial or single copies only for such users or in
response to a request from the library of any other university, or other educational
institution, on its own behalf or for one of its users. I further agree that permission
for multiple copying of this work for scholarly purposes may be granted by me or
the Dean of Graduate Studies. It is understood that copying or publication of this
work for financial gain shall not be allowed without my written permission.
Title of Thesis/Project/Extended Essay
The Late Quaternary Surficial Geology And Geomorpholog~ Of The
Lower Seymour Valley, North Vancouver, British Columbia
Author: - . --- .
(signature)
Olav Benneth Lian
(name)
December 6, 1991
ABSTRACT
A detailed study of the surficial sediments and landforms in the lower Seymour
Valley shows an almost continuous stratigraphic record spanning the last glacial cycle.
Based on lithostratigraphy, extensive radiocarbon dating, and limited supportive
thermoluminescence dating, a comprehensive geochronological history beginning
more than 37 ka BP, during the Olympia Nonglacial Interval, has been developed for
Seymour Valley. This study shows that the valley was slowly aggrading before 29 ka
BP followed by rapid aggradation after 29 ka BP. The pre 29 ka BP aggradation was
possibly a result of climatic fluctuations during the Olympia Nonglacial Interval, while
the post 29 ka BP aggradation was likely a result of ice advancing during the onset of
the Fraser Glaciation. Ice of the Fraser Glaciation reached the mouth of the valley by
about 22 ka BP, and had retreated before 18 ka BP. The valley was subsequently
vegetated. Ice once again advanced and occupied the valley between about 17 ka BP
and 12 ka BP. After about 12 ka BP ice had finally retreated and the valley once again
became vegetated. During and after deglaciation, glacial sediments were rapidly being
eroded from the valley sides and deposited in the valley bottom. An apparent hiatus
occurred during this time of rapid reworking of valley-side glacial sediments. The
hiatus was possibly climatically induced, beginning about 10 to 11 ka BP during an
interval of dryer and warmer climatic conditions (the early Holocene xerotherrnic
interval) and ending sometime before 5 ka BP. By about 5 ka BP, incision of Seymour
River into the valley fill was approximately 85% complete.
This research supports and refines the known mid- to late-Wisconsinan
lithostratigraphy and geochronology of the Fraser Lowland. Six of the twelve
lithostratigraphic units defined for the Fraser Lowland occur in the Seymour Valley,
including Coquitlam Drift, which until now, had only been positively identified in the
Coquitlam-Port Moody area.
TABLE OF CONTENTS
TITLE PAGE ...................................................................................................... i . . APPROVAL PAGE ............................................................................................. 11
ABSTRACT ............................................................................................................. iii ACKNOWLEDGEMENTS ................................................................................... iv TABLE OF CONTENTS ................................................................................... v LIST OF TABLES ............................................................................................. viii
................................................................................................ LIST OF FIGURES ix
CHAPTER 1: INTRODUCTION ....................................................................... 1 1.1 General Introduction .................................................................... 1 1.2 The Objectives ................................................................................... 3 1.3 The Study Area .................................................................................. 3
1.3.1 A Brief History ................................................................. 3 1.3.2 Location ............................................................................. 4 1.3.3 General Geornorphology .............................................. 8
............................................................. 1.3.4 Bedrock Geology 13
CHAPTER 2: PREVIOUS QUATERNARY RESEARCH .......................... 2.1 The Fraser Lowland: A Brief History of Quaternary Research 2.2 The Stratigraphic Record of the Fraser Lowland .........................
2.2.1 Late Sangarnonian(?) to Mid Wisconsinan .................. 2.2.2 Late Wisconsinan ............................................................. 2.2.3 Post-Glacial .......................................................................
2.3 Sea Levels and Crustal Movements ................................................ 2.4 Previous Quaternary Research in and near Seymour Valley .....
...................................................................... CHAPTER 3: METHODOLOGY 30 3.3 General Methodology .................................................................. 30
............................................................................. 3.2 Measured Sections 31 3.2.1 Texture and Structure ..................................................... 31
................................................................................. 3.2.2 Fabric 32 .................................................... 3.2.3 Contact and Thickness 32
3.2.4 The Presence of Organics ............................................... 33 3.2.5 The Presence of Littoral Deposits and Fossil Shells .. 33
3.3 Geochronology ................................................................................... 33
3.3.1 .Radiocarbon Dating ........................................................ 33 3.3.2 Thermoluminescence Dating ......................................... 34
.............................................................................................. 3.4 Mapping 35
CHAPTER 4: THE LITHOSTRATIGRAPHY OF LOWER SEYMOUR VALLEY 36 ........................................................................................ 4.1 Introduction 36
4.2 Lithostratigraphic Units of the Seymour Valley . Descriptions and Interpretations .............................................................................. 44
CHAPTER 5: GEOCHRONOLOGY OF LOWER SEYMOUR VALLEY 5.1 Introduction ........................................................................................ 5.2 >37 000 to 29 000 years BP .............................................................. 5.3 -29 000 to 22 000 years BP .............................................................. 5.4 -22 000 to 18 000 years BP .............................................................. 5.5 - 18 000 to 17 000 years BP .............................................................. 5.6 - 17 000 to 12 000 years BP .............................................................. 5.7 - 12 000 years BP to Present ............................................................
5.7.1 Post-glacial Adjustments ................................................. 5.7.2 On-going Processes ..........................................................
CHAPTER 6: DISCUSSION AND CONCLUSIONS ..................................... 6.1 Introduction ........................................................................................ 6.2 Middle Wisconsinan ...........................................................................
6.2.1 The Olympia Nonglacial Interval .................................. 6.2.1.1 The Cowichan Head Formation ..................
6.3 Late Wisconsinan ............................................................................... 6.3.1 The Fraser Glaciation .....................................................
6.3.1.1 Quadra Sands .................................................. 6.3.1.2 Coquitlam Drift .............................................. 6.3.1.3 The Port Moody interstade .......................... 6.3.1.4 Vashon Drift ...................................................
6.4 Late Wisconsinan to Holocene ........................................................ ......................................................... 6.4.1 Capilano Sediments
.................................................................. 6.5 Post-glacial Adjustments ........................................................................................ 6.6 Conclusions
6.6 Future Research .................................................................................
APPENDIX A: THERMOLUMINESCENCE DATING OF UNIT 1 PEATS .......... A . 1 Introduction ....................................................................................... A.2 The Experiment ................................................................................ A.3 Field Procedures ............................................................................... A.4 Laboratory Procedure . Sample Preparation ............................... AS Laboratory Procedure . Determination of the Equivalent Dose A.6 Dose Rate Determination ............................................................... A.7 Results ................................................................................................ A.8 Discussion .......................................................................................... A.9 Recommendations for Future Research .......................................
...................................................................................... A.10 Conclusions
APPENDIX B: LOCATIONS OF MEASURED SECTIONS ....................... 106
APPENDIX C: DESCRIPTIONS AND INTERPRETATIONS OF .................. MEASURED SECTIONS NOT APPEARING IN FIGURE 4.3 114
APPENDIX D: LOCATIONS OF BENCHMARKS USED IN THIS RESEARCH .............................................................................................. 117
....................................................................................................... REFERENCES 119
LIST OF TABLES
Table 3.1. Particle Size Classification .............................................................. 32
Table 3.2. Aerial Photographs Used in this Research ...................................... 35
Table 3.3. Topographic Maps Used in this Research ....................................... 35
Table 4.1. Lithofacies Code Used in Figure 4.3 ................................................ 37
Table 5.1: Summary of Radiocarbon and TL Dates From Seymour Valley 69
Table 6.1: Summary of Radiocarbon Dates From the Coquitlam-Port Moody Area and Seymour Valley Pertinent to the Coquitlam Stade/Port Moody interstade Chronology ........................................................................................... 80
Table 6.2: Radiocarbon Dates Pertinent to Paraglacial Sedimentation in the Seymour Valley ..................................................................................................... 85
Table 6.3: Correlation of the Lithostratigraphy of the Fraser Lowland with ........................................................................................... that of Seymour Valley 90
Table A.1. Constants Used in the Determination of the Dose Rate .............. 97
Table A.2: Measured/Calculated Values Used in the Determination of the Dose Rate ...................................................................................................... 97
Table A.3. Dose Rates (Gy/ka) ....................................................................... 98
Table A.4. TL Ages ............................................................................................... 98
.... . Table B 1: Locations of Measured Sections Not Appearing in Figure B.2 106
Table D.1: Locations and Elevations of Benchmarks Used During ........................................................................................................... This Research 118
LIST OF FIGURES
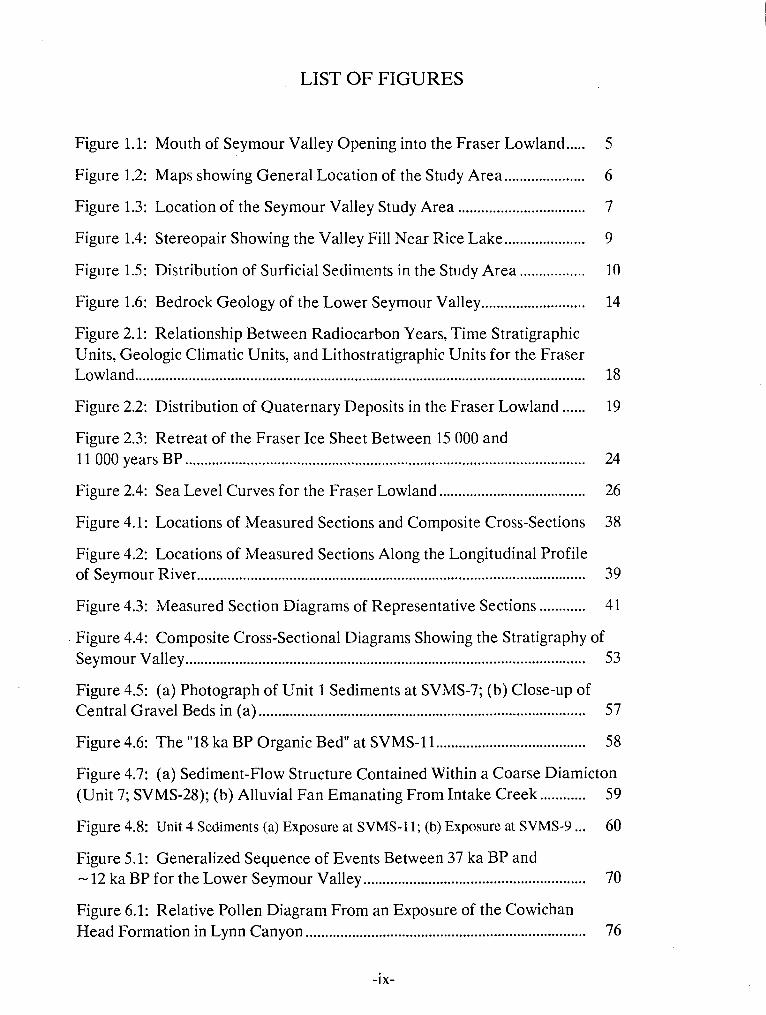
..... Figure 1.1. Mouth of Seymour Valley Opening into the Fraser Lowland 5
Figure 1.2. Maps showing General Location of the Study Area ..................... 6
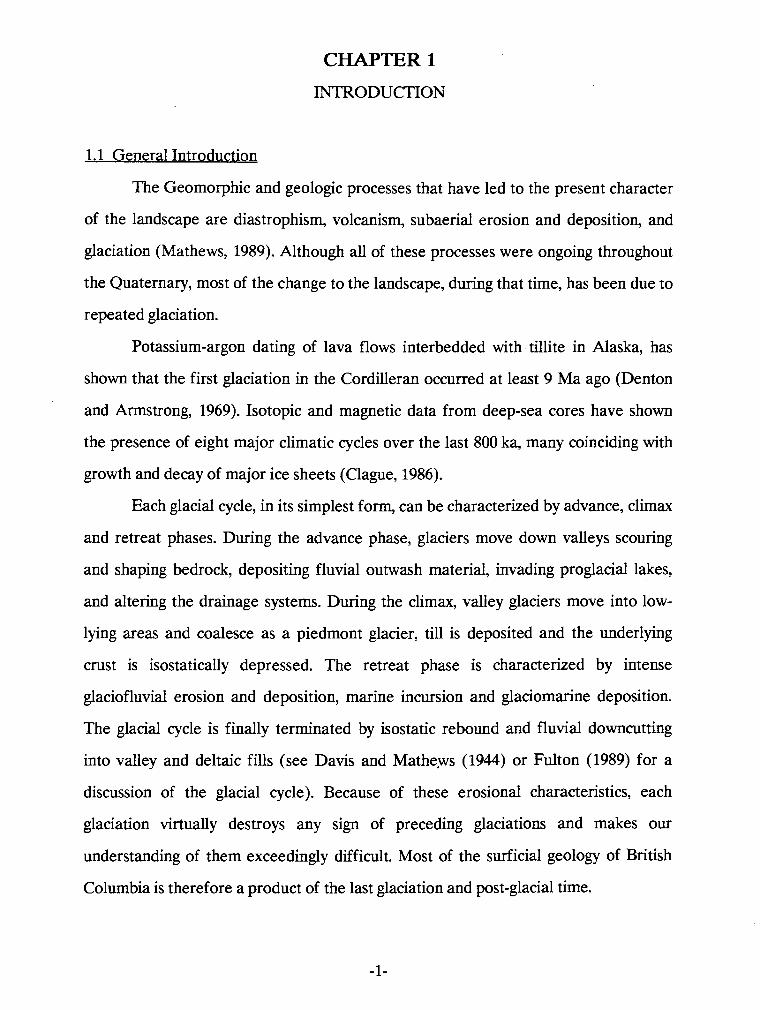
Figure 1.3. Location of the Seymour Valley Study Area ................................. 7
Figure 1.4. Stereopair Showing the Valley Fill Near Rice Lake ..................... 9
Figure 1.5. Distribution of Surficial Sediments in the Study Area ................. 10
Figure 1.6. Bedrock Geology of the Lower Seymour Valley ........................... 14
Figure 2.1: Relationship Between Radiocarbon Years. Time Stratigraphic Units. Geologic Climatic Units. and Lithostratigraphic Units for the Fraser Lowland ..................................................................................................................... 18
Figure 2.2. Distribution of Quaternary Deposits in the Fraser Lowland ...... 19
Figure 2.3: Retreat of the Fraser Ice Sheet Between 15 000 and ........................................................................................................ 11 000 years BP 24
Figure 2.4. Sea Level Curves for the Fraser Lowland ...................................... 26
Figure 4.1: Locations of Measured Sections and Composite Cross-Sections 38
Figure 4.2: Locations of Measured Sections Along the Longitudinal Profile ..................................................................................................... of Seymour River 39
Figure 4.3. Measured Section Diagrams of Representative Sections ............ 41
Figure 4.4: Composite Cross-sectional Diagrams Showing the Stratigraphy of ........................................................................................................ Seymour Valley 53
Figure 4.5: (a) Photograph of Unit 1 Sediments at SVMS-7; (b) Close-up of ..................................................................................... Central Gravel Beds in (a) 57
Figure 4.6. The "18 ka BP Organic Bed" at SVMS-11 ................................. 58
Figure 4.7: (a) Sediment-Flow Structure Contained Within a Coarse Diamicton (Unit 7; SVMS-28); (b) Alluvial Fan Emanating From Intake Creek ............ 59
... Figure 4.8. Unit 4 Sediments (a) Exposure at SVMS-11; (b) Exposure at SVMS-9 60
Figure 5.1: Generalized Sequence of Events Between 37 ka BP and . 12 ka BP for the Lower Seymour Valley .......................................................... 70
Figure 6.1: Relative Pollen Diagram From an Exposure of the Cowichan ......................................................................... Head Formation in Lynn Canyon 76
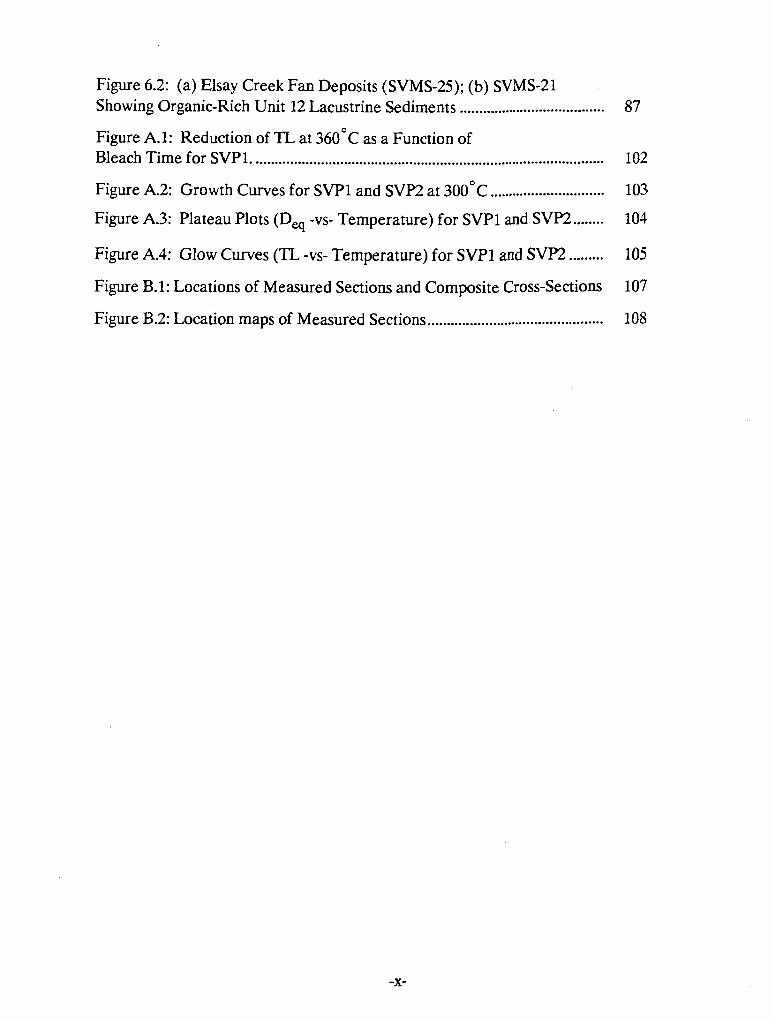
Figure 6.2: (a) Elsay Creek Fan Deposits (SVMS-25); (b) SVMS-21 Showing Organic-Rich Unit 12 Lacustrine Sediments ...................................... 87
Figure A.l: Reduction of TL at 3 6 0 ' ~ as a Function of ............................................................................................ Bleach Time for SVP1 102
Figure A.2. Growth Curves for SVPl and SVP2 at 3 0 0 ' ~ .............................. 103
Figure A.3. Plateau Plots (Dq -VS- Temperature) for SVPl and SVP2 ........ 104
Figure A.4. Glow Curves (TL -vs- Temperature) for SVPl and SVP2 ......... 105
Figure B.l: Locations of Measured Sections and Composite Cross-Sections 107
Figure B.2. Location maps of Measured Sections .............................................. 108
CHAPTER 1
INTRODUCTION
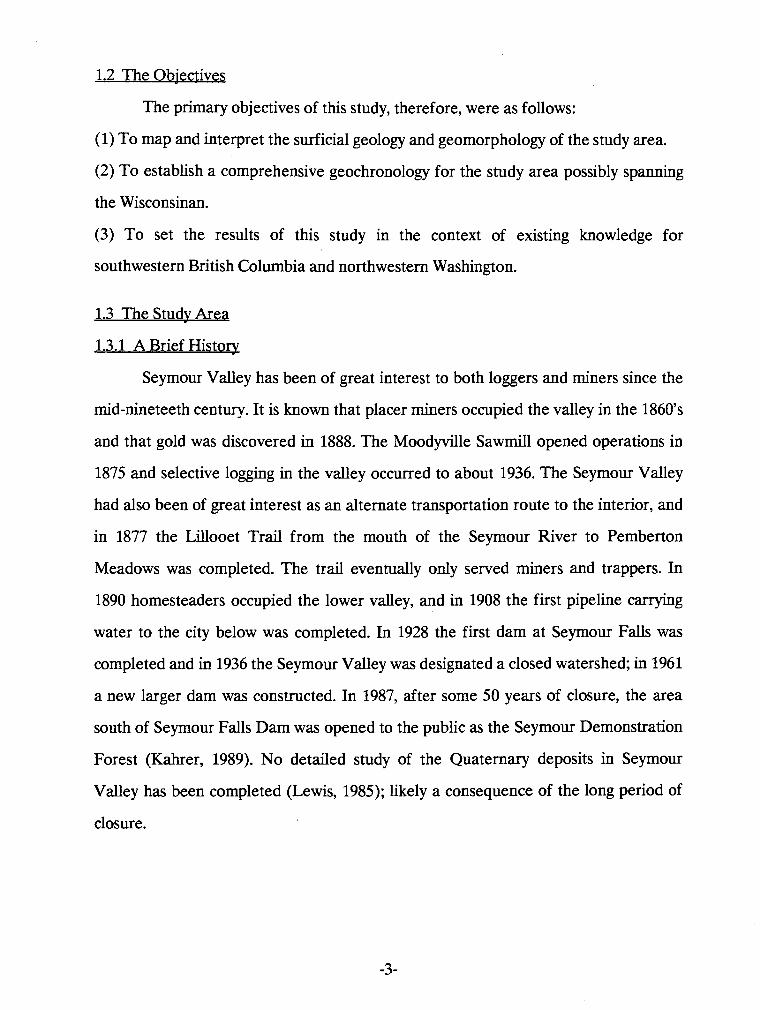
1.1 General Introduction
The Geomorphic and geologic processes that have led to the present character
of the landscape are diastrophism, volcanism, subaerial erosion and deposition, and
glaciation (Mathews, 1989). Although all of these processes were ongoing throughout
the Quaternary, most of the change to the landscape, during that time, has been due to
repeated glaciation.
Potassium-argon dating of lava flows interbedded with tillite in Alaska, has
shown that the first glaciation in the Cordilleran occurred at least 9 Ma ago (Denton
and Armstrong, 1969). Isotopic and magnetic data from deep-sea cores have shown
the presence of eight major climatic cycles over the last 800 ka, many coinciding with
growth and decay of major ice sheets (Clague, 1986).
Each glacial cycle, in its simplest form, can be characterized by advance, climax
and retreat phases. During the advance phase, glaciers move down valleys scouring
and shaping bedrock, depositing fluvial outwash material, invading proglacial lakes,
and altering the drainage systems. During the climax, valley glaciers move into low-
lying areas and coalesce as a piedmont glacier, till is deposited and the underlying
crust is isostatically depressed. The retreat phase is characterized by intense
glaciofluvial erosion and deposition, marine incursion and glaciomarine deposition.
The glacial cycle is finally terminated by isostatic rebound and fluvial downcutting
into valley and deltaic fills (see Davis and Mathews (1944) or Fulton (1989) for a
discussion of the glacial cycle). Because of these erosional characteristics, each
glaciation virtually destroys any sign of preceding glaciations and makes our
understanding of them exceedingly difficult. Most of the surficial geology of British
Columbia is therefore a product of the last glaciation and post-glacial time.

The study of past glacial environments is done primarily by mapping and
interpreting sedimentary exposures and drillhole logs. The certainty of past-
environment interpretation is therefore directly proportional to the number of
exposures studied. In British Columbia, as elsewhere, past glacial histories are
developed by correlating spatially diverse sedimentary exposures. Complete
stratigraphic columns, exposed at one location, representing even the last glacial cycle,
are sparse.
Mountain valleys may provide ideal sites for studying glacial history. As ice
advanced and retreated into the Fraser Lowland, valleys in the Coast and Cascade
ranges were filled with associated sediments. Post-glacial fluvial down-cutting and
subsequent slumping has, in many cases, provided numerous exposures. Despite these
favourable characteristics, few detailed Quaternary studies of mountain valleys in
southwestern British Columbia have been undertaken. Two exceptions are the
Coquitlarn (Hicock, 1976), the Chilliwack (Saunders, 1985) valleys.
Preliminary field reconnaissance had shown that the Seymour Valley contains
some of the best exposures of Quaternary sediments in the Fraser Lowland - sediments that appeared to represent at least one glacial cycle. It was thought that the
documentation and understanding of the stratigraphy in this valley would not only add
to the existing body of knowledge concerning the late Quaternary in southwestern
British Columbia, but open up a new laboratory for a diversity of future Quaternary
research.
1.2 The Objectives
The primary objectives of this study, therefore, were as follows:
(1) To map and interpret the surficial geology and geomorphology of the study area.
(2) To establish a comprehensive geochronology for the study area possibly spanning
the Wisconsinan.
(3) To set the results of this study in the context of existing knowledge for
southwestern British Columbia and northwestern Washington.
1.3 The Study Area
1.3.1 A Brief History
Seymour Valley has been of great interest to both loggers and miners since the
mid-nineteeth century. It is known that placer miners occupied the valley in the 1860's
and that gold was discovered in 1888. The Moodyville Sawmill opened operations in
1875 and selective logging in the valley occurred to about 1936. The Seymour Valley
had also been of great interest as an alternate transportation route to the interior, and
in 1877 the Lillooet Trail from the mouth of the Seymour River to Pemberton
Meadows was completed. The trail eventually only served miners and trappers. In
1890 homesteaders occupied the lower valley, and in 1908 the first pipeline carrying
water to the city below was completed. In 1928 the first dam at Seymour Falls was
completed and in 1936 the Seymour Valley was designated a closed watershed; in 1961
a new larger dam was constructed. In 1987, after some 50 years of closure, the area
south of Seymour Falls Dam was opened to the public as the Seymour Demonstration
Forest (Kahrer, 1989). No detailed study of the Quaternary deposits in Seymour
Valley has been completed (Lewis, 1985); likely a consequence of the long period of
closure.
1.3.2 Location
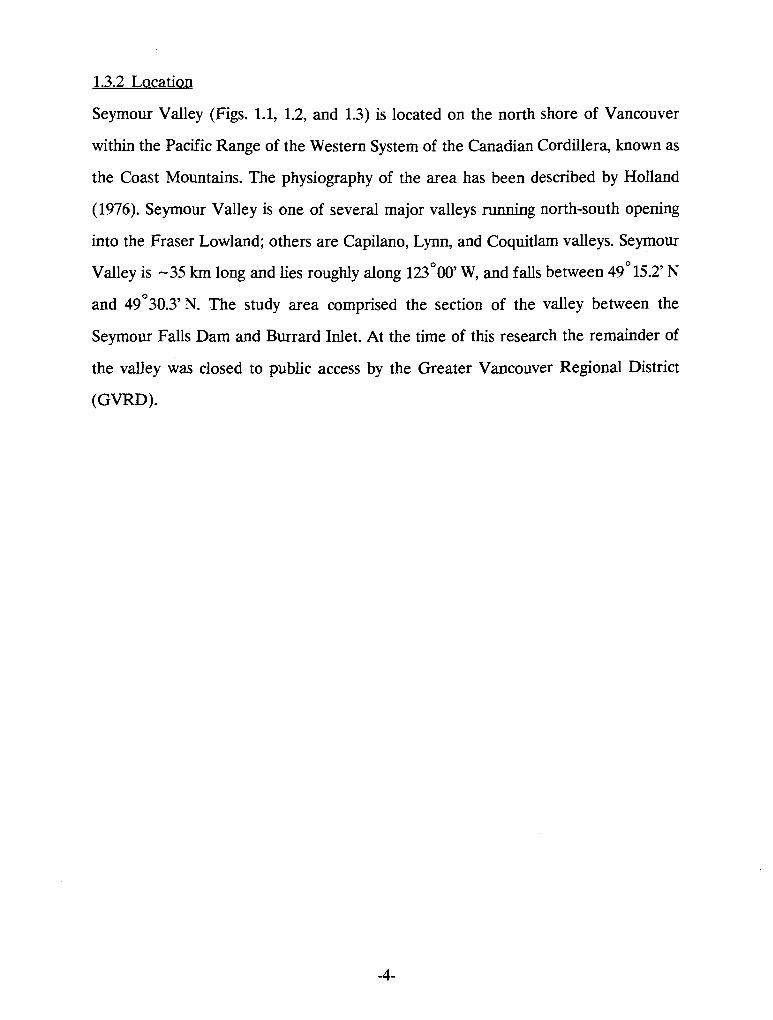
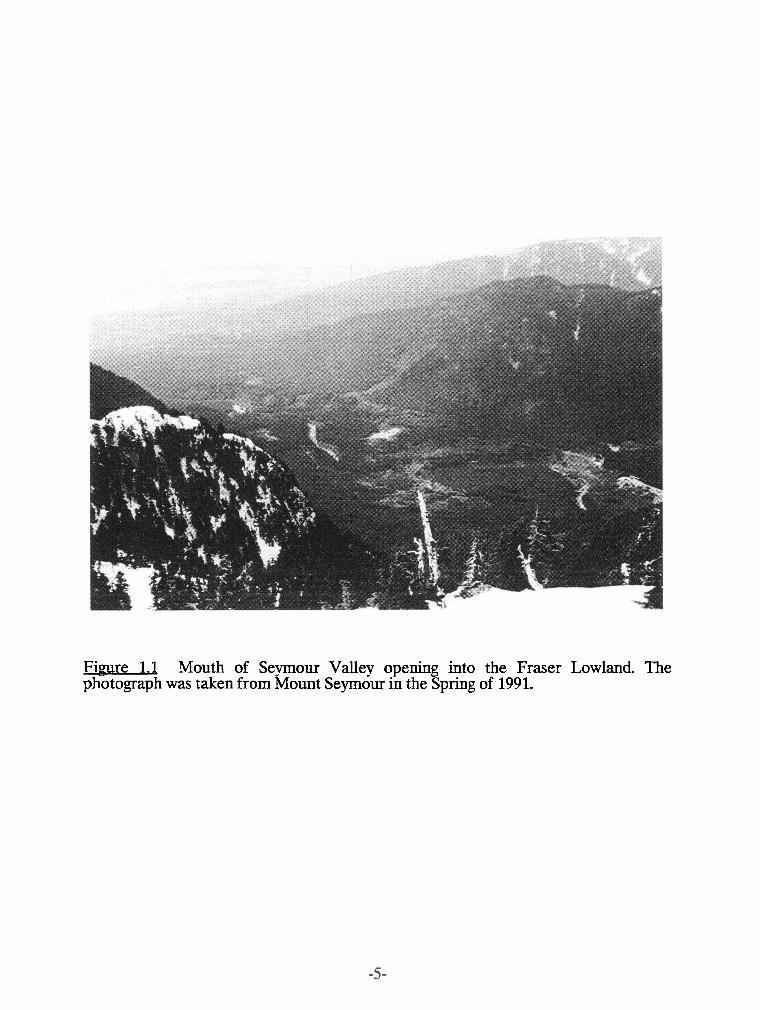
Seymour Valley (Figs. 1.1, 1.2, and 1.3) is located on the north shore of Vancouver
within the Pacific Range of the Western System of the Canadian Cordillera, known as
the Coast Mountains. The physiography of the area has been described by Holland
(1976). Seymour Valley is one of several major valleys running north-south opening
into the Fraser Lowland; others are Capilano, Lynn, and Coquitlam valleys. Seymour
Valley is -35 km long and lies roughly along 123*00' W, and falls between 49'15.2' N
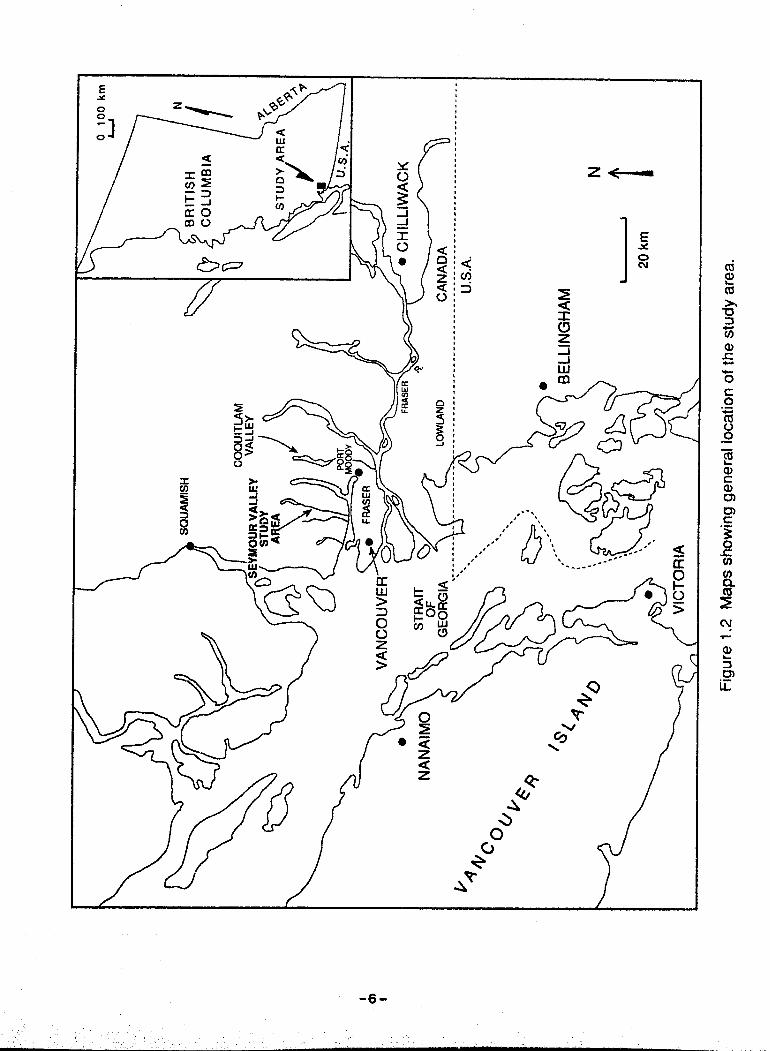
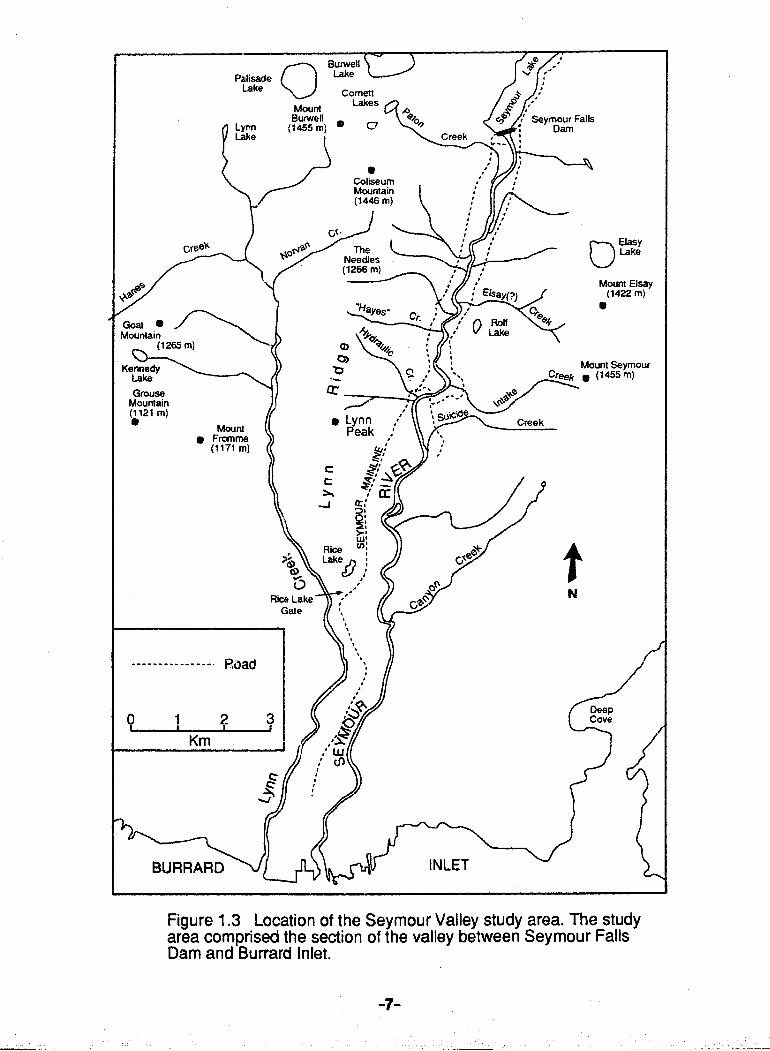
and 49'30.3'N. The study area comprised the section of the valley between the
Seymour Falls Dam and Burrard Inlet. At the time of this research the remainder of
the valley was closed to public access by the Greater Vancouver Regional District
(GVRD).
Fi-ye 1.1 Mouth of Seymour Valley opening into the Fraser Lowland. The photograph was taken from Mount Seymour in the Spring of 1991.
0 100 k
rn
u
BR
ITIS
H
CO
LU
MB
IA
BEL
LIN
GH
AM
N
Figu
re 1
.2
Map
s sh
owin
g ge
nera
l loc
atio
n of
the
stu
dy a
rea.
J cove
Figure 1.3 Location of the Seymour Valley study area. The study area comprised the section of the valley between Seymour Falls Dam and Burrard Inlet.
1.3.3 General Geomorpholo~v
Seymour Valley is a relatively narrow valley about 5 km wide. The valley rises
to the east to an elevation of 1455 m (Mt. Seymour) and to an elevation of 1466 m to
the west (Coliseum Mnt., Lynn Ridge, and The Needles). The valley formed since the
late Cretaceous, by fluvial incision (antecedence) as the Coast Plutonic Complex
began to rise above sea-level. Evidence of this are the two elevated erosional surfaces
on the south slopes of Seymour and Grouse mountains. These two surfaces probably
once formed a single surface stretching across what is now Seymour and Lynn Valleys
(Armstrong, 1990).
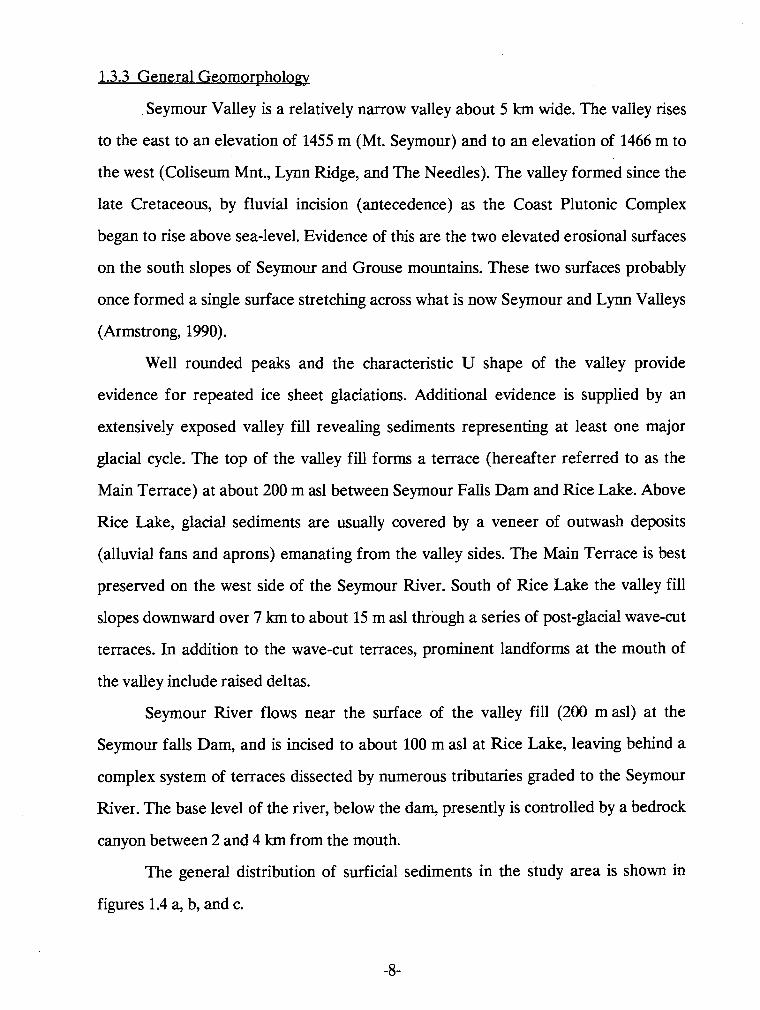
Well rounded peaks and the characteristic U shape of the valley provide
evidence for repeated ice sheet glaciations. Additional evidence is supplied by an
extensively exposed valley fill revealing sediments representing at least one major
glacial cycle. The top of the valley fill forms a terrace (hereafter referred to as the
Main Terrace) at about 200 m as1 between Seymour Falls Dam and Rice Lake. Above
Rice Lake, glacial sediments are usually covered by a veneer of outwash deposits
(alluvial fans and aprons) emanating from the valley sides. The Main Terrace is best
preserved on the west side of the Seymour River. South of Rice Lake the valley fill
slopes downward over 7 krn to about 15 m as1 through a series of post-glacial wave-cut
terraces. In addition to the wave-cut terraces, prominent landforms at the mouth of
the valley include raised deltas.
Seymour River flows near the surface of the valley fill (200 m asl) at the
Seymour falls Dam, and is incised to about 100 m as1 at Rice Lake, leaving behind a
complex system of terraces dissected by numerous tributaries graded to the Seymour
River. The base level of the river, below the dam, presently is controlled by a bedrock
canyon between 2 and 4 km from the mouth.
The general distribution of surficial sediments in the study area is shown in
figures 1.4 a, b, and c.
Fipure 1.4 Stereopair (1:29 434) showing the valley fill near Rice Lake. FT = Fisherman's Trail; T = terrace where Unit 14 sediments are observed to overlay Unit 1 sediments (see Chapter 4).
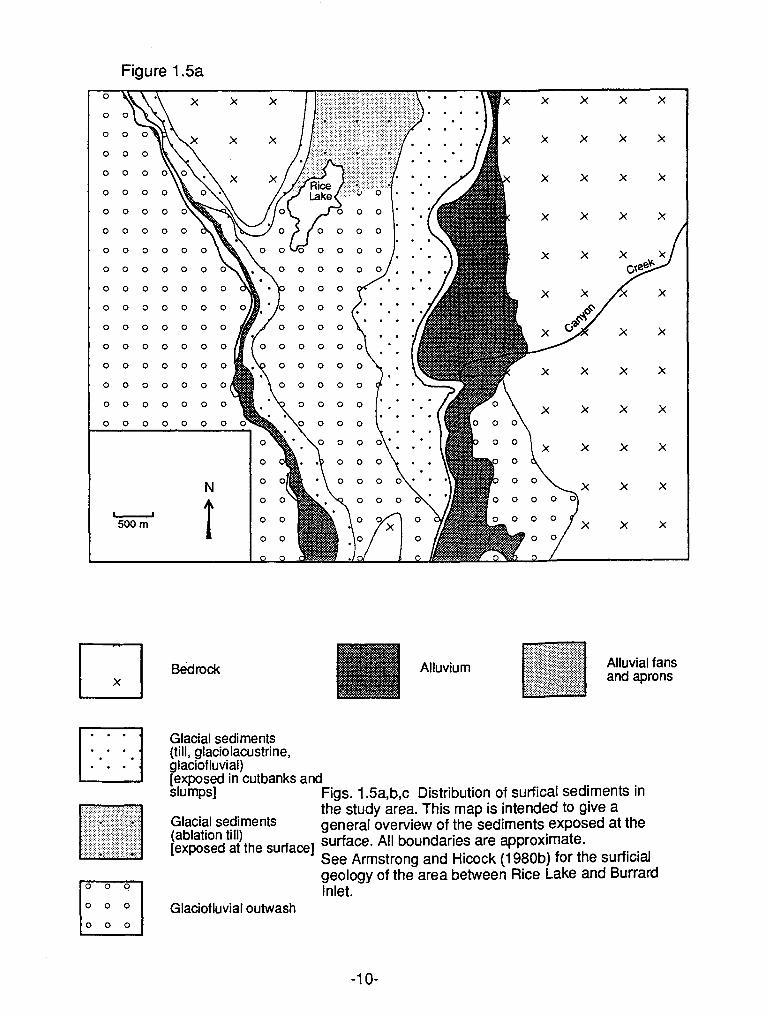
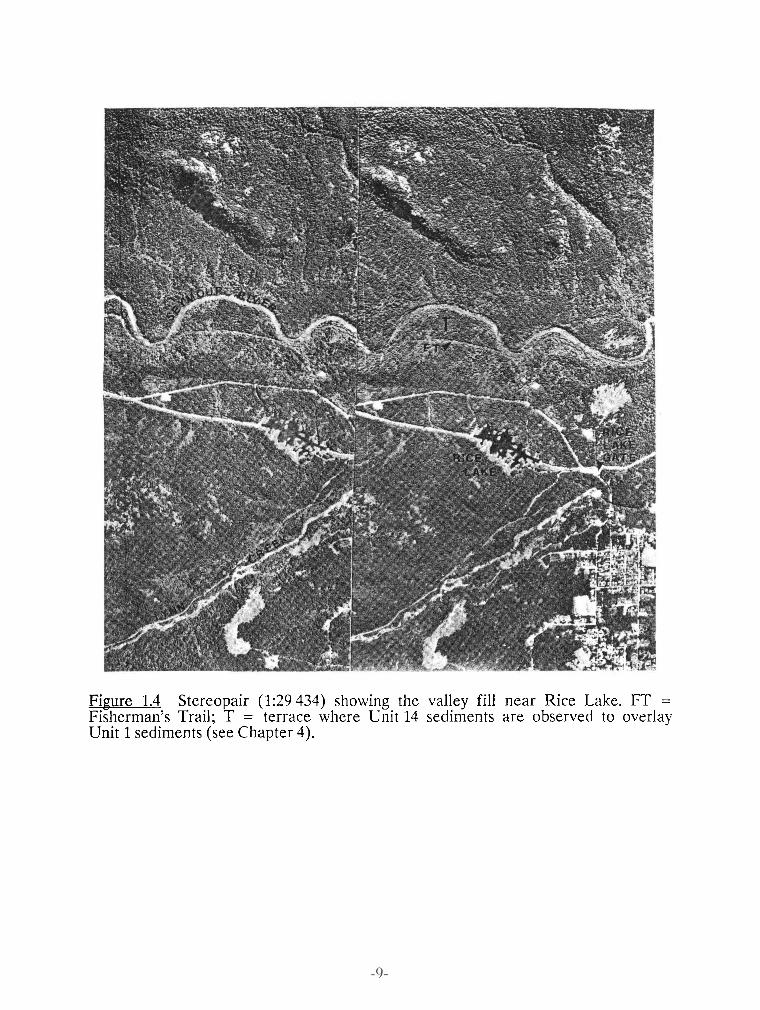
Figure 1.5a
Bedrock
Glacial sediments (till, glaciolacustrine, glaciof luvial) lexposed in cutbanks and
Glacial sediments (ablation till) [exposed at the surface]
Glaciofluvial outwash
Alluvium Alluvial fans and aprons
Figs. 1.5a,b,c Distribution of surfical sediments in the study area. This map is intended to give a general overview of the sediments exposed at the surface. All boundaries are approximate. See Armstrong and Hicock (1 980b) for the surficial geology of the area between Rice Lake and Burrard Inlet.
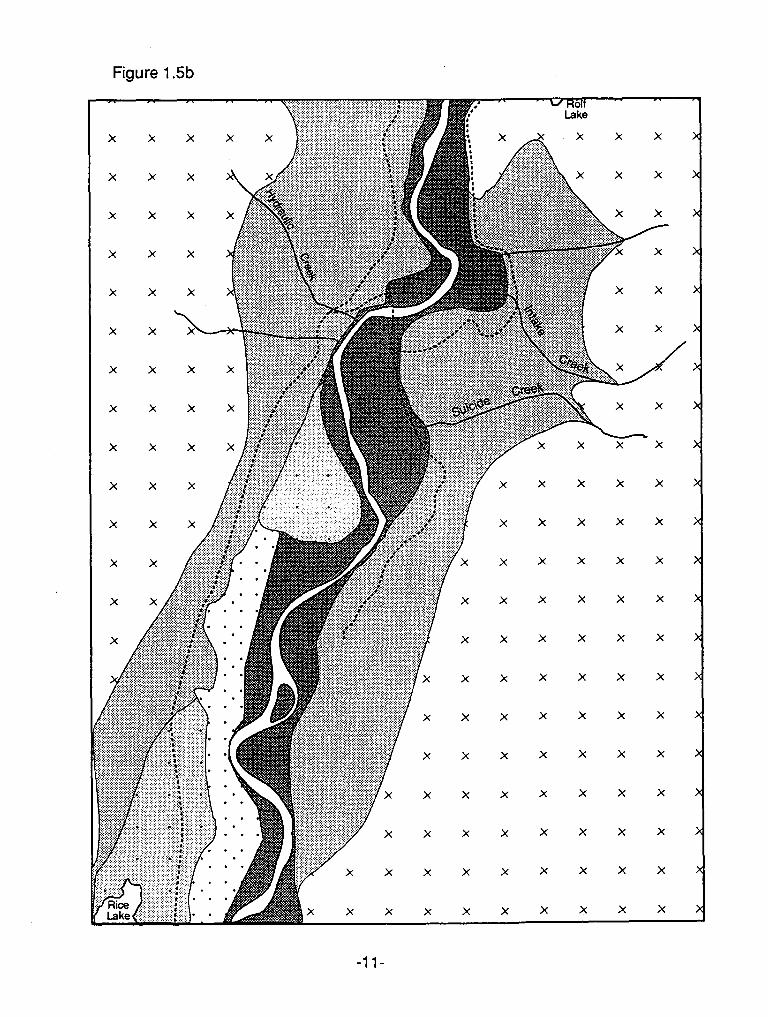
Figure 1.5b
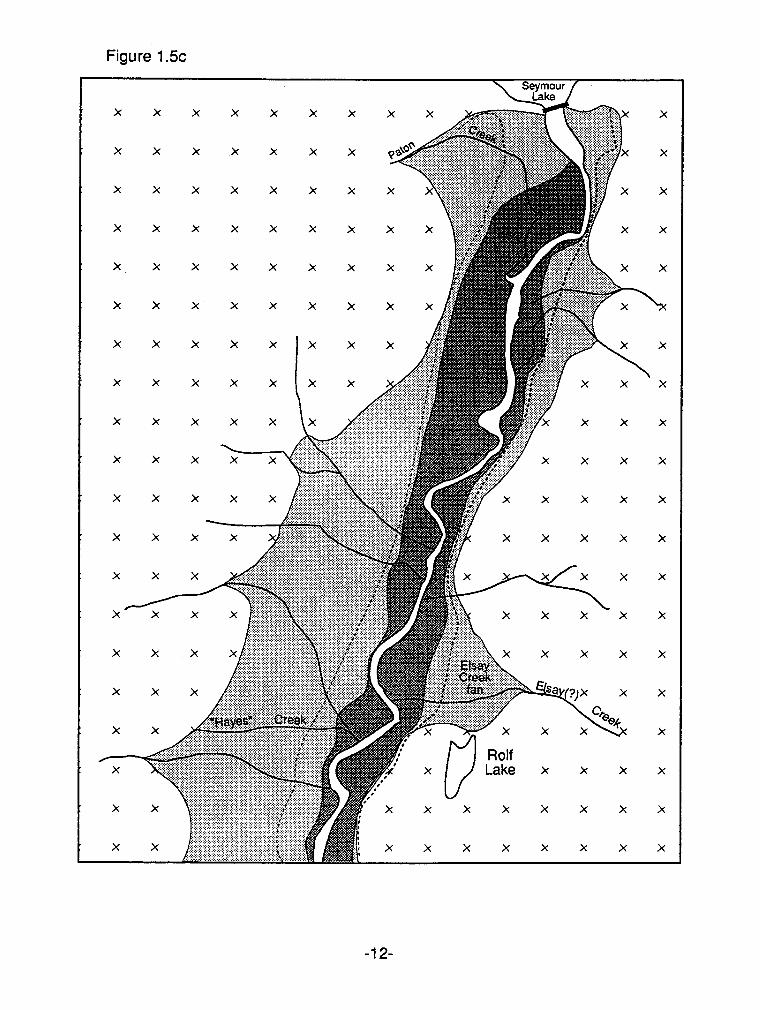
Figure 1.5~
1.3.4 Bedrock Geolog
The bedrock in the study area is part of the Coast Plutonic Complex consisting
of mainly plutonic rocks including quartz diorite, diorite, rnigmatite, granodiorite, and
minor granite (Fig. 1.6). The rocks of the Coast Plutonic Complex were formed in the
Cretaceous and erosion since the Tertiary (Eocene) has exposed them. The research
area is bracketed by two roof pendants, the Lynn Creek Pendant to west, and the
Mount Seymour Pendant to the east. The Mount Seymour Pendant is separated from
the study area by plutonic rocks, while Lynn Creek Pendant comes into direct contact
with surficial deposits in the general area of Hydraulic Creek. The Mount Seymour
Pendant is a composite pendant made up of the Gambier Group (upper
Jurassicllower Cretaceous) and underlying Twin Island Group (pre-Jurassic) rocks.
The Lynn Creek Pendant is probably composed of the Gambier Group rocks
(Roddick, 1979).
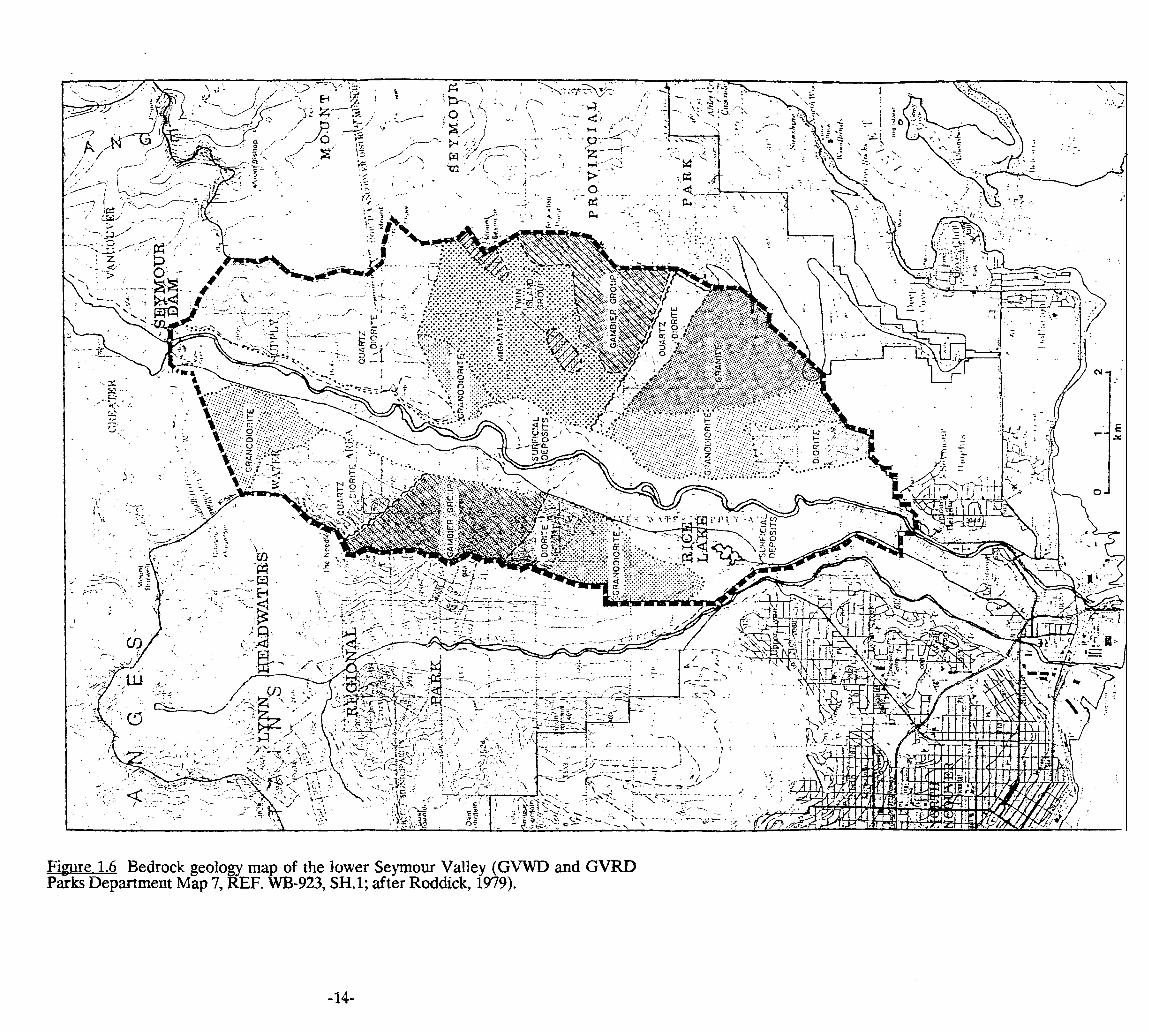
Fipure 1.6 Bedrock geology map of the lower Seymour Valley (GVWD and GVRD Parks Department Map 7, REF. WB-923, SH.l; after Roddick, 1979).
CHAPTER 2
PREVIOUS QUATERNARY RESEARCH
2.1 The Fraser Lowland: A Brief History of Ouaternam Research
Although the surficial geology and geomorphology of the Fraser Lowland was
first noted by explorers in the mid-nineteenth century, detailed descriptions did not
occur until early in the twentieth century. Burwash (1918) described the Pleistocene
drift deposits in the Fraser Delta area and in the Coast Mountains north of Burrard
Inlet. Burwash divided the drift deposits into an upper Vashon Till1 and a lower
Admiralty Till [Semiahmoo Drift12 separated by the Admiralty Sediments [Quadra
Sands], which he described as interglacial deposits. He also noted numerous raised
deltas and marine deposits and concluded that past sea levels were at least 650 feet
(200 m) above present sea level.
Johnston (1923) produced a Geological Survey of Canada (GSC) Memoir in
which he reported on the geology and physical features of the Fraser River Delta map
area from the international boundary north to the Coast Mountains, just north of
Burrard Inlet, and from the west coast to Fort Langley. Johnston described the two till
sheets of Burwash and noted that the uppermost till sheet contained fossil marine
shells and concluded that it was a result of an old sea bottom that had been 'ploughed
up' by ice. He also described the sea-cliffs at Point Grey (Burwash's Admiralty
Sediments) and concluded that because of the occurrence of a lower unit containing
peat beds and fossil plant material, they were deposited during an interglacial. He
named this lower unit the Point Grey Formation [Quadra Sands], and reserved the
name Admiralty Sediments to the overlying and underlying glacial outwash deposits.
Johnston also described the numerous raised beaches and terraces of Burwash,
specifically along the mouths of tributary valleys on the north shore of Burrard Inlet.
1. Vashon till and Admiralty till were originally defied by Bailey (1898) working in the Puget Lowland (northwestern Washington state).
2. Bracketed terms refer to present day equivalents.
-15-
Johnston also briefly discussed Pleistocene oscillations in sea-level and concluded
that, because of spatially different marine limits (marine limit decreasing in direction
of ice retreat), uplift was probably isostatic and associated with deglaciation.
In 1949 J.E. Armstrong began to map the surficial and bedrock geology of the
lower Fraser valley area and adjoining mountains. Armstrong and Brown (1954)
produced a paper which discussed the nature of late Wisconsinan post-glacial
sediments, specifically marine drift. The authors argued that the glacially ploughed up
fossiliferous sediments of Johnston actually represented sediments that had been
deposited by ice wasting into invading sea water during deglaciation, or by the
reworking of tills by wave action. Armstrong (1956) produced a surficial geology map
and report of the Vancouver area. His study indicated that the area was subject to at
least three major glaciations, the Seymour [Westlynn], Semiamu [Semiahmoo], and
Vashon. Armstrong also noted the existence of one probable interglacial period, the
Quadra [Highbury Nonglacial Interval?], between the Seymour and Serniamu
glaciations. The time interval between the Vashon and Semiarnu glaciations was
represented by merely an erosional interval. Armstrong also quoted two radiocarbon
dates, one from post-Vashon Capilano Group sediments (11 500 2 500 yrs), and
another from Quadra Group sediments (>30 000 yrs).
Through the next two decades the increased use of radiocarbon dating allowed
for the correlation of time stratigraphic units with lithostratigraphic units. In the early
1970's the process of defining and cataloging lithostratigraphic units as stratotypes
(Hedberg, 1976) was initiated, and many of the ambiguities associated with the misuse
of unit names were resolved; for example Armstrong and Clague (1977) supplied a
long-needed strict definition for the term &dra Sand. The result of this on-going
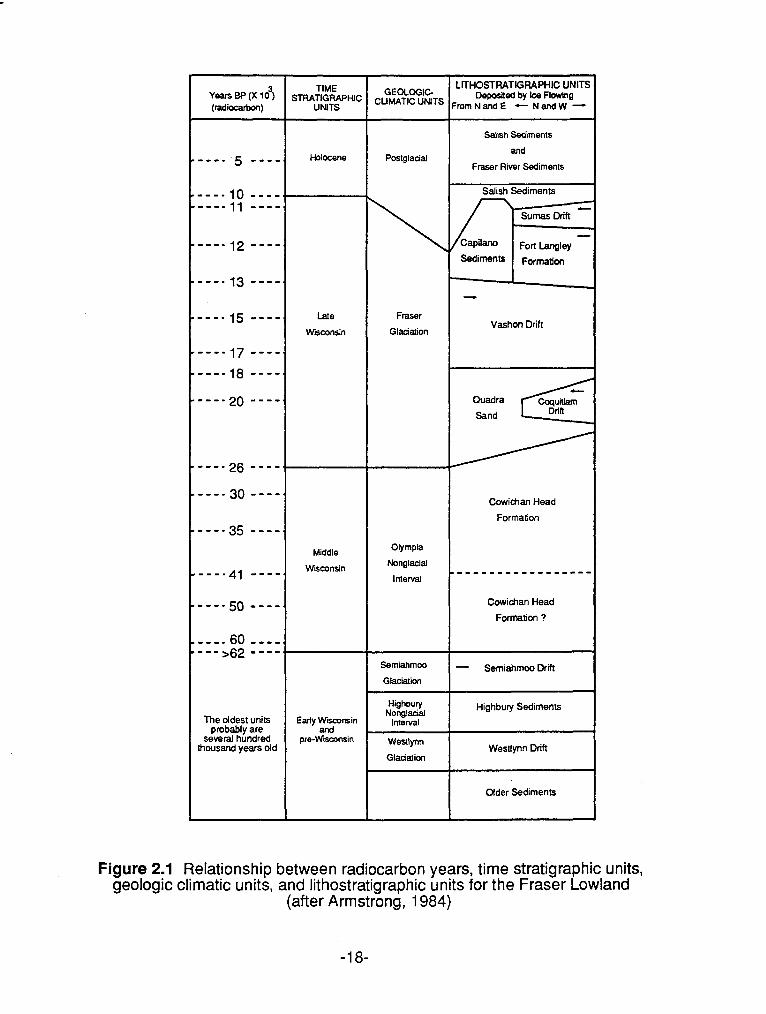
work is the now-accepted Quaternary stratigraphy presented in Figure 2.1.
Armstrong's 1956 surficial geology map was eventually updated by Armstrong
(1980a,b) and Armstrong and Hicock (1980q b). A Brief summary of the stratigraphic
record of the Fraser Lowland, and adjoining mountains is presented below.
2.2 The Stratigraphic Record of the Fraser Lowland
The stratigraphy of the Fraser Lowland has been studied in detail, and at least 14
lithostratigraphic units (Fig. 2.1) have been defined. Of these 14 units, 9 represent
three distinct glacial cycles, while the remainder represent local advances or surges of
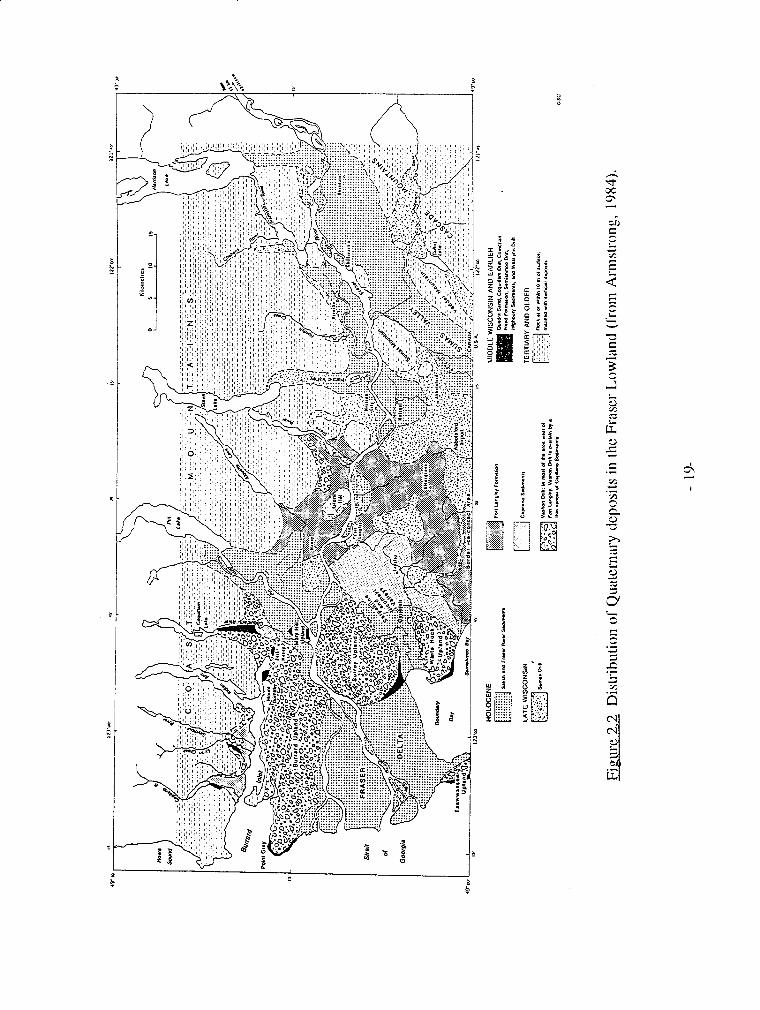
ice margins, and post-Fraser sediments. The general distribution of surficial deposits
in the Fraser Lowland is shown in Figure 2.2.
2.2.1 Late Sanpamonian!?) to Mid Wisconsinan
The oldest named glaciations (evidence of stratigraphically older glacial sediments, in
the Faser Lowland, have been found in drill cores) in the Fraser Lowland are the
Westlynn (Armstrong, 1956, 1975) and the Semiahmoo (Armstrong, 1975; Hicock and
Armstrong, 1983). The Westlynn glaciation is the stratigraphically oldest and most
poorly documented of the two and is represented by Westlynn Drift. Westlynn drift
consists of till, glaciomarine, glaciofluvial, and glaciolacustrine sediments and has
been found in various drillholes in the Fraser Lowland. Westlynn Drift is also thought
to be visible at the Westlynn parastratotype3 for the Highbury Sediments (see below)
(Hicock and Armstrong, 1983; Armstrong et al., 1985). The Semiamhoo glaciation was
the penultimate glaciation, and is represented by Semiamhoo Drift. Semiahmoo Drift
consists mainly of till, glaciofluvial, ice-contact, glaciomarine, and glaciolacustrine
sediments (Hicock and Armstrong, 1983). Semiahmoo Drift has been studied in
relatively more detail and has a holostratotype and parastratotype associated with it.
Both the Westlynn and Semiahmoo drifts are beyond the radiocarbon limit, so that all
associated dates are infinite. Semiahmoo Drift may, however, be associated with a
single
3. "A stratotype is the type representative of a named stratigraphic unit, constituting the standard for the definition and recognition of that unit. A holostratotype is an original stratotype designed at the time of establishment of a stratigraphic unit. A parastratotype is a supplementary stratotype used in the original definition to aid in elucidating the holostratotype" Armstrong and Clague (1!977).
.---. 60 - - - - ---->62 - - - -
The oldest units probably are
several hundred lhousand years old
TIME STRATIGRAPHIC
UNITS
Holocene
Late
Wisconsin
Middle
W~smnsin
Early Wisconsin and
pre-Wisconsin
GEOLOGIC CLIMATIC UNITS
Fraser
Glaciation
Olympia
Nonglacid
Interval
Semiahmoo
Glaciation
Highbury Nongladal
lnte~al
Westlynn
Gladation
LITHOSTRATIGRAPHIC UNITS Deposited by Ice Flowing
mrnNandE -NandW - Salish Sediments
and
Fraser River Sediments
Salish Sediments
C
Sumas Drift
Vashon Drift
Sand
Cowichan Head
Formation
Cowichan Head
Formation ?
-- Semiahmoo Drift
Highbury Sediments
Westlynn Drift
Older Sediments
Figure 2.1 Relationship between radiocarbon years, time stratigraphic units, geologic climatic units, and lithostratigraphic units for the Fraser Lowland
(after Armstrong, 1 984)
finite date of 58 800 +2900,-2100 years BP, from wood in overlying sediments, which
may be considered a minimum age for the drift (Hicock, 1976; Armstrong and Clague,
1977; Armstrong and Hicock, 1983), while the Westlynn Drift may be > 75 000 years
BP old (Armstrong, 1975).
The Westlynn and Semiahmoo glaciations were separated by the Highbury
Nonglacial Interval. Highbury Sediments consist of fluvial, marine, esturine, and
organic sediments (Hicock, 1980; Hicock and Armstrong, 1983; Armstrong, 1984).
Wood extracted from Highbury Sediments at the parastratotype gave infinite
radiocarbon dates of > 54 000 and > 52 000 years BP
The Semiahmoo Glaciation was followed by the Olympia Nonglacial Interval
which is represented by the Cowichan Head Formation. The Cowichan Head
Formation can be separated into two members (an upper terrestrial member and a
lower marine member), but generally includes fluvial, esturine, marine silt, sand and
gravel. Radiocarbon dates from the Cowichan Head Formation range from
25 800 2 310 to 47 000 2 1100 years BP, but a single date (mentioned above) of
58 000 +2900,-2100 extends the upper age limit to about 60 000 years BP (Armstrong
and Clague, 1977). This upper age limit is supported by 230Th/234U ages reaching
67.0 + 11,-10 ka from speleothems on Vancouver Island (Gascoyne et al., 1981).
2.2.2 Late Wisconsinan
Late Wisconsinan lithostratigraphic units, due to relatively abundant exposures,
all have well defined stratotypes; associated radiocarbon dates are all within the limit
of radiocarbon dating techniques.
The Fraser Glaciation is recognized as the last glaciation in which glaciers
occupied the mountains and lowlands of British Columbia (Armstrong et al., 1965),
and therefore is responsible for most of the landforms and stratigraphy found in
British Columbia today. The Fraser Glaciation may be divided into three stades: the
Coquitlam, Vashon, and Sumas. The Coquitlam and Sumas stades were local advances
-20-
or surges, and the Vashon Stade was the main glacial advance of the southwestern
part of the Cordilleran ice sheet.
The advance stage of the Fraser Glaciation began about 29 000 years BP when
cooler climatic conditions caused glaciers to advance from mountain valleys into the
fjords. As the valley glaciers advanced, glacial outwash in the form of braid planes or
sandurs were deposited in front of the ice margins. These outwash sediments have
been studied in great detail and are referred to as the Quadra Sands. The Quadra
Sands consist of cross-stratified, well-sorted sand, minor gravel, and silt. Radiocarbon
dates have shown that Quadra Sands were deposited diachronously, being more than
29 000 years old at the north end of Georgia Strait, yet younger than 15 000 years at
the south end of the Puget Sound (Armstrong and Clague, 1977; Clague, 1977).
The Coquitlam Stade represents the initial advance of ice during the onset of
the Fraser Glaciation. The Coquitlam Stade is represented by the Coquitlam Drift
which has only been positively identified at three exposures in the Fraser Lowland. A
holostratotype and two parastratotypes have been defined in the Coquitlam Valley-
Port Moody area (Hicock and Armstrong, 1985). Coquitlam Drift consists of till,
glaciofluvial, ice-contact, and glaciomarine deposits. Radiocarbon dates from the type
location show that the Coquitlam Stade lasted from about 21 700 k 130 to about
18 700 + 170 years BP and therefore occurred within about 3000 years of the main
Fraser Glaciation. The interval between the end of the Coquitlam Stade and start of
the Vashon Stade has been informally named the Port Moody interstade by Hicock
and Armstrong (1985) and has radiocarbon dates ranging from 18 700 5 170 to
17 800 + 150 years BP associated with it.
The Vashon Stade followed the Port Moody interstade and represents the main
advance of the southwestern part of the Cordilleran ice sheet during the Fraser
Glaciation. During the Vashon Stade valley glaciers coalesced in the lowlands as a
large piedmont glacier and ice accumulated to depths of over 1800 m. During this time
Vashon Drift was laid down. Vashon Drift was deposited diachronously and consists
-21-
of till, glaciofluvial, and glaciolacustrine sediments. The Vashon Drift is bracketed by
radiocarbon dates of 18 300 + 170 and 13 500 +- 220 years BP in the Fraser Lowland.
The Vashon ice sheet reached its maximum by about 14 500 years ago (Hicock and
Armstrong, 1985).
The retreat phase of the Fraser Glaciation (Fig. 2.3) is represented by Capilano
Sediments. Capilano Sediments are diachronous and were deposited away from the
retreating ice margin. Radiocarbon dates have shown that Capilano Sediments were
laid down between 12 800 2 175 and 10 430 +- 150 years BP Capilano Sediments
consist of marine and glaciofluvial sediments deposited when relative sea levels were
at least 15 m above the present sea-level. They are represented by seafloor muds with
dropstones, fossil shells, raised deltas of sand and gravel, raised intertidal sand, and
beach gravels (Armstrong, 1981,1984). Capilano Sediment usually form a thin veneer
overlying Vashon Drift.
During the retreat phase of the Vashon ice, there were several minor
readvances and retreats of the ice margin into the invading sea. This period is referred
to as the Fort Langley Time Interval and is represented by the Fort Langley
Formation. The Fort Langley Formation consists of Interbedded marine and
glaciomarine sediments and glacial drift, and is bracketed by radiocarbon dates of
12 900 +- 170 and 11 680 + 180 years BP (Armstrong, 1981). The Sumas Stade
followed the Fort Langley Time Interval and probably represents the final surge of
the retreating Vashon ice margin. The Sumas Stade is represented by Sumas Drift
which has only been found in the eastern part of the Fraser Lowland. The drift
consists of lodgment and flow tills, advance and recessional glaciofluvial deposits, and
glaciolacustrine deposits. The Sumas Drift is bracketed by radiocarbon dates of
11 700 + 150 and 11 300 + 100 years BP (Armstrong, 1981)
2.2.3 Post-Glacial
The post-glacial is represented by ~alish and Fraser River sediments
-22-

(Armstrong, 1984). Salish Sediments include all post-glacial terrestrial and marine
sediments that were deposited when the sea level was within 15 m of the present sea
level. They include lowland mountain stream sediments, lacustrine, eolian, colluvial,
slide, beach, and bog deposits. Fraser River Sediments represent sediments deposited
by the Fraser River from the time of the initiation of the Fraser Delta, some 9000
years ago, until present. The sediments include distributary, floodplain, and deltaic
deposits. Salish and Fraser River sediments have associated radiocarbon dates ranging
from 12 350 2 190 to modem (Armstrong, 1981,1984).
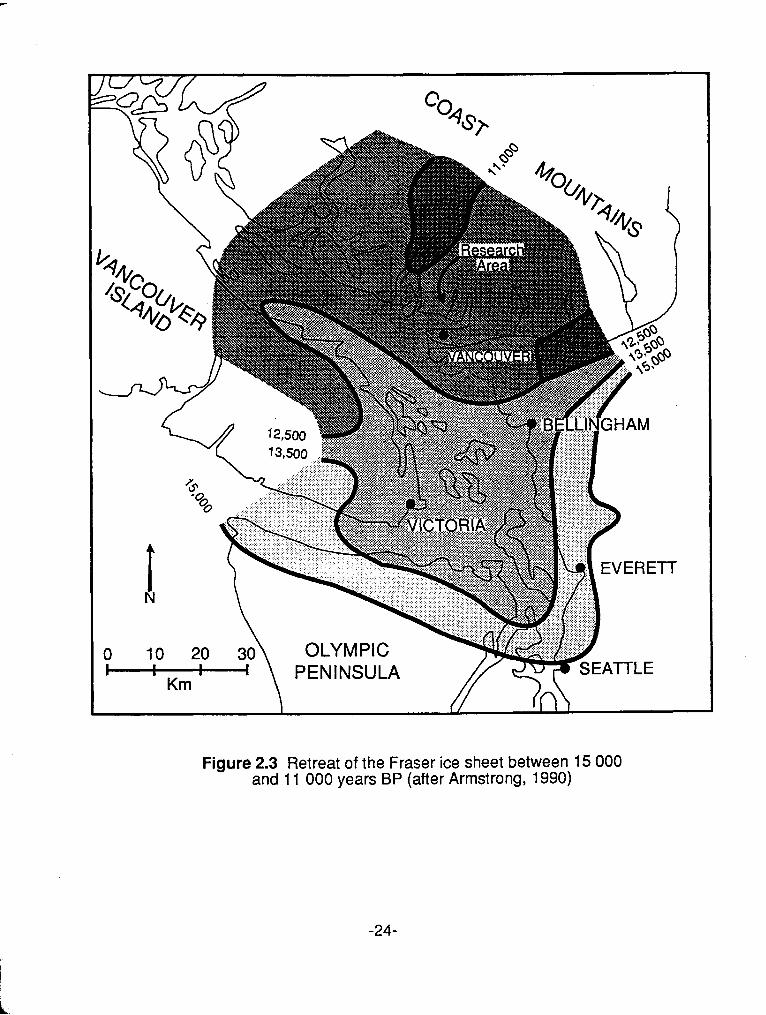
Figure 2.3 Retreat of the Fraser ice sheet between 15 000 and 1 1 000 years BP (after Armstrong, 1990)
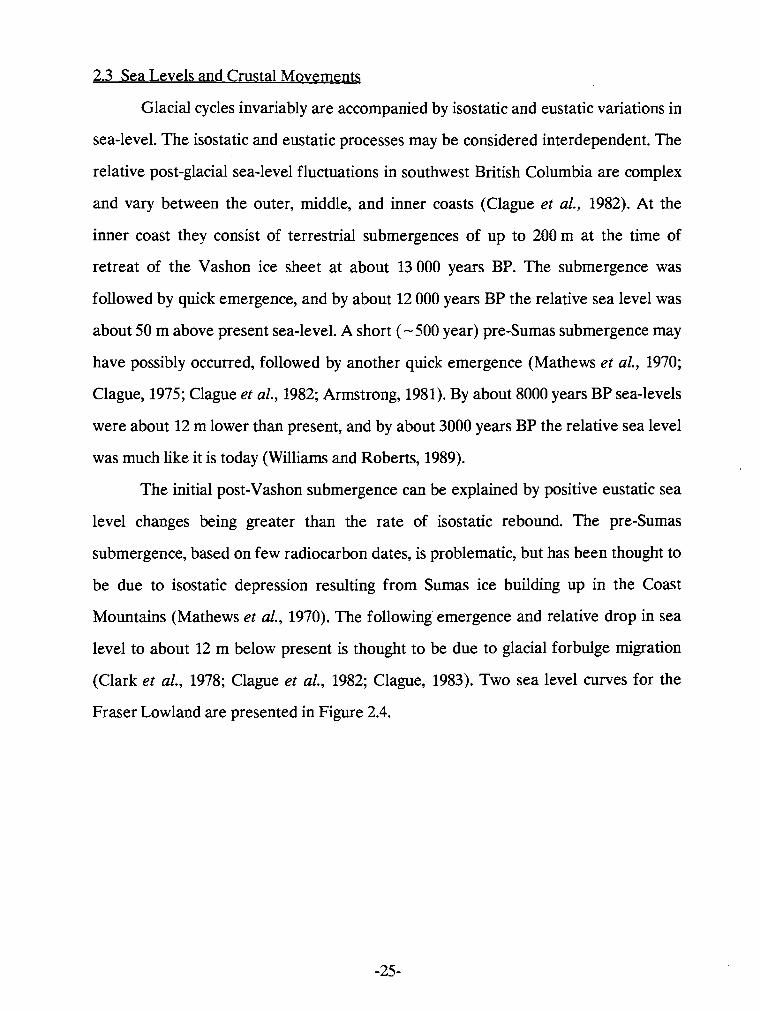
2.3 Sea Levels and Crustal Movements
Glacial cycles invariably are accompanied by isostatic and eustatic variations in
sea-level. The isostatic and eustatic processes may be considered interdependent. The
relative post-glacial sea-level fluctuations in southwest British Columbia are complex
and vary between the outer, middle, and inner coasts (Clague et al., 1982). At the
inner coast they consist of terrestrial submergences of up to 200 m at the time of
retreat of the Vashon ice sheet at about 13 000 years BP. The submergence was
followed by quick emergence, and by about 12 000 years BP the relative sea level was
about 50 m above present sea-level. A short (-500 year) pre-Sumas submergence may
have possibly occurred, followed by another quick emergence (Mathews et al., 1970;
Clague, 1975; Clague et al., 1982; Armstrong, 1981). By about 8000 years BP sea-levels
were about 12 m lower than present, and by about 3000 years BP the relative sea level
was much like it is today (Williams and Roberts, 1989).
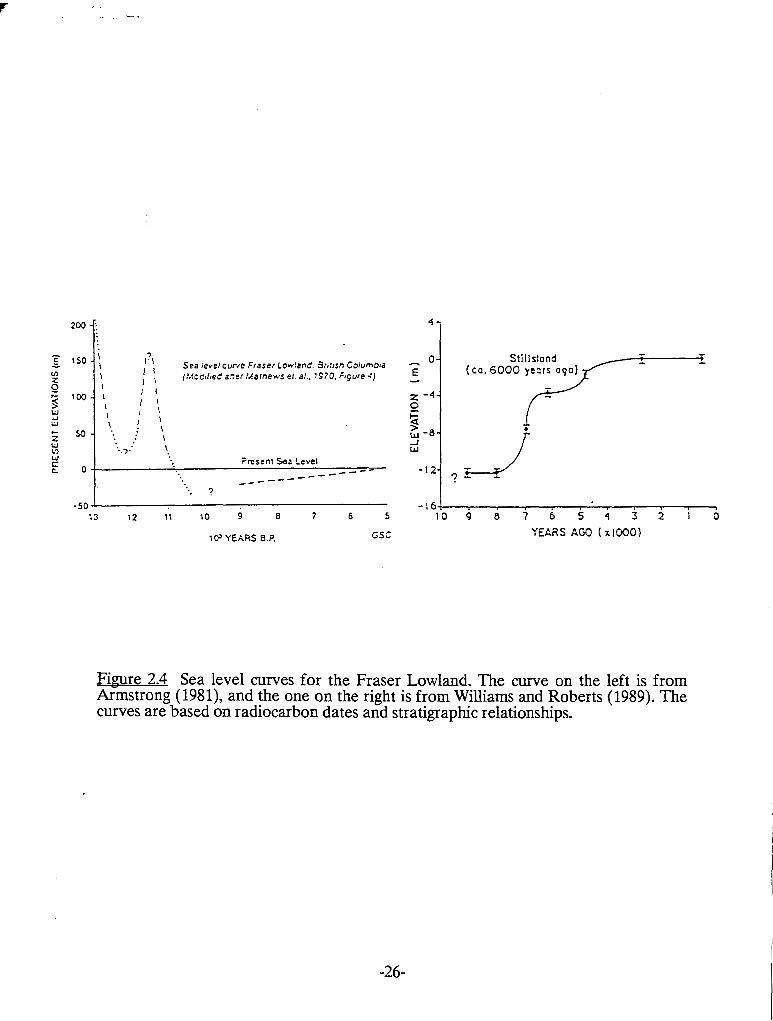
The initial post-Vashon submergence can be explained by positive eustatic sea
level changes being greater than the rate of isostatic rebound. The pre-Sumas
submergence, based on few radiocarbon dates, is problematic, but has been thought to
be due to isostatic depression resulting from Sumas ice building up in the Coast
Mountains (Mathews et al., 1970). The following emergence and relative drop in sea
level to about 12 m below present is thought to be due to glacial forbulge migration
(Clark et al., 1978; Clague et al., 1982; Clague, 1983). Two sea level curves for the
Fraser Lowland are presented in Figure 2.4.
10' YEARS B.P. G S t
-164 I 0 9 8 7 6 5 4 3 2 1 0
YEARS AGO ( x 1000)
Fimre 2.4 Sea level curves for the Fraser Lowland. The curve on the left is from Armstrong (1981), and the one on the right is from Williams and Roberts (1989). The curves are based on radiocarbon dates and stratigraphic relationships.
2.4 Previous Ouaternary Research in and near Seymour Vallev
The first published report on the Quaternary geology and geomorphology of
the study area did not appear until 1918. Burwash (1918) described the lower Seymour
Valley as one of the eight best "drift-sections" in the Vancouver area. Burwash's study
was regional, and he therefore did not perform any detailed studies of the exposures
in the valley. He does, however, present a stratigraphic section from a roadcut -2 krn
west of the Seymour Valley and divides the sediments exposed there into Admiralty
Drift, Admiralty Sediments, and Vashon Drift. Burwash also describes and discusses
the raised terraces at the mouth of Seymour and Lynn canyons and attributes them to
higher sea-levels following deglaciation. He also paid special attention to the lower
bedrock canyons of the Seymour, Lynn and Capilano valleys and concluded, by noting
their youthful appearance and relation to the surrounding topography, that they were
Holocene in age. Johnston (1923), also mentions the raised deltas at the mouth of the
Seymour Valley and more or less confirms what Bunvash saw. Johnston also describes
the bedrock canyons at the mouth of the Seymour, Lynn, and Capilano valleys and
once again comes to the same conclusion as Burwash.
Armstrong (1956), produced a surficial geology map, at a scale of 1:63 360, of
the Vancouver area which included the Seymour Valley study area north to about
49'22'. Included in this map is a location, in the Seymour Valley, of fossil shells. The
map shows the general location of glacial, glaciomarine, and interglacial deposits.
Armstrong also states in his accompanying paper that "Seymour [Westlynn] group
sediments are exposed in the valleys of Capilano, Seymour, and Lynn creeks...". He
also states that "Quadra [Cowichan Head?] interglacial deposits" are found in these
valleys, and that "peat and wood were observed in these sediments". Later maps by
Armstrong (Armstrong and Hicock, 1980b; Armstrong, 1984) show that no additional
work had been done in the Seymour Valley.
At least four fossil shell locations in the study area were documented by
Wagner (1959) and are probably the same locations appearing on a later map by
-27-
Armstrong (1981; p.19). Wagner's study was to interpret the ecological conditions of
the non-glacial intervals.
At least four radiocarbon dates have been produced from an exposure of the
Cowichan Head Formation in the neighbouring Lynn Canyon area of Lynn Valley.
The dates range from 33 000 + 620 to 47 000 + 1100 years BP (Fulton, 1971; Lowdon
and Blake, 1981; Armstrong et al., 1985; Armstrong, 1990). Thermoluminescence
dating of fine-grained (4-11 pm) sediments extracted from peat, at a position
corresponding to a radiocarbon age of 34 900 + 810 (GSC-2873) years BP, yeilded an
apparent TL age of 25 + 4 ka [-21 ka BPI (Divigalpitiya, 1982; Huntley et al., 1983).
A parastratotype for the Highbury Sediments was defined by Hicock and
Armstrong (1983) at a road cut along the Upper Levels Highway at Westlynn (east
bank of the Upper Levels highway, 1.5 km northwest of the north end of the Second
Narrows Bridge). Westlynn Drift (Armstrong, 1975) and the Cowichan Head
Formation (Armstrong and Clague, 1977) are also believed to appear at this location.
Wood from Highbury Sediments at this parastratotype was radiocarbon dated at
> 54 000 and > 52 000 years BP, while wood from the Cowichan Head Formation was
radiocarbon dated at 32 200 + 3300 years BP (Hicock and Armstrong, 1983).
A brief study on the use of remote sensing techniques in detecting the
differences between subsurface glacial and outwash deposits was completed by Joyce
(1976). Three sites were studied in the Seymour watershed. His concern was with
detection, not interpretation of the deposits studied.
A geologic field trip guide for the Lynn Valley-Seymour area was produced by
Maynard (1977). A few geologic sections (exposures) were measured and mapped,
mostly in the adjacent Lynn Valley. Maynard (1978) also produced an M.Sc. thesis
concerned with the geomorphic constraints to urban residential development in the
Seymour area. His research spanned the area between Lynn Creek and Deep Cove,
north to about 49O20'. Although a number of geologic sections along the lower reaches
of Seymour River and Lynn Creek were logged and stratigraphically interpreted, his
-28-
main concern was with relating surficial deposits to possible urban use, rather than to
the Quaternary history of his study area, or the Fraser Lowland.
Numerous bore-holes have been drilled for the Geological Survey of Canada,
many of which were in the lower (south of the Hydro power line) Seymour Valley and
surrounding area. The data from the boreholes are kept in the Vancouver Subsurface
Data Bank (Belanger and Harrison, 1976), a GSC Open File. The borehole data give
limited information on texture and distance to bedrock, and generally is poor. The
borehole logs do, however, on occasion, note the presence of till and shells. The
borehole data for the lower Seymour Valley have been compiled by Maynard (1978).
CHAPTER 3
METHODOLOGY
3.1 General Methodolog
In order to construct a comprehensive lithostratigraphic history of the Seymour
Valley the following procedure was followed:
1. Before the study could proceed, a sufficient number of exposures had to be located.
This was done by exploring virtually all the tributaries of the Seymour River (within
the study area) and noting the location of any exposures (sections) believed to
be relevant.
Because of a sufficient number of natural exposures, the less-reliable borehole
data from the GSC Subsurface Data Bank (Belanger and Harrison, 1976) were not
used; one exception was when depth to bedrock was estimated at the east bank of the
Seymour River during the construction of a valley cross-sectional diagram (see Figure
4.3a).
2. Relevant sections were then logged in terms of the following sediment properties:
- Texture and structure
- Type of contact and thickness of unit
- The presence of organics
- The presence of littoral deposits and fossil shells
3. Individual measured sections were then divided into lithostratigraphic units based
on stratigraphic relation, appearance (depositional environment).
4. Using extensive radiocarbon dating, measured sections were correlated within the
study area, thus building up the late Quaternary lithostratigraphic history for the
valley.
3.2 Measured Sections
Elevations were measured using a Thommen type 335.01.02 altimeter in
conjunction with a series of Greater Vancouver Water District (GVWD) benchmarks
located throughout the study area. The benchmarks are discussed in detail in
Appendix D. Where no nearby benchmarks were available, secondary benchmarks
based on the closest GVWD benchmark were established. The altimeter was generally
used to establish the elevation above sea-level of the top of the sections, a 30 m
measuring tape was then used to measure the section. Where sections were too
vertically large or irregular to efficiently make use the tape measure, the altimeter was
used to find the elevations of the relevant contacts. All elevations recorded using the
altimeter were repeated several times over the course of the field season. From these
repeated measurement an uncertainty of t 1.5 m may be associated with each
elevation measurement.
3.2.1 Texture and Structure
Because this research is concerned with the stratigraphy and chronology of the
surficial deposits in the study area, and not the sedimentology per se, a detailed
quantitative study of texture was not undertaken. Rather, sediments were described as
either fine, medium, or coarse sand, silt and/or clay etc. using the particle size
classification of Wentworth (1922) (Table 3.1); textural analysis was performed
qualitatively in the field using an American/Canadian Stratigraphic field card (see
Miall, 1990; p.27).
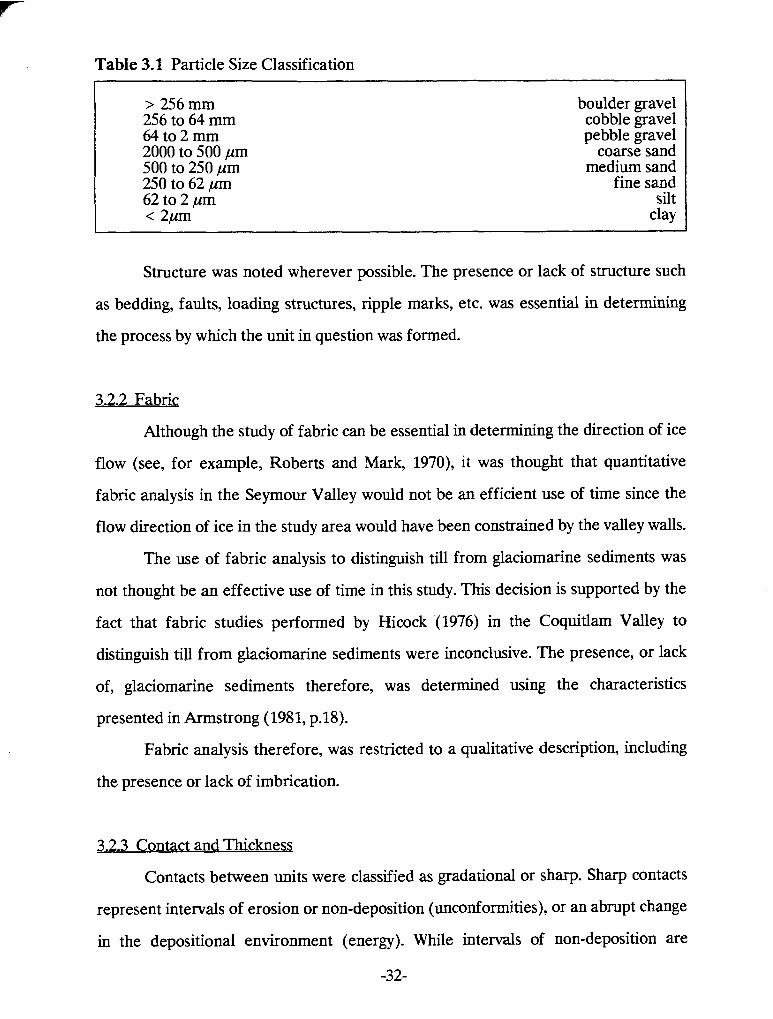
Table 3.1 Particle Size Classification
> 256 mrn 256 to 64 mm 64 to 2 mm 2000 to 500 pm 500 to 250 pm 250 to 62 pm 62 to 2 prn < 2pm
boulder gravel cobble gravel pebble gravel
coarse sand medium sand
fine sand silt
clay
Structure was noted wherever possible. The presence or lack of structure such
as bedding, faults, loading structures, ripple marks, etc. was essential in determining
the process by which the unit in question was formed.
3.2.2 Fabric
Although the study of fabric can be essential in determining the direction of ice
flow (see, for example, Roberts and Mark, 1970), it was thought that quantitative
fabric analysis in the Seymour Valley would not be an efficient use of time since the
flow direction of ice in the study area would have been constrained by the valley walls.
The use of fabric analysis to distinguish till from glaciomarine sediments was
not thought be an effective use of time in this study. This decision is supported by the
fact that fabric studies performed by Hicock (1976) in the Coquitlam Valley to
distinguish till from glaciomarine sediments were inconclusive. The presence, or lack
of, glaciomarine sediments therefore, was determined using the characteristics
presented in Armstrong (1981, p.18).
Fabric analysis therefore, was restricted to a qualitative description, including
the presence or lack of imbrication.
3.2.3 Contact and Thickness
Contacts between units were classified as gradational or sharp. Sharp contacts
represent intervals of erosion or non-deposition (unconformities), or an abrupt change
in the depositional environment (energy). While intervals of non-deposition are
-32-

virtually impossible to deduce, intervals of erosion may be distinguished by, for
example, abruptness of contact in association with "rip-up" or incorporation of
sediment from the underlying unit. Gradational (conformable) contacts represent
periods of continuous deposition, and are found where two units grade into each
other.
3.2.4 The Presence of Organics.
The Presence of organic material is important in determining both the
radiocarbon age of the unit in question, and the climatic environment (i.e. glacial or
non-glacial) in which the unit was deposited.
3.2.5 The Presence of Littoral Deposits and Fossil Shells
The Presence of littoral deposits and fossil shells were used to define areas of
former marine incursion. Since littoral deposits are difficult to distinguish from fluvial
deposits, their presence was confirmed only in association with a related landform, for
example a marine terrace.
3.3 Geochronolog
The geologic and geomorphic history of the valley was developed using
radiocarbon dating of organic material and more limited thennoluminescence (TL)
dating of sediments. All dates appearing in Table 5.1 are new, and therefore are an
addition to those already existing in the literature.
3.3.1 Radiocarbon dating
An inherent problem associated with radiocarbon dating of geologic deposits is
that the age one obtains is that of the time of death of the organic material being
dated, which is not necessarily the time of deposition of the geologic unit in question.
There is always a chance that what is being sampled has been reworked from an older
unit. Whenever possible, samples concentrated at one stratigraphic position, or in
association with organic rich sediments (eg. a buried or reworked soil) were selected.
In addition, the size and shape of the sample was an important factor in the selection
process; the larger the sample, the smaller the chance of it being reworked, at least
over the course of a glaciation. Sampling rounded or abraded wood was also avoided.
Rounded or abraded wood suggests transport over long time periods and/or distances.
Radiocarbon analysis was done at Beta Analytic Incorporated and the
Geological Survey of Canada (GSC) Radiocarbon Dating Laboratory. Beta Analytic
was chosen for their reliability and quick turn around time. This allowed for the
opportunity to re-sample some of the stratigraphic units for confirmation.
Radiocarbon samples from what was thought to be the oldest exposed unit in
the study area (informally dated at >32 000 years BP at the Simon Fraser University
Radiocarbon Laboratory, Department of Archaeology) were submitted to the GSC
laboratory for high pressure counting. The high pressure technique extends the
radiocarbon dating limit to about 54 000 years (Lowdon, 1985).
3.3.2 Thermoluminescence dating
Based on the success of Divigalpitiya (1982) in dating sediments extracted from
peats in the neighbouring Lynn Valley, two samples of sediment-rich peat were
collected for TL dating from what was thought to be the oldest exposed unit in the
study area (see above). This was done for two reasons. (1) In the event that the GSC
high pressure radiocarbon dates gave infinite results, the TL dates would be able to, at
least, determine which non-glacial interval the unit represents. (2) In the event that
the GSC high pressure radiocarbon dates turned out to be finite, the TL dates would
be valuable for comparison, and favourable results would justify using the technique
for dating sediments from units beyond the radiocarbon limit, should any be found
during the course of this research.
TL dating of sediments is, at present, still in its infancy and therefore any TL
dates quoted in research require a detailed discussion of experimental procedure and
results. Such a discussion appears in Appendix A.
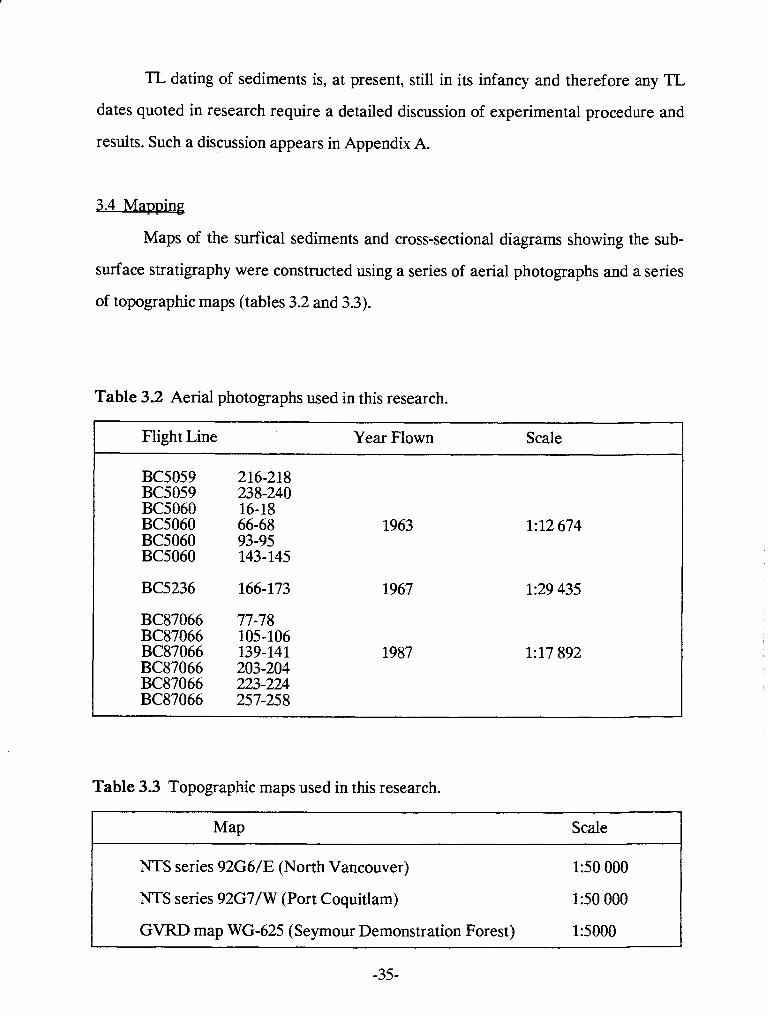
3.4 Mapping
Maps of the surfical sediments and cross-sectional diagrams showing the sub-
surface stratigraphy were constructed using a series of aerial photographs and a series
of topographic maps (tables 3.2 and 3.3).
Table 3.2 Aerial photographs used in this research.
I Flight Line -- -
Year Flown Scale
Table 3.3 Topographic maps used in this research.
Map Scale 1 - -
NTS series 92G6/E (North Vancouver)
I NTS series 92G7/W (Port Coquitlam) 150 000 I GVRD map WG-625 (Seymour Demonstration Forest) 1:5000
CHAPTER 4
THE LITHOSTRATIGRAPHY OF LOWER SEYMOUR VALLEY
4.1 Introduction
Over 30 sections were measured in the study area (coded SVMS = Seymour
Valley Measured Section). The locations of the measured sections along the
longitudinal profile of Seymour River are presented in Figure 4.2. Measured sections
believed to represent the general lithostratigraphy of the study area, a subset of those
in Figure 4.2, are presented schematically in Figure 4.3. The general valley-
stratigraphy also is represented in association with composite valley cross-sections at
different localities in the study area (Fig. 4.4). The location of all the measured
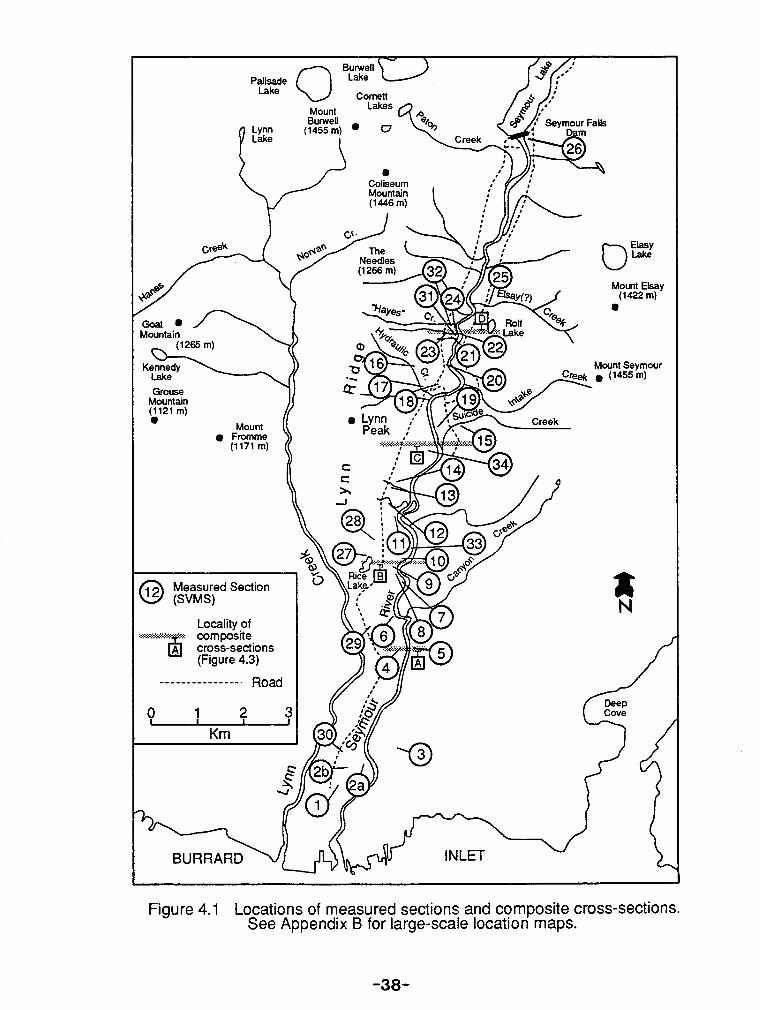
sections can be found in Figure 4.1 and in Appendix B. Descriptions and interpretation
of measured sections not appearing in Figure 4.3 can be found in Appendix C.
All of the measured sections appearing in Figure 4.3 have been coded using a
lithofacies coding scheme based on that of Miall (1977, 1978) and Eyles et al. (1983).
The lithofacies code is presented below in Table 4.1. A list of radiocarbon dates can
be found in Table 5.1.
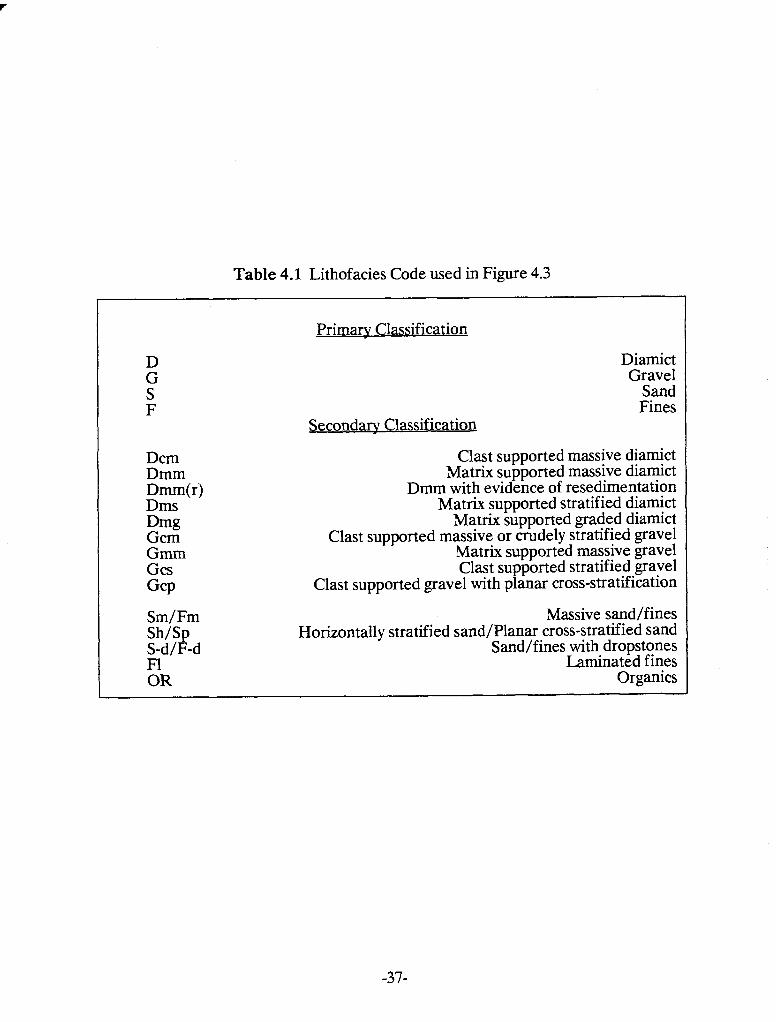
Table 4.1 Lithofacies Code used in Figure 4.3
D G S F
Dcm Dmm Dmm(r) Dms Dmg Gcm Gmm Gcs G ~ P
Sm/Fm Sh/Sp S-d/F-d F1 OR
Primary Classification
Diamict Gravel
Sand Fines
Clast supported massive diamict Matrix supported massive diamict
Dmm with evidence of resedimentation Matrix supported stratified diamict
Matrix supported graded diamict Clast supported massive or crudely stratified gravel
Matrix supported massive gravel Clast supported stratified gravel
Clast supported gravel with planar cross-stratification
Massive sand/fines Horizontally stratified sand/Planar cross-stratified sand
Sand/fines with dropstones Laminated fines
Organics
$J cross-sections (Figure 4.3)
Figure 4.1 Locations of measured sections and composite cross-sections. See Appendix B for large-scale locat~on maps.
-38-
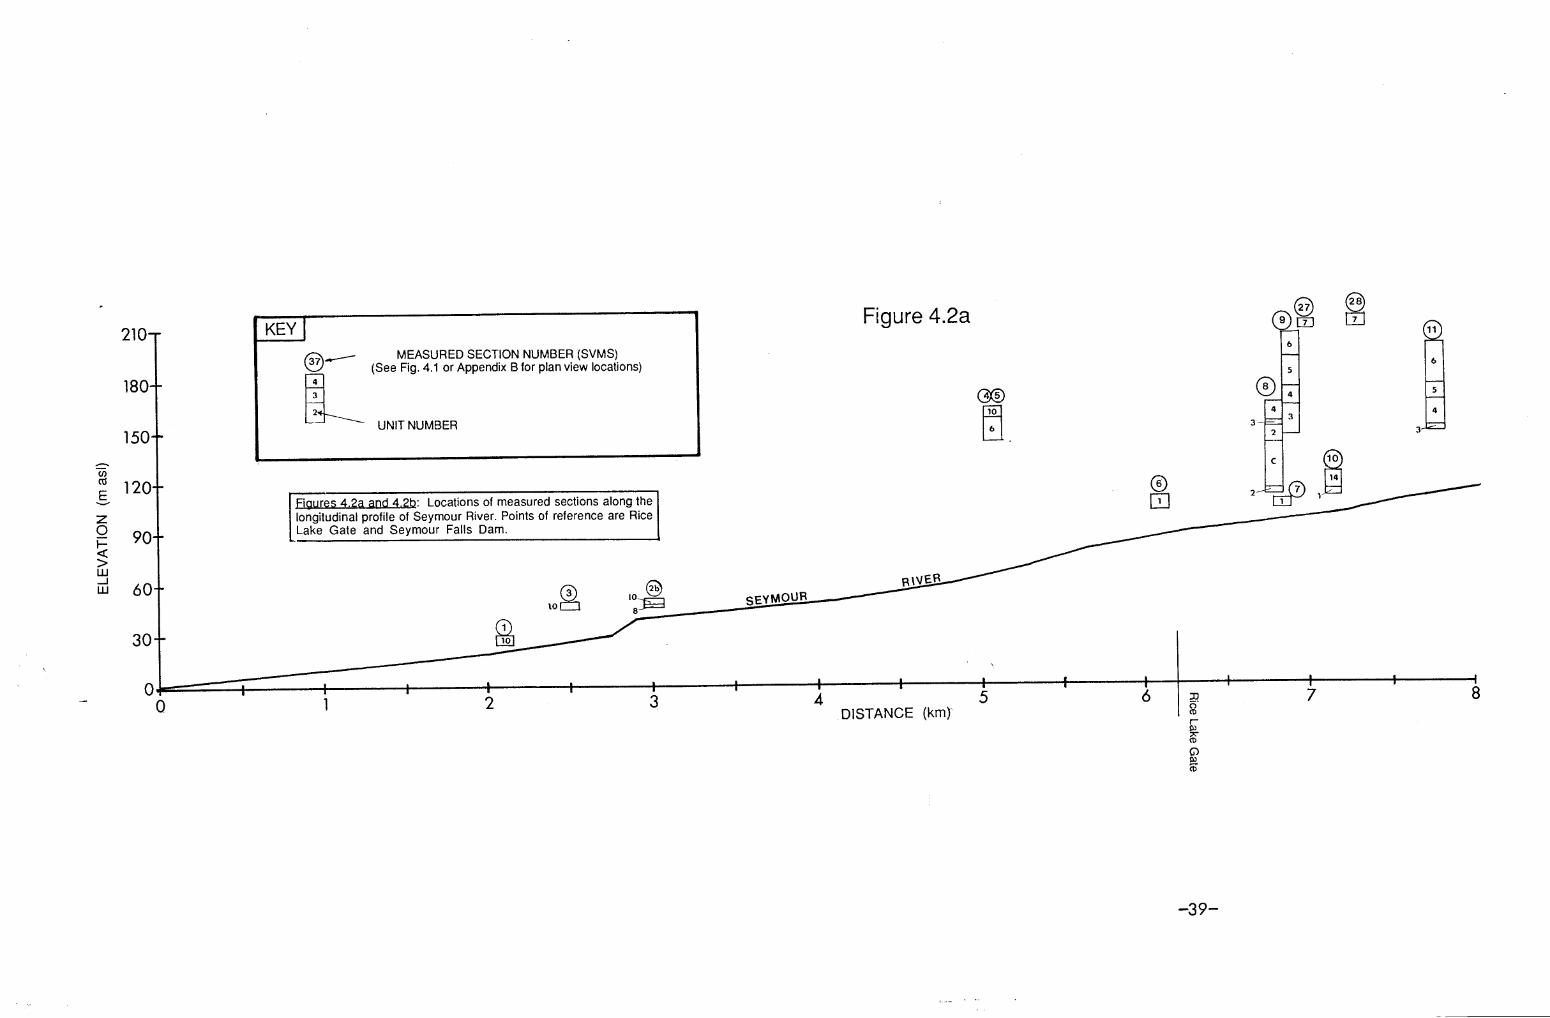
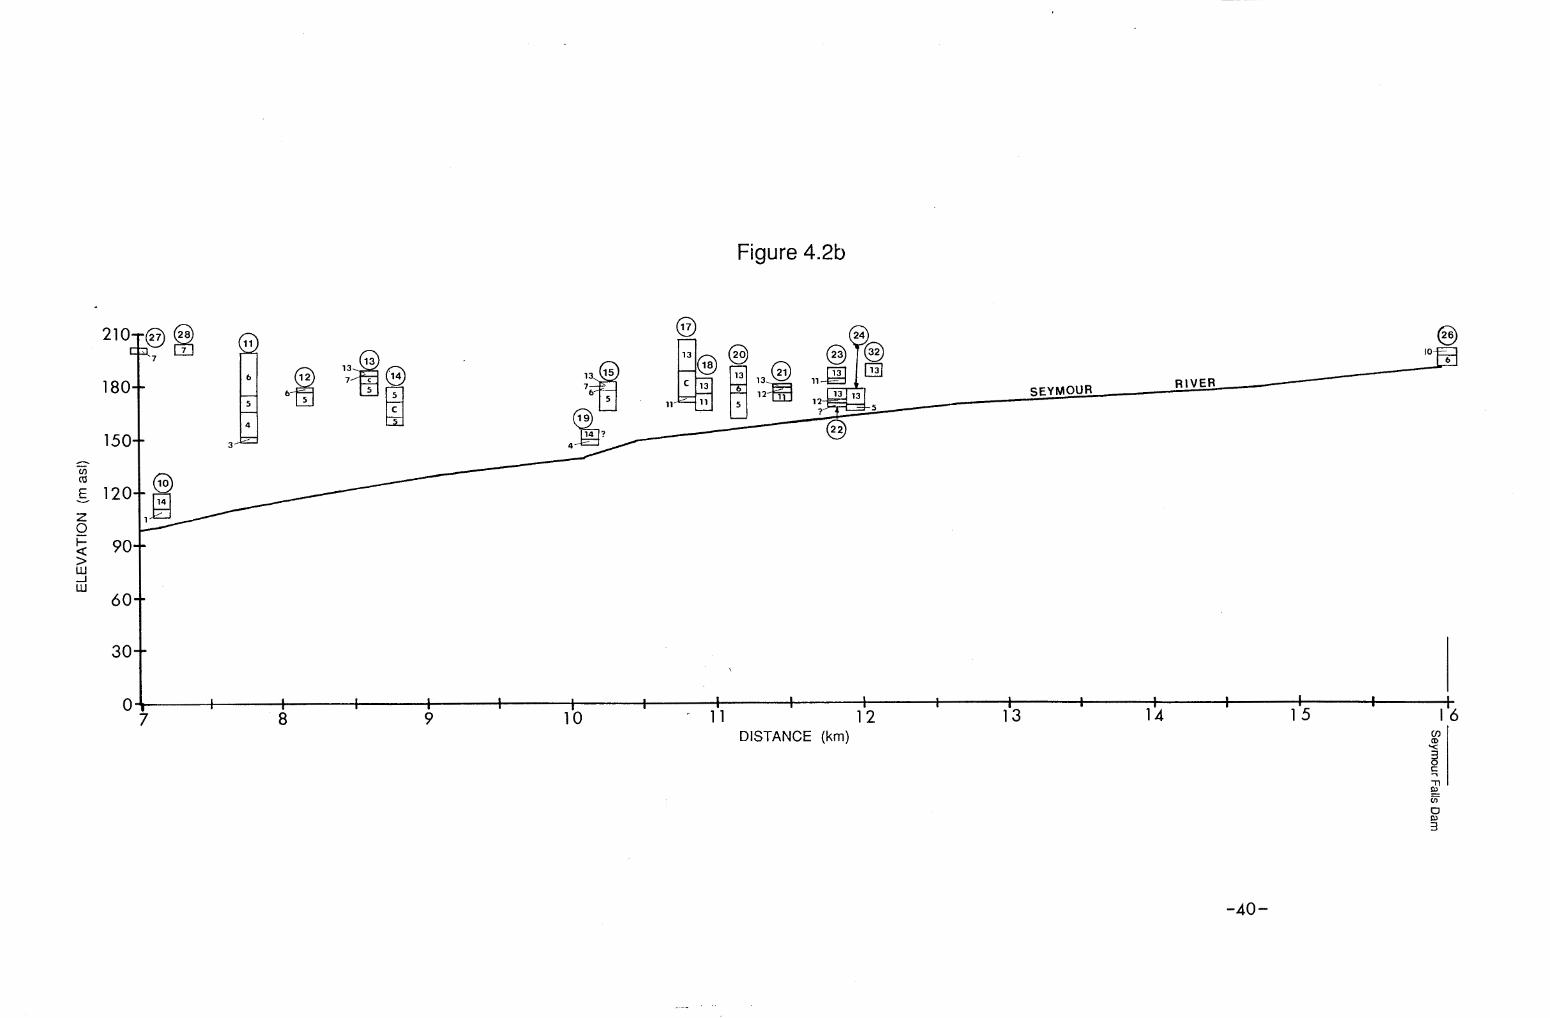
Figure 4.2b
DISTANCE (km)
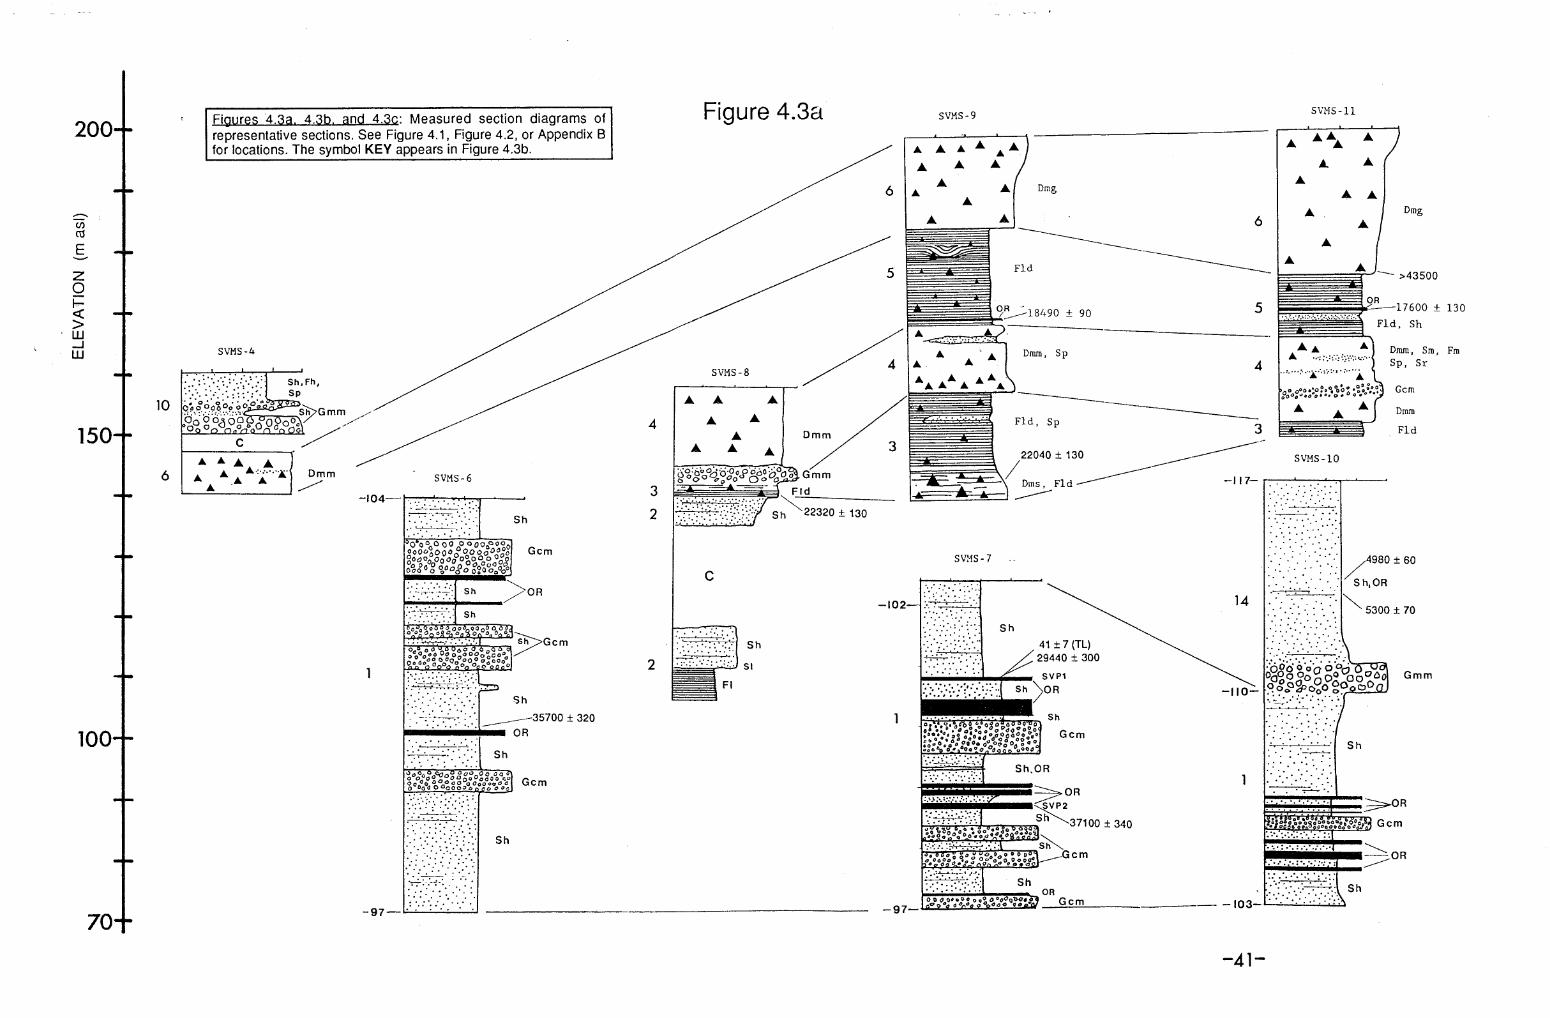
Fiaures 4.3a. 4.3b. and 4 . 3 ~ : Measured section diagrams of representative sections. See Figure 4.1, Figure 4.2, or Appendix B for locations. The symbol KEY appears in Figure 4.3b.
Figure 4.3a SVMS- 11 SVMS - 9
SVMS - 6
Gcrn
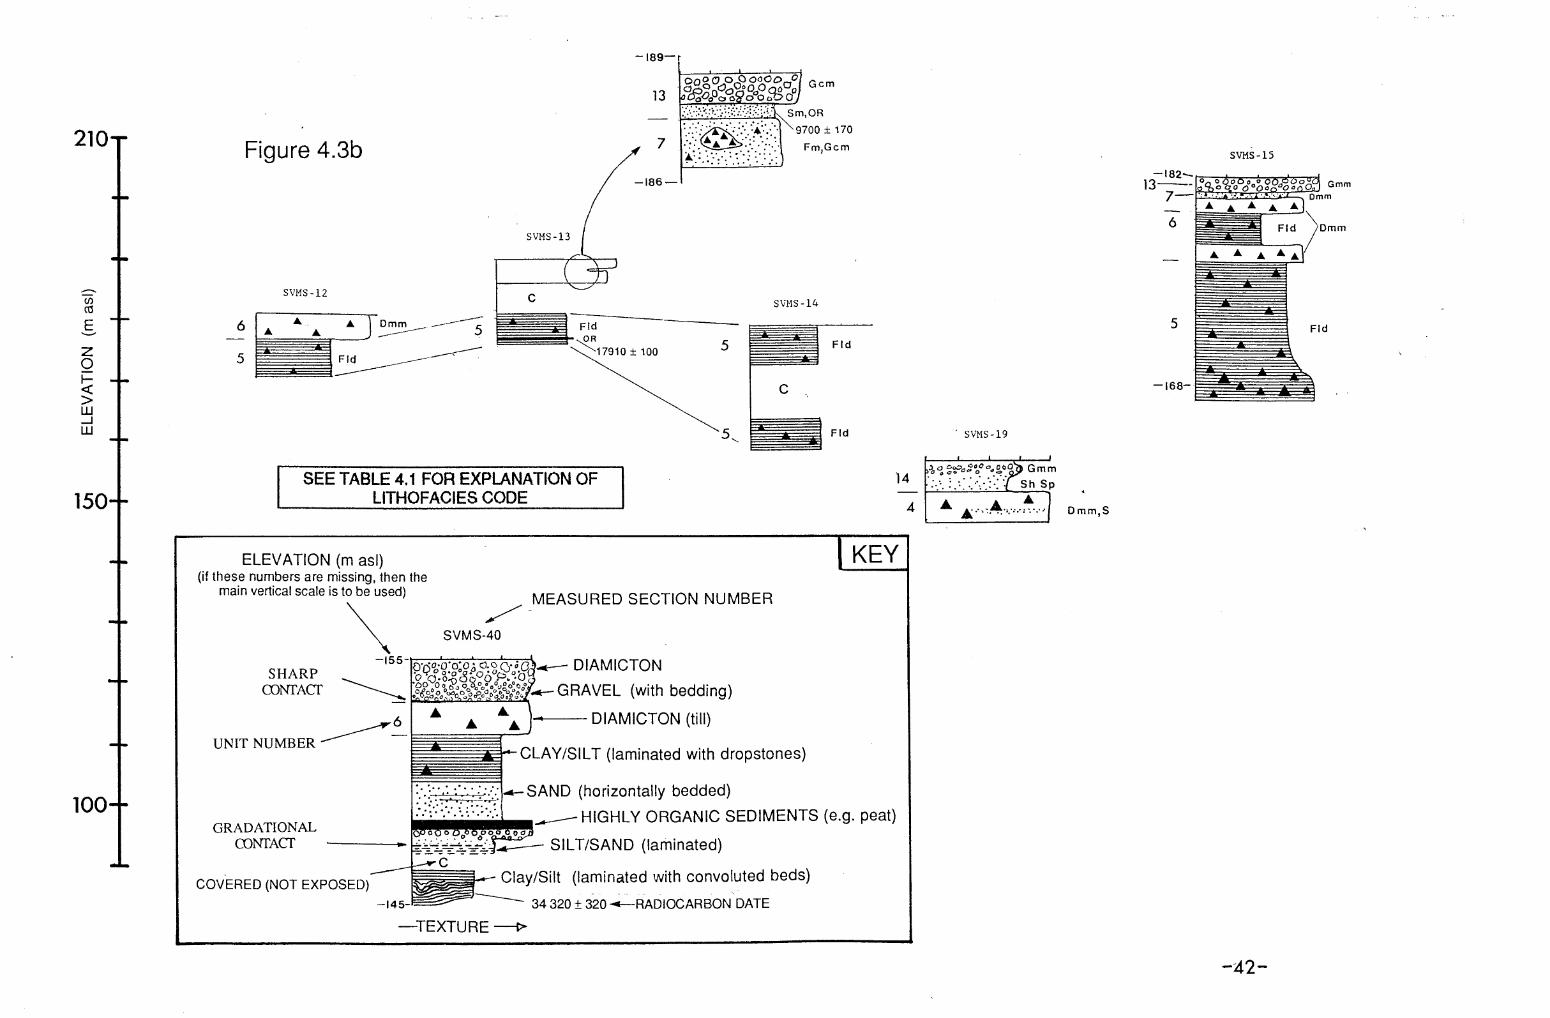
Figure 4.3b
SVMS - 1 2
I SEE TABLE 4.1 FOR EXPLANATION OF LITHOFACIES CODE 1
ELEVATION (m asl) (if these numbers are missing, then the
I KEY main vertical scale is to be used)
\ MEASURED SECTION NUMBER
4'
-155- SHARP DlAMlCTON
C O m A m \ - (with bedding)
UNIT NUMBER / - LAYISILT (laminated with dropstones)
I . . . . . - a :'::$.::+ .... -+. SAND (horizontally bedded) ...,.,.- ,... . - .. . - . . . . . . GRADATIONAL
-.---HIGHLY ORGANIC SEDIMENTS (e.g. peat)
CONTACT ---------c SILTISAND (laminated)
COVERED (NOT EXPOSED) ClayISilt (laminated with convoluted beds)
-145- A 34 320 + 320 +-RADIOCARBON DATE
'Id
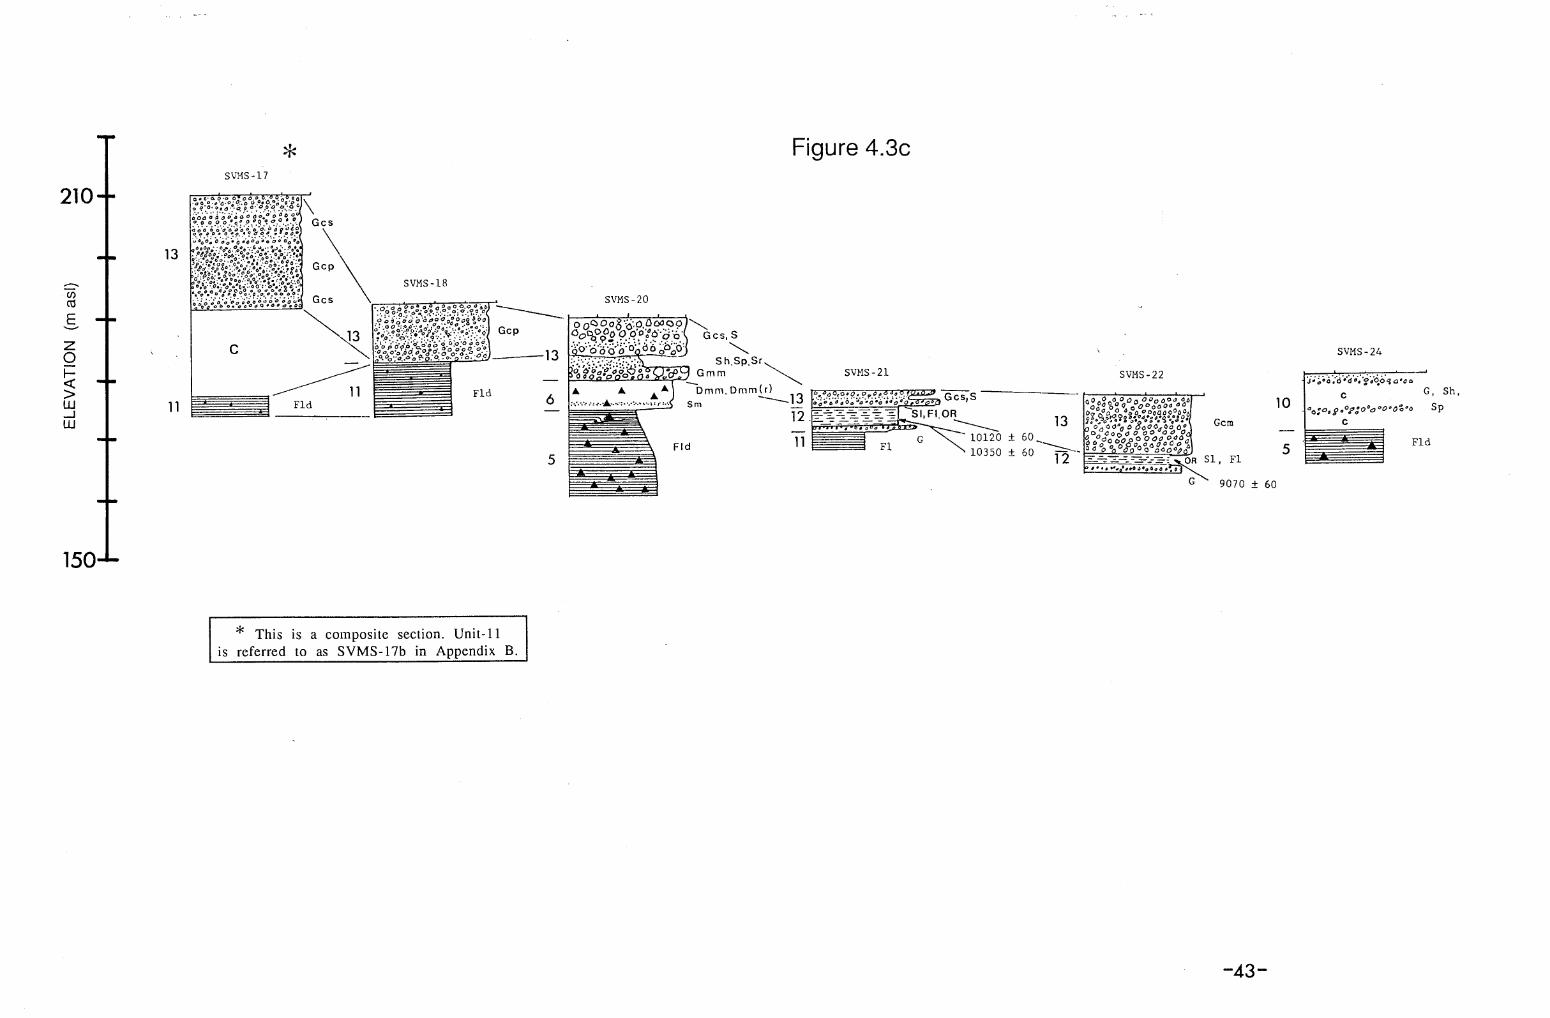
Figure 4 . 3 ~
* This is a composite section. Unit-11 is referred to as SVMS-17b in Appendix B.
SVMS - 20
SVMS - 24
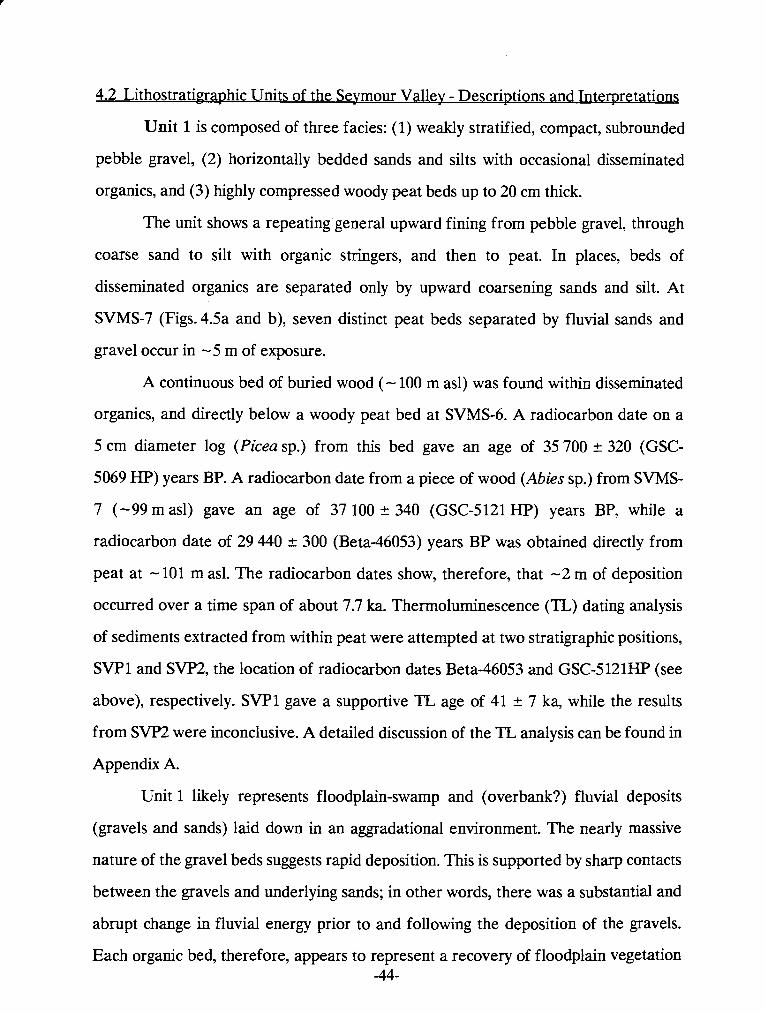
4.2 Lithostrati~raphic Units of the Seymour Valley - Descriptions and Interpretations
Unit 1 is composed of three facies: (1) weakly stratified, compact, subrounded
pebble gravel, (2) horizontally bedded sands and silts with occasional disseminated
organics, and (3) highly compressed woody peat beds up to 20 cm thick.
The unit shows a repeating general upward fining from pebble gravel, through
coarse sand to silt with organic stringers, and then to peat. In places, beds of
disseminated organics are separated only by upward coarsening sands and silt. At
SVMS-7 (Figs. 4.5a and b), seven distinct peat beds separated by fluvial sands and
gravel occur in -5 m of exposure.
A continuous bed of buried wood (- 100 m asl) was found within disseminated
organics, and directly below a woody peat bed at SVMS-6. A radiocarbon date on a
5 cm diameter log (Picea sp.) from this bed gave an age of 35 700 5 320 (GSC-
5069 HP) years BP. A radiocarbon date from a piece of wood (Abies sp.) from SVMS-
7 (-99 m asl) gave an age of 37 100 + 340 (GSC-5121 HP) years BP, while a
radiocarbon date of 29 440 t: 300 (Beta-46053) years BP was obtained directly from
peat at - 101 m asl. The radiocarbon dates show, therefore, that -2 m of deposition
occurred over a time span of about 7.7 ka. Thermoluminescence (TL) dating analysis
of sediments extracted from within peat were attempted at two stratigraphic positions,
SVPl and SVP2, the location of radiocarbon dates Beta-46053 and GSC-5121HP (see
above), respectively. SVPl gave a supportive TL age of 41 + 7 ka, while the results
from SVP2 were inconclusive. A detailed discussion of the TL analysis can be found in
Appendix A.
Unit 1 likely represents floodplain-swamp and (overbank?) fluvial deposits
(gravels and sands) laid down in an aggradational environment. The nearly massive
nature of the gravel beds suggests rapid deposition. This is supported by sharp contacts
between the gravels and underlying sands; in other words, there was a substantial and
abrupt change in fluvial energy prior to and following the deposition of the gravels.
Each organic bed, therefore, appears to represent a recovery of floodplain vegetation -44-
following a major aggradational (flood?) event. The horizontally bedded sands would
therefore represent relatively low-magnitude flood events.
The time spanned by the radiocabon dates from this unit suggest a very slow
rate of aggradation where each gravel bed represents an event of greater magnitude
than the previous.
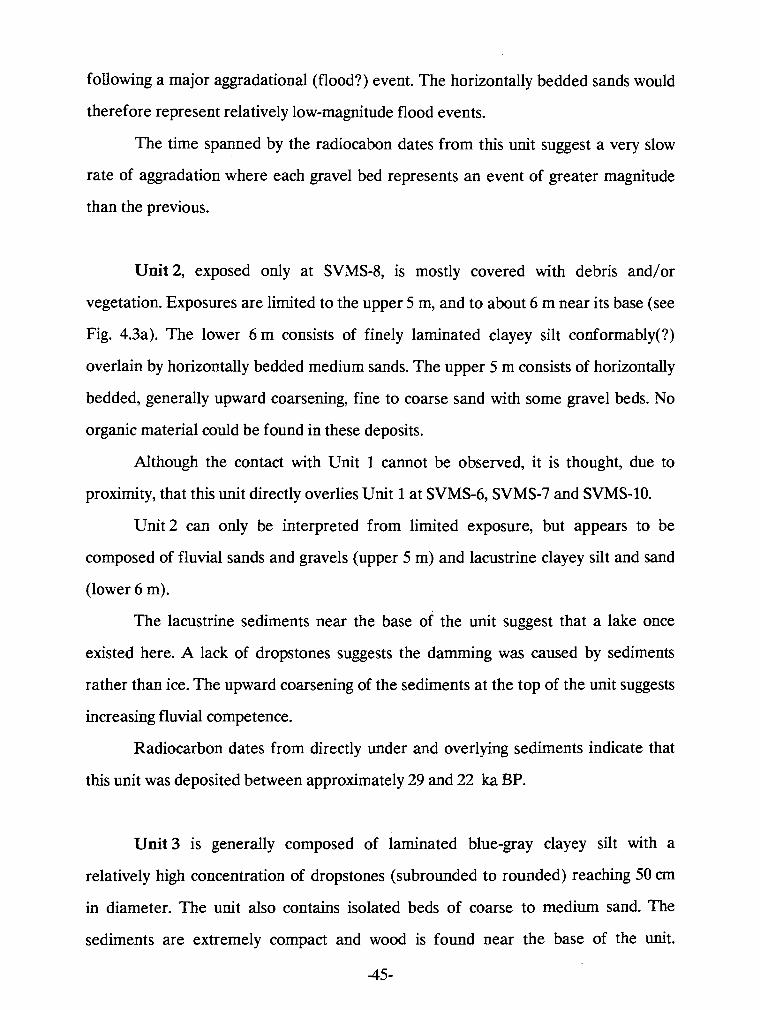
Unit 2, exposed only at SVMS-8, is mostly covered with debris and/or
vegetation. Exposures are limited to the upper 5 m, and to about 6 m near its base (see
Fig. 4.3a). The lower 6 m consists of finely laminated clayey silt conformably(?)
overlain by horizontally bedded medium sands. The upper 5 m consists of horizontally
bedded, generally upward coarsening, fine to coarse sand with some gravel beds. No
organic material could be found in these deposits.
Although the contact with Unit 1 cannot be observed, it is thought, due to
proximity, that this unit directly overlies Unit 1 at SVMS-6, SVMS-7 and SVMS-10.
Unit 2 can only be interpreted from limited exposure, but appears to be
composed of fluvial sands and gravels (upper 5 m) and lacustrine clayey silt and sand
(lower 6 m).
The lacustrine sediments near the base of the unit suggest that a lake once
existed here. A lack of dropstones suggests the damming was caused by sediments
rather than ice. The upward coarsening of the sediments at the top of the unit suggests
increasing fluvial competence.
Radiocarbon dates from directly under and overlying sediments indicate that
this unit was deposited between approximately 29 and 22 ka BP.
Unit 3 is generally composed of laminated blue-gray clayey silt with a
relatively high concentration of dropstones (subrounded to rounded) reaching 50 cm
in diameter. The unit also contains isolated beds of coarse to medium sand. The
sediments are extremely compact and wood is found near the base of the unit.
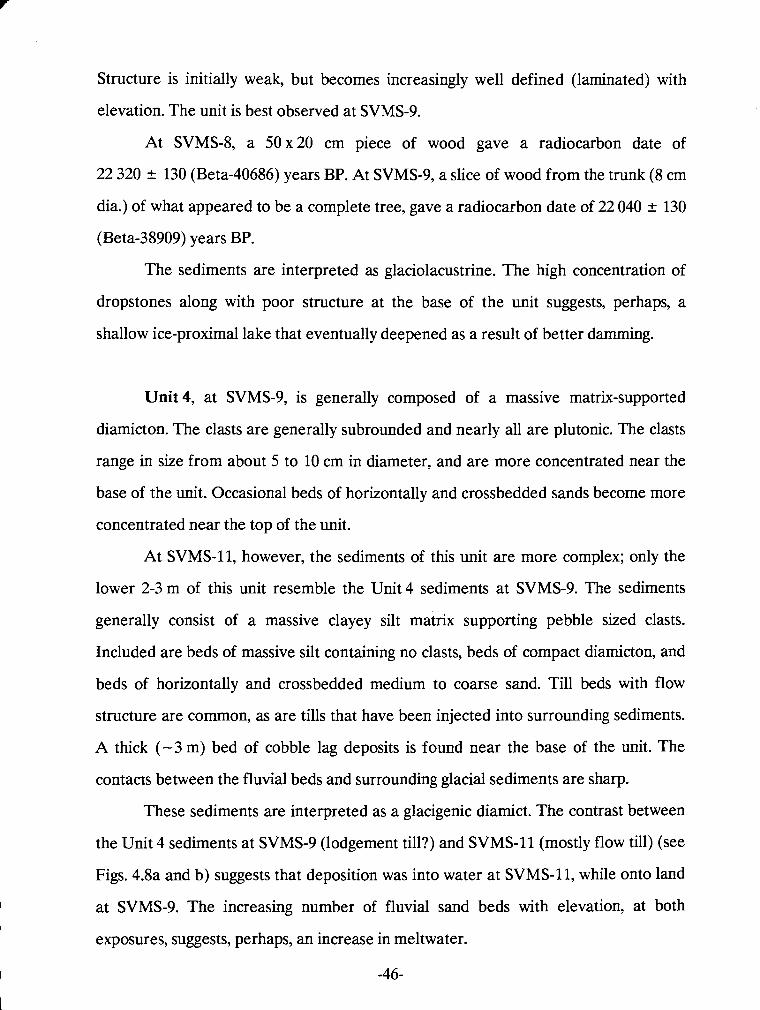
Structure is initially weak, but becomes increasingly well defined (laminated) with
elevation. The unit is best observed at SVMS-9.
At SVMS-8, a 50 x 20 cm piece of wood gave a radiocarbon date of
22 320 2 130 (Beta-40686) years BP. At SVMS-9, a slice of wood from the trunk (8 cm
dia.) of what appeared to be a complete tree, gave a radiocarbon date of 22 040 k 130
(Beta-38909) years BP.
The sediments are interpreted as glaciolacustrine. The high concentration of
dropstones along with poor structure at the base of the unit suggests, perhaps, a
shallow ice-proximal lake that eventually deepened as a result of better damming.
Unit 4, at SVMS-9, is generally composed of a massive matrix-supported
diamicton. The clasts are generally subrounded and nearly all are plutonic. The clasts
range in size from about 5 to 10 cm in diameter, and are more concentrated near the
base of the unit. Occasional beds of horizontally and crossbedded sands become more
concentrated near the top of the unit.
At SVMS-11, however, the sediments of this unit are more complex; only the
lower 2-3 m of this unit resemble the Unit 4 sediments at SVMS-9. The sediments
generally consist of a massive clayey silt matrix supporting pebble sized clasts.
Included are beds of massive silt containing no clasts, beds of compact diarnicton, and
beds of horizontally and crossbedded medium to coarse sand. Till beds with flow
structure are common, as are tills that have been injected into surrounding sediments.
A thick (-3 m) bed of cobble lag deposits is found near the base of the unit. The
contacts between the fluvial beds and surrounding glacial sediments are sharp.
These sediments are interpreted as a glacigenic diamict. The contrast between
the Unit 4 sediments at SVMS-9 (lodgement till?) and SVMS-11 (mostly flow till) (see
Figs. 4.8a and b) suggests that deposition was into water at SVMS-11, while onto land
at SVMS-9. The increasing number of fluvial sand beds with elevation, at both
exposures, suggests, perhaps, an increase in meltwater.
-46-
The shape of the clasts (subrounded) suggests that they were not transported
over a long distance. Rather, it appears that the clasts were reworked from fluvial
deposits from within Seymour Valley. This is supported by their lithology (virtually all
plutonic), i.e. a nonlocal ice source might be expected to deposit drift of a more varied
lithology.
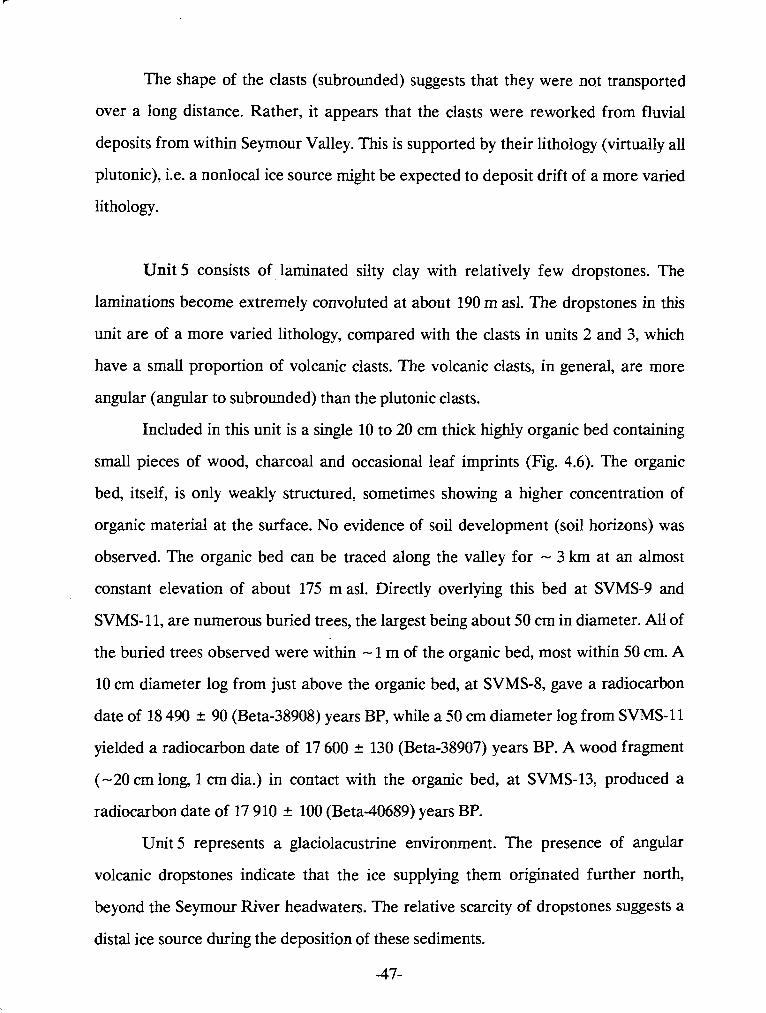
Unit 5 consists of laminated silty clay with relatively few dropstones. The
laminations become extremely convoluted at about 190 rn asl. The dropstones in this
unit are of a more varied lithology, compared with the clasts in units 2 and 3, which
have a small proportion of volcanic clasts. The volcanic clasts, in general, are more
angular (angular to subrounded) than the plutonic clasts.
Included in this unit is a single 10 to 20 crn thick highly organic bed containing
small pieces of wood, charcoal and occasional leaf imprints (Fig. 4.6). The organic
bed, itself, is only weakly structured, sometimes showing a higher concentration of
organic material at the surface. No evidence of soil development (soil horizons) was
observed. The organic bed can be traced along the valley for - 3 km at an almost
constant elevation of about 175 masl. Directly overlying this bed at SVMS-9 and
SVMS-11, are numerous buried trees, the largest being about 50 cm in diameter. All of
the buried trees observed were within - 1 m of the organic bed, most within 50 cm. A
10 cm diameter log from just above the organic bed, at SVMS-8, gave a radiocarbon
date of 18 490 + 90 (Beta-38908) years BP, while a 50 cm diameter log from SVMS-11
yielded a radiocarbon date of 17 600 k 130 (Beta-38907) years BP. A wood fragment
(-20 cm long, 1 cm dia.) in contact with the organic bed, at SVMS-13, produced a
radiocarbon date of 17 910 k 100 (Beta-40689) years BP.
Unit 5 represents a glaciolacustrine environment. The presence of angular
volcanic dropstones indicate that the ice supplying them originated further north,
beyond the Seymour River headwaters. The relative scarcity of dropstones suggests a
distal ice source during the deposition of these sediments.
-47-
The presence of the highly organic bed directly below numerous buried trees,
near the base of this unit, suggests a major climatic recovery subsequent to the initial
advance and apparent retreat of the ice. The radiocarbon dates indicate that a
substantial forest had been established by about 18 ka BP.
The organic bed probably is probably derived from a soil that had developed
on higher ground (floodplain) subsequent to the retreat of the ice. As the water-level
rose in response to the readvancing ice, the soil would have been reworked and
deposited in the lake.
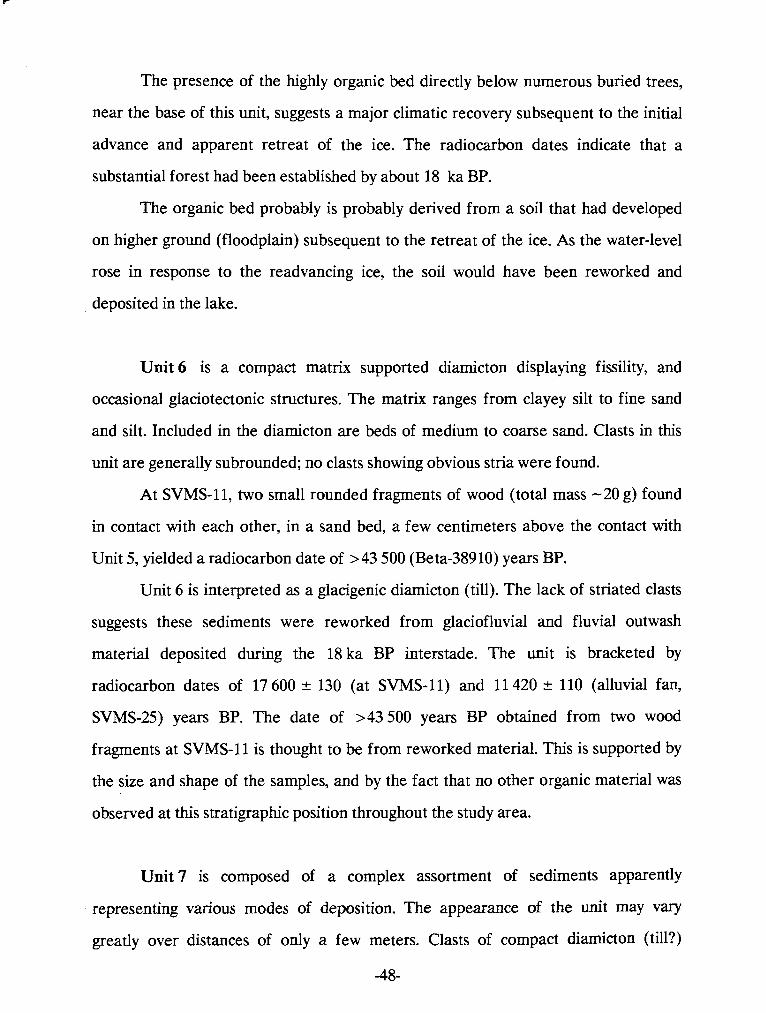
Unit 6 is a compact matrix supported diamicton displaying fissility, and
occasional glaciotectonic structures. The matrix ranges from clayey silt to fine sand
and silt. Included in the diamicton are beds of medium to coarse sand. Clasts in this
unit are generally subrounded; no clasts showing obvious stria were found.
At SVMS-11, two small rounded fragments of wood (total mass -20 g) found
in contact with each other, in a sand bed, a few centimeters above the contact with
Unit 5, yielded a radiocarbon date of > 43 500 (Beta-38910) years BP.
Unit 6 is interpreted as a glacigenic diamicton (till). The lack of striated clasts
suggests these sediments were reworked from glaciofluvial and fluvial outwash
material deposited during the 18 ka BP interstade. The unit is bracketed by
radiocarbon dates of 17 600 2 130 (at SVMS-11) and 11 420 -c 110 (alluvial fan,
SVMS-25) years BP. The date of >43 500 years BP obtained from two wood
fragments at SVMS-11 is thought to be from reworked material. This is supported by
the size and shape of the samples, and by the fact that no other organic material was
observed at this stratigraphic position throughout the study area.
Unit 7 is composed of a complex assortment of sediments apparently
representing various modes of deposition. The appearance of the unit may vary
greatly over distances of only a few meters. Clasts of compact diamicton (till?)
-48-

supported by stratified sands are common, as are clasts of sands and silt (often having
retained their internal structure) supported by more compact massive pebble gravels.
Beds may be extremely convoluted, and sometimes are positioned vertically. Plutonic
and volcanic clasts (up to - 1 m diameter) supported by a variety of matrices are also
common, as are beds of laminated silt and clay showing glaciotectonic features. These
sediments are exposed immediately north of Rice Lake in roadcuts. Here sediments
were apparently deposited subaqueously in a plastic state (see Fig. 4.7a). Additional
exposures of these sediments are found in roadcuts along Seymour Mainline.
Unit 7 clearly represents sediments associated with recession and wasting of
ice. The appearance of this unit varies greatly from place to place. It may however,
generally be interpreted as ablation till (flow till and melt-out till). For detailed
discussions about the genesis of these types of deposits see, for example, Boulton
(1972); Halderson and Shaw (1982); Shaw (1982); Krainer and Poscher (1990);
Brodzikowski and Van Loon (1991). Where these sediments are exposed north of Rice
Lake the topography is hummocky suggesting meltout in a supraglacial lake, rather
than in a marine environment where wave action would have eventually "smoothed"
the landscape.
There are no radiocarbon dates directly associated with this unit. At SVMS-10,
however, a radiocarbon date from charcoal fragments extracted from sediments
directly overlying this unit shows that it was deposited more than 9700 years BP.
Unit 8 is composed of massive stoney clay, sometimes interbedded with sand
or pebble gravel. The clay is not compact and can easily be carved with a trowel when
wet. The stones contained within the clay have diameters of less than 1 cm. These
deposits have only been found in the lower portions of the study area (limited
exposures at SVMS-2a and SVMS-2b).
Unit 8 is interpreted as a glaciomarine clay. This is supported by its lack of
structure and low density. The presence of relatively few (small) dropstones suggests
-49-
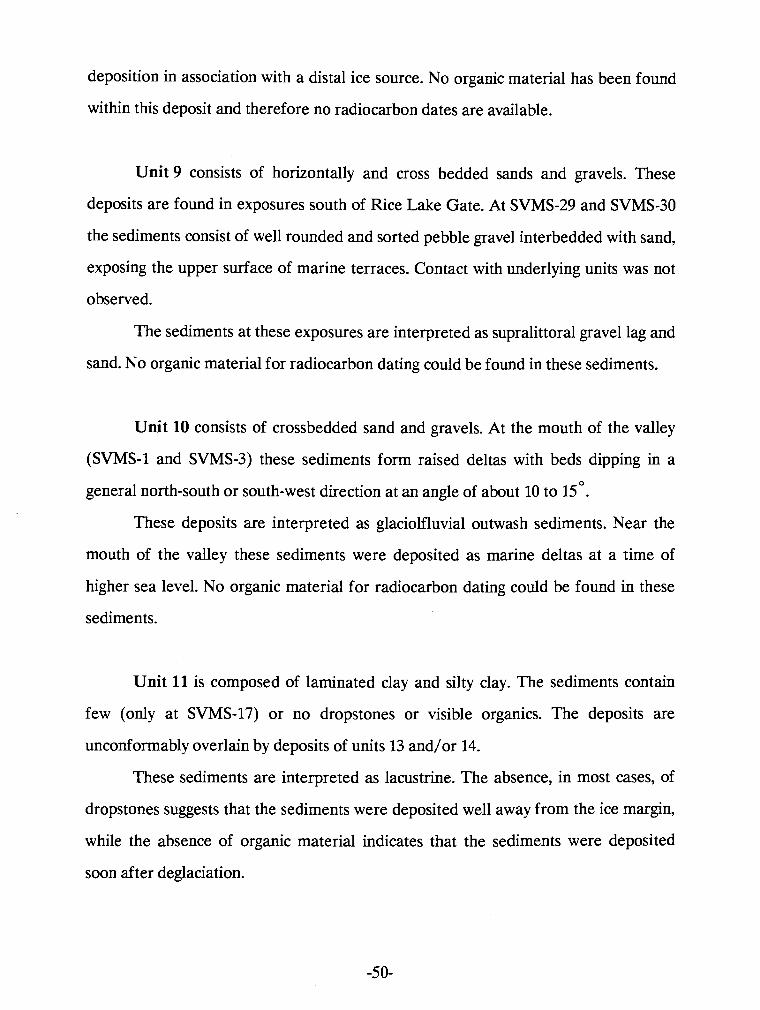
deposition in association with a distal ice source. No organic material has been found
within this deposit and therefore no radiocarbon dates are available.
Unit 9 consists of horizontally and cross bedded sands and gravels. These
deposits are found in exposures south of Rice Lake Gate. At SVMS-29 and SVMS-30
the sediments consist of well rounded and sorted pebble gravel interbedded with sand,
exposing the upper surface of marine terraces. Contact with underlying units was not
observed.
The sediments at these exposures are interpreted as supralittoral gravel lag and
sand. No organic material for radiocarbon dating could be found in these sediments.
Unit 10 consists of crossbedded sand and gravels. At the mouth of the valley
(SVMS-1 and SVMS-3) these sediments form raised deltas with beds dipping in a
general northsouth or south-west direction at an angle of about 10 to 15'.
These deposits are interpreted as glaciolfluvial outwash sediments. Near the
mouth of the valley these sediments were deposited as marine deltas at a time of
higher sea level. No organic material for radiocarbon dating could be found in these
sediments.
Unit 11 is composed of laminated clay and silty clay. The sediments contain
few (only at SVMS-17) or no dropstones or visible organics. The deposits are
unconformably overlain by deposits of units 13 and/or 14.
These sediments are interpreted as lacustrine. The absence, in most cases, of
dropstones suggests that the sediments were deposited well away from the ice margin,
while the absence of organic material indicates that the sediments were deposited
soon after deglaciation.
Unit 12 is composed of organic rich, horizontally bedded sand and silt. At
SVMS-21, at the contact with Unit 11, is a bed of gravel lag (Fig. 6.2a).
Two pieces of wood from the base of this unit, at SVMS-23, gave radiocarbon
dates of 10 120 2 60 (Beta-38911) and 10 350 + 60 (Beta-38912) years BP. At SVMS-
22, a log (10 cm dia.) gave a radiocarbon date of 9070 2 60 (Beta-38913) years BP.
These sediments are interpreted a lacustrine. The presence of an underlying
gravel lag at SVMS-21 suggests that these sediments were deposited, in this case, in an
abandoned or dammed channel.
Unit 13 consists of matrix and clast supported diamicton (Fig. 6.2a). In some
sections the sediments show bedding, while in other sections the sediments are
massive. Imbrication is often observed, suggesting paleoflow roughly perpendicular to
the valley axis. The sediments are extremely loose and can be pulled apart easily. The
clasts generally are angular to subangular. At most of the exposures where this unit
was observed, the diamicton is interbedded with weakly structured organic loamy sand
containing pebbles and usually beds of charcoal fragments. At SVMS-17 and SVMS-
18, however, the clasts are crossbedded, well sorted, and rounded to well rounded.
The deposits form aprons along the valley sides and alluvial fans (Fig. 4.10b)
emanating from tributary valleys. Where the deposits form fans, the sediments are
exposed at the banks of tributary streams which have incised into them. The deposits
are (or were, before logging) generally covered with mature forest.
At SVMS-25 charcoal fragments from a sand bed contained within diamicton
fan deposits (Fig. 6.2a) yielded a radiocarbon date of 11 420 -1- 110 (Beta-40687) years
BP, while at SVMS-13 charcoal fragments from similar sediments below the
diamicton, gave a radiocarbon date of 9700 2 170 (Beta-40690) years BP.
The sediments of Unit 13 are interpreted as paraglacial; that is, they are the
result of the reworking of former glacial sediments subsequent to the retreat of the
valley ice. The general shape of the clasts and the general lack large organic material
-5 1-
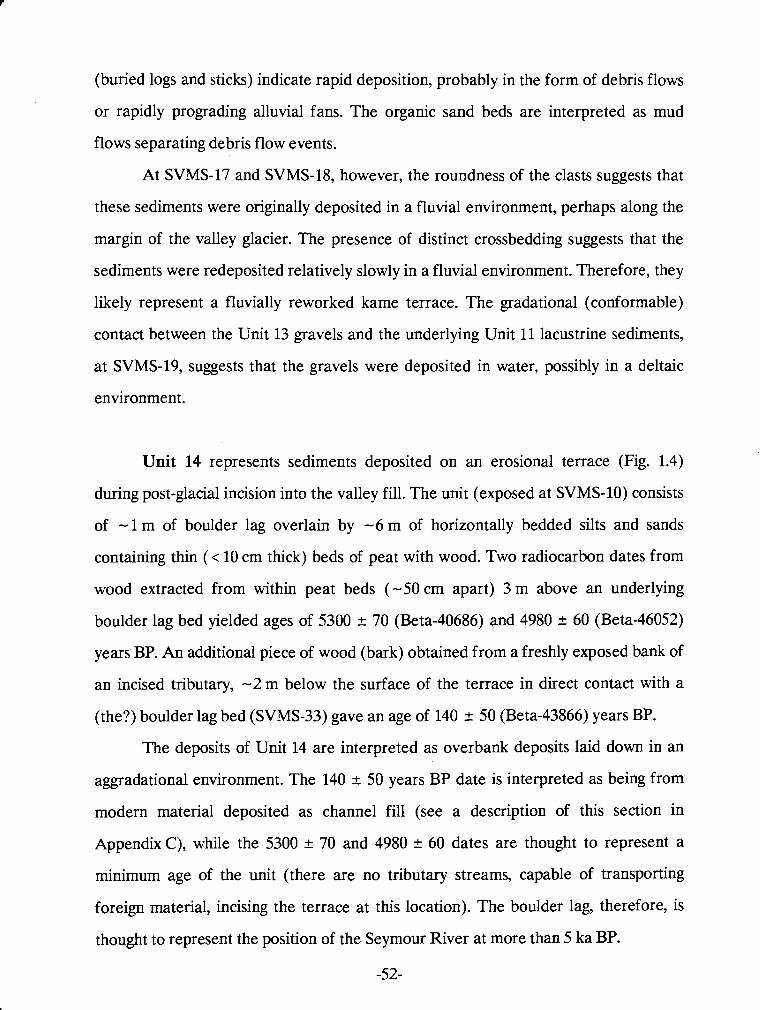
(buried logs and sticks) indicate rapid deposition, probably in the form of debris flows
or rapidly prograding alluvial fans. The organic sand beds are interpreted as mud
flows separating debris flow events.
At SVMS-17 and SVMS-18, however, the roundness of the clasts suggests that
these sediments were originally deposited in a fluvial environment, perhaps along the
margin of the valley glacier. The presence of distinct crossbedding suggests that the
sediments were redeposited relatively slowly in a fluvial environment. Therefore, they
likely represent a fluvially reworked kame terrace. The gradational (conformable)
contact between the Unit 13 gravels and the underlying Unit 11 lacustrine sediments,
at SVMS-19, suggests that the gravels were deposited in water, possibly in a deltaic
environment.
Unit 14 represents sediments deposited on an erosional terrace (Fig. 1.4)
during post-glacial incision into the valley fill. The unit (exposed at SVMS-10) consists
of -1 m of boulder lag overlain by -6 m of horizontally bedded silts and sands
containing thin (< 10 cm thick) beds of peat with wood. Two radiocarbon dates from
wood extracted from within peat beds (-50 cm apart) 3 m above an underlying
boulder lag bed yielded ages of 5300 + 70 (Beta-40686) and 4980 k 60 (Beta-46052)
years BP. An additional piece of wood (bark) obtained from a freshly exposed bank of
an incised tributary, -2 m below the surface of the terrace in direct contact with a
(the?) boulder lag bed (SVMS-33) gave an age of 140 + 50 (Beta-43866) years BP.
The deposits of Unit 14 are interpreted as overbank deposits laid down in an
aggradational environment. The 140 2 50 years BP date is interpreted as being from
modem material deposited as channel fill (see a description of this section in
Appendix C), while the 5300 k 70 and 4980 2 60 dates are thought to represent a
minimum age of the unit (there are no tributary streams, capable of transporting
foreign material, incising the terrace at this location). The boulder lag, therefore, is
thought to represent the position of the Seymour River at more than 5 ka BP.
-52-

0.0 0.4 0.8 1.2 1.6 kilometers
0.0 0.4 0.8 1.2 1.6
Figures 4.4a. b. c. and d. Composite cross-sectional diagrams showing the stratigraphy of the Seymour Valley. The circled numbers represent the unit numbers. BR = bedrock; the heavy dashed line in Figure 4.3b shows the approximate position of the "18 Ka BP organic bed". The locality of each cross-section can be found in Figure 4.1. Solid lines represent observed contacts and the dashed lines show the observed extent of the unit in question.
- - -
210- -210
1 1 1 1 1 1 1 1 1 1 1 1 1 1 1 1 1 1 1 1 1 1 1 1 1 1 1 1 1 1 , 1 1 1 1 1 1 1 1
Seymour Valley Cross Section A
- -
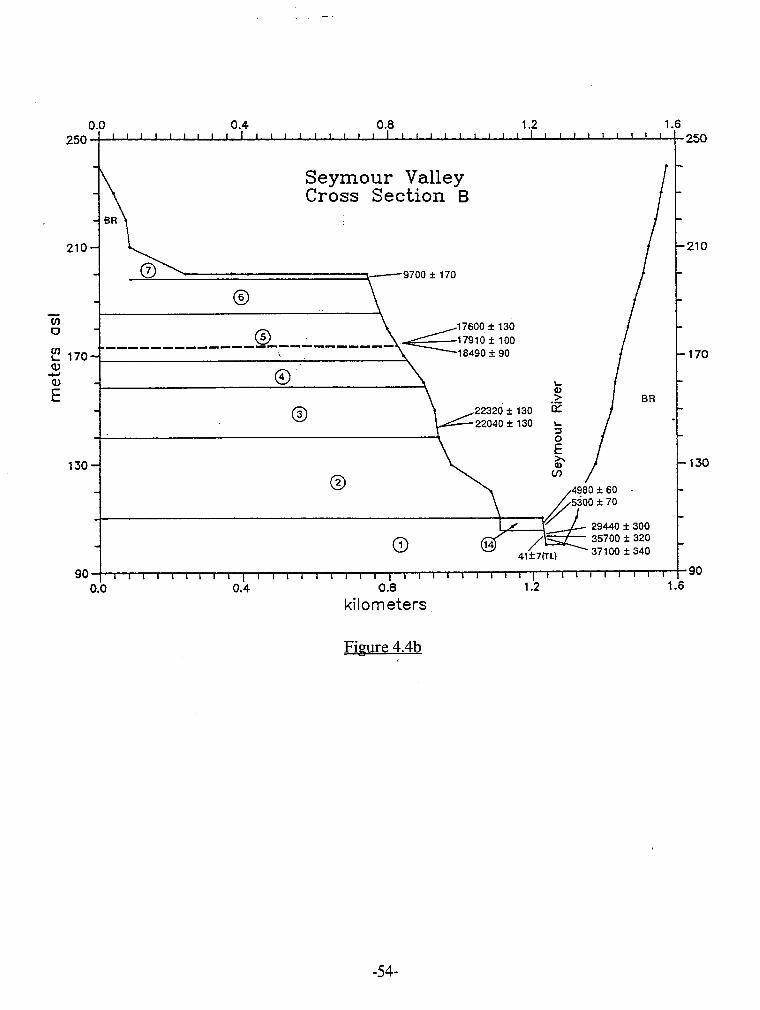
0.0 0.4 0.8 1.2 1.6 250 I t l l l l l r l l l l I l l l 1 1 1 l 1 1 1 1 1 1 1 1 1 1 1 l l l l l l l l 250
Seymour Valley Cross Section B
-210
- - rn 0 - k! 170-. Q, &
E - -
130-
- - d
90 0.0
@
0 - -
I----------------------
-170
@ L - 0) >
0 - - - 1 3 0
0
41k7(TL) 37100 * 340 I I I I ~ I I I I ~ I I I I ~ I I I I ~ I I I I I I I I I I I ~ ~ I ~ I I I ~ 90
0.4 0.8 1.2 1.6
kilometers
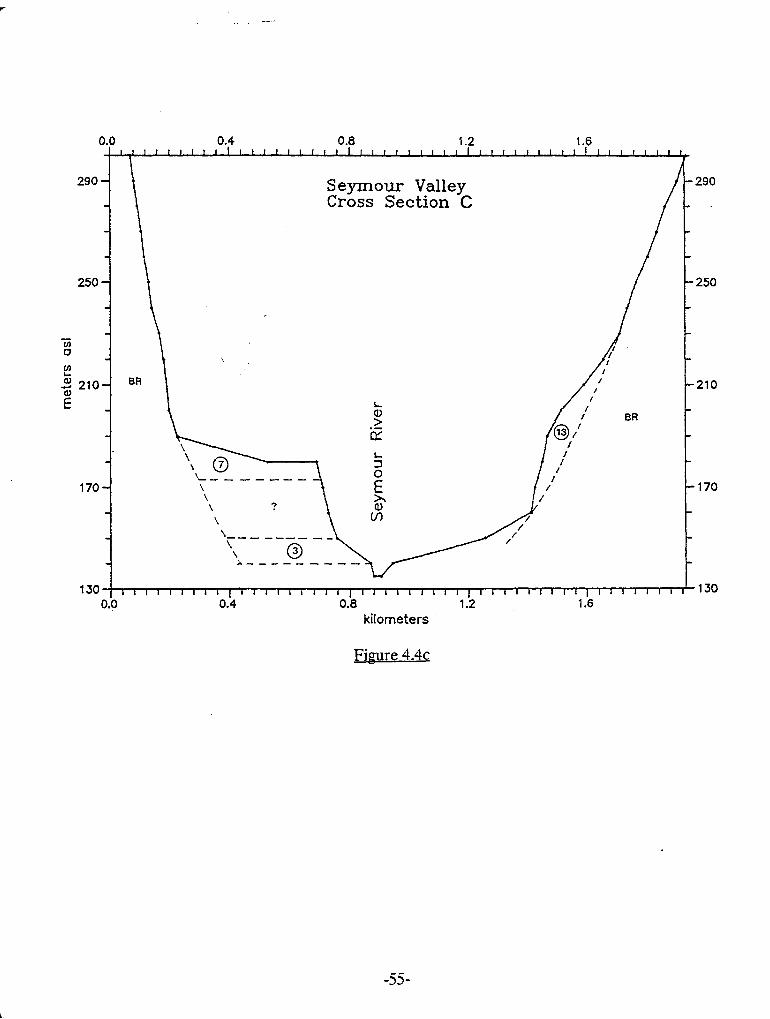
0.0 0.4 0.8 1.2 1.6
Seymour Valley Cross Section C
-
-210
- -
170- - 170 -
\ -
- - - -
130 I I I I I I I I I I I I I I I I I I I I I I I I I I I I I I I I I I I I I I I I I I I I I I I I 130 0.0 0.4 0.8 1.2 1.6
kilometers
Figure 4.4~
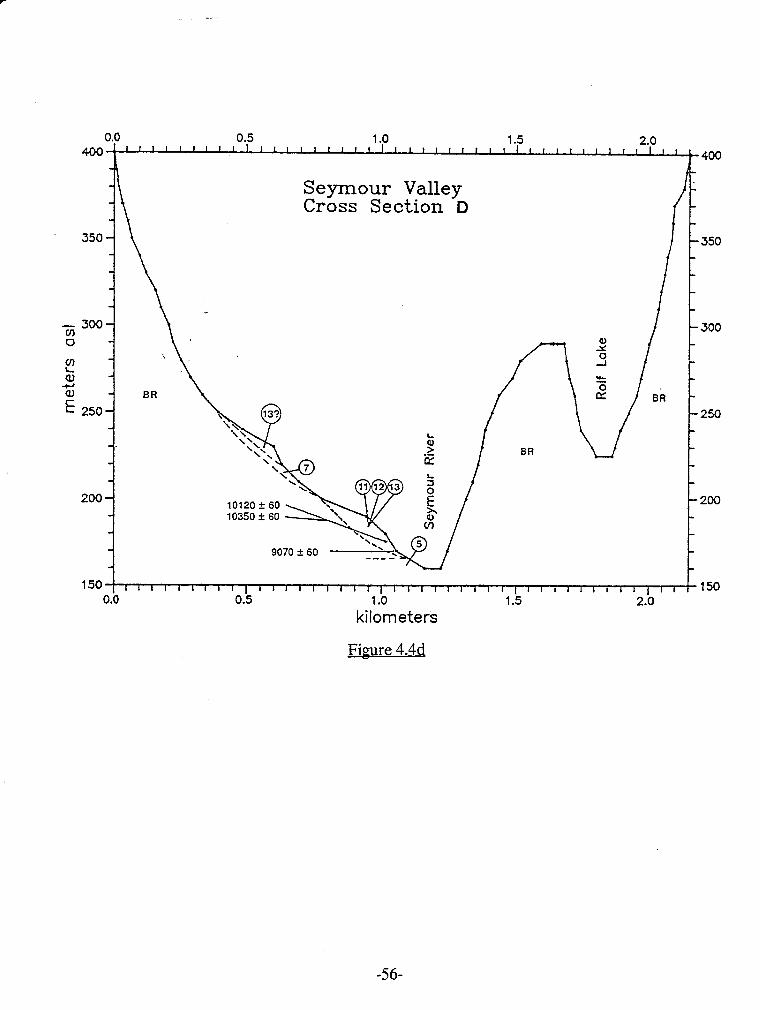
Seymour Valley Cross Section D
1 5 0 ~ 1 1 1 1 1 1 1 1 1 1 1 1 1 1 l l l l l l l l l l l l l l l l l l l l l l l i l ( l l l 150 0.0 0.5 1 .O 1.5 2.0
kilometers
Figure 4.4d
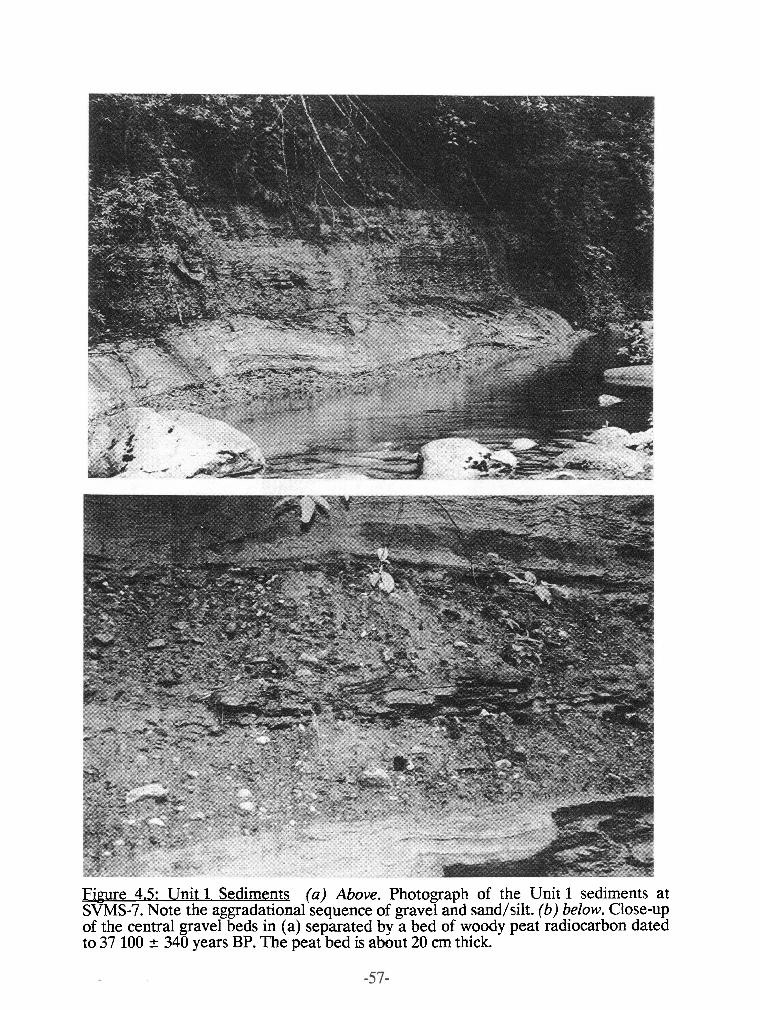
Fi-me 4.5: Unit 1 Sediments (a) Above. Photograph of the Unit 1 sediments at SVMS-7. Note the aggradational sequence of gravel and sand/silt. (b) below. Close-up of the central gravel beds in (a) separated by a bed of woody peat radiocarbon dated to 37 100 2 340 years BP. The peat bed is about 20 cm thick.
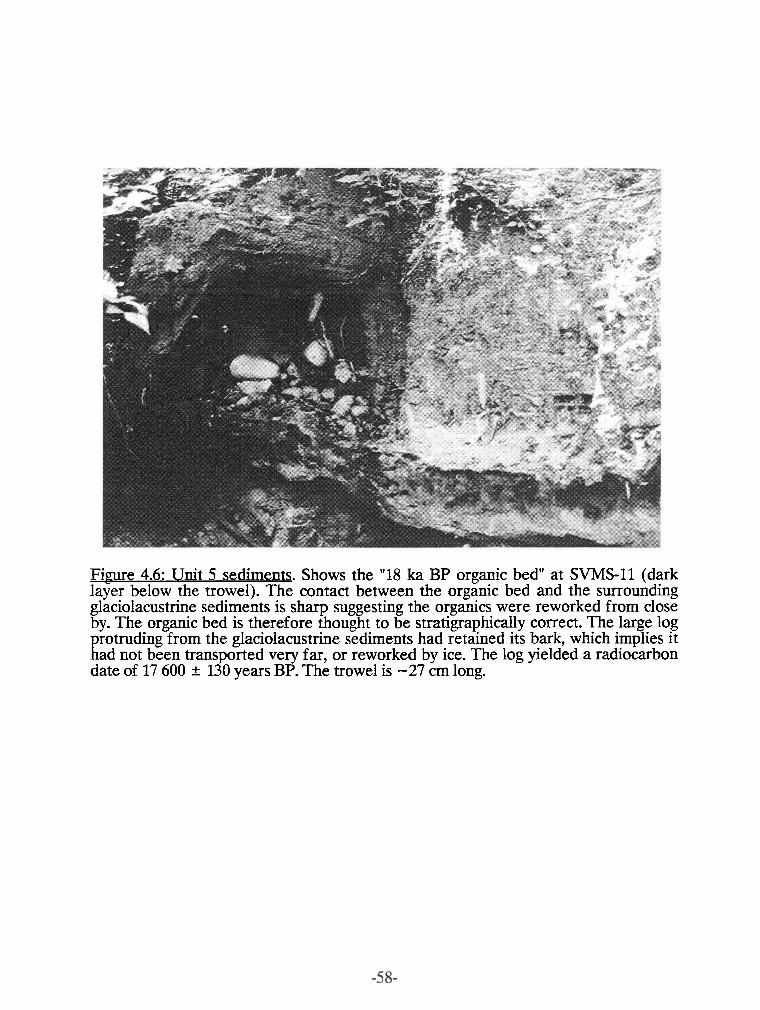
Fi-me 4.6: Unit 5 sediments. Shows the "18 ka BP organic bed" at SVMS-11 (dark layer below the trowel). The contact between the organic bed and the surrounding glaciolacustrine sediments is sharp suggesting the organics were reworked from close by. The organic bed is therefore thought to be stratigraphically correct. The large log protruding from the glaciolacustrine sediments had retained its bark, which implies it had not been transported very far, or reworked by ice. The log yielded a radiocarbon date of 17 600 + 130 years BP. The trowel is -27 crn long.
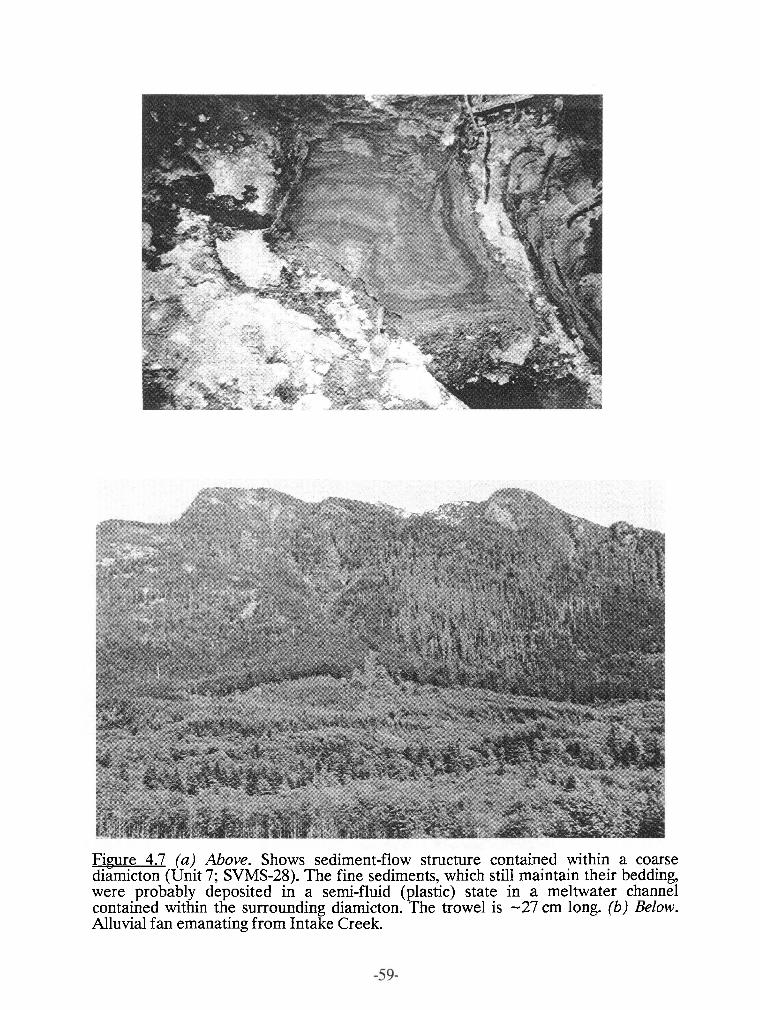
Figure 4.7 (a) Above. Shows sediment-flow structure contained within a coarse diamicton (Unit 7; SVMS-28). The fine sediments, which still maintain their bedding, were probably deposited in a semi-fluid (plastic) state in a meltwater channel contained within the surrounding diamicton. The trowel is -27 cm long. (6) Below. Alluvial fan emanating from Intake Creek.
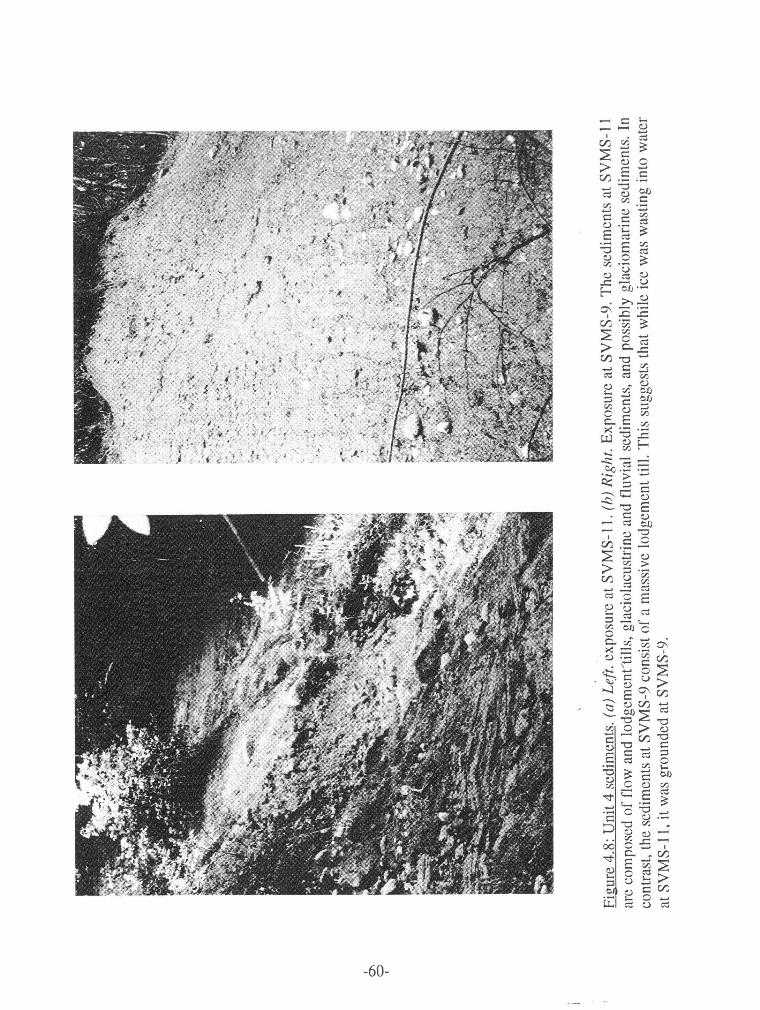
CHAPTER 5
GEOCHRONOLOGY OF LOWER SEYMOUR VALLEY
5.1 Introduction
This chapter presents the apparent geochronology or sedimentary history of
lower Seymour Valley based on interpretations of the measured sections discussed in
Chapter 4. The sedimentology of the units used as evidence for the proposed
geochronology is sometimes reviewed to aid discussion. Detailed descriptions and
interpretations of all the stratigraphic units can be found in Chapter 4. The general
sequence of events from -37 ka until - 12 ka BP is depicted in Figure 5.1. A summary
of the radiocarbon dates obtained during the course of this research appears in
Table 5.1 at the end of this chapter.
5.2 >37 000 to 29 000 vears BP
The oldest sediments exposed in Seymour Valley are those of Unit 1. The unit
is aggradational in nature and generally consists of compressed peat beds separated by
fluvial silt, sand and gravel. No evidence of a glacial origin can be seen in any of the
associated sediments. No underlying sediments representing a previous glaciation are
exposed. Radiocarbon dating has shown that these (exposed) sediments were
deposited over a time period of more than 8 ka, deposition commencing more than 37
ka BP.
The nature of the deposits show that the area of the Seymour Valley
immediately north of the bedrock canyon once was occupied by a low energy
environment (swamp?) that periodically experienced high energy fluvial incursion
resulting in aggradation. The rate of aggradation increased dramatically sometime
after 29 ka BP in response to the onset of glaciation.
5.3 -29 000 to 22 000 years BP
As ice began to advance, increased sediment supply caused Seymour River to -6 1-
aggrade. Between about 29 and 22 ka BP lacustrine and fluvial sediments (Unit 2)
were deposited in the Seymour Valley. The deposits are about 30 m thick and are
exposed at SVMS-8. The presence of fine lacustrine sediments at the base of Unit 2
suggests that the valley was being dammed, possibly by outwash sands accumulating
near the mouth of Seymour Valley, perhaps in the constricted bedrock canyon.
Outwash sands are suggested as the damming agent, rather than ice, because of the
absence of dropstones in the lower lacustrine sediments. The lake eventually filled
with lacustrine and finally upward coarsening fluvial sands and gravels from the
advancing Seymour Valley glacier.
Since ice moving into the Fraser Lowland from the northeast and northwest
would have been fed from higher source areas, it is conceivable that ice from those
areas could have reached the mouth of the Seymour Valley before the Seymour
Valley glacier did (ice from the northeast probably reached the mouth of Seymour
Valley first; the northeastern source areas are closer and the flow paths would have
been more direct). If this was indeed the case then it is likely that ice from those areas
flowed into (or across the mouth of) Seymour Valley. It would therefore be expected
that some of the upper fluvial sediments of Unit 2 would have been deposited by
meltwaters flowing into (or across the mouth of) Seymour Valley. Paleoflow direction
could not be determined, however, because of inadequate exposure.
5.4 -22 000 to 18 000 vears BP
By about 22 ka BP a lake formed again. This is indicated by the occurrence of
glaciolacustrine sediments (Unit 3). The presence of many large dropstones (reaching
-50 cm in diameter) and the "disturbed" nature of the deposits near the base of the
unit indicate a proximal ice source. The fact that Unit 3 drift is nearly massive at the
base and becomes increasingly structured (laminated) with elevation suggests that the
lake eventually became deeper, possibly the result of Fraser Valley ice building up at
the mouth of Seymour Valley. Alternatively, the increase in structure might have been
a result of a brief retreat of the Seymour Valley glacier.
A draining of the lake occurred next. Evidence of this is the presence of a
cobble lag bed (only at SVMS-11) up to -3 m thick. This implies that ice blocking
Seymour Valley must have retreated far enough to permit more efficient drainage of
meltwaters out of Seymour Valley. This lake drainage was followed by the retreat of
the Seymour Valley glacier.
During the retreat of the Seymour Valley glacier, another lake formed. The
nature of the sediments (Unit 4) indicate that while ice was wasting into water at
SVMS-11, it was grounded at SVMS-8. This suggests that during the retreat of the
Seymour Valley glacier, ice in the Fraser Lowland occupied the Seymour Valley to at
least where Rice Lake now exists. Alternatively, the Seymour Valley may have been
invaded by the sea from the southwest, while ice in the Fraser Lowland remained in
the valley mouth.
Eventually the ice blocking the mouth of Seymour Valley retreated, and the
lake drained (or relative sea-level dropped). No fluvial sediments indicating the
occurrence of a meltwater stream following the drainage of the lake have been found,
although such a stream must have existed.
5.5 - 18 000 to 17 000 vears BP
By about 18 ka BP the climate had recovered dramatically, a soil developed
and a substantial forest appeared on the floodplains of Seymour River. After an
undetermined amount of time, possibly more than 1000 years (based on radiocarbon
dates from the study area), ice began to advance again. Ice in the Fraser Lowland once
again dammed the Seymour Valley forming a lake, and glaciolacustrine sediments
were once again deposited (Unit 5). As the level of the lake began to rise, soil that had
developed on higher ground was incorporated into the lake waters and deposited on
the lake bottom. Evidence of this is the presence of a single -20 cm thick
-63-
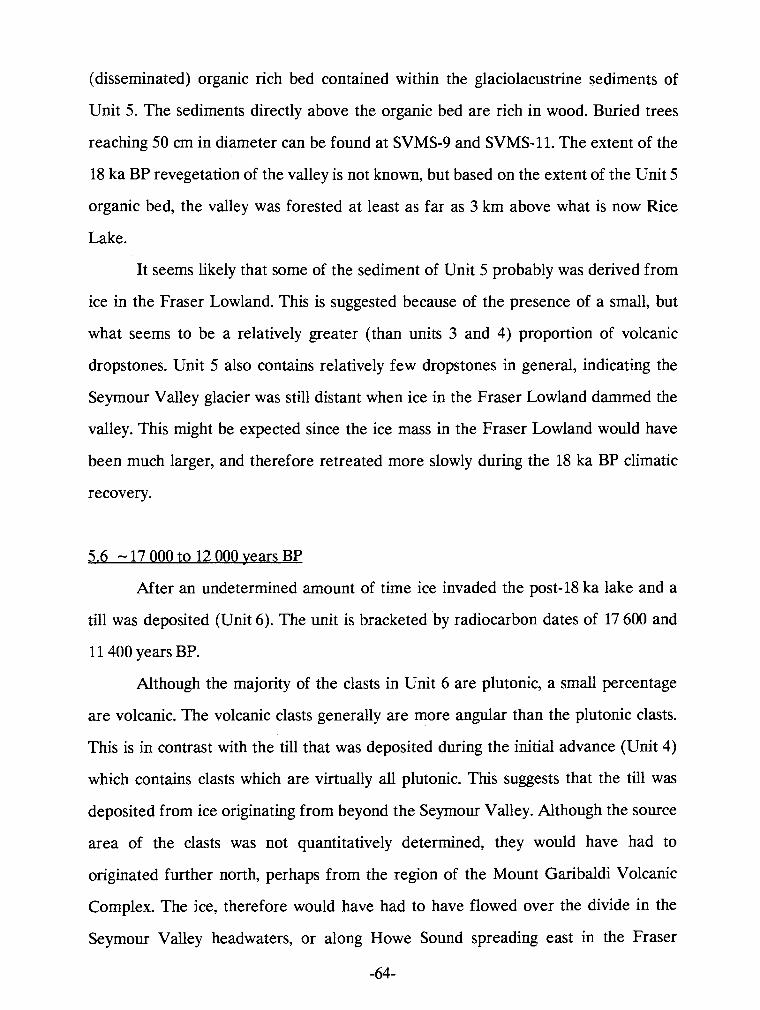
(disseminated) organic rich bed contained within the glaciolacustrine sediments of
Unit 5. The sediments directly above the organic bed are rich in wood. Buried trees
reaching 50 cm in diameter can be found at SVMS-9 and SVMS-11. The extent of the
18 ka BP revegetation of the valley is not known, but based on the extent of the Unit 5
organic bed, the valley was forested at least as far as 3 km above what is now Rice
Lake.
It seems likely that some of the sediment of Unit 5 probably was derived from
ice in the Fraser Lowland. This is suggested because of the presence of a small, but
what seems to be a relatively greater (than units 3 and 4) proportion of volcanic
dropstones. Unit 5 also contains relatively few dropstones in general, indicating the
Seymour Valley glacier was still distant when ice in the Fraser Lowland dammed the
valley. This might be expected since the ice mass in the Fraser Lowland would have
been much larger, and therefore retreated more slowly during the 18 ka BP climatic
recovery.
5.6 - 17 000 to 12 000 years BP
After an undetermined amount of time ice invaded the post-18 ka lake and a
till was deposited (Unit 6). The unit is bracketed by radiocarbon dates of 17 600 and
11 400 years BP.
Although the majority of the clasts in Unit 6 are plutonic, a small percentage
are volcanic. The volcanic clasts generally are more angular than the plutonic clasts.
This is in contrast with the till that was deposited during the initial advance (Unit 4)
which contains clasts which are virtually all plutonic. This suggests that the till was
deposited from ice originating from beyond the Seymour Valley. Although the source
area of the clasts was not quantitatively determined, they would have had to
originated further north, perhaps from the region of the Mount Garibaldi Volcanic
Complex. The ice, therefore would have had to have flowed over the divide in the
Seymour Valley headwaters, or along Howe Sound spreading east in the Fraser
-64-
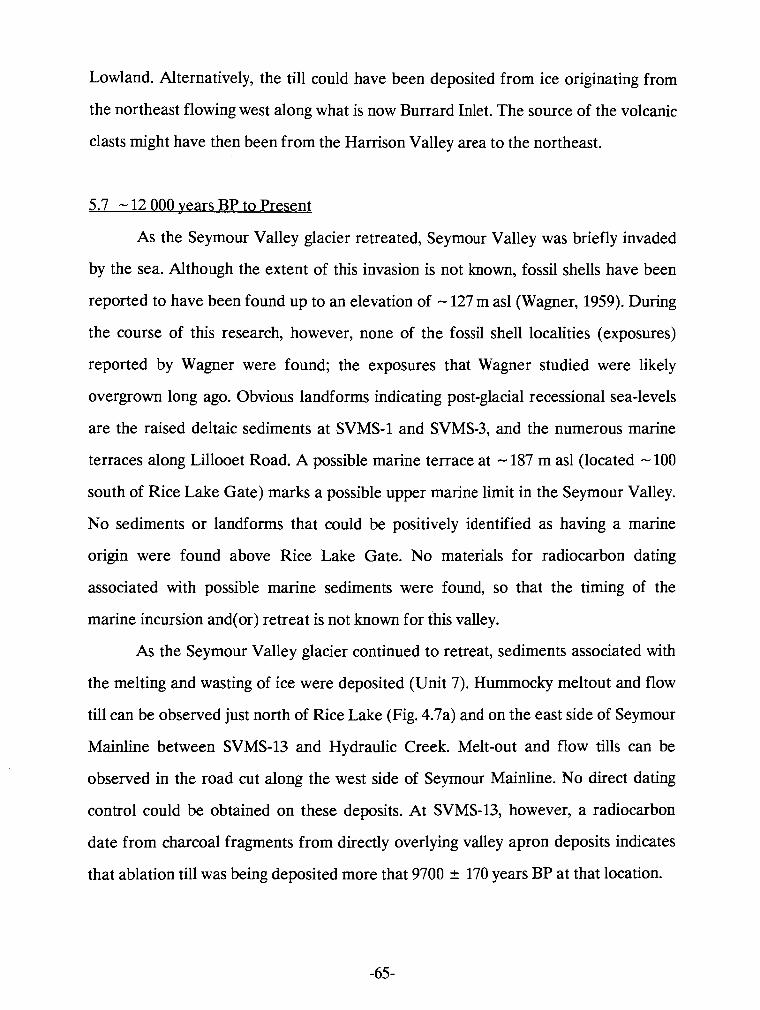
Lowland. Alternatively, the till could have been deposited from ice originating from
the northeast flowing west along what is now Burrard Inlet. The source of the volcanic
clasts might have then been from the Harrison Valley area to the northeast.
5.7 - 12 000 years BP to Present
As the Seymour Valley glacier retreated, Seymour Valley was briefly invaded
by the sea. Although the extent of this invasion is not known, fossil shells have been
reported to have been found up to an elevation of - 127 m as1 (Wagner, 1959). During
the course of this research, however, none of the fossil shell localities (exposures)
reported by Wagner were found; the exposures that Wagner studied were likely
overgrown long ago. Obvious landforms indicating post-glacial recessional sea-levels
are the raised deltaic sediments at SVMS-1 and SVMS-3, and the numerous marine
terraces along Lillooet Road. A possible marine terrace at - 187 m as1 (located - 100
south of Rice Lake Gate) marks a possible upper marine limit in the Seymour Valley.
No sediments or landforms that could be positively identified as having a marine
origin were found above Rice Lake Gate. No materials for radiocarbon dating
associated with possible marine sediments were found, so that the timing of the
marine incursion and(or) retreat is not known for this valley.
As the Seymour Valley glacier continued to retreat, sediments associated with
the melting and wasting of ice were deposited (Unit 7). Hummocky meltout and flow
till can be observed just north of Rice Lake (Fig. 4.7a) and on the east side of Seymour
Mainline between SVMS-13 and Hydraulic Creek. Melt-out and flow tills can be
observed in the road cut along the west side of Seymour Mainline. No direct dating
control could be obtained on these deposits. At SVMS-13, however, a radiocarbon
date from charcoal fragments from directly overlying valley apron deposits indicates
that ablation till was being deposited more that 9700 + 170 years BP at that location.
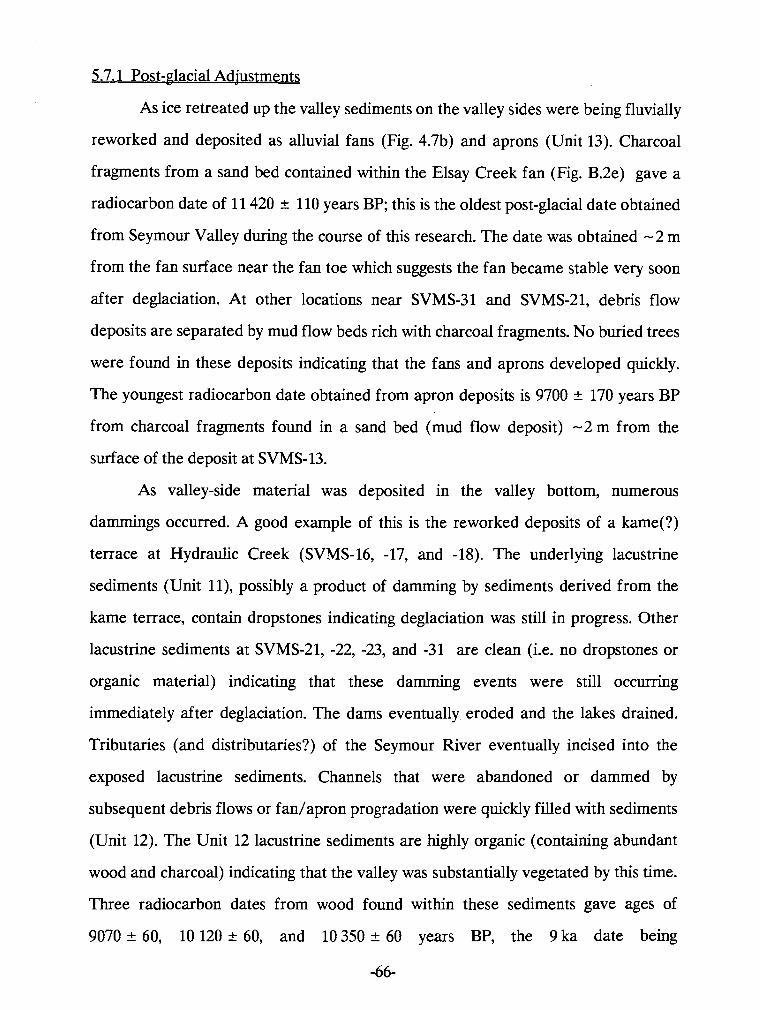
5.7.1 Post-glacial Adjustments
As ice retreated up the valley sediments on the valley sides were being fluvially
reworked and deposited as alluvial fans (Fig. 4.7b) and aprons (Unit 13). Charcoal
fragments from a sand bed contained within the Elsay Creek fan (Fig. B.2e) gave a
radiocarbon date of 11 420 +. 110 years BP; this is the oldest post-glacial date obtained
from Seymour Valley during the course of this research. The date was obtained -2 m
from the fan surface near the fan toe which suggests the fan became stable very soon
after deglaciation. At other locations near SVMS-31 and SVMS-21, debris flow
deposits are separated by mud flow beds rich with charcoal fragments. No buried trees
were found in these deposits indicating that the fans and aprons developed quickly.
The youngest radiocarbon date obtained from apron deposits is 9700 st 170 years BP
from charcoal fragments found in a sand bed (mud flow deposit) -2 m from the
surface of the deposit at SVMS-13.
As valley-side material was deposited in the valley bottom, numerous
dammings occurred. A good example of this is the reworked deposits of a kame(?)
terrace at Hydraulic Creek (SVMS-16, -17, and -18). The underlying lacustrine
sediments (Unit l l ) , possibly a product of damming by sediments derived from the
kame terrace, contain dropstones indicating deglaciation was still in progress. Other
lacustrine sediments at SVMS-21, -22, -23, and -31 are clean (i.e. no dropstones or
organic material) indicating that these damming events were still occurring
immediately after deglaciation. The dams eventually eroded and the lakes drained.
Tributaries (and distributaries?) of the Seymour River eventually incised into the
exposed lacustrine sediments. Channels that were abandoned or dammed by
subsequent debris flows or fan/apron progradation were quickly filled with sediments
(Unit 12). The Unit 12 lacustrine sediments are highly organic (containing abundant
wood and charcoal) indicating that the valley was substantially vegetated by this time.
Three radiocarbon dates from wood found within these sediments gave ages of
9070 st 60, 10 120 st 60, and 10 350 ? 60 years BP, the 9 ka date being
-66-
stratigraphically lower, while the 10 kadates are supportive (see Fig. 4.3~). The
Unit 12 sediments were finally capped with material reworked from glacial sediments
on the valley sides. As this sediment supply became exhausted, fans and aprons
became vegetated and relatively stable.
From the evidence presented above it is likely that most of the valley-side
glacial material was redeposited in the valley bottom within 3000 years of
deglaciation.
As the sediment supply from the valley sides and from the retreating ice began
to dwindle, the Seymour River began to incise into the glacial valley fill deposits while
at the same time tributaries, graded to Seymour River, began to incise alluvial fans
and aprons. The result of this is a complex systems of terraces representing former
positions of the Seymour River within the valley fill. At some point the lower river
became "trapped" in its present course by the bedrock canyon; an event which
prevented excessive lateral movement upstream thereby preserving the pre-Fraser
and overlying sediments to this day.
Although the exact timing of incision was not determined in this study, two
radiocarbon dates from an aggradational terrace directly above channel lag deposits
(SVMS-10) indicate that incision into the valley fill was -85% complete before 5 ka
BP (the cause of aggradation during this time period is discussed in Chapter 6). The
interval of time between -5 ka BP and present therefore represents incision into the
remaining -10 m of valley fill and incision into bedrock. It is not known when
Seymour River became graded to the lower bedrock canyon, but it was likely soon
after 5 ka BP.
The rate of incision into the lower bedrock canyon is not known. Supported by
its "youthful appearance", it has been suggested that the canyon was cut during the
Holocene (Burwash, 1918; Johnston, 1923). Since the canyon likely was filled with
glacial outwash sediment prior to each glacial advance it would have been protected
from the scouring action of ice throughout each glacial advance and retreat, much like
-67-
the pre-Fraser sediments (Unit 1) in the valley were during the initial advance of ice.
It is more probable, therefore, that the canyon is the product of fluvial erosion
occurring over a larger time span.
5.7.2 On-~oing Processes
Although the present physiography of Seymour Valley largely reflects glacial
processes which occurred thousands of years ago, the sediments and landforms in the
valley are still being reworked and reshaped, albeit at a much reduced rate. The warm
winters and high rainfall of southwest British Columbia combined with steep relief
result in a very dynamic geomorphic environment.
The valley fill in the study area currently is being reworked mainly by the
tributaries. Although all of the tributaries are graded to the Seymour River, flash
floods caused by rain-on-snow events during the winter months, and occasional
summer storms, have been observed to cause substantial local erosion. A number of
examples of this activity was observed during the course of this research:
During the winter of 1990/1991 the creek at SVMS-21 incised -1 m into
lacustrine sediments following a rain-on-snow event. Intake Creek washed out a road
and greatly eroded Intake Creek fan. During the fall of 1990, a rainstorm caused the
erosion of a large portion of apron deposits at Hydraulic Creek. During the fall of
1991 a portion of Fisherman's Trail, north of SVMS-11, was washed out during a flood
of Seymour River. It is actually surprising that so much of the valley fill remains to this
day - providing rates of erosion have been relatively constant in the Holocene.
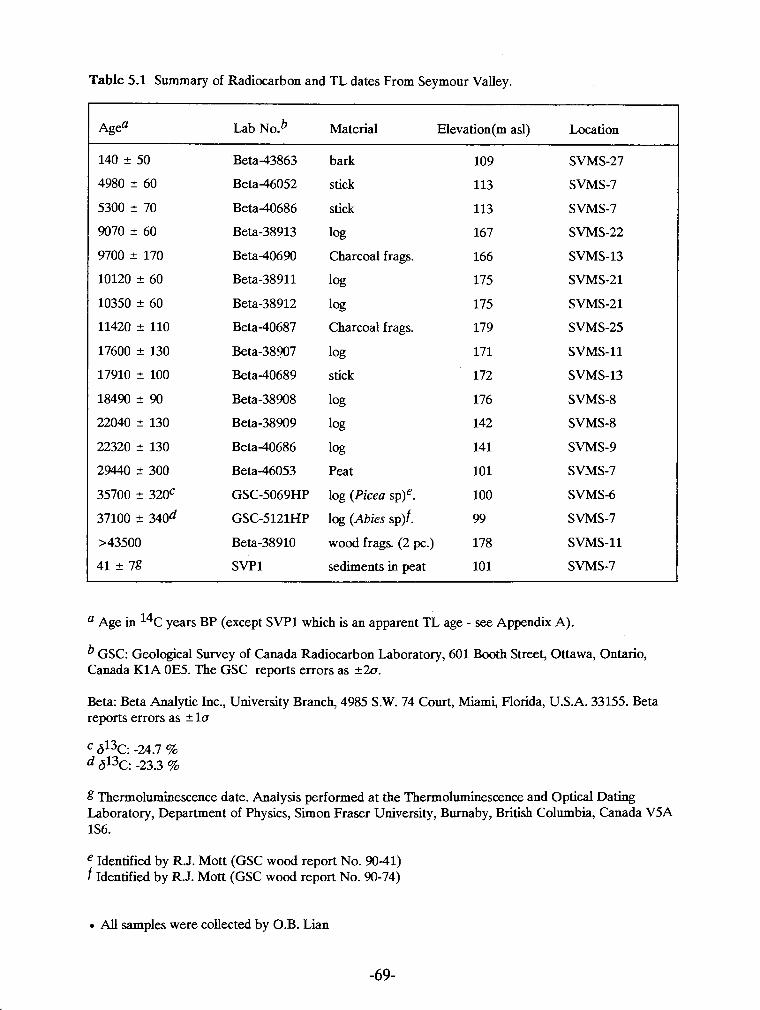
Table 5.1 Summary of Radiocarbon and TL dates From Seymour Valley.
Agea Lab NO.^ Material Elevation(m asl) Location
Beta-43863
Beta-46052
Beta-40686
Beta-38913
Beta40690
Beta-38911
Beta-38912
Beta40687
Beta-38907
Beta-40689
Beta-38908
Beta-38909
Beta-40686
Beta-46053
GSC-5069HP
GSC-5121HP
Beta-38910
SVPl
bark
stick
stick
1%
Charcoal frags.
1%
1%
Charcoal frags.
1%
stick
log
1%
1%
Peat
log (Picea ~ p ) ~ .
log (Abies sp)f.
wood frags. (2 pc.)
sediments in peat
a Age in 14c years BP (except SVPl which is an apparent TL age - see Appendix A).
GSC: Geological Survey of Canada Radiocarbon Laboratory, 601 Booth Street, Ottawa, Ontario, Canada KIA OE5. The GSC reports errors as +2u.
Beta: Beta Analytic Inc., University Branch, 4985 S.W. 74 Court, Miami, Florida, U.S.A. 33155. Beta reports errors as + la
g Thermoluminescence date. Analysis performed at the Thermoluminescence and Optical Dating Laboratory, Department of Physics, Simon Fraser University, Burnaby, British Columbia, Canada V5A 1S6.
Identified by R.J. Mott (GSC wood report No. 90-41) f Identified by R.J. Mott (GSC wood report No. 90-74)
. All samples were collected by O.B. Lian
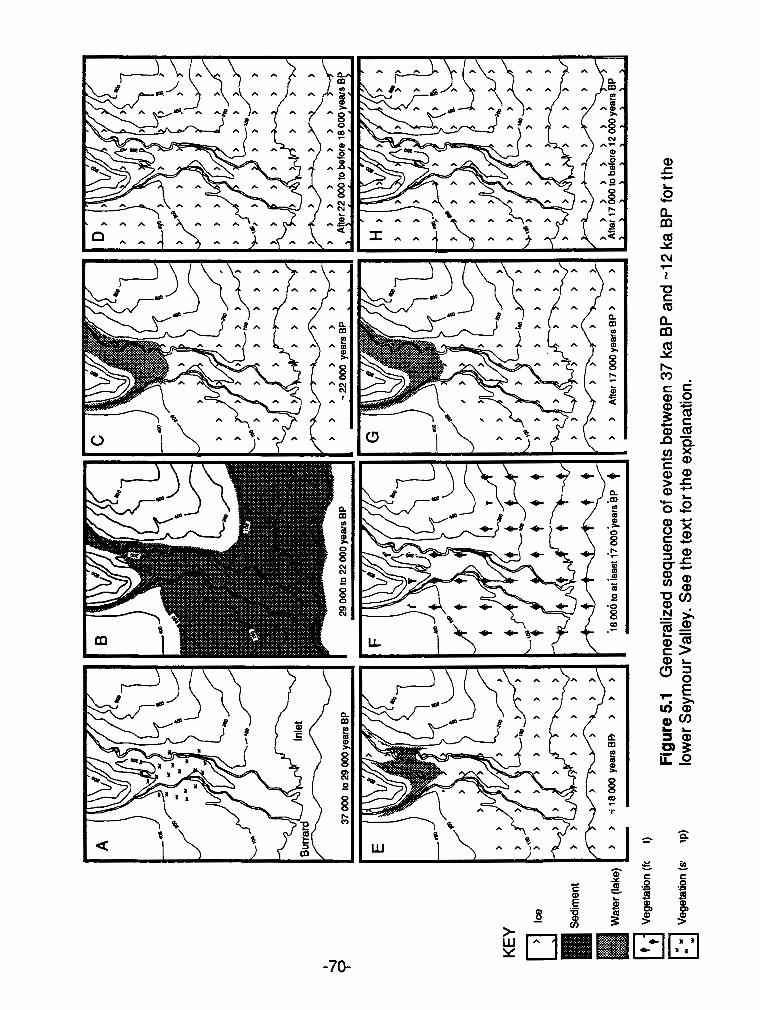
CHAPTER 6
DISCUSSION AND CONCLUSIONS
6.1 Introduction
This chapter discusses how the findings of this study relate to existing
knowledge from the Fraser Lowland and elsewhere. Based on the evidence presented
in Chapter 4, the stratigraphic units in the Seymour Valley are correlated with the
time-stratigraphic, geoclimatic, and lithostratigraphic units defined for the Fraser
Lowland (reviewed in Chapter 2).
6.2 Middle Wisconsinan
6.2.1 The Olvm~ia Nonglacial I n t e ~ a l
6.2.1.1 The Cowichan Head Formation
Based on radiocarbon dating and lithostratigraphy, the Unit 1 sediments may
be considered equivalent to the upper member (see Chapter 2) of the Cowichan Head
Formation; the lower member is not exposed, and may not exist, in the Seymour
Valley. Unit 1 was therefore deposited during the Olympia Nonglacial I n t e ~ a l
(hereafter referred to as the Olympia).
Locally, these sediments may be correlated with an exposure of the Cowichan
Head Formation in the neighbouring Lynn Canyon in Lynn Valley. In Lynn Canyon
these sediments generally consists of about I m of compressed peat containing a 2 cm
thick bed of sand. Also exposed is about 25 cm of underlying till that has been
correlated with Semiahmo Drift (Armstrong et al, 1985; Armstrong, 1990). Four
radiocarbon dates ranging from 47 800 -r- 1100 (GSC-3290) to 33 100 + 620 (GSC-
2797) years BP have been obtained from this unit (Armstrong et al, 1985; Armstrong,
1990).
It appears therefore that in Lynn Canyon this unit represent a more or less
continuous accumulation of peat over a time span of about 15 ka interrupted by only
one small fluvial incursion. This is in contrast to the situation in Seymour Valley
where -2 m of the 5 m exposure of peat and sediment accumulated over a time span
of -8 ka. The different nature of these two exposures may be attributable to the pre-
Fraser position of the two respective streams. The exposure in Lynn Canyon obviously
was not effected by fluctuations in discharge and sediment load of the pre-Fraser
Lynn Creek.
An extensive palynolgical study of the Lynn Canyon exposure has been
completed and is presented in Armstrong et al. (1985). Due to the proximity of this
exposure with Seymour valley, the results are likely applicable to Unit 1 in the
Seymour Valley. The results and interpretations are quoted below:
The peat and silt beds of the Cowichan Head Formation [in Lynn Canyon] contain a singular record of middle Wisconsin vegetation and climate. The lowermost 5-10 cm of the Cowichan Head sequence contain pollen and spore assemblages dominated by club-moss (Lvcopodium cf. annotinurn), grasses (Poaceae), and diverse herbs. These assemblages which are more than 48,000 radiocarbon years old, represent grass-herb meadows similar to those of subalpine or alpine sites today.
Lodgepole pine (Pinus contorta) woodland of forest succeeded the meadows, presumably in response to a warming climate. This woodland, in turn, was replaced by a forest dominated by spruce (species unknown, but probably &a sitchensis) and mountain hemlock (Tsuga mertensiana), which most likely grew in a moist climate that was cooler than present.
Later, western hemlock (Qgg hetero~hvlla) became a forest co-dominated with lodgepole pine and mountain hemlock. The abundance of mountain hemlock suggests that this was the warmest part of the Olympia nonglacial interval. However, the climate was probably not as warm as the present because mountain hemlock, which now occurs in the southern Coast Mountains only above 1000 m a.s.l., coexisted with western hemlock at this low-elevation (65 m) site. The high pollen values may indicate local stands of lodgepole pine on the peat-forming wetland.
High percentages of spruce and mountain hemlock pollen in the upper part of the peat signal the return of cooler conditions before 33,000 years BP. The uppermost silty peat and overlying silt are dominated by pollen of grasses and diverse herbs and by spores of club-moss and ferns. Grass-herb meadows covered the terrain in the vicinity of Lynn Canyon, and the climate was relatively cold, perhaps a herald of the Fraser Glaciation to come.
These middle Wisconsin vegetation changes were accompanied by changes in the character of the Lynn Canyon depositional site. The initial wet grassy meadow was succeeded by a Sphamum bog, which in turn was replaced by a sedge fen. A stream coursed through the fen, depositing the Zcm-thick sand bed on top of the lower peat. The fen was then replaced by herb-rich wet grassy meadow. Still later, the site became a floodplain or shallow lake in which silt accumulated on top of the upper peat (p. 15-10).
/ These results of this palynolgical study appears to agree with the general
"appearance" of the Seymour Valley exposure: in Seymour Valley there is a relative
abundance of fossil logs at the stratigraphic positions corresponding to 36 and 37 ka
BP, which is about the same time where large pine and spruce signals occur in the
Lynn Canyon pollen diagram (Fig. 6.1). At the 29 ka BP position the Seymour Valley
peats appear relatively barren of wood, a time represented by mainly herbs and shrubs
in the Lynn Canyon pollen diagram.
It appears, therefore, that the majority of Unit 1 was deposited during
generally warm climatic conditions. Aggradation in the Seymour Valley during the
Olympia, therefore, cannot be attributed to increased rates of erosion and
sedimentation brought upon by a major climatic deterioration (the onset of glaciation)
although relatively minor climatic fluctuations may be responsible (see below).
There are three primary reasons why a river valley may experience
aggradation:
(1) An increase in base level elevation (2) An increase in sediment supply (3) A decrease in fluvial energy
(1) An increase in base level elevation can be caused by a rise in relative sea-
level. Although it is not known if sea-levels were rising (fluctuating?) during the entire
time of formation of this unit, the character of the overlying sediments (Unit 2)
suggest that sea-level should have been dropping by about 29 ka BP due to the onset
of glaciation.
(2) A stream may aggrade if sediments are being deposited downstream at a
rate greater than they are being transported out of the valley. There are at present no
obvious sources or source areas of sediment upstream, or downstream of the Unit 1
deposits that could have been responsible for this, although there could have been in
the pre-Fraser Seymour Valley.
(3) A decrease in fluvial energy may cause sediments to accumulate rather than
be transported through the system. If the lower Seymour River was multichannel
during this time, channel shifting and abandonment could have resulted in local
aggradation (in-filling). The nearly massive gravels of Unit 1 could therefore be a
result of periodic flooding. The problem still remains, however, that over 5 m of
aggradation have to be accounted for.
Aggradation may have been caused by a combination of these factors.
Knowledge of the climate during the Olympia may suggest a mechanism for the
formation of the Unit 1 peat sequence. If the Olympia did indeed begin more than 60
ka BP, then the 48 ka BP cold period represented in the Lynn Canyon pollen diagram
could be interpreted as relatively short fluctuation in a generally warm climatic
interval. The two spikes of fern and mountain hemlock which coincide between 48 ka
BP and 33 ka BP, may then, suggest brief returns to cooler climates. In fact, Gascoyne
et al. (1981) have found from dl80 studies of speleothems from cave deposits on
Vancouver Island, that temperatures during the Olympia were considerably warmer
65 ka BP than 48 ka BP, declining steadily until the onset of the Fraser Glaciation -29
ka BP. Gascoyne et al. did not detect, however, any fluctuation in temperature during
this decline, a result they attributed to the buffering effect of the nearby ocean.
Evidence of fluctuating climatic conditions during the Olympia have been
found elsewhere. Heusser (1977), working on the Olympic Peninsula (northwestern
Washington), has argued that during the Olympia temperatures were sometimes as
cold as those experienced during the Fraser Glaciation maximum, yet at other times as
warm as those of the present. Climatic fluctuation during the Olympia is also
supported by information from the Cowichan Head Formation (southern Vancouver
Island) (Armstrong and Clague, 1977). Hansen and Easterbrook (1974) apparently
found evidence that the Puget Lowland was occupied by glaciers during part of the
Olympia. Others have argued, however, that the lithostratigraphic evidence for this is
likely invalid since no evidence of a glaciation during this time period has been found
in British Columbia (Fulton et al., 1976; Clague, 1980).
Even in today's relatively warm climate there exists perpetual patches of snow
in the mountains surrounding Seymour Valley. It is conceivable that during the
Olympia, the amount of summer snow in the surrounding mountains expanded and
contracted by orders of magnitude, changes that periodically effected the erosional
efficiency of the tributary streams in Seymour Valley.
It therefore seems plausible that periods of aggradation in the Seymour Valley
during the Olympia could have been in response to changes in temperature, rainfall,
snow, and possibly ice in the surrounding mountains. The above notion is, of course,
an hypothesis which has yet to be tested. However, because of the time span covered
by the unit and its vertical size, periodic climatic fluctuations during the Olympia
appears, at this time, to be a likely cause of aggradation.
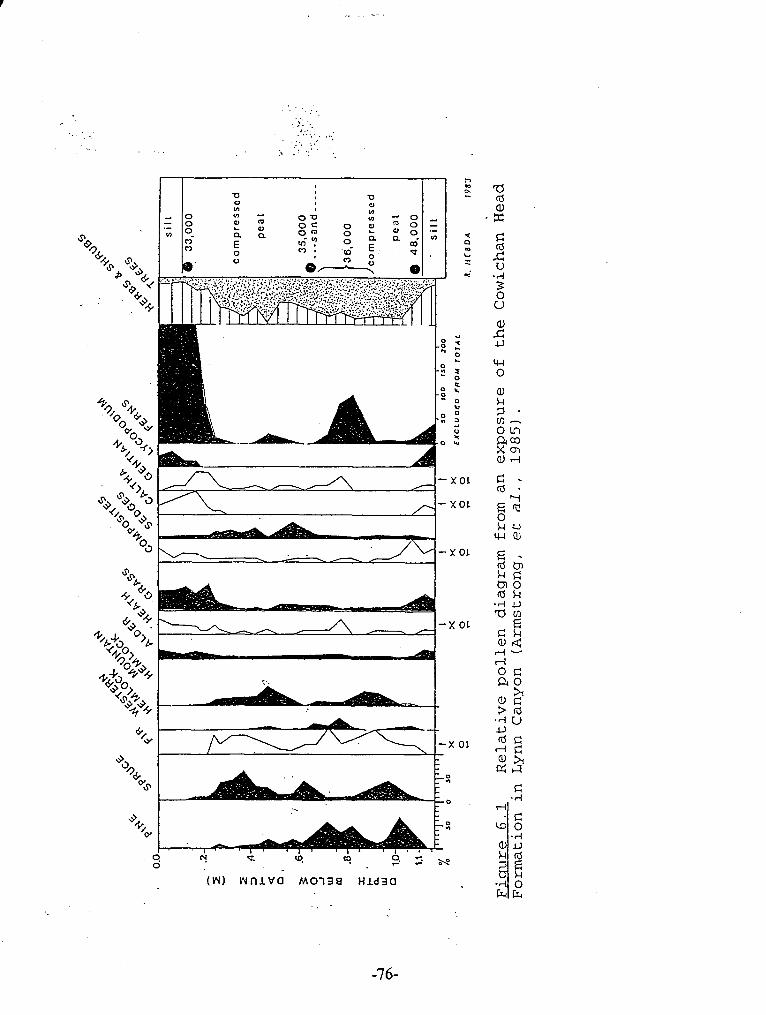
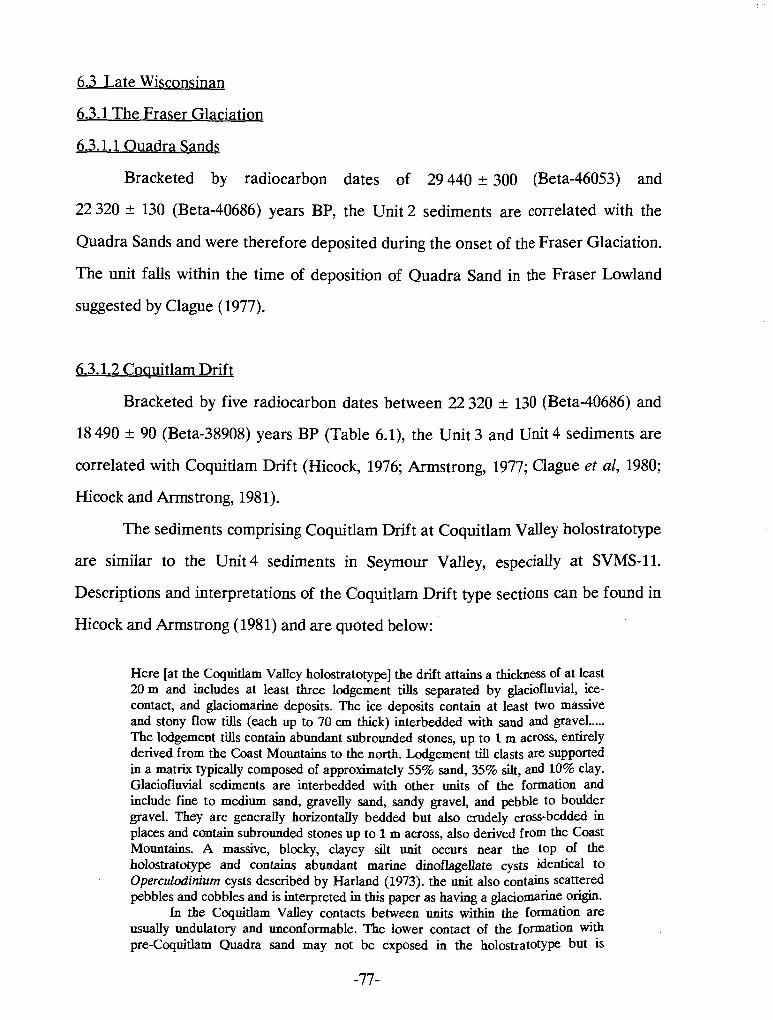
6.3 Late Wisconsinan
6.3.1 The Fraser Glaciation
6.3.1.1 Ouadra Sands
Bracketed by radiocarbon dates of 29 440 300 (Beta-46053) and
22 320 k 130 (Beta-40686) years BP, the Unit 2 sediments are correlated with the
Quadra Sands and were therefore deposited during the onset of the Fraser Glaciation.
The unit falls within the time of deposition of Quadra Sand in the Fraser Lowland
suggested by Clague (1977).
6.3.1.2 Coquitlam Drift
Bracketed by five radiocarbon dates between 22 320 130 (Beta-40686) and
18 490 + 90 (Beta-38908) years BP (Table 6.1), the Unit 3 and Unit 4 sediments are
correlated with Coquitlam Drift (Hicock, 1976; Armstrong, 1977; Clague et al, 1980;
Hicock and Armstrong, 1981).
The sediments comprising Coquitlam Drift at Coquitlam Valley holostratotype
are similar to the Unit 4 sediments in Seymour Valley, especially at SVMS-11.
Descriptions and interpretations of the Coquitlam Drift type sections can be found in
Hicock and Armstrong (1981) and are quoted below:
Here [at the Coquitlam Valley holostratotype] the drift attains a thickness of at least 20 m and includes at least three lodgement tills separated by glaciofluvial, ice- contact, and glaciomarine deposits. The ice deposits contain at least two massive and stony flow tills (each up to 70 cm thick) interbedded with sand and gravel ..... The lodgement tills contain abundant subrounded stones, up to 1 m across, entirely derived from the Coast Mountains to the north. Lodgement till clasts are supported in a matrix typically composed of approximately 55% sand, 35% silt, and 10% clay. Glaciofluvial sediments are interbedded with other units of the formation and include fine to medium sand, gravelly sand, sandy gravel, and pbble to boulder gravel. They are generally horizontdy bedded but also crudely cross-bedded in places and contain subrounded stones up to 1 m across, also derived from the Coast Mountains. A massive, blocky, clayey silt unit occurs near the top of the holostratotype and contains abundant marine dinoflagellate cysts identical to Operculodinium cysts described by Harland (1973). the unit also contains scattered pebbles and cobbles and is interpreted in this paper as having a glacio~narine origin.
In the Coquitlam Valley contacts between units within the formation are usually undulatory and unconformable. The lower contact of the formation with pre-Coquitlam Quadra sand may not be exposed in the holostratotype but is
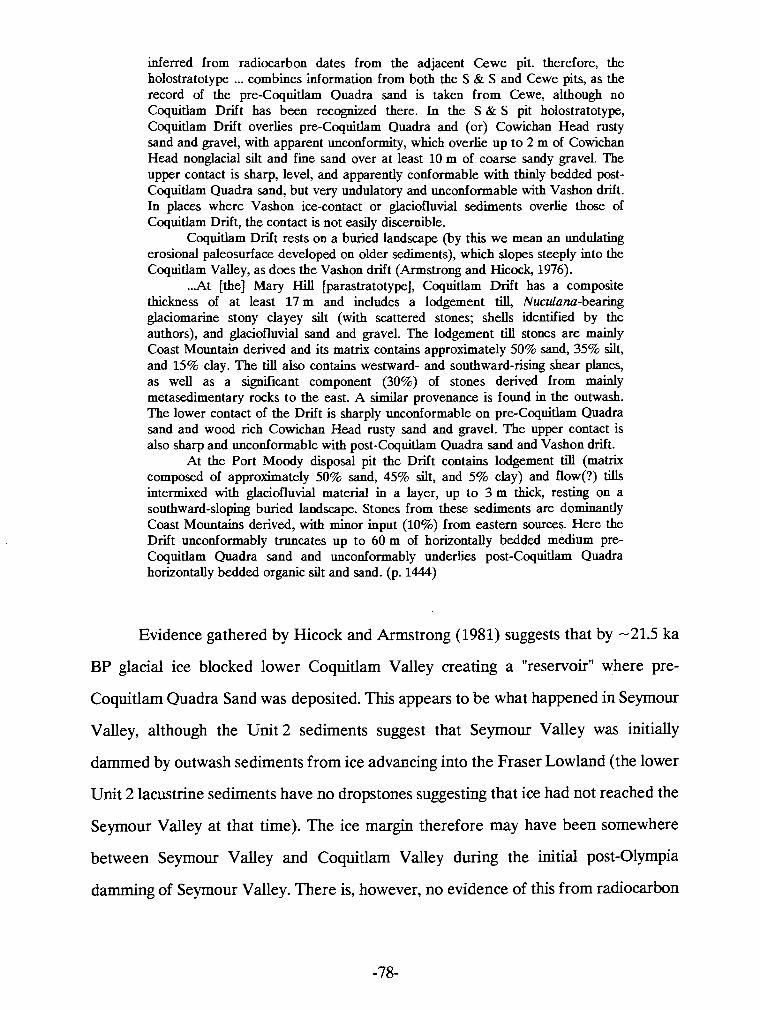
inferred from radiocarbon dates from the adjacent Cewe pit. therefore, the holostratotype ... combines information from both the S & S and Cewe pits, as the record of the pre-Coquitlam Quadra sand is taken from Cewe, although no Coquitlam Drift has been recognized there. In the S & S pit holostratotype, Coquitlam Drift overlies pre-Coquitlam Quadra and (or) Cowichan Head rusty sand and gravel, with apparent unconformity, which overlie up to 2 m of Cowichan Head nonglacial silt and fine sand over at least 10 m of coarse sandy gravel. The upper contact is sharp, level, and apparently conformable with thinly bedded post- Coquitlam Quadra sand, but very undulatory and unconformable with Vashon drift. In places where Vashon ice-contact or glaciofluvial sediments overlie those of Coquitlam Drift, the contact is not easily discernible.
Coquitlam Drift rests on a buried landscape (by this we mean an undulating erosional paleosurface developed on older sediments), which slopes steeply into the Coquitlam Valley, as does the Vashon drift (Armstrong and Hicock, 1976).
... At [the] Mary Hill [parastratotype], Coquitlam Drift has a composite thickness of at least 17 m and includes a lodgement till, Nuculana-bearing glaciomarine stony clayey silt (with scattered stones; shells identified by the authors), and glaciofluvial sand and gravel. The lodgement till stones are mainly Coast Mountain derived and its matrix contains approximately 50% sand, 35% silt, and 15% clay. The till also contains westward- and southward-rising shear planes, as well as a significant component (30%) of stones derived from mainly metasedimentary rocks to the east. A similar provenance is found in the outwash. The lower contact of the Drift is sharply unconformable on pre-Coquitlam Quadra sand and wood rich Cowichan Head rusty sand and gravel. The upper contact is also sharp and unconformable with post-Coquitlam Quadra sand and Vashon drift.
At the Port Moody disposal pit the Drift contains lodgement till (matrix composed of approximately 50% sand, 45% silt, and 5% clay) and flow(?) tills intermixed with glaciofluvial material in a layer, up to 3 m thick, resting on a southward-sloping buried landscape. Stones from these sediments are dominantly Coast Mountains derived, with minor input (10%) from eastern sources. Here the Drift unconformably truncates up to 60 m of horizontally bedded medium pre- Coquitlam Quadra sand and unconformably underlies post-Coquitlam Quadra horizontally bedded organic silt and sand. (p. 1444)
Evidence gathered by Hicock and Armstrong (1981) suggests that by -21.5 ka
BP glacial ice blocked lower Coquitlam Valley creating a "reservoir" where pre-
Coquitlam Quadra Sand was deposited. This appears to be what happened in Seymour
Valley, although the Unit 2 sediments suggest that Seymour Valley was initially
dammed by outwash sediments from ice advancing into the Fraser Lowland (the lower
Unit 2 lacustrine sediments have no dropstones suggesting that ice had not reached the
Seymour Valley at that time). The ice margin therefore may have been somewhere
between Seymour Valley and Coquitlarn Valley during the initial post-Olympia
damming of Seymour Valley. There is, however, no evidence of this from radiocarbon
dating (Table 6.1). This lack of evidence may be due to the paucity of dates, from each
valley, representing the onset of the Coquitlam Stade.
Both Coquitlam Valley and Seymour Valley show that the Coquitlam Stade
was a relatively unstable time when ice margins advanced and retreated into water. In
the Coquitlam Valley, marine indicators suggest that the sea invaded the valley during
the time between deposition of the till beds. Since no microfossil studies were
performed on the Seymour Valley sediments it is not know whether the Unit 4
sediments were deposited in a freshwater lake or into the invading sea. The character
of the sediments at SVMS-8 suggest, however, that the valley below SVMS-11 was
blocked by ice during this time which in turn suggests that the sediments at SVMS-11
were deposited in fresh water. It is therefore conceivable that the sea never invaded
the Seymour Valley during the retreat of the Coquitlam ice. Alternatively, the sea may
have briefly entered Seymour Valley from the southwest, north of SVMS-8, while ice
and sediment remained intact at SVMS-11.
In Coquitlam Valley, both pre- and post-Coquitlam Quadra Sand is present. In
Seymour Valley, however, only the pre-Coquitlam Quadra Sand is represented.
Seymour Valley post-Coquitlam Quadra Sand may have been deposited as lacustrine
sediments (Unit S), the coarser sand-sized material (not exposed) settling out
somewhere up-valley at the lake margin.
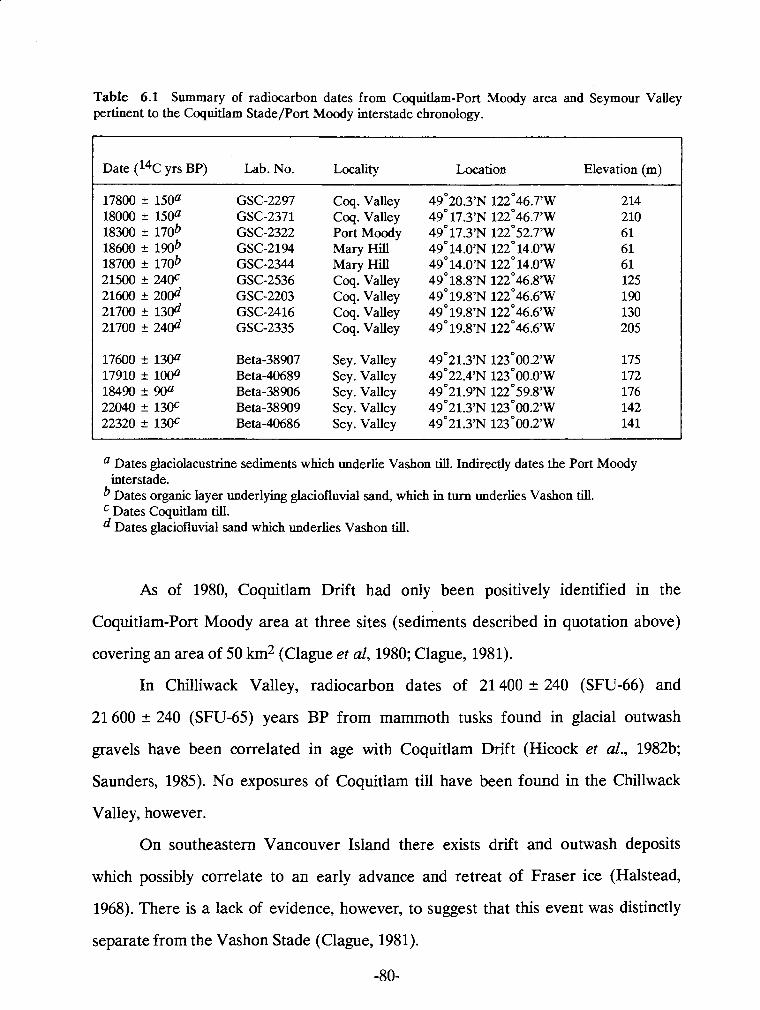
Table 6.1 Summary of radiocarbon dates from Coquitlam-Port Moody area and Seymour Valley pertinent to the Coquitlam Stade/Port Moody interstade chronology.
Date (14c yrs BP) Lab. No. Locality Location Elevation (m)
Coq. Valley Coq. Valley Port Moody Mary Hill Mary Hill Coq. Valley Coq. Valley Coq. Valley Coq. Valley
Sey. Valley Sey. Valley Sey. Valley Sey. Valley Sey. Valley
a Dates glaciolacustrine sediments which underlie Vashon till. Indirectly dates the Port Moody interstade. Dates organic layer underlying glaciofluvial sand, which in turn underlies Vashon till. Dates Coquitlam till. Dates glaciofluvial sand which underlies Vashon till.
As of 1980, Coquitlam Drift had only been positively identified in the
Coquitlam-Port Moody area at three sites (sediments described in quotation above)
covering an area of 50 krn2 (Clague et al, 1980; Clague, 1981).
In Chilliwack Valley, radiocarbon dates of 21 400 + 240 (SFU-66) and
21 600 + 240 (SFU-65) years BP from mammoth tusks found in glacial outwash
gravels have been correlated in age with Coquitlam Drift (Hicock et al., 1982b;
Saunders, 1985). No exposures of Coquitlam till have been found in the Chillwack
Valley, however.
On southeastern Vancouver Island there exists drift and outwash deposits
which possibly correlate to an early advance and retreat of Fraser ice (Halstead,
1968). There is a lack of evidence, however, to suggest that this event was distinctly
separate from the Vashon Stade (Clague, 1981).
-80-
Blaise et al. (1990) have found evidence that the Queen Charlotte Islands were
occupied by an "extensive network of glaciers" during the time of the Coquitlam Stade,
but there is no evidence to show that those glaciers receded before the Fraser
maximum was found.
A summary of the Quaternary stratigraphy in the Canadian Cordillera by
Ryder and Clague (1989) reports no further sedimentary evidence of the Coquitlam
Stade. Seymour Valley, therefore, likely is the only site where Coquitlam Drift has
been positively identified outside the Coquitlam-Port Moody area. It is likely, then,
that the Coquitlam Stade only occurred in the southern Coast Mountains.
It has been suggested by Hicock (1976), Alley and Chatwin (1979), Clague et al.
(1980) that Coquitlam Drift may be correlated with Evans Creek Drift (Crandell,
1963; Armstrong et al., 1965) in northwestern Washington. In the Cascade Mountains,
Evans Creek Drift was deposited by glaciers advancing (advance =20 km at Mount
Ranier) and then retreating during the onset of the Fraser Glaciation. The timing of
this advance is supported by palynological evidence from Davis Lake (-10 lun
northwest of the Evans Creek glacial margin) which indicates that a cooler climate
existed between 26 and 16 ka BP followed by a climatic warming between 16 and 15
ka BP, in turn followed by cooler conditions of the Fraser maximum (Barnosky, 1981).
Evans Creek Drift in the Hoh Valley originating from a glacial advance in the
Olympic Mountains underlies three basal bogs which have produced limiting
radiocarbon dates ranging from 18 800 2 800 (RL-228) to 14 480 2 600 (Y-2454)
(Heusser, 1964; Crandell, 1965; Easterbrook, 1986). No evidence of Evans Creek Drift
has been found in the Puget Lowlands (Easterbrook, 1969).
6.3.1.3 The Port Moody interstade
The Port Moody interstade is represented in the Seymour Valley by a single
organic-rich bed -20 cm thick underlying buried wood. Although these sediments and
wood are clearly reworked, the organic-rich bed is always found within a few meters
-81-
of the underlying Coquitlam Drift and is therefore believed to be stratigraphically
correct. Correlative sediments occur in the Coquitlam valley, Port Moody and at Mary
Hill (Hicock et al., 1982a). Comparison of radiocarbon dates (Table 6.1) from
Coquitlam-Port Moody with radiocarbon dates from the Seymour Valley show no
observable difference in the timing of this event.
Palynological studies at Port Moody and Mary Hill indicate that during the
Port Moody Interstade, the mean annual temperature in the Fraser Lowland was 8 ' ~
lower than today and tree lines were depressed by 1200 to 1500 m. Although these
were sufficient conditions for glaciation, it is thought that a lack of precipitation
prevented this. The lack of precipitation is thought to have been caused by a rain
shadow effect from the Vancouver Island mountains, as the open ocean would have
retreated some 200 km west of the Fraser Lowland during this time (Hicock et al.,
1982a). Four radiocarbon dates (ranging from 17.2 to 19.1 ka BP) collected from
sediments in southcentral and southeastern British Columbia (Clague, et al., 1980)
indicate, however, that at least part of these regions were ice-free at or around the
time of the Port Moody interstade and that climatic changes responsible for the
recession of Coquitlam ice was likely more regional. None of the organics dated from
southcentral and southeastern British Columbia, however, were found in association
with Drift.
Based on degree of soil development, the Port Moody interstade, at Port
Moody, is thought to have lasted 3000-4000 years. This is supported by limiting
radiocarbon dates (Table 6.1) of 21 500 + 240 (GSC-2536) years BP (Coquitlam
maximum) and 17 800 + 150 (GSC-2297) years BP (youngest pre-Vashon date from
the Coquitlam-Port Moody area) (Hicock and Armstrong, 1981). In the Seymour
Valley limiting radiocarbon dates range from 22 ka BP (arrival of Coquitlam ice) to
17.6 ka BP (youngest pre-Vashon date from the Seymour Valley). The continuous
presence of drift between these two stratigraphic positions in the Seymour Valley (i.e..
the lack of datable post-Coquitlam Quadra Sand) makes it impossible to constrain the
-82-
duration of the Port Moody interstade there. There is no evidence from the Seymour
Valley, however, to contradict the findings of Hicock and Armstrong (1981).
6.3.1.4 Vashon Drift
Bracketed by radiocarbon dates of 17 600 + 130 and 11 420 +: 110 years BP,
the Unit 5 and Unit 6 sediments are correlated with Vashon Drift. The Vashon Stade
is thought to have been initiated by increased precipitation possibly due to shifts in
zonal weather pattens (Hicock et al., 1982a). Both the Seymour and Coquitlam valleys
were occupied by Vashon ice by about 17.5 ka BP. Chilliwack Valley, however,
remained ice-free for at least another 1000 years (Calgue et al., 1988) indicating that
the Vashon advance occurred slowly at first, and rapidly after about 16 ka BP,
reaching its maximum by about 15 ka BP. The timing of the Vashon Stade in Seymour
Valley falls within the accepted time period for the Vashon Stade in the Fraser
Lowland.
6.4 Late Wisconsinan to Holocene
6.4.1 Capilano Sediments
Sometime before 11 420 + 110 years BP (Beta-40687) Fraser ice began to
recede from Seymour valley followed by invasion of the sea. As discussed in Chapter
5, the maximum extent of marine incursion following deglaciation is not exactly
known. However, the highest documented elevation that fossil shells have been found
is - 127 m as1 (Wagner, 1959). A possible marine terrace at - 187 m as1 is the highest
possible marine landform or marine sediment exposure found during this research.
Joyce (1976) described sediments exposed in a roadcut (north access road to Rice
Lake) at about 210 m as1 (elevation measured by this author) as being glaciomarine.
Examination of these sediments during the course of this research, however, have
classified them as ablation till. The proposed extent of post-Fraser marine invasion in
the Seymour Valley (somewhere between 127 and 187m asl) is supported by data
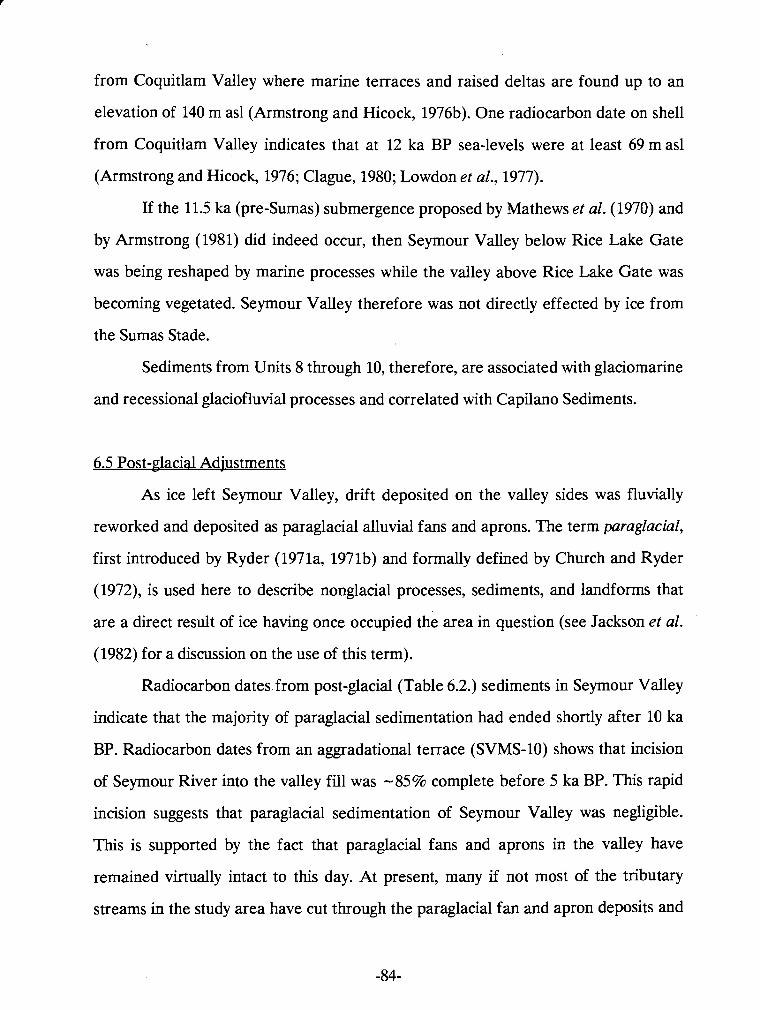
from Coquitlam Valley where marine terraces and raised deltas are found up to an
elevation of 140 m as1 (Armstrong and Hicock, 1976b). One radiocarbon date on shell
from Coquitlam Valley indicates that at 12 ka BP sea-levels were at least 69 m as1
(Armstrong and Hicock, 1976; Clague, 1980; Lowdon et al., 1977).
If the 11.5 ka (pre-Sumas) submergence proposed by Mathews et al. (1970) and
by Armstrong (1981) did indeed occur, then Seymour Valley below Rice Lake Gate
was being reshaped by marine processes while the valley above Rice Lake Gate was
becoming vegetated. Seymour Valley therefore was not directly effected by ice from
the Sumas Stade.
Sediments from Units 8 through 10, therefore, are associated with glaciomarine
and recessional glaciofluvial processes and correlated with Capilano Sediments.
6.5 Post-glacial Adjustments
As ice left Seymour Valley, drift deposited on the valley sides was fluvially
reworked and deposited as paraglacial alluvial fans and aprons. The term paraglacial,
first introduced by Ryder (1971a, 1971b) and formally defined by Church and Ryder
(1972), is used here to describe nonglacial processes, sediments, and landforms that
are a direct result of ice having once occupied the area in question (see Jackson et al.
(1982) for a discussion on the use of this term).
Radiocarbon dates. from post-glacial (Table 6.2.) sediments in Seymour Valley
indicate that the majority of paraglacial sedimentation had ended shortly after 10 ka
BP. Radiocarbon dates from an aggradational terrace (SVMS-10) shows that incision
of Seymour River into the valley fill was -85% complete before 5 ka BP. This rapid
incision suggests that paraglacial sedimentation of Seymour Valley was negligible.
This is supported by the fact that paraglacial fans and aprons in the valley have
remained virtually intact to this day. At present, many if not most of the tributary
streams in the study area have cut through the paraglacial fan and apron deposits and
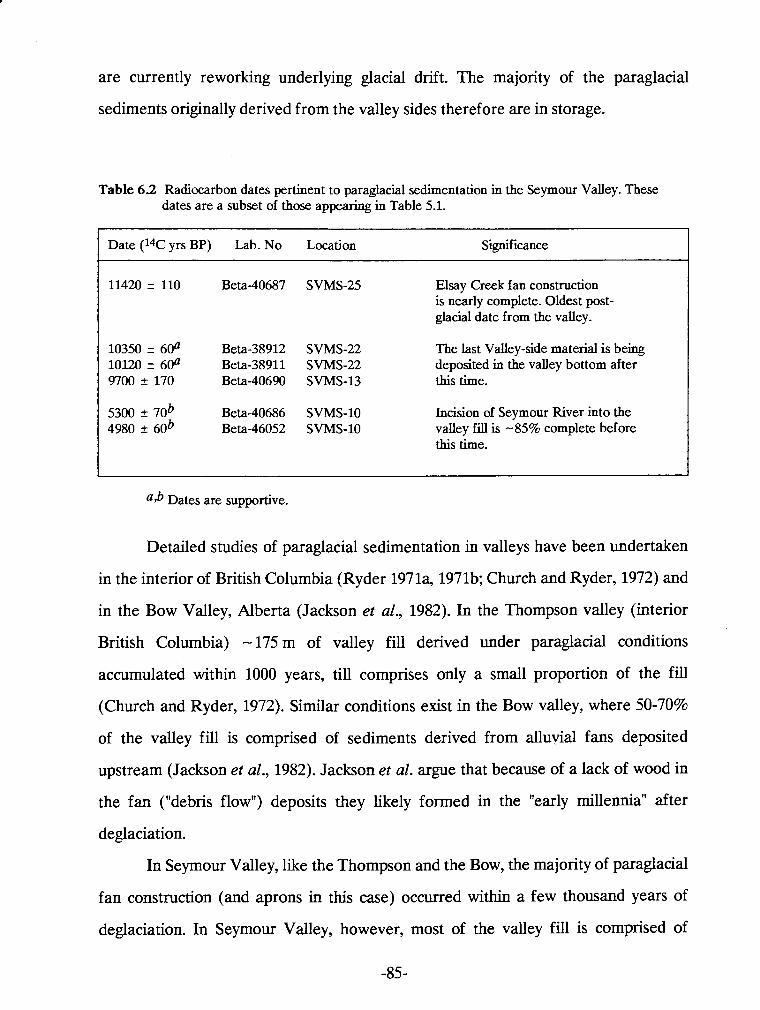
are currently reworking underlying glacial drift. The majority of the paraglacial
sediments originally derived from the valley sides therefore are in storage.
Table 6.2 Radiocarbon dates pertinent to paraglacial sedimentation in the Seymour Valley. These dates are a subset of those appearing in Table 5.1.
Date (14C yrs BP) Lab. No Location Signf icance
11420 + 110 Beta-40687 SVMS-25 Elsay Creek fan construction is nearly complete. Oldest post- glacial date from the valley.
10350 -t 60a Beta-38912 SVMS-22 The last Valley-side material is being 10120 + 60a Beta-38911 SVMS-22 deposited in the valley bottom after 9700 r 170 Beta-40690 SVMS-13 this time.
5300 + 7ob Beta-40686 SVMS-10 Incision of Seymour River into the 4980 r 6ob Beta-46052 SVMS-10 valley fill is - 85% complete before
this time.
Dates are supportive.
Detailed studies of paraglacial sedimentation in valleys have been undertaken
in the interior of British Columbia (Ryder 1971a, 1971b; Church and Ryder, 1972) and
in the Bow Valley, Alberta (Jackson et al., 1982). In the Thompson valley (interior
British Columbia) -175 m of valley fill derived under paraglacial conditions
accumulated within 1000 years, till comprises only a small proportion of the fill
(Church and Ryder, 1972). Similar conditions exist in the Bow valley, where 50-70%
of the valley fill is comprised of sediments derived from alluvial fans deposited
upstream (Jackson et al., 1982). Jackson et al. argue that because of a lack of wood in
the fan ("debris flow") deposits they likely formed in the "early millennia" after
deglaciation.
In Seymour Valley, like the Thompson and the Bow, the majority of paraglacial
fan construction (and aprons in this case) occurred within a few thousand years of
deglaciation. In Seymour Valley, however, most of the valley fill is comprised of
glacial drift and very little material derived from paraglacial fans and aprons has been
deposited downstream. It probably never played a major role in post-glacial
aggradation of the Seymour Valley. Toes of fans at Intake (Fig. 4.10), Suicide, and
Elsay creeks clearly have been reworked by Seymour River but most of this sediment
appears to have quickly moved out of the valley.
In apparent contrast to the Thompson and Bow valleys, the timing of fan and
apron formation in Seymour Valley appears to be more complex for much of the
apron material overlies organic-rich sediments, and mudflow deposits within fans
always contain abundant charcoal. Although the lack of wood (sticks and logs) in fan
and apron deposits in Seymour Valley does indicates rapid deposition, it does not in
all cases indicate immediate construction following deglaciation - there was clearly a
time, albeit short, where vegetation flourished in the valley bottom while a large
quantity of glacial sediment remained intact high on the valley sides. The remaining
valley-side glacial material may have finally been deposited in response to minor
climatic deterioration.
The palynological record in British Columbia shows cool and moist conditions
following deglaciation followed by an interval of relatively low precipitation and high
temperatures, sometimes referred to as the "early Holocene xerothermic interval"
(Mathewes and Heusser, 1981), between about 10 and 7.5 ka BP. This in turn was
followed by a return to cool and moist conditions after 7 ka BP (Mathewes, 1985); in
fact, glaciers in the Garibaldi area advanced between 6 and 5 ka BP (Ryder and
Thomson, 1985). The post-glacial history of the Seymour Valley therefore may be
summarized as follows:
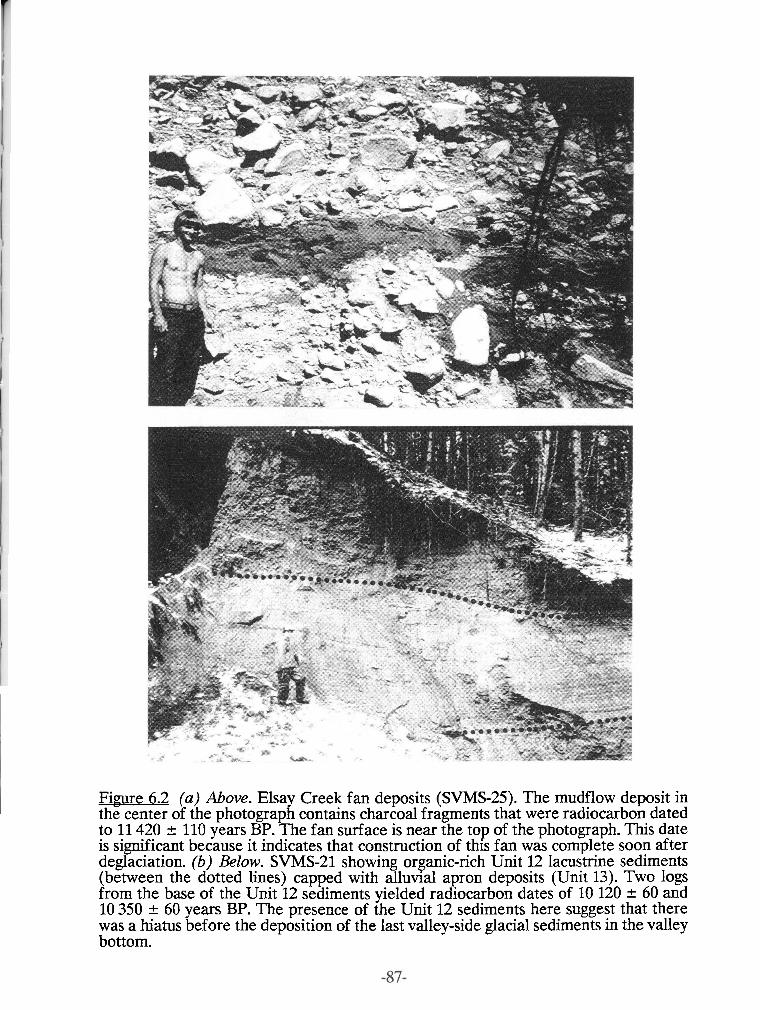
Figure 6.2 (a) Above. Elsay Creek fan deposits (SVMS-25). The mudflow deposit in the center of the photograph contains charcoal fragments that were radiocarbon dated to 11 420 t 110 years BP. The fan surface is near the top of the photograph. This date is significant because it indicates that construction of this fan was complete soon after deglaciation. (b) M o w . SVMS-21 showing organic-rich Unit 12 lacustrine sediments (between the dotted lines) capped with alluvlal apron deposits (Unit 13). Two logs from the base of the Unit 12 sediments yielded radiocarbon dates of 10 120 + 60 and 10 350 t 60 years BP. The presence of the Unit 12 sediments here suggest that there was a hiatus before the deposition of the last valley-side glacial sediments in the valley bottom.
1. Deglaciation to -11 ka BP: Climate cool and moist. Early paraglacial
sedimentation in progress. Elsay Creek fan construction nearly complete by - 11.4 ka
BP.
2. - 11 ka BP to - 7 ka BP(?): Climate warm and dry. A drier climate in conjunction
with the increasing presence of stabilizing vegetation results in reduced rates of
erosion and sedimentation. As paraglacial sedimentation slows Seymour River (and
tributaries) begin to incise the valley fill.
3. After -7 Ka BP(?): Climate cool and moist. Increasing rates of rainfall result in
increased rates of erosion and sedimentation. Paraglacial sedimentation chokes
tributaries, channels get infilled with organic-rich sediments and are finally capped
with debris flow material. Sediment supply from the valley sides quickly diminishes.
Fan and apron surfaces become vegetated and stable as streams once again incise.
Given this history, then the pre-5 ka BP aggradation of the lower Seymour
Valley (Unit 14 sediments), might have been a response to (3), above.
6.6 Conclusions
The late Quaternary history and stratigraphy of lower Seymour Valley has now
been elaborated. The surficial sediments and landforms in the valley show an almost
continuous record of sedimentation over a time span more than 37 000 radiocarbon
years. Of the 13 Lithostratigraphic units defined for the Fraser Lowland (Fig. 2.1), 6
occur in Seymour Valley (Table 6.3). The sedimentary history of Seymour Valley,
over this time period, therefore may be summarized as follows:
(1) Before 37 ka BP to at least 29 ka: Seymour Valley between Rice Lake and the
bedrock canyon, and probably beyond, was occupied by a swamp(?) which was
periodically infilled with fluvial sediments, possibly in response to climatic change.
(2) After 29 ka BP to 22 ka BP: The rate of sedimentation in Seymour Valley
increased dramatically; vegetation was overridden by outwash sands as ice in the
headwaters began to advance. By 22 ka BP ice reached the mouth of the valley.
(3) 22 ka BP to -17 ka BP: An unstable ice margin in the Fraser Lowland resulted in
multiple impoundments of Seymour River. Till, glaciofluvial, fluvial, and possibly
glaciomarine sediments were deposited. Sometime before 18 ka BP the ice has
retreated far enough, and for long enough, to allow vegetation to become established.
This hiatus lasted at least 1000 years (based on radiocarbon dates from Seymour
Valley) and possibly up to 4000 years (based on Coquitlam Valley data from Hicock et
al., 1982a). By about 17 ka BP ice once again arrived at the mouth of Seymour Valley
and till is deposited.
(4) 17 ka BP to 12 ka BP: Ice probably remained in the valley until about 12 ka BP.
Before 11.4 ka BP ice had retreated and vegetation once again became established.
(5) I 2 ka BP to present: Glacial sediments were reworked by Seymour River and its
tributaries, and by marine processes as the sea invaded the isostatically depressed
valley. Alluvial fans and aprons composed of reworked glacial sediments formed and
became stable after 10 ka BP, their rate of formation somewhat conditioned by
climatic fluctuations during the immediate postglacial. Before 5 ka BP incision of the
Seymour River into the valley fill was -85% complete, interrupted by only minor
period(s) of aggradation. Seymour River became graded to bedrock. The glacial valley
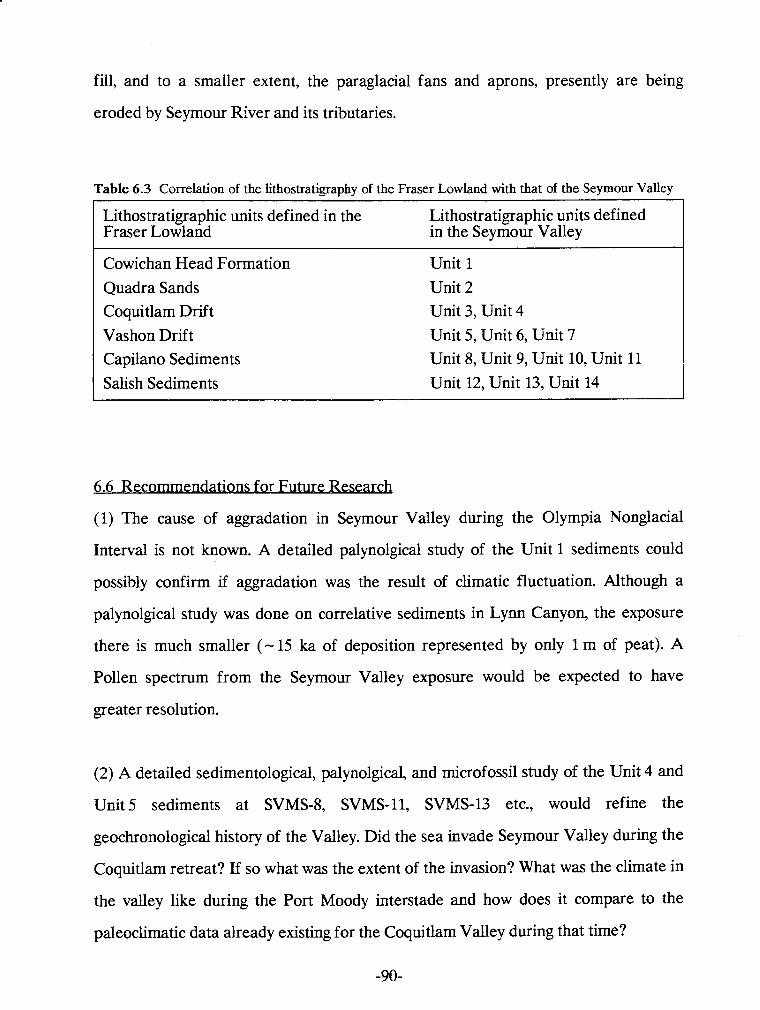
fill, and to a smaller extent, the paraglacial fans and aprons, presently are being
eroded by Seymour River and its tributaries.
Table 6.3 Correlation of the lithostratigraphy of the Fraser Lowland with that of the Seymour Valley
Lithostratigraphic units defined in the Lithostratigraphic units defined Fraser Lowland in the Seymour Valley
Cowichan Head Formation Quadra Sands Coquitlam Drift Vashon Drift Capilano Sediments Salish Sediments
Unit 1
Unit 2 Unit 3, Unit 4
Unit 5, Unit 6, Unit 7 Unit 8, Unit 9, Unit 10, Unit 11 Unit 12, Unit 13, Unit 14
6.6 Recommendations for Future Research
(1) The cause of aggradation in Seymour Valley during the Olympia Nonglacial
Interval is not known. A detailed palynolgical study of the Unit 1 sediments could
possibly confirm if aggradation was the result of climatic fluctuation. Although a
palynolgical study was done on correlative sediments in Lynn Canyon, the exposure
there is much smaller (- 15 ka of deposition represented by only 1 m of peat). A
Pollen spectrum from the Seymour Valley exposure would be expected to have
greater resolution.
(2) A detailed sedimentological, palynolgical, and microfossil study of the Unit 4 and
Unit 5 sediments at SVMS-8, SVMS-11, SVMS-13 etc., would refine the
geochronological history of the Valley. Did the sea invade Seymour Valley during the
Coquitlam retreat? If so what was the extent of the invasion? What was the climate in
the valley like during the Port Moody interstade and how does it compare to the
paleoclimatic data already existing for the Coquitlam Valley during that time?
(3) A study of Seymour Valley above Seymour Falls Dam might show the extent of
the Coquitlam retreat. There is as yet no evidence to indicate the extent of this retreat.
(4) Post glacial sedimentation in Seymour Valley appears to have been complex.
There appears to be an interval when the rate of post-glacial sedimentation decreased
during a time of generally high rates of sedimentation. The timing of this interval is
not exactly known but could be defined with additional radiocarbon dating. It is
possible that this "interval" was climatically induced. A palynolgical study of the
sediments deposited during this time (Unit 12) could test this hypothesis.
(5) A more regional study of valleys opening into Burrard Inlet (Lynn, Capilano, etc.
valleys) and Howe Sound may shed light on the extent of the Coquitlam Stade.
APPENDIX A
THERMOLUMINESCENCE DATING OF UNIT 1 PEATS
A. 1 Introduction
This appendix presents the experimental procedure, data, results, and
conclusions of the thermoluminescence (TL) experiments performed on Seymour
Valley Unit 1 peats (SVPI and SVP2). This appendix is required because the science
of TL dating of sediments is still in its infancy and therefore if TL dates are to be
quoted, the data must also be presented. The general principles of the TL dating of
Quaternary events can be found in Berger (1988) or Aitken (1985). The rationale
behind this study is discussed in Chapter 3.
A.2 The Ex~eriment
The Partial Bleach (R-T) method (Wintle and Huntley, 1982) was used to
determine the time of deposition of fine-grained (4-11 pm) sediments found within
two of the woody peat beds contained within the sediments of Unit 1. Peat beds were
chosen because they represent former low energy environments (relatively slow rates
of sediment deposition) important to the zeroing of the TL clock. It was hoped that,
by sampling peat clean of fluvial sand beds, aeolian sediments would be acquired.
Peat also has been found to act as a closed system thereby reducing the probability of
inputs or outputs of uranium and/or thorium over time (Van der Wijk et al., 1986) .
A.3 Field Procedures
Two woody peat beds (SVP1 and SVP2) were selected for TL dating. The
location and stratigraphic position of these beds can be found in Chapter 4. SVPl
consisted of an -20 cm thick bed of woody peat, while SVP2 consisted of a -20 cm
thick peat bed containing an -2 cm thick bed of sand. The peat below this sand bed
was sampled.
In order to determine the gamma-ray contribution to the dose rate, on-site
gamma-ray spectroscopy was performed using an Exploranium model GR-256
portable gamma-ray spectrometer. In each case, the spectrometer probe was inserted
-50 cm into the section. In the case of SVP1, the probe was inserted into a sand bed
directly above the peat bed, and in the case of SVP2, the probe was inserted in a sand
bed directly below the peat bed. In each case the surface of the probe was in contact
with the peat bed to be sampled. The probe was inserted into the adjacent sand beds
because the peat beds were impossible to auger using the equipment available at the
time.
Subsequent to the gamma-ray analysis, a section (block) of each peat bed was
removed for laboratory analysis.
A.4 Laboratory Procedure - Sample preparation
The following is the procedure that was used to extract the desired sediments
from the peat. It is essentially the same procedure used by Divigalpitiya (1982). One
can refer to this reference for a more detailed explanation. All of the following steps
were performed under appropriate lighting conditions.
1. The outer surfaces of the peat blocks sampled from the field were removed. This material had been exposed to light and therefore could not be used for dating purposes.
2. The peat blocks were examined for any small sand beds. If a sand bed was found, the block was split about this bed. This was done to avoid sampling any sediments which had been deposited by fluvial processes. It was therefore hoped that aeolian sediments were being sampled. Two such beds (-3 mm thick) were found in SVP2; none were found in SVP1.
3. A few grams of peat was shaved off with a knife and left in distilled water for about two days. This was done so that the peat could expand and loosen up.
4. The sample was then wet-sieved through a 37 pm nylon screen. This was done to m i i m k the size of the organic fragments used in step 5.
5. The <37 pm fraction was put in 10% H202; fresh H202 was added each day. After three days the
organics had oxidized and the remaining sample (minerals) was rinsed with distilled water.
6. The sample was put in 10% HC1 for two hours and then rinsed with distilled water. This was done to remove any carbonates present.
7. The sample was put in 100 ml of citrate bicarbonate dithionate (CBD) for 12 hours. This was done to remove any TGblocking iron oxide coatings on the sediment grains. The CBD solution was made by adding 71 g of citrate, 85 g of bicarbonate, and 2 g of dithionate to 1 liter of distilled water.
8. Stokes settling in a 20 cm column of 1 g/liter Calgon solution for 4 hours (suspension discarded) and then for 30 minutes (suspension saved) to separate 4-11 pm size grains. The Calgon is needed to defloculate any clay present.
9. The 4-11 p grains were rinsed with distilled water, methanol, and acetone. Equal quantities (1 ml) of a suspension of the sediment in acetone was then pipetted into vials containing 1 cm diameter aluminum disks. The vials were then set aside to allow the acetone to evaporate. The final result was a number of aluminum disks covered with a uniform layer of sediment.
A S Laborato~ Procedure - Determination of the Eauivalent Dose
The equivalent dose (Dq) was determined using the Partial Bleach (R-T)
method. The procedure was as follows:
1. To construct the R-T curves, portions of each sample were given gamma doses of 0, 30, 60, 90, and 120 Gy y using a 6 0 ~ o source (Atomic Energy of Canada Ltd. model 200 Gammacell; dose rate = 0.75
GY/&).
2. To determine the a effectiveness (b-value), portions of each sample were irradiated for 80, 160,240, and 320 min. using an Oxford style a-irradiator (241~m source; strength -0.38 ~-~min- l ) .
3. The "bleachability" of the samples was tested by exposing one of them (SVP1) for different durations under artificial light (simulated sunlight). A Philips halogen automobile headlamp (lens removed) behind a Corning 0-52 glass filter was used to deliver 5.8 mW of light to the sample. The Corning 0-52 filter cuts out excessive UV light ( 4 4 0 nm) produced by the halogen lamp and therefore helps approximate the natural bleaching that would have occurred during aeolian transportation.
After studying the results (Fig. A.1) it was decided that 10 hours of exposure would be used to produce the bleached portion of the samples.
4. To eliminate the effects of anomalous fading, the samples were heated at 110 O C for four days as per the recommendation of Dr. Glenn Berger, (personal communication, 1991).
5. Half of the sample disks were bleached for 10 hours (see step 3 above) and then set aside for approximately two weeks.
6. The TL of all the sample disks were measured using the apparatus described by Divigalpitiya (1982). The optical filters used in front of the photomultiplier tube, in this case, consisted of a Schott KG-1 (heat absorbing filter), a Schott BG-38, and a Corning 7-59.
7. R-T plots or growth curves (Fig. A2) and finally plateau plots (Dq vs temperature) (Fig. A.4) were
constructed from the aquired data. The Dq for each sample was estimated from the "plateau" data
and appears in Table A.4.
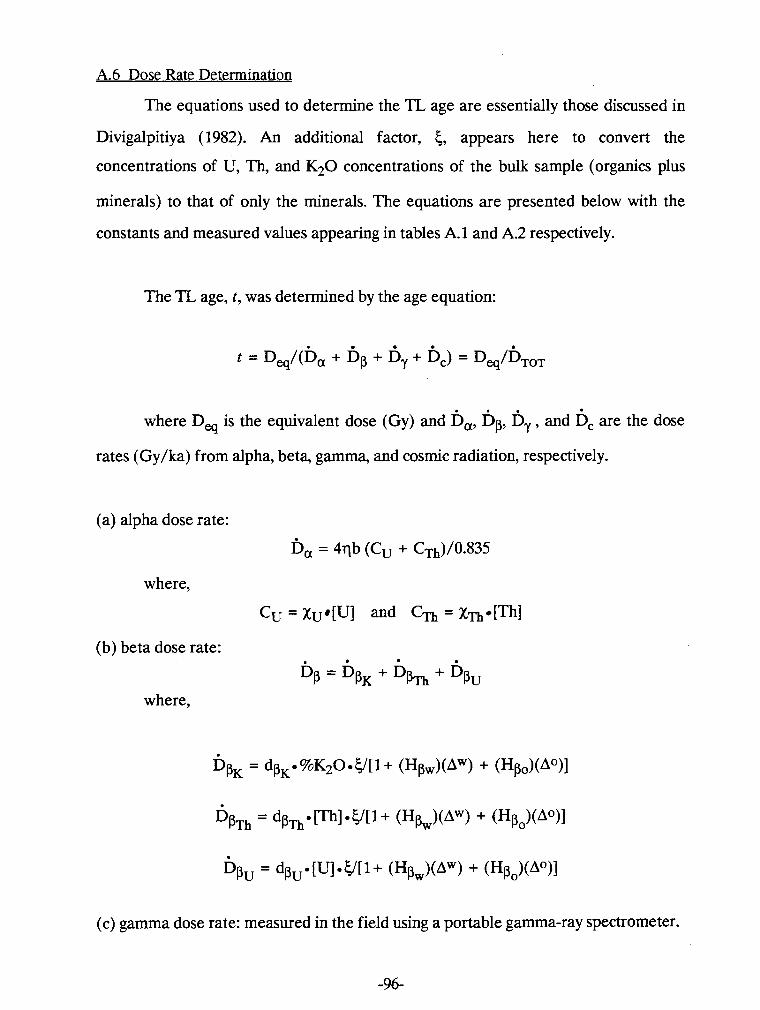
A.6 Dose Rate Determination
The equations used to determine the TL age are essentially those discussed in
Divigalpitiya (1982). An additional factor, 5, appears here to convert the
concentrations of U, Th, and K 2 0 concentrations of the bulk sample (organics plus
minerals) to that of only the minerals. The equations are presented below with the
constants and measured values appearing in tables A.l and A.2 respectively.
The TL age, t, was determined by the age equation:
where Deq is the equivalent dose (Gy) and D , D ~ , D ~ , and D~ are the dose
rates (Gy/ka) from alpha, beta, gamma, and cosmic radiation, respectively.
(a) alpha dose rate:
where,
Cu = xu [U] and CTh = xTh [Th]
(b) beta dose rate:
where,
(c) gamma dose rate: measured in the field using a portable gamma-ray spectrometer.
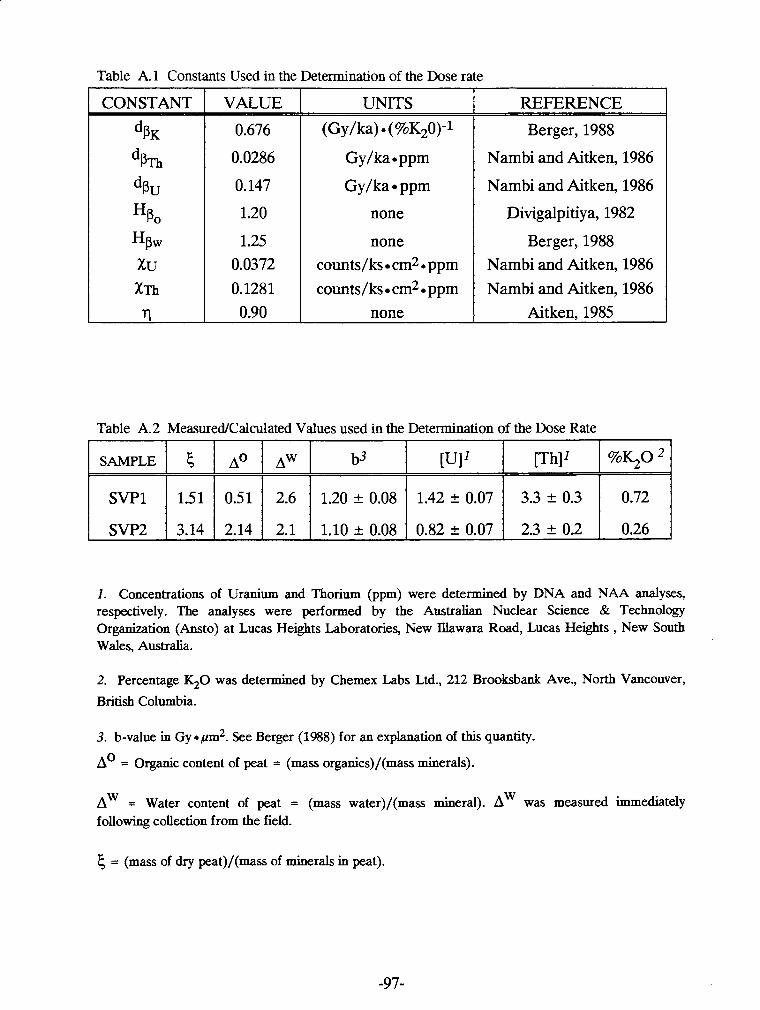
Table A. 1 Constants Used in the Determination of the Dose rate
Table A.2 MeasuredlCalculated Values used in the Determination of the Dose Rate
CONSTANT
d~~
d ~ n d~~
H ~ o
XU X T ~
71
1. Concentrations of Uranium and Thorium (ppm) were determined by DNA and NAA analyses, respectively. The analyses were performed by the Australian Nuclear Science & Technology Organization (Ansto) at Lucas Heights Laboratories, New Illawara Road, Lucas Heights , New South Wales, Australia.
VALUE
0.676
0.0286
0.147
1.20
1.25 0.0372 0.1281 0.90
2. Percentage K20 was determined by Chemex Labs Ltd., 212 Brooksbank Ave., North Vancouver,
British Columbia.
%$o
0.72
0.26
3. b-value in ~y *pm2. See Berger (1988) for an explanation of this quantity.
0 A = Organic content of peat = (mass organics)/(mass minerals).
UNITS
(Gy/ka) (%K20)-l
Gy/ka *ppm
Gy/ka.ppm
none
none counts/ks cm2. ppm
counts/ks cm2 ppm none
SAMPLE -
S W 1
S W 2
AW = Water content of peat = (mass water)/(mass mineral). was measured immediately following collection from the field.
REFERENCE
Berger, 1988
Nambi and Aitken, 1986
Nambi and Aitken, 1986
Divigalpitiya, 1982
Berger, 1988 Nambi and Aitken, 1986 Nambi and Aitken, 1986
Aitken, 1985
5
1.51
3.14
5 = (mass of dry peat)/(mass of minerals in peat).
[Thl
3.3 k 0.3
2.3k0.2
AO
0.51
2.14
A~
2.6
2.1
b3
1.20 k 0.08
1.10+0.08
[ull
1.42 k 0.07
0.82k0.07
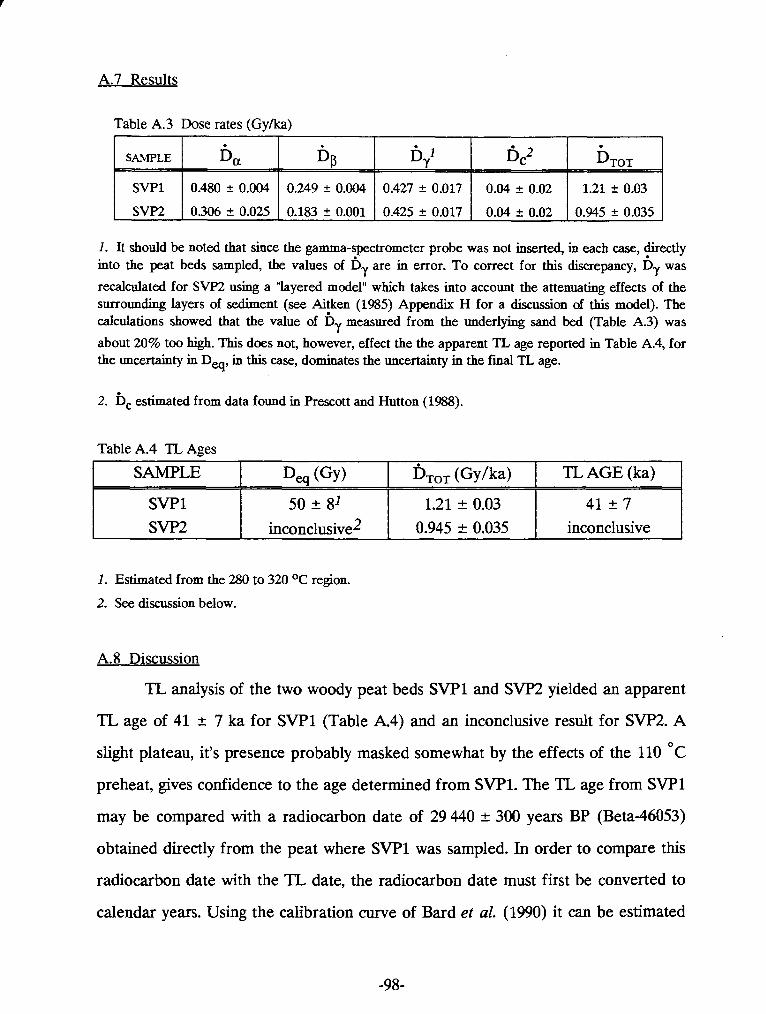
A.7 Results
Table A.3 Dose rates ( G y k )
SAMPLE
1. It should be noted that since the gamma-spectrometer probe was not inserted, in each case, +rectly into the peat beds sampled, the values of hy are in error. To correct for this discrepancy, Dy was
recalculated for SVP2 using a "layered model" which takes into account the attenuating effects of the surrounding layers of sediment (see Aitken (1985) Appendix H for a discussion of this model). The calculations showed that the value of % measured from the underlying sand bed (Table A.3) was
DTOT
SVPl
SVF2
about 20% too high. This does not, however, effect the the apparent TL age reported in Table A.4, for the uncertainty in Dq, in this case, dominates the uncertainty in the final TL age.
2. bc estimated from data found in Prescott and Hutton (1988).
0.480 r 0.004
0.306r0.025
Table A.4 TL Ages
0.249 + 0.004
0.183+0.001
SVPl SVP2
SAMPLE
0.427 r 0.017
0.425k0.017
1. Estimated from the 280 to 320 OC region.
2. See discussion below.
Dq (GY)
50 + 8l
inconclusive2
A.8 Discussion
TL analysis of the two woody peat beds SVPl and SVP2 yielded an apparent
TL age of 41 k 7 ka for SVPl (Table A.4) and an inconclusive result for SVP2. A
slight plateau, it's presence probably masked somewhat by the effects of the 110 OC
preheat, gives confidence to the age determined from SVP1. The TL age from SVPl
may be compared with a radiocarbon date of 29 440 + 300 years BP (Beta-46053)
obtained directly from the peat where SVPl was sampled. In order to compare this
0.04 r 0.02
0.04k0.02
TOT (G~/ka) I TL AGE (ka)
radiocarbon date with the TL date, the radiocarbon date must first be converted to
calendar years. Using the calibration curve of Bard et al. (1990) it can be estimated
1.21 k 0.03
0.945k0.035
1.21 2 0.03 0.945 + 0.035
41 + 7 inconclusive
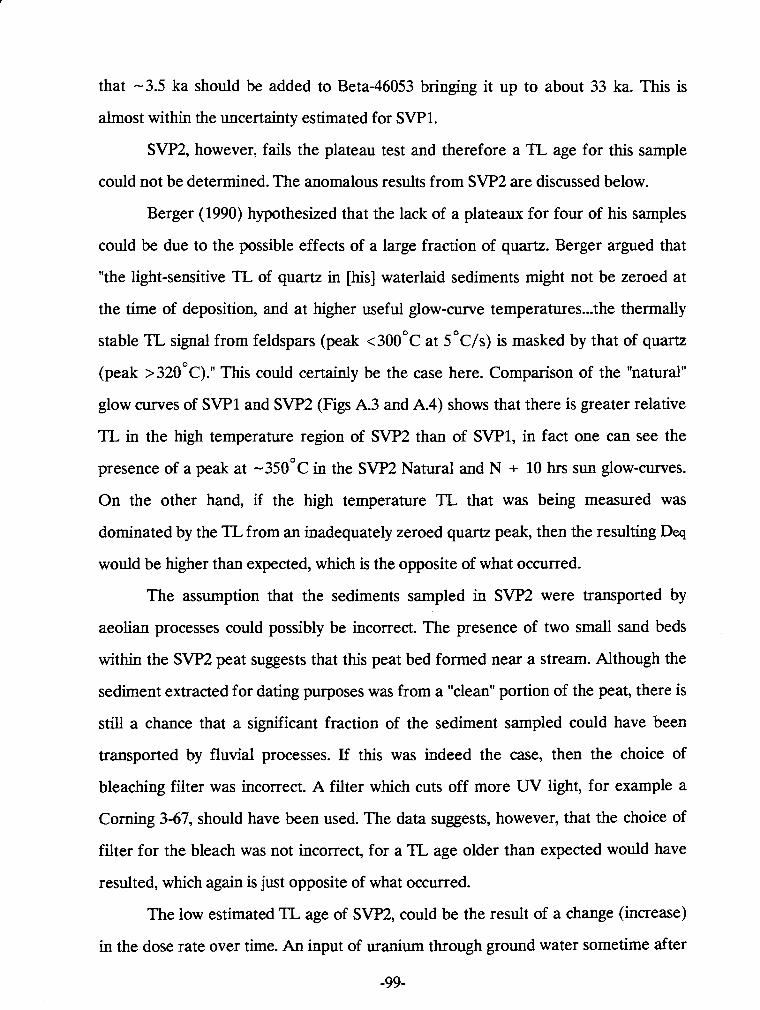
that -3.5 ka should be added to Beta46053 bringing it up to about 33 ka. This is
almost within the uncertainty estimated for SVP1.
SVP2, however, fails the plateau test and therefore a TL age for this sample
could not be determined. The anomalous results from SVP2 are discussed below.
Berger (1990) hypothesized that the lack of a plateaux for four of his samples
could be due to the possible effects of a large fraction of quartz. Berger argued that
"the light-sensitive TL of quartz in [his] waterlaid sediments might not be zeroed at
the time of deposition, and at higher useful glow-curve temperatures ... the thermally
stable TL signal from feldspars (peak <300•‹c at ~OC/S) is masked by that of quartz
(peak >320•‹c)." This could certainly be the case here. Comparison of the "natural"
glow curves of SVPl and SVP2 (Figs A.3 and A.4) shows that there is greater relative
TL in the high temperature region of SVP2 than of SVP1, in fact one can see the
presence of a peak at - 3 5 0 ' ~ in the SVP2 Natural and N + 10 hrs sun glow-curves.
On the other hand, if the high temperature TL that was being measured was
dominated by the TL from an inadequately zeroed quartz peak, then the resulting Deq
would be higher than expected, which is the opposite of what occurred.
The assumption that the sediments sampled in SVP2 were transported by
aeolian processes could possibly be incorrect. The presence of two small sand beds
within the SVP2 peat suggests that this peat bed formed near a stream. Although the
sediment extracted for dating purposes was from a "clean" portion of the peat, there is
still a chance that a significant fraction of the sediment sampled could have been
transported by fluvial processes. If this was indeed the case, then the choice of
bleaching filter was incorrect. A filter which cuts off more W light, for example a
Corning 3-67, should have been used. The data suggests, however, that the choice of
filter for the bleach was not incorrect, for a TL age older than expected would have
resulted, which again is just opposite of what occurred.
The low estimated TL age of SVP2, could be the result of a change (increase)
in the dose rate over time. An input of uranium through ground water sometime after
-99-
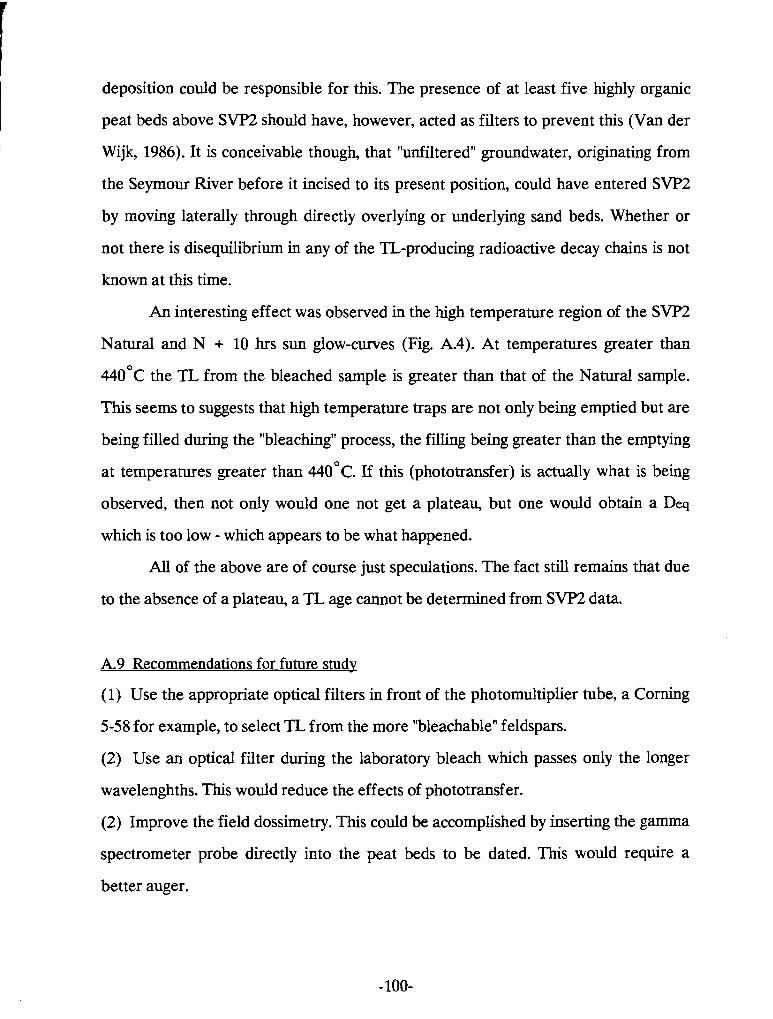
deposition could be responsible for this. The presence of at least five highly organic
peat beds above SVP2 should have, however, acted as filters to prevent this (Van der
Wijk, 1986). It is conceivable though, that "unfiltered" groundwater, originating from
the Seymour River before it incised to its present position, could have entered SVP2
by moving laterally through directly overlying or underlying sand beds. Whether or
not there is disequilibrium in any of the TL-producing radioactive decay chains is not
known at this time.
An interesting effect was observed in the high temperature region of the SVP2
Natural and N + 10 hrs sun glow-curves (Fig. A.4). At temperatures greater than
4 4 0 ' ~ the TL from the bleached sample is greater than that of the Natural sample.
This seems to suggests that high temperature traps are not only being emptied but are
being filled during the "bleaching" process, the filling being greater than the emptymg
at temperatures greater than 4 4 0 ~ ~ . If this (phototransfer) is actually what is being
observed, then not only would one not get a plateau, but one would obtain a Dq
which is too low - which appears to be what happened.
All of the above are of course just speculations. The fact still remains that due
to the absence of a plateau, a TL age cannot be determined from SVP2 data.
A.9 Recommendations for future study
(1) Use the appropriate optical filters in front of the photomultiplier tube, a Corning
5-58 for example, to select TL from the more "bleachable" feldspars.
(2) Use an optical filter during the laboratory bleach which passes only the longer
wavelenghths. This would reduce the effects of phototransfer.
(2) Improve the field dossimetry. This could be accomplished by inserting the gamma
spectrometer probe directly into the peat beds to be dated. This would require a
better auger.
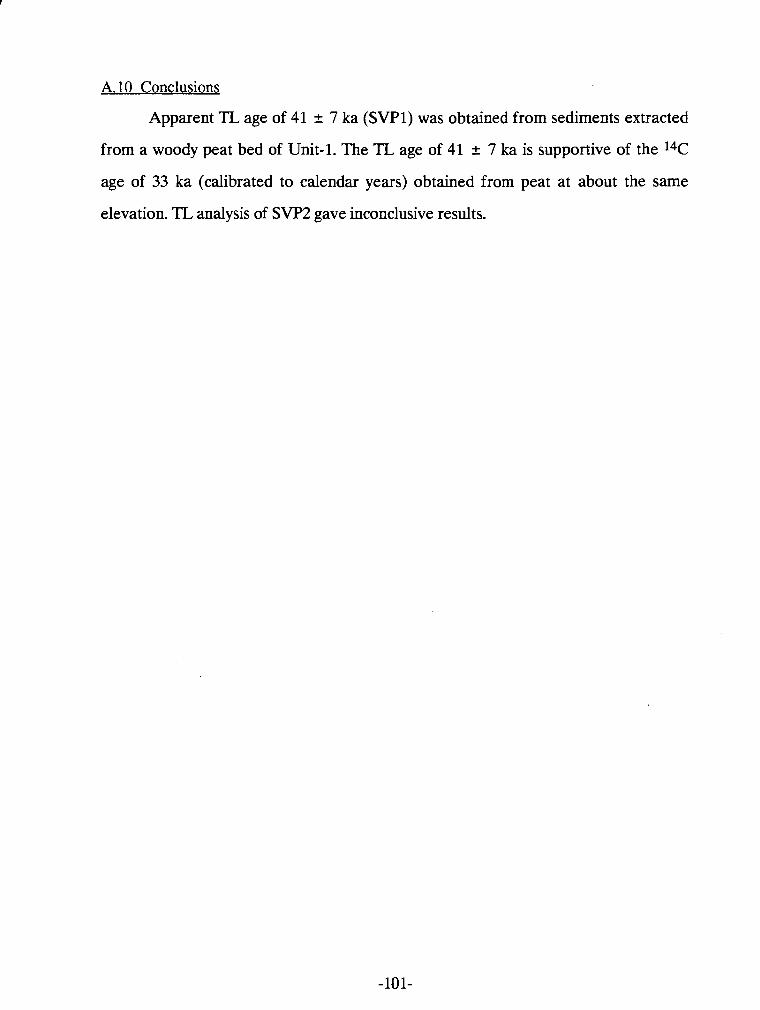
A. 10 Conclusions
Apparent TL age of 41 + 7 ka (SVP1) was obtained from sediments extracted
from a woody peat bed of Unit-1. The TL age of 41 + 7 ka is supportive of the 14C
age of 33 ka (calibrated to calendar years) obtained from peat at about the same
elevation. TL analysis of SVP2 gave inconclusive results.
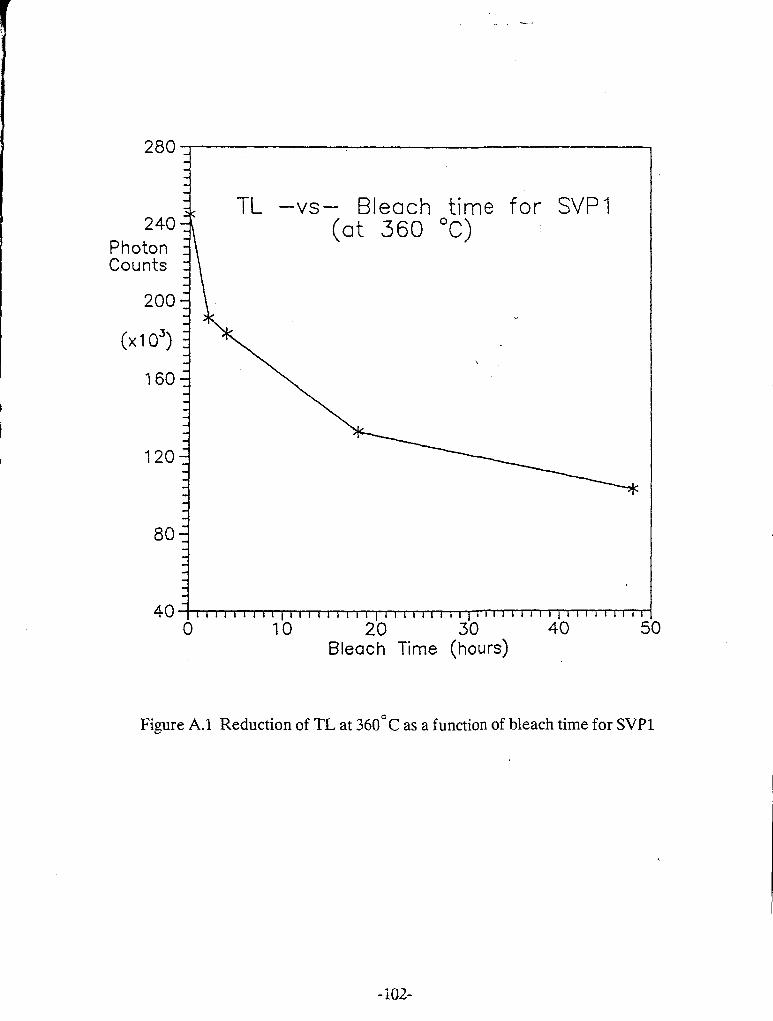
$ TL -vs- Bleach time for SVPl 240
Photon ]\ Counts
(at 360 "c)
Bleach Time (hours)
Figure A.l Reduction of TZ at 3 6 0 ' ~ as a function of bleach time for SVPl
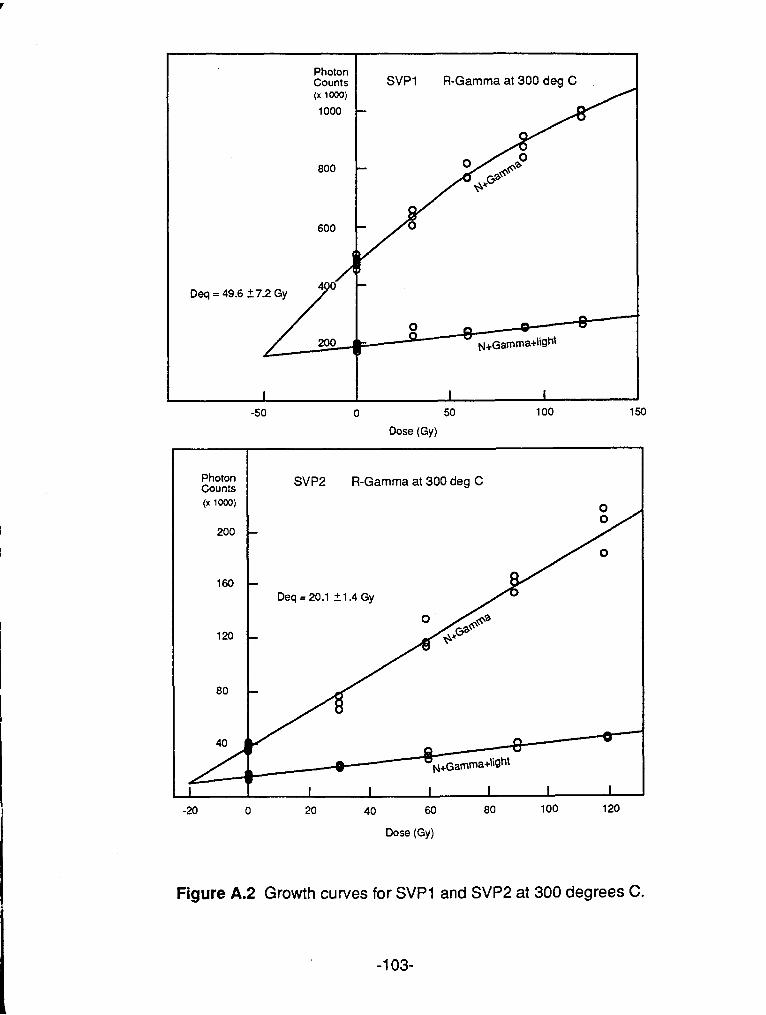
Deq = 49.6 2 7.2 Gy
Photon I Counts SVPl R-Gamma at 300 dm C
Photon Counts (x 1000)
200
160
120
80
2 I
Dose (Gy)
SVP2 R-Gamma at 300 deg C
0
Deq = 20.1 21.4 Gy
-20 0 20 40 60 80 100 120
Dose (Gy)
Figure A.2 Growth curves for SVP1 and SVP2 at 300 degrees C.
-1 03-
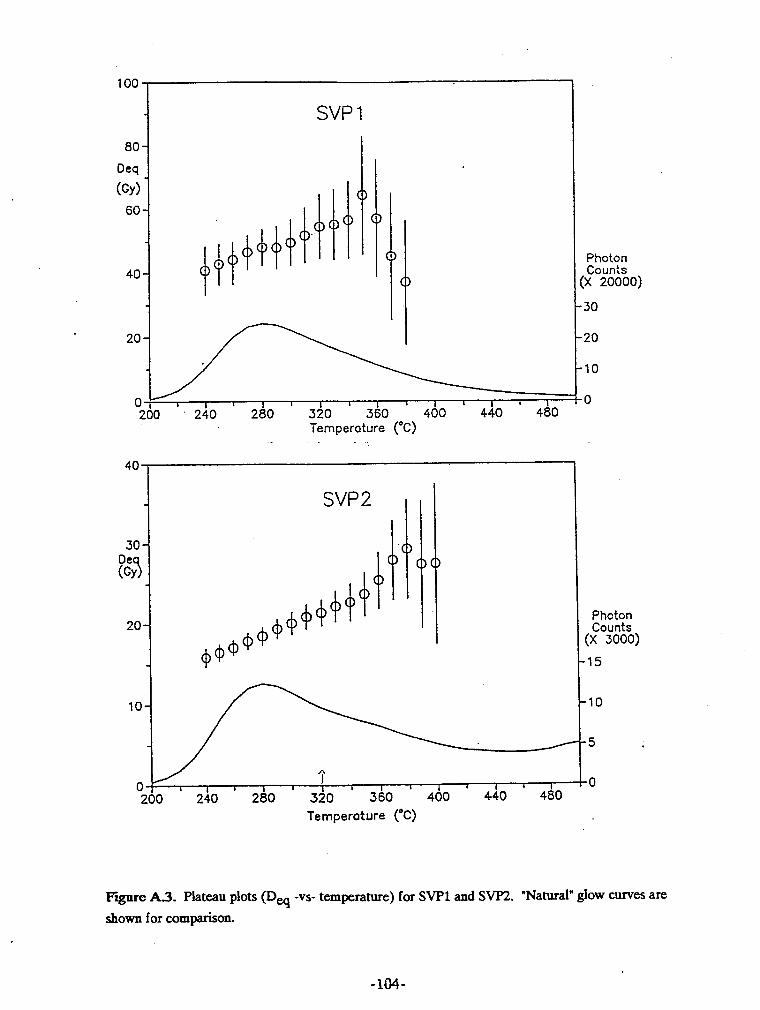
SVP 1
I I I I I I I 1 I I I I I I
3 240 280 320 360 400 440 480 Temperature (OC)
Photon Counts
:x 20000)
Temperature ("C)
Photon Counts
(X 3000)
-15
-10
F p r e A.3. Plateau plots (Dq -vs- temperature) for SVPl and SWZ. 'Natural" glow curves are shown for comparison.
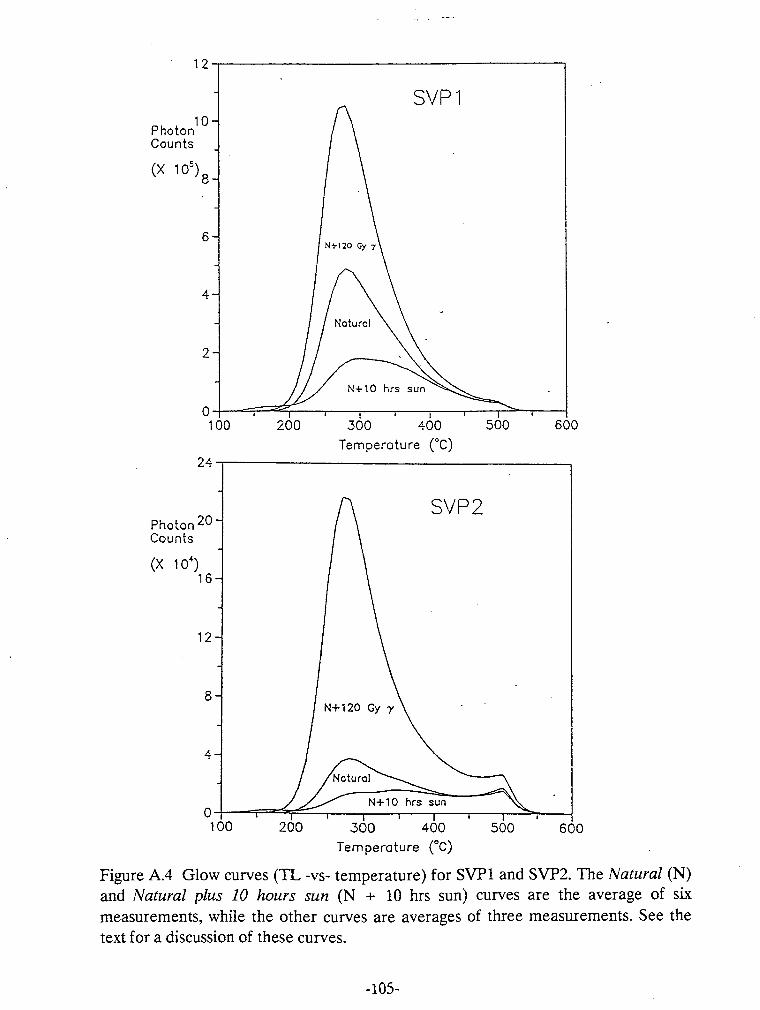
Temperature ("C)
Temperature ("C)
Figure A.4 Glow curves (TL -vs- temperature) for SVPl and SVP2. The Natural (N) and Natural plus 10 hours sun ( N + 10 hrs sun) curves are the average of six measurements, while the other curves are averages of three measurements. See the text for a discussion of these curves.
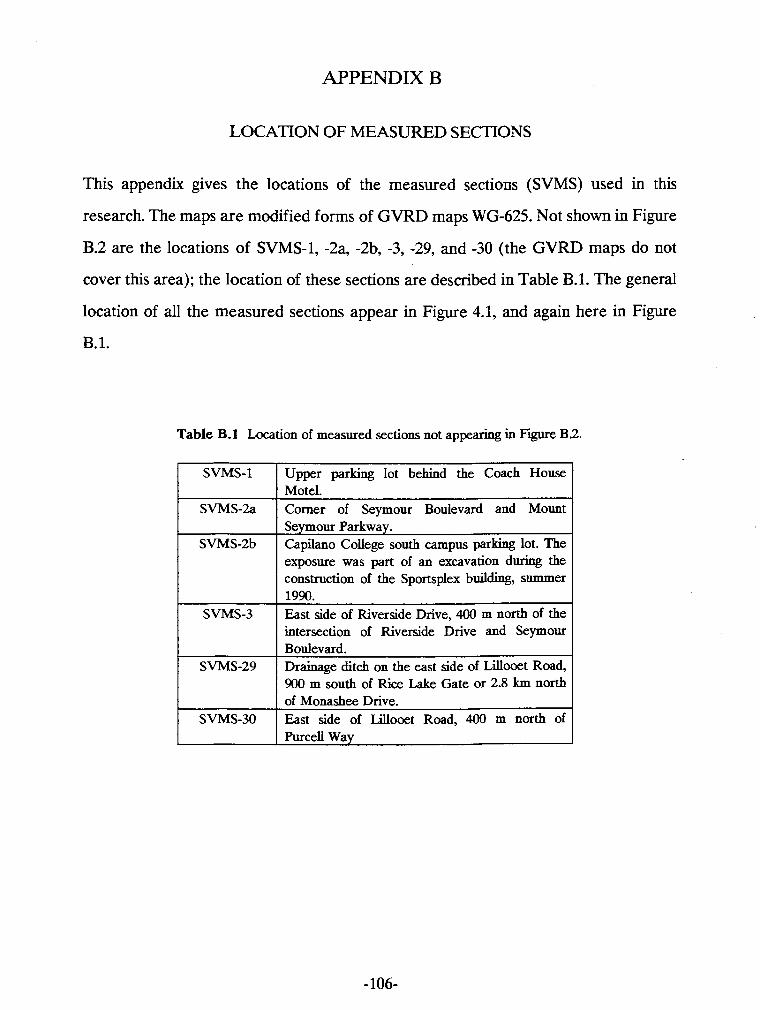
APPENDIX B
LOCATION OF MEASURED SECTIONS
This appendix gives the locations of the measured sections (SVMS) used in this
research. The maps are modified forms of GVRD maps WG-625. Not shown in Figure
B.2 are the locations of SVMS-1, -2a, -2b, -3, -29, and -30 (the GVRD maps do not
cover this area); the location of these sections are described in Table B.1. The general
location of all the measured sections appear in Figure 4.1, and again here in Figure
B. 1.
Table B.1 Location of measured sections not appearing in Figure B.2.
SVMS-1 I Upper parking lot behind the Coach House
SVMS-2a Motel. Comer of Seymour Boulevard and Mount
SVMS-2b
I I intersection of Riverside Drive and Seymour
Seymour Parkway. Capilano College south campus parking lot. The exposure was part of an excavation during the construction of the Sportsplex building, summer
SVMS-3 1990. East side of Riverside Drive, 400 m north of the
SVMS-29 Boulevard. Drainage ditch on the east side of Lillooet Road, 900 m south of Rice Lake Gate or 2.8 km north
SVMS-30 of Monashee Drive. East side of LiUooet Road, 400 m north of Purcell Way
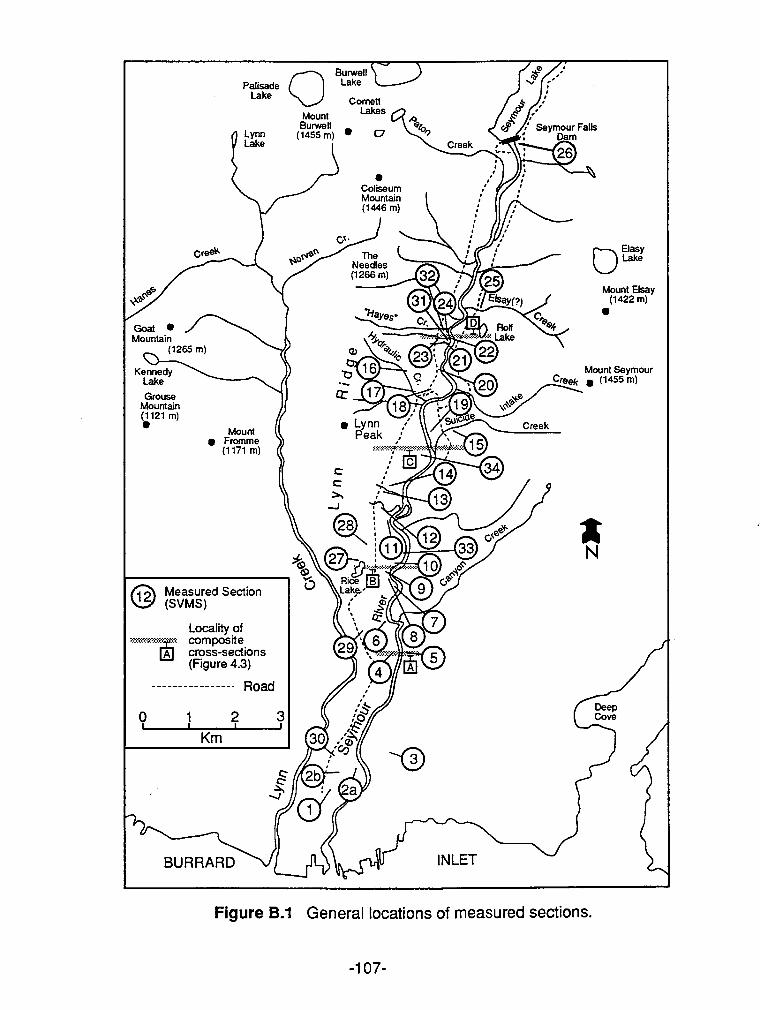
Locality of
Figure B.l General locations of measured sections.
-1 07-
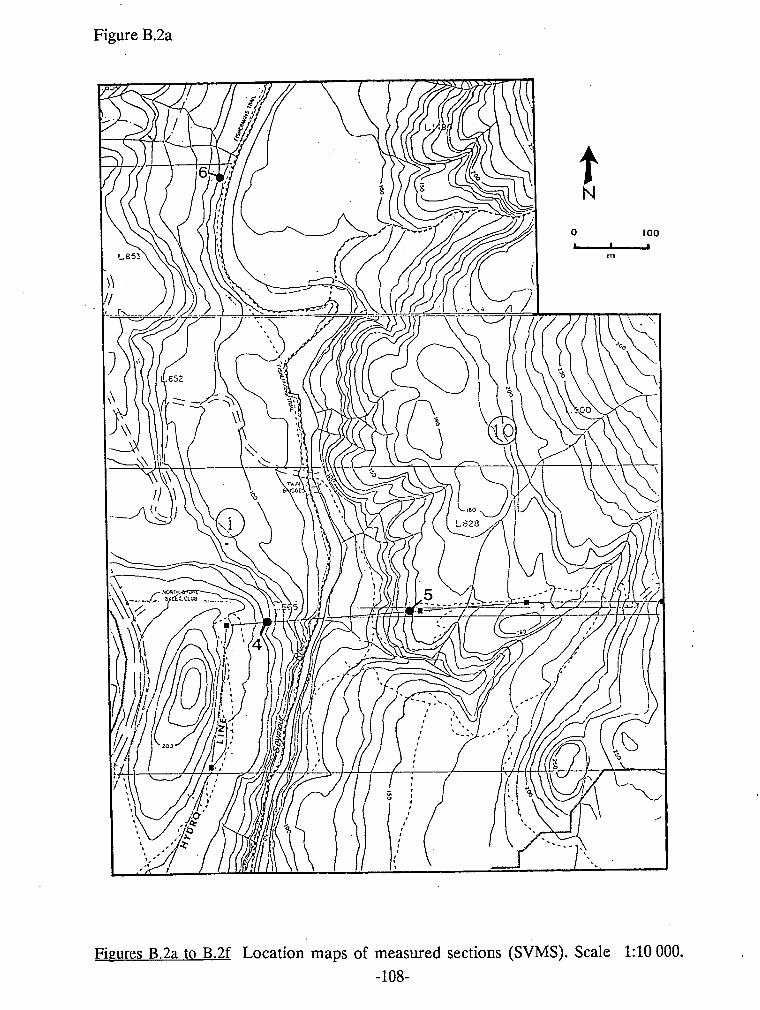
Figure B.2a
Figures B.2a to B.2f Location maps of measured sections (SVMS). Scale 1:10 000. -108-
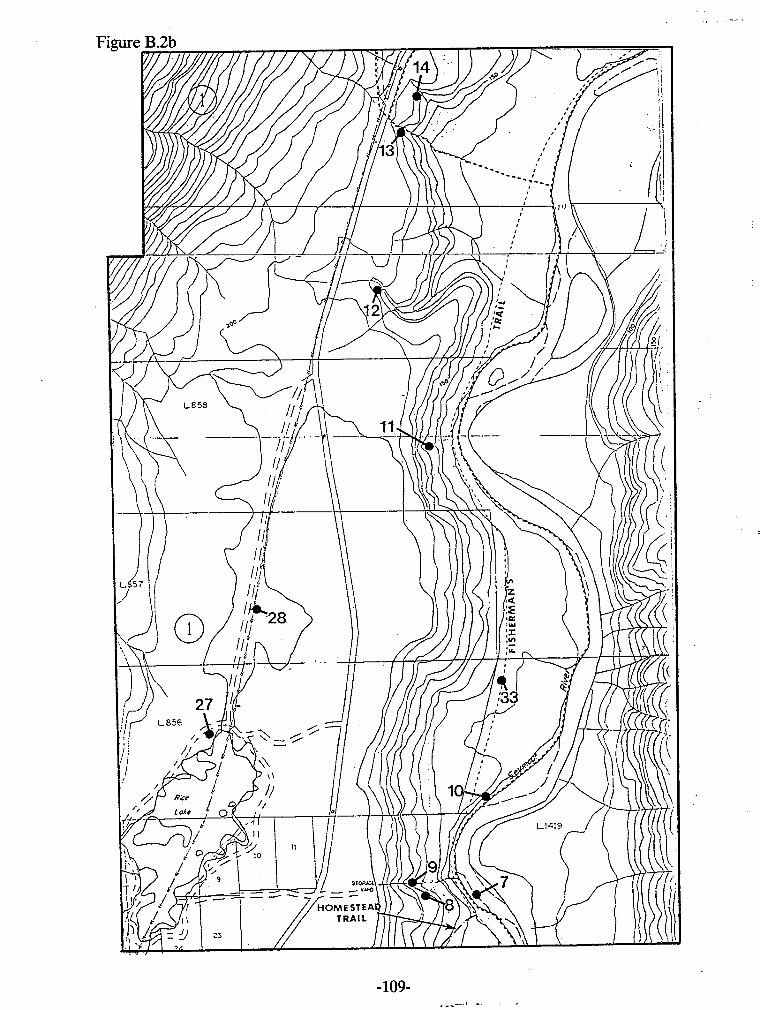
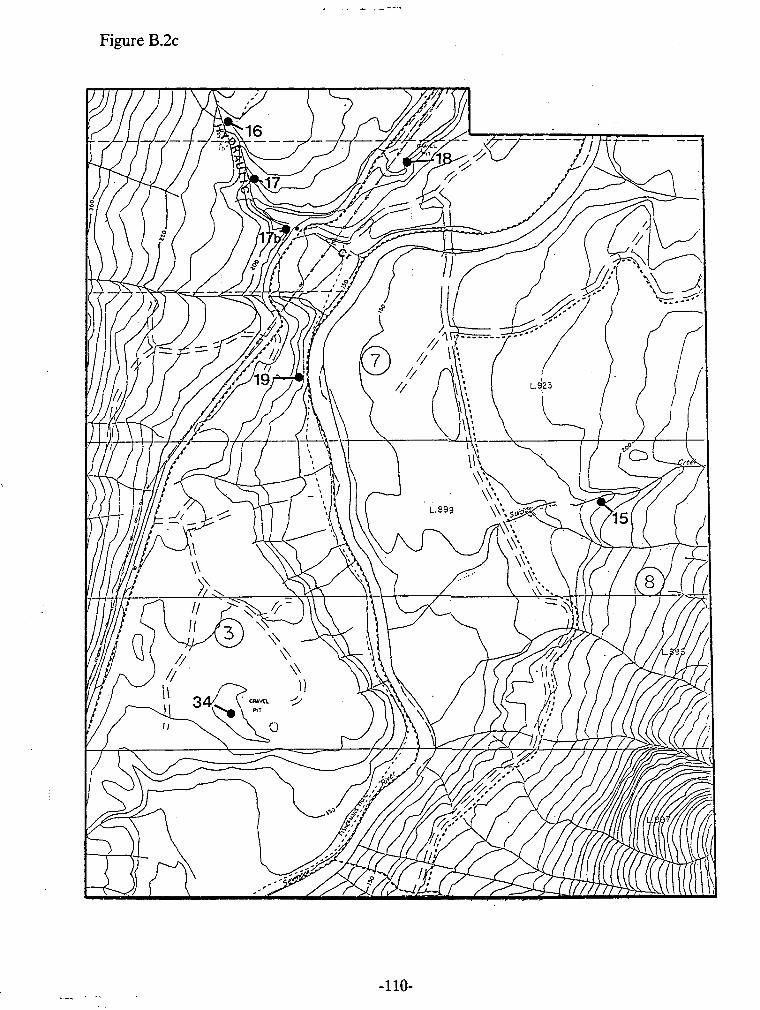
, . _ . .- --..
Figure B.2c
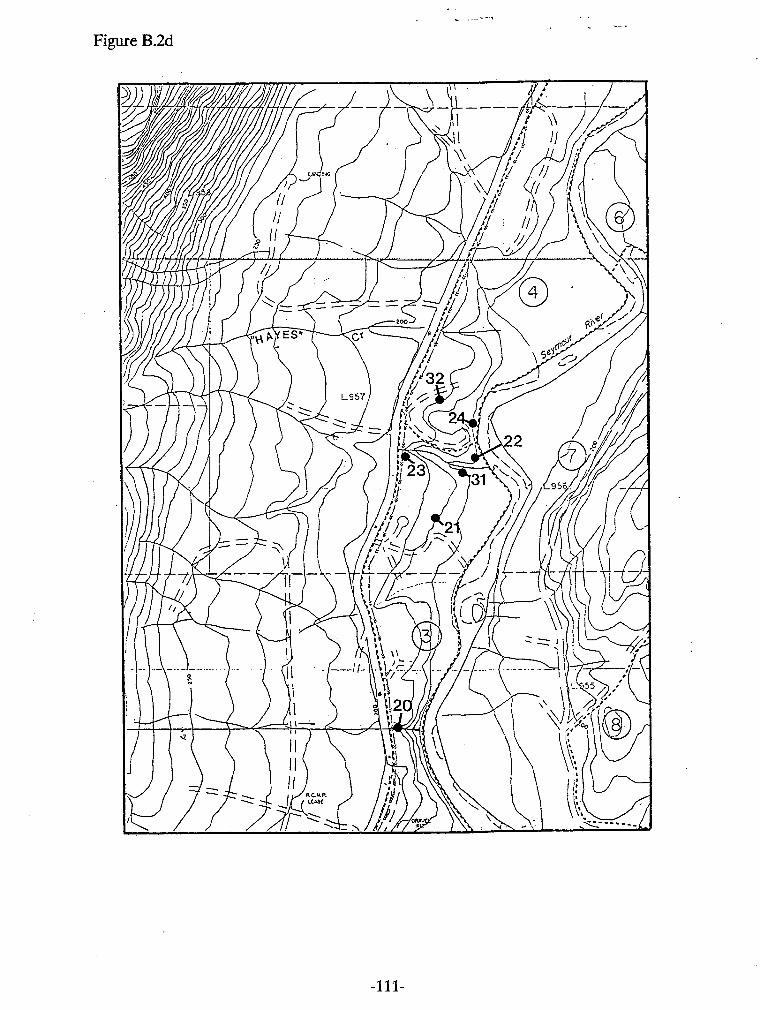
Figure B.2d
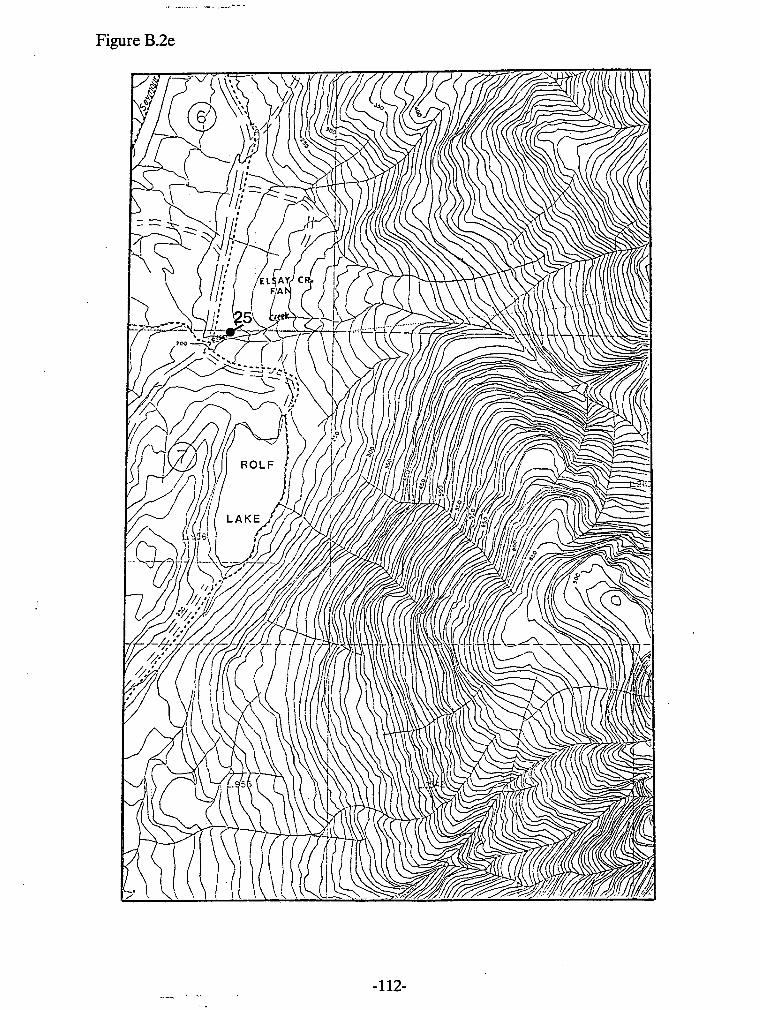
, .. .- -_ ,_- - -
Figure B.2e
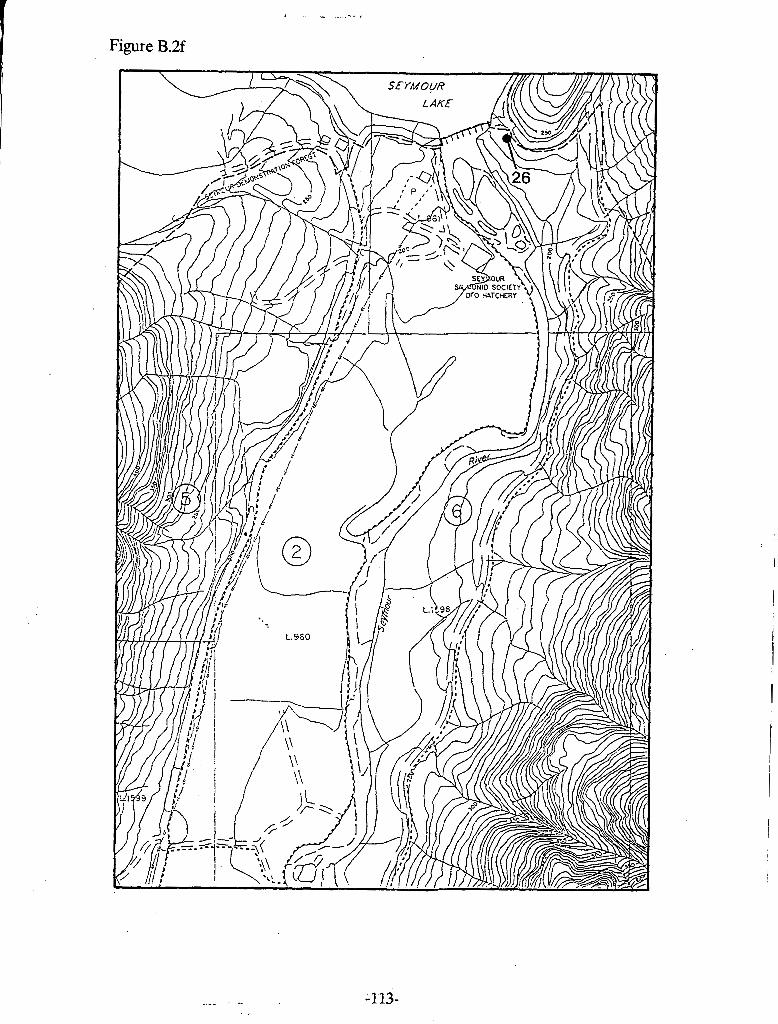
Figure B.2f
APPENDIX C
DESCRIPTIONS AND INTERPRETATIONS OF MEASURED SECTIONS NOT APPEARING IN FIGURE 4.3
29 to 18 m asl: Interbedded silt and sands (fine to medium). Beds become somewhat "confused" in lower half of exposure. Occasional clay clast (rip-up) in lower half of exposure. Beds are dipping to the southwest at approximately 15•‹.[glaciofluvial outwash-deltaic]
19 to 16 ma sl: Bioturbated (massive?) blue-grey clay with occasional sand stringer. Occasional dropstones are also observed [glaciomarine drift].
50 to 48 m asl: Fill
48 to 46 m asl: Pebble beds (imbrication noted in the south direction), horizontally bedded and crossbedded medium and coarse sands [glaciofluvial outwash].
46 to 45 m asl: Horizontally interbedded fine and medium sands [glaciofluvial outwash].
45 to 42 m asl: Non-compact massive blue clay with occasional sand stringer. Occasional dropstones, 1 cm dia. average [glaciomarine drift].
49 to 45 m asl: Crossbedded sands, gravels, and cobbles. beds dipping roughly northwest [glaciofluvial outwash-deltaic?].
80 to -82 m asl: Horizontally bedded and crossbedded sands, gravels, pebbles, and cobbles. High degree of sorting noted in some of the pebble beds. Surface of exposure is a terrace [littoral deposits?].
This section gives virtually the same information as SVMS-4. See F i e 43a.
170 to 167 m ad: Subrounded to rounded clasts up to 20 cm dia. (- 5 cm ave. dia.) in a compact sand matrix [glaciofluvial outwash].
167 to 165 m ad: Subrounded to rounded pebbles interbedded with medium sand. High degree of sorting in the pebble beds [glaciofluvial outwash].
165 to 164 m ad: Horizontally interbedded medium and coarse sands. Included is the occasional pebble bed [glaciofluvial outwash].
203 to 201 m asl: Matrix-supported diamicton. Fairly compact. Subrounded to angular clasts- granitic with occasional volcanic clast. Diamicton is interbedded with bedded sand, gravel, and cobbles [ablation till, glaciofluvial outwash].
202 to 198 m ad: Bedded sands and gravels containing lenses of compact diamicton and isolate "clasts" of structured sand (see Fig. 4.10a) [ablation till, glaciofluvial outwash].
111 to 110.2 m ad: Forest floor.
110.2 to 109.3 m asl: Massive medium sands with ~ebbl'es and clayey-silt clasts and charcoal fragments [fill].
1093 to 109.1 m ad: Paleosol containing roots, pebbles, and wood. A piece of bark from this unit was radiocarbon dated to 140 2 50 (Beta-43863) years BP. See Chapter 4 for interpretation.
109.1 to 109.3 m ad: Rounded cobbles; clast-supported [channel lag].
184 to 182 m as1 (upper 2 m of -14 m excavation; the remainder was covered): Matrix-supported diamicton; fairly compact [ablation till].
234 to 229 m ad: Massive matrix-supported non-compact diamicton interbedded with stratified sands and gravel [ablation till].
229 to 222 m ad: Horizontally bedded and crossbedded coarse sand with some pebble beds [glaciofluvial outwash].
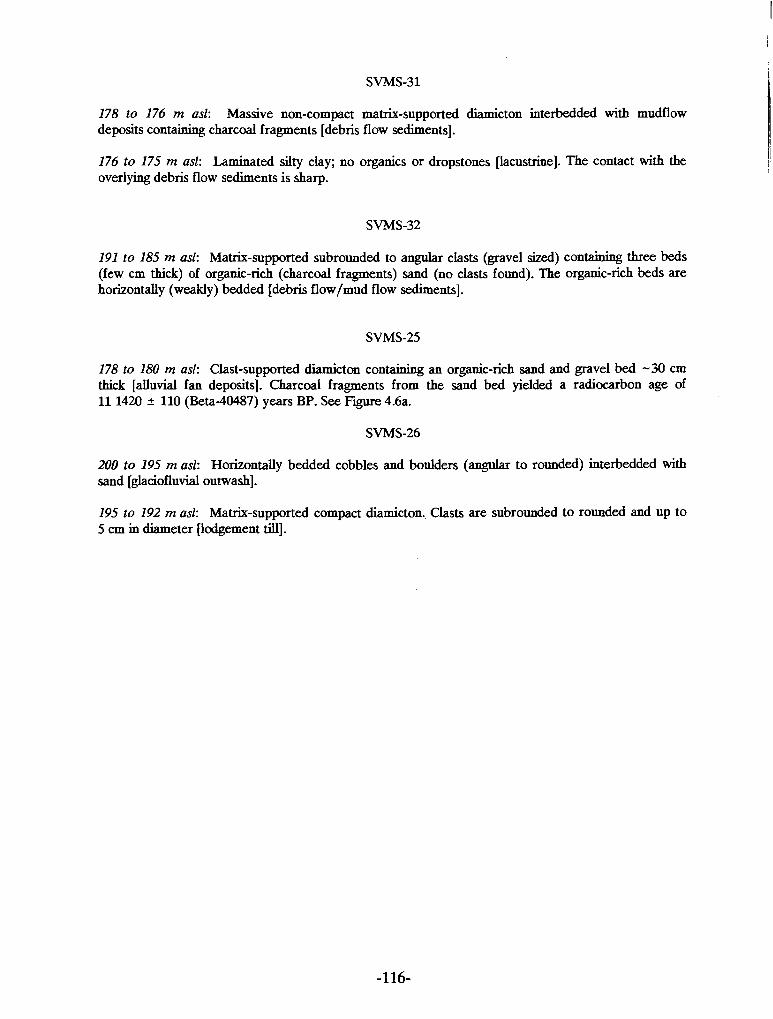
178 to 176 rn ad: Massive non-compact matrix-supported diamicton interbedded with mudflow deposits containing charcoal fragments [debris flow sediments].
176 to 175 m ad: Laminated silty clay; no organics or dropstones [lacustrine]. The contact with the overlying debris flow sediments is sharp.
191 to 185 m ad: Matrix-supported subrounded to angular clasts (gravel sized) containing three beds (few cm thick) of organic-rich (charcoal fragments) sand (no clasts found). The organic-rich beds are horizontally (weakly) bedded [debris flow/mud flow sediments].
178 to 180 m ad: Clast-supported diamicton containing an organic-& sand and gravel bed -30 cm thick [alluvial fan deposits]. Charcoal fragments from the sand bed yielded a radiocarbon age of 11 1420 + 110 (Beta-40487) years BP. See 4.6a.
200 to 195 m ad: Horizontally bedded cobbles and boulders (angular to rounded) interbedded with sand [glaciofluvial outwash].
195 to 192 m ad: Matrix-supported compact diamicton. Clasts are subrounded to rounded and up to 5 cm in diameter [lodgement till].

APPENDIX D
LOCATION OF BENCHMARKS USED IN THIS RESEARCH
Table D.1 shows the location and elevation of the benchmarks used throughout
the course of this research. The benchmarks in Table D.l are a subset of 19 GVRD
"Class B" benchmarks located throughout the study area. The remainder could not be
located. The reported elevations of all benchmarks in Table D.l have been confirmed
by cross-checking. All of these benchmarks are represented by brass plates, except B-
50 which is represented by a steel rod.
In Table D.l, the columns "Location" and "Elevation in feet" contain
information obtained from the Greater Vancouver Regional District (GVRD)
Department of Engineering Standards and Instructions (Part B, Item 301, section 3,
pp. 4-5, Oct. 1973). The reported elevations in feet (ft.) are converted to meters above
sea-level (m asl) by subtracting 91.37 ft. and multiplying by 0.3048 m/ft. The column
"Additional Information" contains additional information on the location of some of
the benchmarks compiled during this research. Distances relative to Rice Lake Gate
were measured along Seymour Mainline (main paved road to Seymour Falls Dam)
where distances are posted every km.
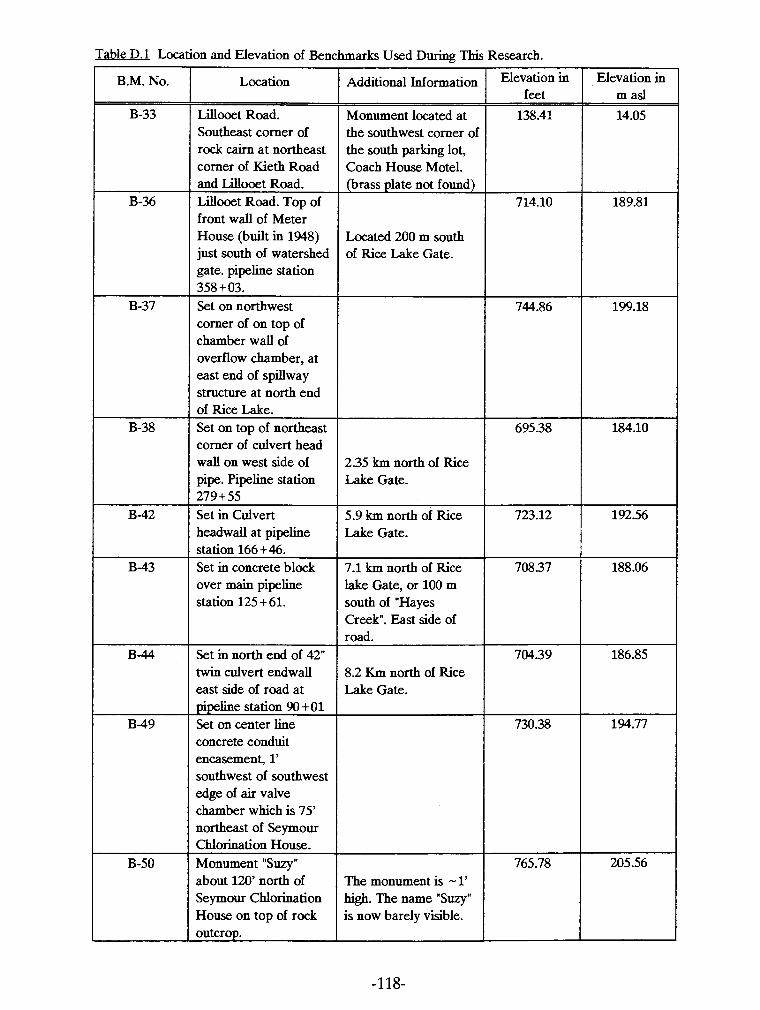
Table D. 1 Location and Elevation of Benchmarks Used During This Research.
Location
Lillooet Road. Southeast comer of rock cairn at northeast comer of Kieth Road and Lillooet Road. Lillooet Road. Top of front wall of Meter House (built in 1948) just south of watershed gate. pipeline station 358 + 03. Set on northwest comer of on top of chamber wall of overflow chamber, at east end of spillway structure at north end of Rice Lake. Set on top of northeast comer of culvert head wall on west side of pipe. Pipeline station 279 + 55 Set in Culvert headwall at pipeline station 166 +46. Set in concrete block over main pipeline station 125 + 61.
Set in north end of 42" twin culvert endwall east side of road at pipeline station 90 + 01 Set on center line concrete conduit encasement, 1' southwest of southwest edge of air valve chamber which is 75' northeast of Seymour Chlorination House. Monument "Suzy" about 120' north of Seymour Chlorination House on top of rock outcrop.
the south parking lot, Coach House Motel.
*dditional lnfonnation
Monument located at the southwest corner of
Located 200 m south of Rice Lake Gate.
Elevation in feet
138.41
2.35 km north of Rice Lake Gate.
Lake Gate. I 5.9 km north of Rice
lake Gate, or 100 m south of "Hayes Creek". East side of
723.12
8.2 Km north of Rice Lake Gate.
Elevation in m ad
14.05
The monument is - 1' high. The name "Suzy" is now barely visible.
765.78
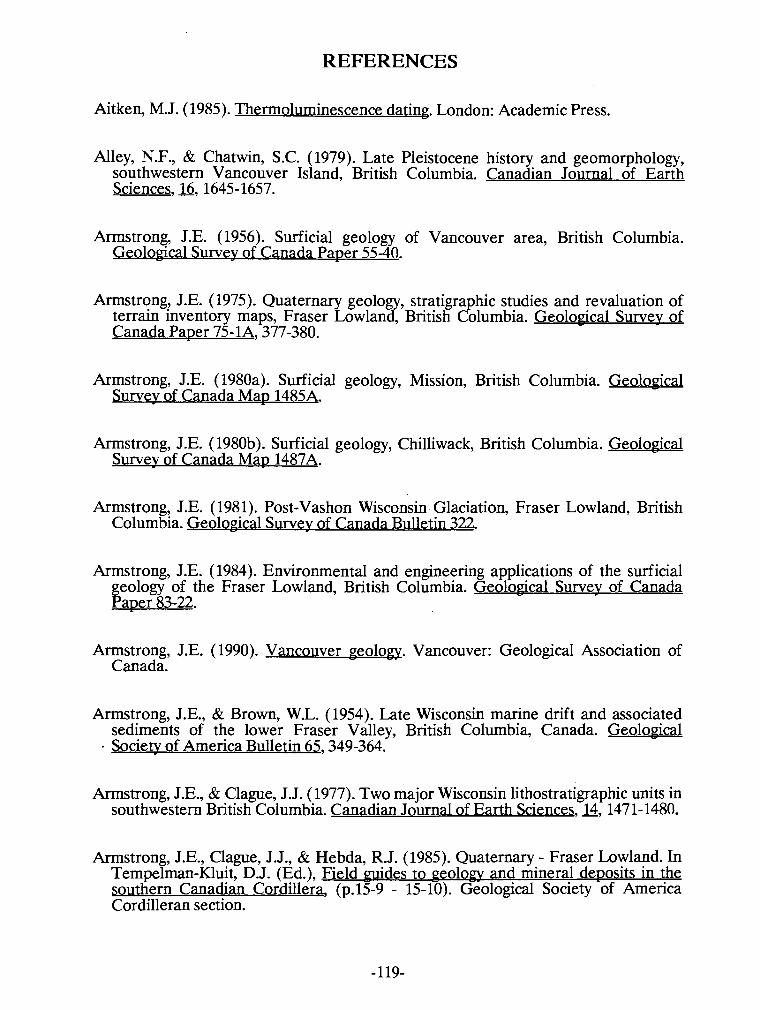
REFERENCES
Aitken, M.J. (1985). Themoluminescence dating. London: Academic Press.
Alley, N.F., & Chatwin, S.C. (1979). Late Pleistocene history and geomorphology, southwestern Vancouver Island, British Columbia. Canadian Journal of Earth Sciences, 16,1645-1657.
Armstrong, J.E. (1956). Surficial geology of Vancouver area, British Columbia. Geological Survey of Canada Paver 55-40.
Armstrong, J.E. (1975). Quaternary geology, stratigra hic studies and revaluation of terrain inventory maps, Fraser Lowland, British olumbia. Geological Survey of Canada Paper 75-lA, 377-380.
2
Armstrong, J.E. (1980a). Surficial geology, Mission, British Columbia. Geological Survey of Canada Map 1485A.
Armstrong, J.E. (1980b). Surficial geology, Chilliwack, British Columbia. Geological Survey of Canada Map 1487A.
Armstrong, J.E. (1981). Post-Vashon Wisconsin- Glaciation, Fraser Lowland, British Columbia. Geological Survey of Canada Bulletin 322.
Armstrong, J.E. (1984). Environmental and engineering applications of the surficial geology of the Fraser Lowland, British Columbia. Geological Survey of Canada Paper 83-22.
Armstrong, J.E. (1990). Vancouver geolop. Vancouver: Geological Association of Canada.
Armstrong, J.E., & Brown, W.L. (1954). Late Wisconsin marine drift and associated sediments of the lower Fraser Valley, British Columbia, Canada. Geological Society of America Bulletin 65,349-364.
Armstrong, J.E., & Clague, J.J. (1977). Two major Wisconsin lithostratigraphic units in southwestern British Columbia, Canadian Journal of Earth Sciences, 14, 1471-1480.
Armstrong, J.E., Clague, J.J., & Hebda, R.J. (1985). Quaternary - Fraser Lowland. In Tempelman-Kluit, D.J. (Ed.), Field %ides to geology and mineral deposits in the southern Canadian Cordillera, (p.15-9 - 15-10). Geological Society of America Cordilleran section.
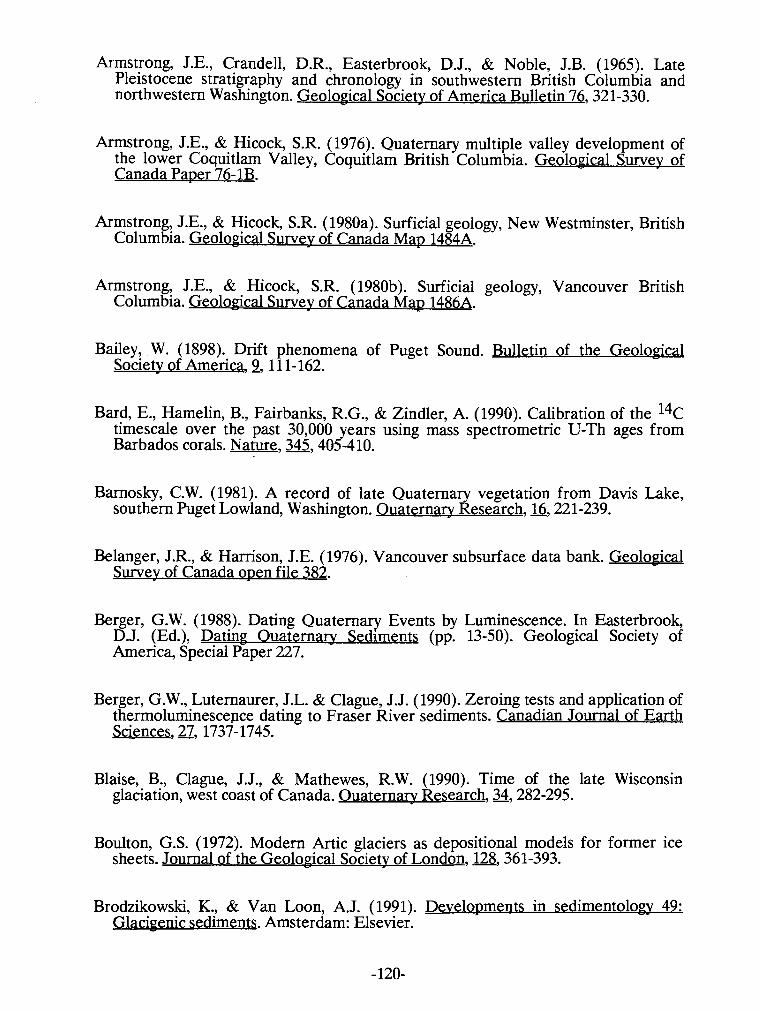
Armstrong, J.E., Crandell, D.R., Easterbrook, D.J., & Noble, J.B. (1965). Late Pleistocene stratigraphy and chronology in southwestern British Columbia and northwestern Washington. Geolo~ical Society of America Bulletin 76,321-330.
Armstrong, J.E., & Hicock, S.R. (1976). Quaternary multiple valley development of the lower Coquitlam Valley, Coquitlam British Columbia. Geological Survey of Canada Paper 76-1B.
Armstrong, J.E., & Hicock, S.R. (1980a). Surficial geology, New Westminster, British Columbia. Geological Survey of Canada M ~ D 1484A.
Armstrong, J.E., & Hicock, S.R. (1980b). Surficial geology, Vancouver British Columbia. Geological Survey of Canada Map 1486A.
Bailey, W. (1898). Drift phenomena of Puget Sound. Bulletin of the Geolo~ical Society of America, 9, 11 1- 162.
Bard, E., Hamelin, B., Fairbanks, R.G., & Zindler, A. (1990). Calibration of the 14c timescale over the past 30,000 years using mass spectrometric U-Th ages from Barbados corals. Nature, 345,405-410.
Barnosky, C.W. (1981). A record of late Quaternary vegetation from Davis Lake, southern Puget Lowland, Washington. Ouaternary Research, 16,221-239.
Belanger, J.R., & Harrison, J.E. (1976). Vancouver subsurface data bank. Geological Survey of Canada open file 382.
Berger, G.W. (1988). Dating Quaternary Events by Luminescence. In Easterbrook, D.J. (Ed.), Dating Ouaternarv Sed~ments (pp. 13-50). Geological Society of America, Special Paper 227.
Berger, G.W., Luternaurer, J.L. & Clague, J.J. (1990). Zeroing tests and application of thermolurninescence dating to Fraser River sediments. Canadian Journal of Earth Sciences, 27,1737-1745.
Blake, B., Clague, J.J., & Mathewes, R.W. (1990). Time of the late Wisconsin glaciation, west coast of Canada. Ouaternary Research, 3,282-295.
Boulton, G.S. (1972). Modern Artic glaciers as depositional models for former ice sheets. Journal of the Geological Society of London, 128,361-393.
Brodzikowski, K, & Van Loon, A.J. (1991). Developments in sedimentolo~ 49: Glacigenic sed~ments. Amsterdam: Elsevier.
Burwash, E,M.J. (1918). The geoloy of Vancouver and vicinity. Chicago: University of Chicago Press.
Church, M., & Ryder, J.M. (1972). Paraglacial sedimentation: A consideration of fluvial processes conditioned by glaciation. Geolo_Pical Society of America Bulletin, 83,3059-3072. -
Clague, J.J. (1975). Late Quaternary sea level fluctuations, Pacific coast of Canada and adjacent areas. Geological Survey of Canada Paper 75-1C.
Clague, J.J. (1977). Quadra Sand: a study of late Pleistocene geology and geomorphic history of coastal southwest British Columbia. Geological Survey of Canada Paper 77-17 --
Clague, J.J. (1981a). Late Quaternary geology and geochronology of British Columbia, part 1: radiocarbon dates. Geological Survey of Canada Paper 80-13.
Clague, J.J. (1981b). Late Quaternary geology and geochronolo of British Columbia, part 2: summary and discussion of radiocarbon-date Quaternary history. Geological Survey of Canada Paper 80-35.
B
Clague, J.J. (1986). The Quaternary stratigraphic record of British Columbia - evidence for episodic sedimentation and erosion controlled by glaciation. Canadian Journal of Earth Sciences, 23,885-894.
Clague, J.J., Armstrong, J.E., & Mathews, W.H. (1980). Advance of the late Wisconsin Cordilleran ice sheet in southern British Columbia since 22,000 yr B.P. Ouaternary Research, 13,322-326.
Clague, J.J., Harper, J.R., Hebda, R.J., & Howes, D.E. (1982). Late Quaternary sea levels and crustal movements, coastal British Columbia. Canadian Journal of Earth Sciences, 18 597-618.
Clark, J.A., Farrell, W.E., & Peltier, W.R. (1978). Global changes in postglacial sea level: a numerical calculation. Ouaternary Research, 9,265-287.
Clague, J.J., Saunders, I.R., & Roberts, M.C. (1988). Ice-free conditions in southwestern British Columbia at 16 000 years BP. Canadian Journal of Earth Sciences, 25,938-94 1.
Crandell, D.R. (1963). Surficial geology of the Lake Tapps quadrangle, Washington. United States Geological Survey Professional Paper 388-A.
Crandell, D.R. (1965). The glacial history of western Washington and Oregon. In Wright, H.E. Jr., & Frey, D.G. (Eds.), The Ouaternary of the United States. New Jersey: Princeton University Press.
Davis, N.F.G., & Mathews, W.H. (1944). Four phases of glaciation with illustrations from southwestern British Columbia. Journal of Geology, 52,403-413.
Denton, G.H., & Armstrong, R.L. (1969). Miocence-Pliocene glaciations in southern Alaska. American Journal of Science, 267,1121-1 142.
Divigalpitiya, W.M.R. (1982). Thermoluminescence Datinp of Sediments. Unpublished M.Sc. thesis, Simon Fraser University, Burnaby, B.C.
Easterbrook, D.J. (1969). Pleistocence chronology of the Puget Lowland and San Juan Islands, Washington. Geological Society of America Bulletin, m, 2273-2286.
Easterbrook, D.J. (1986). Stratigraphy and chronology of Quaternary deposits of the Puget Lowland and Olympic Mountains of Washington and the Cascade Mountains of Washington and Oregon. In Quaternary glaciations in the northern hemisphere. Quaternary Science Reviews ,xx, 145-159.
Eyles, N., Eyles, C.H., & Miall, A.D. (1983). Lithofacies types and vertical profile models; an alternative approach to the description and environmental interpretation of glacial diarnict and diarnictite sequences. Sedimentology, 3, 393- 4 10.
Fulton, R.J. (1971). Radiocarbon geochronology of southwestern British Columbia. Geological Survey of Canada Paper 7 1-37.
Fulton, R.J. (1989). Forward to the Quaternary Geology of Canada and Greenland. In R.J. Fulton (Ed.), Ouaternary Geolow of Canada and Greenland (pp. 6-7). Geological Survey of Canada, geology of Canada no. 1 (also Geological Society of America, The Geologv of North America, v. IS-1).
Fulton, R.J., Armstrong, J.E., & Fyles, J.G. (1976). Stratigraphy and palynology of late Quaternary sediments in Puget Lowland, Washington: Discussion and reply. Geological Society of America Bulletin, 87, 153-156.
Gascoyne, M., Ford, D.C., and Schwarcz, H.P. (1981). Late Pleistocene chronology and paleoclimate of Vancouver Island determined from cave deposits. Journal of Earth Sciences, fi, 1643-1652.
Halderson, S., & Shaw, J. (1982) The problem of recognizing melt-out till. Boreas, 11, 26 1-277.'
Halstead, E.C. (1968). The Cowichan ice tongue, Vancouver Island. Canadian Journal of Earth Sciences, 5,1409-1415.
Hansen, B.S., & Easterbrook, D.J. (1974). Stratigraphy and palynology of late Quaternary sediments in the Puget Lowland, Washington. Geolo_Pical Society of America Bulletin, &, 587-602.
Heusser, C.J. (1964). Palynology of four bog sections from the western Olympic Peninsula, Washington. E c o l o ~ ~ , 45.23-40.
Heusser, C.J. (1977). Quaternary palynology of the Pacific slope of Washington. Ouate rna~ Research, 8,282-306.
Hedberg, H.D. (1976). International stratigraphic de. New York: Wiley.
Hicock, S.R. (1976). Ouaternary Geolog: Coauitlam - Port Moody area. British Columbia. Unpublished M.Sc. thesis, University of British Columbia, Vancouver, B.C.
Hicock, S.R. (1980). Pre-Fraser Pleistocene Strati~aphy. Geochronoloy. and Paleoecology of the Geor9a Depression. British Columbia. Unpublished Ph.D thesis, University of Western Ontario, London Ont.
Hicock, S.R. (1984). Southwest British Columbia: Pleistocene Chronolow, Stratigraphy and Correlation. In Mahaney, W.C. (Ed.), Correlation of Quaternary chronologies (pp. 479-489). Norwich: Geobooks.
Hicock, S.R., & Armstrong, J.E. (1981). Coquitlam Drift: A pre-Vashon Fraser glacial formation in the Fraser Lowland, British Columbia. Canadian Journal of Earth Sciences, B, 1443-1451.
Hicock, S.R., & Armstrong, J.E. (1983). Four Pleistocene formations in southwest British Columbia: their irn~lication for vatterns of sedimentation of possible Sangamonian to early wiscdnsinan age. ~'anadian Journal of Earth ~cieices, 29, 1232-1247.
Hicock, S.R., & Armstrong, J.E. (1985). Vashon Drift: definition of the formation in the Georgia depression, southwest British Columbia. Canadian Journal of Earth Sciences, 22,784-757.
Hicock, S.R., Hebda, RJ., & Armstrong, J.E. (1982a). Lag of the Fraser glacial maximum in the Pacific Northwest: pollen and macrofossil evidence from western Fraser Lowland, British Columbia. Canadian Journal of Earth Sciences, 19, 2288- 2296.
Hicock, S.R., Hobson,K., & Armstrong, J.E. (1982b). Late Pleistocene proboscideans and early Fraser glacial sedimentation in eastern Fraser Lowland, British Columbia. Canadian Journal of Earth Sciences, 19, 899-906.
Holland, S.S. (1976). Landforms of British Columbia: A physiographic outline. British Columbia Department of Mines and Petroleum Resources Bulletin 48.
Huntley, DJ.? Berger, G.W., Divigalpitiya, W.M.R., & Brown, T.A. (1983). Thermolumnescence Dating of Sediments. Journal of the European Study Group on Phvsical. Chemical and Mathematical Techniques Applied to Archaeolog, 9, 607-618.
Jackson, L.E. Jr., MacDonald, G.M., & Wilson, M.C. (1982). Paraglacial origin for terraced river sediments in Bow Valley, Alberta. Canadian Journal of Earth Sciences, 19,2219-2231.
Johnston, W.A. (1923). Geology of Fraser River Delta map area. Geological Survey of Canada Memior 135.
Joyce, G.M. (1976). The Analvsis of Fluvial and Glacial-Fluvial Landforms and Their A & Columbia. Unpublished B.S.F. thesis, University of British Columbia, Vancouver B.C.
Kahrer, G. (1989). From speculative to s~ectacul ar... the Sevmour River Valley 1870's to 1980's: A histoty of land use. Greater Vancouver Regional District: Burnaby.
Krainer, K., & Poscher, G. (1990). Ice-rich, redeposited diamicton blocks and associated structures in Quaternary outwash sediments of the Inn Valley near Imsbruck, Austria. Geografiska Annaler, m, 249-254.
Lewis, T. (1985). Overview of Research in the Watersheds of the Greater Vancouver Water District (unpublished consultant report for the GVWD).
Lowdon, J.A. (1985). The Geological Survey of Canada Radiocarbon Dating Laboratory. Geolo@cal Survey of Canada ~ a ~ e r 84-24.
Lowdon, J.A., & Blake Jr, W. (1981). Geological Survey of Canada radiocarbon dates XXI. Geolodcal Survey of Canada Paper 81-7.
Mathewes, R.W. (1985). Evidence for climatic change in southern British Columbia during late-glacial and Holocene time. In Harington, C.R. (Ed.), Climate chan~e in Canada 5: Critical periods in Ouaternay climatic history of northern North America. Syllogeus no. 55,397-422
Mathewes, R.W., & Heusser, L.E. (1981). A 12 000 year palynological record of temperature and precipitation trends in southwestern British Columbia. Canadian Journal of Botany, 59,707-710.
Mathews, W.H., Fyles, J.G. & Nasmith, H.W. (1970). Postglacial crustal movements in southwestern British Columbia and Washington state. Canadian Journal of Earth Sciences. 7,690-702.
Mathews, W.H. (1989). Development of the Cordilleran landscape during the Quaternary. In R.J. Fulton (Ed.), Ouaternaq Geoloq of Canada and Greenland (pp. 32-34). Geological Survey of Canada, geology of Canada no.1 (also Geological Society of America, The Geolo of North America, v. K-1).
Maynard, D.E. (1977). Guidebook for geologic field trips in the Lynn Canyon - Sevrnour area of North Vancouver (Adventures in Earth Sciences Series #22). Department of Geological Sciences, University of British Columbia.
Miall, A.D. (1977). A review of the braided-river depositional environment. Earth- Science Reviews, 13, 1-63.
Miall, A.D. (1978). Lithofacies types and vertical profile models in braided river deposits: A summary. In Miall, A.D. (Ed.), Fluvial sedimentolog. Calgary: Candadian Society of Petroleum Geologists.
Miall, A.D. (1990). Principles of sedimentarv basin analysis (2nd ed.). New York: Springer-Verlag.
Maynard, D.E. (1978). Geomomhic constraints to urban residential development in the Sevmour area. District ox North Vancouver. B.C. Unpublished M.Sc. thesis, Univeisity of British Columbia, Vancouver.
Nambi, K.S.V. & Aitken, M.J. (1986). Annual-dose conversion factors for TL and ESR dating. Archaeometry, a, 202-205.
Prescott, J.R. & Hutton, J.T. (1988). Cosmic ray and gamma ray dosimetry for TL and ESR. Nuclear Tracks and Radiation Measurements, 14,223-227-
Roddick, J.A. (1979). Vancouver North, Coquitlam, and Pitt Lake map-areas, British Columbia. Geological Survev of Canada Memoir 335.
Roberts, M.C. & Mark, D.M. (1970). The use of trend surfaces in till fabric analysis. Canadian Journal of Earth Sciences, 2 1179-1 184.
Ryder, J.M. (1971a). The stratigraphy and morphology of para-glacial alluvial fans in south-central British Columbia. Canadian Journal of Earth Sciences, 8,279-298.
Ryder, J.M. (1971b). Some aspects of the mo hology of paraglacial fans in south- central British Columbia. Canadian Journal o 'P Earth Sciences, 8, 1252-1264.
Ryder, J.M., & Clague, J.J. (1989). British Columbia (Quaternary stratigraphy and history, Cordilleran ice sheet). In R.J. Fulton (Ed.), Ouaternary Geo loz of Canada and Greenland (pp. 48-58). Geological Survey of Canada, Geology of Canada no.1 (also Geological Society of America, The Geolow of North America, v. K-1).
Ryder, J.M., & Thomson, B. (1986). Neoglaciation in the southern Coast Mountains of British Columbia: Chronology prior to the neoglacial maximum. Canadian Journal of Earth Sciences, 23,273-287.
Saunders, I.R. (1985). Late Ouaternary geology and geomorpholow of the Chilliwack River Valley. British Columbia. Unpublished M.Sc. thesis, Simon Fraser University, Burnaby B.C.
Saunders, LR., Clague, J.J., & Roberts, M.C. (1987). Deglaciation of Chilliwack River Valley, British Columbia. Canadian Journal of Earth Sciences, 24,915-923.
Shaw, J. (1982). Melt-out till in the Edmonton area, Alberta, Canada. Canadian Journal of Earth Sciences, B, 1548-1569.
Van der Wijk, A., El-Daoushy, F., Arends, A.R., & Mook, W.G. (1986). Dating peat with U/Th disequilibrium: Some geochemical considerations. Chemical Geolog, 59 283-292. -9
Wentworth, C.K. (1922). A scale of grade and class terms for clastic sediments. Journal of Geolow, 30,377-392.
Williams, H.F.L. & Roberts, M.C. (1989). Holocene sea-level change and delta growth: Fraser River delta, British Columbia. Canadian Journal of Earth Sciences, 26, 1657-1666. -
Wintle, A.G., & Huntley, D.J. (1982). Thermoluminescence dating of sediments. Ouaternary Science Reviews, L 31-53.
Related Documents