North Dakota's International and Domestic Ports-to-Plains Region Trading Relationships 2004 2010 2011 2010-2011 Difference 2010-2011 % Change 2004-2011 Difference 2004-2011 % Change Mexico Truck Exports $4,387,396 $22,112,644 $24,244,074 $2,131,430 9.6% $19,856,678 452.6% Imports $45,495,030 $45,760,804 $151,773,473 $106,012,669 231.7% $106,278,443 233.6% Total Truck Trade with Mexico $49,882,426 $67,873,448 $176,017,547 $108,144,099 159.3% $126,135,121 252.9% #DIV/0! Rail Exports $42,435,097 $135,390,542 $113,197,225 -$22,193,317 -16.4% $70,762,128 166.8% Imports $307,860 $1,074,652 $362,305 -$712,347 -66.3% $54,445 17.7% Total Rail Trade with Mexico $42,742,957 $136,465,194 $113,559,530 -$22,905,664 -16.8% $70,816,573 165.7% #DIV/0! TOTAL Exports $46,822,493 $157,503,186 $137,441,299 -$20,061,887 -12.7% $90,618,806 193.5% Imports $45,802,890 $46,835,456 $152,135,778 $105,300,322 224.8% $106,332,888 232.2% Total Trade with Mexico $92,625,383 $204,338,642 $289,577,077 $85,238,435 41.7% $196,951,694 212.6% North Dakota -- Page 1

North Dakota Trade Relationships 2004-2011
Jul 13, 2015
Welcome message from author
This document is posted to help you gain knowledge. Please leave a comment to let me know what you think about it! Share it to your friends and learn new things together.
Transcript

North Dakota's International and Domestic Ports-to-Plains Region Trading Relationships
2004 2010 20112010-2011 Difference
2010-2011 % Change
2004-2011 Difference
2004-2011 % Change
MexicoTruck Exports $4,387,396 $22,112,644 $24,244,074 $2,131,430 9.6% $19,856,678 452.6%
Imports $45,495,030 $45,760,804 $151,773,473 $106,012,669 231.7% $106,278,443 233.6%Total Truck Trade with Mexico $49,882,426 $67,873,448 $176,017,547 $108,144,099 159.3% $126,135,121 252.9%
#DIV/0!Rail Exports $42,435,097 $135,390,542 $113,197,225 -$22,193,317 -16.4% $70,762,128 166.8%
Imports $307,860 $1,074,652 $362,305 -$712,347 -66.3% $54,445 17.7%Total Rail Trade with Mexico $42,742,957 $136,465,194 $113,559,530 -$22,905,664 -16.8% $70,816,573 165.7%
#DIV/0!TOTAL Exports $46,822,493 $157,503,186 $137,441,299 -$20,061,887 -12.7% $90,618,806 193.5%
Imports $45,802,890 $46,835,456 $152,135,778 $105,300,322 224.8% $106,332,888 232.2%Total Trade with Mexico $92,625,383 $204,338,642 $289,577,077 $85,238,435 41.7% $196,951,694 212.6%
North Dakota -- Page 1

North Dakota's International and Domestic Ports-to-Plains Region Trading Relationships
Laredo, TX
Truck Exports $3,187,304 $17,595,902 $21,050,714 $3,454,812 19.6% $17,863,410 560.5%% of Total Exports to Mexico 72.6% 79.6% 86.8% 7.3% 14.2%
Imports $13,211,603 $35,455,480 $40,840,380 $5,384,900 15.2% $27,628,777 209.1%% of Total Imports to Mexico 29.0% 77.5% 26.9% -50.6% -2.1%
Total Truck Trade Thru Laredo $16,398,907 $53,051,382 $61,891,094 $8,839,712 16.7% $45,492,187 277.4%% Total Trade with Mexico 32.9% 78.2% 35.2% -43.0% 2.3%
Rail Exports $17,285,274 $15,184,384 $16,788,269 $1,603,885 10.6% -$497,005 -2.9%% of Total Exports to Mexico 40.7% 11.2% 14.8% 3.6% -25.9%
Imports $251,976 $978,120 $0 -$978,120 -100.0% -$251,976 -100.0%% of Total Imports to Mexico 81.8% 91.0% 0.0% -91.0% -81.8%
Total Rail Trade Thru Laredo $17,537,250 $16,162,504 $16,788,269 $625,765 3.9% -$748,981 -4.3%% Total Trade with Mexico 41.0% 11.8% 14.8% 2.9% -26.2%
TOTALExports $20,472,578 $32,780,286 $37,838,983 $5,058,697 15.4% $17,366,405 84.8%
% of Total Exports to Mexico 43.7% 20.8% 27.5% 6.7% -16.2%Imports $13,463,579 $36,433,600 $40,840,380 $4,406,780 12.1% $27,376,801 203.3%
% of Total Imports to Mexico 29.4% 77.8% 26.8% -50.9% -2.5%Total Trade Thru Laredo $33,936,157 $69,213,886 $78,679,363 $9,465,477 13.7% $44,743,206 131.8%
% Total Trade with Mexico 36.6% 33.9% 27.2% -6.7% -9.5%
North Dakota -- Page 2

North Dakota's International and Domestic Ports-to-Plains Region Trading Relationships
Eagle Pass, TX
Truck Exports $359,611 $109,734 $134,020 $24,286 22.1% -$225,591 -62.7%% of Total Exports to Mexico 8.2% 0.5% 0.6% 0.1% -7.6%
Imports $2,668,178 $0 $0 $0 #DIV/0! -$2,668,178 -100.0%% of Total Imports to Mexico 5.9% 0.0% 0.0% 0.0% -5.9%
Total Truck Trade Thru Eagle Pass $8,687,358 $109,734 $134,020 $24,286 22.1% -$2,893,769 -98.5%% Total Trade with Mexico 17.4% 0.2% 0.1% -0.1% -17.3%
Rail Exports $12,267,723 $97,764,967 $69,584,759 -$28,180,208 -28.8% $57,317,036 467.2%% of Total Exports to Mexico 28.9% 72.2% 61.5% -10.7% 32.6%
Imports $55,884 $33,436 $362,305 $328,869 983.6% $306,421 548.3%% of Total Imports to Mexico 0.0% 3.1% 100.0% 96.9% 100.0%
Total Rail Trade Thru Eagle Pass $12,323,607 $97,798,403 $69,947,064 -$27,851,339 -28.5% $57,623,457 467.6%% Total Trade with Mexico 28.8% 71.7% 61.6% -10.1% 32.8%
TOTALExports $12,627,334 $97,874,701 $69,718,779 -$28,155,922 -28.8% $57,091,445 452.1%
% of Total Exports to Mexico 27.0% 62.1% 50.7% -11.4% 23.8%Imports $2,724,062 $33,436 $362,305 $328,869 #DIV/0! -$2,361,757 -86.7%
% of Total Imports to Eagle Pass 5.9% 0.1% 0.2% 0.2% -5.7%Total Trade Thru Laredo $15,351,396 $97,908,137 $70,081,084 -$27,827,053 -28.4% $54,729,688 356.5%
% Total Trade with Mexico 16.6% 47.9% 24.2% -23.7% 7.6%
North Dakota -- Page 3

North Dakota's International and Domestic Ports-to-Plains Region Trading Relationships
Del Rio, TX
Truck Exports $0 $0 $0 $0 #DIV/0! $0 #DIV/0!% of Total Exports to Mexico 0.0% 0.0% 0.0% 0.0% 0.0%
Imports $0 $0 $0 $0 #DIV/0! $0 #DIV/0!% of Total Imports to Mexico 0.0% 0.0% 0.0% 0.0% 0.0%
Total Truck Trade Thru Del Rio $0 $0 $0 $0 #DIV/0! $0 #DIV/0!% Total Trade with Mexico 0.0% 0.0% 0.0% 0.0% 0.0%
Rail Exports% of Total Exports to Mexico
Imports% of Total Imports to Mexico
Total Rail Trade Thru Del Rio% Total Trade with Mexico
TOTALExports $0 $0 $0 $0 #DIV/0! $0 #DIV/0!
% of Total Exports to Mexico 0.0% 0.0% 0.0% 0.0% 0.0%Imports $0 $0 $0 $0 #DIV/0! $0 #DIV/0!
% of Total Imports to Mexico 0.0% 0.0% 0.0% 0.0% 0.0%Total Trade Thru Del Rio $0 $0 $0 $0 #DIV/0! $0 #DIV/0!
% Total Trade with Mexico 0.0% 0.0% 0.0% 0.0% 0.0%
North Dakota -- Page 4

North Dakota's International and Domestic Ports-to-Plains Region Trading Relationships
PTP
Truck Exports $3,546,915 $17,705,636 $21,184,734 $3,479,098 19.6% $17,637,819 497.3%% of Total Exports to Mexico 80.8% 80.1% 87.4% 7.3% 6.5%
Imports $15,879,781 $35,455,480 $40,840,380 $5,384,900 15.2% $24,960,599 157.2%% of Total Imports to Mexico 34.9% 77.5% 26.9% -50.6% -8.0%
Total Truck Trade Thru PTP $19,426,696 $53,161,116 $62,025,114 $8,863,998 16.7% $42,598,418 219.3%% Total Trade with Mexico 38.9% 78.3% 35.2% -43.1% -3.7%
Rail Exports $29,552,997 $112,949,351 $86,373,028 -$26,576,323 -23.5% $56,820,031 192.3%% of Total Exports to Mexico 69.6% 83.4% 76.3% -7.1% 6.7%
Imports $307,860 $1,011,556 $362,305 -$649,251 -64.2% $54,445 17.7%% of Total Imports to Mexico 100.0% 94.1% 100.0% 5.9% 0.0%
Total Rail Trade Thru PTP $29,860,857 $113,960,907 $86,735,333 -$27,225,574 -23.9% $56,874,476 190.5%% Total Trade with Mexico 69.9% 83.5% 76.4% -7.1% 6.5%
TOTALExports $33,099,912 $130,654,987 $107,557,762 -$23,097,225 -17.7% $74,457,850 224.9%
% of Total Exports to Mexico 70.7% 83.0% 78.3% -4.7% 7.6%Imports $16,187,641 $36,467,036 $41,202,685 $4,735,649 13.0% $25,015,044 154.5%
% of Total Imports to Mexico 35.3% 77.9% 27.1% -50.8% -8.3%Total Trade Thru PTP $49,287,553 $167,122,023 $148,760,447 -$18,361,576 -11.0% $99,472,894 201.8%
% Total Trade with Mexico 53.2% 81.8% 51.4% -30.4% -1.8%
North Dakota -- Page 5

North Dakota's International and Domestic Ports-to-Plains Region Trading Relationships
2011 Leading Exports from North Dakota to Mexico (Surface Transportation) 2011Rank Export
1 11 Malts; Starches and Inulin $42,790,5732 12 Oil Seeds and Oleaginous Fruits $19,424,6983 23 Food Residues and Waste $16,947,1654 7 Edible Vegetables and Roots $16,090,7685 10 Cereals $10,604,0516 84 Computer-Related Machinery and Parts $7,720,2197 85 Electrical Machinery; Equipment and Parts $7,585,5728 15 Animal or Vegetable Fats and Oils $5,810,8459 39 Plastics and Articles $3,596,952
10 20 Preparations of Vegetables; Fruits and Nuts $2,097,646
2011 Leading Imports to North Dakota from Mexico (Surface Transportation) 2011Import
1 71 Pearls; Stones; Metals and Imitation Jewelry $75,897,8772 85 Electrical Machinery; Equipment and Parts $42,550,5903 87 Vehicles Other than Railway $12,322,0694 84 Computer-Related Machinery and Parts $9,409,6725 94 Furniture; Lamps and Prefabricated Buildings $7,394,0036 24 Tobacco and Manufactured Tobacco $1,743,0607 90 Measuring and Testing Instruments $1,104,3728 72 Iron and Steel $369,3589 98 Special Classification Provisions $343,416
10 73 Articles of Iron and Steel $306,002
North Dakota -- Page 6

North Dakota's International and Domestic Ports-to-Plains Region Trading Relationships
2011 Leading Exports from North Dakota to Mexico (Surface Transportation) 2011Rank Coahuila Export
1 11 Malts; Starches and Inulin $9,872,1272 85 Electrical Machinery; Equipment and Parts $5,294,1633 23 Food Residues and Waste $2,106,3664 84 Computer-Related Machinery and Parts $1,014,9895 10 Cereals $930,9766 90 Measuring and Testing Instruments $297,9537 39 Plastics and Articles $14,9308 49 Printed Books $9,5929 87 Vehicles Other than Railway 5,501.00
10 73 Articles of Iron and Steel 5,380.00
2011 Leading Exports from North Dakota to Mexico (Surface Transportation) 2011Rank Nuevo Leon Export
1 11 Products of the milling industry; Malt; Starches; inulin; Wheat gluten $10,535,1112 10 Cereals $4,663,8083 39 Plastics and articles thereof $3,273,1504 85 Electrical machinery and equipment and parts thereof; Sound recorders and reproducers $2,160,8785 84 Nuclear reactors; boilers; machinery and mechanical appliances; parts thereof $1,564,8286 90 Optical; photographic; cinematographic; measuring; checking; precision; medical instruments $713,4997 7 Edible vegetables and certain roots and tubers $618,0778 27 Mineral fuels; mineral oils and products of their distillation; Bituminous substances; Mineral waxes $426,7219 23 Residues and waste from the food industries; Prepared animal feed $289,908
10 20 Preparations of vegetables; fruit; nuts; or other parts of plants $283,713
North Dakota -- Page 7

North Dakota's International and Domestic Ports-to-Plains Region Trading Relationships
2011 Leading Exports from North Dakota to Mexico (Surface Transportation) 2011Rank Tamaulipas Export
1 39 Plastics and articles thereof $91,6422 84 Nuclear reactors; boilers; machinery and mechanical appliances; parts thereof 72,1203 87 Vehicles; other than railway or tramway rolling stock; and parts and accessories thereof 9,255456789
10
North Dakota -- Page 8

North Dakota's International and Domestic Ports-to-Plains Region Trading Relationships
2004 2010 20112010-2011 Difference
2010-2011 % Change
2004-2011 Difference
2004-2011 % Change
CanadaTruck Exports $352,617,295.00 $1,142,298,099 $1,718,631,393 $576,333,294 50.5% $1,366,014,098 387.4%
Imports $825,606,711.00 $1,284,044,420 $1,551,612,718 $267,568,298 20.8% $726,006,007 87.9%Total Truck Trade with Canada $1,178,224,006.00 $2,426,342,519 $3,270,244,111 $843,901,592 34.8% $2,092,020,105 177.6%
#DIV/0!Rail Exports $111,520,552.00 $407,013,276 $419,217,893 $12,204,617 3.0% $307,697,341 275.9%
Imports $240,870,374.00 $538,977,593 $732,223,353 $193,245,760 35.9% $491,352,979 204.0%Total Rail Trade with Canada $352,390,926.00 $945,990,869 $1,151,441,246 $205,450,377 21.7% $799,050,320 226.8%
$0 #DIV/0!TOTAL Exports $464,137,847.00 $1,549,311,375 $2,137,849,286 $588,537,911 38.0% $1,673,711,439 360.6%
Imports $1,066,477,085.00 $1,823,022,013 $2,283,836,071 $460,814,058 25.3% $1,217,358,986 114.1%Total Trade with Canada $1,530,614,932.00 $3,372,333,388 $4,421,685,357 $1,049,351,969 31.1% $2,891,070,425 188.9%
North Dakota -- Page 9

North Dakota's International and Domestic Ports-to-Plains Region Trading Relationships
Raymond, MT
Truck Exports $1,240,512 $5,346,106 $13,420,356 $8,074,250 151.0% $12,179,844 981.8%% of Total Exports to Canada 0.4% 0.5% 0.8% 0.3% 0.4%
Imports $34,580,237 $41,886,623 $185,488,984 $143,602,361 342.8% $150,908,747 436.4%% of Total Imports to Canada 4.2% 3.3% 12.0% 8.7% 7.8%
Total Truck Trade Thru Raymond $35,820,749 $47,232,729 $198,909,340 $151,676,611 321.1% $163,088,591 455.3%% Total Trade with Canada 3.0% 1.9% 6.1% 4.1% 3.0%
Rail Exports $0% of Total Exports to Canada 0.0% 0.0%
Imports $0% of Total Imports to Canada 0.0% 0.0%
Total Truck Trade Thru Raymond $0 $0% Total Trade with Canada 0.0% 0.0%
TOTALExports $1,240,512 $5,346,106 $13,420,356 $8,074,250 151.0% $12,179,844 981.8%
% of Total Exports to Canada 0.3% 0.3% 0.6% 0.3% 0.4%Imports $34,580,237 $41,886,623 $185,488,984 $143,602,361 342.8% $150,908,747 436.4%
% of Total Imports to Canada 3.2% 2.3% 8.1% 5.8% 4.9%Total Trade Thru Raymond $35,820,749 $47,232,729 $198,909,340 $151,676,611 321.1% $163,088,591 455.3%
% Total Trade with Canada 2.3% 1.4% 4.5% 3.1% 2.2%
North Dakota -- Page 10

North Dakota's International and Domestic Ports-to-Plains Region Trading Relationships
Sweet Grass, MT
Truck Exports $7,326,593 $20,014,338 $16,233,163 -$3,781,175 -18.9% $8,906,570 121.6%% of Total Exports to Canada 2.1% 1.8% 0.9% -0.8% -1.1%
Imports $10,219,204 $61,217,106 $130,542,603 $69,325,497 113.2% $120,323,399 1177.4%% of Total Exports to Canada 1.2% 4.8% 8.4% 3.6% 7.2%
Total Truck Trade Thru Sweetgrass 17,545,797 $81,231,444 $146,775,766 $65,544,322 80.7% $129,229,969 736.5%% Total Trade with Canada 1.5% 3.3% 4.5% 1.1% 3.0%
Rail Exports $4,911,997 $6,606,914 $34,027,581 $27,420,667 415.0% $29,115,584 592.7%% of Total Exports to Canada 4.4% 1.6% 8.1% 6.5% 3.7%
Imports $5,803,312 $8,241,861 $51,752,121 $43,510,260 527.9% $45,948,809 791.8%% of Total Exports to Canada 2.4% 1.5% 7.1% 5.5% 4.7%
Total Rail Trade Thru Sweet Grass $10,715,309 $14,848,775 $85,779,702 $70,930,927 477.7% $75,064,393 700.5%% Total Trade with Canada 3.0% 1.6% 7.4% 5.9% 4.4%
TOTALExports $12,238,590 $26,621,252 $50,260,744 $23,639,492 88.8% $38,022,154 310.7%
% of Total Exports to Canada 2.6% 1.7% 2.4% 0.6% -0.3%Imports $16,022,516 $69,458,967 $182,294,724 $112,835,757 162.4% $166,272,208 1037.7%
% of Total Imports to Canada 1.5% 3.8% 8.0% 4.2% 6.5%Total Trade Thru Sweet Grass $28,261,106 $96,080,219 $232,555,468 $136,475,249 142.0% $204,294,362 722.9%
% Total Trade with Canada 1.8% 2.8% 5.3% 2.4% 3.4%
North Dakota -- Page 11
North Dakota's International and Domestic Ports-to-Plains Region Trading Relationships
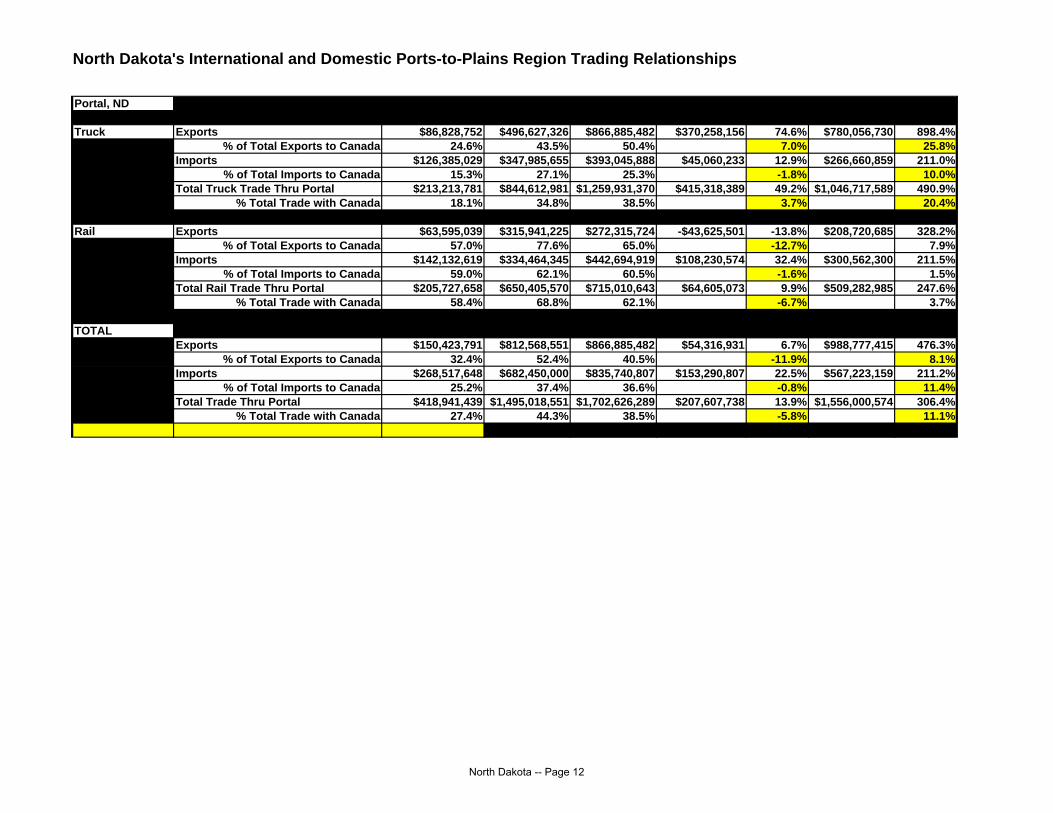
Portal, ND
Truck Exports $86,828,752 $496,627,326 $866,885,482 $370,258,156 74.6% $780,056,730 898.4%% of Total Exports to Canada 24.6% 43.5% 50.4% 7.0% 25.8%
Imports $126,385,029 $347,985,655 $393,045,888 $45,060,233 12.9% $266,660,859 211.0%% of Total Imports to Canada 15.3% 27.1% 25.3% -1.8% 10.0%
Total Truck Trade Thru Portal $213,213,781 $844,612,981 $1,259,931,370 $415,318,389 49.2% $1,046,717,589 490.9%% Total Trade with Canada 18.1% 34.8% 38.5% 3.7% 20.4%
Rail Exports $63,595,039 $315,941,225 $272,315,724 -$43,625,501 -13.8% $208,720,685 328.2%% of Total Exports to Canada 57.0% 77.6% 65.0% -12.7% 7.9%
Imports $142,132,619 $334,464,345 $442,694,919 $108,230,574 32.4% $300,562,300 211.5%% of Total Imports to Canada 59.0% 62.1% 60.5% -1.6% 1.5%
Total Rail Trade Thru Portal $205,727,658 $650,405,570 $715,010,643 $64,605,073 9.9% $509,282,985 247.6%% Total Trade with Canada 58.4% 68.8% 62.1% -6.7% 3.7%
TOTALExports $150,423,791 $812,568,551 $866,885,482 $54,316,931 6.7% $988,777,415 476.3%
% of Total Exports to Canada 32.4% 52.4% 40.5% -11.9% 8.1%Imports $268,517,648 $682,450,000 $835,740,807 $153,290,807 22.5% $567,223,159 211.2%
% of Total Imports to Canada 25.2% 37.4% 36.6% -0.8% 11.4%Total Trade Thru Portal $418,941,439 $1,495,018,551 $1,702,626,289 $207,607,738 13.9% $1,556,000,574 306.4%
% Total Trade with Canada 27.4% 44.3% 38.5% -5.8% 11.1%
North Dakota -- Page 12

North Dakota's International and Domestic Ports-to-Plains Region Trading Relationships
Wild Horse0
Truck Exports $0 $0 $0 $0 #DIV/0! $0 #DIV/0!% of Total Exports to Canada 0.0% 0.0% 0.0% 0.0% 0.0%
Imports $23,762 $11,407 $97,500 $86,093 754.7% $73,738 310.3%% of Total Imports to Canada 0.0% 0.0% 0.0% 0.0% 0.0%
Total Truck Trade Thru Wild Horse $23,762 $11,407 $97,500 $86,093 754.7% $73,738 310.3%% Total Trade with Canada 0.0% 0.0% 0.0% 0.0% 0.0%
Rail Exports $0 $0 #DIV/0! $0 #DIV/0!% of Total Exports to Canada 0.0% 0.0% 0.0% 0.0% 0.0%
Imports $0 $0 #DIV/0! $0 #DIV/0!% of Total Imports to Canada 0.0% 0.0% 0.0% 0.0% 0.0%
Total Rail Trade Thru Wild Horse $0 $0 $0 $0 #DIV/0! $0 #DIV/0!% Total Trade with Canada 0.0% 0.0% 0.0% 0.0% 0.0%
TOTALExports $0 $0 $0 $0 #DIV/0! $0 #DIV/0!
% of Total Exports to Canada 0.0% 0.0% 0.0% 0.0% 0.0%Imports $23,762 $11,407 $97,500 $86,093 754.7% $73,738 310.3%
% of Total Imports to Canada 0.0% 0.0% 0.0% 0.0% 0.0%Total Trade Thru Wild Horse $23,762 $11,407 $97,500 $86,093 754.7% $73,738 310.3%
% Total Trade with Canada 0.0% 0.0% 0.0% 0.0% 0.0%
North Dakota -- Page 13

North Dakota's International and Domestic Ports-to-Plains Region Trading Relationships
PTP#DIV/0!
Truck Exports $95,395,857 $521,987,770 $896,539,001 $374,551,231 71.8% $801,143,144 839.8%% of Total Exports to Canada 27.1% 45.7% 52.2% 6.5% 25.1%
Imports $137,868,507 $414,560,274 $537,106,347 $122,546,073 29.6% $399,237,840 289.6%% of Total Imports to Canada 16.7% 32.3% 34.6% 2.3% 17.9%
Total Truck Trade Thru PTP $233,264,364 $936,548,044 $1,433,645,348 $497,097,304 53.1% $1,200,380,984 514.6%% Total Trade with Canada 19.8% 38.6% 43.8% 5.2% 24.0%
Rail Exports $68,507,036 $322,548,139 $306,343,305 -$16,204,834 -5.0% $237,836,269 347.2%% of Total Exports to Canada 19.4% 28.2% 17.8% -10.4% -1.6%
Imports $147,935,931 $342,706,206 $494,447,040 $151,740,834 44.3% $346,511,109 234.2%% of Total Imports to Canada 17.9% 26.7% 31.9% 5.2% 13.9%
Total Rail Trade Thru PTP $216,442,967 $665,254,345 $800,790,345 $135,536,000 20.4% $584,347,378 270.0%% Total Trade with Canada 18.4% 27.4% 24.5% -2.9% 6.1%
TOTALExports $163,902,893 $844,535,909 $1,202,882,306 $358,346,397 42.4% $1,038,979,413 633.9%
% of Total Exports to Canada 35.3% 54.5% 56.3% 1.8% 21.0%Imports $285,804,438 $757,266,480 $1,031,553,387 $274,286,907 36.2% $745,748,949 260.9%
% of Total Imports to Canada 26.8% 41.5% 45.2% 3.6% 18.4%Total Trade Thru PTP $449,707,331 $1,601,802,389 $2,234,435,693 $632,633,304 39.5% $1,784,728,362 396.9%
% Total Trade with Canada 29.4% 47.5% 50.5% 3.0% 21.2%
North Dakota -- Page 14

North Dakota's International and Domestic Ports-to-Plains Region Trading Relationships
2011 Leading Exports from North Dakota to Canada (Surface Transportation) 2011Rank Export1 27 Mineral fuels; mineral oils and products of their distillation; Bituminous substances; Mineral waxes $805,145,7162 84 Nuclear reactors; boilers; machinery and mechanical appliances; parts thereof $345,164,5153 87 Vehicles; other than railway or tramway rolling stock; and parts and accessories thereof $307,871,0734 38 Miscellaneous chemical products $112,158,6565 15 Animal or vegetable fats and oils and their cleavage products; Prepared edible fats; Animal waxes $97,776,9306 23 Residues and waste from the food industries; Prepared animal feed $85,446,8227 10 Cereals $69,375,2608 12 Oil seeds and oleaginous fruits; Miscellaneous grains; Seeds and fruit; Industrial plants $65,001,2169 22 Beverages; spirits and vinegar $29,794,48610 7 Edible vegetables and certain roots and tubers $27,397,731
2011 Leading Imports to North Dakota from Canada (Surface Transportation) 2011Rank Import1 84 Nuclear reactors; boilers; machinery and mechanical appliances; parts thereof $436,381,6622 12 Oil seeds and oleaginous fruits; Miscellaneous grains; Seeds and fruit; Industrial plants $429,853,2083 27 Mineral fuels; mineral oils and products of their distillation; Bituminous substances; Mineral waxes $308,528,0364 31 Fertilizers $273,210,2065 73 Articles of iron or steel $157,305,5566 28 Inorganic chemicals; Organic or inorganic compounds of precious metals; of rare-earth metals $145,307,0177 87 Vehicles; other than railway or tramway rolling stock; and parts and accessories thereof $135,965,8898 98 Special classification provisions $94,881,5599 72 Iron and steel $72,420,42110 10 Cereals $61,584,822
North Dakota -- Page 15

North Dakota's International and Domestic Ports-to-Plains Region Trading Relationships
2011 Leading Exports from North Dakota to Canada (Surface Transportation) 2011Rank Alberta Export
1 27 Mineral fuels; mineral oils and products of their distillation; Bituminous substances; Mineral waxes $75,995,7842 38 Miscellaneous chemical products $68,379,3463 23 Residues and waste from the food industries; Prepared animal feed $27,761,2624 10 Cereals $10,675,2095 17 Sugars and sugar confectionery $10,322,0096 22 Beverages; spirits and vinegar $5,487,3717 84 Nuclear reactors; boilers; machinery and mechanical appliances; parts thereof $3,897,2478 87 Vehicles; other than railway or tramway rolling stock; and parts and accessories thereof $2,016,1099 12 Oil seeds and oleaginous fruits; Miscellaneous grains; Seeds and fruit; Industrial plants $1,677,672
10 15 Animal or vegetable fats and oils and their cleavage products; Prepared edible fats; Animal waxes $1,055,718
2011 Leading Exports from North Dakota to Canada (Surface Transportation) 2011Rank British Colombia Export
1 15 Animal or vegetable fats and oils and their cleavage products; Prepared edible fats; Animal waxes $78,539,0622 22 Beverages; spirits and vinegar $16,070,1253 23 Residues and waste from the food industries; Prepared animal feed $13,574,5644 38 Miscellaneous chemical products $6,132,7135 10 Cereals $4,508,8036 29 Organic chemicals $2,693,5967 7 Edible vegetables and certain roots and tubers $2,394,2818 84 Nuclear reactors; boilers; machinery and mechanical appliances; parts thereof $2,280,0319 39 Plastics and articles thereof $1,685,349
10 27 Mineral fuels; mineral oils and products of their distillation; Bituminous substances; Mineral waxes $1,677,855
North Dakota -- Page 16

North Dakota's International and Domestic Ports-to-Plains Region Trading Relationships
2011 Leading Exports from North Dakota to Canada (Surface Transportation) 2011Rank Saskatchewan Export
1 27 Mineral fuels; mineral oils and products of their distillation; Bituminous substances; Mineral waxes $664,276,3882 84 Nuclear reactors; boilers; machinery and mechanical appliances; parts thereof $124,649,1133 87 Vehicles; other than railway or tramway rolling stock; and parts and accessories thereof $100,472,1104 38 Miscellaneous chemical products $14,230,2475 23 Residues and waste from the food industries; Prepared animal feed $12,609,8386 85 Electrical machinery and equipment and parts thereof; Sound recorders and reproducers $10,549,3467 29 Organic chemicals $8,739,8018 73 Articles of iron or steel $6,396,9029 31 Fertilizers $5,792,471
10 72 Iron and steel $4,302,793
North Dakota -- Page 17

North Dakota's International and Domestic Ports-to-Plains Region Trading Relationships
2002 Domestic -- 2007Rail
ChangeTruck
ChangeDomestic --
2015
Rail Change
2002-2015
Truck Change
2002-2015
Exports Rail Truck Exports Rail Truck Exports Rail TruckColorado 0 39 4% Colorado 38 0 2% 0% -100% Colorado 80 320 8% 722%Montana 0 201 19% Montana 0 398 25% 98% Montana 43 411 9% 105%Nebraska 0 72 7% Nebraska 0 151 10% 110% Nebraska 69 181 5% 151%New Mexico 0 0 0% New Mexico 32 0 2% New Mexico 40 46 2%North Dakota North Dakota North Dakota 376.95 0Oklahoma 0 59 5% Oklahoma 0 0 0% -100% Oklahoma 4 74 2% 26%South Dakota 0 513 48% South Dakota 0 745 47% 45% South Dakota - 1,791 37% 249%Texas 47 137 17% Texas 0 285 18% -100% 108% Texas 904 332 26% 1823% 142%Wyoming 0 12 1% Wyoming 0 0 0% -100% Wyoming - 118 2% 887%Total ($m) 47 1,033 Total ($m) 1,579 104% -100% 53% Total ($m) 1,516 3,274 100% 3126% 217%
1,080 1,579 46% 4,790 344%
Imports Rail Truck Imports Rail Truck Imports Rail TruckColorado 0 0 0% Colorado 0 120 5% Colorado - 123 4%Montana 0 50 6% Montana 73 195 11% 290% Montana 83 247 11% 395%Nebraska 0 207 24% Nebraska 0 358 15% 73% Nebraska 7 293 10% 42%New Mexico 0 0 0% New Mexico 0 0 0% New Mexico - 0 0%North Dakota North Dakota North Dakota 0Oklahoma 24 91 13% Oklahoma 0 184 8% -100% 102% Oklahoma 0 90 3% -98% -1%South Dakota 1 199 23% South Dakota 0 645 27% -100% 224% South Dakota - 1,205 40% -100% 505%Texas 0 280 32% Texas 0 788 33% 181% Texas 35 879 30% 214%Wyoming 0 12 1% Wyoming 0 44 2% 267% Wyoming 7 46 2% 284%Total ($m) 25 839 Total ($m) 73 2,334 100% 192% 178% Total ($m) 132 2,884 100% 429% 244%
864 2,407 179% 3,017 249%
TOTALS Rail Truck TOTALS Rail Truck TOTALS Rail TruckColorado 0 39 2% Colorado 38 120 4% 208% Colorado 80 444 7% 1038%Montana 0 251 13% Montana 73 593 16% 136% Montana 126 658 11% 162%Nebraska 0 279 14% Nebraska 0 509 13% 82% Nebraska 76 474 7% 70%New Mexico 0 0 0% New Mexico 32 0 1% New Mexico 40 47 1%North Dakota North Dakota North Dakota 0Oklahoma 24 150 9% Oklahoma 0 184 5% -100% 23% North Dakota 4 165 2% -83% 10%South Dakota 1 712 37% South Dakota 0 1,390 34% -100% 95% Oklahoma - 2,996 40% -100% 321%Texas 47 417 24% Texas 0 1,073 26% -100% 157% South Dakota 939 1,211 29% 1897% 190%Wyoming 0 24 1% Wyoming 0 44 1% 83% Texas 7 165 2% 585%Total ($m) 72 1,872 Total ($m) 143 3,913 100% 99% 109% Total ($m) 1,272 6,159 100% 229%
1,944 4,056 109% 7,430 282%
North Dakota -- Page 18
Related Documents