PHASE I WATERSHED ASSESSMENT FINAL REPORT AND TMDLs NORTH-CENTRAL BIG SIOUX RIVER BROOKINGS, HAMLIN, DEUEL, AND CODINGTON COUNTIES SOUTH DAKOTA South Dakota Watershed Protection Program Division of Financial and Technical Assistance South Dakota Department of Environment and Natural Resources Steven M. Pirner, Secretary December 2005

Welcome message from author
This document is posted to help you gain knowledge. Please leave a comment to let me know what you think about it! Share it to your friends and learn new things together.
Transcript

PHASE I WATERSHED ASSESSMENT FINAL REPORT
AND TMDLs
NORTH-CENTRAL BIG SIOUX RIVER BROOKINGS, HAMLIN, DEUEL, AND CODINGTON COUNTIES
SOUTH DAKOTA
South Dakota Watershed Protection Program Division of Financial and Technical Assistance
South Dakota Department of Environment and Natural Resources Steven M. Pirner, Secretary
December 2005
PHASE I WATERSHED ASSESSMENT FINAL REPORT
AND TMDLs
NORTH-CENTRAL BIG SIOUX RIVER BROOKINGS, HAMLIN, DEUEL, AND CODINGTON COUNTIES
SOUTH DAKOTA
South Dakota Watershed Protection Program Division of Financial and Technical Assistance
South Dakota Department of Environment and Natural Resources Steven M. Pirner, Secretary
Project Sponsor and Prepared By
East Dakota Water Development District
State of South Dakota Mike Rounds, Governor
December 2005
This project was conducted in cooperation with the State of South Dakota and the United States Environmental Protection Agency, Region 8. EPA Grants # C9998185-96 and # C9998185-00

EXECUTIVE SUMMARY PROJECT TITLE: North-Central Big Sioux River Watershed Assessment START DATE: April 01, 2001 COMPLETION DATE: 12/31/06 FUNDING: TOTAL BUDGET: $330,576 (projected) TOTAL EPA GRANT: $150,243 TOTAL EXPENDITURES OF EPA FUNDS: $150,243 (through 12/31/06) TOTAL SECTION 319 MATCH ACCRUED: $205,846.36 (through 12/31/06) BUDGET REVISIONS: Original EPA Grant: $172,243 Grant Reductions: $ 22,000 Revised EPA Grant: $150,243 TOTAL EXPENDITURES: $356,089.36 (through 12/31/06) SUMMARY ACCOMPLISHMENTS The North-Central Big Sioux River watershed assessment project began in April of 2001 and continued through December of 2005 when data analysis and compilation into a final report was completed. The assessment was conducted as a result of this area of the Big Sioux River watershed being placed on the 1998 303(d) list for total suspended solids (TSS) problems. The project met all of its milestones in a timely manner, with the exception of completing the final report. This was delayed while completion of TMDL reports for an additional watershed (the Central Big Sioux River Watershed Assessment) was completed. An EPA section 319 grant provided a majority of the funding for this project. The Department of Environment and Natural Resources and East Dakota Water Development District provided matching funds for the project. Water quality monitoring and watershed modeling resulted in the identification of several sources of impairment. These sources may be addressed through best management practices (BMPs) and the construction of several waste management systems at animal feeding operations. The long term goal for this project was to locate and document sources of non-point source pollution in the North-Central Big Sioux River (BSR) watershed and provide feasible restoration alternatives to improve water quality. Through identification of sources of impairment in the watershed, this goal was accomplished.

ii
ACKNOWLEDGEMENTS The cooperation of the following organizations and individuals is gratefully appreciated. The assessment of the North-Central Big Sioux River and its watershed could not have been completed without the cooperation of the landowners in the study area - their cooperation is greatly appreciated. Brookings County Conservation District Codington County Conservation District Deuel County Conservation District Hamlin County Conservation District Natural Resource Solutions Sioux Falls Health Lab South Dakota Cattlemen’s Association South Dakota Corn Growers Association South Dakota Department of Environment and Natural Resources South Dakota Department of Game, Fish and Parks South Dakota Soybean Association South Dakota State University, Department of Wildlife and Fisheries, GAP Analysis Lab South Dakota Geological Survey South Dakota State University, Water Resource Institute United States Department of Agriculture, Farm Service Agency, Brookings United States Department of Agriculture, Farm Service Agency, Watertown United States Department of Agriculture, Natural Resource Conservation Service United States Environmental Protection Agency United States Fish and Wildlife Service United States Geological Survey
East Dakota Water Development staff that contributed to the development of this report:
Technical Staff: Deb Springman, Becky Banks, Mark Hanson, Craig Milewski, Dray Walter Summer Assistants: Sam Kezar, Kate VanDerWal

iii
TABLE OF CONTENTS EXECUTIVE SUMMARY ................................................................................................... i
ACKNOWLEDGEMENTS ................................................................................................ ii TABLE OF CONTENTS ................................................................................................... iii
LIST OF FIGURES .............................................................................................................vii
LIST OF TABLES ................................................................................................................ ix
LIST OF APPENDICES ..................................................................................................... xi
ABBREVIATIONS ...............................................................................................................xii
INTRODUCTION .................................................................................................................. 1 PURPOSE............................................................................................................................................................ 1 GENERAL WATERSHED DESCRIPTION ................................................................................. 1
Geology and Soils Climate Land Use Population History
PROJECT DESCRIPTION .......................................................................................................... 5 BENEFICIAL USES ................................................................................................................... 9 RECREATIONAL USE ............................................................................................................ 11 THREATENED AND ENDANGERED SPECIES ...................................................................... 12
PROJECT GOALS, OBJECTIVES, AND MILESTONES .................................. 13 GOALS ..............................................................................................................................................................13 OBJECTIVES .......................................................................................................................... 13 Objective 1. Water Quality Assessment ............................................................................ 13 Objective 2. Quality Assurance/ Quality Control (QA/QC) ................................................ 13 Objective 3. Watershed Modeling .................................................................................... 13 Objective 4. Information and Outreach ............................................................................. 14 Objective 5. Reporting/TMDL Determination ................................................................... 14 MILESTONES ......................................................................................................................... 15
METHODS .............................................................................................................................. 16 ENVIRONMENTAL INDICATORS ......................................................................................... 16 Water Quality Monitoring ................................................................................................ 16
Description of Parameters ........................................................................................ 17 Water Quality Parameter Definitions ........................................................................ 17
Flow and Discharge Gaging ..................................................................................... 21 Flow Duration Intervals ........................................................................................... 21 Biological Monitoring ...................................................................................................... 25

iv
Fish Sampling ......................................................................................................... 26 Fish Index of Biological Integrity (IBI) .................................................................... 26
Macroinvertebrate Sampling .................................................................................... 28 Macroinvertebrate (IBI) ........................................................................................... 29
Physical Habitat ............................................................................................................... 32 Habitat Assessment ................................................................................................. 32
Index of Physical Integrity (IPI) ............................................................................... 34 QUALITY ASSURANCE AND DATA MANAGEMENT ....................................................................... 37
ASSESSSMENT OF SOURCES ............................................................................................... 37 Point Sources ................................................................................................................... 37 Non-point Sources ........................................................................................................... 38 Modeling ........................................................................................................................ 39 FLUX Model .......................................................................................................... 40 AGNPS Feedlot Model ............................................................................................ 41
AnnAGNPS Landuse Model..................................................................................... 41
RESULTS .................................................................................................................................... 42 WATER QUALITY MONITORING ......................................................................................... 42 Chemical Parameters ....................................................................................................... 43
Fecal Coliform Bacteria Total Solids Total Suspended Solids Total Dissolved Solids Total Ammonia Nitrogen as N Nitrate-Nitrite Total Kjeldahl Nitrogen Organic Nitrogen Total Phosphorus Total Dissolved Phosphorus Field Parameters .............................................................................................................. 50 Dissolved Oxygen pH Air Temperature Water Temperature Conductivity Specific Conductivity Salinity Turbidity - NTU
Flow Duration Intervals..................................................................................................... 56 BIOLOGICAL MONITORING ................................................................................................. 56 Fish Sampling .................................................................................................................. 56
Rare, Threatened and Endangered Species ................................................................ 58 Macroinvertebrate Sampling ............................................................................................. 59 PHYSICAL HABITAT MONITORING .................................................................................... 60 Habitat Assessment .......................................................................................................... 60 ASSESSSMENT OF SOURCES . ............................................................................................. 62 Point Sources ................................................................................................................... 62

v
Non-point Sources ........................................................................................................... 65 Modeling ......................................................................................................................... 66 FLUX Modeling .................................................................................................... 66 AGNPS Feedlot Model ........................................................................................... 66
AnnAGNPS Model .................................................................................................. 66
ANALYSIS AND SUMMARY ......................................................................................... 72 SUMMARY OF POLLUTANT LOADINGS ............................................................................ 72 Castlewood North ............................................................................................................ 73
Castlewood to Estelline..................................................................................................... 86 Estelline South ................................................................................................................ 98
WATER QUALITY GOALS .......................................................................................... 110 TARGET REDUCTIONS & FUTURE ACTIVITY RECOMMENDATIONS .................................................................................................. 113 PUBLIC INVOLVEMENT & COORDINATION .................................................. 122 ASPECTS OF THE PROJECT THAT DID NOT WORK WELL .................. 123 LITERATURE CITED ..................................................................................................... 124
vi
LIST OF FIGURES Figure 1. The Big Sioux Basin Boundary and Location of the NCBSRW ......................................... 2 Figure 2. South Dakota Precipitation Normals in Inches From 1971-2000.......................................... 3 Figure 3. South Dakota Growing Season Precipitation in Inches from 1971-2000 ............................... 3 Figure 4. Landuse in the NCBSRW ............................................................................................... 4 Figure 5. Ecoregions III and IV of Eastern South Dakota . .............................................................. 6 Figure 6. Location of Monitoring Sites . ......................................................................................... 8 Figure 7. Sample Result Flow Duration Interval with Zones and Plotted Grab Samples.................... 22 Figure 8. Diagrams of Transect Spacing, Horizontal, Bank, and Instream Measurements ................. 34 Figure 9. City of Watertown and the Monitoring Sites Used to Figure Stormwater Runoff ............. 38 Figure 10. Box and Whisker Plot of Fecal Coliform Bacteria for River and Tributary Sites ................ 44 Figure 11. Box and Whisker Plot of Total Solids for River and Tributary Sites .................................. 44 Figure 12. Box and Whisker Plot of TSS for River and Tributary Sites ............................................. 45 Figure 13. Box and Whisker Plot of Total Dissolved Solids for River and Tributary Sites .................. 46 Figure 14. Box and Whisker Plot of Total Ammonia Nitrogen as N for River and Tributary Sites.............................................................................................................................. 47 Figure 15. Box and Whisker Plot of Nitrate-Nitrite for River and Tributary Sites .............................. 47 Figure 16. Box and Whisker Plot of Total Kjeldahl Nitrogen for River and Tributary Sites ................ 48 Figure 17. Box and Whisker Plot of Organic Nitrogen for River and Tributary Sites .......................... 49 Figure 18. Box and Whisker Plot of Total Phosphorus for River and Tributary Sites .......................... 49 Figure 19. Box and Whisker Plot of Total Dissolved Phosphorus for River and Tributary Sites.............................................................................................................................. 50 Figure 20. Box and Whisker Plot of Dissolved Oxygen for River and Tributary Sites ........................ 51 Figure 21. Box and Whisker Plot of pH for River and Tributary Sites ............................................... 52 Figure 22. Box and Whisker Plot of Air Temperature for River and Tributary Sites ........................... 52 Figure 23. Box and Whisker Plot of Water Temperature for River and Tributary Sites ....................... 53 Figure 24. Box and Whisker Plot of Conductivity for River and Tributary Sites ................................ 54 Figure 25. Box and Whisker Plot of Specific Conductivity for River and Tributary Sites ................... 54 Figure 26. Box and Whisker Plot of Salinity for River and Tributary Sites ........................................ 55 Figure 27. Box and Whisker Plot of Turbidity for River and Tributary Sites ...................................... 56 Figure 28. Scatterplot of Macroivertebrate IBI Scores. .................................................................... 59 Figure 29. The Three Major Watersheds of the North-Central Study Area......................................... 72 Figure 30. Castlewood North Location Map ................................................................................... 73 Figure 31. Castlewood North Area Landuse . .................................................................................. 74 Figure 32. Castlewood North Watershed Livestock ......................................................................... 74 Figure 33. Fecal Coliform Bacteria Percent Exceedence at Standard ≤ 2000 cfu/100mL in the Lake Kampeska to Willow Creek Segment of the Big Sioux River ................................... 76 Figure 34. Fecal Coliform Bacteria Percent Exceedence at Standard ≤ 2000 cfu/100mL in the Willow Creek to Stray Horse Creek Segment of the Big Sioux River ............................... 76 Figure 35. Fecal Coliform Bacteria Percent Exceedence at Standard ≤ 2000 cfu/100mL in Willow Creek ............................................................................................................... 77 Figure 36. Fecal Coliform Bacteria in Billions of Colonies Per Day Monitored vs the Standard in the Castlewood North Area .......................................................................... 77 Figure 37. Scatterplots of Fecal Coliform Bacteria Grab Samples for River Sites (R14-R18) and Willow Creek (T35 and T36) ................................................................................... 78 Figure 38. Scatterplot of Fecal Coliform Bacteria Grab Samples for the Lake Pelican Weir (T34).................................................................................................................... 79

vii
Figure 39. 25-Year Trend (1980-2004) of Yearly Seasonal Medians of Fecal Coliform Bacteria at R14............................................................................................................... 79 Figure 40. 25-Year Trend (1980-2004) of Yearly Seasonal Medians of Fecal Coliform Bacteria at R17.............................................................................................................. 80 Figure 41. TSS in kg Monitored vs the Standard in the Castlewood North Area................................. 80 Figure 42. Scatterplot of TSS Grab Samples for River Sites (R14-R18) and Willow Creek (T35 and T36) ..................................................................................................... 81 Figure 43. Scatterplot of TSS Grab Samples for the Lake Pelican Weir (T34) ................................... 82 Figure 44. Dissolved Oxygen Percent Exceeedence at Standard ≥ 5 mg/L in Willow Creek ................ 83 Figure 45. Scatterplot of Dissolved Oxygen Samples for Willow Creek............................................ 83 Figure 46. Castlewood to Estelline Location Map ........................................................................... 86 Figure 47. Castlewood to Estelline Area Landuse ........................................................................... 87 Figure 48. Castlewood to Estelline Watershed Livestock ................................................................ 87 Figure 49. Fecal Coliform Bacteria Percent Exceedence at Standard ≤ 2000 cfu/100mL in the Stray Horse Creek to Near Volga Segment of the Big Sioux River................................... 89 Figure 50. Fecal Coliform Bacteria Percent Exceedence at Standard ≤ 2000 cfu/100mL in Stray Horse Creek ......................................................................................................... 89 Figure 51. Fecal Coliform Bacteria Percent Exceedence at Standard ≤ 2000 cfu/100mL in Hidewood Creek .......................................................................................................... 90 Figure 52. Fecal Coliform Bacteria in Billions of Colonies Per Day Monitored vs the Standard in the Castlewood to Estelline Area ................................................................................... 91 Figure 53. Scatterplots of Fecal Coliform Bacteria Grab Samples for River Site R19, Stray Horse Creek (T37), Hidewood Creek (T40 and T41), and the Lake Poinsett Outlet (T39) ............ 92 Figure 54. TSS in kg Monitored vs the Standard in the Castlewood to Estelline Area ........................ 93 Figure 55. Scatterplots of TSS Grab Samples for the Stray Horse Creek to Near Volga Segment of the Big Sioux River, Stray Horse Creek, Hidewood Creek, and the
Lake Poinsett Outlet...................................................................................................... 94 Figure 56. Dissolved Oxygen Percent Exceedence at Standard ≥ 5mg/L in Hidewood Creek.............. 95 Figure 57. Scatterplot of Dissolved Oxygen Samples for Hidewood Creek........................................ 96 Figure 58. Estelline South Location Map . ...................................................................................... 98 Figure 59. Estelline South Area Landuse ....................................................................................... 99 Figure 60. Estelline South Watershed Livestock ............................................................................. 99 Figure 61. Fecal Coliform Bacteria Percent Exceedence at Standard ≤ 2000 cfu/100mL in the Near Volga to Brookings Segment of the Big Sioux River............................................. 101 Figure 62. Fecal Coliform Bacteria Percent Exceedence at Standard ≤ 2000 cfu/100mL in Peg Munky Run ......................................................................................................... 101 Figure 63. Fecal Coliform Bacteria Percent Exceedence at Standard ≤ 2000 cfu/100mL in Unnamed Creek Near Volga ....................................................................................... 102 Figure 64. Fecal Coliform Bacteria in Billions of Colonies Per Day Monitored vs the Standard in the Estelline South Area .....................................................................................................103 Figure 65. Scatterplots of Fecal Coliform Bacteria Grab Samples for River Site R01, Peg Munky Run (T42), and the Unnamed Creek Near Volga (T47).................................................. 104 Figure 66. 25-Year Trend (1980-2004) of Yearly Seasonal Medians of Fecal Coliform Bacteria at R01 .......................................................................................................... 105 Figure 67. TSS in kg Monitored vs the Standard in the Estelline South Area ......................................106 Figure 68. Scatterplots of TSS Grab Samples for River Site R01, Peg Munky Run (T42), and the Unnamed Creek Near Volga (T47) .............................................................................. 107
viii
Figure 69. Percent Exceedence of Fecal Coliform By Site ............................................................. 110 Figure 70. Percent Exceedence of TSS by Big Sioux River Segment or by Major Tributary ............. 111 Figure 71. Least Impaired to Most Impaired Montoring Sites ........................................................ 112 Figure 72. Targeted TMDL for the Big Sioux River Segments, Major Tributaries, and Lakes ........... 114

ix
LIST OF TABLES Table 1. 303(d) Listing of Locations Not Meeting Water Quality Criteria .......................................... 1 Table 2. Land Area and Population of Codington, Hamlin, Deuel, and Brookings Counties ................. 5 Table 3. Description of Level IV Ecoregions Within the North-Central Big Sioux River Watershed ....................................................................................................................... 7 Table 4. Numeric Criteria Assigned to Beneficial Uses of Surface Waters for the North-Central Big Sioux River and Tributaries ................................................................. 10 Table 5. Monitoring Sites and Their Beneficial Use Classification .................................................. 11 Table 6. Public Recreation Areas Within the NCBSRW Study Area ............................................... 11 Table 7. Endangered, Threatened, and Candidate Species of the NCBSRW Area .............................. 12 Table 8. Milestones - Proposed and Actual Objective Completion Dates ......................................... 15 Table 9. Project Sites Coinciding with DENR and USGS Monitoring Locations ............................... 16 Table 10. Water Quality Parameters Analyzed and Laboratory Detect Limits for WRI and the Sioux Falls Health Labs .................................................................................................. 17 Table 11. Water Quality Parameters and Lab Detect Limits for the State Health Lab ......................... 17 Table 12. Sample Result of Fecal Coliform Bacteria Reduction Calculation Results .......................... 23 Table 13. Descriptions of Stream Gaging Stations Analyzed with the Drainage-Area Ratio
Method............................................................................................................................... ....... .24 Table 14. Process of Developing Biological Indicators for the NCBSRW ......................................... 25 Table 15. Candidate Fish Metrics Calculated for the NCBSRW ........................................................ 27 Table 16. Core Fish Metrics for the NCBSRWA ............................................................................. 28 Table 17. Sample Score Sheet for Fishes ......................................................................................... 28 Table 18. Deployment and Retrieval Dates for Rock Baskets by Site ................................................ 29 Table 19. Candidate Macroinvertebrate Metrics Calculated for the NCBSRWA ................................ 30 Table 20. Core Macroinvertebrate Metrics Calculated for the BSR and Tributaries in the
NCBSRW .......................................................................................................................... ........ 31 Table 21. Sample Score Sheet for Macroinvertebrates ...................................................................... 32 Table 22. Parameters and Scores Used to Rate the Physical Habitat Measurements ............................ 35 Table 23. Sample Score Sheet for Physical Habitat ........................................................................... 36 Table 24. Sample Final Score Sheet for Physical Habitat .................................................................. 36 Table 25. Modeling and Assessment Techniques and Outputs Used for the NCBSRWAP ................... 40 Table 26. Summary of Chemical Parameters Sampled in the Tributaries and River ............................ 43 Table 27. Summary of Field Parameters Sampled in the Tributaries and River ................................... 50 Table 28. Fish Score for Site T36 .................................................................................................... 57 Table 29. Fish Score for Site T37 .................................................................................................... 57 Table 30. Fish Score for Site T41 .................................................................................................... 58 Table 31. Fish Score for Site T42 .................................................................................................... 58 Table 32. Numbers and Location of Topeka Shiners ......................................................................... 58 Table 33. Physical Habitat Score for Site T36 ................................................................................. 60 Table 34. Physical Habitat Score for Site T37 .................................................................................. 60 Table 35. Physical Habitat Score for Site T41 .................................................................................. 61 Table 36. Physical Habitat Score for Site T42 .................................................................................. 61 Table 37. NPDES Percent Contributions of TSS .............................................................................. 63 Table 38. NPDES Percent Contributions of Fecal Coliform Bacteria ................................................. 64 Table 39. Wildlife Contribution of Fecal Coliform Bacteria .............................................................. 65 Table 40. Failing Septic System Contribution of Fecal Coliform Bacteria .......................................... 66

x
Table 41. AnnAGNPS Output for a 1-Year Simulated Period ............................................................ 68 Table 42. AnnAGNPS Output for a 10-Year Simulated Period .......................................................... 69 Table 43. AnnAGNPS Output for a 25-Year Simulated Period .......................................................... 70 Table 44. Phosphorus Reduction Results After Converting Cropland to Grassland ............................ 71 Table 45. Summary of Beneficial Use Class by Site ........................................................................ 75 Table 46. Ranges and Percent Exceedences of Fecal Coliform Bacteria, TSS, and Summer Means of Total PO4 for the Sites in the Castlewood North Area ........................................ 82 Table 47. Bugs, Fish, and Habitat Final Index Values and Suggested Impaiment for the Sites in the Castlewood North Area ......................................................................................... 84 Table 48. Percent Fecal Coliform Bacteria Reduction in the Castlewood North Area ......................... 85 Table 49. Summary of Beneficial Use Class by Site ......................................................................... 88 Table 50. Ranges and Percent Exceedences of Fecal Coliform Bacteria, TSS, and Summer Means of Total PO4 in the Castlewood to Estelline Area ................................................... 95 Table 51. Bugs, Fish, and Habitat Final Index Values and Suggested Impairment for the Castlewood to Estelline Area ........................................................................................... 97 Table 52. Percent Fecal Coliform Bacteria Reduction and Possible Sources in the Castlewood to Estelline Area .................................................................................................... 97 Table 53. Summary of Beneficial Use Class by Site ...................................................................... 100 Table 54. Ranges and Percent Exceedences of Fecal Coliform Bacteria, TSS, and Summer Means of Total PO4 in the Estelline South Area .............................................................. 108 Table 55. Bugs, Fish, and Habitat Final Index Values and Suggested Impairment in the Estelline South Area ................................................................................................................... 109 Table 56. Percent Fecal Coliform Bacteria Reduction in the Estelline South Area ............................ 109 Table 57. Priority Management Table for River Segments and Major Tributaries in the North Central Big Sioux River Watershed ............................................................................... 113 Table 58. Proposed TMDL Listing of Areas Not Meeting Water Quality Criteria ............................ 113 Table 59. Best Management Practices for Fecal Coliform Bacteria and Nutrient Problems ............... 115 Table 60. Percent Reduction Achievable by Best Management Practice .......................................... 116 Table 61. Recommended Management Practices for Fecal Coliform Bacteria by Hydrologic Conditions ................................................................................................................... 118

xi
LIST OF APPENDICES Appendix A. Monitoring Site Locations ..................................................................................A-1 Appendix B. WQ Grab Sample Data ....................................................................................... B-1 Appendix C. WQ Field Datasheet ........................................................................................... .C-1 Appendix D. Stage Recorder Start and End Dates ....................................................................D-1 Appendix E. Stage Discharge Curves ..................................................................................... E-1 Appendix F. Equations Used to Calculate Discharges ................................................................F-1 Appendix G. Flow Duration Interval Graph Data ......................................................................G-1 Appendix H. Terms and Definitions of the Core Fish Metrics ...................................................H-1 Appendix I. Box Plots of Fish Metrics .....................................................................................I-1 Appendix J. Natural Resource Solutions Contract and Laboratory Procedures ........................... J-1 Appendix K. Box Plots of Macroinvertebrate Metrics ..............................................................K-1 Appendix L. Macroinvertebrate Score Sheets .......................................................................... L-1 Appendix M. Terms and Definitions of the Physical Habitat Measurements .............................. M-1 Appendix N. Field Data Sheets ..............................................................................................N-1 Appendix O. WRI Lab Memo ................................................................................................O-1 Appendix P. QA/QC - WQ Duplicates and Blanks ...................................................................P-1 Appendix Q. WQ Parameters - FLUX Yearly Loads, Concentrations, and CV's .........................Q-1 Appendix R. Monthly Concentrations - FLUX ......................................................................... R-1 Appendix S. Monthly Loadings - FLUX ..................................................................................S-1 Appendix T. Methodology of the AGNPS Feedlot Model ......................................................... T-1 Appendix U. Min, Max, Median, Percent Violation, by Parameter for BSR and Tributaires .........U-1 Appendix V. Flow Duration Intervals and Fecal Reductions by Site ...............................................V-1 Appendix W. Fecal Coliform Bacteria Exceedence Table ......................................................... W-1 Appendix X. Fishes Collected During the NCBSRWAP............................................................X-1 Appendix Y. Life History Designations for Fishes Found During the NCBSRWAP ...................Y-1 Appendix Z. Candidate Metric Results for Fishes ..................................................................... Z-1 Appendix AA. Macroinvertebrate Candidate Metric Results...................................................... AA-1 Appendix BB. TSS Loadings and Reductions by Site ................................................................BB-1 Appendix CC. AgNPS Model Outputs for Feedlots in the NCBSRW Study Area ........................CC-1 Appendix DD. TMDL - Lake Kampeska to Willow Creek Segment (Fecal Coliform Bacteria)... DD-1 Appendix EE. TMDL - Willow Creek to Stray Horse Creek Segment (Fecal Coliform
Bacteria) ...................................................................................................... ...EE-1 Appendix FF. TMDL - Willow Creek (Fecal Coliform Bacteria) .............................................. FF-1 Appendix GG. TMDL - Stray Horse Creek (Fecal Coliform Bacteria)....................................... GG-1 Appendix HH. TMDL - Hidewood Creek (Fecal Coliform Bacteria)......................................... HH-1 Appendix II. TMDL - Peg Munky Run (Fecal Coliform Bacteria)............................................. II-1 Appendix JJ. Public Notice and EPA TMDL Comments and SDDENR Response to Comments .... JJ-1

xii
ABBREVIATIONS AFOs Animal Feeding Operations – facility where animals are confined, fed, or
maintained for a total of 45 days in any 12 month period, and where vegetation is not sustained in the normal growing season over any portion of the lot or facility
ARSD Administrative Rules of South Dakota – legal statutes that specify standards or requirements
AGNPS Agricultural Non-Point Source – an event-based, watershed-scale model developed to simulate runoff, sediment, chemical oxygen demand, and nutrient transport in surface runoff from ungaged agricultural watersheds
BMP Best Management Practice – an agricultural practice that has been determined to be an effective, practical means of preventing or reducing nonpoint source pollution
BSR Big Sioux River CFU Colony Forming Units - a count of the number of active bacterial cells CV Coefficient of Variance – a statistical term used to describe the amount of
variation within a set of measurements for a particular test DO Dissolved Oxygen EDWDD East Dakota Water Development District IBI Index of Biological Integrity IPI Index of Physical Integrity MOS Margin of Safety – an index indicating the amount beyond the minimum
necessary MPN Most Probably Number - a term used to signify that the number of bacteria
was determined by means of the multiple-tube fermentation technique NGP Northern Glaciated Plains NPDES National Pollution Discharge Elimination System NPS Non-point Source NRCS Natural Resources Conservation Service NTU Nephelometric Turbidity Units – measure of the concentration of size of
suspended particles (cloudiness) based on the scattering of light transmitted or reflected by the medium
SD South Dakota SDDENR South Dakota Department of Environment and Natural Resources SDGFP South Dakota Department of Game Fish & Parks SDSU South Dakota State University TKN Total Kjeldahl Nitrogen TMDL Total Maximum Daily Load – a calculation of the maximum amount of a
pollutant that a waterbody can receive and still meet water quality standards, and an allocation of the amount to the pollutant’s sources
TSS Total Suspended Solids µmhos/cm microhmos/centimeter – unit of measurement for conductivity USFWS United States Fish and Wildlife Service USGS United States Geologic Survey WQ Water Quality – term used to describe the chemical, physical, and
biological characteristics of water, usually in respect to its suitability for a particular purpose
WRI Water Resource Institute

1
INTRODUCTION PURPOSE The purpose of this assessment is to determine sources of impairment and develop restoration alternatives for the north-central Big Sioux River (BSR) and its major tributaries in Brookings, Hamlin, Deuel and Codington Counties of South Dakota (Figure 1). Direct runoff to the river, as well as perennial and intermittent tributaries, contributes loadings of sediment, nutrients, and fecal coliform bacteria primarily related to seasonal snow melt or rainfall events. In the 1998 and 2000 South Dakota 305(b) Water Quality Assessment Report and the 1998 and 2002 303(d) Waterbody List, the north-central portion of the Big Sioux River was listed as partially supporting its designated uses because of excess total suspended solids, pathogens, nutrients, and organic enrichment. In the 2004 Integrated Report for Surface Water Quality Assessment, the north-central portion from the confluence of Willow Creek and the Big Sioux River to the City of Brookings is not supporting its designated uses due to excessive suspended solids, fecal coliform bacteria, and nitrates. Table 1 shows those locations identified as not meeting water quality criteria. Through water quality monitoring (chemical and biological), stream gaging, and land use analysis, sources of impairment can be determined and feasible alternatives for restoration efforts can be developed. Because of its listing in the South Dakota 303(d) Waterbody List, this portion of the Big Sioux River is identified as a priority for the development of Total Maximum Daily Loads (TMDLs) for the pollutants of concern. This final assessment report and associated TMDLs will serve as the foundation for restoration projects that can be developed and implemented to meet the designated uses and water quality standards of the north-central portion of the Big Sioux River and its tributaries. This project is intended to be the initial phase of a series of watershed-wide restoration implementation projects. Table 1. 303(d) Listing of Locations Not Meeting Water Quality Criteria
Years Listed
Segment or Lake EDWDD Sites Basis Cause Source
1998 2002 2004
Willow Creek to Stray Horse Creek (segment of the BSR)
R17, R18 DENR460740 Nitrates Fecal Coliform Bacteria Organic Enrichment TSS
Crop Production, Livestock, Municipal PS Discharge, Industrial PS Discharge
1998 2002 2004
Near Volga to Brookings (segment of the BSR)
R20, R01 DENR460662 Fecal Coliform Bacteria Organic Enrichment TSS
Crop Production, Grazing in Riparian Zones, Animal Feeding Operations
GENERAL WATERSHED DESCRIPTION The north-central BSR watershed is approximately 502,894 acres (203,521 hectares) in size and lies within the Big Sioux Basin (Figure 1). The BSR is a permanent, natural river that flows north to south along the eastern edge of South Dakota and drains into the Missouri River at Sioux City, Iowa. The BSR is supplied by numerous intermittent tributaries, which carry water primarily during spring snowmelt or rainfall events. The North-Central BSR Watershed Project extends from the USGS gaging station north of Watertown (near the confluence with Mud Creek) south to the confluence with North Deer Creek (southeast of Volga). Within the study area, the Big Sioux

2
River rarely becomes intermittent; however, wet-dry cycles have prominent effects on annual discharge. Major tributaries often become intermittent during dry phases. The river and its tributaries drain portions of Codington, Deuel, Hamlin and Brookings Counties. The river also receives storm sewer discharges or additional runoff from several communities along its course, including the cities of Watertown, Castlewood, Estelline, and Brookings. Direct runoff to the river, as well as perennial and intermittent tributaries, contributes loadings of sediment and nutrients. The river and tributaries also recharge shallow aquifers found adjacent to these water bodies. These shallow aquifers are the principle source of drinking water for the residents of the region. Other flow alterations of the BSR include channelization, culverts, and bridges at numerous road crossings of the river and tributaries.
MN
IA
SD
ND
State BoundaryBig Sioux BasinNorth-Central Big Sioux River Project Area
Figure 1. The Big Sioux Basin Boundary and Location of the NCBSRW

3
Geology and Soils Based on the relative age of the landscape, the surficial character of the watershed can be divided into two parts: 1) along the valley of the BSR and the eastern tributaries where drainage is well developed and un-drained depressions are rare; 2) to the west of the river, including the Oakwood Lakes area where drainage is poor and there are many potholes, sloughs, and lakes. Land elevation ranges from nearly 2,050 feet above mean sea level in the northeastern part of the study area to about 1,600 feet in the southern edge of the project area. Soils within the watershed area are derived from a variety of parent materials. Upland soils are relatively fine-grained, and have developed over glacial till or eolian (loess) deposits. Coarse-grained soils are found along present or former water courses, and are derived from glacial outwash or alluvial sediments. Surficial materials and bedrock mainly consist of glacial till over Cretaceous shales. Climate The average annual precipitation in the north-central BSR watershed is 23.2 inches, of which 76 percent typically falls during the growing season in April through September (Figures 2 and 3). Tornadoes and severe thunderstorms strike occasionally. These storms are often local in extent, short in duration, and occasionally produce heavy rainfall. The average seasonal snowfall is 36.5 inches per year (SDSU 2003).
Figure 2. South Dakota Precipitation Normals in Inches from 1971 to 2000
Figure 3. South Dakota Growing Season Precipitation in Inches from
1971 to 2000

4
Land Use Land use in the watershed is predominantly agricultural (Figure 4). Approximately 73 percent of the area is cropland, with corn, soybeans, and small grains, and 23 percent is grassland and pastureland. As part of the assessment, 371 animal feeding operations in the watershed were evaluated. More than 74,000 animals were documented. Of this number, 93 percent were cattle, four percent were sheep, two percent were pigs, and the remaining were horses. Urban development and growth has taken place in and around the community of Watertown. Smaller communities in the region are also experiencing expanding growth.
Cropland (73%)Grassland/Rangeland (23%)Water (1%)Building/Farmstead (3%)
County Boundary
River/Tributary
Grant County
Deuel County
Codington County
Hamlin County
Brookings County
Figure 4. Landuse in the NCBSRW

5
Population A majority of the population in the North-Central Big Sioux River study area lives within Codington County (sixth largest in the state). The fourth largest city in the state of South Dakota, Watertown, lies within this county. Other towns located in the study area include Kranzburg in Codington County; Estelline and Castlewood in Hamlin County; Bemis, Altamont, Goodwin, and Clear Lake in Deuel County; and Bruce and Volga in Brookings County. Table 2 shows the land area of each county, the people per square mile, and the population based on the 2000 Census. Table 2. Land Area and Population of Codington, Hamlin, Deuel and Brookings Counties
History The Big Sioux River, like most rivers across the Midwest, have watersheds that have been converted from tallgrass prairies and deciduous hardwoods to a matrix of intensive agricultural uses with areas of urban sprawl. This conversion has resulted in large-scale alterations to watershed level processes. Primarily, the alteration has been an increase in overland flow of energy and material resources resulting from a decrease in ground-water infiltration/subsurface recharge. An increase in surface runoff has associated increases in the non-point source transport of sediment, nutrient, agricultural and residential chemicals, and feedlot runoff. PROJECT DESCRIPTION The boundaries of the north-central Big Sioux River watershed in eastern South Dakota study area were defined by the boundaries of tributaries that enter the Big Sioux River between USGS gaging station north of Watertown (near the confluence with Mud Creek) south to the confluence with North Deer Creek (southeast of Volga). This 502,894 acre area lies within the Northern Glaciated Plains (NGP) ecoregion (Level III). Within the NGP, two Level IV ecoregions are represented in the assessment area: the Big Sioux Basin (46m) and the Prairie Coteau (46l) (Figure 5). Descriptions of the two Level IV ecoregions are provided in Table 3.
Codington Hamlin Deuel Brookings South Dakota
Land Area (sq. mi) 688 507 624 794 75885
People (sq. mi) 37.7 10.9 7.2 35.5 9.9
Population (2000) 25929 5615 4364 28265 754844

6
Figure 5. Ecoregions III and IV of Eastern South Dakota

7
Table 3. Description of Level IV Ecoregions Within the North-Central Big Sioux River Watershed (Omernik et al. 1987)
Ecoregion
Physiography
Potential Natural Vegetation Land Use and Land
Cover
Climate
Soil Order Northern Glaciated Plains (46) Prairie Coteau
(46l) Surficial geology of glacial till. Hummocky, rolling landscape with high concentration of lakes and wetlands and poorly defined stream network.
Big bluestem, little bluestem, switchgrass, indiangrass, and blue gramma.
Rolling portions of landscape primarily in pastureland. Flatter portions of landscape in row crop, primarily of corn and soybeans. Some small grain and alfalfa.
Mean annual rainfall of 20-22 inches. Frost-free from 110-140 free days.
Mollisols
Big Sioux Basin (46m)
Surficial geology of glacial till. Rolling landscape with defined stream network and few wetlands.
Tallgrass prairie: Big bluestem, little bluestem, switchgrass, indiangrass, sideoats gramma, and lead plant. Riparian areas: willows and cordgrass to the north and some woodland south.
Row crop agriculture of mostly corn and soybean. Some small grain and alfalfa.
Mean annual rainfall of 20-22 inches. Frost-free from 110-140 free days.
Mollisols

8
Monitoring site locations were dispersed among 10 tributary locations and eight river locations throughout the study area. Figure 6 shows the locations of the tributary and river sites. The shaded area (delineated watershed) was generated based on hydrography and topography. Although sampled, tributary Site T34 and river Sites R14 and R15 were not included in this shaded area, as they were modeled during the Upper Big Sioux River Watershed Assessment (Williams and Mullen 2002). The feedlot assessment boundary was hand drawn based on our monitoring site locations and watershed boundaries. River Site R01 was omitted from this area because a feedlot assessment was completed during the Central Big Sioux River Watershed Assessment Project for this area. See Appendix A for monitoring site details.
Figure 6. Location of Monitoring Sites
#
#
#
####
#
#
## #
# #
#
#
#
#
###
#
T36
T35
R14
T34 R15
R16 R17
R18 T37
T40
T39T41
R19 T42
T48T43
T44
R20
T45
T46
T47
R1
Feedlot Assessment Boundary
Peg Munky Run
Hidewood Ck
Stra
y Ho
rse
Ck
Willow Ck
Mud Ck
Delineated WatershedCounty BoundariesBig Sioux RiverTributary
Monitoring Site
BrookingsCounty
DeuelCounty
Grant County
HamlinCounty
Codington County

9
BENEFICIAL USES The State of South Dakota has assigned all water bodies that are situated within its borders a set of beneficial uses. Beneficial use means the purpose or benefit to be derived from a water body. Under state and federal law the beneficial use of water is to be protected from degradation. Of the eleven beneficial uses, two are assigned to all streams in the state; (9) fish and wildlife propagation, recreation and stock watering, and (10) irrigation. A set of standards is applied to the BSR and its major tributaries. These standards must be met to maintain the beneficial uses for a particular water body. In the 1998 and 2000 South Dakota 305(b) water quality assessment several designated beneficial uses of the North-Central Big Sioux River are impaired by total suspended solids (TSS), low dissolved oxygen, pH, and ammonia. These impairments were documented by the surface water quality monitoring program to regularly exceed standards. The 2004 Integrated Report for Surface Water Quality Assessment also shows the north-central portion of the Big Sioux River to be impaired by nitrates and fecal coliform bacteria. Probable pollutant source categories identified in the report for the BSR are on-site wastewater systems, agricultural livestock, and municipal/industrial discharges. Much of the Big Sioux River is classified as “non-support” for both aquatic life and limited contact recreation. The 1998 and 2002 South Dakota 303(d) waterbody list, as well as the 2004 Integrated Report listing, included the Big Sioux River near Watertown, Castlewood, Estelline, Bruce and Volga. The designated beneficial uses of the north-central Big Sioux River near these cities are assigned numeric water quality standards that are not to be exceeded (Table 4). All river sites are assigned beneficial uses one, five, eight, nine, and ten. All tributaries are assigned beneficial uses nine and ten. Willow Creek (T35 and T36), Stray Horse Creek (T37), Hidewood Creek (T40 and T41), and Peg Munky Run (T42) are also assigned beneficial uses six and eight (Table 5). Table 4 depicts the numeric criteria assigned to the beneficial uses.

10
Table 4. Numeric Criteria Assigned to Beneficial Uses of Surface Waters for the North-Central Big Sioux River and Tributaries
Note: 1 30-day average 2 daily maximum 3 (0.411÷(1+107.204-pH) + (58.4÷1+10pH-7.204)) in accordance with ARSD 74:51:01, Appendix A, Equation 2
1 5 6 8 9 10 Parameters Domestic Warmwater Warmwater Limited Fish & wildlife Irrigation
(mg/L) except water semi permanent marginal contact propagation, where noted supply fish life fish life recreation recreation &
propagation propagation stock watering
Fecal Coliform ≤ 1,000 (geomean) (per 100 mL) ≤ 2,000 (single May 1 - Sept. 30 sample)
Specific Conductivity ≤ 4,0001/ 7,0002 ≤ 2,5001/ 4,3752
(umhos/cm @ 25o C)
Total Ammonia ≤ result of the ≤ result of the Nitrogen as N Equation3 Equation3
Nitrogen, Nitrates ≤10.0 ≤ 501/ 882 as N
Dissolved oxygen > 5.0 > 4.0 > 5.0
pH (standard units) ≥ 6.5 - ≤ 9.0 ≥ 6.5 - ≤ 9.0 ≥ 6.0 - ≤ 9.0 ≥ 6.0 - ≤ 9.5
Suspended solids ≤ 901/ 1582 ≤ 1501/ 2632
Total dissolved solids ≤ 1,0001/ 1,7502 ≤ 2,5001/ 4,3752
Temperature (oF) ≤ 90 ≤ 90

11
Table 5. Monitoring Sites and Their Beneficial Use Classification
Beneficial Use Classification
Water Body Site ID 1 5 6 8 9 10 BSR nr Brookings R1 BSR at Watertown R14 BSR at Braoadway R15
BSR 20th Ave R16 BSR below Watertown R17
BSR nr Castlewood R18 BSR nr Estelline R19
BSR nr Bruce R20 Lake Pelican Weir T34
Willow Creek (nr Waverly) T35 Willow Creek (nr Watertown) T36
Stray Horse Creek T37 Lake Poinsett Outlet T39
Hidewood Creek (nr Clear Lake) T40 Hidewood Creek (nr Estelline) T41
Peg Munky Run T42 East Oakwood Lake Outlet 1 T45 East Oakwood Lake Outlet 2 T46 Unnamed Creek (nr Volga) T47
RECREATIONAL USE State, county, and local parks are located throughout the north-central region of the Big Sioux River Watershed (Table 6). Table 6. Public Recreation Areas Within the NCBSRW Study Area County City Public Recreational Areas Brookings Volga Oakwood Lakes State Park Codington Watertown Sandy Shore Recreation Area
Bramble Park Discovery Center & Zoo City Park-Belmont, Harper, Jackson, Lincoln Mallard Cove, McKinley, Morningside, Nelson, Pelican, Riverside, Skate, and Sioux
Deuel Goodwin Bullhead Lake Public Access School Lake Public Access Round Lake Public Access Clear Lake Lake Cochrane Recreation Area

12
THREATENED AND ENDANGERED SPECIES The following table (Table 7) of threatened and endangered species and their location by county within NCBSR watershed study area was constructed using information from South Dakota Game, Fish, and Parks, USGS, and the USFWS. Specie status within the study area is identified as endangered, threatened, rare, or candidate with the county of occurrence is listed. Topeka shiners (Notropis topeka) were identified in two of the monitored tributary sites. The whooping crane, banded killifish, American burying beetle, Dakota skipper, and western prairie fringed orchid have historically been found in the NCBSRW and could possibly still be in the area. The bald eagle, piping plover, central mudminnow, northern redbelly dace, northern redbelly snake, and regal fritillary are listed species that are commonly found within the area. However, none of these species were encountered during the study. Table 7. Endangered, Threatened, and Candidate Species of the NCBSRW Area
Name Scientific Name Category Status Federal State
County Location Occurrence
Whooping crane Grus americana Bird FE SE Brookings, Codington Rare Bald eagle Haliaeetus leucocephalus Bird FT ST Brookings Common Topeka shiner Notrophis topeka Fish FE Brookings, Codington, Deuel,
Hamlin, Grant Common
Piping Plover Charadrius melodus Bird FT ST Codington Common Banded killifish Fundulus diaphanus Fish SE Deuel Rare Central mudminnow Umbra limi Fish SR Brookings, Deuel Common Trout perch Percopsis omiscomaycus Fish SR Codington Common Northern redbelly dace Phoxinus eos Fish ST Brookings, Deuel, Grant Common American burying beetle Nicrophorus americanus Insect FE SR Brookings Rare Dakota skipper Hesperia dacotae Insect FC SR Brookings, Codington, Deuel,
Hamlin, Grant Rare
Northern redbelly Snake Storeria occipitomaculata occipitomaculata
Reptile SR Brookings, Codington, Deuel, Hamlin, Grant
Common
Western prairie fringed orchid Plantanthera praeclara Plant FT SR Brookings Rare
KEY TO CODES: FE= Federal Endangered SE=State Endangered
FT= Federal Threatened ST=State Threatened FC=Federal Candidate SR=State Rare

13
PROJECT GOALS, OBJECTIVES, AND MILESTONES GOALS The goals of this assessment project are to:
1) Determine and document sources of impairment to the north-central portion of the BSR watershed
2) Identify feasible restoration alternatives to support watershed implementation projects to improve water quality impairments within the watershed
3) Develop TMDLs based on identified pollutants
Impairments cited in the 1998 and the 2000 305(b) Water Quality Assessment Report and the 1998 and 2002 South Dakota 303(d) Waterbody List for this portion of the BSR watershed were excessive suspended solids, pathogens (fecal coliform bacteria), nutrients, and organic enrichment. Goals were accomplished through the collection of tributary and river data, aided by the completion of the FLUX, AnnAGNPS, and the Agricultural Non-Point Source (AGNPS) watershed modeling tools. Through data analysis and modeling, the identification of impairment sources was possible. The identification of these impairment sources will aid the state’s non-point source (NPS) program by allowing strategic targeting of funds to portions of the watershed that will provide the greatest benefit per expenditure. OBJECTIVES Objective 1. Water Quality Assessment Water sampling of river and tributary sites began in April 2001 and in June 2001, respectively. Water samples were collected at Big Sioux River sites from April 2001 to October 2001, April 2002 to October 2002, and again from May 2004 to September 2004. Water samples were collected from tributary sites from June 2001 to October 2001 and from April 2002 to October 2002 (Table 8). Detailed level and flow data were entered into a database that was used to assess the nutrient and solids loadings. Solinst leveloggers and Thalmedies hydrometers (OTTs) were installed at the pre-selected monitoring sites along the tributaries. Objective 2. Quality Assurance/ Quality Control (QA/QC) Ten percent of the water quality samples were collected as duplicate and blank samples. These samples provide defendable proof that sample data were collected in a scientific and reproducible manner. QA/QC data collection began in April of 2001 and was completed on schedule in October of 2002. Additional Big Sioux River samples were collected in 2004 and also included QA/QC samples (Table 8). Objective 3. Watershed Modeling Three models were used in this project to analyze and predict loadings. The FLUX model was used to calculate loadings and concentrations in monthly, yearly, and daily increments. The AnnAGNPS model was used to predict sediment and nutrient loads based on 1-year, 10-year, and 25-year simulated periods. This model was also used to determine potential sediment and nutrient loading reductions with the

14
implementation of BMPs. AGNPS was used to model feedlot runoff loads and to help pinpoint areas of concern. Load duration intervals and hydrologic conditions were used to calculate fecal coliform loads and predict the reductions needed to meet water quality standards (Table 8). Objective 4. Information and Outreach Several field trips were organized which provided knowledge about the project, as well as demonstrations of field operations. An assessment of the condition of the animal feeding operations located within the project area was conducted by contacting landowners individually. Press releases were also provided to local papers at various times throughout the project (Table 8). Objective 5. Reporting/TMDL Determination When a waterbody is listed on the state’s 303(d) list, TMDLs must be developed for that waterbody to meet water quality standards. A TMDL is a tool or target value that is based on the linkages between water quality conditions and point and non-point sources of pollution. Based upon these linkages, maximum allowable levels of pollution are allocated to the different sources of pollution so that water quality standards are attainable. Sources that exceed maximum allowable levels (or loadings) must be addressed in an implementation plan that calls for management actions that reduce loadings (1998, 2002 303(d) Waterbody List and the 2004 SD Integrated Report). Furthermore, an implementation plan can call for protection of areas that are below allowable levels. Identifying the causes and sources of water quality impairments is a continuation of the process that placed the waterbody on the 303(d) list. In the case of the North-Central Big Sioux River watershed, high levels of fecal coliform bacteria and the probable non-point sources identified in the 305(b) water quality assessment, guided the strategy of this assessment.

15
MILESTONES The North-Central Big Sioux River Watershed Assessment Project was scheduled to start in October 2000; however, actual monitoring was delayed until April of 2001 due to monitoring equipment needing to be installed and additional staff hired. The following table shows the proposed completion dates versus the actual completion dates of the project goals, objectives, and activities.
Table 8. Milestones - Proposed and Actual Objective Completion Dates
O N D J F M A M J J A S O N D J F M A M J J A S O N D J F M A M J J A S O N D J F M A M J J A S O N D J F M A M J J A S O N DObjective 1 Water Quality Assessment
Objective 2QA/QC
Objective 3Landuse Assessment
Objective 4Information and Outreach
Objective 5Reporting/TMDL
Proposed Completion Dates
Actual completion Dates
2000 2001 2003 2004 20052002

16
METHODS ENVIRONMENTAL INDICATORS Water Quality Monitoring Water samples were collected from eight river sites and 10 tributary sites. The sample collection was scheduled to coincide with spring runoff, storm events, and during base flow conditions. A total of 420 samples were collected over three sampling seasons from April 2001 through October 2004. This included 266 standard samples, 30 blank standard samples, and 30 duplicate standard samples, and 80 additional river fecal samples with 7 duplicate and 7 blank samples. An example of the water quality data sheet used is located in Appendix C. Sampling occurred April through October of 2001 and again April through October of 2002 at Sites T34, T35, T36, T37, T39, T40, T41, T42, T46, and T47, R01, R14, R15, R16, R17, R18, R19, and R20. The SD DENR suggested the collection of extra fecal coliform samples from the Big Sioux River sites, which was accomplished in 2004. Field measurements included dissolved oxygen, pH, turbidity, air temperature, water temperature, conductivity, salinity, stage, and general climatic information. A Hanna Instruments 9025 meter was used to measure pH. Salinity, dissolved oxygen, water temperature, and conductivity were measured using a YSI 85 meter. Turbidity was measured using a LaMotte 2020 turbidity meter and a mercury thermometer was used to measure air temperature. The Water Resource Institute (WRI) at South Dakota State University (SDSU) in Brookings, South Dakota, performed analysis on samples for total solids, total suspended solids (TSS), ammonia, nitrate-N, total Kjeldahl nitrogen, organic nitrogen, total phosphorus, and total dissolved phosphorous that were collected during 2001 and 2002. The Sioux Falls Health Laboratory in Sioux Falls, South Dakota, analyzed all fecal coliform bacteria samples collected in 2001 and 2002. Water quality samples collected in 2004 were analyzed by the State Health Lab in Pierre, South Dakota. Appendix B contains all grab sample data for each monitoring site. Two of the river sites (R01 and R14) were also monitored by the state of South Dakota as part of the SD DENR Ambient Surface Water Quality Monitoring program. Two other ambient monitoring sites were located within 1.5 miles of project Sites R17 and R19. The TSS, ammonia, and fecal coliform data was incorporated into our database and analyzed in conjunction with our data. Historical flow data monitored by the USGS was also utilized in our analysis. Table 9 depicts the USGS and SD DENR sites that coincided with EDWDD monitoring sites. Table 9. Project Sites Coinciding with DENR and USGS Monitoring Locations
EDWDD Site DENR Site USGS Site R01 WQM 62 R14 WQM 55 6479500 R15 6479512 R17 WQM 1 (1 mi N) 6479520 R18 6479525 R19 BS08 (1.5 mi S) R20 6479770 T36 6479515

17
Description of Parameters Water quality was sampled according to the SD DENR WRAP protocols (Stueven et al. 2000). Water quality analyses provided concentrations for a standard suite of parameters (Tables 10 and 11). The detection limits are set by the lab based on lab equipment sensitivity.
Table 11. Water Quality Parameters and Lab Detect Limits for the State Health Lab
Parameter Units Abbreviation Lower Detect LimitAlkalinity-M mg/L Alk-M < 6.0Alkalinity-P mg/L Alk-P 0Total suspended solids mg/L TSS < 1.0Total solids mg/L TotSol < 7.0Volatile Total Suspended Solids mg/L VTSS < 1.0Nitrates mg/L NO2NO3 < 0.1Ammonia-nitrogen mg/L NH3N < 0.02TKN mg/L TKN < 0.11Total phosphorus mg/L TPO4 < 0.002Total dissolved phosphorus mg/L TDPO4 < 0.003Fecal coliform bacteria cfu/100 mL Fecal < 10.0E coli mpn/100 mL Ecoli < 1.0
Water Quality Parameter Definitions
Alkalinity Alkalinity is a measure of the buffering capacity of water, or the capacity of water to neutralize acid. Measuring alkalinity is important in determining a stream's ability to neutralize acidic pollution from rainfall or wastewater. Alkalinity does not refer to pH, but instead refers to the ability of water to resist change in pH. Waters with low alkalinity are very susceptible to changes in pH. Waters with high alkalinity are able to resist major changes in pH. Lakes with high alkalinity have high pH values while lakes with low alkalinity have low pH values. The hardness of the water is usually determined by the amount of calcium and magnesium salts present in water and is associated with the presence of
Table 10. Water Quality Parameters Analyzed and Laboratory Detect Limits for WRI and the Sioux Falls Health Lab Parameter Units Lower Detect Limit Total suspended solids mg/L 1 Total solids mg/L 1 Nitrates mg/L 0.01 Ammonia-nitrogen mg/L 0.01 Organic nitrogen mg/L 0.01 TKN mg/L 0.01 Total phosphorus mg/L 0.01 Total dissolved phosphorus mg/L 0.01 Fecal Coliform* cfu/100 mL <1, <10, <100 * tested by Sioux Falls Health Lab

18
carbonates. Hard water lakes are generally more productive than soft water lakes and can accept more input of salts, nutrients, and acids to their system without change than can soft water lakes. The range of pH values associated with M-alkalinity (methyl orange indicator) is 4.2 to 4.5. The range of pH values associated with P-alkalinity (phenolphthalein indicator) is 8.2 to 8.5. Total Suspended Solids TSS is the portion of total solids that are suspended in solution, whereas dissolved solids make up the rest of the total. Higher TSS can increase surface water temperature and decrease water clarity. Suspended solids are the materials that do not pass through a filter such as silt and clay particles, plankton, algae, fine organic debris, and other particulate matter. Subtracting suspended solids from total solids derives total dissolved solids concentrations. Suspended volatile solids are that portion of suspended solids that are organic (organic matter that burns in a 500o C muffle furnace). Total Solids Total Solids are materials, suspended or dissolved, present in natural water. Sources of total solids include industrial discharges, sewage, fertilizers, road runoff, and soil erosion. Volatile Total Suspended Solids Volatile solids are those solids lost on ignition (heating to 550 degrees C.). Volatile solids measure the sediments which are able to be burned off of a dried sediment sample. Volatile total suspended solids are useful because they give a rough approximation of the amount of organic matter present in the water sample. ‘‘Fixed solids’’ is the term applied to the residue of total, suspended, or dissolved solids after heating to dryness for a specified time at a specified temperature. The weight loss on ignition is called ‘‘volatile solids.’’ Nitrate-Nitrite Nitrate and nitrite are inorganic forms of nitrogen easily assimilated by algae and other macrophytes. Sources of nitrate and nitrite can be from agricultural practices and direct input from septic tanks, precipitation, groundwater, and from decaying organic matter. Nitrate-nitrite can also be converted from ammonia through denitrification by bacteria. The process increases with increasing temperature and decreasing pH. Ammonia Ammonia is the byproduct of bacterial decomposition of organic matter. Source of this form of nitrogen, most readily available for plant uptake, may come from animal feeding areas, decaying organic matter, bacterial conversion of other nitrogen compounds, or industrial and municipal surface water discharges. Total Ammonia Nitrogen as N Ammonia nitrogen is present in surface and ground water supplies. Ammonia nitrogen is a dissolved inorganic form of nitrogen. This nitrogen associated with ammonia is a nutrient for algae and macrophytes. High levels may indicate excessive algae growth, macrophyte growth, and/or presence of sanitary waste, and can be detrimental to aquatic life.

19
Total Kjeldahl Nitrogen Total Kjeldahl Nitrogen (TKN) is used to calculate organic nitrogen. TKN minus ammonia derives organic nitrogen. Sources of organic nitrogen can include release from dead or decaying organic matter, septic systems or agricultural waste. Organic nitrogen is broken down to more usable ammonia and other forms of inorganic nitrogen by bacteria. Total Nitrogen Total nitrogen is the sum of nitrate-nitrite and TKN concentrations. Total nitrogen is used mostly in determining the limiting nutrient, either nitrogen or phosphorus. Nitrogen was analyzed in four forms: nitrate/ nitrite, ammonia, and Total Kjeldahl Nitrogen (TKN). From these four forms, total, organic, and inorganic nitrogen may be calculated. Nitrate and nitrite levels are usually caused from fertilizer application runoff. High ammonia concentrations are directly related to sewage and fecal runoff. Nitrogen is difficult to manage because it is highly soluble and very mobile in water. Total Phosphorus Phosphorus differs from nitrogen in that is not as water-soluble and will attach to fine sediments and other substrates. Once attached, it is less available for uptake and utilization. Phosphorus can be natural from geology and soil, from decaying organic matter, waste from septic tanks or agricultural runoff. Nutrients such as phosphorus and nitrogen tend to accumulate during low flows because they are associated with fine particles whose transport is dependent upon discharge (Allan 1995). These nutrients are also retained and released on stream banks and floodplains within the watershed. Phosphorus will remain in the sediments unless released by increased stage or discharge. Total Dissolved Phosphorus Total dissolved phosphorus is the fraction of total phosphorus that is readily available for use by algae. Dissolved phosphorus will attach to suspended materials if they are present in the water column and if they are not already saturated with phosphorus. Dissolved phosphorus is readily available to algae for uptake and growth. Fecal Coliform Bacteria Fecal coliform are bacteria that are found in the environment and are used as indicators of possible sewage contamination because they are commonly found in human and animal feces. They indicate the possible presence of pathogenic bacteria, viruses, and protozoans that also live in human and animal digestive systems. These bacteria can enter the river and tributaries by runoff from feedlots, pastures, sewage treatment plants, and seepage from septic tanks. E. Coli Escherichia coli is a type of fecal coliform bacteria that is found in the intestines of healthy humans and animals. The presence of E. coli in water is a strong indication of recent sewage or animal waste contamination, which may contain disease causing organisms.

20
Dissolved Oxygen Dissolved oxygen is important for the growth and reproduction of fish and other aquatic life. Solubility of oxygen generally increases as temperature decreases, and decreases with lowing atmospheric pressure. Stream morphology, turbulence, and flow can also have an affect on oxygen concentrations. Dissolved oxygen concentrations are not uniform within or between stream reaches. A stream with running water will contain more dissolved oxygen than still water. Cold water holds more oxygen than warm water. Dissolved oxygen levels of at least 4-5 mg/L are needed to support a wide variety of aquatic life. Very few species can exist at levels below 3 mg/L. pH pH is based on a scale from 0 to 14. On this scale, 0 is the most acidic value, 14 is the most alkaline value, and 7 represents neutral. A change of 1 pH unit represents a 10-fold change in acidity or alkalinity. The range of freshwater is 2-12. pH is a measure of hydrogen ion activity, the more free hydrogen ions (more acidic), the lower the pH in water. Values outside the standard (pH 6.0 – 9.5) do not meet South Dakota’s water quality standards. Water Temperature Water temperature affects aquatic productivity and water chemistry, including the levels of DO and un-ionized ammonia. Temperature extremes are especially important in determining productivity of aquatic life from algae to fish. Conductivity In streams and rivers, conductivity is affected primarily by the geology of the area through which the water flows. Streams that run through areas with granite bedrock tend to have lower conductivity, and areas with clay soils tend to have higher conductivity. In lakes, geology of the watershed establishes the ranges of conductivity. In general, a higher conductivity indicates that more material is dissolved material, which may contain more contaminants. Specific Conductivity Also known as temperature compensated conductivity which automatically adjusts the reading to a calculated value which would have been read if the sample had been at 25o C. The ability of water to conduct an electrical current, which is the measure of the quantity of ions in the water. It is determined by the presence of inorganic dissolved solids, such as salts. Specific conductivity is generally found to be a good measure of the concentration of total dissolved solids (TDS) and salinity. Salinity Salinity is the natural concentration of salts in water. This is influenced by the geologic formations underlying the area. Salinity is lower in areas underlain by igneous formations and higher in areas underlain by sedimentary formations.

21
Turbidity (NTU) Turbidity or water clarity is a measure of how much the passage of light is restricted by suspended particles. Turbidity is measured in nephelometric turbidity units (NTUs). High NTU levels may increase temperatures; lower dissolved oxygen levels, and reduce photosynthesis. High NTU levels can clog fish gills, which lowers growth rate and resistance to disease; and it can smother fish eggs and macro invertebrates. Sources of turbidity include soil erosion, waste discharge, urban runoff, eroding stream banks, and excessive algae growth.
Flow and Discharge Gaging A total of 10 tributary monitoring sites were established along the Big Sioux River and continuous stream flow was collected using stage recorders. The sites were selected to determine which portions of the watershed were contributing the greatest amount of nutrient and sediment load to the river. Six tributary sites were equipped with OTT Thalimedes hydrometers, two were installed with Solinst model 3001 leveloggers, one site was monitored by the USGS, and one site was monitored by the City of Watertown. All sites, except one, were monitored for two seasons because of high water conditions. Site T39 (Lake Poinsett Outlet) was only monitored the second season because high water prohibited the installation of equipment during 2001. Stage recorder start and end dates can be found in Appendix D. Water stage was recorded to the nearest 1/100th of a foot for each of the sites. A USGS top setting wading rod, with either a Price AA or pygmy current meter attached, and a CMD 9000 digimeter were used to determine flows at various stages. In the much larger streams, a USGS Type A crane equipped with a Price AA current meter attached to a four-wheel truck was used to record flow data. All sites were also installed with USGS Style C staff gauges as a quality control check for the continuous meters. Recorded stages and flows were used to create stage-discharge tables and curves for each site (Gordon et al. 1992). USGS gaging station data was acquired for all the river sites. Streamflow records for non-gauged river sites were derived using interpolation methods (Gordon et al. 1992). Stage to discharge tables and curves can be found in Appendix E. Equations used to find discharges for each monitoring site can be found in Appendix F.
Flow Duration Intervals Flow duration intervals were constructed for fecal coliform bacteria at all monitored sites. America’s Clean Water Foundation was consulted regarding the calculation of fecal coliform bacteria reductions with the limited data set. It was suggested that flow duration intervals using flow duration curve zones would meet the requirements of our report (Cleland 2003). This method calculates fecal coliform bacteria in a way similar to the FLUX model, (concentration) x (flow), except it is less complex using zones based on hydrologic conditions and the median fecal coliform concentrations. By defining hydrologic conditions, specific restoration efforts could be targeted. The five hydrologic conditions are (1) High Flows (0-10 percent), (2) Moist Conditions (10-40 percent), (3) Mid-Range Flows (40-60 percent), (4) Dry Conditions (60-90percent), and (5) Low Flows (90-100 percent) (Figure 7). For example, if several samples exceeded the target load during dry conditions, restoration efforts may be targeted at in-stream livestock, riparian areas, or discharges from industries.

22
1.00E+07
1.00E+09
1.00E+11
1.00E+13
1.00E+15
1.00E+17
0 10 20 30 40 50 60 70 80 90
Flow Duration Interval (%)
Feca
l Col
ifor
m B
acte
ria
(cou
nts/
day)
Target
Non-ExceedneceExceedence
Rain Event
90th
Median
Willow Creek to Stray Horse Creek Segment (R17 & R18)2001-2002 & 2004 (May-Sep) EDWDD & DENR Monitoring Data
LowFlows
HighFlows
Moist Conditions
Mid-RangeFlows
Dry Conditions
Figure 7. Sample Result Flow Duration Interval with Zones and Plotted Grab Samples
(Sites R17 and R18 merged).
Two sets of data were used to calculate reductions: (1) discharge data and (2) water quality samples. Appendix G lists the years of record used for the construction of the flow duration interval graphs. Figure 7 is an example of a flow duration interval, separated into zones, with seasonal fecal grab samples plotted. Seasonal months include May, June, July, August, and September. The target line was graphed along 21 points representing the entire range of flows using percentiles of the target load at matching flows. Similarly, grab samples were plotted against instantaneous flow at the time the sample was taken. Medians and 90th percentiles were calculated, per zone, for grab sample data. Samples collected during rain events are indicated with an ‘X’. Those samples indicated with a red box are exceedences of the allowable load. To find the existing load in each zone, the median concentration of the grab samples was multiplied by the median flow. (median concentration of zone) × (median flow of zone) = existing load in that zone To find the percent reduction per hydrologic condition, the median of the allowable load within a hydrologic zone (target) was divided by the median of the sampled load at that particular hydrologic condition (site value) and then subtracted from 100. 100 – (Target ÷ Site Value × 100) = % reduction
To find the reduction with a 10% margin of safety applied the following equation was used:
100 – [(Target ÷ 1.1) ÷ (Site Value)] × 100 = % reduction with MOS
Table 12 shows an example of these calculations. Reduction calculation tables for all the monitoring sites can be found in Appendix V. These tables are separated into five hydrologic zones regardless of the number of samples per zone. In some instances where few samples were taken, hydrologic zones were

23
combined to the find percent reduction required to meet water quality standards. Monitoring sites on the same stream or river segment were merged (not averaged) to find the percent reduction for the TMDLs. Specific tables can be found in the TMDL reports which are located in Appendices DD through JJ. When considering management options for fecal coliform bacteria reductions, these tables will be useful in targeting hydrologic conditions exceeding their allowable loads. Table 12 also shows reductions for Site R17 and R18 as well as the outcome when the data was merged from both sites. Figure 7 shows both sites merged together and where samples fall within each zone of the combined flow duration curve. Merging datasets from multiple sites within each segment allowed the data from the entire segment to be used to determine impairment status and reductions rather than a single downstream monitoring station. In this example, the number of samples within each flowzone was increased as is shown in Figure 7. Sampling was conducted on the same date on many sites and as bacteria die-off as they progress downstream using all of the data within the reach is more reflective of the entire segment. Although the mid-range to low flows show no reduction is required, the reductions needed to achieve full support status are in the high conditions (0-10%) zone. Best Management Practices will be used targeting both high and low flow conditions within the entire segment and should achieve full support. In this example a 10% reduction will be targeted for the entire segment rather than a specific monitoring location (SDDENR-Central Big Sioux Watershed Assessment Final Report, 2008). Table 12. Sample Result of Fecal Coliform Bacteria Reduction Calculation from Figure 7.
Site R17 Reductions High Moist Mid-Range Dry Low Flows Median (0-20) (20-40) (40-60) (60-90) (90-100)
% Reduction 26 0 0 0 ----- % Reduction with MOS 33 0 0 0 -----
Site R18 Reductions High Moist Mid-Range Dry Low Flows Median (0-20) (20-40) (40-60) (60-90) (90-100)
% Reduction 0 0 3 7 ----- % Reduction with MOS 0 0 11 16 -----
Merged Site Reductions High Moist Mid-Range Dry Low Flows Median (0-20) (20-40) (40-60) (60-90) (90-100)
Median Concentration (counts/day) 4.97E+10 1.90E+10 1.81E+10 2.35E+10 ------ X Flow Median (cfs) 290 70 26 8.4 1.9 = Existing 1.44E+13 1.33E+12 4.70E+11 1.97E+11 ------
Target Load (at 2,000 cfu/100mL) 1.42E+13 3.43E+12 1.27E+12 4.11E+11 9.30E+10 % Reduction w/MOS 10 0 0 0 ------
Load duration curves are developed using an average daily, long-term record of stream flow. Several of the mainstem BSR sites have been, or are currently, monitored by the USGS (Table 13). Daily average flows for ungaged mainstem sites were derived using the drainage-area ratio method. This method is commonly used to find flow of an ungaged site that is in close proximity to a gauged site on the same stream. The drainage area of the ungaged site should be within 0.5 and 1.5 times the drainage area of the gaged site.

24
Table 13. Descriptions of Stream Gaging Stations Analyzed with the Drainage-Area Ratio Method
EDWDD Site USGS Site evaluated
Period of Record
Drainage Area mi2
Ungaged DA/ Gaged DA
ratio Ecoregion
R01 06480000 --- 3190 1.22 NGP
R14 * 06479500 1945-present 1129 --- NGP R15 * 06479512
(used 06479520) flood data only 1277 1.49 NGP
R16 06479520 --- ~1797 0.95 NGP R17 * 06479520 1994-present 1902 --- NGP R18 * 06479525 1976-present 1997 --- NGP R19 06479525 --- ~2435 1.22 NGP R20 * 06479770 2000-present 2800 --- NGP
* USGS Station and Monitoring Site Coincided
Sites should also be located within the same ecoregion and have similar topography (FDEP 2003). The following calculation was used: To find flow per area of the gaged site:
gaged site flow ÷ gaged site drainage area mi2 = gaged site flow per area (mi2) To find the flow of the ungaged site:
gaged site flow per area × ungaged site drainage area mi2 = ungaged site flow Daily average flows over approximately a 20-year period of time were ranked from highest to lowest. The percent of days each flow was exceeded was calculated by dividing each rank by the number of flow data points.
rank ÷ number of data points = percent of days the flow was exceeded Next, the load was calculated by multiplying each average daily flow by the water quality standard for the parameter and multiplying by the conversion factor.
flow (cfs) × standard (mg/L) × conversion factor = load The conversion factor for converting the mg/L to pounds per day for TSS is 5.396, as shown by the following formula: mg × 1 L × 86400 sec × ft3 × 1 lb_____ = lbs/day L 0.0353146667 ft3 1 day sec 453592.37 mg The conversion factor for converting cfu/100mL to colonies per day for fecal coliform bacteria is 24,468,480 as shown by the following formula:
cfu × 28320 mL × 86400 sec × ft3 = col/day 100mL 1 ft3 1 day sec

25
Biological Monitoring The biological assessment framework used in this study was previously developed during the Central Big Sioux River Watershed Assessment. This framework uses a multimetric approach to analyze biological data (Barbour et al. 1999). This approach involves two phases with the process and rationale outlined in Table 14.
Table 14. Process of Developing Biological Indicators for the NCBSRW Phase I. Development of Biological Indicators 1. Stream Classification Stream classifications group sites that share similar physical and
chemical characteristics. Grouped sites are expected to have similar biology under natural conditions and respond similarly to human disturbances (i.e. streams vs rivers).
2. Candidate Metric Identification
A list of candidate metrics (i.e., biological traits) that have the potential to be responsive to stressors is developed. This list is composed of metrics that are relevant to the region’s stream ecology and represents aspects of community richness, composition, tolerance, trophic structure, and individual health.
3. Select Core Metrics Metrics from the candidate list are selected based on their ability to discriminate between least-impacted sites and most-impacted sites. A set of core metrics is produced that represents aspects of community richness, composition, tolerance, trophic structure, and individual health.
4. Index Development An index is an aggregate of scores from selected core metrics. However, prior to aggregation, metric values must be transformed to standardized metric scores that are unitless because each metric may have different units (e.g., integers, percentages). Once scores are transformed and aggregated into an index, the ability of the index to discriminate between least impaired and most impaired sites is tested.
5. Index Thresholds Established
The range of site index scores reflects a range of biological impairment (e.g., poor, fair, good). This range of biological impairment is subdivided into classes based on thresholds. The thresholds are index scores that define the upper and lower limits on classes.
Phase II. Indicator Use in Assessment and Monitoring Assessment and Monitoring With the above completed, the index is ready to use as a
tool for assessing and monitoring the health of streams.

26
Fish Sampling Fish were sampled in four of the tributaries (Site T36, Site T37, Site T41, and Site T42) with bag seines (5 mm mesh) ranging from 15 to 30 feet in length. Pools and runs were sampled in a downstream direction with a seine that reached from bank to bank. A block net (8 mm mesh) was placed across the stream at the lower end of the reach to prevent fish from escaping. Riffles were usually sampled by kicking through the substrate in a downstream direction toward a bag seine placed across the stream at the bottom of the riffle. Collected fish were placed in holding crates, identified to species, and a representative number of each species measured (25 to 50 individuals), noting external diseases, anomalies, fin damage, and parasites. Weighing 100 individuals and using their average weight to divide into bulk weights of uncounted individuals, estimated the number of abundant species. Collections were taken for voucher jars. Fish Index of Biological Integrity (IBI) The index of biological integrity for fish was constructed using methods contained in the Rapid Bioassessment Protocol IV (RBPIV) by Barbour et al. (1999), Karr’s (1981) fish community assessment, and Plafkin et al. (1989) RBP protocol for macroinvertebrates and fishes. Candidate metrics representative of the Midwest region were chosen to represent richness/composition, headwater/pioneering attributes, tolerance/intolerance, trophic guilds, and reproduction (Table 15). Core metrics were chosen in each category through a process of comparative descriptive analysis. Appendix H describes metrics recommended for use within the Midwest region. These metrics in conjunction with the descriptive analysis were used in the selection of the best possible core metrics. The ability of each metric to discriminate between sites least impacted and sites most impacted. Comparative descriptive analysis was accomplished using box and whisker plots, analyzing all monitoring sites at the same time for metrics in each of the five categories (richness/composition, headwater/pioneering attributes, tolerance, trophic guilds, and reproduction). Box plots that yielded a good spread (based on best professional judgment) and differing means were chosen as core metrics in each category (Table 16). Coefficients of variation (CVs) also aided in the selection of the core metrics (Appendix I). Each metric was chosen based upon its discriminatory power in terms of distinguishing least impaired to most impaired sites. Once the core metrics in Table 16 were chosen, best value percentiles were calculated. The 95th percentile was used as a basis for best value for those metrics that decreased with impairment. Those metrics that increased with impairment were given a 5th percentile as a basis for best value. Once either the 95th or 5th percentile standard was set for each metric, the actual measured metric value was compared to the standard best value to find the standardized metric score. Standardized metric scores range from 0 to 100, with 0 being very poor and 100 being excellent. Decrease in response to impairment:
(measured metric value) ÷ (standard best value –0) × 100 = standardized metric score Increase in response to impairment:
(100 - measured metric value) ÷ (100 - standard best value) × 100 = standardized metric score

27
Table 15. Candidate Fish Metrics Calculated for the NCBSRW
Category # Metric Response to Disturbance
Species Richness and Composition 1 Total Species Richness Decrease 2 Native Species Richness Decrease 3 Native Minnow Species Richness Decrease 4 Water Column Species Richness Decrease 5 Benthic Species Richness Decrease 6 Benthic Insectivore Richness Decrease Headwater/Pioneering Attributes 7 Headwater Species Richness Decrease 8 % Headwater Species Decrease 9 % Headwater Species Biomass Decrease 10 % Pioneering Species Increase 11 % Pioneering Species Biomass Increase Intolerant/Tolerant Attributes 12 Intolerant Species Richness Decrease 13 % Intolerant Species Decrease 14 % Intolerant Species Biomass Decrease 15 Sensitive Species Richness Decrease 16 % Sensitive Species Decrease 17 % Sensitive Species Biomass Decrease 18 % Green Sunfish Increase 19 % Green Sunfish Biomass Increase 20 % Tolerant Species Increase 21 % Tolerant Species Biomass Increase Trophic Guilds 22 % Insectivorous Minnows Decrease 23 % Insectivorous Minnows Biomass Decrease 24 % Insectivores Decrease 25 % Insectivore Biomass Decrease 26 % Predators Increase 27 % Predator Biomass Increase 28 % Omnivores Increase 29 % Omnivore Biomass Increase 30 % Herbivores Decrease 31 % Herbivore Biomass Decrease Reproduction 31 % Simple Lithophils Decrease 32 % Simple Lithophil Biomass Decrease

28
Table 16. Core Fish Metrics for the NCBSRW
Table 17 is an example of a tributary score sheet outlining the metrics and the score allocated to each metric. After each of the twelve metrics was scored, the standardized metric scores were averaged for each monitoring site and served as the final index value for that site. Score sheets for fish (by monitoring site) can be found in the Results Section.
Table 17. Sample Score Sheet for Fishes Site T36 Metric Response to
Impairment Percentile for "best" value
Standard (best value)
Measured metric value
Standardized Metric score
Species Richness Decrease 95th 21 11.0 52 Water Column Species Richness Decrease 95th 8 4.0 50 Benthic Species Richness Decrease 95th 10 5.0 50 % Headwater Species Decrease 95th 31.7 9.0 28 % Pioneer Species Biomass Increase 5th 28.5 41.0 83 % Intolerant Species Decrease 95th 13.6 0.0 0 % Sensitive Species Decrease 95th 27.2 9.0 33 % Tolerant Species Biomass Increase 5th 31.3 72.5 40 % Insectivorous Minnows Decrease 95th 94.2 68.5 73 % Insectivorous Biomass Decrease 95th 77.1 55.0 71 % Omnivore Increase 5th 12.7 42.1 66 % Simple Lithophil Biomass Decrease 95th 59.6 49.5 83
Final index value for this site: 52
Macroinvertebrate Sampling Sampling of macroinvertebrates with rock baskets occurred in both the tributary and the river sites from late August to mid October of 2002. Four baskets were placed at each site for a period of 45 days + 3 days (Table 18). Construction, deployment, and retrieval of rock baskets were conducted according to the SD DENR protocols (Stueven et al. 2000). Sorting, identification, and enumeration of macroinvertebrates occurred at the lowest practical taxonomic level (See Appendix J for outsource contracts and laboratory procedures). Three of the four baskets at each site were chosen for collection and were composited, with the exception of six sites. Six sites were chosen to represent the least impacted and the most impacted sampling sites based on water chemistry and visual evaluations. Although six sites had separate voucher
Category # Metric Response to Disturbance
Species Richness and Composition 1 Total Species Richness Decrease 2 Water Column Species Richness Decrease 3 Benthic Species Richness Decrease Headwater/Pioneering Attributes 4 % Headwater Species Decrease 5 % Pioneer Species Biomass Increase Intolerant/Tolerant Attributes 6 % Intolerant Species Decrease 7 % Sensitive Species Decrease 8 % Tolerant Species Biomass Increase Trophic Guilds 9 % Insectivorous Minnows Decrease 10 % Insectivorous Biomass Decrease 11 % Omnivore Increase Reproduction 12 % Simple Lithophil Biomass Decrease

29
jars for each rock basket collected, without having prior established reference type sites to base the results, there was not enough information from only three baskets and only six sites to make a good analysis. Thus, the results from the separate jars at each of the six sites were combined, per site, so they could be evaluated together with all the other sites. Candidate metrics (Table 15) were calculated and reduced to a set of core metrics for scoring (Table 16).
Table 18. Deployment and Retrieval Dates for Rock Baskets by Site Site Site Name Method Deployment
Date Retrieval
Date #Days
Colonized
T34 Lake Pelican Weir Cone 8/19/2002 10/3/2002 46 T35 Willow Creek (nr Waverly) Cone 8/19/2002 10/2/2002 45 T36 Willow Creek (nr Watertown) Cone 8/19/2002 10/3/2002 46 T37 Stray Horse Creek Cone 8/26/2002 10/8/2002 44 T38 Boswell Diversion Ditch ------------- decomissioned ------------ T39 Lake Poinsett Outlet Cone 8/28/2002 10/9/2002 43 T40 Hidewood Creek (nr Clear Lake) Cone 8/19/2002 10/2/2002 45 T41 Hidewood Creek (nr Estelline) --------------------- DRY ------------------------ T42 Peg Munky Run --------------------- DRY ------------------------ T45 East Oakwood Lake Outlet 1 Flat 8/28/2002 10/10/2002 44 T46 East Oakwood Lake Outlet 2 Flat 8/29/2002 10/11/2002 44 T47 Unnamed Creek (nr Volga) Flat 8/29/2002 10/11/2002 44 T48 E. Oakwood Lake Inlet 3 Cone 8/29/2002 10/11/2002 44 R01 BSR nr Brookings Cone 8/28/2002 10/10/2002 44 R14 BSR at Watertown Cone 8/20/2002 10/7/2002 49 R15 BSR at Braoadway Flat 8/19/2002 10/3/2002 46 R16 BSR 20th Ave Cone 8/20/2002 10/7/2002 49 R17 BSR below Watertown Cone 8/20/2002 10/7/2002 49 R18 BSR nr Castlewood Cone 8/27/2002 10/8/2002 43 R19 BSR nr Estelline Cone 8/27/2002 10/8/2002 43 R20 BSR nr Bruce Cone 8/28/2002 10/9/2002 43
Macroinvertebrate Index of Biological Integrity (IBI)
The development of the macroinvertebrate index of biotic integrity (IBI) followed the process outlined in Table 14. There were no established reference sites; therefore, the following steps were taken to develop an index score for each site. In addition, a set of core metrics was chosen for the Big Sioux River sites and a separate table of core metrics was chosen for the tributary sites. Candidate metrics (Table 19) were chosen to represent the categories of abundance richness, composition, tolerance/intolerance, and feeding. The EPA Rapid Bioassessment Protocols for Use in Streams and Rivers (Barbour et al. 1999) aided in developing these procedures. Core metrics (Table 20) were then chosen in each category through a process of comparative descriptive analysis, similar to the fish analysis. Comparative descriptive analysis was done using box and whisker plots (Appendix K), analyzing all data from all the monitoring sites at the same time for each of the five categories (abundance, richness, composition, tolerance, and feeding).

30
Table 19. Candidate Macroinvertebrate Metrics Calculated for the NCBSRWA Category # Metric Response to
Disturbance Abundance Measures 1 Abundance Decrease 2 Corrected Abundance Variable 3 EPT Abundance Decrease Richness Measures 4 Total No. Taxa Decrease 5 Number of EPT Taxa Decrease 6 Number of Ephemeroptera Taxa Decrease 7 Number of Trichoptera Taxa Decrease 8 Number of Plecoptera Taxa Decrease 9 Number of Diptera Taxa Decrease 10 Number of Chironomidae Taxa Decrease Composition Measures 11 Ratio EPT/Chironomidae Abundance Decrease 12 % EPT Decrease 13 % Ephemeroptera Decrease 14 % Plecoptera Decrease 15 % Trichoptera Decrease 16 % Coleoptera Decrease 17 % Diptera Increase 18 % Oligochaeta Variable 19 % Baetidae Increase 20 % Hydropsychidae Increase 21 % Chironomidae Increase 22 % Gastropoda Decrease 23 Shannon-Weiner Index Decrease Tolerance/Intolerance Measures 24 Number of Intolerant Taxa Decrease 25 % Intolerant Organisms Decrease 26 Number of Tolerant Taxa Increase 27 % Tolerant Organisms Increase 28 % Burrowers Increase 29 % Chironimidae + Olgochaeta Increase 30 Hilsenhoff Biotic Index Increase 31 % Dominant Taxon Increase 32 % Hydropsychidae to Trichoptera Increase 33 % Baetidae to Ephemeroptera Increase Feeding Measures 34 % individuals as Gatherers and filterers Decrease 35 % Gatherers Decrease 36 % Filterers Increase 37 % Shredders Decrease 38 % Scrapers Decrease 39 Ratio Scrapers/(Scrapers+Filterers) Decrease 40 Number of Gatherer Taxa Decrease 41 Number of Filterer Taxa Decrease 42 Number of Shredder Taxa Decrease 43 Number of Scraper Taxa Decrease 44 Individuals as Clingers Decrease 45 Number of Clinger Taxa Decrease 46 % Clingers Decrease 47 Number of Predator Organisms Variable 48 Number of Predator Taxa Variable 49 % Predators Variable

31
Once the core metrics in Table 20 were chosen, best value percentiles were calculated. The 95th percentile was used as a basis for best value for those metrics that decreased with impairment. Those metrics that increased with impairment were given a 5th percentile as a basis for best value. Once either the 95th or 5th percentile standard was set for each metric, the actual measured metric value was compared to the standard best value to find the standardized metric score. Standardized metric scores range from 0 to 100, with 0 being very poor and 100 being excellent. Decrease in response to impairment:
measured metric value ÷ (standard best value – 0) x 100 = standardized metric score Increase in response to impairment:
(100 - measured metric value) ÷ (100 - standard best value) x 100 = standardized metric score
Table 21 is an example of a tributary score sheet that outlines the metrics and the score assigned to each metric. After each of the core metrics were scored, the standardized metric scores were averaged for each monitoring site and served as the final index value for that site. Score sheets for the tributary and river sites can be found in Appendix L.
Table 20. Core Macroinvertebrate Metrics Calculated for the BSR and Tributaries in the NCBSRW Category # Metric Response to Disturbance Abundance Measures 1 Abundance Decrease Richness Measures 2 Total Number of Taxa Decrease 3 Number of EPT Taxa Decrease 4 Number of Diptera Taxa Decrease Composition Measures 5 % EPT Decrease 6 % Diptera Increase 7 % Chironomidae Increase Tolerance/Intolerance Measures 8 % Tolerant Organisms Increase 9 % Chironomidae + Oligochaeta Increase 10 % Hydropsychidae/Trichoptera Increase Feeding Measures 11 % Gatherers Decrease 12 % Filterers Increase 13 % Clingers Decrease

32
Table 21. Sample Score Sheet for Macroinvertebrates Site R15 Metric Response to
Impairment Percentile for "best" value
Standard (best value)
Measured metric value
Standardized Metric score
Abundance Decrease 95th 323 274 85 Taxa Richness Decrease 95th 33 34 100 EPT Richness Decrease 95th 11 5 45 Diptera Richness Decrease 95th 11 11 100 % EPT Decrease 95th 69.2 5.8 8 % Diptera Increase 5th 28.1 36.9 88 % Chironomidae Increase 5th 26.8 35.0 89 % Tolerant Increase 5th 8.3 80.3 21 % Chironomidae + Oligochaeta Increase 5th 27.8 64.2 50 % Hydropsychidae/Trichoptera Increase 5th 0 15.4 85 % Gatherers Decrease 95th 70.4 57.3 81 % Filterers Increase 5th 2.8 12.0 91 % Clingers Decrease 95th 37.9 6.9 18
Final index value for this site: 66
Physical Habitat The physical characteristics of wadeable streams were synthesized from many sources including Simonson et al. (1994) and Platts et al. (1983). The data are compatible with available physical assessments (Barbour et al. 1999; Stueven et al. 2000). A list of terms and definitions are provided in Appendix M to aid use of the following procedures. Near each monitoring site, a reach was selected that had one type and intensity of riparian landuse, and where bridges and dams appeared to have minimal impact. Data collection consisted of five components: physical, discharge, water surface slope, water quality, and reach classification. Habitat Assessment Field measurements of physical characteristics using a transect method were adapted from Simonson et al. (1994) and Platts et al. (1983). Field data sheets are provided in Appendix N. Reaches were selected within one type of riparian land use in most cases, and where bridges and dams appeared to have minimal impact. Once a site was selected, a preliminary mean stream width (PMSW) was obtained and used to determine transect spacing and reach length (Simonson et al. 1994). When low flows restricted stream width to a small portion of the streambed, streambed channel width was used to determine transect spacing. Transects were marked with flags. Data collection began on the upstream end of the reach and proceeded downstream. Transect data collection was divided into three practical components. The first suite of data was collected according to visual estimates and counts. On either end of a transect the riparian land use, dominant vegetation type, animal vegetation use, dominant bank substrate, and bank slumping (presence/absence) were recorded. Where a transect crossed the stream, dominant macrohabitat type was designated as pool, riffle, or run. Bed substrate data was collected using the Wolman “pebble count” by visually dividing the transect into eight “cells”. Within each cell, substrate size was measured and the class size recorded. This method objectively classified substrates in clear streams and was a necessity in turbid streams where visual estimates were not possible (Wolman 1954).

33
A second suite of data focused on stream bank and riparian features and was measured with a graduated pole and angle finder. After identifying the break point between the bank and channel bottom, measurements related to stream bank length, bank angle, and bank height were recorded (Figure 8). The length of bank that was vegetated, eroded, and depositional was measured. Vegetated portions were that length of bank where root structure contributed to bank stability, eroded portions were that length with no root structure support, and depositional portions were that length where recent deposition dominated the bank surface. Riparian-related cover types were measured at the end of each transect as the horizontal length of overhanging vegetation (OHV) and undercut bank (UCB) extending over the streambed. A third suite of data focused on horizontal and vertical point measurements which were used to calculate stream width, depth and velocity; channel bottom and top width; and bankfull width, depth, and width:depth ratio. At most sites, point data were obtained by staking a tape measure from left top bank to the right top bank. In some cases, the tape measure was staked at left bankfull and right bankfull. Moving from left to right, key channel features (i.e., location codes) were identified and the distance from the left stake was recorded. Vertical measurements were bankfull depth, water depth, and water velocity. Bankfull depths were measured at the water edge and at three points within the stream. Water depth and velocity were measured at the three points within the stream (1/4, 1/2, and 3/4 of the distance across the stream surface). At each site, data were also collected on large woody debris (LWD), discharge, water surface slope, and water quality. The number of LWD was tallied for the entire reach. Length, diameter, and angle to streambank measurements of all LWD were measured and used to calculate the volume of LWD within the reach. Flow data were collected at a single transect or other stream cross-sections where flow was uniform. The velocity-area method was used to calculated discharge (Gordon et al. 1992). Water surface slope (%) was calculated by dividing the drop in water surface from transect one to transect 13 by the longitudinal stream distance using a surveying level. Water temperature, air temperature, turbidity, pH, dissolved oxygen, and conductivity were measured once at each reach.

34
Transect Spacing3 mean stream widthsbetween transects
Horizontal Measurements
Bank top Width
Bankfull Width
Stream Width
Bed Width
Bank Measurements
A
B
C
D
A – Bank HeightB – Bankfull HeightC – Bank LengthD – Bank Angle Substrate Size
Bankfull DepthWater DepthVelocity
Instream Measurements
Figure 8. Diagrams of Transect Spacing, Horizontal, Bank, and In-stream Measurements
Index of Physical Integrity (IPI)
The physical habitat index for the NCBSRWAP was developed based on EPA’s Rapid Bioassessment of substrate, channel morphology, bank structure, and riparian vegetation (Barbour et al. 1999). Parameters and scoring of each site was modified to suit this project. The following table (Table 22) outlines the parameters and the score assigned to each rating. By using the information collected on the field data sheets, each monitoring site was rated individually using the eight parameters. Scores ranged from 0 to 100 (Table 23). After each site was scored, a standardized metric score based on the ‘best value’, was calculated. This served as the final index value for that site as shown in Table 24.

35
Table 22. Parameters and Scores Used to Rate the Physical Habitat Measurements Physical Parameter
Rating
Excellent Good Fair Poor Very Poor 1. Channel Flow Status
Perrenial streamflow. Water surface reaches base of both lower banks, and minimal amount of channel substrate is exposed.
Perrenial streamflows. Water surface covers <100% but >75% of the available channel bottom.
Perrenial streamflows. Water surface covers 50-75% of the available channel bottom.
Perrenial streamflows. Water surface covers >50% of the available channel bottom.
Average Stream Width about 1/3 channel bottom width. Intermittent.
SCORE 10 7.5 5 2.5 0 2. Physical Complexity
high high/moderate moderate moderate/low low
>8 hydrologic units, usually at least 3 riffles present
6 to 7 hydrologic units, usually 2 to 4 riffles present
4 to 5 hydrologic units, usually 1 to 3 riffles present
2 to 3 hydrologic units, usually 0 to 1 riffles present
1 hydrologic units, no riffles present
SCORE 10 7.5 5 2.5 0 3. Coefficient of Variation of Velocity
>1.2 0.9 to 1.2 0.6 to 0.9 0.3 to 0.6 <0.3
SCORE 10 7.5 5 2.5 0 4. Bed Composition
> 75% gravel and larger > 75% gravel and sand (at least 50% gravel)
> 75% coarse gravel, sand, and silt
> 75% sand and silt (at least 50% sand)
> 75% silt or smaller
SCORE * 16 12 8 4 0 * Add 4 points if cobble size and larger comprise 10% of substrate 5. Measure of Incision
Mean Bank Full Height is >70% of mean Bank Height.
Mean Bank Full Height is >60 to 69% of mean Bank Height.
Mean Bank Full Height is >50 to 59% of mean Bank Height.
Mean Bank Full Height is >40 to 49% of mean Bank Height.
Mean Bank Full Height is <40% of mean Bank Height.
SCORE 10 7.5 5 2.5 0 6. Bank Stability >80% bank vegetated; the
remaining erosional or depositional.
>60 to 80% bank vegetated; the remaining erosional or depositional.
>40 to 60% bank vegetated; the remaining erosional or depositional.
>20 to 40% bank vegetated; the remaining erosional or depositional.
<20% bank vegetated; the remaining erosional or depositional.
SCORE 20 15 10 5 0 7. Overhanging Vegetation
Average amount >0.5 m >0.3 - 0.49 m >0.2 - 0.29 m >0.1 - 0.19 m <0.1 m
SCORE 10 7.5 5 2.5 0 8. Animal Vegetation Use
No Use: All the potential plant biomass is present.
Light Use: Almost all of the potential plant biomass is present.
Moderate Use: About 1/2 of plant biomass is present. Plant stubble about half potential height.
High Use: Less than 1/2 of plant biomass is present. Plant stubble greater than 2 inches.
Very High Use: Nearly all plant biomass removed. Plant stubble less than 2 inches.
SCORE 10 7.5 5 2.5 0

36
Table 23. Sample Score Sheet for Physical Habitat From the above sample, Site T36 scored a 60.5. This was repeated for each site that had a physical habitat assessment field data sheet. There are no established reference sites within South Dakota. All sites were ranked and the 95th percentile was used as the standard. The following calculation was used to find the metric score for each of the eight physical habitat parameters (Table 24).
(measured metric value) ÷ (standard best value) × 100 = standardized metric score The final index value was found by averaging the eight standardized metric scores. The values range from 0 (very poor) to 100 (excellent). Score sheets for each site can be found in the Results Section. Table 24. Sample Final Score Sheet for Physical Habitat
Site T36
Metric Percentile
for "best" valueStandard
(best value) Measured
metric value Standardized Metric score
Channel Flow Status 95th 10 10 100 Physical Complexity 95th 10 2.5 25 CV of Velocity 95th 10 10 100 Bed Composition 95th 19 8 44 Measure of Incision 95th 10 7.5 75 Bank Stability 95th 19 20 100 Overhanging Vegetation 95th 2.5 2.5 33 Animal Vegetation Use 95th 10 0 0 Final index value for this site: 60
SiteID: T36 Site Name: Willow Creek (near Watertown)) Parameter Score
1 Channel Flow Status (10) 10
2 Hydrologic Complexity (10) 2.5
3 CV of Velocity (10) 10
4 Bed Composition (20) 8
5 Channel Incision (10) 7.5
6 Bank Stability (20) 20 7 Overhanging Vegetation (10) 2.5
8 Animal Vegetation Use (10) 0 Total = 60.5

37
Quality Assurance and Data Management Quality Assurance/Quality Control (QA/QC) samples were collected for at least 10% of the samples taken. A total of 420 water samples were collected from 18 monitoring sites. Total QA/QC samples were 74, with 37 being duplicates and 37 blanks. QA/QC results were entered into a computer database and screened for data errors. Overall, the duplicates produced very similar results to the sample itself, with the exception of fecal coliform counts, TSS, ammonia, and nitrate-nitrite. Variations among duplicate bacteria samples may have occurred because of natural variability. Differences in the results from 2001-2002 containing nitrogen (nitrate-nitrite, organic nitrogen, TKN) may be attributed to the use of reverse osmosis water for cleaning and filtering and also due to faulty lab equipment used in analysis. Unfortunately, the lab director was unable to come up with a correction factor due to the randomness of the errors. See copy of WRI lab director’s memo in Appendix O. Field blanks consistently registered detectable limits of nutrients and sediments. Sediment detects may be due to inadequate rinsing of bottles or the quality of rinsing water. Sources of the nitrogen problems may have been the quality of the rinsing water, but more likely due to faulty lab equipment used for the analysis. See Appendix P for field duplicates and blanks. ASSESSMENT OF SOURCES Point Sources Wastewater Treatment Facilities (NPDES) Data for all permitted NPDES facilities was obtained from DENR personnel in Pierre (pers comm. SD DENR). Each facility was matched to a monitoring location within the study area. Each facility was evaluated to determine its percent contribution of fecal coliform bacteria and TSS to the downstream monitoring sites for the study period. This was accomplished by the following equations:
30-day average flow (mean) × 30-day average concentration (mean) × # of days discharged = total load
(total facility load ÷ total monitored load) × 100 = percent facility load Urban Stormwater Runoff Stormwater impacts were estimated for the City of Watertown by using a mass-balance approach because there was only a limited amount of monitoring data. To calculate the relative contribution, Site R16 (BSR at 20th Ave) was isolated by subtracting off monitored sites upstream (Figure 9). This included subtracting Site R14 (BSR at Watertown) and Site T34 (Lake Pelican Weir). The remainder was assumed to be the contribution from the City of Watertown’s immediate area.

38
Lake Kampeska
Pelican Lake
R14
T36
T34 R15
R16
Figure 9. City of Watertown Area and the Monitoring Sites Used to Figure Stormwater Runoff
Non Point Sources Agricultural Runoff Agricultural runoff was taken into account when the AnnAGNPS model calculated landuse scenarios for TSS and nutrient reductions. The AGNPS model was used to perform ratings on the feedlots in the study area. This information was then incorporated as part of the process of prioritizing watershed areas for fecal reduction. Background Wildlife Contribution Fecal coliform bacteria contributions from wildlife was considered to be background. A general estimate of wildlife fecal coliform bacteria loading was derived from assessing total deer contributions. Deer are the largest of the wild animals occupying the study area and factual information was readily available for this animal. Using 2002 deer population numbers (Huxoll 2002) per square mile for Brookings, Deuel, Hamlin, and Codington Counties, estimations of deer per square mile were calculated. The five monitoring sites used to calculate this contribution were chosen because they were not influence by any other monitoring locations within the study area. The average deer per square mile was multiplied by the square miles of the township where the monitoring sites (T36, T37, T41, T42, and T46) were located, giving number of deer per township.

39
deer/square mile × square miles/township = deer/township Then the number of deer per township was multiplied by the number of days monitored and then multiplied by the CFU/deer/day (MPCA 2002) to calculate total CFU's per township from deer.
deer/township × # monitoring days × CFU/deer/day = CFU’s per township (from deer) To determine the percent deer contribution of fecal coliform bacteria, CFU’s per township per deer were divided by the total CFU’s monitored, multiplied by 100.
[CFU’s per township ÷ CFU’s monitored] × 100 = % deer contribution of fecal coliform bacteria Failing Septic Systems Contribution The fecal coliform background contribution from rural households was calculated using the Census 2000 Housing Units (US Census Bureau 2000). Housing unit numbers for each township where monitoring Sites T36, T37, T41, T42, and T46 are located were used to calculate failing septic system contribution. These particular monitoring sites were chosen because they represented rural areas throughout the study area. According to the US EPA (2002a) failure rates of onsite septic systems ranged from 10 to 20 percent, with the majority of these failures occurring with systems 30 or more years old. Therefore, 20 percent of the households for each monitoring site area were used to figure septic contribution. The average number of people per household (MPCA 2002) was multiplied by the number of households (20 percent) for the five monitoring site areas, giving a total number of people.
average number of people per household × # of households (20%) = total number of people Then the total number of people per township area of the monitored site was multiplied by the number of days monitored and then multiplied by the CFU/person/day to calculate total CFU’s per monitored site.
total number of people per area × # monitoring days ×CFU/people/day = CFU’s per area (from people) To determine the percent septic contribution of fecal coliform bacteria, CFU’s per area per person were divided by the total CFU’s monitored, multiplied by 100.
[CFU’s per area ÷ CFU’s monitored] × 100 = % septic system contribution of fecal coliform bacteria Modeling The strategy for selecting modeling and assessment techniques for the North-Central Big Sioux River watershed was based on the need to:
1) balance the cost of modeling intensity with the need to cover a broad geographic area in a timely manner,
2) link the transport of total suspended solids (TSS) with watershed processes and land uses,
3) link the transport of fecal coliform bacteria with feedlot density, proximity, and ratings, and land uses,

40
4) link the transport of nutrients (phosphorus and nitrates) with watershed processes and land uses, and
5) generate key information that integrates the relationship of cumulative effects and watershed health (indices of biological integrity) with the choices and consequences of human decisions in watershed protection and restoration.
These needs conform to the advantages of performing an assessment on a large scale (Barbour et al. 1999). Specific advantages include being able to address cumulative effects by accounting for large-scale watershed processes to guide management approaches. Six basic modeling and assessment techniques were used. Each technique generates an independent set of information (Table 25). The IPI and IBI assessment techniques have previously been described. This section will focus on the three models (FLUX, AGNPS, and AnnAGNPS) used to assess water quality in the study area.
Table 25. Modeling and Assessment Techniques and Outputs Used for the NCBSRWAP Modeling Technique Outputs
Loadings for WQ Parameters FLUX Model Concentrations for WQ Parameters
AGNPS - Feedlot Rating Model Total P & N, chemical oxygen demand (COD), and
a feedlot rating Flow Duration Interval Zones Hydrologic Condition Targets and Loads
% reduction for fecal coliform bacteria AnnAGNPS Model Sediment Yield Nutrient Yield Land Use Scenarios
Assessment Technique Outputs Physical Assessment Index of Physical Integrity (IPI) Biological Assessment Fish Index of Biological Integrity (IBI) Macroinvertebrate Index of Biological Integrity IBI)
FLUX Model
Total nutrient and sediment loads were calculated with the use of the Army Corps of Engineers Eutrophication Model known as FLUX (Walker 1999). FLUX uses six different loading calculation methods with individual sample data in conjunction with daily discharges. For each monitoring site, nutrient and sediment loadings were calculated with the model. The FLUX model uses 1) grab-sample water quality concentrations with an instantaneous flow and 2) continuous flow records. Loadings and concentrations were calculated by month and stratified into low and high flows to distinguish between base flow and runoff flow. Coefficients of variation (CV) were used to determine what method of calculation was appropriate for each parameter at each site (Appendix Q). Each water quality parameter was computed by site as daily, monthly and yearly concentrations and loadings. See Appendix R for monthly concentrations by site and Appendix S for monthly loadings by site.

41
Water quality was sampled according to Stueven et al. (2000) and analyzed at South Dakota State University, Water Quality Laboratory and the State Health Laboratory. Water quality analyses provided concentrations for a standard suite of parameters. Continuous streamflow records for tributary sites were derived using stage records and stage-discharge curves (Appendix E). Continuous streamflow records for river sites coinciding with USGS monitoring locations were obtained. Using these records, continuous streamflows for monitored BSR sites between gaging stations were derived using interpolation methods (Gordon 1992).
AGNPS Feedlot Model
The Agricultural Non-Point Source Pollution (AGNPS) model is a GIS-integrated water quality model that predicts non-point source pollutant loadings within agricultural watersheds. ArcView GIS software was used to spatially analyze feedlots and their pollution potential. Watersheds dominated by agricultural uses (i.e. pastured cattle in stream drainages, runoff from manure application, and runoff from concentrated animal feeding operations) can influence the amount of fecal coliform bacteria entering nearby surface waters. Assessment of the feedlots, using the AGNPS model, assumed the probable sources of fecal coliform bacteria loadings were related to agricultural land use (upland and riparian), animal feeding operations, and the use of streams for stock watering. The methods used in the NCBSRWA to determine loadings and reductions of fecal coliform bacteria, could serve as an integrated measure of runoff from feedlots and land uses. Pollutant frequency was measured using the density of feedlots located upstream of a monitoring site. Using feedlot scores based on proximity to the receiving waters provided an indicator of potential input of all feedlots. Upland and riparian land uses provided an indicator of the availability of upland areas available for pastured livestock. A complete methodology report can be found in Appendix T.
AnnAGNPS Landuse Model
The AnnAGNPS model expands the capabilities of the AGNPS model. This model was to be used as a tool to evaluate non-point source pollution from agricultural watersheds ranging in size up to 740,000 acres. With this model the watershed is divided into homogenous land areas or cells based on soil type, land use, and land management. AnnAGNPS simulates the transport of surface water, sediment, nutrients, and pesticides through the watershed. The current condition of the watershed can be modeled and used to compare the effects of implementing various conservation alternatives over time within the watershed.

42
RESULTS WATER QUALITY MONITORING Water quality data collected during the NCBSRWAP was evaluated based on the specific criteria that the DENR developed for listing water bodies in the 1998 and 2002 South Dakota 303(d) Waterbody List, and the 2004 Integrated Report. The EPA approved listing criteria used by the state of South Dakota during the assessment, to determine if a waterbody is meeting its beneficial uses, is contained in the following paragraph. It should be noted that EPA guidance, in reference to TMDL targets, are based on the acute criteria of any one sample, which was used in establishing targets for the TMDLs of this assessment. Use support was based on the frequency of exceedences of water quality standards (if applicable) for the following chemical and field parameters. A stream segment with only a slight exceedence (10 percent or less violations for each parameter) is considered to meet water quality criteria for that parameter. The EPA established the following general criteria in the 1992 305(b) Report Guidelines (SDDENR 2000) suitable for determining use support of monitored streams. Fully supporting ≤ 10.0 % of samples violate standards Not supporting > 10.0 % of samples violate standards This general criteria is based on having 20 or more samples for a monitoring location. Many of the monitoring sites were sampled less than 20 times. For those monitoring sites with less than 20 samples, the following criteria will apply: Fully supporting ≤ 25.0 % samples violate standards Not supporting > 25.0 % of samples violate standards Use support assessment for fish life propagation primarily involved monitoring levels of the following major parameters: dissolved oxygen, total ammonia nitrogen as N, water temperature, pH, and suspended solids. Use support for swimmable uses and limited contact recreation involved monitoring the levels fecal coliform bacteria (May 1 – September 30) and dissolved oxygen. If more than one beneficial use is assigned for the same parameter (i.e. fecal coliform bacteria) at a particular monitoring site, the more stringent criteria was applied. The use support for monitoring sites will be discussed further in the Assessment Section. The results for the following parameters are summarized below for all the tributary and river sites (T34, T35, T36, T37, T39, T40, T41, T42, T46, T47, R01, R14, R15, R16, R17, R18, R19, and R20). See Appendix U for detailed information about means, minimums, maximums, medians, percent violations, and use support of each monitoring site and parameter.

43
Chemical Parameters Table 26 shows a summary of the minimum and maximum results from the chemical parameter sampling of the tributaries and the rivers. More specific details of the sampling follow after the table. Table 26. Summary of Chemical Parameters Sampled in the Tributaries and River
Parameter Unit min max min maxFecals cfu/100mL no detect 930,000 no detect 410,000TotSol mg/L 222 2,113 122 1,587TSS mg/L 1 202 1 328TDS mg/L 172 2,084 112 613TAmmN mg/L no detect 7.850 0.022 0.789NO2NO3 mg/L no detect 3.515 no detect 11.404TKN mg/L 0.438 10.946 0.539 4.108OrgNtr mg/L 0.404 7.037 0.447 3.352TPO4 mg/L 0.038 2.016 0.047 2.956TDPO4 mg/L 0.009 1.493 0.012 2.797
Tributaries River
Fecal Coliform Bacteria
Fecal coliform bacteria ranged from non-detect at T34 (Lake Pelican Weir) and T39 (Lake Poinsett Outlet) to a maximum of 930,000 cfu/100mL (T35-Willow Creek) for the tributary sites (Figure 10). The lowest median of 235 cfu/100mL was at Site T34 and the highest median of 4,250 cfu/100mL was at Site T42. Fecal coliform bacteria ranged from non-detect at several sites to a maximum of 410,000 cfu/100ml (R18-BSR near Castlewood) for the river sites (Figure 10). The lowest median of 180 cfu/100mL was at Site R01 and the highest median of 1,800 cfu/100mL was at Site R18. A single grab sample daily maximum of ≤ 2,000 cfu/100mL was used to determine the percent violations and assess for the beneficial use support of (8) Limited Contact Recreation for all tributary and river sites. Using this criterion, tributary Sites T35, T36, T37, T41, T42 and rivers Sites R14, R16, R17, and R18 are not supporting for this parameter. Sites that are fully supporting include T40, R01, R15, and R19. Tributary Sites T34, T39, T46, and T47 are not assigned numeric criteria for fecal coliform bacteria.

44
Fecal Coliform Bacteria
0
100000
200000
300000
400000
500000
600000
700000
800000
900000
1000000
RIVERS TRIBS
coun
ts/1
00m
L
Figure 10. Box and Whisker Plot of Fecal Coliform Bacteria for River and Tributary Sites
Total Solids
Total solids ranged from a minimum of 222 mg/L (T25-Willow Creek) to a maximum of 2,113 mg/L (T40-Hidewood Creek) for the tributary sites (Figure 11). The lowest median of 415 mg/L was at Site T35 and the highest median of 1,046 mg/L was at Site T40. Total solids ranged from a minimum of 122 mg/L (R14-BSR at Watertown) to a maximum 1,587 mg/L (R20-BSR near Bruce) for the river sites (Figure 11). The lowest median of 480 mg/L was at Site R14 and the highest median of 680 mg/L was at Site R01. There is no standard or assigned beneficial use for this parameter.
Total Solids
0
500
1000
1500
2000
RIVERS TRIBS
mg/
L
Figure 11. Box and Whisker Plot of Total Solids for River and Tributary Sites

45
Total Suspended Solids
Total suspended solids ranged from a minimum of 1 mg/L (T47-Unnamed Creek near Volga) to a maximum of 202 mg/L (T36-Willow Creek near Watertown) for the tributary sites (Figure 12). The lowest median of 7 mg/L was at Site T47 and the highest median of 42 mg/L was at Site T39. Total suspended solids ranged from a minimum of 1 mg/L at R17 (BSR below Watertown) and at R19 (BSR near Estelline) to a maximum of 328 mg/L (R20-BSR near Bruce) for the river sites (Figure 12). The lowest median of 22 mg/L was at Site R16 and the highest median of 72 mg/L was at Site R01. A single grab sample daily maximum of ≤ 158 mg/L was used to determine the percent violations and assess for the beneficial use support of (5) Warm Water Semi-Permanent Fish Life Propagation for river Sites R01, R14, R15, R16, R17, R18, R19, and R20. These river sites are fully supporting for this parameter. A single grab sample daily maximum of ≤ 263 mg/L was used to determine the percent violations and assess for the beneficial use support of (6) Warm Water Marginal Fish Life Propagation for tributary Sites T35, T36, T37, T40, T41, and T42. These tributaries are fully supporting of this parameter. Based on the existing standard for total suspended solids, tributary Sites T34, T39, T46, and T47 are not assigned numeric criteria.
Total Suspended Solids
0
50
100
150
200
250
300
350
RIVERS TRIBS
mg/
L
Figure 12. Box and Whisker Plot of TSS for River and Tributary Sites
Total Dissolved Solids (TDS)
TDS ranged from a minimum of 172 mg/L (T37-Stray Horse Creek) to a maximum of 2,084 mg/L (T40-Hidewood Creek) for the tributary sites (Figure 13). The lowest median of 384 mg/L was at Site T35 and the highest median of 982 mg/L at Site T40. TDS ranged from a minimum of 112 mg/L at Site R14 (BSR at Watertown) and R15 (BSR at Broadway) to a maximum of 613 mg/L (R19-BSR near Estelline) for the river sites (Figure 13). The lowest median of 444 mg/L was at Site R14 and the highest median of 613 mg/L was at Site R19. A single grab sample daily maximum of ≤ 4,375 mg/L was used to determine the percent violations and assess for the beneficial use support of (9) Fish and Wildlife, Propagation, Recreation and Stock Watering

46
for the tributary sites. A single grab sample daily maximum of ≤ 1,750 mg/L was used to determine the percent violations and assess for the beneficial use support of (1) Domestic Water Supply for the river sites. Using this criterion, all tributary sites and all river sites are fully supporting for this parameter.
Total Dissolved Solids
0
500
1000
1500
2000
RIVERS TRIBS
mg/
L
Figure 13. Box and Whisker Plot of Total Dissolved Solids for River and Tributary sites
Total Ammonia Nitrogen as N
Total ammonia nitrogen as N ranged from a non-detect (T47-Unamed Creek near Volga) to a maximum of 7.85 mg/L (T40-Hidewood Creek) for the tributary sites (Figure 14). The lowest median of 0.059 mg/L was at Site T42 and the highest median of 0.401 mg/L was at Site T40. Total ammonia nitrogen as N ranged from a minimum of 0.022 (R20-BSR near Bruce) to a maximum 0.798 mg/L (R18-BSR near Castlewood) for all river sites (Figure 14). The lowest median of 0.100 mg/L was at Site R01 and the highest median of 0.214 mg/L was at Site R15. To calculate a single grab sample daily maximum, an equation (equation 2 in Appendix A to Chapter 74:51:01 of the South Dakota Administrative Rules) based on pH was used. This was used to determine the percent violations and assess for the beneficial use support (5) Warmwater Semi-permanent Fish Life Propagation for the river and lake monitoring sites. This same process was used to determine the percent violations and assess for the beneficial use support (6) Warmwater Marginal Fish Life Propagation for tributary Sites T35, T36, T37, T40, T41, and T42. Using this criterion, all tributary sites and all river sites are fully supporting for this parameter.

47
0
1
2
3
4
5
6
7
8
Tributaries Rivers
mg/
L
Figure 14. Box and Whisker Plot of Total Ammonia Nitrogen as N for River and Tributary Sites
Nitrate-Nitrite
Nitrate-nitrite ranged from a non-detect at T39 (Lake Poinsett Outlet) to a maximum of 3.515 mg/L (T40-Hidewood Creek) for the tributary sites (Figure 15). The lowest median of 0.062 mg/L was at T39, and the highest median of 0.779 mg/L was at Site T41. Nitrate-nitrite ranged from a non-detect at R19 (BSR near Estelline) to a maximum of 11.404 mg/L (R16-BSR at 20th Ave) for the river sites (Figure 15). The lowest median of 0.144 mg/L was at Site R14 and the highest median of 1.365 mg/L was at Site R18. A single grab sample daily maximum of ≤ 88 mg/L was used to determine the percent violations and assess for the beneficial use support of (9) Fish and Wildlife Propagation, Recreation and Stock Watering for the tributary sites. A single grab sample daily maximum of 10 mg/L was used to determine the percent violations and assess for the beneficial use support of (1) Domestic Water Supply for the river sites. Using this criterion, all tributary and all river sites are fully supporting of this parameter.
Nitrate-Nitrite
0
2
4
6
8
10
12
RIVERS TRIBS
mg/
L
Figure 15. Box and Whisker Plot of Nitrate-Nitrite for River and Tributary Sites

48
Total Kjeldahl Nitrogen (TKN)
TKN ranged from a minimum of 0.438 mg/L (T42-Peg Munky Run) to a maximum of 10.946 mg/L (T40-Hidewood Creek) for the tributary sites (Figure 16). The lowest median of 0.703 mg/L was at Site T42 and the highest median of 1.949 mg/L was at Site T37. TKN ranged from a minimum of 0.539 mg/L (R15-BSR at Broadway) to a maximum 4.108 mg/L (R18-BSR near Castlewood) for the river sites (Figure 16). The lowest median of 1.107 mg/L was at Site R15 and the highest median of 1.691 mg/L was at Site R19. There is no standard or assigned beneficial use for this parameter.
Total Kjeldahl Nitrogen
0
2
4
6
8
10
12
RIVERS TRIBS
mg/
L
Figure 16. Box and Whisker Plot of Total Kjeldahl Nitrogen for River and Tributary Sites
Organic Nitrogen
Organic nitrogen ranged from a minimum of 0.404 mg/L (T42-Peg Munky Run) to a maximum of 7.037 mg/L (T47-Unnamed Creek near Volga) for the tributary sites (Figure 17). The lowest median of 0.662 mg/L was at Site T42 and the highest median of 1.714 mg/L was at Site T37. Organic nitrogen ranged from a minimum of 0.447 mg/L (R14-BSR at Broadway) to a maximum 3.352 mg/L (R19-BSR near Estelline) for the river sites (Figure 17). The lowest median of 0.957 mg/L was at Site R15 and the highest median of 1.606 mg/L was at Site R19. There is no standard or assigned beneficial use for this parameter.

49
Total Kjeldahl Nitrogen
0
2
4
6
8
10
12
RIVERS TRIBS
mg/
L
Figure 17. Box and Whisker Plot of Organic Nitrogen for River and Tributary Sites Total Phosphorus
Total phosphorus ranged from a minimum of 0.038 mg/L (T34-Lake Pelican Weir) to a maximum of 2.016 mg/L (T47-Unnamed Creek near Volga) for the tributary sites (Figure 18). The lowest median of 0.093 mg/L was at Site T41 and the highest median of 0.618 mg/L was at Site T47. Total phosphorus ranged from a minimum of 0.047 mg/L (R14-BSR at Watertown) to a maximum 2.956 mg/L (R16-BSR at 20th Ave) for the river sites (Figure 18). The lowest median of 0.181 mg/L was at Site R15 and the highest median of 0.608 mg/L was at Site R16. There is no standard or assigned beneficial use for this parameter. However, phosphorous is an essential nutrient for the production of crops and comes from commercial fertilizers and livestock waste. It is also the primary nutrient for algae growth in lakes and streams. Since a standard for total phosphorous has not been established, data was compared to the ecoregion mean for phosphorus in Minnesota (Fandrei et al. 1988). In this report, according to Table 3, Northern Glaciated Plains, the summer reference mean for total phosphorus is 0.25 mg/L.
Total Phosphorus
0
0.5
1
1.5
2
2.5
3
RIVERS TRIBS
mg/
L
Figure 18. Box and Whisker Plot of Total Phosphorus for River and Tributary Sites

50
Total Dissolved Phosphorus
Total dissolved phosphorus ranged from a minimum of 0.009 mg/L (T41-Hidewood Creek) to a maximum of 1.493 mg/L (T47-Unnamed Creek near Volga) for the tributary sites (Figure 19). The lowest median of 0.036 mg/L was at Site T34 and the highest median of 0.591 mg/L was at Site T47. Total dissolved phosphorus ranged from a minimum of 0.012 mg/L (R20-BSR near Bruce) to a maximum 2.797 mg/L (R16-BSR at 20th Ave) for the river sites (Figure 19). The lowest median of 0.080 mg/L was at Site R14 and the highest median of 0.517 mg/L was at Site R16. There is no standard or assigned beneficial use for this parameter.
Total Dissolved Phosphorus
0
0.5
1
1.5
2
2.5
3
RIVERS TRIBS
mg/
L
Figure 19. Box and Whisker Plot of Total Dissolved Phosphorus for River and Tributary Sites
Field Parameters Table 27 shows a summary of the minimum and maximum results from the field parameter sampling of the tributaries and the rivers. More specific details of the sampling follow after the table. Table 27. Summary of Field Parameters Sampled in the Tributaries and River
Parameter Unit min max min maxDO mg/L 1.4 20.0 1.4 20.0pH units 7.4 8.7 7.3 9Atemp °C 2.0 36.5 -0.5 32.3Wtemp °C 1.1 27.3 2.2 26.4Cond µmhos/cm 118 2132 89 1136SpeCond µmhos/cm 234 3068 159 1175Sal ppt 0.1 0.3 0.1 0.6Turbidity NTU 0.0 5.0 1.8 340.0
Tributaries River

51
Dissolved Oxygen
Dissolved oxygen ranged from a minimum of 1.4 mg/L (T40-Hidewood Creek and T47 Unnamed Creek near Volga) to a maximum of 20.0 mg/L (T47-Unnamed Creek near Volga) for the tributary sites (Figure 20). The lowest median of 7.4 mg/L at T40, and the highest median of 14.2 mg/L were at Site T41. Dissolved oxygen ranged from a minimum of 1.4 mg/L (R19-BSR near Estelline and R20-BSR near Bruce) to a maximum of 20 mg/L (R18-BSR near Castelwood) for the river sites (Figure 20). The lowest median of 7.6 mg/L was at Site R15 and the highest median of 10.2 mg/L was at Site R18. A single grab sample daily maximum of > 5 mg/L (most stringent) was used to determine the percent violations and assess for the beneficial use support of (5), (6), (7) and (8) for all river sites and tributary Sites T35, T36, T37, T40, T41, and T42. Tributary sites assigned this criteria that are fully supporting of this parameter include T36, T37, T41, and T42. Tributary sites that are not supporting include T35, and T40. All river sites are fully supporting of this parameter. Based on the existing standard for dissolved oxygen, tributary Sites T34, T39, T46, and T47 are not assigned a beneficial use.
Dissolved Oxygen
0
5
10
15
20
RIVERS TRIBS
mg/
L
Figure 20. Box and Whisker Plot of Dissolved Oxygen for River and Tributary Sites
pH
pH ranged from a minimum of 7.4 at several sites, to a maximum of 8.7 at several tributary sites (Figure 21). The lowest median of 7.9 was at several sites, and the highest median of 8.4 was at Site T39. pH ranged from a minimum of 7.3 (R18-BSR near Castlewood) to a maximum of 9.0 (R01-BSR near Brookings) for the river sites (Figure 21). The lowest median of 8.0 was at Sites R15 and R16, and the highest median of 8.4 was at Sites R01 and R20. A single grab sample daily maximum of the most restrictive standard of ≥ 6.0 to ≤ 9.0 was used to determine the percent violations at and assess for the beneficial use support of (6) and (9) for tributary Sites T35, T36, T37, T40, T41, and T42. Tributary sites assigned beneficial use (9) used the criteria of 6.0 to 9.5 include T34, T39, T46, and T47. A single grab sample daily maximum of the most restrictive standard of ≥ 6.5 to ≤ 9.0 was used to determine the percent violations at and assess for the beneficial use support of (1), (5), and (9) for all the river Sites R01, R14-R20. Using this criterion, all tributary sites and

52
all river sites are fully supporting of this parameter. Based on the existing standard for pH, tributary Sites T34 and T39 are not assigned a beneficial use.
pH
7
7.5
8
8.5
9
9.5
RIVERS TRIBS
units
Figure 21. Box and Whisker Plot of pH for River and Tributary Sites
Air Temperature
Air temperature ranged from a minimum of 2.0o C (T39-Lake Poinsett Outlet) to a maximum of 36.5o C (T46-East Oakwood Lake Outlet) for the tributary sites (Figure 22). The lowest median temperature of 16.0o C was at Site T36 and T41, and the highest median temperature of 21.1o C was at Site T46. Air temperature ranged from a minimum of -0.5o C (R17-BSR below Watertown) to a maximum 32.3o C (R20-BSR near Bruce) for the river sites (Figure 22). The lowest median temperature of 14.0o C was at Sites R14 and R15, and the highest median temperature of 17.0o C was at Sites R01 and R20. There is no standard or assigned beneficial use for this parameter.
Air Temperature
0
5
10
15
20
25
30
35
40
RIVERS TRIBS
Deg
rees
Cel
sius
Figure 22. Box and Whisker Plot for Air Temperature for River and Tributary Sites
Water Temperature
Water temperature ranged from a minimum of 1.1o C (T36-Willow Creek) to a maximum of 27.3o C (T34-Lake Pelican Weir) for the tributary sites (Figure 23). The lowest median temperature of 12.4o C was at Sites T36 and T42, and the highest median temperature of 20.4o C was at T46.

53
Water temperature ranged from a minimum of 2.2o C (R15-BSR at Broadway) to a maximum of 26.4o C (R17-BSR below Watertown) for the river sites (Figure 23). The lowest median temperature of 11.5o C at R14 and the highest median temperature of 15.8o C were at Site R01. A single grab sample daily maximum temperature of ≤ 32.2o C was used to determine the percent violations and assess for the beneficial use support of (5) for all of the river sites. A single grab sample daily maximum of ≤ 32.2o C was used to determine the percent violations and assess for the beneficial use support of (6) for tributary Sites T35, T36, T37, T40, T41, and T42. All tributary sites and all river sites using this criterion are fully supporting of this parameter. Based on the existing standard for water temperature, tributary Sites T34, T39, T46, and T47 are not assigned a beneficial use or standard.
Air Temperature
0
5
10
15
20
25
30
35
40
RIVERS TRIBS
Deg
rees
Cel
sius
Figure 23. Box and Whisker Plot of Water Temperature for River and Tributary Sites
Conductivity
Conductivity ranged from a minimum of 118 µmhos/cm (T36-Willow Creek) to a maximum of 2,132 µmhos/cm (T40-Hidewood Creek) for the tributary sites (Figure 24). The lowest median of 464 µmhos/cm was at Site T35 and the highest median of 1,169 µmhos/cm was at Site T40. Conductivity ranged from a minimum of 89 µmhos/cm (R15-BSR at Broadway) to a maximum 1,136 µmhos/cm (R01-BSR near Brookings) for the river sites (Figure 24). The lowest median of 511 µmhos/cm was at Site R14 and the highest median of 708 µmhos/cm was at Site R01. There is no standard or assigned beneficial use for this parameter.

54
Conductivity
0
500
1000
1500
2000
2500
RIVERS TRIBS
µmho
s/cm
Figure 24. Box and Whisker Plot of Conductivity for Rivers and Tributary Sites
Specific Conductivity
Specific conductivity ranged from a minimum of 234 µmhos/cm (T37-Stray Horse Creek) to a maximum of 3,068 µmhos/cm (T40-Hidewood Creek) for the tributary sites (Figure 25). The lowest median of 545 µmhos/cm was at Site T35, and the highest median of 1,281 µmhos/cm was at T46. Specific conductivity ranged from a minimum of 159 µmhos/cm (R15-BSR at Broadway) to a maximum of 1,175 µmhos/cm (R01-BSR near Brookings) for the river sites (Figure 25). The lowest median of 664 µmhos/cm at R14 and the highest median of 869 µmhos/cm were at Site R19. A single grab sample daily maximum of the most restrictive standard of ≤ 4,375 µmhos/cm was used to determine the percent violations and assess for the beneficial use support of (9) Fish and Wildlife Propagation, Recreation, and Stock Watering and (10) Irrigation for the tributary and river sites. Using this criterion, all tributary sites and all river sites are fully supporting of this parameter.
Specific Conductivity
0
500
1000
1500
2000
2500
3000
3500
RIVERS TRIBS
µmho
s/cm
Figure 25. Box and Whisker Plot of Specific Conductivity for Rivers and Tributary Sites

55
Salinity
Salinity ranged from a minimum of 0.1 ppt at several sites, to a maximum of 0.3 ppt (T46-East Oakwood Lake Outlet and T47-Unnamed Creek near Volga) for the tributary sites (Figure 26). The lowest median of 0.3 ppt was at Sites T34 and T35, and the highest median of 0.7 ppt was at Site T46. Salinity ranged from a minimum of 0.1 ppt (several sites), to a maximum 0.6 ppt (several sites) for the river sites (Figure 26). The lowest median was 0.3 ppt (several sites) and the highest median was 0.4 ppt (several sites). There is no standard or assigned beneficial use for this parameter.
Salinity
0
0.2
0.4
0.6
0.8
1
1.2
1.4
1.6
1.8
RIVERS TRIBS
ppt
Figure 26. Box and Whisker Plot of Salinity for River and Tributary Sites
Turbidity – NTU
Turbidity ranged from a minimum of 0.0 NTU (T47-Unnamed Creek near Volga) to a maximum of 5.0 NTU (T41-Hidewood Creek) for the tributary sites (Figure 27). The lowest median of 6.5 NTU was at Site T42 and the highest median of 24.7 NTU was at Site T46. Turbidity ranged from a minimum of 1.8 NTU (R15-BSR at Broadway) to a maximum 340 NTU (R18-BSR near Castlewood) for the river sites (Figure 27). The lowest median of 10.0 NTU was at Site R16 and the highest median of 37.0 NTU at Site R01. There is no standard or assigned beneficial use for this parameter.

56
Turbidity
0
50
100
150
200
250
300
350
RIVERS TRIBS
Nep
helo
met
ric T
urbi
dity
Uni
ts (N
TU)
Figure 27. Box and Whisker Plot of Turbidity (NTU) for River and Tributary Sites
Flow Duration Intervals Flow duration intervals divided into hydrologic zones and plotted with seasonal fecal coliform bacteria grab samples were used to find the seasonal loadings and reductions of fecal coliform bacteria at each monitoring site. Target loadings based on the water quality standards and the current load for each monitoring site is shown for each hydrologic zone along with reductions, including a 10 percent margin of safety (MOS) applied. These loads and percent reductions are presented in Appendix V. Sample data collected during this project, as well as by the DENR were utilized in the calculation of the fecal coliform bacteria. Each graph corresponds to the fecal exceedence tables located in Appendix W, and serves as a visual aid in determining if there are non-point source, point source, and/or unmanageable problems. The line on the graphs represents the ≤ 2000 cfu/100mL water quality standard for beneficial use (8) Limited Contact Recreation. The ≤ 2000 cfu/100mL standard was applied to all river sites and applicable tributary sites. BIOLOGICAL MONITORING Fish Sampling Data from the fish surveys at each site were compiled into a fisheries collection report, which was submitted to the SD GFP for each year of sampling (Appendix X). Also, the life history designation for fish found during the NCBSRWAP is located in Appendix Y. Fish were surveyed at tributary sites T36 (Willow Creek), T37 (Stray Horse Creek), T41 (Hidewood Creek), and T42 (Peg Munky Run). The other tributaries in the study area were very intermittent and became dry before sampling could be completed. The Big Sioux River sites were not surveyed for fish. Results of the candidate fish metrics can be found in Appendix Z.
Fish index scores from each monitoring site were compiled (Table 28, 29, 30, and 31). Because only four sites were sampled, categories were based on those used in the CBSRWAP. These categories were derived by first ordering the final index scores for each monitoring site, from highest to lowest and calculating the percent rank. The three categories designated for fish during the Central Big Sioux River

57
watershed assessment were 24-51 (poor), 52-72 (fair), and 73-90 (good). These same categories were applied to this project. Although Site T37 scored a 92 (outside the good category) it was included in the good category for this assessment. Any site scoring above 94 would have been classified as least-impaired. Two of the sites (T36 and T41) fell into the fair category, and two sites (T37 and T42) fell into the good category. In comparison with the three other sites, T36 scored very poorly. It should be noted that reference sites concerning fish have not been designated nor sampled. The classification of sites into one of the three impairment categories is based solely on the fisheries data collected during the Central and North Central Watershed Assessment Projects. The sites were compared to themselves and not to a known biological benchmark.
Table 28. Fish Score for Site T36
Site T36 - Willow Creek (near Watertown)
Metric
Response to
Impairment
Percentile for "best"
value
Standard (best value)
Measured metric value
Standardized Metric score
Species Richness Decrease 95th 21 11.0 52Water Column Species Richness Decrease 95th 8 4.0 50Benthic Species Richness Decrease 95th 10 5.0 50% Headwater Species Decrease 95th 31.7 9.0 28% Pioneer Species Biomass Increase 5th 28.5 41.0 83% Intolerant Species Decrease 95th 13.6 0.0 0% Sensitive Species Decrease 95th 27.2 9.0 33% Tolerant Species Biomass Increase 5th 31.3 72.5 40% Insectivorous Minnows Decrease 95th 94.2 68.5 73% Insectivorous Biomass Decrease 95th 77.1 55.0 71% Omnivore Increase 5th 12.7 42.1 66% Simple Lithophil Biomass Decrease 95th 59.6 49.5 83
52Final index value for this site:
Table 29. Fish Score for Site T37 Site T37 - Stray Horse Creek
Metric
Response to
Impairment
Percentile for "best"
value
Standard (best value)
Measured metric value
Standardized Metric score
Species Richness Decrease 95th 21 22.0 100Water Column Species Richness Decrease 95th 8 9.0 100Benthic Species Richness Decrease 95th 10 10.0 100% Headwater Species Decrease 95th 31.7 22.7 72% Pioneer Species Biomass Increase 5th 28.5 26.8 100% Intolerant Species Decrease 95th 13.6 13.6 100% Sensitive Species Decrease 95th 27.2 27.3 100% Tolerant Species Biomass Increase 5th 31.3 31.3 100% Insectivorous Minnows Decrease 95th 94.2 95.3 100% Insectivorous Biomass Decrease 95th 77.1 64.3 83% Omnivore Increase 5th 12.7 58.7 47% Simple Lithophil Biomass Decrease 95th 59.6 60.4 100
92Final index value for this site:
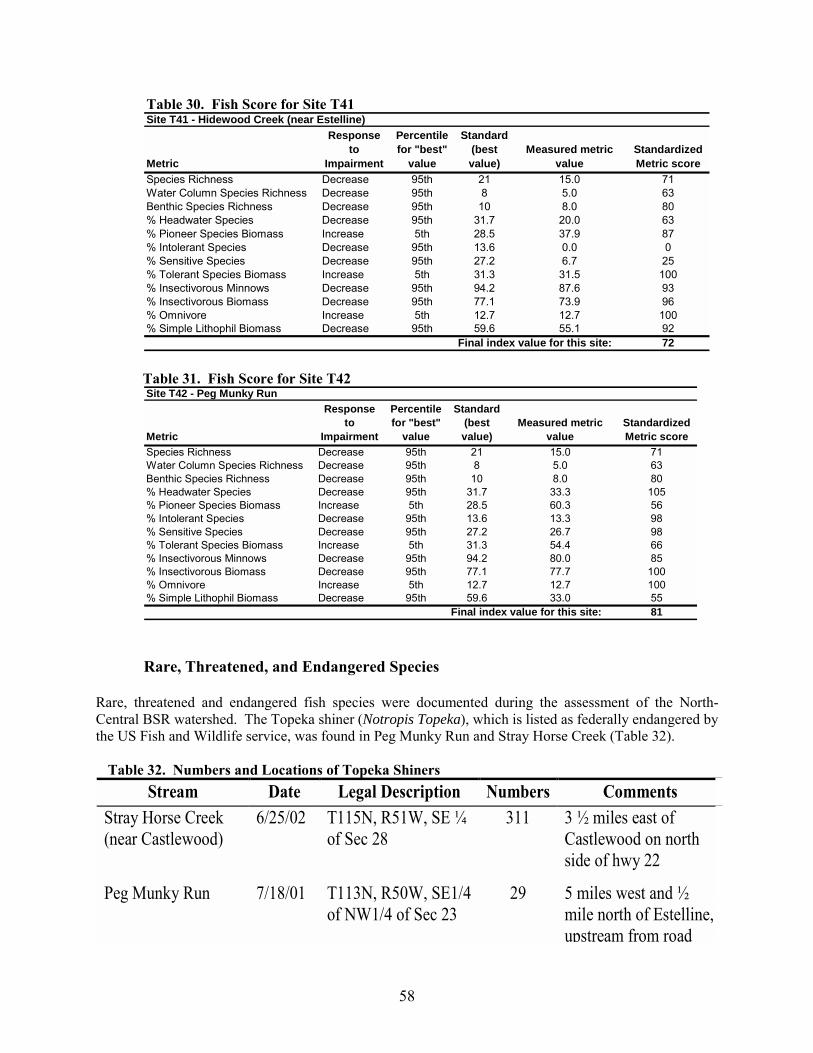
58
Table 30. Fish Score for Site T41 Site T41 - Hidewood Creek (near Estelline)
Metric
Response to
Impairment
Percentile for "best"
value
Standard (best value)
Measured metric value
Standardized Metric score
Species Richness Decrease 95th 21 15.0 71Water Column Species Richness Decrease 95th 8 5.0 63Benthic Species Richness Decrease 95th 10 8.0 80% Headwater Species Decrease 95th 31.7 20.0 63% Pioneer Species Biomass Increase 5th 28.5 37.9 87% Intolerant Species Decrease 95th 13.6 0.0 0% Sensitive Species Decrease 95th 27.2 6.7 25% Tolerant Species Biomass Increase 5th 31.3 31.5 100% Insectivorous Minnows Decrease 95th 94.2 87.6 93% Insectivorous Biomass Decrease 95th 77.1 73.9 96% Omnivore Increase 5th 12.7 12.7 100% Simple Lithophil Biomass Decrease 95th 59.6 55.1 92
72Final index value for this site:
Table 31. Fish Score for Site T42 Site T42 - Peg Munky Run
Metric
Response to
Impairment
Percentile for "best"
value
Standard (best value)
Measured metric value
Standardized Metric score
Species Richness Decrease 95th 21 15.0 71Water Column Species Richness Decrease 95th 8 5.0 63Benthic Species Richness Decrease 95th 10 8.0 80% Headwater Species Decrease 95th 31.7 33.3 105% Pioneer Species Biomass Increase 5th 28.5 60.3 56% Intolerant Species Decrease 95th 13.6 13.3 98% Sensitive Species Decrease 95th 27.2 26.7 98% Tolerant Species Biomass Increase 5th 31.3 54.4 66% Insectivorous Minnows Decrease 95th 94.2 80.0 85% Insectivorous Biomass Decrease 95th 77.1 77.7 100% Omnivore Increase 5th 12.7 12.7 100% Simple Lithophil Biomass Decrease 95th 59.6 33.0 55
81Final index value for this site: Rare, Threatened, and Endangered Species
Rare, threatened and endangered fish species were documented during the assessment of the North-Central BSR watershed. The Topeka shiner (Notropis Topeka), which is listed as federally endangered by the US Fish and Wildlife service, was found in Peg Munky Run and Stray Horse Creek (Table 32).
Table 32. Numbers and Locations of Topeka Shiners Stream Date Legal Description Numbers Comments
Stray Horse Creek (near Castlewood)
6/25/02 T115N, R51W, SE ¼ of Sec 28
311 3 ½ miles east of Castlewood on north side of hwy 22
Peg Munky Run
7/18/01 T113N, R50W, SE1/4 of NW1/4 of Sec 23
29 5 miles west and ½ mile north of Estelline, upstream from road

59
Macroinvertebrate Sampling Macroinvertebrate sampling occurred within all the tributary and river sites, with the exception of T41 and T42. These three sites are intermittent streams and became dry before macroinvertebrates were collected. Laboratory work and compilation of the results for each metric were outsourced to the researchers at Natural Resource Solutions. These results can be found in Appendix AA. Macroinvertebrate index scores from each monitoring site, n=16, were compiled and graphed. Figure 28 visually shows the category in which each site fell. The categories are 25-51 (poor), 52-63 (fair), 65-71 (good). The majority of the sites fell within the fair and good categories. Sites T35, T36, T39, and T40 fell into the poor category; all of these are lake outlets except T36. Although, T36 is close to being in the fair category, the poor macroinvertebrate score should be of concern. It should be noted that reference sites concerning macroinvertebrates have not been designated nor sampled. The classification of sites into one of the three impairment categories is based solely on the biological data collected during the Central and North Central Watershed Assessment Projects. The sites were compared to themselves and not to a known biological benchmark.
Poor
Fair
Good
Bug IBI Scores - Tributaries & Rivers
R01R14
R15R16
R17R18
R19R20
T34T35
T36T37
T39T40
T44T45
T46T47
T48
Site
05
101520253035404550556065707580859095
100
Scor
e
R01
R14
R15
R16
R17
R18
R19
R20 T34T47
T46
T40
T39
T37
T36
T35
Figure 28. Scatterplot of Macroinvertbrate IBI Scores

60
PHYSICAL HABITAT MONITORING Habitat Assessment Physical habitat sampling occurred within the tributary sites where fish were collected. These sites included T36, T37, T41, and T42. The Big Sioux River sites were not surveyed for fish or physical habitat. Physical habitat scores from each monitoring site were compiled (Tables 33, 34, 35, and 36). Because only four sites were sampled, categories were based on the CBSRWAP. These categories were derived by first ordering the final index scores for each monitoring site, from highest to lowest and calculating the percent rank. The three categories designated for physical habitat during the central Big Sioux River watershed assessment were 31-46 (poor), 50-64 (fair), and 65-80 (good). These same categories were applied to this project. Although Site T37 scored a 94 (outside the good category) it was included in the good category for this assessment. All sites fell into the good category. It should be noted that reference sites regarding physical habitat have not been designated nor sampled. The classification of sites into one of the three impairment categories is based solely on the biological data collected during the Central and North Central Watershed Assessment Projects. The sites were compared to themselves and not to a known biological benchmark.
Table 33. Physical Habitat Score for Site T36 Site T36 - Willow Creek near Watertown
MetricPercentile for "best" value
Standard (best value)
Measured metric value
Standardized Metric score
Channel Flow Status 95th 10 10 100Physical Complexity 95th 10 2.5 25CV of Velocity 95th 10 10 100Bed Composition 95th 19 8 42Measure of Incision 95th 10 7.5 75Bank Stability 95th 19 20 100Overhanging Vegetation 95th 2.5 2.5 100Animal Vegetation Use 95th 10 0 0
68Final index value for this site:
Table34. Physical Habitat Score for Site T37 Site T37 - Stray Horse Creek
MetricPercentile for "best" value
Standard (best value)
Measured metric value
Standardized Metric score
Channel Flow Status 95th 10 10 100Physical Complexity 95th 10 10 100CV of Velocity 95th 10 10 100Bed Composition 95th 19 20 100Measure of Incision 95th 10 10 100Bank Stability 95th 19 10 53Overhanging Vegetation 95th 2.5 2.5 100Animal Vegetation Use 95th 10 10 100
94Final index value for this site:

61
Table 35. Physical Habitat Score for Site T41 Site T41 - Hidewood Creek near Estelline
MetricPercentile for "best" value
Standard (best value)
Measured metric value
Standardized Metric score
Channel Flow Status 95th 10 10 100Physical Complexity 95th 10 2.5 25CV of Velocity 95th 10 7.5 75Bed Composition 95th 19 8 42Measure of Incision 95th 10 5 50Bank Stability 95th 19 10 53Overhanging Vegetation 95th 2.5 2.5 100Animal Vegetation Use 95th 10 10 100
68Final index value for this site:
Table 36. Physical Habitat Score for Site T42 Site T42 - Peg Munky Run
MetricPercentile for "best" value
Standard (best value)
Measured metric value
Standardized Metric score
Channel Flow Status 95th 10 10 100Physical Complexity 95th 10 7.5 75CV of Velocity 95th 10 7.5 75Bed Composition 95th 19 16 84Measure of Incision 95th 10 2.5 25Bank Stability 95th 19 15 79Overhanging Vegetation 95th 2.5 2.5 100Animal Vegetation Use 95th 10 5 50
74Final index value for this site:

62
ASSESSMENT OF SOURCES Point Sources Wastewater Treatment Facilities (NPDES) Table 37 represents the percent contribution of TSS from each wastewater treatment facility in the study area. The ‘Ave L/day’ column is calculated by the following: (average millions of gallons a day) × (conversion from millions gallons a day to cubic feet per second) × (seconds in a day) × (conversion from cubic feet to liters) The ‘Total mg’ column is calculated multiplying the following columns: (Ave L/day) × (Ave mg/L) × (Days Discharge) The ‘% of Total’ column is calculated by the following columns: (Total kg ÷ Total TSS (kg) from FLUX) ×100 Table 38 represents the percent contribution of fecal coliform bacteria from each wastewater treatment facility in the study area. The ‘Ave ft3/day’ column is calculated by the following:
(average millions of gallons a day) × (conversion from millions of gallons a day to cubic feet per second) × (seconds in a day)
The ‘CFU’s’ column is calculated by multiplying the following columns: (Ave ft3/day) × (Ave Conc) × (Days Discharge) The ‘% of Total’ column is calculated by the following columns: (CFUs ÷ Total CFU from FLUX) ×100 Urban Stormwater Runoff Based on the method described in the methods section, under Urban Stormwater Runoff, calculations resulted in a 37 percent relative contribution of TSS for the City of Watertown. This percentage represents the well-developed residential, commercial, and industrial areas; however, this percentage could increase with increased construction erosion activities if proper stormwater management is not implemented. For the purpose of this study, the City of Watertown is considered background contribution since no violations of TSS standards were found.

63
Table 37. NPDES Percent Contributions of TSS Drains
to Name NPIDTotal
Retention Ave MGDAve
ft3/dayAve
ConcDays
Discharge Total mg Total kgTotal TSS (kg) from % of Total Remarks
R17 Benchmark Foam Inc. SD0025895 * NA -------- NA -------- -------- -------- -------- --------R01 Bruce, City SD0025224 *** NA -------- NA -------- -------- -------- -------- --------
R19 Castlewood, City SD0021580 *** NA -------- NA -------- -------- -------- -------- --------
T40 Clear Lake, City (001A) SD0020699 No 0.342857 45833.37 14.48571 90 5.98E+07 5.98E+01 9.26E+04 0.064503discharge varies from 1 to 3 months a yr TSS 30 Day avg Limit 30
R14 Dakota Sioux Casino SD0026921 *** NA -------- NA -------- -------- -------- -------- --------
R20 Estelline, City SD0022144 * NA -------- NA -------- -------- -------- -------- --------
T37 Goodwin, City SD0024716 *** NA -------- NA -------- -------- -------- -------- --------
T37 Kranzburg, Town SD0024724 ** NA -------- NA -------- -------- -------- -------- --------
T39 Lake Poinsett Sanitary District SD0026450 *** NA -------- NA -------- -------- -------- -------- --------
T47 Land O'Lakes SD0025836 *** NA -------- NA -------- -------- -------- -------- --------
R14 Northern Con-Agg, Inc. SD0026182 *** NA -------- NA -------- -------- -------- -------- --------
R16 Oak Valley Farms (001A) SD0027324 No 0.1936 25880.58 5.169091 365 4.88E+07 4.88E+01 4.32E+06 0.001131 TSS 30 Day avg, Limit 30
R16 Oak Valley Farms (002A) SD0027324 No 0.020857 2788.197 none -------- -------- -------- -------- -------- no TSS data
T34 Technical Ordinance, Inc. SD0026301 *** NA -------- NA -------- -------- -------- -------- --------
R01 Volga, City (001A) SD0021920 No 0.391831 52380.2 17.44615 90 8.22E+07 8.22E+01 4.74E+07 0.000173discharge varies from 2 to 4 months a yr TSS 30 Day avg Limit 90
R16 Watertown, City (002A) SD0023370 No 2.886923 385925.8 6.410714 365 9.03E+08 9.03E+02 4.32E+06 0.020911 TSS 30 Day avg, Limit 30* Reported no discharge from 2001 to Present** Reported no discharge for the life of the facility*** Reported either total retention or no discharge
Daily loadings for each NPDES permit holder can be found in each TMDL watershed where the facility is located (Appendix DD-JJ).

64
Table 38. NPDES Percent Contributions of Fecal Coliform Bacteria
Drains to Name NPID
Total Retention
Ave MGD 30 day avg
Ave ft3/day Ave Conc
Days Discharge
(with fecal) per year CFU's
Total CFU from flux % of Total Remarks
R17 Benchmark Foam Inc. SD0025895 * NA -------- NA -------- -------- -------- -------- No DischargesR01 Bruce, City SD0025224 *** NA -------- NA -------- -------- -------- --------
R19 Castlewood, City SD0021580 *** NA -------- NA -------- -------- -------- --------
T40 Clear Lake, City (001A) SD0020699 No 0.3428571 45833.37 none -------- -------- -------- -------- no fecal data
R14 Dakota Sioux Casino SD0026921 *** NA -------- NA -------- -------- -------- --------
R20 Estelline, City SD0022144 * NA -------- NA -------- -------- -------- -------- No DischargesT37 Goodwin, City SD0024716 *** NA -------- NA -------- -------- -------- --------
T37 Kranzburg, Town SD0024724 ** NA -------- NA -------- -------- -------- -------- No Discharges
T39 Lake Poinsett Sanitary District SD0026450 *** NA -------- NA -------- -------- -------- --------
T47 Land O'Lakes SD0025836 *** NA -------- NA -------- -------- -------- --------R14 Northern Con-Agg, Inc. SD0026182 *** NA -------- NA -------- -------- -------- --------R16 Oak Valley Farms (001A) SD0027324 No 0.1936 25880.58 1.3478261 150 5.23E+06 3.92E+14 0.000001 Fecal 30 day geo Limit 1000
R16 Oak Valley Farms (002A) SD0027324 No 0.0208571 2788.197 none -------- -------- -------- -------- no fecal data
T34 Technical Ordinance, Inc. SD0026301 *** NA -------- NA -------- -------- -------- --------
R01 Volga, City (001A) SD0021920 No 0.3918308 52380.2 none -------- -------- -------- -------- no fecal dataR16 Watertown, City (002A) SD0023370 No 2.8869231 385925.8 54.913043 150 3.18E+09 3.92E+14 0.000811 Fecal 30 day geo Limit 1000* Reported no discharge from 2001 to Present** Reported no discharge for the life of the facility*** Reported either total retention or no discharge
Daily loadings for each NPDES permit holder can be found in each TMDL watershed where the facility is located (Appendix DD-JJ).

65
Non-Point Sources Agricultural Runoff Sediment and nutrient loadings from agricultural runoff was calculated by the AnnAGNPS model using different land use scenarios. Agricultural runoff was also taken into account when the AGNPS model was used to perform ratings on the feedlots in the study area. This information was then incorporated in the process of prioritizing watershed areas for fecal reduction. Background Wildlife Contribution The average contribution from deer is 16.5 percent, watershed wide (Table 39). The 16.5 percent will be used as an average when assessing each monitoring site. This number assumes a 100 percent contribution of fecal coliform bacteria is delivered into the receiving waters. Therefore, due to its unrealistic 100 percent delivery only for deer, it will represent all wildlife contributions in this watershed for this project. Table 39. Wildlife Contribution of Fecal Coliform Bacteria
Site Deer/Sq. Mile Sq. Miles Deer Days CFU's/deer/day CFU's Total CFU's % deerT36 4.56 32 146 306 5.00E+08 2.23E+13 3.04E+14 7.3T37 4.81 35.9 173 269 5.00E+08 2.32E+13 1.28E+15 1.8T41 4.81 52.9 254 210 5.00E+08 2.67E+13 1.03E+14 25.9T42 5.06 36 182 194 5.00E+08 1.77E+13 4.19E+13 42.2T46 3.41 35.1 120 278 5.00E+08 1.66E+13 3.31E+14 5.0
Average 16.5
Wildlife Background CFU's
Failing Septic Systems Contribution The calculated contribution from failing septic systems is 25.6 percent, watershed wide (Table 40). The 25.6 percent will be used as an average when assessing each monitoring site. However, this percentage is very high because it assumes that all failing rural septic systems are reaching the receiving waters. The number of onsite septic systems in the study area is unknown. However, according to the US EPA (2002a) failure rates of onsite septic systems range from 10 to 20 percent, with a majority of these failures occurring with systems 30 or more years old. Until there is better factual data on the conditions of the rural septic systems in this study area, the 25.6 percent average was used. Although, assumptions that only a small percentage of this number (25.6 percent) is actual failing septic systems may be warranted in circumstances where livestock situations are clearly the predominant factor in the fecal coliform bacteria loadings. Table 40. Failing Septic System Contribution of Fecal Coliform Bacteria
Site People/household # households 20% people Days CFU's/person/day CFU's Total CFU's % peopleT36 2.5 113 22.6 57 306 2.00E+09 3.46E+13 3.04E+14 11.4T37 2.5 86 17.2 43 269 2.00E+09 2.31E+13 1.28E+15 1.8T41 2.5 344 68.8 172 210 2.00E+09 7.22E+13 1.03E+14 70.1T42 2.5 65 13 33 194 2.00E+09 1.26E+13 4.19E+13 30.1T46 2.5 176 35.2 88 278 2.00E+09 4.89E+13 3.31E+14 14.8
Average 25.6
Failing Septic Contribution

66
Modeling
FLUX Modeling The FLUX Model (Army Corps of Engineers Loading Model) was used to estimate the nutrient loadings for each site. Annual loads from the project period and their standard errors (CV) are presented in Appendix P. Data collected during this project, an earlier project (CBSRWAP), as well as by the United States Geological Survey (USGS) were utilized in the calculation of the loads and concentrations. Results from the FLUX model were also used to find the percent reduction in TSS for each monitoring location (Appendix BB).
AGNPS Feedlot Model The Brookings County Conservation District evaluated 371 animal feeding operations within the North-Central BSR watershed. The AGNPS model ranked the feedlots on a scale from 0 to 100 with larger numbers indicating a greater potential to pollute nearby surface waters. Of the feedlots evaluated, the AGNPS model rated 147 of the animal feeding operations ≥ 50. Outputs from the model also include total phosphorus, total nitrogen, and chemical oxygen demand (Appendix CC).
AnnAGNPS Modeling The AnnAGNPS Model was setup to compare sediment, nitrogen, and phosphorus loadings from the watershed (502,894 acre drainage area) for 1-year, 10-year, and 25-year simulated periods. Several landuse scenarios were modeled which included 1) present condition, 2) changing cropland (corn and soybeans) to grass, 3) removing the feedlots, 4) removing any impoundments, and 5) changing cropping practices to no-tillage. Due to the size of the watershed, the area was delineated into three watersheds, Estelline-South, Castlewood to Estelline, and Castlewood-North. Tables 41, 42, and 43 show the results of these scenarios during 1-year, 10-year, and 25-year simulated periods, respectively. The percent differences and indicators of increasing or decreasing differences are at the bottom of each table using equation ((larger number – smaller number) ÷ larger number) × 100 to find percent difference or (smaller number ÷ larger number) then minus from one and multiply by 100. As indicated by all three tables, feedlots in the watershed are not having as great as an affect on sediment and nutrients as the agricultural practices. During the 1-year simulated period, removal of all feedlots reduced nutrient loading from 3 to 4 percent in the Castlewood North area and had a negligible affect to the Castlewood to Estelline and the Estelline South areas. Changes in cropping practices to conservative tillage resulted in a 9 percent and 11 percent reduction in nitrogen and phosphorus loading, respectively. No-tillage practices have the greatest affect on attached nitrogen and attached phosphorus reductions (Table 41). A 25 percent reduction in sediment loads were estimated for the Castlewood to Estelline and the Estelline South areas when no-tillage practices were applied. Removing row cropping virtually eliminates any sediment problems; however, this would not be a feasible option. During the 10-year simulated period (Table 42), feedlot removal exhibited the greatest reduction in nutrients for the Castlewood North area, but in contrast had the least affect on the Estelline South area. No tillage application had the same affect on nutrients throughout the entire North Central Big Sioux River Watershed constituting a 16 percent and 20 percent reduction in nitrogen and phosphorus, respectively.

67
During the 25-year simulated period (Table 43), reductions in sediment and nutrients were significantly less than what was exhibited during the 10-year period with the removal of feedlots or when no-tillage practices were applied. Areas of the watershed are more defined in regards to the load reductions of nutrients and sediment in the applicable TMDL reports located in Appendices DD through JJ. It should be noted that the water quality of the North Central Big Sioux River Watershed did not exhibit problems with total suspended solids.

68
Table 41. AnnAGNPS Output for a 1-Year Simulated Period
ScenerioSediment Load (tons/acre/year)
Nitrogen Load (unit area)
(lbs/acre/yr)
Attached Nitrogen
Load (lbs/acre/yr)
Dissolved Nitrogen
Load (lbs/acre/yr)
Total Phosphorus
Load (unit area) (lbs/acre/yr)
Attached Phosphorus
Load (lbs/acre/yr)
Dissolved Phosphorus
Load (lbs/acre/yr)
Present Condition 0.0000 0.319 0.157 0.162 0.065 0.022 0.042All Grass 0.0000 0.210 0.131 0.079 0.030 0.014 0.016No Feedlots 0.0000 0.308 0.151 0.156 0.063 0.022 0.041No Impoundments 0.0152 0.587 0.362 0.225 0.092 0.040 0.053No Tillage 0.0000 0.306 0.106 0.200 0.056 0.014 0.042
All Grass 0 34 17 51 54 36 62No Feedlots 0 3 4 4 3 0 2No Impoundments 100 46 57 28 29 45 21No Tillage 0 9 42 9 11 47 0
ScenerioSediment Load (tons/acre/year)
Nitrogen Load (unit area)
(lbs/acre/yr)
Attached Nitrogen
Load (lbs/acre/yr)
Dissolved Nitrogen
Load (lbs/acre/yr)
Total Phosphorus
Load (unit area) (lbs/acre/yr)
Attached Phosphorus
Load (lbs/acre/yr)
Dissolved Phosphorus
Load (lbs/acre/yr)
Present Condition 0.0167 0.726 0.394 0.332 0.135 0.053 0.083All Grass 0.0000 0.085 0.041 0.044 0.016 0.006 0.009No Feedlots 0.0167 0.723 0.393 0.330 0.135 0.053 0.082No Impoundments 0.0175 0.743 0.404 0.339 0.143 0.054 0.089No Tillage 0.0062 0.546 0.174 0.372 0.110 0.022 0.088
All Grass 100 88 90 87 88 89 89No Feedlots 0 0 0 1 0 0 1No Impoundments 5 2 2 2 6 2 7No Tillage 25 9 42 9 11 47 6
ScenerioSediment Load (tons/acre/year)
Nitrogen Load (unit area)
(lbs/acre/yr)
Attached Nitrogen
Load (lbs/acre/yr)
Dissolved Nitrogen
Load (lbs/acre/yr)
Total Phosphorus
Load (unit area) (lbs/acre/yr)
Attached Phosphorus
Load (lbs/acre/yr)
Dissolved Phosphorus
Load (lbs/acre/yr)
Present Condition 0.0072 0.915 0.452 0.464 0.252 0.056 0.195All Grass 0.0000 0.205 0.059 0.146 0.059 0.008 0.050No Feedlots 0.0072 0.912 0.450 0.462 0.251 0.056 0.195No Impoundments 0.0098 1.032 0.521 0.510 0.331 0.066 0.265No Tillage 0.0032 0.777 0.230 0.547 0.230 0.026 0.204
All Grass 100 78 87 69 77 86 74No Feedlots 0 0 0 0 0 0 0No Impoundments 27 11 13 9 24 15 26No Tillage 25 9 42 9 11 47 4
Estelline South Watershed - 1 Year Simulation Period
Percent Difference from Present Condition
Castlewood North Watershed - 1 Year Simulation Period
Percent Difference from Present Condition
Castlewood to Estelline Watershed - 1 Year Simulation Period
Percent Difference from Present Condition

69
Table 42. AnnAGNPS Output for a 10-Year Simulated Period
ScenerioSediment Load (tons/acre/year)
Nitrogen Load (unit area)
(lbs/acre/yr)
Attached Nitrogen
Load (lbs/acre/yr)
Dissolved Nitrogen
Load (lbs/acre/yr)
Total Phosphorus
Load (unit area) (lbs/acre/yr)
Attached Phosphorus
Load (lbs/acre/yr)
Dissolved Phosphorus
Load (lbs/acre/yr)
Present Condition 0.0000 0.346 0.203 0.143 0.163 0.050 0.113All Grass 0.0000 0.187 0.084 0.103 0.078 0.017 0.061No Feedlots 0.0000 0.307 0.176 0.131 0.157 0.047 0.110No Impoundments 0.0192 0.631 0.428 0.203 0.179 0.057 0.122No Tillage 0.0000 0.295 0.124 0.171 0.122 0.023 0.100
All Grass 0 46 59 28 52 66 46No Feedlots 0 11 13 8 4 6 3No Impoundments 100 45 53 30 9 12 7No Tillage 0 16 40 13 20 58 10
ScenerioSediment Load (tons/acre/year)
Nitrogen Load (unit area)
(lbs/acre/yr)
Attached Nitrogen
Load (lb/acre/yr)
Dissolved Nitrogen
Load (lb/acre/yr)
Total Phosphorus
Load (unit area) (lb/acre/yr)
Attached Phosphorus
Load (lbs/acre/yr)
Dissolved Phosphorus
Load (lbs/acre/yr)
Present Condition 0.0000 0.298 0.200 0.097 0.233 0.069 0.165All Grass 0.0000 0.095 0.040 0.055 0.078 0.010 0.069No Feedlots 0.0000 0.265 0.175 0.090 0.229 0.066 0.163No Impoundments 0.0221 0.617 0.474 0.143 0.274 0.085 0.189No Tillage 0.0000 0.252 0.129 0.123 0.179 0.031 0.148
All Grass 0 68 80 43 67 86 58No Feedlots 0 11 13 7 2 4 1No Impoundments 100 52 58 32 15 19 13No Tillage 0 16 40 13 20 58 10
ScenerioSediment Load (tons/acre/year)
Nitrogen Load (unit area)
(lbs/acre/yr)
Attached Nitrogen
Load (lbs/acre/yr)
Dissolved Nitrogen
Load (lbs/acre/yr)
Total Phosphorus
Load (unit area) (lbs/acre/yr)
Attached Phosphorus
Load (lbs/acre/yr)
Dissolved Phosphorus
Load (lbs/acre/yr)
Present Condition 0.0000 0.638 0.328 0.310 0.405 0.079 0.325All Grass 0.0000 0.305 0.070 0.235 0.190 0.012 0.178No Feedlots 0.0000 0.614 0.311 0.303 0.401 0.078 0.323No Impoundments 0.0147 1.200 0.765 0.435 0.532 0.114 0.418No Tillage 0.0000 0.577 0.218 0.359 0.340 0.039 0.301
All Grass 0 52 79 24 53 85 45No Feedlots 0 4 5 2 1 1 1No Impoundments 100 47 57 29 24 31 22No Tillage 0 16 40 13 20 58 10
Estelline South Watershed - 10 Year Simulation Period
Percent Difference from Present Condition
Castlewood North Watershed - 10 Year Simulation Period
Percent Difference from Present Condition
Castlewood to Estelline Watershed - 10 Year Simulation Period
Percent Difference from Present Condition

70
Table 43. AnnAGNPS Output for a 25-Year Simulated Period
ScenerioSediment Load (tons/acre/year)
Nitrogen Load (unit area)
(lbs/acre/yr)
Attached Nitrogen
Load (lbs/acre/yr)
Dissolved Nitrogen
Load (lbs/acre/yr)
Total Phosphorus
Load (unit area) (lbs/acre/yr)
Attached Phosphorus
Load (lbs/acre/yr)
Dissolved Phosphorus
Load (lbs/acre/yr)
Present Condition 0.0000 0.288 0.161 0.127 0.209 0.045 0.164All Grass 0.0000 0.147 0.058 0.089 0.103 0.013 0.090No Feedlots 0.0000 0.256 0.139 0.117 0.205 0.043 0.162No Impoundments 0.0148 0.511 0.334 0.177 0.223 0.050 0.174No Tillage 0.0000 0.253 0.101 0.152 0.175 0.021 0.154
All Grass 0 49 64 30 51 71 45No Feedlots 0 11 14 8 2 4 1No Impoundments 100 44 52 28 6 10 6No Tillage 0 13 40 17 12 58 5
ScenerioSediment Load (tons/acre/year)
Nitrogen Load (unit area)
(lbs/acre/yr)
Attached Nitrogen
Load (lbs/acre/yr)
Dissolved Nitrogen
Load (lbs/acre/yr)
Total Phosphorus
Load (unit area) (lbs/acre/yr)
Attached Phosphorus
Load (lbs/acre/yr)
Dissolved Phosphorus
Load (lbs/acre/yr)
Present Condition 0.0000 0.236 0.155 0.081 0.291 0.064 0.228All Grass 0.0000 0.072 0.027 0.044 0.111 0.008 0.103No Feedlots 0.0000 0.210 0.135 0.075 0.288 0.062 0.226No Impoundments 0.0170 0.496 0.376 0.120 0.328 0.075 0.253No Tillage 0.0000 0.210 0.103 0.107 0.250 0.029 0.220
All Grass 0 69 83 46 62 88 55No Feedlots 0 11 13 7 1 3 1No Impoundments 100 52 59 33 11 15 10No Tillage 0 13 40 17 12 58 5
ScenerioSediment Load (tons/acre/year)
Nitrogen Load (unit area)
(lbs/acre/yr)
Attached Nitrogen
Load (lbs/acre/yr)
Dissolved Nitrogen
Load (lbs/acre/yr)
Total Phosphorus
Load (unit area) (lbs/acre/yr)
Attached Phosphorus
Load (lbs/acre/yr)
Dissolved Phosphorus
Load (lbs/acre/yr)
Present Condition 0.0000 0.519 0.256 0.264 0.466 0.069 0.397All Grass 0.0000 0.243 0.051 0.192 0.242 0.010 0.231No Feedlots 0.0000 0.500 0.242 0.258 0.464 0.068 0.395No Impoundments 0.0115 0.963 0.594 0.369 0.592 0.095 0.497No Tillage 0.0000 0.488 0.173 0.314 0.421 0.035 0.385
All Grass 0 53 80 27 48 86 42No Feedlots 0 4 5 2 0 1 1No Impoundments 100 46 57 28 21 27 20No Tillage 0 13 40 17 12 58 5
Estelline South Watershed - 25 Year Simulation Period
Percent Difference from Present Condition
Castlewood North Watershed - 25 Year Simulation Period
Percent Difference from Present Condition
Castlewood to Estelline Watershed - 25 Year Simulation Period
Percent Difference from Present Condition

71
Approximately 54,395 acres in the Castlewood North area, 107,756 acres in the Castlewood to Estelline area, and 94,224 acres in the Estelline South area were converted from cropland to grassland to run the ‘all grass’ scenario. Sediment loading only showed a marked decrease during the 1-year simulation period when cropland was converted to grassland, and no-tillage practices were applied. However, there were decreases in phosphorus loads during all three scenarios (Table 44).
Table 44. Phosphorus Reduction Results After Converting Cropland to Grassland
1-Year 10-Year 25-YearCastlewood North 0.035 0.085 0.106
Castlewood to Estelline 0.119 0.155 0.180
Estelline South 0.193 0.215 0.224
Conversion of Crops to GrasslandPhosphorus Results
(lbs/acre/year reductions)
Approximately 2,994 acres of impoundments (10 acres or larger) in the Castlewood North area, 1,885 acres of impoundments (10 acres or larger) in the Castlewood to Estelline area, and 6,318 acres of impoundments (10 acres or larger) in the Estelline South area were removed to run the ‘no impoundments’ scenario. The removal of the impoundments caused increases in nitrogen and phosphorus loadings in all three scenarios. This demonstrates the importance of impoundments in filtering out nutrients. Approximately 73 percent of the total watershed area (367,113 acres) is in agricultural cropland. Converting all agricultural cropping practices to no-tillage (no-till planter and no-till drill) achieved sediment reductions during the 1-year simulated period. The 1-year simulated period showed a 25 percent difference in sediment in the Castlewood to Estelline area and the Estelline South area (Table 41). Decreases in nutrients (9-20% load, 40-58% attached, and 4-17% dissolved) could be achieved if more no-tillage practices were implemented in all three watershed areas.

72
ANALYSIS AND SUMMARY SUMMARY OF POLLUTANT LOADINGS The large watershed area involved (approximately 500,000 acres) necessitated the division of the watershed into smaller sub-watersheds for analysis (Figure 29). The sections are (1) “Castlewood North” - the Town of Castlewood to the northern most end of the watershed (126,321 acres), (2) “Castlewood to Estelline” - the City of Castlewood to the Town of Estelline (193,530 acres), and (3) “Estelline South” - the Town of Estelline to the southern most end of the watershed (183,043 acres). Landuse, water quality, biological and physical aspects, and source linkage were compiled and presented in this section for each watershed area. A separate assessment report has been completed for the Oakwood chain of lakes located in the ‘Estelline South’ watershed area. Additionally, a separate watershed assessment was completed in 2005 for the chain of lakes (Wigdale Lake, School Lake, Bullhead Lake, and Round Lake) in the Castlewood North area in northwest Deuel County.
Castlewood North
Castlewood to Estelline
Estelline South
Town
County Boundary
Big Sioux River
Watershed Boundary
Major TributaryMonitoring Site
Willow Ck
Stra
y Ho
rse
Ck
Hidewood Ck
Peg Munky Run
GrantCounty
DeuelCounty
BrookingsCounty
HamlinCounty
CodingtonCounty
Figure 29. The Three Major Watersheds of the North-Central Study Area

73
Castlewood North This map (Figure 30) shows the location of the area designated as the Castlewood North area.
CodingtonCounty Deuel
County
HamlinCounty
BrookingsCounty
GrantCounty
Watertown
Mud Ck
Willow CkT36
T35
R17R16
R15
R14
R18
T34
Castlewood
Big
Siou
x Rive
rLake
Kampeska
Pelican Lk
Town
Big Sioux River
Watershed Boundary
Major Tributary
Project WQ Site
Ambient WQ Site
Figure 30. Castlewood North Location Map Land Use This area includes the Lake Pelican Weir (Site T34), Willow Creek (Sites T35 and T36), and the Big Sioux River monitoring sites R16, R17, and R18. The Big Sioux River Sites R14 and R15 will also be included in this analysis section. AnnAGNPS modeling was completed on this area during the Upper Big Sioux River Watershed Assessment completed in March 2002. The watersheds of School Lake, Bullhead Lake, Round Lake, and Wigdale Lake, in northwestern Deuel County and part of Grant County, are also located in this region. A separate watershed assessment was completed on these four lakes in 2005.

74
Willow Creek drains this chain of lakes and enters the Big Sioux River south of the City of Watertown. Specific lake related data can be found in the School Lake Watershed Assessment Report. The Castlewood North area is located in the Northern Glaciated Plains and encompasses approximately 126,321 acres. Land use in this area is predominantly agricultural (Figure 31). Approximately 68 percent of the area is cropland, such as corn and soybeans, and 28 percent is grassland and pastureland. There are 81 animal feeding operations in this area, with approximately 99 percent of the livestock consisting of cattle (Figure 32. There are four NPDES permitted facilities identified in this portion of the North-Central watershed which includes the City of Watertown, Northern Con-Agg, Inc., Oak Valley Farms, and the Dakota Sioux Casino. However, Northern Con-Ag, Inc. and the Dakota Sioux Casino are not located directly within the designated watershed (Tables 37 and 38).
Castlewood North Landuse
Building or
Farmstead2%
Water2%
Rangeland or Pastureland
28%
Cropland68%
Figure 31. Castlewood North Area Landuse
0
20
40
60
80
100
Perc
enta
ge
Cattle Hogs
Castlewood North Watershed Livestock
Figure 32. Castlewood North Watershed Livestock

75
Water Quality Summary Beneficial uses for river Sites R14, R15, R16, R17, and R18 are 1, 5, 8, 9, and 10. Willow Creek (Sites T35 and T36) is assigned beneficial uses 6, 8, 9, and 10 and the Lake Pelican Weir (T34) is assigned beneficial uses 9 and 10. Table 45 is a summary of the beneficial uses classes assigned to each monitoring site and whether they are meeting or not meeting water quality criteria. (1) Domestic Water Supply
(5) Warmwater Semi-permanent Fish Life Propagation (6) Warmwater Marginal Fish Life Propagation (8) Limited Contact Recreation (9) Fish and Wildlife Propagation, Recreation and Stock Watering (10) Irrigation
Table 45. Summary of Beneficial Use Class by Site
Site (1) (5) (6) (8) (9) (10)R14 - ×R15 -R16 - ×R17 - ×R18 - ×T34 - - - -T35 - - × ×T36 - - ×
-×
meetingnot applicablenot meeting
Beneficial Use Class
Based on the results from the water quality criteria established by DENR as described in the Results Section under Water Quality Monitoring, all the river sites (R14, R15, R16, R17, and R18) are meeting the water quality criteria for beneficial uses (1) Domestic Water Supply, (5) Warmwater Semi-permanent Fish Life Propagation, (9) Fish and Wildlife Propagation, Recreation and Stock Watering, and (10) Irrigation (Figures 33 and 34). Tributary Sites T34, T35 and T36 are meeting the water quality criteria for beneficial uses (9) and (10). For beneficial use (6) Warmwater Marginal Fish Life Propagation, Sites T35 and T36 are meeting the criteria as described in the 303(d) waterbody listing for water temperature, TSS, pH, and total ammonia as nitrogen. Site T36 meets the water quality criteria for dissolved oxygen, but T35 does not (Figure 35). For beneficial use (8) Limited Contact Recreation, all sites, except T35, meet the water quality criteria for dissolved oxygen. Site R15 is the only site meeting the water quality criteria for fecal coliform bacteria, all other sites (T35, T36, R14, R16, R17, and R18) are not meeting. The numeric criteria for fecal coliform bacteria is ≤ 2000 cfu/100mL and for dissolved oxygen it is ≥ 5 mg/L.

76
Fecal Coliform Bacteria Results
Lake Kampeska to Willow Creek Segment
0102030405060708090
100
R14 R15 R16
Site
Feca
l % E
xcee
denc
e at
Sta
ndar
d
at Standard 2000
Figure 33. Fecal Coliform Bacteria Percent Exceedence at Standard ≤ 2000 cfu/100mL for the Lake Kampeska to Willow Creek Segment of the Big Sioux River
Willow Creek to Stray Horse Creek Segment
0
20
40
60
80
100
R17 R18
Site
Feca
l % E
xcee
denc
e at
Sta
ndar
d
at Standard 2000
Figure 34. Fecal Coliform Bacteria Percent Exceedence at Standard ≤ 2000 cfu/100mL in
the Willow Creek to Stray Horse Creek Segment of the Big Sioux River

77
Willow Creek
010
2030
4050
6070
8090
100
T35 T36
Site
Feca
l % E
xcee
denc
e at
Sta
ndar
d
at Standard 2000
Figure 35. Fecal Coliform Bacteria Percent Exceedence at Standard ≤ 2000 cfu/100mL in Willow Creek
The average discharge and seasonal grab sample data were used to develop the graphs shown in Figure 36. Graphs showing the monitored loadings and the allowable target loads within each of the five hydrologic conditions at the ≤ 2000 cfu/100mL water quality standard are found in Figure 36. Scatterplots of the fecal coliform bacteria grab samples are shown in Figure 37.
Castlewood North Area
Lake Kampeska to Willow Creek SegmentFecal Coliform Bacteria Loading
110
1001000
10000100000
High Moist Mid-Range
Dry Low
Hydrologic Condition
Bill
ions
of
Col
onie
s pe
r D
ay
Target Load
Willow Creek to Stray Horse Creek Segment Fecal Coliform Bacteria Loading
110
1001000
10000100000
High Moist Mid-Range
Dry Low
Hydrologic Condition
Bill
ions
of
Col
onie
s pe
r Day
Target Load
Willow Creek Fecal Coliform Bacteria Loading
110
1001000
10000100000
High Moist Mid-Range
Dry Low
Hydrologic Condition
Bill
ions
of
Col
onie
s pe
r Day
Target Load
Figure 36. Fecal Coliform Bacteria in Billions of Colonies per Day Monitored vs the Standard in the
Castlewood North Area

78
Figure 37. Scatterplots of Fecal Coliform Bacteria Grab Samples for River Sites (R14-R18) and Willow Creek (T35 and T36)
Lk Kampeska to Willow Creek SegmentFecal Coliform Bacteria Grab Samples
110
1001000
10000100000
Apr-0
1Aug
-01Dec
-01Mar
-02
Jul-0
2Nov
-02Mar
-03
Jul-0
3Oct-
03Feb
-04
Jun-0
4Oct-
04
Date
cfu/
100m
L
R14R15R16Standard
Willow Creek to Stray Horse Creek SegmentFecal Coliform Bacteria Grab Samples
110
1001000
10000100000
1000000
Apr-0
1Aug
-01Dec
-01Mar
-02
Jul-0
2Nov
-02Mar
-03
Jul-0
3Oct-
03Feb
-04
Jun-0
4Oct-
04
Date
cfu/
100m
L
StandardR17R18
Willow Creek - Fecal Coliform Bacteria Grab Samples
110
1001000
10000100000
1000000
Apr-01
Jun-0
1Aug
-01
Oct-01
Dec-0
1Fe
b-02
Apr-02
Jun-0
2Aug
-02
Oct-02
Date
cfu/
100m
L
T35T36Standard

79
Figure 38 shows the fecal coliform bacteria grab samples for the Lake Pelican Weir (T34). Although the Lake Pelican Weir is not assigned a numeric standard for fecal coliform bacteria, this graph shows the amount flowing into and out of the lake.
* Numeric Standard does not apply
* Lake Pelican WeirFecal Coliform Bacteria Grab Samples
110
1001000
10000
Apr-01
Jun-0
1
Aug-01
Oct-01
Dec-01
Feb-02
Apr-02
Jun-0
2
Aug-02
Oct-02
Date
cfu/
100m
L
Into Lk Out of Lk Standard
Figure 38. Scatterplots of Fecal Coliform Bacteria Grab Samples for the Lake Pelican
Weir (T34) Trends in fecal coliform bacteria are shown in Figures 39 and 40. SD DENR ambient grab sample data for R14 (WQM55) and R17 (WQM1) was used to construct these figures. The seasonal (May through Sept) medians for each year, from 1980 to 2004, were calculated. The statistical significance of a trend was determined to occur at an R2 value of 0.25 or greater, due to the large sample size of 25 years of data. Figure 39 does not show trend in fecal coliform bacteria, R2 = 0.1636, for monitoring Site R14. This area is not meeting the water quality criteria for fecal coliform bacteria and should be monitored for trends over the next several years.
R14 Fecal Coliform Bacteria
Seasonal Median Trend
R2 = 0.1636
0200400600800
1000
1980
1982
1984
1986
1988
1990
1992
1994
1996
1998
2000
2002
2004
Year
Seas
onal
Med
ian
(cfu
/100
mL)
Figure 39. 25-Year Trend (1980-2004) of Yearly Seasonal Medians of Fecal Coliform Bacteria at R14

80
Figure 40 shows no significant trend for fecal coliform bacteria, R2 = 0.0048, at monitoring Site R17. This area is not meeting the water quality criteria for fecal coliform bacteria.
R17 Fecal Coliform Bacteria Seasonal Median Trend
R2 = 0.0048
0
500
1000
1500
1980
1982
1984
1986
1988
1990
1992
1994
1996
1998
2000
2002
2004
Year
Seas
onal
Med
ian
(cfu
/100
mL)
Figure 40. 25-Year Trend (1980-2004) of Yearly Seasonal Medians of Fecal Coliform
Bacteria at R17 Total Suspended Solids Results Of the sites assigned a numeric standard for TSS, there was only one exceedence of 314 mg/L which occurred at R18. Based on FLUX model results, Figure 41 shows the estimated TSS loadings for the Big Sioux River sites (R14, R15, R16, R17, and R18) and the Willow Creek sites (T35 and T36) as compared to the allowable load of ≤ 158 mg/L for the river sites and ≤ 263 mg/L for Willow Creek.
TSS Load - Lake Kampeska to Willow Creek
1
10
100
1000
R14 R15 R16
Site
KG
in H
undr
eds
of
Thou
sand
s
Monitored to meet Standard 158mg/L
TSS Load -Willow Creek to Stray Horse Creek
1
10
100
1000
R17 R18
Site
KG
in H
undr
eds
of
Thou
sand
s
Monitored to meet Standard 158mg/L
TSS Load -Willow Creek
0.1
1
10
100
T35 T36
Site
KG
in H
undr
eds
of
Thou
sand
s
Monitored to meet Standard 263mg/L
Figure 41. TSS in kg Monitored vs the Standard in the Castlewood North Area

81
Scatterplots of the TSS grab samples are shown in Figure 42.
Willow Creek TSS Grab Samples
110
1001000
Apr-01
Jun-0
1Aug
-01Oct-
01Dec
-01Feb
-02Apr-
02Ju
n-02
Aug-02
Oct-02
Date
cfu/
100m
L
T35 T36 Standard
Lk Kampeska to Willow Creek SegmentTSS Grab Samples
1
10
100
1000
Apr-01
Jun-0
1Aug
-01Oct-
01Dec
-01Feb
-02Apr-
02Ju
n-02
Aug-02
Oct-02
Date
cfu/
100m
L
R14 R15 R16 Standard
Willow Creek to Stray Horse Creek SegmentTSS Grab Samples
110
1001000
Apr-01
Jun-0
1Aug
-01Oct-
01Dec
-01Feb
-02Apr-
02Ju
n-02
Aug-02
Oct-02
Date
cfu/
100m
L
Standard R17 R18
Figure 42. Scatterplots of TSS Grab Samples for River Sites (R14-R18) and Willow Creek (T35 and T36)

82
Figure 43 shows the TSS grab samples for the Lake Pelican Weir (T34). Although the Lake Pelican Weir is not assigned a numeric standard for TSS, this graph shows the amount going into and coming out of the lake.
* Numeric Standard does not apply
* Lake Pelican WeirTSS Grab Samples
110
1001000
Apr-01
Jun-0
1
Aug-01
Oct-01
Dec-01
Feb-02
Apr-02
Jun-0
2
Aug-02
Oct-02
Date
cfu/
100m
L
Standard Into Lk Out of Lk
Figure 43. Scatterplot of TSS Grab Samples for the Lake Pelican Weir (T34)
Data Summary The following table (Table 46) summarizes the ranges of fecal coliform bacteria cfu/100mL, TSS mg/L, and the percent exceedences. It also shows the summer mean of total PO4 mg/L for each river monitoring site. Table 46. Ranges and Percent Exceedences of Fecal Coliform Bacteria, TSS, and Summer
Means of Total PO4 in the Castlewood North Area Site Fecal
cfu/100mL % fecal
exceedence TSS mg/L
% TSS exceedence
Summer Mean Total PO4
mg/L R14 nd-31,000 21% 4-87 0% 0.202 R15 40-8,000 10% 8-53 0% 0.186 R16 90-10,000 14% 7-59 0% 1.433 R17 10-33,000 14% 1-141 0% 0.772 R18 70-410,000 48% 5-314 6% 0.718 T34 nd-8,000 NA 6-40 NA 0.154 T35 110-930,000 33% 2-56 0% 0.445 T36 230-110,000 40% 5-202 0% 0.319
The summer mean concentrations of total phosphorus at Sites R16, R17, R18, T35, and T36 exceed the NGP ecoregion mean of 0.25 mg/L (Fandrei et al. 1988). The summer mean concentrations of total phosphorus at Site R17 and Site R18 are three times greater than the ecoregion mean and Site R16 is almost six times greater. These higher numbers can be attributed to sources such as urban stormwater

83
runoff, livestock waste, streambank erosion, commercial fertilizers, construction site erosion, and/or urban stormwater runoff. Willow Creek is meeting water quality criteria for beneficial use (9) Fish and Wildlife Propagation, Recreation, and Stock Watering, and (10) Irrigation. However, for beneficial use (6) Warmwater Marginal Fish Life Propagation , and (8) Limited Contact Recreation, Willow Creek is not meeting water quality criteria for dissolved oxygen (≥ 5 mg/L) at Site T35 (Figure 44). Together, Site T35 and Site T36 are at 19 percent violation and is not within the numeric standards for this creek. Dissolved oxygen ranged from 3.2 mg/L to 19.3 mg/L. A scatterplot of the dissolved oxygen grab samples is shown in Figure 45.
Willow Creek
0102030405060708090
100
T35 T36
Site
DO
% E
xcee
denc
e at
St
anda
rd
at Standard > or = 5.0 mg/L Figure 44. Dissolved Oxygen Percent Exceedence at Standard ≥ 5 mg/L in Willow Creek
Willow Creek - Dissolved Oxygen Samples
0.0
5.0
10.0
15.0
20.0
Jan-01 Apr-01 Jul-01 Nov-01 Feb-02 May-02 Sep-02 Dec-02Date
mg/
L
T35 T36
DO must be = 5.0 mg/L to be within numeric standard
Figure 45. Scatterplot of Dissolved Oxygen Samples for Willow Creek

84
Biological and Physical Habitat Summary Fish and physical habitat measurements were not completed on any of the Big Sioux River mainstem sites. The only site surveyed for fish and physical habitat in the Castlewood North area was Site T36. Macroinvertebrates were collected at all the sites in this area. The following table summarizes the scores and suggested site impairment based on the macroinvertebrate data. Score sheets for each site can be found in Appendix L. Moderately impacted sites (R18, T34, and T36) had moderately high taxa richness; however, tolerant organisms dominated. Intolerant taxa such as Ephemeroptera and Trichoptera were found, but not in abundance. The most dominant organism at Site T36 was Chronomid Glyptotendipes sp. which is a highly tolerant filterer with a tolerance of 10. HBI’s ranged from 7.4 to 8.5. A more tolerant benthic community may indicate higher silt levels, lower flows, higher temperatures, and/or impaired habitat/substrate. River Sites R14, R15, R16, and R17 and tributary Site T35 suggest severe impairment with a significantly higher number of very tolerant species and HBI’s of 9.0 to 9.5. Abundant filamentous algae were present at Site R14. The most severely impaired site is R16 with an HBI of 9.5, the top two dominant taxa were Dicrotendipes sp. and Tubificidae, and no intolerant taxa present (Table 47). A highly tolerant benthic community may indicate organic pollution and/or excessive sedimentation. Fish and physical habitat were only assessed at Site T36. This site scored the lowest in both categories a compared with the other assessed sites in the NCBSRW. The most abundant fish species was the fathead minnow, which is indicative of a degraded stream. Physical habitat of this site lacked physical complexity, had poor bed substrate, and the immediate area was heavily grazed.
Table 47. Bugs, Fish, and Habitat Final Index Values and Suggested Impairment for the Sites in the Castlewood North Area
Source Linkage and Conclusion Fecal Coliform Bacteria Reductions and Sources Based on modeling and loading calculations, fecal coliform bacteria (Table 48) would need the following reductions at each site:
Site Macroinverts Fish Habitat Suggested Impairment (based on bug data)
R14 56 ----- ----- Severe R15 66 ----- ----- Severe R16 54 ----- ----- Severe R17 61 ----- ----- Severe R18 68 ----- ----- Moderate T34* 67 ----- ----- Moderate to Severe T35* 38 ----- ----- Severe T36 50 52 60 Moderate
----- not sampled * lake outlet

85
Table 48. Percent Fecal Coliform Bacteria Reduction in the Castlewood North Area
The monitoring data shows high fecal concentration during runoff events and at base flows. Potential non-background non-point sources of fecal coliform bacteria would be failing septic systems, pastured livestock, improper manure application, feedlot runoff, and urban runoff. According to the feedlot inventory, 36 of the 81 animal feeding operations in this area rated 50 or greater on a 0 to 100 scale. Higher ratings indicate a greater potential for the operation to pollute nearby surface waters. Livestock waste would contribute to the higher fecal counts during runoff events; whereas, livestock in the stream and failing septic systems contribute to the higher fecal counts during low flows. There are five known NPDES permitted facilities within the drainage area. Of these five, two were identified as point sources that discharged during the sampling period (Table 38). Their contributions were calculated and determined to be insignificant. Reductions of fecal coliform bacteria should focus on non-point sources (See Target Reductions and Future Activity Recommendations Section). .
Site Numeric Criteria
Fecal % Reduction *(Flow)
Event vs Base Flow
R14 ≤ 2000 0% NA R15 ≤ 2000 9% (H) Both R16 ≤ 2000 59% (H) Both R17 ≤ 2000 33% (H) Both R18 ≤ 2000 11% (MR), 16% (D) Both T34 ----- ----- NA T35 ≤ 2000 44% (MR), 100% (D) Both T36 ≤ 2000 77% (H), 77% (MR) Both
* Flow Ranges H=High Flows (0-10%) M=Moist Conditions (10-40%) MR=Mid-Range Flows (40-60%) D=Dry Conditions (60-90%) L=Low Flows (90-100%)

86
Castlewood to Estelline This map (Figure 46) shows the area and location designated as the Castlewood to Estelline area.
Codington County
GrantCounty
Hamlin County
DeuelCounty
BrookingsCounty
T39
T37
R19
T41
T40
Castlewood
Estelline
Clear Lake
Hidewood Ck
Stra
y H
orse
Ck
Big
Sioux R
Town
Big Sioux River
Watershed Boundary
Major Tributary
Project WQ Site
Ambient WQ Site
LakePoinsett
Figure 46. Castlewood to Estelline Location Map Land Use Summary This area includes the Lake Poinsett Outlet (Site T39), Stray Horse Creek (Site T37), Hidewood Creek (Sites T40 and T41), and the Big Sioux River Site R19. The Castlewood to Estelline area is located in the Northern Glaciated Plains and encompasses approximately 193,530 acres. Land use in this area is predominantly agricultural (Figure 47). Approximately 75 percent of the area is cropland, such as corn and soybeans, and 23 percent is grassland and pastureland. There are 145 animal feeding operations in this area, with approximately 94 percent of the livestock consisting of cattle (Figure 48). There are six NPDES permitted facilities located within this watershed (Table 37 and 38). They include the City of Castlewood, the City of Clear Lake, the Town of Kranzburg, the Lake Poinsett Sanitary District, and Technical Ordinance, Inc.

87
Castelwood to Estelline Landuse
Cropland75%
Rangland or Grassland
23%
Building or Farmstead
2%
Figure 47. Castlewood to Estelline Area Landuse
0
20
40
60
80
100
Perc
enta
ge
Cattle Sheep Hogs Horses
Castlewood to Estelline Watershed Livestock
Figure 48. Castlewood to Estelline Watershed Livestock
Water Quality Summary The beneficial uses assigned to Big Sioux River Site R19 are 1, 5, 8, 9, and 10. Stray Horse Creek (Site T37) and Hidewood Creek (Sites T40 and 41) are assigned beneficial uses 6, 8, 9, and 10, and the Lake Poinsett Outlet (T39) is assigned beneficial uses 9 and 10. Table 49 is a summary of the beneficial uses classes assigned to each monitoring site and whether they are meeting or not meeting water quality criteria.

88
(1) Domestic Water Supply (5) Warmwater Semi-permanent Fish Life Propagation (6) Warmwater Marginal Fish Life Propagation (8) Limited Contact Recreation (9) Fish and Wildlife Propagation, Recreation and Stock Watering (10) Irrigation
Table 49. Summary of Beneficial Use Class by Site
Site (1) (5) (6) (8) (9) (10)R19 -T37 - - ×T39 - - - -T40 - - × ×T41 - - ×
-×
Beneficial Use Class
meetingnot applicablenot meeting
Based on the results from the water quality criteria established by DENR as described in the Results Section under Water Quality Monitoring, river Site R19 is meeting all the water quality criteria for all its assigned beneficial uses (Figure 49). Tributary Sites T37, T39, T40, and T41 are meeting the water quality criteria for beneficial uses (9) and (10). For beneficial use (6) Warmwater Marginal Fish Life Propagation , Sites T37, T40, and T41 are meeting the criteria as described in the 303(d) waterbody listing for water temperature, TSS, pH, and total ammonia as nitrogen. Site T37 and T41 meet the water quality criteria for dissolved oxygen, but T40 does not. All tributary sites, except T40, meet the water quality criteria for dissolved oxygen under beneficial use (8) Limited Contact Recreation. Site T40 is the only tributary site meeting the water quality criteria for fecal coliform bacteria; all others (T37 and T41) are not meeting (Figures 50 and 51). The numeric criteria for fecal coliform bacteria is ≤ 2000 cfu/100mL and for dissolved oxygen it is ≥ 5 mg/L.

89
Fecal Coliform Bacteria Results
Stray Horse Creek to Near Volga Segment
0102030405060708090
100
R19 R20
Site
Feca
l % E
xcee
denc
e at
Sta
ndar
d
at Standard 2000
Figure 49. Fecal Coliform Bacteria Percent Exceedence at Standard ≤ 2000cfu/100mL in the Stray Horse Creek to Near Volga Segment of the Big Sioux River
Stray Horse Creek
0
10
20
30
40
50
60
70
80
90
100
T37
Site
Feca
l % E
xcee
denc
e at
Sta
ndar
d
at Standard 2000
Figure 50. Fecal Coliform Bacteria Percent Exceedence at Standard
≤ 2000cfu/100mL in Stray Horse Creek

90
Hidewood Creek
0102030405060708090
100
T40 T41
Site
Feca
l % E
xcee
denc
e at
St
anda
rd
at Standard 2000
Figure 51. Fecal Coliform Bacteria Percent Exceedence at Standard
≤ 2000cfu/100mL in Hidewood Creek

91
Graphs were constructed showing the monitored loadings and the allowable target loads of fecal coliform bacteria at the ≤ 2000 cfu/100mL water quality standard, within each of the five hydrologic conditions (Figure 52). Scatterplots of the fecal coliform bacteria grab samples are shown in Figure 53.
Castlewood to Estelline Area
Stray Horse Creek to Near Volga SegmentFecal Coliform Bacteria Loading
110
1001000
10000100000
High Moist Mid-Range
Dry Low
Hydrologic Condition
Bill
ions
of
Col
onie
s pe
r Day
Target Load
Stray Horse Creek Fecal Coliform Bacteria Loading
110
1001000
10000100000
High Moist Mid-Range
Dry Low
Hydrologic Condition
Bill
ions
of
Col
onie
s pe
r Day
Target Load
Hidewood Creek Fecal Coliform Bacteria Loading
110
1001000
10000
High Moist Mid-Range Dry Low
Hydrologic Condition
Bill
ions
of
Col
onie
s pe
r Day
Target Load
Figure 52. Fecal Coliform Bacteria in Billions of Colonies per Day Monitored vs the Standard in the Castlewood to Estelline Area
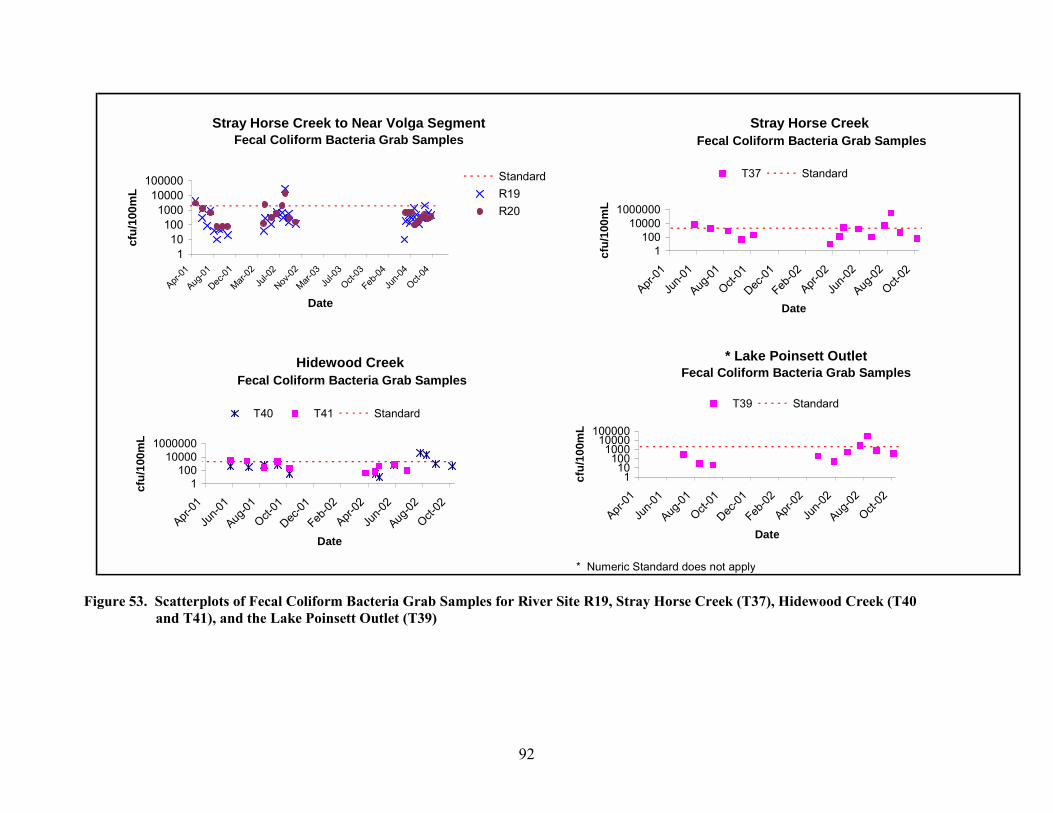
92
* Numeric Standard does not apply
Stray Horse Creek Fecal Coliform Bacteria Grab Samples
1100
100001000000
Apr-01
Jun-0
1Aug
-01Oct-
01Dec
-01Feb
-02Apr-
02Ju
n-02
Aug-02
Oct-02
Date
cfu/
100m
L
T37 Standard
Hidewood Creek Fecal Coliform Bacteria Grab Samples
1100
100001000000
Apr-01
Jun-0
1Aug
-01Oct-
01Dec
-01Feb
-02Apr-
02Ju
n-02
Aug-02
Oct-02
Date
cfu/
100m
L
T40 T41 Standard
* Lake Poinsett OutletFecal Coliform Bacteria Grab Samples
110
1001000
10000100000
Apr-01
Jun-0
1Aug
-01Oct-
01Dec
-01Feb
-02Apr-
02Ju
n-02
Aug-02
Oct-02
Date
cfu/
100m
L
T39 Standard
Stray Horse Creek to Near Volga SegmentFecal Coliform Bacteria Grab Samples
110
1001000
10000100000
Apr-01
Aug-01
Dec-01
Mar-02
Jul-0
2Nov
-02Mar-
03Ju
l-03
Oct-03
Feb-04
Jun-0
4Oct-
04
Date
cfu/
100m
L
StandardR19R20
Figure 53. Scatterplots of Fecal Coliform Bacteria Grab Samples for River Site R19, Stray Horse Creek (T37), Hidewood Creek (T40
and T41), and the Lake Poinsett Outlet (T39)

93
Total Suspended Solids Results A sample of 188 mg/L of TSS was collected at Site R19 and was the only violation of the TSS daily maximum standard of ≤ 158 mg/L in this watershed. Figure 54 shows the estimated TSS FLUX loadings for the Big Sioux River Site (R19), Stray Horse Creek (T37), and Hidewood Creek (T40 and T41) as compared to the allowable load of ≤ 158 mg/L for the river site and ≤ 263 mg/L for Stray Horse Creek and Hidewood Creek. Scatterplots of the TSS grab samples are shown in Figure 55.
TSS Load -Stray Horse Creek to Near Volga
1
10
100
1000
R19 R20
Site
KG
in H
undr
eds
of
Thou
sand
s
Monitored to meet Standard 158mg/L
TSS Load -Hidewood Creek
0.1
1
10
100
T40 T41
Site
KG
in H
undr
eds
of
Thou
sand
s
Monitored to meet Standard 263mg/L
TSS Load -Stray Horse Creek
1
10
100
T37
Site
KG
in H
undr
eds
of
Thou
sand
s
Monitored to meet Standard 263mg/L
Figure 54. TSS in kg Monitored vs the Standard in the Castlewood to Estelline Area

94
* Numeric Standard does not apply
Stray Horse Creek to Near Volga SegmentTSS Grab Samples
110
1001000
Apr-01
Jun-0
1Aug
-01Oct-
01Dec
-01Feb
-02Apr-
02Ju
n-02
Aug-02
Oct-02
Date
cfu/
100m
L
Standard R19 R20
Stray Horse CreekTSS Grab Samples
110
1001000
Apr-01
Jun-0
1Aug
-01Oct-
01Dec
-01Feb
-02Apr-
02Ju
n-02
Aug-02
Oct-02
Date
cfu/
100m
L
T37 Standard
Hidewood CreekTSS Grab Samples
110
1001000
Apr-01
Jun-0
1Aug
-01Oct-
01Dec
-01Feb
-02Apr-
02Ju
n-02
Aug-02
Oct-02
Date
cfu/
100m
L
T40 T41 Standard
* Lake Poinsett OutletTSS Grab Samples
110
1001000
Apr-01
Jun-0
1Aug
-01Oct-
01Dec
-01Feb
-02Apr-
02Ju
n-02
Aug-02
Oct-02
Date
cfu/
100m
L
T39 Standard
Figure 55. Scatterplots of TSS Grab Samples for the Stray Horse Creek to Near Volga Segment of the Big Sioux River, Stray Horse Creek, Hidewood Creek, and the Lake Poinsett Outlet
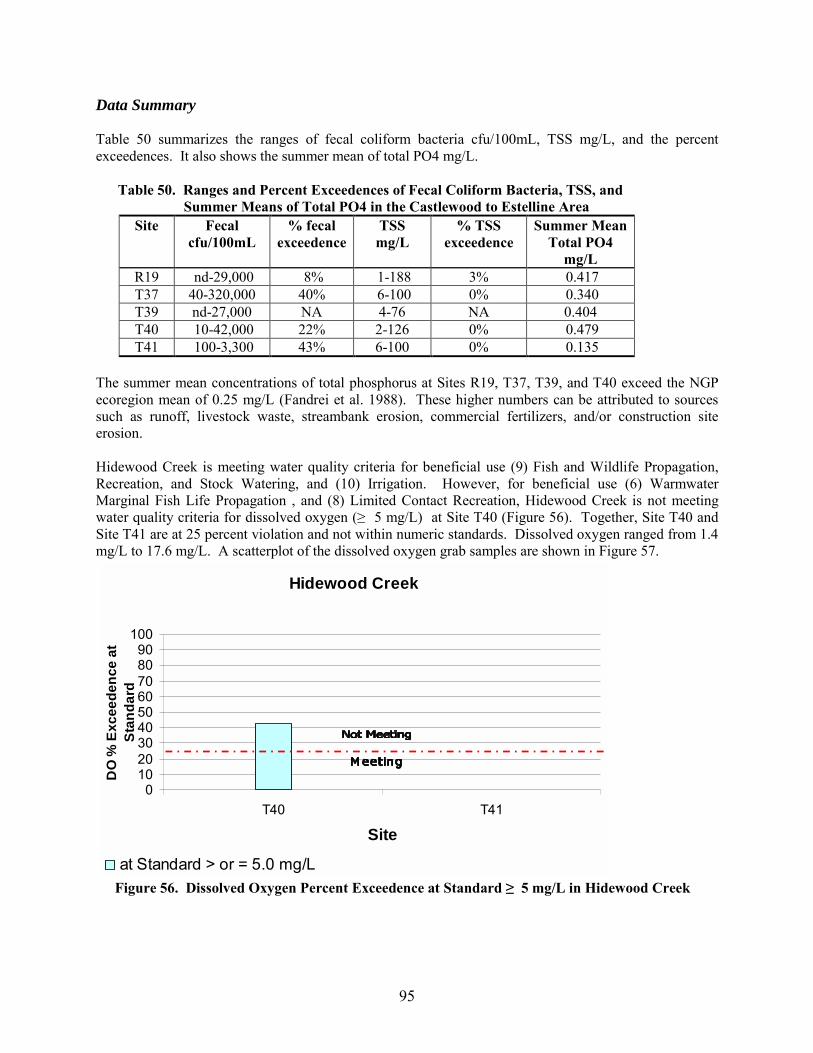
95
Data Summary Table 50 summarizes the ranges of fecal coliform bacteria cfu/100mL, TSS mg/L, and the percent exceedences. It also shows the summer mean of total PO4 mg/L. Table 50. Ranges and Percent Exceedences of Fecal Coliform Bacteria, TSS, and Summer Means of Total PO4 in the Castlewood to Estelline Area
Site Fecal cfu/100mL
% fecal exceedence
TSS mg/L
% TSS exceedence
Summer Mean Total PO4
mg/L R19 nd-29,000 8% 1-188 3% 0.417 T37 40-320,000 40% 6-100 0% 0.340 T39 nd-27,000 NA 4-76 NA 0.404 T40 10-42,000 22% 2-126 0% 0.479 T41 100-3,300 43% 6-100 0% 0.135
The summer mean concentrations of total phosphorus at Sites R19, T37, T39, and T40 exceed the NGP ecoregion mean of 0.25 mg/L (Fandrei et al. 1988). These higher numbers can be attributed to sources such as runoff, livestock waste, streambank erosion, commercial fertilizers, and/or construction site erosion. Hidewood Creek is meeting water quality criteria for beneficial use (9) Fish and Wildlife Propagation, Recreation, and Stock Watering, and (10) Irrigation. However, for beneficial use (6) Warmwater Marginal Fish Life Propagation , and (8) Limited Contact Recreation, Hidewood Creek is not meeting water quality criteria for dissolved oxygen (≥ 5 mg/L) at Site T40 (Figure 56). Together, Site T40 and Site T41 are at 25 percent violation and not within numeric standards. Dissolved oxygen ranged from 1.4 mg/L to 17.6 mg/L. A scatterplot of the dissolved oxygen grab samples are shown in Figure 57.
Hidewood Creek
0102030405060708090
100
T40 T41
Site
DO
% E
xcee
denc
e at
St
anda
rd
at Standard > or = 5.0 mg/L Figure 56. Dissolved Oxygen Percent Exceedence at Standard ≥ 5 mg/L in Hidewood Creek

96
Hidewood Creek - Dissolved Oxygen Samples
0.0
5.0
10.0
15.0
20.0
Apr-01 Jul-01 Nov-01 Feb-02 May-02 Sep-02 Dec-02Date
mg/
LT40 T41
DO must be ≥ 5.0 mg/L to be within numeric standard
Figure 57. Scatterplot of Dissolved Oxygen Samples for Hidewood Creek
Biological and Physical Habitat Summary The only sites surveyed for fish and physical habitat in the Castlewood to Estelline area were Site T37 and Site T41. Macroinvertebrates were collected at all the sites in this area, with the exception of Site T41, due to dry stream conditions. The following table (Table 51) summarizes the scores and suggested site impairment based on the macroinvertebrate data. Score sheets for each site can be found in Appendix L. Moderate to severely impacted sites (R19, T37, and T39) consisted mainly of tolerant organisms. Intolerant organisms were non-existent at Site R19. HBI scores ranged from 7.4 to 8.7. EPT richness and abundance measures were very low. A more tolerant benthic community may indicate higher silt levels, lower flows, higher temperatures, and/or impaired habitat/substrate. The results of Site T40 suggest severe impairment with Chironomidae dominating and an HBI of 9.8. This location also showed a significant amount of filamentous algae. Ephemeroptera and Trichoptera were not present. Site T41 scored lower than T37 in physical habitat due to poor bank stability and lack of physical complexity. Site T37 scored very well, only lacking in the area of bank stability. The fish survey indicated a healthy fish community at Site T37 with 21 species sampled. Site T41 scored in the fair category with only 15 species identified with a very low percentage of sensitive species and an absence of intolerant species. The sensitive/intolerant species are usually the first to be affected by major sources of degradation such as siltation, low dissolved oxygen, reduced flow, and/or chemical contamination. However, the most abundant species at Site T41 were common shiners, creek chubs, sand shiners, and stonerollers. These species are indicators of a healthy stream. Topeka Shiners were found at Site T37 (311 in number). Topeka Shiners are associated with lower water temperatures and isolated instream pools influenced by groundwater (Kerns 1999).

97
Table 51. Bugs, Fish, and Habitat Final Index Values and Suggested Impairment in the Castlewood to Estelline Area
Site Macroinverts Fish Habitat Suggested Impairment (based on bug data)
R19 57 ------ ------ Moderate to Severe T37 63 92 94 Moderate to Severe
T39** 51 ------ ------ Moderate to Severe T40** 35 ------ ------ Severe T41 * 72 68 ------
* dry stream ----- not sampled ** lake outlet
Source Linkage and Conclusion
Fecal Coliform Bacteria Reductions and Sources Based on modeling and loading calculations, fecal coliform bacteria (Table 52) would need the following reductions at each site:
Table 52. Percent Fecal Coliform Bacteria Reduction in the Castlewood to Estelline Area Site Numeric
Standard Fecal % Reduction
*(Flow) Event vs Base Flow
R19 ≤ 2000 58% (H) Both T37 ≤ 2000 99% (H) Event T39 NA ------- NA T40 ≤ 2000 89% (L) Event T41 ≤ 2000 86% (H), 24% (M) Both
* Flow Ranges H=High Flows (0-10%) M=Moist Conditions (10-40%) MR=Mid-Range Flows (40-60%) D=Dry Conditions (60-90%) L=Low Flows (90-100%)
The monitoring data shows high fecal concentration during runoff events and at low flows. Potential sources of fecal coliform bacteria would be failing septic systems, pastured livestock, inadequate manure application, and feedlot runoff. According to the feedlot inventory, 66 of the 145 animal feeding operations within this area rated 50 or greater on a 0 to 100 scale. Higher ratings indicate a greater potential of the operation to pollute nearby surface waters. Livestock waste would contribute to the higher fecal counts during runoff events; whereas, livestock in the stream and failing septic systems contribute to the higher fecal counts during low flows. There are six NPDES permitted facilities within the drainage area. One was identified as a point source that discharged during the sampling period; however, no fecal coliform data was documented (Table 38). Reductions in fecal coliform bacteria should focus on non-point sources (See Target Reductions and Future Activity Recommendations Section).

98
Estelline South This map (Figure 58) shows the area and location designated as the Estelline South area.
CodingtonCounty
DeuelCounty
HamlinCounty
BrookingsCounty
GrantCounty
Brookings
Volga
Arlington
Estelline
T48
T43
T44 T45
T46T47
R01
R20
T42
Bruce
Town
Big Sioux River
Watershed Boundary
Major Tributary
Project WQ Site
Ambient WQ Site
Figure 58. Estelline South Location Map Land Use Summary This area includes Peg Munky Run (Site T42), an Unnamed Creek Near Volga (Site T47), and Big Sioux River Sites R20 and R01. The Oakwood Lakes watershed is located in this area and includes inlet and outlet Sites T43, T44, T45, and T48. There is a separate assessment report for the Oakwood chain of lakes that addresses these monitoring sites. The Estelline South area is located in the Northern Glaciated Plains and encompasses approximately 183,043 acres. Land use in the watershed is predominantly agricultural (Figure 59). Approximately 76 percent of the area is cropland, such as corn and soybeans, and 18 percent is grassland and pastureland. There are 130 animal feeding operations in this area, with approximately 89 percent of the livestock consisting of cattle (Figure 60). There are three NPDES permitted facilities located within this watershed (Tables 37 and 38). They include the City of Bruce, the City of Estelline, and the City of Volga.

99
Estelline South Landuse
Building or Farmstead
4%Water
2%
Cropland76%
Rangeland or Grassland
18%
Figure 59. Estelline South Area Landuse
0
20
40
60
80
100
Perc
enta
ge
Cattle Sheep Hogs Horses
Estelline South Watershed Livestock
Figure 60. Estelline South Watershed Livestock

100
Water Quality Summary Beneficial uses for river sites R20 and R01 are 1, 5, 8, 9, and 10. Peg Munky Run (Site T42) is assigned beneficial uses 6, 8, 9, and 10, and the Unnamed Creek near Volga (T47) is assigned beneficial uses 9 and 10. Table 53 is a summary of the beneficial uses classes assigned to each monitoring site and whether they are meeting or not meeting water quality criteria.
(1) Domestic Water Supply (5) Warmwater Semi-permanent Fish Life Propagation
(6) Warmwater Marginal Fish Life Propagation (8) Limited Contact Recreation (9) Fish and Wildlife Propagation, Recreation and Stock Watering (10) Irrigation
Table 53. Summary of Beneficial Use Class by Site
Site (1) (5) (6) (8) (9) (10)R20 - ×R01 -T42 - - ×T47 - - - -
-×
Beneficial Use Class
meetingnot applicablenot meeting
Based on the results from the water quality criteria established by DENR as described in the Results Section under Water Quality Monitoring, all the river sites (R20 and R01) are meeting the water quality criteria for beneficial uses (1) Domestic Water Supply, (5) Warmwater Semi-permanent Fish Life Propagation, (9) Fish and Wildlife Propagation, Recreation and Stock Watering, and (10) Irrigation. Tributary sites T42 and T47 are meeting the water quality criteria for beneficial uses (9) and (10) and T42 is meeting for beneficial use (6). For beneficial use (8) Limited Contact Recreation, all sites meet the water quality criteria for dissolved oxygen. Site R01 is the only site meeting the water quality criteria for fecal colifom bacteria; all other sites (R20, T47 and T42) are not meeting (Figures 61, 62, and 63). The numeric criteria for dissolved oxygen is > 5 mg/L and for fecal coliform bacteria it is ≤ 2000 cfu/100mL.

101
Fecal Coliform Bacteria Results
Near Volga to Brookings Segment
0102030405060708090
100
R01
Site
Feca
l % E
xcee
denc
e at
St
anda
rd
at Standard 2000
Figure 61. Fecal Coliform Bacteria Percent Exceedence at Standard ≤ 2000cfu/100mL in the Near Volga to Brookings Segment of the Big Sioux River
Peg Munky Run
0102030405060708090
100
T42
Site
Feca
l % E
xcee
denc
e at
St
anda
rd
at Standard 2000
Figure 62. Fecal Coliform Bacteria Percent Exceedence at Standard ≤ 2000cfu/100mL in Peg Munky Run

102
* Numeric Standard does not apply
* Unnamed Creek Near Volga
0102030405060708090
100
*T47
Site
Feca
l % E
xcee
denc
e at
St
anda
rd
at Standard 2000
Figure 63. Fecal Coliform Bacteria Percent Exceedence at Standard ≤ 2000cfu/100mL
in Unnamed Creek Near Volga
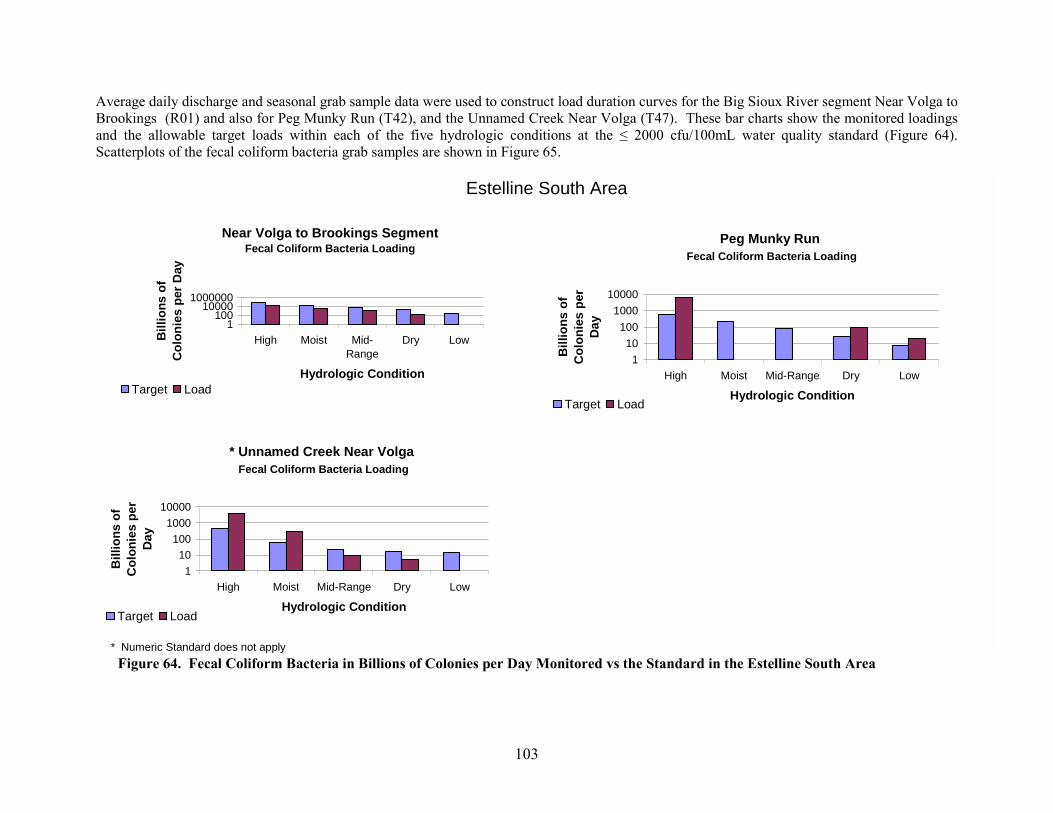
103
Average daily discharge and seasonal grab sample data were used to construct load duration curves for the Big Sioux River segment Near Volga to Brookings (R01) and also for Peg Munky Run (T42), and the Unnamed Creek Near Volga (T47). These bar charts show the monitored loadings and the allowable target loads within each of the five hydrologic conditions at the ≤ 2000 cfu/100mL water quality standard (Figure 64). Scatterplots of the fecal coliform bacteria grab samples are shown in Figure 65.
* Numeric Standard does not apply
Estelline South Area
Near Volga to Brookings SegmentFecal Coliform Bacteria Loading
1100
100001000000
High Moist Mid-Range
Dry Low
Hydrologic Condition
Bill
ions
of
Col
onie
s pe
r Day
Target Load
Peg Munky Run Fecal Coliform Bacteria Loading
110
1001000
10000
High Moist Mid-Range Dry Low
Hydrologic Condition
Bill
ions
of
Col
onie
s pe
r D
ay
Target Load
* Unnamed Creek Near Volga Fecal Coliform Bacteria Loading
110
1001000
10000
High Moist Mid-Range Dry Low
Hydrologic Condition
Bill
ions
of
Col
onie
s pe
r D
ay
Target Load
Figure 64. Fecal Coliform Bacteria in Billions of Colonies per Day Monitored vs the Standard in the Estelline South Area

104
* Numeric Standard does not apply
Peg Munky Run Fecal Coliform Bacteria Grab Samples
110
1001000
10000
Apr-01
Jun-0
1Aug
-01Oct-
01Dec
-01Feb
-02Apr-
02Ju
n-02
Aug-02
Oct-02
Date
cfu/
100m
L
T42 Standard
* Unnamed Creek Near VolgaFecal Coliform Bacteria Grab Samples
110
1001000
10000100000
Apr-01
Jun-0
1Aug
-01Oct-
01Dec
-01Feb
-02Apr-
02Ju
n-02
Aug-02
Oct-02
Date
cfu/
100m
L
T47 Standard
Near Volga to Brookings SegmentFecal Coliform Bacteria Grab Samples
110
1001000
10000
Apr-01
Aug-01
Dec-01
Mar-02
Jul-0
2Nov
-02Mar-
03Ju
l-03
Oct-03
Feb-04
Jun-0
4Oct-
04
Date
cfu/
100m
L StandardR01
Figure 65. Scatterplot s of Fecal Coliform Bacteria Grab Samples for River Site R01, Peg Munky Run (T42), and the Unnamed Creek Near Volga (T47)

105
Trends in fecal coliform bacteria are shown in Figure 66. DENR ambient grab sample data for R01 (WQM62) was used to construct these figures. The seasonal (May through Sept) medians for each year, from 1980 to 2004, were calculated. The statistical significance of a trend was determined to occur at an R2 value of 0.25 or greater, due to the large sample size of 25 years of data. Figure 66 does not constitute a significant trend, at monitoring site R01, in fecal coliform bacteria with an R2 = 0.2260. This area is currently meeting the water quality criteria for fecal coliform bacteria. The current trend line seems to indicate a progressive downward trend in fecal coliform bacteria. This site should continue to be monitored for trends over the next several years.
R01 Fecal Coliform Bacteria Seasonal Median Trend
R2 = 0.226
0100200300400500
1980
1982
1984
1986
1988
1990
1992
1994
1996
1998
2000
2002
2004
Year
Seas
onal
Med
ian
(cfu
/100
mL)
Figure 66. 25-Year Trend (1980-2004) of Yearly Seasonal Medians of Fecal Coliform
Bacteria at R01 Total Suspended Solids Results Of the sites assigned a numeric standard for TSS, there was one exceedence at Site R20 of 314 mg/L, and three exceedences at Site R01 of 182 mg/L, 174 mg/L, and 190 mg/L. Based on FLUX model results, Figure 67 shows the estimated TSS loadings for the Big Sioux River Site (R01), and Peg Munky Run (T32) as compared to the allowable load of ≤ 158 mg/L for the river site and ≤ 263 mg/L for Peg Munky Run. Scatterplots of the TSS grab samples are shown in Figure 68.

106
TSS Load -Near Volga to Brookings
1
10
100
1000
10000
R01
Site
KG
in
Hun
dred
s of
Th
ousa
nds
Monitored to meet Standard 158mg/L
TSS Load -Peg Munky Run
0.1
1
10
T42
Site
KG
in
Hun
dred
s of
Th
ousa
nds
Monitored to meet Standard 263mg/L
Figure 67. TSS in kg Monitored vs the Standard in the Estelline South Area

107
* Numeric Standard does not apply
Near Volga to Brookings SegmentTSS Grab Samples
110
1001000
10000
Apr-01
Jun-0
1
Aug-01
Oct-01
Dec-01
Feb-02
Apr-02
Jun-0
2
Aug-02
Oct-02
Date
cfu/
100m
LStandard R01
Peg Munky RunTSS Grab Samples
110
1001000
Apr-01
Jun-0
1
Aug-01
Oct-01
Dec-01
Feb-02
Apr-02
Jun-0
2
Aug-02
Oct-02
Date
cfu/
100m
L
T42 Standard
* Unnamed Creek Near VolgaTSS Grab Samples
110
1001000
Apr-01
Jun-0
1
Aug-01
Oct-01
Dec-01
Feb-02
Apr-02
Jun-0
2
Aug-02
Oct-02
Date
cfu/
100m
L
T47 Standard
Figure 68. Scatterplots of TSS Grab Samples for River Site R01, Peg Munky Run (T42),
and the Unnamed Creek near Volga (T47)

108
Data Summary The following table (Table 54) summarizes the ranges of fecal coliform bacteria cfu/100mL, TSS mg/L, and the percent exceedences. It also shows the summer mean of total PO4 mg/L. The summer mean concentrations for total phosphorus at each site fall within the ecoregion mean of 0.25 mg/L (Fandrei et al. 1988). Table 54. Ranges and Percent Exceedences of Fecal Coliform Bacteria, TSS, and Summer Means of Total PO4 in the Estelline South Area
Site Fecal cfu/100mL
% fecal exceedence
TSS mg/L
% TSS exceedence
Summer Mean Total PO4
mg/L R01 nd->2,500 5% 7-190 8% 0.366 R20 80-14,000 18% 6-328 6% 0.338 T42 420-10,000 75% 4-28 0% 0.194 T47 180-25,000 ----- 1-62 ----- 0.854
-- water quality criteria not applicable The summer mean concentrations of total phosphorus at sites R01, R20, and T47 exceed the NGP ecoregion mean of 0.25 mg/L (Fandrei et al. 1988). Site T47 exceeded the ecoregion mean by almost three and half times. These higher numbers can be attributed to sources such as runoff, livestock waste, streambank erosion, commercial fertilizers, and/or construction site erosion. Biological and Physical Habitat Summary The only site surveyed for fish and physical habitat in the Estelline South area was Site T42. Macroinvertebrates were collected at all the sites in this area, with the exception of T42, due to dry stream conditions. Biological and physical data suggested impairment. Impairment ranged from minimal to severe (Table 55). Score sheets for each site can be found in Appendix L. Based on macroinvertebrate collection, Sites R01 and R20 showed the best overall biotic health and the least impairment of the 33 macroinvertebrate samples collected in the NCBSRW. Both locations had a high percentage of EPT and a moderate amount of intolerant taxa. Several species of Ephemeroptera were found at Site R20. In addition, shredders, scrapers, clingers, and filterers were abundant at both locations. HBI’s ranged from 4.9 to 5.0 suggesting minimal to moderate impairment (Table 55). Communities at these sites indicate lower silt levels, higher flows, cooler temperatures, and/or more complex substrates. Suggested impairment for Site T47 was moderate to severe. EPT richness and abundance were low with primarily tolerant Chironomidae, Dipteria, and Oligochaeta present. No intolerant organisms. The dominant organism was Tubificidae which has a tolerance value of 10. This community indicates higher silt levels, lower flows, higher temperatures, and/or impaired habitat/substrate. Site T42 went dry before macroinvertebrates could be sampled; however fish and physical habitat were assessed. This site ranked fairly high in habitat and good in fish community. Improvements in bank stability and limiting animal vegetation use could improve the physical attributes of this site. Twenty-nine Topeka Shiners were found at Site T42, along with abundant common shiners, creek chubs and stonerollers.

109
Table 55. Bugs, Fish, and Habitat Final Index Values and Suggested Impairment for the Estelline South Area
Site Macroinverts Fish Habitat Suggested Impairment (based on bug data)
R01 69 ------ ------ Minimal to Moderate R20 71 ------ ------ Minimal to Moderate T42 * 81 65 ------ T47 65 ------ ------ Moderate to Severe
----- not sampled * dry
Source Linkage and Conclusion
Fecal Coliform Bacteria Reductions and Sources Based on modeling and loading calculations, fecal coliform bacteria (Table 56) would need the following reductions at each site:
Table 56. Percent Fecal Coliform Bacteria Reduction in the Estelline South Area Site Numeric
Standard Fecal % Reduction
*(Flow) Event vs Base Flow
R01 ≤ 2000 0% Event R20 ≤ 2000 36% (H) Event T42 ≤ 2000 92% (H), 72% (D) Both T47 NA ----- -----
-- numeric standard not applicable * Flow Ranges H=High Flows (0-10%) M=Moist Conditions (10-40%) MR=Mid-Range Flows (40-60%) D=Dry Conditions (60-90%) L=Low Flows (90-100%)
The monitoring data shows high fecal concentration during runoff events and non-event flows. Potential non-background non-point sources of fecal coliform bacteria would be failing septic systems, pastured livestock, inadequate manure application, and feedlot runoff. According to the feedlot inventory, 43 of the 130 animal feeding operations in this area rated 50 or greater on a 0 to 100 scale. Higher ratings indicate a greater potential of the operation to pollute nearby surface waters. Livestock waste would contribute to the higher fecal counts during runoff events; whereas, livestock in the stream and failing septic systems contribute to the higher fecal counts during low flows. There are four known NPDES permitted facilities within the drainage area. Of these four, one was identified as a point source that discharged during the sampling period; however, no fecal coliform data was documented (Table 38). Reductions of fecal coliform bacteria should focus on non-point sources (See Target Reductions and Future Activity Recommendations Section).

110
WATER QUALITY GOALS Water quality goals are based on beneficial uses and standards to meet those uses. Based on monitoring results of the Big Sioux River and its tributaries fecal coliform bacteria and dissolved oxygen were the two parameters found not meeting the standards. Willow Creek and Hidewood Creek are the two locations with low dissolved oxygen levels. Both streams drain into the BSR. Round Lake serves as the headwaters for Willow Creek and Clear Lake serves as the headwaters for Hidewood Creek. The goals for these sites are to increase the dissolved oxygen levels by reducing phosphorus loadings and increasing streambank vegetation. These activities should reduce the excessive algae growth and provide shading which will reduce water temperatures. However, as mentioned earlier in the Analysis and Summary Section, future biological oxygen demand (BOD) sampling will need to be accomplished prior to TMDL development. Based on reducing loadings or concentrations to acceptable levels, goals were established for river segments or tributaries not meeting the fecal coliform bacteria water quality criteria. In order for the river segments and the tributaries to meet the water quality goals for fecal coliform bacteria, a numeric standard of ≤ 2000 cfu/100mL must be applied. Likewise, to meet the water quality goals for dissolved oxygen, concentrations of ≥ 5 will need to be achieved. To meet the goals for dissolved oxygen, concentrations would need to be increased. Figure 69 shows the percent exceedence of the standard (≤ 2000 cfu/100mL) for fecal coliform bacteria by river or tributary site. The next figure (Figure 70) shows the river segments and major tributaries assigned a fecal coliform bacteria standard and the percent exceedence of that standard. Peg Munky Run, Stray Horse Creek, and Hidewood Creek are the top three violators of the fecal coliform bacteria criteria in the North-Central Big Sioux River watershed.
Fecal Coliform
0
10
20
30
40
50
60
70
80
90
100
*T34 T35 T36 T37
*T39 T40 T41 T42
*T46
*T47 R14 R15 R16 R17 R18 R19 R20 R01
Site
% E
xcee
denc
e at
Sta
ndar
d
at Standard 2000
Tributary Sites Big Sioux River
* Site not assigned a numeric standard for fecal coliform bacteria
Figure 69. Percent Exceedence of Fecal Coliform Bacteria by Site

111
Fecal Coliform Bacteria
0102030405060708090
100
Peg MunkyRun
Stray HorseCreek
Hidew oodCreek
Willow Creek Willow Creekto Stray
Horse CreekSegment
LakeKampeska toWillow Creek
Segment
Stray HorseCreek to Near
VolgaSegment
Near Volga toBrookingsSegment
Site
% E
xcee
denc
e at
Sta
ndar
d
at Standard 2000 cfu/100mL
Figure 70. Percent Exceedence of TSS by Big Sioux River Segment or by Major Tributary Collection of the physical and biological data is important because it helps to show the long-term effects of what is happening in the watershed. Macroinvertebrates and fishes are sensitive to their environments. Thus, biological indicators can be a useful tool in monitoring the health of streams and can ultimately assist in the establishment of management initiatives to help resolve water quality problems throughout the watershed. To determine relative impairment of a site (least impaired to most impaired), scores from the IBI (macroinvertebrates) and standardized reductions of fecal coliform bacteria were totaled. The site receiving the highest score became the least impaired, and the site receiving the lowest score became the most impaired. Figure 71 shows the monitoring sites from least to most impaired, based on a percent rank derived from total scores. The only two sites not represented are T41 (Hidewood Creek near Estelline) and T42 (Peg Munky Run) because these streams went dry before macroinvertebrates could be collected. This is unfortunate since T42 seems to be a major violator in fecal coliform bacteria samples. The higher concentrations of fecal coliform bacteria at these sites may be directly related to the low and intermittent stream flows and/or instream cattle.

112
0.0010.0020.0030.0040.0050.0060.0070.0080.0090.00
100.00
R01-BSR near Brookings
R15-BSR at Broadway
*T34 -Lake Pelican Weir
R20-BSR near Bruce
R19-BSR near Estelline
R17-BSR below Watertown
R16-BSR at 20th Avenue
R14-BSR at Watertown
*T39-Lake Poinsett Outlet
*T47-Unnamed Creek
T37-Stray Horse Creek
R18-BSR near Castlewood
T40-Hidewood Creek
T36-Willow Creek
T35-Willow Creek
*T46-East Oakwood LakeOutlet
Site
% Rank
Score Totals
* Site not assigned a numeric standard for fecal coliform
bacteria
Figure 71. Least Im
paired to Most Im
paired Monitoring Sites

113
TARGET REDUCTIONS AND FUTURE ACTIVITY RECOMMENDATIONS The following fecal coliform bacteria priority management table (Table 57) has been categorized into five hydrologic conditions; (1) High Flows, (2) Moist Conditions, (3) Mid-Range Flows, (4) Dry Conditions, and (5) Low Flows. The percent reductions needed for each condition are indicated. Table 57. Priority Management Table for River Segments and Major Tributaries in the North-Central Big Sioux River Watershed
Major Tributary High Flows Moist Conditions Mid-Range Flows Dry Conditions Low Flows
Willow Creek ----------78%---------- ----------5%----------Stray Horse Creek ----------99%----------Hidewood Creek ----------59%----------Peg Munky Run
Big Sioux River SegmentLake Kampeska to Willow Creek ---------33%---------Willow Creek to Stray Horse Creek ---------10%---------Stray Horse Creek to Near Volga --2 grab samples --
Hydrologic Condition
--------------------------------------------------------------------38%----------------------------------------------------------
For the purpose of this assessment, TMDLs will be approached on a segment by segment basis, assuming the TMDL of the preceding segment will be reached. Table 58 shows the proposed TMDL list. At this time, seven TMDLs for fecal coliform bacteria are proposed. The reports will focus on the segments that were listed in the 305 (b) Water Quality Assessment, and any others not meeting their water quality criteria. The TMDL reports can be found in Appendices DD through JJ. Figure 72 shows the locations of these impaired waters. Table 58. Proposed TMDL Listing of Areas Not Meeting Water Quality Criteria Segment Affected Sites Cause Tributary Affected Sites CauseLake Kampeska to Willow Creek R14-R16 Fecal Willow Creek T35-T36 FecalWillow Creek to Stray Horse Creek R17-R18 Fecal Stray Horse Creek T37 FecalStray Horse Creek to Near Volga R19-R20 Fecal Hidewood Creek T40-T41 Fecal
Peg Munky Run T42 Fecal

114
Watertown
BrookingsH
orse
Will
ow C
k
Hidewood Ck
PegMunky
Volga
Run
Impaired portion of BSR
Impaired Tributary
Big Sioux River (BSR)
Major Tributary
Northern Portion of the
Big Sioux Basin
Stra
y
CK
Impaired Lake
Figure 72. Targeted TMDL for the Big Sioux River Segments, Major Tributaries, and Lakes

115
BEST MANAGEMENT PRACTICES Table 59 contains a recommended list of reductions that were selected based on fecal coliform bacteria and nutrients needed for each site. Nutrients are listed because they are directly correlated to the reductions of fecal and TSS.
Table 59. Best Management Practices for Fecal Coliform Bacteria and Nutrient Problems BMP Fecal Nutrients Potential
Reduction (1) Feedlot Runoff Containment X X High (2) Manure Management X X High (3) Grazing Management X X Moderate (4) Alternative Livestock Watering X X Moderate (5) Contour Farming X Moderate (6) Contour Strip Farming X High (7) Terracing X High (8) Conservation Tillage (30% residue) X Moderate (9) No Till X High (10) Grassed Waterways X Moderate (11) Buffer/Filter Strips X X Moderate (12) Commercial Fertilizer Management X Moderate (13) Streambank Stabilization X High (14) Urban Runoff Controls (14a) Pet Waste Control X X High (14b) Lawn Fertilizer Control X High (14c) Construction Erosion Control X High (14d) Street Sweeping X High (14e) Stormwater Ponds X X High (15) Wetland Restoration or Creation X X High (16) Riparian Vegetation Restoration X X High (17) Conservation Easements X X High (18) Livestock Exclusion X X High Note: approximate range of reductions: Low = 0-25% Moderate = 25-75% High = 75-100%
Most of these BMPs are further explained in Table 60 with an explanation of the benefits of using a particular BMP and the reduction that can be achieved when put to use. This table was adapted from an MPCA sources (MPCA 1990).

116
Table 60. Percent Reduction Achievable by Best Management Practice BMP Benefits Achievable Reduction
Manure Management • Reduces Nutrient Runoff • Significant Source of Fertilizer
50-100% reduction of nutrient runoff
Buffer/Filter Strips • Controls sediment, phosphorus, nitrogen, organic matter, and pathogens
50% sediment and nutrient delivery reduction
Conservation Tillage • Reduces runoff • Reduces wind erosion • More efficient in use of labor,
time, fuel, and equipment
30-70% pollutant reduction 50% nutrient loss reduction (depends on residue and direction of rows and contours)
Contouring • Control erosion of cropland and pasture
• Reduces runoff and conserves moisture
• Can increase yields
30-50% erosion reduction 25% nutrient reduction 10-50% runoff reduction (based on 2-12 % slope)
Confinement Ponds • Sediment/nutrient reduction • Reduction in peak flow runoff • Increase in wildlife habitat
60-90% sediment trapping 10-40% nutrient trapping
Fencing • Reduces erosion • Increases vegetation • Stabilized banks • Improves aquatic habitat
Up to 70% erosion reduction
Grassed Waterways • Reduces gulley and channel erosion
• Reduces sediment associated nutrient runoff
• Increases wildlife habitat
10-50% sediment delivery reduction (broad) 0-10% sediment deliver reduction (narrow)
Strip Cropping • Reduces erosion and sediment loss
• Reduces field loss of sediment associated nutrients
High quality sod strips filter out 75% of eroded soil from cultivated strips
Terraces with Contours
• High reduction of erosion • Reduces loss of sediment
associated nutrients
50-100% sediment reduction 25-45% nutrient reduction (2-12 degree slopes)
117
FECAL COLIFORM BACTERIA BMP RECOMMENDATIONS BY HYDROLOGIC CONDITION The options necessary to meet the goals of beneficial use (8) Limited Contact Recreation for the Big Sioux River segments as well as for the major tributaries include 1) ensuring the proposed TMDLs will meet the goals, and/or 2) ensuring the tributaries within the watershed are supporting the goals of the Big Sioux River and if they are not, then an evaluation of their standards may be necessary. Table 61 breaks down the five hydrologic conditions and the possible sources of fecal coliform bacteria and the recommended management practices to help reduce loads. High flow is representative of conditions when precipitation intensity exceeds the rate of water infiltration into the soil, and which may eventually cause flooding. Moist conditions are representative of those periods when the soils are already saturated and where runoff is occurring. Mid-range flows are representative of subsequent rain events, and of a time when saturation is beginning to lessen. Dry conditions are representative of those times when rain is sparse, although may still occur. Low flows are representative of conditions when rain is absent and when there is a drought or drought-like situation.

118
Table 61. Recommended Management Practices for Fecal Coliform Bacteria Reduction by Hydrological Condition
Hydrologic Condition
Source of Pollutant
Possible Contributing Source Areas Recommended Management Practices
High Flows (0-10)
Nonpoint Source
Absent/Poor Riparian Areas Sewer System Overflows/Stormwater Manure Runoff/Concentrated Feedlots
Riparian buffers- riparian forest buffers, filter strips, grassed waterways, shelterbelts, field windbreaks, living snow fences, contour grass strips, wetland restoration Sewer and NPDES Inspection Feedlot Runoff Containment
Moist Conditions
(10-40)
Nonpoint Source
Absent/Poor Riparian Areas Incorrect Land Application of Livestock waste Livestock In-stream Manure Runoff/Concentrated Feedlots Pastured Livestock Sewer System Overflows/Stormwater Urban Runoff
Riparian buffers- riparian forest buffers, filter strips, grassed waterways, shelterbelts, field windbreaks, living snow fences, contour grass strips, wetland restoration Fertilizer Management Alternative Livestock Watering Feedlot Runoff Containment Fencing, Channel crossing, Grazing Management Sewer and NPDES Inspection Pet Waste Management
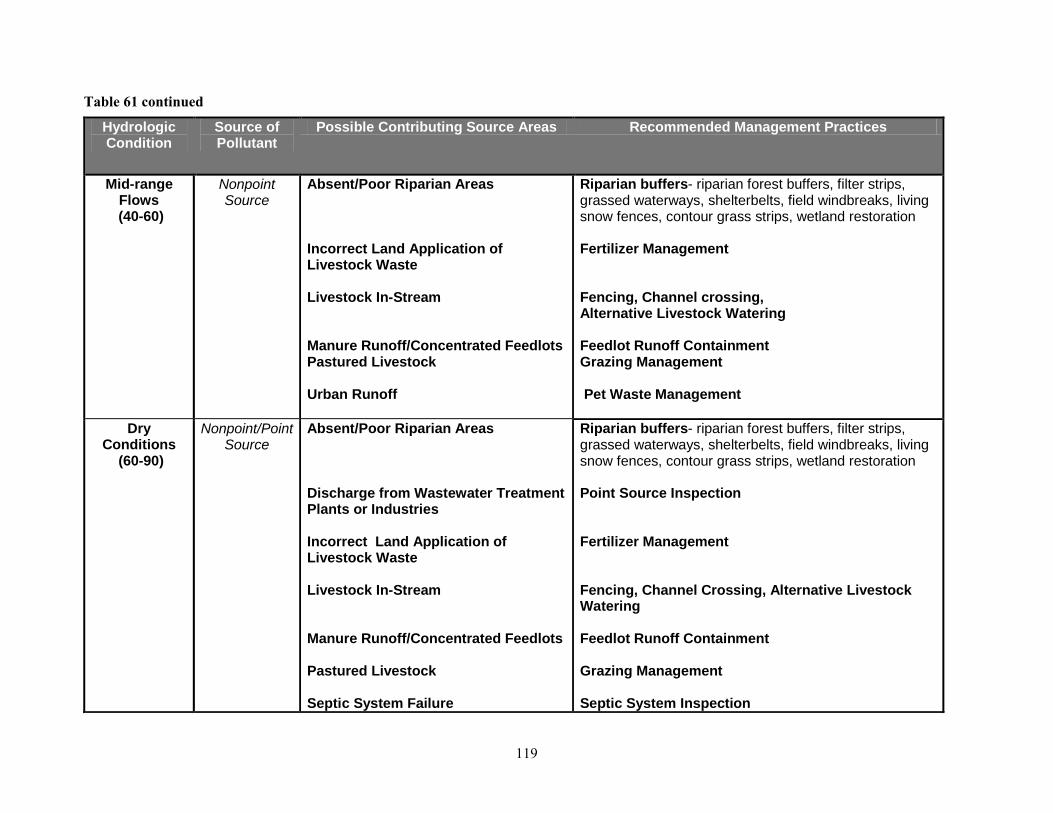
119
Table 61 continued
Hydrologic Condition
Source of Pollutant
Possible Contributing Source Areas Recommended Management Practices
Mid-range Flows
(40-60)
Nonpoint Source
Absent/Poor Riparian Areas Incorrect Land Application of Livestock Waste Livestock In-Stream Manure Runoff/Concentrated Feedlots Pastured Livestock Urban Runoff
Riparian buffers- riparian forest buffers, filter strips, grassed waterways, shelterbelts, field windbreaks, living snow fences, contour grass strips, wetland restoration Fertilizer Management Fencing, Channel crossing, Alternative Livestock Watering Feedlot Runoff Containment Grazing Management Pet Waste Management
Dry Conditions
(60-90)
Nonpoint/Point Source
Absent/Poor Riparian Areas Discharge from Wastewater Treatment Plants or Industries Incorrect Land Application of Livestock Waste Livestock In-Stream Manure Runoff/Concentrated Feedlots Pastured Livestock Septic System Failure
Riparian buffers- riparian forest buffers, filter strips, grassed waterways, shelterbelts, field windbreaks, living snow fences, contour grass strips, wetland restoration Point Source Inspection Fertilizer Management Fencing, Channel Crossing, Alternative Livestock Watering Feedlot Runoff Containment Grazing Management Septic System Inspection

120
Table 61 continued
Furthermore, BMPs for fecal coliform bacteria reduction can be found on the BMP table (Table 59). A combination of BMPs from this table could be applied to achieve the fecal coliform bacteria reductions with the exception of 5-10, 12, 13, 14b, 14c, and 14d (See Appendix V for fecal coliform bacteria loadings and reductions). Monitoring locations requiring immediate attention within each hydrologic condition is discussed. High Flows Probable sources of fecal coliform bacteria within the high flows hydrologic condition may be related to absent or poor riparian areas, stormwater runoff, feedlot runoff, and overflowing sewer systems (Table 61). Exceedences contributing to the fecal coliform bacteria problems during the high flows are occurring during rain events. The applicable BMPs for these areas may be 1, 2, 11, 14e, 15, 16, and 17 (Table 59). The higher percentages of reductions are needed in the high flow hydrologic condition (Table 61). Six of the seven river and tributary segments need reductions in high flows.
Hydrologic Condition
Source of Pollutant
Possible Contributing Source Areas Recommended Management Practices
Low Flows (90-100)
Point Source Discharge from Wastewater Treatment Plants or Industries Livestock In-Stream Manure Runoff/Concentrated Feedlots Pastured Livestock Septic System Failure Straight-Pipe Septic Systems
Point Source Inspection Fencing, Channel Crossing, Alternative Livestock Watering Feedlot Runoff Containment Grazing Management Septic System Inspection Septic System Replacement

121
Moist Conditions Probable sources of fecal coliform bacteria within the moist conditions hydrologic condition may be related to absent or poor riparian areas, stormwater runoff, overflowing sewer systems, urban runoff, incorrect land application of livestock waste, in-stream livestock, pastured livestock, and concentrated feedlots (Table 61). The applicable BMPs for these areas may be 1, 2, 3, 4, 11, 15, 16, 17 and 18 (Table 59). Mid-Range Flows Probable sources of fecal coliform bacteria within the mid-range flows hydrologic condition may be related to absent or poor riparian areas, urban runoff, incorrect land application of livestock waste, in-stream livestock, pastured livestock, and concentrated feedlots (Table 61). The applicable BMPs for this area may be 1, 2, 3, 4, 11, 16, 17 and 18 (Table 59). Fencing, channel crossing, alternative livestock watering, and grazing management are recommended for those sites affected by non-rain periods. Dry Conditions Probable sources of fecal coliform bacteria within the dry conditions hydrologic condition may be related to absent or poor riparian areas, incorrect land application of livestock waste, in-stream livestock, pastured livestock, concentrated feedlots, discharge from wastewater treatment plants, and septic system failure (Table 61). Applicable BMPs for these areas may be 2, 3, 4, and 18 (Table 59). Fencing, channel crossing, alternative livestock watering, and grazing management are recommended for those sites affected by non-rain periods. Low Flows Probable sources of fecal coliform bacteria within the low flow hydrologic condition may be related to in-stream livestock, concentrated feedlots, discharge from wastewater treatment plants, straight pipes, and septic system failure (Table 61). The applicable BMPs for this area may be 2, 3, 4, and 18 (Table 59). Willow Creek and Peg Munky Run indicated problems during low flows and during non-rain periods. This may indicate problems septic leakage and/or in-stream livestock. Fencing, channel crossing, alternative livestock watering, and grazing management are recommended.

122
PUBLIC INVOLVEMENT AND COORDINATION STATE AGENCIES The SD DENR was the primary state agency involved in the completion of this assessment. They provided equipment as well as technical assistance throughout the project. They also provided ambient water quality data for several of the Big Sioux River sites. FEDERAL AGENCIES The Environmental Protection Agency (EPA) provided the primary source of funds for the completion of the assessment of the Big Sioux River watershed. The United States Geological Survey (USGS) provided historical stream flow data for the watershed. The Natural Resource Conservation Service (NRCS) provided technical assistance LOCAL GOVERNMENTS, OTHER GROUPS, AND GENERAL PUBLIC The EDWDD provided the sponsorship that made this project possible on a local basis. In addition to providing administrative sponsorship, EDWDD also provided local matching funds and personnel to complete the assessment. Public involvement consisted of individual meetings with landowners that provided a great deal of historic perspective on the watershed. OTHER SOURCES OF FUNDS In addition to funds supplied by the East Dakota Water Development District (EDWDD) and the Environmental Protection Agency (EPA), financial support was provided by the Brookings County Conservation District (BCCD) and the South Dakota Conservation Commission (SDCC). The inventory of the animal feeding operations (AFOs) and assessment of the potential environmental risk posed by each was work completed by BCCD using these funds in support of the overall project. The inventory and assessment of the AFOs was funded by EPA 319, EDWDD, and the SDCC grant.

123
ASPECTS OF THE PROJECT THAT DID NOT WORK WELL Most of the objectives proposed for the project were met in an acceptable fashion and in a reasonable time frame. Due to delays in obtaining a properly working AnnAGNPS program and delays in receiving water quality results from the WRI lab, the related tasks of this project fell behind schedule. Additionally, another sizeable 319 funded watershed assessment project was being completed as the same time this project was beginning. East Oakwood Lake was included as part of the North-Central Big Sioux Watershed Assessment Project. Three years into this project, two additional lakes were added and needed to be sufficiently assessed. It was decided in 2006 that a separate assessment report be written for these lakes. The fish and macroinvertebrate sampling would have told us more if we could have sampled during each year of the project or at least twice in the one year it was done. Many of the sites chosen were very intermittent and became dry before fish and/or macroinvertebrates could be collected. Macroinvertebrates were not collected until mid-October making it difficult to compare bugs with the fecal coliform data, as the standards only apply during May through September. Rock baskets may be misleading to the types of macroinvertebrates inhabiting a stream at a particular site. It would only be valuable if the substrate of that stream included rocks. For example, a rock basket within a silt-bottom stream may collect bugs that are not typically seen or inhabit that area of the stream due to rocks not ordinarily being in the area. Another more effective method of sampling macroinvertebrates in these heavily silted streams should have been used (i.e. D-net sampler). Many of the monitoring sites are classified as intermittent streams and yielded very few fecal coliform results before they went dry. Perhaps additional monthly sampling should have been scheduled on these more intermittent streams. Sampling and analysis methods could be improved in future projects by
- coordinating macroinvertebrate, fish, and water sampling - sampling more than once for fish and macroinvertebrates through the project period - determining if rock baskets are adequate for sampling sites with a bed substrate of silt or clay - separating and analyzing the data by subwatershed level or by stream order - increasing the number of instantaneous discharge measurements at ungaged sites - having reference sites to compare data to
Overall, taking into consideration the size of this project, the assessment went as well as expected.

124
LITERATURE CITED Allan, J. D. 1995. Stream Ecology Structure and Function of Running Waters.
Chapman & Hall Publishers. London. 388 pp.
Bailey, R. M., and M. O. Allum. 1962. Fishes of South Dakota. Misc. Pub. Mus. Zool. Univ. Mich. 119:1-133.
Barbour, M. T., J. Gerritsen, B. D. Snyder, and J. B. Stribling. 1999. Rapid
Bioassessment Protocols for Use in Wadeable Streams and Rivers: Periphyton, Benthic Macroinvertebrates, and Fish. United States Environmental Protection Agency. EPA 841-B-99-002.
Cleland, B. R. 2003. TMDL Development from the “Bottom Up” – Part III: Duration Curves and Wet-Weather Assessments. America’s Clean Water Foundation. Washington D.C.
Fandrei, G., S. Heiskary, and S. McCollar. 1988. Descriptive Characteristics of the Seven Ecoregions in Minnesota, by MPCA Water Quality Program Development Section.
FDEP. 2003. TMDL for Total Coliform Bacteria for Hatchet Creek, Alachua County, Florida. http://www.dep.state.fl.us/water/tmdl/docs/tmdls/ HatchetCreekPathogenTMDLFinal.pdf. Florida Department of Environmental Protection, Watershed Assessment Section.
Gordon, N. D., T. A. McMahon, and B. L. Finlayson. 1992. Stream hydrology: an introduction for ecologists. John Wiley and Sons. New York, New York.
Harrelson, C. C., C. L. Rawlinds, and J. P. Potyondy. 1994. Stream Channel Reference Sites: An Illustrated Guide to Field Technique. General Technical Report RM-245. Fort Collins, CO: U.S. Department of Agriculture, Forest Service, Rocky Mountain Forest and Range Experiment Station. 61 pp.
Hilsenhoff, W. L. 1987. An improved biotic index of organic stream pollution. Great Lakes Entomology. 20:31-39.
Huxoll, C. 2002. County Wildlife Assessment with a Summary of the 1991-2002 Assessments. South Dakota Department of Game, Fish, and Parks.
Hughes, R. M., and J. M. Omernik. 1981. Use and Misuse of the Terms Watershed and Stream Order. American Fisheries Society, Warmwater Stream Symposium, Bethesda, Maryland, pp. 320-326.
Karr, J. R. 1981. Assessment of biotic integrity using fish communities. Fisheries
6:21-27.

125
Karr, J. R., K .D. Fausch, P. L. Angermeier, P. R. Yant, and I. J. Schlosser. 1986. Assessing biological integrity in running waters. A method and its rationale. Special Publication 5. Illinois Natural History Survey.
Kerns, H. 1999. More than a Minnow. Missouri Conservationist. http://www.conservation.state.mo.us/conmag/1999/02/4.html MPCA. 1990. Protecting Minnesota’s Waters….The Land-Use Connection. MPCA
Public Information Office and Water Quality Division, Minnesota. 28 pp.
MPCA. 2002. Regional Total Maximum Daily Load Evaluation of Fecal Coliform Bacteria Impairments in the Lower Mississippi River Basin in Minnesota. 230 pp.
OEPA. 1987. Biological criteria for the protection of aquatic life. Volumes I-III. Ohio Environmental Protection Agency. Columbus, Ohio.
Omernik, J. M. 1987. Ecoregions of the Conterminous United States. Map (scale 1:7,500,000). Annals of the Association of American Geographers 77(1):118-125.
Plafkin, J. L., M. T. Barbour, K. D. Porter, S. K. Gross, and R. M. Hughes. 1989. Rapid Bioassessment Protocols For Use In Streams And Rivers: Benthic Macroinvertebrates And Fish. Unites States Environmental Protection Agency. EPA/444/4-89-001. Platts, W. S., W. F. Megahan, and G. W. Marshall. 1983. Methods for evaluating stream
riparian and biotic conditions. U.S. Forest Service General Technical Report INT-138. Rosgen, D. 1996. Applied river morphology. Wildland Hydrology. Pagosa Springs,
CO. Robison, E. G., and R. L. Beschta. 1990. Characteristics of coarse woody debris for
several coastal stream of southeast Alaska, USA. Canadian Journal of Fisheries and Aquatic Sciences. 47:1684-1693.
Schumm, S. A., M. D. Harvey, and C. C. Watson. 1984. Incised channels: morphology,
dynamics and control. Water Resources Publication.
SDDENR. 1998. The 1998 South Dakota Report to Congress 305(b) Water Quality Assessment. South Dakota Department of Environment and Natural Resources, Pierre, South Dakota. 235 pp.
SDDENR. 1998. The 1998 South Dakota 303 (d) Waterbody List and Supporting
Documentation. South Dakota Department of Environment and Natural Resources, Pierre, South Dakota. 94 pp.

126
SDDENR. 2000. The 2000 South Dakota Report to Congress 305(b) Water Quality Assessment. South Dakota Department of Environment and Natural Resources, Pierre, South Dakota. 262 pp.
SDDENR. 2002. The 2002 South Dakota 303 (d) Waterbody List and Supporting Documentation. South Dakota Department of Environment and Natural Resources, Pierre, South Dakota. 58 pp.
SDDENR. 2004. The 2004 South Dakota Integrated Report for Surface Water Quality Assessment. South Dakota Department of Environment and Natural Resources, Pierre, South Dakota. 64 pp.
SDDENR. 2004. The Central Big Sioux River Watershed Assessment and TMDL Final Report.
South Dakota Department of Environment and Natural Resources, Pierre, South Dakota. 227 pp.
SDSU. 2003. South Dakota State University Climate and Weather Web Page. http://climate.sdstate.edu/climate_site/climate_page.htm Simonson, T. D., J. Lyons, and P. D Kanehl. 1994. Quantifying fish habitat in streams:
transect spacing, sample size, and a proposed framework. 14:607-615.
Stueven, E., A. Wittmuss, and R .L. Smith. 2000. Standard operating procedures for Field samplers. South Dakota Department of Environment and Natural Resources, Water Resources Assistant Program, Pierre, South Dakota.
US Census Bureau. 2000. U. S. Census Bureau. http://quickfacts.census.gov/hunits/states/46pl.html. Washington, D. C.
USEPA. 2002. U.S. Environmental Protection Agency. Office of Water. National Water Quality Inventory, 2000 Report to Congress. EPA-841-R-02-001. Pp 9-15.
USEPA. 2002a. U.S. Environmental Protection Agency. Office of Water. Onsite Wastewater Treatment Systems Manual. EPA-600-R-00-008. Pp 20-23.
Walker, W. W. 1999. Simplified procedures for eutrophication assessment and prediction: user manual. United States Army Corps of Engineers. Instruction Report W-96-2.
Williams, M., and J. Mullin. 2002. Upper Big Sioux River Watershed Project. City of Watertown, South Dakota. 16 pp.
Wolman, M. G. 1954. A method of sampling coarse river-bed material. Transactions of the American Geophysical Union 35:951-956.

Appendix A. Monitoring Site Locations
A-1

Location WQ GagingNumber Descriptive Name Latitude Longitude Samples Station Miscellaneous Information
R14 Big Sioux River at Watertown 44 56 30 097 08 50 Yes Yes DENR WQM Station 55, USGS Gage 06479500R15 BSR @ Broadway @ Watertown 44 53 22 097 07 07 Yes Yes USGS Gage 06479512R16 BSR @ 20th Avenue @ Watertown 44 52 36 097 05 51 Yes YesR17 Big Sioux River below Watertown 44 50 32 097 02 57 Yes Yes DENR WQM Station 1, USGS Gage 06479520R18 Big Sioux River near Castlewood 44 43 54 097 02 39 Yes Yes USGS Gage 06479525R19 Big Sioux River near Estelline 44 34 25 096 55 45 Yes No DENR WQM Station 8R20 Big Sioux River near Bruce 44 25 40 096 54 15 Yes Yes Planned USGS Gage 06479770R1 Big Sioux River near Brookings 44 17 50 096 52 04 Yes No DENR WQM Station 62T34 Lake Pelican Outlet Weir 44 53 24 097 07 28 Yes Yes City of Watertown GageT35 Willow Creek near Waverly 44 57 57 096 52 55 Yes YesT36 Willow Creek near Watertown 44 55 08 097 02 43 Yes Yes USGS Station 06479515T37 Stray Horse Creek near Castlewood 44 43 52 096 57 23 Yes Yes Former USGS Station 06479529T38 Boswell Diversion Ditch 44 38 15 097 01 35 Yes Yes Discontinued Site due to inoperable diversion gatesT39 Lake Poinsett outlet 44 36 05 097 00 45 Yes Yes Former Lake Poinsett assessment siteT40 Hidewood Creek near Clear Lake 44 44 50 096 40 10 Yes YesT41 Hidewood Creek near Estelline 44 36 42 096 54 17 Yes Yes Former USGS Station 06479640T42 Peg Munky Run near Estelline 44 34 22 096 51 15 Yes Yes Former USGS Station 06479750T46 East Oakwood Lake outlet creek II 44 23 05 096 55 05 Yes Yes Former DENR WQM siteT47 Unnnamed creek near Volga 44 20 05 096 54 30 Yes Yes
North-Central Big Sioux River Watershed Assessment ProjectWater Quality Sampling/Stream Gaging Sites

Appendix B. WQ Grab Sample Data
B-1

Appendix B
North-Central Big Sioux River Watershed Water Quality - - 2001 through 2002
Site Site Name Date Time Lab# Runoff?
Water Temp
C˚
Air Temp
C˚Conductivity
µs/cm
Specific Conductivity
µs/cmSalinity
ppt
Dissolved Oxygen
mg/LpH
unitsTurbidity
NTU
Fecal Coliform
cfu/100mLTSS mg/L
Tot Solids mg/L
Dissolved Solids mg/L
Nitrates mg/L
Ammonia mg/L
Organic Nitrogen
mg/L TKN mg/LTot PO4
mg/LTotDis
PO4 mg/L
T34 Lake Pelican Weir 07/25/01 1045 01-6310 Y 24.8 24.5 587 588 0.3 9.9 8.7 19 <100 25 425 400 0.038 0.077 1.710 1.787 0.160 0.036T34 Lake Pelican Weir 08/27/01 1100 01-6324 N 23.3 24.5 775 803 0.4 6.3 7.7 16 110 20 544 524 0.244 0.301 1.292 1.593 0.219 0.125T34 Lake Pelican Weir 09/27/01 1020 01-6398 N 14.1 17.0 571 718 0.4 11.5 8.0 10 270 10 482 472 0.262 0.142 0.580 0.722 0.119 0.103T34 Lake Pelican Weir 10/22/01 1230 01-6444 N 9.9 15.0 505 718 0.4 11.5 8.3 7 20 6 390 384 0.232 0.076 0.430 0.506 0.038 0.021T34 Lake Pelican Weir 04/09/02 1200 02-6021 N 5.2 9.8 330 528 0.3 19.5 8.5 5 <10 12 380 368 0.119 0.059 1.090 1.149 0.122 0.068T34 Lake Pelican Weir 04/30/02 1115 02-6043 Y 10.4 13.0 512 708 0.3 17.3 8.4 11 <10 24 512 488 0.047 0.059 0.834 0.893 0.107 0.030T34 Lake Pelican Weir 05/09/02 1245 02-6080 Y 7.0 4.8 455 692 0.3 16.9 8.4 10 30 24 476 452 0.068 0.199 0.982 1.181 0.112 0.020T34 Lake Pelican Weir 06/10/02 1045 02-6096 N 22.2 25.0 627 663 0.3 6.4 8.3 17 290 40 424 384 0.084 0.166 1.140 1.306 0.149 0.083T34 Lake Pelican Weir 07/08/02 1135 02-6127 N 27.3 27.0 644 616 0.3 4.5 8.1 18 ----- 30 450 420 0.096 0.312 1.351 1.663 0.197 0.137T34 Lake Pelican Weir 08/07/02 1030 02-6169 Y 23.0 24.5 610 635 0.3 9.3 8.3 23 400 26 472 446 0.791 0.098 1.125 1.223 0.125 0.030T34 Lake Pelican Weir 08/21/02 1100 02-6187 Y 18.8 22.5 274 311 0.2 7.4 7.8 45 8000 28 240 212 0.423 0.355 0.742 1.097 0.242 0.132T34 Lake Pelican Weir 09/09/02 1145 02-6209 N 22.8 26.3 774 806 0.4 7.4 8.0 22 200 15 539 524 0.360 0.090 0.618 0.708 0.062 0.023T34 Lake Pelican Weir 10/17/02 1115 02-6250 N 7.5 5.0 506 760 0.4 7.5 ------ 4 10 11 471 460 0.519 0.083 0.747 0.830 0.048 0.032
T35 Willow Creek (nr Waverly) 06/14/01 1100 01-6216 Y 20.0 15.0 473 522 0.3 4.6 8.0 7 200 2 357 355 0.056 0.102 1.080 1.182 0.159 0.100T35 Willow Creek (nr Waverly) 07/24/01 1030 01-6301 Y 23.3 19.0 498 514 0.2 3.2 8.2 9 500 8 360 352 0.036 0.080 1.205 1.285 0.122 0.089T35 Willow Creek (nr Waverly) 08/27/01 1000 01-6322 N 20.9 29.0 494 540 0.3 4.2 8.6 24 4400 37 409 372 0.040 0.104 1.900 2.004 0.224 0.138T35 Willow Creek (nr Waverly) 09/26/01 1100 01-6393 N 12.7 20.0 454 596 0.3 13.8 8.7 7 1000 10 430 420 0.029 0.143 1.371 1.514 1.679 0.124T35 Willow Creek (nr Waverly) 10/22/01 1030 01-6442 N 6.8 14.0 430 664 0.3 13.7 8.4 12 3600 13 513 500 0.110 0.288 1.468 1.756 0.210 0.172T35 Willow Creek (nr Waverly) 04/09/02 1045 02-6018 N 2.7 8.0 206 359 0.2 14.2 7.8 2 <10 6 222 216 0.153 0.150 0.883 1.033 0.181 0.132T35 Willow Creek (nr Waverly) 04/30/02 1000 02-6039 Y 7.8 12.5 396 590 0.3 16.8 8.3 6 10 10 434 424 0.071 0.120 1.041 1.161 0.088 0.065T35 Willow Creek (nr Waverly) 05/09/02 1100 02-6077 Y 5.9 10.5 387 611 0.3 17.6 8.6 9 110 27 439 412 0.067 0.070 1.121 1.191 0.103 0.055T35 Willow Creek (nr Waverly) 06/10/02 1000 02-6093 N 21.2 22.5 582 627 0.3 10.2 8.5 4 290 19 383 364 0.046 0.100 1.186 1.286 0.081 0.053T35 Willow Creek (nr Waverly) 07/08/02 945 02-6125 N 23.4 21.0 520 536 0.3 5.5 8.5 6 ----- 14 410 396 0.050 0.156 1.072 1.228 0.079 0.071T35 Willow Creek (nr Waverly) 08/07/02 910 02-6166 Y 20.8 26.0 504 549 0.3 7.4 8.1 22 1300 23 475 452 0.070 0.408 1.956 2.364 0.156 0.033T35 Willow Creek (nr Waverly) 08/21/02 915 02-6184 Y 18.0 22.0 229 265 0.1 9.5 7.4 55 930000 26 274 248 0.900 0.366 2.726 3.092 1.562 1.341T35 Willow Creek (nr Waverly) 09/09/02 1000 02-6206 N 19.9 18.9 479 531 0.3 3.2 8.1 100 28000 56 420 364 0.060 0.583 2.076 2.659 0.280 0.111T35 Willow Creek (nr Waverly) 10/17/02 945 02-6245 N 3.8 4.0 366 618 0.3 9.8 ------ 12 700 23 471 448 0.132 0.218 1.260 1.478 0.110 0.080
T36 Willow Creek (nr Watertown) 04/08/01 1400 01-6040 Y 1.1 10.0 118 ------ 0.1 5.3 7.7 75 1700 202 390 188 1.344 0.808 2.467 3.275 0.792 0.404T36 Willow Creek (nr Watertown) 04/13/01 915 01-6072 Y 4.3 12.0 294 485 0.2 5.8 7.7 25 1000 50 345 295 2.022 0.740 1.609 2.349 0.562 0.389T36 Willow Creek (nr Watertown) 05/08/01 920 01-6151 Y 10.8 12.0 433 594 0.3 8.1 8.1 8 1800 13 437 424 0.564 0.125 1.166 1.291 0.218 0.208T36 Willow Creek (nr Watertown) 06/14/01 1130 01-6217 Y 19.5 16.0 761 849 0.4 5.3 8.1 10 12000 9 619 610 0.335 0.316 1.355 1.671 0.297 0.260T36 Willow Creek (nr Watertown) 07/20/01 1215 01-6284 Y 24.2 24.0 714 725 0.4 5.1 7.9 22 8100 23 631 608 0.553 0.238 1.528 1.766 0.329 0.244T36 Willow Creek (nr Watertown) 08/27/01 1040 01-6323 N 20.3 ------ 746 822 0.4 8.9 8.0 10 2500 14 566 552 0.402 0.192 1.204 1.396 0.202 0.143T36 Willow Creek (nr Watertown) 09/26/01 1140 01-6394 N 12.4 22.0 683 914 0.5 10.8 8.2 7 1200 12 652 640 0.286 0.092 1.016 1.108 0.101 0.022T36 Willow Creek (nr Watertown) 10/22/01 1130 01-6443 N 8.8 16.0 645 939 0.5 14.2 8.2 6 1800 10 642 632 0.354 0.096 0.850 0.946 0.064 0.019T36 Willow Creek (nr Watertown) 04/09/02 1115 02-6019 N 4.8 8.2 291 477 0.2 13.5 8.2 6 <10 9 333 324 0.564 0.292 0.718 1.010 0.160 0.116T36 Willow Creek (nr Watertown) 04/29/02 915 02-6029 Y 5.3 6.5 505 816 0.4 11.7 8.4 3 20 6 602 596 0.044 0.018 0.804 0.822 0.068 0.050T36 Willow Creek (nr Watertown) 05/09/02 1145 02-6078 Y 2.1 8.5 488 774 0.4 19.3 8.4 3 230 7 559 552 0.038 0.056 1.152 1.208 0.070 0.045T36 Willow Creek (nr Watertown) 06/10/02 1020 02-6094 N 21.5 23.5 714 765 0.4 8.8 8.3 7 260 13 505 492 0.069 0.031 1.065 1.096 0.165 0.123T36 Willow Creek (nr Watertown) 07/08/02 1050 02-6126 N 23.9 25.2 849 866 0.4 4.4 8.1 9 ----- 13 699 686 0.126 0.298 1.402 1.700 0.474 0.393T36 Willow Creek (nr Watertown) 08/07/02 945 02-6167 Y 21.4 23.8 762 818 0.4 6.6 8.1 15 1000 29 689 660 0.088 0.203 1.686 1.889 0.265 0.128T36 Willow Creek (nr Watertown) 08/21/02 1015 02-6185 Y 18.0 23.0 280 323 0.2 7.5 7.9 280 110000 160 410 250 0.662 0.345 2.705 3.050 1.247 0.773T36 Willow Creek (nr Watertown) 09/09/02 1045 02-6207 N 21.2 24.8 840 905 0.4 3.9 8.0 13 1100 7 651 644 0.102 0.216 0.990 1.206 0.145 0.082T36 Willow Creek (nr Watertown) 10/17/02 1015 02-6246 N 5.9 9.0 554 864 0.4 9.5 ------ 2 100 5 641 636 0.124 0.122 0.658 0.780 0.045 0.022

Appendix B
Site Site Name Date Time Lab# Runoff?Water
Temp C˚Air
Temp C˚Conductivity
µs/cm
Specific Conductivity
µs/cmSalinity
ppt
Dissolved Oxygen
mg/LpH
unitsTurbidity
NTU
Fecal Coliform
cfu/100mLTSS mg/L
Tot Solids mg/L
Dissolved Solids mg/L
Nitrates mg/L
Ammonia mg/L
Organic Nitrogen
mg/L TKN mg/LTot PO4
mg/LTotDis
PO4 mg/L
T37 Stray Horse Creek 06/14/01 1230 01-6219 Y 19.6 15.0 604 674 0.3 5.5 7.8 48 6900 48 680 632 3.423 0.378 2.348 2.726 0.603 0.435T37 Stray Horse Creek 07/20/01 1230 01-6285 Y 24.8 27.0 960 962 0.5 5.1 8.0 15 2000 20 756 736 0.772 0.344 1.644 1.988 0.271 0.103T37 Stray Horse Creek 08/27/01 1140 01-6325 N 23.9 32.5 766 788 0.4 12.5 8.5 18 810 25 545 520 0.510 0.060 1.974 2.034 0.191 0.029T37 Stray Horse Creek 09/26/01 1215 01-6395 N 14.3 22.0 741 936 0.5 9.6 8.5 19 40 37 673 636 0.522 0.126 1.873 1.999 0.125 0.028T37 Stray Horse Creek 10/22/01 1315 01-6445 N 9.2 17.0 717 1026 0.5 12.5 8.3 13 190 28 724 696 1.080 0.082 1.582 1.664 0.108 0.036T37 Stray Horse Creek 04/09/02 1400 02-6026 N 6.0 9.0 402 633 0.3 13.8 8.2 4 10 8 400 392 0.934 0.343 1.247 1.590 0.211 0.149T37 Stray Horse Creek 04/29/02 1000 02-6030 Y 5.8 13.0 691 1084 0.5 13.4 8.3 3 120 6 758 752 0.260 0.041 0.883 0.924 0.066 0.022T37 Stray Horse Creek 05/09/02 1015 02-6075 Y 5.3 3.5 716 1150 0.6 11.4 8.3 19 >2500 32 924 892 0.450 0.270 2.205 2.475 0.500 0.264T37 Stray Horse Creek 06/10/02 1245 02-6101 N 22.1 24.7 979 1038 0.5 10.2 8.3 8 1600 28 780 752 0.056 0.154 1.456 1.610 0.157 0.038T37 Stray Horse Creek 07/09/02 1100 02-6140 N 24.8 27.0 940 947 0.5 8.3 8.3 14 100 56 794 738 0.148 0.126 1.783 1.909 0.252 0.077T37 Stray Horse Creek 08/06/02 930 2-6155 Y 21.1 20.0 780 841 0.4 9.1 8.3 55 4500 65 749 684 0.039 0.089 2.728 2.817 0.290 0.036T37 Stray Horse Creek 08/21/02 1230 02-6191 Y 18.5 23.5 205 234 0.1 7.0 7.7 110 320000 100 272 172 0.436 0.538 1.991 2.529 0.815 0.391T37 Stray Horse Creek 09/10/02 1115 02-6217 N 19.9 23.3 772 854 0.4 6.0 8.2 16 430 13 653 640 0.043 0.195 1.249 1.444 0.196 0.088T37 Stray Horse Creek 10/17/02 1315 02-6255 N 6.4 6.5 612 946 0.5 8.2 ------ 3 60 9 673 664 0.086 0.097 0.942 1.039 0.102 0.032
T39 Lake Poinsett Outlet 06/14/01 1310 01-6221 Y 20.5 16.0 1054 1152 0.6 5.2 7.6 5 <1 4 888 884 0.136 0.484 1.536 2.020 0.237 0.228T39 Lake Poinsett Outlet 07/24/01 1300 01-6307 Y 25.4 21.0 1175 1164 0.6 2.6 7.8 7 300 6 934 928 0.061 1.102 1.309 2.411 0.286 0.247T39 Lake Poinsett Outlet 08/27/01 1230 01-6326 N 23.9 27.0 1186 1212 0.6 10.7 8.3 12 30 41 1037 996 0.058 0.156 1.476 1.632 0.228 0.182T39 Lake Poinsett Outlet 09/26/01 1300 01-6396 N 15.8 22.0 996 1215 0.6 14.1 8.7 9 20 19 1027 1008 0.048 0.191 1.342 1.533 0.259 0.201T39 Lake Poinsett Outlet 10/22/01 1345 01-6447 N 10.9 15.5 896 1238 0.6 5.2 8.6 9 <10 16 932 916 0.130 0.222 1.173 1.395 0.224 0.194T39 Lake Poinsett Outlet 04/08/02 1450 02-6012 N 9.4 10.5 844 1200 0.6 16.5 8.4 23 <10 63 971 908 0.174 0.273 1.403 1.676 0.288 0.103T39 Lake Poinsett Outlet 05/01/02 1100 02-6054 Y 10.4 13.0 899 1245 0.6 10.7 8.5 28 <10 60 1028 968 0.062 0.161 1.909 2.070 0.201 0.080T39 Lake Poinsett Outlet 05/08/02 1145 02-6066 Y 8.3 8.0 795 1166 0.6 12.1 8.5 13 190 42 882 840 0.106 0.134 1.488 1.622 0.187 0.060T39 Lake Poinsett Outlet 06/11/02 830 02-6104 N 18.8 16.0 1089 1235 0.6 7.1 8.5 16 50 56 984 928 0.050 0.193 1.574 1.767 0.281 0.156T39 Lake Poinsett Outlet 07/09/02 1215 02-6142 N 24.8 29.0 1302 1319 0.7 7.9 8.4 12 500 20 1080 1060 0.088 0.128 1.632 1.760 0.502 0.363T39 Lake Poinsett Outlet 08/06/02 940 02-6156 Y 19.3 21.0 839 941 0.5 6.2 8.6 23 2800 31 743 712 0.038 0.128 1.658 1.786 0.987 0.691T39 Lake Poinsett Outlet 08/22/02 1045 02-6201 Y 20.4 21.0 260 285 0.1 2.5 7.7 80 27000 76 312 236 0.520 0.304 1.567 1.871 0.612 0.425T39 Lake Poinsett Outlet 09/10/02 1200 02-6218 N 19.1 22.0 692 783 0.4 8.9 8.3 50 800 67 645 578 0.004 0.168 3.014 3.182 0.665 0.214T39 Lake Poinsett Outlet 10/16/02 1000 02-6241 N 4.9 2.0 583 946 0.5 7.3 ------ 20 330 48 720 672 0.036 0.124 2.055 2.179 0.261 0.013
T40 Hidewood Creek (nr Clear Lake) 06/14/01 945 01-6215 Y 20.2 17.0 511 560 0.2 6.2 7.6 9 400 4 394 390 0.284 0.466 1.068 1.534 0.219 0.173T40 Hidewood Creek (nr Clear Lake) 07/24/01 945 01-6300 Y 24.3 19.0 672 680 0.3 2.2 7.9 3 300 5 477 472 0.075 0.189 1.168 1.357 0.245 0.192T40 Hidewood Creek (nr Clear Lake) 08/27/01 930 01-6319 N 19.8 22.5 1190 1210 0.6 4.7 7.5 5 670 2 1022 1020 0.066 0.136 1.220 1.356 0.292 0.217T40 Hidewood Creek (nr Clear Lake) 09/26/01 1000 01-6392 N 10.9 19.0 1697 2395 0.8 11.3 7.7 8 680 13 1665 1652 0.104 0.522 0.740 1.262 0.181 0.108T40 Hidewood Creek (nr Clear Lake) 10/22/01 930 01-6441 N 6.9 11.0 1364 2131 1.1 14.5 7.8 6 30 5 1517 1512 1.268 0.336 0.762 1.098 0.151 0.097T40 Hidewood Creek (nr Clear Lake) 04/09/02 1000 02-6017 N 2.9 7.0 402 697 0.3 17.6 8.1 4 <10 14 498 484 0.186 0.110 1.792 1.902 0.189 0.094T40 Hidewood Creek (nr Clear Lake) 04/30/02 930 02-6038 Y 7.4 10.5 500 751 0.4 13.7 8.1 4 30 12 492 480 0.106 0.054 1.102 1.156 0.101 0.047T40 Hidewood Creek (nr Clear Lake) 05/09/02 1045 02-6076 Y 5.9 7.4 523 822 0.4 14.4 8.2 5 10 15 555 540 0.139 0.118 1.031 1.149 0.111 0.054T40 Hidewood Creek (nr Clear Lake) 06/10/02 835 02-6091 N 20.4 24.0 880 965 0.5 8.6 7.9 8 520 22 702 680 0.057 0.116 1.854 1.970 0.267 0.143T40 Hidewood Creek (nr Clear Lake) 07/08/02 900 02-6124 N 22.9 20.0 1147 1205 0.6 1.7 7.9 22 ------ 126 1070 944 0.074 2.936 2.808 5.744 1.043 0.375T40 Hidewood Creek (nr Clear Lake) 08/07/02 830 02-6163 Y 19.9 24.7 1651 1829 0.9 1.4 7.6 26 42000 104 1628 1524 0.094 7.850 3.096 10.946 1.134 0.790T40 Hidewood Creek (nr Clear Lake) 08/21/02 845 02-6182 Y 17.6 25.0 1954 2287 1.2 3.6 7.4 23 20000 36 1920 1884 3.515 0.630 2.951 3.581 0.575 0.353T40 Hidewood Creek (nr Clear Lake) 09/10/02 1030 02-6214 N 16.4 18.0 2132 2550 1.4 2.5 8.0 85 990 98 1994 1896 0.084 1.030 3.612 4.642 0.718 0.127T40 Hidewood Creek (nr Clear Lake) 10/17/02 900 02-6244 N 3.9 4.0 1822 3068 1.6 9.9 ------ 9 440 29 2113 2084 0.740 0.521 0.876 1.397 0.212 0.128
T41 Hidewood Creek (nr Estelline) 06/14/01 1330 01-6222 Y 19.3 16.0 379 425 0.2 6.2 7.8 116 3300 98 450 352 2.302 0.184 1.914 2.098 0.417 0.175T41 Hidewood Creek (nr Estelline) 07/20/01 1315 01-6286 Y 24.4 ------ 800 810 0.4 8.2 8.2 5 2500 6 526 520 0.905 0.088 0.742 0.830 0.103 0.090T41 Hidewood Creek (nr Estelline) 08/27/01 1215 01-6327 N 23.9 27.0 782 819 0.4 14.5 8.0 10 270 16 592 576 1.138 0.027 1.162 1.189 0.083 0.017T41 Hidewood Creek (nr Estelline) 09/26/01 1330 01-6397 N 13.4 25.0 647 833 0.4 15.8 8.4 5 2300 6 502 496 1.131 0.034 0.906 0.940 0.048 0.009T41 Hidewood Creek (nr Estelline) 10/22/01 1430 01-6448 N 9.8 16.0 654 927 0.5 13.9 8.3 7 220 10 618 608 1.554 0.054 0.582 0.636 0.047 0.038T41 Hidewood Creek (nr Estelline) 04/08/02 1515 02-6013 N 6.4 11.0 330 513 0.2 17.4 8.1 21 40 54 362 308 0.652 0.328 1.076 1.404 0.243 0.115T41 Hidewood Creek (nr Estelline) 04/29/02 1015 02-6031 Y 7.3 12.0 550 834 0.4 14.7 8.3 6 70 17 585 568 0.090 0.045 0.756 0.801 0.072 0.025T41 Hidewood Creek (nr Estelline) 05/08/02 1230 02-6067 Y 7.6 9.7 525 787 0.4 14.6 8.2 5 460 14 522 508 0.271 0.050 1.220 1.270 0.065 0.013T41 Hidewood Creek (nr Estelline) 06/11/02 845 02-6105 N 18.0 19.0 777 896 0.4 10.1 8.2 8 700 18 610 592 0.312 0.186 0.891 1.077 0.124 0.045T41 Hidewood Creek (nr Estelline) 07/09/02 1030 02-6139 N 22.7 24.0 780 826 0.4 11.1 8.5 11 100 100 732 632 0.116 0.086 1.400 1.486 0.108 0.038T41 Hidewood Creek (nr Estelline) 08/06/02 DRY DRY DRY DRY DRY DRY DRY DRY DRY DRY DRY DRY DRY DRY DRY DRY DRY DRY DRY DRY DRY
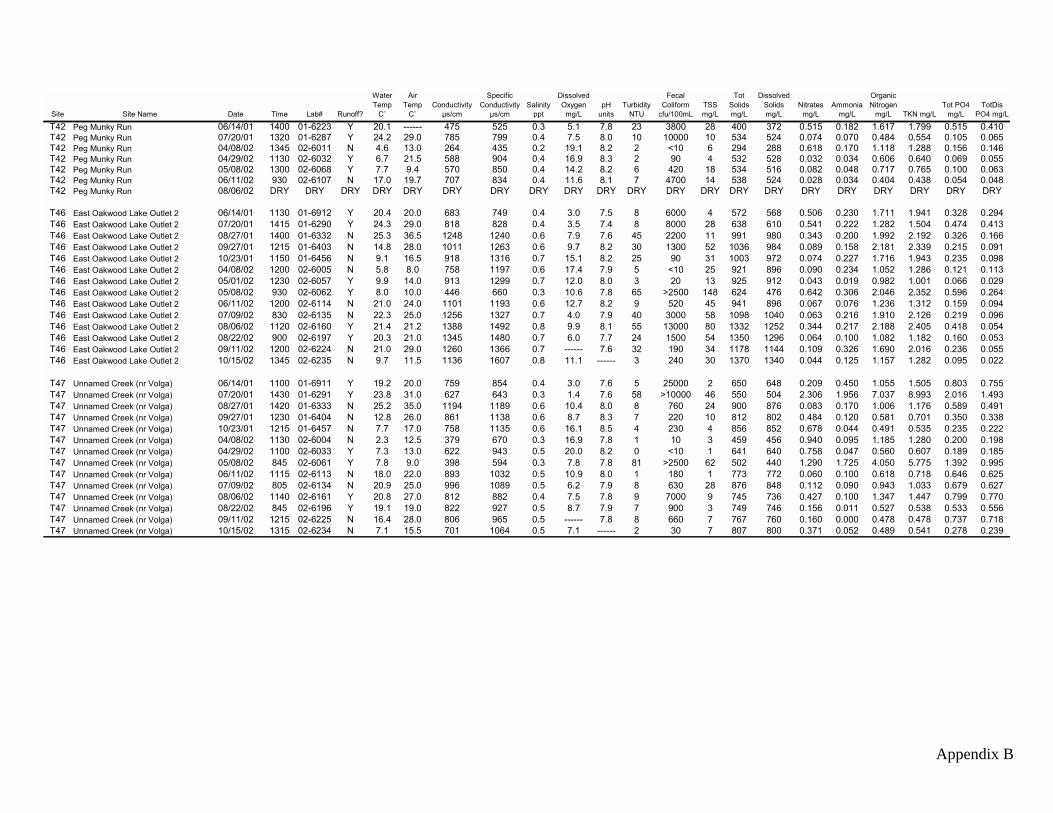
Appendix B
Site Site Name Date Time Lab# Runoff?
Water Temp
C˚
Air Temp
C˚Conductivity
µs/cm
Specific Conductivity
µs/cmSalinity
ppt
Dissolved Oxygen
mg/LpH
unitsTurbidity
NTU
Fecal Coliform
cfu/100mLTSS mg/L
Tot Solids mg/L
Dissolved Solids mg/L
Nitrates mg/L
Ammonia mg/L
Organic Nitrogen
mg/L TKN mg/LTot PO4
mg/LTotDis
PO4 mg/L
T42 Peg Munky Run 06/14/01 1400 01-6223 Y 20.1 ------ 475 525 0.3 5.1 7.8 23 3800 28 400 372 0.515 0.182 1.617 1.799 0.515 0.410T42 Peg Munky Run 07/20/01 1320 01-6287 Y 24.2 29.0 785 799 0.4 7.5 8.0 10 10000 10 534 524 0.074 0.070 0.484 0.554 0.105 0.065T42 Peg Munky Run 04/08/02 1345 02-6011 N 4.6 13.0 264 435 0.2 19.1 8.2 2 <10 6 294 288 0.618 0.170 1.118 1.288 0.156 0.146T42 Peg Munky Run 04/29/02 1130 02-6032 Y 6.7 21.5 588 904 0.4 16.9 8.3 2 90 4 532 528 0.032 0.034 0.606 0.640 0.069 0.055T42 Peg Munky Run 05/08/02 1300 02-6068 Y 7.7 9.4 570 850 0.4 14.2 8.2 6 420 18 534 516 0.082 0.048 0.717 0.765 0.100 0.063T42 Peg Munky Run 06/11/02 930 02-6107 N 17.0 19.7 707 834 0.4 11.6 8.1 7 4700 14 538 524 0.028 0.034 0.404 0.438 0.054 0.048T42 Peg Munky Run 08/06/02 DRY DRY DRY DRY DRY DRY DRY DRY DRY DRY DRY DRY DRY DRY DRY DRY DRY DRY DRY DRY DRY
T46 East Oakwood Lake Outlet 2 06/14/01 1130 01-6912 Y 20.4 20.0 683 749 0.4 3.0 7.5 8 6000 4 572 568 0.506 0.230 1.711 1.941 0.328 0.294T46 East Oakwood Lake Outlet 2 07/20/01 1415 01-6290 Y 24.3 29.0 818 828 0.4 3.5 7.4 8 8000 28 638 610 0.541 0.222 1.282 1.504 0.474 0.413T46 East Oakwood Lake Outlet 2 08/27/01 1400 01-6332 N 25.3 36.5 1248 1240 0.6 7.9 7.6 45 2200 11 991 980 0.343 0.200 1.992 2.192 0.326 0.166T46 East Oakwood Lake Outlet 2 09/27/01 1215 01-6403 N 14.8 28.0 1011 1263 0.6 9.7 8.2 30 1300 52 1036 984 0.089 0.158 2.181 2.339 0.215 0.091T46 East Oakwood Lake Outlet 2 10/23/01 1150 01-6456 N 9.1 16.5 918 1316 0.7 15.1 8.2 25 90 31 1003 972 0.074 0.227 1.716 1.943 0.235 0.098T46 East Oakwood Lake Outlet 2 04/08/02 1200 02-6005 N 5.8 8.0 758 1197 0.6 17.4 7.9 5 <10 25 921 896 0.090 0.234 1.052 1.286 0.121 0.113T46 East Oakwood Lake Outlet 2 05/01/02 1230 02-6057 Y 9.9 14.0 913 1299 0.7 12.0 8.0 3 20 13 925 912 0.043 0.019 0.982 1.001 0.066 0.029T46 East Oakwood Lake Outlet 2 05/08/02 930 02-6062 Y 8.0 10.0 446 660 0.3 10.6 7.8 65 >2500 148 624 476 0.642 0.306 2.046 2.352 0.596 0.264T46 East Oakwood Lake Outlet 2 06/11/02 1200 02-6114 N 21.0 24.0 1101 1193 0.6 12.7 8.2 9 520 45 941 896 0.067 0.076 1.236 1.312 0.159 0.094T46 East Oakwood Lake Outlet 2 07/09/02 830 02-6135 N 22.3 25.0 1256 1327 0.7 4.0 7.9 40 3000 58 1098 1040 0.063 0.216 1.910 2.126 0.219 0.096T46 East Oakwood Lake Outlet 2 08/06/02 1120 02-6160 Y 21.4 21.2 1388 1492 0.8 9.9 8.1 55 13000 80 1332 1252 0.344 0.217 2.188 2.405 0.418 0.054T46 East Oakwood Lake Outlet 2 08/22/02 900 02-6197 Y 20.3 21.0 1345 1480 0.7 6.0 7.7 24 1500 54 1350 1296 0.064 0.100 1.082 1.182 0.160 0.053T46 East Oakwood Lake Outlet 2 09/11/02 1200 02-6224 N 21.0 29.0 1260 1366 0.7 ------ 7.6 32 190 34 1178 1144 0.109 0.326 1.690 2.016 0.236 0.055T46 East Oakwood Lake Outlet 2 10/15/02 1345 02-6235 N 9.7 11.5 1136 1607 0.8 11.1 ------ 3 240 30 1370 1340 0.044 0.125 1.157 1.282 0.095 0.022
T47 Unnamed Creek (nr Volga) 06/14/01 1100 01-6911 Y 19.2 20.0 759 854 0.4 3.0 7.6 5 25000 2 650 648 0.209 0.450 1.055 1.505 0.803 0.755T47 Unnamed Creek (nr Volga) 07/20/01 1430 01-6291 Y 23.8 31.0 627 643 0.3 1.4 7.6 58 >10000 46 550 504 2.306 1.956 7.037 8.993 2.016 1.493T47 Unnamed Creek (nr Volga) 08/27/01 1420 01-6333 N 25.2 35.0 1194 1189 0.6 10.4 8.0 8 760 24 900 876 0.083 0.170 1.006 1.176 0.589 0.491T47 Unnamed Creek (nr Volga) 09/27/01 1230 01-6404 N 12.8 26.0 861 1138 0.6 8.7 8.3 7 220 10 812 802 0.484 0.120 0.581 0.701 0.350 0.338T47 Unnamed Creek (nr Volga) 10/23/01 1215 01-6457 N 7.7 17.0 758 1135 0.6 16.1 8.5 4 230 4 856 852 0.678 0.044 0.491 0.535 0.235 0.222T47 Unnamed Creek (nr Volga) 04/08/02 1130 02-6004 N 2.3 12.5 379 670 0.3 16.9 7.8 1 10 3 459 456 0.940 0.095 1.185 1.280 0.200 0.198T47 Unnamed Creek (nr Volga) 04/29/02 1100 02-6033 Y 7.3 13.0 622 943 0.5 20.0 8.2 0 <10 1 641 640 0.758 0.047 0.560 0.607 0.189 0.185T47 Unnamed Creek (nr Volga) 05/08/02 845 02-6061 Y 7.8 9.0 398 594 0.3 7.8 7.8 81 >2500 62 502 440 1.290 1.725 4.050 5.775 1.392 0.995T47 Unnamed Creek (nr Volga) 06/11/02 1115 02-6113 N 18.0 22.0 893 1032 0.5 10.9 8.0 1 180 1 773 772 0.060 0.100 0.618 0.718 0.646 0.625T47 Unnamed Creek (nr Volga) 07/09/02 805 02-6134 N 20.9 25.0 996 1089 0.5 6.2 7.9 8 630 28 876 848 0.112 0.090 0.943 1.033 0.679 0.627T47 Unnamed Creek (nr Volga) 08/06/02 1140 02-6161 Y 20.8 27.0 812 882 0.4 7.5 7.8 9 7000 9 745 736 0.427 0.100 1.347 1.447 0.799 0.770T47 Unnamed Creek (nr Volga) 08/22/02 845 02-6196 Y 19.1 19.0 822 927 0.5 8.7 7.9 7 900 3 749 746 0.156 0.011 0.527 0.538 0.533 0.556T47 Unnamed Creek (nr Volga) 09/11/02 1215 02-6225 N 16.4 28.0 806 965 0.5 ------ 7.8 8 660 7 767 760 0.160 0.000 0.478 0.478 0.737 0.718T47 Unnamed Creek (nr Volga) 10/15/02 1315 02-6234 N 7.1 15.5 701 1064 0.5 7.1 ------ 2 30 7 807 800 0.371 0.052 0.489 0.541 0.278 0.239

Appendix B
Site Site Name Date Time Lab# Runoff?Water
Temp C˚Air
Temp C˚Conductivity
µs/cm
Specific Conductivity
µs/cmSalinity
ppt
Dissolved Oxygen
mg/LpH
unitsTurbidity
NTU
Fecal Coliform
cfu/100mLTSS mg/L
Tot Solids mg/L
Dissolved Solids mg/L
Nitrates mg/L
Ammonia mg/L
Organic Nitrogen
mg/LTKN mg/L
Tot PO4 mg/L
TotDis PO4 mg/L
R01 BSR near Brookings 04/09/01 730 01-6049 Y 4.6 4.0 209 341.2 0.2 9.0 8.2 39 650 56 284 228 1.470 0.585 1.674 2.259 0.508 0.411R01 BSR near Brookings 04/13/01 1300 01-6093 Y 6.7 14.0 261 403.0 0.2 5.4 9.0 18 140 37 327 290 1.202 0.320 1.150 1.470 0.390 0.311R01 BSR near Brookings 05/08/01 900 01-6159 Y 12.9 16.0 677 891.0 0.4 6.8 7.4 6 100 14 578 564 0.039 0.066 0.945 1.011 0.168 0.130R01 BSR near Brookings 06/15/01 1000 01-6921 Y 17.6 17.0 583 679.0 0.3 7.1 7.7 18 600 28 492 464 0.867 0.202 1.336 1.538 0.391 0.332R01 BSR near Brookings 07/25/01 1000 01-6314 Y 24.2 20.0 884 897.0 0.4 5.1 7.8 24 700 72 728 656 0.554 0.254 1.423 1.677 0.390 0.292R01 BSR near Brookings 08/28/01 1300 01-6341 N 23.3 31.5 1136 1175.0 0.6 13.8 8.5 31 110 107 1007 900 0.083 0.029 1.750 1.779 0.276 0.141R01 BSR near Brookings 09/26/01 1245 01-6389 N 15.8 16.0 891 1083.0 0.5 15.7 8.5 16 70 40 904 864 0.496 0.042 1.291 1.333 0.246 0.171R01 BSR near Brookings 10/23/01 1230 01-6458 N 9.7 20.0 820 1157.0 0.6 15.8 8.7 4 240 9 845 836 0.168 0.040 1.022 1.062 0.141 0.091R01 BSR near Brookings 04/08/02 1045 02-6003 Y 7.2 7.5 499 754.0 0.4 11.7 8.5 44 <10 146 638 492 0.952 0.400 1.440 1.840 0.463 0.230R01 BSR near Brookings 05/01/02 1330 02-6058 Y 11.7 14.0 715 959.0 0.5 9.6 8.3 56 40 130 766 636 0.282 0.042 1.393 1.435 0.358 0.080R01 BSR near Brookings 05/09/02 750 02-6072 Y 5.9 3.5 454 715.0 0.3 13.9 8.1 67 >2500 182 666 484 0.694 0.258 1.697 1.955 0.578 0.239R01 BSR near Brookings 06/11/02 1230 02-6115 N 20.9 28.0 877 952.0 0.5 15.2 8.5 50 260 154 798 644 0.041 0.067 2.056 2.123 0.417 0.033R01 BSR near Brookings 07/09/02 1245 02-6143 N 25.8 29.0 827 814.0 0.4 10.9 8.5 60 250 129 717 588 0.074 0.100 1.896 1.996 0.400 0.074R01 BSR near Brookings 08/06/02 1200 02-6162 Y 22.6 26.0 706 739.0 0.4 12.4 8.4 37 1400 78 590 512 0.070 0.106 1.486 1.592 0.296 0.037R01 BSR near Brookings 08/22/02 815 02-6195 Y 21.8 19.0 750 798.0 0.4 7.2 8.0 55 600 100 680 580 0.034 0.090 1.678 1.768 0.426 0.037R01 BSR near Brookings 09/11/02 1245 02-6226 N 20.8 26.8 708 770.0 0.4 ------ 8.3 65 140 98 650 552 0.040 0.176 1.994 2.170 0.445 0.067R01 BSR near Brookings 10/15/02 1300 02-6233 N 8.2 7.5 632 930.0 0.5 13.9 ------ 5 <10 14 694 680 0.098 0.098 1.130 1.228 0.218 0.082
R14 BSR at Watertown 04/08/01 1510 01-6042 Y 3.9 10.0 111 185 0.1 8.4 8.3 18 250 10 122 112 0.866 0.306 1.133 1.439 0.430 0.349R14 BSR at Watertown 04/13/01 1000 01-6086 Y 4.8 13.0 168 274 0.1 5.0 7.8 11 30 5 200 195 0.914 0.252 0.904 1.156 0.303 0.285R14 BSR at Watertown 05/08/01 1000 01-6152 Y 10.8 13.0 546 748 0.4 7.7 8.2 5 2200 6 494 488 0.144 0.096 1.532 1.628 0.111 0.077R14 BSR at Watertown 06/15/01 1030 01-6227 Y 17.3 19.0 523 613 0.3 6.7 7.9 11 1500 35 475 440 0.235 0.312 1.212 1.524 0.237 0.172R14 BSR at Watertown 07/24/01 1100 01-6302 Y 23.2 19.0 778 803 0.4 7.0 8.2 17 800 35 583 548 0.116 0.131 1.379 1.510 0.235 0.087R14 BSR at Watertown 08/28/01 930 01-6334 N 19.1 27.5 682 760 0.4 8.2 8.2 22 1800 25 525 500 0.168 0.069 1.633 1.702 0.153 0.082R14 BSR at Watertown 09/26/01 1020 01-6384 N 11.1 14.0 511 700 0.3 7.2 8.3 7 430 9 469 460 0.196 0.076 0.578 0.654 0.057 0.035R14 BSR at Watertown 10/24/01 930 01-6461 N 3.9 1.0 138 235 0.1 16.4 8.6 18 320 43 439 396 0.140 0.041 0.596 0.637 0.106 0.030R14 BSR at Watertown 04/09/02 1130 02-6020 Y 6.3 9.0 320 494 0.1 14.9 8.2 11 <10 27 331 304 0.596 0.159 0.820 0.979 0.161 0.080R14 BSR at Watertown 04/30/02 1045 02-6042 Y 11.5 11.0 504 678 0.3 11.0 8.2 17 50 52 496 444 0.086 0.119 0.946 1.065 0.153 0.039R14 BSR at Watertown 05/09/02 1215 02-6079 Y 6.8 6.0 480 740 0.4 15.7 8.5 24 520 87 559 472 0.086 0.116 1.226 1.342 0.214 0.032R14 BSR at Watertown 06/10/02 1030 02-6095 N 21.9 25.0 599 638 0.3 11.4 8.5 13 1000 36 428 392 0.063 0.059 1.152 1.211 0.148 0.060R14 BSR at Watertown 07/08/02 1200 02-6128 N 24.5 28.5 611 617 0.3 9.5 8.4 16 3400 28 464 436 0.078 0.048 1.605 1.653 0.185 0.083R14 BSR at Watertown 08/07/02 1015 02-6168 Y 21.9 24.0 650 691 0.3 8.5 8.1 60 1300 70 598 528 0.122 0.339 1.978 2.317 0.320 0.080R14 BSR at Watertown 08/21/02 1045 02-6186 Y 19.0 25.5 471 531 0.3 8.2 8.0 50 11000 44 480 436 0.164 0.124 1.253 1.377 0.341 0.207R14 BSR at Watertown 09/09/02 1115 02-6208 N 22.3 26.0 630 664 0.3 5.3 8.4 65 4500 51 495 444 0.076 0.244 1.533 1.777 0.216 0.058R14 BSR at Watertown 10/17/02 1045 02-6249 N 5.0 4.5 450 728 0.4 7.7 ------ 7 1700 25 517 492 0.185 0.036 0.522 0.558 0.047 0.021
R15 BSR at Braoadway 04/08/01 1555 01-6043 Y 2.2 9.0 89 159 0.1 6.0 7.9 30 260 47 159 112 0.714 0.331 1.070 1.401 0.376 0.282R15 BSR at Braoadway 04/13/01 1015 01-6087 Y 5.4 11.0 196 317 0.2 6.2 7.9 11 <10 12 242 230 0.961 0.214 0.867 1.081 0.312 0.256R15 BSR at Braoadway 05/08/01 1030 01-6153 Y 13.0 14.0 527 718 0.4 6.1 8.0 4 1400 8 484 476 0.114 0.051 1.058 1.109 0.126 0.072R15 BSR at Braoadway 06/15/01 1100 01-6226 Y 18.0 18.5 522 602 0.3 6.6 7.9 18 1600 43 495 452 0.212 0.301 1.338 1.639 0.239 0.136R15 BSR at Braoadway 07/24/01 1130 01-6303 Y 25.7 20.0 716 707 0.3 5.3 8.5 21 800 30 526 496 0.164 0.125 1.146 1.271 0.181 0.111R15 BSR at Braoadway 08/28/01 1000 01-6335 N 21.0 29.0 750 812 0.4 8.5 7.9 13 80 15 571 556 0.262 0.292 1.251 1.543 0.220 0.127R15 BSR at Braoadway 09/26/01 1000 01-6383 N 13.3 14.0 578 743 0.4 11.6 8.3 6 60 8 532 524 0.208 0.201 0.640 0.841 0.141 0.081R15 BSR at Braoadway 10/24/01 1000 01-6462 N 6.3 1.5 459 707 0.3 16.5 8.4 6 <10 8 452 444 0.174 0.092 0.447 0.539 0.069 0.050R15 BSR at Braoadway 04/09/02 1220 02-6022 Y 6.3 8.5 322 500 0.2 17.3 8.1 8 <10 20 330 310 0.454 0.095 0.826 0.921 0.163 0.096R15 BSR at Braoadway 04/30/02 1130 02-6044 Y 11.1 11.0 548 745 0.4 14.2 8.3 15 30 46 570 524 0.066 0.072 0.957 1.029 0.154 0.049R15 BSR at Braoadway 05/09/02 1315 02-6081 Y 6.3 5.5 466 724 0.4 16.6 8.3 8 890 20 504 484 0.098 0.117 0.842 0.959 0.105 0.045R15 BSR at Braoadway 06/10/02 1115 02-6097 N 22.2 25.2 624 659 0.3 8.2 8.3 21 410 53 437 384 0.076 0.213 1.158 1.371 0.192 0.065R15 BSR at Braoadway 07/08/02 1230 02-6129 N 25.3 28.0 693 690 0.3 7.5 8.1 13 4000 25 497 472 0.496 0.292 1.206 1.498 0.207 0.114R15 BSR at Braoadway 08/07/02 1045 02-6170 Y 22.7 25.0 670 701 0.3 6.8 8.0 20 300 45 521 476 0.558 0.375 1.012 1.387 0.212 0.091R15 BSR at Braoadway 08/21/02 1120 02-6188 Y 18.7 23.0 329 374 0.2 7.6 7.7 40 8000 27 263 236 0.660 0.398 0.709 1.107 0.239 0.114R15 BSR at Braoadway 09/09/02 1230 02-6210 N 22.8 28.0 822 858 0.4 7.1 7.8 22 70 24 572 548 1.064 0.278 0.767 1.045 0.179 0.090R15 BSR at Braoadway 10/17/02 1130 02-6251 N 6.7 5.5 577 886 0.4 11.1 ------ 2 10 20 604 584 1.851 0.320 0.656 0.976 0.097 0.039

Appendix B
Site Site Name Date Time Lab# Runoff?
Water Temp
C˚
Air Temp
C˚Conductivity
µs/cm
Specific Conductivity
µs/cmSalinity
ppt
Dissolved Oxygen
mg/LpH
unitsTurbidity
NTU
Fecal Coliform
cfu/100mLTSS mg/L
Tot Solids mg/L
Dissolved Solids mg/L
Nitrates mg/L
Ammonia mg/L
Organic Nitrogen
mg/L TKN mg/LTot PO4
mg/LTotDis
PO4 mg/L
R16 BSR 20th Ave 04/08/01 1615 01-6044 Y 3.1 8.0 97 168 0.1 7.3 7.6 32 450 34 166 132 0.718 0.350 1.004 1.354 0.360 0.253R16 BSR 20th Ave 04/13/01 1040 01-6088 Y 5.1 11.0 196 315 0.1 4.9 8.1 10 50 9 239 230 0.972 0.202 0.892 1.094 0.329 0.295R16 BSR 20th Ave 05/08/01 1100 01-6154 Y 11.2 14.0 513 695 0.3 7.5 8.2 3 1300 7 483 476 0.094 0.068 0.986 1.054 0.145 0.113R16 BSR 20th Ave 06/15/01 1120 01-6228 Y 18.0 15.5 537 620 0.3 6.1 7.8 21 900 49 469 420 0.264 0.348 1.358 1.706 0.341 0.215R16 BSR 20th Ave 07/24/01 1145 01-6304 Y 24.9 20.0 758 757 0.4 5.6 8.2 22 800 46 562 516 0.571 0.208 1.218 1.426 0.404 0.299R16 BSR 20th Ave 08/28/01 1040 01-6336 N 19.8 28.5 1002 1114 0.6 15.8 7.7 6 100 8 736 728 9.761 0.130 1.942 2.072 2.492 2.413R16 BSR 20th Ave 09/26/01 930 01-6382 N 15.3 12.0 901 1107 0.6 8.3 7.8 4 90 8 768 760 10.718 0.277 1.724 2.001 2.623 2.595R16 BSR 20th Ave 10/24/01 1030 01-6463 N 9.4 0.5 556 792 0.4 15.3 8.3 8 40 12 636 624 6.462 0.132 1.403 1.535 1.886 1.705R16 BSR 20th Ave 04/09/02 1245 02-6023 Y 8.2 10.0 370 545 0.3 9.9 8.2 8 <10 18 390 372 0.636 0.209 0.828 1.037 0.202 0.111R16 BSR 20th Ave 04/30/02 1145 02-6045 Y 12.2 16.0 580 768 0.4 14.4 8.2 9 20 23 535 512 0.204 0.034 1.314 1.348 0.212 0.135R16 BSR 20th Ave 05/09/02 1320 02-6082 Y 6.9 5.5 487 744 0.4 12.3 8.3 9 1500 22 518 496 0.188 0.106 0.876 0.982 0.233 0.126R16 BSR 20th Ave 06/10/02 1130 02-6098 N 20.6 25.0 706 762 0.4 9.6 8.1 16 580 43 523 480 4.457 0.186 1.856 2.042 0.982 0.914R16 BSR 20th Ave 07/08/02 1300 02-6130 N 21.8 28.0 1004 1073 0.5 12.1 7.9 10 ----- 59 771 712 11.404 0.166 2.232 2.398 2.751 2.426R16 BSR 20th Ave 08/07/02 1115 02-6171 Y 21.1 25.5 1029 1115 0.6 11.1 7.9 12 3500 21 753 732 10.823 0.248 2.202 2.450 2.956 2.797R16 BSR 20th Ave 08/21/02 1200 02-6190 Y 18.6 24.1 315 361 0.2 6.5 7.7 70 10000 36 284 248 0.968 0.252 0.852 1.104 0.608 0.517R16 BSR 20th Ave 09/09/02 1245 02-6211 N 21.4 30.0 758 813 0.4 6.3 7.5 29 6900 43 583 540 9.414 0.440 2.502 2.942 2.232 1.766R16 BSR 20th Ave 10/17/02 1145 02-6252 N 12.0 4.0 844 1122 0.6 9.2 ------ 3 <10 8 738 730 10.550 0.232 1.680 1.912 2.256 2.068
R17 BSR below Watertown 04/08/01 1640 01-6045 Y 3.4 7.0 112 191 0.1 3.6 7.4 47 500 74 201 127 0.978 0.550 1.358 1.908 0.537 0.360R17 BSR below Watertown 04/13/01 1100 01-6089 Y 4.9 12.0 214 348 0.2 5.1 ----- 15 190 21 226 205 1.214 0.292 1.098 1.390 0.329 0.294R17 BSR below Watertown 05/08/01 1120 01-6155 Y 11.2 14.0 499 677 0.3 7.6 8.3 6 1900 16 448 432 0.316 0.114 1.064 1.178 0.203 0.158R17 BSR below Watertown 06/15/01 1145 01-6229 Y 18.0 15.0 594 685 0.3 6.3 8.0 20 1200 48 552 504 0.500 0.318 1.317 1.635 0.342 0.256R17 BSR below Watertown 07/24/01 1200 01-6305 Y 23.2 21.0 736 763 0.4 6.8 8.2 29 2500 56 560 504 1.096 0.184 1.402 1.586 0.477 0.338R17 BSR below Watertown 08/28/01 1100 01-6337 N 20.4 28.0 786 858 0.4 6.5 8.4 23 2000 37 677 640 2.882 0.094 1.852 1.946 0.764 0.507R17 BSR below Watertown 09/26/01 1100 01-6385 N 12.6 15.0 552 702 0.3 7.4 8.3 19 13200 23 699 676 5.391 0.181 1.480 1.661 1.202 1.131R17 BSR below Watertown 10/24/01 1045 01-6464 N 4.5 -0.5 628 1031 0.5 14.7 8.6 11 470 12 684 672 4.893 0.145 1.273 1.418 1.221 1.146R17 BSR below Watertown 04/09/02 1300 02-6024 Y 8.2 11.0 405 598 0.3 12.3 8.2 7 <10 18 422 404 1.203 0.238 0.903 1.141 0.315 0.209R17 BSR below Watertown 04/30/02 1215 02-6046 Y 12.1 15.0 610 807 0.4 14.2 8.4 6 <10 26 590 564 0.635 0.046 1.052 1.098 0.285 0.198R17 BSR below Watertown 05/09/02 1330 02-6083 Y 6.8 6.0 481 737 0.4 17.8 8.4 6 2000 54 530 476 0.758 0.150 1.148 1.298 0.353 0.206R17 BSR below Watertown 06/10/02 1145 02-6099 N 22.1 24.5 780 826 0.4 10.9 8.3 15 1600 42 538 496 2.600 0.383 1.412 1.795 0.811 0.620R17 BSR below Watertown 07/08/02 1315 02-6131 N 26.4 29.0 970 941 0.5 12.5 8.5 9 ----- 60 728 668 4.854 0.338 2.295 2.633 1.159 1.056R17 BSR below Watertown 08/07/02 1130 02-6172 Y 22.6 24.5 715 750 0.4 9.9 8.2 33 2600 50 566 516 3.395 0.488 1.560 2.048 1.357 1.123R17 BSR below Watertown 08/21/02 1145 02-6189 Y 18.7 25.0 403 458 0.2 6.9 7.7 110 33000 141 481 340 0.432 0.203 1.635 1.838 0.550 0.201R17 BSR below Watertown 09/09/02 1330 02-6212 N 23.6 29.1 954 992 0.5 6.3 8.2 37 1300 43 687 644 4.059 0.254 1.826 2.080 1.273 1.121R17 BSR below Watertown 10/17/02 1215 02-6253 N 7.0 10.5 688 1046 0.5 7.4 ------ 7 960 17 669 652 6.478 0.191 1.328 1.519 1.511 1.342
R18 BSR nr Castlewood 04/08/01 1730 01-6046 Y 5.3 8.0 172 276 0.1 4.5 7.3 43 650 53 229 176 1.386 0.675 1.730 2.405 0.691 0.509R18 BSR nr Castlewood 04/13/01 1130 01-6090 Y 5.1 12.0 217 349 0.2 5.3 8.3 14 1400 6 196 190 1.204 0.387 1.352 1.739 0.462 0.381R18 BSR nr Castlewood 05/08/01 1200 01-6156 Y 13.9 14.0 519 658 0.3 7.5 8.1 2 100 5 421 416 0.036 0.072 1.303 1.375 0.230 0.189R18 BSR nr Castlewood 06/15/01 1230 01-6230 Y 17.8 17.0 614 711 0.3 7.3 7.9 15 1800 37 549 512 0.936 0.281 1.408 1.689 0.427 0.344R18 BSR nr Castlewood 07/25/01 1130 01-6311 Y 22.8 25.0 780 815 0.4 10.3 8.0 21 1000 53 581 528 1.178 0.178 1.161 1.339 0.460 0.338R18 BSR nr Castlewood 08/28/01 1130 01-6338 N 19.8 28.0 872 969 0.5 18.0 8.4 26 800 48 708 660 1.413 0.065 1.858 1.923 0.442 0.286R18 BSR nr Castlewood 09/26/01 1130 01-6386 N 13.4 15.0 725 933 0.5 10.2 8.3 19 1700 22 702 680 3.699 0.131 1.303 1.434 0.726 0.629R18 BSR nr Castlewood 10/24/01 1100 01-6465 N 4.7 0.5 620 1011 0.5 14.9 8.5 15 1100 22 682 660 3.374 0.058 1.190 1.248 0.934 0.740R18 BSR nr Castlewood 04/09/02 1330 02-6025 Y 8.6 9.5 427 623 0.3 12.4 8.3 13 <10 37 421 384 1.560 0.326 1.131 1.457 0.394 0.277R18 BSR nr Castlewood 04/30/02 1245 02-6047 Y 12.7 13.0 600 784 0.4 20.0 8.5 8 50 28 506 478 0.590 0.049 1.147 1.196 0.296 0.183R18 BSR nr Castlewood 05/09/02 940 02-6074 Y 5.1 8.7 414 668 0.3 16.6 8.3 19 480 46 522 476 1.132 0.292 1.127 1.419 0.426 0.285R18 BSR nr Castlewood 06/10/02 1230 02-6100 N 22.0 24.3 815 864 0.4 9.0 8.3 65 6500 74 602 528 1.854 0.387 1.860 2.247 0.834 0.529R18 BSR nr Castlewood 07/09/02 1145 02-6141 N 23.9 29.0 911 931 0.5 9.6 8.4 55 11200 152 800 648 1.546 0.148 2.315 2.463 1.344 0.740R18 BSR nr Castlewood 08/06/02 900 02-6153 Y 19.6 18.0 878 980 0.5 7.9 7.8 22 16000 65 701 636 1.365 0.382 1.816 2.198 1.038 0.883R18 BSR nr Castlewood 08/21/02 1245 02-6192 Y 18.7 20.8 180 220 0.1 7.1 7.7 340 410000 314 498 184 0.698 0.798 3.310 4.108 1.502 0.674R18 BSR nr Castlewood 09/09/02 1400 02-6213 N 25.0 31.0 916 915 0.4 11.4 8.8 35 2900 84 686 602 1.234 0.150 2.366 2.516 0.470 0.208R18 BSR nr Castlewood 10/17/02 1300 02-6254 N 7.4 8.0 679 1026 0.5 12.7 ------ 3 300 13 681 668 4.018 0.116 1.156 1.272 0.706 0.622

Appendix B
Site Site Name Date Time Lab# Runoff?
Water Temp
C˚
Air Temp
C˚Conductivity
µs/cm
Specif ic Conductivity
µs/cmSalinity
ppt
Dissolved Oxygen
mg/LpH
unitsTurbidity
NTU
Fecal Coliform
cfu/100mLTSS mg/L
Tot Solids mg/L
Dissolved Solids mg/L
Nitrates mg/L
Ammonia mg/L
Organic Nitrogen
mg/L TKN mg/LTot PO4
mg/LTotDis
PO4 mg/L
R19 BSR nr Estelline 04/08/01 1750 01-6047 Y 4.7 9.0 149 244 0.1 2.6 7.9 55 600 75 255 180 1.516 0.576 1.652 2.228 0.488 0.306R19 BSR nr Estelline 04/13/01 1200 01-6091 Y 5.5 13.0 268 429 0.2 5.4 7.7 22 800 32 332 300 1.705 0.442 1.738 2.180 0.385 0.292R19 BSR nr Estelline 05/08/01 1230 01-6157 Y 12.4 16.0 632 831 0.4 7.7 8.2 5 4000 9 573 564 0.194 0.104 1.113 1.217 0.222 0.158R19 BSR nr Estelline 06/15/01 1130 01-6923 Y 18.1 20.0 610 701 0.3 8.5 7.9 16 1300 26 504 478 1.000 0.248 1.443 1.691 0.377 0.287R19 BSR nr Estelline 07/25/01 1200 01-6312 Y 24.3 28.0 981 993 0.5 6.3 7.8 24 900 ----- ------ ----- 0.525 0.595 1.720 2.315 0.396 0.262R19 BSR nr Estelline 08/28/01 1200 01-6339 N 24.0 30.5 975 995 0.5 10.1 8.6 21 10 48 1024 976 0.150 0.062 1.606 1.668 0.143 0.131R19 BSR nr Estelline 09/26/01 1145 01-6387 N 15.2 16.0 411 509 0.2 8.3 8.6 17 50 30 866 836 0.433 0.079 1.361 1.440 0.285 0.208R19 BSR nr Estelline 10/24/01 1130 01-6466 N 6.1 2.0 723 1152 0.6 13.7 8.5 13 20 39 875 836 0.624 0.108 1.535 1.643 0.281 0.149R19 BSR nr Estelline 04/08/02 1345 02-6010 Y 7.7 9.0 462 690 0.3 17.7 8.1 24 <10 79 547 468 1.105 0.332 1.244 1.576 0.385 0.192R19 BSR nr Estelline 05/01/02 1030 02-6053 Y 10.8 13.0 699 960 0.5 12.6 8.5 34 40 77 725 648 0.321 0.055 1.326 1.381 0.275 0.085R19 BSR nr Estelline 05/08/02 1245 02-6069 Y 7.7 8.5 638 956 0.5 10.0 8.3 11 280 27 675 648 0.656 0.168 1.276 1.444 0.243 0.126R19 BSR nr Estelline 06/11/02 900 02-6106 N 18.7 17.5 889 1011 0.5 9.0 8.3 31 320 109 777 668 1.214 0.273 1.709 1.982 0.456 0.240R19 BSR nr Estelline 07/09/02 1000 02-6138 N 23.3 23.0 840 869 0.4 8.8 8.9 220 710 142 764 622 0.082 0.058 3.352 3.410 0.615 0.240R19 BSR nr Estelline 08/06/02 1000 2-6157 Y 19.9 22.7 807 895 0.4 8.9 8.5 75 700 111 715 604 0.075 0.128 1.944 2.072 0.540 0.267R19 BSR nr Estelline 08/22/02 1145 02-6202 Y 20.9 21.0 255 279 0.1 1.4 7.7 140 29000 188 400 212 0.526 0.384 1.836 2.220 0.924 0.405R19 BSR nr Estelline 09/10/02 1215 02-6219 N 19.5 21.0 655 730 0.4 18.8 8.7 85 570 148 628 480 0.002 0.144 2.388 2.532 0.532 0.056R19 BSR nr Estelline 10/16/02 1030 02-6242 N 5.0 2.0 574 926 0.5 9.2 ------ 4 120 7 631 624 1.598 0.046 0.915 0.961 0.232 0.170
R20 BSR nr Bruce 04/08/01 1830 01-6048 Y 5.3 8.0 150 243 0.1 2.2 7.9 75 1200 91 263 172 1.612 0.600 1.898 2.498 0.543 0.332R20 BSR nr Bruce 04/13/01 1230 01-6092 Y 6.8 15.0 244 375 0.2 5.1 8.2 22 580 29 299 270 1.472 0.445 1.136 1.581 0.384 0.301R20 BSR nr Bruce 05/08/01 1300 01-6158 Y 12.8 18.0 628 820 0.4 7.9 8.1 5 3000 7 591 584 0.128 0.095 1.540 1.635 0.190 0.172R20 BSR nr Bruce 06/15/01 1100 01-6922 Y 18.1 17.0 495 574 0.3 8.7 7.9 19 1300 25 405 380 1.384 0.198 1.838 2.036 0.353 0.283R20 BSR nr Bruce 07/25/01 1030 01-6313 Y 24.1 22.0 935 953 0.5 5.8 7.9 41 700 118 802 684 0.634 0.468 1.597 2.065 0.454 0.244R20 BSR nr Bruce 08/28/01 1230 01-6340 N 23.9 32.3 1129 1163 0.6 4.9 8.5 30 80 79 1587 1508 0.168 0.139 1.476 1.615 0.278 0.118R20 BSR nr Bruce 09/26/01 1215 01-6388 N 14.7 16.0 694 866 0.4 9.5 8.5 17 80 30 834 804 0.440 0.023 1.226 1.249 0.271 0.190R20 BSR nr Bruce 10/23/01 1015 01-6451 N 8.9 7.5 539 785 0.4 16.5 8.8 4 80 8 800 792 0.383 0.067 1.068 1.135 0.146 0.121R20 BSR nr Bruce 04/08/02 1600 02-6014 Y 9.9 13.0 448 647 0.3 16.1 8.1 40 <10 132 546 414 0.997 0.300 1.258 1.558 0.427 0.184R20 BSR nr Bruce 05/01/02 1145 02-6055 Y 11.1 14.0 535 729 0.4 14.6 8.5 40 130 87 703 616 0.306 0.059 1.371 1.430 0.299 0.083R20 BSR nr Bruce 05/08/02 1345 02-6070 Y 8.0 9.0 597 886 0.4 15.4 8.4 16 >2500 62 640 578 0.590 0.138 1.164 1.302 0.241 0.079R20 BSR nr Bruce 06/11/02 1000 02-6108 N 18.6 18.5 846 965 0.5 12.1 8.4 35 330 105 749 644 0.694 0.113 1.772 1.885 0.450 0.107R20 BSR nr Bruce 07/09/02 930 02-6137 N 23.8 22.0 808 827 0.4 9.3 8.6 38 600 64 660 596 0.052 0.088 1.578 1.666 0.370 0.155R20 BSR nr Bruce 08/06/02 1045 2-6158 Y 21.2 25.0 689 744 0.4 13.0 8.4 35 2100 55 583 528 0.028 0.022 1.515 1.537 0.328 0.012R20 BSR nr Bruce 08/22/02 1215 02-6203 Y 20.7 22.5 415 452 0.2 4.1 7.7 220 14000 328 632 304 0.942 0.500 2.902 3.402 0.411 0.152R20 BSR nr Bruce 09/11/02 930 02-6221 N 18.4 23.0 626 716 0.4 ------ 8.6 55 300 76 572 496 0.252 0.062 1.972 2.034 0.407 0.047R20 BSR nr Bruce 10/16/02 1100 02-6243 N 5.2 3.0 549 883 0.4 12.8 ------ 3 160 6 562 556 0.288 0.060 0.932 0.992 0.152 0.082

Appendix B
Extra Big Sioux River Samples Taken in 2004
Site Site Name Date Time Runoff ?
Water Temp
C˚
Air Temp
C˚Conductivity
µs/cm
Specific Conductivity
µs/cmSalinity
ppt
Dissolved Oxygen
mg/L pH unitsTurbidity
NTU
Fecal Coliform
cfu/100mL
R01 Big Sioux River nr Brookings 05/17/04 1315 y 13.5 15.0 612 ----- ----- 8.64 ----- 24 2400R01 Big Sioux River nr Brookings 06/02/04 1300 n 15.8 21.0 779 950 0.4 4.98 7.31 21 600R01 Big Sioux River nr Brookings 06/16/04 1330 n 19.2 17.0 743 835 0.4 8.22 8.32 34 900R01 Big Sioux River nr Brookings 07/01/04 1215 n 24.7 34.0 873 880 0.4 9.13 8.25 11 980R01 Big Sioux River nr Brookings 07/14/04 1210 n 25.0 28.0 777 798 0.4 9.60 8.46 40 340R01 Big Sioux River nr Brookings 07/27/04 210 n 24.0 33.0 834 849 0.4 11.29 7.71 40 140R01 Big Sioux River nr Brookings 08/10/04 1443 n 20.3 ----- 741 815 0.4 13.54 7.97 40 130R01 Big Sioux River nr Brookings 08/25/04 917 n 20.1 21.0 779 830 0.2 9.51 8.39 37 70R01 Big Sioux River nr Brookings 09/08/04 1528 n 22.4 23.4 354 432 0.2 11.46 8.84 40 80R01 Big Sioux River nr Brookings 09/27/04 1445 n 17.7 22.1 650 765 0.4 8.74 8.16 32 180
R14 Big Sioux River at Watertown 05/17/04 1020 y 11.1 ----- 573 ----- ----- 9.65 ----- 10 260R14 Big Sioux River at Watertown 06/02/04 930 n 13.4 19.0 663 850 0.4 5.21 7.24 24 710R14 Big Sioux River at Watertown 06/16/04 1030 n 18.8 16.0 695 789 0.4 6.72 7.91 14 250R14 Big Sioux River at Watertown 07/01/04 915 n 22.0 24.0 654 693 0.3 4.60 8.01 9 31000R14 Big Sioux River at Watertown 07/17/04 915 n 21.1 23.0 589 638 0.3 2.31 7.52 8 820R14 Big Sioux River at Watertown 07/27/04 1130 n 20.2 26.0 660 730 0.4 8.06 7.56 35 8700R14 Big Sioux River at Watertown 08/09/04 1313 n 16.3 15.0 628 756 ----- 8.90 8.49 23 1200R14 Big Sioux River at Watertown 08/25/04 1205 n 20.0 26.5 677 748 0.4 8.96 8.30 23 3100R14 Big Sioux River at Watertown 09/08/04 1251 y 18.2 23.0 600 695 0.3 10.98 7.57 33 790R14 Big Sioux River at Watertown 09/27/04 1230 n 15.4 19.5 675 826 0.4 9.27 7.99 11 2000
R15 Big Sioux River at Broadway St. 05/17/04 1045 y 12.9 17.0 449 ----- ----- 11.07 ----- 12 510R15 Big Sioux River at Broadway St. 06/02/04 1000 n 14.9 18.0 606 760 0.4 4.46 7.23 23 1100R15 Big Sioux River at Broadway St. 06/16/04 1055 n 19.5 18.0 709 806 0.4 4.55 7.93 14 370R15 Big Sioux River at Broadway St. 07/01/04 935 n 22.2 27.0 533 563 0.3 4.75 7.78 13 1300R15 Big Sioux River at Broadway St. 07/14/04 940 n 22.9 23.0 763 795 0.4 4.68 7.53 16 90R15 Big Sioux River at Broadway St. 07/27/04 1150 n 21.5 25.0 805 863 0.4 10.25 7.62 10 80R15 Big Sioux River at Broadway St. 08/09/04 1428 n 18.0 15.8 713 821 ----- 11.00 8.12 17 60R15 Big Sioux River at Broadway St. 08/25/04 1145 n 20.9 24.0 588 638 0.3 4.21 8.03 12 300R15 Big Sioux River at Broadway St. 09/08/04 1313 y 18.2 28.0 599 688 0.3 6.18 7.66 15 50R15 Big Sioux River at Broadway St. 09/27/04 1300 n 16.4 19.5 758 907 0.4 7.60 7.73 7 40
R16 Big Sioux River at 20th Ave 05/17/04 1100 y 13.2 15.0 752 ----- ----- 10.50 ----- 8 440R16 Big Sioux River at 20th Ave 06/02/04 1015 n 13.2 17.0 798 1028 0.5 5.75 7.15 7 460R16 Big Sioux River at 20th Ave 06/16/04 1115 n 16.4 18.0 847 1009 0.5 7.20 7.82 7 260R16 Big Sioux River at 20th Ave 07/01/04 955 n 17.9 27.0 1068 1245 0.6 7.81 7.50 10 230R16 Big Sioux River at 20th Ave 07/14/04 955 n 18.2 24.0 1027 1182 0.6 7.23 7.47 9 810R16 Big Sioux River at 20th Ave 07/27/04 1210 n 18.9 25.0 1031 1206 0.6 10.22 7.48 12 380R16 Big Sioux River at 20th Ave 08/09/04 1448 n 17.4 13.5 1025 1203 ----- 8.50 7.73 12 710R16 Big Sioux River at 20th Ave 08/25/04 1130 n 18.4 23.5 1052 1203 0.6 8.04 7.69 10 120R16 Big Sioux River at 20th Ave 09/08/04 1330 y 18.8 28.0 946 1071 0.5 9.43 7.92 7 420R16 Big Sioux River at 20th Ave 09/27/04 1315 n 16.7 21.7 937 1114 0.6 7.40 7.65 7 140

Appendix B
Site Site Name Date Time Runoff ?
Water Temp
C˚
Air Temp
C˚Conductivity
µs/cm
Specific Conductivity
µs/cmSalinity
ppt
Dissolved Oxygen
mg/L pH unitsTurbidity
NTU
Fecal Coliform
cfu/100mL
R17 Big Sioux River below Watertown 05/17/04 1120 y 13.9 14.0 553 ----- ----- 6.32 ----- 26 650R17 Big Sioux River below Watertown 06/02/04 1040 n 14.3 17.0 704 887 0.4 5.41 7.22 25 660R17 Big Sioux River below Watertown 06/16/04 1140 n 18.0 16.0 841 971 0.5 6.04 8.09 22 190R17 Big Sioux River below Watertown 07/01/04 1010 n 23.2 26.0 1124 1163 0.6 6.75 8.04 10 460R17 Big Sioux River below Watertown 07/14/04 1015 n 23.0 23.0 930 965 0.5 7.85 8.26 12 370R17 Big Sioux River below Watertown 07/27/04 1225 n 22.6 25.0 1065 1122 0.6 13.04 7.70 18 310R17 Big Sioux River below Watertown 08/09/04 1518 n 17.4 14.0 957 1134 ----- 13.95 8.63 21 300R17 Big Sioux River below Watertown 08/25/04 1108 n 20.1 20.5 533 584 0.3 12.61 8.43 33 2200R17 Big Sioux River below Watertown 09/08/04 1348 y 20.7 29.0 652 708 0.4 11.13 8.42 37 500R17 Big Sioux River below Watertown 09/27/04 1330 n 16.7 20.3 560 936 0.5 8.10 7.98 38 600
R18 Big Sioux River nr Castlewood 05/17/04 1150 y 13.6 16.0 818 ----- ----- 9.49 ----- 13 3300R18 Big Sioux River nr Castlewood 06/02/04 1120 n 14.9 20.0 748 928 0.5 7.09 7.28 3 70R18 Big Sioux River nr Castlewood 06/16/04 1205 n 18.6 16.0 735 837 0.4 8.06 8.32 10 3200R18 Big Sioux River nr Castlewood 07/01/04 1035 n 23.7 26.0 1031 1056 0.5 5.92 8.56 6 2800R18 Big Sioux River nr Castlewood 07/14/04 1040 n 24.2 25.0 876 893 0.5 5.88 8.32 21 4400R18 Big Sioux River nr Castlewood 07/27/04 1250 n 24.0 25.0 954 977 0.5 13.47 7.90 60 420R18 Big Sioux River nr Castlewood 08/09/04 1550 n 18.0 15.0 785 907 ----- 9.10 9.75 40 160R18 Big Sioux River nr Castlewood 08/25/04 1045 n 19.7 19.5 1090 1213 0.6 10.61 8.95 18 980R18 Big Sioux River nr Castlewood 09/08/04 1414 y 21.4 30.0 700 744 0.4 12.24 8.94 15 2500R18 Big Sioux River nr Castlewood 09/27/04 1350 n 17.0 20.5 784 926 0.5 8.30 8.08 45 1100
R19 Big Sioux River nr. Estelline 05/17/04 1220 y 14.0 16.0 618 ----- ----- 11.40 ----- 23 180R19 Big Sioux River nr. Estelline 06/02/04 1145 n 14.8 20.0 750 1932 0.5 5.58 7.39 16 460R19 Big Sioux River nr. Estelline 06/16/04 1230 n 18.0 15.0 798 919 0.5 7.07 8.14 17 310R19 Big Sioux River nr. Estelline 07/01/04 1105 n 22.7 32.0 768 843 0.4 8.49 8.35 6 1340R19 Big Sioux River nr. Estelline 07/14/04 1105 n 23.0 26.0 778 810 0.4 10.51 8.76 35 250R19 Big Sioux River nr. Estelline 07/27/04 120 n 22.6 31.0 795 835 0.4 12.48 7.78 130 110R19 Big Sioux River nr. Estelline 08/09/04 1626 n 18.1 15.0 679 784 ----- 6.80 9.18 150 310R19 Big Sioux River nr. Estelline 08/25/04 1010 n 18.3 18.0 360 413 0.2 16.92 8.66 75 2100R19 Big Sioux River nr. Estelline 09/08/04 1430 n 21.0 26.0 733 793 0.4 12.40 9.21 110 320R19 Big Sioux River nr. Estelline 09/27/04 1400 n 16.8 19.8 757 903 0.4 8.40 7.94 26 470
R20 Big Sioux River nr Bruce 05/17/04 1245 y 15.1 17.0 575 ----- ----- 13.80 ----- 16 710R20 Big Sioux River nr Bruce 06/02/04 1240 n 15.3 20.0 593 728 0.4 7.04 7.52 13 670R20 Big Sioux River nr Bruce 06/16/04 1300 n 19.2 16.0 758 851 0.4 6.08 8.12 8 730R20 Big Sioux River nr Bruce 07/01/04 1140 n 24.3 32.0 816 827 0.4 10.17 8.39 3 100R20 Big Sioux River nr Bruce 07/14/04 1130 n 24.7 26.0 757 761 0.4 7.90 8.52 8 150R20 Big Sioux River nr Bruce 07/27/04 145 n 23.7 32.0 805 826 0.4 10.53 7.76 25 180R20 Big Sioux River nr Bruce 08/09/04 1710 n 18.8 16.0 634 723 ----- 5.80 9.12 45 330R20 Big Sioux River nr Bruce 08/25/04 950 n 18.2 18.0 682 784 0.4 4.12 7.77 20 490R20 Big Sioux River nr Bruce 09/08/04 1502 n 22.0 24.5 330 370 0.1 12.61 8.95 20 250R20 Big Sioux River nr Bruce 09/27/04 1445 n 16.8 19.9 696 826 0.4 8.74 8.09 35 360

Appendix C. WQ Field Data Sheet
C-1

Appendix C
North-Central Big Sioux River Watershed Assessment East Dakota Water Development District
Water Quality Data
Lab No. Source: Tributary / River Site Location Code: Site Name: Samples Collected By: Date: Time: Staff Gage Reading: Type of Sample: Grab / Time Comp / Depth Integrated Sample Depth: Visual Observations Field Analysis Precipitation – none light moderate heavy Parameter Measure Wind (&direction) – calm moderate strong Water Temperature Odor – yes no Air Temperature Septic - yes no Conductivity Dead Fish - yes no Salintiy Film - yes no Dissolved Oxygen Color - pH Width - Secchi Depth - Turbidity Ice Cover - yes no Lab Analysis Field Preparation
Cool to 4oC 2mL conc H2SO4 Cool to 4oC
2mL conc H2SO4 Cool to 4oC
Filtered, 2mL conc H2SO4 Cool to 4oC
Na2S2O3
Parameter Bottle A Bottle B Bottle C Bottle D Bottle E
Total Solids XXX Total Suspended Solids XXX Ammonia-N XXX Total Kjeldahl-N XXX Nitrate-N XXX Total Phosphorus XXX Total Dissolved Phosphorus XXX Fecal Coliform XXX Field Observations:
Appendix D. Stage Recorder Start and End Dates
D-1

Appendix D
Stage Recorder Start and End Dates
Site Site Name Start Date End Date Recorder TypeT34 Lake Pelican Weir
T35 Willow Creek (nr Waverly) 05/29/01 10/30/01 OTT Thalimedes Hydrometer04/08/02 10/31/02 OTT Thalimedes Hydrometer
T36 Willow Creek (nr Watertown)
T37 Stray Horse Creek 06/07/01 10/30/01 Solinst Levelogger04/08/02 10/31/02 Solinst Levelogger
T38 * Boswell Diversion Ditch 05/30/01 10/30/01 OTT Thalimedes Hydrometer
T39 Lake Poinsett Outlet 04/16/02 10/31/02 OTT Thalimedes Hydrometer
T40 Hidewood Creek (nr Clear Lake) 06/08/01 10/30/01 Solinst Levelogger04/05/02 10/31/02 Solinst Levelogger
T41 Hidewood Creek (nr Estelline) 05/29/01 10/30/01 OTT Thalimedes Hydrometer04/08/02 10/31/02 OTT Thalimedes Hydrometer
T42 Peg Munky Run 05/21/01 10/30/01 OTT Thalimedes Hydrometer04/05/02 10/31/02 OTT Thalimedes Hydrometer
T46 East Oakwood Lake Outlet 2 05/29/01 10/30/01 OTT Thalimedes Hydrometer04/05/02 10/31/02 OTT Thalimedes Hydrometer
T47 Unnamed Creek (nr Volga) 05/29/01 10/30/01 OTT Thalimedes Hydrometer04/05/02 10/31/02 OTT Thalimedes Hydrometer
* Site decomissioned due to unoperable flood gates
------------------- City of Watertown --------------------
----------------------- USGS ---------------------------

Appendix E. Stage-Discharge Curves
E-1

Appendix E
Stage – Discharge Curves
T35 T37Stage Discharge Stage Discharge
0.78 0.338 2.38 8.7421.01 0.656 2.14 4.8691.34 1.173 1.92 0.4631.48 2.035 1.9 1.1221.63 1.189 1.91 1.3411.72 2.287 1.91 0.9391.89 2.62 1.75 0.2372.08 3.902 1.75 0.288
1.75 0.1412.78 43.021
T39 T40Stage Discharge Stage Discharge1.78 17.996 0.86 0.231.86 24.727 0.86 0.1681.87 16.016 0.89 0.3711.9 20.013 1.02 0.828
1.97 5.144 1.44 11.5141.98 23.432 1.56 17.4762.18 1.761 2.2 31.3434.08 275.935 2.4 34.0496.429 536.114
T41 T42Stage Discharge Stage Discharge0.78 3.05 1.1 0.0420.82 3.273 1.13 0.1160.88 5.552 1.13 0.0951.06 15.214 1.22 0.6131.26 21.661 1.26 0.8561.28 15.298 1.3 1.8171.63 26.496 1.355 1.8372.59 58.644 1.39 3.403
1.395 3.4921.46 4.3641.46 5.1241.76 14.221
T35
y = 1.7309x2 - 2.466x + 1.3137R2 = 0.9001
0246
0 1 2 3
Stage
Dis
char
ge
T37
y = 53.858x2 - 204.39x + 193.92R2 = 0.984
010203040
0 1 2 3
Stage
Dis
char
ge
T40
y = -0.3012x2 + 24.048x - 21.067R2 = 0.9905
010203040
0 0.5 1 1.5 2 2.5 3Stage
Dis
char
ge
T41
y = 0.5124x2 + 28.56x - 19.132R2 = 0.9808
020406080
0 0.5 1 1.5 2 2.5 3Stage
Dis
char
ge
T42
y = 28.94x2 - 61.07x + 32.118R2 = 0.9942
05
1015
0 0.5 1 1.5 2
Stage
Dis
char
ge
T39
y = 12.991x2 + 6.4529x - 24.596R2 = 0.9802
0
200
400
600
0 2 4 6 8
Stage
Dis
char
ge

Appendix E
T47 T46
Stage Discharge Stage Discharge1.29 0.999 0.92 0.0570.98 1.036 1.65 7.4091.12 0.719 1.66 8.3061.06 0.366 1.8 12.6451.38 0.81 2.02 26.9280.62 0.232 2.18 30.4931.29 1.502 2.42 42.6512.56 18.805 4.17 51.9931.86 7.934 4.2 63.5951.38 1.266 4.8 87.1831.18 1.2211.06 0.594
1 0.6560.98 0.5690.91 0.6191.04 1.056
T37 T40Pressure Stage Pressure Stage
2.18 2.28 0.98 0.872.12 2.38 1.29 1.561.9 2.14 1.65 1.751.67 1.92 1.28 1.441.77 1.9 1.11 1.021.78 1.91 0.79 0.891.70 1.91 0.81 0.861.58 1.75 0.81 0.861.48 1.75 0.48 0.522.49 2.78
T46
y = -0.4943x2 + 23.378x - 23.168R2 = 0.9174
020406080
100
0 1 2 3 4 5 6Stage
Dis
char
ge
T47
y = 6.5073x2 - 11.259x + 5.1819R2 = 0.9852
05
101520
0 1 2 3
Stage
Dis
char
ge
T37 Pressure to Stage
y = 1.0279x + 0.153R2 = 0.9576
0123
0 0.5 1 1.5 2 2.5 3
Pressure
Stag
e
T40 Pressure to Stage
y = 1.1091x - 0.0482R2 = 0.9251
0.000.501.001.502.00
0 0.5 1 1.5 2
Pressure
Stag
e

Appendix F. Equations used to Calculate Discharges
F-1

Appendix F
Equations used to Calculate Discharges
SiteID Equation R2
T35 y = 1.7309x2 - 2.466x + 1.3137 0.900T36 City of WatertownT37 y = 53.858x2 - 204.39x + 193.92 0.984T39 y = 12.991x2 +6.4529x - 24.596 0.980T40 y = -0.3012x2 - 24.048x - 21.067 0.991T41 y = 0.5124x2 + 28.56x - 19.132 0.981T42 y = 28.94x2 - 61.07x + 32.118 0.994T46 y = -0.4943x2 + 23.378x - 23.168 0.917T47 y = 6.5073x2 - 11.259x + 5.1819 0.985R01 USGS providedR14 USGS providedR15 USGS providedR16 USGS providedR17 USGS providedR18 USGS providedR19 USGS providedR20 USGS provided
Stream Flow - Stage Relationships

Appendix G
Appendix G. Flow Duration Interval Graph Data
G-1
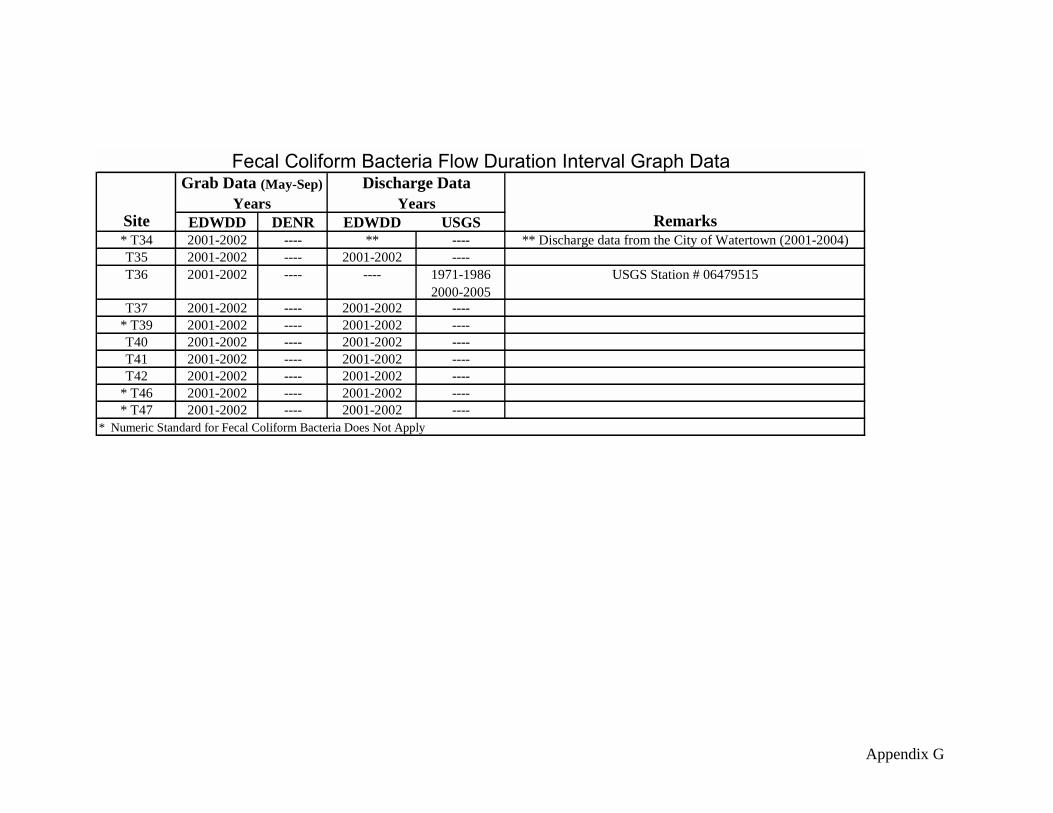
Appendix G
EDWDD DENR EDWDD USGS* T34 2001-2002 ---- ** ---- ** Discharge data from the City of Watertown (2001-2004)T35 2001-2002 ---- 2001-2002 ----T36 2001-2002 ---- ---- 1971-1986
2000-2005USGS Station # 06479515
T37 2001-2002 ---- 2001-2002 ----* T39 2001-2002 ---- 2001-2002 ----T40 2001-2002 ---- 2001-2002 ----T41 2001-2002 ---- 2001-2002 ----T42 2001-2002 ---- 2001-2002 ----
* T46 2001-2002 ---- 2001-2002 ----* T47 2001-2002 ---- 2001-2002 ----
* Numeric Standard for Fecal Coliform Bacteria Does Not Apply
Fecal Coliform Bacteria Flow Duration Interval Graph Data
Site
Grab Data (May-Sep) Discharge Data
RemarksYears Years

Appendix G
EDWDD DENR EDWDD USGSR01 2001-2002
20042001-2002
2004---- 1980-Present Discharge data derived from USGS Station # 06480000
R14 2001-2002 2004
2001-2002 2004
---- 1945-Present Station #06479500
R15 2001-2002 2004
---- ---- 1994-Present Discharge data derived from USGS Station # 06479520
R16 2001-2002 2004
---- ---- 1994-Present Discharge data derived from USGS Station # 06479520
R17 2001-2002 2004
2001-2002 2004
---- 1994-Present Station #06479520
R18 2001-2002 2004
---- ---- 1976-Present Station #06479525
R19 2001-2002 2004
2001-2002 2004
---- 1976-Present Discharge data derived from USGS Station #06479525
R20 2001-2002 2004
---- ---- 2000-Present Station #06479770
Fecal Coliform Bacteria Load Duration Interval Graph Data
Site
Grab Data (May-Sep) Discharge Data
RemarksDates Dates

Appendix H. Terms and Definitions of the Core Fish Metrics
H-1

Appendix H
Terms and Definitions of the Core Fish Metrics Knowledge of historical indigenous fish distributions can be valuable to selection of candidate metrics. A comparison of recent fish distributions in the Big Sioux River with those summarized in Bailey and Allum (1962) indicate that no loss of species has occurred. All species have been persistent over a documented period of 50 to 60 years. Non-indigenous fish introductions and distributions need to be understood before candidate metrics are selected. In some states, non-indigenous introductions have significant effects on the stream ecology. In South Dakota, the distributions of most non-indigenous fishes are minimal. Non-indigenous species, based on recent collections, rarely comprise a significant number or biomass of fishes in samples from headwater and wadable sites. Climatic and geologic factors influence streamflow patterns and faunal diversity, and therefore, must form part of the basis for metric selection. Stream flow patterns in eastern South Dakota are influenced by cycling of wet and dry phases over 10-20 year periods. During dry phases, headwaters, and quite often, entire tributaries become intermittent. Theoretically, fish community structure and function in these environments are less diverse than communities in perennial stream environments. Additionally, the diversity of the regional fish fauna in the Big Sioux River, which flows to the Missouri River, is lower than regional fish faunas in rivers that flow to the Mississippi River. The following metrics and their definitions are those recommended to be used when assessing the Midwest region. These metrics weighed heavily on which candidate metrics would be chosen as the core metrics. Though, box plots were used to further differentiate what the overall final core metrics for fishes would be used. After each metric description, the core metric it corresponds to is in parenthesis. Metric : Total number of fish species As originally intended this metric has been accepted as an indicator of overall stream health. The most common alternative in warm water streams is number of native fish species, which will be tested. (Core Metric 1 – Total Species Richness) Metric: Number and identity of darter species Darters represent a diverse taxonomic group that inhabits benthic habitats. These species decline when benthic habitat is subject ed to sedimentation and reduced oxygen. In the Big Sioux River system, only three darters species occur with the blackside darter rarely collected in either historic or recent surveys. Karr suggested that other benthic taxon could replace darters in regions outside the range of darters. Alternative metrics to be tested are number of benthic species, and number of benthic insectivore species. (Core Metric 3 – Benthic Species Richness) Metric: Number and identity of sunfish species Sunfishes represent a diverse taxanomic group that inhabits pools. These species decline when pool habitats are degraded and pool cover is reduced. Only two sunfish species are native to the Big Sioux River system. Therefore, alternative metrics must be selected that incorporate a more diverse array of non-benthic species. For
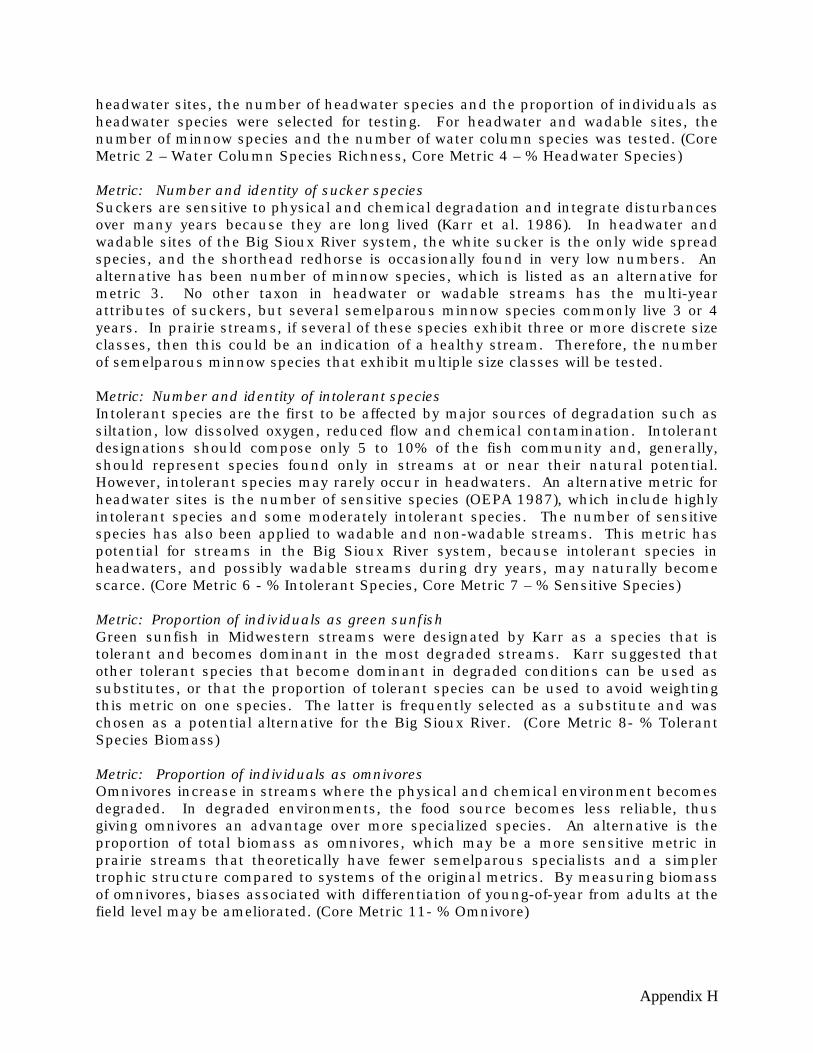
Appendix H
headwater sites, the number of headwater species and the proportion of individuals as headwater species were selected for testing. For headwater and wadable sites, the number of minnow species and the number of water column species was tested. (Core Metric 2 – Water Column Species Richness, Core Metric 4 – % Headwater Species) Metric: Number and identity of sucker species Suckers are sensitive to physical and chemical degradation and integrate disturbances over many years because they are long lived (Karr et al. 1986). In headwater and wadable sites of the Big Sioux River system, the white sucker is the only wide spread species, and the shorthead redhorse is occasionally found in very low numbers. An alternative has been number of minnow species, which is listed as an alternative for metric 3. No other taxon in headwater or wadable streams has the multi-year attributes of suckers, but several semelparous minnow species commonly live 3 or 4 years. In prairie streams, if several of these species exhibit three or more discrete size classes, then this could be an indication of a healthy stream. Therefore, the number of semelparous minnow species that exhibit multiple size classes will be tested. Metric: Number and identity of intolerant species Intolerant species are the first to be affected by major sources of degradation such as siltation, low dissolved oxygen, reduced flow and chemical contamination. Intolerant designations should compose only 5 to 10% of the fish community and, generally, should represent species found only in streams at or near their natural potential. However, intolerant species may rarely occur in headwaters. An alternative metric for headwater sites is the number of sensitive species (OEPA 1987), which include highly intolerant species and some moderately intolerant species. The number of sensitive species has also been applied to wadable and non-wadable streams. This metric has potential for streams in the Big Sioux River system, because intolerant species in headwaters, and possibly wadable streams during dry years, may naturally become scarce. (Core Metric 6 - % Intolerant Species, Core Metric 7 – % Sensitive Species) Metric: Proportion of individuals as green sunfish Green sunfish in Midwestern streams were designated by Karr as a species that is tolerant and becomes dominant in the most degraded streams. Karr suggested that other tolerant species that become dominant in degraded conditions can be used as substitutes, or that the proportion of tolerant species can be used to avoid weighting this metric on one species. The latter is frequently selected as a substitute and was chosen as a potential alternative for the Big Sioux River. (Core Metric 8- % Tolerant Species Biomass) Metric: Proportion of individuals as omnivores Omnivores increase in streams where the physical and chemical environment becomes degraded. In degraded environments, the food source becomes less reliable, thus giving omnivores an advantage over more specialized species. An alternative is the proportion of total biomass as omnivores, which may be a more sensitive metric in prairie streams that theoretically have fewer semelparous specialists and a simpler trophic structure compared to systems of the original metrics. By measuring biomass of omnivores, biases associated with differentiation of young-of-year from adults at the field level may be ameliorated. (Core Metric 11- % Omnivore)

Appendix H
Metric: Proportion of individuals as insectivorous minnows Insectivores decrease in streams where the physical and chemical environments become degraded, because the invertebrate food base becomes less reliable. An alternative is the proportion of total biomass as insectivorous minnows. For the same reason given for metric 8, biomass may be a more sensitive metric in prairie streams. (Core Metric 9 - % Insectivorous Minnows, Core Metric 10 - % Insectivorous Biomass) Metric: Proportion of individuals as piscivores This metric represents the upper trophic level in streams. However, in prairie streams of the Big Sioux River system, piscivores are not as diverse as streams that flow into the Mississippi River. Headwater streams and wadable streams do not typically support a persistent adult piscivore assemblage. In contrast, they often support a persistent assemblage of pioneer species, which may indicate either unstable or degraded conditions. The proportion of pioneering was selected as an alternative metric for headwater and wadable streams. (Core Metric 5 - % Pioneering Species Biomass) Metric: Number of individuals in sample This metric is based on the concept that the number of individuals sampled per unit length or area of stream decreases as stream degradation increases. An alternative to be tested is biomass of fish per unit area of stream. Metric: Proportion of individuals as hybrids This metric evaluates the habitat degradation as it influences reproduction of stream fishes. Generally, as stream degradation increases, reproductive isolation breaks down and hybridization increases. Hybridization can be difficult to determine and does occur among minnows in streams that are not degraded. Alternatives often selected are proportion of individuals as simple lithophils or number of simple lithophilic species, which were selected also for the Big Sioux River system. (Core Metric 12 - % Simple Lithophil Biomass) Metric: Proportion of individuals with disease, tumors, fin damage, and skeletal anomalies This metric is sensitive to the factors that cause poor health to a large proportion of individuals. A large proportion of individuals found in poor health are usually an indication of sub-acute effects of chemical pollution (Plafkin et al. 1989). This metric is usually retained in its original form. No alternatives are proposed for testing.

Appendix I
Appendix I. Box Plots of Fish Metrics
I-1

Appendix I
Box and Whisker Plots of the Fish Metrics
Species Richness and Composition
0
5
10
15
20
25
Species Richness Native SpeciesRichness
Native MinnowRichness
WaterColumnSpecies Richness
Benthic SpeciesRichness
Benthic InsectivoreRichness
n CV Mean SD SE Median IQRSpecies Richness 4 0.290 15.75 4.57 2.29 8.47 to 23.03 15.00 6.25
Native Species Richness 4 0.290 15.75 4.57 2.29 8.47 to 23.03 15.00 6.25Native Minnow Richness 4 0.102 8.00 0.82 0.41 6.70 to 9.30 8.00 1.00
WaterColumn Species Richness 4 0.386 5.75 2.22 1.11 2.22 to 9.28 5.00 3.25Benthic Species Richness 4 0.266 7.75 2.06 1.03 4.47 to 11.03 8.00 2.25
Benthic Insectivore Richness 4 0.272 6.00 1.63 0.82 3.40 to 8.60 6.00 2.00
Metric 95% CI of Mean

Appendix I
Headwater/Pioneering Attributes
-5
5
15
25
35
45
55
65
HeadWaterSpecies
Richness
% HeadWaterSpecies
% HeadWaterBIOMASS
% PioneerSpecies
% PioneerSpecies
BIOMASS
Metric n CV Mean SD SE Median IQRHeadWater Species Richness 4 0.547 3.50 1.91 0.96 0.45 to 6.55 4.00 2.50
% HeadWater Species 4 0.470 21.25 9.98 4.99 5.37 to 37.13 21.35 13.40% HeadWater BIOMASS 4 0.776 10.93 8.48 4.24 -2.57 to 24.42 11.90 12.98
% Pioneer Species 4 0.275 40.45 11.12 5.56 22.76 to 58.14 40.00 14.05% Pioneer Species BIOMASS 4 0.336 41.50 13.94 6.97 19.32 to 63.68 39.45 20.35
95% CI of Mean

Appendix I
Intolerant/Tolerant Attributes
-5
5
15
25
35
45
55
65
75
85
IntolerantSpecies
RICHNESS
%IntolerantSpecies
BIOMASS
%SensitiveSpecies
% GreenSunfish
% TolerantSpecies
Metric n CV Mean SD SE Median IQRIntolerant Species RICHNESS 4 1.200 1.25 1.50 0.75 -1.14 to 3.64 1.00 2.75
% Intolerant Species 4 1.155 6.73 7.77 3.88 -5.63 to 19.08 6.65 13.53% Intolerant Species BIOMASS 4 1.184 1.25 1.48 0.74 -1.10 to 3.61 1.05 2.70
Sensitive Species Richness 4 0.816 3.00 2.45 1.22 -0.90 to 6.90 2.50 4.50% Sensitive Species 4 0.637 17.43 11.10 5.55 -0.24 to 35.09 17.85 18.73
% Sensitive Species BIOMASS 4 0.400 2.60 1.04 0.52 0.95 to 4.25 2.70 1.50% Green Sunfish 4 0.671 0.16 0.11 0.05 -0.01 to 0.34 0.14 0.20
% Green Sunfish BIOMASS 4 1.123 0.32 0.36 0.18 -0.25 to 0.90 0.18 0.57% Tolerant Species 4 0.302 38.78 11.70 5.85 20.16 to 57.39 36.65 19.08
% Tolerant Species Biomass 4 0.420 47.43 19.93 9.96 15.72 to 79.13 42.95 36.53
95% CI of Mean

Appendix I
Trophic Guilds
-5
15
35
55
75
95
115
%Insectivorous
minnows
%Insectivorous
minnowsBIOMASS
%Insectivores
%InsectivoresBIOMASS
% Predator % PredatorBIOMASS
% Omnivore % OmnivoreBIOMASS
% Herbivore % HerbivoreBIOMASS
Metric n CV Mean SD SE Median IQR% Insectivorous minnows 4 0.138 82.85 11.43 5.71 64.67 to 101.03 83.80 16.25
% Insectivorous minnows BIOMASS 4 0.125 76.73 9.56 4.78 61.52 to 91.93 78.40 11.28% Insectivores 4 0.279 57.40 16.03 8.01 31.90 to 82.90 56.30 22.20
% Insectivores BIOMASS 4 0.150 67.73 10.19 5.09 51.52 to 83.93 69.10 14.78% Predator 4 2.000 0.01 0.01 0.01 -0.01 to 0.02 0.00 0.02
% Predator BIOMASS 4 2.000 0.93 1.85 0.93 -2.02 to 3.87 0.00 2.78% Omnivore 4 0.723 31.55 22.80 11.40 -4.72 to 67.83 27.40 41.85
% Omnivore BIOMASS 4 0.846 21.68 18.33 9.17 -7.49 to 50.84 16.35 33.28% Herbivore 4 1.084 16.78 18.18 9.09 -12.15 to 45.70 17.30 30.93
% Herbivore BIOMASS 4 0.801 9.15 7.33 3.66 -2.51 to 20.81 10.50 10.45
95% CI of Mean

Appendix I
Reproduction
0
10
20
30
40
50
60
70
% SimpleLithophil
% SimpleLithophil
BIOMASS
Metric n CV Mean SD SE Median IQR% Simple Lithophil 4 0.266 32.05 8.52 4.26 18.49 to 45.61 31.45 12.00
% Simple Lithophil BIOMASS 4 0.240 49.50 11.87 5.93 30.62 to 68.38 52.30 13.70
95% CI of Mean

Appendix J
Appendix J. Natural Resource Solutions Contract
and Laboratory Procedures
J-1

Appendix J
Contract No. 2, Natural Resource Solutions, Inc. and East Dakota Water Development District
Contract for Services This agreement, made the 28th day of October 2002 is between Natural Resource Solutions and East Dakota Water Development District, referred to in this document as the District. A. Scope of Services: Natural Resource Solutions agrees to provide macroinvertebrate
identifications and metric calculations for samples collected from sites in the North-Central Big Sioux River Watershed Assessment by the District. The level of taxonomic resolution will be equivalent to or below the taxonomic level (generally species) previously identified by the South Dakota Department of Environment and Natural Resources (SDDENR). Results will include the following:
1. Macroinvertebrate will be identified and enumerated for 31 rock basket samples
collected at 19 sites in 2002. Thirteen of these samples are composite samples of 3 rock baskets per site for 13 sites. Eighteen of these samples comprise 3 individually preserved rock baskets per site for 6 sites.
2. Calculation of the 39 metrics in Table 1 will be completed for the 31 samples.
These metrics will be subject to review for appropriateness for assessment and monitoring of the Big Sioux River. The District Manager at EDWDD and Natural Resource Solutions must agree upon any changes.
3. A report will be prepared that includes a description of the major taxonomic
groups and water quality conditions they are usually associated with. 4. Hard and electronic copies (Electronic Data Deliverables-EDD) will be required
for the data. The data will be entered into the EDAS database. 5. The functional feeding group assignments, i.e. gatherer, shredder, piercer etc.,
will be included for each genus/species in the EDD. 6. The biotic index value (tolerance values) will be included for each genus species
in the EDD. 7. Standard laboratory protocols for the SDDENR will be followed in the analysis
(Appendix A). 8. Standard QA/QC protocols be followed in the future if deemed necessary
(Appendix A).
9. The voucher collection described in the standard laboratory protocols (Appendix A) will include a set of permanent slides of the head capsules and/or whole mounts of the identified chironomidae genus/species.

Appendix J
10. A summary of the methods, equipment and keys used to identify
macroinvertebrate samples will be provided.
Results for all samples submitted to Natural Resource Solutions by November 15, 2002 will be provided to the District by September 1, 2003. A five-percent reduction in per sample price will be deducted for every week delay in receipt of results. A summary of cost is presented in Table 2.
B. Responsibilities of the District: The District agrees to provide general direction and
necessary District coordination and contracts relating to the Scope of Services outlined in paragraph A. The District will provide macroinvertebrate samples collected during the 2002 North-Central Big Sioux River Watershed Assessment in one group.
C. Compensation: The District agrees to pay Natural Resource Solutions $220.00/sample
for professional services rendered. This covers four items: $40.00/sample for sorting, $50.00/sample for benthic identification, $80.00/sample for chironomid and oligochaete identification, $15.00/sample electronic data compilation and $35.00 /sample for metric calculation, compilation, and analysis. A detailed report for $450.00 will be prepared. In addition, for macroinvertebrates that would be new additions to the District’s collection a reference/voucher collection for $25.00, and a slide-mounted reference collection of Chironomidaes and Oligochaetas for $25.00 will also be provided. The total contract will not exceed $7320.00. Natural Resource Solutions will send a monthly invoice to the District for services completed by the end of each month of the contract with a description of sample items completed. The District will pay Natural Resource Solutions within 30 days of receipt of each monthly invoice.
D. Other Conditions: The District will be reimbursed for these costs through
Environmental Protection Agency 319 funds for the Central Big Sioux River Watershed assessment.
E. Federal Aid Requirements: Natural Resource Solutions agrees with the following
federal aid requirements:
1. To comply with Executive order 11246, concerning Equal Employment Opportunity.
2. Complete, sign and return the MBE/WBE forms (attached). F. Amendments: This contract may be amended with written approval of both parties. G. Terms: This contract shall run from Novemeber 15, 2002 to September 1, 2003.

Appendix J
H. Additional Work: For additional services other than those listed in Section A, a separate
contract will be negotiated between the District and Natural Resource Solutions on a per sample basis.
I. Hold Harmless: The Natural Resource Solutions agrees to hold harmless and indemnify
the East Dakota Water Development District, its officers, agents and employees, from and against any and all actions, suits, damages, liability or other proceedings which may arise as a result of performing services hereunder. This section does not require the Natural Resource Solutions to be responsible for or defend against claims or damages arising solely from acts or omissions of the East Dakota Water Development District, its officers or employees.
J. Insurance Provision: Does the State agency require an insurance provision?
YES __X__ NO _____
If YES, does the Natural Resource Solutions agree, at its sole cost and expense, to maintain adequate general liability, worker's compensation, professional liability and automobile liability insurance during the period of this Agreement? YES __X__ NO ______
K. Termination: The District can terminate this agreement if the District determines that
adequate progress is not being made. The District shall give a two week written notice of any such termination, and shall pay for all services performed and expenses incurred up through the effective date of such termination.
All parties find this contract in order and agree to comply with the responsibilities and conditions outlined.
___________________________________________ __________________ Rebecca L. Spawn-Stroup, Owner Date Natural Resource Solutions
Appendix J
________________________________ Natural Resource Solutions - Tax ID # ___________________________________________ __________________ Jay Gilbertson, Manager Date East Dakota Water Development District I certify that I am a … (sign and check all that apply) ___X___Minority Business Enterprise ___X_ _Woman Business Enterprise FOR AGENCY USE -State Agency Coding (MSA Center)________________________________________ -State Agency MSA company from which contract is to be paid ______________________________________________________________________ -Object/subject MSA Account to which voucher(s) will be coded ______________________________________________________________________

Appendix J
Table 1. The following metrics will be calculated for the rock basket samples collected in 2002.
Category Number Metric Abundance Measures 1 Corrected abundance 2 EPT abundance Richness Measures 3 Total number of taxa 4 Number of EPT taxa 5 Number of Ephemeroptera taxa 6 Number of Trichoptera taxa 7 Number of Plecoptera taxa 8 Number of Diptera taxa 9 Number of Chironomidae taxa Composition Measures 10 Ratio EPT/Chironomidae Abundance 11 %EPT 12 %Ephemeroptera 13 %Plecoptera 14 %Trichoptera 15 % Coleoptera 16 % Diptera 17 % Oligochaeta 18 % Baetidae 19 % Hydropsychidae 20 % Chironomidae 21 % Simuliidae 22 Shannon-Wiener Index Tolerance/Intolerance Measures 23 No. of Intolerant Taxa 24 % Tolerant Organisms 25 % Sediment Tolerant Organisms 26 Hilsenhoff Biotic Index 27 % Dominant Taxon 28 % Hydropsychidae to Trichoptera 29 % Baetidae to Ephemeroptera Feeding Measures 30 % individuals as gatherers and filterers 31 % gatherers 32 % filterers 33 % shredders 34 % grazers and scrapers 35 Ratio scrapers/(scrapers+filterers) 36 Number of gatherer taxa 37 Number of filterer taxa 38 Number of shredder taxa 39 Number of grazer/scraper taxa

Appendix J
Table 2. Summary of cost for contract work.
Activity Quantity Cost Total
Sample Processing 31 samples $220.00/sample $6820.00 Report Preparation 1 $450.00 $450.00 General Reference Collection1 1 $25.00 $25.00 Slide-mounted Reference Collection1 1 $25.00 $25.00
Grand Total $7320.001Only macroinvertebrates that would be new additions to the District’s collection.

Appendix J
APPENDIX A. MACROINVERTEBRATE ENUMERATION AND IDENTIFICATION
Laboratory Procedures for Macroinvertebrate Enumeration 1. Prior to processing any samples in a lot (i.e., samples within a collection date, specific watershed, or
project), complete the sample log-in sheet to verify that all samples have arrived at the laboratory, and are in proper condition for processing.
2. Thoroughly rinse sample in a 500 µm-mesh sieve to remove preservative and fine sediment. Large
organic material (whole leaves, twigs, algal or macrophyte mats, etc.) not removed in the field should be rinsed, visually inspected, and discarded. If the samples have been preserved in alcohol, it will be necessary to soak the sample contents in water for about 15 minutes to hydrate the benthic organisms, which will prevent them from floating on the water surface during sorting. If the sample was stored in more than one container, the contents of all containers for given sample should be combined at this time. Gently mix the sample by hand while rinsing to make homogeneous.
3. Floating and picking the sample can be completed if there is an inordinate amount of organic debris
within the sample. This can be completed by various methods as long as visible degradation on the organisms within the sample does not occur. There are a variety of flotation methods available and any one can be used, i.e. sugar or epsom salts. Other methodologies may be employed so long as the individual organisms within the samples are not significantly damaged which may hinder the identification process.
4. After washing, spread the sample evenly across a pan marked with grids approximately 6 cm x 6 cm.
On the laboratory bench sheet, note the presence of large or obviously abundant organisms; do not remove them from the pan. However, Vinson and Hawkins (1996) present an argument for including these large organisms in the count, because of the high probability that these organisms will be excluded from the targeted grids.
5. Use a random numbers table to select 4 numbers corresponding to squares (grids) within the gridded
pan. Remove all material (organisms and debris) from the four gird squares, and place the material into a shallow white pan and add a small amount of water to facilitate sorting. If there appear (through a cursory count or observation) to be 100 organisms ± 20% (cumulative of 4 grids), then subsampling is complete.
Any organism that is lying over a line separating two grids is considered to be on the grid containing its head. In those instances where it may not be possible to determine the location of the head (worms for instance), the organisms is considered to be in the gird containing most of its body.
If the density of organisms is high enough that many more than 100/200/300 organisms are contained in the 4 grids, transfer the contents of the 4 grids to a second gridded pan. Randomly select grids for this second level of sorting as was done for the first, sorting grids one at a time until 100/200/300 organisms ± 20% are found. If picking through the entire next grid is likely to result in a subsample of greater than 120/240/360 organisms, then that grid may be subsampled in the sample manner as before to decrease the likelihood of exceeding 120/240/360 organisms. That is, spread the contents of the last grid into another gridded pan. Pick grids one at a time until the desired number is reached. The total number of grids for each subsorting level should be noted on the laboratory bench sheet.

Appendix J
6. Save the sorted debris residue in a separate container. Add a label that includes the words “sorted residue” in addition to all prior sample label information and preserve in 95% ethanol. Save the remaining unsorted sample debris residue in a separate container labeled “sample residue”; this container should include the original sample label. Length of storage and archival is determined by the laboratory or benthic section supervisor.
7. Place the sorted 100/200/300-organism (±20%) subsample into glass vials, and preserve in 70%
ethanol. Label the vials inside with the sample identifier or lot number, date, stream name, sampling location and taxonomic group. If more than one vial is needed, each should be labeled separately and numbered (e.g., 1 of 2, 2 of 2). For convenience in reading the labels inside the vials, insert the labels left-edge first. If identification is to occur immediately after sorting, a petri dish or watch glass can be used instead of vials.
8. Midges (Chironomidae) should be mounted on slides in an appropriate medium (e.g., Euperal, CMC-
10); slides should be labeled with the site identifier, date collected, and the first initial and last name of the collector. As with midges, worms (Oligochaeta) must also be mounted on slides and should be appropriately labeled.
9. Fill out header information on Laboratory Bench Sheet as in field sheets. Also check subsample
target number. Complete back of sheet for subsampling/sorting information. Note number of grids picked, time expenditure, and number of organisms. If on the back of the laboratory Bench Sheet. Calculate sorting efficiency to determine whether sorting effort passes or fails.
10. Record date of sorting and slide monitoring, if applicable, on Log-In Sheet as documentation of
progress and status of sample lot. Quality Control (QC) for Sorting
1. Ten Percent of the sorted samples in each lot should be examined by laboratory QC personnel or a
qualified co-worker. (A lot is defined as a special study, basin study, entire index period, or individual sorter.) The QC worker will examine the grids chosen and tray used for sorting and will look for organisms missed by the sorter. Organisms found will be added to the sample vials. If the QC worker finds less than 10 organisms (or 10% in larger subsamples) remaining in the grids or sorting tray, the sample passes; if more than 10 (or 10%) are found, the sample fails. If the first 10% of the sample lot fails, a second 10% of the sample lot will be checked by the QC worker. Sorter in-training will have their samples 100% checked until the trainer decides that training is complete.
2. After laboratory processing is complete for a given sample, all sieves, pans, trays, etc., that have
come in contact with sample will be rinsed thoroughly, examined carefully, and picked free of organisms or debris; organisms found will be added to the sample residue.
Identification of Macroinvertebrates
Taxonomy can be at any level, but should be consistent among samples. In the original RBPs, two levels of identification were suggested – family (RBP II) and genus/species (RBP III) level (Plafkin et al. 1989). Genus/species will provide more accurate information on ecological/environmental relationships and sensitivity to impairment. Family level will provide a higher degree of precision among samples and taxonomists, requires less expertise to perform, and accelerates assessment results. In either case, only those taxonomic keys that have been peer reviewed and are published in some way to be available to other taxonomists should be used. Unnamed species (i.e., species A, B, 1

Appendix J
or 2) may be ecologically informative, but will contribute to variability and inconsistency when a statewide database is being developed.
1. Most organisms are identified to the lowest practical level (generally genus or species) by a qualified
taxonomist using a dissecting microscope. Midges (Diptera: Chironomidae) are mounted on slides in an appropriate medium and identified using a compound microscope. Each taxon found in a sample is recorded and enumerated in a laboratory bench notebook and then transcribed to the laboratory bench sheet for subsequent reports. Any difficulties encountered during identification (e.g., missing gills) are noted on these sheets.
2. Labels with specific taxa names (and taxonomist’s initials) are added to the vials of specimens by the
taxonomist. Individual specimens may be extracted from the sample to be included in a reference collection or to be verified by a 2nd taxonomist. Slides are initialed by the identifying taxonomist. A separate label may be added to slides to include the taxon (taxa) name(s) for use in a voucher or reference collection.
3. Record the identity and number of organisms on the Laboratory Bench Sheet. Either a tally counter
or “slash” marks on the bench sheet can be done to keep track of the cumulative count. Also, record the life stage of the organisms, taxonomist’s initials and taxonomic certainty rating (TCR) as a measure of confidence.
4. Complete the back of the bench sheet to explain certain TCR ratings or condition of organisms.
Other comments can be included to provide additional insights for data interpretation. If QC was performed, record on back of sheet.
5. For archiving samples, specimen vials, grouped by station and date, are placed in jars with a small
amount of denatured 70% ethanol and tightly capped. The ethanol level in these jars must be examined periodically and replenished as needed, before ethanol loss from the specimen vials takes place. A stick-on label is placed on the outside of the jar indicating sample identifier, date, and preservative (denatured 70% ethanol).
Identification QA/QC Procedures of Macroinvertebrates
1. A voucher collection of all samples and subsamples should be maintained. These specimens should be properly labeled, preserved, and stored in the laboratory for future reference. A taxonomist (the reviewer) not responsible for the original identifications should spot check samples corresponding to the identifications on the bench sheet.
2. The reference collection of each identified taxon should also be maintained and verified by a second
taxonomist. The word “val.” and the 1st initial and last name of the person validating the identification should be added to the vial label. Specimens sent out for taxonomic validations should be recorded in a “Taxonomy Validation Notebook” showing the label information and the date sent out. Upon return of the specimens, the date received and the finding should also be recorded in the notebook along with the name of the person who performed the validation.
3. Information on samples completed (through the identification process) will be recorded in the
“sample log” notebook to track the progress of each sample within the sample lot. Tracking of each sample will be updated as each step is completed (i.e., subsampling and sorting, mounting of midges and worms, taxonomy).

Appendix K
Appendix K. Box Plots of Macroinvertebrate Metrics
K-1

Appendix K
Box and Whisker Plots of the Macroinvertebrate Candidate Metrics (includes monitoring sites for both the North-Central BSR assessment and the Oakwood Lakes assessment)
-1000
0
1000
2000
3000
4000
5000
6000
7000
Abundance CorrectedAbundance
EPT Abundance
Metric n CV Mean SD SE Median IQRAbundance 19 0.14 290.84 39.60 9.09 271.7 to 309.9 299.7 31.2 277.0 to 312.0
Corrected Abundance 19 0.89 1931.52 1726.93 396.18 1099.2 to 2763.9 1440.0 1655.1 661.4 to 2466.0EPT Abundance 19 1.31 50.96 66.70 15.30 18.8 to 83.1 25.0 42.8 9.0 to 69.7
95% CI of Mean 95% CI of Median

Appendix K
-5
0
5
10
15
20
25
30
35
Taxa Richness EPT Taxa Ephemeroptera Taxa Trichoptera Taxa Diptera Taxa Chironomidae Taxa
Metric n CV Mean SD SE Median IQRTaxa Richness 19 0.31 21.18 6.64 1.52 18.0 to 24.4 21.0 10.5 15.0 to 26.0
EPT Taxa 19 0.72 4.01 2.89 0.66 2.6 to 5.4 3.0 3.5 2.0 to 6.0Ephemeroptera Taxa 19 0.70 2.07 1.45 0.33 1.4 to 2.8 2.0 2.0 1.0 to 3.0
Trichoptera Taxa 19 0.82 1.95 1.60 0.37 1.2 to 2.7 2.0 2.0 1.0 to 3.0Diptera Taxa 19 0.37 7.42 2.74 0.63 6.1 to 8.7 8.3 4.8 5.0 to 10.0
Chironomidae Taxa 19 0.40 6.40 2.55 0.59 5.2 to 7.6 7.0 4.8 4.0 to 9.0
95% CI of Mean 95% CI of Median

Appendix K
-40
-20
0
20
40
60
80
100
EPT/Chiro
Abund.
% EPT% Eph
emeropte
ra% Tric
hopter
a% C
oleopte
ra% D
iptera
% Olig
ochae
ta% Bae
tidae
% Hyd
ropsy
chidae
% Chir
onom
idae
% Gastr
opod
aSha
nWien
er (lo
g e)
ShanW
iener
(log 2
)
ShanW
iener
(log 1
0)
Metric n CV Mean SD SE Median IQREPT/Chiro Abund. 19 1.52 0.63 0.96 0.22 0.2 to 1.1 0.2 0.6 0.1 to 1.0
% EPT 19 1.28 16.89 21.62 4.96 6.5 to 27.3 7.6 14.8 3.3 to 24.1% Ephemeroptera 19 0.98 8.29 8.10 1.86 4.4 to 12.2 6.3 10.1 1.1 to 13.0
% Trichoptera 19 2.08 8.60 17.87 4.10 0.0 to 17.2 1.3 4.0 0.3 to 4.7% Coleoptera 19 1.53 2.59 3.96 0.91 0.7 to 4.5 0.6 2.8 0.1 to 3.7
% Diptera 19 0.44 48.45 21.14 4.85 38.3 to 58.6 47.5 26.0 28.9 to 60.0% Oligochaeta 19 1.08 14.81 15.98 3.67 7.1 to 22.5 11.4 28.5 0.6 to 29.5
% Baetidae 19 3.33 0.02 0.07 0.02 0.0 to 0.1 0.0 0.0 0.0 to 0.0% Hydropsychidae 19 2.25 7.95 17.92 4.11 -0.7 to 16.6 0.7 2.7 0.0 to 2.9
% Chironomidae 19 0.45 45.47 20.65 4.74 35.5 to 55.4 44.3 24.0 28.3 to 56.0% Gastropoda 19 1.21 1.75 2.10 0.48 0.7 to 2.8 1.0 2.1 0.0 to 2.5
ShanWiener (log e) 19 0.23 1.94 0.44 0.10 1.7 to 2.2 2.0 0.5 1.7 to 2.2ShanWiener (log 2) 19 0.23 2.80 0.63 0.14 2.5 to 3.1 2.8 0.7 2.4 to 3.2
ShanWiener (log 10) 19 0.23 0.84 0.19 0.04 0.8 to 0.9 0.8 0.2 0.7 to 1.0
95% CI of Median95% CI of Mean

Appendix K
-40
-20
0
20
40
60
80
100
120
140
No. Int
oleran
t Tax
a% In
tolera
nt Orga
nisms
No. Tole
rant T
axa% Tole
rant O
rganis
ms% Burr
owers
% Chir
onom
idae +
Olig
ocha
etaHilse
nhoff B
iotic
Index
% Dom
inant
Taxon
% Hyd
ropsy
chidae
/ Tric
hopte
ra
% Baetid
ae / E
phem
eropte
ra
Metric n CV Mean SD SE Median IQRNo. Intolerant Taxa 19 1.92 0.68 1.31 0.30 0.1 to 1.3 0.0 0.8 0.0 to 1.0
% Intolerant Organisms 19 2.65 2.91 7.69 1.77 -0.8 to 6.6 0.0 0.5 0.0 to 0.7No. Tolerant Taxa 19 0.31 13.61 4.16 0.95 11.6 to 15.6 14.0 5.7 11.0 to 18.0
% Tolerant Organisms 19 0.34 78.62 26.73 6.13 65.7 to 91.5 87.9 24.7 72.5 to 97.9% Burrowers 19 1.98 4.25 8.40 1.93 0.2 to 8.3 1.5 4.1 0.6 to 5.1
% Chironomidae + Oligochaeta 19 0.34 60.28 20.73 4.76 50.3 to 70.3 63.0 31.3 44.6 to 81.2Hilsenhoff Biotic Index 19 0.16 8.37 1.38 0.32 7.7 to 9.0 8.7 1.0 8.0 to 9.3
% Dominant Taxon 19 0.31 39.27 12.20 2.80 33.4 to 45.1 37.4 14.7 31.3 to 47.1% Hydropsychidae / Trichoptera 19 0.89 47.81 42.65 9.78 27.3 to 68.4 50.0 97.2 0.0 to 98.8
% Baetidae / Ephemeroptera 19 3.98 0.27 1.09 0.25 -0.3 to 0.8 0.0 0.0 0.0 to 0.0
95% CI of Median95% CI of Mean

Appendix K
-40-20
020406080
100120140160
% Gathe
rers+
Filterer
s% G
atherer
s% Filte
rers
% Shredd
ers% Scra
pers
Scrape
rs / (S
crape
rs+Filte
rers)
Gathere
r Tax
aFilte
rer Tax
aShre
dder
Taxa
Scrape
r Taxa
No. Clin
gers
% Clin
gers
Clinge
r Tax
a% Pred
ators
Predato
r Ind.
Predato
r Tax
a

Appendix K
Metric n CV Mean SD SE Median IQR% Gatherers+Filterers 19 0 74.64 12.33 2.83 68.7 to 80.6 76.8 13.2 67.9 to 82.2
% Gatherers 19 0 46.28 21.76 4.99 35.8 to 56.8 50.3 26.1 32.1 to 62.4% Filterers 19 1 28.36 23.13 5.31 17.2 to 39.5 20.4 33.7 6.3 to 44.0
% Shredders 19 2 3.96 6.53 1.50 0.8 to 7.1 0.6 4.6 0.0 to 4.9% Scrapers 19 1 3.41 3.62 0.83 1.7 to 5.2 2.0 5.7 0.3 to 6.5
Scrapers / (Scrapers+Filterers) 19 1 15.83 20.14 4.62 6.1 to 25.5 10.9 13.6 0.8 to 16.1Gatherer Taxa 19 0 7.67 3.07 0.70 6.2 to 9.1 7.0 4.3 5.0 to 10.0
Filterer Taxa 19 1 3.04 2.13 0.49 2.0 to 4.1 2.0 2.7 1.0 to 4.3Shredder Taxa 19 1 1.26 1.08 0.25 0.7 to 1.8 1.7 2.0 0.0 to 2.0
Scraper Taxa 19 1 1.75 1.42 0.33 1.1 to 2.4 1.3 2.0 0.7 to 3.0No. Clingers 19 1 26.90 35.93 8.24 9.6 to 44.2 11.0 39.8 2.0 to 44.0
% Clingers 19 1 8.91 11.50 2.64 3.4 to 14.5 4.2 13.0 0.7 to 14.8Clinger Taxa 19 1 2.94 1.62 0.37 2.2 to 3.7 3.0 2.5 1.0 to 4.0% Predators 19 1 16.29 13.62 3.12 9.7 to 22.9 11.8 13.2 6.7 to 20.4
Predator Ind. 19 1 46.12 41.42 9.50 26.2 to 66.1 34.3 41.0 19.0 to 64.0Predator Taxa 19 0 6.95 2.57 0.59 5.7 to 8.2 7.0 2.7 5.3 to 9.0
95% CI of Median95% CI of Mean

Appendix L
Appendix L. Macroinvertebrate Score Sheets
L-1

Appendix L
Macroinvertebrate Score Sheets – River Sites
Site R01
MetricResponse to Impairment
Percentile for "best" value
Standard (best value)
Measured metric value
Standardized Metric score
Abundance Decrease 95th 323 304 94Taxa Richness Decrease 95th 33 23 70EPT Richness Decrease 95th 11 12 100Diptera Richness Decrease 95th 11 8 73% EPT Decrease 95th 69.2 69.9 100% Diptera Increase 5th 28.1 28.9 99% Chironomidae Increase 5th 26.8 28.3 98% Tolerant Increase 5th 8.3 15.6 92% Chironomidae + Oligochaeta Increase 5th 27.8 28.6 99% Hydropsychidae/Trichoptera Increase 5th 0 98.8 1% Gatherers Decrease 95th 70.4 5.7 8% Filterers Increase 5th 2.8 66.7 34% Clingers Decrease 95th 37.9 20.3 54
71Final index value for this site:
Site R14
MetricResponse to Impairment
Percentile for "best" value
Standard (best value)
Measured metric value
Standardized Metric score
Abundance Decrease 95th 323 300 93Taxa Richness Decrease 95th 33 27 82EPT Richness Decrease 95th 11 3 27Diptera Richness Decrease 95th 11 10 91% EPT Decrease 95th 69.2 13.3 19% Diptera Increase 5th 28.1 60.0 56% Chironomidae Increase 5th 26.8 59.3 56% Tolerant Increase 5th 8.3 92.0 9% Chironomidae + Oligochaeta Increase 5th 27.8 71.3 40% Hydropsychidae/Trichoptera Increase 5th 0 0.0 100% Gatherers Decrease 95th 70.4 42.7 61% Filterers Increase 5th 2.8 12.0 91% Clingers Decrease 95th 37.9 2.7 7
56Final index value for this site:

Appendix L
Site R15
MetricResponse to Impairment
Percentile for "best" value
Standard (best value)
Measured metric value
Standardized Metric score
Abundance Decrease 95th 323 274 85Taxa Richness Decrease 95th 33 34 100EPT Richness Decrease 95th 11 5 45Diptera Richness Decrease 95th 11 11 100% EPT Decrease 95th 69.2 5.8 8% Diptera Increase 5th 28.1 36.9 88% Chironomidae Increase 5th 26.8 35.0 89% Tolerant Increase 5th 8.3 80.3 21% Chironomidae + Oligochaeta Increase 5th 27.8 64.2 50% Hydropsychidae/Trichoptera Increase 5th 0 15.4 85% Gatherers Decrease 95th 70.4 57.3 81% Filterers Increase 5th 2.8 12.0 91% Clingers Decrease 95th 37.9 6.9 18
66Final index value for this site: Site R16
MetricResponse to Impairment
Percentile for "best" value
Standard (best value)
Measured metric value
Standardized Metric score
Abundance Decrease 95th 323 300 93Taxa Richness Decrease 95th 33 19 58EPT Richness Decrease 95th 11 1 9Diptera Richness Decrease 95th 11 8 73% EPT Decrease 95th 69.2 0.4 1% Diptera Increase 5th 28.1 52.3 66% Chironomidae Increase 5th 26.8 51.6 66% Tolerant Increase 5th 8.3 92.0 9% Chironomidae + Oligochaeta Increase 5th 27.8 88.9 15% Hydropsychidae/Trichoptera Increase 5th 0 0.0 100% Gatherers Decrease 95th 70.4 74.7 100% Filterers Increase 5th 2.8 6.1 97% Clingers Decrease 95th 37.9 4.2 11
54Final index value for this site: Site R17
MetricResponse to Impairment
Percentile for "best" value
Standard (best value)
Measured metric value
Standardized Metric score
Abundance Decrease 95th 323 288 89Taxa Richness Decrease 95th 33 29 88EPT Richness Decrease 95th 11 5 45Diptera Richness Decrease 95th 11 11 100% EPT Decrease 95th 69.2 9.4 14% Diptera Increase 5th 28.1 38.2 86% Chironomidae Increase 5th 26.8 35.4 88% Tolerant Increase 5th 8.3 91.0 10% Chironomidae + Oligochaeta Increase 5th 27.8 68.1 44% Hydropsychidae/Trichoptera Increase 5th 0 66.7 33% Gatherers Decrease 95th 70.4 56.6 80% Filterers Increase 5th 2.8 1.0 100% Clingers Decrease 95th 37.9 3.8 10
61Final index value for this site:
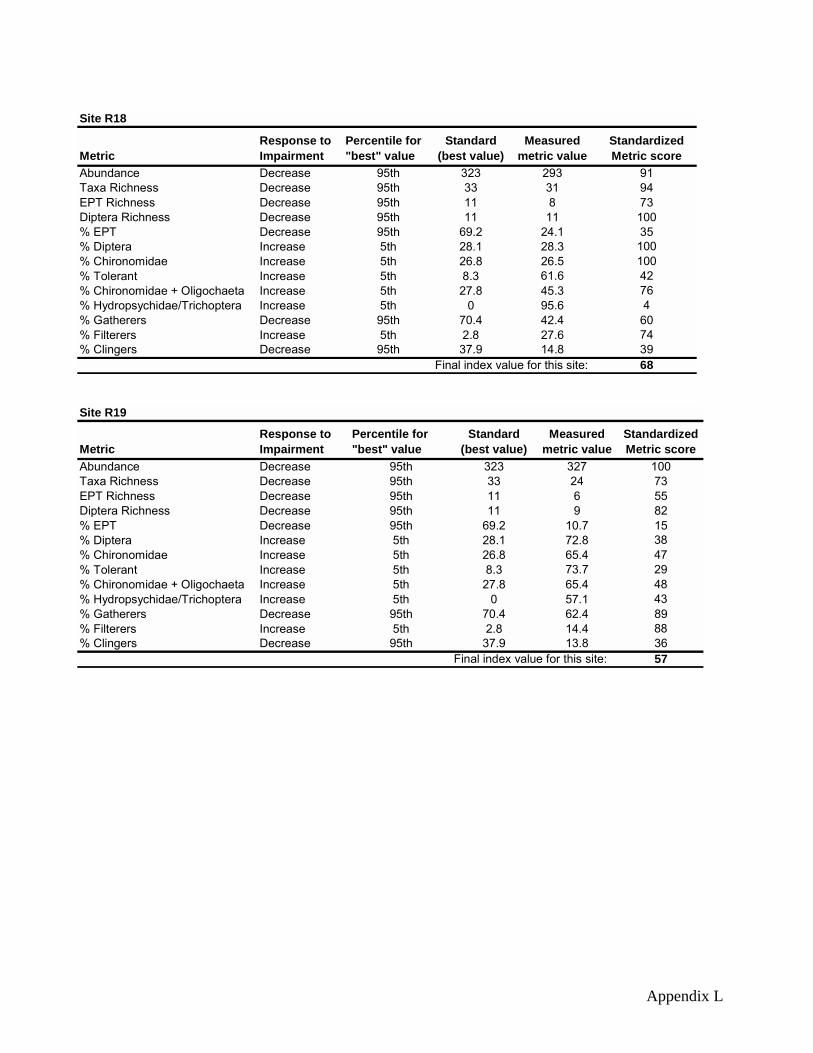
Appendix L
Site R18
MetricResponse to Impairment
Percentile for "best" value
Standard (best value)
Measured metric value
Standardized Metric score
Abundance Decrease 95th 323 293 91Taxa Richness Decrease 95th 33 31 94EPT Richness Decrease 95th 11 8 73Diptera Richness Decrease 95th 11 11 100% EPT Decrease 95th 69.2 24.1 35% Diptera Increase 5th 28.1 28.3 100% Chironomidae Increase 5th 26.8 26.5 100% Tolerant Increase 5th 8.3 61.6 42% Chironomidae + Oligochaeta Increase 5th 27.8 45.3 76% Hydropsychidae/Trichoptera Increase 5th 0 95.6 4% Gatherers Decrease 95th 70.4 42.4 60% Filterers Increase 5th 2.8 27.6 74% Clingers Decrease 95th 37.9 14.8 39
68Final index value for this site: Site R19
MetricResponse to Impairment
Percentile for "best" value
Standard (best value)
Measured metric value
Standardized Metric score
Abundance Decrease 95th 323 327 100Taxa Richness Decrease 95th 33 24 73EPT Richness Decrease 95th 11 6 55Diptera Richness Decrease 95th 11 9 82% EPT Decrease 95th 69.2 10.7 15% Diptera Increase 5th 28.1 72.8 38% Chironomidae Increase 5th 26.8 65.4 47% Tolerant Increase 5th 8.3 73.7 29% Chironomidae + Oligochaeta Increase 5th 27.8 65.4 48% Hydropsychidae/Trichoptera Increase 5th 0 57.1 43% Gatherers Decrease 95th 70.4 62.4 89% Filterers Increase 5th 2.8 14.4 88% Clingers Decrease 95th 37.9 13.8 36
57Final index value for this site:

Appendix L
Site R20
MetricResponse to Impairment
Percentile for "best" value
Standard (best value)
Measured metric value
Standardized Metric score
Abundance Decrease 95th 323 315 98Taxa Richness Decrease 95th 33 17 52EPT Richness Decrease 95th 11 7 64Diptera Richness Decrease 95th 11 5 45% EPT Decrease 95th 69.2 67.9 98% Diptera Increase 5th 28.1 27.9 100% Chironomidae Increase 5th 26.8 27.3 99% Tolerant Increase 5th 8.3 4.4 100% Chironomidae + Oligochaeta Increase 5th 27.8 27.3 100% Hydropsychidae/Trichoptera Increase 5th 0 100.0 0% Gatherers Decrease 95th 70.4 4.1 6% Filterers Increase 5th 2.8 63.8 37% Clingers Decrease 95th 37.9 47.3 100
69Final index value for this site:

Appendix L
Macroinvertebrate Score Sheets – Tributary
Site T34
MetricResponse to Impairment
Percentile for "best" value
Standard (best value)
Measured metric value
Standardized Metric score
Abundance Decrease 95th 324 334 100Taxa Richness Decrease 95th 26 26 79EPT Richness Decrease 95th 5 6 55Diptera Richness Decrease 95th 10 7 64% EPT Decrease 95th 37.4 7.5 11% Diptera Increase 5th 16.4 18.6 100% Chironomidae Increase 5th 15.1 18.6 100% Tolerant Increase 5th 70.6 97.9 2% Chironomidae + Oligochaeta Increase 5th 35.5 29.9 97% Hydropsychidae/Trichoptera Increase 5th 0 50.0 50% Gatherers Decrease 95th 74.4 68.6 97% Filterers Increase 5th 5.1 6.3 96% Clingers Decrease 95th 17.9 7.2 19
67Final index value for this site: Site T35
MetricResponse to Impairment
Percentile for "best" value
Standard (best value)
Measured metric value
Standardized Metric score
Abundance Decrease 95th 324 144 45Taxa Richness Decrease 95th 26 10 30EPT Richness Decrease 95th 5 1 9Diptera Richness Decrease 95th 10 4 36% EPT Decrease 95th 37.4 0.8 1% Diptera Increase 5th 16.4 51.6 67% Chironomidae Increase 5th 15.1 50.4 68% Tolerant Increase 5th 70.6 98.0 2% Chironomidae + Oligochaeta Increase 5th 35.5 81.2 26% Hydropsychidae/Trichoptera Increase 5th 0 0.0 100% Gatherers Decrease 95th 74.4 39.5 56% Filterers Increase 5th 5.1 44.0 58% Clingers Decrease 95th 17.9 0.5 1
38Final index value for this site:

Appendix L
Site T36
MetricResponse to Impairment
Percentile for "best" value
Standard (best value)
Measured metric value
Standardized Metric score
Abundance Decrease 95th 324 277 86Taxa Richness Decrease 95th 26 26 79EPT Richness Decrease 95th 5 4 36Diptera Richness Decrease 95th 10 10 91% EPT Decrease 95th 37.4 13.7 20% Diptera Increase 5th 16.4 57.8 59% Chironomidae Increase 5th 15.1 56.0 60% Tolerant Increase 5th 70.6 79.8 22% Chironomidae + Oligochaeta Increase 5th 35.5 60.3 55% Hydropsychidae/Trichoptera Increase 5th 0 100.0 0% Gatherers Decrease 95th 74.4 32.1 46% Filterers Increase 5th 5.1 49.5 52% Clingers Decrease 95th 17.9 15.9 42
50Final index value for this site: Site T37
MetricResponse to Impairment
Percentile for "best" value
Standard (best value)
Measured metric value
Standardized Metric score
Abundance Decrease 95th 324 307 95Taxa Richness Decrease 95th 26 21 64EPT Richness Decrease 95th 5 4 36Diptera Richness Decrease 95th 10 10 91% EPT Decrease 95th 37.4 46.8 68% Diptera Increase 5th 16.4 47.5 73% Chironomidae Increase 5th 15.1 47.1 72% Tolerant Increase 5th 70.6 68.7 34% Chironomidae + Oligochaeta Increase 5th 35.5 48.1 72% Hydropsychidae/Trichoptera Increase 5th 0 35.4 65% Gatherers Decrease 95th 74.4 25.7 37% Filterers Increase 5th 5.1 40.3 61% Clingers Decrease 95th 17.9 19.9 53
63Final index value for this site: Site T39
MetricResponse to Impairment
Percentile for "best" value
Standard (best value)
Measured metric value
Standardized Metric score
Abundance Decrease 95th 324 306 95Taxa Richness Decrease 95th 26 17 52EPT Richness Decrease 95th 5 2 18Diptera Richness Decrease 95th 10 5 45% EPT Decrease 95th 37.4 4.9 7% Diptera Increase 5th 16.4 68.5 44% Chironomidae Increase 5th 15.1 42.6 78% Tolerant Increase 5th 70.6 72.5 30% Chironomidae + Oligochaeta Increase 5th 35.5 63.0 51% Hydropsychidae/Trichoptera Increase 5th 0 0.0 100% Gatherers Decrease 95th 74.4 35.3 50% Filterers Increase 5th 5.1 13.4 89% Clingers Decrease 95th 17.9 0.1 0
51Final index value for this site:

Appendix L
Site T40
MetricResponse to Impairment
Percentile for "best" value
Standard (best value)
Measured metric value
Standardized Metric score
Abundance Decrease 95th 324 312 97Taxa Richness Decrease 95th 26 13 39EPT Richness Decrease 95th 5 0 0Diptera Richness Decrease 95th 10 3 27% EPT Decrease 95th 37.4 0.0 0% Diptera Increase 5th 16.4 88.5 16% Chironomidae Increase 5th 15.1 88.5 16% Tolerant Increase 5th 70.6 99.0 1% Chironomidae + Oligochaeta Increase 5th 35.5 89.1 15% Hydropsychidae/Trichoptera Increase 5th 0 0.0 100% Gatherers Decrease 95th 74.4 55.8 79% Filterers Increase 5th 5.1 36.5 65% Clingers Decrease 95th 17.9 0.6 2
35Final index value for this site: Site T46
MetricResponse to Impairment
Percentile for "best" value
Standard (best value)
Measured metric value
Standardized Metric score
Abundance Decrease 95th 324 280 87Taxa Richness Decrease 95th 26 16 48EPT Richness Decrease 95th 5 2 18Diptera Richness Decrease 95th 10 5 45% EPT Decrease 95th 37.4 1.4 2% Diptera Increase 5th 16.4 40.4 83% Chironomidae Increase 5th 15.1 33.9 90% Tolerant Increase 5th 70.6 87.9 13% Chironomidae + Oligochaeta Increase 5th 35.5 84.6 21% Hydropsychidae/Trichoptera Increase 5th 0 0.0 100% Gatherers Decrease 95th 74.4 56.8 81% Filterers Increase 5th 5.1 20.4 82% Clingers Decrease 95th 17.9 3.6 9
52Final index value for this site:

Appendix L
Site T47
MetricResponse to Impairment
Percentile for "best" value
Standard (best value)
Measured metric value
Standardized Metric score
Abundance Decrease 95th 324 275 85Taxa Richness Decrease 95th 26 24 73EPT Richness Decrease 95th 5 3 27Diptera Richness Decrease 95th 10 9 82% EPT Decrease 95th 37.4 28.0 40% Diptera Increase 5th 16.4 14.2 100% Chironomidae Increase 5th 15.1 11.6 100% Tolerant Increase 5th 70.6 85.1 16% Chironomidae + Oligochaeta Increase 5th 35.5 41.1 82% Hydropsychidae/Trichoptera Increase 5th 0 72.7 27% Gatherers Decrease 95th 74.4 77.8 100% Filterers Increase 5th 5.1 4.4 98% Clingers Decrease 95th 17.9 4.7 12
65Final index value for this site:

Appendix M
Appendix M. Terms and Definitions of the Physical Habitat Measurements
M-1

Appendix M
Terms and Definitions of the Physical Habitat Measurements Definitions and measurements procedures for site variables (adapted from Wolman 1954; Hughes and Omernik 1981; Platts etal. 1983; Schumm et al. 1984, Robison and Beschta 1990; Gordon et al. 1992; Simonson et al. 1994, Harrelson et al. 1994, and Rosgen 1996). Transect – A line that extends from the left bank to the right bank, perpendicular to stream flow. Channel bank (stream bank) – The sides of the channel (or stream) that typically restrict lateral movement of water and sediment.
Channel bottom (stream bed) – The bottom portion of the channel (or stream) that typically does not restrict lateral movement of sediment and water.
Bankfull – That point on the channel bank where flows begin to crest that bank and move onto the floodplain. Bank top – Often the same point as bankfull except in streams that are incised.
Incised – Describes channels or streams with bottoms that have or are in the process of downcutting into the landscape. High, steep, eroding banks are often associated with incised streams.
Channel Morphometry
Stream width (m) - Horizontal distance along transect, measured perpendicular to stream flow from left edge of water to right edge of water at existing water surface, to nearest 0.1 m.
Stream depth (m) - Vertical distance from existing water surface to channel bottom; measured at three equally spaced points along transect, to nearest 0.1 m.
Channel bottom depth (m) - Horizontal distance along transects, measured perpendicular to stream flow, measured as that section classified as stream bed not stream bank, to the nearest 0.1 m.
Bankfull width (m) - Horizontal distance along transects, measured perpendicular to stream flow, from top of low bank to a point of equal height on opposite bank, to nearest 0.1m. See Harrelson et al. (1994) for useful indicators of bankfull.
Bankfull depth (m) - Vertical distance from the plane of bankfull with to the channel bottom or bank, measured at a number of equally spaced points along the transect to adequately describe mean bankfull depth and cross-section, to the nearest 0.1 m.
Width:depth ratio - An index of cross-sectional shape, where both width and depth are measured at the bankfull level, unitless.

Appendix M
Bank height (m) - Vertical distance along transect from edge of channel bottom to level land on top of bank, measured to the nearest 0.1 m. Does not refer to bankfull height. Stream bottom slope (%) - The amount of vertical drop per unit of horizontal distance along the channel bottom, measured with surveyor’s level.
Stream surface slope (%) - The amount of vertical drop per unit of horizontal distance along the water surface, measured with surveyor’s level.
Bed and Bank Material
It is very important to distinguish between clay and silt. Although both are composed of very fine particles, their properties are quite different. For example, clay can be very resistant to erosion, where particles of silt can be easily eroded. These properties can play a strong role in channel morphometry.
Channel bed substrate - Composition of bed material classified into size categories similar to Wolman’s pebble count. A substrate particle is selected off the bed surface (except for fine substrates) at 8 equal distances along each transect in the channel and placed into one of the following categories:
Detritus (organic matter) Clay (< 0.004 mm; inorganic matter; retains shape when compressed) Silt (0.004-0.062 mm; inorganic matter does not retain shape when compressed ) Sand (0.062-2 mm) Very Fine Gravel (2-4 mm) Fine Gravel (4-8 mm) Medium Gravel (8-16 mm) Coarse Gravel (16-32 mm) V. Coarse Gravel (32-64 mm) Cobble (64-128 mm) Large Cobble (128-256 mm) Boulder (256-512 mm) Large Boulder (>512 mm)
Streambed substrate - If the channel is not completely inundated, then this is the composition of bed material with the wetted channel classified in to size categories similar to Wolman’s Pebble count. A substrate particle is selected off the inundated bed surface at eight equal distances along each transect in the stream and placed into one of the categories listed above.
Bank substrate - Composition of bank material classified into size categories similar to Wolman’s Pebble Count.
Streambank and Riparian Characteristics
Streambank length - the linear distance along the transect from the junction of the stream bed and the stream bank to the top of the bank, measured to the nearest 0.1 m.

Appendix M
Streambank vegetation - A measurement of bank resistance to erosion due to vegetation, measured as the linear distance along the streambank length, which is vegetated by perennial herbaceous plants (grasses, forbs and aquatic species), shrubs or trees.
Streambank erosion - A measurement of bank instability along the transect line measured as the linear distance of exposed and eroded bank soils having very little to no structural support from vegetation during high flows. This does not include area of deposition where soils can be bare.
Streambank deposition - The Stream bank length that is neither vegetated not eroded.
Streambank slope (degree) - The angle formed by the downward slope of the stream bank and the horizontal stream bottom.
Riparian buffer with (m) - The condition of the land contour on the horizontal distance along the transect line from the stream’s edge out 10 m. If the land is completely disturbed, then the riparian buffer is 0. If the land is completely undisturbed, then the buffer width is recorded as >10m. It may be appropriate to measure or approximate buffer widths beyond 10 m. Buffer widths <10 m should be measured to the nearest 1 m.
Riparian land use - The land use on the bank contour over the horizontal distance along the transect line from the stream’s edge out 10 m. Land use classes are adapted from Simonson et al. (1994). Vegetation use by animals - The condition of the vegetation by any land use (but primarily grazing and row cropping) on the transect line over the contour of the bank from the stream’s edge out 10 m. Rating procedures are described by Platts et al. (1983).
Streamflow Characteristics
Streamflow (Q, cms) - The volume of water moving past a given stream cross section per unit of time. Physical Fish Cover
Overhanging vegetation - If present, the bankside, banktop, and non-inundated vegetation that currently overhangs the water surface. Measured as the horizontal distance along the transect line from the water’s edge to the furthest point over the water surface that the vegetation protrudes, to the nearest 0.1 m. Undercut bank - If present, the horizontal distance along the transect line from the furthest point of bank protrusion and the furthest undercut of the bank, to the nearest 0.1 m.

Appendix M
Instream vegetation - If present the inundated macrophytic vegetation (submergent or emergent) within the stream channel. Measured as the total horizontal distance along the transect that has instream vegetation present as described, to the nearest 0.1 m.
Large woody debris (LWD), occurrence of - Generally, LWD are pieces of wood that are minimally 10 cm in diameter and 3 m long that occur within the bankfull channel providing potential cover for organisms. Measured along the transect and within one mean stream width separately as the number of pieces within the stream different zones.
Large woody debris (LWD), volume and orientation - Volume (cubic meters) of those same pieces within four zones calculated by measuring length and diameter of each piece of LWD. Orientation is recorded as the degrees to which the woody debris is predominately orientated with respect to the channel. Woody debris orientated completely upstream (i.e., root wad on downstream end) would be recorded as 180 while that orientated perpendicular to the channel would be recorded as 90, and that orientated completely downstream (i.e., root wad on upstream end) would be recorded as 0. See Robison and Beshta (1990). Dominant habitat type along the transect is designated as pool, riffle, or run. Stream bank and riparian features include several variables. A certain amount of ambiguity will occur when attempting to identify features used as endpoints for measuring this suite of linear features. One ambiguity is the breakpoint between the channel bank and channel bottom. Measurements related to stream bank length, bank angle, and bank height will be affected by location of this point. Another ambiguity is the demarcation between the vegetated and non-vegetated portions of the channel bank. The vegetated portion contributes a root structure that holds bank soil together. Riparian-related cover types include five linear cover measurements that depend on the type and health of riparian vegetation: overhanging vegetation, undercut bank, submergent macrophytes, emergent macrophytes and large woody debris. When a piece of LWD or log jam is encountered, data entries include: transect space, log jam number (if applicable), LWD piece number, zone, meander location, habitat association, orientation (angle), and volume measurements (length and diameter). Transect space is simply the section between two consecutive transects. Zone, meander location, and habitat association are described on the data sheet. Volume measurements are the length and diameter of each piece of LWD. A graduated pole is more useful than a tape measure. One diameter measurement is made at the mid-section of the debris.
Bed and bank substrate data collection procedures follow the Wolman “pebble count” method. Along the transect, the bed is visually divided into eight cells using the tape measure as a guide. Within each cell, a crew member reaches to the bottom of the stream with one finger extended and eyes averted. The first piece of substrate touched is lifted to the surface. The substrate size is measured and the class size recorded. This method provides a way to objectively classify substrates in clear streams and is a necessity in turbid streams where visual estimates are not possible. Also, more than

Appendix M
100 substrates points can be combined from all transects, categorized and analyzed according to common fluvial methods or user needs.
Transect point data are measurements associated with a series of points lined up on an imaginary from left bank to the right bank. Each point has a location code, which identifies the channel feature at the point, and station number which is the point’s horizontal distance from the left bank along the transect. Transect point data aid characterization of channel morphology, and are used to calculate the width if the stream surface, the channel bottom, and the width at bankfull. Point measurements include depth measurements. Depth measurements are used in conjunction with bankfull width to calculate width:depth ratios. Depth measurements and velocities are taken at three points in the stream (1/4, 1/2, and 3/4 of the distance across the stream surface) to characterize the physical conditions of the stream habitat at the time of sampling.
Discharge.—Discharge data is collected at a single transect or other stream cross-section where flows are uniform. The velocity-area method described in Gordon et al. (1992) is used.
Water Surface Slope (%) —Using a surveying level and tripod, or other method, the drop in water surface slope from transect one to transect 13 is measured and divided by the
horizontal stream distance.
Water Quality.—Water quality data include easily measured parameters that are basic to a minimal assessment of the suitability of the site to fishes. Parameters are listed in Table 1.
Reach Classification.—For each reach, stream type (Rosgen 1996) and stage of channel evolution (Schumm et al. 1984) characterized level of stability and potential channel sources of sediment through bed and bank erosion.

Appendix N
Appendix N. Field Data Sheets
N-1

Appendix N
On Site Description Data Project Site ID: Stream Name:
m/d/yr____________
T , R , 1/4 of Sec______
GPS coordinates (utm): Transect 1, Northing_________________________Easting_______________________ Downstream Transect, Northing_________________________Easting_______________________ Investigators:__________________________________________________________________________________ Rosgen Classification (field level evaluation):________________________________________________________ Habitats Available number of each
Pool Run Riffle Other (describe) ______________________ Lengths of Riffle(s): , , , , . Total=________
Preliminary Mean Stream Width
Water Quality
Width
Number
Width (0.1 m)
Parameter
Reading
1
Time (2400)
2
Water Temperature (oC)
3
Air Temperature (oC)
4
Turbidity (NTU)
5
Secchi (cm)
6
Dissolved Oxygen (mg/L)
7
Specific Conductance (uS/cm)
8
Conductivity (uS/cm)
9
Visual Observations:
10
Odor - yes no
Sum
Septic - yes no
PMSW
Deadfish - yes no Surface Film - yes no
Transect Spacing:______________
Color: _______________________________

Appendix N
Reach Length: ________________
Weather Conditions: Current Past 24 h 9 9 Clear/sunny 9 9 Partly cloudy 9 9 Intermittent showers 9 9 Steady rain 9 9 Heavy rain Ice Cover - yes no

Appendix N
Map, Slope Measurements, and Photo-documentation Data Project Site ID: Stream Name: m/d/yr:____________ Water Surface Slope Measurements for Reach Transect #
Height of Inst. (cm)
Rod Reading from water surface (cm)
Elevation Difference (0.01 m)
Horizontal Distance (reach length above)
Slope (m/m)
Slope (%)
Draw a map of the site with location of most upstream and most downstream transects. Include locations of photographic points, direction of photograph, and frame number.

Appendix N
Bed Substrate Composition Project Site ID: Stream Name: m/d/yr:____________ Organic Substrates
Description
Tally
Number
Detritus
sticks, wood, coarse plant
material (CPOM)
Muck-Mud
black, very fine organic
(FPOM)
Inorganic Substrates
Diameter
Tally
Number
Clay
<0.004 (slick)
Silt
0.004-0.062
Sand
0.062-2 (gritty)
Very Fine Gravel
>2-4
Fine Gravel
>4-8
Medium Gravel
>8-16
Coarse Gravel
>16-32
Very Coarse Gravel
>32-64
Cobble
>64-128
Large Cobble
>128-256
Boulder
>256-512
Large Boulder
>512
Total Number:

Appendix N
Transect Data Project Site ID: Stream Name: m/d/yr:__________________ Transect Number _______of ________ Habitat Type Along Transect (circle one): pool riffle run
Streambank and Riparian Features
Left Bank
Right Bank
Bank Substrate (dominant) Bank Slumpage (present, p or absent, a) Bank Height (0.1 m) Bankfull Height (0.1) Bank Angle (degrees) Streambank length (0.1 m) Length of Streambank Vegetated (0.1 m) Length of Streambank Eroded (0.1 m) Length of Streambank Deposition (0.1 m) Riparian landuse (circle one)
cropland pasture/rangeland prairie wetland shrub
woodland/forested barnyard developed other-specify
cropland pasture/rangeland prairie wetland shrub
woodland/forested barnyard developed other-specify
Animal Vegetation Use (circle one)
none low
moderate high
none low
moderate high
Riparian Vegetation Type (Dominant)
sedge/rush cottonwoods grass/forb green ash
willows silver maple shrubs other__________
sedge/rush cottonwoods grass/forb green ash
willows silver maple shrubs other__________
Riparian Age Class(es) of Trees, if present
seedling/sprout young/sapling mature
decadent dead
seedling/sprout young/sapling mature
decadent dead
Riparian Buffer Width (m) Overhanging Vegetation (0.1 m) Undercut Bank (0.1 m) Submergent Macrophytes (0.1 m) Emergent Macrophytes (0.1 m)
Transect Data and Depth Velocity Data
(record units under the heading for each column) Location Code
Station
Bankfull
Depth
Water Depth
Velocity
LTB
LBF
LEW
LCB
STR (@1/4)
STR (@1/2)
STR (@3/4)
RCB
REW
RBF
RTB
Location Codes:
LTB left top bank RTB right top bank LBF left bankfull RBF right bankfull
LCB left channel bottom
RCB right channel bottom LEW left edge water
REW right edge water
STR stream Bank top width (RTB-LTB) =____________ Bankfull width (RBF-LBF)=____________ Channel Bottom Width (RCB-LCB)=____________ Stream Width (REW-LEW)=____________ Average Bank Full Depth = ______________

Appendix N
Seine Fish Data Project Site ID:_______Stream Name:_________________________m/d/yr:___________Page ________of______
Method of Collection
9 Upstream 9 Downstream 9 Cross-stream 9 Kick Bag attached? Yes No Mesh Size Block nets used? Yes No
Habitat Sample ID #
Habitat(s) Sampled for ID # listed above
9 Pool 9 Run 9 Riffle 9 Composite (entire reach) 9 Other (describe)____________________________________________
Transect spacing for above ID #
Starting Transect____________ Ending Transect____________
Pass #
_____________of_______________
Fish Data
Species Code
Bulk #
Length (mm)
Bulk weight
(g)
Parasites
&Anomalies
Species Code
Bulk #
Length (mm)
Bulk
weight (g)
Parasites
&Anomalies
Parasites & Anomalies Code: D= deformed, EF=eroded fin, FG=fungus, LE=lesions, AW=anchor worm, BS=blackspot, EM=emaciated, O=other.

Appendix N
Project Site ID Stream Name: m/d/yr: Page of_______
Habitat Sample ID # Pass #: of __________
Fish Data
Species Code
Bulk #
Length (mm)
Bulk weight
(g)
Parasites
&Anomalies
Species Code
Bulk #
Length (mm)
Bulk
weight (g)
Parasites
&Anomalies
Parasites & Anomalies Code: D= deformed, EF=eroded fin, FG=fungus, LE=lesions, AW=anchor worm, BS=blackspot, EM=emaciated, O=other.

Appendix N
Large Woody Debris Data
Project Site ID: Stream Name: m/d/yr:_____________ Page of ___
Transect Spacing
Log Jam Number
LWD Number
Zone
Meander Location
Habitat
Association
Angle
Length
Diameter
Zone: B=bank, C=mid-channel Meander Location: IM=inside meander, OM=outside meander, CO=crossover, SS=straight section Habitat Association: PL=pool, RF=riffle, RN=run

Appendix N
Discharge (record units under the heading for each column)
Project Site ID: Stream Name: m/d/yr:_____________ Staff Gauge Reading:___________________
Number
Cell Spacing
Station
Cell Width (W)
Cell Depth (D)
Velocity
(V)
Cell Discharge (W x D x V)
1
2
3
4
5
6
7
8
9
10
11
12
13
14
15
16
17
18
19
20
21
22
23
24
25
26
27
28
29
30
Total Discharge = Sum=

Appendix N
Macroinvertebrate Rock Basket Information
Project Site ID:__________ Site Location:______________________________
Canopy Cover (circle one): 0-25% 26-50% 51-75% 76-100%
Rock Basket Placement Conditions Date:______________ Time:________ Placed By:_____________________
Number of Rock Baskets Placed:__________ Design (circle one): Cone Flat
Basket Number Water Depth Water Velocity Habitat Type Comments 1 2 3 4 5
Interim Conditions
Date:______________ Time:________ Basket Number Water Depth Water Velocity Habitat Type Comments
1 2 3 4 5
Rock Basket Retrieval Conditions Date:______________ Time:________ Recovered By:__________________ Number of Rock Baskets Recovered:_______ Colonization Days:______________ Litter Packs(circle one): Absent/Rare Common Abundant Basket Number Water Depth Water Velocity Habitat Type Comments
1 2 3 4 5
(over)

Appendix N
Macroinvertebrate Rock Basket Information Project ____________________________ Project Site ID ______________________ Site Name _________________________ Date of Placement ___________________
Date of Retrieval __________________
DO _________________
DO ______________________
Water Temp ___________________
Water Temp _______________________
Conductivity ___________________
Conductivity _______________________
pH __________________
pH ___________________
Turbidity _________________
Turbidity __________________
Basket Location Map:

Appendix O
Appendix O. WRI Lab Memo
O-1

Appendix O
To: East Dakota Water Development District project staff 1/17/03 From: David German Re: QA/QC problems with the Kjeldahl Unit A malfunction of the Kjeldahl unit in the Water Resources Institute’s Water Quality Laboratory (WQL) was identified in October 2002. The decision has been made to replace the unit. A call for bids is going out next week. The new unit should be on-line by mid-March 2003. The Kingsbury Lakes project staff first reported hits on blanks they had submitted to the lab in 2001. Water Quality Lab staff ran additional blanks on the instrument to check for errors at that time. Results were good and the hits were assumed to be due to sample preparation and handling. Source water, acid preservative, and bottles are all possible sources of nitrogen in blanks. For example, source water was a problem for East Dakota Water Development District (EDWDD) blanks submitted in July and August 2002, which had small but detectable concentrations of dissolved solids. The reverse osmosis (R.O.) unit in the WQL had reduced efficiency during this period until the membrane was replaced. The best source water for blanks is water produced by the Nanopure system. This unit produces small quantities of very high quality water, which should be used for all blanks and preparation of known additions to blanks. R.O. water is adequate for washing and rinsing but may contain small amounts of nitrate and other constituents. It is my understanding that the Kingsbury Lakes project staff took a series of steps to identify the problem causing detections in the blanks. In September 2002 project leaders became convinced the problem was in the WQL rather than in sample preparation. A series of test runs were completed to diagnose the problem. The results of those test runs are included in Tables 1 and 2. The results of these tests indicated a malfunction of the Kendal unit. Table 1 includes the results of samples mostly submitted by the Kingsbury Lakes project. Results of analysis from blanks and knowns ran by the WQL are presented in Table 2. I met with the Kingsbury Lakes project staff to discuss a plan to determine the source of the malfunction. Two lab blanks were analyzed on 9-23-02 (Table 2). A significant hit (.424 ppm) was observed on burner #5. A set of samples submitted by Kingsbury Lakes project staff as actual lake samples were also analyzed on 9-24-02 and 9-25-02. Hits were observed on burners 5 and 6 (Table 1) but results were inconsistent. For example, a hit was observed on burner 5 on 9-25-02, but not on 9-24-02 (Table 1). The intermittent nature of the problem was evident in the QA/QC samples submitted by the Kingsbury Lake project earlier in the year also (Table 1). For example, a hit was observed on burner 3 on 7-30-02 but not on 7-29-02.

Appendix O
Analysis of the QA/QC data in Table 1 indicated intermittent problems with burners 3, 5, 6, and 11. Most of the blanks analyzed in 2002 for both the Kingsbury Lakes project and the EDWDD were analyzed on these four burners. Following the set of blanks submitted as samples by the Kingsbury Lakes project staff a series of test runs were conducted by the WQL. The additional blanks were analyzed by the WQL to determine if a pattern could be established that would allow for correction of the data. The results are presented in Table 2. Burners 5 and 6 appear to be the most likely to produce hits, although not consistently. Burner 3 was also suspect based on hits in July (Table 1) but was not included in the test phase because it went out of service on September 17th and the parts needed for repair were out of stock. The lack of consistency of hits on a particular burner may be due to the amount of ammonia in the air in the lab. According to the manufacturer, the distillation unit consists of a stacked apparatus with seals between the parts. A failure in these seals may allow distillation of ammonia from the air in the lab into a blank sample. This may account for the lack of hits in the ammonia analysis (the first distillation of the day) when compared to the organic ammonia distillation (the second distillation of the day). More ammonia in the air around the instrument in the afternoon is available to leak into the distillation unit on the second distillation. This may also explain why lower hits were observed when full sets of blanks were run (Table 2). After reviewing the results from the series of runs using lab blanks I still had some questions about how the problem affects actual sample values. Blanks seem to have an error of approximately .4 ppm increase in concentration when run with actual samples. The concentration seems to be less when a full set of blanks is run even on #6 (Table 2). Over the Christmas break I started to wonder if having samples on the other burners could cause a blank to cause higher blanks so I talked to Shirley about doing a blank and a dup in a sample run. On 12/31/02 she ran a dup on #4 (3.13 ppm) and #6 (3.21 ppm) and a blank on #5 (.03ppm) (Table 1). These results show a slight increase in concentration on 5 & 6 but the magnitude is less than we see in blanks submitted by both projects. A full set of samples of known concentration were analyzed on 1-2-03. The knowns were handled exactly like a set of samples. Results were acceptable (table 2). The actual value was 1.13 ppm and the test results ranged from 1.03 to 1.15 from burners 4 through 11. Blanks were also included with runs of samples on 1-6-03, 1-7-03, and 1-8-03 on burners 5 and 6. Hits were observed but were an order of magnitude below what had been observed in some blanks in earlier QA/QC runs (Table 2) and in project blanks. It seems difficult to reproduce the concentrations observed in blanks submitted by the project staff in test runs of lab blanks that have been analyzed so far by the WQL. This has been troubling me for a while now and has caused me to wonder what is missing. As I studied the most recent data I realized we had not completed a test run with actual samples and blanks combined that included both the distillation for ammonia and organic nitrogen.

Appendix O
When a separate result for ammonia is not required, a digestion step is followed by a distillation step (the first of the day) which produces a result for TKN. Analyses that were conducted this way are labeled TKN only in the comments column (Table 2). It seems that fewer problems were observed when the separate distillation to determine ammonia was not done prior to the digestion of the organic nitrogen. A test run using actual samples and blanks combined that included both the distillation for ammonia and organic nitrogen may be helpful to recreate the type of hits observed in the project blanks. The question is “can any of this information help determine correction factors for the data produced during the time the instrument exhibited intermittent problems?” 1. The problem is probably caused by leaky seals in the distillation apparatus which allows ammonia from the air to be condensed into the sample so quantity in the blank may be a function of the amount in the lab air. 2. The problems with blanks seemed to occur most often at the beginning of runs (burners # 3,5 or 6) where the blanks were often placed but there were exceptions. 3. A correction factor is unlikely to increase the accuracy of the data because of the intermittent nature of the problem and the difficulty of determining the burner position of a given sample. 4. A higher than normal error rate in the data occurred for samples submitted in 2001 and 2002.
I am not confident enough about the specific location of the problem on the instrument to identify correction factors that could be applied to specific samples. I think the best course of action at this point is to report the data as is, with the qualification that an error of approximately .4 ppm may be present in some TKN results due to instrument malfunctions.

Appendix P
Appendix P. QA/QC
Water Quality Duplicates & Blanks
P-1

Appendix P
QA/QC Duplicates and Blanks for the North-Central BSR WQ - - 2001 through 2002
StreamName Time Sample Depth Date Site Lab#
Water Temp
C˚
Air Temp
C˚DO
mg/LField pH su
Fecal Coliform
cfu/100mL
Total Suspended Solids mg/L
Total Solids mg/L
Total Dissolved
Solids mg/LNO2NO3
mg/LNH3N mg/L
OrgNtr mg/L
TKN mg/L
Tot PO4 mg/L
TotDis PO4 mg/L
BSR at Brkgs 730 Grab Surface 04/09/01 R01 01-6049 4.6 4 9 8.17 650 56 284 228 1.470 0.59 1.67 2.26 0.558 0.434Duplicate Grab Surface 01-6050 450 56 412 356 1.554 0.58 1.67 2.25 0.508 0.411Absolute Difference 200 0 128 226 0.892 1.08 0.57 1.75 0.147 0.434Percent Difference 31 0 31 36 5.4 1.2 0.4 0.6 8.925 5.304
Willow Creek near Watertown 915 Grab Surface 04/13/01 T36 01-6072 4.3 12 5.8 7.74 1000 50 345 295 2.022 0.74 1.61 2.35 0.562 0.389Duplicate Grab Surface 01-6084 1400 55 410 355 2.004 0.75 1.66 2.40 0.498 0.357Absolute Difference 400 5 65 60 0.018 0.01 0.05 0.05 0.064 0.032Percent Difference 29 9 16 17 0.9 0.8 2.8 2.2 11.4 8.2
Willow Creek nr Watertown 920 Grab Surface 05/08/01 T36 01-6151 10.8 12 8.1 8.14 1800 13 437 424 0.564 0.13 1.17 1.29 0.218 0.208Duplicate Grab Surface 01-6149 2200 17 479 462 0.559 0.14 1.21 1.35 0.199 0.193Absolute Difference 400 4 42 38 0.005 0.01 0.04 0.06 0.020 0.015Percent Difference 18 24 9 8 0.9 9.4 3.6 4.2 8.9 7.3
Hidewood Creek (nr Clear Lake) 945 Grab Surface 06/14/01 T40 01-6215 20.2 17 6.2 7.57 400 4 394 390 0.284 0.47 1.07 1.52 0.219 0.173Duplicate Grab Surface 01-6114 500 3 371 368 0.272 0.49 1.53 2.01 0.233 0.177Absolute Difference 100 1 23 22 0.012 0.02 0.46 0.49 0.014 0.004Percent Difference 20 25 6 6 4.2 4.1 30.1 24.3 6.0 2.3
BSR at Watertown 1030 Grab Surface 06/15/01 R14 01-6227 17.3 19 6.7 7.91 1500 35 475 440 0.235 0.31 1.21 1.52 0.237 0.172Duplicate Grab Surface 01-6225 1300 29 429 400 0.250 0.36 1.23 1.59 0.249 0.171Absolute Difference 200 6 46 40 0.015 0.05 0.01 0.07 0.012 0.001Percent Difference 13 17 10 9 6.0 14.3 1.1 4.2 4.8 0.6
Hidewood Creek (nr Clear Lake) 945 Grab Surface 07/24/01 T40 01-6300 24.3 19 2.2 7.85 300 5 477 472 0.075 0.19 1.17 1.36 0.245 0.192Duplicate Grab Surface 01-6298 <100 7 451 444 0.066 0.21 1.16 1.37 0.240 0.195Absolute Difference 300 2 26 28 0.009 0.02 0.01 0.01 0.005 0.003Percent Difference 100 29 5 6 12.0 10.4 0.7 1.0 2.0 1.5
Hidewood Creek (nr Clear Lake) 930 Grab Surface 08/27/01 T40 01-6319 19.8 22.5 4.7 7.53 670 2 1022 1020 0.066 0.14 1.22 1.36 0.292 0.217Duplicate Grab Surface 01-6320 600 4 1068 1064 0.050 0.10 1.25 1.36 0.279 0.204Absolute Difference 70 2 46 44 0.016 0.03 0.03 0 0.013 0.013Percent Difference 10 50 4 4 24.2 23.5 2.6 0 4.5 6.0
BSR nr Brookings 1300 Grab Surface 08/28/01 R01 01-6341 23.3 31.5 13.8 8.51 110 107 1007 900 0.083 0.03 1.75 1.78 0.276 0.141Duplicate Grab Surface 01-6343 50 106 966 860 0.077 0.01 1.76 1.78 0.274 0.149Absolute Difference 60 1 41 40 0.006 0.02 0.01 0.00 0.002 0.008Percent Difference 55 1 4 4 7.2 51.7 0.8 0.1 0.7 5.4
Hidewood Creek (nr Clear Lake) 1000 Grab Surface 09/26/01 T40 01-6392 10.9 19 11.3 7.66 680 13 1665 1652 0.104 0.52 0.74 1.26 0.181 0.108Duplicate Grab Surface 01-6391 900 12 1536 1524 0.100 0.53 0.75 1.29 0.184 0.110Absolute Difference 220 1 129 128 0.004 0.01 0.01 0.02 0.003 0.002Percent Difference 24 8 8 8 3.8 1.9 1.7 1.8 1.6 1.8
BSR @ 20th Ave 930 Grab Surface 09/26/01 R16 01-6382 15.3 12 8.3 7.78 90 8 768 760 10.718 0.28 1.72 2.00 2.595 2.623Duplicate Grab Surface 01-6381 110 8 760 752 10.450 0.28 1.68 1.96 2.599 2.525Absolute Difference 20 0 8 8 0.268 0.00 0.04 0.04 0.004 0.098Percent Difference 18 0 1 1 2.5 0.7 2.4 2.2 0.2 3.7
Hidewood Creek (nr Clear Lake) 930 Grab Surface 10/22/01 T40 01-6441 6.9 11 14.5 7.79 30 5 1517 1512 1.268 0.34 0.76 1.10 0.151 0.097Duplicate Grab Surface 01-6440 80 5 1577 1572 1.343 0.36 0.77 1.13 0.175 0.072Absolute Difference 50 0 60 60 0.075 0.03 0.01 0.03 0.024 0.025Percent Difference 63 0 4 4 5.6 6.9 0.7 2.7 13.7 25.8

Appendix P
StreamName Time Sample Depth Date Site Lab#
Water Temp
C˚
Air Temp
C˚DO
mg/LField pH su
Fecal Coliform
cfu/100mL
Total Suspended Solids mg/L
Total Solids mg/L
Total Dissolved
Solids mg/LNO2NO3
mg/LNH3N mg/L
OrgNtr mg/L
TKN mg/L
Tot PO4 mg/L
TotDis PO4 mg/L
BSR nr Bruce 1015 Grab Surface 10/23/01 R20 01-6451 8.9 7.5 16.5 8.79 80 8 800 792 0.383 0.07 1.07 1.14 0.146 0.121Duplicate Grab Surface 01-6450 70 8 788 780 0.387 0.13 0.99 1.12 0.150 0.130Absolute Difference 10 0 12 12 0.004 0.07 0.08 0.01 0.004 0.009Percent Difference 13 0 2 2 1.0 49.6 7.2 1.0 2.7 6.9
BSR @ Watertown 930 Grab Surface 10/24/01 R14 01-6461 3.9 1 16.4 8.63 320 43 439 396 0.140 0.04 0.60 0.64 0.106 0.030Duplicate Grab Surface 01-6460 390 30 418 388 0.140 0.04 0.66 0.70 0.140 0.018Absolute Difference 70 13 21 8 0 0 0.06 0.06 0.034 0.012Percent Difference 18 30 5 2 0 0 9.1 8.6 24.3 40.0
BSR nr Brookings 1045 Grab Surface 04/08/02 R01 2-6003 7.2 7.5 11.7 8.53 <10 146 638 492 0.952 0.40 1.44 1.84 0.463 0.230Duplicate Grab Surface 2-6001 <10 160 636 476 0.958 0.40 1.52 1.92 0.450 0.266Absolute Difference 0 14 2 16 0.006 0.00 0.08 0.08 0.013 0.036Percent Difference 0 9 0 3 0.6 1.0 5.1 4.3 2.8 13.5
Hidewood ck nr Clear Lk 1000 Grab Surface 04/09/02 T40 2-6017 2.9 7 17.6 8.12 <10 14 498 484 0.186 0.11 1.79 1.90 0.189 0.094Duplicate Grab Surface 2-6016 <10 15 507 492 0.184 0.08 1.34 1.42 0.185 0.074Absolute Difference 0 1 9 8 0.002 0.03 0.46 0.49 0.004 0.020Percent Difference 0 7 2 2 1.1 26.4 25.4 25.5 2.1 21.3
Hidewood ck nr Clear Lk 930 Grab Surface 04/30/02 T40 2-6038 7.4 10.5 13.7 8.1 30 12 492 480 0.106 0.05 1.10 1.16 0.101 0.047Duplicate Grab Surface 2-6037 10 11 443 432 0.110 0.06 1.31 1.37 0.104 0.052Absolute Difference 20 1 49 48 0.004 0.00 0.21 0.21 0.003 0.005Percent Difference 67 8 10 10 3.6 6.9 15.7 15.4 2.9 9.6
Willow Ck nr Waverly 1000 Grab Surface 04/30/02 T35 2-6039 7.8 12.5 16.8 8.3 10 10 434 424 0.071 0.12 1.04 1.16 0.088 0.065Duplicate Grab Surface 2-6041 <10 9 393 384 0.068 0.06 1.04 1.10 0.097 0.060Absolute Difference 10 1 41 40 0.003 0.06 0.00 0.06 0.009 0.005Percent Difference 100 10 9 9 4.2 48.3 0.3 5.3 9.3 7.7
No Name Ck nr Volga 845 Grab Surface 05/08/02 T47 2-6061 7.8 9 7.8 7.81 TNTC 62 502 440 1.290 1.73 4.05 5.78 1.392 0.995Duplicate Grab Surface 2-6060 TNTC 52 492 440 1.295 1.73 4.07 5.80 1.411 0.988Absolute Difference 10 10 0 0.005 0.01 0.02 0.03 0.019 0.007Percent Difference 16 2 0 0.4 0.4 0.5 0.5 1.3 0.7
BSR nr Brookings 750 Grab Surface 05/09/02 R01 2-6072 5.9 3.5 13.9 8.11 TNTC 182 666 484 0.694 0.26 1.70 1.96 0.578 0.239Duplicate Grab Surface 2-6071 TNTC 178 710 532 0.704 0.33 1.64 1.97 0.583 0.227Absolute Difference 4 44 48 0.010 0.07 0.06 0.01 0.005 0.012Percent Difference 2 6 9 1.4 21.8 3.4 0.7 0.9 5.0
Hidewood Ck nr Clear Lk 835 Grab Surface 06/10/02 T40 2-6091 20.4 24 8.6 7.9 520 22 702 680 0.057 0.12 1.85 1.97 0.267 0.143Duplicate Grab Surface 2-6090 470 19 683 664 0.058 0.22 1.36 1.58 0.262 0.145Absolute Difference 50 3 19 16 0.001 0.100 0.49 0.39 0.005 0.002Percent Difference 10 14 3 2 1.7 47.3 26.5 19.7 1.9 1.4
Lake Poinsett Outlet 830 Grab Surface 06/11/02 T39 2-6104 18.8 16 7.1 8.49 50 56 984 928 0.050 0.19 1.57 1.77 0.281 0.156Duplicate Grab Surface 2-6103 60 52 952 900 0.049 0.19 1.64 1.83 0.243 0.171Absolute Difference 10 4 32 28 0.001 0.00 0.06 0.07 0.038 0.015Percent Difference 17 7 3 3 2.0 0.5 3.9 3.5 13.5 8.8
Hidewood ck nr Clear Lk 900 Grab Surface 07/08/02 T40 2-6124 22.9 20 1.7 7.93 ------- 126 1070 944 0.074 2.94 2.81 5.74 1.043 0.375Duplicate Grab Surface 2-6122 170 1126 956 0.070 2.82 3.16 5.98 1.007 0.493Absolute Difference 44 56 12 0.004 0.12 0.36 0.24 0.036 0.118Percent Difference 26 5 1 5.4 4.0 11.3 4.0 3.5 23.9

Appendix P
StreamName Time Sample Depth Date Site Lab#
Water Temp
C˚
Air Temp
C˚DO
mg/LField pH su
Fecal Coliform
cfu/100mL
Total Suspended Solids mg/L
Total Solids mg/L
Total Dissolved
Solids mg/LNO2NO3
mg/LNH3N mg/L
OrgNtr mg/L
TKN mg/L
Tot PO4 mg/L
TotDis PO4 mg/L
Unamed Ck nr Volga 805 Grab Surface 07/09/02 T47 2-6134 20.9 25 6.2 7.94 630 28 876 848 0.112 0.09 0.94 1.03 0.679 0.627Duplicate Grab Surface 2-6133 580 64 900 836 0.110 0.07 0.87 0.94 0.686 0.644Absolute Difference 50 36 24 12 0.002 0.02 0.07 0.09 0.007 0.017Percent Difference 8 56 3 1 1.8 17.8 7.7 8.6 1.0 2.6
BSR nr Castlrwood 900 Grab Surface 8/6/2002 R18 2-6153 19.6 18 7.9 7.78 16000 65 701 636 1.365 0.38 1.82 2.20 1.038 0.883Duplicate Grab Surface 2-6154 17000 41 721 680 1.358 0.41 1.87 2.28 1.219 0.856Absolute Difference 1000 24 20 44 0.007 0.03 0.05 0.08 0.181 0.027Percent Difference 6 37 3 6 0.5 6.1 2.9 3.5 14.8 3.1
Hidewood ck nr Clear Lk 830 Grab Surface 08/07/02 T40 2-6163 19.9 24.7 1.4 7.57 42000 104 1628 1524 0.094 7.85 3.10 10.95 1.134 0.790Duplicate Grab Surface 2-6164 30200 54 1570 1516 0.086 7.78 3.24 11.02 1.397 0.814Absolute Difference 11800 50 58 8 0.008 0.07 0.15 0.07 0.263 0.024Percent Difference 28 48 4 1 8.5 0.9 4.5 0.7 18.8 2.9
Hidewood ck nr Clear Lk 845 Grab Surface 08/21/02 T40 2-6182 17.6 25 3.6 7.35 20000 36 1920 1884 3.515 0.6300 2.9510 3.5810 0.575 0.353Duplicate Grab Surface 2-6181 21000 54 1974 1920 3.488 0.4800 2.6700 3.1500 0.687 0.352Absolute Difference 1000 18 54 36 0.027 0.15 0.28 0.43 0.112 0.001Percent Difference 5 33 3 2 0.8 23.8 9.5 12.0 16.3 0.3
BSR nr Brookings 815 Grab Surface 08/22/02 R01 2-6195 21.8 19 7.2 8.03 600 100 680 580 0.034 0.0900 1.6780 1.7680 0.426 0.037Duplicate Grab Surface 2-6193 1000 10 742 732 0.034 0.1160 1.6600 1.7760 0.416 0.006Absolute Difference 400 90 62 152 0 0.03 0.02 0.01 0.010 0.031Percent Difference 40 90 8 21 0 22.4 1.1 0.5 2.3 83.8
Willow Ck nr Waverly 1000 Grab Surface 09/09/02 T35 2-6206 19.9 18.9 3.2 8.13 28000 56 420 364 0.060 0.5830 2.0760 2.6590 0.280 0.111Duplicate Grab Surface 2-6205 26000 58 402 344 0.058 0.5980 2.2660 2.8640 0.291 0.122Absolute Difference 2000 2 18 20 0.002 0.02 0.19 0.21 0.011 0.011Percent Difference 7 3 4 5 3.3 2.5 8.4 7.2 3.8 9.0
Hidewood ck nr Clear Lk 1030 Grab Surface 09/10/02 T40 2-6214 16.4 18 2.5 8 990 98 1994 1896 0.084 1.0300 3.6120 4.6420 0.718 0.127Duplicate Grab Surface 2-6215 1100 86 1986 1900 0.070 0.9940 3.5630 4.5570 0.670 0.108Absolute Difference 110 12 8 4 0.014 0.04 0.05 0.09 0.048 0.019Percent Difference 10 12 0 0 16.7 3.5 1.4 1.8 6.7 15.0
Willow Ck nr Watertown 1015 Grab Surface 10/17/02 T36 2-6246 5.9 9 9.45 4.53 100 5 641 636 0.124 0.1220 0.6580 0.7800 0.045 0.022Duplicate Grab Surface 2-6247 100 4 616 612 0.126 0.1450 0.7060 0.8510 0.039 0.014Absolute Difference 0 1 25 24 0.002 0.02 0.05 0.07 0.006 0.008Percent Difference 0 20 4 4 1.6 15.9 6.8 8.3 13.3 36.4
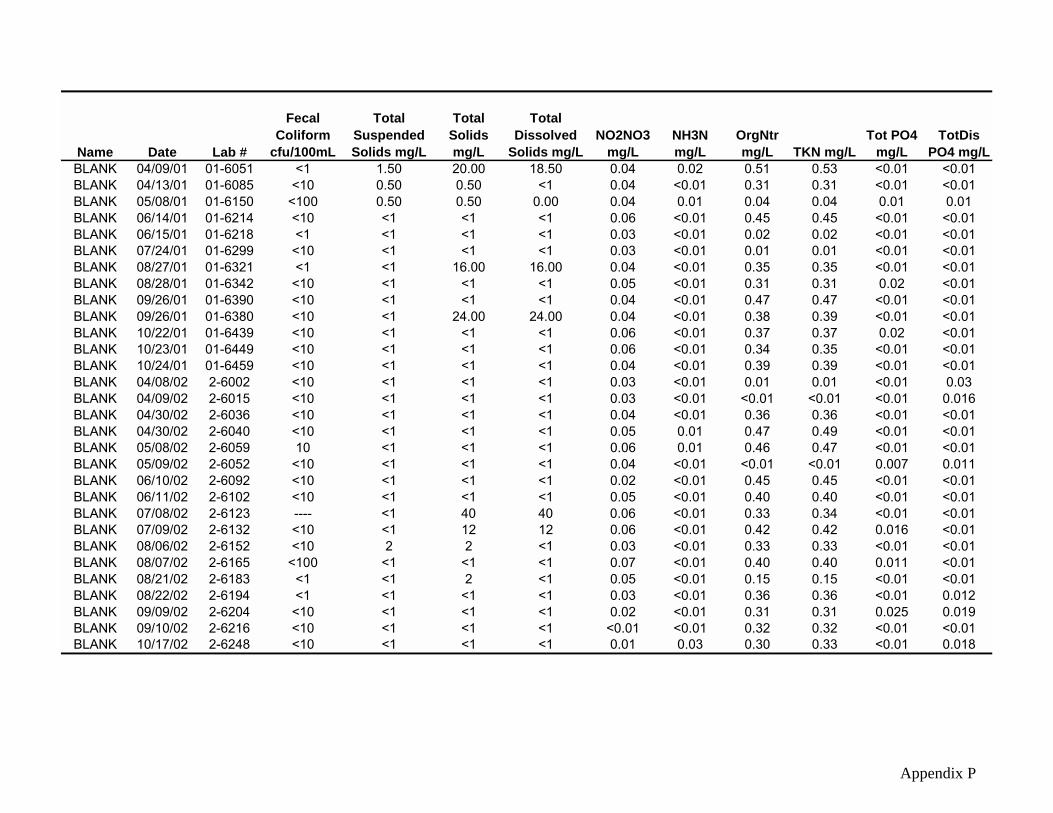
Appendix P
Name Date Lab #
Fecal Coliform
cfu/100mL
Total Suspended Solids mg/L
Total Solids mg/L
Total Dissolved
Solids mg/LNO2NO3
mg/LNH3N mg/L
OrgNtr mg/L TKN mg/L
Tot PO4 mg/L
TotDis PO4 mg/L
BLANK 04/09/01 01-6051 <1 1.50 20.00 18.50 0.04 0.02 0.51 0.53 <0.01 <0.01BLANK 04/13/01 01-6085 <10 0.50 0.50 <1 0.04 <0.01 0.31 0.31 <0.01 <0.01BLANK 05/08/01 01-6150 <100 0.50 0.50 0.00 0.04 0.01 0.04 0.04 0.01 0.01BLANK 06/14/01 01-6214 <10 <1 <1 <1 0.06 <0.01 0.45 0.45 <0.01 <0.01BLANK 06/15/01 01-6218 <1 <1 <1 <1 0.03 <0.01 0.02 0.02 <0.01 <0.01BLANK 07/24/01 01-6299 <10 <1 <1 <1 0.03 <0.01 0.01 0.01 <0.01 <0.01BLANK 08/27/01 01-6321 <1 <1 16.00 16.00 0.04 <0.01 0.35 0.35 <0.01 <0.01BLANK 08/28/01 01-6342 <10 <1 <1 <1 0.05 <0.01 0.31 0.31 0.02 <0.01BLANK 09/26/01 01-6390 <10 <1 <1 <1 0.04 <0.01 0.47 0.47 <0.01 <0.01BLANK 09/26/01 01-6380 <10 <1 24.00 24.00 0.04 <0.01 0.38 0.39 <0.01 <0.01BLANK 10/22/01 01-6439 <10 <1 <1 <1 0.06 <0.01 0.37 0.37 0.02 <0.01BLANK 10/23/01 01-6449 <10 <1 <1 <1 0.06 <0.01 0.34 0.35 <0.01 <0.01BLANK 10/24/01 01-6459 <10 <1 <1 <1 0.04 <0.01 0.39 0.39 <0.01 <0.01BLANK 04/08/02 2-6002 <10 <1 <1 <1 0.03 <0.01 0.01 0.01 <0.01 0.03BLANK 04/09/02 2-6015 <10 <1 <1 <1 0.03 <0.01 <0.01 <0.01 <0.01 0.016BLANK 04/30/02 2-6036 <10 <1 <1 <1 0.04 <0.01 0.36 0.36 <0.01 <0.01BLANK 04/30/02 2-6040 <10 <1 <1 <1 0.05 0.01 0.47 0.49 <0.01 <0.01BLANK 05/08/02 2-6059 10 <1 <1 <1 0.06 0.01 0.46 0.47 <0.01 <0.01BLANK 05/09/02 2-6052 <10 <1 <1 <1 0.04 <0.01 <0.01 <0.01 0.007 0.011BLANK 06/10/02 2-6092 <10 <1 <1 <1 0.02 <0.01 0.45 0.45 <0.01 <0.01BLANK 06/11/02 2-6102 <10 <1 <1 <1 0.05 <0.01 0.40 0.40 <0.01 <0.01BLANK 07/08/02 2-6123 ---- <1 40 40 0.06 <0.01 0.33 0.34 <0.01 <0.01BLANK 07/09/02 2-6132 <10 <1 12 12 0.06 <0.01 0.42 0.42 0.016 <0.01BLANK 08/06/02 2-6152 <10 2 2 <1 0.03 <0.01 0.33 0.33 <0.01 <0.01BLANK 08/07/02 2-6165 <100 <1 <1 <1 0.07 <0.01 0.40 0.40 0.011 <0.01BLANK 08/21/02 2-6183 <1 <1 2 <1 0.05 <0.01 0.15 0.15 <0.01 <0.01BLANK 08/22/02 2-6194 <1 <1 <1 <1 0.03 <0.01 0.36 0.36 <0.01 0.012BLANK 09/09/02 2-6204 <10 <1 <1 <1 0.02 <0.01 0.31 0.31 0.025 0.019BLANK 09/10/02 2-6216 <10 <1 <1 <1 <0.01 <0.01 0.32 0.32 <0.01 <0.01BLANK 10/17/02 2-6248 <10 <1 <1 <1 0.01 0.03 0.30 0.33 <0.01 0.018

Appendix P
QA/QC Duplicates and Blanks for Extra River Samples in 2004
Stream Time Sample Depth Date SiteIDWater
Temp C˚Air Temp
C˚
Dissolved Oxygen
mg/LField pH
su
Fecal Coliform
cfu/100mL
BSR nr Estelline 1230 Grab Surface 06/16/04 R19 18 15 7.07 8.14 310Duplicate Grab Surface 440Absolute Difference 130Percent Difference 29.5
BSR nr Estelline 1105 Grab Surface 07/01/04 R19 22.7 32 8.49 8.35 1340Duplicate Grab Surface 1550Absolute Difference 210Percent Difference 13.5
BSR below Watertown 1225 Grab Surface 07/27/04 R17 22.6 25 13.04 7.7 310Duplicate Grab Surface 340Absolute Difference 30Percent Difference 8.8
BSR nr Brookings 1443 Grab Surface 08/10/04 R01 20.3 13.54 7.97 130Duplicate Grab Surface 120Absolute Difference 10Percent Difference 7.7
BSR nr Brookings 917 Grab Surface 08/25/04 R01 20.1 21 9.51 8.39 70Duplicate Grab Surface 60Absolute Difference 10Percent Difference 14.3
BSR at Broadway 1313 Grab Surface 09/08/04 R15 18.2 28 6.18 7.66 50Duplicate Grab Surface 80Absolute Difference 30Percent Difference 37.5
BSR at Watertown 1230 Grab Surface 09/27/04 R14 15.4 19.5 9.27 7.99 2000Duplicate Grab Surface 1800Absolute Difference 200Percent Difference 10.0
Name DateFecal Coliform
cfu/100mLBLANK 06/16/04 <10BLANK 07/01/04 <10BLANK 07/27/04 <10BLANK 08/09/04 <2BLANK 08/25/04 <10BLANK 09/08/04 <10BLANK 09/27/04 <10

Appendix Q
Appendix Q. WQ Parameters
FLUX Yearly Loads, Concentrations, and CV’s
Q-1

Appendix Q
R01 R14 R15Parameter Concentration (ppb) FLUX Load Kg/Yr CV Parameter Concentration (ppb) FLUX Load Kg/Yr CV Parameter Concentration (ppb) FLUX Load Kg/Yr CVSuspSol 64970 40574980 0.126 SuspSol 20549 1977510 0.257 SuspSol 31193 3336901 0.386TotSol 564093 352288000 0.065 TotSol 231576 22285280 0.184 TotSol 344217 36823160 0.142DisSol 491709 307082900 0.095 DisSol 218691 21045310 0.202 DisSol 306642 32803470 0.174NO2NO3 811 506245 0.128 NO2NO3 741 71326 0.086 NO2NO3 630 67348 0.137NH3N 272 169858 0.235 NH3N 248 23821 0.108 NH3N 242 25887 0.216Orgntr 1410 880602 0.083 Orgntr 1082 104113 0.106 Orgntr 988 105712 0.069TKN 1678 1047893 0.105 TKN 1385 133263 0.073 TKN 1230 131599 0.089TotPO4 394 249431 0.123 TotPO4 322 30997 0.185 TotPO4 258 27554 0.095TotDisPO4 259 161646 0.121 TotDisPO4 265 25514 0.125 TotDisPO4 170 18231 0.099Fecal 579109 258521800 0.301 Fecal 750434 51065520 0.448 Fecal 1815160 137316800 0.409DO 8598 5369705 0.066 DO 8032 772971 0.105 DO 7283 779061 0.052
R16 R17 R18Parameter Concentration (ppb) FLUX Load Kg/Yr CV Parameter Concentration (ppb) FLUX Load Kg/Yr CV Parameter Concentration (ppb) FLUX Load Kg/Yr CVSuspSol 24539 3694030 0.339 SuspSol 48409 7765081 0.226 SuspSol 48254 8054271 0.379TotSol 342533 51564140 0.123 TotSol 386598 60160200 0.050 TotSol 426650 71213180 0.034DisSol 316194 47599250 0.149 DisSol 330893 51491720 0.103 DisSol 515921 86113730 0.125NO2NO3 899 135271 0.172 NO2NO3 1019 158585 0.102 NO2NO3 1124 187572 0.082NH3N 246 37022 0.255 NH3N 305 47420 0.240 NH3N 441 73607 0.264Orgntr 1022 153910 0.043 Orgntr 1254 195087 0.070 Orgntr 1584 264377 0.088TKN 1268 190932 0.075 TKN 1609 250377 0.107 TKN 2040 340489 0.119TotPO4 385 57888 0.103 TotPO4 433 67376 0.168 TotPO4 586 97775 0.162TotDisPO4 301 45270 0.116 TotDisPO4 290 45182 0.088 TotDisPO4 414 69063 0.134Fecal 1800286 191649400 0.473 Fecal 3169811 358720000 0.692 Fecal 54160500 6522125000 0.961DO 7233 1088787 0.082 DO 7453 1195439 0.137 DO 7693 1284014 0.500
R19 R20 T34 (From BSR Into Lake Pelican)Parameter Concentration (ppb) FLUX Load Kg/Yr CV Parameter Concentration (ppb) FLUX Load Kg/Yr CV Parameter Concentration (ppb) FLUX Load Kg/Yr CVSuspSol 54340 11045010 0.208 SuspSol 61553 26729770 0.288 SuspSol 16352 443555 0.167TotSol 459882 93475030 0.097 TotSol 756395 328470100 0.115 TotSol 465834 12635950 0.061DisSol 352286 71605180 0.198 DisSol 662074 287510600 0.148 DisSol 449482 12192400 0.063NO2NO3 1221 248220 0.141 NO2NO3 1071 465174 0.210 NO2NO3 204 5540 0.328NH3N 366 74370 0.163 NH3N 337 146454 0.257 NH3N 134 3631 0.184Orgntr 1600 325131 0.040 Orgntr 1618 702738 0.098 Orgntr 883 23960 0.073TKN 2022 410938 0.066 TKN 1870 812223 0.099 TKN 982 26643 0.072TotPO4 426 86478 0.111 TotPO4 377 163658 0.146 TotPO4 119 3225 0.090TotDisPO4 268 54518 0.067 TotDisPO4 250 108771 0.096 TotDisPO4 63 1711 0.226Fecal 4132999 605588600 0.556 Fecal 2558944 824558600 0.307 Fecal 309367 8391730 0.615DO 7718 1568751 0.163 DO 10543 4578372 0.173 DO 13710 371897 0.141
T35 T36 T37Parameter Concentration (ppb) FLUX Load Kg/Yr CV Parameter Concentration (ppb) FLUX Load Kg/Yr CV Parameter Concentration (ppb) FLUX Load Kg/Yr CVSuspSol 11015 21965 0.193 SuspSol 52183 1572160 0.133 SuspSol 65229 552074 0.385TotSol 377269 752293 0.043 TotSol 418349 12604010 0.021 TotSol 628719 5321203 0.312DisSol 364881 727591 0.040 DisSol 372289 11216330 0.063 DisSol 577384 4886732 0.358NO2NO3 75 149 0.237 NO2NO3 1159 34910 0.093 NO2NO3 1487 12589 0.723NH3N 140 278 0.125 NH3N 504 15199 0.226 NH3N 419 3548 0.188Orgntr 1222 2438 0.046 Orgntr 1710 51509 0.083 Orgntr 2065 17480 0.081TKN 1362 2716 0.047 TKN 211508 63745 0.101 TKN 2505 21201 0.037TotPO4 178 355 0.149 TotPO4 677 20399 0.100 TotPO4 574 4856 0.148TotDisPO4 111 222 0.183 TotDisPO4 378 11388 0.122 TotDisPO4 351 2970 0.061Fecal 21813080 43496390 0.927 Fecal 30082920 906337900 0.859 Fecal 34378480 290964600 0.936DO 8452 16853 0.129 DO 7300 219926 0.107 DO 6825 57762 0.125

Appendix Q
T39 T40 T41Parameter Concentration (ppb) FLUX Load Kg/Yr CV Parameter Concentration (ppb) FLUX Load Kg/Yr CV Parameter Concentration (ppb) FLUX Load Kg/Yr CVSuspSol 23347 3165099 0.276 SuspSol 8590 96398 0.202 SuspSol 19150 386145 0.294TotSol 883994 119838900 0.060 TotSol 582418 6535813 0.024 TotSol 549584 11081810 0.063DisSol 864681 117220800 0.067 DisSol 529551 5942545 0.016 DisSol 537926 10846730 0.074NO2NO3 132 17877 0.294 NO2NO3 229 2567 0.356 NO2NO3 1029 20742 0.291NH3N 525 71135 0.332 NH3N 148 1658 0.191 NH3N 91 1843 0.325Orgntr 1455 197200 0.043 Orgntr 1326 14881 0.137 Orgntr 992 20012 0.194TKN 1980 268435 0.064 TKN 1474 16539 0.122 TKN 1065 21471 0.189TotPO4 282 38242 0.120 TotPO4 254 2854 0.142 TotPO4 96 1946 0.237TotDisPO4 233 31640 0.084 TotDisPO4 114 1275 0.300 TotDisPO4 43 872 0.193Fecal 4330912 587121200 0.944 Fecal 7310430 82036600 0.505 Fecal 1085459 21887200 0.395DO 6372 863851 0.211 DO 7700 86413 0.267 DO 14046 283226 0.058
T42 T46 T47Parameter Concentration (ppb) FLUX Load Kg/Yr CV Parameter Concentration (ppb) FLUX Load Kg/Yr CV Parameter Concentration (ppb) FLUX Load Kg/Yr CVSuspSol 16502 46316 0.344 SuspSol 51535 1012483 0.541 SuspSol 35615 58631 0.256TotSol 462875 1299145 0.024 TotSol 780717 15338260 0.018 TotSol 591686 974060 0.042DisSol 447097 1254862 0.034 DisSol 765524 15039770 0.023 DisSol 556071 915429 0.059NO2NO3 277 778 0.237 NO2NO3 438 8605 0.067 NO2NO3 1216 2003 0.277NH3N 108 302 0.254 NH3N 228 4477 0.089 NH3N 1172 1929 0.133Orgntr 1087 3050 0.222 Orgntr 1567 30791 0.077 Orgntr 3598 5924 0.274TKN 1194 3352 0.223 TKN 1782 35020 0.074 TKN 4769 7852 0.299TotPO4 276 775 0.465 TotPO4 374 7343 0.164 TotPO4 1227 2019 0.172TotDisPO4 220 617 0.464 TotDisPO4 248 4878 0.119 TotDisPO4 923 1520 0.174Fecal 6658630 18688700 0.641 Fecal 4068350 79928300 0.231 Fecal 9640370 15870400 0.415DO 11086 31116 0.331 DO 9224 181219 0.229 DO 14679 24165 0.246

Appendix R
Appendix R. Monthly Concentrations - FLUX
R-1
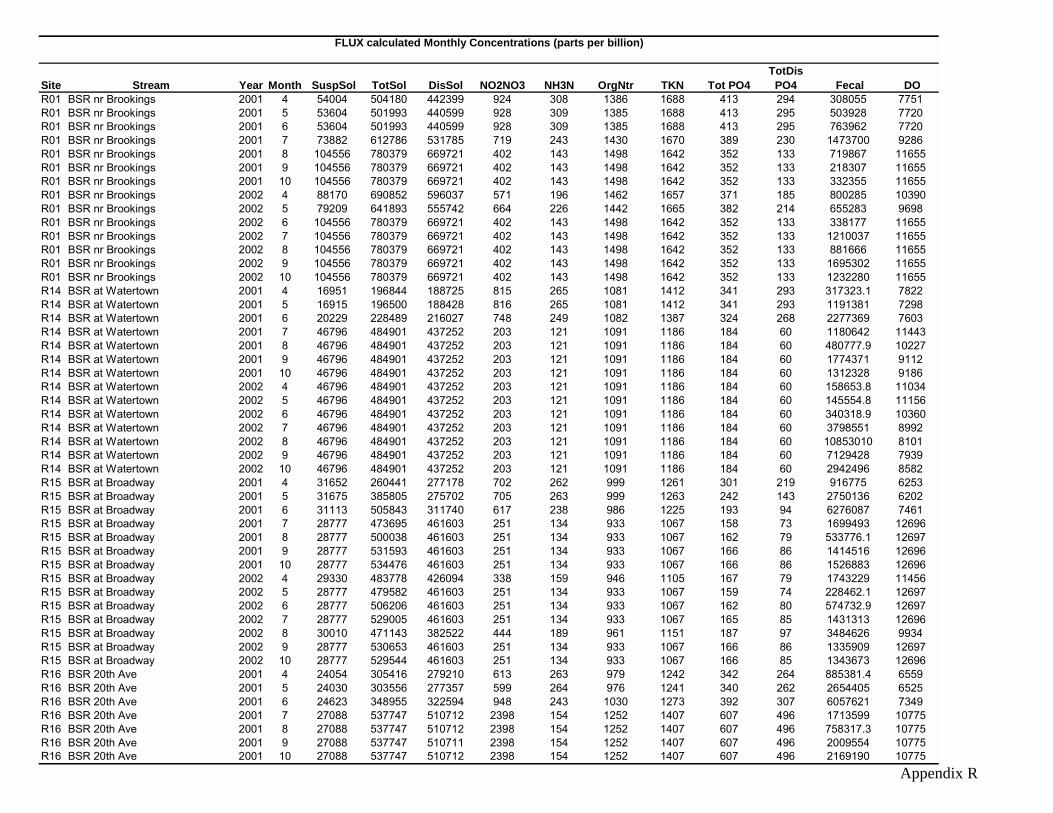
Appendix R
Site Stream Year Month SuspSol TotSol DisSol NO2NO3 NH3N OrgNtr TKN Tot PO4TotDis
PO4 Fecal DOR01 BSR nr Brookings 2001 4 54004 504180 442399 924 308 1386 1688 413 294 308055 7751R01 BSR nr Brookings 2001 5 53604 501993 440599 928 309 1385 1688 413 295 503928 7720R01 BSR nr Brookings 2001 6 53604 501993 440599 928 309 1385 1688 413 295 763962 7720R01 BSR nr Brookings 2001 7 73882 612786 531785 719 243 1430 1670 389 230 1473700 9286R01 BSR nr Brookings 2001 8 104556 780379 669721 402 143 1498 1642 352 133 719867 11655R01 BSR nr Brookings 2001 9 104556 780379 669721 402 143 1498 1642 352 133 218307 11655R01 BSR nr Brookings 2001 10 104556 780379 669721 402 143 1498 1642 352 133 332355 11655R01 BSR nr Brookings 2002 4 88170 690852 596037 571 196 1462 1657 371 185 800285 10390R01 BSR nr Brookings 2002 5 79209 641893 555742 664 226 1442 1665 382 214 655283 9698R01 BSR nr Brookings 2002 6 104556 780379 669721 402 143 1498 1642 352 133 338177 11655R01 BSR nr Brookings 2002 7 104556 780379 669721 402 143 1498 1642 352 133 1210037 11655R01 BSR nr Brookings 2002 8 104556 780379 669721 402 143 1498 1642 352 133 881666 11655R01 BSR nr Brookings 2002 9 104556 780379 669721 402 143 1498 1642 352 133 1695302 11655R01 BSR nr Brookings 2002 10 104556 780379 669721 402 143 1498 1642 352 133 1232280 11655R14 BSR at Watertown 2001 4 16951 196844 188725 815 265 1081 1412 341 293 317323.1 7822R14 BSR at Watertown 2001 5 16915 196500 188428 816 265 1081 1412 341 293 1191381 7298R14 BSR at Watertown 2001 6 20229 228489 216027 748 249 1082 1387 324 268 2277369 7603R14 BSR at Watertown 2001 7 46796 484901 437252 203 121 1091 1186 184 60 1180642 11443R14 BSR at Watertown 2001 8 46796 484901 437252 203 121 1091 1186 184 60 480777.9 10227R14 BSR at Watertown 2001 9 46796 484901 437252 203 121 1091 1186 184 60 1774371 9112R14 BSR at Watertown 2001 10 46796 484901 437252 203 121 1091 1186 184 60 1312328 9186R14 BSR at Watertown 2002 4 46796 484901 437252 203 121 1091 1186 184 60 158653.8 11034R14 BSR at Watertown 2002 5 46796 484901 437252 203 121 1091 1186 184 60 145554.8 11156R14 BSR at Watertown 2002 6 46796 484901 437252 203 121 1091 1186 184 60 340318.9 10360R14 BSR at Watertown 2002 7 46796 484901 437252 203 121 1091 1186 184 60 3798551 8992R14 BSR at Watertown 2002 8 46796 484901 437252 203 121 1091 1186 184 60 10853010 8101R14 BSR at Watertown 2002 9 46796 484901 437252 203 121 1091 1186 184 60 7129428 7939R14 BSR at Watertown 2002 10 46796 484901 437252 203 121 1091 1186 184 60 2942496 8582R15 BSR at Broadway 2001 4 31652 260441 277178 702 262 999 1261 301 219 916775 6253R15 BSR at Broadway 2001 5 31675 385805 275702 705 263 999 1263 242 143 2750136 6202R15 BSR at Broadway 2001 6 31113 505843 311740 617 238 986 1225 193 94 6276087 7461R15 BSR at Broadway 2001 7 28777 473695 461603 251 134 933 1067 158 73 1699493 12696R15 BSR at Broadway 2001 8 28777 500038 461603 251 134 933 1067 162 79 533776.1 12697R15 BSR at Broadway 2001 9 28777 531593 461603 251 134 933 1067 166 86 1414516 12696R15 BSR at Broadway 2001 10 28777 534476 461603 251 134 933 1067 166 86 1526883 12696R15 BSR at Broadway 2002 4 29330 483778 426094 338 159 946 1105 167 79 1743229 11456R15 BSR at Broadway 2002 5 28777 479582 461603 251 134 933 1067 159 74 228462.1 12697R15 BSR at Broadway 2002 6 28777 506206 461603 251 134 933 1067 162 80 574732.9 12697R15 BSR at Broadway 2002 7 28777 529005 461603 251 134 933 1067 165 85 1431313 12696R15 BSR at Broadway 2002 8 30010 471143 382522 444 189 961 1151 187 97 3484626 9934R15 BSR at Broadway 2002 9 28777 530653 461603 251 134 933 1067 166 86 1335909 12697R15 BSR at Broadway 2002 10 28777 529544 461603 251 134 933 1067 166 85 1343673 12696R16 BSR 20th Ave 2001 4 24054 305416 279210 613 263 979 1242 342 264 885381.4 6559R16 BSR 20th Ave 2001 5 24030 303556 277357 599 264 976 1241 340 262 2654405 6525R16 BSR 20th Ave 2001 6 24623 348955 322594 948 243 1030 1273 392 307 6057621 7349R16 BSR 20th Ave 2001 7 27088 537747 510712 2398 154 1252 1407 607 496 1713599 10775R16 BSR 20th Ave 2001 8 27088 537747 510712 2398 154 1252 1407 607 496 758317.3 10775R16 BSR 20th Ave 2001 9 27088 537747 510711 2398 154 1252 1407 607 496 2009554 10775R16 BSR 20th Ave 2001 10 27088 537747 510712 2398 154 1252 1407 607 496 2169190 10775
FLUX calculated Monthly Concentrations (parts per billion)

Appendix R
Site Stream Year Month SuspSol TotSol DisSol NO2NO3 NH3N OrgNtr TKN Tot PO4TotDis
PO4 Fecal DOR16 BSR 20th Ave 2002 5 27088 537747 510712 2398 154 1252 1407 607 496 324568.3 10775R16 BSR 20th Ave 2002 6 27088 537747 510711 2398 154 1252 1407 607 496 816503.3 10775R16 BSR 20th Ave 2002 7 27088 537747 510712 2398 154 1252 1407 607 496 2033417 10775R16 BSR 20th Ave 2002 8 25787 438123 411444 1633 201 1135 1336 493 396 3585081 8967R16 BSR 20th Ave 2002 9 27088 537747 510712 2398 154 1252 1407 607 496 1897881 10775R16 BSR 20th Ave 2002 10 27088 537747 510711 2398 154 1252 1407 607 496 1908911 10775R17 BSR below Watertown 2001 4 50028 265636 294121 939 329 1259 1644 413 268 1597353 6325R17 BSR below Watertown 2001 5 50108 447794 294121 939 329 1259 1644 413 268 4791494 7355R17 BSR below Watertown 2001 6 47885 630393 325549 1007 308 1254 1614 430 287 10934670 9043R17 BSR below Watertown 2001 7 40023 527356 516290 1423 183 1227 1431 533 404 2972087 11268R17 BSR below Watertown 2001 8 40023 586166 516290 1423 183 1227 1431 533 404 966812.9 10549R17 BSR below Watertown 2001 9 40023 659599 516290 1423 183 1227 1431 533 404 2562070 9770R17 BSR below Watertown 2001 10 40023 666469 516290 1423 183 1227 1431 533 404 2765597 9702R17 BSR below Watertown 2002 4 41950 535363 516290 1423 183 1227 1431 533 404 3048203 10605R17 BSR below Watertown 2002 5 40023 540222 516290 1423 183 1227 1431 533 404 413806.6 11099R17 BSR below Watertown 2002 6 40023 599769 516290 1423 183 1227 1431 533 404 1040997 10377R17 BSR below Watertown 2002 7 40023 653799 516290 1423 183 1227 1431 533 404 2592495 9839R17 BSR below Watertown 2002 8 44314 555822 421780 1217 245 1241 1522 482 346 6104769 9413R17 BSR below Watertown 2002 9 40023 656609 516290 1423 183 1227 1431 533 404 2399388 9795R17 BSR below Watertown 2002 10 40023 653434 516290 1423 183 1227 1431 533 404 2393410 9833R18 BSR nr Castlewood 2001 4 48571 284110 249735 1173 490 1647 2151 606 429 30794200 6444R18 BSR nr Castlewood 2001 5 48581 497432 685814 877 491 1649 2154 607 430 82176260 6405R18 BSR nr Castlewood 2001 6 48541 703418 1234745 731 485 1641 2140 604 428 152680200 6562R18 BSR nr Castlewood 2001 7 46743 509987 227696 1315 209 1283 1510 487 341 100042200 13657R18 BSR nr Castlewood 2001 8 46743 594483 644952 1618 209 1283 1510 487 341 1925577 13657R18 BSR nr Castlewood 2001 9 46743 687007 1455155 1962 209 1283 1510 487 341 4344527 13657R18 BSR nr Castlewood 2001 10 46743 691122 1492290 1977 209 1283 1510 487 341 4455400 13657R18 BSR nr Castlewood 2002 4 46743 540303 319236 1421 209 1283 1510 487 341 58097830 13657R18 BSR nr Castlewood 2002 5 46743 538396 317547 1414 209 1283 1510 487 341 948071.8 13657R18 BSR nr Castlewood 2002 6 46743 606360 655355 1659 209 1283 1510 487 341 1956635 13657R18 BSR nr Castlewood 2002 7 46743 660191 1439762 1866 209 1283 1510 487 341 4298570 13657R18 BSR nr Castlewood 2002 8 47877 571774 965068 1161 383 1509 1908 561 396 87037960 9180R18 BSR nr Castlewood 2002 9 46743 694307 1530975 1989 209 1283 1510 487 341 4570897 13657R18 BSR nr Castlewood 2002 10 46743 685730 1439554 1957 209 1283 1510 487 341 4239549 13657R19 BSR nr Estelline 2001 4 51448 410338 293267 1346 457 1615 2071 442 288 2324890 6935R19 BSR nr Estelline 2001 5 51360 408822 291462 1350 325 1615 2072 442 289 6203045 7260R19 BSR nr Estelline 2001 6 51716 414934 298742 1334 260 1613 2066 440 286 11525020 7544R19 BSR nr Estelline 2001 7 67880 691895 628669 638 305 1528 1793 348 175 7603881 10083R19 BSR nr Estelline 2001 8 67880 691895 628668 638 196 1528 1793 348 175 344729.4 10802R19 BSR nr Estelline 2001 9 67880 691894 628668 638 121 1528 1793 348 175 777785.7 11541R19 BSR nr Estelline 2001 10 67880 691894 628668 638 118 1528 1793 348 175 799145.3 11575R19 BSR nr Estelline 2002 4 64525 634413 560194 783 266 1546 1850 367 198 4453624 9714R19 BSR nr Estelline 2002 5 67880 691894 628668 638 257 1528 1793 348 175 169730 10334R19 BSR nr Estelline 2002 6 67880 691894 628668 638 178 1528 1793 348 175 346930.8 10900R19 BSR nr Estelline 2002 7 67880 691895 628669 638 152 1528 1793 348 175 769558.3 11312R19 BSR nr Estelline 2002 8 57681 517140 420494 1077 261 1582 1965 406 245 6715882 8719R19 BSR nr Estelline 2002 9 67880 691894 628668 638 116 1528 1793 348 175 818311.4 11598R19 BSR nr Estelline 2002 10 67880 691895 628669 638 122 1528 1793 348 175 758991.6 11531R20 BSR nr Bruce 2001 4 47835 360658 317790 1201 375 1623 1971 390 280 1381629 5001R20 BSR nr Bruce 2001 5 47835 583596 514231 1201 375 1623 1971 390 280 1977291 8092R20 BSR nr Bruce 2001 6 47835 775317 683164 1201 375 1623 1971 390 280 2626863 10750R20 BSR nr Bruce 2001 7 47835 1241919 1094306 1201 375 1623 1971 390 280 4207763 17220

Appendix R
Site Stream Year Month SuspSol TotSol DisSol NO2NO3 NH3N OrgNtr TKN Tot PO4TotDis
PO4 Fecal DOR20 BSR nr Bruce 2001 8 86412 893525 782907 835 269 1609 1687 352 197 5523623 12444R20 BSR nr Bruce 2001 9 116085 589071 506996 554 188 1598 1469 323 133 1036711 8318R20 BSR nr Bruce 2001 10 116085 942895 811520 554 188 1598 1469 323 133 1659407 13315R20 BSR nr Bruce 2002 4 104907 718773 622892 660 219 1602 1551 334 157 1924495 10097R20 BSR nr Bruce 2002 5 116085 743577 639974 554 188 1598 1469 323 133 1308628 10500R20 BSR nr Bruce 2002 6 116085 1652326 1422106 554 188 1598 1469 323 133 2907941 23333R20 BSR nr Bruce 2002 7 116085 4316593 3715160 554 188 1598 1469 323 133 7596805 60955R20 BSR nr Bruce 2002 8 116085 2561573 2204668 554 188 1598 1469 323 133 5962960 36172R20 BSR nr Bruce 2002 9 116085 5960564 5130075 554 188 1598 1469 323 133 10490040 84170R20 BSR nr Bruce 2002 10 116085 5224097 4496220 554 188 1598 1469 323 133 9349250 73770T35 Willow Creek (nr Waverly) 2001 5 4994 366737 358145 63 102 1087 1190 137 90 123991 5739T35 Willow Creek (nr Waverly) 2001 6 4662 366737 358145 63 102 1087 1190 137 90 115750 5358T35 Willow Creek (nr Waverly) 2001 7 7842 366737 358145 63 102 1087 1190 137 90 194710 9013T35 Willow Creek (nr Waverly) 2001 8 14305 397582 377873 97 211 1483 1694 258 152 40436140 8610T35 Willow Creek (nr Waverly) 2001 9 33567 416658 390074 118 278 1728 2006 334 190 151916100 9063T35 Willow Creek (nr Waverly) 2001 10 39380 416658 390074 118 278 1728 2006 334 190 178223200 10632T35 Willow Creek (nr Waverly) 2002 4 11650 366737 358145 63 102 1087 1190 137 90 289260 13389T35 Willow Creek (nr Waverly) 2002 5 10205 366737 358145 63 102 1087 1190 137 90 253360 11728T35 Willow Creek (nr Waverly) 2002 6 11535 388472 372047 87 179 1366 1545 222 134 20332540 9340T35 Willow Creek (nr Waverly) 2002 7 18908 416658 390074 118 278 1728 2006 334 190 85571840 5105T35 Willow Creek (nr Waverly) 2002 8 22768 411271 386628 112 259 1659 1918 312 179 96401990 7445T35 Willow Creek (nr Waverly) 2002 9 28326 416658 390074 118 278 1728 2006 334 190 128197900 7648T35 Willow Creek (nr Waverly) 2002 10 35372 416658 390074 118 278 1728 2006 334 190 160084000 9550T36 Willow Creek (nr Watertown) 2001 4 58360 395064 348538 1300 666 1813 2262 759 422 18460330 6301T36 Willow Creek (nr Watertown) 2001 5 55181 407046 360760 1227 280 1760 2187 717 399 65452600 7320T36 Willow Creek (nr Watertown) 2001 6 40366 462890 417724 888 165 1512 1836 521 295 75135340 9592T36 Willow Creek (nr Watertown) 2001 7 8477 583090 540335 159 138 977 1082 99 70 1100140 11116T36 Willow Creek (nr Watertown) 2001 8 8477 583090 540335 159 178 977 1082 99 70 3874740 9423T36 Willow Creek (nr Watertown) 2001 9 8477 583090 540335 159 233 977 1082 99 70 12353590 7841T36 Willow Creek (nr Watertown) 2001 10 8477 583090 540335 159 233 977 1082 99 70 11238460 7775T36 Willow Creek (nr Watertown) 2002 4 33200 489903 445279 725 198 1392 1667 426 244 32143830 10392T36 Willow Creek (nr Watertown) 2002 5 8477 583090 540335 159 101 977 1082 99 70 304000 13724T36 Willow Creek (nr Watertown) 2002 6 8477 583090 540335 159 167 977 1082 99 70 2943100 9863T36 Willow Creek (nr Watertown) 2002 7 8477 583090 540335 159 227 977 1082 99 70 12522330 8070T36 Willow Creek (nr Watertown) 2002 8 52452 417334 371254 1165 374 1714 2122 681 380 34810990 7243T36 Willow Creek (nr Watertown) 2002 9 8477 583090 540335 159 266 977 1082 99 70 22349620 7129T36 Willow Creek (nr Watertown) 2002 10 8477 583090 540335 159 245 977 1082 99 70 14254140 7524T37 Stray Horse Creek 2001 6 71120 598769 546413 1408 450 2116 2590 616 396 39372400 6730T37 Stray Horse Creek 2001 7 63710 640257 588571 1509 411 2052 2483 563 339 33090420 6849T37 Stray Horse Creek 2001 8 29433 811090 777029 1968 232 1756 1988 315 77 4029890 7403T37 Stray Horse Creek 2001 9 29433 739494 705553 1968 232 1756 1988 315 77 4029890 7403T37 Stray Horse Creek 2001 10 29433 812712 778641 1968 232 1756 1988 315 77 4029890 7403T37 Stray Horse Creek 2002 4 37871 821017 807412 1855 276 1829 2110 376 141 11183690 7267T37 Stray Horse Creek 2002 5 40642 815112 807251 1817 290 1853 2150 396 163 13532830 7222T37 Stray Horse Creek 2002 6 29433 760151 726155 1968 232 1756 1988 315 77 4029890 7403T37 Stray Horse Creek 2002 7 58867 748962 764616 1573 386 2010 2413 528 302 28984290 6928T37 Stray Horse Creek 2002 8 69921 584879 519099 1425 444 2106 2573 608 387 38356190 6749T37 Stray Horse Creek 2002 9 29433 791719 757649 1968 232 1756 1988 315 77 4029890 7403T37 Stray Horse Creek 2002 10 29433 837947 803872 1968 232 1756 1988 315 77 4029890 7403T40 Hidewood Creek (nr Clear Lake) 2001 6 3589 485369 476570 126 124 1303 1427 252 105 6700260 3720T40 Hidewood Creek (nr Clear Lake) 2001 7 5710 485369 476571 126 124 1303 1427 252 105 6700260 5920T40 Hidewood Creek (nr Clear Lake) 2001 8 9781 1044400 781753 716 261 1435 1696 268 153 10215040 8254

Appendix R
Site Stream Year Month SuspSol TotSol DisSol NO2NO3 NH3N OrgNtr TKN Tot PO4TotDis
PO4 Fecal DOT40 Hidewood Creek (nr Clear Lake) 2001 9 16841 1607838 1089342 1310 399 1567 1966 284 201 13757540 8445T40 Hidewood Creek (nr Clear Lake) 2001 10 42114 1607838 1089342 1310 399 1567 1966 284 201 13757540 21116T40 Hidewood Creek (nr Clear Lake) 2002 4 12292 485369 476570 126 124 1303 1427 252 105 6700260 12742T40 Hidewood Creek (nr Clear Lake) 2002 5 14530 591115 534298 238 150 1328 1478 255 114 7365110 14878T40 Hidewood Creek (nr Clear Lake) 2002 6 15394 1607838 1089342 1310 399 1567 1966 284 201 13757540 7719T40 Hidewood Creek (nr Clear Lake) 2002 7 2087206 1607838 1089342 1310 399 1567 1966 284 201 13757540 1046549T40 Hidewood Creek (nr Clear Lake) 2002 8 154085 1607838 1089342 1310 399 1567 1966 284 201 13757540 77260T40 Hidewood Creek (nr Clear Lake) 2002 9 0 0 0 0 0 0 0 0 0 0 0T40 Hidewood Creek (nr Clear Lake) 2002 10 390898 1607838 1089342 1310 399 1567 1966 284 201 13757540 196001T41 Hidewood Creek (nr Estelline) 2001 5 21982 547545 561349 890 130 994 1126 129 76 850523 12977T41 Hidewood Creek (nr Estelline) 2001 6 18681 525642 534046 1052 85 992 1055 91 68 1124372 14223T41 Hidewood Creek (nr Estelline) 2001 7 20707 547299 550801 953 113 993 1098 115 70 956323 13458T41 Hidewood Creek (nr Estelline) 2001 8 21982 574578 561349 890 130 994 1126 129 75 850523 12977T41 Hidewood Creek (nr Estelline) 2001 9 19282 555715 539016 1022 93 993 1068 98 33 1074525 13996T41 Hidewood Creek (nr Estelline) 2001 10 18392 542592 531656 1066 81 992 1049 88 27 1148342 14332T41 Hidewood Creek (nr Estelline) 2002 4 18392 557957 531656 1066 81 992 1049 88 19 1148342 14332T41 Hidewood Creek (nr Estelline) 2002 5 18392 563704 531656 1066 81 992 1049 88 16 1148342 14332T41 Hidewood Creek (nr Estelline) 2002 6 21111 596921 554141 933 118 994 1107 119 58 922823 13306T41 Hidewood Creek (nr Estelline) 2002 7 21982 689333 561349 890 130 994 1126 129 68 850523 12977T42 Peg Munky Run 2001 5 4093 532145 527820 33 35 599 635 70 55 6658630 14545T42 Peg Munky Run 2001 6 21939 432524 411728 384 139 1300 1439 367 292 6658630 9571T42 Peg Munky Run 2001 7 13694 478548 465362 222 91 976 1068 230 183 6658630 11869T42 Peg Munky Run 2001 8 4093 532145 527820 33 35 599 635 70 55 6658630 14545T42 Peg Munky Run 2001 9 0 0 0 0 0 0 0 0 0 0 0T42 Peg Munky Run 2001 10 4093 532145 527820 33 35 599 635 70 55 6658630 14545T42 Peg Munky Run 2002 4 6665 517784 511085 84 50 700 751 113 89 6658630 13828T42 Peg Munky Run 2002 5 8913 505236 496463 128 63 789 852 150 119 6658630 13202T42 Peg Munky Run 2002 6 4093 532145 527820 33 35 599 635 70 55 6658630 14545T42 Peg Munky Run 2002 7 0 0 0 0 0 0 0 0 0 0 0

Appendix R
Site Stream Year Month SuspSol TotSol DisSol NO2NO3 NH3N OrgNtr TKN Tot PO4TotDis
PO4 Fecal DOT47 Unnamed Creek (nr Volga) 2001 5 32805 606344 573539 1140 1065 3327 4390 1157 881 29775240 33593T47 Unnamed Creek (nr Volga) 2001 6 37901 579764 541864 1278 1259 3819 5078 1284 957 16162840 21541T47 Unnamed Creek (nr Volga) 2001 7 43986 548022 504037 1443 1492 4406 5898 1435 1048 8185810 11672T47 Unnamed Creek (nr Volga) 2001 8 31812 611523 579711 1113 1027 3231 4257 1132 867 17415180 22378T47 Unnamed Creek (nr Volga) 2001 9 7002 740946 733944 441 78 836 911 515 497 4156890 9924T47 Unnamed Creek (nr Volga) 2001 10 17956 683807 665852 738 497 1893 2388 787 660 10707440 17395T47 Unnamed Creek (nr Volga) 2002 4 31207 614681 583473 1097 1003 3173 4175 1117 858 15891590 23526T47 Unnamed Creek (nr Volga) 2002 5 43172 552266 509093 1421 1461 4328 5788 1415 1036 6689690 11235T47 Unnamed Creek (nr Volga) 2002 6 11914 715322 703407 574 266 1310 1573 637 570 5939790 15307T47 Unnamed Creek (nr Volga) 2002 7 7002 740946 733944 441 78 836 911 515 497 5202740 8881T47 Unnamed Creek (nr Volga) 2002 8 7002 740946 733944 441 78 836 911 515 497 3885070 10701T47 Unnamed Creek (nr Volga) 2002 9 7002 740946 733944 441 78 836 911 515 497 5618920 8466T47 Unnamed Creek (nr Volga) 2002 10 11909 715352 703444 574 266 1309 1572 637 570 9438170 15476** flux runs done for T34 but not displayed here due to reliabilty (T34 in and out flows)

Appendix S
Appendix S. Monthly Loadings - FLUX
S-1

Appendix S
Site Stream Year Month SuspSol TotSol DisSol NO2NO3 NH3N Orgntr TKN Tot PO4TotDis
PO4 Fecal DOR01 BSR nr Brookings 2001 4 13072770 122046900 107091500 223635 74476 335399 408558 99878 71103 74570920 1876362R01 BSR nr Brookings 2001 5 8464515 79269230 69574520 146537 48789 218649 266571 65229 46584 79574870 1219122R01 BSR nr Brookings 2001 6 5403293 50601230 44412650 93541 31144 139574 170165 41639 29737 77007940 778222R01 BSR nr Brookings 2001 7 3989372 33088380 28714630 38801 13120 77213 90169 20987 12445 79574870 501431R01 BSR nr Brookings 2001 8 3416589 25500550 21884560 13131 4678 48966 53667 11493 4341 23523200 380854R01 BSR nr Brookings 2001 9 1866468 13930850 11955440 7173 2556 26750 29318 6279 2372 3897082 208059R01 BSR nr Brookings 2001 10 1266854 9455474 8114682 4869 1735 18156 19899 4262 1610 4026985 141219R01 BSR nr Brookings 2002 4 3919799 30713380 26498160 25387 8735 64991 73668 16514 8225 35578470 461897R01 BSR nr Brookings 2002 5 3432607 27817030 24083580 28757 9779 62484 72159 16565 9253 28397270 420260R01 BSR nr Brookings 2002 6 1204882 8992932 7717733 4631 1650 17268 18926 4053 1531 3897082 134311R01 BSR nr Brookings 2002 7 347961 2597090 2228822 1337 476 4987 5466 1171 442 4026985 38788R01 BSR nr Brookings 2002 8 477556 3564358 3058931 1835 654 6844 7501 1607 607 4026985 53234R01 BSR nr Brookings 2002 9 240348 1793899 1539523 924 329 3445 3775 809 305 3897082 26792R01 BSR nr Brookings 2002 10 331630 2475206 2124220 1275 454 4753 5209 1116 421 4026985 36968R14 BSR at Watertown 2001 4 1101605 12792720 12265090 52961 17215 70230 91768 22166 19055 20622560 508366R14 BSR at Watertown 2001 5 376628 4375267 4195547 18161 5902 24061 31447 7599 6535 26527340 162504R14 BSR at Watertown 2001 6 228034 2575634 2435163 8429 2808 12194 15637 3650 3017 25671620 85701R14 BSR at Watertown 2001 7 184233 1909019 1721429 800 476 4295 4669 723 238 4648102 45051R14 BSR at Watertown 2001 8 42881 444331 400668 186 111 1000 1087 168 55 440553 9371R14 BSR at Watertown 2001 9 11244 116511 105062 49 29 262 285 44 15 426341 2190R14 BSR at Watertown 2001 10 15710 162783 146787 68 41 366 398 62 20 440553 3084R14 BSR at Watertown 2002 4 96410 999002 900835 419 249 2248 2443 379 124 326862 22733R14 BSR at Watertown 2002 5 141638 1467655 1323436 615 366 3302 3590 556 183 440553 33767R14 BSR at Watertown 2002 6 58625 607469 547776 255 151 1367 1486 230 76 426341 12978R14 BSR at Watertown 2002 7 5427 56238 50712 24 14 127 138 21 7 440553 1043R14 BSR at Watertown 2002 8 1900 19683 17749 8 5 44 48 8 3 440553 329R14 BSR at Watertown 2002 9 2798 28997 26148 12 7 65 71 11 4 426341 475R14 BSR at Watertown 2002 10 6800 70464 63540 30 18 159 172 27 9 440553 1247R15 BSR at Broadway 2001 4 2161035 17781460 18924160 47899 17918 68182 86101 20559 14967 62592190 426931R15 BSR at Broadway 2001 5 826692 10069120 7195549 18404 6876 26078 32954 6304 3744 71775780 161855R15 BSR at Broadway 2001 6 344346 5598403 3450174 6830 2639 10917 13556 2131 1045 69460430 82571R15 BSR at Broadway 2001 7 129909 2138442 2083855 1132 607 4212 4819 713 331 7672167 57317R15 BSR at Broadway 2001 8 43341 753111 695225 378 202 1405 1608 243 119 803925 19122R15 BSR at Broadway 2001 9 15827 292379 253884 138 74 513 587 91 47 777992 6983R15 BSR at Broadway 2001 10 15151 281409 243041 132 71 491 562 88 46 803925 6685R15 BSR at Broadway 2002 4 128650 2121971 1868954 1481 698 4148 4846 732 348 7646234 50248R15 BSR at Broadway 2002 5 101261 1687579 1624314 883 473 3284 3756 558 262 803925 44677R15 BSR at Broadway 2002 6 38954 685230 624853 340 182 1263 1445 220 109 777992 17187R15 BSR at Broadway 2002 7 16163 297126 259269 141 76 524 600 93 48 803925 7131R15 BSR at Broadway 2002 8 46356 727782 590887 686 292 1485 1777 289 150 5382754 15345R15 BSR at Broadway 2002 9 16759 309036 268823 146 78 543 622 97 50 777992 7394R15 BSR at Broadway 2002 10 16603 305519 266321 145 78 538 616 96 49 803925 7325R16 BSR 20th Ave 2001 4 2311027 29343100 26825370 58933 25299 94028 119327 32886 25330 85063860 630175R16 BSR 20th Ave 2001 5 882537 11148590 10186390 22003 9703 35863 45566 12493 9615 97487330 239656R16 BSR 20th Ave 2001 6 383479 5434696 5024144 14763 3783 16041 19824 6103 4783 94342580 114458R16 BSR 20th Ave 2001 7 172081 3416124 3244379 15237 981 7956 8937 3855 3149 10885920 68449R16 BSR 20th Ave 2001 8 57411 1139703 1082404 5083 327 2654 2982 1286 1051 1607181 22836R16 BSR 20th Ave 2001 9 20965 416200 395276 1856 120 969 1089 470 384 1555336 8340R16 BSR 20th Ave 2001 10 20070 398424 378393 1777 114 928 1042 450 367 1607181 7983R16 BSR 20th Ave 2002 4 163592 3043053 2877167 12683 1083 7405 8487 3431 2784 10834080 61496
FLUX Calculated Monthly Loadings (Kg)

Appendix S
Site Stream Year Month SuspSol TotSol DisSol NO2NO3 NH3N Orgntr TKN Tot PO4TotDis
PO4 Fecal DOR16 BSR 20th Ave 2002 5 134133 2662787 2528915 11877 765 6201 6966 3005 2455 1607181 53355R16 BSR 20th Ave 2002 6 51599 1024340 972841 4569 294 2386 2680 1156 944 1555336 20525R16 BSR 20th Ave 2002 7 21410 425027 403658 1896 122 990 1112 480 392 1607181 8516R16 BSR 20th Ave 2002 8 56054 952361 894367 3550 437 2467 2904 1072 861 7792999 19492R16 BSR 20th Ave 2002 9 22199 440690 418534 1966 127 1026 1153 497 406 1555336 8830R16 BSR 20th Ave 2002 10 21992 436588 414638 1947 125 1017 1142 493 403 1607181 8748R17 BSR below Watertown 2001 4 5087368 24848090 27512620 87828 30770 117756 153808 38651 25043 162434400 643139R17 BSR below Watertown 2001 5 1947844 17406910 11433240 36498 12787 48935 63917 16062 10407 186257800 285922R17 BSR below Watertown 2001 6 789354 10391540 5366410 16607 5081 20678 26607 7090 4732 180249500 149061R17 BSR below Watertown 2001 7 269112 3545864 3471459 9570 1228 8253 9621 3582 2719 19983880 75762R17 BSR below Watertown 2001 8 89782 1314911 1158164 3193 410 2753 3210 1195 907 2168795 23664R17 BSR below Watertown 2001 9 32787 540340 422942 1166 150 1006 1172 436 331 2098834 8003R17 BSR below Watertown 2001 10 31387 522648 404877 1116 143 963 1122 418 317 2168795 7609R17 BSR below Watertown 2002 4 274058 2829460 2728658 7522 965 6487 7563 2815 2137 19913920 69279R17 BSR below Watertown 2002 5 209766 2831347 2705919 7460 957 6433 7500 2792 2120 2168795 58171R17 BSR below Watertown 2002 6 80694 1209242 1040932 2870 368 2475 2885 1074 815 2098834 20922R17 BSR below Watertown 2002 7 33482 546947 431911 1191 153 1027 1197 446 338 2168795 8231R17 BSR below Watertown 2002 8 101954 1278802 970408 2801 563 2855 3501 1109 797 14045500 21657R17 BSR below Watertown 2002 9 35010 574360 451618 1245 160 1074 1252 466 354 2098834 8568R17 BSR below Watertown 2002 10 31485 514025 406141 1120 144 966 1126 419 318 1958912 7736R18 BSR nr Castlewood 2001 4 4662016 27269910 23970520 112613 46989 158081 206450 58208 41181 2955741000 618544R18 BSR nr Castlewood 2001 5 1934341 19806260 27307090 34926 19553 65655 85779 24172 17102 3272015000 255046R18 BSR nr Castlewood 2001 6 1006704 14588350 25607650 15158 10058 34033 44391 12537 8868 3166467000 136091R18 BSR nr Castlewood 2001 7 396523 4326280 1931570 11157 1773 10882 12808 4133 2891 848669900 115855R18 BSR nr Castlewood 2001 8 139990 1780419 1931570 4844 626 3842 4522 1459 1021 5766919 40902R18 BSR nr Castlewood 2001 9 60045 882515 1869262 2520 268 1648 1940 626 438 5580890 17544R18 BSR nr Castlewood 2001 10 60502 894565 1931570 2559 271 1660 1954 631 441 5766919 17677R18 BSR nr Castlewood 2002 4 237205 2741878 1620027 7210 1060 6510 7662 2472 1729 427032000 69306R18 BSR nr Castlewood 2002 5 284326 3274948 1931570 8603 1271 7803 9184 2963 2073 5766919 83074R18 BSR nr Castlewood 2002 6 124435 1614213 1744644 4415 556 3415 4019 1297 907 5208831 36357R18 BSR nr Castlewood 2002 7 62710 885706 1931570 2504 280 1721 2026 654 457 5766919 18322R18 BSR nr Castlewood 2002 8 177045 2114350 3568700 4295 1417 5579 7055 2075 1463 321855400 33948R18 BSR nr Castlewood 2002 9 57071 847723 1869262 2429 255 1566 1844 595 416 5580890 16675R18 BSR nr Castlewood 2002 10 58672 860740 1806953 2456 262 1610 1895 612 428 5580890 17143R19 BSR nr Estelline 200105 4 6021282 48024170 34322700 157499 53450 189000 242324 51728 33719 272095300 811651R19 BSR nr Estelline 200105 5 2493522 19848350 14150480 65520 15770 78426 100596 21483 14017 301158400 352490R19 BSR nr Estelline 200106 6 1307802 10492820 7554568 33739 6573 40801 52245 11138 7239 291443600 190767R19 BSR nr Estelline 200107 7 702131 7156755 6502763 6600 3158 15805 18550 3601 1811 78652320 104293R19 BSR nr Estelline 200108 8 247882 2526642 2295755 2330 714 5580 6549 1271 639 1258874 39445R19 BSR nr Estelline 200109 9 106322 1083731 984699 999 189 2393 2809 545 274 1218265 18077R19 BSR nr Estelline 200110 10 106930 1089924 990326 1005 186 2407 2825 548 276 1258874 18234R19 BSR nr Estelline 200204 4 578299 5685838 5020662 7013 2381 13853 16580 3292 1776 39914980 87064R19 BSR nr Estelline 200205 5 503460 5131725 4662784 4732 1910 11333 13301 2582 1298 1258874 76646R19 BSR nr Estelline 200206 6 238364 2429622 2207601 2241 624 5366 6298 1222 615 1218265 38276R19 BSR nr Estelline 200207 7 111041 1131828 1028401 1044 248 2500 2934 569 286 1258874 18505R19 BSR nr Estelline 200208 8 260081 2331746 1895976 4857 1177 7133 8862 1832 1106 30281420 39312R19 BSR nr Estelline 200209 9 101057 1030061 935933 950 173 2275 2670 518 261 1218265 17267R19 BSR nr Estelline 200210 10 103892 1058960 962191 977 187 2339 2745 533 268 1218265 17649R20 BSR nr Bruce 2001 4 6433844 48509020 42743300 161591 50400 218343 265149 52507 37660 201382000 672606R20 BSR nr Bruce 2001 5 5359040 65381720 57610530 134597 41981 181868 220855 43736 31369 221520700 906556R20 BSR nr Bruce 2001 6 3903730 63272630 55752130 98045 30580 132480 160879 31859 22850 214374900 877312R20 BSR nr Bruce 2001 7 2518294 65381720 57610530 63249 19727 85463 103783 20552 14741 221520700 906556

Appendix S
Site Stream Year Month SuspSol TotSol DisSol NO2NO3 NH3N Orgntr TKN Tot PO4TotDis
PO4 Fecal DOR20 BSR nr Bruce 2001 8 2957345 30579680 26793930 28585 9218 55066 57749 12060 6742 189038400 425891R20 BSR nr Bruce 2001 9 2181415 11069570 9527239 10403 3539 30029 27605 6072 2502 19481420 156314R20 BSR nr Bruce 2001 10 1408263 11438560 9844814 6716 2285 19386 17821 3920 1615 20130800 161525R20 BSR nr Bruce 2002 4 2123571 14549780 12608900 13354 4430 32431 31402 6764 3182 38970760 204381R20 BSR nr Bruce 2002 5 1785750 11438560 9844814 8516 2897 24582 22598 4971 2048 20130800 161525R20 BSR nr Bruce 2002 6 777697 11069570 9527239 3709 1262 10706 9841 2165 892 19481420 156314R20 BSR nr Bruce 2002 7 307614 11438560 9844814 1467 499 4235 3893 856 353 20130800 161525R20 BSR nr Bruce 2002 8 518370 11438560 9844814 2472 841 7136 6560 1443 595 26627250 161525R20 BSR nr Bruce 2002 9 215585 11069570 9527239 1028 350 2968 2728 600 247 19481420 156314R20 BSR nr Bruce 2002 10 245977 11069570 9527239 1173 399 3386 3113 685 282 20130800 156314T35 Willow Creek (nr Waverly) 2001 5 265 19460 19004 3 5 58 63 7 5 6579 305T35 Willow Creek (nr Waverly) 2001 6 2650 208445 203562 36 58 618 676 78 51 65800 3045T35 Willow Creek (nr Waverly) 2001 7 2738 128048 125048 22 36 380 415 48 32 68000 3147T35 Willow Creek (nr Waverly) 2001 8 1638 45524 43267 11 24 170 194 30 17 4630000 986T35 Willow Creek (nr Waverly) 2001 9 1275 15821 14811 5 11 66 76 13 7 5768300 344T35 Willow Creek (nr Waverly) 2001 10 1275 13485 12625 4 9 56 65 11 6 5768300 344T35 Willow Creek (nr Waverly) 2002 4 2032 63951 62453 11 18 190 208 24 16 50400 2335T35 Willow Creek (nr Waverly) 2002 5 2738 98407 96102 17 28 292 319 37 24 68000 3147T35 Willow Creek (nr Waverly) 2002 6 1871 62996 60333 14 29 222 251 36 22 3297200 1515T35 Willow Creek (nr Waverly) 2002 7 1317 29023 27171 8 19 120 140 23 13 5960600 356T35 Willow Creek (nr Waverly) 2002 8 1363 24618 23143 7 16 99 115 19 11 5770500 446T35 Willow Creek (nr Waverly) 2002 9 1275 18748 17552 5 13 78 90 15 9 5768300 344T35 Willow Creek (nr Waverly) 2002 10 1275 15013 14056 4 10 62 72 12 7 5768300 344T36 Willow Creek (nr Watertown) 2001 4 1297519 8783466 7749044 28903 14807 40312 50288 16870 9372 410428700 140100T36 Willow Creek (nr Watertown) 2001 5 308990 2279271 2020090 6872 1566 9855 12245 4013 2235 366504500 40990T36 Willow Creek (nr Watertown) 2001 6 94610 1084924 979063 2082 387 3543 4304 1221 691 176102700 22481T36 Willow Creek (nr Watertown) 2001 7 2852 196173 181789 54 46 329 364 33 24 370100 3740T36 Willow Creek (nr Watertown) 2001 8 810 55699 51615 15 17 93 103 10 7 370100 900T36 Willow Creek (nr Watertown) 2001 9 246 16907 15667 5 7 28 31 3 2 358200 227T36 Willow Creek (nr Watertown) 2001 10 279 19204 17796 5 8 32 36 3 2 370100 256T36 Willow Creek (nr Watertown) 2002 4 76002 1121507 1019350 1659 452 3186 3816 975 559 73585000 23790T36 Willow Creek (nr Watertown) 2002 5 10321 709934 657877 194 124 1190 1318 121 85 370100 16709T36 Willow Creek (nr Watertown) 2002 6 1032 70965 65761 19 20 119 132 12 9 358200 1200T36 Willow Creek (nr Watertown) 2002 7 251 17235 15971 5 7 29 32 3 2 370100 239T36 Willow Creek (nr Watertown) 2002 8 44692 355592 316329 993 318 1461 1808 580 324 29660900 6172T36 Willow Creek (nr Watertown) 2002 9 136 9345 8660 3 4 16 17 2 1 358190 114T36 Willow Creek (nr Watertown) 2002 10 213 14652 13578 4 6 25 27 3 2 358190 189T37 Stray Horse Creek 2001 6 255458 2150742 1962681 5059 1617 7601 9303 2214 1422 141423300 24172T37 Stray Horse Creek 2001 7 91502 919549 845317 2166 591 2948 3566 808 487 47525120 9837T37 Stray Horse Creek 2001 8 2776 76499 73286 186 22 166 188 30 7 380081 698T37 Stray Horse Creek 2001 9 587 14737 14061 39 5 35 40 6 2 80311 148T37 Stray Horse Creek 2001 10 2940 81183 77780 197 23 176 199 31 8 402552 740T37 Stray Horse Creek 2002 4 5869 127228 125120 287 43 284 327 58 22 1733065 1126T37 Stray Horse Creek 2002 5 10011 200787 198851 448 72 457 530 98 40 3333554 1779T37 Stray Horse Creek 2002 6 846 21856 20879 57 7 51 57 9 2 115868 213T37 Stray Horse Creek 2002 7 8246 104907 107099 220 54 282 338 74 42 4059809 970T37 Stray Horse Creek 2002 8 146476 1225249 1087447 2984 930 4412 5389 1273 810 80351470 14138T37 Stray Horse Creek 2002 9 2185 58764 56235 146 17 130 148 23 6 299112 550T37 Stray Horse Creek 2002 10 5152 146667 140703 344 41 307 348 55 13 705357 1296T40 Hidewood Creek (nr Clear Lake) 2001 6 14167 1916072 1881338 499 489 5145 5634 993 416 26450300 14686T40 Hidewood Creek (nr Clear Lake) 2001 7 19094 1622952 1593531 423 415 4358 4772 841 352 22404000 19794T40 Hidewood Creek (nr Clear Lake) 2001 8 6738 719536 538586 493 180 988 1168 184 106 7037600 5686

Appendix S
Site Stream Year Month SuspSol TotSol DisSol NO2NO3 NH3N Orgntr TKN Tot PO4TotDis
PO4 Fecal DOT40 Hidewood Creek (nr Clear Lake) 2001 9 3034 289606 196214 236 72 282 354 51 36 2478000 1521T40 Hidewood Creek (nr Clear Lake) 2001 10 3034 115815 78467 94 29 113 142 20 15 991000 1521T40 Hidewood Creek (nr Clear Lake) 2002 4 14167 559382 549241 146 143 1502 1645 290 121 7722000 14686T40 Hidewood Creek (nr Clear Lake) 2002 5 17035 693014 626404 279 176 1557 1733 299 134 8634800 17442T40 Hidewood Creek (nr Clear Lake) 2002 6 3034 316846 214669 258 79 309 387 56 40 2711100 1521T40 Hidewood Creek (nr Clear Lake) 2002 7 3135 2415 1636 2 1 2 3 0 0 20700 1572T40 Hidewood Creek (nr Clear Lake) 2002 8 3135 32709 22161 27 8 32 40 6 4 279900 1572T40 Hidewood Creek (nr Clear Lake) 2002 9 3034 0 0 0 0 0 0 0 0 0 1521T40 Hidewood Creek (nr Clear Lake) 2002 10 3034 12477 8454 10 3 12 15 2 2 106800 1521T41 Hidewood Creek (nr Estelline) 2001 5 3472 86480 88660 141 21 157 178 20 12 134333 2050T41 Hidewood Creek (nr Estelline) 2001 6 59068 1662036 1688610 3325 269 3137 3335 288 216 3555172 44973T41 Hidewood Creek (nr Estelline) 2001 7 31552 833932 839268 1451 172 1514 1673 175 106 1457173 20507T41 Hidewood Creek (nr Estelline) 2001 8 17386 454432 443970 704 103 786 890 102 59 672676 10263T41 Hidewood Creek (nr Estelline) 2001 9 36761 1059453 1027616 1949 178 1892 2035 187 63 2048547 26694T41 Hidewood Creek (nr Estelline) 2001 10 52158 1538720 1507709 3022 230 2813 2974 249 78 3256550 40645T41 Hidewood Creek (nr Estelline) 2002 4 29636 899045 856666 1717 130 1598 1690 141 30 1850341 23094T41 Hidewood Creek (nr Estelline) 2002 5 36075 1105670 1042810 2090 159 1946 2057 172 32 2252401 28112T41 Hidewood Creek (nr Estelline) 2002 6 10324 291904 270983 456 58 486 541 58 29 451274 6507T41 Hidewood Creek (nr Estelline) 2002 7 558 17504 14254 23 3 25 29 3 2 21597 330T42 Peg Munky Run 2001 5 40 5148 5106 0 0 6 6 1 1 64400 141T42 Peg Munky Run 2001 6 24428 481582 458427 428 155 1447 1603 408 325 7413900 10656T42 Peg Munky Run 2001 7 2374 82948 80662 39 16 169 185 40 32 1154200 2057T42 Peg Munky Run 2001 8 61 7866 7802 1 1 9 9 1 1 98400 215T42 Peg Munky Run 2001 9 0 0 0 0 0 0 0 0 0 0 0T42 Peg Munky Run 2001 10 17 2194 2176 0 0 3 3 0 0 27500 60T42 Peg Munky Run 2002 4 1788 138871 137074 23 14 188 201 30 24 1785900 3709T42 Peg Munky Run 2002 5 2280 129231 126986 33 16 202 218 38 31 1703200 3377T42 Peg Munky Run 2002 6 209 27150 26929 2 2 31 32 4 3 339700 742T42 Peg Munky Run 2002 7 0 0 0 0 0 0 0 0 0 0 0

Appendix S
Site Stream Year Month SuspSol TotSol DisSol NO2NO3 NH3N Orgntr TKN Tot PO4TotDis
PO4 Fecal DOT47 Unnamed Creek (nr Volga) 2001 5 271 5011 4740 9 9 28 36 10 7 246100 278T47 Unnamed Creek (nr Volga) 2001 6 6862 104972 98110 232 228 692 919 232 173 2926400 3900T47 Unnamed Creek (nr Volga) 2001 7 15749 196216 180467 517 534 1578 2112 514 375 2930900 4179T47 Unnamed Creek (nr Volga) 2001 8 2803 53877 51074 98 90 285 375 100 76 1534300 1972T47 Unnamed Creek (nr Volga) 2001 9 225 23767 23543 14 3 27 29 17 16 133300 318T47 Unnamed Creek (nr Volga) 2001 10 1004 38245 37240 41 28 106 134 44 37 598900 973T47 Unnamed Creek (nr Volga) 2002 4 4798 94500 89702 169 154 488 642 172 132 2443100 3617T47 Unnamed Creek (nr Volga) 2002 5 24923 318819 293896 821 843 2499 3342 817 598 3861900 6486T47 Unnamed Creek (nr Volga) 2002 6 734 44089 43354 35 16 81 97 39 35 366100 944T47 Unnamed Creek (nr Volga) 2002 7 185 19623 19437 12 2 22 24 14 13 137800 235T47 Unnamed Creek (nr Volga) 2002 8 248 26278 26029 16 3 30 32 18 18 137800 380T47 Unnamed Creek (nr Volga) 2002 9 166 17583 17417 11 2 20 22 12 12 133300 201T47 Unnamed Creek (nr Volga) 2002 10 462 27748 27286 22 10 51 61 25 22 366100 600** flux runs done for T34 but not displayed here due to data reliabilty (T34 in and out flows)

104 Appendix T
Appendix T. Methodology of the AGNPS Feedlot Model
T-1
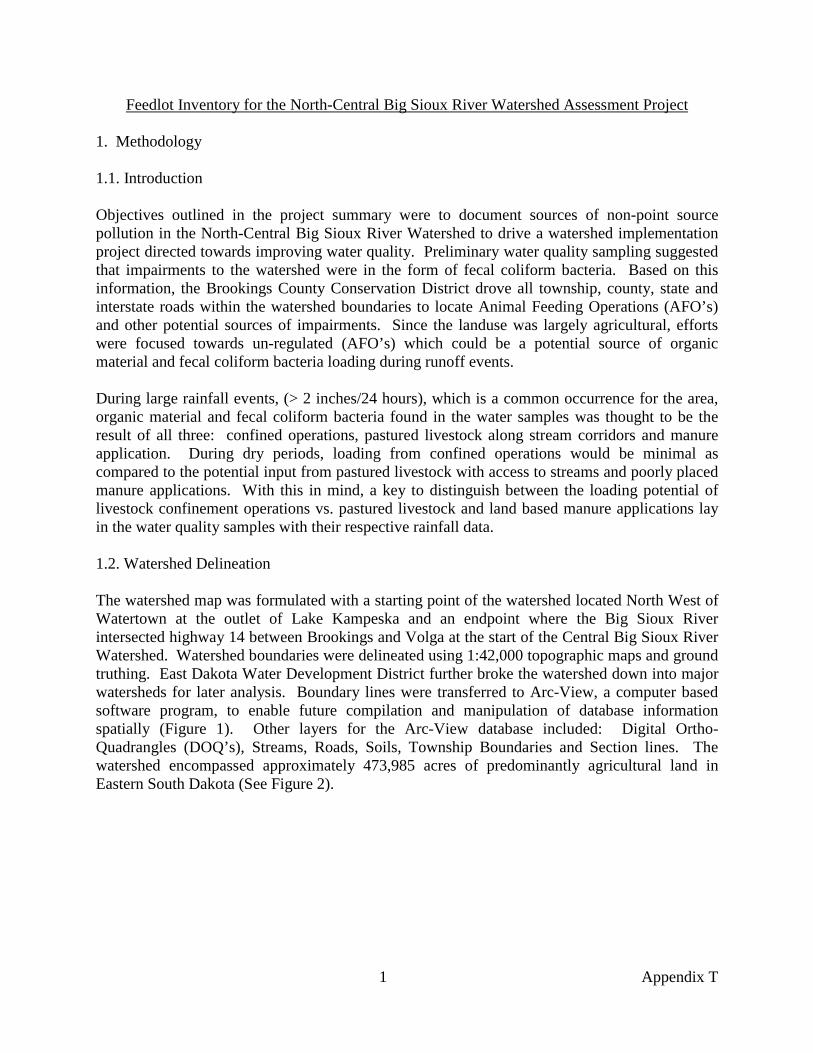
1 Appendix T
Feedlot Inventory for the North-Central Big Sioux River Watershed Assessment Project 1. Methodology 1.1. Introduction Objectives outlined in the project summary were to document sources of non-point source pollution in the North-Central Big Sioux River Watershed to drive a watershed implementation project directed towards improving water quality. Preliminary water quality sampling suggested that impairments to the watershed were in the form of fecal coliform bacteria. Based on this information, the Brookings County Conservation District drove all township, county, state and interstate roads within the watershed boundaries to locate Animal Feeding Operations (AFO’s) and other potential sources of impairments. Since the landuse was largely agricultural, efforts were focused towards un-regulated (AFO’s) which could be a potential source of organic material and fecal coliform bacteria loading during runoff events. During large rainfall events, (> 2 inches/24 hours), which is a common occurrence for the area, organic material and fecal coliform bacteria found in the water samples was thought to be the result of all three: confined operations, pastured livestock along stream corridors and manure application. During dry periods, loading from confined operations would be minimal as compared to the potential input from pastured livestock with access to streams and poorly placed manure applications. With this in mind, a key to distinguish between the loading potential of livestock confinement operations vs. pastured livestock and land based manure applications lay in the water quality samples with their respective rainfall data. 1.2. Watershed Delineation The watershed map was formulated with a starting point of the watershed located North West of Watertown at the outlet of Lake Kampeska and an endpoint where the Big Sioux River intersected highway 14 between Brookings and Volga at the start of the Central Big Sioux River Watershed. Watershed boundaries were delineated using 1:42,000 topographic maps and ground truthing. East Dakota Water Development District further broke the watershed down into major watersheds for later analysis. Boundary lines were transferred to Arc-View, a computer based software program, to enable future compilation and manipulation of database information spatially (Figure 1). Other layers for the Arc-View database included: Digital Ortho-Quadrangles (DOQ’s), Streams, Roads, Soils, Township Boundaries and Section lines. The watershed encompassed approximately 473,985 acres of predominantly agricultural land in Eastern South Dakota (See Figure 2).

2 Appendix T
Hidewood
Willow
Stra
yH
orse
Peg MunkyPoin
sett
Tributary
Big Sioux River
Watershed Boundaries
Monitoring Site
Municipality
N
W E
S
Brookings
Watertown
Figure 1. North-Central Big Sioux River Watershed Separated into Sub-watersheds
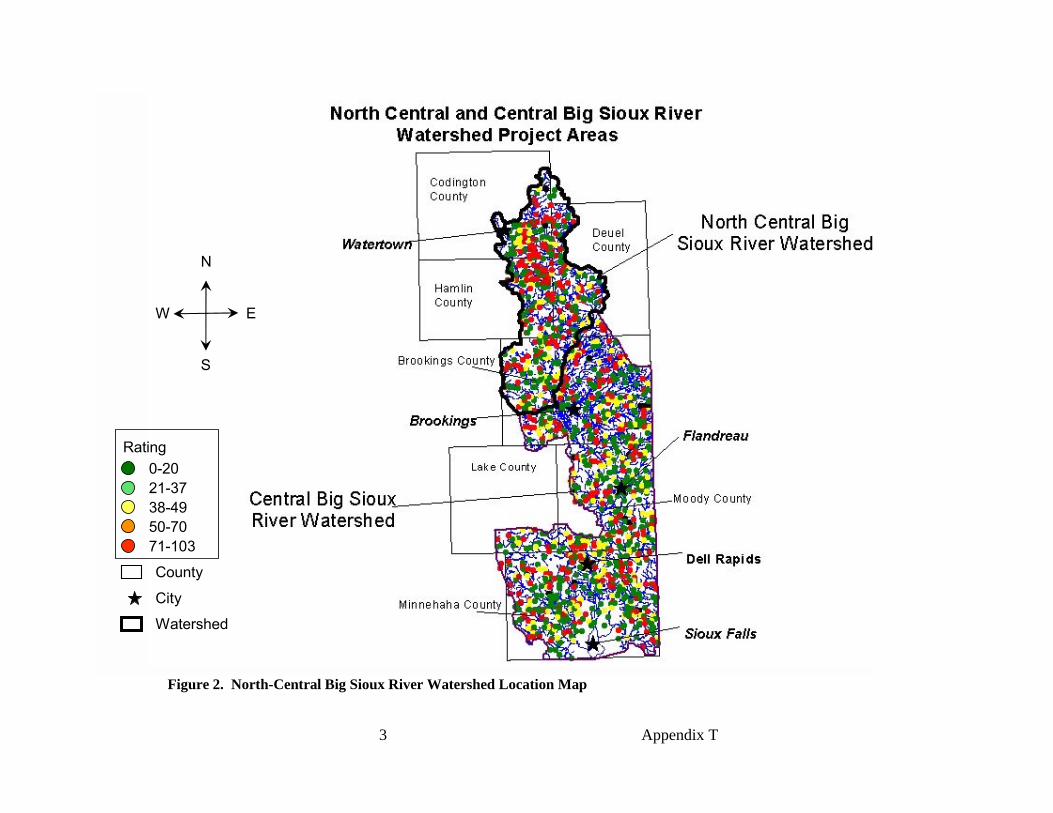
3 Appendix T
N
W E
S
Rating0-2021-37
50-7038-49
71-103
County
City
Watershed
Figure 2. North-Central Big Sioux River Watershed Location Map

4 Appendix T
1.3. Feedlot Model All livestock operations within watershed boundaries were highlighted on copies of the latest plat book directories for future contacts. Arc-View was then used to produce an enlarged image (usually on a 1:1,400 scale) of all highlighted operations from 2003 DOQ’s that were donated to the project from the Natural Resource Conservation Service (NRCS). These enlarged photos would later serve as templates and data sheets for collection of the operations’ information (Figure 3). Each producer was given a chance to volunteer information about their operation through direct visits, phone calls or letters left in their doors. If a producer was willing to volunteer information for the assessment, they were shown the DOQ printout and asked for data to satisfy inputs for Agricultural Non-Point Source (AGNPS) pollution model’s feedlot module. Information collected from each producer is shown in (Table 1).
Figure 3. Digital Ortho-Quadrangles used for Operator Surveys
Feeding operations with potential for runoff were assessed using the AGNPS feedlot module. Operations confining <40 animal units (AU’s) and exhibiting no potential for runoff were excluded from the model and simply marked on Arc-View as a green dot. There were a few operations confining <40 AU’s that were included in the investigation only because they were located within a short distance from a major tributary or the Big Sioux River itself and exhibited a potential to have runoff occur. Any feeding operation with >40 AU’s was modeled using AGNPS. Extra effort was made to contact and interview every producer with a livestock operation personally in the watershed in order to collect good quality information. Gaining trust with producers and access to their operations made this possible. 371 operations were evaluated in the watershed for potential

5 Appendix T
to contribute runoff to surface waters. Of the 371 operations, 297 animal feeding operations were assessed using AGNPS Feedlot Module. The remaining 74 operations did not rate high enough during a preliminary investigation to warrant an assessment. During our investigation, several of the operations visited fit the criteria for a Concentrated Animal Feeding Operation (CAFO). Large CAFO’s that were permitted or had a waste system in place were inventoried, and labeled in the database, but were not subjected to the feedlot model itself. Most of the CAFO’s had some type of waste storage system in place, and some had obtained coverage under the general permit. A portion of the operations believed to be CAFO’s though did not have any waste storage or coverage under the general permit. A few of the operations assessed fit the definition of either small or medium CAFO’s according to the South Dakota Department of Environment and Natural Resources Web site describing conditions. Table 1. Information Collected From Each Producer
ID Area Acres Animal Number Animal2 Number2 Code Waste System Months Buffer Buffer1 10544.9 2.6 BEEF CATTLE 40 0 T1NDCK NONE 0 03 13461.9 3.3 BEEF CATTLE 180 0 T1NDCK NONE 0 04 8563.8 2.1 BEEF CATTLE 150 0 T1NDCK NONE 0 06 10335.7 2.6 BEEF CATTLE 100 DAIRY 50 T1NDCK NONE 0 3007 3923.6 1.0 SOWS 120 0 T1NDCK NONE 0 09 8941.7 2.2 BEEF CATTLE 100 0 T1NDCK NONE 0 0
12 11324.7 2.8 BEEF CATTLE 80 0 T1NDCK NONE 0 016 24571.4 6.1 BEEF CATTLE 150 0 T1NDCK NONE 0 020 28591.4 7.1 BEEF CATTLE 200 0 T4SXMCK NONE 12 50 PASTURE21 22427.3 5.5 BEEF CATTLE 400 0 T3SXMCK NONE 0 021 18234.2 4.5 BEEF CATTLE 250 0 T3SXMCK NONE 0 022 16959.6 4.2 BEEF CATTLE 300 0 T3SXMCK NONE 0 026 12447.3 3.1 BUFFALO 50 0 T3SXMCK NONE 0 450
1000 10850.9 2.7 DAIRY CATTLE 120 0 T1NDCK NONE 0 0
1.4. Arc-View Model Geographic Information Systems (GIS) ARC-View was then used to create a watershed distribution map of all operations with their respective information. Four shape files were created to handle the data from the assessments for each of the operations. The first shape file created was the Operator theme (Table 2). It contained location information as well as summary information that were added back to the theme table after the AGNPS feedlot module was run for all of the operations. The second shape file created was the Feedlot theme. It was used to capture the size and number of head each lot contained for each operation. The third shape file was the roof theme. It allowed us to measure the area of roof involved in adding water to the feedlot that AGNPS required as an input. The last shape file was the Watershed theme. This theme was used to digitize the area and landuse type that comprised the 2a and 3a areas that were also inputs needed in the AGNPS module (Figure 4).
Table 2. Table Used to Create the Operator Theme in ArcView ID Distance LMU Code PO4 (ppm) COD (ppm) PO4 (lbs) COD (lbs) SURFACER GROUNDR CAFO1 16295.4 1 T1NDCK 13.0 689.7 37.5 1987.5 39 1 NO2 15896.2 1 T1NDCK 18.4 974.0 153.3 8113.1 60 1 NO3 15656.0 1 T1NDCK 46.0 2432.4 187.2 9909.4 61 1 NO4 14799.1 1 T1NDCK 60.1 3184.0 140.5 7436.1 56 1 NO5 11833.9 1 T1NDCK 85.0 4500.0 135.8 7189.3 54 1 NO6 9110.4 1 T1NDCK 19.2 1214.6 57.0 3609.4 47 1 NO7 8315.9 1 T1NDCK 28.4 946.4 31.8 1061.2 29 2 NO8 10646.6 3 T3SXMCK 11.4 590.0 123.9 6436.9 58 1 NO9 4404.9 1 T1NDCK 57.7 3054.3 131.5 6959.7 55 1 NO10 21366.8 2 T2NDCK 8.9 1412.8 11.2 1786.0 36 3 NO11 21896.0 2 T2NDCK 85.0 4500.0 248.7 13163.7 264 2 NO12 20032.4 2 T2NDCK 36.4 1928.6 132.2 7000.0 56 2 NO13 19321.8 2 T2NDCK 2.7 430.4 15.3 2429.0 43 2 NO14 18128.7 2 T2NDCK 54.8 2900.7 209.4 11077.1 62 2 NO15 18175.1 2 T2NDCK 51.2 2692.8 194.1 10210.1 61 2 NO16 22194.9 2 T2NDCK 9.9 463.9 55.1 2571.3 44 1 NO

6 Appendix T
ArcView Image of Digitized Feedlots
Rating0-2021-37
50-7038-49
71-103
Feedlot
Roof
Watershed
Figure 4. ArcView Image of Digitized Feedlots
Figure 5 shows a simple drawing that illustrates the basic interactions that needed to be taken in consideration when gathering information for the AGNPS feedlot module (USDA AGNPS Feedlot Manual). After digitizing each operation for the operator location; feedlot locations and size; roof area; watershed landuse and size; all required inputs were satisfied for the AGNPS feedlot module.

7 Appendix T
Area Border
Buffer Area Border
Buffer Area
Sub-area Border
Figure 5. Example of an Animal Lot with Surrounding Watershed
1.5. Combining Arc-View and the AGNPS Feedlot Module Data was then entered separately for each operation from the Arc-View themes into the AGNPS feedlot module. The module was run to simulate a 25 year 24 hour rainstorm event that was currently a requirement of the general permit for construction of waste storage facilities. Some of the inputs were indexes, so they were standardized to simplify data entry with the thinking that differences in the output would be caused by interactions taking place for each operation’s unique situation. After all of the operations were run through AGNPS, the output data was entered back into the operator theme to allow a means of differentiating between feeding operations with a high potential to have runoff from those with little or no potential. AGNPS surface ratings for runoff potential ranged from 0 – 103 for the facilities assessed. AGNPS Phosphorus loading potentials ranged from 0.0 lbs. – 1,513 lbs. for any single animal feeding operation. By using Arc-View, a watershed map could easily be made with feedlots geo-referenced and categorized by a graduated color scheme representing various potential to have runoff occurring. Operations exhibiting low potential were color coded green while intermediate potential sites were given a light green or yellow color. Medium high to high potential operations were color coded orange and red (Figure 2). By coding each operation with a unique value representative of the monitoring site that it eventually flowed to allowed us to count the number of feedlots in a particular sub-watershed and compare it to water quality data from that point. Depending on runoff potentials of the feedlots affecting any monitoring site, we were able to make a prediction of which sites should exhibit good or poor water quality downstream. The joining of the AGNPS feedlot module and GIS feedlot databases created a comprehensive watershed model that could simulate various scenarios in order to better predict interactions taking place in the watershed.

8 Appendix T
Managers could use the model as a tool to test “what if” circumstances and make changes to get more desirable outcomes. While working with producers during the implementation phase, simulations could be run to see what effects one might achieve by planning for certain practices (e.g. filters, sediment basins or complete waste management systems). Implementation of best management practices in high pollution potential areas could be the key to improving water quality in the North Central Big Sioux River Watershed.

Appendix U
Appendix U. Min, Max, Median, Percent Violation
by Parameter for BSR and Tributaries
U-1

Appendix U
# of Violations Percent Use Site Stream Samples Mean Min Max Median of WQS Violating SupportT34 Lake Pelican Weir 8 1163 nd 8000 235 ----** ---- ----T35 Willow Creek (nr Waverly) 9 107311 110 930000 1000 3 33 NotT36 Willow Creek (nr Watertown) 10 13819 230 110000 1500 4 40 NotT37 Stray Horse Creek 10 33888 40 320000 1800 4 40 NotT39 Lake Poinsett Outlet 11 2881 nd 27000 190 ----** ---- ----T40 Hidewood Creek (nr Clear Lake) 9 7286 10 42000 670 2 22 FullT41 Hidewood Creek (nr Estelline) 7 1376 100 3300 700 3 43 NotT42 Peg Munky Run 4 4730 420 10000 4250 3 75 NotT46 East Oakwood Lake Outlet 2 11 3476 20 13000 2200 ----** ---- ----T47 Unnamed Creek (nr Volga) 10 4785 180 25000 830 ----** ---- ----R1 BSR nr Brookings 37 419 nd >2500 180 2 5 FullR14 BSR at Watertown 34 2445 nd 31000 795 7 21 NotR15 BSR at Broadway 21 1024 40 8000 370 2 10 FullR16 BSR 20th Ave 21 1482 90 10000 520 3 14 NotR17 BSR below Watertown 35 2144 10 33000 620 5 14 NotR18 BSR nr Castlewood 21 22448 70 410000 1800 10 48 NotR19 BSR nr Estelline 37 1265 nd 29000 300 3 8 FullR20 BSR nr Bruce 22 1322 80 14000 425 4 18 Not
---- denotes no standard or beneficial use assigned----** denotes violations if beneficial use (8) were applicable
Fecal Coliform Bacteria cfu/100mL (May-Sept)
NOTE: For beneficial use (8) standard is 2000 cfu/100mLFecal coliform data includes May 01 to Sept. 02 and May 04 to Sept. 04
# of Violations Percent Use Site Stream Samples Mean Min Max Median of WQS Violating SupportT34 Lake Pelican Weir 13 16.6 5.2 27.3 18.8 ---- ---- ----T35 Willow Creek (nr Waverly) 14 14.8 2.7 23.4 19.0 0 0 FullT36 Willow Creek (nr Watertown) 17 13.3 1.1 24.2 12.4 0 0 FullT37 Stray Horse Creek 14 15.8 5.3 24.8 19.1 0 0 FullT39 Lake Poinsett Outlet 14 16.6 4.9 25.4 19.0 ---- ---- ----T40 Hidewood Creek (nr Clear Lake) 14 14.2 2.9 24.3 17.0 0 0 FullT41 Hidewood Creek (nr Estelline) 10 15.3 6.4 24.4 15.7 0 0 FullT42 Peg Munky Run 6 13.4 4.6 24.2 12.4 0 0 FullT46 East Oakwood Lake Outlet 2 14 16.7 5.8 25.3 20.4 ---- ---- ----T47 Unnamed Creek (nr Volga) 14 14.9 2.3 25.2 17.2 ---- ---- ----R1 BSR nr Brookings 17 15.3 4.6 25.8 15.8 0 0 FullR14 BSR at Watertown 17 13.7 3.9 24.5 11.5 0 0 FullR15 BSR at Broadway 17 14.5 2.2 25.7 13.3 0 0 FullR16 BSR 20th Ave 17 14.7 3.1 24.9 15.3 0 0 FullR17 BSR below Watertown 17 14.5 3.4 26.4 12.6 0 0 FullR18 BSR nr Castlewood 17 14.5 4.7 25.0 13.9 0 0 FullR19 BSR nr Estelline 17 14.3 4.7 24.3 15.2 0 0 FullR20 BSR nr Bruce 17 14.8 5.2 24.1 14.7 0 0 Full
Water Temperature C°
NOTE: 32.2 C is standard for those sites with beneficial use (5) and (6)---- denotes no standard or beneficial use assigned

Appendix V
# of Violations Percent Use Site Stream Samples Mean Min Max Median of WQS Violating SupportT34 Lake Pelican Weir 13 18.4 4.8 27.0 22.5 ---- ---- ----T35 Willow Creek (nr Waverly) 14 17.3 4.0 29.0 19.0 ---- ---- ----T36 Willow Creek (nr Watertown) 16 16.5 6.5 25.2 16.0 ---- ---- ----T37 Stray Horse Creek 14 18.9 3.5 32.5 21.0 ---- ---- ----T39 Lake Poinsett Outlet 14 17.4 2.0 29.0 18.5 ---- ---- ----T40 Hidewood Creek (nr Clear Lake) 14 16.4 4.0 25.0 18.5 ---- ---- ----T41 Hidewood Creek (nr Estelline) 9 17.7 9.7 27.0 16.0 ---- ---- ----T42 Peg Munky Run 5 18.5 9.4 29.0 19.7 ---- ---- ----T46 East Oakwood Lake Outlet 2 14 21.0 8.0 36.5 21.1 ---- ---- ----T47 Unnamed Creek (nr Volga) 14 21.4 9.0 35.0 21.0 ---- ---- ----R1 BSR nr Brookings 17 17.6 3.5 31.5 17.0 ---- ---- ----R14 BSR at Watertown 17 16.2 1.0 28.5 14.0 ---- ---- ----R15 BSR at Broadway 17 16.3 1.5 29.0 14.0 ---- ---- ----R16 BSR 20th Ave 17 16.3 0.5 30.0 15.5 ---- ---- ----R17 BSR below Watertown 17 16.8 -0.5 29.1 15.0 ---- ---- ----R18 BSR nr Castlewood 17 16.6 0.5 31.0 15.0 ---- ---- ----R19 BSR nr Estelline 17 16.0 2.0 30.5 16.0 ---- ---- ----R20 BSR nr Bruce 17 16.8 3.0 32.3 17.0 ---- ---- -------- denotes no standard or beneficial use assigned
Air Temperature C°
# of Violations Percent Use Site Stream Samples Mean Min Max Median of WQS Violating SupportT34 Lake Pelican Weir 13 552 274 775 571 ---- ---- ----T35 Willow Creek (nr Waverly) 14 430 206 582 464 ---- ---- ----T36 Willow Creek (nr Watertown) 17 569 118 849 645 ---- ---- ----T37 Stray Horse Creek 14 706 205 979 729 ---- ---- ----T39 Lake Poinsett Outlet 14 901 260 1302 898 ---- ---- ----T40 Hidewood Creek (nr Clear Lake) 14 1175 402 2132 1169 ---- ---- ----T41 Hidewood Creek (nr Estelline) 10 622 330 800 651 ---- ---- ----T42 Peg Munky Run 6 565 264 785 579 ---- ---- ----T46 East Oakwood Lake Outlet 2 14 1020 446 1388 1056 ---- ---- ----T47 Unnamed Creek (nr Volga) 14 759 379 1194 783 ---- ---- ----R1 BSR nr Brookings 17 684 209 1136 708 ---- ---- ----R14 BSR at Watertown 17 481 111 778 511 ---- ---- ----R15 BSR at Broadway 17 523 89 822 548 ---- ---- ----R16 BSR 20th Ave 17 627 97 1029 580 ---- ---- ----R17 BSR below Watertown 17 596 112 970 610 ---- ---- ----R18 BSR nr Castlewood 17 608 172 916 620 ---- ---- ----R19 BSR nr Estelline 17 622 149 981 638 ---- ---- ----R20 BSR nr Bruce 17 607 150 1129 597 ---- ---- ----
Conductivity µS/cm
---- denotes no standard or beneficial use assigned
# of Violations Percent Use Site Stream Samples Mean Min Max Median of WQS Violating SupportT34 Lake Pelican Weir 13 15.9 3.9 45.0 15.9 ---- ---- ----T35 Willow Creek (nr Waverly) 14 19.6 2.3 100.0 8.9 ---- ---- ----T36 Willow Creek (nr Watertown) 17 29.5 1.6 280.0 9.0 ---- ---- ----T37 Stray Horse Creek 14 24.6 2.8 110.0 15.4 ---- ---- ----T39 Lake Poinsett Outlet 14 21.9 4.8 80.0 14.6 ---- ---- ----T40 Hidewood Creek (nr Clear Lake) 14 15.6 3.4 85.0 8.1 ---- ---- ----T41 Hidewood Creek (nr Estelline) 10 19.4 5.0 116.0 7.2 ---- ---- ----T42 Peg Munky Run 6 8.3 1.6 23.1 6.5 ---- ---- ----T46 East Oakwood Lake Outlet 2 14 25.2 3.1 65.1 24.7 ---- ---- ----T47 Unnamed Creek (nr Volga) 14 14.1 0.0 80.9 6.8 ---- ---- ----R1 BSR nr Brookings 17 35.0 4.3 67.1 37.0 ---- ---- ----R14 BSR at Watertown 17 21.9 5.4 65.0 16.7 ---- ---- ----R15 BSR at Broadway 17 15.2 1.8 40.0 13.4 ---- ---- ----R16 BSR 20th Ave 17 16.0 2.6 70.0 10.0 ---- ---- ----R17 BSR below Watertown 17 23.5 5.8 110.0 15.0 ---- ---- ----R18 BSR nr Castlewood 17 42.1 2.4 340.0 19.1 ---- ---- ----R19 BSR nr Estelline 17 46.8 3.7 220.0 23.7 ---- ---- ----R20 BSR nr Bruce 17 40.8 3.3 220.0 35.0 ---- ---- -------- denotes no standard or beneficial use assigned
NTU

Appendix V
# of Violations Percent Use Site Stream Samples Mean Min Max Median of WQS Violating SupportT34 Lake Pelican Weir 12 8.2 7.7 8.7 8.3 ---- ---- ----T35 Willow Creek (nr Waverly) 13 8.2 7.4 8.7 8.3 0 0 FullT36 Willow Creek (nr Watertown) 15 8.1 7.7 8.4 8.1 0 0 FullT37 Stray Horse Creek 13 8.2 7.7 8.5 8.3 0 0 FullT39 Lake Poinsett Outlet 13 8.3 7.6 8.7 8.4 ---- ---- ----T40 Hidewood Creek (nr Clear Lake) 13 7.8 7.4 8.2 7.9 0 0 FullT41 Hidewood Creek (nr Estelline) 10 8.2 7.8 8.5 8.2 0 0 FullT42 Peg Munky Run 6 8.1 7.8 8.3 8.1 0 0 FullT46 East Oakwood Lake Outlet 2 13 7.8 7.4 8.2 7.9 0 0 FullT47 Unnamed Creek (nr Volga) 13 7.9 7.6 8.5 7.9 0 0 FullR1 BSR nr Brookings 16 8.3 7.4 9.0 8.4 0 0 FullR14 BSR at Watertown 16 8.2 7.8 8.6 8.2 0 0 FullR15 BSR at Broadway 16 8.1 7.7 8.5 8.0 0 0 FullR16 BSR 20th Ave 16 8.0 7.5 8.3 8.0 0 0 FullR17 BSR below Watertown 15 8.2 7.4 8.6 8.3 0 0 FullR18 BSR nr Castlewood 16 8.2 7.3 8.8 8.3 0 0 FullR19 BSR nr Estelline 16 8.3 7.7 8.9 8.3 0 0 FullR20 BSR nr Bruce 16 8.3 7.7 8.8 8.4 0 0 Full
Standard of 6.0-9.5 for tributary sites with beneficial use of only 9---- denotes no standard or beneficial use assigned
pH units
Most restrictive standard is 6.5-9.0 for River sites with beneficial use 1, 5, and 9Most restrictive standard is 6.0-9.0 for tributary sites with beneficial use 6 and 9
# of Violations Percent Use Site Stream Samples Mean Min Max Median of WQS Violating SupportT34 Lake Pelican Weir 13 0.3 0.2 0.4 0.3 ---- ---- ----T35 Willow Creek (nr Waverly) 14 0.3 0.1 0.3 0.3 ---- ---- ----T36 Willow Creek (nr Watertown) 17 0.4 0.1 0.5 0.4 ---- ---- ----T37 Stray Horse Creek 14 0.4 0.1 0.6 0.5 ---- ---- ----T39 Lake Poinsett Outlet 14 0.5 0.1 0.7 0.6 ---- ---- ----T40 Hidewood Creek (nr Clear Lake) 14 0.7 0.2 1.6 0.6 ---- ---- ----T41 Hidewood Creek (nr Estelline) 10 0.4 0.2 0.5 0.4 ---- ---- ----T42 Peg Munky Run 6 0.4 0.2 0.4 0.4 ---- ---- ----T46 East Oakwood Lake Outlet 2 14 0.6 0.3 0.8 0.7 ---- ---- ----T47 Unnamed Creek (nr Volga) 14 0.5 0.3 0.6 0.5 ---- ---- ----R1 BSR nr Brookings 17 0.4 0.2 0.6 0.4 ---- ---- ----R14 BSR at Watertown 17 0.3 0.1 0.4 0.3 ---- ---- ----R15 BSR at Broadway 17 0.3 0.1 0.4 0.3 ---- ---- ----R16 BSR 20th Ave 17 0.4 0.1 0.6 0.4 ---- ---- ----R17 BSR below Watertown 17 0.4 0.1 0.5 0.4 ---- ---- ----R18 BSR nr Castlewood 17 0.4 0.1 0.5 0.4 ---- ---- ----R19 BSR nr Estelline 17 0.4 0.1 0.6 0.4 ---- ---- ----R20 BSR nr Bruce 17 0.4 0.1 0.6 0.4 ---- ---- ----
Salinity ppt
---- denotes no standard or beneficial use assigned

Appendix V
# of Violations Percent Use Site Stream Samples Mean Min Max Median of WQS Violating SupportT34 Lake Pelican Weir 13 10.4 4.5 19.5 9.3 ----** ---- ----T35 Willow Creek (nr Waverly) 14 9.5 3.2 17.6 9.7 4 29 NotT36 Willow Creek (nr Watertown) 17 8.7 3.9 19.3 8.1 2 12 FullT37 Stray Horse Creek 14 9.5 5.1 13.8 9.4 0 0 FullT39 Lake Poinsett Outlet 14 8.4 2.5 16.5 7.6 ----** ---- ----T40 Hidewood Creek (nr Clear Lake) 14 8.0 1.4 17.6 7.4 6 43 NotT41 Hidewood Creek (nr Estelline) 10 12.6 6.2 17.4 14.2 0 0 FullT42 Peg Munky Run 6 12.4 5.1 19.1 12.9 0 0 FullT46 East Oakwood Lake Outlet 2 13 9.5 3.0 17.4 9.9 ----** ---- ----T47 Unnamed Creek (nr Volga) 13 9.6 1.4 20.0 8.7 ----** ---- ----R1 BSR nr Brookings 35 10.3 4.3 15.8 9.7 1 3 FullR14 BSR at Watertown 36 9.4 4.6 16.4 8.8 1 3 FullR15 BSR at Broadway 17 9.6 5.3 17.3 7.6 0 0 FullR16 BSR 20th Ave 17 9.5 4.9 15.8 9.2 1 6 FullR17 BSR below Watertown 36 10.2 3.6 19.3 10.1 1 3 FullR18 BSR nr Castlewood 17 10.9 4.5 20.0 10.2 1 6 FullR19 BSR nr Estelline 30 10.4 1.4 18.9 9.5 2 7 FullR20 BSR nr Bruce 36 10.8 1.4 18.9 10.1 2 6 Full
Dissolved Oxygen mg/L
Most restrictive standard for DO is ≥ 5.0 mg/L for beneficial uses 5, 7, and 8----** denotes no standard or beneficial use assigned for DO, but there are violations if standard were applied---- denotes no standard or beneficial use assigned
# of Violations Percent Use Site Stream Samples Mean Min Max Median of WQS Violating SupportT34 Lake Pelican Weir 13 0.155 0.059 0.355 0.098 ---- ---- ----T35 Willow Creek (nr Waverly) 14 0.206 0.070 0.583 0.147 ---- ---- ----T36 Willow Creek (nr Watertown) 17 0.246 0.018 0.808 0.203 ---- ---- ----T37 Stray Horse Creek 14 0.203 0.041 0.538 0.140 ---- ---- ----T39 Lake Poinsett Outlet 14 0.269 0.124 1.102 0.180 ---- ---- ----T40 Hidewood Creek (nr Clear Lake) 14 1.072 0.054 7.850 0.401 ---- ---- ----T41 Hidewood Creek (nr Estelline) 10 0.108 0.027 0.328 0.070 ---- ---- ----T42 Peg Munky Run 6 0.090 0.034 0.182 0.059 ---- ---- ----T46 East Oakwood Lake Outlet 2 14 0.190 0.019 0.326 0.217 ---- ---- ----T47 Unnamed Creek (nr Volga) 14 0.354 nd 1.956 0.098 ---- ---- ----R1 BSR nr Brookings 17 0.169 0.0290 0.585 0.100 ---- ---- ----R14 BSR at Watertown 17 0.149 0.0360 0.339 0.119 ---- ---- ----R15 BSR at Broadway 17 0.222 0.0510 0.398 0.214 ---- ---- ----R16 BSR 20th Ave 17 0.211 0.034 0.440 0.208 ---- ---- ----R17 BSR below Watertown 17 0.245 0.046 0.550 0.203 ---- ---- ----R18 BSR nr Castlewood 17 0.264 0.049 0.798 0.178 ---- ---- ----R19 BSR nr Estelline 17 0.224 0.046 0.595 0.144 ---- ---- ----R20 BSR nr Bruce 17 0.199 0.022 0.600 0.113 ---- ---- ----
Ammonia mg/L
---- denotes no standard or beneficial use assigned
# of Violations Percent Use Site Stream Samples Mean Min Max Median of WQS Violating SupportT34 Lake Pelican Weir 13 0.065 0.020 0.137 0.036 ---- ---- ----T35 Willow Creek (nr Waverly) 14 0.183 0.033 1.341 0.095 ---- ---- ----T36 Willow Creek (nr Watertown) 17 0.201 0.019 0.773 0.128 ---- ---- ----T37 Stray Horse Creek 14 0.123 0.022 0.435 0.058 ---- ---- ----T39 Lake Poinsett Outlet 14 0.226 0.013 0.691 0.198 ---- ---- ----T40 Hidewood Creek (nr Clear Lake) 14 0.207 0.047 0.790 0.136 ---- ---- ----T41 Hidewood Creek (nr Estelline) 10 0.057 0.009 0.175 0.038 ---- ---- ----T42 Peg Munky Run 6 0.131 0.048 0.410 0.064 ---- ---- ----T46 East Oakwood Lake Outlet 2 14 0.132 0.022 0.413 0.095 ---- ---- ----T47 Unnamed Creek (nr Volga) 14 0.587 0.185 1.493 0.591 ---- ---- ----R1 BSR nr Brookings 17 0.162 0.033 0.411 0.130 ---- ---- ----R14 BSR at Watertown 17 0.104 0.021 0.349 0.080 ---- ---- ----R15 BSR at Broadway 17 0.107 0.039 0.282 0.091 ---- ---- ----R16 BSR 20th Ave 17 1.103 0.111 2.797 0.517 ---- ---- ----R17 BSR below Watertown 17 0.604 0.158 1.342 0.360 ---- ---- ----R18 BSR nr Castlewood 17 0.460 0.183 0.883 0.381 ---- ---- ----R19 BSR nr Estelline 17 0.210 0.056 0.405 0.208 ---- ---- ----R20 BSR nr Bruce 17 0.157 0.012 0.332 0.152 ---- ---- ----
Total Dissolved Phosphorous mg/L
---- denotes no standard or beneficial use assigned

Appendix V
# of Violations Percent Use Site Stream Samples Mean Min Max Median of WQS Violating SupportT34 Lake Pelican Weir 13 0.131 0.038 0.242 0.122 ---- ---- ----T35 Willow Creek (nr Waverly) 14 0.360 0.079 1.679 0.158 ---- ---- ----T36 Willow Creek (nr Watertown) 17 0.306 0.045 1.247 0.202 ---- ---- ----T37 Stray Horse Creek 14 0.278 0.066 0.815 0.204 ---- ---- ----T39 Lake Poinsett Outlet 14 0.373 0.187 0.987 0.271 ---- ---- ----T40 Hidewood Creek (nr Clear Lake) 14 0.388 0.101 1.134 0.232 ---- ---- ----T41 Hidewood Creek (nr Estelline) 10 0.131 0.047 0.417 0.093 ---- ---- ----T42 Peg Munky Run 6 0.167 0.054 0.515 0.103 ---- ---- ----T46 East Oakwood Lake Outlet 2 14 0.261 0.066 0.596 0.227 ---- ---- ----T47 Unnamed Creek (nr Volga) 14 0.675 0.189 2.016 0.618 ---- ---- ----R1 BSR nr Brookings 17 0.359 0.141 0.578 0.390 ---- ---- ----R14 BSR at Watertown 17 0.201 0.047 0.430 0.185 ---- ---- ----R15 BSR at Broadway 17 0.189 0.069 0.376 0.181 ---- ---- ----R16 BSR 20th Ave 17 1.236 0.145 2.956 0.608 ---- ---- ----R17 BSR below Watertown 17 0.746 0.203 1.511 0.550 ---- ---- ----R18 BSR nr Castlewood 17 0.670 0.230 1.502 0.470 ---- ---- ----R19 BSR nr Estelline 17 0.399 0.143 0.924 0.385 ---- ---- ----R20 BSR nr Bruce 17 0.336 0.146 0.543 0.353 ---- ---- ----
Total Phosphorous mg/L
---- denotes no standard or beneficial use assigned
# of Violations Percent Use Site Stream Samples Mean Min Max Median of WQS Violating SupportT34 Lake Pelican Weir 13 1.128 0.506 1.787 1.149 ---- ---- ----T35 Willow Creek (nr Waverly) 14 1.660 1.033 3.092 1.382 ---- ---- ----T36 Willow Creek (nr Watertown) 17 1.563 0.780 3.275 1.291 ---- ---- ----T37 Stray Horse Creek 14 1.911 0.924 2.817 1.949 ---- ---- ----T39 Lake Poinsett Outlet 14 1.922 1.395 3.182 1.777 ---- ---- ----T40 Hidewood Creek (nr Clear Lake) 14 2.792 1.098 10.946 1.466 ---- ---- ----T41 Hidewood Creek (nr Estelline) 10 1.173 0.636 2.098 1.133 ---- ---- ----T42 Peg Munky Run 6 0.914 0.438 1.799 0.703 ---- ---- ----T46 East Oakwood Lake Outlet 2 14 1.777 1.001 2.405 1.942 ---- ---- ----T47 Unnamed Creek (nr Volga) 14 1.809 0.478 8.993 0.876 ---- ---- ----R1 BSR nr Brookings 17 1.661 1.011 2.259 1.677 ---- ---- ----R14 BSR at Watertown 17 1.325 0.558 2.317 1.377 ---- ---- ----R15 BSR at Broadway 17 1.160 0.539 1.639 1.107 ---- ---- ----R16 BSR 20th Ave 17 1.674 0.982 2.942 1.535 ---- ---- ----R17 BSR below Watertown 17 1.657 1.098 2.633 1.635 ---- ---- ----R18 BSR nr Castlewood 17 1.884 1.196 4.108 1.689 ---- ---- ----R19 BSR nr Estelline 17 1.880 0.961 3.410 1.691 ---- ---- ----R20 BSR nr Bruce 17 1.742 0.992 3.402 1.615 ---- ---- ----
Total Kjeldahl Nitrogen mg/L
---- denotes no standard or beneficial use assigned
# of Violations Percent Use Site Stream Samples Mean Min Max Median of WQS Violating SupportT34 Lake Pelican Weir 13 0.972 0.430 1.710 0.982 ---- ---- ----T35 Willow Creek (nr Waverly) 14 1.453 0.883 2.726 1.233 ---- ---- ----T36 Willow Creek (nr Watertown) 17 1.316 0.658 2.705 1.166 ---- ---- ----T37 Stray Horse Creek 14 1.708 0.883 2.728 1.714 ---- ---- ----T39 Lake Poinsett Outlet 14 1.653 1.173 3.014 1.552 ---- ---- ----T40 Hidewood Creek (nr Clear Lake) 14 1.720 0.740 3.612 1.194 ---- ---- ----T41 Hidewood Creek (nr Estelline) 10 1.065 0.582 1.914 0.991 ---- ---- ----T42 Peg Munky Run 6 0.824 0.404 1.617 0.662 ---- ---- ----T46 East Oakwood Lake Outlet 2 14 1.588 0.982 2.188 1.701 ---- ---- ----T47 Unnamed Creek (nr Volga) 14 1.455 0.478 7.037 0.781 ---- ---- ----R1 BSR nr Brookings 17 1.492 0.945 2.056 1.440 ---- ---- ----R14 BSR at Watertown 17 1.177 0.522 1.978 1.212 ---- ---- ----R15 BSR at Broadway 17 0.938 0.447 1.338 0.957 ---- ---- ----R16 BSR 20th Ave 17 1.463 0.828 2.502 1.358 ---- ---- ----R17 BSR below Watertown 17 1.412 0.903 2.295 1.358 ---- ---- ----R18 BSR nr Castlewood 17 1.620 1.127 3.310 1.352 ---- ---- ----R19 BSR nr Estelline 17 1.656 0.915 3.352 1.606 ---- ---- ----R20 BSR nr Bruce 17 1.544 0.932 2.902 1.515 ---- ---- ----
Organic Nitrogen mg/L
---- denotes no standard or beneficial use assigned

Appendix V
# of Violations Percent Use Site Stream Samples Mean Min Max Median of WQS Violating SupportT34 Lake Pelican Weir 13 0.253 0.038 0.791 0.232 0 0 FullT35 Willow Creek (nr Waverly) 14 0.130 0.029 0.900 0.064 0 0 FullT36 Willow Creek (nr Watertown) 17 0.452 0.038 2.022 0.335 0 0 FullT37 Stray Horse Creek 14 0.626 0.039 3.423 0.443 0 0 FullT39 Lake Poinsett Outlet 14 0.108 nd 0.520 0.062 0 0 FullT40 Hidewood Creek (nr Clear Lake) 14 0.485 0.057 3.515 0.105 0 0 FullT41 Hidewood Creek (nr Estelline) 10 0.847 0.090 2.302 0.779 0 0 FullT42 Peg Munky Run 6 0.225 0.028 0.618 0.078 0 0 FullT46 East Oakwood Lake Outlet 2 14 0.216 0.043 0.642 0.090 0 0 FullT47 Unnamed Creek (nr Volga) 14 0.574 0.060 2.306 0.399 0 0 FullR1 BSR nr Brookings 17 0.421 0.034 1.470 0.168 0 0 FullR14 BSR at Watertown 17 0.249 0.063 0.914 0.144 0 0 FullR15 BSR at Broadway 17 0.478 0.066 1.851 0.262 0 0 FullR16 BSR 20th Ave 17 4.600 0.094 11.404 0.972 4 24 FullR17 BSR below Watertown 17 2.452 0.316 6.478 1.214 0 0 FullR18 BSR nr Castlewood 17 1.601 0.036 4.018 1.365 0 0 FullR19 BSR nr Estelline 17 0.690 nd 1.705 0.526 0 0 FullR20 BSR nr Bruce 17 0.610 0.028 1.612 0.440 0 0 Full
Nitrate-Nitrite as Nitrogen mg/L
Most restrictive standard is ≤ 10 for River sites with beneficial use (1) and (9)All tributary sites have a standard of ≤ 88 for beneficial use (9)
# of Violations Percent Use Site Stream Samples Mean Min Max Median of WQS Violating SupportT34 Lake Pelican Weir 13 426 212 524 446 0 0 FullT35 Willow Creek (nr Waverly) 14 380 216 500 384 0 0 FullT36 Willow Creek (nr Watertown) 17 517 188 686 596 0 0 FullT37 Stray Horse Creek 14 636 172 892 674 0 0 FullT39 Lake Poinsett Outlet 14 831 236 1060 912 0 0 FullT40 Hidewood Creek (nr Clear Lake) 14 1112 390 2084 982 0 0 FullT41 Hidewood Creek (nr Estelline) 10 516 308 632 544 0 0 FullT42 Peg Munky Run 6 459 288 528 520 0 0 FullT46 East Oakwood Lake Outlet 2 14 955 476 1340 976 0 0 FullT47 Unnamed Creek (nr Volga) 14 706 440 876 753 0 0 FullR1 BSR nr Brookings 17 587 228 900 580 0 0 FullR14 BSR at Watertown 17 417 112 548 444 0 0 FullR15 BSR at Broadway 17 430 112 584 476 0 0 FullR16 BSR 20th Ave 17 512 132 760 512 0 0 FullR17 BSR below Watertown 17 501 127 676 504 0 0 FullR18 BSR nr Castlewood 17 496 176 680 528 0 0 FullR19 BSR nr Estelline 16 572 180 976 613 0 0 FullR20 BSR nr Bruce 17 584 172 1508 578 0 0 FullMost restrictive standard is 1750 mg/L for River sites with beneficial use (1) All tributary sites have a standard of 4375 mg/L for beneficial use (9)
Total Dissolved Solids mg/L
# of Violations Percent Use Site Stream Samples Mean Min Max Median of WQS Violating SupportT34 Lake Pelican Weir 13 21 6 40 24 ---- ---- FullT35 Willow Creek (nr Waverly) 14 20 2 56 17 0 0 FullT36 Willow Creek (nr Watertown) 17 34 5 202 13 0 0 FullT37 Stray Horse Creek 14 34 6 100 28 0 0 FullT39 Lake Poinsett Outlet 14 39 4 76 42 ---- ---- FullT40 Hidewood Creek (nr Clear Lake) 14 35 2 126 15 0 0 FullT41 Hidewood Creek (nr Estelline) 10 34 6 100 17 0 0 FullT42 Peg Munky Run 6 13 4 28 12 0 0 FullT46 East Oakwood Lake Outlet 2 14 44 4 148 33 0 0 FullT47 Unnamed Creek (nr Volga) 14 15 1 62 7 0 0 FullR1 BSR nr Brookings 36 78 7 190 72 3 8 FullR14 BSR at Watertown 36 34 4 87 29 0 0 FullR15 BSR at Broadway 17 27 8 53 24 0 0 FullR16 BSR 20th Ave 17 26 7 59 22 0 0 FullR17 BSR below Watertown 36 40 1 141 38 0 0 FullR18 BSR nr Castlewood 17 62 5 314 46 1 6 FullR19 BSR nr Estelline 35 57 1 188 44 1 3 FullR20 BSR nr Bruce 17 77 6 328 64 1 6 Full
----denotes no standard or beneficial use assigned
Total Suspended Solids mg/L
Note for beneficial use (5) standard is 158 mg/L; for beneficial use (6) standard is 263 mg/L

Appendix V
# of Violations Percent Use Site Stream Samples Mean Min Max Median of WQS Violating SupportT34 Lake Pelican Weir 13 447 240 544 471 ---- ---- ----T35 Willow Creek (nr Waverly) 14 400 222 513 415 ---- ---- ----T36 Willow Creek (nr Watertown) 17 551 333 699 602 ---- ---- ----T37 Stray Horse Creek 14 670 272 924 702 ---- ---- ----T39 Lake Poinsett Outlet 14 870 312 1080 933 ---- ---- ----T40 Hidewood Creek (nr Clear Lake) 14 1146 394 2113 1046 ---- ---- ----T41 Hidewood Creek (nr Estelline) 10 550 362 732 556 ---- ---- ----T42 Peg Munky Run 6 472 294 538 533 ---- ---- ----T46 East Oakwood Lake Outlet 2 14 999 572 1370 997 ---- ---- ----T47 Unnamed Creek (nr Volga) 14 721 459 900 758 ---- ---- ----R1 BSR nr Brookings 17 669 284 1007 680 ---- ---- ----R14 BSR at Watertown 17 452 122 598 480 ---- ---- ----R15 BSR at Broadway 17 456 159 604 497 ---- ---- ----R16 BSR 20th Ave 17 539 166 771 535 ---- ---- ----R17 BSR below Watertown 17 545 201 728 560 ---- ---- ----R18 BSR nr Castlewood 17 558 196 800 581 ---- ---- ----R19 BSR nr Estelline 17 643 255 1024 653 ---- ---- ----R20 BSR nr Bruce 17 661 263 1587 632 ---- ---- ----
Total Solids mg/L
---- denotes no standard or beneficial use assigned
# of Violations Percent Use Site Stream Samples Mean Min Max Median of WQS Violating SupportT34 Lake Pelican Weir 13 657 311 806 692 0 0 FullT35 Willow Creek (nr Waverly) 14 537 265 664 545 0 0 FullT36 Willow Creek (nr Watertown) 17 746 323 939 817 0 0 FullT37 Stray Horse Creek 14 865 234 1150 941 0 0 FullT39 Lake Poinsett Outlet 14 1079 285 1319 1183 0 0 FullT40 Hidewood Creek (nr Clear Lake) 14 1510 560 3068 1208 0 0 FullT41 Hidewood Creek (nr Estelline) 9 767 425 927 823 0 0 FullT42 Peg Munky Run 6 724 435 904 817 0 0 FullT46 East Oakwood Lake Outlet 2 14 1216 660 1607 1281 0 0 FullT47 Unnamed Creek (nr Volga) 14 938 594 1189 954 0 0 FullR1 BSR nr Brookings 17 827 341 1175 814 0 0 FullR14 BSR at Watertown 17 594 185 803 664 0 0 FullR15 BSR at Broadway 17 641 159 886 707 0 0 FullR16 BSR 20th Ave 17 757 168 1122 762 0 0 FullR17 BSR below Watertown 17 730 191 1046 750 0 0 FullR18 BSR nr Castlewood 17 749 220 1026 815 0 0 FullR19 BSR nr Estelline 17 775 244 1152 869 0 0 FullR20 BSR nr Bruce 17 743 243 1163 785 0 0 Full
Specific Conductivity µS/cm
NOTE: For beneficial uses of (9) and (10) the more strict standard of 4375 umhos/cm is applied ** In addition to EDWDD water quality samples, SD DENR ambient water quality monitoring data was also used to assess fecal coliform bacteria, total suspended solids, and dissolved oxygen

Appendix V
Appendix V. Flow Duration Intervals
and Reductions by Site
V-1

Appendix V
0.01
0.1
1
10
100
1000
10000
100000
1000000
0 10 20 30 40 50 60 70 80 90
Flow Duration Interval (%)
Feca
l Col
ifor
m B
acte
ria
(bill
ions
col
onie
s/da
y)
Target
Non-ExceedenceExceedence
Rain Event
90th
Median
R14 - Big Sioux River at Watertown, SD
2001-2002 & 2004 (May-Sep) Monitoring Data
DryConditions
LowFlows
HighFlows
Mid-rangeFlows
MoistConditions
0.01
0.1
1
10
100
1000
10000
100000
1000000
0 10 20 30 40 50 60 70 80
Flow Duration Interval (%)
Feca
l Col
ifor
m B
acte
ria
(bill
ions
col
onie
s/da
y)
R15 - Big Sioux River at Broadway
2001-2002 & 2004 (May-Sep) Monitoring Da
DryConditions
HighFlows
Mid-rangeFlows
MoistConditions
R15 - 2000 cfu/100mL
MedianHigh Flows
(0-10)Moist
(10-40)Mid-Range (40-60) (6
Target 18867 3943 986
Site Value 18876 1492 198
0 0 0
9 0 0Note: units in billions of colonies per day
% Reduction
% Reduction with MOS
R14 - 2000 cfu/100mL
MedianHigh Flows
(0-10)Moist
(10-40)Mid-Range (40-60)
Dry (60-90)
Low Flows (90-100)
Target 9935 1419 196 39 5
Site Value 6680 144 154 18 2
0 0 0 0 0
0 0 0 0 0Note: units in billions of colonies per day
% Reduction
% Reduction with MOS
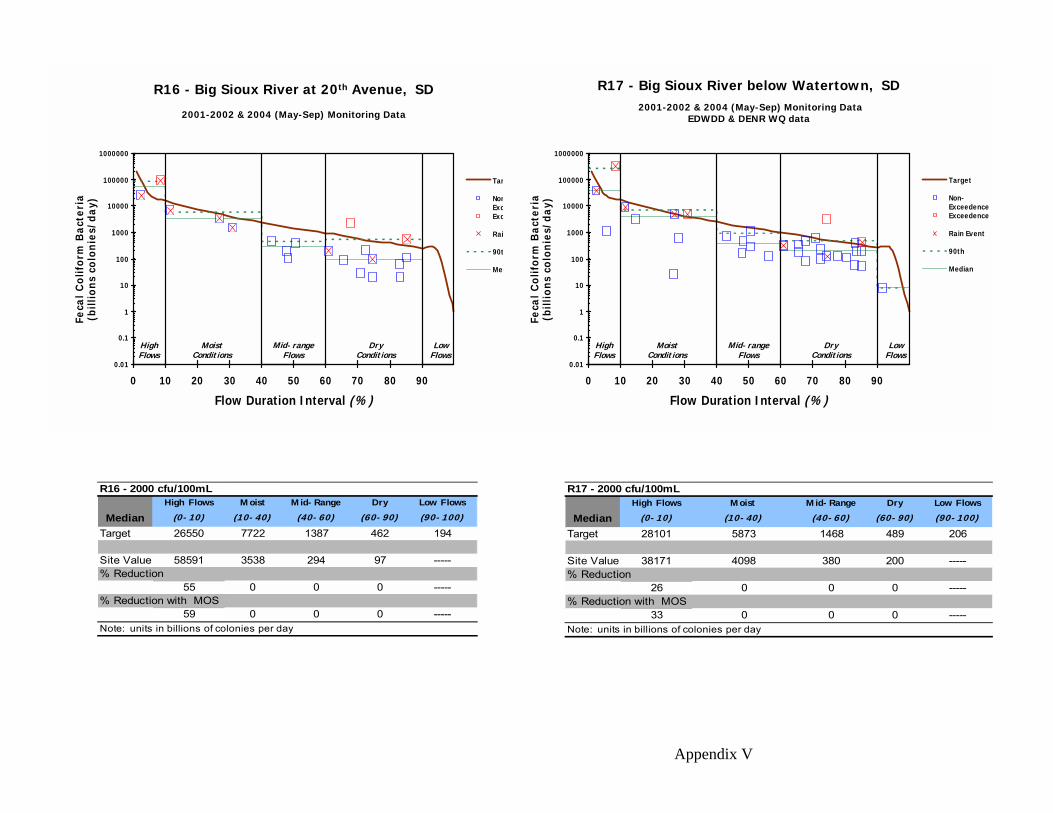
Appendix V
0.01
0.1
1
10
100
1000
10000
100000
1000000
0 10 20 30 40 50 60 70 80 90
Flow Duration Interval (%)
Feca
l Col
ifor
m B
acte
ria
(bill
ions
col
onie
s/da
y)
Target
Non-ExceedenceExceedence
Rain Event
90th
Median
R16 - Big Sioux River at 20th Avenue, SD
2001-2002 & 2004 (May-Sep) Monitoring Data
DryConditions
LowFlows
HighFlows
Mid-rangeFlows
MoistConditions
0.01
0.1
1
10
100
1000
10000
100000
1000000
0 10 20 30 40 50 60 70 80 90
Flow Duration Interval (%)
Feca
l Col
ifor
m B
acte
ria
(bill
ions
col
onie
s/da
y)
Target
Non-ExceedenceExceedence
Rain Event
90th
Median
R17 - Big Sioux River below Watertown, SD 2001-2002 & 2004 (May-Sep) Monitoring Data
EDWDD & DENR WQ data
DryConditions
LowFlows
HighFlows
Mid-rangeFlows
MoistConditions
R17 - 2000 cfu/100mL
MedianHigh Flows
(0-10)Moist
(10-40)Mid-Range (40-60)
Dry (60-90)
Low Flows (90-100)
Target 28101 5873 1468 489 206
Site Value 38171 4098 380 200 -----
26 0 0 0 -----
33 0 0 0 -----
% Reduction
% Reduction with MOS
Note: units in billions of colonies per day
R16 - 2000 cfu/100mL
MedianHigh Flows
(0-10)Moist
(10-40)Mid-Range (40-60)
Dry (60-90)
Low Flows (90-100)
Target 26550 7722 1387 462 194
Site Value 58591 3538 294 97 -----
55 0 0 0 -----
59 0 0 0 -----
% Reduction
% Reduction with MOS
Note: units in billions of colonies per day

Appendix V
0.01
0.1
1
10
100
1000
10000
100000
1000000
0 10 20 30 40 50 60 70 80 90
Flow Duration Interval (%)
Feca
l Col
ifor
m B
acte
ria
(bill
ions
col
onie
s/da
y)
Target
Non-ExceedenceExceedence
Rain Event
90th
Median
R18 - Big Sioux River near Castlewood, SD
2001-2002 & 2004 (May-Sep) Monitoring Data
DryConditions
LowFlows
HighFlows
Mid-rangeFlows
MoistConditions
0.01
0.1
1
10
100
1000
10000
100000
1000000
0 10 20 30 40 50 60 70 80 90
Flow Duration Interval (%)
Feca
l Col
ifor
m B
acte
ria
(bill
ions
col
onie
s/da
y)
Target
Non-ExceedenceExceedence
Rain Event
90th
Median
R19 - Big Sioux River near Estelline, SD
2001-2002 & 2004 (May-Sep) Monitoring Data
DryConditions
LowFlows
HighFlows
Mid-rangeFlows
MoistConditions
R19 - 2000 cfu/100mL
MedianHigh Flows
(0-10)Moist
(10-40)Mid-Range (40-60)
Dry (60-90)
Low Flows (90-100)
Target 28106 5132 1432 459 72
Site Value 61065 659 87 75 -----
54 0 0 0 -----
58 0 0 0 -----Note: units in billions of colonies per day
% Reduction
% Reduction with MOS
R18 - 2000 cfu/100mL
MedianHigh Flows
(0-10)Moist
(10-40)Mid-Range (40-60)
Dry (60-90)
Low Flows (90-100)
Target 23051 4209 1175 377 59
Site Value 19556 2765 1206 407 -----
0 0 3 7 -----
0 0 11 16 -----
% Reduction
% Reduction with MOS
Note: units in billions of colonies per day

Appendix V
0.01
0.1
1
10
100
1000
10000
100000
1000000
0 10 20 30 40 50 60 70 80 90
Flow Duration Interval (%)
Feca
l Col
ifor
m B
acte
ria
(bill
ions
col
onie
s/da
y)
Target
Non-ExceedenceExceedence
Rain Event
90th
Median
R20 - Big Sioux River near Bruce, SD
2001-2002 & 2004 (May-Sep) Monitoring Data
DryConditions
LowFlows
HighFlows
Mid-rangeFlows
MoistConditions
R01 - 2000 cfu/100mL
MedianHigh Flows
(0-10)Moist
(10-40)Mid-Range (40-60)
Dry (60-90)
Low Flows (90-100)
Target 75696 19285 6128 1802 320
Site Value 26310 1766 1471 162 -----
0 0 0 0 -----
0 0 0 0 -----Note: units in billions of colonies per day
% Reduction
% Reduction with MOS
0.01
0.1
1
10
100
1000
10000
100000
1000000
0 10 20 30 40 50 60 70 80 90
Flow Duration Interval (%)
Feca
l Col
ifor
m B
acte
ria
(bill
ions
col
onie
s/da
y)
Target
Non-ExceedenceExceedence
Rain Event
90th
Median
R01 – Big Sioux River Near Brookings 2001-2002 & 2004 (May-Sep) EDWDD & DENR Monitoring Data
DryConditions
LowFlows
HighFlows
Mid-rangeFlows
MoistConditions
R20 - 2000 cfu/100mL
MedianHigh Flows
(0-10)Moist
(10-40)Mid-Range (40-60)
Dry (60-90)
Low Flows (90-100)
Target 46885 6754 1762 587 24
Site Value 66803 786 646 92 -----
30 0 0 0 -----
36 0 0 0 -----Note: units in billions of colonies per day
% Reduction
% Reduction with MOS

Appendix V
0.01
0.1
1
10
100
1000
10000
100000
1000000
0 10 20 30 40 50 60 70 80 90
Flow Duration Interval (%)
Feca
l Col
ifor
m B
acte
ria
(bill
ions
col
onie
s/da
y)
Target
Non-ExceedenceExceedence
Rain Event
90th
Median
T34* – Lake Pelican Weir (Flow out of Lake)
* numeric standard does not apply
DryConditions
LowFlows
HighFlows
Mid-rangeFlows
MoistConditions
0.01
0.1
1
10
100
1000
10000
100000
1000000
0 10 20 30 40 50 60 70 80 90
Flow Duration Interval (%)
Feca
l Col
ifor
m B
acte
ria
(bill
ions
col
onie
s/da
y)
Target
Non-ExceedenceExceedence
Rain Event
90th
Median
T34* – Lake Pelican Weir (Flow into Lake)
* numeric standard does not apply
DryConditions
LowFlows
HighFlows
Mid-rangeFlows
MoistConditions

Appendix V
0.01
0.1
1
10
100
1000
10000
100000
1000000
0 10 20 30 40 50 60 70 80 90
Flow Duration Interval (%)
Feca
l Col
ifor
m B
acte
ria
(bill
ions
col
onie
s/da
y)
Target
Non-ExceedenceExceedence
Rain Event
90th
Median
T35 – Willow Creek near Waverly, SD
DryConditions
LowFlows
HighFlows
Mid-rangeFlows
MoistConditions
0.01
0.1
1
10
100
1000
10000
100000
1000000
0 10 20 30 40 50 60 70 80 90
Flow Duration Interval (%)
Feca
l Col
ifor
m B
acte
ria
(bill
ions
col
onie
s/da
y)
Target
Non-ExceedenceExceedence
Rain Event
90th
Median
T36 – Willow Creek near Watertown, SD
DryConditions
LowFlows
HighFlows
Mid-rangeFlows
MoistConditions
T35 - 2000 cfu/100mL
MedianHigh Flows
(0-10)Moist
(10-40)Mid-Range (40-60)
Dry (60-90)
Low Flows (90-100)
Target 372 161 54 25 21
Site Value 41 16 88 495 11
0 0 39 95 0
0 0 44 95 0Note: units in billions of colonies per day
% Reduction
% Reduction with MOS
T36 - 2000 cfu/100mL
MedianHigh Flows
(0-10)Moist
(10-40)Mid-Range (40-60)
Dry (60-90)
Low Flows (90-100)
Target 5530 587 103 17 2
Site Value 22317 175 403 10 -----
75 0 74 0 -----
77 0 77 0 -----Note: units in billions of colonies per day
% Reduction
% Reduction with MOS

Appendix V
0.01
0.1
1
10
100
1000
10000
100000
1000000
10000000
0 10 20 30 40 50 60 70 80 90 100
Flow Duration Interval (%)
Feca
l Col
ifor
m B
acte
ria
(bill
ions
col
onie
s/da
y)
Target
Non-ExceedneceExceedence
Rain Event
90th
Median
T37 – Stray Horse Creek
LowFlows
HighFlows
Mid-range Flowsto
Dry ConditionsMoist
Conditions 0.01
0.1
1
10
100
1000
10000
100000
1000000
0 10 20 30 40 50 60 70 80 90
Flow Duration Interval (%)
Feca
l Col
ifor
m B
acte
ria
(bill
ions
col
onie
s/da
y)
Target
Non-ExceedenceExceedence
Rain Event
90th
Median
T39* – Lake Poinsett Outlet
* numeric standard does not apply
DryConditions
LowFlows
HighFlows
Mid-rangeFlows
MoistConditions
T37 - 2000 cfu/100mL
MedianHigh Flows
(0-10)Moist
(10-40)
Mid-Range to Dry (40-90)
Low Flows (90-100)
Target 1029 167 71 1
Site Value 70407 ---- 4 -----% Reduction
99 0 0 -----% Reduction with MOS
99 0 0 -----Note: units in billions of colonies per day
T39 - 2000 cfu/100mL
MedianHigh Flows
(0-10)Moist
(10-40)Mid-Range (40-60)
Dry (60-90)
Low Flows (90-100)
Target 26716 19668 9891 2793 977
Site Value ---- 3154 193 129 1
----- 0 0 0 -----
----- 0 0 0 -----Note: units in billions of colonies per day
% Reduction
% Reduction with MOS

Appendix V
0.01
0.1
1
10
100
1000
10000
100000
1000000
0 10 20 30 40 50 60 70 80 90
Flow Duration Interval (%)
Feca
l Col
ifor
m B
acte
ria
(bill
ions
col
onie
s/da
y)
Target
Non-ExceedenceExceedence
Rain Event
90th
Median
T40 – Hidewood Creek near Clear Lake
DryConditions
LowFlows
HighFlows
Mid-rangeFlows
MoistConditions
0.01
0.1
1
10
100
1000
10000
100000
1000000
0 10 20 30 40 50 60 70 80 90
Flow Duration Interval (%)
Feca
l Col
ifor
m B
acte
ria
(bill
ions
col
onie
s/da
y)
Target
Non-ExceedenceExceedence
Rain Event
90th
Median
T41 – Hidewood Creek near Estelline
DryConditions
LowFlows
HighFlows
Mid-rangeFlows
MoistConditions
T40 - 2000 cfu/100mL
MedianHigh Flows
(0-10)Moist
(10-40)Mid-Range (40-60)
Dry (60-90)
Low Flows (90-100)
Target 3589 1310 581 101 26
Site Value 858 102 ---- 44 206
0 0 ---- 0 87
0 0 ----- 0 89Note: units in billions of colonies per day
% Reduction
% Reduction with MOS
T41 - 2000 cfu/100mL
MedianHigh Flows
(0-10)Moist
(10-40)Mid-Range (40-60)
Dry (60-90)
Low Flows (90-100)
Target 2024 1547 1187 626 99
Site Value 13588 1842 263 115 1
85 16 0 0 0
86 24 0 0 0Note: units in billions of colonies per day
% Reduction
% Reduction with MOS

Appendix V
0.01
0.1
1
10
100
1000
10000
100000
1000000
0 10 20 30 40 50 60 70 80 90
Flow Duration Interval (%)
Feca
l Col
ifor
m B
acte
ria
(bill
ions
col
onie
s/da
y)
Target
Non-ExceedenceExceedence
Rain Event
90th
Median
T42 – Peg Munky Run
DryConditions
LowFlows
HighFlows
Mid-rangeFlows
MoistConditions
0.01
0.1
1
10
100
1000
10000
100000
1000000
0 10 20 30 40 50 60 70 80 90
Flow Duration Interval (%)
Feca
l Col
ifor
m B
acte
ria
(bill
ions
col
onie
s/da
y)
Target
Non-ExceedenceExceedence
Rain Event
90th
Median
T46* – East Oakwood Lake Outlet 2
* numeric standard does not apply
DryConditions
LowFlows
HighFlows
Mid-rangeFlows
MoistConditions
T42 - 2000 cfu/100mL
MedianHigh Flows
(0-10)Moist
(10-40)Mid-Range (40-60)
Dry (60-90)
Low Flows (90-100)
Target 604 205 85 28 7
Site Value 6736 ---- ---- 91 19
91 ---- ---- 69 63
92 ----- ----- 72 67Note: units in billions of colonies per day
% Reduction
% Reduction with MOS
T46 - 2000 cfu/100mL
MedianHigh Flows
(0-10)Moist
(10-40)Mid-Range (40-60)
Dry (60-90)
Low Flows (90-100)
Target 3339 2114 1063 585 78
Site Value 14168 7763 237 ---- 4
76 73 0 ---- 0
79 75 0 ----- 0Note: units in billions of colonies per day
% Reduction
% Reduction with MOS

Appendix V
0.01
0.1
1
10
100
1000
10000
100000
1000000
0 10 20 30 40 50 60 70 80 90
Flow Duration Interval (%)
Feca
l Col
ifor
m B
acte
ria
(bill
ions
col
onie
s/da
y)
Target
Non-ExceedenceExceedence
Rain Event
90th
Median
T47* – Unnamed Creek near Volga, SD
* numeric standard does not apply
DryConditions
LowFlows
HighFlows
Mid-rangeFlows
MoistConditions
T47 - 2000 cfu/100mL
MedianHigh Flows
(0-10)Moist
(10-40)Mid-Range (40-60)
Dry (60-90)
Low Flows (90-100)
Target 426 62 22 18 15
Site Value 3926 316 9 5 ----
89 80 0 0 ----
90 82 0 0 -----Note: units in billions of colonies per day
% Reduction
% Reduction with MOS

Appendix W
Appendix W. Fecal Coliform Bacteria Exceedences
W-1

Appendix W
Fecal Coliform Bacteria Exceedences
Note: --- denotes beneficial use and/or standard has not been set for this site for this water quality parameter * SDDENR ambient WQ data included (includes May – Sept 2001-2002, 2004 data)
Site Location Start Date
End Date
# of Samples
Min Median Max Violations of WQS
Percent Violating
Numeric Standard
Use Support TMDL
T34 Lake Pelican Weir Jul 01 Sep 02 8 nd 235 8000 --- --- --- --- T35 Willow Creek Jun 01 Sep 02 9 110 1000 930000 3 33 2000 Not T36 Willow Creek May 01 Sep 02 10 230 1500 110000 4 40 2000 Not T37 Stray Horse Creek Jun 01 Sep 02 10 40 1800 320000 4 40 2000 Not T39 Lake Poinsett Outlet Jun 01 Sep 02 11 nd 190 27000 --- --- --- --- T40 Hidewood Creek Jun 01 Sep 02 9 10 670 42000 2 22 2000 Full T41 Hidewood Creek Jun 01 Aug 02 7 100 700 3300 3 43 2000 Not T42 Peg Munky Run Jun 01 Aug 02 4 420 4250 10000 3 75 2000 Not T46 East Oakwood Lake
Outlet Jun 01 Sep 02 11 20 2200 13000 --- --- --- ---
T47 Unnamed Creek Jun 01 Sep 02 10 180 830 25000 --- --- --- --- R01* BSR near Brookings May 01 Sep 04 37 nd 180 >2500 2 5 2000 Full R14* BSR at Watertown May 01 Sep 04 34 nd 795 31000 7 21 2000 Not R15 BSR at Broadway May 01 Sep 04 21 40 370 8000 2 10 2000 Full R16 BSR at 20th Avenue May 01 Sep 04 21 90 520 10000 3 14 2000 Not R17* BSR below Watertown May 01 Sep 04 35 10 620 33000 5 14 2000 Not R18 BSR near Castlewood May 01 Sep 04 21 70 1800 410000 10 48 2000 Not R19* BSR near Estelline May 01 Sep 04 37 nd 300 29000 3 8 2000 Full R20 BSR near Bruce May 01 Sep 04 22 80 425 14000 4 18 2000 Not

Appendix X
Appendix X. Fishes Collected During the NCBSRWAP
X-1

Appendix X
South Dakota Scientific Collector’s Permit Report Form
Monitored Species Only Permittee: East Dakota Water Development District Permit Number: 30 Locations of Topeka shiners collected for the NCBSRWAP in 2001. Stream Date Legal Description Numbers Comments Disposition Peg Munky Run
7/18/01 T113N, R50W, SE1/4 of NW1/4 of Sec 23
29 5 miles west and ½ mile north of Estelline, upstream from road
Released in good condition
Locations of Topeka shiners collected during the NCBSRWAP in 2002. Stream Date Legal Description Numbers Comments Disposition Stray Horse Creek nr Castlewood
6/25/02 T115N, R51W, SE ¼ of Sec 28
311 3 ½ miles east of Castlewood on north side of hwy 22
Released in good condition

Appendix X
South Dakota Scientific Collector’s Permit Report Form Non-Listed Species
Permittee: East Dakota Water Development District Permit Number: 30
Non-listed fish species collected during the North-Central Big Sioux River Watershed Assessment Project in 2001 Location Peg Munky
Run nr Estelline, SD
County Brookings Date Species
18-Jul-01
Black Bullhead 6 Black Crappie 0 Bigmouth Shiner 17 Blacknose Dace 24 Bluntnose Minnow 0 Brassy Minnow 8 Brook Stickleback 1 Channel Catfish 0 Common Shiner 46 Common Carp 0 Creek Chub 38 Emerald Shiner 0 Fathead Minnow 3 Green Sunfish 1 Iowa Darter 2 Johnny Darter 17 Largemouth Bass 0 Northern Pike 0 Orange spotted Sunfish 0 Red Shiner 0 River Carpsucker 0 Sand Shiner 0 Smallmouth Bass 0 Shorthead Redhorse 0 Stonecat 0 Stoneroller 102 Tadpole Madtom 4 Walleye 0 White Sucker 40 Yellow Perch 0

Appendix X
Non-listed fish species collected during the North-Central Big Sioux River Watershed Assessment Project in 2002. Location Stray Horse
Creek nr Castlewood, SD
Hidewood Creek nr Estelline, SD
Willow Creek nr Watertown, SD
County Hamlin Hamlin Codington Date Species
25-Jun-02
02-Jul-02
16-Jul-02
Black Bullhead 27 8 3 Bigmouth Shiner 93 113 238 Blacknose Dace 2 32 0 Brassy Minnow 2 0 0 Brook Stickleback 1 0 0 Bluntnose Minnow 0 0 15 Channel Catfish 0 2 0 Common Shiner 2665 736 262 Creek Chub 60 280 205 Fathead Minnow 5228 53 547 Green Sunfish 7 4 1 Iowa Darter 1 0 0 Johnny Darter 102 83 53 Northern Pike 2 0 0 Orange spotted Sunfish 69 0 0 Red Shiner 38 1 0 Sand Shiner 13 294 95 Shorthead Redhorse 2 0 0 Stonecat 8 0 0 Stoneroller 189 282 0 Tadpole Madtom 4 45 20 White Sucker 75 110 76 Yellow Perch 130 1 0

Appendix Y
Appendix Y. Fish Life History Designations
Y-1

Appendix Y
Life History Designations for Fishes Found During NCBSRWAP Common Name
Scientific name Tr
ophi
c
Tole
ranc
e
Sens
itive
Hab
itat G
uild
(B
or W
C)
Hea
dwat
er
Pion
eer
Sim
ple
Lith
ophi
l
Carps and Minnows
Cyprinidae
Central stoneroller Campostoma anomalum H M B H p Red shiner Cyprinella lutrensis I T G Brassy minnow Hybognathus hankinsoni H M G Common shiner Luxilus cornutus I M WC SL Bigmouth shiner Notropis dorsalis I M B Sand shiner Notropis stramineus I M WC Topeka shiner Notropis topeka I I S WC Bluntnose minnow Pimephales notatus O T G P Fathead minnow Pimephales promelas O T G P Blacknose dace Rhinichthys atratulus I M B H SL Creek chub Semotilus atromaculatus I T WC P Suckers Catostomidae White sucker Catostomus commersoni O T B SL Shorthead redhorse Moxostoma
macrolepidotum I M S B SL
Bullhead/Catfishes Ictaluridae Black bullhead Ameiurus melas I M B P Channel catfish Ictalurus punctatus I M B Stonecat Noturus flavus I I S B Tadpole madtom Noturus gyrinus I M S B Pikes Esocidae Northern pike Esox lucius P M WC Sticklebacks Gasterosteidae Brook stickleback Culaea inconstans I M S WC H Sunfishes Centrarchidae Green sunfish Lepomis cyanellus I T WC P Orangespotted sunfish
Lepomis humilis I M WC
Perches Percidae Iowa darter Etheostoma exile I I S B H Johnny darter Etheostoma nigrum I M B H P Yellow perch Perca flavescens I M WC Trophic Tolerance Habitat Guild H = Herbivore I = Intolerant B = Benthic I = Insectivore M = Moderately Tolerant G = Generalist O = Omnivore T = Tolerant WC = Water Column P = Predator

Appendix Z
Appendix Z. Fishes Candidate Metric Results
Z-1

Appendix Z
SiteIDSpecies
Richness
Native Species
Richness
Native Minnow
Richness
WaterColumn Species Richness
Benthic Species
Richness
Benthic Insectivore Richness
HeadWater Species Richness
% HeadWater
Species
% HeadWater BIOMASS
% Pioneer Species
% PioneeSpecies
BIOMASST36 11 11 7 4 5 4 1 9 1 55 41T37 22 22 9 9 10 8 5 22.7 7 27.3 26.8T41 15 15 8 5 8 6 3 20 16.8 40 37.9T42 15 15 8 5 8 6 5 33.3 19 40 60.3
SiteID
% Intolerant Species
% Intolerant Species
BIOMASS
Sensitive Species
Richness
% Sensitive Species
% Sensitive Species
BIOMASS% Green Sunfish
% Green Sunfish
BIOMASS
% Tolerant Species
% Tolerant Species Biomass
% Insectivorous
minnows
% Insectivorou
minnows BIOMASS
T36 0 0 1 9 2.3 0.07 0.08 54.5 72.5 68.5 63.T37 13.6 2.9 6 27.3 3.1 0.08 0.14 27.3 31.3 95.3 76.T41 0 0 1 6.7 1.3 0.2 0.21 40 31.5 87.6 86.T42 13.3 2.1 4 26.7 3.7 0.3 0.86 33.3 54.4 80 8
SiteID
% Insectivo
res BIOMAS
S%
Predator
% Predator BIOMASS
% Omnivore
% Omnivore BIOMASS
% Herbivore
% Herbivor
e BIOMAS
S% Simple Lithophil
% Simple Lithophil BIOMASS
T36 55 0 0 42.1 46.3 0 0 22.3 49.5T37 64.3 0.02 3.7 58.7 25 2.1 6.5 30.4 60.4T41 73.9 0 0 12.7 7.7 32.5 15.6 43 55.1T42 77.7 0 0 12.7 7.7 32.5 14.5 32.5 33

Appendix AA
Appendix AA Macroinvertebrate Candidate Metric Results
AA-1

Appendix AA
StationID c.f. Abundance Corrected Abundance StationID EPT Abundance StationID Taxa RichnessR01 8.47 283 2,397 R01 224 R01 18R01 11.08 331 3,667 R01 262 R01 25R01 6 298 1,788 R01 153 R01 26R14 4.8 300 1,440 R14 40 R14 27R15 9 274 2,466 R15 16 R15 34R16 1 250 250 R16 2 R16 22R16 1.14 337 384 R16 1 R16 26R16 3.43 312 1,070 R16 0 R16 10R17 3.6 288 1,037 R17 27 R17 29R18 3 325 975 R18 49 R18 34R18 4.8 281 1,349 R18 137 R18 30R18 2.18 274 597 R18 23 R18 29R19 9 327 2,943 R19 35 R19 24R20 21.6 315 6,804 R20 214 R20 17T34 7.2 334 2,405 T34 25 T34 26T35 5.14 309 1,588 T35 3 T35 11T35 2.25 287 646 T35 4 T35 13T35 1 70 70 T35 1 T35 13T35 1 22 22 T35 0 T35 6T35 1 33 33 T35 0 T35 7T36 2.18 277 604 T36 38 T36 26T37 12.46 296 3,688 T37 128 T37 27T37 36 286 10,296 T37 155 T37 11T37 9 340 3,060 T37 146 T37 25T39 6.86 326 2,236 T39 15 T39 19T39 4.8 289 1,387 T39 15 T39 15T39 4 304 1,216 T39 15 T39 17T40 2.12 312 661 T40 0 T40 13T44 3.43 299 1,026 T44 16 T44 15T45 7.2 276 1,987 T45 9 T45 15T46 1.24 280 347 T46 4 T46 16T47 3.27 275 899 T47 77 T47 24T48 6.86 314 2,154 T48 24 T48 15
Metric 1 and 2 Metric 3 Metric 4

Appendix AA
StationID EPT Taxa StationID Ephemeroptera Taxa StationID Trichoptera Taxa StationID Plecoptera TaxaR01 9 R01 3 R01 6 R01 0R01 14 R01 6 R01 8 R01 0R01 12 R01 7 R01 5 R01 0R14 3 R14 2 R14 1 R14 0R15 5 R15 2 R15 3 R15 0R16 2 R16 1 R16 1 R16 0R16 1 R16 1 R16 0 R16 0R16 0 R16 0 R16 0 R16 0R17 5 R17 3 R17 2 R17 0R18 9 R18 4 R18 5 R18 0R18 10 R18 6 R18 4 R18 0R18 6 R18 5 R18 1 R18 0R19 6 R19 3 R19 3 R19 0R20 7 R20 3 R20 4 R20 0T34 6 T34 3 T34 3 T34 0T35 1 T35 1 T35 0 T35 0T35 1 T35 1 T35 0 T35 0T35 1 T35 1 T35 0 T35 0T35 0 T35 0 T35 0 T35 0T35 0 T35 0 T35 0 T35 0T36 4 T36 3 T36 1 T36 0T37 4 T37 2 T37 2 T37 0T37 3 T37 1 T37 2 T37 0T37 5 T37 3 T37 2 T37 0T39 3 T39 3 T39 0 T39 0T39 1 T39 1 T39 0 T39 0T39 1 T39 1 T39 0 T39 0T40 0 T40 0 T40 0 T40 0T44 3 T44 1 T44 2 T44 0T45 2 T45 1 T45 1 T45 0T46 2 T46 1 T46 1 T46 0T47 3 T47 1 T47 2 T47 0T48 3 T48 1 T48 2 T48 0
Metric 5 Metric 6 Metric 7 Metric 8

Appendix AA
StationID Diptera Taxa StationID Chironomidae Taxa StationID EPT Abund Chiro Abund EPT/Chiro Abund.R01 8 R01 7 R01 224 57 3.93R01 7 R01 6 R01 262 62 4.23R01 10 R01 8 R01 153 137 1.12R14 10 R14 9 R14 40 178 0.22R15 11 R15 9 R15 16 96 0.17R16 9 R16 9 R16 2 137 0.01R16 12 R16 11 R16 1 160 0.01R16 4 R16 4 R16 0 164 0.00R17 11 R17 10 R17 27 102 0.26R18 12 R18 10 R18 49 63 0.78R18 10 R18 9 R18 137 60 2.28R18 11 R18 10 R18 23 106 0.22R19 9 R19 8 R19 35 214 0.16R20 5 R20 4 R20 214 86 2.49T34 7 T34 7 T34 25 62 0.40T35 4 T35 4 T35 3 273 0.01T35 5 T35 5 T35 4 216 0.02T35 4 T35 3 T35 1 27 0.04T35 3 T35 2 T35 0 7 0.00T35 2 T35 2 T35 0 6 0.00T36 10 T36 9 T36 38 155 0.25T37 11 T37 10 T37 128 138 0.93T37 7 T37 6 T37 155 129 1.20T37 11 T37 10 T37 146 169 0.86T39 6 T39 5 T39 15 201 0.07T39 4 T39 3 T39 15 104 0.14T39 5 T39 4 T39 15 92 0.16T40 3 T40 3 T40 0 276 0.00T44 5 T44 4 T44 16 262 0.06T45 6 T45 4 T45 9 150 0.06T46 5 T46 4 T46 4 95 0.04T47 9 T47 7 T47 77 32 2.41T48 4 T48 3 T48 24 139 0.17
Metric 9 Metric 10 Metric 11

Appendix AA
StationID % EPT StationID % Ephemeroptera StationID % Plecoptera StationID % TrichopteraR01 79.15 R01 6.01 R01 0.00 R01 73.14R01 79.15 R01 15.11 R01 0.00 R01 64.05R01 51.34 R01 24.83 R01 0.00 R01 26.51R14 13.33 R14 13.00 R14 0.00 R14 0.33R15 5.84 R15 1.09 R15 0.00 R15 4.74R16 0.80 R16 0.40 R16 0.00 R16 0.40R16 0.30 R16 0.30 R16 0.00 R16 0.00R16 0.00 R16 0.00 R16 0.00 R16 0.00R17 9.38 R17 8.33 R17 0.00 R17 1.04R18 15.08 R18 7.08 R18 0.00 R18 8.00R18 48.75 R18 25.27 R18 0.00 R18 23.49R18 8.39 R18 7.30 R18 0.00 R18 1.09R19 10.70 R19 8.56 R19 0.00 R19 2.14R20 67.94 R20 6.98 R20 0.00 R20 60.95T34 7.49 T34 6.29 T34 0.00 T34 1.20T35 0.97 T35 0.97 T35 0.00 T35 0.00T35 1.39 T35 1.39 T35 0.00 T35 0.00T35 1.43 T35 1.43 T35 0.00 T35 0.00T35 0.00 T35 0.00 T35 0.00 T35 0.00T35 0.00 T35 0.00 T35 0.00 T35 0.00T36 13.72 T36 11.19 T36 0.00 T36 2.53T37 43.24 T37 42.23 T37 0.00 T37 1.01T37 54.20 T37 9.09 T37 0.00 T37 45.10T37 42.94 T37 38.24 T37 0.00 T37 4.71T39 4.60 T39 4.60 T39 0.00 T39 0.00T39 5.19 T39 5.19 T39 0.00 T39 0.00T39 4.93 T39 4.93 T39 0.00 T39 0.00T40 0.00 T40 0.00 T40 0.00 T40 0.00T44 5.35 T44 4.01 T44 0.00 T44 1.34T45 3.26 T45 2.90 T45 0.00 T45 0.36T46 1.43 T46 1.07 T46 0.00 T46 0.36T47 28.00 T47 24.00 T47 0.00 T47 4.00T48 7.64 T48 5.73 T48 0.00 T48 1.91
Metric 12 Metric 13 Metric 14 Metric 15

Appendix AA
StationID % Coleoptera StationID % Diptera StationID % Oligochaeta StationID No.Baetidae Totl.Indiv % BaetidaeR01 0.35 R01 20.49 R01 0.00 R01 0 283 0.00R01 0.60 R01 19.34 R01 0.30 R01 0 331 0.00R01 0.34 R01 46.98 R01 0.67 R01 1 298 0.34R14 4.67 R14 60.00 R14 12.00 R14 0 300 0.00R15 3.65 R15 36.86 R15 29.20 R15 0 274 0.00R16 2.00 R16 54.80 R16 28.00 R16 0 250 0.00R16 0.30 R16 49.55 R16 40.65 R16 0 337 0.00R16 0.00 R16 52.56 R16 43.27 R16 0 312 0.00R17 2.43 R17 38.19 R17 32.64 R17 0 288 0.00R18 8.92 R18 20.62 R18 22.15 R18 0 325 0.00R18 8.90 R18 21.71 R18 8.90 R18 0 281 0.00R18 4.74 R18 42.70 R18 25.55 R18 0 274 0.00R19 11.62 R19 72.78 R19 0.00 R19 0 327 0.00R20 2.22 R20 27.94 R20 0.00 R20 0 315 0.00T34 0.30 T34 18.56 T34 11.38 T34 1 334 0.30T35 0.32 T35 88.35 T35 5.18 T35 0 309 0.00T35 0.35 T35 75.26 T35 12.20 T35 0 287 0.00T35 1.43 T35 40.00 T35 27.14 T35 0 70 0.00T35 0.00 T35 36.36 T35 45.45 T35 0 22 0.00T35 0.00 T35 18.18 T35 63.64 T35 0 33 0.00T36 13.00 T36 57.76 T36 4.33 T36 0 277 0.00T37 1.01 T37 46.96 T37 2.36 T37 0 296 0.00T37 0.00 T37 45.45 T37 0.35 T37 0 286 0.00T37 0.88 T37 50.00 T37 0.29 T37 0 340 0.00T39 0.31 T39 65.03 T39 23.93 T39 0 326 0.00T39 0.00 T39 75.09 T39 15.92 T39 0 289 0.00T39 0.00 T39 65.46 T39 21.38 T39 0 304 0.00T40 0.64 T40 88.46 T40 0.64 T40 0 312 0.00T44 0.00 T44 87.96 T44 1.00 T44 0 299 0.00T45 0.00 T45 55.43 T45 1.09 T45 0 276 0.00T46 0.00 T46 40.36 T46 50.71 T46 0 280 0.00T47 0.73 T47 14.18 T47 29.45 T47 0 275 0.00T48 0.00 T48 44.90 T48 0.32 T48 0 314 0.00
Metric 16 Metric 17 Metric 18 Metric 19

Appendix AA
StationID No.Hydrop Totl.Indiv % Hydropsychidae StationID % Chironomidae StationID % GastropodaR01 205 283 72.44 R01 20.14 R01 0.00R01 209 331 63.14 R01 18.73 R01 0.00R01 78 298 26.17 R01 45.97 R01 0.00R14 0 300 0.00 R14 59.33 R14 1.33R15 2 274 0.73 R15 35.04 R15 5.47R16 0 250 0.00 R16 54.80 R16 0.40R16 0 337 0.00 R16 47.48 R16 0.59R16 0 312 0.00 R16 52.56 R16 0.00R17 2 288 0.69 R17 35.42 R17 2.08R18 23 325 7.08 R18 19.38 R18 8.31R18 65 281 23.13 R18 21.35 R18 1.07R18 3 274 1.09 R18 38.69 R18 4.01R19 4 327 1.22 R19 65.44 R19 0.31R20 192 315 60.95 R20 27.30 R20 0.63T34 2 334 0.60 T34 18.56 T34 6.59T35 0 309 0.00 T35 88.35 T35 0.00T35 0 287 0.00 T35 75.26 T35 0.00T35 0 70 0.00 T35 38.57 T35 0.00T35 0 22 0.00 T35 31.82 T35 0.00T35 0 33 0.00 T35 18.18 T35 0.00T36 7 277 2.53 T36 55.96 T36 5.05T37 0 296 0.00 T37 46.62 T37 0.68T37 129 286 45.10 T37 45.10 T37 0.00T37 1 340 0.29 T37 49.71 T37 2.35T39 0 326 0.00 T39 61.66 T39 3.07T39 0 289 0.00 T39 35.99 T39 0.00T39 0 304 0.00 T39 30.26 T39 1.32T40 0 312 0.00 T40 88.46 T40 1.60T44 4 299 1.34 T44 87.63 T44 0.00T45 1 276 0.36 T45 54.35 T45 0.00T46 0 280 0.00 T46 33.93 T46 2.50T47 8 275 2.91 T47 11.64 T47 0.00T48 1 314 0.32 T48 44.27 T48 0.32
Metric 20 Metric 21 Metric 22

Appendix AA
StationID ShanWiener (log e) ShanWiener (log 2) ShanWiener (log 10) StationID No. Intolerant TaxaR01 2.00 2.89 0.87 R01 3R01 2.31 3.33 1.00 R01 6R01 2.34 3.38 1.02 R01 3R14 2.31 3.34 1.00 R14 0R15 2.70 3.90 1.17 R15 1R16 2.16 3.12 0.94 R16 0R16 1.91 2.75 0.83 R16 0R16 1.08 1.56 0.47 R16 0R17 2.19 3.16 0.95 R17 0R18 2.77 4.00 1.20 R18 2R18 2.89 4.18 1.26 R18 4R18 2.58 3.72 1.12 R18 1R19 2.15 3.10 0.93 R19 0R20 1.83 2.65 0.80 R20 4T34 2.05 2.95 0.89 T34 0T35 0.80 1.16 0.35 T35 0T35 1.15 1.66 0.50 T35 0T35 2.07 2.99 0.90 T35 0T35 1.51 2.18 0.66 T35 0T35 1.50 2.16 0.65 T35 0T36 2.11 3.04 0.92 T36 0T37 2.07 2.99 0.90 T37 0T37 1.73 2.49 0.75 T37 1T37 2.07 2.98 0.90 T37 1T39 2.09 3.02 0.91 T39 0T39 1.80 2.60 0.78 T39 0T39 1.94 2.80 0.84 T39 0T40 1.26 1.82 0.55 T40 0T44 1.20 1.73 0.52 T44 1T45 1.68 2.42 0.73 T45 0T46 1.79 2.59 0.78 T46 0T47 2.23 3.22 0.97 T47 0T48 1.37 1.98 0.59 T48 0
Metric 23 Metric 24

Appendix AA
StationID % Intolerant Organisms StationID No. Tolerant Taxa StationID % Tolerant OrganismsR01 34.98 R01 3 R01 10.25R01 34.14 R01 8 R01 15.41R01 14.77 R01 10 R01 21.14R14 0.00 R14 18 R14 92.00R15 0.36 R15 19 R15 80.29R16 0.00 R16 15 R16 93.20R16 0.00 R16 20 R16 86.94R16 0.00 R16 7 R16 95.83R17 0.00 R17 20 R17 90.97R18 0.62 R18 16 R18 58.15R18 3.56 R18 15 R18 52.67R18 1.09 R18 15 R18 74.09R19 0.00 R19 15 R19 73.70R20 20.63 R20 6 R20 4.44T34 0.00 T34 20 T34 97.90T35 0.00 T35 9 T35 99.03T35 0.00 T35 12 T35 99.65T35 0.00 T35 10 T35 95.71T35 0.00 T35 5 T35 95.45T35 0.00 T35 7 T35 100.00T36 0.00 T36 18 T36 79.78T37 0.00 T37 18 T37 95.61T37 11.19 T37 6 T37 17.48T37 0.29 T37 18 T37 92.94T39 0.00 T39 14 T39 95.09T39 0.00 T39 12 T39 59.86T39 0.00 T39 12 T39 62.50T40 0.00 T40 11 T40 99.04T44 0.67 T44 10 T44 97.66T45 0.00 T45 12 T45 98.19T46 0.00 T46 13 T46 87.86T47 0.00 T47 14 T47 85.09T48 0.00 T48 11 T48 98.41
Metric 25 Metric 26 Metric 27
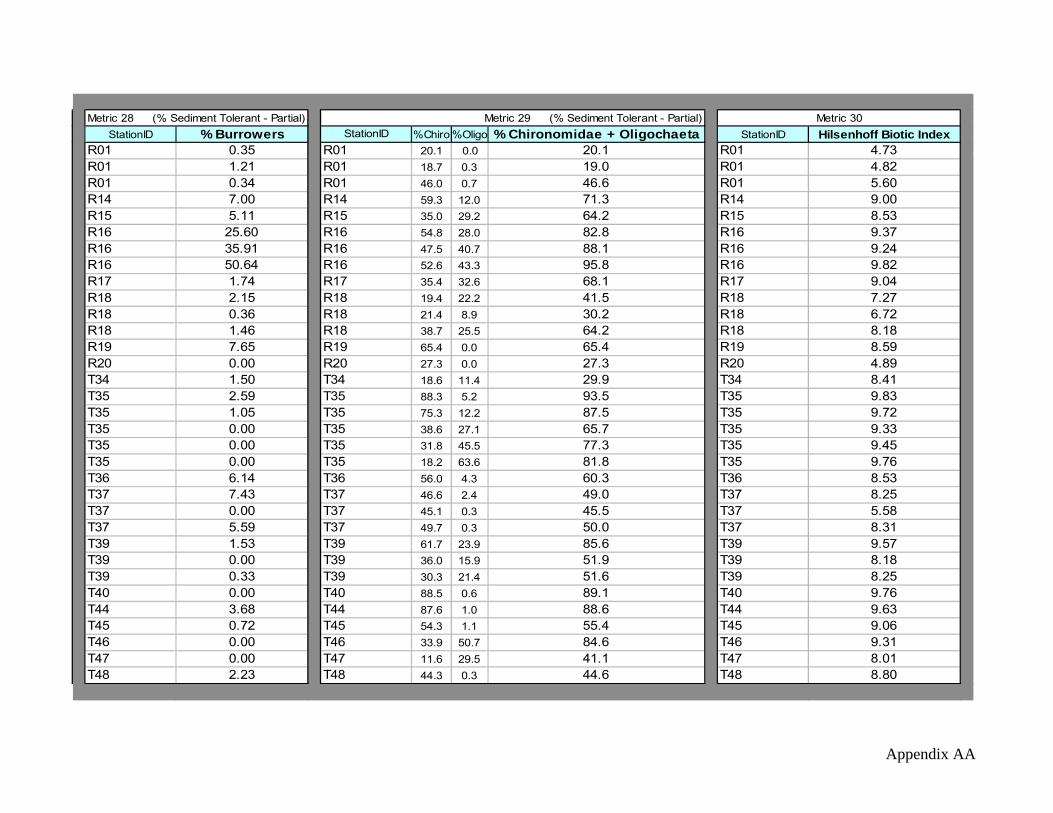
Appendix AA
StationID % Burrowers StationID %Chiro %Oligo % Chironomidae + Oligochaeta StationID Hilsenhoff Biotic IndexR01 0.35 R01 20.1 0.0 20.1 R01 4.73R01 1.21 R01 18.7 0.3 19.0 R01 4.82R01 0.34 R01 46.0 0.7 46.6 R01 5.60R14 7.00 R14 59.3 12.0 71.3 R14 9.00R15 5.11 R15 35.0 29.2 64.2 R15 8.53R16 25.60 R16 54.8 28.0 82.8 R16 9.37R16 35.91 R16 47.5 40.7 88.1 R16 9.24R16 50.64 R16 52.6 43.3 95.8 R16 9.82R17 1.74 R17 35.4 32.6 68.1 R17 9.04R18 2.15 R18 19.4 22.2 41.5 R18 7.27R18 0.36 R18 21.4 8.9 30.2 R18 6.72R18 1.46 R18 38.7 25.5 64.2 R18 8.18R19 7.65 R19 65.4 0.0 65.4 R19 8.59R20 0.00 R20 27.3 0.0 27.3 R20 4.89T34 1.50 T34 18.6 11.4 29.9 T34 8.41T35 2.59 T35 88.3 5.2 93.5 T35 9.83T35 1.05 T35 75.3 12.2 87.5 T35 9.72T35 0.00 T35 38.6 27.1 65.7 T35 9.33T35 0.00 T35 31.8 45.5 77.3 T35 9.45T35 0.00 T35 18.2 63.6 81.8 T35 9.76T36 6.14 T36 56.0 4.3 60.3 T36 8.53T37 7.43 T37 46.6 2.4 49.0 T37 8.25T37 0.00 T37 45.1 0.3 45.5 T37 5.58T37 5.59 T37 49.7 0.3 50.0 T37 8.31T39 1.53 T39 61.7 23.9 85.6 T39 9.57T39 0.00 T39 36.0 15.9 51.9 T39 8.18T39 0.33 T39 30.3 21.4 51.6 T39 8.25T40 0.00 T40 88.5 0.6 89.1 T40 9.76T44 3.68 T44 87.6 1.0 88.6 T44 9.63T45 0.72 T45 54.3 1.1 55.4 T45 9.06T46 0.00 T46 33.9 50.7 84.6 T46 9.31T47 0.00 T47 11.6 29.5 41.1 T47 8.01T48 2.23 T48 44.3 0.3 44.6 T48 8.80
Metric 28 (% Sediment Tolerant - Partial) Metric 29 (% Sediment Tolerant - Partial) Metric 30

Appendix AA
StationID % Dominant Taxon StationID % Hydropsychidae / Trichoptera StationID % Baetidae / EphemeropteraR01 28.27 R01 99.03 R01 0.00R01 24.17 R01 98.58 R01 0.00R01 25.84 R01 98.73 R01 1.35R14 36.67 R14 0.00 R14 0.00R15 23.72 R15 15.38 R15 0.00R16 25.60 R16 0.00 R16 0.00R16 35.91 R16 0.00 R16 0.00R16 50.64 R16 0.00 R16 0.00R17 31.25 R17 66.67 R17 0.00R18 20.92 R18 88.46 R18 0.00R18 15.66 R18 98.48 R18 0.00R18 27.01 R18 100.00 R18 0.00R19 40.67 R19 57.14 R19 0.00R20 40.95 R20 100.00 R20 0.00T34 50.00 T34 50.00 T34 4.76T35 82.20 T35 0.00 T35 0.00T35 70.03 T35 0.00 T35 0.00T35 30.00 T35 0.00 T35 0.00T35 40.91 T35 0.00 T35 0.00T35 48.48 T35 0.00 T35 0.00T36 45.49 T36 100.00 T36 0.00T37 38.85 T37 0.00 T37 0.00T37 33.92 T37 100.00 T37 0.00T37 33.24 T37 6.25 T37 0.00T39 21.47 T39 0.00 T39 0.00T39 39.10 T39 0.00 T39 0.00T39 35.20 T39 0.00 T39 0.00T40 49.68 T40 0.00 T40 0.00T44 71.57 T44 100.00 T44 0.00T45 35.14 T45 100.00 T45 0.00T46 47.14 T46 0.00 T46 0.00T47 26.18 T47 72.73 T47 0.00T48 41.40 T48 16.67 T48 0.00
Metric 31 Metric 32 Metric 33

Appendix AA
StationID % Gatherers+Filterers StationID % Gatherers StationID % Filterers StationID % ShreddersR01 83.04 R01 1.41 R01 81.63 R01 8.48R01 80.06 R01 5.74 R01 74.32 R01 3.63R01 54.36 R01 10.07 R01 44.30 R01 26.17R14 54.67 R14 42.67 R14 12.00 R14 0.33R15 69.34 R15 57.30 R15 12.04 R15 2.92R16 69.20 R16 55.20 R16 14.00 R16 11.60R16 77.45 R16 74.48 R16 2.97 R16 2.97R16 95.83 R16 94.55 R16 1.28 R16 0.00R17 57.64 R17 56.60 R17 1.04 R17 1.39R18 64.62 R18 44.31 R18 20.31 R18 2.46R18 66.55 R18 32.03 R18 34.52 R18 4.98R18 78.83 R18 50.73 R18 28.10 R18 1.09R19 76.76 R19 62.39 R19 14.37 R19 0.61R20 67.94 R20 4.13 R20 63.81 R20 24.76T34 74.85 T34 68.56 T34 6.29 T34 5.99T35 98.06 T35 15.86 T35 82.20 T35 0.65T35 97.56 T35 27.53 T35 70.03 T35 0.00T35 62.86 T35 32.86 T35 30.00 T35 0.00T35 77.27 T35 54.55 T35 22.73 T35 0.00T35 81.82 T35 66.67 T35 15.15 T35 0.00T36 81.59 T36 32.13 T36 49.46 T36 0.36T37 75.68 T37 48.65 T37 27.03 T37 5.41T37 59.09 T37 0.35 T37 58.74 T37 29.37T37 63.24 T37 28.24 T37 35.00 T37 6.76T39 69.94 T39 51.53 T39 18.40 T39 0.00T39 35.99 T39 23.53 T39 12.46 T39 0.00T39 40.13 T39 30.92 T39 9.21 T39 0.00T40 92.31 T40 55.77 T40 36.54 T40 0.00T44 93.31 T44 20.40 T44 72.91 T44 0.00T45 76.81 T45 71.01 T45 5.80 T45 0.00T46 77.14 T46 56.79 T46 20.36 T46 0.00T47 82.18 T47 77.82 T47 4.36 T47 4.36T48 92.04 T48 50.32 T48 41.72 T48 0.00
Metric 34 Metric 35 Metric 36 Metric 37

Appendix AA
StationID % Scrapers StationID Scrapers Filterers Scrapers / (Scrapers+Filterers) StationID Gatherer TaxaR01 6.01 R01 17 231 6.85 R01 3R01 11.18 R01 37 246 13.07 R01 6R01 15.10 R01 45 132 25.42 R01 8R14 2.00 R14 6 36 14.29 R14 14R15 9.12 R15 25 33 43.10 R15 12R16 1.60 R16 4 35 10.26 R16 8R16 0.89 R16 3 10 23.08 R16 8R16 0.00 R16 0.00 4 0.00 R16 6R17 3.13 R17 9 3 75.00 R17 9R18 13.23 R18 43 66 39.45 R18 13R18 11.74 R18 33 97 25.38 R18 12R18 5.11 R18 14 77 15.38 R18 13R19 2.75 R19 9 47 16.07 R19 7R20 6.03 R20 19 201 8.64 R20 3T34 6.59 T34 22 21 51.16 T34 11T35 0.00 T35 0.00 254 0.00 T35 6T35 0.00 T35 0.00 201 0.00 T35 7T35 0.00 T35 0.00 21 0.00 T35 6T35 0.00 T35 0.00 5 0.00 T35 3T35 0.00 T35 0.00 5 0.00 T35 3T36 6.50 T36 18 137 11.61 T36 10T37 0.68 T37 2 80 2.44 T37 8T37 0.00 T37 0.00 168 0.00 T37 1T37 2.65 T37 9 119 7.03 T37 7T39 3.07 T39 10 60 14.29 T39 11T39 0.00 T39 0.00 36 0.00 T39 6T39 1.32 T39 4 28 12.50 T39 6T40 1.60 T40 5 114 4.20 T40 5T44 0.00 T44 0.00 218 0.00 T44 5T45 0.00 T45 0.00 16 0.00 T45 6T46 2.50 T46 7 57 10.94 T46 6T47 0.00 T47 0.00 12 0.00 T47 9T48 0.32 T48 1 131 0.76 T48 5
Metric 38 Metric 39 Metric 40

Appendix AA
StationID Filterer Taxa StationID Shredder Taxa StationID Scraper Taxa StationID No. ClingersR01 7 R01 1 R01 3 R01 82R01 9 R01 2 R01 3 R01 85R01 7 R01 2 R01 2 R01 19R14 1 R14 1 R14 2 R14 8R15 5 R15 2 R15 4 R15 19R16 1 R16 3 R16 2 R16 28R16 1 R16 2 R16 2 R16 5R16 1 R16 0 R16 0 R16 0R17 2 R17 3 R17 2 R17 11R18 7 R18 3 R18 5 R18 46R18 4 R18 4 R18 4 R18 71R18 2 R18 2 R18 4 R18 14R19 2 R19 2 R19 3 R19 45R20 8 R20 2 R20 3 R20 149T34 3 T34 2 T34 2 T34 24T35 1 T35 1 T35 0 T35 2T35 1 T35 0 T35 0 T35 1T35 1 T35 0 T35 0 T35 1T35 1 T35 0 T35 0 T35 0T35 1 T35 0 T35 0 T35 0T36 4 T36 1 T36 4 T36 44T37 4 T37 3 T37 1 T37 20T37 5 T37 2 T37 0 T37 119T37 5 T37 2 T37 3 T37 39T39 1 T39 0 T39 1 T39 1T39 1 T39 0 T39 0 T39 0T39 1 T39 0 T39 1 T39 0T40 1 T40 0 T40 1 T40 2T44 3 T44 0 T44 0 T44 2T45 2 T45 0 T45 0 T45 1T46 2 T46 0 T46 1 T46 10T47 3 T47 2 T47 0 T47 13T48 2 T48 0 T48 1 T48 6
Metric 41 Metric 42 Metric 43 Metric 44

Appendix AA
StationID Clinger Taxa StationID % Clingers StationID Predator Ind. StationID Predator TaxaR01 3 R01 28.98 R01 4 R01 3R01 5 R01 25.68 R01 9 R01 4R01 4 R01 6.38 R01 10 R01 6R14 3 R14 2.67 R14 129 R14 9R15 4 R15 6.93 R15 49 R15 10R16 4 R16 11.20 R16 43 R16 7R16 3 R16 1.48 R16 47 R16 11R16 0 R16 0.00 R16 13 R16 3R17 4 R17 3.82 R17 106 R17 12R18 6 R18 14.15 R18 23 R18 5R18 5 R18 25.27 R18 24 R18 4R18 3 R18 5.11 R18 33 R18 6R19 5 R19 13.76 R19 65 R19 10R20 5 R20 47.30 R20 4 R20 1T34 5 T34 7.19 T34 38 T34 7T35 1 T35 0.65 T35 4 T35 3T35 1 T35 0.35 T35 7 T35 5T35 1 T35 1.43 T35 26 T35 6T35 0 T35 0.00 T35 5 T35 2T35 0 T35 0.00 T35 6 T35 3T36 4 T36 15.88 T36 20 T36 6T37 4 T37 6.76 T37 22 T37 9T37 3 T37 41.61 T37 4 T37 1T37 5 T37 11.47 T37 21 T37 6T39 1 T39 0.31 T39 88 T39 6T39 0 T39 0.00 T39 185 T39 8T39 0 T39 0.00 T39 178 T39 9T40 1 T40 0.64 T40 19 T40 6T44 1 T44 0.67 T44 20 T44 7T45 1 T45 0.36 T45 64 T45 7T46 2 T46 3.57 T46 57 T46 7T47 3 T47 4.73 T47 37 T47 10T48 2 T48 1.91 T48 24 T48 7
Metric 46 Metric 47 Metric 48Metric 45

Appendix AA
StationID % PredatorsR01 1.41R01 2.72R01 3.36R14 43.00R15 17.88R16 17.20R16 13.95R16 4.17R17 36.81R18 7.08R18 8.54R18 12.04R19 19.88R20 1.27T34 11.38T35 1.29T35 2.44T35 37.14T35 22.73T35 18.18T36 7.22T37 7.43T37 1.40T37 6.18T39 26.99T39 64.01T39 58.55T40 6.09T44 6.69T45 23.19T46 20.36T47 13.45T48 7.64
Metric 49

Appendix BB
Appendix BB. TSS Loading and Reductions
by Site
BB-1

Appendix BB
Reduct.Monthly
Site ID StreamName Year Month Q (hm3) Conc (ppb) Mass (kg) Conc (ppb) Mass (kg) Ave. (%)R01 BSR nr Brookings 2001 4 242.07 54004 13072770 158000 34770055 -166R01 BSR nr Brookings 2001 5 157.91 53604 8464515 158000 22681475 -168R01 BSR nr Brookings 2001 6 100.80 53604 5403293 158000 14478689 -168R01 BSR nr Brookings 2001 7 54.00 73882 3989372 158000 7755933 -94R01 BSR nr Brookings 2001 8 32.68 104556 3416589 158000 4693605 -37R01 BSR nr Brookings 2001 9 17.85 104556 1866468 158000 2564053 -37R01 BSR nr Brookings 2001 10 12.12 104556 1266854 158000 1740442 -37R01 BSR nr Brookings 2002 4 44.46 88170 3919799 158000 6385642 -63R01 BSR nr Brookings 2002 5 43.34 79209 3432607 158000 6224625 -81R01 BSR nr Brookings 2002 6 11.52 104556 1204882 158000 1655265 -37R01 BSR nr Brookings 2002 7 3.33 104556 347961 158000 478022 -37R01 BSR nr Brookings 2002 8 4.57 104556 477556 158000 655987 -37R01 BSR nr Brookings 2002 9 2.30 104556 240348 158000 330220 -37R01 BSR nr Brookings 2002 10 3.17 104556 331630 158000 455615 -37
730.11 47434644 104869627 -121
R14 BSR at Watertown 2001 4 64.99 16951 1101605 158000 9334784 -747R14 BSR at Watertown 2001 5 22.27 16915 376628 158000 3198207 -749R14 BSR at Watertown 2001 6 11.27 20229 228034 158000 1619069 -610R14 BSR at Watertown 2001 7 3.94 46796 184233 158000 565496 -207R14 BSR at Watertown 2001 8 0.92 46796 42881 158000 131571 -207R14 BSR at Watertown 2001 9 0.24 46796 11244 158000 34473 -207R14 BSR at Watertown 2001 10 0.34 46796 15710 158000 48262 -207R14 BSR at Watertown 2002 4 2.06 46796 96410 158000 295891 -207R14 BSR at Watertown 2002 5 3.03 46796 141638 158000 434787 -207R14 BSR at Watertown 2002 6 1.25 46796 58625 158000 179976 -207R14 BSR at Watertown 2002 7 0.12 46796 5427 158000 16662 -207R14 BSR at Watertown 2002 8 0.04 46796 1900 158000 5889 -210R14 BSR at Watertown 2002 9 0.06 46796 2798 158000 8618 -208R14 BSR at Watertown 2002 10 0.15 46796 6800 158000 20827 -206
110.66 2273933 15894513 -599
R15 BSR at Broadway 2001 4 68.27 31652 2161035 158000 9806629 -354R15 BSR at Broadway 2001 5 26.10 31675 826692 158000 3748765 -353R15 BSR at Broadway 2001 6 11.07 31113 344346 158000 1589624 -362R15 BSR at Broadway 2001 7 4.51 28777 129909 158000 648375 -399R15 BSR at Broadway 2001 8 1.51 28777 43341 158000 216316 -399R15 BSR at Broadway 2001 9 0.55 28777 15827 158000 79000 -399R15 BSR at Broadway 2001 10 0.53 28777 15151 158000 75696 -400R15 BSR at Broadway 2002 4 4.39 29330 128650 158000 629989 -390R15 BSR at Broadway 2002 5 3.52 28777 101261 158000 505456 -399R15 BSR at Broadway 2002 6 1.35 28777 38954 158000 194484 -399R15 BSR at Broadway 2002 7 0.56 28777 16163 158000 80724 -399R15 BSR at Broadway 2002 8 1.55 30010 46356 158000 221918 -379R15 BSR at Broadway 2002 9 0.58 28777 16759 158000 83596 -399R15 BSR at Broadway 2002 10 0.58 28777 16603 158000 82878 -399
125.06 3901046 17963451 -360
Total Suspended Solids LoadingModeled
Loading Max. 10%MOS

Appendix BB
Reduct.Monthly
Site ID StreamName Year Month Q (hm3) Conc (ppb) Mass (kg) Conc (ppb) Mass (kg) Ave. (%)
R16 BSR 20th Ave 2001 4 96.08 24054 2311027 158000 13800007 -497R16 BSR 20th Ave 2001 5 36.73 24030 882537 158000 5275333 -498R16 BSR 20th Ave 2001 6 15.57 24623 383479 158000 2236993 -483R16 BSR 20th Ave 2001 7 6.35 27088 172081 158000 912522 -430R16 BSR 20th Ave 2001 8 2.12 27088 57411 158000 304365 -430R16 BSR 20th Ave 2001 9 0.77 27088 20965 158000 111175 -430R16 BSR 20th Ave 2001 10 0.74 27088 20070 158000 106435 -430R16 BSR 20th Ave 2002 4 6.17 26504 163592 158000 886524 -442R16 BSR 20th Ave 2002 5 4.95 27088 134133 158000 711287 -430R16 BSR 20th Ave 2002 6 1.91 27088 51599 158000 273627 -430R16 BSR 20th Ave 2002 7 0.79 27088 21410 158000 113473 -430R16 BSR 20th Ave 2002 8 2.17 25787 56054 158000 312265 -457R16 BSR 20th Ave 2002 9 0.82 27088 22199 158000 117782 -431R16 BSR 20th Ave 2002 10 0.81 27088 21992 158000 116633 -430
175.99 4318550 25278420 -485
R17 BSR below Watertown 2001 4 101.69 50028 5087368 158000 14606382 -187R17 BSR below Watertown 2001 5 38.87 50108 1947844 158000 5583576 -187R17 BSR below Watertown 2001 6 16.48 47885 789354 158000 2367702 -200R17 BSR below Watertown 2001 7 6.72 40023 269112 158000 965811 -259R17 BSR below Watertown 2001 8 2.24 40023 89782 158000 322176 -259R17 BSR below Watertown 2001 9 0.82 40023 32787 158000 117638 -259R17 BSR below Watertown 2001 10 0.78 40023 31387 158000 112611 -259R17 BSR below Watertown 2002 4 6.53 41950 274058 158000 938376 -242R17 BSR below Watertown 2002 5 5.24 40023 209766 158000 752798 -259R17 BSR below Watertown 2002 6 2.02 40023 80694 158000 289571 -259R17 BSR below Watertown 2002 7 0.84 40023 33482 158000 120224 -259R17 BSR below Watertown 2002 8 2.30 44314 101954 158000 330507 -224R17 BSR below Watertown 2002 9 0.88 40023 35010 158000 125682 -259R17 BSR below Watertown 2002 10 0.79 40023 31485 158000 113042 -259
186.21 9014083 26746096 -197
R18 BSR nr Castlewood 2001 4 95.98 48571 4662016 158000 13786793 -196R18 BSR nr Castlewood 2001 5 39.82 48581 1934341 158000 5719169 -196R18 BSR nr Castlewood 2001 6 20.74 48541 1006704 158000 2978875 -196R18 BSR nr Castlewood 2001 7 8.48 46743 396523 158000 1218467 -207R18 BSR nr Castlewood 2001 8 3.00 46743 139990 158000 430191 -207R18 BSR nr Castlewood 2001 9 1.29 46743 60045 158000 184573 -207R18 BSR nr Castlewood 2001 10 1.29 46743 60502 158000 185865 -207R18 BSR nr Castlewood 2002 4 5.08 46743 237205 158000 728955 -207R18 BSR nr Castlewood 2002 5 6.08 46743 284326 158000 873740 -207R18 BSR nr Castlewood 2002 6 2.66 46743 124435 158000 382360 -207R18 BSR nr Castlewood 2002 7 1.34 46743 62710 158000 192760 -207R18 BSR nr Castlewood 2002 8 3.70 47877 177045 158000 531167 -200R18 BSR nr Castlewood 2002 9 1.22 46743 57071 158000 175380 -207R18 BSR nr Castlewood 2002 10 1.26 46743 58672 158000 180264 -207
191.93 9261584 27568558 -198
ModeledLoading Max. 10%MOS

Appendix BB
Reduct.Monthly
Site ID StreamName Year Month Q (hm3) Conc (ppb) Mass (kg) Conc (ppb) Mass (kg) Ave. (%)
R19 BSR nr Estelline 2001 4 117.04 51448 6021282R19 BSR nr Estelline 2001 5 48.55 51360 2493522 158000 6973545 -180R19 BSR nr Estelline 2001 6 25.29 51716 1307802 158000 3632276 -178R19 BSR nr Estelline 2001 7 10.34 67880 702131 158000 1485775 -112R19 BSR nr Estelline 2001 8 3.65 67880 247882 158000 524560 -112R19 BSR nr Estelline 2001 9 1.57 67880 106322 158000 224935 -112R19 BSR nr Estelline 2001 10 1.58 67880 106930 158000 226227 -112R19 BSR nr Estelline 2002 4 8.96 64525 578299 158000 1287269 -123R19 BSR nr Estelline 2002 5 7.42 67880 503460 158000 1065351 -112R19 BSR nr Estelline 2002 6 3.51 67880 238364 158000 504451 -112R19 BSR nr Estelline 2002 7 1.64 67880 111041 158000 234989 -112R19 BSR nr Estelline 2002 8 4.51 57681 260081 158000 647656 -149R19 BSR nr Estelline 2002 9 1.49 67880 101057 158000 213875 -112R19 BSR nr Estelline 2002 10 1.53 67880 103892 158000 219907 -112
120.03 6860782 17240816 -151
R20 BSR nr Bruce 2001 4 134.50 47835 6433844 158000 19319378 -200R20 BSR nr Bruce 2001 5 112.03 47835 5359040 158000 16091869 -200R20 BSR nr Bruce 2001 6 81.61 47835 3903730 158000 11722020 -200R20 BSR nr Bruce 2001 7 52.65 47835 2518294 158000 7561880 -200R20 BSR nr Bruce 2001 8 34.22 86412 2957345 158000 4915811 -66R20 BSR nr Bruce 2001 9 18.79 116085 2181415 158000 2699215 -24R20 BSR nr Bruce 2001 10 12.13 116085 1408263 158000 1742453 -24R20 BSR nr Bruce 2002 4 20.24 104907 2123571 158000 2907631 -37R20 BSR nr Bruce 2002 5 15.38 116085 1785750 158000 2209558 -24R20 BSR nr Bruce 2002 6 6.70 116085 777697 158000 962220 -24R20 BSR nr Bruce 2002 7 2.65 116085 307614 158000 380636 -24R20 BSR nr Bruce 2002 8 4.47 116085 518370 158000 641336 -24R20 BSR nr Bruce 2002 9 1.86 116085 215585 158000 266733 -24R20 BSR nr Bruce 2002 10 2.12 116085 245977 158000 304365 -24
499.35 30736496 71725105 -133
Loading Max. 10%MOSModeled

Appendix BB
Reduct.Monthly
Site ID StreamName Year Month Q (hm3) Conc (ppb) Mass (kg) Conc (ppb) Mass (kg) Ave. (%)T35 Willow Creek (nr Waverly) 2001 5 0.05 4994 265 263000 12672 -4682T35 Willow Creek (nr Waverly) 2001 6 0.57 4662 2650 263000 135804 -5025T35 Willow Creek (nr Waverly) 2001 7 0.35 7842 2738 263000 83443 -2947T35 Willow Creek (nr Waverly) 2001 8 0.12 14305 1638 263000 27495 -1579T35 Willow Creek (nr Waverly) 2001 9 0.04 33567 1275 263000 9085 -613T35 Willow Creek (nr Waverly) 2001 10 0.03 39380 1275 263000 7651 -500T35 Willow Creek (nr Waverly) 2002 4 0.17 11650 2032 263000 41602 -1948T35 Willow Creek (nr Waverly) 2002 5 0.27 10205 2738 263000 64076 -2240T35 Willow Creek (nr Waverly) 2002 6 0.16 11535 1871 263000 38733 -1971T35 Willow Creek (nr Waverly) 2002 7 0.07 18908 1317 263000 16736 -1171T35 Willow Creek (nr Waverly) 2002 8 0.06 22768 1363 263000 14345 -953T35 Willow Creek (nr Waverly) 2002 9 0.05 28326 1275 263000 10759 -744T35 Willow Creek (nr Waverly) 2002 10 0.04 35372 1275 263000 8607 -575
1.97 21710 471009 -2070
T36 Willow Creek (nr Watertown) 2001 4 22.23 58360 1297519 263000 5315708 -310T36 Willow Creek (nr Watertown) 2001 5 5.60 55181 308990 263000 1338909 -333T36 Willow Creek (nr Watertown) 2001 6 2.34 40366 94610 263000 560429 -492T36 Willow Creek (nr Watertown) 2001 7 0.34 8477 2852 263000 80335 -2717T36 Willow Creek (nr Watertown) 2001 8 0.10 8477 810 263000 22953 -2734T36 Willow Creek (nr Watertown) 2001 9 0.03 8477 246 263000 6934 -2721T36 Willow Creek (nr Watertown) 2001 10 0.03 8477 279 263000 7890 -2726T36 Willow Creek (nr Watertown) 2002 4 2.29 33200 76002 263000 547279 -620T36 Willow Creek (nr Watertown) 2002 5 1.22 8477 10321 263000 291213 -2722T36 Willow Creek (nr Watertown) 2002 6 0.12 8477 1032 263000 29169 -2727T36 Willow Creek (nr Watertown) 2002 7 0.03 8477 251 263000 7173 -2762T36 Willow Creek (nr Watertown) 2002 8 0.85 52452 44692 263000 203705 -356T36 Willow Creek (nr Watertown) 2002 9 0.02 8477 136 263000 3825 -2715T36 Willow Creek (nr Watertown) 2002 10 0.03 8477 213 263000 5977 -2706
35.22 1837953 8421499 -358
T37 Stray Horse Creek 2001 6 3.59 71120 255458 263000 858815 -236T37 Stray Horse Creek 2001 7 1.44 63710 91502 263000 343335 -275T37 Stray Horse Creek 2001 8 0.09 29433 2776 263000 22475 -710T37 Stray Horse Creek 2001 9 0.02 29433 587 263000 4782 -715T37 Stray Horse Creek 2001 10 0.10 29433 2940 263000 23909 -713T37 Stray Horse Creek 2002 4 0.16 37871 5869 263000 37059 -531T37 Stray Horse Creek 2002 5 0.25 40642 10011 263000 58816 -487T37 Stray Horse Creek 2002 6 0.03 29433 846 263000 6934 -719T37 Stray Horse Creek 2002 7 0.14 58867 8246 263000 33473 -306T37 Stray Horse Creek 2002 8 2.10 69921 146476 263000 500895 -242T37 Stray Horse Creek 2002 9 0.07 29433 2185 263000 17693 -710T37 Stray Horse Creek 2002 10 0.18 29433 5152 263000 41841 -712
8.16 532047 1950025 -267
Loading Max. 10%MOS
Total Suspended Solids LoadingModeled

Appendix BB
Reduct.Monthly
Site ID StreamName Year Month Q (hm3) Conc (ppb) Mass (kg) Conc (ppb) Mass (kg) Ave. (%)
T39 Lake Poinsett Outlet 2001 6 23.05 11914 274548 263000 5509850 -1907T39 Lake Poinsett Outlet 2001 7 36.20 13829 500647 263000 8655569 -1629T39 Lake Poinsett Outlet 2001 8 27.39 18278 500647 263000 6548700 -1208T39 Lake Poinsett Outlet 2001 9 17.88 27092 484497 263000 4275902 -783T39 Lake Poinsett Outlet 2001 10 8.49 29184 247720 263000 2029404 -719T39 Lake Poinsett Outlet 2002 4 2.20 28618 62952 263000 526000 -736T39 Lake Poinsett Outlet 2002 5 4.02 32348 130100 263000 961624 -639T39 Lake Poinsett Outlet 2002 6 1.95 64672 125903 263000 465510 -270T39 Lake Poinsett Outlet 2002 7 0.02 8575395 130100 263000 3586 97T39 Lake Poinsett Outlet 2002 8 0.92 154645 142053 263000 219725 -55
130.27 3131213 31145895 -895
T40 Hidewood Creek (nr Clear Lake) 2001 6 3.95 3589 14167 263000 943931 -6563T40 Hidewood Creek (nr Clear Lake) 2001 7 3.34 5710 19094 263000 799520 -4087T40 Hidewood Creek (nr Clear Lake) 2001 8 0.69 9781 6738 263000 164734 -2345T40 Hidewood Creek (nr Clear Lake) 2001 9 0.18 16841 3034 263000 43036 -1319T40 Hidewood Creek (nr Clear Lake) 2001 10 0.07 42114 3034 263000 17215 -467T40 Hidewood Creek (nr Clear Lake) 2002 4 1.15 12292 14167 263000 275433 -1844T40 Hidewood Creek (nr Clear Lake) 2002 5 1.17 14530 17035 263000 280215 -1545T40 Hidewood Creek (nr Clear Lake) 2002 6 0.20 15394 3034 263000 47101 -1453T40 Hidewood Creek (nr Clear Lake) 2002 7 0.00 2087206 3135 263000 478 85T40 Hidewood Creek (nr Clear Lake) 2002 8 0.02 154085 3135 263000 4782 -53T40 Hidewood Creek (nr Clear Lake) 2002 9 0.00 0 3034 263000 0 100T40 Hidewood Creek (nr Clear Lake) 2002 10 0.01 390898 3034 263000 1913 37
10.78 92637 2578356 -2683
T41 Hidewood Creek (nr Estelline) 2001 5 0.16 21982 3472 263000 37776 -988T41 Hidewood Creek (nr Estelline) 2001 6 3.16 18681 59068 263000 756005 -1180T41 Hidewood Creek (nr Estelline) 2001 7 1.52 20707 31552 263000 364375 -1055T41 Hidewood Creek (nr Estelline) 2001 8 0.79 21982 17386 263000 189121 -988T41 Hidewood Creek (nr Estelline) 2001 9 1.91 19282 36761 263000 455707 -1140T41 Hidewood Creek (nr Estelline) 2001 10 2.84 18392 52158 263000 678062 -1200T41 Hidewood Creek (nr Estelline) 2002 4 1.61 18392 29636 263000 385175 -1200T41 Hidewood Creek (nr Estelline) 2002 5 1.96 18392 36075 263000 468857 -1200T41 Hidewood Creek (nr Estelline) 2002 6 0.49 21111 10324 263000 116915 -1033T41 Hidewood Creek (nr Estelline) 2002 7 0.03 21982 558 263000 5977 -971
14.46 276988 3457972 -1148
T42 Peg Munky Run 2001 5 0.01 4093 40 263000 2391 -5938T42 Peg Munky Run 2001 6 1.11 21939 24428 263000 266108 -989T42 Peg Munky Run 2001 7 0.17 13694 2374 263000 41363 -1643T42 Peg Munky Run 2001 8 0.02 4093 61 263000 3586 -5828T42 Peg Munky Run 2001 10 0.00 4093 17 263000 956 -5559T42 Peg Munky Run 2002 4 0.27 6665 1788 263000 64076 -3484T42 Peg Munky Run 2002 5 0.26 8913 2280 263000 61207 -2585T42 Peg Munky Run 2002 6 0.05 4093 209 263000 12194 -5740
1.89 31195 451882 -1349
Loading Max. 10%MOS
Total Suspended Solids LoadingModeled

Appendix CC
Appendix CC. AgNPS Model Outputs for Feedlots in the NCBSRW Study
CC-1

Appendix CC
AgNPS Model Output for Feedlots in the NCBSRW Study Area
Site Density Mean PO4 Mean COD Mean PO4 Mean COD Sum Phos Sum COD Sum Phos Sum COD(ppm) (ppm) (lbs) (lbs) (ppm) (ppm) (lbs) (lbs)
R1 22 11.6 624.6 46.2 2,558.2 255.5 13,741.8 1,016.1 56,279.7R17 7 4.7 244.4 15.4 750.7 33.0 1,711.0 108.0 5,255.0R18 40 39.7 2,203.0 112.8 655.8 1,588.0 88,118.0 4,512.0 26,232.6R19 49 31.5 1,710.4 120.3 6,972.4 1,543.0 83,808.0 5,897.0 341,650.0R20 36 28.5 1,490.5 177.4 9,146.3 1,025.2 53,656.2 6,386.9 329,265.5T35 2 24.0 2,633.5 89.0 9,435.0 48.0 5,267.0 178.0 18,870.0T36 24 31.2 1,980.0 174.8 11,352.1 749.0 47,521.0 4,194.0 272,450.0T37 53 30.1 1,731.9 142.1 8,341.3 1,592.7 91,789.0 7,532.5 442,087.0T39 2 75.0 3,981.0 129.5 6,852.0 150.0 7,962.0 259.0 13,704.0T41 39 36.8 1,880.9 138.7 6,961.7 1,437.0 73,357.0 5,410.0 271,505.0T42 19 21.3 1,065.3 63.6 2,942.4 405.0 20,241.0 1,209.0 55,905.0T46 11 12.9 826.7 46.5 2,935.5 142.0 9,094.0 511.0 32,291.0T47 11 29.5 1,731.7 112.0 7,689.8 325.0 19,049.0 1,232.0 84,588.0

Appendix DD. TMDL – Lake Kampeska to Willow Creek
(Fecal Coliform Bacteria)
DD-1

Big Sioux River (Lake Kampeska to Willow Creek) Total Maximum Daily Load December 2005
East Dakota Water Development District, Brookings, South DakotaEast Dakota Water Development District, Brookings, South DakotaEast Dakota Water Development District, Brookings, South DakotaEast Dakota Water Development District, Brookings, South Dakota 2
TOTAL MAXIMUM DAILY LOAD EVALUATION (Fecal Coliform Bacteria)
for the
Big Sioux River (Lake Kampeska to Willow Creek)
(HUC 10170202)
Codington County, South Dakota
East Dakota Water Development District Brookings, South Dakota
December 2005

Big Sioux River (Lake Kampeska to Willow Creek) Total Maximum Daily Load December 2005
East Dakota Water Development District, Brookings, South DakotaEast Dakota Water Development District, Brookings, South DakotaEast Dakota Water Development District, Brookings, South DakotaEast Dakota Water Development District, Brookings, South Dakota 3
Lake Kampeska to Willow Creek Total Maximum Daily Load Waterbody Type: River Segment Assessment Unit ID: SD-BS-R-BIG_SIOUX_02 303(d) Listing Parameter: Fecal Coliform Bacteria Designated Uses: Warmwater Semi-permanent Fish Life Propagation Domestic Water Supply Limited Contact Recreation Fish and Wildlife Propagation Recreation and Stock Watering Irrigation Size of Waterbody: 9.6 miles Size of Watershed: 8,061 acres Water Quality Standards: Narrative and Numeric Indicators: Water Chemistry Analytical Approach: Modeling and Assessment Techniques used include Flow
Duration Interval Location: HUC Code: 10170202 Goal: Reduce the fecal coliform counts per day by 33 percent during
high flow conditions Target: ≤ 2000 cfu/100mL of fecal coliform bacteria (any one sample)
during the months of May through September
Objective The intent of this summary is to clearly identify the components of the TMDL submittal to support adequate public participation and facilitate the US Environmental Protection Agency (EPA) review and approval. The TMDL was developed in accordance with Section 303(d) of the federal Clean Water Act and guidance developed by EPA. Introduction The section of the Big Sioux River from Lake Kampeska to Willow Creek is a 9.6 mile segment with a watershed of approximately 8,061 acres and is located within the Big Sioux River Basin (HUC 10170202) in the south-central part of Codington County, South Dakota. The watershed of this segment lies within Codington County as shown by the shaded region in Figure 1 and is included as part of the North-Central Big Sioux River Watershed Assessment Project. The entire study area for this project is also outlined in Figure 1. The North-Central Big Sioux River Watershed Assessment Project identified the Big Sioux River segment Lake Kampeska to Willow Creek for TMDL development due to not supporting of its beneficial use limited contact recreation because of excessive fecal coliform bacteria. Information supporting this listing was derived from East Dakota Water Development District monitoring data and SD DENR ambient water quality data. Appendix B of the assessment report summarizes the data collected during the North-Central Big Sioux River Watershed Assessment Project from April 2001 through October 2002, and from May 2004 through September 2004.

Big Sioux River (Lake Kampeska to Willow Creek) Total Maximum Daily Load December 2005
East Dakota Water Development District, Brookings, South DakotaEast Dakota Water Development District, Brookings, South DakotaEast Dakota Water Development District, Brookings, South DakotaEast Dakota Water Development District, Brookings, South Dakota 4
Tributary
Big Sioux River
Watershed Boundaries
N
W E
S
Monitoring Site
City of Watertown
Lake
Kampe
ska
Pelican Lake
Big
Sioux
River
R14
Willow Creek
R16
R15
R34
BrookingsCounty
GrantCounty
DeuelCounty
HamlinCounty
CodingtonCounty
Monitoring Site
Lake
Stream
Big Sioux River
Community
North-Central BSR Watershed
Lake Kampeska to Willow Creek Watershed
Figure 1. Location of the Lake Kampeska to Willow Creek Segment and its
Watershed in South Dakota. Problem Identification The Lake Kampeska to Willow Creek segment is a small portion of the Big Sioux River, starting near the confluence of Mud Creek and the Big Sioux River just north of monitoring site R14 and ending at the confluence of the Big Sioux River and Willow Creek. The watershed area shown in Figure 2 drains approximately 61 percent grass/grazing land and cropland acres. The municipality of Watertown is located in this area.
Figure 2. Big Sioux River Segment (Lake Kampeska to Willow Creek) Watershed

Big Sioux River (Lake Kampeska to Willow Creek) Total Maximum Daily Load December 2005
East Dakota Water Development District, Brookings, South DakotaEast Dakota Water Development District, Brookings, South DakotaEast Dakota Water Development District, Brookings, South DakotaEast Dakota Water Development District, Brookings, South Dakota 5
The river segment Lake Kampeska to Willow Creek (R14-R16) was found to carry fecal coliform bacteria which degrades water quality. This segment is considered impaired because more than 10 percent of the values (of 20 or more samples) exceeded the numeric criteria of ≤ 2000 counts per 100 milliliters of fecal coliform bacteria. This segment requires reducing the fecal coliform counts per day by 33 percent during high flow conditions. Table 1 displays the fecal coliform data collected from May 2001 to September 2003 and from May 2004 to September 2004. Table 1. Summary of Fecal Coliform Data for the Lake Kampeska to Willow Creek
Segment Description of Applicable Water Quality Standards & Numeric Water Quality Targets The Big Sioux River segment from Lake Kampeska to Willow Creek has been assigned beneficial uses by the state of South Dakota Surface Water Quality Standards regulations (See page 12 of the Assessment Report). Along with these assigned uses are narrative and numeric criteria that define the desired water quality of this river segment. These criteria must be maintained for the segment to satisfy its assigned beneficial uses, which are listed below:
• Domestic water supply • Warmwater semi-permanent fish propagation • Limited contact recreation • Fish and wildlife propagation, recreation and stock watering • Irrigation
Individual parameters determine the support of beneficial uses. Use support for limited contact recreation involved monitoring the levels of fecal coliform from May 1 through September 30. This segment experiences excess loading of fecal coliform bacteria due to poor riparian areas, in-stream livestock, stormwater runoff, feedlot/manure runoff, and NPDES systems. Administrative Rules of South Dakota Article 74:51 contains numeric and narrative standards to be applied to the surface waters (i.e. streams, rivers) of the state. To assess the status of the beneficial uses for this river segment, water samples were obtained using SD DENR standard operating procedures and the results were compared to the applicable water quality criteria. Water samples from both the East Dakota Water Development District and the SD DENR ambient water quality monitoring program were utilized. The Lake Kampeska to Willow Creek Big Sioux River Segment is currently assigned a numeric standard of ≤ 2000 cfu/100mL for fecal coliform bacteria. A flow duration interval with hydrologic zones approach was used to assess this segment. This methodology, developed by Dr. Bruce Cleland, was used in order to target restoration efforts by dividing the range of flows into hydrologic conditions. For example, if all the exceedences occurred during low-flow conditions, point sources of the pollutant should be suspected. Conversely, if all the exceedences occurred during higher flow periods, then non-point sources of pollution should be suspected. Using Dr. Cleland’s approach, the following five hydrologic conditions were utilized:
Parameter Causing
Impairment
Number of Samples
(May-Sep)
Percent of Samples > 2000 counts/100mL
Minimum Concentration (counts/100mL)
Maximum Concentration (counts/100mL)
Fecal Coliform 76 16 no detect 31,000

Big Sioux River (Lake Kampeska to Willow Creek) Total Maximum Daily Load December 2005
East Dakota Water Development District, Brookings, South DakotaEast Dakota Water Development District, Brookings, South DakotaEast Dakota Water Development District, Brookings, South DakotaEast Dakota Water Development District, Brookings, South Dakota 6
High Flows (0 to 10 percent), Moist Conditions (10-40 percent), Mid-Range Flows (40-60 percent), Dry Conditions (60-90 percent), and Low Flows (90-100 percent). The methodology of flow duration intervals is explained further in the Methods section of the Assessment Report. Three monitoring locations (R14, R15, and R16) were setup on this segment and one SD DENR ambient water quality monitoring site (WQM 55) existed on this segment of the Big Sioux River. Of the 76 water samples that were collected, 12 (or 16 percent) violated the water quality standards for fecal coliform bacteria. Based on the water quality violations, this segment is currently not supporting its limited contact recreation beneficial use. This segment requires reducing the fecal coliform counts per day by 33 percent during high flow conditions (Table 2). Table 2. Lake Kampeska to Willow Creek Fecal Coliform Bacteria Reductions
Pelican Lake outlet was assessed as a potential source of fecal coliform bacteria into this segment of the Big Sioux River. A monitoring site (T34) was located at the Pelican Lake Weir. This inlet/outlet is not assigned numeric criteria for fecal coliform bacteria. However, its water quality was assessed at the ≤ 2000 cfu/100 mL standard for fecal coliform bacteria. Results show there is a very low potential that Pelican Lake is having an influence on the fecal coliform bacteria problems in the Lake Kampeska to Willow Creek segment of the Big Sioux River. Table 3 displays the fecal coliform data collected from May 2001 through September 2002. Of the six samples collected when the direction of flow was into the lake, one exceeded the ≤ 2000 cfu/100 mL limit. There were no fecal coliform bacteria exceedences when the direction of flow was out of the lake. Table 3. Summary of Fecal Coliform Data for the Pelican Lake Weir
Pollutant Assessment Point Sources NPDES facilities taken into consideration within this area include the City of Watertown, Oak Valley Farms, and Glacial Lakes Ethanol. Total fecal coliform bacteria contribution from these facilities during the study period was insignificant at 0.00008 percent. Calculations used total colonies from the facility divided by the total colonies at the nearest downstream monitoring location.
Parameter Causing
Impairment
Number of Samples
(May-Sep)
Percent of Samples > 2000 counts/100mL
Minimum Concentration (counts/100mL)
Maximum Concentration (counts/100mL)
Fecal Coliform 8 13 no detect 8,000
High Moist Mid-Range Dry Low Flows(0-10) (10-40) (40-60) (60-90) (90-100)
Median Concentration (counts/day) 6.59E+10 1.05E+10 9.45E+09 1.52E+10 1.00E+10Flow Median (cfs) 323 52 11 2.3 0.2
= Existing 2.13E+13 5.47E+11 1.04E+11 3.50E+10 2.00E+09
Target Load (at 2,000 cfu/100mL) 1.58E+13 2.54E+12 5.38E+11 1.13E+11 9.79E+09% Reduction w/MOS 33 0 0 0 0
Note: units are counts/day
Median
X
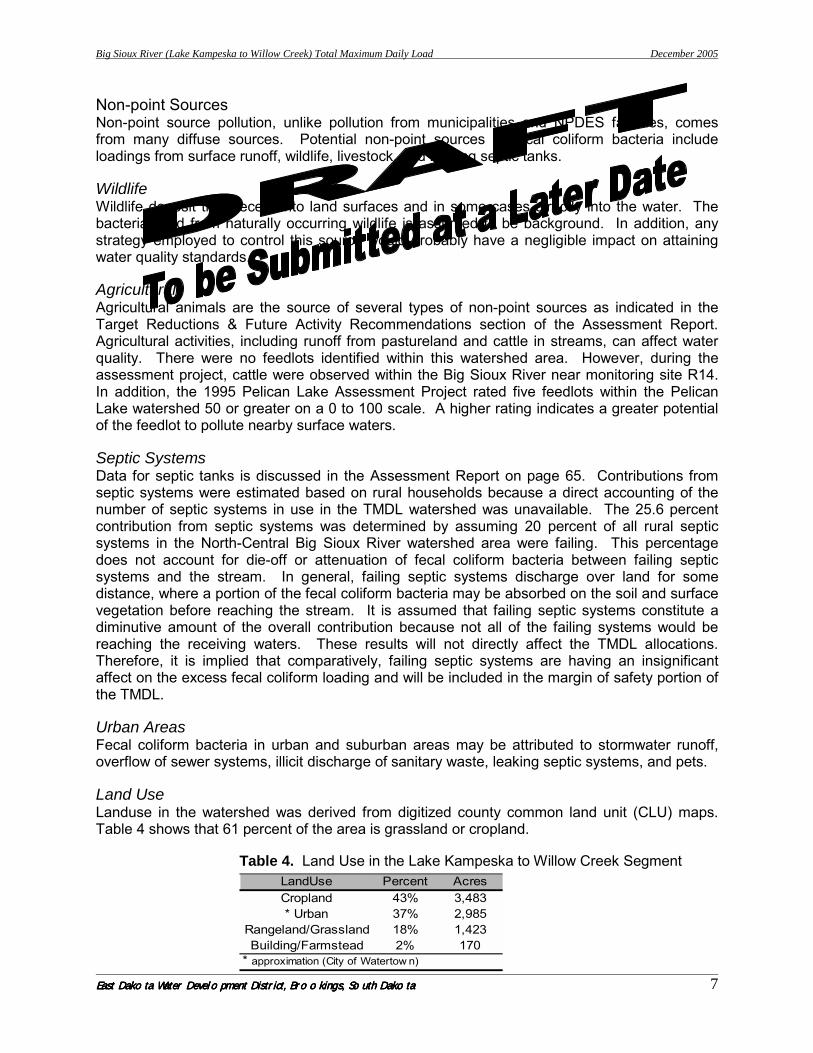
Big Sioux River (Lake Kampeska to Willow Creek) Total Maximum Daily Load December 2005
East Dakota Water Development District, Brookings, South DakotaEast Dakota Water Development District, Brookings, South DakotaEast Dakota Water Development District, Brookings, South DakotaEast Dakota Water Development District, Brookings, South Dakota 7
Non-point Sources Non-point source pollution, unlike pollution from municipalities and NPDES facilities, comes from many diffuse sources. Potential non-point sources of fecal coliform bacteria include loadings from surface runoff, wildlife, livestock, and leaking septic tanks. Wildlife Wildlife deposit their feces onto land surfaces and in some cases directly into the water. The bacterial load from naturally occurring wildlife is assumed to be background. In addition, any strategy employed to control this source would probably have a negligible impact on attaining water quality standards. Agricultural Agricultural animals are the source of several types of non-point sources as indicated in the Target Reductions & Future Activity Recommendations section of the Assessment Report. Agricultural activities, including runoff from pastureland and cattle in streams, can affect water quality. There were no feedlots identified within this watershed area. However, during the assessment project, cattle were observed within the Big Sioux River near monitoring site R14. In addition, the 1995 Pelican Lake Assessment Project rated five feedlots within the Pelican Lake watershed 50 or greater on a 0 to 100 scale. A higher rating indicates a greater potential of the feedlot to pollute nearby surface waters. Septic Systems Data for septic tanks is discussed in the Assessment Report on page 65. Contributions from septic systems were estimated based on rural households because a direct accounting of the number of septic systems in use in the TMDL watershed was unavailable. The 25.6 percent contribution from septic systems was determined by assuming 20 percent of all rural septic systems in the North-Central Big Sioux River watershed area were failing. This percentage does not account for die-off or attenuation of fecal coliform bacteria between failing septic systems and the stream. In general, failing septic systems discharge over land for some distance, where a portion of the fecal coliform bacteria may be absorbed on the soil and surface vegetation before reaching the stream. It is assumed that failing septic systems constitute a diminutive amount of the overall contribution because not all of the failing systems would be reaching the receiving waters. These results will not directly affect the TMDL allocations. Therefore, it is implied that comparatively, failing septic systems are having an insignificant affect on the excess fecal coliform loading and will be included in the margin of safety portion of the TMDL. Urban Areas Fecal coliform bacteria in urban and suburban areas may be attributed to stormwater runoff, overflow of sewer systems, illicit discharge of sanitary waste, leaking septic systems, and pets. Land Use Landuse in the watershed was derived from digitized county common land unit (CLU) maps. Table 4 shows that 61 percent of the area is grassland or cropland. Table 4. Land Use in the Lake Kampeska to Willow Creek Segment
LandUse Percent AcresCropland 43% 3,483* Urban 37% 2,985
Rangeland/Grassland 18% 1,423Building/Farmstead 2% 170
* approximation (City of Watertow n)

Big Sioux River (Lake Kampeska to Willow Creek) Total Maximum Daily Load December 2005
East Dakota Water Development District, Brookings, South DakotaEast Dakota Water Development District, Brookings, South DakotaEast Dakota Water Development District, Brookings, South DakotaEast Dakota Water Development District, Brookings, South Dakota 8
1.00E+07
1.00E+09
1.00E+11
1.00E+13
1.00E+15
0 10 20 30 40 50 60 70 80 90
Flow Duration Interval (%)
Feca
l Col
ifor
m B
acte
ria
(cou
nts/
day)
Target
Non-ExceedneceExceedence
Rain Event
90th
Median
Lake Kampeska to Willow Creek (R14, R15, R16) 2001-2002 & 2004 (May-Sep) EDWDD & DENR Monitoring Data
DryConditions
LowFlows
HighFlows
Mid-rangeFlows
MoistConditions
Linkage Analysis Water quality data was collected at three project monitoring sites (R14, R15, and R16) and one SD DENR ambient site on the Big Sioux River. Samples were collected according to South Dakota’s EPA approved Standard Operating Procedures for Field Samplers. The fecal coliform bacteria water samples were analyzed by the Sioux Falls Health Lab (2001-2002) in Sioux Falls, South Dakota and by the State Health Lab (2004) in Pierre, South Dakota. Quality Assurance/Quality Control samples were collected on 10% of the samples according to South Dakota’s EPA approved Non-point Source Quality Assurance/ Quality Control Plan. Details concerning water sampling techniques, analysis, and quality control are addressed in the assessment final report. The Flow Duration Interval method calculates fecal coliform bacteria loading, (concentration) × (flow), using zones based on hydrologic conditions. Reductions are calculated using the median of the fecal coliform bacteria samples in each zone. This method shows that while a TMDL may be expressed as a single point it can also be thought of as a continuum of points representing the criterion value and various flow values. In order to assess the impact of fecal coliform bacteria for this segment of the Big Sioux River, the flow duration interval curve was divided into “flow zones”. The purpose of the zones is to differentiate hydrologic conditions, between peak and low flows, as ranges. For this segment, the ranges or flow zones are High (0-10), Moist (10-40), Mid-Range (40-60), Dry (60-90) and Low (90-100). Load duration curves were calculated using the following equation:
(flow) × (conversion factor) × (state criteria) = quantity/day or daily load This curve represents the threshold of the load. As seen in Figure 3, any samples occurring above this line is an exceedence of the water quality standard and represented by a red box (Table 5). Table 6 depicts the allowable coliform bacteria load during the study for peak flow, low flow, and 5th percentile increments in flow. Figure 3. Flow Duration Interval for the Lake Kampeska to Willow Creek Segment

Big Sioux River (Lake Kampeska to Willow Creek) Total Maximum Daily Load December 2005
East Dakota Water Development District, Brookings, South DakotaEast Dakota Water Development District, Brookings, South DakotaEast Dakota Water Development District, Brookings, South DakotaEast Dakota Water Development District, Brookings, South Dakota 9
Table 5. Exceedences of the Water Quality Standard (≤ 2000 cfu/100mL)
Table 6. Fecal Coliform Target Loads for Flow
Flow Rank (percent) cfs
fecal Coliform
(counts/day)Flow
Conditions0.019 4666.97 2.28E+14 Peak0.1 4294.82 2.10E+14
0.274 4156.86 2.03E+141 4109.86 2.01E+145 323.00 1.58E+13
10 184.96 9.05E+1215 113.00 5.53E+1220 75.00 3.67E+1225 52.00 2.54E+1230 38.74 1.90E+1235 28.00 1.37E+1240 20.14 9.86E+1145 15.12 7.40E+1150 11.00 5.38E+1155 8.06 3.94E+1160 6.20 3.03E+1165 4.83 2.37E+1170 3.56 1.74E+1175 2.30 1.13E+1180 1.50 7.34E+1085 0.90 4.40E+1090 0.50 2.45E+1095 0.20 9.79E+09100 0.01 4.89E+08 Low
Allowable Loads 2000 cfu/100mL
StationSample
DateSample
TimeFlow (cubic feet per second - cfs)
Flow Rank
Flow Rank
(percent)Fecal Coliform (counts/100mL)
Fecal Coliform Load
(counts/day)R14 07/01/04 915 0.34 0.919 91.85 31000 2.58E+11R14 08/21/02 1045 2.60 0.738 73.79 11000 7.00E+11R16 08/21/02 1200 378.00 0.038 3.82 10000 9.25E+13R14 07/27/04 1130 0.01 0.998 99.79 8700 2.13E+09R15 08/21/02 1120 4.80 0.652 65.20 8000 9.40E+11R16 09/09/02 1245 13.20 0.472 47.24 6900 2.23E+12R14 09/09/02 1115 0.54 0.888 88.79 4500 5.95E+10R15 07/08/02 1230 7.40 0.567 56.67 4000 7.24E+11R16 08/07/02 1115 6.40 0.595 59.47 3500 5.48E+11R14 07/08/02 1200 2.20 0.753 75.28 3400 1.83E+11R14 08/25/04 1205 0.02 0.994 99.43 3100 1.52E+09R14 05/08/01 1000 442.00 0.030 3.02 2200 2.38E+13

Big Sioux River (Lake Kampeska to Willow Creek) Total Maximum Daily Load December 2005
East Dakota Water Development District, Brookings, South DakotaEast Dakota Water Development District, Brookings, South DakotaEast Dakota Water Development District, Brookings, South DakotaEast Dakota Water Development District, Brookings, South Dakota 10
TMDL Allocations TMDL
Wasteload Allocations (WLAs) NPDES facilities are permitted to discharge effluent at the bacteria standard. When operating properly, they will not cause or contribute to water quality violations. Their contributions are relatively small in comparison to the total loading of the segment. The worst case scenario of all point source waste loads within this segment would be approximately 3.31 × 10¹¹ fecal counts if all the facilities discharged their maximum amount at the same time. This amount is unlikely since most dischargers operate well within their permit limits and discharge smaller loads than allowed. In order to find the TMDL, the waste load allocation (point source) was added to the allowable load (non-point source) and a 10 percent margin of safety was applied. New or increases in discharges affecting this segment will be required to meet bacterial standards prior to discharge. This ensures these additions of load will not cause violations of water quality standards. The identified point sources in this watershed are contributing an insignificant amount to the fecal coliform loading. Therefore, the “wasteload allocation” component is of no consequence, as indicated in the above TMDL. Load Allocations (LAs) Load allocations account for the portion of the TMDL assigned to non-point sources. Natural background constitutes two percent of the total and the remainder of the LA is assigned to those land uses likely to contribute fecal coliform bacteria loads at rates above natural background. This includes cropland, pastureland, and residential areas. Based on the flow duration interval method, a 33 percent reduction is needed from non-point sources during high flow conditions, as was shown in Table 2. Seasonal Variation Different seasons of the year can yield differences in water quality due to changes in precipitation and agricultural practices. When a rainfall event occurs, fecal coliform bacteria that have built up on the land surface under dry conditions are washed off and finally deposited into lakes, rivers, and wetlands. To determine seasonal differences, runoff events were noted for the East Dakota Water Development District samples. The ambient water quality samples from the SD DENR were compared to historic precipitation data. Monitoring sites R14, R15, and R16 of the Lake Kampeska to Willow Creek segment of the Big Sioux River are not meeting the water quality criteria for fecal coliform bacteria. Of the 12 samples that were exceeding the ≤ 2000 cfu/100mL standard, five (or 42 percent) were during rain events. Margin of Safety The margin of safety (MOS) is a portion of the loading capacity that is set aside to prevent the exceedence of a water quality standard as a means of accounting for the uncertainty involved in developing a TMDL. The MOS for this TMDL is explicit, meaning a specific quantity, in this
Point Source
10% MOS WLA LA % Background Other NPSHigh 1.58E+13 1.58E+12 1.42E+13 3.31E+11 1.39E+13 2.78E+11 1.36E+13Moist 2.54E+12 2.54E+11 2.29E+12 3.31E+11 1.96E+12 3.91E+10 1.92E+12
Mid-Range 5.38E+11 5.38E+10 4.84E+11 3.31E+11 1.53E+11 3.06E+09 1.50E+11Dry 1.13E+11 1.13E+10 1.02E+11 3.31E+11 -2.29E+11 -4.59E+09 -2.25E+11Low 9.79E+09 9.79E+08 8.81E+09 3.31E+11 -3.22E+11 -6.44E+09 -3.16E+11
Zone
Note: units are counts/day
TMDL
TMDL Total Allocations
Non-Point Source 100% = 2% + 98%

Big Sioux River (Lake Kampeska to Willow Creek) Total Maximum Daily Load December 2005
East Dakota Water Development District, Brookings, South DakotaEast Dakota Water Development District, Brookings, South DakotaEast Dakota Water Development District, Brookings, South DakotaEast Dakota Water Development District, Brookings, South Dakota 11
case 10%, of the loading is set aside. This explicit MOS takes into consideration the uncertainties associated with flow and non-point sources. Critical Conditions The critical condition for fecal coliform loadings in any watershed depends on the presence of point sources and land use within that watershed. During a dry period, typically the critical condition is non-point sources followed by a rainfall event. During the rainfall event, fecal coliform bacteria that have built up on the land surface can wash into the stream, causing wet weather exceedences. Follow-Up Monitoring Monitoring and evaluation efforts will be targeted toward the effectiveness of implemented BMPs. Sample sites will be based on BMP site selection and include the parameter of fecal coliform bacteria. Once the implementation project is completed, post-implementation monitoring will be necessary to assure that the TMDL has been reached and improvement to the beneficial uses occurs. This will be achieved by recurrent water quality sampling at the original monitoring sites. Public Participation Efforts taken to gain public education, review, and comment during development of the TMDL involved: 1. East Dakota Water Development District monthly board meetings 2. Field demonstrations for the public 3. Articles in the local newspapers The findings from these public meetings and comments have been taken into consideration in development of the Big Sioux River Segment – Lake Kampeska to Willow Creek TMDL. Implementation Plan The TMDL analysis was performed using the best data available to specify the fecal coliform reductions necessary to achieve water quality criteria. The intent of meeting the criteria is to support the designated use classifications of this segment. A detailed implementation plan is not included in this TMDL. The involvement of local land owners and agencies will be needed in order to develop an implementation plan. In general, reductions in fecal coliform bacteria should be sought through identification and installation of agricultural and urban BMPs to reduce loads during runoff events.

Appendix EE. TMDL –Willow Creek to Stray Horse Creek
(Fecal Coliform Bacteria)
EE-1

Big Sioux River (Willow Creek to Stray Horse Creek) Total Maximum Daily Load December 2005
East Dakota Water Development District, Brookings, South DakotaEast Dakota Water Development District, Brookings, South DakotaEast Dakota Water Development District, Brookings, South DakotaEast Dakota Water Development District, Brookings, South Dakota 2
TOTAL MAXIMUM DAILY LOAD EVALUATION (Fecal Coliform Bacteria)
for the
Big Sioux River (Willow Creek to Stray Horse Creek)
(HUC 10170202)
Codington and Hamlin Counties, South Dakota
East Dakota Water Development District Brookings, South Dakota
December 2005

Big Sioux River (Willow Creek to Stray Horse Creek) Total Maximum Daily Load December 2005
East Dakota Water Development District, Brookings, South DakotaEast Dakota Water Development District, Brookings, South DakotaEast Dakota Water Development District, Brookings, South DakotaEast Dakota Water Development District, Brookings, South Dakota 3
Willow Creek to Stray Horse Creek Total Maximum Daily Load Waterbody Type: River Segment Assessment Unit ID: SD-BS-R-BIG_SIOUX_03 303(d) Listing Parameter: Fecal Coliform Bacteria Designated Uses: Warmwater Semi-permanent Fish Life Propagation Domestic Water Supply Limited Contact Recreation Fish and Wildlife Propagation Recreation and Stock Watering Irrigation Size of Waterbody: 22.4 miles Size of Watershed: 144,371 acres Water Quality Standards: Narrative and Numeric Indicators: Water Chemistry Analytical Approach: Modeling and Assessment Techniques used include Flow
Duration Interval, AGNPS Model, and AnnAGNPS Model Location: HUC Code: 10170202 Goal: Full Support of the Limited Contact Recreation Beneficial Use
during the months of May through September Target: ≤ 2000 cfu/100mL of fecal coliform bacteria (any one sample)
during the months of May through September
Objective The intent of this summary is to clearly identify the components of the TMDL submittal to support adequate public participation and facilitate the US Environmental Protection Agency (EPA) review and approval. The TMDL was developed in accordance with Section 303(d) of the federal Clean Water Act and guidance developed by EPA. Introduction The section of the Big Sioux River from Willow Creek to Stray Horse Creek is a 22.4 mile segment with a watershed of approximately 144,371 acres and is located within the Big Sioux River Basin (HUC 10170202) in the south-central part of Codington County and the north-central part of Hamlin County, South Dakota. The watershed of this segment lies within Hamlin, Codington, Grant, and Deuel Counties as shown by the shaded region in Figure 1 and is included as part of the North-Central Big Sioux River Watershed Assessment Project. This watershed area includes the Willow Creek watershed. The entire study area for this project is also outlined in Figure 1. Initially, the 1998 South Dakota 303 (d) Waterbody List identified the segment Willow Creek to Stray Horse Creek to be partially supporting of its beneficial uses. It was subsequently listed as partially supporting in the 2002 South Dakota 303 (d) Waterbody List. In the 2004 and 2006 South Dakota Integrated Report, the Willow Creek to Stray Horse Creek segment was identified as not supporting its beneficial use limited contact recreation due to excessive fecal coliform bacteria. This segment is influenced by the Willow Creek tributary. Information supporting this listing was derived from statewide ambient monitoring data. Furthermore, the North-Central Big

Big Sioux River (Willow Creek to Stray Horse Creek) Total Maximum Daily Load December 2005
East Dakota Water Development District, Brookings, South DakotaEast Dakota Water Development District, Brookings, South DakotaEast Dakota Water Development District, Brookings, South DakotaEast Dakota Water Development District, Brookings, South Dakota 4
Sioux River Watershed Assessment Project identified this segment as impaired for fecal coliform bacteria. Appendix B of the assessment report summarizes the data collected during the North-Central Big Sioux River Watershed Assessment Project from April 2001 through October 2002, and from May 2004 through September 2004.
Figure 1. Location of the Willow Creek to Stray Horse Creek Segment and its Watershed in South Dakota.
Problem Identification The Willow Creek to the Stray Horse Creek segment is a small portion of the Big Sioux River, starting near the confluence of the Big Sioux River and Willow Creek and ending at the confluence of the Big Sioux River and Stray Horse Creek. The watershed area shown in Figure 2 drains approximately 96 percent grass/grazing land and cropland acres. The municipality of Castlewood is located within this area. The river segment Willow Creek to Stray Horse Creek (Site R17 and Site R18) was found to carry fecal coliform bacteria which degrades water quality. This segment is considered impaired because more than 10 percent of the values (of 20 or more samples) exceeded the numeric criteria of ≤ 2000 counts per 100 milliliters of fecal coliform bacteria. Table 1 displays the fecal coliform data collected from May 2001 to September 2002 and from May 2004 to September 2004.
Table 1. Summary of Fecal Coliform Data for the Willow Creek to Stray Horse Creek Segment
BrookingsCounty
GrantCounty
DeuelCounty
HamlinCounty
CodingtonCounty
Monitoring Site
Lake
Stream
Big Sioux River
Community
North-Central BSR Watershed
Willow Creek to Stray Horse Creek Watershed
Parameter Causing
Impairment
Number of Samples
(May-Sep)
Percent of Samples > 2000 counts/100mL
Minimum Concentration (counts/100mL)
Maximum Concentration (counts/100mL)
Fecal Coliform 56 27 10 410,000

Big Sioux River (Willow Creek to Stray Horse Creek) Total Maximum Daily Load December 2005
East Dakota Water Development District, Brookings, South DakotaEast Dakota Water Development District, Brookings, South DakotaEast Dakota Water Development District, Brookings, South DakotaEast Dakota Water Development District, Brookings, South Dakota 5
Figure 2. Big Sioux River Segment (Willow Creek to Stray Horse Creek) Watershed
Description of Applicable Water Quality Standards & Numeric Water Quality Targets The Big Sioux River segment from Willow Creek to Stray Horse Creek has been assigned beneficial uses by the state of South Dakota Surface Water Quality Standards regulations (See page 12 of the Assessment Report). Along with these assigned uses are narrative and numeric criteria that define the desired water quality of this river segment. These criteria must be maintained for the segment to satisfy its assigned beneficial uses, which are listed below:
• Domestic water supply • Warmwater semi-permanent fish propagation • Limited contact recreation • Fish and wildlife propagation, recreation and stock watering • Irrigation
Individual parameters determine the support of beneficial uses. Use support for limited contact recreation involved monitoring the levels of fecal coliform from May 1 through September 30. This segment experiences excess loading of fecal coliform bacteria due to poor riparian areas, in-stream livestock, feedlot/manure runoff, and/or overflowing sewer systems. Administrative Rules of South Dakota Article 74:51 contains numeric and narrative standards to be applied to the surface waters (i.e. streams, rivers) of the state. To assess the status of the beneficial uses for this river segment, water samples were obtained using SD DENR standard operating procedures and the results were compared to the applicable water quality criteria. Water samples from both the East Dakota Water Development District and the SD DENR ambient water quality monitoring program were utilized.
Willow Creek
Big Sioux River
Watershed Boundaries
N
W E
S
Monitoring Site
Municipality
Tributary
Lake Kampeska
Pelican Lake
Mud
Creek
WillowCreek
Stra
yH
orse
Cre
ek
Castlewood
Watertown
Goodwin

Big Sioux River (Willow Creek to Stray Horse Creek) Total Maximum Daily Load December 2005
East Dakota Water Development District, Brookings, South DakotaEast Dakota Water Development District, Brookings, South DakotaEast Dakota Water Development District, Brookings, South DakotaEast Dakota Water Development District, Brookings, South Dakota 6
The Willow Creek to Stray Horse Creek Big Sioux River Segment is currently assigned a numeric standard of ≤ 2000 cfu/100mL for fecal coliform bacteria. A flow duration interval with hydrologic zones approach was used to assess this segment. This methodology, developed by Bruce Cleland, was used in order to target restoration efforts by dividing the range of flows into hydrologic conditions. For example, if all the exceedences occurred during low-flow conditions, point sources of the pollutant should be suspected. Conversely, if all the exceedences occurred during higher flow periods, then non-point sources of pollution should be suspected. Using Cleland’s approach, the following five hydrologic conditions were utilized: High Flows (0-20 percent), Moist Conditions (20-40 percent), Mid-range Flows (40-60 percent), Dry Conditions (60-90 percent), and Low Flows (90-100 percent). Flow duration interval methodology is explained further in the Methods section of the Assessment Report. Two monitoring locations (Site R17 and Site R18) were setup on this segment and one SD DENR ambient water quality monitoring site (WQM 1) existed on this segment of the Big Sioux River. Of the 56 water samples that were collected, 15 (or 27 percent) violated the water quality standards for fecal coliform bacteria. Based on the water quality violations, this segment is currently not supporting its limited contact recreation beneficial use. One tributary, Willow Creek (Site T35 and Site T36), joins the upper end of this segment and was also assessed for its level of fecal coliform loading. This tributary is also assigned a numeric standard of ≤ 2000 cfu/100mL for fecal coliform bacteria and currently does not support its beneficial uses. Table 2 displays the fecal coliform data collected from May 2001 through September 2002 at Willow Creek. Table 2. Summary of Fecal Data for Willow Creek
At ≤ 2000 cfu/100mL Willow Creek needs reductions of fecal coliform bacteria during high flows and dry conditions. A separate TMDL for Willow Creek has been initiated. It is expected the TMDL for Willow Creek will satisfy the requirements of this TMDL in regards to the load it is contributing to the Willow Creek to Stray Horse Creek segment of the Big Sioux River. Pollutant Assessment Point Sources NPDES facilities taken into consideration within this area include the City of Castlewood and Benchmark Foam, Inc. (Table 3). Total fecal coliform bacteria contribution from these facilities during the study period was zero. Both facilities do not discharge.
Table 3. NPDES Facilities
Permit Number Facility Name Fecal Coliform WLA (counts/day) SD0021580 Castlewood, City of 0.00E+00 SD0025895 Benchmark Foam, Inc. 0.00E+00
Parameter Causing
Impairment
Number of Samples
(May-Sep)
Percent of Samples > 2000 counts/100mL
Minimum Concentration (counts/100mL)
Maximum Concentration (counts/100mL)
Fecal Coliform 19 37 110 930,000

Big Sioux River (Willow Creek to Stray Horse Creek) Total Maximum Daily Load December 2005
East Dakota Water Development District, Brookings, South DakotaEast Dakota Water Development District, Brookings, South DakotaEast Dakota Water Development District, Brookings, South DakotaEast Dakota Water Development District, Brookings, South Dakota 7
Non-point Sources Non-point source pollution, unlike pollution from municipalities and NPDES facilities, comes from many diffuse sources. Potential non-point sources of fecal coliform bacteria include loadings from surface runoff, wildlife, livestock, and leaking septic tanks. Wildlife Wildlife deposit their feces onto land surfaces and in some cases directly into the water. The bacterial load from naturally occurring wildlife is assumed to be background. In addition, any strategy employed to control this source would probably have a negligible impact on attaining water quality standards. Agricultural Agricultural animals are the source of several types of non-point sources as indicated in the Target Reductions & Future Activity Recommendations section of the Assessment Report. Agricultural activities, including runoff from pastureland and cattle in streams, can affect water quality. Livestock data collected during AGNPS Feedlot modeling in this watershed (including the Willow Creek watershed) are listed in Table 4.
Table 4. Livestock Distribution for Willow Creek to Stray Horse Creek Watershed
Septic Systems Data for septic tanks is discussed in the Assessment Report on page 65. Contributions from septic systems were estimated based on rural households because a direct accounting of the number of septic systems in use in the TMDL watershed was unavailable. The 25.6 percent contribution from septic systems was determined by assuming 20 percent of all rural septic systems in the North-Central Big Sioux River watershed area were failing. This percentage does not account for die-off or attenuation of fecal coliform bacteria between failing septic systems and the stream. In general, failing septic systems discharge over land for some distance, where a portion of the fecal coliform bacteria may be absorbed on the soil and surface vegetation before reaching the stream. It is assumed that failing septic systems constitute a diminutive amount of the overall contribution because not all of the failing systems would be reaching the receiving waters. These results will not directly affect the TMDL allocations. Therefore, it is implied that comparatively, failing septic systems are having an insignificant affect on the excess fecal coliform loading and will be included in the margin of safety portion of the TMDL. Urban Areas Fecal coliform bacteria in urban and suburban areas may be attributed to stormwater runoff, overflow of sewer systems, illicit discharge of sanitary waste, leaking septic systems, and pets. Land Use Landuse in the watershed was derived using the AnnAGNPS Model. Table 5 shows that 96 percent of the area is grass or cropland.
Livestock # inDistribution Watershed
Beef Cattle/Calves 19,289Dairy Cattle/Calves 3,294
Heifers 1,970Dry Dairy 375
Pigs 300Bulls 150

Big Sioux River (Willow Creek to Stray Horse Creek) Total Maximum Daily Load December 2005
East Dakota Water Development District, Brookings, South DakotaEast Dakota Water Development District, Brookings, South DakotaEast Dakota Water Development District, Brookings, South DakotaEast Dakota Water Development District, Brookings, South Dakota 8
Table 5. Land Use in the Willow Creek to Stray Horse Creek Segment Linkage Analysis Water quality data was collected at two project monitoring sites (Site R17 and Site R18) and one SD DENR ambient site on the Big Sioux River (WQM 1). Data was also collected at two additional sites from the entering tributary (Willow Creek, Site T35 and Site T36). Samples were collected according to South Dakota’s EPA approved Standard Operating Procedures for Field Samplers. The fecal coliform bacteria water samples were analyzed by the Sioux Falls Health Lab (2001-2002) in Sioux Falls, South Dakota and by the State Health Lab (2004) in Pierre, South Dakota. Quality Assurance/Quality Control samples were collected on 10% of the samples according to South Dakota’s EPA approved Non-point Source Quality Assurance/ Quality Control Plan. Details concerning water sampling techniques, analysis, and quality control are addressed in the assessment final report. The Flow Duration Interval method calculates fecal coliform bacteria loading, (concentration) × (flow), using zones based on hydrologic conditions. Reductions are calculated using the median of the fecal coliform bacteria samples in each zone. This method shows that while a TMDL may be expressed as a single point it can also be thought of as a continuum of points representing the criterion value and various flow values. In order to assess the impact of fecal coliform bacteria for this segment of the Big Sioux River, the flow duration interval curve was divided into “flow zones”. The purpose of the zones is to differentiate hydrologic conditions, between peak and low flows, as ranges. For this segment, the ranges or flow zones are High (0-20), Moist (20-40), Mid-range (40-60), Dry (60-90), and Low (90-100). Load duration curves were calculated using the following equation:
(flow) × (conversion factor) × (state criteria) = quantity/day or daily load This curve represents the threshold of the load. As seen in Figure 3, any samples occurring above this line is an exceedence of the water quality standard and represented by a red box (Table 6). Table 7 depicts the allowable coliform bacteria load during the study for peak flow, low flow, and 5th percentile increments in flow. A flow duration interval graph and fecal exceedence table was also constructed for Willow Creek (Attachment 1).
LandUse Percent AcresCropland 70% 100,548
Rangeland/Grassland 26% 38,226Water 2% 2,887
Building/Farmstead 2% 2,364None 0% 347

Big Sioux River (Willow Creek to Stray Horse Creek) Total Maximum Daily Load December 2005
East Dakota Water Development District, Brookings, South DakotaEast Dakota Water Development District, Brookings, South DakotaEast Dakota Water Development District, Brookings, South DakotaEast Dakota Water Development District, Brookings, South Dakota 9
1.00E+07
1.00E+09
1.00E+11
1.00E+13
1.00E+15
1.00E+17
0 10 20 30 40 50 60 70 80 90
Flow Duration Interval (%)
Feca
l Col
ifor
m B
act
eria
(c
ount
s/da
y)Target
Non-ExceedneceExceedence
Rain Event
90th
Median
Willow Creek to Stray Horse Creek Segment (R17 & R18)2001-2002 & 2004 (May-Sep) EDWDD & DENR Monitoring Data
LowFlows
HighFlows
Moist Conditions
Mid-RangeFlows
Dry Conditions
Figure 3. Flow Duration Interval for the Willow Creek to Stray Horse Creek Segment
Table 6. Exceedences of the Water Quality Standard (≤ 2000 cfu/100mL)
StationSample
DateSample
TimeFlow (cubic feet per second - cfs)
Flow Rank
Flow Rank
(percent)Fecal Coliform (counts/100mL)
Fecal Coliform Load
(counts/day)R18 08/21/02 1245 513.00 0.048 4.78 410000 5.15E+15R17 08/21/02 1145 400.00 0.068 6.84 33000 3.23E+14R18 08/06/02 900 6.70 0.804 80.42 16000 2.62E+12R17 09/26/01 1100 10.00 0.705 70.46 13200 3.23E+12R18 07/09/02 1145 15.00 0.624 62.38 11200 4.11E+12R18 06/10/02 1230 40.00 0.408 40.78 6500 6.36E+12R18 07/14/04 1040 38.00 0.418 41.76 4400 4.09E+12R18 05/17/04 1150 22.00 0.538 53.78 3300 1.78E+12R18 06/16/04 1205 78.00 0.281 28.07 3200 6.11E+12R18 09/09/02 1400 17.00 0.598 59.79 2900 1.21E+12R18 07/01/04 1035 65.00 0.314 31.41 2800 4.45E+12R17 08/07/02 1130 6.80 0.801 80.08 2600 4.33E+11R17 07/24/01 1200 80.00 0.275 27.48 2500 4.89E+12R18 09/08/04 1414 9.00 0.733 73.26 2500 5.51E+11R17 08/25/04 1108 7.30 0.782 78.18 2200 3.93E+11

Big Sioux River (Willow Creek to Stray Horse Creek) Total Maximum Daily Load December 2005
East Dakota Water Development District, Brookings, South DakotaEast Dakota Water Development District, Brookings, South DakotaEast Dakota Water Development District, Brookings, South DakotaEast Dakota Water Development District, Brookings, South Dakota 10
Table 7. Fecal Coliform Target Loads for Flow Allowable Loads 2000 cfu/100mL
Flow Rank (percent) cfs fecal Coliform (counts/day) Flow Conditions
0.019 5197.78 2.54E+14 Peak 0.1 4640.00 2.27E+14
0.274 4432.00 2.17E+14 1 4350.00 2.13E+14 5 500.00 2.45E+13 10 290.00 1.42E+13 15 185.00 9.05E+12 20 132.00 6.46E+12 25 93.00 4.55E+12 30 70.00 3.43E+12 35 55.00 2.69E+12 40 41.00 2.01E+12 45 32.00 1.57E+12 50 26.00 1.27E+12 55 21.00 1.03E+12 60 17.00 8.32E+11 65 13.00 6.36E+11 70 10.00 4.89E+11 75 8.40 4.11E+11 80 6.80 3.33E+11 85 5.50 2.69E+11 90 4.00 1.96E+11 95 1.90 9.30E+10
100 0.01 4.89E+08 Low The Agricultural Non-Point Source Pollution (AGNPS) model is a GIS-integrated water quality model that predicts non-point source loadings within agricultural watersheds. ArcView GIS software was used to spatially analyze animal feeding operations and their pollution potential. The feedlot assessment assumed the probable sources of fecal coliform bacteria loadings within the NCBSR watershed were agricultural related and rated the feedlots based on runoff potential. Feedlot ratings ranged from 0-102. Table 8 lists the 44 feedlots rating 50 or greater and the watershed in which each is located. A rating of 50 or greater warrants concern in regards to potential pollution problems. A map identifying the region of concern is shown in Figure 4. A complete methodology report can be found in Appendix T of the Assessment Report.
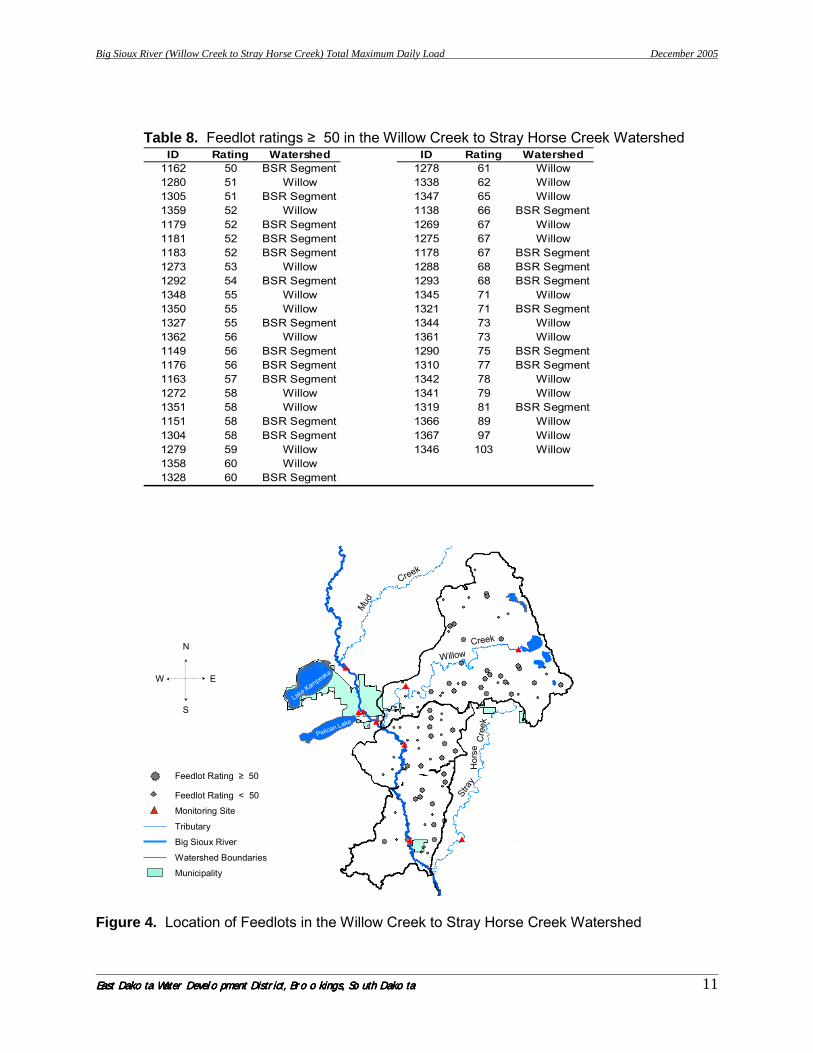
Big Sioux River (Willow Creek to Stray Horse Creek) Total Maximum Daily Load December 2005
East Dakota Water Development District, Brookings, South DakotaEast Dakota Water Development District, Brookings, South DakotaEast Dakota Water Development District, Brookings, South DakotaEast Dakota Water Development District, Brookings, South Dakota 11
Table 8. Feedlot ratings ≥ 50 in the Willow Creek to Stray Horse Creek Watershed
Figure 4. Location of Feedlots in the Willow Creek to Stray Horse Creek Watershed
ID Rating Watershed ID Rating Watershed1162 50 BSR Segment 1278 61 Willow1280 51 Willow 1338 62 Willow1305 51 BSR Segment 1347 65 Willow1359 52 Willow 1138 66 BSR Segment1179 52 BSR Segment 1269 67 Willow1181 52 BSR Segment 1275 67 Willow1183 52 BSR Segment 1178 67 BSR Segment1273 53 Willow 1288 68 BSR Segment1292 54 BSR Segment 1293 68 BSR Segment1348 55 Willow 1345 71 Willow1350 55 Willow 1321 71 BSR Segment1327 55 BSR Segment 1344 73 Willow1362 56 Willow 1361 73 Willow1149 56 BSR Segment 1290 75 BSR Segment1176 56 BSR Segment 1310 77 BSR Segment1163 57 BSR Segment 1342 78 Willow1272 58 Willow 1341 79 Willow1351 58 Willow 1319 81 BSR Segment1151 58 BSR Segment 1366 89 Willow1304 58 BSR Segment 1367 97 Willow1279 59 Willow 1346 103 Willow1358 60 Willow1328 60 BSR Segment
Tributary
Big Sioux River
Watershed Boundaries
N
W E
S
Monitoring Site
Municipality
Feedlot Rating < 50
Feedlot Rating ≥ 50
Lake Kampeska
Pelican Lake
Mud
Creek
WillowCreek
Stra
yH
orse
Cre
ek

Big Sioux River (Willow Creek to Stray Horse Creek) Total Maximum Daily Load December 2005
East Dakota Water Development District, Brookings, South DakotaEast Dakota Water Development District, Brookings, South DakotaEast Dakota Water Development District, Brookings, South DakotaEast Dakota Water Development District, Brookings, South Dakota 12
TMDL Allocations TMDL
Duration Curve Zone (Expressed as counts/day) Segment ID Name TMDL
Component High Moist Mid-Range Dry Low
TMDL 1.42E+13 3.43E+12 1.27E+12 4.11E+11 9.30E+10
10% MOS 1.42E+12 3.43E+11 1.27E+11 4.11E+10 9.30E+09
Total
Allocations 1.28E+13 3.09E+12 1.15E+12 3.70E+11 8.37E+10
LA 1.28E+13 3.09E+12 1.15E+12 3.70E+11 8.37E+10
Castlewood, City of WLA - - - - -
Benchmark Foam, Inc. WLA - - - - - Background 2.56E+11 6.17E+10 2.29E+10 7.40E+09 1.67E+09
SD-BS-R-Big_Sioux_03
Other NPS 1.25E+13 3.03E+12 1.12E+12 3.63E+11 8.20E+10 Wasteload Allocations (WLAs) NPDES facilities are permitted to discharge effluent at the bacteria standard. When operating properly, they will not cause or contribute to water quality violations. Their contributions are relatively small in comparison to the total loading of the segment. Most dischargers operate well within their permit limits and discharge smaller loads than allowed. New or increases in discharges affecting this segment will be required to meet bacterial standards prior to discharge. This ensures these additions of load will not cause violations of water quality standards. Identified point sources in this watershed currently do not discharge. Therefore, the “wasteload allocation” component of this TMDL will be zero. Load Allocations (LAs) Load allocations account for the portion of the TMDL assigned to non-point sources. Natural background constitutes two percent of the total and the remainder of the LA is assigned to those land uses likely to contribute fecal coliform bacteria loads at rates above natural background. This includes cropland, pastureland, and residential areas. Based on the flow duration interval method, reductions are needed from non-point sources during high flow conditions. Seasonal Variation Different seasons of the year can yield differences in water quality due to changes in precipitation and agricultural practices. When a rainfall event occurs, fecal coliform bacteria that have built up on the land surface under dry conditions are washed off and finally deposited into lakes, rivers, and wetlands. To determine seasonal differences, runoff events were noted for the East Dakota Water Development District samples. The ambient water quality samples from the SD DENR were compared to historic precipitation data. Monitoring sites R17 and R18 on the Willow Creek to Stray Horse Creek segment of the Big Sioux River are not meeting the water quality criteria for fecal coliform bacteria. Of the 15 samples that were exceeding the ≤ 2000 cfu/100mL standard, seven (or 47 percent) occured during rain events. Margin of Safety The margin of safety (MOS) is a portion of the loading capacity that is set aside to prevent the exceedence of a water quality standard as a means of accounting for the uncertainty involved in developing a TMDL. The MOS for this TMDL is explicit, meaning a specific quantity, in this case 10%, of the loading is set aside. This explicit MOS takes into consideration the uncertainties associated with flow and non-point sources.

Big Sioux River (Willow Creek to Stray Horse Creek) Total Maximum Daily Load December 2005
East Dakota Water Development District, Brookings, South DakotaEast Dakota Water Development District, Brookings, South DakotaEast Dakota Water Development District, Brookings, South DakotaEast Dakota Water Development District, Brookings, South Dakota 13
Critical Conditions The critical condition for fecal coliform loadings in any watershed depends on the presence of point sources and land use within that watershed. During a dry period, typically the critical condition is non-point sources followed by a rainfall event. During the rainfall event, fecal coliform bacteria that have built up on the land surface can wash into the stream, causing wet weather exceedences. Follow-Up Monitoring Monitoring and evaluation efforts will be targeted toward the effectiveness of implemented BMPs. Sample sites will be based on BMP site selection and include the parameter of fecal coliform bacteria. Once the implementation project is completed, post-implementation monitoring will be necessary to assure that the TMDL has been reached and improvement to the beneficial uses occurs. This will be achieved by recurrent water quality sampling at the original monitoring sites. Public Participation Efforts taken to gain public education, review, and comment during development of the TMDL involved: 1. East Dakota Water Development District monthly board meetings 2. Field demonstrations for the public 3. Articles in the local newspapers The findings from these public meetings and comments have been taken into consideration in development of the Big Sioux River Segment –Willow Creek to Stray Horse Creek TMDL. Implementation Plan The TMDL analysis was performed using the best data available to specify the fecal coliform reductions necessary to achieve water quality criteria. The intent of meeting the criteria is to support the designated use classifications of this segment. A detailed implementation plan is not included in this TMDL. The involvement of local land owners and agencies will be needed in order to develop an implementation plan. In general, reductions in fecal coliform bacteria should be sought through identification and installation of agricultural and urban BMPs to reduce loads during runoff events. To guide implementation efforts the existing condition was calculated by multiplying the median concentration by the median of the flow from each flowzone. The target load is the median of the flow multiplied by the numeric standard (≤ 2,000 cfu/100mL) for fecal coliform bacteria. The percent reduction is the difference between the existing and target load with a 10% MOS for uncertainties due to variation in flow. Using this baseline, this segment requires reducing the fecal coliform counts per day by 10 percent during high flow conditions (Table 9). Additional controls may be needed in order to achieve the applicable water quality standards and meet the TMDL goal for this segment as the median concentration is used here as a starting point. Willow Creek was the only one tributary affecting this segment, with an assigned numeric standard for fecal coliform bacteria. It was also assessed at ≤ 2,000 cfu/100mL numeric standard (Table 10). The high flow and dry condition reductions shown in Table 10 are based on the median concentration from flowzone.

Big Sioux River (Willow Creek to Stray Horse Creek) Total Maximum Daily Load December 2005
East Dakota Water Development District, Brookings, South DakotaEast Dakota Water Development District, Brookings, South DakotaEast Dakota Water Development District, Brookings, South DakotaEast Dakota Water Development District, Brookings, South Dakota 14
Table 9. Willow Creek to Stray Horse Creek Fecal Coliform Bacteria Reductions
Table 10. Willow Creek Fecal Coliform Bacteria Reductions
High Moist Mid-Range Dry Low Flows(0-20) (20-40) (40-60) (60-90) (90-100)
Median Concentration (counts/day) 4.97E+10 1.90E+10 1.81E+10 2.35E+10 ------Flow Median (cfs) 290 70 26 8.4 1.9
= Existing 1.44E+13 1.33E+12 4.70E+11 1.97E+11 ------
Target Load (at 2,000 cfu/100mL) 1.42E+13 3.43E+12 1.27E+12 4.11E+11 9.30E+10% Reduction w/MOS 10 0 0 0 ------
X
Note: units are counts/day
Median
High Moist Mid-Range Dry Low Flows(0-10) (10-40) (40-60) (60-90) (90-100)
Median Concentration (counts/day) 2.05E+11 1.74E+10 7.20E+09 4.45E+10 ------Flow Median (cfs) 109 10 2 0.4 0.05
= Existing 2.23E+13 1.74E+11 1.44E+10 1.78E+10 ------
Target Load (at 2,000 cfu/100mL) 5.33E+12 4.89E+11 9.79E+10 1.86E+10 2.45E+09% Reduction w/MOS 78 0 0 5 ------
Note: units are counts/day
Median
X

East Dakota Water Development District, Brookings, South DakotaEast Dakota Water Development District, Brookings, South DakotaEast Dakota Water Development District, Brookings, South DakotaEast Dakota Water Development District, Brookings, South Dakota Attachment 1Attachment 1Attachment 1Attachment 1
Willow Creek Exceedence Table & Flow Duration Interval
1.00E+07
1.00E+09
1.00E+11
1.00E+13
1.00E+15
0 10 20 30 40 50 60 70 80 90
Flow Duration Interval (%)
Feca
l Col
ifor
m B
acte
ria
(cou
nts/
day)
Target
Non-ExceedneceExceedence
Rain Event
90th
Median
Willow Creek (T35 and T36)
DryConditions
LowFlows
HighFlows
Mid-rangeFlows
MoistConditions
StationSample
DateSample
TimeFlow (cubic feet per second - cfs)
Flow Rank
Flow Rank
(percent)Fecal Coliform (counts/100mL)
Fecal Coliform Load
(counts/day)T35 08/21/02 915 0.48 0.700 70.30 930000 1.09E+13T36 08/21/02 1015 242.00 0.023 2.28 110000 6.51E+14T35 09/09/02 1000 0.72 0.630 62.96 28000 4.95E+11T36 06/14/01 1130 76.00 0.069 6.94 12000 2.23E+13T36 07/20/01 1215 4.00 0.392 39.20 8100 7.93E+11T35 08/27/01 1000 0.81 0.611 61.06 4400 8.76E+10T36 08/27/01 1040 0.54 0.673 67.26 2500 3.30E+10

Appendix FF. TMDL –Willow Creek
(Fecal Coliform Bacteria)
FF-1

Willow Creek Total Maximum Daily Load December 2005
East Dakota Water Development District, Brookings, South DakotaEast Dakota Water Development District, Brookings, South DakotaEast Dakota Water Development District, Brookings, South DakotaEast Dakota Water Development District, Brookings, South Dakota 2
TOTAL MAXIMUM DAILY LOAD EVALUATION (Fecal Coliform Bacteria)
for
Willow Creek
(HUC 10170202)
Deuel and Codington Counties, South Dakota
East Dakota Water Development District Brookings, South Dakota
December 2005

Willow Creek Total Maximum Daily Load December 2005
East Dakota Water Development District, Brookings, South DakotaEast Dakota Water Development District, Brookings, South DakotaEast Dakota Water Development District, Brookings, South DakotaEast Dakota Water Development District, Brookings, South Dakota 3
Willow Creek Total Maximum Daily Load Waterbody Type: Stream Assessment Unit ID: SD-BS-R-WILLOW_01 303(d) Listing Parameter: Fecal Coliform Bacteria Designated Uses: Warmwater Marginal Fish Life Propagation Limited Contact Recreation Fish and Wildlife Propagation Recreation and Stock Watering Irrigation Size of Waterbody: 25.2 miles (approximately) Size of Watershed: 79,931 acres Water Quality Standards: Narrative and Numeric Indicators: Water Chemistry Analytical Approach: Modeling and Assessment Techniques used include Flow
Duration Interval, AGNPS Model, and AnnAGNPS Model Location: HUC Code: 10170202 Goal: Full Support of the Limited Contact Recreation Beneficial Use
during the months of May through September Target: ≤ 2000 cfu/100mL of fecal coliform bacteria (any one sample)
during the months of May through September Objective The intent of this summary is to clearly identify the components of the TMDL submittal to support adequate public participation and facilitate the US Environmental Protection Agency (EPA) review and approval. The TMDL was developed in accordance with Section 303(d) of the federal Clean Water Act and guidance developed by EPA. Introduction The mainstem of Willow Creek is approximately 25.2 miles in length with a watershed of approximately 79,931 acres. This tributary is located within the Big Sioux River Basin (HUC 10170202) in the eastern part of Codington County and northwestern Deuel County, South Dakota. The watershed of this stream lies within Grant, Deuel, and Codington Counties as shown by the shaded region in Figure 1 and is included as part of the North-Central Big Sioux River Watershed Assessment Project. The entire study area for this project is also outlined in Figure 1. The North-Central Big Sioux River Watershed Assessment Project identified Willow Creek for TMDL development due to not meeting the water quality criteria for fecal coliform bacteria. Information supporting this listing was derived from East Dakota Water Development District monitoring data. Willow Creek was not on any 303(d) State Waterbody lists prior to this assessment. Appendix B of the assessment report summarizes the data collected during the North-Central Big Sioux River Watershed Assessment Project from April 2001 through October 2002.

Willow Creek Total Maximum Daily Load December 2005
East Dakota Water Development District, Brookings, South DakotaEast Dakota Water Development District, Brookings, South DakotaEast Dakota Water Development District, Brookings, South DakotaEast Dakota Water Development District, Brookings, South Dakota 4
Willow Creek
Big Sioux River
Watershed Boundaries
N
W E
S
Monitoring Site
Municipality
BigSioux
River
MudCree
k
Creek
Willow
Watertown
Goodwin
Kranzburg
Figure 1. Location of Willow Creek and its Watershed in South Dakota. Problem Identification Willow Creek begins at the outlet of Round Lake and then joins the Big Sioux River about 1 mile south of the City of Watertown. The watershed area shown in Figure 2 drains approximately 95 percent grass/grazing land and cropland acres. The municipality of Watertown borders this area.
Figure 2. Willow Creek Watershed
BrookingsCounty
GrantCounty
DeuelCounty
HamlinCounty
CodingtonCounty
Monitoring Site
Willow Creek Watershed
Lake
Stream
Big Sioux River
Community
North-Central BSR Watershed

Willow Creek Total Maximum Daily Load December 2005
East Dakota Water Development District, Brookings, South DakotaEast Dakota Water Development District, Brookings, South DakotaEast Dakota Water Development District, Brookings, South DakotaEast Dakota Water Development District, Brookings, South Dakota 5
Willow Creek (Site T35 and Site T36) was found to carry fecal coliform bacteria which degrades water quality. This stream is considered impaired because more than 25 percent of the values (of less than 20 samples) exceeded the numeric criteria of ≤ 2000 counts per 100 milliliters of fecal coliform bacteria. This stream requires reducing the fecal coliform counts per day during high flow and dry conditions. Table 1 displays the fecal coliform data collected from May 2001 through September 2002.
Table 1. Summary of Fecal Coliform Data for the Willow Creek Description of Applicable Water Quality Standards & Numeric Water Quality Targets Willow Creek has been assigned beneficial uses by the state of South Dakota Surface Water Quality Standards regulations (See page 12 of the Assessment Report). Along with these assigned uses are narrative and numeric criteria that define the desired water quality of this stream. These criteria must be maintained for the stream to satisfy its assigned beneficial uses, which are listed below:
• Warmwater marginal fish life propagation • Limited contact recreation • Fish and wildlife propagation, recreation and stock watering • Irrigation
Individual parameters determine the support of beneficial uses. Use support for limited contact recreation involved monitoring the levels of fecal coliform from May 1 through September 30. This stream experiences excess loading of fecal coliform bacteria due to poor riparian areas, in-stream livestock, feedlot/manure runoff, and/or overflowing sewer systems. Administrative Rules of South Dakota Article 74:51 contains numeric and narrative standards to be applied to the surface waters (i.e. streams, rivers) of the state. To assess the status of the beneficial uses for this stream, water samples were obtained using SD DENR standard operating procedures and the results were compared to the applicable water quality criteria. Willow Creek is currently assigned a numeric standard of ≤ 2000 cfu/100mL for fecal coliform bacteria. A flow duration interval with hydrologic zones approach was used to assess this stream. This methodology, developed by Bruce Cleland, was used in order to target restoration efforts by dividing the range of flows into hydrologic conditions. For example, if all the exceedences occurred during low-flow conditions, point sources of the pollutant should be suspected. Conversely, if all the exceedences occurred during higher flow periods, then non-point sources of pollution should be suspected. Using Cleland’s approach, the following five hydrologic conditions were utilized: High Flows (0-10 percent), Moist Conditions (10-40 percent), Mid-Range Flows (40-60 percent), Dry Conditions (60-90 percent), and Low Flows (90-100 percent). The methodology of flow duration intervals is explained further in the Methods section of the Assessment Report.
Parameter Causing
Impairment
Number of Samples
(May-Sep)
Percent of Samples > 2000 counts/100mL
Minimum Concentration (counts/100mL)
Maximum Concentration (counts/100mL)
Fecal Coliform 19 37 110 930,000

Willow Creek Total Maximum Daily Load December 2005
East Dakota Water Development District, Brookings, South DakotaEast Dakota Water Development District, Brookings, South DakotaEast Dakota Water Development District, Brookings, South DakotaEast Dakota Water Development District, Brookings, South Dakota 6
Two monitoring locations (Site T35 and Site T36) were setup on this stream. Of the 19 water samples that were collected, seven (or 37 percent) violated the water quality standards for fecal coliform bacteria. Based on the water quality violations, this stream is currently not supporting its limited contact recreation beneficial use. Pollutant Assessment Point Sources Benchmark Foam, Inc., was the only identified NPDES facility within this area taken into consideration. Total fecal coliform bacteria contribution from this facility during the study period was zero. This facility did not discharge during this period.
Table 2. NPDES Facilities
Permit Number Facility Name Fecal Coliform WLA (counts/day) SD0025895 Benchmark Foam, Inc. 0.00E+00
Non-point Sources Non-point source pollution, unlike pollution from municipalities and NPDES, comes from many diffuse sources. Potential non-point sources of fecal coliform bacteria include loadings from surface runoff, wildlife, livestock, and leaking septic tanks. Wildlife Wildlife deposit their feces onto land surfaces and in some cases directly into the water. The bacterial load from naturally occurring wildlife is assumed to be background. In addition, any strategy employed to control this source would probably have a negligible impact on attaining water quality standards. Agricultural Agricultural animals are the source of several types of non-point sources as indicated in the Target Reductions & Future Activity Recommendations section of the Assessment Report. Agricultural activities, including runoff from pastureland and cattle in streams, can affect water quality. Livestock data collected in watershed during AGNPS Feedlot assessment are listed in Table 3.
Table 3. Livestock Distribution for the Willow Creek Watershed
Septic Systems Data for septic tanks is discussed in the Assessment Report on page 65. Contributions from septic systems were estimated based on rural households because a direct accounting of the number of septic systems in use in the TMDL watershed was unavailable. The 25.6 percent contribution from septic systems was determined by assuming 20 percent of all rural septic systems in the North-Central Big Sioux River watershed area were failing. This percentage does not account for die-off or attenuation of fecal coliform bacteria between failing septic systems and the stream. In general, failing septic systems discharge over land for some
Livestock Willow Distribution Creek (T35, T36)
Beef Cattle/Calves 8140Dairy Cattle 1479
Heifers 615Dry Dairy 50

Willow Creek Total Maximum Daily Load December 2005
East Dakota Water Development District, Brookings, South DakotaEast Dakota Water Development District, Brookings, South DakotaEast Dakota Water Development District, Brookings, South DakotaEast Dakota Water Development District, Brookings, South Dakota 7
distance, where a portion of the fecal coliform bacteria may be absorbed on the soil and surface vegetation before reaching the stream. It is assumed that failing septic systems constitute a diminutive amount of the overall contribution because not all of the failing systems would be reaching the receiving waters. These results will not directly affect the TMDL allocations. Therefore, it is implied that comparatively, failing septic systems are having an insignificant affect on the excess fecal coliform loading and will be included in the margin of safety portion of the TMDL. Urban Areas Fecal coliform bacteria in urban and suburban areas may be attributed to stormwater runoff, overflow of sewer systems, illicit discharge of sanitary waste, leaking septic systems, and pets. Land Use Landuse in the watershed was derived using the AnnAGNPS Model. Table 4 shows that 95 percent of the area is grass or cropland.
Table 4. Land Use in the Willow Creek Watershed Linkage Analysis Water quality data was collected at two project monitoring sites (Site T35 and Site T36) on Willow Creek. Samples were collected according to South Dakota’s EPA approved Standard Operating Procedures for Field Samplers. The fecal coliform bacteria water samples were analyzed by the Sioux Falls Health Lab (2001-2002) in Sioux Falls, South Dakota. Quality Assurance/Quality Control samples were collected on 10% of the samples according to South Dakota’s EPA approved Non-point Source Quality Assurance/ Quality Control Plan. Details concerning water sampling techniques, analysis, and quality control are addressed in the assessment final report. The Flow Duration Interval method calculates fecal coliform bacteria loading, (concentration) × (flow), using zones based on hydrologic conditions. Reductions are calculated using the median of the fecal coliform bacteria samples in each zone. This method shows that while a TMDL may be expressed as a single point it can also be thought of as a continuum of points representing the criterion value and various flow values. In order to assess the impact of fecal coliform bacteria for this stream, the flow duration interval curve was divided into “flow zones”. The purpose of the zones is to differentiate hydrologic conditions, between peak and low flows, as ranges. For this stream, the ranges or flow zones are High (0-10), Moist (10-40), Mid-Range (40-60), Dry (60-90), and Low (90-100). Load duration curves were calculated using the following equation:
(flow) × (conversion factor) × (state criteria) = quantity/day or daily load This curve represents the threshold of the load. As seen in Figure 3, any samples occurring above this line is an exceedence of the water quality standard and represented by a red box (Table 5). Table 6 depicts the allowable coliform bacteria load during the study for peak flow, low flow, and 5th percentile increments in flow.
LandUse Percent AcresCropland 62% 49,319
Rangeland/Grassland 33% 26,511Water 4% 2,887
Building/Farmstead 1% 1,168None 0% 46

Willow Creek Total Maximum Daily Load December 2005
East Dakota Water Development District, Brookings, South DakotaEast Dakota Water Development District, Brookings, South DakotaEast Dakota Water Development District, Brookings, South DakotaEast Dakota Water Development District, Brookings, South Dakota 8
Figure 3. Flow Duration Interval for Willow Creek Table 5. Exceedences of the Water Quality Standard (≤ 2000 cfu/100mL)
1.00E+07
1.00E+09
1.00E+11
1.00E+13
1.00E+15
0 10 20 30 40 50 60 70 80 90
Flow Duration Interval (%)
Feca
l Col
ifor
m B
acte
ria
(cou
nts/
day)
Target
Non-ExceedneceExceedence
Rain Event
90th
Median
Willow Creek (T35 and T36)
DryConditions
LowFlows
HighFlows
Mid-rangeFlows
MoistConditions
StationSample
DateSample
TimeFlow (cubic feet per second - cfs)
Flow Rank
Flow Rank
(percent)Fecal Coliform (counts/100mL)
Fecal Coliform Load
(counts/day)T35 08/21/02 915 0.48 0.700 70.30 930000 1.09E+13T36 08/21/02 1015 242.00 0.023 2.28 110000 6.51E+14T35 09/09/02 1000 0.72 0.630 62.96 28000 4.95E+11T36 06/14/01 1130 76.00 0.069 6.94 12000 2.23E+13T36 07/20/01 1215 4.00 0.392 39.20 8100 7.93E+11T35 08/27/01 1000 0.81 0.611 61.06 4400 8.76E+10T36 08/27/01 1040 0.54 0.673 67.26 2500 3.30E+10

Willow Creek Total Maximum Daily Load December 2005
East Dakota Water Development District, Brookings, South DakotaEast Dakota Water Development District, Brookings, South DakotaEast Dakota Water Development District, Brookings, South DakotaEast Dakota Water Development District, Brookings, South Dakota 9
Table 6. Fecal Coliform Target Loads for Flow Allowable Loads 2000 cfu/100mL
Flow Rank (percent) cfs fecal Coliform (counts/day) Flow Conditions
0.019 6913.84 3.38E+14 Peak 0.1 6700.00 3.28E+14
0.274 6659.46 3.26E+14 1 6651.00 3.25E+14 5 109.00 5.33E+12
10 49.00 2.40E+12 15 27.00 1.32E+12 20 17.00 8.32E+11 25 10.00 4.89E+11 30 7.10 3.47E+11 35 5.30 2.59E+11 40 3.71 1.81E+11 45 2.80 1.37E+11 50 2.00 9.79E+10 55 1.30 6.36E+10 60 0.88 4.31E+10 65 0.64 3.13E+10 70 0.48 2.35E+10 75 0.38 1.86E+10 80 0.27 1.32E+10 85 0.18 8.81E+09 90 0.11 5.38E+09 95 0.05 2.45E+09
100 0.01 4.89E+08 Low The Agricultural Non-Point Source Pollution (AGNPS) model is a GIS-integrated water quality model that predicts non-point source loadings within agricultural watersheds. ArcView GIS software was used to spatially analyze animal feeding operations and their pollution potential. The feedlot assessment assumed the probable sources of fecal coliform bacteria loadings within the NCBSR watershed were agricultural related and rated the feedlots based on runoff potential. Feedlot ratings ranged from 0-102. Table 7 lists the 23 feedlots rating 50 or greater. A rating of 50 or greater warrants concern in regards to potential pollution problems. A map identifying the region of concern is shown in Figure 4. A complete methodology report can be found in Appendix T of the Assessment Report.

Willow Creek Total Maximum Daily Load December 2005
East Dakota Water Development District, Brookings, South DakotaEast Dakota Water Development District, Brookings, South DakotaEast Dakota Water Development District, Brookings, South DakotaEast Dakota Water Development District, Brookings, South Dakota 10
Table 7. Feedlot ratings ≥ 50 in the Willow Creek Watershed
Figure 4. Location of Feedlots in the Willow Creek Watershed
ID Rating ID Rating1280 51 1347 651359 52 1269 671273 53 1275 671348 55 1345 711350 55 1344 731362 56 1361 731272 58 1342 781351 58 1341 791279 59 1366 891358 60 1367 971278 61 1346 1031338 62
Tributary
Big Sioux River
Watershed Boundaries
Monitoring Site
Municipality
Feedlot Rating < 50
Feedlot Rating ≥ 50
N
W E
S
Lake Kampeska
Pelican Lake
Watertown Willow

Willow Creek Total Maximum Daily Load December 2005
East Dakota Water Development District, Brookings, South DakotaEast Dakota Water Development District, Brookings, South DakotaEast Dakota Water Development District, Brookings, South DakotaEast Dakota Water Development District, Brookings, South Dakota 11
TMDL Allocations TMDL
Duration Curve Zone (Expressed as counts/day) Segment ID Name TMDL
Component High Moist Mid-Range Dry Low
TMDL 5.33E+12 4.89E+11 9.79E+10 1.86E+10 2.45E+09 10% MOS 5.33E+11 4.89E+10 9.79E+09 1.86E+09 2.45E+08
Total
Allocations 4.80E+12 4.40E+11 8.81E+10 1.67E+10 2.21E+09
LA 4.80E+12 4.40E+11 8.81E+10 1.67E+10 2.21E+09
Benchmark Foam, Inc. WLA - - - - -
Background 9.59E+10 8.80E+09 1.76E+09 3.35E+08 4.41E+07
SD-BS-R-WILLOW_01
Other NPS 4.70E+12 4.31E+11 8.63E+10 1.64E+10 2.16E+09
Wasteload Allocations (WLAs) NPDES facilities are permitted to discharge effluent at the bacteria standard. When operating properly, they will not cause or contribute to water quality violations. Their contributions are relatively small in comparison to the total loading of the stream. Most dischargers operate well within their permit limits and discharge smaller loads than allowed. New or increases in discharges affecting this stream will be required to meet bacterial standards prior to discharge. This ensures these additions of load will not cause violations of water quality standards. Identified point sources in this watershed currently do not discharge. Therefore, the “wasteload allocation” component of this TMDL will be zero. Load Allocations (LAs) Load allocations account for the portion of the TMDL assigned to non-point sources. Natural background constitutes two percent of the total and the remainder of the LA is assigned to those land uses likely to contribute fecal coliform bacteria loads at rates above natural background. This includes cropland, pastureland, and residential areas. Based on the flow duration interval method, reductions will be needed during high flow and dry conditions from non-point sources. Seasonal Variation Different seasons of the year can yield differences in water quality due to changes in precipitation and agricultural practices. When a rainfall event occurs, fecal coliform bacteria that have built up on the land surface under dry conditions are washed off and finally deposited into lakes, rivers, and wetlands. To determine seasonal differences, runoff events were noted for the East Dakota Water Development District samples. Monitoring sites T35 and T36 on Willow Creek are not meeting the water quality criteria for fecal coliform bacteria. Of the seven samples that were exceeding the ≤ 2000 cfu/100mL standard, four (or 57 percent) occurred during rain events. Margin of Safety The margin of safety (MOS) is a portion of the loading capacity that is set aside to prevent the exceedence of a water quality standard as a means of accounting for the uncertainty involved in developing a TMDL. The MOS for this TMDL is explicit, meaning a specific quantity, in this case 10%, of the loading is set aside. This explicit MOS takes into consideration the uncertainties associated with flow and non-point sources.

Willow Creek Total Maximum Daily Load December 2005
East Dakota Water Development District, Brookings, South DakotaEast Dakota Water Development District, Brookings, South DakotaEast Dakota Water Development District, Brookings, South DakotaEast Dakota Water Development District, Brookings, South Dakota 12
Critical Conditions The critical condition for fecal coliform loadings in any watershed depends on the presence of point sources and land use within that watershed. During a dry period, typically the critical condition is non-point sources followed by a rainfall event. During the rainfall event, fecal coliform bacteria that have built up on the land surface can wash into the stream, causing wet weather exceedences. Follow-Up Monitoring Monitoring and evaluation efforts will be targeted toward the effectiveness of implemented BMPs. Sample sites will be based on BMP site selection and include the parameter of fecal coliform bacteria. Once the implementation project is completed, post-implementation monitoring will be necessary to assure that the TMDL has been reached and improvement to the beneficial uses occurs. This will be achieved by recurrent water quality sampling at the original monitoring sites. Public Participation Efforts taken to gain public education, review, and comment during development of the TMDL involved: 1. East Dakota Water Development District monthly board meetings 2. Field demonstrations for the public 3. Articles in the local newspapers The findings from these public meetings and comments have been taken into consideration in development of the Willow Creek TMDL. Implementation Plan The TMDL analysis was performed using the best data available to specify the fecal coliform reductions necessary to achieve water quality criteria. The intent of meeting the criteria is to support the designated use classifications of this stream. A detailed implementation plan is not included in this TMDL. The involvement of local land owners and agencies will be needed in order to develop an implementation plan. In general, reductions in fecal coliform bacteria should be sought through identification and installation of agricultural BMPs to reduce loads during runoff events and during dry periods. To guide implementation efforts the existing condition was calculated by multiplying the median concentration by the median of the flow from each flowzone. The target load is the median of the flow multiplied by the numeric standard (≤ 2,000 cfu/100mL) for fecal coliform bacteria. The percent reduction is the difference between the existing and target load with a 10% MOS for uncertainties due to variation in flow. Using this baseline, this segment requires reducing the fecal coliform counts per day by 78 percent during high flow conditions and 5 percent during dry conditions (Table 9). Additional controls may be needed in order to achieve the applicable water quality standards and meet the TMDL goal for this segment as the median concentration is used here as a starting point.

Willow Creek Total Maximum Daily Load December 2005
East Dakota Water Development District, Brookings, South DakotaEast Dakota Water Development District, Brookings, South DakotaEast Dakota Water Development District, Brookings, South DakotaEast Dakota Water Development District, Brookings, South Dakota 13
Table 8. Willow Creek Fecal Coliform Bacteria Reductions
High Moist Mid-Range Dry Low Flows(0-10) (10-40) (40-60) (60-90) (90-100)
Median Concentration (counts/day) 2.05E+11 1.74E+10 7.20E+09 4.45E+10 ------Flow Median (cfs) 109 10 2 0.4 0.05
= Existing 2.23E+13 1.74E+11 1.44E+10 1.78E+10 ------
Target Load (at 2,000 cfu/100mL) 5.33E+12 4.89E+11 9.79E+10 1.86E+10 2.45E+09% Reduction w/MOS 78 0 0 5 ------
Note: units are counts/day
Median
X

Appendix GG. TMDL – Stray Horse Creek
(Fecal Coliform Bacteria)
GG-1
Stray Horse Creek Total Maximum Daily Load December 2005
East Dakota Water Development District, Brookings, South East Dakota Water Development District, Brookings, South East Dakota Water Development District, Brookings, South East Dakota Water Development District, Brookings, South DakotaDakotaDakotaDakota 2
TOTAL MAXIMUM DAILY LOAD EVALUATION (Fecal Coliform Bacteria)
for
Stray Horse Creek
(HUC 10170202)
Hamlin and Codington Counties, South Dakota
East Dakota Water Development District Brookings, South Dakota
December 2005

Stray Horse Creek Total Maximum Daily Load December 2005
East Dakota Water Development District, Brookings, South East Dakota Water Development District, Brookings, South East Dakota Water Development District, Brookings, South East Dakota Water Development District, Brookings, South DakotaDakotaDakotaDakota 3
Stray Horse Creek Total Maximum Daily Load Waterbody Type: Stream Assessment Unit ID: SD-BS-R-STRAYHORSE_01 303(d) Listing Parameter: Fecal Coliform Bacteria Designated Uses: Warmwater Marginal Fish Life Propagation Limited Contact Recreation Fish and Wildlife Propagation Recreation and Stock Watering Irrigation Size of Waterbody: 23.2 miles (approximately) Size of Watershed: 57,548 acres Water Quality Standards: Narrative and Numeric Indicators: Water Chemistry Analytical Approach: Modeling and Assessment Techniques used include Flow
Duration Interval, AGNPS Model, and AnnAGNPS Model Location: HUC Code: 10170202 Goal: Full Support of the Limited Contact Recreation Beneficial Use
durin the months of May through September Target: ≤ 2000 cfu/100mL of fecal coliform bacteria (any one sample)
during the months of May through September
Objective The intent of this summary is to clearly identify the components of the TMDL submittal to support adequate public participation and facilitate the US Environmental Protection Agency (EPA) review and approval. The TMDL was developed in accordance with Section 303(d) of the federal Clean Water Act and guidance developed by EPA. Introduction The mainstem of Stray Horse Creek, beginning south of Kranzburg, is approximately 23.2 miles with a watershed of approximately 57,548 acres. This tributary is located within the Big Sioux River Basin (HUC 10170202) in the north-central part of Hamlin County and southeastern Codington County, South Dakota. The watershed of this stream lies within Hamlin, Deuel, and Codington Counties as shown by the shaded region in Figure 1 and is included as part of the North-Central Big Sioux River Watershed Assessment Project. The entire study area for this project is also outlined in Figure 1. The North-Central Big Sioux River Watershed Assessment Project identified Stray Horse Creek for TMDL development due to not meeting the water quality criteria for fecal coliform bacteria. Information supporting this listing was derived from East Dakota Water Development District monitoring data. Stray Horse Creek has not been on any 303(d) State Waterbody lists prior to this assessment. Appendix B of the assessment report summarizes the data collected during the North-Central Big Sioux River Watershed Assessment Project from June 2001 through October 2002.

Stray Horse Creek Total Maximum Daily Load December 2005
East Dakota Water Development District, Brookings, South East Dakota Water Development District, Brookings, South East Dakota Water Development District, Brookings, South East Dakota Water Development District, Brookings, South DakotaDakotaDakotaDakota 4
Stray Horse Creek
Big Sioux River
Watershed Boundaries
N
W E
S
Monitoring Site
Municipality
BigSioux
River
Hor
seC
reek
Goodwin
Kranzburg
Stra
y
Castlewood
Figure 1. Location of Stray Horse Creek and its Watershed in South Dakota. Problem Identification Stray Horse Creek begins near the City of Kranzburg and then joins the Big Sioux River about two miles southeast of Castlewood. The watershed area shown in Figure 2 drains approximately 97 percent grass/grazing land and cropland acres. The municipalities of Kranzburg and Goodwin are located in this area.
Figure 2. Stray Horse Creek Watershed
BrookingsCounty
GrantCounty
DeuelCounty
HamlinCounty
CodingtonCounty
Monitoring Site
Stray Horse Creek Watershed
Lake
Stream
Big Sioux River
Community
North-Central BSR Watershed

Stray Horse Creek Total Maximum Daily Load December 2005
East Dakota Water Development District, Brookings, South East Dakota Water Development District, Brookings, South East Dakota Water Development District, Brookings, South East Dakota Water Development District, Brookings, South DakotaDakotaDakotaDakota 5
Stray Horse Creek (Site T37) was found to carry fecal coliform bacteria which degrades water quality. This stream is considered impaired because more than 25 percent of the values (of less than 20 samples) exceeded the numeric criteria of ≤ 2000 counts per 100 milliliters of fecal coliform bacteria. This stream requires reducing the fecal coliform counts per day during high flows. Table 1 displays the fecal coliform data collected from June 2001 through September 2002.
Table 1. Summary of Fecal Coliform Data for the Stray Horse Creek Description of Applicable Water Quality Standards & Numeric Water Quality Targets Stray Horse Creek has been assigned beneficial uses by the state of South Dakota Surface Water Quality Standards regulations (See page 12 of the Assessment Report). Along with these assigned uses are narrative and numeric criteria that define the desired water quality of this stream. These criteria must be maintained for the stream to satisfy its assigned beneficial uses, which are listed below:
• Warmwater marginal fish life propagation • Limited contact recreation • Fish and wildlife propagation, recreation and stock watering • Irrigation
Individual parameters determine the support of beneficial uses. Use support for limited contact recreation involved monitoring the levels of fecal coliform from May 1 through September 30. This stream experiences excess loading of fecal coliform bacteria due to poor riparian areas, in-stream livestock, feedlot/manure runoff, and/or overflowing sewer systems. Administrative Rules of South Dakota Article 74:51 contains numeric and narrative standards to be applied to the surface waters (i.e. streams, rivers) of the state. To assess the status of the beneficial uses for this stream, water samples were obtained using SD DENR standard operating procedures and the results were compared to the applicable water quality criteria. Stray Horse Creek is currently assigned a numeric standard of ≤ 2000 cfu/100mL for fecal coliform bacteria. A flow duration interval with hydrologic zones approach was used to assess this stream. This methodology, developed by Bruce Cleland, was used in order to target restoration efforts by dividing the range of flows into hydrologic conditions. For example, if all the exceedences occurred during low-flow conditions, point sources of the pollutant should be suspected. Conversely, if all the exceedences occurred during higher flow periods, then non-point sources of pollution should be suspected. Using Cleland’s approach, the following four hydrologic conditions were utilized: High Flows (0-10 percent), Moist Conditions (10-40 percent), Mid-Range Flows to Dry Conditions (40-90 percent), and Low Flows (90-100 percent). The methodology of flow duration intervals is explained further in the Methods section of the Assessment Report. One monitoring locations (Site T37) was setup on this stream. Of the 10 water samples that were collected, four (or 40 percent) violated the water quality standards for fecal coliform
Parameter Causing
Impairment
Number of Samples
(May-Sep)
Percent of Samples > 2000 counts/100mL
Minimum Concentration (counts/100mL)
Maximum Concentration (counts/100mL)
Fecal Coliform 10 40 40 320,000

Stray Horse Creek Total Maximum Daily Load December 2005
East Dakota Water Development District, Brookings, South East Dakota Water Development District, Brookings, South East Dakota Water Development District, Brookings, South East Dakota Water Development District, Brookings, South DakotaDakotaDakotaDakota 6
bacteria. Based on the water quality violations, this stream is currently not supporting its limited contact recreation beneficial use. Pollutant Assessment Point Sources NPDES facilities taken into consideration within this area include the Town of Kranzburg and the City of Goodwin (Table 2). Total fecal coliform bacteria contribution from these facilities during the study period was zero. Both facilities do not discharge. Table 2. NPDES Facilities
Permit Number Facility Name Fecal Coliform WLA (counts/day) SD0024724 Kranzburg, City of 0.00E+00 SDG824716 Goodwin, City of 0.00E+00
Non-point Sources Non-point source pollution, unlike pollution from municipalities and NPDES facilities, comes from many diffuse sources. Potential non-point sources of fecal coliform bacteria include loadings from surface runoff, wildlife, livestock, and leaking septic tanks. Wildlife Wildlife deposit their feces onto land surfaces and in some cases directly into the water. The bacterial load from naturally occurring wildlife is assumed to be background. In addition, any strategy employed to control this source would probably have a negligible impact on attaining water quality standards. Agricultural Agricultural animals are the source of several types of non-point sources as indicated in the Target Reductions & Future Activity Recommendations section of the Assessment Report. Agricultural activities, including runoff from pastureland and cattle in streams, can affect water quality. Livestock data collected in the watershed during AGNPS Feedlot assessment are listed in Table 3. Table 3. Livestock Distribution for the Stray Horse Creek watershed
Livestock Distribution Stray Horse Creek (T37) Beef Cattle/Calves 12761
Dairy Cattle 2350 Heifers 1495 Sheep 1200 Steers 917 Pigs 260
Horses 27 Septic Systems Data for septic tanks is discussed in the Assessment Report on page 65. Contributions from septic systems were estimated based on rural households because a direct accounting of the number of septic systems in use in the TMDL watershed was unavailable. The 25.6 percent contribution from septic systems was determined by assuming 20 percent of all rural septic systems in the North-Central Big Sioux River watershed area were failing. This percentage does not account for die-off or attenuation of fecal coliform bacteria between failing septic systems and the stream. In general, failing septic systems discharge over land for some distance, where a portion of the fecal coliform bacteria may be absorbed on the soil and surface

Stray Horse Creek Total Maximum Daily Load December 2005
East Dakota Water Development District, Brookings, South East Dakota Water Development District, Brookings, South East Dakota Water Development District, Brookings, South East Dakota Water Development District, Brookings, South DakotaDakotaDakotaDakota 7
vegetation before reaching the stream. It is assumed that failing septic systems constitute a diminutive amount of the overall contribution because not all of the failing systems would be reaching the receiving waters. These results will not directly affect the TMDL allocations. Therefore, it is implied that comparatively, failing septic systems are having an insignificant affect on the excess fecal coliform loading and will be included in the margin of safety portion of the TMDL. Urban Areas Fecal coliform bacteria in urban and suburban areas may be attributed to stormwater runoff, overflow of sewer systems, illicit discharge of sanitary waste, leaking septic systems, and pets. Land Use Landuse in the watershed was derived from the AnnAGNPS Model. Table 4 shows that 97 percent of the area is grass or cropland.
Table 4. Land Use in the Stray Horse Creek Watershed Linkage Analysis Water quality data was collected at one project monitoring site (Site T37) on Stray Horse Creek. Samples were collected according to South Dakota’s EPA approved Standard Operating Procedures for Field Samplers. Fecal coliform bacteria water samples were analyzed by the Sioux Falls Health Lab (2001-2002) in Sioux Falls, South Dakota. Quality Assurance/Quality Control samples were collected on 10% of the samples according to South Dakota’s EPA approved Non-point Source Quality Assurance/ Quality Control Plan. Details concerning water sampling techniques, analysis, and quality control are addressed in the assessment final report. The Flow Duration Interval method calculates fecal coliform bacteria loading, (concentration) × (flow), using zones based on hydrologic conditions. Reductions are calculated using the median of the fecal coliform bacteria samples in each zone. This method shows that while a TMDL may be expressed as a single point it can also be thought of as a continuum of points representing the criterion value and various flow values. In order to assess the impact of fecal coliform bacteria for this stream, the flow duration interval curve was divided into “flow zones”. The purpose of the zones is to differentiate hydrologic conditions, between peak and low flows, as ranges. For this stream, the ranges or flow zones are High (0-10), Moist (10-40), Mid-Range to Dry (40-90), and Low (90-100). Load duration curves were calculated using the following equation:
(flow) × (conversion factor) × (state criteria) = quantity/day or daily load This curve represents the threshold of the load. As seen in Figure 3, any samples occurring above this line is an exceedence of the water quality standard and represented by a red box (Table 5). Table 6 depicts the allowable coliform bacteria load during the study for peak flow, low flow, and 5th percentile increments in flow.
LandUse Percent AcresCropland 79% 45,629
Rangeland/Grassland 18% 10,412Building/Farmstead 2% 1,044
None 1% 463

Stray Horse Creek Total Maximum Daily Load December 2005
East Dakota Water Development District, Brookings, South East Dakota Water Development District, Brookings, South East Dakota Water Development District, Brookings, South East Dakota Water Development District, Brookings, South DakotaDakotaDakotaDakota 8
Figure 3. Flow Duration Interval for Stray Horse Creek
Table 5. Exeedences of the Water Quality Standard (≤ 2000 cfu/100mL )
StationSample
DateSample
TimeFlow (cubic feet per second - cfs)
Flow Rank
Flow Rank
(percent)Fecal Coliform (counts/100mL)
Fecal Coliform Load
(counts/day)T37 08/21/02 1230 474.61 0.005 0.50 320000 3.72E+15T37 06/14/01 1230 416.99 0.004 0.40 6900 7.04E+13T37 08/06/02 930 0.33 0.724 72.40 4500 3.63E+10T37 05/09/02 1015 32.15 0.042 4.20 2500 1.97E+12
1.00E+07
1.00E+09
1.00E+11
1.00E+13
1.00E+15
1.00E+17
0 10 20 30 40 50 60 70 80 90 100
Flow Duration Interval (%)
Feca
l Col
ifor
m B
acte
ria
(cou
nts/
day)
Target
Non-ExceedneceExceedence
Rain Event
90th
Median
Stray Horse Creek (T37)
LowFlows
HighFlows
Mid-range Flowsto
Dry ConditionsMoist
Conditions

Stray Horse Creek Total Maximum Daily Load December 2005
East Dakota Water Development District, Brookings, South East Dakota Water Development District, Brookings, South East Dakota Water Development District, Brookings, South East Dakota Water Development District, Brookings, South DakotaDakotaDakotaDakota 9
Table 6. Fecal Coliform Target Loads for Flow
Allowable Loads 2000 cfu/100mL
Flow Rank (percent) cfs fecal Coliform (counts/day) Flow Conditions 0.019 580.30 2.84E+13 Peak 0.1 503.44 2.46E+13
0.274 496.25 2.43E+13
1 492.97 2.41E+13 5 21.02 1.03E+12
10 10.47 5.13E+11 15 6.87 3.36E+11 20 4.75 2.32E+11 25 3.40 1.67E+11 30 2.94 1.44E+11 35 2.41 1.18E+11 40 1.79 8.77E+10
45 1.44 7.07E+10 50 0.94 4.61E+10 55 0.70 3.44E+10 60 0.56 2.76E+10 65 0.45 2.19E+10 70 0.37 1.83E+10 75 0.27 1.30E+10 80 0.17 8.28E+09 85 0.08 3.71E+09 90 0.04 1.79E+09 95 0.01 6.75E+08
100 0.01 2.96E+08 Low The Agricultural Non-Point Source Pollution (AGNPS) model is a GIS-integrated water quality model that predicts non-point source loadings within agricultural watersheds. ArcView GIS software was used to spatially analyze animal feeding operations and their pollution potential. The feedlot assessment assumed the probable sources of fecal coliform bacteria loadings within the NCBSR watershed were agricultural related and rated the feedlots based on runoff potential. Feedlot ratings ranged from 0-102. Table 7 lists the 32 feedlots rating 50 or greater. A rating of 50 or greater warrants concern in regards to potential pollution problems. A map identifying the region of concern is shown in Figure 4. A complete methodology report can be found in Appendix T of the Assessment Report.

Stray Horse Creek Total Maximum Daily Load December 2005
East Dakota Water Development District, Brookings, South East Dakota Water Development District, Brookings, South East Dakota Water Development District, Brookings, South East Dakota Water Development District, Brookings, South DakotaDakotaDakotaDakota 10
Table 7. Feedlot ratings ≥ 50 in the Stray Horse Creek Watershed
Figure 4. Location of Feedlots in the Stray Horse Creek Watershed
ID Rating ID Rating ID Rating1153 51 1283 62 1261 721286 52 1154 63 1260 741289 52 1249 63 1174 751285 53 1161 64 1262 751171 55 1251 64 1152 781160 57 1303 64 1159 791172 58 1301 65 1175 811265 58 1284 67 1268 811156 60 1302 67 1170 851313 60 1155 71 1168 861299 61 1258 72
Tributary
Big Sioux River
Watershed Boundaries
Monitoring Site
Municipality
Feedlot Rating < 50
Feedlot Rating ≥ 50
N
W E
S
Stra
yH
orse
Ck
Castlewood
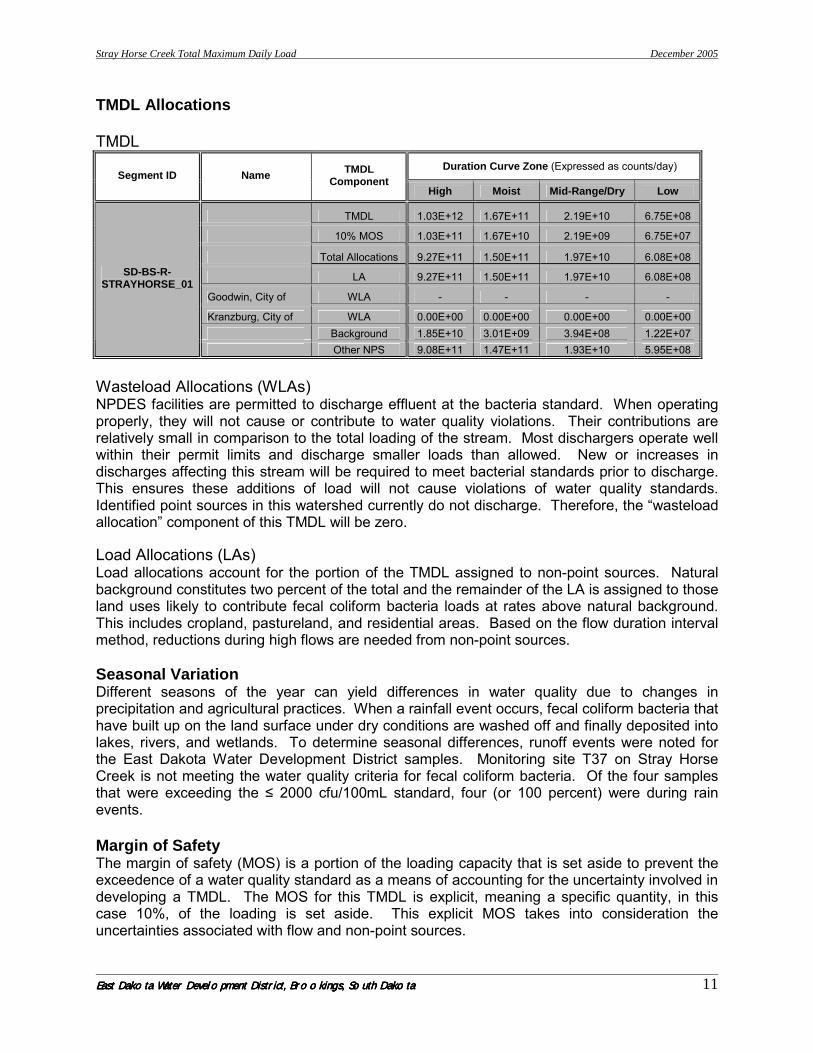
Stray Horse Creek Total Maximum Daily Load December 2005
East Dakota Water Development District, Brookings, South East Dakota Water Development District, Brookings, South East Dakota Water Development District, Brookings, South East Dakota Water Development District, Brookings, South DakotaDakotaDakotaDakota 11
TMDL Allocations TMDL
Duration Curve Zone (Expressed as counts/day) Segment ID Name TMDL
Component High Moist Mid-Range/Dry Low
TMDL 1.03E+12 1.67E+11 2.19E+10 6.75E+08
10% MOS 1.03E+11 1.67E+10 2.19E+09 6.75E+07
Total Allocations 9.27E+11 1.50E+11 1.97E+10 6.08E+08
LA 9.27E+11 1.50E+11 1.97E+10 6.08E+08
Goodwin, City of WLA - - - -
Kranzburg, City of WLA 0.00E+00 0.00E+00 0.00E+00 0.00E+00 Background 1.85E+10 3.01E+09 3.94E+08 1.22E+07
SD-BS-R-STRAYHORSE_01
Other NPS 9.08E+11 1.47E+11 1.93E+10 5.95E+08
Wasteload Allocations (WLAs) NPDES facilities are permitted to discharge effluent at the bacteria standard. When operating properly, they will not cause or contribute to water quality violations. Their contributions are relatively small in comparison to the total loading of the stream. Most dischargers operate well within their permit limits and discharge smaller loads than allowed. New or increases in discharges affecting this stream will be required to meet bacterial standards prior to discharge. This ensures these additions of load will not cause violations of water quality standards. Identified point sources in this watershed currently do not discharge. Therefore, the “wasteload allocation” component of this TMDL will be zero. Load Allocations (LAs) Load allocations account for the portion of the TMDL assigned to non-point sources. Natural background constitutes two percent of the total and the remainder of the LA is assigned to those land uses likely to contribute fecal coliform bacteria loads at rates above natural background. This includes cropland, pastureland, and residential areas. Based on the flow duration interval method, reductions during high flows are needed from non-point sources. Seasonal Variation Different seasons of the year can yield differences in water quality due to changes in precipitation and agricultural practices. When a rainfall event occurs, fecal coliform bacteria that have built up on the land surface under dry conditions are washed off and finally deposited into lakes, rivers, and wetlands. To determine seasonal differences, runoff events were noted for the East Dakota Water Development District samples. Monitoring site T37 on Stray Horse Creek is not meeting the water quality criteria for fecal coliform bacteria. Of the four samples that were exceeding the ≤ 2000 cfu/100mL standard, four (or 100 percent) were during rain events. Margin of Safety The margin of safety (MOS) is a portion of the loading capacity that is set aside to prevent the exceedence of a water quality standard as a means of accounting for the uncertainty involved in developing a TMDL. The MOS for this TMDL is explicit, meaning a specific quantity, in this case 10%, of the loading is set aside. This explicit MOS takes into consideration the uncertainties associated with flow and non-point sources.

Stray Horse Creek Total Maximum Daily Load December 2005
East Dakota Water Development District, Brookings, South East Dakota Water Development District, Brookings, South East Dakota Water Development District, Brookings, South East Dakota Water Development District, Brookings, South DakotaDakotaDakotaDakota 12
Critical Conditions The critical condition for fecal coliform loadings in any watershed depends on the presence of point sources and land use within that watershed. During a dry period, typically the critical condition is non-point sources followed by a rainfall event. During the rainfall event, fecal coliform bacteria that have built up on the land surface can wash into the stream, causing wet weather exceedences. Follow-Up Monitoring Monitoring and evaluation efforts will be targeted toward the effectiveness of implemented BMPs. Sample sites will be based on BMP site selection and include the parameter of fecal coliform bacteria. Once the implementation project is completed, post-implementation monitoring will be necessary to assure that the TMDL has been reached and improvement to the beneficial uses occurs. This will be achieved by recurrent water quality sampling at the original monitoring sites. Public Participation Efforts taken to gain public education, review, and comment during development of the TMDL involved: 1. East Dakota Water Development District monthly board meetings 2. Field demonstrations for the public 3. Articles in the local newspapers The findings from these public meetings and comments have been taken into consideration in development of the Stray Horse Creek TMDL. Implementation Plan The TMDL analysis was performed using the best data available to specify the fecal coliform reductions necessary to achieve water quality criteria. The intent of meeting the criteria is to support the designated use classifications of this stream. A detailed implementation plan is not included in this TMDL. The involvement of local land owners and agencies will be needed in order to develop an implementation plan. In general, reductions in fecal coliform bacteria should be sought through identification and installation of agricultural BMPs to reduce loads during runoff events and wet weather conditions. To guide implementation efforts the existing condition was calculated by multiplying the median concentration by the median of the flow from each flowzone. The target load is the median of the flow multiplied by the numeric standard (≤ 2,000 cfu/100mL) for fecal coliform bacteria. The percent reduction is the difference between the existing and target load with a 10% MOS for uncertainties due to variation in flow. Using this baseline, this segment requires reducing the fecal coliform counts per day by 99 percent during high flow conditions (Table 8). Additional controls may be needed in order to achieve the applicable water quality standards and meet the TMDL goal for this segment as the median concentration is used here as a starting point.
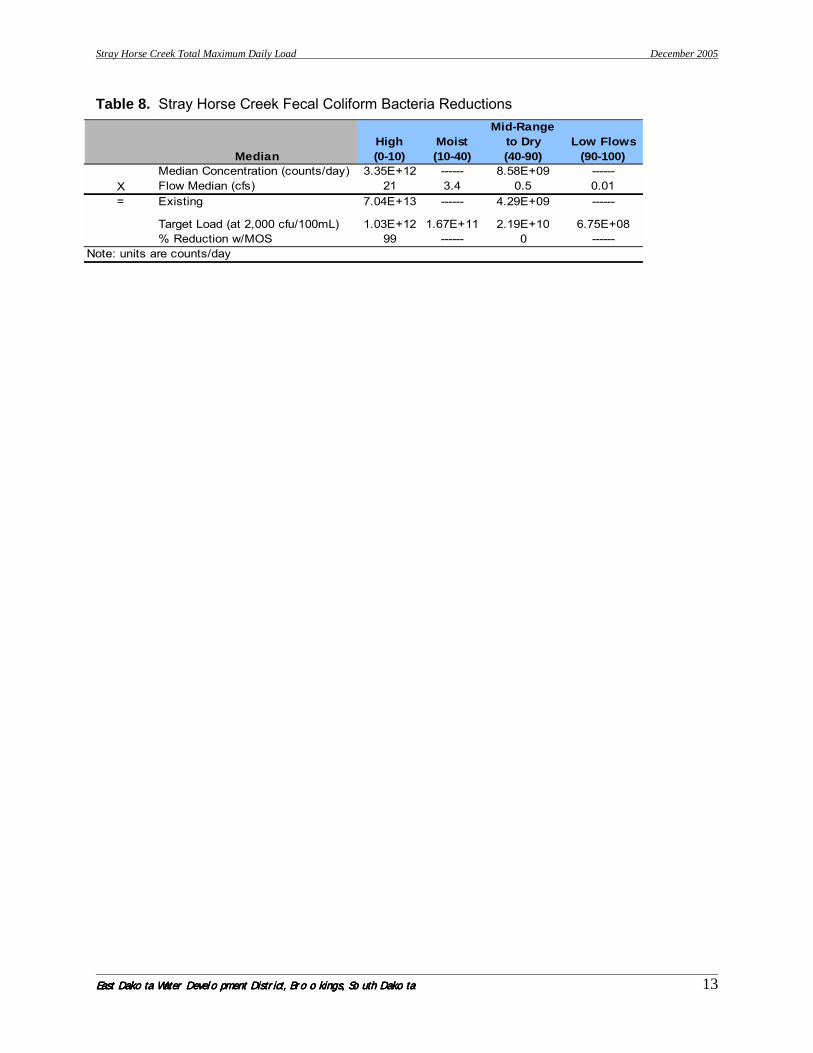
Stray Horse Creek Total Maximum Daily Load December 2005
East Dakota Water Development District, Brookings, South East Dakota Water Development District, Brookings, South East Dakota Water Development District, Brookings, South East Dakota Water Development District, Brookings, South DakotaDakotaDakotaDakota 13
Table 8. Stray Horse Creek Fecal Coliform Bacteria Reductions
High MoistMid-Range
to Dry Low Flows(0-10) (10-40) (40-90) (90-100)
Median Concentration (counts/day) 3.35E+12 ------ 8.58E+09 ------Flow Median (cfs) 21 3.4 0.5 0.01
= Existing 7.04E+13 ------ 4.29E+09 ------
Target Load (at 2,000 cfu/100mL) 1.03E+12 1.67E+11 2.19E+10 6.75E+08% Reduction w/MOS 99 ------ 0 ------
Note: units are counts/day
Median
X

Appendix HH. TMDL – Hidewood Creek (Fecal Coliform Bacteria)
HH-1

Hidewood Creek Total Maximum Daily Load December 2005
East Dakota Water Development District, Brookings, South DakotaEast Dakota Water Development District, Brookings, South DakotaEast Dakota Water Development District, Brookings, South DakotaEast Dakota Water Development District, Brookings, South Dakota 2
TOTAL MAXIMUM DAILY LOAD EVALUATION (Fecal Coliform Bacteria)
for
Hidewood Creek
(HUC 10170202)
Hamlin and Deuel Counties, South Dakota
East Dakota Water Development District Brookings, South Dakota
December 2005

Hidewood Creek Total Maximum Daily Load December 2005
East Dakota Water Development District, Brookings, South DakotaEast Dakota Water Development District, Brookings, South DakotaEast Dakota Water Development District, Brookings, South DakotaEast Dakota Water Development District, Brookings, South Dakota 3
Hidewood Creek Total Maximum Daily Load Waterbody Type: Stream Assessment Unit ID: SD-BS-R-HIDEWOOD_01 303(d) Listing Parameter: Fecal Coliform Bacteria Designated Uses: Warmwater Marginal Fish Life Propagation Limited Contact Recreation Fish and Wildlife Propagation Recreation and Stock Watering Irrigation Size of Waterbody: 25.7 miles (approximately) Size of Watershed: 85,815 acres Water Quality Standards: Narrative and Numeric Indicators: Water Chemistry Analytical Approach: Modeling and Assessment Techniques used include Flow
Duration Interval, AGNPS Model, and AnnAGNPS Model Location: HUC Code: 10170202 Goal: Full Support of the Limited Contact Recreation Beneficial Use
during the months of May through September Target: ≤ 2000 cfu/100mL of fecal coliform bacteria (any one sample)
during the months of May through September
Objective The intent of this summary is to clearly identify the components of the TMDL submittal to support adequate public participation and facilitate the US Environmental Protection Agency (EPA) review and approval. The TMDL was developed in accordance with Section 303(d) of the federal Clean Water Act and guidance developed by EPA. Introduction Hidewood Creek is a 25.7 mile tributary with a watershed of approximately 85,815 acres, located within the Big Sioux River Basin (HUC 10170202) in the south-eastern part of Hamlin County and southwestern Deuel County, South Dakota. The watershed of this stream lies within Hamlin and Deuel Counties as shown by the shaded region in Figure 1 and is included as part of the North-Central Big Sioux River Watershed Assessment Project. The entire study area for this project is also outlined in Figure 1. The North-Central Big Sioux River Watershed Assessment Project identified Hidewood Creek for TMDL development due to not meeting the water quality criteria for fecal coliform bacteria. Information supporting this listing was derived from East Dakota Water Development District monitoring data. Hidewood Creek has not been on any 303(d) State Waterbody lists prior to this assessment including the 2006 list. Appendix B of the assessment report summarizes the data collected during the North-Central Big Sioux River Watershed Assessment Project from June 2001 through October 2002.

Hidewood Creek Total Maximum Daily Load December 2005
East Dakota Water Development District, Brookings, South DakotaEast Dakota Water Development District, Brookings, South DakotaEast Dakota Water Development District, Brookings, South DakotaEast Dakota Water Development District, Brookings, South Dakota 4
Figure 1. Location of Hidewood Creek and its Watershed in South Dakota. Problem Identification Hidewood Creek begins at the outlet of Clear Lake and then joins the Big Sioux River about two miles northwest of the City of Estelline. The watershed area shown in Figure 2 drains approximately 98 percent grass/grazing land and cropland acres. The municipality of Clear Lake is located in this area.
Figure 2. Hidewood Creek Watershed
BrookingsCounty
GrantCounty
DeuelCounty
HamlinCounty
CodingtonCounty
Monitoring Site
Hidewood Ck Watershed
Lake
Stream
Big Sioux River
Community
North-Central BSR Watershed
Hidewood Creek
Big Sioux River
Watershed Boundaries
N
W E
S
Monitoring Site
HidewoodCreek
Municipality
BigSioux
River
Clear Lake

Hidewood Creek Total Maximum Daily Load December 2005
East Dakota Water Development District, Brookings, South DakotaEast Dakota Water Development District, Brookings, South DakotaEast Dakota Water Development District, Brookings, South DakotaEast Dakota Water Development District, Brookings, South Dakota 5
Hidewood Creek (Site T40 and Site T41) was found to carry fecal coliform bacteria which degrades water quality. This stream is considered impaired because more than 25 percent of the values (of less than 20 samples) exceeded the numeric criteria of ≤ 2000 counts per 100 milliliters of fecal coliform bacteria. This stream requires reductions during high flows. Table 1 displays the fecal coliform data collected from June 2001 through September 2002.
Table 1. Summary of Fecal Coliform Data for the Hidewood Creek Description of Applicable Water Quality Standards & Numeric Water Quality Targets Hidewood Creek has been assigned beneficial uses by the state of South Dakota Surface Water Quality Standards regulations (See page 12 of the Assessment Report). Along with these assigned uses are narrative and numeric criteria that define the desired water quality of this stream. These criteria must be maintained for the stream to satisfy its assigned beneficial uses, which are listed below:
• Warmwater marginal fish life propagation • Limited contact recreation • Fish and wildlife propagation, recreation and stock watering • Irrigation
Individual parameters determine the support of beneficial uses. Use support for limited contact recreation involved monitoring the levels of fecal coliform bacteria from May 1 through September 30. This stream experiences fecal coliform bacteria due to poor riparian areas, in-stream livestock, feedlot/manure runoff, NPDES systems, and/or overflowing sewer systems. Administrative Rules of South Dakota Article 74:51 contains numeric and narrative standards to be applied to the surface waters (i.e. streams, rivers) of the state. To assess the status of the beneficial uses for this stream, water samples were obtained using SD DENR standard operating procedures and the results were compared to the applicable water quality criteria. Hidewood Creek is currently assigned a numeric standard of ≤ 2000 cfu/100mL for fecal coliform bacteria. A flow duration interval with hydrologic zones approach was used to assess this stream. This methodology, developed by Bruce Cleland, was used in order to target restoration efforts by dividing the range of flows into hydrologic conditions. For example, if all the exceedences occurred during low-flow conditions, point sources of the pollutant should be suspected. Conversely, if all the exceedences occurred during higher flow periods, then non-point sources of pollution should be suspected. Using Cleland’s approach, the following five hydrologic conditions were utilized: High Flows (0-10 percent), Moist Conditions (10-40 percent), Mid-Range Flows (40-60), Dry Conditions (60-90 percent), and Low Flows (90-100 percent). The methodology of flow duration intervals is explained further in the Methods section of the Assessment Report. Two monitoring locations (Site T40 and Site T41) were setup on this stream. Of the 16 water samples that were collected, five (or 31 percent) violated the water quality standards for fecal
Parameter Causing
Impairment
Number of Samples
(May-Sep)
Percent of Samples > 2000 counts/100mL
Minimum Concentration (counts/100mL)
Maximum Concentration (counts/100mL)
Fecal Coliform 16 31 10 42,000

Hidewood Creek Total Maximum Daily Load December 2005
East Dakota Water Development District, Brookings, South DakotaEast Dakota Water Development District, Brookings, South DakotaEast Dakota Water Development District, Brookings, South DakotaEast Dakota Water Development District, Brookings, South Dakota 6
coliform bacteria. Based on the water quality violations, this stream is currently not supporting its limited contact recreation beneficial use. Pollutant Assessment Point Sources NPDES facilities taken into consideration within this area include the City of Clear Lake and Technical Ordinance, Inc. (Table 2). Total fecal coliform bacteria contribution from these facilities during the study period was zero. Technical Ordinance, Inc did not discharge during this period and the City of Clear Lake did not discharge fecal coliform bacteria.
Table 2. NPDES Facilities
Permit Number Facility Name Fecal Coliform WLA (counts/day)
SD0020699 Clear Lake, City of 7.03E+10 SD0026301 Technical Ordinance, Inc. 0.00E+00
Non-point Sources Non-point source pollution, unlike pollution from municipalities and NPDES, comes from many diffuse sources. Potential non-point sources of fecal coliform bacteria include loadings from surface runoff, wildlife, livestock, and leaking septic tanks. Wildlife Wildlife deposit their feces onto land surfaces and in some cases directly into the water. The bacterial load from naturally occurring wildlife is assumed to be background. In addition, any strategy employed to control this source would probably have a negligible impact on attaining water quality standards. Agricultural Agricultural animals are the source of several types of non-point sources as indicated in the Target Reductions & Future Activity Recommendations section of the Assessment Report. Agricultural activities, including runoff from pastureland and cattle in streams, can affect water quality. Livestock data collected in this watershed during the AGNPS Feedlot assessment are listed in Table 4.
Table 3. Livestock Distribution for the Hidewood Creek Watershed
Septic Systems Data for septic tanks is discussed in the Assessment Report on page 65. Contributions from septic systems were estimated based on rural households because a direct accounting of the number of septic systems in use in the TMDL watershed was unavailable. The 25.6 percent contribution from septic systems was determined by assuming 20 percent of all rural septic systems in the North-Central Big Sioux River watershed area were failing. This percentage does not account for die-off or attenuation of fecal coliform bacteria between failing septic systems and the stream. In general, failing septic systems discharge over land for some
Livestock HidewoodDistribution Creek (T40, T41)Beef Cattle 6380Dairy Cattle 325
Heifers 300

Hidewood Creek Total Maximum Daily Load December 2005
East Dakota Water Development District, Brookings, South DakotaEast Dakota Water Development District, Brookings, South DakotaEast Dakota Water Development District, Brookings, South DakotaEast Dakota Water Development District, Brookings, South Dakota 7
distance, where a portion of the fecal coliform bacteria may be absorbed on the soil and surface vegetation before reaching the stream. It is assumed that failing septic systems constitute a diminutive amount of the overall contribution because not all of the failing systems would be reaching the receiving waters. These results will not directly affect the TMDL allocations. Therefore, it is implied that comparatively, failing septic systems are having an insignificant affect on the excess fecal coliform loading and will be included in the margin of safety portion of the TMDL. Urban Areas Fecal coliform bacteria in urban and suburban areas may be attributed to stormwater runoff, overflow of sewer systems, illicit discharge of sanitary waste, leaking septic systems, and pets. Land Use Landuse in the watershed was derived using the AnnAGNPS Model. Table 4 shows that 98 percent of the area is in grass or cropland.
Table 4. Land Use in the Hidewood Creek Watershed Linkage Analysis Water quality data was collected at two project monitoring sites (Site T40 and Site T41) on Hidewood Creek. Samples were collected according to South Dakota’s EPA approved Standard Operating Procedures for Field Samplers. The fecal coliform bacteria water samples were analyzed by the Sioux Falls Health Lab (2001-2002) in Sioux Falls, South Dakota. Quality Assurance/Quality Control samples were collected on 10% of the samples according to South Dakota’s EPA approved Non-point Source Quality Assurance/ Quality Control Plan. Details concerning water sampling techniques, analysis, and quality control are addressed in the assessment final report. The Flow Duration Interval method calculates fecal coliform bacteria loading, (concentration) × (flow), using zones based on hydrologic conditions. Reductions are calculated using the median of the fecal coliform bacteria samples in each zone. This method shows that while a TMDL may be expressed as a single point it can also be thought of as a continuum of points representing the criterion value and various flow values. In order to assess the impact of fecal coliform bacteria for this stream, the flow duration interval curve was divided into “flow zones”. The purpose of the zones is to differentiate hydrologic conditions, between peak and low flows, as ranges. For this stream, the ranges or flow zones are High (0-10), Moist (10-40), Mid-Range (40-60), Dry (60-90), and Low (90-100). Load duration curves were calculated using the following equation:
(flow) × (conversion factor) × (state criteria) = quantity/day or daily load This curve represents the threshold of the load. As seen in Figure 3, any samples occurring above this line is an exceedence of the water quality standard and represented by a red box (Table 5). Table 6 depicts the allowable coliform bacteria load during the study for peak flow, low flow, and 5th percentile increments in flow.
LandUse Percent AcresCropland 68% 58,318
Rangeland/Grassland 30% 25,752Building/Farmstead 2% 1,711
None 0% 34

Hidewood Creek Total Maximum Daily Load December 2005
East Dakota Water Development District, Brookings, South DakotaEast Dakota Water Development District, Brookings, South DakotaEast Dakota Water Development District, Brookings, South DakotaEast Dakota Water Development District, Brookings, South Dakota 8
1.00E+07
1.00E+09
1.00E+11
1.00E+13
1.00E+15
0 10 20 30 40 50 60 70 80 90
Flow Duration Interval (%)
Feca
l Col
ifor
m B
acte
ria
(cou
nts/
day)
Target
Non-ExceedneceExceedence
Rain Event
90th
Median
Hidewood Creek (T40 & T41)
DryConditions
LowFlows
HighFlows
Mid-rangeFlows
MoistConditions
Figure 3. Flow Duration Interval for Hidewood Creek
Table 5. Exceedances of the Water Quality Standard (≤ 2000 cfu/100mL)
StationSample
DateSample
TimeFlow (cubic feet per second - cfs)
Flow Rank
Flow Rank
(percent)Fecal Coliform (counts/100mL)
Fecal Coliform Load
(counts/day)T40 08/07/02 830 0.20 0.994 99.37 42000 2.06E+11T40 08/21/02 845 3.62 0.809 80.85 20000 1.77E+12T41 06/14/01 1330 167.90 0.002 0.19 3300 1.36E+13T41 07/20/01 1315 11.12 0.646 64.55 2500 6.81E+11T41 09/26/01 1330 32.72 0.215 21.51 2300 1.84E+12

Hidewood Creek Total Maximum Daily Load December 2005
East Dakota Water Development District, Brookings, South DakotaEast Dakota Water Development District, Brookings, South DakotaEast Dakota Water Development District, Brookings, South DakotaEast Dakota Water Development District, Brookings, South Dakota 9
Table 6. Fecal Coliform Target Loads for Flow Allowable Loads 2000 cfu/100mL
Flow Rank (percent) cfs fecal Coliform (counts/day) Flow Conditions 0.019 243.93 1.19E+13 Peak 0.1 206.81 1.01E+13
0.274 192.57 9.42E+12 1 163.93 8.02E+12 5 66.59 3.26E+12
10 42.88 2.10E+12 15 38.67 1.89E+12 20 33.75 1.65E+12 25 29.41 1.44E+12 30 26.70 1.31E+12 35 24.56 1.20E+12 40 24.26 1.19E+12 45 20.25 9.91E+11 50 17.36 8.50E+11 55 15.28 7.48E+11 60 13.34 6.53E+11 65 10.62 5.20E+11 70 6.99 3.42E+11 75 4.93 2.41E+11 80 3.82 1.87E+11 85 2.34 1.15E+11 90 1.43 7.02E+10 95 0.77 3.78E+10
100 0.10 5.05E+09 Low
Table 7. Feedlot ratings ≥ 50 in the Hidewood Creek Watershed
The Agricultural Non-Point Source Pollution (AGNPS) model is a GIS-integrated water quality model that predicts non-point source loadings within agricultural watersheds. ArcView GIS software was used to spatially analyze animal feeding operations and their pollution potential. The feedlot assessment assumed the probable sources of fecal coliform bacteria loadings within the NCBSR watershed were agricultural related and rated the feedlots based on runoff potential. Feedlot ratings ranged from 0-102. Table 7 lists the 15 feedlots rating 50 or greater. A rating of 50 or greater warrants concern in regards to potential pollution problems. A map identifying the region of concern is shown in Figure 4. A complete methodology report can be found in Appendix T of the Assessment Report.
ID Rating1233 551247 591255 591215 621223 621244 621246 631227 661242 662132 671221 711230 731113 741229 791237 98

Hidewood Creek Total Maximum Daily Load December 2005
East Dakota Water Development District, Brookings, South DakotaEast Dakota Water Development District, Brookings, South DakotaEast Dakota Water Development District, Brookings, South DakotaEast Dakota Water Development District, Brookings, South Dakota 10
Figure 3. Location of Feedlots in the Hidewood Creek Watershed TMDL Allocations TMDL
Duration Curve Zone (Expressed as counts/day) Segment ID Name TMDL
Component High Moist Mid-Range Dry Low
TMDL 3.62E+12 1.44E+12 8.50E+11 2.41E+11 3.78E+10
10% MOS 3.62E+11 1.44E+11 8.50E+10 2.41E+10 3.78E+09
Total Allocations 3.26E+12 1.30E+12 7.65E+11 2.17E+11 3.40E+10
LA 3.19E+12 1.23E+12 6.95E+11 1.47E+11 -3.63E+10
Clear Lake, City of WLA 7.03E+10 7.03E+10 7.03E+10 7.03E+10 7.03E+10
Technical Ordinance, Inc. WLA - - - - -
Background 6.38E+10 2.45E+10 1.39E+10 2.93E+09 -7.26E+08
SD-BS-R-HIDEWOOD_01
Other NPS 3.12E+12 1.20E+12 6.81E+11 1.44E+11 -3.56E+10
Wasteload Allocations (WLAs) NPDES facilities are permitted to discharge effluent at the bacteria standard. When operating properly, they will not cause or contribute to water quality violations. Their contributions are relatively small in comparison to the total loading of the stream. The worst case scenario of all point source waste loads within this stream would be approximately 7.03 × 10¹⁰ fecal counts if the facilities discharged their maximum amount at the same time. This amount is unlikely since most dischargers operate well within their permit limits and discharge smaller loads than allowed. In order to find the TMDL, the waste load allocation (point source) was added to the allowable load (non-point source) and a 10 percent margin of safety was applied. New or
Tributary
Big Sioux River
Watershed Boundaries
Monitoring Site
Municipality
Feedlot Rating < 50
Feedlot Rating ≥ 50
N
W E
S
Hidewood
Ck
Clear Lake

Hidewood Creek Total Maximum Daily Load December 2005
East Dakota Water Development District, Brookings, South DakotaEast Dakota Water Development District, Brookings, South DakotaEast Dakota Water Development District, Brookings, South DakotaEast Dakota Water Development District, Brookings, South Dakota 11
increases in discharges affecting this stream will be required to meet bacterial standards prior to discharge. This ensures these additions of load will not cause violations of water quality standards. Identified point sources in this watershed are contributing an insignificant amount to the fecal coliform loading. Therefore, the “wasteload allocation” component is of no consequence, as indicated in the above TMDL. Load Allocations (LAs) Load allocations account for the portion of the TMDL assigned to non-point sources. Natural background constitutes two percent of the total and the remainder of the LA is assigned to those land uses likely to contribute fecal coliform bacteria loads at rates above natural background. This includes cropland, pastureland, and residential areas. Based on the flow duration interval method, reductions during high flows will be needed from non-point sources. Seasonal Variation Different seasons of the year can yield differences in water quality due to changes in precipitation and agricultural practices. When a rainfall event occurs, fecal coliform bacteria that have built up on the land surface under dry conditions are washed off and finally deposited into lakes, rivers, and wetlands. To determine seasonal differences, runoff events were noted for the East Dakota Water Development District samples. Monitoring sites T40 and T41 on Hidewood Creek are not meeting the water quality criteria for fecal coliform bacteria. Of the five samples that were exceeding the ≤ 2000 cfu/100mL standard, four (or 80 percent) were during rain events. Margin of Safety The margin of safety (MOS) is a portion of the loading capacity that is set aside to prevent the exceedence of a water quality standard as a means of accounting for the uncertainty involved in developing a TMDL. The MOS for this TMDL is explicit, meaning a specific quantity, in this case 10%, of the loading is set aside. This explicit MOS takes into consideration the uncertainties associated with flow and non-point sources. Critical Conditions The critical condition for fecal coliform loadings in any watershed depends on the presence of point sources and land use within that watershed. During a dry period, typically the critical condition is non-point sources followed by a rainfall event. During the rainfall event, fecal coliform bacteria that have built up on the land surface can wash into the stream, causing wet weather exceedences. Follow-Up Monitoring Monitoring and evaluation efforts will be targeted toward the effectiveness of implemented BMPs. Sample sites will be based on BMP site selection and include the parameter of fecal coliform bacteria. Once the implementation project is completed, post-implementation monitoring will be necessary to assure that the TMDL has been reached and improvement to the beneficial uses occurs. This will be achieved by recurrent water quality sampling at the original monitoring sites. Public Participation Efforts taken to gain public education, review, and comment during development of the TMDL involved:

Hidewood Creek Total Maximum Daily Load December 2005
East Dakota Water Development District, Brookings, South DakotaEast Dakota Water Development District, Brookings, South DakotaEast Dakota Water Development District, Brookings, South DakotaEast Dakota Water Development District, Brookings, South Dakota 12
1. East Dakota Water Development District monthly board meetings 2. Field demonstrations for the public 3. Articles in the local newspapers The findings from these public meetings and comments have been taken into consideration in development of the Hidewood Creek TMDL. Implementation Plan The TMDL analysis was performed using the best data available to specify the fecal coliform reductions necessary to achieve water quality criteria. The intent of meeting the criteria is to support the designated use classifications of this stream. A detailed implementation plan is not included in this TMDL. The involvement of local land owners and agencies will be needed in order to develop an implementation plan. In general, reductions in fecal coliform bacteria should be sought through identification and installation of agricultural and urban BMPs to reduce loads during runoff events. To guide implementation efforts the existing condition was calculated by multiplying the median concentration by the median of the flow from each flowzone. The target load is the median of the flow multiplied by the numeric standard (≤ 2,000 cfu/100mL) for fecal coliform bacteria. The percent reduction is the difference between the existing and target load with a 10% MOS for uncertainties due to variation in flow. Using this baseline, this segment requires reducing the fecal coliform counts per day by 59 percent during high flow conditions (Table 8). Additional controls may be needed in order to achieve the applicable water quality standards and meet the TMDL goal for this segment as the median concentration is used here as a starting point. Table 8. Hidewood Creek Fecal Coliform Bacteria Reductions
High Moist Mid-Range Dry Low Flows(0-10) (10-40) (40-60) (60-90) (90-100)
Median Concentration (counts/day) 1.08E+11 3.52E+10 6.76E+09 2.20E+10 1.63E+10Flow Median (cfs) 67 29 17 5 0.8
= Existing 7.21E+12 1.02E+12 1.15E+11 1.10E+11 1.30E+10
Target Load (at 2,000 cfu/100mL) 3.26E+12 1.44E+12 8.50E+11 2.41E+11 3.78E+10% Reduction w/MOS 59 0 0 0 0
Note: units are counts/day
Median
X

Appendix II. TMDL – Peg Munky Run (Fecal Coliform Bacteria)
II-1

Public Notice and EPA TMDL Comments February 2008
East Dakota Water Development District, Brookings, South DakotaEast Dakota Water Development District, Brookings, South DakotaEast Dakota Water Development District, Brookings, South DakotaEast Dakota Water Development District, Brookings, South Dakota
TOTAL MAXIMUM DAILY LOAD EVALUATION (Fecal Coliform Bacteria)
for
Peg Munky Run
(HUC 10170202)
Brookings and Deuel Counties, South Dakota
East Dakota Water Development District Brookings, South Dakota
December 2005

Public Notice and EPA TMDL Comments February 2008
East Dakota Water Development District, Brookings, South DakotaEast Dakota Water Development District, Brookings, South DakotaEast Dakota Water Development District, Brookings, South DakotaEast Dakota Water Development District, Brookings, South Dakota
Peg Munky Run Total Maximum Daily Load Waterbody Type: Stream 303(d) Listing Parameter: Fecal Coliform Bacteria Designated Uses: Warmwater Marginal Fish Life Propagation Limited Contact Recreation Fish and Wildlife Propagation Recreation and Stock Watering Irrigation Size of Waterbody: 13.8 miles (approximately) Size of Watershed: 36,698 acres Water Quality Standards: Narrative and Numeric Indicators: Water Chemistry Analytical Approach: Modeling and Assessment Techniques used include Flow
Duration Interval, AGNPS Model, and AnnAGNPS Model Location: HUC Code: 10170202 Goal: Reduce the fecal coliform counts per day by 38% overall flow
conditions Target: ≤ 2000 cfu/100mL of fecal coliform bacteria (any one sample)
during the months of May through September
Objective The intent of this summary is to clearly identify the components of the TMDL submittal to support adequate public participation and facilitate the US Environmental Protection Agency (EPA) review and approval. The TMDL was developed in accordance with Section 303(d) of the federal Clean Water Act and guidance developed by EPA. Introduction Peg Munky Run is a 13.8 mile tributary with a watershed of approximately 36,698 acres, located within the Big Sioux River Basin (HUC 10170202) in the north-central part of Brookings County and southwestern Deuel County, South Dakota. The watershed of this stream lies within Hamlin, Deuel, and Brookings Counties as shown by the shaded region in Figure 1 and is included as part of the North-Central Big Sioux River Watershed Assessment Project. The entire study area for this project is also outlined in Figure 1. The North-Central Big Sioux River Watershed Assessment Project identified Peg Munky Run for TMDL development due to not meeting the water quality criteria for fecal coliform bacteria. Information supporting this listing was derived from East Dakota Water Development District monitoring data. Appendix B of the assessment report summarizes the data collected during the North-Central Big Sioux River Watershed Assessment Project from June 2001 through June 2002.

Public Notice and EPA TMDL Comments February 2008
East Dakota Water Development District, Brookings, South DakotaEast Dakota Water Development District, Brookings, South DakotaEast Dakota Water Development District, Brookings, South DakotaEast Dakota Water Development District, Brookings, South Dakota
Figure 1. Location of Peg Munky Run and its Watershed in South Dakota. Problem Identification Peg Munky Run begins three miles northwest of the City of Toronto and then joins the Big Sioux River approximately six miles north of the City of Bruce. The watershed area shown in Figure 2 drains approximately 98 percent grass/grazing land and cropland acres. The municipality of Estelline is located in this area.
Figure 2. Peg Munky Run Watershed
Monitoring Site
Peg Munky Run Watershed
Lake
Stream
Big Sioux River
Community
North-Central BSR Watershed
BrookingsCounty
GrantCounty
DeuelCounty
HamlinCounty
CodingtonCounty
Peg Munky Run
Big Sioux River
Watershed Boundaries
N
W E
S
Monitoring Site
Municipality
BigSioux
River
Peg Munky Run
Estelline

Public Notice and EPA TMDL Comments February 2008
East Dakota Water Development District, Brookings, South DakotaEast Dakota Water Development District, Brookings, South DakotaEast Dakota Water Development District, Brookings, South DakotaEast Dakota Water Development District, Brookings, South Dakota
Peg Munky Run (Site T42) was found to carry fecal coliform bacteria which degrades water quality. This stream is considered impaired because more than 25 percent of the values (of less than 20 samples) exceeded the numeric criteria of ≤ 2000 counts per 100 milliliters of fecal coliform bacteria. This stream requires reducing the fecal coliform counts per day by 38 percent overall flow conditions. Table 1 displays the fecal coliform data collected from June 2001 through June 2002.
Table 1. Summary of Fecal Coliform Data for the Peg Munky Run Description of Applicable Water Quality Standards & Numeric Water Quality Targets Peg Munky Run has been assigned beneficial uses by the state of South Dakota Surface Water Quality Standards regulations (See page 12 of the Assessment Report). Along with these assigned uses are narrative and numeric criteria that define the desired water quality of this stream. These criteria must be maintained for the stream to satisfy its assigned beneficial uses, which are listed below:
• Warmwater marginal fish life propagation • Limited contact recreation • Fish and wildlife propagation, recreation and stock watering • Irrigation
Individual parameters determine the support of beneficial uses. Use support for limited contact recreation involved monitoring the levels of fecal coliform from May 1 through September 30. This stream experiences fecal coliform bacteria due to poor riparian areas, in-stream livestock, feedlot/manure runoff, and/or overflowing sewer systems. Administrative Rules of South Dakota Article 74:51 contains numeric and narrative standards to be applied to the surface waters (i.e. streams, rivers) of the state. To assess the status of the beneficial uses for this stream, water samples were obtained using SD DENR standard operating procedures and the results were compared to the applicable water quality criteria. Peg Munky Run is currently assigned a numeric standard of ≤ 2000 cfu/100mL for fecal coliform bacteria. A flow duration interval with hydrologic zones approach was used to assess this stream. This methodology, developed by Dr. Bruce Cleland, was used in order to target restoration efforts by dividing the range of flows into hydrologic conditions. For example, if all the exceedences occurred during low-flow conditions, point sources of the pollutant should be suspected. Conversely, if all the exceedences occurred during higher flow periods, then non-point sources of pollution should be suspected. Using Dr. Cleland’s approach, the following five hydrologic conditions were utilized: High Flows (0 to 10 percent), Moist Conditions (10-40 percent), Mid-Range Flows (40-60), Dry Conditions (60-90 percent), and Low Flows (90-100 percent). However, due to the low number of samples, all zones were combined to assess the overall fecal coliform bacteria problem. The methodology of flow duration intervals is explained further in the Methods section of the Assessment Report.
Parameter Causing
Impairment
Number of Samples
(May-Sep)
Percent of Samples > 2000 counts/100mL
Minimum Concentration (counts/100mL)
Maximum Concentration (counts/100mL)
Fecal Coliform 4 75 420 10,000

Public Notice and EPA TMDL Comments February 2008
East Dakota Water Development District, Brookings, South DakotaEast Dakota Water Development District, Brookings, South DakotaEast Dakota Water Development District, Brookings, South DakotaEast Dakota Water Development District, Brookings, South Dakota
One monitoring location (Site T42) was setup on this stream. Of the four water samples that were collected, three (or 75 percent) violated the water quality standards for fecal coliform bacteria. Based on the water quality violations, this stream is currently not supporting its limited contact recreation beneficial use. This stream requires reducing the fecal coliform counts per day, over all hydrologic conditions, by 38 percent. However, the problems seem to be occurring during high flows and during dry to low conditions (Table 2). Table 2. Peg Munky Run Fecal Coliform Bacteria Reductions
Pollutant Assessment Point Sources The City of Estelline was the only identified NPDES facility within this area taken into consideration. Total fecal coliform bacteria contribution from this facility during the study period was zero. This facility did not discharge during this period. Non-point Sources Non-point source pollution, unlike pollution from municipalities and NPDES, comes from many diffuse sources. Potential non-point sources of fecal coliform bacteria include loadings from surface runoff, wildlife, livestock, and leaking septic tanks. Wildlife Wildlife deposit their feces onto land surfaces and in some cases directly into the water. The bacterial load from naturally occurring wildlife is assumed to be background. In addition, any strategy employed to control this source would probably have a negligible impact on attaining water quality standards. Agricultural Agricultural animals are the source of several types of non-point sources as indicated in the Target Reductions & Future Activity Recommendations section of the Assessment Report. Agricultural activities, including runoff from pastureland and cattle in streams, can affect water quality. Livestock data collected in this watershed during AGNPS Feedlot assessment are listed in Table 3.
Table 3. Livestock Distribution for the Peg Munky Run Watershed
Livestock Peg MunkyDistribution Run (T42)Beef Cattle 3628Beef Calves 190
Heifers 80Dairy Cattle 50
Sheep 50
Overall(0-100)
Median Concentration (counts/day) 7.18E+10Flow Median (cfs) 1.74
= Existing 1.25E+11
Target Load (at 2,000 cfu/100mL) 8.50E+10% Reduction w/MOS 38
Median
X
Note: units are counts/day

Public Notice and EPA TMDL Comments February 2008
East Dakota Water Development District, Brookings, South DakotaEast Dakota Water Development District, Brookings, South DakotaEast Dakota Water Development District, Brookings, South DakotaEast Dakota Water Development District, Brookings, South Dakota
Septic Systems Data for septic tanks is discussed in the Assessment Report on page 65. Contributions from septic systems were estimated based on rural households because a direct accounting of the number of septic systems in use in the TMDL watershed was unavailable. The 25.6 percent contribution from septic systems was determined by assuming 20 percent of all rural septic systems in the North-Central Big Sioux River watershed area were failing. This percentage does not account for die-off or attenuation of fecal coliform bacteria between failing septic systems and the stream. In general, failing septic systems discharge over land for some distance, where a portion of the fecal coliform bacteria may be absorbed on the soil and surface vegetation before reaching the stream. It is assumed that failing septic systems constitute a diminutive amount of the overall contribution because not all of the failing systems would be reaching the receiving waters. These results will not directly affect the TMDL allocations. Therefore, it is implied that comparatively, failing septic systems are having an insignificant affect on the excess fecal coliform loading and will be included in the margin of safety portion of the TMDL. Urban Areas Fecal coliform bacteria in urban and suburban areas may be attributed to stormwater runoff, overflow of sewer systems, illicit discharge of sanitary waste, leaking septic systems, and pets. Land Use Landuse in the watershed was derived from the AnnAGNPS Model. Table 4 shows that 98 percent of the area is in grass or cropland.
Table 4. Land Use in the Peg Munky Run Watershed Linkage Analysis Water quality data was collected at one project monitoring site (T42) on Peg Munky Run. Samples were collected according to South Dakota’s EPA approved Standard Operating Procedures for Field Samplers. The fecal coliform bacteria water samples were analyzed by the Sioux Falls Health Lab (2001-2002) in Sioux Falls, South Dakota. Quality Assurance/Quality Control samples were collected on 10% of the samples according to South Dakota’s EPA approved Non-point Source Quality Assurance/ Quality Control Plan. Details concerning water sampling techniques, analysis, and quality control are addressed in the assessment final report. The Flow Duration Interval method calculates fecal coliform bacteria loading, (concentration) × (flow), using zones based on hydrologic conditions. Reductions are calculated using the median of the fecal coliform bacteria samples in each zone. This method shows that while a TMDL may be expressed as a single point it can also be thought of as a continuum of points representing the criterion value and various flow values. In order to assess the impact of fecal coliform bacteria for this stream, the flow duration interval curve was divided into “flow zones”. The purpose of the zones is to differentiate hydrologic conditions, between peak and low flows, as ranges. The typical flow zones are High (0-10), Moist (10-40), Mid-Range (40-60), Dry (60-90), and Low (90-100). However, because of the limited sample data, the overall condition of the hydrologic zones was evaluated. Excessive fecal coliform loadings are occurring during
LandUse Percent AcresCropland 77% 28,374
Rangeland/Grassland 21% 7,549Building/Farmstead 2% 775

Public Notice and EPA TMDL Comments February 2008
East Dakota Water Development District, Brookings, South DakotaEast Dakota Water Development District, Brookings, South DakotaEast Dakota Water Development District, Brookings, South DakotaEast Dakota Water Development District, Brookings, South Dakota
high flows and during dry to low flows. Load duration curves were calculated using the following equation:
(flow) × (conversion factor) × (state criteria) = quantity/day or daily load This curve represents the threshold of the load. As seen in Figure 3, any samples occurring above this line is an exceedence of the water quality standard and represented by a red box (Table 5). Table 6 depicts the allowable coliform bacteria load during the study for peak flow, low flow, and 5th percentile increments in flow. Figure 3. Flow Duration Interval for Peg Munky Run Table 5. Exceedences of the Water Quality Standard ≤ 2000 cfu/100mL
1.00E+07
1.00E+09
1.00E+11
1.00E+13
1.00E+15
0 10 20 30 40 50 60 70 80 90
Flow Duration Interval (%)
Feca
l Col
ifor
m B
acte
ria
(cou
nts/
day)
Target
Non-ExceedneceExceedence
Rain Event
90th
Median
Peg Munky Run (T42)
DryConditions
LowFlows
HighFlows
Mid-rangeFlows
MoistConditions
StationSample
DateSample
TimeFlow (cubic feet per second - cfs)
Flow Rank
Flow Rank
(percent)Fecal Coliform (counts/100mL)
Fecal Coliform Load
(counts/day)T42 07/20/01 1320 0.37 0.809 80.90 10000 9.05E+10T42 06/11/02 930 0.16 0.914 91.40 4700 1.85E+10T42 06/14/01 1400 143.16 0.008 0.80 3800 1.33E+13

Public Notice and EPA TMDL Comments February 2008
East Dakota Water Development District, Brookings, South DakotaEast Dakota Water Development District, Brookings, South DakotaEast Dakota Water Development District, Brookings, South DakotaEast Dakota Water Development District, Brookings, South Dakota
Table 6. Fecal Coliform Target Loads for Flow The Agricultural Non-Point Source Pollution (AGNPS) model is a GIS-integrated water quality model that predicts non-point source loadings within agricultural watersheds. ArcView GIS software was used to spatially analyze animal feeding operations and their pollution potential. The feedlot assessment assumed the probable sources of fecal coliform bacteria loadings within the NCBSR watershed were agricultural related and rated the feedlots based on runoff potential. Feedlot ratings ranged from 0-102. Table 7 lists the eight feedlots rating 50 or greater. A rating of 50 or greater warrants concern in regards to potential pollution problems. A map identifying the region of concern is shown in Figure 4. A complete methodology report can be found in Appendix T of the Assessment Report. Table 7. Feedlot ratings ≥ 50 in the
Peg Munky Run Watershed
ID Rating1201 511203 511199 621193 641202 671211 761207 811206 85
Flow Rank
(percent) cfs
fecal Coliform
(counts/day)Flow
Conditions0.019 190.50 9.32E+12 Peak0.1 174.96 8.56E+12
0.274 171.27 8.38E+121 167.41 8.19E+125 12.35 6.04E+1110 7.54 3.69E+1115 5.49 2.69E+1120 4.83 2.36E+1125 4.19 2.05E+1130 3.36 1.64E+1135 3.02 1.48E+1140 2.46 1.20E+1145 2.03 9.92E+1050 1.74 8.50E+1055 1.41 6.90E+1060 1.17 5.70E+1065 0.84 4.10E+1070 0.73 3.57E+1075 0.57 2.81E+1080 0.40 1.94E+1085 0.32 1.55E+1090 0.16 7.86E+0995 0.14 6.81E+09
100 0.02 1.07E+09 Low
Allowable Loads 2000 cfu/100mL

Public Notice and EPA TMDL Comments February 2008
East Dakota Water Development District, Brookings, South DakotaEast Dakota Water Development District, Brookings, South DakotaEast Dakota Water Development District, Brookings, South DakotaEast Dakota Water Development District, Brookings, South Dakota
Figure 4. Location of Feedlots in the Peg Munky Run Watershed TMDL Allocations TMDL
Wasteload Allocations (WLAs) NPDES facilities are permitted to discharge effluent at the bacteria standard. When operating properly, they will not cause or contribute to water quality violations. Their contributions are relatively small in comparison to the total loading of the segment. Most dischargers operate well within their permit limits and discharge smaller loads than allowed. New or increases in discharges affecting this segment will be required to meet bacterial standards prior to discharge. This ensures these additions of load will not cause violations of water quality standards. Identified point sources in this watershed currently do not discharge. Therefore, the “wasteload allocation” component of this TMDL will be zero. Load Allocations (LAs) Load allocations account for the portion of the TMDL assigned to non-point sources. Natural background constitutes two percent of the total and the remainder of the LA is assigned to those land uses likely to contribute fecal coliform bacteria loads at rates above natural background. This includes cropland, pastureland, and residential areas. Based on the flow duration interval method, a 38 percent reduction is needed from non-point sources, as was shown in Table 2.
Tributary
Big Sioux River
Watershed Boundaries
N
W E
S
Monitoring Site
Municipality
Feedlot Rating < 50
Feedlot Rating ≥ 50
Peg
Munky Run
Hidewoo
d
Ck
City of Estelline
Point Source
10% MOS WLA LA % Background Other NPSOverall Conditons 8.50E+10 8.50E+09 7.65E+10 0.00E+00 7.65E+10 1.53E+09 7.50E+10Note: units are counts/day
Non-Point Source 100% = 2% + 98%Zone
TMDL
TMDL Total Allocations

Public Notice and EPA TMDL Comments February 2008
East Dakota Water Development District, Brookings, South DakotaEast Dakota Water Development District, Brookings, South DakotaEast Dakota Water Development District, Brookings, South DakotaEast Dakota Water Development District, Brookings, South Dakota
Seasonal Variation Different seasons of the year can yield differences in water quality due to changes in precipitation and agricultural practices. When a rainfall event occurs, fecal coliform bacteria that have built up on the land surface under dry conditions are washed off and finally deposited into lakes, rivers, and wetlands. To determine seasonal differences, runoff events were noted for the East Dakota Water Development District samples. Monitoring site T42 on Peg Munky Run is not meeting the water quality criteria for fecal coliform bacteria. Of the three samples that were exceeding the ≤ 2000 cfu/100mL standard, two (or 67 percent) were during rain events. Margin of Safety The margin of safety (MOS) is a portion of the loading capacity that is set aside to prevent the exceedence of a water quality standard as a means of accounting for the uncertainty involved in developing a TMDL. The MOS for this TMDL is explicit, meaning a specific quantity, in this case 10%, of the loading is set aside. This explicit MOS takes into consideration the uncertainties associated with flow and non-point sources. Critical Conditions The critical condition for fecal coliform loadings in any watershed depends on the presence of point sources and land use within that watershed. During a dry period, typically the critical condition is non-point sources followed by a rainfall event. During the rainfall event, fecal coliform bacteria that have built up on the land surface can wash into the stream, causing wet weather exceedences. Follow-Up Monitoring Monitoring and evaluation efforts will be targeted toward the effectiveness of implemented BMPs. Sample sites will be based on BMP site selection and include the parameter of fecal coliform bacteria. Once the implementation project is completed, post-implementation monitoring will be necessary to assure that the TMDL has been reached and improvement to the beneficial uses occurs. This will be achieved by recurrent water quality sampling at the original monitoring sites. Public Participation Efforts taken to gain public education, review, and comment during development of the TMDL involved: 1. East Dakota Water Development District monthly board meetings 2. Field demonstrations for the public 3. Articles in the local newspapers The findings from these public meetings and comments have been taken into consideration in development of the Peg Munky Run TMDL. Implementation Plan The TMDL analysis was performed using the best data available to specify the fecal coliform reductions necessary to achieve water quality criteria. The intent of meeting the criteria is to support the designated use classifications of this stream. A detailed implementation plan is not included in this TMDL. The involvement of local land owners and agencies will be needed in order to develop an implementation plan. In general, reductions in fecal coliform bacteria

Public Notice and EPA TMDL Comments February 2008
East Dakota Water Development District, Brookings, South DakotaEast Dakota Water Development District, Brookings, South DakotaEast Dakota Water Development District, Brookings, South DakotaEast Dakota Water Development District, Brookings, South Dakota
should be sought through identification and installation of agricultural and urban BMPs to reduce loads during runoff events.
Public Notice and EPA TMDL Comments February 2008
East Dakota Water Development District, Brookings, South DakotaEast Dakota Water Development District, Brookings, South DakotaEast Dakota Water Development District, Brookings, South DakotaEast Dakota Water Development District, Brookings, South Dakota
Appendix JJ. Public Notice TMDL Comments and
SDDENR Response to Comments Fecal Coliform
JJ-1

Public Notice and EPA TMDL Comments February 2008
East Dakota Water Development District, Brookings, South DakotaEast Dakota Water Development District, Brookings, South DakotaEast Dakota Water Development District, Brookings, South DakotaEast Dakota Water Development District, Brookings, South Dakota
North Central Big Sioux River TMDLs - Public Notice Comments from EPA
• The Introduction section (p. 1), the body of the assessment report and the individual TMDLs should be updated to reflect the most recent listing information from the 2006 303(d) list. Also, each individual TMDL (i.e., Appendix DD – JJ) should include the State’s assessment unit ID(s) for the segment(s) covered, and a statement as to whether the segment covered by the TMDL is on the 2006 303(d) list or not.
SDDENR Response - The assessment unit IDs have been added to each segment and language has been added to reflect the 2006 IR. Assessment unit IDs for the smaller waterbodies not specifically listed in the 2006 IR will be created and added to the TMDL language.
EPA response: OK
• The equations referenced in the Flow Duration Interval section (p. 22) seem to have errors in them. We
recommend copying the equations from the Central Big Sioux River report (p. 46). Also, it seems that by using these equations and the data provided in Table 12, the percent reduction for each of the zones would not be zero. This table seems to match the LDC table for site R14 in Appendix V, however the rows labeled “Existing” and “Target Load” should be reversed. Because Table 12 is meant to be an example of the percent reduction calculations it might be better to use data from a site that requires some reductions. Also, the example conversion for cfu/100mL to col/day (p. 24) should start with cfu/100mL rather than col/day.
SDDENR Response – Equations on pg 22 and 24 have been corrected. Table 12 is only an example to reflect a site with actual reductions. This table has been changed.
EPA response: OK
• The Assessment of Sources sections (pp. 37, 64, 65) as well as Appendix DD refers to stormwater
contributions from the City of Watertown. Both sections include this source in the non point source grouping. The City of Watertown has a municipal separate storm sewer system (MS4) permit from SD DENR for their stormwater discharges. This makes the stormwater fecal coliform contributions from Watertown a point source according to the various EPA regulations and guidance. Subsequently, this source needs to be included in the Point Source section of the assessment report and in the TMDL for the segment of the Big Sioux River that includes the City of Watertown (i.e., Appendix DD; TMDL for the Big Sioux River from Lake Kampeska to Willow Creek). Also, the TMDL for this segment needs to include a separate WLA for stormwater for the City of Watertown in accordance with EPA’s guidance (See EPA’s memorandum: “Establishing Total Maximum Daily Load (TMDL) Wasteload Allocations (WLAs) for Storm Water Sources and NPDES Permit Requirements Based on Those WLAs,” November 22, 2002 - http://www.epa.gov/npdes/pubs/final-wwtmdl.pdf). Also, the TMDL should be clear on whether the City of Watertown will need to reduce their fecal coliform loading from stormwater.
SDDENR Response – When the TMDL was initiated, an MS4 Phase II was not necessary. Watertown was not included as an MS4 because of this. However, with the existing flow and loading data, as part of this assessment, DENR can allocate a WLA to city of Watertown for their MS4. However, at this time the City of Watertown has not been contacted regarding the potential and Fecal WLA for their MS4 permit for the Kampeska to Willow Creek Segment. Until the city has been given time to comment on the WLA, this TMDL will be withheld for final approval at this time.
EPA response: OK
• The Assessment of Sources section (p. 62) includes tables that list the NPDES percent contributions of TSS
and fecal coliform. However, neither these tables nor the individual TMDLs list the WLAs, as a daily load, for each one of the discharging facilities. As a result of the TMDL program’s evolution and issues related to the Anacostia lawsuit, EPA must now have the NPDES permit numbers and WLAs for each TMDL approval. We must subsequently enter that information into our national TMDL tracking system. The loading tables in each TMDL need to be revised to include the individual WLA for each point source

Public Notice and EPA TMDL Comments February 2008
East Dakota Water Development District, Brookings, South DakotaEast Dakota Water Development District, Brookings, South DakotaEast Dakota Water Development District, Brookings, South DakotaEast Dakota Water Development District, Brookings, South Dakota
discharge that is contributing a load to that segment, rather than the combined WLA as is currently included (See Tables 2-2 and 5-4 in EPA’s Aug 2007 load duration curve guidance. The full reference is given below).
SDDENR Response –. Note under each table states that the units are in pounds or colonies per day. DENR has added the permit numbers and individual WLA for each TMDL. EPA response: OK
• The load duration curves used in each of the TMDLs (Appendix DD – JJ) seem to have been created by combining two or more curves to form a single curve. For example, the Big Sioux River segment from Willow Creek to Stray Horse Creek has two monitoring stations – R17 & R18. The LDC for R17 requires a 33% reduction at high flow only, and the LDC for R18 requires an 11% reduction at mid-range flow and a 16% reduction at dry flow (all percentages include a 10% MOS). However, when both of these curves are combined in the TMDL (Appendix EE) the result is LDC that requires a 10% reduction at high flow only. This may be a result of averaging the flows from both curves to create a single curve.
Requiring only a 10% reduction at high flow, as specified in the TMDL for this segment, does not appear to protect the water quality at station R17 which requires a 33% reduction at high flow, or at R18 which requires reductions for both mid-range and dry flows. Also, by averaging flows from multiple stations to form a single curve, the new curve does not correspond to the flows at any of the individual stations (i.e., a theoretical curve has been created to derive the necessary TMDL loads). We do not recommend combining multiple curves in a segment into a single curve. Often, when there are multiple monitoring stations within a segment, the LDC for the monitoring station nearest the end of the segment is used to derive the TMDL loads (as was done for most of the TMDLs in the Central Big Sioux report), because it may best represent the reductions needed in that segment rather than the contributions from the upstream segment. We recommend using the curve from the monitoring station that is closest to the end of the segment to derive the loading capacity and revise the TMDLs for the each one Central Big Sioux river segments and tributaries.
SDDENR Response – Multiple curves were combined for the fecal coliform TMDLs because of the random distribution of the samples. There was no relationship between the flow and concentration for fecal coliform. Samples were clustered together resulting in flowzones with little to no data that could be used to calculate an existing load or reduction. The samples and flows between both sites were then used to calculate an existing load. If they were not combined this would not be possible. BMPs used to achieve the reductions at the high flow zone will have similar effects in the lower zones as well, i.e. animal waste management systems and/or exclusionary fencing. Through implementation efforts at the high flowzone TMDLs will be met at all zones. The problem is with the variability of the fecal coliform bacteria. The TMDL needs to be written for the entire reach/segment rather than for individual stations. Sampling was conducted on the same day on many sites so this method of combining data within a “reach” is more reflective and more protective the that entire segment. A TMDL should not be based on the individual sampling stations within a segment. In the end the reductions are high enough that the implementation will target those areas of concern. EPA response: (Same as Central Big Sioux Coments) Berry made the comment that we then need to clarify (in the document not the individual TMDLs) the process used to merge the data sets by adding a couple of paragraphs. He thinks he saw something in document that said the data was averaged and averaging is not acceptable for them. Will need to search document to determine if this wording exists and update it if it does. Ruppel asked how far apart the stations were and Deb said they were about 15-18 stream miles apart. He said they will “think about this” (merging the data) to see if there will be a problem. He said “there may not be a problem” but he doesn’t know and wants to think about it. • The TMDL for the Big Sioux River segment from Stray Horse Creek to near Volga (Appendix FF) requires
reducing the fecal coliform counts per day by two grab samples as the TMDL goal. As is mentioned in the comment below, these reductions will mostly be used to guide post-TMDL implementation; however this is not an acceptable goal. See the comment below on our recommendations for use of the percent reduction

Public Notice and EPA TMDL Comments February 2008
East Dakota Water Development District, Brookings, South DakotaEast Dakota Water Development District, Brookings, South DakotaEast Dakota Water Development District, Brookings, South DakotaEast Dakota Water Development District, Brookings, South Dakota
goals as a guide to revising this TMDL (i.e., either remove the goal or use the percent reduction from R20 as part of the implementation discussion).
SDDENR Response – Further review of the EDWDD data with DENR’s ambient data indicates that this particular segment does not require a TMDL. This segment has never been listed for impairment of the limited contact beneficial use (1998-2006). It is currently meeting this beneficial use so DENR has decided not to submit this particular TMDL for approval.
EPA response: OK. Berry states, “if it’s not impaired, it’s not impaired”
• The TMDL for Peg Munky Run (Appendix JJ) is based on four data points from one monitoring station –
T42. These 4 data points represent only 3 of the 5 flow ranges. It appears that due to the limited data set, it was decided to use the median concentration for all four data points, rather than the median within each individual flow zone, to derive the necessary reduction percentage/load. As is mentioned in the comment below, these reductions will mostly be used to guide post-TMDL implementation. However, with the very limited amount of data for this stream, a high level of uncertainty is built into the LDC for this segment. Even if the 90th percentile data line were used to derive the reduction goal, the margin of error is likely to be high. We recommend delaying the TMDL for this stream until more data can be collected.
SDDENR Response – According to DENR methodology four samples is insufficient data for listing and developing a TMDL. The intent of the sampling was to develop load allocations and reductions for the implementation of other TMDLs in the watershed. Sampling is continuing via the implementation project and a TMDL will be developed if data shows the need. This is the same issue with Bachelor Creek. EPA response: Berry talked a little bit about this. How much data is needed to develop a load duration curve and a TMDL? Berry said they don’t have the answer to that but 4 samples doesn’t seem to be enough. • The Flow Duration Interval section (pp. 21 – 24) and the individual TMDLs mention that the existing loads
and the reductions goals are based on the median concentration of the fecal coliform bacteria samples from each flow zone. While we recognize that use of the median concentration data is largely used to as a guide for post-TMDL implementation, we are concerned that each TMDL uses the calculated percent reductions as the TMDL “goal.” The amount of load reduction necessary to achieve the water quality standards is likely higher than the values derived using the median concentrations. The LDC guidance document (See: “An Approach for Using Load Duration Curves in the Development of TMDLs,” EPA 841-B-07-006, August 2007 - http://www.epa.gov/owow/tmdl/duration_curve_guide_aug2007.pdf), and training modules developed by Bruce Cleland mention using the 90th percentile values of the data within each flow zone. Using the 90th percentile values ensures that no more than 10 percent of the data will exceed the applicable water quality standard. This approach is consistent with the assessment methodologies of many states which allow up to a 10 percent exceedance of the WQS before listing the water body as impaired. We recommend either: 1) removing the percent reductions from the TMDLs entirely (Appendices DD – JJ) – specifically remove them as the “Goal” for each TMDL and remove the reduction tables within each TMDL; 2) use the 90th percentile values to be consistent with DENR’s assessment methodology and the examples in the LDC guidance; or 3) move the percent reduction tables and percent reduction goals to the Implementation section of each TMDL. Also, include a statement in the Implementation section that the reductions derived from the median concentrations will be used as a starting point to begin implementation, but that additional controls may be needed in order to achieve the applicable water quality standards and meet the loads specified in the TMDL.
SDDENR Response –The percent reduction tables and goals were moved to the implementation section. A new goal was set for each TMDL stating “Full Support of the Beneficial Uses”.
EPA response: OK with Option 3. See previous comment from Central Big Sioux.
• The phosphorus TMDLs that were developed to address the TSI impairments in East Oakwood Lake and
West Oakwood Lake are well written. Based on the data collected during the assessment it appears that East Oakwood Lake may be impaired for dissolved oxygen and pH. The pH impairment is mentioned in the assessment report, but the dissolved oxygen results do not recognize the impairments. Table 53 (p. 47)

Public Notice and EPA TMDL Comments February 2008
East Dakota Water Development District, Brookings, South DakotaEast Dakota Water Development District, Brookings, South DakotaEast Dakota Water Development District, Brookings, South DakotaEast Dakota Water Development District, Brookings, South Dakota
indicates that 7 of the 59 dissolved oxygen samples taken in East Oakwood Lake exceed the WQS – an 11.9% violation rate. Based on this violation rate we recommend adding a dissolved oxygen target to the East Oakwood Lake TMDL, and a dissolved oxygen/phosphorus linkage analysis (similar to what UT DEQ has used – see other recently developed lake TMDLs developed by SD DENR). These revisions would allow the phosphorus TMDL to address the dissolved oxygen violations.
SDDENR Response – DENR needs to review the profile data collected at the time these DO samples were collected to see if the language you mention in your comment is applicable. EPA response: Alan said they aren’t going to count the bottom DO measurements and they were going to review the profile data. Stacy mentioned that the WQS for DO were going to be changed this year with the triennial review of the WQS. I’m not sure EPA is in agreement but at this point we’d been on the phone for 1 ½ hours! Ugh… We need to review the assessment methodology of the IR with regard to DO surface and bottom measurements. If there are enough violations we will have to insert language regarding refuge which we’ve done with several lake TMDLs already. 4 TMDLs to be Submitted for Final Approval: Appendix EE. Willow Creek to Stray Horse Creek Segment (Fecal Coliform) Appendix GG. Willow Creek (Fecal Coliform) Appendix HH. Stray Horse Creek (Fecal Coliform) Appendix II. Hidewood Creek (Fecal Coliform) 3 TMDLs to be withheld at this time: Appendix DD. Lake Kampeska to Willow Creek Segment (Fecal Coliform Bacteria) for MS4 Reasons
(Watertown) Appendix FF. Stray Horse Creek to Near Volga Segment (Fecal Coliform) has never been identified as
impaired and will not be submitted. Appendix JJ. Peg Munky Run (Fecal Coliform) does not have enough data. More sampling will be
conducted.


Related Documents