printed on recycled paper Prepared by the: TCEQ Strategic Assessment Division, TMDL Team TSSWCB TMDL Team TEXAS COMMISSION ON ENVIRONMENTAL QUALITY TEXAS STATE SOIL AND WATER CONSERVATION BOARD December 2002 An Implementation Plan for Soluble Reactive Phosphorus in the North Bosque River Watershed For Segments 1226 and 1255

Welcome message from author
This document is posted to help you gain knowledge. Please leave a comment to let me know what you think about it! Share it to your friends and learn new things together.
Transcript

printed onrecycled paper
P r e p a r e d b y t h e :T C E Q S t r a t e g i c A s s e s s m e n t D i v i s i o n , T M D L T e a m T S S W C B T M D L T e a m
T E X A S C O M M I S S I O N O N E N V I R O N M E N T A L Q U A L I T YT E X A S S T A T E S O I L A N D W A T E R C O N S E R V A T I O N B O A R D
December 2002
An Implementation Plan for Soluble Reactive Phosphorus in theNorth Bosque River WatershedFor Segments 1226 and 1255

ii

iii
Table of Contents
Introduction . . . . . . . . . . . . . . . . . . . . . . . . . . . . . . . . . . . . . . . . . . . . . . . . . . . . . . . . . . . . . . . . . . 1Watershed Characteristics . . . . . . . . . . . . . . . . . . . . . . . . . . . . . . . . . . . . . . . . . . . . . . . . . . . 2Summary of TMDL Goals . . . . . . . . . . . . . . . . . . . . . . . . . . . . . . . . . . . . . . . . . . . . . . . . . . 4
Reduction of Phosphorus in the North Bosque River . . . . . . . . . . . . . . . . . . . . . . . . . 4Reduction of Algal Growth . . . . . . . . . . . . . . . . . . . . . . . . . . . . . . . . . . . . . . . . . . . . . 6Nonpoint Sources . . . . . . . . . . . . . . . . . . . . . . . . . . . . . . . . . . . . . . . . . . . . . . . . . . . . . 6
Nutrient Utilization Plan (NUP) . . . . . . . . . . . . . . . . . . . . . . . . . . . . . . . . . . . . . 8Point Sources . . . . . . . . . . . . . . . . . . . . . . . . . . . . . . . . . . . . . . . . . . . . . . . . . . . . . . . . 9
Control Actions and Management Strategies . . . . . . . . . . . . . . . . . . . . . . . . . . . . . . . . . . . . . . . . 9CNMPs . . . . . . . . . . . . . . . . . . . . . . . . . . . . . . . . . . . . . . . . . . . . . . . . . . . . . . . . . . . . . . . . 10WQMPs . . . . . . . . . . . . . . . . . . . . . . . . . . . . . . . . . . . . . . . . . . . . . . . . . . . . . . . . . . . . . . . . 11TSSWCB Role . . . . . . . . . . . . . . . . . . . . . . . . . . . . . . . . . . . . . . . . . . . . . . . . . . . . . . . . . . 11
Implementation Phases . . . . . . . . . . . . . . . . . . . . . . . . . . . . . . . . . . . . . . . . . . . . . . . . . . . . . . . . 12Phase I . . . . . . . . . . . . . . . . . . . . . . . . . . . . . . . . . . . . . . . . . . . . . . . . . . . . . . . . . . . . . . . . . 12
Comprehensive Nutrient Management Planning for All Identifiable AgriculturalSources of Phosphorus Loading in the North Bosque Watershed . . . . . . . . . . 13
Microwatershed-Based Approach to Water Quality Monitoring and Agricultural Producer Assistance . . . . . . . . . . . . . . . . . . . . . . . . . . . . . . . . . . . 13
Removal of 50% of CAFO Manure from the Watershed for Disposal . . . . . . . . . . . 14Municipal WWTP Effluent Limits . . . . . . . . . . . . . . . . . . . . . . . . . . . . . . . . . . . . . . 14Adapting Rules, Permit Reviews, and Enforcement Activities to
Watershed Issues . . . . . . . . . . . . . . . . . . . . . . . . . . . . . . . . . . . . . . . . . . . . . . . 15Water Quality Monitoring . . . . . . . . . . . . . . . . . . . . . . . . . . . . . . . . . . . . . . . . . . . . . 17Schedule for Phase I . . . . . . . . . . . . . . . . . . . . . . . . . . . . . . . . . . . . . . . . . . . . . . . . . 17Relative Contributions of Phase I Management Strategies for Nonpoint Sources . . 17
Phase II . . . . . . . . . . . . . . . . . . . . . . . . . . . . . . . . . . . . . . . . . . . . . . . . . . . . . . . . . . . . . . . . 21
Programs To Implement Control Actions and Management Measures . . . . . . . . . . . . . . . . . . . . 22Legal Authority . . . . . . . . . . . . . . . . . . . . . . . . . . . . . . . . . . . . . . . . . . . . . . . . . . . . . . . . . . 22
TSSWCB . . . . . . . . . . . . . . . . . . . . . . . . . . . . . . . . . . . . . . . . . . . . . . . . . . . . . . . . . . 22TCEQ . . . . . . . . . . . . . . . . . . . . . . . . . . . . . . . . . . . . . . . . . . . . . . . . . . . . . . . . . . . . . 22
Permitting Programs . . . . . . . . . . . . . . . . . . . . . . . . . . . . . . . . . . . . . . . . . . . . . . . . . . . . . . 24Agriculture . . . . . . . . . . . . . . . . . . . . . . . . . . . . . . . . . . . . . . . . . . . . . . . . . . . . . . . . . 25
Schedule . . . . . . . . . . . . . . . . . . . . . . . . . . . . . . . . . . . . . . . . . . . . . . . . . . . . . . 28Assurance . . . . . . . . . . . . . . . . . . . . . . . . . . . . . . . . . . . . . . . . . . . . . . . . . . . . . 28
Municipal Permits . . . . . . . . . . . . . . . . . . . . . . . . . . . . . . . . . . . . . . . . . . . . . . . . . . . 28Phase I . . . . . . . . . . . . . . . . . . . . . . . . . . . . . . . . . . . . . . . . . . . . . . . . . . . . . . . 31Phase II . . . . . . . . . . . . . . . . . . . . . . . . . . . . . . . . . . . . . . . . . . . . . . . . . . . . . . 32Schedule . . . . . . . . . . . . . . . . . . . . . . . . . . . . . . . . . . . . . . . . . . . . . . . . . . . . . . 32Assurance . . . . . . . . . . . . . . . . . . . . . . . . . . . . . . . . . . . . . . . . . . . . . . . . . . . . . 32
Industrial Permits . . . . . . . . . . . . . . . . . . . . . . . . . . . . . . . . . . . . . . . . . . . . . . . . . . . 33Storm Water Permits . . . . . . . . . . . . . . . . . . . . . . . . . . . . . . . . . . . . . . . . . . . . . . . . . 33

iv
Composting Program . . . . . . . . . . . . . . . . . . . . . . . . . . . . . . . . . . . . . . . . . . . . . . . . . . . . . 34Schedule . . . . . . . . . . . . . . . . . . . . . . . . . . . . . . . . . . . . . . . . . . . . . . . . . . . . . . . . . . . 36Assurance . . . . . . . . . . . . . . . . . . . . . . . . . . . . . . . . . . . . . . . . . . . . . . . . . . . . . . . . . . 36
Voluntary Best Management Practices and Educational Programs . . . . . . . . . . . . . . . . . . 36Microwatershed Councils . . . . . . . . . . . . . . . . . . . . . . . . . . . . . . . . . . . . . . . . . . . . . 37Schedule . . . . . . . . . . . . . . . . . . . . . . . . . . . . . . . . . . . . . . . . . . . . . . . . . . . . . . . . . . . 38Assurance . . . . . . . . . . . . . . . . . . . . . . . . . . . . . . . . . . . . . . . . . . . . . . . . . . . . . . . . . . 38
Compliance and Enforcement Program . . . . . . . . . . . . . . . . . . . . . . . . . . . . . . . . . . . . . . . 38
Water Quality Monitoring Plan . . . . . . . . . . . . . . . . . . . . . . . . . . . . . . . . . . . . . . . . . . . . . . . . . . 40Compost Program Monitoring . . . . . . . . . . . . . . . . . . . . . . . . . . . . . . . . . . . . . . . . . . . . . . 41Implementation Monitoring . . . . . . . . . . . . . . . . . . . . . . . . . . . . . . . . . . . . . . . . . . . . . . . . 41Tributary Monitoring . . . . . . . . . . . . . . . . . . . . . . . . . . . . . . . . . . . . . . . . . . . . . . . . . . . . . 42Model Refinement Monitoring . . . . . . . . . . . . . . . . . . . . . . . . . . . . . . . . . . . . . . . . . . . . . 43
Schedule . . . . . . . . . . . . . . . . . . . . . . . . . . . . . . . . . . . . . . . . . . . . . . . . . . . . . . . . . . . 43Assurance . . . . . . . . . . . . . . . . . . . . . . . . . . . . . . . . . . . . . . . . . . . . . . . . . . . . . . . . . . 43
Measures of Success . . . . . . . . . . . . . . . . . . . . . . . . . . . . . . . . . . . . . . . . . . . . . . . . . . . . . . . . . . 44Programmatic Measures . . . . . . . . . . . . . . . . . . . . . . . . . . . . . . . . . . . . . . . . . . . . . . . . . . . 44Water Quality Measures of Success . . . . . . . . . . . . . . . . . . . . . . . . . . . . . . . . . . . . . . . . . . 45Evaluation of Stream Water Quality Goal Attainment . . . . . . . . . . . . . . . . . . . . . . . . . . . . 46
Comparison of monitored data to model-predicted probability curves . . . . . . . . . . . 47Comparison of monitored data to historical data regressions . . . . . . . . . . . . . . . . . . 48
Other Activities . . . . . . . . . . . . . . . . . . . . . . . . . . . . . . . . . . . . . . . . . . . . . . . . . . . . . . . . . . . . . . 49Refinement of the Watershed Model . . . . . . . . . . . . . . . . . . . . . . . . . . . . . . . . . . . . . . . . . 49
Schedule . . . . . . . . . . . . . . . . . . . . . . . . . . . . . . . . . . . . . . . . . . . . . . . . . . . . . . . . . . . 49Assurance . . . . . . . . . . . . . . . . . . . . . . . . . . . . . . . . . . . . . . . . . . . . . . . . . . . . . . . . . . 49
Effluent Trading Study . . . . . . . . . . . . . . . . . . . . . . . . . . . . . . . . . . . . . . . . . . . . . . . . . . . . 50Schedule . . . . . . . . . . . . . . . . . . . . . . . . . . . . . . . . . . . . . . . . . . . . . . . . . . . . . . . . . . . 50Assurance . . . . . . . . . . . . . . . . . . . . . . . . . . . . . . . . . . . . . . . . . . . . . . . . . . . . . . . . . . 50
Other Sources of Information . . . . . . . . . . . . . . . . . . . . . . . . . . . . . . . . . . . . . . . . . . . . . . . . . . . 69Texas Commission on Environmental Quality (TCEQ) . . . . . . . . . . . . . . . . . . . . . . . . . . . 69Texas State Soil and Water Conservation Board (TSSWCB) . . . . . . . . . . . . . . . . . . . . . . 70Texas Water Development Board (TWDB) . . . . . . . . . . . . . . . . . . . . . . . . . . . . . . . . . . . . 70US Department of Agriculture, Natural Resources Conservation Service
(USDA-NRCS) - Texas Office . . . . . . . . . . . . . . . . . . . . . . . . . . . . . . . . . . . . . . . . . 70
References Cited . . . . . . . . . . . . . . . . . . . . . . . . . . . . . . . . . . . . . . . . . . . . . . . . . . . . . . . . . . . . . 71

v
TablesTable 1. Percent Reduction Goals at North Bosque River Index Sites . . . . . . . . . . . . . . . . . . . . . 5Table 2. Schedule for Phase I . . . . . . . . . . . . . . . . . . . . . . . . . . . . . . . . . . . . . . . . . . . . . . . . . . . 18Table 3. Existing Condition WWTP Phosphorus Loading to the
North Bosque River, 1995-1998 . . . . . . . . . . . . . . . . . . . . . . . . . . . . . . . . . . . . . . . . . . 30Table 4. Initial Waste Load Allocation, Full Permitted Discharge . . . . . . . . . . . . . . . . . . . . . . . 31Table 5. Historical Data Regression Equations for North Bosque River Index Sites . . . . . . . . 46
Figures
Figure 1. North Bosque Watershed . . . . . . . . . . . . . . . . . . . . . . . . . . . . . . . . . . . . . . . . . . . . . . . 51Figure 2. Bosque River Land Uses . . . . . . . . . . . . . . . . . . . . . . . . . . . . . . . . . . . . . . . . . . . . . . . 52Figure 3. Estimates of Gross Existing Loadings at Selected North Bosque River Stations . . . . 53Figure 4. SWAT Model results at Valley Mills . . . . . . . . . . . . . . . . . . . . . . . . . . . . . . . . . . . . . . 54Figure 5. SWAT Model results at Clifton . . . . . . . . . . . . . . . . . . . . . . . . . . . . . . . . . . . . . . . . . . 55Figure 6. SWAT Model results Above Meridian . . . . . . . . . . . . . . . . . . . . . . . . . . . . . . . . . . . . 56Figure 7. SWAT Model results Below Stephenville . . . . . . . . . . . . . . . . . . . . . . . . . . . . . . . . . . 57Figure 8. SWAT Model results Above Stephenville . . . . . . . . . . . . . . . . . . . . . . . . . . . . . . . . . . 58Figure 9. TMDL goal probability curve for index site at Valley Mills . . . . . . . . . . . . . . . . . . . . 59Figure 10. TMDL goal probability curve for index site at Clifton . . . . . . . . . . . . . . . . . . . . . . . 60Figure 11. TMDL goal probability curve for index site Above Meridian . . . . . . . . . . . . . . . . . . 61Figure 12. TMDL goal probability curve for index site Below Stephenville . . . . . . . . . . . . . . . 62Figure 13. TMDL goal probability curve for index site Above Stephenville . . . . . . . . . . . . . . . 63Figure 14. Regression curve at index site above Stephenville . . . . . . . . . . . . . . . . . . . . . . . . . . 64Figure 15. Regression curve at index site below Stephenville . . . . . . . . . . . . . . . . . . . . . . . . . . 65Figure 16. Regression curve at index site above Meridian . . . . . . . . . . . . . . . . . . . . . . . . . . . . . 66Figure 17. Regression curve at index site Clifton . . . . . . . . . . . . . . . . . . . . . . . . . . . . . . . . . . . . 67Figure 18. Regression curve at index site Valley Mills . . . . . . . . . . . . . . . . . . . . . . . . . . . . . . . . 68

vi

1 Control actions refer to point source pollutant reduction strategies, generally Texas Pollutant Discharge Elimination System (TPDES) permits. Management measures refer to nonpoint sourcepollutant reduction strategies, generally voluntary best management practices.
December 2002Texas State Soil and Water Conservation Board • Texas Commission on Environmental Quality 1
An Implementation Plan for Soluble Reactive Phosphorus in
the North Bosque River Watershed
IntroductionIn keeping with the Texas commitment to restore and maintain water quality in impairedwater bodies, the Texas Commission on Environmental Quality (TCEQ or Commission)and the Texas State Soil and Water Conservation Board (TSSWCB) recognized from theinception of the total maximum daily load (TMDL) program that implementation planswould need to be established for each TMDL developed.
The TMDL is a technical analysis that:
(1) determines the maximum loadings of pollutant a water body can receive andstill both attain and maintain its water quality standards, and
(2) allocates this allowable loading to point and nonpoint source categories in thewatershed.
Based upon the TMDL, an implementation plan is developed. The implementation plan isa strategic planning document for use by appropriate state agencies, which identifiesregulatory and non-regulatory activities designed to achieve water quality standardsconsistent with the TMDL. It also functions to provide direction for other public andprivate entities involved in TMDL implementation in the affected watershed. Though theplan itself is not a rulemaking, it includes a description of potential regulatory andvoluntary strategies to achieve the pollutant reductions identified in the TMDL. Allnecessary rulemaking will be conducted in accordance with the Administrative ProcedureAct. It also includes a schedule by which the Commission and TSSWCB anticipate thesestrategies will be implemented.
This implementation plan contains the following:
(1) a description of strategies for control actions and management measures1 toachieve the water quality target;
(2) legal authority under which the participating agencies may requireimplementation of such strategies;
(3) schedule for implementing activities to achieve TMDL objectives;

December 2002Texas State Soil and Water Conservation Board • Texas Commission on Environmental Quality2
(4) a follow-up surface water quality monitoring plan to determine theeffectiveness of the control actions and management measures undertaken;
(5) a statement of why TCEQ and the TSSWCB have concluded that theimplementation of voluntary management measures will achieve the loadallocations for nonpoint sources; and
(6) identification of measurable outcomes TCEQ will review to determine theefficiency of the implementation plan and whether water quality standards arebeing achieved.
This implementation plan is designed to guide the achievement of reductions inconcentrations of phosphorus in the North Bosque and Upper North Bosque River asdefined in the adopted TMDLs. Implementation is conceptually divided into two phases:Phase I will be implemented immediately, while Phase II generically includes additionalcontrols and measures that may be needed if water quality goals of the TMDL are notbeing achieved. Figures 1 through 8 of this document are identical to figures with thesame numbers in the TMDL document.
This implementation plan was prepared by the Texas State Soil and Water ConservationBoard and the TMDL Team in the Strategic Assessment Division of the Office ofEnvironmental Policy, Analysis, and Assessment of the TCEQ.
Technical assistance in the form of published reports and consultations was provided by:
• the Texas Institute for Applied Environmental Research (TIAER); and• numerous programs or organizational units within the TCEQ.
This implementation plan was approved by the TSSWCB on January 16, 2003, and bythe TCEQ on December13, 2002. The combined TMDL and implementation planprovide local, regional, and state organizations a comprehensive strategy for restoringand maintaining water quality in an impaired water body. TCEQ has ultimateresponsibility for ensuring that water quality standards are restored and maintained inimpaired water bodies.
Watershed CharacteristicsThe Bosque River is located in north central Texas, northwest of the City of Waco, and isa tributary of the Brazos River. The Bosque River is impounded at Waco, near itsconfluence with the Brazos River, to form Waco Lake (Segment 1225), which suppliespublic drinking water for many people in the vicinity of Waco. The North Bosque Riveris the longest arm of the Bosque system, draining approximately 75% of the Waco Lakewatershed, while the Middle and South Bosque Rivers and Hog Creek drain most of theremaining area (Figure 1).
Topographically and historically, the Bosque River watershed is representative of theheart of Texas. The upper watershed has medium-sized hills, carved into a limestone

December 2002Texas State Soil and Water Conservation Board • Texas Commission on Environmental Quality 3
plateau, with relatively shallow, rocky soils and areas of moderate to steep slope. Theupper watershed has long been utilized for ranching, dairies, and other animal productionagriculture. The lower watershed, drained by the Middle and South Bosque Rivers, hasrolling blackland prairie with deep soils, and row crop production is the predominantform of agriculture. The distribution of these and other land uses within the watershed isdepicted on Figure 2.
The North Bosque River is administratively divided into two designated water qualitysegments (see Figure 1):
• Segment 1226, North Bosque River – extends from a point 100 metersupstream of FM Road 185 in McLennan County to a point immediatelyupstream of the confluence of Indian Creek in Erath County
• Segment 1255, Upper North Bosque River – extends from a point immediatelyupstream of the confluence of Indian Creek in Erath County to the confluenceof the North Fork and South Fork of the North Bosque River in Erath County
Designated uses for both segments of the North Bosque River are established in theTexas Surface Water Quality Standards (30 TAC Chapter 307). The current designateduses for the North Bosque River (Segment 1226) are contact recreation, high qualityaquatic life use, and public water supply. The current designated uses for the UpperNorth Bosque River (Segment 1255) are contact recreation, and intermediate qualityaquatic life use. The differences in designated uses reflects the headwater characteristicsof the Upper North Bosque River segment, especially its intermittent flow.
Bacterial concentrations in the Upper North Bosque River (Segment 1255) and itstributaries are of concern, to the extent that some water bodies in Erath County areimpaired for contact recreation use. The 2002 water quality inventory found thatdownstream waters, including the North Bosque River (Segment 1226) and Waco Lake(Segment 1225), are fully supporting the contact recreation and public water supply uses. Specific TMDLs or implementation plans regarding bacteria issues have not beendeveloped yet, but data collection in the North Bosque watershed is assessing and willcontinue to assess bacterial levels and sources. However, management measures forcontrol of phosphorus loading will also have some corollary effect on reducing bacterialoading, since the nonpoint source nutrient and bacteria loads largely originate from thesame sites and materials and are transported via the same processes and pathways.
Water quality concerns in the North Bosque River watershed are largely associated withanimal feeding operations, though discharges from other agricultural uses and urbanizedareas also contribute. Individual animal feeding operations are categorized as eitherConcentrated Animal Feeding Operations (CAFOs) or Animal Feeding Operations(AFOs). CAFOs are larger facilities that must be authorized by registrations or individualpermits, while AFOs are similar but smaller facilities that may operate under theconditions of Chapter 321 of the Texas Administrative Code Subchapter B without

December 2002Texas State Soil and Water Conservation Board • Texas Commission on Environmental Quality4
registration or individual permit. In the North Bosque River watershed, AFOs andCAFOs are virtually all dairies, but other types of animal production may also be sodesignated. For dairies, AFOs are generally facilities with 200 head or fewer, whileCAFOs are those facilities with more than 200 head.
Throughout this implementation plan, use of the term “animal feeding operation(s)”refers to all facilities for any type of animal, while use of the acronyms AFO or CAFOdistinguish or refer to the type of authorization and size. In this implementation plan, useof the term “dairies” refers to all CAFOs and AFOs that produce milk.
Summary of TMDL GoalsThe North Bosque River TMDLs address phosphorus loading in the watersheds of theNorth Bosque River (Segment 1226) and the Upper North Bosque River (Segment 1255).The North Bosque River segments were included on the 303(d) List of impaired watersdue to indications that nutrients are adversely affecting the segments. Studies within thewatersheds identified phosphorus as the limiting nutrient and identified soluble reactivephosphorus as the parameter best correlated to algal growth response. For purposes of theTMDLs, the parameters soluble reactive phosphorus and orthophosphate-phosphorus areconsidered to be essentially identical. Within this document, references to the NorthBosque River and its watershed generally include both designated segments, unless aspecific distinction is made.
The goal of the North Bosque River TMDLs is to achieve a significant reduction insoluble reactive phosphorus (SRP) annual-average concentrations, as measured in theriver at five index sites. Reduced annual-average concentrations in the river will also bereflected as reduced total annual “net loading” at the monitored index sites. Measurestaken to achieve the goal of reduced concentrations in the river will reduce “grossloading” from the individual sources. Net loading is calculated from and closely linked toinstream concentration, while gross loading is more comparable to effluentconcentrations. Instream concentration and net loading are direct indicators of ecosystemresponse and condition that tend to integrate both management efficiency and streamassimilative capacity, while gross loading and effluent concentration measure individualtreatment system or management measure performance without providing direct insightto stream conditions. Hence, instream concentrations and net loading are the preferredmetrics for monitoring the success of TMDL implementation.
Reduction of Phosphorus in the North Bosque RiverThe goal of the TMDLs is expressed as a “percent reduction” of instream phosphorusconcentrations at five index sites along the North Bosque River, relative to the existingcondition at the respective sites. The “existing condition” at each site was defined bywater quality data collected circa 1995 - 1998 for analyses that supported TMDLdevelopment. The broad numeric statement of the goals of the North Bosque RiverTMDLs is to reduce annual-average SRP concentrations in the river by approximately50% for the entire North Bosque River watershed as a long-term watershed average with

December 2002Texas State Soil and Water Conservation Board • Texas Commission on Environmental Quality 5
some local variation that reflects location within the watershed. More precise values forthe individual index sites are shown in Table 1 (which corresponds to Tables 4 and 6 ofthe North Bosque TMDL document). Net load and annual concentration values in Table1 correspond to averages indicated by horizontal lines on the model output depicted inFigures 4 through 8, which are reproduced from the TMDL document.
Table 1. Percent Reduction Goals at North Bosque River Index Sites
Predicted Average Net Total-Annual Soluble Phosphorus Loading
Loading is expressedin units of kilograms
per year, kg/yrAbove
StephenvilleBelow
StephenvilleAbove
Meridian Clifton Valley Mills
Predicted averagetotal-annual load from‘Existing’ scenario
4,061 10,068 22,117 26,990 28,832
Predicted averagetotal-annual load from‘TMDL-e’ scenario
1,556 4,173 10,479 15,498 17,625
% reduction 61.7 % 58.6 % 52.6 % 42.6 % 38.9 %
Predicted Average Annual-Average Soluble Phosphorus Concentration
AboveStephenville
BelowStephenville
Above Meridian Clifton Valley Mills
From ‘Existing’scenario (ppb)
203.3 1,143.2 117.0 52.2 41.3
From ‘TMDL-e’scenario (ppb)
114.2 448.1 54.5 30.3 27.5
% reduction 43.8 % 60.8 % 53.4 % 41.9 % 33.4 %
As shown in Table 1, the percent decreases, for both instream concentration and netloading, are expected to be somewhat higher upstream, and somewhat lower downstream,due to the geographic distribution of sources and the hydrology of the watershed. Forexample, at the Valley Mills index site, annual-average concentration is expected todecrease by approximately 33%, while average total-annual net loading (i.e. as measuredin the river) decreases by approximately 39%. At the index site Above Meridian, near themiddle of the watershed, annual-average concentration is expected to decrease byapproximately 50%, with a similar reduction in average total-annual phosphorus netloading. At the sites near Stephenville, reduction targets are near 60%.
The instream concentration and net load reduction goals are to be achieved by reducingthe average total-annual gross loading (i.e. as measured near the source) through thestrategies for management measures and control actions described. The TMDL includedan estimate that achieving the annual-average concentration targets at each of the index

December 2002Texas State Soil and Water Conservation Board • Texas Commission on Environmental Quality6
sites might require aggregate gross load reductions of approximately 50% overall fromboth point and nonpoint sources.
Reduction of Algal GrowthSoluble phosphorus reductions of the magnitude sought by this implementation plan willreduce the potential for problematic algae growth in the North Bosque River anddownstream waters, and should reduce the actual occurrence of algal blooms. Modelsimulations predicted that the annual-average soluble phosphorus concentration in thelower North Bosque River will be low enough to limit algal growth during most of theyears following implementation (see Figures 4 through 5). Algal growth potential willalso be significantly reduced at the upstream stations, although to a lesser degree (Figures6 through 8). However, algae and nutrient interactions are extremely dynamic and verymuch influenced by weather conditions and other environmental factors. Efforts tocontrol nutrient loading can reduce or limit the occurrence of algal blooms, but cannottotally prevent them in water bodies that contain natural communities of aquaticorganisms adapted to episodic flow regimes and nutrient loadings that interact with otherseasonal limitations such as temperature or light intensity. The model analyses predicted,as shown in Figures 4-8, that load reductions anticipated from this plan will improvewater quality conditions (i.e. reduce nutrient loads and concentrations), though in someyears the annual-average soluble phosphorus concentrations will still exceed thepreliminary algal growth limiting concentration goals discussed in the TMDL.
Nonpoint Sourcess implementation plan addresses all aspects of dairy or animal feeding operation
facilities as components of nonpoint source loading, although the potential for dischargefrom retention facilities causes some parts of animal feeding operations to be defined aspoint sources from a legal or regulatory perspective. Retention facilities are often called“runoff control structures (RCS),” “ponds,” or “lagoons.” Runoff from waste applicationfields (WAFs) caused by rainfall is a nonpoint source discharge that is controlled by useof best management practices (BMPs). Runoff from WAFs caused by excessiveirrigation with waste material is an unauthorized discharge subject to enforcement. Sincecurrently available information is not sufficient to distinguish animal feeding operationnonpoint loading (authorized runoff from WAFs) from point loading (authorizeddischarges from retention structures), the load allocation for animal feeding operationnonpoint sources includes the waste load allocation for animal feeding operation pointsources. Unauthorized discharges from retention structures or waste application fields areaddressed using enforcement policies in place at the time of the investigation. There isno load allocation for unauthorized discharges.
Estimates of gross soluble phosphorus loading that occurred during the period fromNovember 1995 through March 1998 were calculated, by land use category, from datacollected in the North Bosque watershed (McFarland and Hauck, 1999). Figure 3presents those estimates, as calculated at each of five index sites along the North BosqueRiver. The bar graphs and pie charts in Figure 3 indicate that the land use named “WAF”

December 2002Texas State Soil and Water Conservation Board • Texas Commission on Environmental Quality 7
contributed a large portion of the total loading. The data used to develop Figure 3characterized small watersheds with mixed land uses, including all aspects of dairyoperations. All loadings that emanated from any aspect of a dairy operation during themonitored period were addressed in the analyses as WAFs, although it is probable thatsome amount of loading actually originated from authorized or unauthorized “pointsource” discharges from retention structures.
When properly performed, land application remains one of the best and most appropriatemethods for dealing with large amounts of animal wastes. In many cases, land applicationis a beneficial reuse of waste materials. This implementation plan seeks to identifystrategies to assure that all land application in the North Bosque watershed is planned,managed, and performed in accordance with effective nutrient management practices. Ingeneral, particular attention will be paid to waste application fields (WAFs) used by dairyoperations in the North Bosque River watershed to ensure that waste application occurson suitable sites and is properly managed to minimize phosphorus transport into surfacewaters. Strategies for NPS load reduction management in this implementation plan willfocus on dairies and the WAF land use, especially during the initial phase ofimplementation. At the same time, compliance and enforcement activities will focus oneliminating unauthorized discharges and loading from all parts of dairy operations.
Distinguishing the relative importance of various aspects of dairy operations with regardto phosphorus loading would require more detailed sampling and analyses. More precisedata would also be needed to characterize the differences in phosphorus export expectedfrom a properly managed active WAF, from an improperly managed active WAF, andfrom an inactive WAF still recovering from excessive applications in the past.Developing enough single-land use data, including edge-of-field data from WAFs, tofully characterize and predict loading from various aspects of dairy operations will take asignificant amount of time. Several entities will continue efforts to gather and analyzedata from such studies, and the TCEQ and the TSSWCB will utilize such data as itbecomes available.
The gross existing loadings from various land uses depicted in Figure 3 did not serve asinput to the watershed model from which instream concentration and net loading targetswere derived, so there is no direct linkage between gross loading and net loadingembodied in previous analyses. However, comparing the gross loading estimates fromFigure 3 to model-predicted net loadings at the same sites (Figures 4 - 8), and assuming asimple linear relationship between gross and net loading, allows an estimate of apparentreduction in total nonpoint source gross loading that would correspond to a model-predicted reduction in net loading. Using the index site “Above Meridian” as thereference point for such estimates, gross nonpoint source load reductions needed to meetthe TMDL goals may range from 20% to 56%, depending on the type of simple linearrelationship assumed (ratio or difference). Presuming that dairy operations are the onlytype of nonpoint source reduced, loading from dairies and WAFs may need to be reducedby 33% to 90% to achieve overall nonpoint source load reductions of that magnitude.

December 2002Texas State Soil and Water Conservation Board • Texas Commission on Environmental Quality8
These estimated percentages refer to reductions in the amount of phosphorus exportedfrom land to the stream system; the estimates are not directly related to the amount ofwaste applied to WAFs in the watershed.
This implementation plan will initially focus on achieving comprehensive nutrientmanagement of dairy wastes to minimize current and future loading of phosphorus fromWAFs. Initial implementation will also include enhanced efforts to enforce currentpermit requirements (see Enforcement Program) and to assure that existing retentionstructures have been adequately designed, constructed, and managed (see PermittingPrograms, Agriculture) in order to eliminate unauthorized discharges from animalfeeding operations (see additional discussion under Point Sources). However, the residualeffects of abused or abandoned WAFs, or effects of unauthorized discharges fromretention or waste storage facilities, may impede progress towards the TMDL goal andmay require additional measures or other operational limits. Water quality monitoring,refinement of model analyses, and periodic assessments of progress will allow adaptationof implementation strategies as needed to better address the effects of residual sourcesand unauthorized discharges.
Nutrient Utilization Plan (NUP)The NPS strategies proposed in this implementation plan would bring as many acres aspossible, of the land receiving manure and/or wastewater applications, into conformancewith United State Department of Agriculture-Natural Resources Conservation Service(USDA-NRCS) Practice Standard 590 (Nutrient Management). Some permittedoperations may already have developed a Nutrient Utilization Plan (NUP) as arequirement of their permit and the TCEQ Chapter 321 Subchapter B ConcentratedAnimal Feeding Operation (CAFO) Rules. It should be noted that a NUP is not aComprehensive Nutrient Management Plan (CNMP), which is discussed later in thisimplementation plan as a mechanism for achieving proper nutrient management. A NUPis a subset, or a grouping of the measurable and enforceable practices, of a CNMP. ACNMP is a dynamic instrument that both prescribes future activities and documents pastperformance. It also records daily management of the facility while taking issues such asfeed management, manure and wastewater handling and storage, nutrient management,land treatment practices, and other manure and wastewater utilization options intoconsideration. In most cases, an operator’s NUP can be used to reduce the effort neededto compile an effective CNMP.
The TSSWCB has recently begun a project, partly aimed at addressing private andunpermitted land application sites, which provides cost-share funding for landownerswho agree to manage their land in accordance with a certified water quality managementplan (WQMP) which would include the elements of the NUP. Water quality managementplans include suites of best management practices (BMPs) on a producer’s entire agri-cultural operation that can minimize environmental degradation as a result of existingconditions, as well as prevent future problems from occurring.
December 2002Texas State Soil and Water Conservation Board • Texas Commission on Environmental Quality 9
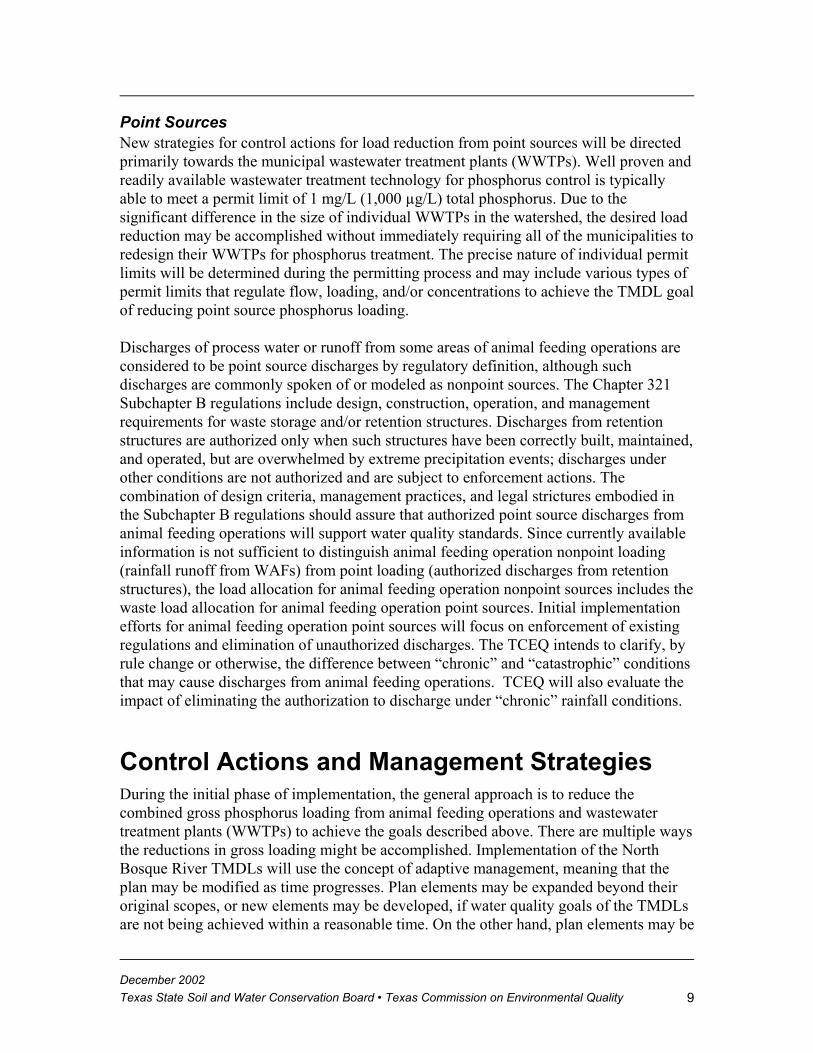
Point SourcesNew strategies for control actions for load reduction from point sources will be directedprimarily towards the municipal wastewater treatment plants (WWTPs). Well proven andreadily available wastewater treatment technology for phosphorus control is typicallyable to meet a permit limit of 1 mg/L (1,000 µg/L) total phosphorus. Due to thesignificant difference in the size of individual WWTPs in the watershed, the desired loadreduction may be accomplished without immediately requiring all of the municipalities toredesign their WWTPs for phosphorus treatment. The precise nature of individual permitlimits will be determined during the permitting process and may include various types ofpermit limits that regulate flow, loading, and/or concentrations to achieve the TMDL goalof reducing point source phosphorus loading.
Discharges of process water or runoff from some areas of animal feeding operations areconsidered to be point source discharges by regulatory definition, although suchdischarges are commonly spoken of or modeled as nonpoint sources. The Chapter 321Subchapter B regulations include design, construction, operation, and managementrequirements for waste storage and/or retention structures. Discharges from retentionstructures are authorized only when such structures have been correctly built, maintained,and operated, but are overwhelmed by extreme precipitation events; discharges underother conditions are not authorized and are subject to enforcement actions. Thecombination of design criteria, management practices, and legal strictures embodied inthe Subchapter B regulations should assure that authorized point source discharges fromanimal feeding operations will support water quality standards. Since currently availableinformation is not sufficient to distinguish animal feeding operation nonpoint loading(rainfall runoff from WAFs) from point loading (authorized discharges from retentionstructures), the load allocation for animal feeding operation nonpoint sources includes thewaste load allocation for animal feeding operation point sources. Initial implementationefforts for animal feeding operation point sources will focus on enforcement of existingregulations and elimination of unauthorized discharges. The TCEQ intends to clarify, byrule change or otherwise, the difference between “chronic” and “catastrophic” conditionsthat may cause discharges from animal feeding operations. TCEQ will also evaluate theimpact of eliminating the authorization to discharge under “chronic” rainfall conditions.
Control Actions and Management StrategiesDuring the initial phase of implementation, the general approach is to reduce thecombined gross phosphorus loading from animal feeding operations and wastewatertreatment plants (WWTPs) to achieve the goals described above. There are multiple waysthe reductions in gross loading might be accomplished. Implementation of the NorthBosque River TMDLs will use the concept of adaptive management, meaning that theplan may be modified as time progresses. Plan elements may be expanded beyond theiroriginal scopes, or new elements may be developed, if water quality goals of the TMDLsare not being achieved within a reasonable time. On the other hand, plan elements may be

December 2002Texas State Soil and Water Conservation Board • Texas Commission on Environmental Quality10
delayed or reduced in scope if water quality goals are achieved through greater BMPefficiency than anticipated or by management measures extraneous to the TMDLimplementation plan. For instance, a U.S. Army Corps of Engineers watershedrestoration project now in planning stages may lead some landowners to set aside riparianbuffer zones, or to establish wetland areas, for the purpose of reducing nonpoint sourceloading of various substances including phosphorus.
CNMPsA key element of action plans in priority watersheds impacted by agricultural orsilvicultural sources will be the voluntary development, certification by the TSSWCB,and implementation of comprehensive nutrient management plans (CNMPs) that managepollution from CAFOs, and water quality management plans (WQMPs) that abatenonpoint source pollution on private lands. Implementation of these voluntary plans iscrucial in achieving and documenting the attainment of water quality goals relating toagricultural and silvicultural NPS pollution.
There are several added benefits to developing and implementing a CNMP. The jointEnvironmental Protection Agency (EPA) - USDA Unified National Strategy for AnimalFeeding Operations, published March 9, 1999, set a national performance expectationthat all animal feeding operations, including permitted CAFOs, would obtain a CNMP.This expectation is evident in the most recent proposed changes to EPA’s regulationsregarding CAFOs. Also, the Farm Security and Rural Investment Act of 2002:
• removes the prohibition against Environmental Quality Incentives Program(EQIP) cost share for waste storage facilities for large, confined animal feedingoperations,
• requires livestock producers who receive cost share for animal waste systemsto have CNMPs,
• authorizes the Secretary of Agriculture to make incentive payments toproducers to implement land management practices and CNMPs, and
• targets 60 percent of EQIP funding to livestock water quality concerns.
The concept of the CNMP has been an integral part of the TSSWCB’s WQMP Programsince its inception when the facility is an AFO. However, because of the non-point sourcedesignation of the program’s definition, it has not been made available to CAFOs.Because of the national implications regarding CAFOs and the need for such a programfor water quality impaired areas such as the North Bosque River watershed, theTSSWCB has worked with the USDA-NRCS, the Texas Institute for AppliedEnvironmental Research (TIAER), Texas Cooperative Extension (TCE), TCEQ, and theTexas Association of Dairymen (TAD), to develop a CNMP program for Texas. Programdevelopment is underway.

December 2002Texas State Soil and Water Conservation Board • Texas Commission on Environmental Quality 11
WQMPsWater quality management plans are site-specific plans, authorized under state law, thatare designed to control NPS pollution from agricultural and silvicultural activities. Fundssupporting development of WQMPs come from legislative appropriations. WQMPs aretraditional conservation plans that meet the resource management system criteria in theUnited States Department of Agriculture - Natural Resources Conservation Service(USDA-NRCS) Field Office Technical Guide and contain measures to address allpotential sources of NPS pollution. WQMPs are developed through soil and waterconservation districts (SWCDs) with assistance from the USDA-NRCS and the TSSWCBstaff and are certified by the TSSWCB. This approach to NPS abatement andmanagement is unique because it uses a voluntary approach while affording thelandowner a mechanism for compliance with state water quality standards for a givenstream segment.
Nutrient management planning in accordance with the USDA-NRCS Practice Standardfor nutrient management (Code 590) is currently being observed on many dairyoperations and on the private agricultural property of other landowners. However, manyacres of private land are being supplemented with dairy manure and/or wastewater thatmay be applied without proper nutrient management practices. A concerted effort will bemade by TSSWCB to enhance the application of management measures on existing dairyoperations and to install proper nutrient management measures on all other such lands.
TSSWCB RoleThe Texas State Soil and Water Conservation Board (TSSWCB) will assist dairyoperators, and other agricultural producers, in the voluntary development andimplementation of water quality management plans (WQMPs) for AFOs, andComprehensive Nutrient Management Plans (CNMPs) for CAFOs in the North Bosquewatershed that utilize animal wastes. The TSSWCB WQMPs for individual operationswill address all land uses that comprise the total operation, which may include dairies,cropland, pastureland, or rangeland, as well as WAFs, and will address commercialfertilizer use as well as manure. CNMPs are not required to cover a producer’s totaloperation, or “whole-farm,” but they are required to cover the entire conservation system,or the production area and waste management activities. Nutrient management plans(NMPs), developed according to USDA-NRCS Practice Standard 590, are mandatorysubsections of all WQMPs and CNMPs. In the case of a CAFO, the NMP must be aNutrient Utilization Plan (NUP) as defined by the current Chapter 321, Subchapter B,CAFO Rules.
Efforts to reduce phosphorus loading from agricultural sources throughout the entirewatershed will be most effectively managed and measured if smaller microwatersheds aretargeted individually for BMP implementation and water quality monitoring. Monitoringmicrowatersheds will enable more precise identification of areas with waste managementproblems or inadequacies and better support efforts to improve management. Stateagencies should provide programs that will allow for agricultural microwatershed

December 2002Texas State Soil and Water Conservation Board • Texas Commission on Environmental Quality12
management councils of producers to discuss the need for accurate and comprehensivenutrient management planning, CNMP/WQMP development and implementationprocesses, meaningful water quality monitoring, cost-share availability, and self-policingor peer pressure as a mechanism to assure implementation.
Implementation PhasesThe adaptive management concept is reflected in the phases of implementation describedbelow. Phase I elements will be implemented immediately. Elements that may be neededif Phase I is not enough to achieve water quality goals are generically described as PhaseII, although there could actually be several secondary phases.
Phase IThe first phase implementation plan is based on feasible measures that were simulated inmodel analyses performed for the TMDL. Simply stated, those measures were:
• Phosphorus application rates in WAFs.• Reduced phosphorus diet for dairy cows, to reduce the phosphorus content of
dairy wastes.• Removing approximately half of the dairy-generated manure from the North
Bosque River watershed for use or disposal outside the watershed.• Effluent limits on phosphorus for municipal wastewater treatment plants.
Those basic elements will be implemented through the following strategies. Each isdiscussed in more detail below.
• Comprehensive nutrient management planning for all identifiable agriculturalsources of phosphorus loading in the North Bosque watershed.
• Microwatershed-based approach to water quality monitoring and agriculturalproducer assistance.
• Facilitating establishment of commercial composting facilities in the NorthBosque region and a sustainable market for compost products.
• Permit limits for phosphorus at municipal wastewater treatment plants.• Adapting rules, permit reviews, and enforcement activities, including
proposing changes to the current CAFO regulations. • Water quality monitoring, refinement of the TMDL model and analyses, and
assessment of progress towards water quality goals.
For most dairies, participation in efforts to remove manure from the watershed andefforts to reduce the phosphorus content of feed will be voluntary activities. Using thosevoluntary management measures may benefit the dairy operations by reducing their costsand efforts needed to develop comprehensive nutrient management plans. The success of

December 2002Texas State Soil and Water Conservation Board • Texas Commission on Environmental Quality 13
Phase I measures will be determined based on water quality results. Therefore, TCEQand the TSSWCB have concluded that implementation of the voluntary managementmeasures will assist achievement of water quality goals and that other elements ofcomprehensive nutrient management plans, which will be regulatory requirements formost dairies or CAFOs of other types, can support the goals if voluntary measures are notadopted by a sufficient number of dairy operations.
Comprehensive Nutrient Management Planning for All Identifiable Agricultural Sources of Phosphorus Loading in the North Bosque WatershedThe basic goal of this strategy is that waste management by dairies, and other facilitiesthat manage large amounts of animal wastes, effectively minimizes phosphorus loadingto the stream system. This goal would be furthered by use of comprehensive nutrientmanagement plans (CNMPs) designed so that animal waste applications to sites withinthe North Bosque River watershed do not exceed the application rates required by theNRCS Practice Standard for Nutrient Management (Code 590). Utilization of the manureremoval or reduced phosphorus feed management practices support and are componentsof the CNMP. The CNMPs could also incorporate any appropriate innovative methodsdairy operators may choose to utilize, such as free-stalls, capture-and-treat systems, orothers.
Comprehensive nutrient management planning includes feed management. Feedmanagement activities are voluntary measures, as defined by the NRCS Field OfficeTechnical Guide, but are highly recommended as a component of CNMPs developedwithin the North Bosque watershed. Feed management activities can reduce the amountof phosphorus in dairy wastes, to the extent possible, without adversely affecting milkproduction or herd health. Education and outreach efforts by the TSSWCB and otherentities will encourage dairy operators to learn the practices and benefits associated withreducing feed phosphorus levels appropriately and to implement those practices. Specificinformation and recommendations should be obtained from Land Grant Universities,industry, the Agricultural Research Service, or professional societies such as theFederation of Animal Science Societies (FASS) or American Registry of ProfessionalAnimal Scientists (ARPAS), or other technically qualified entities.
Microwatershed-Based Approach to Water Quality Monitoring and Agricultural Producer AssistanceThis strategy is based on an ongoing TSSWCB project entitled Technical and FinancialAssistance to Dairy Producers and Landowners of the North Bosque River WatershedWithin the Cross-Timbers and Upper Leon Soil and Water Conservation Districts(TSSWCB Projects # 01-13 and # 01-14). The project will establish an overall TechnicalAdvisory council and numerous microwatershed landowner councils and will coordinatemeetings of the councils. Monitoring will be conducted to characterize WAFperformance in the microwatersheds, based on tributary sampling. Technical assistance

December 2002Texas State Soil and Water Conservation Board • Texas Commission on Environmental Quality14
will be provided to landowners for development of CNMPs and implementation of themanagement practices in the individual plans.
This microwatershed approach provides finer geographic resolution for managingimplementation activities. Data from microwatersheds will help define sources ofpollutants, help characterize the effects of implemented management measures, and helpthe TSSWCB coordinate assistance for property owners. This approach will help eachindividual microwatershed group assess and correct deficiencies in waste applicationfields, retention structures, or other aspects of dairy management and may identify othertypes of land use that could improve management practices.
Removal of 50% of CAFO Manure from the Watershed for DisposalThe basic goal of this strategy is to remove from the North Bosque River watershedapproximately 50% of the manure produced by dairies, and other facilities that managelarge amounts of animal wastes, within the watershed. Operators of dairies and otherfacilities will be encouraged to participate in a program to create several compostingfacilities and a sustainable market for composted manure as a way to achieve this goal.Permit rules applicable to the North Bosque River watershed require new or expandingdairies to either remove manure from the watershed or employ other management optionsto prevent pollutant export. Composting may be the most cost-effective way for thosedairies to satisfy such a permit condition. More information regarding the compostingprogram is in Watershed Restoration Action Strategy for the North Bosque RiverWatershed (HUC 12060204) and §319 grant documents for the “State of TexasComposted Manure Incentive Program.”
Municipal WWTP Effluent LimitsThe basic goals of this strategy are to reduce overall phosphorus loading from existingWWTP discharges and to minimize future loading from new or expanded municipaldischarges.
Discharges from WWTPs are not evenly distributed along the North Bosque River, sincethe municipalities vary substantially in size. Most of the WWTP loading occurs in theupper portion of the watershed, above Meridian. Model simulations performed to supportTMDL development assumed that most of the load reduction would occur in the upperwatershed. Making the initial reductions in WWTP loading in the upper watershed isnecessary to achieve water quality goals at the below Stephenville index site. Since theCity of Stephenville is by far the largest WWTP discharge, and is the discharge furthestupstream along the river, it is a focus for Phase I reductions from point sources.
Table 4 summarizes the initial allocation of total phosphorus (TP) among the existingWWTPs and allowance for future growth proposed by the TCEQ for Phase I. Totalphosphorus is used for this waste load allocation to remain consistent with normalpractice in WWTP permitting and design and because it is a more inclusive measure ofphosphorus loading. The TCEQ will draft Phase I permits to incorporate requirements

December 2002Texas State Soil and Water Conservation Board • Texas Commission on Environmental Quality 15
that permittees monitor and report phosphorus loading, and will require planning andpermitting to begin Phase II for individual permittees as each reaches or exceeds the loadlimits allocated for Phase I. In Phase II, permit limits may be either “load-based”–requiring that effluent flow and/or concentration be controlled so that the permittedloading rate for total phosphorus not be exceeded – or “concentration-based”– requiringan average effluent concentration (1 mg/L TP) for any flow discharged. Later phasesmay involve a transition from load-based to concentration-based permit limits forindividual WWTPs.
The model simulations upon which Phase I is based included an explicit allowance forfuture growth of 0.6 million gallons per day (MGD) of hypothetical wastewater dischargewith a soluble reactive phosphorus concentration equivalent to 1 mg/L TP, or 829.5kilograms per year (kg/yr) of TP load. Table 4 allocates part of the allowance for growth(AFG) among all the cities except Stephenville and leaves the residual part as AFG. Thisdistribution allows for the new Cranfills Gap facility and is appropriate in Phase Ibecause Stephenville’s load limitation, which is necessary to attain water quality goals atthe below Stephenville index site, is expected to provide sufficient improvement to meetgoals at downstream index sites. Changes at downstream WWTPs may not be needed toattain water quality goals. Existing permit limits will remain in effect until amendmentsare approved through the TCEQ permitting process. More information is available in thesection Municipal Permits.
Adapting Rules, Permit Reviews, and Enforcement Activities to Watershed Issues The basic goal of this strategy is to assure that regulatory activities adequately supportefforts to achieve water quality targets. This type of effort is implicit in the concept ofadaptive management. Much of the effort this strategy requires will happen withinTCEQ, but it will affect many regulated entities within the North Bosque watershed.Some adaptations will occur during Phase I, and others may occur during Phase II. Modelrefinement efforts during Phase I will increase spatial resolution of analyses, integrate thelatest knowledge concerning phosphorus dynamics, and support review and adaptation ofthe implementation plan.
TCEQ will initiate an analysis of the correlation between the occurrence of “chronic”rainfall events and overflows from lagoons and waste storage ponds. Results will be usedto determine what revisions to the CAFO regulations are warranted.
Rule changes stipulated by the 77th Legislature that affect animal feeding operations inthe North Bosque River watershed were developed during 2001 and are in effect forPhase I. Those rule changes require that new or expanding CAFOs in the watershed havecertified nutrient utilization plans for any waste application fields with high soilphosphorus concentrations, and may limit the amount of manure a dairy operation isallowed to use or dispose within the watershed. Permits for new or expanded CAFOs

December 2002Texas State Soil and Water Conservation Board • Texas Commission on Environmental Quality16
would include those rule changes. In conformance with existing rules, Phase I TCEQpermit review procedures will also seek to assure that:
• all authorized CAFOs have comprehensive nutrient management plans. • all CAFO retention structures and facilities are designed, constructed, and
managed to minimize the occurrence of discharges – which may require morethan the published generic minimum design criteria and may require retrofit ofsome structures.
• all municipal wastewater treatment plant permits contain specific requirementsand limitations regarding the phosphorus content of their discharges.
More information is available in the section Permitting Programs.
Compliance and enforcement activities in the North Bosque watershed during Phase Iinclude inspections and other investigations based on issues of regional concern. Citiesand CAFOs will be inspected with the goals of this implementation plan in mind. Formalenforcement actions result if CAFOs:
• increase herd size without proper authorization.• fail to maintain adequate storage capacity or freeboard in retention structures
or waste storage ponds, or fail to notify TCEQ of discharges.• apply waste or wastewater to a WAF that has been documented to have
exceeded 200 parts per million phosphorus in Zone 1 of the soil horizon.
More information is available in the section Enforcement Program.
The current CAFO regulations expire in July 2004. In the Spring of 2003, TCEQ willinitiate the rulemaking process to revise appropriate sections of the current CAFOregulations, which may include but is not limited to:
• requiring all AFOs and CAFOs to use comprehensive nutrient managementplans.
• specifying additional requirements for tailwater controls at waste applicationsites or additional management requirements to prevent runoff caused byexcessive irrigation with wastewater.
• requiring AFOs and CAFOs to recertify retention structures if discharges haveoccurred due to “chronic” rainfall events.
• clarifying distinctions between “chronic” and “catastrophic” rainfall events,and/or eliminating the “chronic” rainfall event exemption.
• specifying more stringent design factors and/or management practices forretention structures.

December 2002Texas State Soil and Water Conservation Board • Texas Commission on Environmental Quality 17
More information is available in the section Legal Authority.
Water Quality MonitoringThe North Bosque River watershed will continue to be extensively monitored by variousentities concerned with water quality issues. All data collected will be used to the extentpossible to support assessment of TMDL implementation and to develop any adaptivestrategies that may be needed as Phase II. All data collection and laboratory analyses willbe performed consistent with Quality Assurance Project Plans (QAPPs). Moreinformation about monitoring activities is available in the sections of this plan titledWater Quality Monitoring Plan and Measures of Success.
Routine monitoring will occur at both historical and new sites on the river and itstributaries, to provide the primary basis for assessments of watershed conditions. Routinemonitoring is performed by TCEQ and several other qualified entities and will bescheduled annually through the TCEQ coordinated monitoring process. Data from routinemonitoring activities are stored in the TCEQ database.
Special project monitoring will support several individual projects. The CompostProgram and Microwatershed Council Program will plan and perform monitoringactivities intended to characterize the effects of existing management practices, and ofnew management practices, so that the effectiveness of various implementation elementscan be determined. The Model Refinement Project will collect data needed to supportmodel improvements, utilizing data from routine monitoring and other special projects tothe extent possible. Data from special projects may be used for periodic assessments ofgeneral water quality if the data represent ambient conditions suitable for suchassessments.
Schedule for Phase ITable 2 summarizes the schedule for implementing major elements of this plan. Moreinformation is available in subsequent sections that address specific elements.
Relative Contributions of Phase I Management Strategies for Nonpoint SourcesPredicting how much the three strategies for nonpoint WAF and animal wastemanagement will each contribute towards achieving the water quality goals is verydifficult, since the measures are at least partially voluntary and their effects overlap tosome extent. Furthermore, the locations and export loading rates of former or currentWAFs with existing elevated soil concentrations of phosphorus are not clear, and theresidual effects of those areas are not easily predicted. The potential effects of unplanneddischarges due to mismanagement or extreme weather conditions are also unpredictablewith existing models or information. Phase I management measures will need toovercome those unpredictable effects in order to be successful, or Phase II measures willbe needed.

December 2002Texas State Soil and Water Conservation Board • Texas Commission on Environmental Quality18
Table 2. Schedule for Phase I
Activity Activity Description Schedule forImplementingPhase I Activities
Agriculturepermits (TCEQ)
• Phosphorus-based waste management plans for newor expanding dairies are required before permits willbe issued.
• Existing facilities currently operating underphosphorus-based NUPs or TSSWCB water qualitymanagement plans will continue to do so.
• Existing facilities currently operating undernitrogen-based waste management plans will beencouraged or required to develop phosphorus-based plans within 3 years, as appropriate underpertinent rules and regulations.
• Chapter 321 Subchapter B rules will be modifiedduring the 2004 reauthorization if needed to supportthis goal.
• The goal of the TCEQ and the TSSWCB is that alldairies in the North Bosque River watershed will bepracticing phosphorus-based waste management bythe end of calendar year 2006.
Permit andoperational changesbegin 2002, completeby 2006
Initiate Ch 321 SubCh B rulereauthorization -Spring 2003
Implemented HB2912 requirementsfor new andexpanding dairies -Fall 2002
Municipalpermits (TCEQ)
• Upon approval of the implementation plan, TCEQwill initiate minor amendment actions for permitteeswhich do not currently have phosphorus limitsconsistent with the Phase 1 plan in order to make thepermits consistent with the Phase I municipalwasteload allocation. The City of Clifton permitcurrently has a phosphorus limit which is consistentwith (i.e. less than) the allocation; a majoramendment action is necessary to change the Cliftonpermit to the load limit and conditions for Phase I. The Phase I Clifton permit amendment action willbegin when the City of Clifton initiates a majoramendment application. The initial load allocationsfor each city are shown in Table 4. The permits willbe drafted to state that when the self-monitoring dataindicates that the discharge has reached 100% of theloading rate specified in Table 4, based on the dailyaverage for three consecutive months, the permitteeshall within 90 days submit a plan to achievecompliance with the load limit on a continuous basisOR to achieve a concentration limit of 1 mg/l basedon the permittee's requested design capacity flow.
Permit andoperational changesbeginning in 2003,continuing as neededfor individualtransitions to PhaseII
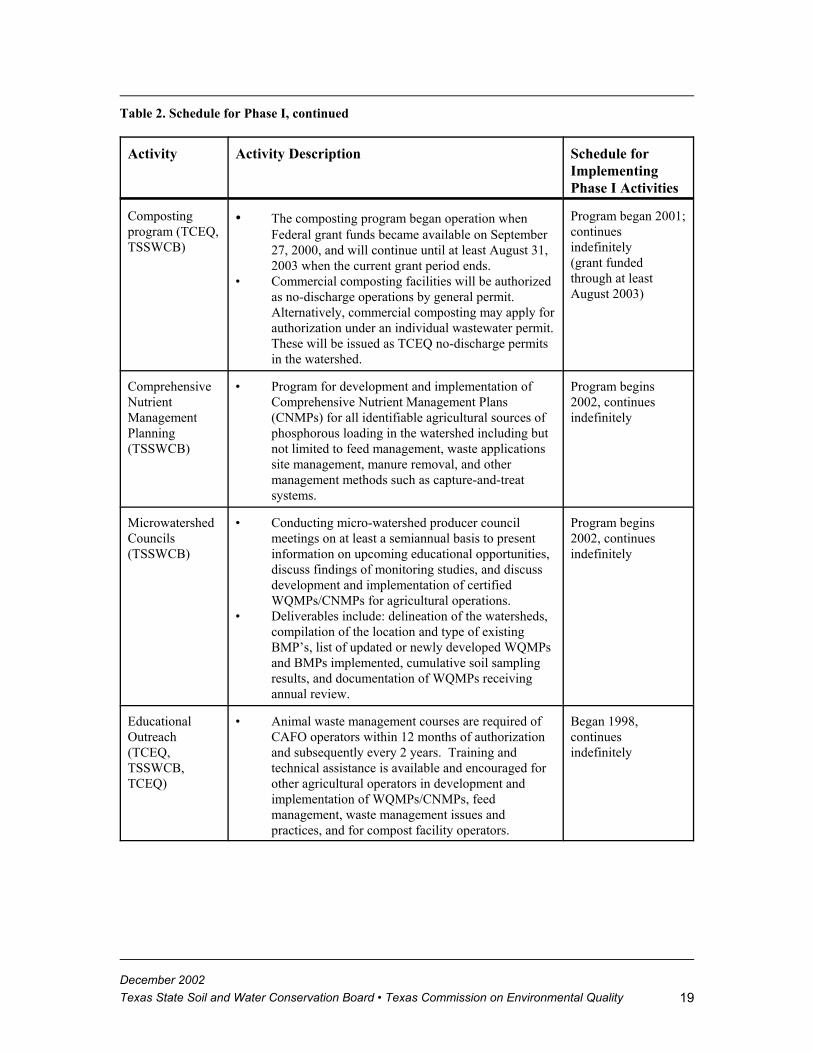
Table 2. Schedule for Phase I, continued
Activity Activity Description Schedule forImplementingPhase I Activities
December 2002Texas State Soil and Water Conservation Board • Texas Commission on Environmental Quality 19
Compostingprogram (TCEQ,TSSWCB)
• The composting program began operation whenFederal grant funds became available on September27, 2000, and will continue until at least August 31,2003 when the current grant period ends.
• Commercial composting facilities will be authorizedas no-discharge operations by general permit. Alternatively, commercial composting may apply forauthorization under an individual wastewater permit. These will be issued as TCEQ no-discharge permitsin the watershed.
Program began 2001;continuesindefinitely (grant fundedthrough at leastAugust 2003)
ComprehensiveNutrientManagementPlanning(TSSWCB)
• Program for development and implementation ofComprehensive Nutrient Management Plans(CNMPs) for all identifiable agricultural sources ofphosphorous loading in the watershed including butnot limited to feed management, waste applicationssite management, manure removal, and othermanagement methods such as capture-and-treatsystems.
Program begins2002, continuesindefinitely
MicrowatershedCouncils(TSSWCB)
• Conducting micro-watershed producer councilmeetings on at least a semiannual basis to presentinformation on upcoming educational opportunities,discuss findings of monitoring studies, and discussdevelopment and implementation of certifiedWQMPs/CNMPs for agricultural operations.
• Deliverables include: delineation of the watersheds,compilation of the location and type of existingBMP’s, list of updated or newly developed WQMPsand BMPs implemented, cumulative soil samplingresults, and documentation of WQMPs receivingannual review.
Program begins2002, continuesindefinitely
EducationalOutreach(TCEQ,TSSWCB,TCEQ)
• Animal waste management courses are required ofCAFO operators within 12 months of authorizationand subsequently every 2 years. Training andtechnical assistance is available and encouraged forother agricultural operators in development andimplementation of WQMPs/CNMPs, feedmanagement, waste management issues andpractices, and for compost facility operators.
Began 1998,continuesindefinitely

Table 2. Schedule for Phase I, continued
Activity Activity Description Schedule forImplementingPhase I Activities
December 2002Texas State Soil and Water Conservation Board • Texas Commission on Environmental Quality20
Water QualityMonitoring(TCEQ,TSSWCB, andothers)
• Implementation monitoring – weekly in-streammonitoring of soluble reactive phosphorous or PO4-P concentrations and flow measurements at 5 indexsites in the watershed to begin 2002 or 2003.
• Compost program monitoring – field monitoring tomeasure water quality improvements attributable tothe removal and composting of manure will begin in2002.
• Micro-watershed councils monitoring – in-streamsmall tributary monitoring to characterize theperformance of management of waste applicationfields and other wastewater management practices aspart of TSSWCB micro-watershed councils projectto begin in 2002.
• Model refinement monitoring – data to supportmodel refinement may be extracted from othermonitoring activities as described above. Modelrefinement investigative work will begin in the fallof 2002. Additional data needs will be assessedthroughout the model refinement development.
Some ongoing,special projects andexpanded routinemonitoring networkby 2006
Model refinementwill be completed by2006.
Coordinatedmonitoring plans aredeveloped annuallyin the spring. Nextdevelopment: Spring2003
The following discussion illustrates how the Phase I measures may potentially interact,using estimates of their predicted effects at the index site called “Above Meridian,”which is the middle site on Figure 3. These values represent estimates at one specificindex site and would be different if calculated at other points along the river.
Using the index site “Above Meridian” as the reference point for such estimates, grossnonpoint source load reductions needed to meet the TMDL goals may range from 20% to56%, depending on the type of simple linear relationship assumed. Presuming that dairyoperations are the only type of nonpoint source reduced, simple estimations suggest thatloadings from dairies and WAFs may need to be reduced by 33% to 90% to achieveoverall nonpoint source load reductions of that magnitude. The following illustrativediscussion will assume that dairy-related gross loading needs to be reduced by 60%,which is arbitrarily selected from within the estimated range.
The management goal of removing 50% of CAFO manure from the watershed willprimarily rely on the composting program. If the goal is attained, WAF gross loading willbe reduced by approximately 50% compared to what may otherwise have occurred. It ispossible that even more could be removed. However, if nobody participates, the manureremoval management strategy may achieve nothing, i.e. 0% is the minimum possiblecontribution. For illustrative discussion, assume this strategy removes enough manure

December 2002Texas State Soil and Water Conservation Board • Texas Commission on Environmental Quality 21
from the watershed so that phosphorus export from WAFs is reduced by 30%. Thatleaves 60 - 30 = 30% to be further reduced.
The reduced-phosphorus feed management strategy was proposed by dairy representa-tives during TMDL development. Information provided at that time suggests that carefulfeed mixing could reduce the phosphorus content of cow manure by as much as 28%. Thepotential contribution of this strategy is estimated as ranging from 0% (if nobody does it)to about 25% (if almost everybody does it). However, it will further contribute tophosphorus loading reduction only in the manure that is not hauled out of the watershed.For illustrative discussion, assume this strategy is applied by enough dairy operations toreduce the watershed average manure phosphorus content by 15%. Applying thatpercentage to the residual 70% remaining in the watershed (after haul-out of 30%), thereis a further reduction in gross loading of phosphorus (not manure) of 0.15(70%) = 10.5%.Now a total of 30% + 10.5% = 40.5% has been reduced, leaving 60 - 40.5 = 19.5%further reduction needed.
Other aspects of comprehensive nutrient management, like application rates in WAFs,would account for the balance of the 60% reduction, which is 19.5% in this illustrativeexample. If the results of the other strategies are better than presumed for this example,the land application rate measure may not need to accomplish as great a reduction.Conversely, if voluntary participation in the other two strategies is small and theycontribute little toward the reduction goal, or if unpredictable loading is large, thecomprehensive nutrient management strategy will have to accomplish a greater reduction.Potentially, the comprehensive nutrient management strategy may need to contributeanywhere from as little as 1% to as much as 60% towards the 60% reduction presumedfor this discussion. Of course, if the number of dairy cattle increases while dairy-relatedloading is being reduced, land application rates and CNMPs in general would also needto play a large role in preventing loading increases.
Phase IIIf water quality goals are not being attained by Phase I management strategies within areasonable amount of time, additional strategies will be needed. Water quality monitoringwill be used to determine if the water quality goals are being attained or approached. Formore information, see the sections “Water Quality Monitoring Plan” and “Water QualityMeasures of Success.” Information derived from monitoring BMP effectiveness may beused to determine which sources need additional control, or to refine model analyses thatpredict the extent and effect of additional measures.
Additional strategies, if needed, may occur in several subsequent phases, depending onthe effects of previously implemented strategies, but are described here as a singlesecondary phase for convenience. Types of future-phase management measures that maybe considered are listed below, but other management measures or control actions coulddevelop to augment or replace these. Details of Phase II elements will not be fullydeveloped until the need for them is clear.

December 2002Texas State Soil and Water Conservation Board • Texas Commission on Environmental Quality22
• Imposition of special requirements within the watershed for manure disposal,retention structures, tailwater controls, or other aspects of CAFO and AFOmanagement.
• Requirement of storm water control plans to reduce phosphorus loading fromcities, industries, or other regulated sites.
• Additional voluntary or regulatory strategies measures to reduce phosphorusloading from other land uses.
• Imposition of 1 mg/L total phosphorus permit limits for all wastewater treat-ment plants.
Programs To Implement Control Actions and Management MeasuresLegal AuthorityThe TCEQ, because of its central role in establishing state water quality standards anddetermining compliance with those standards, has particular responsibilities to fulfill inthe state’s overall water quality management program. The TSSWCB supports theprocess by providing input to the technical analyses, participating in steering committees,and by implementing NPS management programs and projects as necessary to addressthe agricultural and silvicultural contributions to impaired water bodies in the state.
TSSWCBThe TSSWCB is responsible for developing and implementing provisions of TMDLs andwatershed action plans related to agricultural and silvicultural nonpoint sources (TexasAgriculture Code 201.026 (a)), in conjunction with TCEQ management of the generalTMDL process. The TSSWCB is the lead agency for abatement of pollution fromagricultural or silvicultural activities, and shares responsibility with TCEQ for represent-ing the state before the federal Environmental Protection Agency or other federalagencies in matters relating to agricultural or silvicultural nonpoint source pollution(Texas Agriculture Code 201.026 (b)). Another responsibility of the TSSWCB is tocertify that water quality management plans for agricultural or silvicultural operationscomply with state water quality standards (Texas Agriculture Code 201.026 (c)).
TCEQThe TCEQ’s general authority to protect water quality in the State of Texas is specifiedin the Texas Water Code. General powers and duties are provided by the provisions ofTitle 2, Subtitle A, Chapter 5, Subchapter D. The TCEQ derives its specific authority toconduct enforcement actions from TWC, Title 2, Subtitle A, Chapter 7. Specifically,TWC § 7.002 authorizes the Commission to initiate an action to enforce provisions of thewater code and to institute legal proceedings to compel compliance with the TWC andwith rules, orders, permits or other decisions of the Commission. Responsibilities and

December 2002Texas State Soil and Water Conservation Board • Texas Commission on Environmental Quality 23
authorizations pertaining specifically to water quality protection are contained withinTitle 2, Subtitle D, Chapter 26.
The TCEQ received delegation of the NPDES program from EPA on September 14,1998, and is authorized to implement the Texas Pollutant Discharge Elimination System(TPDES), the regulatory program to control discharges of pollutants to surface waters.The TPDES program covers all permitting, surveillance and inspection, public assistance,and enforcement regulatory processes associated with waste discharges into surface waterin the state, with the exception of discharges associated with oil, gas, and geothermalexploration and development. The TPDES program includes discharges of waste fromindustry and municipal treatment works, and discharges of storm water associated withindustrial activities, construction sites, and municipal separate storm sewer systems(MS4s).
Texas statutory provisions require the Commission to establish the level of quality to bemaintained in, and to control the quality of, water in the state (TWC Section 26.011).Texas fulfills its obligations under Section 303(d) of the Clean Water Act to list impairedsegments and create TMDLs through functions assigned by the Legislature to TCEQ. TheSection 303(d) list is prepared by TCEQ as part of its monitoring, planning and assess-ment duties (TWC §26.0135). Watershed monitoring and assessments involving agricul-tural or silvicultural nonpoint source pollution must be coordinated through the TSSWCBwith local soil and water conservation districts (TWC §26.0135).
TMDLs are part of the state water quality management plans that TCEQ is charged bystatute to prepare (TWC §26.036). As the state environmental regulatory body, theCommission has primary responsibility for implementation of water quality managementfunctions within the State (TWC §26.0136 and §26.127). The Executive Director of theTCEQ must prepare and develop, and the Commission must approve, a comprehensiveplan for control of water quality in the state (TWC § 26.012). Texas Surface WaterQuality Standards are contained in Title 30, Chapter 307 of the Texas AdministrativeCode (30 TAC Chapter 307). TCEQ procedures for implementing these standards aredescribed in the most recent version of the document titled Implementation of the TexasCommission on Environmental Quality Standards. The list of impaired segments andresulting TMDLs are tools for water quality planning.
The Texas Land Application Permit (TLAP) program is administered under Chapter 309of the Texas Administrative Code (30 TAC Chapter 309). The TLAP program regulatesmunicipal and industrial discharges made adjacent to waters of the state. “Dischargeadjacent to waters” essentially means disposal of wastes by irrigation on land rather thanby direct discharge to a water body. Cities or composting operations within the NorthBosque River watershed that operate or propose “no discharge” permits are regulated bythe TLAP program. A proposed general permit for composting facilities would beauthorized under TLAP regulations.

December 2002Texas State Soil and Water Conservation Board • Texas Commission on Environmental Quality24
Permits or registrations for CAFO waste management or discharge are authorized underChapter 321 of the Texas Administrative Code (30 TAC Chapter 321) Subchapter B.CAFO irrigation facilities (i.e. waste application fields) have operational and regulatoryrequirements similar to those of the TLAP, but are regulated under different rules. Inaddition to regulating waste application fields, permits for dairies or other CAFOsregulate additional aspects of the operation, including discharges from retention struc-tures necessitated by conditions such as extreme precipitation events.
The North Bosque River watershed is a “major sole source impairment zone” as definedin House Bill (HB) 2912, Article 12, relating to Regulation of Certain Animal FeedingOperations and Senate Bill (SB) 2, Article 8, relating to Concentrated Animal FeedingOperations, which were passed by the 77th Texas Legislature in 2001. Animal feedingoperations in the North Bosque River watershed, including dairies, are subject to therequirements of that legislation as contained in 30 TAC Chapter 321.
The Chapter 321 Subchapter B CAFO regulations expire on July 27, 2004 unlessreadopted. The regulations will be reviewed and revised as appropriate for reauthoriza-tion. The regulations may be modified to better support implementation of this plan forthe North Bosque River watershed during the next or any other reauthorization cycle. Inthe Spring of 2003, TCEQ will initiate the rulemaking process to revise appropriatesections of the current CAFO regulations, which may include but is not limited to:
• requiring all animal feeding operations to use comprehensive nutrient manage-ment plans that minimize phosphorus loading, regardless of herd size, date ortype of authorization, type of animal, etc.
• specifying additional requirements for runoff and tailwater controls at wasteapplication sites, or additional management requirements to prevent runoffcaused by excessive irrigation with wastewater.
• requiring animal feeding operations to recertify retention structures if dis-charges have occurred due to “chronic” rainfall events.
• clarifying distinctions between “chronic” and “catastrophic” rainfall events,and/or eliminating the “chronic” rainfall event exemption.
• increasing storage capacity and/or freeboard requirements for waste storageand retention structures.
• changing minimum design criteria for retention structures (e.g. specifying thatponds must contain an event larger than the current 25-year 24-hour stormevent or requiring more rigorous analyses of the potential for overflows tooccur).
Permitting ProgramsStrategies of this implementation plan that are implemented through regulatory require-ments will be administered through existing TCEQ wastewater permitting programs inthe Office of Permitting, Remediation, and Registration, Water Quality Division.

December 2002Texas State Soil and Water Conservation Board • Texas Commission on Environmental Quality 25
AgricultureAnimal feeding operations, including dairies, may be authorized in several ways:
• CAFO Individual Permits; customized requirements specific to the CAFO.• CAFO Registration; general requirements under Chapter 321 Subchapter B
rules.• Animal Feeding Operation (AFO); general requirements under Chapter 321
Subchapter B rules, but without written authorization.
Individual permits or registrations under Chapter 321 Subchapter B rules are required fordairies with more than 200 head, and those facilities are categorized as CAFOs. Dairieswith less than 200 head may operate without registration, but must comply with Chapter321 Subchapter B rules and are categorized as Animal Feeding Operations (AFOs). Theterm “animal feeding operations” is also sometimes used in a generic, comprehensivesense that includes all CAFOs and AFOs for any type of animal.
Comprehensive nutrient management planning is recommended for all animal feedingoperations of any type or size that manage animal wastes in the North Bosque Riverwatershed, regardless of the individual facilities’ sizes, locations, or form of authorization(i.e. registration, individual permit, etc.). CAFOs operating under Subchapter B writtenauthorization are required to develop and implement pollution prevention plans (PPP)which include all controls and management practices necessary to control waste transportoff the CAFO. The PPP embodies many of the same principles as the CNMP. A CNMPencompasses aspects of a nutrient management plan (NMP), but will additionally coverthe entire conservation system (at a minimum the CAFO production area and wastemanagement activities) by providing the operator with a dynamic operations manual foraddressing the agronomic and environmental facets of the animal feeding operation.Nutrient management planning, which is an element of both the PPP and CNMP, requiresthat application of animal wastes to land within the North Bosque River watershedshould not exceed application rates and schedules appropriate for the nutrient-related(including phosphorus) characteristics of the application site soils. NMPs have tradition-ally been developed as part of a conservation plan for producers and landowners toaddress nutrient specifications for cropping systems.
CNMPs and NMPs are all primary planning tools utilized to define and documentappropriate waste management practices for the facility and/or specific waste applicationfield. Additionally, Subchapter B regulations require Nutrient Utilization Plans (NUP)when soil phosphorus concentrations exceed the regulatory threshold. NUPs utilize aPhosphorus Index Analysis (PI) which evaluates site-specific risk factors and manage-ment practices that are in place to minimize the release of phosphorus to surface water.Facility-specific Phosphorus Index Analyses become part of a scheme of nutrientmanagement to restrict manure application to phosphorus rates. Some factors evaluatedin the nutrient management planning process include the amount and types of wastesgenerated, the slope and surface drainage characteristics of WAFs, soil permeability, the

December 2002Texas State Soil and Water Conservation Board • Texas Commission on Environmental Quality26
extent of buffer strips and tailwater controls around WAFs, and the seasonal timing andabundance of precipitation, as well as many other factors pertinent to nutrient manage-ment. Annual soil sampling is required on each WAF to monitor soil phosphorusconcentrations for comparison to the critical concentrations (determined by the PI foreach WAF) that will trigger changes in waste application rate. The ultimate purpose ofNUPs is to establish and guide management practices that allow a facility to maximizethe beneficial reuse of animal waste as nutrients for improving agronomic productionwhile minimizing export of nutrients to water bodies. It is recommended that dairyproducers seek assistance from one of the agencies mentioned below to develop andimplement the nutrient control measures itemized within this implementation plan.
Dairy facilities and other CAFOs may already have NMPs, pollution prevention plansand/or NUPs developed to support previous permit applications. Some facilities areoperating under certified water quality management plans approved by the TSSWCB,which include the essential elements of an CNMP. New or expanding dairy CAFOs in theNorth Bosque River watershed are required to manage waste in the following ways:
• remove certain wastes from the watershed, • haul wastes to authorized composting operations,• apply wastes according to the pollution prevention plan requirements of
Subchapter B, • apply wastes in accordance with the terms of an NUP approved by a certified
nutrient management specialist.
The TCEQ agriculture permit program will review and process new, renewal andamended registrations and individual permit applications for CAFO facilities within theNorth Bosque River watershed to assure that the requirements of current rules andregulations are met. Reviews of individual permit applications and registrations willconsider the adequacy of the CAFO facilities, including close scrutiny of the retentionstructures and history of discharges. A record of frequent discharges due to precipitationevents or poor management/operation may be grounds for requiring recertification ofretention structures to assure the required storage capacity is met, in order to minimizethe occurrence of precipitation-driven discharges. A poor history of compliance withpermit requirements at a CAFO may cause the TCEQ to revise permit conditions or denyreauthorization.
As each CAFO application is reviewed for authorization under Subchapter B, thepermitting program will determine whether comprehensive nutrient managementplanning is embodied in the facility’s pollution prevention plan.
• New or expanding dairy CAFOs will be required to demonstrate through theapplication process that they will operate under the nutrient managementpractices as stipulated in Chapter 321 rules pertinent to a major sole sourceimpairment zone.

December 2002Texas State Soil and Water Conservation Board • Texas Commission on Environmental Quality 27
• Existing dairy CAFOs that continue to operate without expansion, under eitherregistration or individual permit authorization, will be required to update andimplement any elements missing from the pollution prevention plan, or NUP,relating to appropriate nutrient management practices required under Subchap-ter B regulations. When appropriate, this category of existing CAFOs may berequired to develop some form of phosphorus-based waste management plan.
• Voluntary modifications of existing CAFO facilities that are necessary tocorrect deficiencies of existing retention structures, or other aspects of CAFOmanagement, without any change in authorized herd size or dairy site plan, willnot require amendment of permits or authorizations. Voluntary changes thatwill improve operation or maintenance of retention structures, or other aspectsof CAFO management, without changes in herd size or expansion of the siteplan, may be processed as minor amendments under some circumstances ifauthorization is required. Permittees should discuss such plans with TCEQagriculture permitting staff before beginning work, to determine if authoriza-tion is needed and to coordinate the work with the regulatory system.
• Dairy AFOs will be encouraged to develop and follow TSSWCB certifiedwater quality management plans. All dairies that have fewer than 200 dairycattle (including dry cattle) in confinement can legally be in this category. Anyexisting dairy that plans to expand its authorized herd to more than 200 headwill be required to develop appropriate PPPs under Chapter 321 rules.
In some cases, permit conditions may suffice to achieve adequate nutrient controlswithout requiring NUPs or CNMPs for the waste application fields. For instance, afacility that is required by permit to remove 100% of its wastes from the watershed fordisposal or reuse may not need a formal NUP or CNMP for the WAFs.
Any plan for nutrient management within the North Bosque River watershed will need toencourage efforts to remove excess wastes from the watershed for beneficial reuse ordisposal. The more waste a facility can remove from the North Bosque watershed, thegreater the likelihood the overall concentration level of phosphorus in the soils will bereduced within the watershed. Therefore, participation in the composting program isencouraged to voluntarily support this waste removal effort and for CAFOs it may berequired as a component of some pollution prevention plans.
The TSSWCB can provide assistance to any agricultural producer, including dairyoperators, for developing and implementing CNMPs. Operators of large dairies (CAFOs),small dairies (AFOs), or other types of agricultural property that use manure to supple-ment soils, are eligible for TSSWCB assistance. Besides help with development of plans,TSSWCB can also certify that the plans meet NRCS and TCEQ requirements, and mayprovide cost share assistance for construction/implementation of plan elements.
Further information and guidance regarding TCEQ’s Subchapter B rules and regulationspertinent to animal feeding operation, Pollution Prevention Plans, or Nutrient Utilization

December 2002Texas State Soil and Water Conservation Board • Texas Commission on Environmental Quality28
Plans is available from the TCEQ. Information about Certified Water Quality Manage-ment Plans, Nutrient Management Plans and Comprehensive Nutrient Management Plansis available from the Texas State Soil and Water Conservation Board, or from the U.S.Department of Agriculture Natural Resource Conservation Service. Assistance indeveloping those types of plans is available to agricultural producers from the TSSWCBand other agriculture-support entities.
ScheduleApproval of this implementation plan does not automatically change permit limits.Existing permit limits and conditions remain in effect until the established permittingprocess results in formal approval of amendments. The TCEQ may initiate revisions andamendments to individual permits when appropriate. The general permit may be revised,and may require re-registration of facilities to assure compliance with the revisions.
Phosphorus-based waste management plans for new or expanding dairies are requiredbefore permits will be issued. Existing facilities currently operating under phosphorus-based NUPs or TSSWCB water quality management plans will continue to do so.Existing facilities currently operating under nitrogen-based waste management plans willbe encouraged or required to develop plans within 3 years, as appropriate under pertinentrules and regulations. Chapter 321 Subchapter B rules may be modified if needed tosupport this goal. The goal of the TCEQ and the TSSWCB is that all dairies in the NorthBosque River watershed will be practicing phosphorus-based waste management by theend of calendar year 2006.
AssuranceThe existing TCEQ permitting program and structure will assure that permits arereviewed and/or modified to address comprehensive nutrient management planning. Theexisting TCEQ compliance and enforcement program will assure that the permit require-ments are implemented and met. The TSSWCB will perform annual status reviews toensure the implementation of WQMPs and CNMPs. If the TSSWCB finds that a WQMPor a CNMP has not been properly implemented or maintained, the plan will be decerti-fied. If a permitted facility is using a certified CNMP to fulfill a permit requirement foran NUP, the TSSWCB will notify the TCEQ if it becomes decertified, making theoperation subject to an enforcement action by the TCEQ for being in violation of thepermit.
Municipal PermitsThis plan addresses only the phosphorus limitations for permits in the North BosqueRiver watershed. All other effluent limits for other constituents or aspects of WWTPdischarge will continue to be determined by existing permitting processes.
This implementation plan anticipates that permit limits for municipal or industrial waste-water treatment facilities will be for total phosphorus (TP), for several reasons. Totalphosphorus has usually been the parameter used to design WWTPs and establish permit

December 2002Texas State Soil and Water Conservation Board • Texas Commission on Environmental Quality 29
limits, so using that parameter here maintains consistency with normal permitting anddesign practices. Total phosphorus is also a more conservative and complete measure ofeffluent loading rate, since TP measurements include the PO4-P or SRP component also,but PO4-P or SRP effluent measurements omit some amount of sorbed or solid phasephosphorus.
There are some technological limitations to be considered when planning to controlphosphorus loading from wastewater treatment facilities. Phosphorus removal may beachieved by chemical/physical processes, biological processes, or a combination thereof.A variety of patented process designs are commercially available. Widely used chemi-cal/physical treatment processes can dependably meet permit limits of 1 mg/L totalphosphorus (Metcalf & Eddy, 1979). Many municipal WWTPs built to meet permit limitsfor phosphorus are designed to achieve an average effluent concentration of 1 mg/L totalphosphorus. A few facilities around the nation have done better, consistently achievingeffluent concentrations as low as 0.1 mg/L total phosphorus, but that requires consider-able expertise and commitment in facility operation as well as design engineering.Extreme treatment levels, to meet effluent limits significantly lower than 1 mg/L totalphosphorus, are less likely to be feasible for small facilities such as those in the NorthBosque River watershed.
There are currently seven municipalities with wastewater discharge permits in the NorthBosque River watershed. Six existing facilities (Stephenville, Hico, Iredell, Meridian,Clifton, Valley Mills) discharge directly to the North Bosque or Upper North BosqueRiver, and were monitored from November 1995 through March 1998 to determine theamount of nutrient loading emanating from each. The loading rates monitored during1995 - 1998, as shown in Table 3, were extracted from the report Existing NutrientSources and Contributions to the Bosque River Watershed (McFarland and Hauck,1999). Permit numbers that identify the specific TPDES permits have been included foreach facility. Cranfills Gap is included in Table 3 to provide continuity with subsequenttables and discussion.
The Clifton WWTP permit was amended during November 1999 to authorize expansionof the facility. The amended permit includes an annual average loading limit of 6.2pounds per day of total phosphorus, which was the best estimate of existing loading fromthe Clifton WWTP then available. That limit was established to prevent an increase inphosphorus loading prior to completion of the TMDL analyses and implementation plan.The Clifton permit is the only one in the watershed that currently contains a phosphoruslimit. Any changes to phosphorus limits in the Clifton permit will be consistent with theapproved TMDL and this implementation plan.
The seventh facility (Cranfills Gap) received a new permit during April 2001. TheCranfills Gap WWTP will discharge to the headwaters of Meridian Creek, more than 20stream miles from the North Bosque River. The permit authorizes a small facilityadequate to serve approximately 400 people, with an expected service population of less
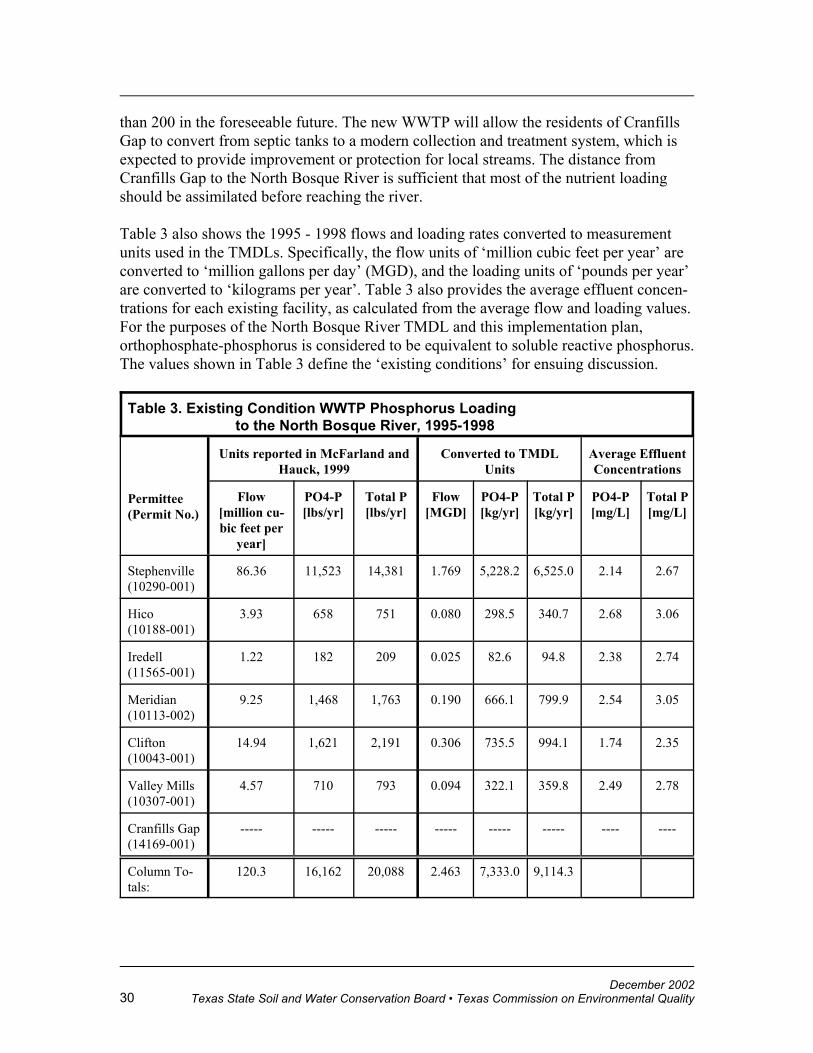
December 2002Texas State Soil and Water Conservation Board • Texas Commission on Environmental Quality30
than 200 in the foreseeable future. The new WWTP will allow the residents of CranfillsGap to convert from septic tanks to a modern collection and treatment system, which isexpected to provide improvement or protection for local streams. The distance fromCranfills Gap to the North Bosque River is sufficient that most of the nutrient loadingshould be assimilated before reaching the river.
Table 3 also shows the 1995 - 1998 flows and loading rates converted to measurementunits used in the TMDLs. Specifically, the flow units of ‘million cubic feet per year’ areconverted to ‘million gallons per day’ (MGD), and the loading units of ‘pounds per year’are converted to ‘kilograms per year’. Table 3 also provides the average effluent concen-trations for each existing facility, as calculated from the average flow and loading values.For the purposes of the North Bosque River TMDL and this implementation plan,orthophosphate-phosphorus is considered to be equivalent to soluble reactive phosphorus.The values shown in Table 3 define the ‘existing conditions’ for ensuing discussion.
Table 3. Existing Condition WWTP Phosphorus Loading to the North Bosque River, 1995-1998
Permittee(Permit No.)
Units reported in McFarland andHauck, 1999
Converted to TMDLUnits
Average EffluentConcentrations
Flow[million cu-bic feet per
year]
PO4-P[lbs/yr]
Total P[lbs/yr]
Flow[MGD]
PO4-P[kg/yr]
Total P[kg/yr]
PO4-P[mg/L]
Total P[mg/L]
Stephenville(10290-001)
86.36 11,523 14,381 1.769 5,228.2 6,525.0 2.14 2.67
Hico(10188-001)
3.93 658 751 0.080 298.5 340.7 2.68 3.06
Iredell(11565-001)
1.22 182 209 0.025 82.6 94.8 2.38 2.74
Meridian(10113-002)
9.25 1,468 1,763 0.190 666.1 799.9 2.54 3.05
Clifton(10043-001)
14.94 1,621 2,191 0.306 735.5 994.1 1.74 2.35
Valley Mills(10307-001)
4.57 710 793 0.094 322.1 359.8 2.49 2.78
Cranfills Gap(14169-001)
----- ----- ----- ----- ----- ----- ---- ----
Column To-tals:
120.3 16,162 20,088 2.463 7,333.0 9,114.3

December 2002Texas State Soil and Water Conservation Board • Texas Commission on Environmental Quality 31
Phase I Table 4 summarizes the initial waste load allocation of total phosphorus for municipalsources during Phase I. This initial allocation approximately corresponds to modelsimulations performed for the TMDL, but is stated in total phosphorus instead oforthophosphate-phosphorus. The modeling included 0.600 MGD of allowance for futuregrowth (AFG) at 1 mg/L total phosphorus, which equates to 829.5 kg/yr of totalphosphorus. In this allocation, the total phosphorus loading associated with part of theAFG is distributed among Cranfills Gap, Hico, Iredell, Meridian, Clifton, and ValleyMills. The AFG shown in Table 4 is less than was modeled to reflect that redistribution.
Upon approval of this implementation plan, TCEQ staff will initiate minor amendmentactions for permittees which do not currently have phosphorus limits consistent with thePhase I plan in order to make the permits consistent with the Phase I municipal wasteloadallocation. The City of Clifton permit currently has a phosphorus limit which is
Table 4. Initial Waste Load Allocation, Full PermittedDischarge
Permittee(Permit No.)
PermittedFlow
[MGD]
Initial AllocationLoad
[kg/yr Total P]
InitialAllocation Load
[lb/d Total P]Stephenville(10290-001) 3.000 4,200 25.4
Hico(10188-001) 0.200 525 3.2
Iredell(11565-001) 0.050 280 1.7
Meridian(10113-002) 0.450 980 5.9
Clifton(10043-001) 0.650 1,160 7.0
Valley Mills(10307-001) 0.360 500 3.0
Cranfills Gap(14169-001) 0.040 65 0.4
Allowance ForGrowth 0.225 290 1.8
Column Totals: 4.975 8,000 48.4
At average PO4-P/TP ratio of 0.82 (CDM data), total allocation = 39.7 lb/d PO4-P. If average PO4-P/TP ratio is 0.90, total allocation = 43.6 lb/d PO4-P.
consistent with (i.e. less than) the allocation; a major amendment action is necessary tochange the Clifton permit to the load limit and conditions for Phase I. The Phase IClifton permit amendment action will begin when the City of Clifton initiates a majoramendment application. The TCEQ will draft permits to state that when the self-monitoring data indicate that the discharge from a WWTP has reached 100% of the

December 2002Texas State Soil and Water Conservation Board • Texas Commission on Environmental Quality32
loading rate specified in Table 4, based on the daily average for three consecutivemonths, the permittee shall within 90 days submit a plan to:
C achieve compliance with the load limit on a continuous basis, OR C achieve an effluent concentration limit of 1 mg/L total phosphorus based
on the permittee’s requested design capacity flow.
Phase II Phase II begins for each of the existing municipal permittees when their permits areamended after Phase I load allocations are reached. In Phase II, the load or concentrationlimits become regulatory limits stated in the effluent limits table of the permit. Permitsmay be drafted to include a compliance period of up to three years to achieve compliancewith the load or concentration limitation. Those facilities that choose to meet load limitsduring Phase II must control discharge volume and quality so as to remain below the loadlimit. Those facilities that choose to meet a 1 mg/L effluent concentration limit will beallowed discharge volume limits appropriate for their population needs and WWTPdesign capacity. However, the TCEQ retains the authority to modify the requirements ofPhase II if additional information or future conditions indicate that to be necessary.
ScheduleApproval of this implementation plan does not automatically change permit limits.Existing permit limits and conditions remain in effect until the established permittingprocess results in formal approval of amendments. The TCEQ may initiate revisions andamendments to permits if appropriate.
Upon approval of this implementation plan, TCEQ staff will initiate minor amendmentactions for permittees which do not currently have phosphorus limits consistent with thePhase I plan in order to make the permits consistent with the Phase I municipal wasteloadallocation. The City of Clifton permit currently has a phosphorus limit which isconsistent with (i.e. less than) the allocation; a major amendment action is necessary tochange the Clifton permit to the load limit and conditions described above for Phase I. The Phase I Clifton permit amendment action will begin when the City of Cliftoninitiates a major amendment application.
Permit amendments to incorporate Phase II conditions will occur as the discharges ofindividual permittees reach the Phase I allocations. A permittee may choose to enterPhase II immediately, or at any time prior to reaching the Phase I allocation, but onceinto Phase II may not return to Phase I. Due to its unique situation, the City ofStephenville may find it advantageous to address Phase II immediately.
AssuranceThe existing TCEQ permitting program and structure will assure that permits arereviewed and/or modified to incorporate appropriate phosphorus limits. The existing
December 2002Texas State Soil and Water Conservation Board • Texas Commission on Environmental Quality 33
TCEQ compliance and enforcement program will assure that the permit requirements areimplemented and met.
The Texas Water Development Board (TWDB) has several programs that provide grantsor low cost loans to municipalities for water and wastewater infrastructure needs. Eligiblepermittees in the North Bosque River watershed may elect to apply for financialassistance for wastewater treatment upgrades from the TWDB.
Industrial Permits There are currently no industrial wastewater discharge permits for facilities in the NorthBosque River watershed, nor is there any indication that applications for such dischargesare pending. However, there is an existing industrial no-discharge permit for a facilitylocated in the Paluxy River (Segment 1229) watershed, north of Stephenville. Thatpermit authorizes use of two irrigation sites, one of which is located on the Upper NorthBosque River (Segment 1255) side of the watershed divide. No-discharge permitsauthorize disposal adjacent to waters in the state (i.e. to application fields), but not to thewaters themselves.
Commercial composting facilities in the North Bosque River watershed will requireindustrial wastewater permit authorizations. The current expectation is that most of thecommercial composting facilities will be authorized as no-discharge operations bygeneral permit registrations through the Texas Land Application Permits process.Individual permit applications for commercial composting facilities in the watershedunder the Texas Land Application Permits program would also be processed as no-discharge permits.
If applications for industrial wastewater discharge are received, permit limits andconditions appropriate for the type of discharge and its precise location will bedeveloped, and will address phosphorus discharge to assure the permits are consistentwith the goals of the TMDLs. For general planning purposes, entities that propose todischarge treated industrial wastewater in the North Bosque River watershed shouldanticipate receiving effluent limits equivalent to 1 mg/L, or less, of total phosphorus.
Storm Water Permits The TCEQ was authorized by EPA, on September 14, 1998, to administer the NPDESstorm water program through the issuance of TPDES permits. EPA has agreed, under theterms of a memorandum of agreement between the two agencies, to continue toadminister NPDES storm water permits that were effective on this date until they eitherexpire or are replaced by a comparable TPDES permit. TCEQ will reissue these permitsas TPDES permits upon their expiration. The NPDES program includes the regulation ofstorm water discharges from industrial activities, construction activities, and municipalseparate storm sewer systems (MS4s).

December 2002Texas State Soil and Water Conservation Board • Texas Commission on Environmental Quality34
The storm water permit program is implemented nationwide in two phases (which are notthe same as the two phases of this implementation plan). Phase One permits regulatedischarges of storm water associated with industrial activities, storm water dischargesfrom construction activities that disturb 5 or more acres, and discharges from large andmedium size MS4s (cities with a population equal to or greater than 100,000 people). TheTPDES Phase One general storm water permit for industrial activity was issued inAugust, 2001. Phase One medium and large municipal separate storm sewer system(MS4) individual permits are being issued as their NPDES individual permits expire.
Phase Two permits will regulate discharges from construction sites that disturb at leastone acre and discharges from small MS4s (urbanized areas and certain designated cities).Phase Two general permits for small MS4s and construction activities are scheduled forissue in December 2002. The Phase Two general permit for construction activities is forboth small construction activities between 1 and 5 acres and Phase One activitiesdisturbing 5 acres or more. In the North Bosque River watershed, only construction siteswill be immediately affected by Phase Two storm water permit requirements. However,the TCEQ has until December 2002 to complete designation of small MS4s not inurbanized areas that will be required to obtain coverage.
On August 20, 2001, TCEQ reissued the NPDES permit number TXR050000, regulatingstorm water discharges associated with industrial activities, as TPDES permit numberTXR050000. This general permit provides that storm water discharges to impaired waterbodies may be authorized if they are consistent with the approved TMDL and theimplementation plan. Covered facilities must incorporate the limitations, conditions andrequirements applicable to their discharges, including monitoring frequency andreporting required by TCEQ rules, into their storm water pollution prevention plan inorder to be eligible for permit coverage.
Phase I of this implementation plan proposes no changes to existing or pending stormwater permit conditions or limits within the North Bosque watershed. However, ifmonitoring or other information eventually initiates Phase II implementation, theimplementation plan may require storm water permits for entities that affect the NorthBosque River watershed to be revised to reduce phosphorus loading. Revisions to theplan may also affect individual TPDES permits authorizing storm water discharges, MS4permits, or storm water permits that authorize discharges from construction activities.
Composting ProgramThe composting program provides the primary means for seeking to removeapproximately 50% of CAFO manure from the North Bosque River watershed.Participation in the compost program will be voluntary, but may provide the mostefficient way for some facilities to meet individual regulatory requirements. Agriculturepermits for some facilities therefore may require participation in the compost program orindividual arrangements to accomplish the same result.

December 2002Texas State Soil and Water Conservation Board • Texas Commission on Environmental Quality 35
The desired goal of the composting program is the relocation of excess manure in orderto reduce nutrient loading from conventional land application practices. The primaryconcept is to create a sustainable market for manure-derived compost, so that privatecommercial composting facilities can be established and remain economically viable inthe long term. The composting facilities will provide an alternative way for dairies todispose of manure, thereby reducing the amount of manure to be land applied within theNorth Bosque River watershed. More information regarding the composting program isavailable on the TCEQ Web site (see Other Sources of Information).
In response to the program's popularity and successes to date, Texas will be providingadditional funding to the program during the project’s remaining two years. Additionalefforts are underway to identify and secure even more funds to assist with the export ofsurplus manure generated by dairies located in the Bosque watershed. Efforts are alsounderway to ensure that markets are in place to drive the continued export of manurefrom the Bosque and Leon River watersheds after the end of the project. The TCEQworks with the TSSWCB to promote awareness of composted manure as a soilamendment, and to stimulate markets among government agencies. The TexasDepartment of Transportation (TxDOT) is expected to be the largest governmentalpurchaser of compost over the next few years, and has already identified projects thatmay use in excess of 149,000 cubic yards.
The TSSWCB's portion of the project, the Dairy Manure Export Support (DMES)project, addresses removing the manure. The DMES project provides incentives tosupport the transport of surplus manure from dairy farms in portions of the North BosqueRiver watershed to compost facilities. When manure is transferred to compostingfacilities in the watersheds, it must be properly treated and contained, and must notexacerbate existing water quality problems. During the early stages of the project, theTCEQ NPS Program developed guidance, site criteria, and reporting forms forparticipating compost operators. TCEQ staff provided technical assistance on compostproduction techniques to interested compost operators. Compost users may also receiveTSSWCB assistance, under long standing agricultural assistance programs, to developand implement nutrient management plans that include compost.
In addition to technical assistance, the TCEQ has also established quality assurancerequirements for such compost. During 2001, TCEQ staff performed site visits at eachcompost facility to ensure the product meets TxDOT and other appropriate specifications.The TCEQ also checks for proper maintenance of storm water controls, such as lagoonsand berms, and adherence to other necessary procedures.
The TCEQ and the Brazos River Authority (BRA) are developing a water qualitymonitoring strategy for the North Bosque and Leon watersheds to measure water qualityimprovements attributable to the removal and composting of manure. During 2001, theTCEQ met with the BRA and other monitoring partners to begin design of a monitoringplan. Field monitoring will get underway during 2002. In addition, the TSSWCB has

December 2002Texas State Soil and Water Conservation Board • Texas Commission on Environmental Quality36
contracted with the Texas Institute for Applied Environmental Research (TIAER) toperform microwatershed monitoring that will help identify specific tributaries andsubwatersheds that may need additional, more intensive, BMP implementation, and willaid in measuring water quality improvements that result from the composting program.
ScheduleThe composting program began operation when Federal grant funds became available onSeptember 27, 2000, and will continue until at least August 31, 2003 when the currentgrant period ends. Payouts to appropriate participants began approximately in January2001.
AssuranceGrant funding under §319 of the Clean Water Act will assure several years of subsidy todevelop markets and allow commercial composting facilities to establish viableoperations. The waste management option provided to dairies is a benefit that willencourage voluntary participation. New or expanding dairies in the North Bosque Riverwatershed will be required to remove all excess manure from the watershed, as stipulatedin 30 TAC Chapter 321. The composting program plan includes monitoring participationand the amount of manure from the North Bosque River watershed that enters theprogram, and the amount that leaves the watershed.
Voluntary Best Management Practices and Educational ProgramsAs the water quality management agency of the state, the TCEQ seeks to provideinformation to all interested persons or entities on how to best protect and manage waterquality. The educational program described in this document is an outreach effort by theTCEQ and other agencies to assist those entities participating in TMDL implementationand to encourage protection of the state’s water quality.
Reducing the phosphorus content of animal feed in order to reduce the phosphoruscontent of manure is a voluntary element of the implementation plan. Implementation ofthis measure can benefit the individual dairy or other type of agriculture operation, byboth reducing the cost of feed and reducing the land area needed for phosphorus-basedapplication of manure. The Chapter 321, Subchapter B rules require that CAFO operatorswithin the Dairy Outreach Program Area (DOPA) must complete an eight-hour course onanimal waste management within 12 months of authorization, and complete an additionaleight hours of training in animal waste management in each subsequent 24-month period.Continuing education periodically provided for agricultural producers in the NorthBosque River area by the Texas Cooperative Extension (TCE) and the TSSWCBprimarily address waste management issues and practices. Since phosphorus has beenidentified as a concern in the area, the continuing education classes have largely focusedon management practices specific for phosphorus. The class curricula are designed tocover any topics that the dairy operators need, and will sometimes include the methodsand benefits of reducing phosphorus levels in animal feed.

December 2002Texas State Soil and Water Conservation Board • Texas Commission on Environmental Quality 37
The same continuing education program(s) may also assist implementation by educatingdairy operators or others regarding other aspects of phosphorus-based wastemanagement, such as proper management of waste application fields, development ofnutrient management plans, and so forth. The TCEQ will continue to support and assistthe educational outreach efforts of the other agencies, in keeping with the programs andprotocols current at any time.
In addition, the composting program includes a training and technical assistance programfor compost facility operators, TxDOT staff and contractors, and staff of other stateagencies. The TCEQ Small Business and Environmental Assistance Division is trainingand assisting compost operators in best management practices for their sites, and isproviding workshops and other assistance to state agency staff and contractors in the useof compost products for nonpoint source pollution control and soil improvement.
Microwatershed CouncilsIn addition to the existing educational endeavors carried out by the TSSWCB, a specialvoluntary project funded by §319 of the Clean Water Act calls for agricultural producercouncils to be grouped by microwatersheds for the purposes of informationdissemination, discussion of WQMP/CNMP development and implementation issues andcost-share opportunities, proliferation of peer-involvement, and overcoming producerdenial. Additional facets of this project include the TSSWCB working cooperatively withthe Cross-Timbers Soil and Water Conservation District (SWCD), headquartered inStephenville, and the Upper Leon SWCD, headquartered in Comanche, to providetechnical and financial assistance to dairy producers and third-party landowners towardthe development and implementation of certified WQMPs and CNMPs for the purposesof reducing NPS nutrient losses from agricultural operations that land-apply animalwaste.
In this project the SWCDs can arrange for the technical assistance necessary to developWQMPs and CNMPs through direct interaction with the dairy operators in the NorthBosque watershed. The SWCD technicians will work closely with the TSSWCBRegional Office in Dublin. Technical assistance is best provided or arranged by localSWCDs because it allows for more local support to landowners in the implementation ofBMPs. The district technicians will work with landowners to develop WQMPs (fornonpoint source AFOs and third-party landowners) and CNMPs (for point sourceCAFOs), consistent with the recent changes to the Subchapter B CAFO Rules and themost current standards in the USDA-NRCS Field Office Technical Guide. The TSSWCBand the NRCS are also arranging training and certification courses for third-partydevelopers of CNMPs in the North Bosque River watershed.
TIAER will monitor the North Bosque River watershed to determine the reduction inNPS pollution resulting from the implementation of these WQMPs and CNMPs andprovide data to inform microwatershed producer councils of their contribution to NPSpollution. The producer councils will include landowners and agricultural producers from

December 2002Texas State Soil and Water Conservation Board • Texas Commission on Environmental Quality38
within each microwatershed, and the monitoring will be set up at targeted areas withineach microwatershed. The monitoring effort will make use of numerous automatedsampling systems in TIAER’s possession that will be made available to this project, aswell as supplemental financial support for data obtained through QAPPs approved byEPA or the State of Texas. A monitoring demonstration will also be carried out so thateach microwatershed producer council will be able to see local evidence of NPS nutrientlosses from WAFs.
ScheduleEducational outreach regarding phosphorus management at dairy facilities has occurredsince at least 1998, and will continue indefinitely. Activities associated with thecomposting program began in late 2000. The TSSWCB §319 project described abovebegan in January 2002 and is anticipated to begin providing direct technical assistance toproducers by mid-2002.
AssuranceEducational outreach to agricultural producers is a well established role of both the TexasCooperative Extension and the TSSWCB. Both agencies have programs in place. Fordairy operators, the reduced cost for feed and reduced area needed for land applicationare benefits expected to motivate voluntary participation in this implementation element.Training opportunities and assistance for compost facility operators through thecomposting program are supported by grant funds for the life of the program.
Compliance and Enforcement ProgramThe compliance and enforcement program is administered by the TCEQ Office ofCompliance & Enforcement which includes the Enforcement Division, ComplianceSupport Division, the Monitoring Operations Division and the Field Operations Division.The Field Operations Division (FOD) consists of 16 regional offices and two specialproject offices located throughout the state, and a central office located in Austin. Majorregional office responsibilities include conducting investigations for compliancedetermination at the permitted and registered air, water, and waste facilities locatedacross the state, investigating complaints at permitted and nonpermittedfacilities/operations based on citizen requests for assistance, and developing many of theagency’s enforcement actions for most types of air, water, and waste violations identifiedduring investigations.
All violations of any permit or any documented unauthorized discharges of wasteidentified during investigations or compliance determination are evaluated using theEnforcement Initiation Criteria (EIC) adopted by the TCEQ. The EIC documentestablishes the procedures for determining the severity of enforcement actions.
Regional offices located in Waco (Region 9), Dallas/Fort Worth (Region 4), and theStephenville special project office, all share various responsibilities for investigations ofactivities which may impact environmental conditions in the North Bosque River

December 2002Texas State Soil and Water Conservation Board • Texas Commission on Environmental Quality 39
watershed. These offices conduct routine investigations of permitted wastewaterdischargers and special investigations of any unpermitted or otherwise unauthorizeddischarges into the North Bosque River and its tributaries. The Stephenville specialprojects office annually investigates all Concentrated Animal Feeding Operations(CAFOs) that have TPDES permits in the Dairy Outreach Program Areas (DOPAs) .
When potential excessive application of nutrients in the North Bosque River watershedwas identified as a concern, the Stephenville special project office initiated a survey ofapplication fields at selected CAFO facilities in the area. The survey was conducted fromMay 2000 through August 2000. These studies found many facilities with phosphorusconcentrations in waste application field soils exceeding 200 parts per million (ppm).Several enforcement actions were generated based on the sample results. Owners of thefacilities were sent a certified letter notifying them that additional investigations will beconducted, and that applying waste or wastewater to a field that is documented to be over200 ppm phosphorus, unless applied according to an approved Nutrient Utilization Plan,will result in the TCEQ initiating enforcement action against that facility.
Other CAFO or AFO activities that result in formal enforcement actions include:
• Increasing herd size without notifying the TCEQ; • Increasing herd size without a required permit; • Failure to maintain adequate storage capacity or freeboard in retention
structures or waste storage ponds; • Causing or allowing discharges of wastes due to improper management or
operation of waste disposal activities or retention structures;• Failure to notify the TCEQ of any discharge from retention structures
during chronic or catastrophic rainfall events.
In addition, enforcement within the North Bosque River watershed has been adjusted sothat any violations related to the CAFO activities listed above, or other types ofunauthorized discharges by CAFOs, have been assigned a higher level of significance.
Investigations of wastewater dischargers which are considered “major” by the EPA areroutinely conducted by the Field Operations Division in alternate years. “Minor”facilities are investigated based on criteria set by the TCEQ and EPA. Additionally, theFOD is able to conduct discretionary investigations based on issues of regional concern.In this case of a TMDL, all dischargers into impaired water bodies will be considered fordiscretionary investigations during March of each year as the FOD begins to developwork plans for the following fiscal year.

December 2002Texas State Soil and Water Conservation Board • Texas Commission on Environmental Quality40
Water Quality Monitoring PlanSpecific details of surface water quality monitoring activities will become part of theannual coordinated monitoring plan and schedules, and will be reviewed as each annualplan is developed. This document provides a more general description of the long termgoals and intent of environmental monitoring activities that are specifically required forimplementation of the North Bosque River TMDLs.
House Bill 2699 of the 77th Legislature, passed in 2001, mandated some specificmonitoring and reporting activities by the TCEQ within the North Bosque Riverwatershed. The bill directs the TCEQ to activate water quality monitoring sites in theNorth Bosque watershed, to collect samples from those sites on a quarterly basis, andreport the results of the monitoring on a quarterly basis. The bill further specifies a list ofparameters to be analyzed and reported, including orthophosphate-phosphorus (PO4-P).The TCEQ is directed to provide the quarterly reports to the Governor, the LieutenantGovernor, the Speaker of the House of Representatives, each member of the HouseCommittee on Appropriations, each member of the Senate Committee on Finance, eachmember of the House Committee on Natural Resources, and each member of the SenateCommittee on Natural Resources. The legislation states that the TCEQ is allowed toprescribe additional water quality control practices for animal feeding operations by ruleor general permit or to include additional provisions in an individual or general permit asnecessary to protect water resources in the North Bosque River watershed.
The TCEQ will develop and implement a long-term monitoring program to evaluatewater quality improvements and attainment of the water quality targets for the NorthBosque River watershed. The monitoring program will use existing TCEQ processes andprograms, as described below, to provide continuity with historical monitoring andprovide more specific data in the future. Short term projects by other entities may alsoprovide usable data periodically throughout implementation, and will be utilized to theextent possible. The monitoring effort will:
• provide data useful in refining the initial modeling efforts and verifyingmodel assumptions;
• include both wet weather and low flow conditions to better characterizethe contributions of point and nonpoint sources, and;
• expand monitoring to provide information for identifying tributaries andsubwatersheds with significant load contributions, especially in the UpperNorth Bosque River (Segment 1255).
Environmental monitoring and data management activities of the TCEQ are primarilymanaged by the Office of Compliance & Enforcement, Monitoring Operations Division.Other program areas within TCEQ and external entities often coordinate with MonitoringOperations to provide data. The data collection and management activities of theMonitoring Operations Division include many types of data, but the ensuing discussion

December 2002Texas State Soil and Water Conservation Board • Texas Commission on Environmental Quality 41
addresses only those activities that are directly pertinent to implementation of the NorthBosque River TMDLs.
Coordination of water quality monitoring is an annual activity that involves the TCEQRegional Offices, the Clean Rivers Program (CRP) of the TCEQ, and the CRP regionalplanning agency partners. The goal of coordinated monitoring is to assure that waterquality monitoring performed by TCEQ, the CRP Regional Partner, and any otherqualified monitoring organizations operating within the basin, is complementary andefficient. The individual monitoring entities are thus able to adjust schedules to providemore complete and representative temporal coverage, and may adjust the types of datacollected to achieve more compatible or more comprehensive aggregate data sets.Completed plans for each year specify the sites that will be monitored, the parametersthat will be measured at each site, and the schedule for each parameter and site.
During calendar year 2002, TCEQ will begin incorporating new implementationmonitoring and subwatershed monitoring into the coordinated monitoring plan for Statefiscal year 2003, using information from this document to guide station locations,parameters sampled, and sampling schedules. Due to the size of the watershed and thelogistics of monitoring station establishment, several years may be needed to fullydevelop the monitoring network. TCEQ intends that a complete water quality monitoringsystem able to support the requirements of legislative directives and the TMDLs will bein place and operating in the North Bosque River watershed by the end of calendar year2006.
Compost Program MonitoringThe TCEQ and the Brazos River Authority (BRA) are developing a water qualitymonitoring strategy for the North Bosque and Leon watersheds to measure water qualityimprovements attributable to the removal and composting of manure. During 2001, theTCEQ met with the BRA and other monitoring partners to begin design of a monitoringplan. Field monitoring will begin during 2002.
Monitoring sites and schedules developed for the Compost Program will be included inthe coordinated monitoring plans each year. Sites and activities associated with CompostProgram monitoring may also be part of the tributary and/or mainstem monitoringactivities discussed below. Appropriate data collected for Compost Program monitoring(i.e. representative of ambient stream conditions) will also be used for generalassessments of water quality.
Implementation MonitoringAdditional water quality monitoring for determining success of the TMDLs for the NorthBosque River will begin with Phase I of implementation, and will continue throughoutany subsequent phases. These additional monitoring activities will be included in thecoordinated monitoring plans.

December 2002Texas State Soil and Water Conservation Board • Texas Commission on Environmental Quality42
Instream concentrations of phosphorus will be monitored in the North Bosque River atValley Mills, Clifton, above Meridian, below Stephenville, and above Stephenville.Monitoring stations will approximately correspond to model output points, so thatcomparisons between model predictions and monitored data are possible. More preciselocations will be defined as the monitoring activities are initiated, and new stations willbe established as needed.
The primary parameter for evaluating success will be the instream concentration ofsoluble reactive phosphorus (SRP) or orthophosphate-phosphorus (PO4-P), which areconsidered equivalent for the purposes of the North Bosque River TMDLs andimplementation plan. Flow measurements will be included as needed to allowcomputation of net loading rates based on concentration data. Flow data may come fromexisting or new permanent flow measurement stations maintained by the US GeologicalSurvey or other entities, or may come from measurements performed manually as waterquality data are collected. Load calculations during high flow events can depend onUSGS gage data extrapolations as manual measurements under those conditions may behazardous. Measurements will be at least weekly, and will include both baseflow andstorm runoff conditions. Monitoring will be performed by one or more of TCEQ,TSSWCB, Brazos River Authority (BRA), TIAER, or other qualified monitoringorganizations identified through the annual coordinated monitoring plans.
Assessment of the monitored data will consider annual average concentrations for SRP orPO4-P. Assessments will be performed annually by TCEQ. Comparisons of index sitedata to the cumulative frequency curves, as described below under Measures of Success,will begin when five years of data are available for the respective index sites.
Subwatersheds upstream from mainstem stations that do not show progress will bepresumed sources of excessive loading. Tributary monitoring may refocus on specificsubwatersheds that mainstem data or available information indicates are the most likelyto be sources of excessive loading.
Tributary MonitoringInstream concentrations of phosphorus will be monitored in tributaries of the NorthBosque River segments to identify subwatersheds that are disproportionate sources ofloading. Parameters other than phosphorus will also be monitored, reported, andassessed. Subwatershed monitoring data will be used to characterize managementpractice performance and loading during the recent past, and may support modelrefinement or serve as the basis for imposing additional subwatershed-specific controls(e.g. review of facility compliance, development of NUPs, etc.).
Detailed tributary monitoring plans may selectively focus on subwatersheds that containsignificant numbers of dairies or WAFs or other sources that are deemed likely sources ofsignificant loading. Tributary sites will be monitored for both baseflow and storm runoffconditions, with flow measurements adequate to estimate loading with reasonable

December 2002Texas State Soil and Water Conservation Board • Texas Commission on Environmental Quality 43
accuracy. Tributary stream and/or subwatershed monitoring may at times be performedby one or more of TCEQ, Brazos River Authority (BRA), TIAER, or other qualifiedentities participating in coordinated monitoring activities. During Phase I, a large amountof monitoring will occur at the microwatershed level as part of the TSSWCB §319project previously described in this document under the section heading MicrowatershedCouncils.
If specific tributary subwatersheds are identified as contributing disproportionately largenutrient or pollutant loads, or as having other indications of existing or potentialdisproportionate pollutant effects (e.g. degraded biological communities, low dissolvedoxygen, significant growth in dairy operations, etc.), outreach or regulatory programswill verify compliance with existing management requirements. If noncompliant,enforcement mechanisms will be employed. If compliant, analyses to refine subwatershedcomponents of the overall TMDL will be indicated, which may include adjustments toregulatory practices or load allocations.
Model Refinement Monitoring The TCEQ is committed to refining the model analyses upon which the North BosqueRiver TMDLs are based. Additional data of various types may be needed to support thateffort. The general intent is that model refinement will utilize all data or information thatare pertinent and serve to improve the models. As the aspects of modeling to be refinedare precisely defined, data requirements and availability to support model refinement willalso become clear and appropriate plans made.
Data to support model refinement may be extracted from the other monitoring activitiesdescribed above, or from other sources (e.g. special studies of soil dynamics or CAFOmanagement), or may require additional data that support specific needs of the models. Ifthe model refinement effort requires new monitoring sites or data types, those will beincorporated into the coordinated monitoring plans each year as needed. Data gatheredfor model refinement that is also pertinent for assessments of ambient water qualityconditions will be used for such assessments.
ScheduleCoordinated monitoring plans are prepared each year to address and direct activitiesduring the ensuing fiscal year. New monitoring specifically intended to measure successof the North Bosque River TMDL implementation plan will be incorporated into thewatershed monitoring schedule as soon as possible following adoption of theimplementation plan. The goal of the TCEQ is to have the environmental monitoringactivities described above fully operational by the end of calendar year 2006.
AssuranceExisting programs and processes within the TCEQ will assure that surface water qualitymonitoring activities are scheduled and performed each year. To the extent that funds areavailable, the TCEQ budget will assure some amount of monitoring is possible during

December 2002Texas State Soil and Water Conservation Board • Texas Commission on Environmental Quality44
each year. The coordinated monitoring process will assure that the efforts of otherappropriate monitoring entities will support TMDL implementation, while seekingefficient synergy among monitoring efforts.
Measures of SuccessWater quality will be the primary, and ultimate, measure by which success of the NorthBosque River TMDLs is evaluated. Programmatic measures of success will enumerateactivities and steps taken by TCEQ program areas towards implementing the controlactions and management measures that are expected to eventually result in water qualityresults. The TCEQ anticipates developing an internal tracking system to documentprogrammatic implementation. If environmental data eventually indicate that there hasnot been sufficient change in water quality to be deemed successful, then programmaticmeasures may indicate whether implementation efforts have been incomplete or erratic,and thus provide some insight regarding appropriate Phase II efforts. Programmaticmeasures may also serve to document TCEQ efforts in annual reports to the StateLegislature.
Programmatic MeasuresPermit actions within the North Bosque River watershed will be counted and assessed.All types of water-related permit actions will be enumerated, including municipal andindustrial wastewater, storm water, and agricultural operation permits. Annualassessments will report the number of new permits issued and the number of existingpermits amended or renewed, by category of permit. The assessments will also report thepercentage of permits within each category that have been revised or issued withconditions that implement the TMDLs. The goal will be to have 100% of permits revisedto incorporate TMDL requirements by calendar year 2006.
Enforcement activities within the North Bosque River watershed will be counted andassessed. Annual assessments will report the number of inspections performed each year,categorized by permit type and including unpermitted activities. Annual reports willcount the number of CAFOs within the North Bosque River watershed that were sent soilmonitoring report forms, and the number of those CAFOs that did not submit theappropriate number of completed soil monitoring forms. The number of permit violationsor unauthorized discharges will also be reported, categorized by type (e.g. municipal,industrial, agricultural, storm water). The total amount of fines levied for violations willbe included, whether paid directly to the state or used for Supplemental EnvironmentalProjects (SEP), categorized by type. Reports of enforcement activity will provide insightregarding the extent of unauthorized or poorly-managed discharges, and the amount ofregulatory effort to address those situations; however, these numbers would not be usedto define success of the TMDL.
December 2002Texas State Soil and Water Conservation Board • Texas Commission on Environmental Quality 45
The compost program will track and annually report the amount of dairy manureproduced within the North Bosque River watershed that is exported as a result of thecompost program. That information will be used in conjunction with annual estimates oftotal dairy manure produced within the North Bosque River watershed to calculate thepercent removed. Annual removal rates equal to or greater than 50% will be consideredindicative of success.
The extent of water quality monitoring activities will be reported as a programmaticmeasure, while the results from monitoring will support the water quality measures ofsuccess. Annual assessments will report the number of water quality monitoring sitesactive during the preceding year, and the number of events monitored (i.e. samplescollected and analyzed) or records collected (i.e. constituent values for database – eachsampling event will generate multiple records). The annual report will also specify howmany of the five index sites have become active and are collecting data for use asdescribed below.
Water Quality Measures of SuccessAverage annual soluble phosphorus concentrations at each of the five TMDL index sitesalong the North Bosque River will be assessed using a method based on comparison ofstream monitoring results to two sets of curves that represent each of the five index sites. One set of curves is based on results from watershed modeling performed for TMDLdevelopment, and the other set is based on regression analyses of historical nutrientconcentration and flow data representing the years 1996 through 2000. The five indexsites are named Valley Mills, Clifton, Above Meridian, Below Stephenville, and AboveStephenville. The site names identify approximate locations, as indicated on large-scalemaps and figures in the TMDL report and this document. Precise locations formonitoring stations at the index sites will be determined as the monitoring network isdeveloped.
A set of probability distribution curves was constructed from TMDL model predictions.Each index site will utilize a different probability distribution curve, as illustrated inFigures 9 through 13. The probability curves in Figures 9 through 13 are identical to the“TMDL-e” curves shown in Figures 4 through 8. At least five years worth of data will berequired to reasonably determine if the annual average river quality is consistent with theprobability curve goals. After that, each year will add another point to the monitoredresult, making assessment more robust. Subsequent evaluations of progress against themodel-predicted probability distribution curves will occur annually, and will utilize alldata collected since implementation monitoring began.
A set of regression equations was derived from analyses of historical data from sites inthe vicinity of the aforementioned five index sites. The regression equations are first-order linear “curves” that plot as straight lines on charts. The equations presented herewere derived by the Texas Institute for Applied Environmental Research, but it ispossible that the equations could change to some extent if additional data or analyses

December 2002Texas State Soil and Water Conservation Board • Texas Commission on Environmental Quality46
indicate that to be appropriate at some time in the future. The equations or curves relateannual average concentrations of soluble reactive phosphorus (y-axis values) to the base-10 logarithms of annual average streamflows (x-axis values), and are presented in Table5 and Figures 14 through 18. Comparison of monitored annual average data to theseregression curves will provide indications of whether the recent annual averagephosphorus concentrations (and annual loads) were relatively lower than observed during1996-2000 for similar annual flow conditions.
Table 5. Historical Data Regression Equations for North Bosque River Index Sites
In equations, “x” = log10 of annual average flow in cubic feet per second “y” = annual average concentration (mg/L) of soluble reactive phosphorus
Index Site Equation R2 value Data Years
Above Stephenville y = 0.0347 x + 0.2388 0.3519 1997-2000
Below Stephenville y = -1.0176 x + 2.7889 0.6207 1994-2000
Above Meridian y = 0.0396 x - 0.0419 0.7164 1996-2000
Clifton y = 0.0236 x - 0.0249 0.94 1996-2000
Valley Mills y = 0.0209 x - 0.0228 0.846 1996-2000
Evaluation of Stream Water Quality Goal Attainment• Evaluation will be based on concentration measurements of soluble reactive
phosphorus or orthophosphate-phosphorus. Monitoring plans and QAPPs willestablish exactly which parameter is analyzed and reported by laboratories, andhow various forms of phosphorus measurement may be combined if necessary.Methods used must provide minimum detection levels and minimum analyticalreporting levels low enough to clearly show whether TMDL goals are met—specifically, the minimum analytical levels should be less than 10 µg/L or 0.010mg/L. Monitoring plans will also address whether flow measurements arepossible or needed at each site, and whether load calculations can or will be made.For most consistent comparability to model predictions of time-weightedconcentration, sampling should occur at a regular time interval. To provideadequate resolution, the time interval between sampling events should not exceedtwo weeks (i.e. $26 samples per year); ideally, the time interval betweensampling events should be one week or less (i.e. $52 samples per year).
• All suitable individual (grab) concentration measurements collected during a yearwill be averaged to determine the annual average SRP or PO4-P concentration foreach site. A data base records the annual average concentration for each site andeach year of monitoring.
• If continuous-record monitoring stations with sufficiently low analytical reportinglimits are established at any of the index sites, annual averages at those sites maybe calculated directly from the data records of those stations.

December 2002Texas State Soil and Water Conservation Board • Texas Commission on Environmental Quality 47
Comparison of monitored data to model-predicted probability curves• Annual average values are plotted on probability charts like those in Figs 9 - 13,
using separate charts for each index site. The annual average values are plotted inrank order from left to right on the charts, at intervals of 1/(n+1) where “n” is thenumber of annual average data points available for that particular index site. For instance, if there are 7 annual average data points available (n = 7), theplotting interval is 1/(7+1) = 1/8 = 0.125. The highest annual average value isthen plotted over a probability of 0.125 (on scale from 0 to 1), the second highestover a probability of 2(0.125)= 0.250, the third highest over a probability value of3(0.125)=0.375, etc. The lowest of the seven data points thus ends up plotted overa probability value of 7(0.125) = 0.875.Each new annual data point added to the curves will change the shape to someextent, by changing the intervals at which all the values are plotted (shifts pointsright or left on chart) as well as adding another concentration value.
• The curves thus defined by the plotted annual average values are then comparedto the model-predicted probability curves for respective index sites, as shown onFigs 9 - 13. • If the monitored data curve at a site is entirely below the model-predicted
curve for that site, the water quality goals are being attained.• If the monitored data curve at a site is entirely above the model-predicted
curve for that site, the water quality goals are definitely not being attained,and additional implementation phases will be needed as soon as possible.
• If the monitored data curve at a site crosses the model-predicted curve, partialattainment of the water quality goals is indicated. - If 80% or more of the monitored curve is below the model curve, adequate
attainment is indicated. - If 20% or less of the monitored curve is below the model curve, additional
measures must be developed and implemented. - If between 20% and 80% of the monitored curve is below the model
curve, review must consider the annual concentrations that exceed thetarget (i.e. are above the model curve).
- If the “exceedance” concentrations are less than 30 micrograms per liter(µg/L), or 0.030 mg/L, those concentrations are not considered exceed-ances of the water quality goals because they are less than the algal-limiting annual concentration determined by TMDL studies in thewatershed. Other monitored points above the model curve should beassessed with some regard to the change from previous year plots, e.g. hasthe newest point shifted the monitored curve towards a “better” or“worse” profile. In this situation, change towards “better” is regarded as indicatingprobable progress towards water quality goals, and may justify continuingthe current implementation phase. Change towards “worse” is regarded aspossibly indicating either insufficient management measures, or the effects

December 2002Texas State Soil and Water Conservation Board • Texas Commission on Environmental Quality48
of unusual weather conditions. However, if three years in a row indicate atrend towards “worse”, additional management measures should bedeveloped and implemented.
Comparison of monitored data to historical data regressionsC Annual average flows, in cubic feet per second (cfs), are compiled for each index
site. Determination of annual average flows may use records of establishedstream gaging stations, or may use individual flow measurements performed aswater quality samples were collected, depending on what is available to representthe site.
C Annual average flows are transformed by calculating the base-10 logarithm foreach one.
C The annual average concentrations and the transformed annual average flowsprovide a set of two values for each year at each site being analyzed. Fordiscussion purposes, the monitored annual average concentration will berepresented as “ym”, the log-transformed annual average flow will be representedas “xm”, and the annual average concentration predicted by the regressionequations will be represented by “ye”.
C A single set of annual data points can be directly compared to the appropriateregression equation mathematically. To do this, the xm value is used in theequation to calculate ye. If ye is larger than ym, that indicates the recent conditionsare relatively better than historical data for similar annual flows. Conversely, if yeis smaller than or equal to ym, that indicates the recent conditions are worse or nodifferent than historical data for similar annual flows.
C Sets of annual data points can also be compared to the appropriate regressionequations graphically, using graphs similar to Figures 14 through 18. For thismethod, the line on each graph represents ye. The set of ym and xm values are usedas axis values to plot a point on the graph. If the point falls below the ye line, thatindicates the recent conditions are relatively better than historical data for similarannual flows. Conversely, if the point falls above or on the ye line, that indicatesthe recent conditions are worse or no different from historical data for similarannual flows.
C Graphics similar to Figures 14 through 18 can also record and summarizemultiple years of monitored results, by plotting all the appropriate sets of annualdata on a single chart. Over a period of time, the accumulation of annual datapoints on graphs of this type may provide insights about the effect of annuallyvarying weather and flow conditions, or about the efficacy of implementationmeasures under differing annual flow conditions.

December 2002Texas State Soil and Water Conservation Board • Texas Commission on Environmental Quality 49
Other ActivitiesRefinement of the Watershed ModelThe TCEQ will initiate efforts to refine the model analyses upon which the North BosqueRiver TMDLs are based. The first goal of model refinement efforts will be to increase theresolution of the model analyses by reducing the size of subwatershed compartments forwhich output values are calculated and reported by the model. The finer resolution isexpected to provide more detailed predictions of water quality conditions in tributarystreams and small flood-control reservoirs within the subwatersheds, and thus allow moredetailed assessments of contributing sources that can focus control efforts more precisely.
A second goal of the model refinement efforts will be to enhance model simulations byincorporating any applicable and appropriate results from monitoring within the NorthBosque River watershed and reviews of pertinent information from other sources. Thoseadditional sources of information may lead to modifications of source characterizations,management practice simulations, model hydrology or hydraulics, kinetic rates usedwithin the model, or other factors yet to be identified.
When the model has been suitably refined, it will be used to review the TMDLs that werebased on the previous model analyses. Evaluation of the refined model results will alsobe influenced by the water quality data collected up to that time. If review of the data andthe refined model suggests changes that would better support attainment of water qualitygoals, the TCEQ will revise the TMDLs and/or the implementation plan for the NorthBosque River watershed as appropriate. Review of the refined model and decisionsregarding the need for TMDL modification will be coordinated with stakeholders, andany changes to the TMDLs or implementation plan will utilize the appropriate publicreview processes.
Model refinement work will be performed by a contractor hired by the TCEQ. Moredetailed work plans for the model refinement effort will be developed as the workproceeds. The TCEQ will also seek input from others regarding the type and extent ofmodel revisions that should be attempted.
ScheduleFunding for the model refinement work is expected to become available in fiscal year2003 (which begins September 1, 2002). Pre-contracting activities will begin duringcalendar year 2002 in anticipation of establishing the contract and beginning work duringFY2003. The goal of the TCEQ is that model refinement and review of the TMDLs willbe completed by the end of calendar year 2006.
AssuranceThe TCEQ plans to use some Federal grant funds to support the model refinement work.Possible sources include some combination of §106 funds, which are 100% Federal,and/or §319 grant funds, which are 60% Federal with 40% State match.
December 2002Texas State Soil and Water Conservation Board • Texas Commission on Environmental Quality50
Effluent Trading StudyThe concept of effluent trading has often been discussed as a way to increase theefficiency of TMDL implementation and/or provide more flexibility for sources requiredto achieve extreme load reductions. In the context of TMDL implementation, “effluenttrading” refers to theoretical trading of discharge allocations (e.g. permitted loads) amonglocal or regional sources, and generally does not mean physical transfers of actualeffluent discharge. Arranging effluent trades amongst watershed sources typically wouldrequire that some entity tracks the trades and keeps the account balanced to remain withinthe TMDL allocation. The accounting entity may also need to mediate legal agreements,or disagreements, between trading partners.
The TCEQ will encourage and support efforts to establish and operate an effluent tradingarrangement within the North Bosque River watershed, but does not intend to lead suchefforts nor to serve as the accounting entity. Federal funding may become available toinvestigate the feasibility of, or to establish, effluent trading programs for specific TMDLwatersheds. If reasonable and suitable proposals to study or establish an effluent tradingprogram for the North Bosque River watershed should be developed, the TCEQ willcooperate and participate to the extent possible.
ScheduleAction with regard to effluent trading studies or plans will depend largely on theinitiative of others, and the TCEQ cannot stipulate when or if such efforts will occur.However, the TCEQ will attempt to cooperate with such efforts in a timely and helpfulmanner.
AssuranceStudy or development of an effluent trading program is optional. Any such effort thatuses §319 grant funding will have the assurance provided by the grant stipulations.

Erath
Coryell
Bosque
McLennan
Hamilton
SomervellStephenville
Dublin
Hico
Iredell
Meridian
CliftonCranfills Gap
Waco
Valley Mills
Crawford
McGregor
WQ Segment watersheds1226 - North Bosque1255 - Upper North Bosque
0 5 10 15 Miles
N
EW
S
Figure 1 - North Bosque River Watershed

Bosque Land UsesCroplandDairy Waste FieldsForestPastureRangeUrbanWWTPWater
Figure 2 - Bosque Watershed Land Uses

1
WAFRow CropNon-Row CropPastureWood/RangeWWTPUrban
Figure 3 - Estimates of Gross Existing Loadingsat Selected North Bosque River Stations
Load estimates were derived from export coefficients for each land use in each subwatershed.
Estimated loads represent the grossamount of PO4-P generated over/by theland surface from November 1995 throughMarch 1998. Due to loss or assimilation ofPO4-P between points of origin and streammonitoring locations, the net load measured (or predicted) is less than the gross load generated by watershed.
0
15000
30000
45000
60000
75000
90000
PO4 LOADINGS (kg) Nov 95 - Mar 98
7%
9%
2%
2%
80%
0
15000
30000
45000
60000
75000
90000
PO4 LOADINGS (kg) Nov 95 - Mar 98
54%
6%
2%5%
5%
28%
0
15000
30000
45000
60000
75000
90000
PO4 LOADINGS (kg) Nov 95 - Mar 98
18%
10%
6%
55%
2%2%
7%
0
15000
30000
45000
60000
75000
90000
PO4 LOADINGS (kg) Nov 95 - Mar 98
45%
24%
10%6%
9%1% 5%
0
15000
30000
45000
60000
75000
90000
PO4 LOADINGS (kg) Nov 95 - Mar 98
50%22%
9%
6%
1% 4%8%

December 2002Texas State Soil and Water Conservation Board • Texas Commission on Environmental Quality54
Figure 4 - SWAT Model results at Valley Mills
PO4 Concentrations @ Valley Mills - Future
0
20
40
60
80
100
120
0 0.1 0.2 0.3 0.4 0.5 0.6 0.7 0.8 0.9 1
Exceedance Probability
Sol P
con
cent
ratio
n in
ppb
Future Existing TMDL-f
PO4 Loadings @ Valley Mills - Future
0
20000
40000
60000
80000
100000
120000
140000
160000
0 0.1 0.2 0.3 0.4 0.5 0.6 0.7 0.8 0.9 1Exceedance Probability
Ann
ual S
ol P
Loa
d in
kg
Future Existing TMDL-f
PO4 Loadings @ Valley Mills - Existing
0
10000
20000
30000
40000
50000
60000
70000
80000
90000
100000
110000
120000
0 0.1 0.2 0.3 0.4 0.5 0.6 0.7 0.8 0.9 1
Exceedance ProbabilityA
nnua
l Sol
P L
oad
in k
gExisting TMDL-e
PO4 Concentrations @ Valley Mills - Existing
0
10
20
30
40
50
60
70
80
0 0.1 0.2 0.3 0.4 0.5 0.6 0.7 0.8 0.9 1Exceedance Probability
Sol P
con
cent
ratio
n in
ppb
Existing TMDL-e
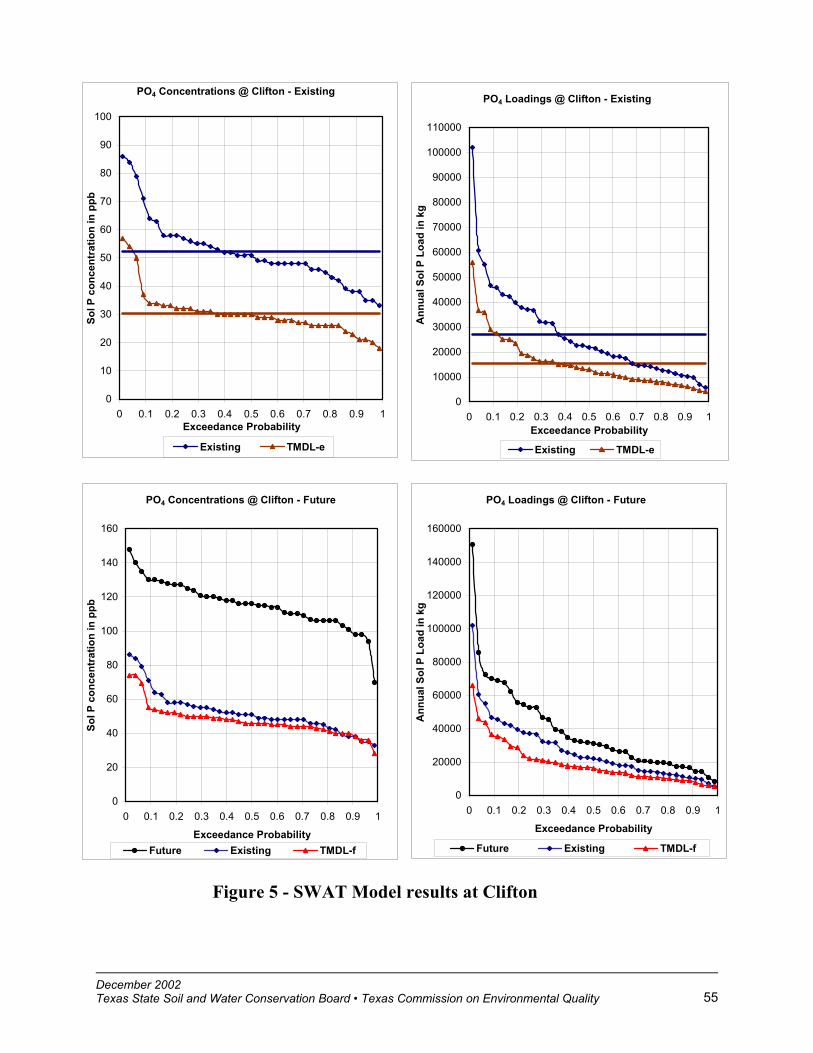
December 2002Texas State Soil and Water Conservation Board • Texas Commission on Environmental Quality 55
Figure 5 - SWAT Model results at Clifton
PO4 Concentrations @ Clifton - Future
0
20
40
60
80
100
120
140
160
0 0.1 0.2 0.3 0.4 0.5 0.6 0.7 0.8 0.9 1
Exceedance Probability
Sol P
con
cent
ratio
n in
ppb
Future Existing TMDL-f
PO4 Loadings @ Clifton - Future
0
20000
40000
60000
80000
100000
120000
140000
160000
0 0.1 0.2 0.3 0.4 0.5 0.6 0.7 0.8 0.9 1
Exceedance Probability
Ann
ual S
ol P
Loa
d in
kg
Future Existing TMDL-f
PO4 Loadings @ Clifton - Existing
0
10000
20000
30000
40000
50000
60000
70000
80000
90000
100000
110000
0 0.1 0.2 0.3 0.4 0.5 0.6 0.7 0.8 0.9 1Exceedance Probability
Ann
ual S
ol P
Loa
d in
kg
Existing TMDL-e
PO4 Concentrations @ Clifton - Existing
0
10
20
30
40
50
60
70
80
90
100
0 0.1 0.2 0.3 0.4 0.5 0.6 0.7 0.8 0.9 1Exceedance Probability
Sol P
con
cent
ratio
n in
ppb
Existing TMDL-e
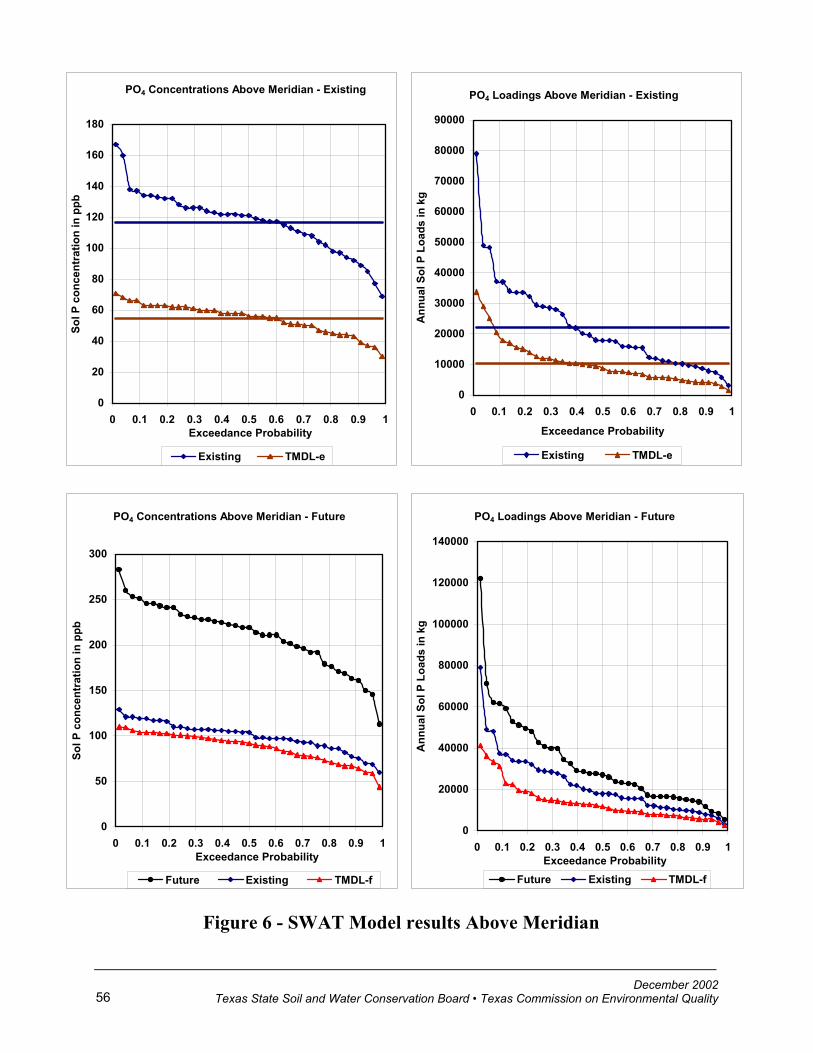
December 2002Texas State Soil and Water Conservation Board • Texas Commission on Environmental Quality56
Figure 6 - SWAT Model results Above Meridian
PO4 Concentrations Above Meridian - Future
0
50
100
150
200
250
300
0 0.1 0.2 0.3 0.4 0.5 0.6 0.7 0.8 0.9 1Exceedance Probability
Sol P
con
cent
ratio
n in
ppb
Future Existing TMDL-f
PO4 Loadings Above Meridian - Future
0
20000
40000
60000
80000
100000
120000
140000
0 0.1 0.2 0.3 0.4 0.5 0.6 0.7 0.8 0.9 1Exceedance Probability
Ann
ual S
ol P
Loa
ds in
kg
Future Existing TMDL-f
PO4 Concentrations Above Meridian - Existing
0
20
40
60
80
100
120
140
160
180
0 0.1 0.2 0.3 0.4 0.5 0.6 0.7 0.8 0.9 1Exceedance Probability
Sol P
con
cent
ratio
n in
ppb
Existing TMDL-e
PO4 Loadings Above Meridian - Existing
0
10000
20000
30000
40000
50000
60000
70000
80000
90000
0 0.1 0.2 0.3 0.4 0.5 0.6 0.7 0.8 0.9 1
Exceedance ProbabilityA
nnua
l Sol
P L
oads
in k
g
Existing TMDL-e
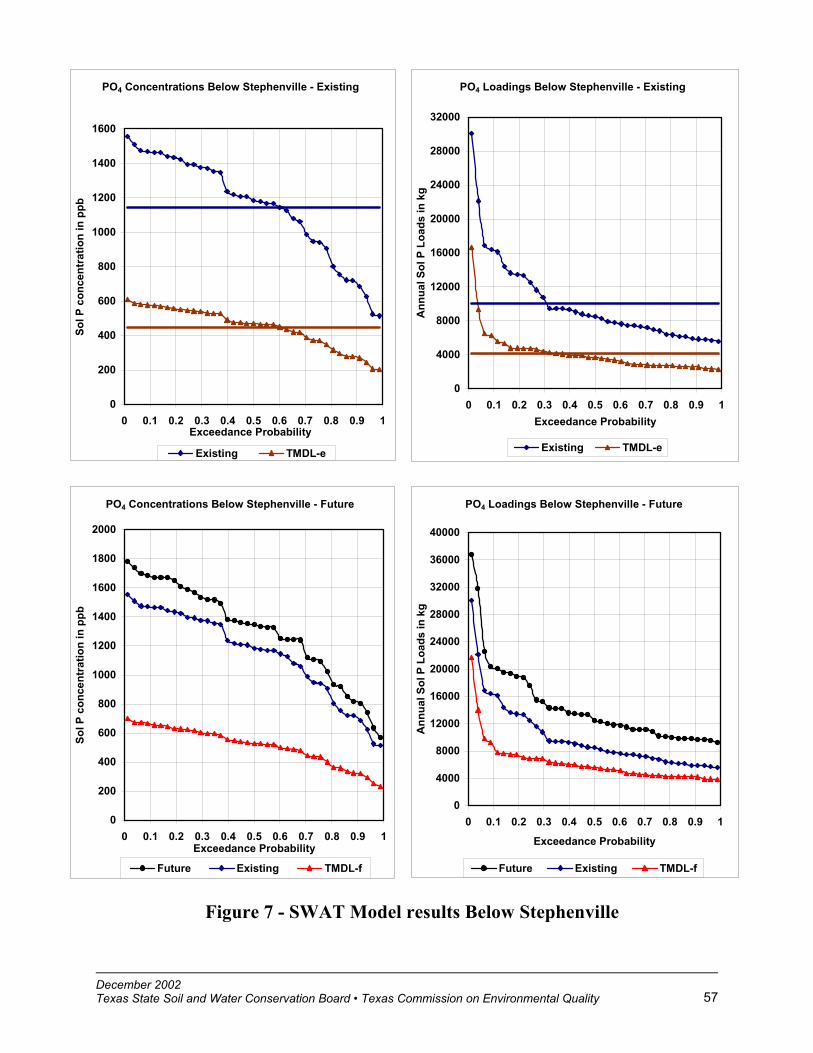
December 2002Texas State Soil and Water Conservation Board • Texas Commission on Environmental Quality 57
Figure 7 - SWAT Model results Below Stephenville
PO4 Concentrations Below Stephenville - Future
0
200
400
600
800
1000
1200
1400
1600
1800
2000
0 0.1 0.2 0.3 0.4 0.5 0.6 0.7 0.8 0.9 1Exceedance Probability
Sol P
con
cent
ratio
n in
ppb
Future Existing TMDL-f
PO4 Loadings Below Stephenville - Future
0
4000
8000
12000
16000
20000
24000
28000
32000
36000
40000
0 0.1 0.2 0.3 0.4 0.5 0.6 0.7 0.8 0.9 1
Exceedance Probability
Ann
ual S
ol P
Loa
ds in
kg
Future Existing TMDL-f
PO4 Concentrations Below Stephenville - Existing
0
200
400
600
800
1000
1200
1400
1600
0 0.1 0.2 0.3 0.4 0.5 0.6 0.7 0.8 0.9 1Exceedance Probability
Sol P
con
cent
ratio
n in
ppb
Existing TMDL-e
PO4 Loadings Below Stephenville - Existing
0
4000
8000
12000
16000
20000
24000
28000
32000
0 0.1 0.2 0.3 0.4 0.5 0.6 0.7 0.8 0.9 1Exceedance Probability
Ann
ual S
ol P
Loa
ds in
kg
Existing TMDL-e

December 2002Texas State Soil and Water Conservation Board • Texas Commission on Environmental Quality58
Figure 8 - SWAT Model results Above Stephenville
PO4 Concentrations Above Stephenville - Future
0
100
200
300
400
500
600
700
800
900
0 0.1 0.2 0.3 0.4 0.5 0.6 0.7 0.8 0.9 1
Exceedance Probability
Sol P
con
cent
ratio
n in
ppb
Future Existing TMDL-f
PO4 Loadings Above Stephenville - Future
0
4000
8000
12000
16000
20000
24000
28000
0 0.1 0.2 0.3 0.4 0.5 0.6 0.7 0.8 0.9 1Exceedance Probability
Ann
ual S
ol P
Loa
d in
kg
Future Existing TMDL-f
PO4 Loadings Above Stephenville - Existing
0
4000
8000
12000
16000
20000
24000
0 0.1 0.2 0.3 0.4 0.5 0.6 0.7 0.8 0.9 1Exceedance Probability
Ann
ual S
ol P
Loa
d in
kg
Existing TMDL-e
PO4 Concentrations Above Stephenville - Existing
0
100
200
300
400
500
600
0 0.1 0.2 0.3 0.4 0.5 0.6 0.7 0.8 0.9 1Exceedance Probability
Sol P
con
cent
ratio
n in
ppb
Existing TMDL-e

December 2002Texas State Soil and Water Conservation Board • Texas Commission on Environmental Quality 59
0
10
20
30
40
50
60
70
80
Avg
Annu
al S
ol P
con
cent
ratio
n, p
pb
0 0.2 0.4 0.6 0.8 1 Exceedance Probability
TMDL Goal @ Valley Mills
Figure 9. TMDL goal probability curve for index site at Valley Mills

December 2002Texas State Soil and Water Conservation Board • Texas Commission on Environmental Quality60
0
10
20
30
40
50
60
70
80
90
100 Av
g An
nual
Sol
P c
once
ntra
tion,
ppb
0 0.2 0.4 0.6 0.8 1 Exceedance Probability
TMDL Goal @ Clifton
Figure 10. TMDL goal probability curve for index site at Clifton

December 2002Texas State Soil and Water Conservation Board • Texas Commission on Environmental Quality 61
0
10
20
30
40
50
60
70
80
90
100 Av
g An
nual
Sol
P c
once
ntra
tion,
ppb
0 0.2 0.4 0.6 0.8 1 Exceedance Probability
TMDL Goal @ Above Meridian
Figure 11. TMDL goal probability curve for index site Above Meridian

December 2002Texas State Soil and Water Conservation Board • Texas Commission on Environmental Quality62
0
100
200
300
400
500
600
700
800
900
1000 Av
g An
nual
Sol
P c
once
ntra
tion,
ppb
0 0.2 0.4 0.6 0.8 1 Exceedance Probability
TMDL Goal @ Below Stephenville
Figure 12. TMDL goal probability curve for index site Below Stephenville

December 2002Texas State Soil and Water Conservation Board • Texas Commission on Environmental Quality 63
0
50
100
150
200
250
300 Av
g An
nual
Sol
P c
once
ntra
tion,
ppb
0 0.2 0.4 0.6 0.8 1 Exceedance Probability
TMDL Goal @ Above Stephenville
Figure 13. TMDL goal probability curve for index site Above Stephenville

December 2002Texas State Soil and Water Conservation Board • Texas Commission on Environmental Quality64
0.000
0.050
0.100
0.150
0.200
0.250
0.300
0.350
-0.5 0 0.5 1 1.5 2 2.5 3
Log10 of Annual Average Flow (cfs)
Ann
ual A
vera
ge S
RP
(mg/
L)
Figure 14. Regression curve at index site above Stephenville

December 2002Texas State Soil and Water Conservation Board•Texas Commission on Environmental Quality 65
0.000
0.500
1.000
1.500
2.000
2.500
3.000
0 0.2 0.4 0.6 0.8 1 1.2 1.4 1.6 1.8 2 2.2 2.4 2.6 2.8 3
Log10 of Annual Average Flow (cfs)
Ann
ual A
vera
ge S
RP
(mg/
L)
Figure 15. Regression curve at index site below Stephenville

December 2002Texas State Soil and Water Conservation Board • Texas Commission on Environmental Quality66
0.000
0.010
0.020
0.030
0.040
0.050
0.060
0.070
0.080
1 1.2 1.4 1.6 1.8 2 2.2 2.4 2.6 2.8 3
Log10 of Annual Average Flow (cfs)
Ann
ual A
vera
ge S
RP
(mg/
L)
Figure 16. Regression curve at index site above Meridian
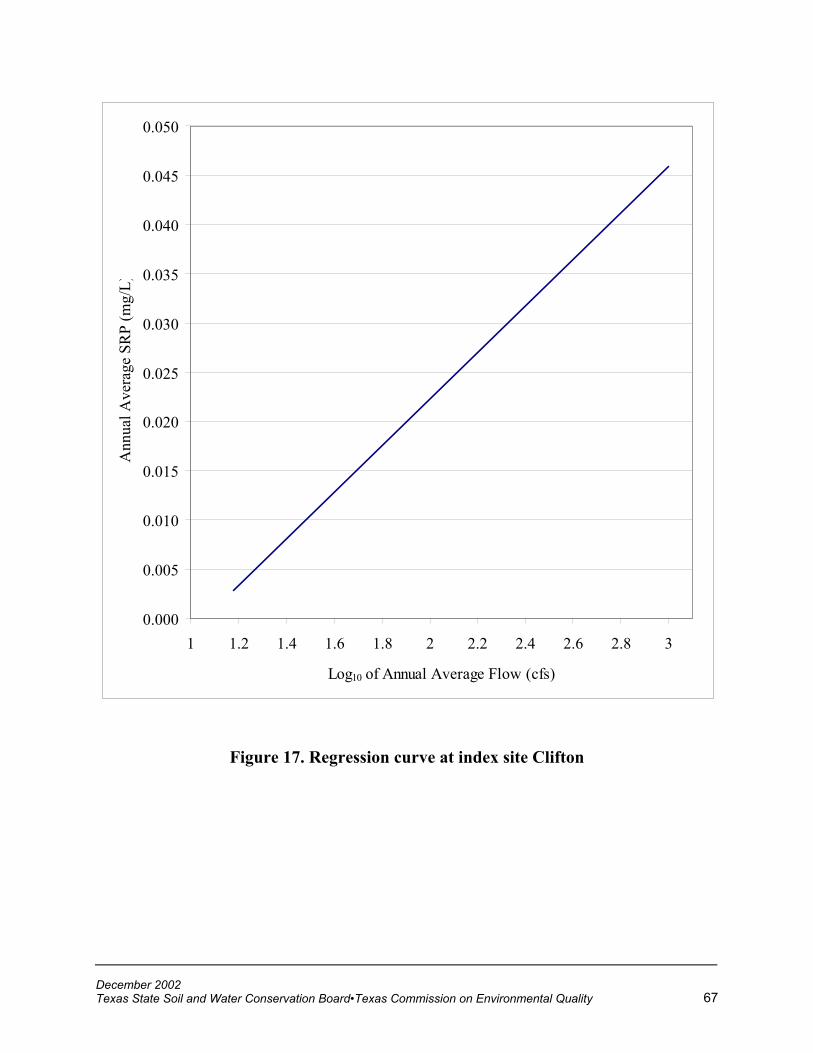
December 2002Texas State Soil and Water Conservation Board•Texas Commission on Environmental Quality 67
0.000
0.005
0.010
0.015
0.020
0.025
0.030
0.035
0.040
0.045
0.050
1 1.2 1.4 1.6 1.8 2 2.2 2.4 2.6 2.8 3
Log10 of Annual Average Flow (cfs)
Ann
ual A
vera
ge S
RP
(mg/
L)
Figure 17. Regression curve at index site Clifton

December 2002Texas State Soil and Water Conservation Board • Texas Commission on Environmental Quality68
0.000
0.005
0.010
0.015
0.020
0.025
0.030
0.035
0.040
0.045
1 1.2 1.4 1.6 1.8 2 2.2 2.4 2.6 2.8 3 3.2 3.4
Log10 of Annual Average Flow (cfs)
Ann
ual A
vera
ge S
RP
(mg/
L)
Figure 18. Regression curve at index site Valley Mills

December 2002
Texas State Soil and Water Conservation Board • Texas Commission on Environmental Quality 69
Other Sources of Information
Texas Commission on Environmental Quality (TCEQ)
TCEQ Total Maximum Daily Load Program . . . . . . . . . . . . . . . . . . . . . . .512-239-4900http://www.tnrcc.state.tx.us/water/quality/tmdl/
TCEQ Wastewater PermitsMain line / Switchboard. . . . . . . . . . . . . . . . . . . . . . . . . . . . . . . . . . . . .512-239-4671Agriculture Permits . . . . . . . . . . . . . . . . . . . . . . . . . . . . . . . . . . . . . . . .512-239-1552Municipal Permits . . . . . . . . . . . . . . . . . . . . . . . . . . . . . . . . . . . . . . . . .512-239-4540Industrial Permits . . . . . . . . . . . . . . . . . . . . . . . . . . . . . . . . . . . . . . . . .512-239-4515Storm Water Permits . . . . . . . . . . . . . . . . . . . . . . . . . . . . . . . . . . . . . . .512-239-4527http://www.tnrcc.state.tx.us/permitting/waterperm/wwperm/
TCEQ Composting ProgramSmall Business & Environmental Assistance . . . . . . . . . . . . . . . . . . . .512-239-6774Water Quality Planning & Assessment . . . . . . . . . . . . . . . . . . . . . . . .512-239-4411http://www.tnrcc.state.tx.us/water/quality/nps/compost/
TCEQ Regional OfficesRegion 4, Dallas/Fort Worth
Switchboard . . . . . . . . . . . . . . . . . . . . . . . . . . . . . . . . . . . . . . . . . .817-588-5800Water . . . . . . . . . . . . . . . . . . . . . . . . . . . . . . . . . . . . . . . . . . . . . . . .817-588-5901
Stephenville Special Project Office . . . . . . . . . . . . . . . . . . . . . . . . . . .254-965-5624or . . . . . . . . . . . . . . . . . . . . . . . . . . . . . . . . . . . . . . . . . . . . . . 1-800-687-7078
Region 9, Waco Switchboard . . . . . . . . . . . . . . . . . . . . . . . . . . . . . . . . . . . . . . . . . .254-751-0335Water . . . . . . . . . . . . . . . . . . . . . . . . . . . . . . . . . . . . . . . . . . . . . . . .254-761-3007
http://www.tnrcc.state.tx.us/admin/directory/region/reglist/
TCEQ Information About Reporting Environmental Problemshttp://www.tnrcc.state.tx.us/enforcement/complaints.html
TCEQ Internet Site Links to State Regulationshttp://www.tnrcc.state.tx.us/oprd/index.html
TCEQ Water Quality Standards Onlinehttp://www.tnrcc.state.tx.us/permitting/waterperm/wqstand/
December 2002Texas State Soil and Water Conservation Board • Texas Commission on Environmental Quality70
Texas State Soil and Water Conservation Board (TSSWCB)
Switchboard (Temple, Tx) . . . . . . . . . . . . . . . . . . . . . . . . . . . . . . . . . . 254-773-2250or . . . . . . . . . . . . . . . . . . . . . . . . . . . . . . . . . . . . . . . . . . . . . . . . . 1-800-792-3485
Water Quality Management Plan Programhttp://www.tsswcb.state.tx.us/programs/wqmp.html
Total Maximum Daily Load Programhttp://www.tsswcb.state.tx.us/programs/tmdl.html
Bosque/Leon Composting Programhttp://www.tsswcb.state.tx.us/programs/bosqueleon.html
SWCD Assistance Programhttp://www.tsswcb.state.tx.us/programs/swcdassistance.html
Texas Water Development Board (TWDB)
Assistance Programs . . . . . . . . . . . . . . . . . . . . . . . . . . . . . . . . . . . . . . . 512-463-7857http://www.twdb.state.tx.us/assistance/assistance_main.htm
US Department of Agriculture, Natural Resources Conservation Service (USDA-NRCS) - Texas Office
Switchboard (Temple, Tx) . . . . . . . . . . . . . . . . . . . . . . . . . . . . . . . . . . 254-742-9800http://www.tx.nrcs.usda.gov/

December 2002Texas State Soil and Water Conservation Board • Texas Commission on Environmental Quality 71
References CitedCamp Dresser & McKee Inc. May 2001. North Bosque River Phosphorus Removal Study.Prepared for the Brazos River Authority. Waco, Tx.
McFarland, A. and Hauck, L. 1999. Existing Nutrient Sources and Contributions to theBosque River Watershed. TIAER Report # PR9911. Stephenville, TX: Texas Institute forApplied Environmental Research, Tarleton State University.
Metcalf & Eddy, Inc. 1979. Wastewater Engineering: Treatment Disposal Reuse, SecondEdition. McGraw-Hill Book Company, Boston, Massachusetts.
Related Documents