HIGHLIGHTS NORTH AMERICA WWW.COLLIERS.COM Q1 2012 | OFFICE K.C. CONWAY EMD | Market Analytics The Bottom Line • A national rebalancing of business growth from FIRE (Finance, Insurance and Real Estate) to ICEE (Intellectual Capital, Energy and Education) has shifted office demand to cities with ICEE industry concentrations. • An oncoming wave of maturing debt will soon change the volume and tenor of sales transactions. • National office absorption remains steady, but a full robust recovery is still in the future. • Office construction is still low, with only 9.4 MSF of new supply delivered in Q1 2012. Measured Rebalancing We often use the term “measured rebalancing” to describe the current state of the U.S. office property market. This refers to the long process of working through an oversupply of office space according to materially different demand drivers. The market must recalculate the amount of office space required, and recalibrate in areas that space demand has shifted. MARKET INDICATORS Relative to prior period U.S. OFFICE MARKET SUMMARY STATISTICS, Q1 2012 Office Demand Steady on Strength of ICEE Industries Q1 2012 Q2 2012* VACANCY NET ABSORPTION CONSTRUCTION RENTAL RATE *Projected Vacancy Rate: 14.95% Change from Q4 2011: –0.09% Absorption: 8.1 Million Square Feet New Construction: 7.5 Million Square Feet Under Construction: 38 Million Square Feet Asking Rents Per Square Foot (Change from Q4 2011): Downtown Class A: $40.96 (+0.56%) Suburban Class A: $26.14 (+1.07%) 15.3% vac. 15.3% vac. Sq. Ft. By Region 2.000000 1.000000 2.000000 Total_OffSF-Vacant_OffSF Vacant_OffSF Absorption Per Market Q4 '11 - Q1 '12 1,200,000 120,000 -120,000 -1,200,000 4 million 2 million 400,000 Occupied Sq. Ft. Vacant Sq. Ft. 16.3% vac. 15.3% vac. 15.3% vac. 13.5% vac. 6.7% vac. NORTH AMERICAN OFFICE VACANCY, INVENTORY AND ABSORPTION—Q1

North American Office Highlights Q1 2012
Jul 21, 2015
Welcome message from author
This document is posted to help you gain knowledge. Please leave a comment to let me know what you think about it! Share it to your friends and learn new things together.
Transcript

HIGHLIGHTSNORTH AMERICA
WWW.COLLIERS.COM
Q1 2012 | OFFICE
K.C. CONWAY EMD | Market Analytics
The Bottom Line•A national rebalancing of business growth from FIRE (Finance, Insurance and Real Estate) to ICEE
(Intellectual Capital, Energy and Education) has shifted office demand to cities with ICEE industry concentrations.
•An oncoming wave of maturing debt will soon change the volume and tenor of sales transactions. •National office absorption remains steady, but a full robust recovery is still in the future.• Office construction is still low, with only 9.4 MSF of new supply delivered in Q1 2012.
Measured RebalancingWe often use the term “measured rebalancing” to describe the current state of the U.S. office property market. This refers to the long process of working through an oversupply of office space according to materially different demand drivers. The market must recalculate the amount of office space required, and recalibrate in areas that space demand has shifted.
MARKET INDICATORSRelative to prior period
U.S. OFFICE MARKETSUMMARY STATISTICS, Q1 2012
Office Demand Steady on Strength of ICEE Industries
Q1 2012
Q2 2012*
VACANCY
NET ABSORPTION
CONSTRUCTION
RENTAL RATE
*Projected
Vacancy Rate: 14.95% Change from Q4 2011: –0.09%
Absorption: 8.1 Million Square Feet
New Construction: 7.5 Million Square Feet
Under Construction: 38 Million Square Feet
Asking Rents Per Square Foot (Change from Q4 2011): Downtown Class A: $40.96 (+0.56%) Suburban Class A: $26.14 (+1.07%)
15.3% vac.
15.3% vac.
Sq. Ft. By Region
2.00000000e+009
1.00000000e+009
2.00000000e+008
Total_O�SF-Vacant_O�SFVacant_O�SF
Absorption Per MarketQ4 '11 - Q1 '12
1,200,000
120,000
-120,000
-1,200,000
4 million
2 million
400,000
Occupied Sq. Ft.
Vacant Sq. Ft.
16.3% vac.15.3% vac.
15.3% vac.
13.5% vac.
6.7% vac.
NORTH AMERICAN OFFICE VACANCY, INVENTORY AND ABSORPTION—Q1
P. 2 | COLLIERS INTERNATIONAL
HIGHLIGHTS | Q1 2012 | OFFICE | NORTH AMERICA
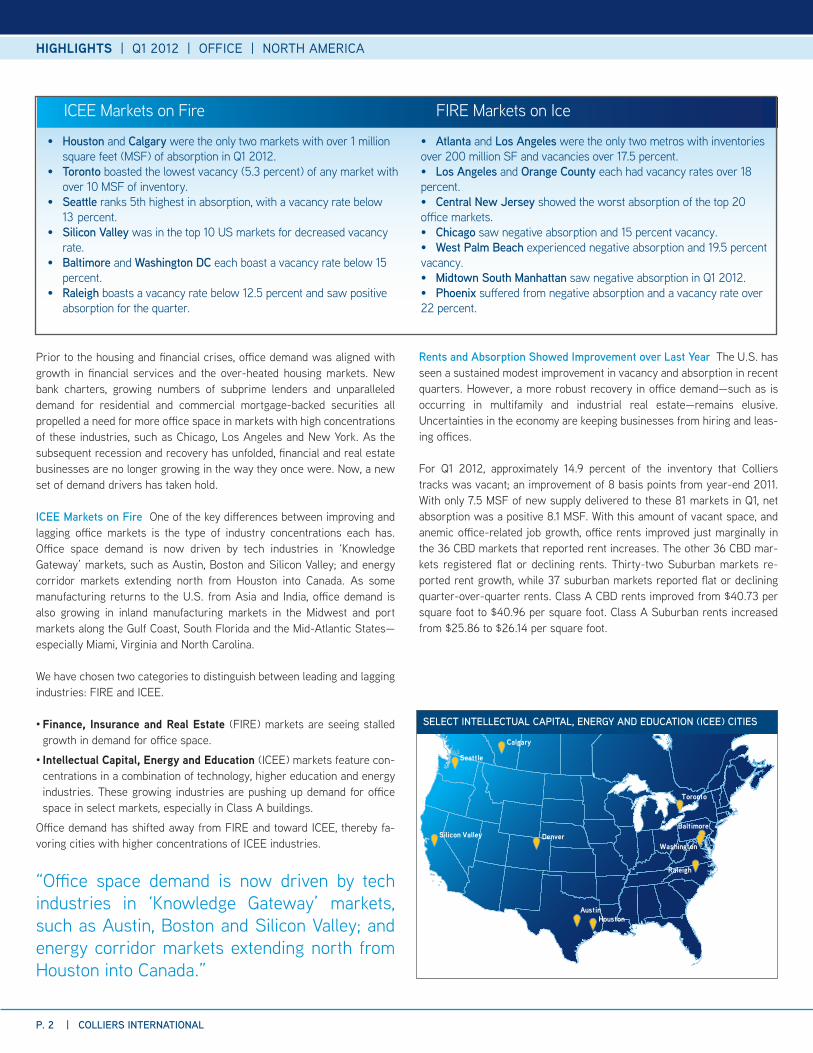
“Office space demand is now driven by tech industries in ‘Knowledge Gateway’ markets, such as Austin, Boston and Silicon Valley; and energy corridor markets extending north from Houston into Canada.”
Raleigh
WashingtonSilicon Valley
Austin
Denver
Houston
Calgary
Toronto
Seattle
Baltimore
ICEE Markets on Fire FIRE Markets on Ice
• Houston and Calgary were the only two markets with over 1 million square feet (MSF) of absorption in Q1 2012.• Toronto boasted the lowest vacancy (5.3 percent) of any market with over 10 MSF of inventory.• Seattle ranks 5th highest in absorption, with a vacancy rate below 13 percent.• Silicon Valley was in the top 10 US markets for decreased vacancy rate.• Baltimore and Washington DC each boast a vacancy rate below 15 percent.• Raleigh boasts a vacancy rate below 12.5 percent and saw positive absorption for the quarter.
• Atlanta and Los Angeles were the only two metros with inventories over 200 million SF and vacancies over 17.5 percent.• Los Angeles and Orange County each had vacancy rates over 18 percent.• Central New Jersey showed the worst absorption of the top 20 o�ce markets.• Chicago saw negative absorption and 15 percent vacancy.• West Palm Beach experienced negative absorption and 19.5 percent vacancy.• Midtown South Manhattan saw negative absorption in Q1 2012.• Phoenix su�ered from negative absorption and a vacancy rate over 22 percent.
Prior to the housing and financial crises, office demand was aligned with growth in financial services and the over-heated housing markets. New bank charters, growing numbers of subprime lenders and unparalleled demand for residential and commercial mortgage-backed securities all propelled a need for more office space in markets with high concentrations of these industries, such as Chicago, Los Angeles and New York. As the subsequent recession and recovery has unfolded, financial and real estate businesses are no longer growing in the way they once were. Now, a new set of demand drivers has taken hold.
ICEE Markets on Fire One of the key differences between improving and lagging office markets is the type of industry concentrations each has. Office space demand is now driven by tech industries in ‘Knowledge Gateway’ markets, such as Austin, Boston and Silicon Valley; and energy corridor markets extending north from Houston into Canada. As some manufacturing returns to the U.S. from Asia and India, office demand is also growing in inland manufacturing markets in the Midwest and port markets along the Gulf Coast, South Florida and the Mid-Atlantic States—especially Miami, Virginia and North Carolina.
We have chosen two categories to distinguish between leading and lagging industries: FIRE and ICEE.
•Finance, Insurance and Real Estate (FIRE) markets are seeing stalled growth in demand for office space.
•Intellectual Capital, Energy and Education (ICEE) markets feature con-centrations in a combination of technology, higher education and energy industries. These growing industries are pushing up demand for office space in select markets, especially in Class A buildings.
Office demand has shifted away from FIRE and toward ICEE, thereby fa-voring cities with higher concentrations of ICEE industries.
Rents and Absorption Showed Improvement over Last Year The U.S. has seen a sustained modest improvement in vacancy and absorption in recent quarters. However, a more robust recovery in office demand—such as is occurring in multifamily and industrial real estate—remains elusive. Uncertainties in the economy are keeping businesses from hiring and leas-ing offices.
For Q1 2012, approximately 14.9 percent of the inventory that Colliers tracks was vacant; an improvement of 8 basis points from year-end 2011. With only 7.5 MSF of new supply delivered to these 81 markets in Q1, net absorption was a positive 8.1 MSF. With this amount of vacant space, and anemic office-related job growth, office rents improved just marginally in the 36 CBD markets that reported rent increases. The other 36 CBD mar-kets registered flat or declining rents. Thirty-two Suburban markets re-ported rent growth, while 37 suburban markets reported flat or declining quarter-over-quarter rents. Class A CBD rents improved from $40.73 per square foot to $40.96 per square foot. Class A Suburban rents increased from $25.86 to $26.14 per square foot.
SELECT INTELLECTUAL CAPITAL, ENERGY AND EDUCATION (ICEE) CITIES
P. 3 | COLLIERS INTERNATIONAL
HIGHLIGHTS | Q1 2012 | OFFICE | NORTH AMERICA
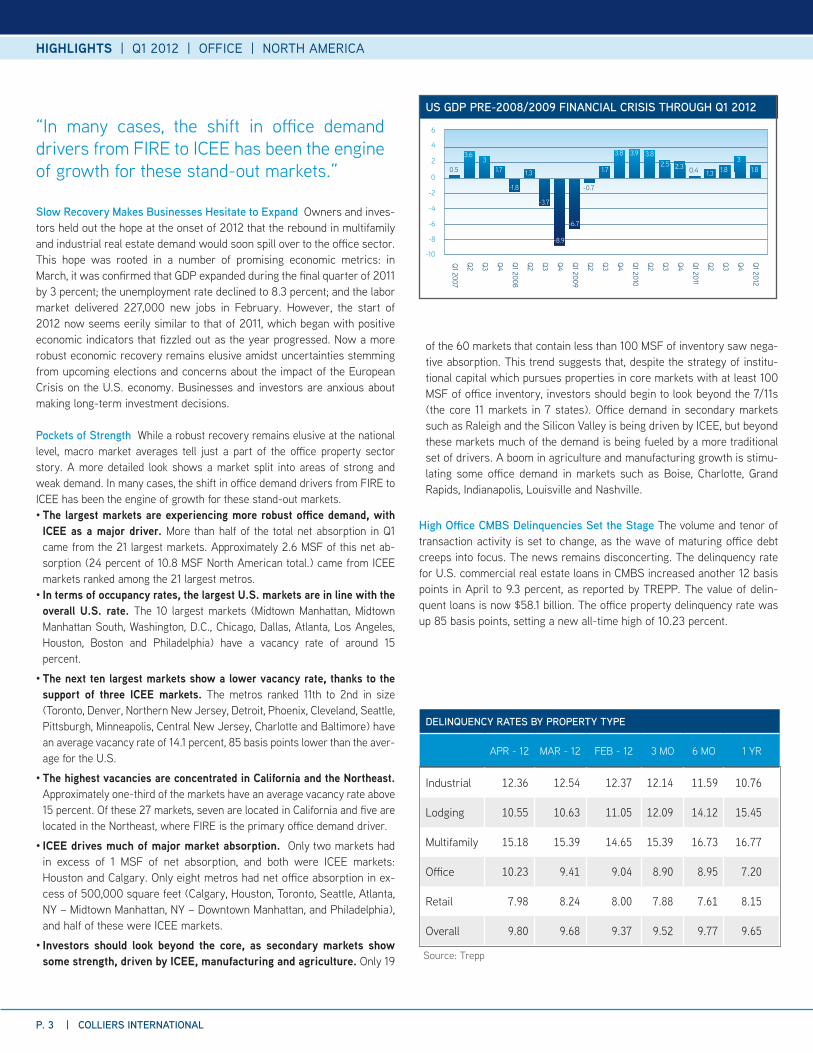
Slow Recovery Makes Businesses Hesitate to Expand Owners and inves-tors held out the hope at the onset of 2012 that the rebound in multifamily and industrial real estate demand would soon spill over to the office sector. This hope was rooted in a number of promising economic metrics: in March, it was confirmed that GDP expanded during the final quarter of 2011 by 3 percent; the unemployment rate declined to 8.3 percent; and the labor market delivered 227,000 new jobs in February. However, the start of 2012 now seems eerily similar to that of 2011, which began with positive economic indicators that fizzled out as the year progressed. Now a more robust economic recovery remains elusive amidst uncertainties stemming from upcoming elections and concerns about the impact of the European Crisis on the U.S. economy. Businesses and investors are anxious about making long-term investment decisions.
Pockets of Strength While a robust recovery remains elusive at the national level, macro market averages tell just a part of the office property sector story. A more detailed look shows a market split into areas of strong and weak demand. In many cases, the shift in office demand drivers from FIRE to ICEE has been the engine of growth for these stand-out markets. •The largest markets are experiencing more robust office demand, with ICEE as a major driver. More than half of the total net absorption in Q1 came from the 21 largest markets. Approximately 2.6 MSF of this net ab-sorption (24 percent of 10.8 MSF North American total.) came from ICEE markets ranked among the 21 largest metros.
•In terms of occupancy rates, the largest U.S. markets are in line with the overall U.S. rate. The 10 largest markets (Midtown Manhattan, Midtown Manhattan South, Washington, D.C., Chicago, Dallas, Atlanta, Los Angeles, Houston, Boston and Philadelphia) have a vacancy rate of around 15 percent.
•The next ten largest markets show a lower vacancy rate, thanks to the support of three ICEE markets. The metros ranked 11th to 2nd in size (Toronto, Denver, Northern New Jersey, Detroit, Phoenix, Cleveland, Seattle, Pittsburgh, Minneapolis, Central New Jersey, Charlotte and Baltimore) have an average vacancy rate of 14.1 percent, 85 basis points lower than the aver-age for the U.S.
•The highest vacancies are concentrated in California and the Northeast. Approximately one-third of the markets have an average vacancy rate above 15 percent. Of these 27 markets, seven are located in California and five are located in the Northeast, where FIRE is the primary office demand driver.
•ICEE drives much of major market absorption. Only two markets had in excess of 1 MSF of net absorption, and both were ICEE markets: Houston and Calgary. Only eight metros had net office absorption in ex-cess of 500,000 square feet (Calgary, Houston, Toronto, Seattle, Atlanta, NY – Midtown Manhattan, NY – Downtown Manhattan, and Philadelphia), and half of these were ICEE markets.
•Investors should look beyond the core, as secondary markets show some strength, driven by ICEE, manufacturing and agriculture. Only 19
of the 60 markets that contain less than 100 MSF of inventory saw nega-tive absorption. This trend suggests that, despite the strategy of institu-tional capital which pursues properties in core markets with at least 100 MSF of office inventory, investors should begin to look beyond the 7/11s (the core 11 markets in 7 states). Office demand in secondary markets such as Raleigh and the Silicon Valley is being driven by ICEE, but beyond these markets much of the demand is being fueled by a more traditional set of drivers. A boom in agriculture and manufacturing growth is stimu-lating some office demand in markets such as Boise, Charlotte, Grand Rapids, Indianapolis, Louisville and Nashville.
High Office CMBS Delinquencies Set the Stage The volume and tenor of transaction activity is set to change, as the wave of maturing office debt creeps into focus. The news remains disconcerting. The delinquency rate for U.S. commercial real estate loans in CMBS increased another 12 basis points in April to 9.3 percent, as reported by TREPP. The value of delin-quent loans is now $58.1 billion. The office property delinquency rate was up 85 basis points, setting a new all-time high of 10.23 percent.
“In many cases, the shift in office demand drivers from FIRE to ICEE has been the engine of growth for these stand-out markets.”
US GDP PRE-2008/2009 FINANCIAL CRISIS THROUGH Q1 2012
Q2 Q3 Q4 Q1 2011
Q2 Q3Q4Q3 Q1 2009
Q2Q2Q4Q3 Q1 2008
Q1 2007
Q2 Q3 Q4 Q1 2010
Q4 Q1 2012
-8
-10
-6
-4
-2
0
2
4
6
1.83
1.81.32.32.5
3.83.93.8
1.71.31.73
3.6
-6.7
-8.9
-3.7
-1.8 -0.7
0.40.5
Source: Trepp
DELINQUENCY RATES BY PROPERTY TYPE
APR - 12 MAR - 12 FEB - 12 3 MO 6 MO 1 YR
Industrial 12.36 12.54 12.37 12.14 11.59 10.76
Lodging 10.55 10.63 11.05 12.09 14.12 15.45
Multifamily 15.18 15.39 14.65 15.39 16.73 16.77
Office 10.23 9.41 9.04 8.90 8.95 7.20
Retail 7.98 8.24 8.00 7.88 7.61 8.15
Overall 9.80 9.68 9.37 9.52 9.77 9.65
P. 4 | COLLIERS INTERNATIONAL
HIGHLIGHTS | Q1 2012 | OFFICE | NORTH AMERICA
Stabilized and Distressed Sales Set Two Very Different Pricing Benchmarks The ICEE markets will continue to attract a disproportionate share of investment capital slated for office properties in 2012, thanks to positive absorption, declining vacancy and strong office-related job growth. But unlike the distinction in demand between FIRE and ICEE, there is another story of extreme bifur-cation in transaction volume and pricing: the split between the highly valued stabilized assets in core markets and the distressed and overleveraged properties working their way through debt restructuring.
Institutional capital is still focused on stabilized assets in core markets, regardless of the office demand drivers, with transaction activity concentrated in a few major markets; New York, Washington, D.C., Chicago, Boston, Houston, Los Angeles, San Francisco, Seattle, Dallas, Atlanta and Denver were all markets with more than $1.5 billion in office transaction activity in 2011 and they continue to lead investment activity in Q1 2012, according to data from Real Capital Analytics. Much of the institutional investment in Atlanta and Chicago represents opportunistic distressed asset investment by those wishing to capitalize on overleveraged CMBS office debt maturities and defaults. The remaining eight markets represent the core financial service, technology and energy markets. Institutional capital believes these eight markets have the most compelling metrics and yield for investment objectives.
Two recent office transactions illustrate the pricing dichotomy between stabilized properties in core markets and distressed or overleveraged properties.
•$550 per square foot for Seattle’s 872,000-square-foot Russell Investment Center•$101 per square foot for Minneapolis’ 1.1-million-square-foot Fifth Street Towers office complex
The Russell Investment Center in Seattle, built in 2006, was originally the corporate headquarters of Washington Mutual. As fallout of the financial crisis, the property was left without a tenant. In 2009, Northwest Mutual paid $132 per square foot for this mostly vacant CBD Seattle office build-ing. Since then, the property attracted investment-grade tenants leasing up 95% of its available space. In three years, Northwest Mutual more than quadrupled its investment. This transaction shows the high price that institutional capital will pay for a prime property in a core market—sales above $500 per square foot are no longer atypical in Boston, Houston and Seattle—where there is certainty of cash-flow stability. This kind of turnaround story is what investors in the over-lever-aged Atlanta, Charlotte, Chicago and Phoenix markets are anticipating.
The Minneapolis Fifth Street Towers office complex exemplifies a very different type of transaction. This 1.1 MSF 1985 vintage property was purchased in a foreclosure auction sale with an occupancy that had fallen to 60 percent. The $101 per square price shows the relatively low ceiling that in-vestment capital is willing to pay for over-leveraged and distressed office assets requiring both further funds and considerable management expertise in order to re-stabilize.
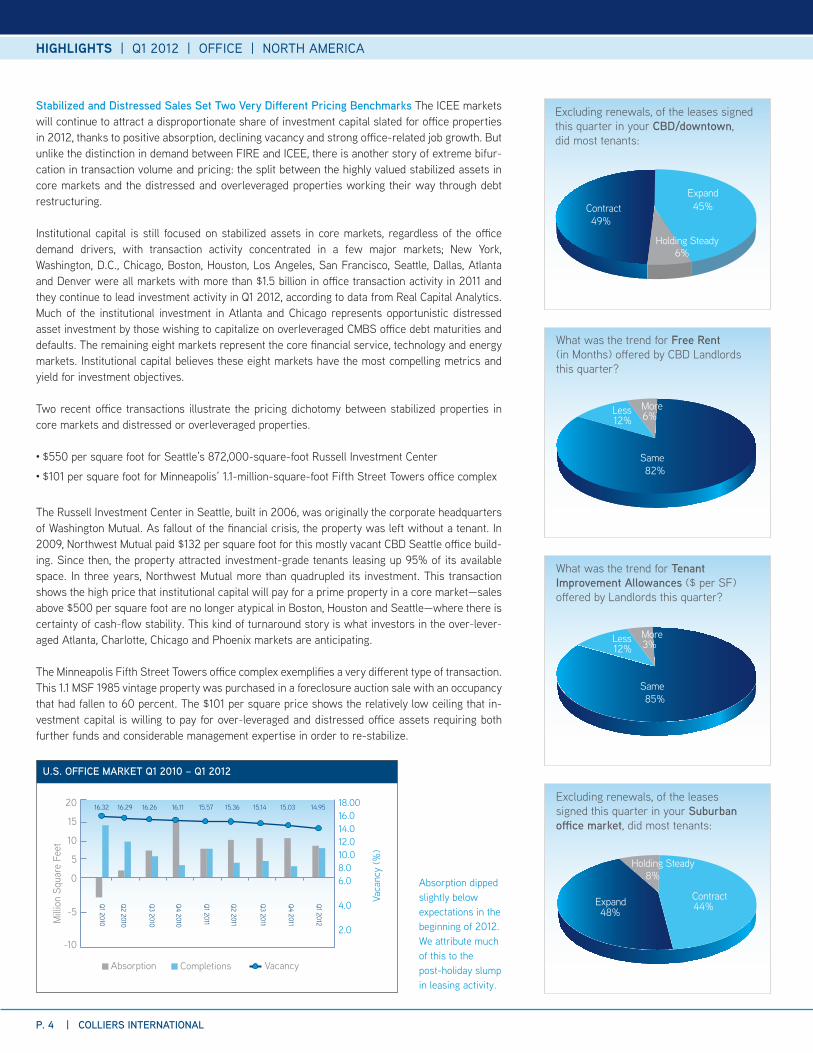
Absorption dipped slightly below expectations in the beginning of 2012. We attribute much of this to the post-holiday slump in leasing activity.
U.S. OFFICE MARKET Q1 2010 – Q1 2012
Q4 2011
Q1 2012
Q3 2011
Q2 2011
Q1 2011
Q4 2010
Q3 2010
Q2 2010
Absorption Completions Vacancy
Mill
ion
Squa
reFe
et
Vaca
ncy
(%)
2.0
4.0
6.08.010.012.014.016.018.0016.32 16.29 16.26 15.03 14.9515.57 15.3616.11 15.14
-10
-5
0
5
10
15
20
Q1 2010
49%45%
6%
Excluding renewals, of the leases signed this quarter in your CBD/downtown, did most tenants:
Contract Expand
Holding Steady
What was the trend for Free Rent (in Months) o�ered by CBD Landlords this quarter?
82%
12% 6%
Same
Less More
What was the trend for Tenant Improvement Allowances ($ per SF) o�ered by Landlords this quarter?
85%
12% 3%
Same
Less More
Excluding renewals, of the leases signed this quarter in your Suburban o�ce market, did most tenants:
48%Expand 44%
Contract
8%Holding Steady

HIGHLIGHTS | Q1 2012 | OFFICE | NORTH AMERICA
COLLIERS INTERNATIONAL | P. 5
“The market must recalculate the amount of office space required, and recalibrate in areas that space demand has shifted.”
Rents and Office Construction at a Crawl, but ICEE Markets Show Signs of Life Only 9.5 MSF of new supply was delivered in Q1 2012, just 0.2 percent of the total 6.3 billion square feet of existing office inventory. The lack of significant office construction has helped to bolster current office demand and will intensify future demand when it returns. Stabilized office markets with vacancy rates of 10–15 percent and 1.5–2.0 percent job growth require existing inventory to expand by approximately 2.0 percent to maintain market equilibrium and keep rents from rising. At such a growth rate, the nation would require 122.8 MSF—more than eight times the cur-rent new supply. With so little new supply in the pipeline, the stage is set for continued improvement in office vacancy, especially in the ICEE markets.
•The markets that saw the most new deliveries of space in Q1 2012 were New York, Calgary, Washington, D.C., Houston, Philadelphia, Baltimore and Louisville.
In some cases, the absence of available properties in technology and energy markets is stimulating new construction activity. This has caused an uptick in Houston’s office construction, where 915,000 square feet of new supply was delivered in Q1 2012. It has also spurred unexpected construction in some smaller markets. In the Raleigh market, for example, software
publisher SAS Institute announced in March that it will build another 213,000 square feet on its Cary campus later this year. SAS was not able to find existing expansion space. This is not the first new construction for SAS. In 2011, it opened a 287,000 square foot building, and added 367 jobs. When this latest building is completed in late 2014, SAS will add another 650 office workers to its existing 5,000 Cary, NC, employees.
This same kind of growth and demand for office space is occurring in other technology and energy markets, such as Austin, Baltimore, Denver, San Jose/Silicon Valley, Seattle and Portland.
Downtown Houston, TX; Source: Thinkstock.com
HIGHLIGHTS | Q1 2012 | OFFICE | NORTH AMERICA
COLLIERS INTERNATIONAL | P. 6
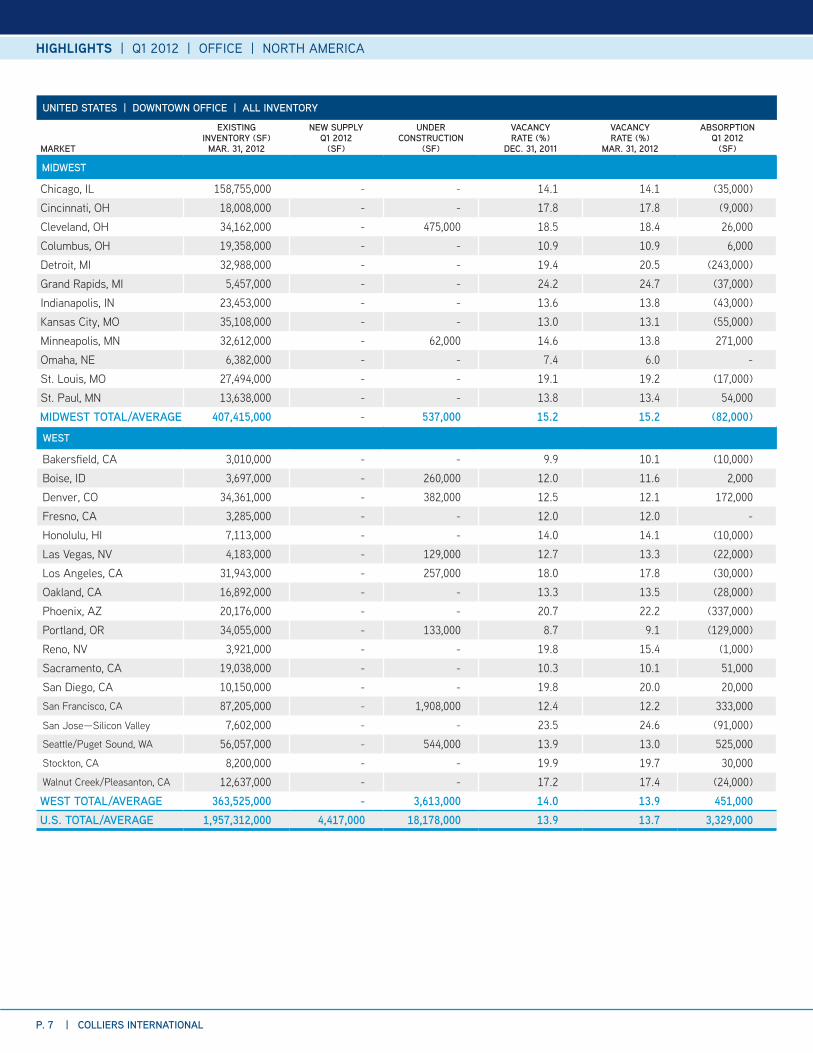
UNITED STATES | DOWNTOWN OFFICE | ALL INVENTORY
MARKET
EXISTING INVENTORY (SF)
MAR. 31, 2012
NEW SUPPLY Q1 2012
(SF)
UNDER CONSTRUCTION
(SF)
VACANCY RATE (%)
DEC. 31, 2011
VACANCY RATE (%)
MAR. 31, 2012
ABSORPTION Q1 2012
(SF)
NORTHEAST
Baltimore, MD 29,115,000 34,000 - 15.3 15.3 28,000
Boston, MA 61,047,000 - 1,810,000 15.8 15.4 153,000
Hartford, CT 9,715,000 - - 24.3 25.1 (35,000)
New York, NY—Downtown Manhattan 110,942,000 2,845,000 5,200,000 15.9 16.0 707,000
New York, NY—Midtown Manhattan 227,532,000 740,000 1,052,000 11.9 11.7 766,000
New York, NY—Midtown South Manhattan 165,369,000 35,000 850,000 8.7 8.6 (53,000)
Philadelphia, PA 43,114,000 - - 11.4 11.6 (93,000)
Pittsburgh, PA 32,234,000 - - 10.3 9.8 (50,000)
Stamford, CT 19,273,000 - - 18.8 18.7 162,000
Washington DC 140,860,000 - 2,107,000 10.5 10.3 285,000
White Plains, NY 7,800,000 - - 14.3 14.8 (26,000)
NORTHEAST TOTAL/AVERAGE 847,001,000 3,654,000 11,019,000 12.2 12.1 1,844,000
SOUTH
Atlanta, GA 49,946,000 - 450,000 17.9 17.6 154,000
Charleston, SC 2,068,000 - - 7.6 9.0 (18,000)
Charlotte, NC 23,188,000 - - 11.1 11.3 37,000
Columbia, SC 4,964,000 - - 24.1 23.8 (30,000)
Dallas/Fort Worth, TX 45,550,000 - - 23.8 24.2 (175,000)
Ft. Lauderdale-Broward, FL 8,129,000 - - 16.6 16.1 68,000
Houston, TX 38,333,000 - - 16.6 14.3 267,000
Jacksonville, FL 15,902,000 - - 13.6 14.5 10,000
Little Rock, AR 6,538,000 - - 16.0 15.3 1,000
Louisville, KY 51,664,000 233,000 195,000 11.4 11.0 461,000
Memphis, TN 13,366,000 - - 18.2 18.1 56,000
Miami-Dade, FL 17,774,000 - - 20.9 20.5 72,000
Nashville, TN 8,114,000 530,000 90,000 22.7 22.9 1,000
Oklahoma City, OK 9,576,000 - 1,800,000 16.5 15.1 133,000
Orlando, FL 12,704,000 - - 13.1 11.8 164,000
Raleigh/Durham/Chapel Hill, NC 12,338,000 - 402,000 5.8 5.7 (44,000)
Savannah, GA 747,000 - 72,000 16.9 15.1 13,000
Tampa Bay, FL 8,423,000 - - 14.3 14.0 1,000 West Palm Beach/Palm Beach County, FL 10,047,000 - - 18.2 18.5 (55,000)
SOUTH TOTAL/AVERAGE 339,371,000 763,000 3,009,000 16.4 16.0 1,116,000
P. 7 | COLLIERS INTERNATIONAL
HIGHLIGHTS | Q1 2012 | OFFICE | NORTH AMERICA
UNITED STATES | DOWNTOWN OFFICE | ALL INVENTORY
MARKET
EXISTING INVENTORY (SF)
MAR. 31, 2012
NEW SUPPLY Q1 2012
(SF)
UNDER CONSTRUCTION
(SF)
VACANCY RATE (%)
DEC. 31, 2011
VACANCY RATE (%)
MAR. 31, 2012
ABSORPTION Q1 2012
(SF)
MIDWEST
Chicago, IL 158,755,000 - - 14.1 14.1 (35,000) Cincinnati, OH 18,008,000 - - 17.8 17.8 (9,000) Cleveland, OH 34,162,000 - 475,000 18.5 18.4 26,000 Columbus, OH 19,358,000 - - 10.9 10.9 6,000 Detroit, MI 32,988,000 - - 19.4 20.5 (243,000) Grand Rapids, MI 5,457,000 - - 24.2 24.7 (37,000) Indianapolis, IN 23,453,000 - - 13.6 13.8 (43,000) Kansas City, MO 35,108,000 - - 13.0 13.1 (55,000) Minneapolis, MN 32,612,000 - 62,000 14.6 13.8 271,000 Omaha, NE 6,382,000 - - 7.4 6.0 - St. Louis, MO 27,494,000 - - 19.1 19.2 (17,000) St. Paul, MN 13,638,000 - - 13.8 13.4 54,000 MIDWEST TOTAL/AVERAGE 407,415,000 - 537,000 15.2 15.2 (82,000)
WEST
Bakersfield, CA 3,010,000 - - 9.9 10.1 (10,000)Boise, ID 3,697,000 - 260,000 12.0 11.6 2,000 Denver, CO 34,361,000 - 382,000 12.5 12.1 172,000 Fresno, CA 3,285,000 - - 12.0 12.0 - Honolulu, HI 7,113,000 - - 14.0 14.1 (10,000)Las Vegas, NV 4,183,000 - 129,000 12.7 13.3 (22,000)Los Angeles, CA 31,943,000 - 257,000 18.0 17.8 (30,000)Oakland, CA 16,892,000 - - 13.3 13.5 (28,000)Phoenix, AZ 20,176,000 - - 20.7 22.2 (337,000)Portland, OR 34,055,000 - 133,000 8.7 9.1 (129,000)Reno, NV 3,921,000 - - 19.8 15.4 (1,000)Sacramento, CA 19,038,000 - - 10.3 10.1 51,000 San Diego, CA 10,150,000 - - 19.8 20.0 20,000 San Francisco, CA 87,205,000 - 1,908,000 12.4 12.2 333,000 San Jose—Silicon Valley 7,602,000 - - 23.5 24.6 (91,000)Seattle/Puget Sound, WA 56,057,000 - 544,000 13.9 13.0 525,000 Stockton, CA 8,200,000 - - 19.9 19.7 30,000 Walnut Creek/Pleasanton, CA 12,637,000 - - 17.2 17.4 (24,000)
WEST TOTAL/AVERAGE 363,525,000 - 3,613,000 14.0 13.9 451,000 U.S. TOTAL/AVERAGE 1,957,312,000 4,417,000 18,178,000 13.9 13.7 3,329,000
HIGHLIGHTS | Q1 2012 | OFFICE | NORTH AMERICA
COLLIERS INTERNATIONAL | P. 8
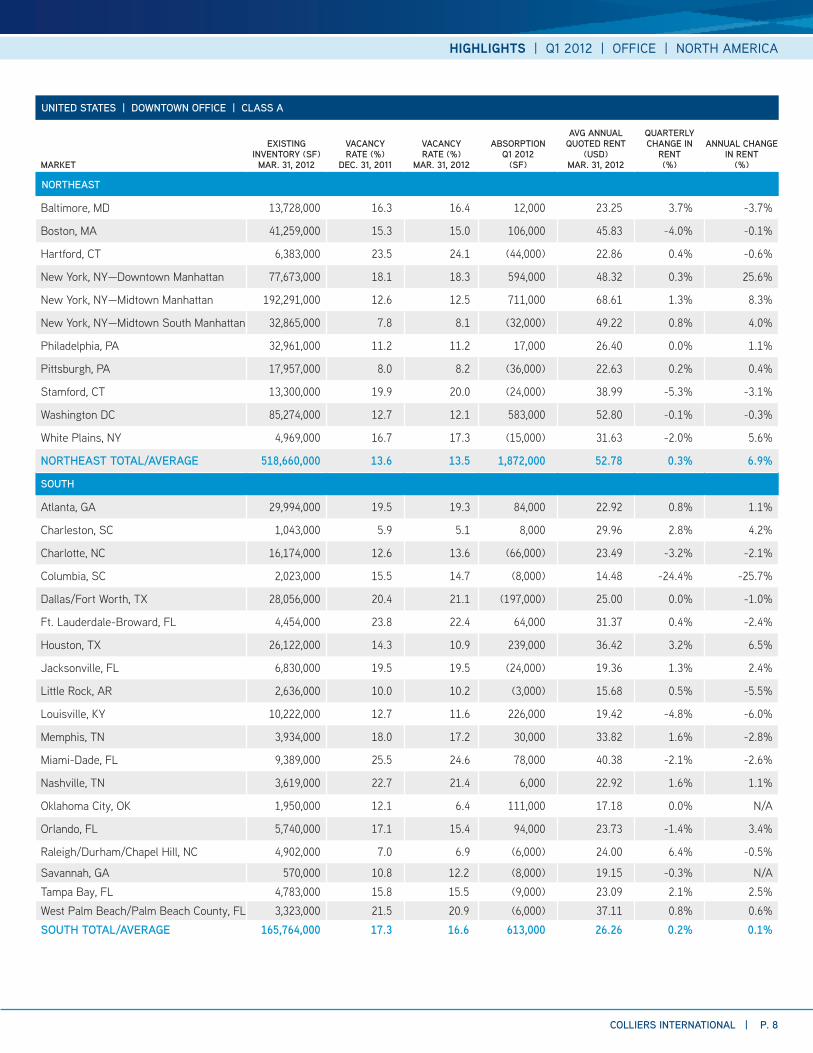
UNITED STATES | DOWNTOWN OFFICE | CLASS A
MARKET
EXISTING INVENTORY (SF)
MAR. 31, 2012
VACANCY RATE (%)
DEC. 31, 2011
VACANCY RATE (%)
MAR. 31, 2012
ABSORPTION Q1 2012
(SF)
AVG ANNUAL QUOTED RENT
(USD) MAR. 31, 2012
QUARTERLY CHANGE IN
RENT(%)
ANNUAL CHANGE IN RENT
(%)
NORTHEAST
Baltimore, MD 13,728,000 16.3 16.4 12,000 23.25 3.7% -3.7%
Boston, MA 41,259,000 15.3 15.0 106,000 45.83 -4.0% -0.1%
Hartford, CT 6,383,000 23.5 24.1 (44,000) 22.86 0.4% -0.6%
New York, NY—Downtown Manhattan 77,673,000 18.1 18.3 594,000 48.32 0.3% 25.6%
New York, NY—Midtown Manhattan 192,291,000 12.6 12.5 711,000 68.61 1.3% 8.3%
New York, NY—Midtown South Manhattan 32,865,000 7.8 8.1 (32,000) 49.22 0.8% 4.0%
Philadelphia, PA 32,961,000 11.2 11.2 17,000 26.40 0.0% 1.1%
Pittsburgh, PA 17,957,000 8.0 8.2 (36,000) 22.63 0.2% 0.4%
Stamford, CT 13,300,000 19.9 20.0 (24,000) 38.99 -5.3% -3.1%
Washington DC 85,274,000 12.7 12.1 583,000 52.80 -0.1% -0.3%
White Plains, NY 4,969,000 16.7 17.3 (15,000) 31.63 -2.0% 5.6%
NORTHEAST TOTAL/AVERAGE 518,660,000 13.6 13.5 1,872,000 52.78 0.3% 6.9%
SOUTH
Atlanta, GA 29,994,000 19.5 19.3 84,000 22.92 0.8% 1.1%
Charleston, SC 1,043,000 5.9 5.1 8,000 29.96 2.8% 4.2%
Charlotte, NC 16,174,000 12.6 13.6 (66,000) 23.49 -3.2% -2.1%
Columbia, SC 2,023,000 15.5 14.7 (8,000) 14.48 -24.4% -25.7%
Dallas/Fort Worth, TX 28,056,000 20.4 21.1 (197,000) 25.00 0.0% -1.0%
Ft. Lauderdale-Broward, FL 4,454,000 23.8 22.4 64,000 31.37 0.4% -2.4%
Houston, TX 26,122,000 14.3 10.9 239,000 36.42 3.2% 6.5%
Jacksonville, FL 6,830,000 19.5 19.5 (24,000) 19.36 1.3% 2.4%
Little Rock, AR 2,636,000 10.0 10.2 (3,000) 15.68 0.5% -5.5%
Louisville, KY 10,222,000 12.7 11.6 226,000 19.42 -4.8% -6.0%
Memphis, TN 3,934,000 18.0 17.2 30,000 33.82 1.6% -2.8%
Miami-Dade, FL 9,389,000 25.5 24.6 78,000 40.38 -2.1% -2.6%
Nashville, TN 3,619,000 22.7 21.4 6,000 22.92 1.6% 1.1%
Oklahoma City, OK 1,950,000 12.1 6.4 111,000 17.18 0.0% N/A
Orlando, FL 5,740,000 17.1 15.4 94,000 23.73 -1.4% 3.4%
Raleigh/Durham/Chapel Hill, NC 4,902,000 7.0 6.9 (6,000) 24.00 6.4% -0.5%
Savannah, GA 570,000 10.8 12.2 (8,000) 19.15 -0.3% N/ATampa Bay, FL 4,783,000 15.8 15.5 (9,000) 23.09 2.1% 2.5%West Palm Beach/Palm Beach County, FL 3,323,000 21.5 20.9 (6,000) 37.11 0.8% 0.6%SOUTH TOTAL/AVERAGE 165,764,000 17.3 16.6 613,000 26.26 0.2% 0.1%
P. 9 | COLLIERS INTERNATIONAL
HIGHLIGHTS | Q1 2012 | OFFICE | NORTH AMERICA
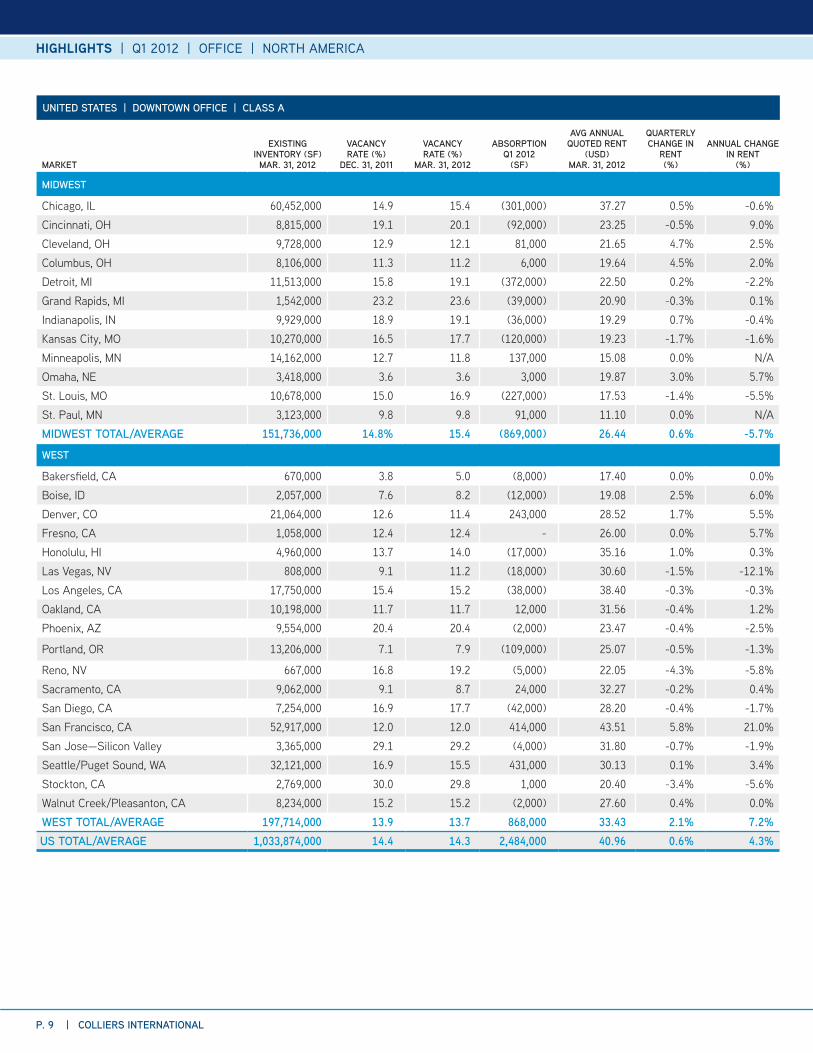
UNITED STATES | DOWNTOWN OFFICE | CLASS A
MARKET
EXISTING INVENTORY (SF)
MAR. 31, 2012
VACANCY RATE (%)
DEC. 31, 2011
VACANCY RATE (%)
MAR. 31, 2012
ABSORPTION Q1 2012
(SF)
AVG ANNUAL QUOTED RENT
(USD) MAR. 31, 2012
QUARTERLY CHANGE IN
RENT(%)
ANNUAL CHANGE IN RENT
(%)
MIDWEST
Chicago, IL 60,452,000 14.9 15.4 (301,000) 37.27 0.5% -0.6%Cincinnati, OH 8,815,000 19.1 20.1 (92,000) 23.25 -0.5% 9.0%Cleveland, OH 9,728,000 12.9 12.1 81,000 21.65 4.7% 2.5%Columbus, OH 8,106,000 11.3 11.2 6,000 19.64 4.5% 2.0%Detroit, MI 11,513,000 15.8 19.1 (372,000) 22.50 0.2% -2.2%Grand Rapids, MI 1,542,000 23.2 23.6 (39,000) 20.90 -0.3% 0.1%Indianapolis, IN 9,929,000 18.9 19.1 (36,000) 19.29 0.7% -0.4%Kansas City, MO 10,270,000 16.5 17.7 (120,000) 19.23 -1.7% -1.6%Minneapolis, MN 14,162,000 12.7 11.8 137,000 15.08 0.0% N/AOmaha, NE 3,418,000 3.6 3.6 3,000 19.87 3.0% 5.7%St. Louis, MO 10,678,000 15.0 16.9 (227,000) 17.53 -1.4% -5.5%St. Paul, MN 3,123,000 9.8 9.8 91,000 11.10 0.0% N/AMIDWEST TOTAL/AVERAGE 151,736,000 14.8% 15.4 (869,000) 26.44 0.6% -5.7%
WEST
Bakersfield, CA 670,000 3.8 5.0 (8,000) 17.40 0.0% 0.0%Boise, ID 2,057,000 7.6 8.2 (12,000) 19.08 2.5% 6.0%Denver, CO 21,064,000 12.6 11.4 243,000 28.52 1.7% 5.5%Fresno, CA 1,058,000 12.4 12.4 - 26.00 0.0% 5.7%Honolulu, HI 4,960,000 13.7 14.0 (17,000) 35.16 1.0% 0.3%Las Vegas, NV 808,000 9.1 11.2 (18,000) 30.60 -1.5% -12.1%Los Angeles, CA 17,750,000 15.4 15.2 (38,000) 38.40 -0.3% -0.3%Oakland, CA 10,198,000 11.7 11.7 12,000 31.56 -0.4% 1.2%Phoenix, AZ 9,554,000 20.4 20.4 (2,000) 23.47 -0.4% -2.5%
Portland, OR 13,206,000 7.1 7.9 (109,000) 25.07 -0.5% -1.3%
Reno, NV 667,000 16.8 19.2 (5,000) 22.05 -4.3% -5.8%Sacramento, CA 9,062,000 9.1 8.7 24,000 32.27 -0.2% 0.4%San Diego, CA 7,254,000 16.9 17.7 (42,000) 28.20 -0.4% -1.7%San Francisco, CA 52,917,000 12.0 12.0 414,000 43.51 5.8% 21.0%San Jose—Silicon Valley 3,365,000 29.1 29.2 (4,000) 31.80 -0.7% -1.9%Seattle/Puget Sound, WA 32,121,000 16.9 15.5 431,000 30.13 0.1% 3.4%Stockton, CA 2,769,000 30.0 29.8 1,000 20.40 -3.4% -5.6%Walnut Creek/Pleasanton, CA 8,234,000 15.2 15.2 (2,000) 27.60 0.4% 0.0%WEST TOTAL/AVERAGE 197,714,000 13.9 13.7 868,000 33.43 2.1% 7.2%
US TOTAL/AVERAGE 1,033,874,000 14.4 14.3 2,484,000 40.96 0.6% 4.3%
P. 10 | COLLIERS INTERNATIONAL
HIGHLIGHTS | Q1 2012 | OFFICE | NORTH AMERICA
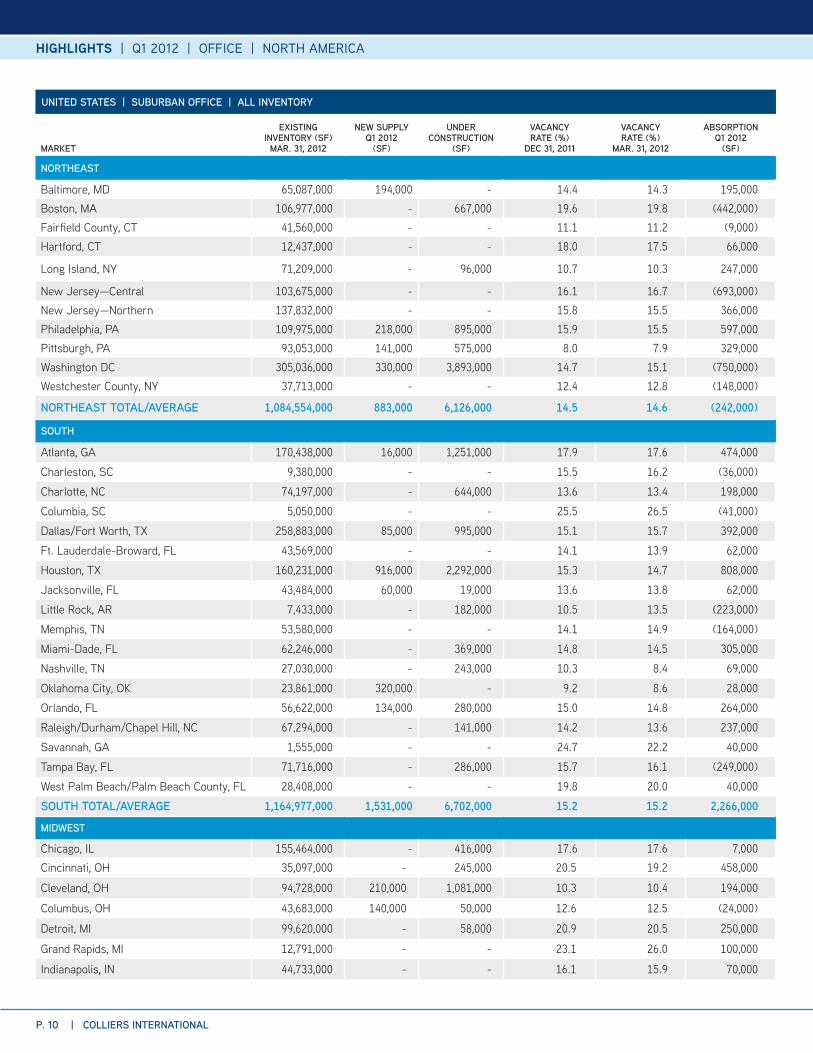
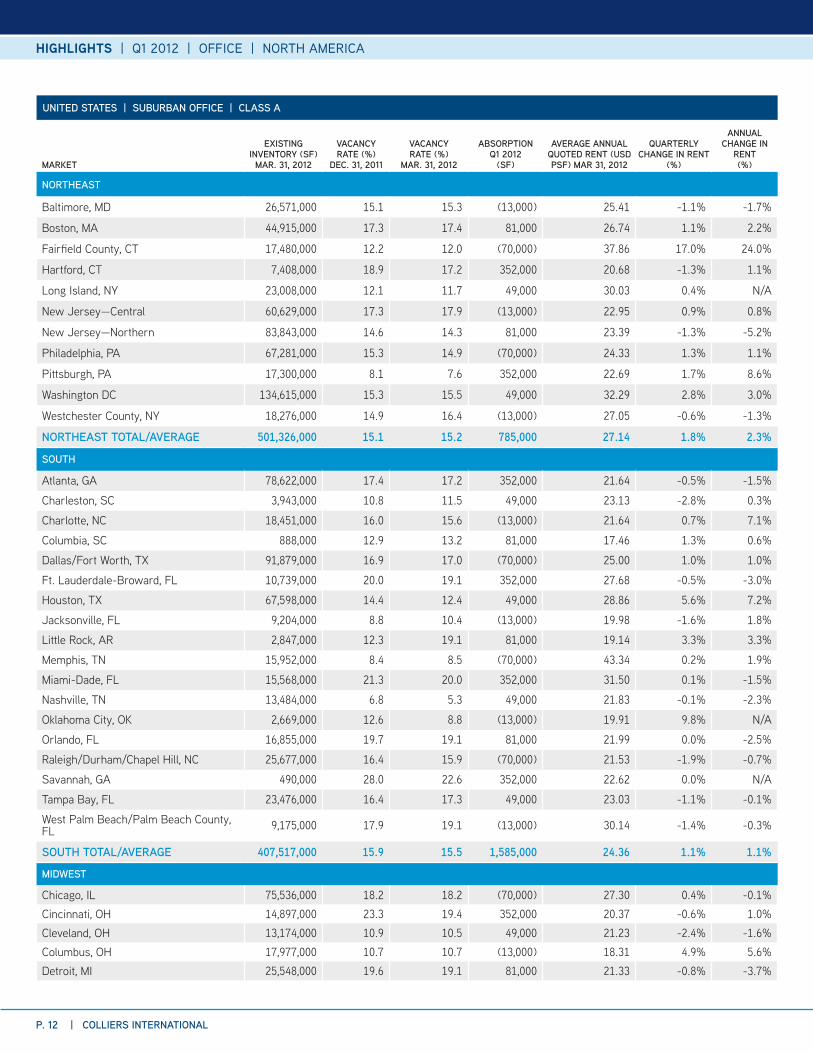
UNITED STATES | SUBURBAN OFFICE | ALL INVENTORY
MARKET
EXISTING INVENTORY (SF)
MAR. 31, 2012
NEW SUPPLY Q1 2012
(SF)
UNDER CONSTRUCTION
(SF)
VACANCY RATE (%)
DEC 31, 2011
VACANCY RATE (%)
MAR. 31, 2012
ABSORPTION Q1 2012
(SF)
NORTHEAST
Baltimore, MD 65,087,000 194,000 - 14.4 14.3 195,000 Boston, MA 106,977,000 - 667,000 19.6 19.8 (442,000)Fairfield County, CT 41,560,000 - - 11.1 11.2 (9,000)Hartford, CT 12,437,000 - - 18.0 17.5 66,000
Long Island, NY 71,209,000 - 96,000 10.7 10.3 247,000
New Jersey—Central 103,675,000 - - 16.1 16.7 (693,000)New Jersey—Northern 137,832,000 - - 15.8 15.5 366,000 Philadelphia, PA 109,975,000 218,000 895,000 15.9 15.5 597,000 Pittsburgh, PA 93,053,000 141,000 575,000 8.0 7.9 329,000 Washington DC 305,036,000 330,000 3,893,000 14.7 15.1 (750,000)Westchester County, NY 37,713,000 - - 12.4 12.8 (148,000)
NORTHEAST TOTAL/AVERAGE 1,084,554,000 883,000 6,126,000 14.5 14.6 (242,000)
SOUTH
Atlanta, GA 170,438,000 16,000 1,251,000 17.9 17.6 474,000
Charleston, SC 9,380,000 - - 15.5 16.2 (36,000)
Charlotte, NC 74,197,000 - 644,000 13.6 13.4 198,000
Columbia, SC 5,050,000 - - 25.5 26.5 (41,000)
Dallas/Fort Worth, TX 258,883,000 85,000 995,000 15.1 15.7 392,000
Ft. Lauderdale-Broward, FL 43,569,000 - - 14.1 13.9 62,000
Houston, TX 160,231,000 916,000 2,292,000 15.3 14.7 808,000
Jacksonville, FL 43,484,000 60,000 19,000 13.6 13.8 62,000
Little Rock, AR 7,433,000 - 182,000 10.5 13.5 (223,000)
Memphis, TN 53,580,000 - - 14.1 14.9 (164,000)
Miami-Dade, FL 62,246,000 - 369,000 14.8 14.5 305,000
Nashville, TN 27,030,000 - 243,000 10.3 8.4 69,000
Oklahoma City, OK 23,861,000 320,000 - 9.2 8.6 28,000
Orlando, FL 56,622,000 134,000 280,000 15.0 14.8 264,000
Raleigh/Durham/Chapel Hill, NC 67,294,000 - 141,000 14.2 13.6 237,000
Savannah, GA 1,555,000 - - 24.7 22.2 40,000
Tampa Bay, FL 71,716,000 - 286,000 15.7 16.1 (249,000)
West Palm Beach/Palm Beach County, FL 28,408,000 - - 19.8 20.0 40,000
SOUTH TOTAL/AVERAGE 1,164,977,000 1,531,000 6,702,000 15.2 15.2 2,266,000
MIDWEST
Chicago, IL 155,464,000 - 416,000 17.6 17.6 7,000 Cincinnati, OH 35,097,000 - 245,000 20.5 19.2 458,000
Cleveland, OH 94,728,000 210,000 1,081,000 10.3 10.4 194,000
Columbus, OH 43,683,000 140,000 50,000 12.6 12.5 (24,000)
Detroit, MI 99,620,000 - 58,000 20.9 20.5 250,000
Grand Rapids, MI 12,791,000 - - 23.1 26.0 100,000
Indianapolis, IN 44,733,000 - - 16.1 15.9 70,000

HIGHLIGHTS | Q1 2012 | OFFICE | NORTH AMERICA
COLLIERS INTERNATIONAL | P. 11
UNITED STATES | SUBURBAN OFFICE | ALL INVENTORY
MARKET
EXISTING INVENTORY (SF)
MAR. 31, 2012
NEW SUPPLY Q1 2012
(SF)
UNDER CONSTRUCTION
(SF)
VACANCY RATE (%)
DEC 31, 2011
VACANCY RATE (%)
MAR. 31, 2012
ABSORPTION Q1 2012
(SF)
Kansas City, MO 56,191,000 - 102,000 13.8 13.9 (82,000)
Minneapolis, MN 83,345,000 - 467,000 13.8 13.7 121,000
Omaha, NE 20,470,000 - 679,000 12.9 12.3 133,000
St. Louis, MO 55,304,000 - - 12.5 10.8 47,000
MIDWEST TOTAL/AVERAGE 701,426,000 350,000 3,098,000 15.5 15.4 1,274,000
WEST
Bakersfield, CA 5,975,000 - - 8.1 7.8 26,000
Boise, ID 10,883,000 - - 21.4 19.2 231,000
Denver, CO 103,618,000 - 185,000 15.1 15.0 108,000
Fairfield, CA 4,708,000 - - 23.7 23.5 12,000
Fresno, CA 17,981,000 6,000 10,000 13.5 13.2 69,000
Honolulu, HI 7,513,000 - - 13.1 13.1 2,000
Las Vegas, NV 35,089,000 9,000 5,000 26.3 26.4 (18,000)
Los Angeles—Inland Empire, CA 21,558,000 - 140,000 23.3 23.2 23,000
Los Angeles, CA 168,450,000 - 1,123,000 18.3 18.3 95,000
Oakland, CA 16,066,000 - 97,000 17.6 18.6 (107,000)
Orange County, CA 80,682,000 - 380,000 18.8 18.6 (282,000)
Phoenix, AZ 110,351,000 210,000 236,000 22.0 22.0 152,000
Portland, OR 43,962,000 28,000 385,000 12.5 11.9 294,000
Reno, NV 6,934,000 - - 19.7 16.9 1,000
Sacramento, CA 72,687,000 72,000 235,000 19.4 19.4 63,000
San Diego, CA 68,066,000 4,000 249,000 14.7 14.3 255,000
San Francisco Peninsula 35,123,000 - - 12.5 12.5 (5,000)
San Jose—Silicon Valley 53,922,000 - 447,000 14.9 13.9 367,000
Seattle/Puget Sound, WA 72,785,000 - 426,000 13.1 12.9 124,000
Walnut Creek/Pleasanton, CA 32,942,000 - - 15.0 14.7 96,000
WEST TOTAL/AVERAGE 969,295,000 329,000 3,918,000 17.4 17.2 1,506,000
U.S. TOTAL/AVERAGE 3,920,252,000 3,093,000 19,844,000 15.6 15.5 4,804,000
P. 12 | COLLIERS INTERNATIONAL
HIGHLIGHTS | Q1 2012 | OFFICE | NORTH AMERICA
UNITED STATES | SUBURBAN OFFICE | CLASS A
MARKET
EXISTING INVENTORY (SF)
MAR. 31, 2012
VACANCY RATE (%)
DEC. 31, 2011
VACANCY RATE (%)
MAR. 31, 2012
ABSORPTION Q1 2012
(SF)
AVERAGE ANNUAL QUOTED RENT (USD PSF) MAR 31, 2012
QUARTERLY CHANGE IN RENT
(%)
ANNUAL CHANGE IN
RENT (%)
NORTHEAST
Baltimore, MD 26,571,000 15.1 15.3 (13,000) 25.41 -1.1% -1.7%
Boston, MA 44,915,000 17.3 17.4 81,000 26.74 1.1% 2.2%
Fairfield County, CT 17,480,000 12.2 12.0 (70,000) 37.86 17.0% 24.0%
Hartford, CT 7,408,000 18.9 17.2 352,000 20.68 -1.3% 1.1%
Long Island, NY 23,008,000 12.1 11.7 49,000 30.03 0.4% N/A
New Jersey—Central 60,629,000 17.3 17.9 (13,000) 22.95 0.9% 0.8%
New Jersey—Northern 83,843,000 14.6 14.3 81,000 23.39 -1.3% -5.2%
Philadelphia, PA 67,281,000 15.3 14.9 (70,000) 24.33 1.3% 1.1%
Pittsburgh, PA 17,300,000 8.1 7.6 352,000 22.69 1.7% 8.6%
Washington DC 134,615,000 15.3 15.5 49,000 32.29 2.8% 3.0%
Westchester County, NY 18,276,000 14.9 16.4 (13,000) 27.05 -0.6% -1.3%
NORTHEAST TOTAL/AVERAGE 501,326,000 15.1 15.2 785,000 27.14 1.8% 2.3%
SOUTH
Atlanta, GA 78,622,000 17.4 17.2 352,000 21.64 -0.5% -1.5%
Charleston, SC 3,943,000 10.8 11.5 49,000 23.13 -2.8% 0.3%
Charlotte, NC 18,451,000 16.0 15.6 (13,000) 21.64 0.7% 7.1%
Columbia, SC 888,000 12.9 13.2 81,000 17.46 1.3% 0.6%
Dallas/Fort Worth, TX 91,879,000 16.9 17.0 (70,000) 25.00 1.0% 1.0%
Ft. Lauderdale-Broward, FL 10,739,000 20.0 19.1 352,000 27.68 -0.5% -3.0%
Houston, TX 67,598,000 14.4 12.4 49,000 28.86 5.6% 7.2%
Jacksonville, FL 9,204,000 8.8 10.4 (13,000) 19.98 -1.6% 1.8%
Little Rock, AR 2,847,000 12.3 19.1 81,000 19.14 3.3% 3.3%
Memphis, TN 15,952,000 8.4 8.5 (70,000) 43.34 0.2% 1.9%
Miami-Dade, FL 15,568,000 21.3 20.0 352,000 31.50 0.1% -1.5%
Nashville, TN 13,484,000 6.8 5.3 49,000 21.83 -0.1% -2.3%
Oklahoma City, OK 2,669,000 12.6 8.8 (13,000) 19.91 9.8% N/A
Orlando, FL 16,855,000 19.7 19.1 81,000 21.99 0.0% -2.5%
Raleigh/Durham/Chapel Hill, NC 25,677,000 16.4 15.9 (70,000) 21.53 -1.9% -0.7%
Savannah, GA 490,000 28.0 22.6 352,000 22.62 0.0% N/A
Tampa Bay, FL 23,476,000 16.4 17.3 49,000 23.03 -1.1% -0.1%
West Palm Beach/Palm Beach County, FL 9,175,000 17.9 19.1 (13,000) 30.14 -1.4% -0.3%
SOUTH TOTAL/AVERAGE 407,517,000 15.9 15.5 1,585,000 24.36 1.1% 1.1%
MIDWEST
Chicago, IL 75,536,000 18.2 18.2 (70,000) 27.30 0.4% -0.1%Cincinnati, OH 14,897,000 23.3 19.4 352,000 20.37 -0.6% 1.0%Cleveland, OH 13,174,000 10.9 10.5 49,000 21.23 -2.4% -1.6%Columbus, OH 17,977,000 10.7 10.7 (13,000) 18.31 4.9% 5.6%Detroit, MI 25,548,000 19.6 19.1 81,000 21.33 -0.8% -3.7%
HIGHLIGHTS | Q1 2012 | OFFICE | NORTH AMERICA
COLLIERS INTERNATIONAL | P. 13
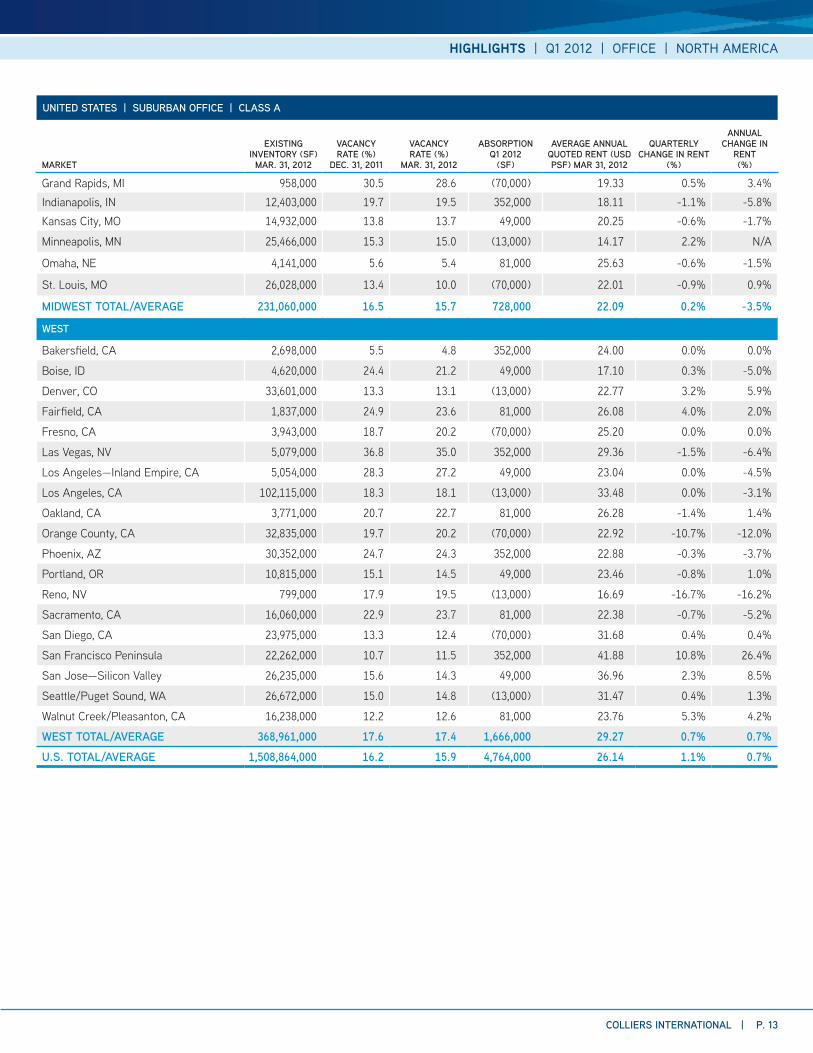
UNITED STATES | SUBURBAN OFFICE | CLASS A
MARKET
EXISTING INVENTORY (SF)
MAR. 31, 2012
VACANCY RATE (%)
DEC. 31, 2011
VACANCY RATE (%)
MAR. 31, 2012
ABSORPTION Q1 2012
(SF)
AVERAGE ANNUAL QUOTED RENT (USD PSF) MAR 31, 2012
QUARTERLY CHANGE IN RENT
(%)
ANNUAL CHANGE IN
RENT (%)
Grand Rapids, MI 958,000 30.5 28.6 (70,000) 19.33 0.5% 3.4%Indianapolis, IN 12,403,000 19.7 19.5 352,000 18.11 -1.1% -5.8%Kansas City, MO 14,932,000 13.8 13.7 49,000 20.25 -0.6% -1.7%
Minneapolis, MN 25,466,000 15.3 15.0 (13,000) 14.17 2.2% N/A
Omaha, NE 4,141,000 5.6 5.4 81,000 25.63 -0.6% -1.5%
St. Louis, MO 26,028,000 13.4 10.0 (70,000) 22.01 -0.9% 0.9%
MIDWEST TOTAL/AVERAGE 231,060,000 16.5 15.7 728,000 22.09 0.2% -3.5%
WEST
Bakersfield, CA 2,698,000 5.5 4.8 352,000 24.00 0.0% 0.0%
Boise, ID 4,620,000 24.4 21.2 49,000 17.10 0.3% -5.0%
Denver, CO 33,601,000 13.3 13.1 (13,000) 22.77 3.2% 5.9%
Fairfield, CA 1,837,000 24.9 23.6 81,000 26.08 4.0% 2.0%
Fresno, CA 3,943,000 18.7 20.2 (70,000) 25.20 0.0% 0.0%
Las Vegas, NV 5,079,000 36.8 35.0 352,000 29.36 -1.5% -6.4%
Los Angeles—Inland Empire, CA 5,054,000 28.3 27.2 49,000 23.04 0.0% -4.5%
Los Angeles, CA 102,115,000 18.3 18.1 (13,000) 33.48 0.0% -3.1%
Oakland, CA 3,771,000 20.7 22.7 81,000 26.28 -1.4% 1.4%
Orange County, CA 32,835,000 19.7 20.2 (70,000) 22.92 -10.7% -12.0%
Phoenix, AZ 30,352,000 24.7 24.3 352,000 22.88 -0.3% -3.7%
Portland, OR 10,815,000 15.1 14.5 49,000 23.46 -0.8% 1.0%
Reno, NV 799,000 17.9 19.5 (13,000) 16.69 -16.7% -16.2%
Sacramento, CA 16,060,000 22.9 23.7 81,000 22.38 -0.7% -5.2%
San Diego, CA 23,975,000 13.3 12.4 (70,000) 31.68 0.4% 0.4%
San Francisco Peninsula 22,262,000 10.7 11.5 352,000 41.88 10.8% 26.4%
San Jose—Silicon Valley 26,235,000 15.6 14.3 49,000 36.96 2.3% 8.5%
Seattle/Puget Sound, WA 26,672,000 15.0 14.8 (13,000) 31.47 0.4% 1.3%
Walnut Creek/Pleasanton, CA 16,238,000 12.2 12.6 81,000 23.76 5.3% 4.2%
WEST TOTAL/AVERAGE 368,961,000 17.6 17.4 1,666,000 29.27 0.7% 0.7%
U.S. TOTAL/AVERAGE 1,508,864,000 16.2 15.9 4,764,000 26.14 1.1% 0.7%
P. 14 | COLLIERS INTERNATIONAL
HIGHLIGHTS | Q1 2012 | OFFICE | NORTH AMERICA
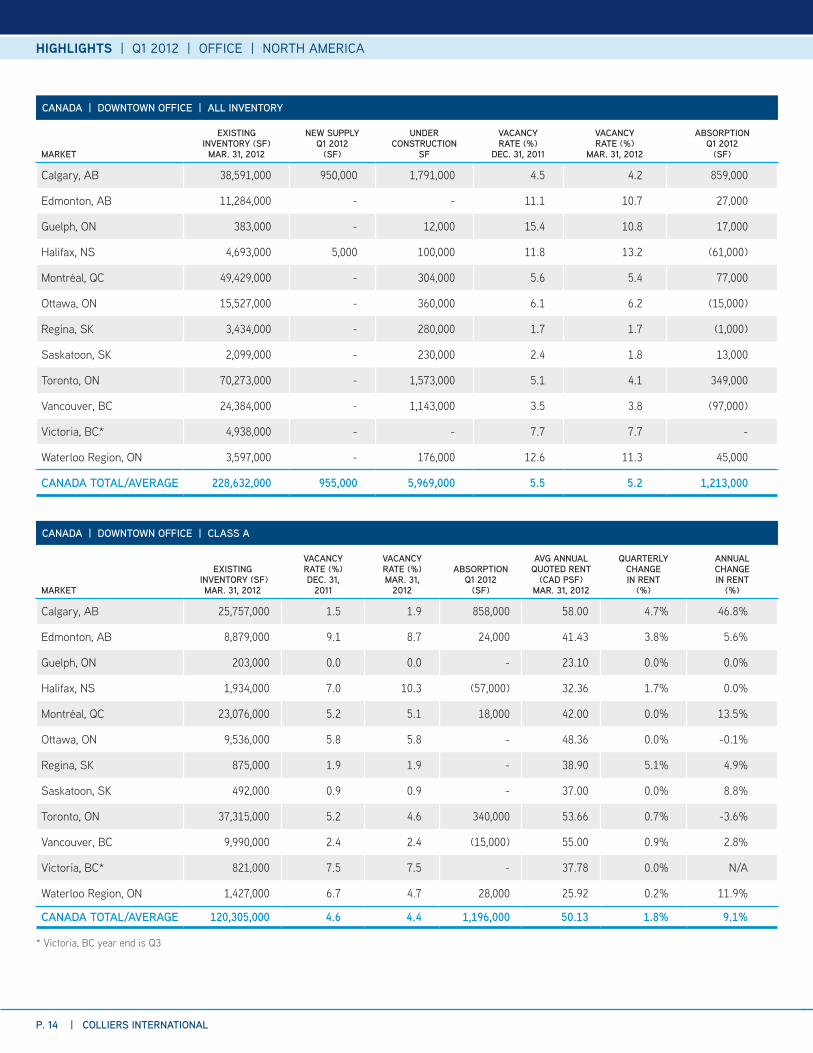
CANADA | DOWNTOWN OFFICE | ALL INVENTORY
MARKET
EXISTING INVENTORY (SF)
MAR. 31, 2012
NEW SUPPLY Q1 2012
(SF)
UNDERCONSTRUCTION
SF
VACANCY RATE (%)
DEC. 31, 2011
VACANCY RATE (%)
MAR. 31, 2012
ABSORPTION Q1 2012
(SF)
Calgary, AB 38,591,000 950,000 1,791,000 4.5 4.2 859,000
Edmonton, AB 11,284,000 - - 11.1 10.7 27,000
Guelph, ON 383,000 - 12,000 15.4 10.8 17,000
Halifax, NS 4,693,000 5,000 100,000 11.8 13.2 (61,000)
Montréal, QC 49,429,000 - 304,000 5.6 5.4 77,000
Ottawa, ON 15,527,000 - 360,000 6.1 6.2 (15,000)
Regina, SK 3,434,000 - 280,000 1.7 1.7 (1,000)
Saskatoon, SK 2,099,000 - 230,000 2.4 1.8 13,000
Toronto, ON 70,273,000 - 1,573,000 5.1 4.1 349,000
Vancouver, BC 24,384,000 - 1,143,000 3.5 3.8 (97,000)
Victoria, BC* 4,938,000 - - 7.7 7.7 -
Waterloo Region, ON 3,597,000 - 176,000 12.6 11.3 45,000
CANADA TOTAL/AVERAGE 228,632,000 955,000 5,969,000 5.5 5.2 1,213,000
CANADA | DOWNTOWN OFFICE | CLASS A
MARKET
EXISTING INVENTORY (SF)
MAR. 31, 2012
VACANCY RATE (%) DEC. 31,
2011
VACANCY RATE (%) MAR. 31,
2012
ABSORPTION Q1 2012
(SF)
AVG ANNUAL QUOTED RENT
(CAD PSF) MAR. 31, 2012
QUARTERLY CHANGE IN RENT
(%)
ANNUAL CHANGE IN RENT
(%)
Calgary, AB 25,757,000 1.5 1.9 858,000 58.00 4.7% 46.8%
Edmonton, AB 8,879,000 9.1 8.7 24,000 41.43 3.8% 5.6%
Guelph, ON 203,000 0.0 0.0 - 23.10 0.0% 0.0%
Halifax, NS 1,934,000 7.0 10.3 (57,000) 32.36 1.7% 0.0%
Montréal, QC 23,076,000 5.2 5.1 18,000 42.00 0.0% 13.5%
Ottawa, ON 9,536,000 5.8 5.8 - 48.36 0.0% -0.1%
Regina, SK 875,000 1.9 1.9 - 38.90 5.1% 4.9%
Saskatoon, SK 492,000 0.9 0.9 - 37.00 0.0% 8.8%
Toronto, ON 37,315,000 5.2 4.6 340,000 53.66 0.7% -3.6%
Vancouver, BC 9,990,000 2.4 2.4 (15,000) 55.00 0.9% 2.8%
Victoria, BC* 821,000 7.5 7.5 - 37.78 0.0% N/A
Waterloo Region, ON 1,427,000 6.7 4.7 28,000 25.92 0.2% 11.9%
CANADA TOTAL/AVERAGE 120,305,000 4.6 4.4 1,196,000 50.13 1.8% 9.1%
* Victoria, BC year end is Q3

HIGHLIGHTS | Q1 2012 | OFFICE | NORTH AMERICA
COLLIERS INTERNATIONAL | P. 15
CANADA | SUBURBAN OFFICE | ALL INVENTORY
MARKET
EXISTING INVENTORY (SF)
MAR. 31, 2012
NEW SUPPLY Q1 2012
(SF)
UNDER CONSTRUCTION
(SF)
VACANCY RATE (%)
DEC. 31, 2011
VACANCY RATE (%)
MAR. 31, 2012
ABSORPTION Q1 2012
(SF)
Calgary, AB 23,800,000 - 1,214,000 9.4 8.4 329,000
Edmonton, AB 8,993,000 85,000 279,000 13.0 11.9 137,000
Guelph, ON 1,383,000 - - 4.4 4.7 (4,000)
Halifax, NS 6,668,000 256,000 130,000 10.0 11.9 101,000
Montréal, QC 23,771,000 - 298,000 9.8 8.6 182,000
Ottawa, ON 21,008,000 36,000 122,000 8.1 8.5 (97,000)
Regina, SK 678,000 - - 0.1 0.1 -
Toronto, ON 68,278,000 104,000 664,000 7.0 6.5 454,000
Vancouver, BC 27,678,000 200,000 1,141,000 10.9 11.2 82,000
Victoria, BC* 3,593,000 - 95,000 9.1 9.1 -
Waterloo Region, ON 6,732,000 322,000 207,000 12.9 12.0 329,000
CANADA TOTAL/AVERAGE 192,582,000 1,003,000 4,150,000 8.9 8.5 1,513,000
CANADA | SUBURBAN OFFICE | CLASS A
MARKET
EXISTING INVENTORY (SF)
MAR. 31, 2012
VACANCY RATE (%) DEC. 31,
2011
VACANCY RATE (%) MAR. 31,
2011
ABSORPTION Q1 2012
(SF)
AVERAGE ANNUAL QUOTED RENT
(CAD PSF) MAR. 31, 2012
QUARTERLY CHANGE IN RENT
(%)
ANNUAL CHANGE IN RENT
(%)
Calgary, AB 11,104,366 7.8 6.6 145,792 42.00 2.4% 13.5%
Edmonton, AB 847,668 3.0 4.0 - 25.96 0.6% 1.4%
Guelph, ON 2,739,210 8.6 9.7 (8,440) 29.48 4.8% 4.1%
Halifax, NS 13,336,192 8.0 7.1 28,702 28.00 0.0% -6.7%
Montréal, QC 11,980,116 8.5 8.6 124,861 31.26 0.0% -4.3%
Ottawa, ON 677,530 0.1 0.1 (18,493) 28.50 0.0% 0.0%
Regina, SK 31,029,906 8.3 7.1 - 29.57 0.7% -2.8%
Toronto, ON 13,426,379 11.5 12.2 238,752 36.25 0.7% -5.8%
Vancouver, BC 817,488 8.7 8.7 52,594 40.00 0.0% N/A
Victoria, BC* 3,174,920 16.3 16.3 - 24.20 -0.7% 5.1%
Waterloo Region, ON 89,133,775 8.8 8.4 270,813 31.98 0.8% 0.4%
Canada Total 89,133,775 8.8 8.4 834,581 31.98 0.8% .4%
Inventory – Includes all existing multi- or single-tenant leased and owner-occupied office properties greater than or equal to 10,000 square feet (net rentable area). In some larger markets this minimum size threshold may vary up to 50,000 square feet. Does not include medical or government buildings.
Vacancy Rate – Percentage of total inventory physically vacant as of the survey date, including direct vacant and sublease space.
Absorption – Net change in physically occupied space over a given period of time.
New Supply – Includes completed speculative and build-to-suit construction. New supply quoted on a net basis after any demolitions or conversions.
Annual Quoted Rent – Includes all costs associated with occupying a full floor in the mid-rise portion of a Class A building, inclusive of taxes, insurance, maintenance, janitorial and utilities (electricity surcharges added where applicable). All office rents in this report are quoted on an annual, gross per square foot basis. Rent calculations do not include sublease space.
Cap Rate – (Or going-in cap rate) Capitalization rates in this survey are based on multi-tenant institutional grade buildings fully leased at market rents. Cap rates are calculated by dividing net operating income (NOI) by purchase price.
Note: SF = square feet MSF = million square feet
PSF = per square foot CBD = central business district
Glossary
* Victoria, BC year end is Q3
HIGHLIGHTS | Q1 2012 | OFFICE | NORTH AMERICA
WWW.COLLIERS.COM
COLLIERS INTERNATIONAL
601 Union Street, Suite 4800Seattle, WA 98101TEL +1 206 695 4200
FOR MORE INFORMATION
K.C. ConwayEMD Market Analytics | USATEL +1 678 458 3477EMAIL [email protected]
Jeff SimonsonSenior Research Analyst | USATEL +1 760 930 7941EMAIL [email protected]
Cliff PlankNational Director | GIS & MappingTEL +1 602 222 5183EMAIL [email protected]
Lauren ChlebowskiGlobal Brand Designer | Global Marketing
James CookDirector of Research | USATEL +1 602 633 4061EMAIL [email protected]
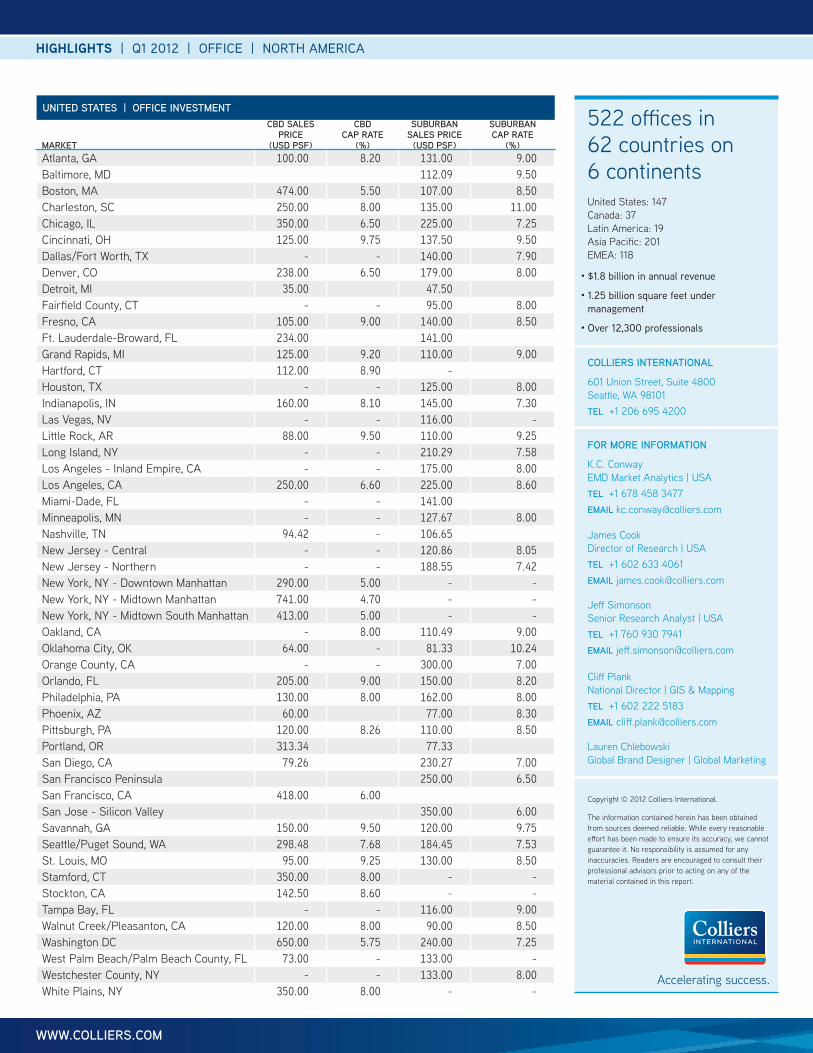
522 offices in 62 countries on 6 continentsUnited States: 147Canada: 37Latin America: 19Asia Pacific: 201EMEA: 118
• $1.8 billion in annual revenue
• 1.25 billion square feet under management
• Over 12,300 professionals
Copyright © 2012 Colliers International.
The information contained herein has been obtained from sources deemed reliable. While every reasonable effort has been made to ensure its accuracy, we cannot guarantee it. No responsibility is assumed for any inaccuracies. Readers are encouraged to consult their professional advisors prior to acting on any of the material contained in this report.
Accelerating success.
UNITED STATES | OFFICE INVESTMENT
MARKET
CBD SALES PRICE
(USD PSF)
CBD CAP RATE
(%)
SUBURBAN SALES PRICE
(USD PSF)
SUBURBAN CAP RATE
(%)Atlanta, GA 100.00 8.20 131.00 9.00 Baltimore, MD 112.09 9.50 Boston, MA 474.00 5.50 107.00 8.50 Charleston, SC 250.00 8.00 135.00 11.00 Chicago, IL 350.00 6.50 225.00 7.25 Cincinnati, OH 125.00 9.75 137.50 9.50 Dallas/Fort Worth, TX - - 140.00 7.90 Denver, CO 238.00 6.50 179.00 8.00 Detroit, MI 35.00 47.50 Fairfield County, CT - - 95.00 8.00 Fresno, CA 105.00 9.00 140.00 8.50 Ft. Lauderdale-Broward, FL 234.00 141.00 Grand Rapids, MI 125.00 9.20 110.00 9.00Hartford, CT 112.00 8.90 -Houston, TX - - 125.00 8.00 Indianapolis, IN 160.00 8.10 145.00 7.30 Las Vegas, NV - - 116.00 -Little Rock, AR 88.00 9.50 110.00 9.25 Long Island, NY - - 210.29 7.58 Los Angeles - Inland Empire, CA - - 175.00 8.00 Los Angeles, CA 250.00 6.60 225.00 8.60 Miami-Dade, FL - - 141.00 Minneapolis, MN - - 127.67 8.00 Nashville, TN 94.42 - 106.65 New Jersey - Central - - 120.86 8.05 New Jersey - Northern - - 188.55 7.42 New York, NY - Downtown Manhattan 290.00 5.00 - -New York, NY - Midtown Manhattan 741.00 4.70 - -New York, NY - Midtown South Manhattan 413.00 5.00 - -Oakland, CA - 8.00 110.49 9.00 Oklahoma City, OK 64.00 - 81.33 10.24 Orange County, CA - - 300.00 7.00 Orlando, FL 205.00 9.00 150.00 8.20 Philadelphia, PA 130.00 8.00 162.00 8.00 Phoenix, AZ 60.00 77.00 8.30 Pittsburgh, PA 120.00 8.26 110.00 8.50 Portland, OR 313.34 77.33 San Diego, CA 79.26 230.27 7.00 San Francisco Peninsula 250.00 6.50 San Francisco, CA 418.00 6.00 San Jose - Silicon Valley 350.00 6.00 Savannah, GA 150.00 9.50 120.00 9.75 Seattle/Puget Sound, WA 298.48 7.68 184.45 7.53 St. Louis, MO 95.00 9.25 130.00 8.50 Stamford, CT 350.00 8.00 - -Stockton, CA 142.50 8.60 - -Tampa Bay, FL - - 116.00 9.00 Walnut Creek/Pleasanton, CA 120.00 8.00 90.00 8.50 Washington DC 650.00 5.75 240.00 7.25 West Palm Beach/Palm Beach County, FL 73.00 - 133.00 -Westchester County, NY - - 133.00 8.00 White Plains, NY 350.00 8.00 - -
Related Documents