NORSK Field Development & Technology MANUAL HYDRO Reservoir Technology PVT ANALYSIS Chapter 1 About the Manual Rev. 0.6 Page 1 November 1998 1. ABOUT THE MANUAL 1.1 Introduction 1.1.1 Objectives The objective with this manual is to help reservoir engineers to plan, define, initiate, follow up and quality-control fluid samples and PVT analyses. In addition, guidelines are given to assemble, compare, and apply PVT data for input to reservoir calculations, e.g. fluid characterization, "quick-look" material balance calculations, black-oil and compositional reservoir simulation, well test analysis, process simulation, etc. 1.1.2 How to Use the Manual Engineers with little or no experience in fluid sampling, PVT analysis, and equation of state (EOS) simulation, should read this manual carefully. The main body of the manual may not include all the general background material required. However, selected PVT references are enclosed in the manual. The experienced engineer familiar with PVT may use this manual as a reference on the following subjects: Fluid Sampling and Laboratory Analyses Chapters 2 and 3 assist in how to design, initiate, follow up, and quality- control fluid samples and PVT analysis of laboratory data. Chapter 3 summarizes the sampling procedures used to collect fluids and the experimental methods used to measure fluid properties. Procedures and recommendations related to initiating fluid sampling and PVT analyses are presented in Chapter 2. We urge the engineers to use the order forms included for fluid sampling, compositional analyses, and PVT studies. PVT Requirements/Oil and Gas Correlations Chapter 4 summarizes PVT requirements and correlations. This chapter is useful as a reference for engineers working with prospect evaluation, where measured PVT data are often unavailable and must be calculated from correlations. Engineers who already use certain PVT correlations (e.g. on a spreadsheet) may find useful the discussions related to each correlation. Example Calculations: Correlations and EOS Simulation Perhaps the most important contribution of this manual are the example calculations in Chapter 5. The examples are based on several different fluid systems from the Visund field: Brent North II oil, gas and water samples, Statfjord undersaturated oil samples, and Lunde condensate samples. Oil and gas PVT properties for Brent North are calculated from correlations in

Welcome message from author
This document is posted to help you gain knowledge. Please leave a comment to let me know what you think about it! Share it to your friends and learn new things together.
Transcript
NORSK Field Development & Technology MANUALHYDRO Reservoir Technology PVT ANALYSIS
Chapter 1 About the Manual Rev. 0.6Page 1November 1998
1. ABOUT THE MANUAL
1.1 Introduction
1.1.1 ObjectivesThe objective with this manual is to help reservoir engineers to plan, define,initiate, follow up and quality-control fluid samples and PVT analyses. Inaddition, guidelines are given to assemble, compare, and apply PVT data forinput to reservoir calculations, e.g. fluid characterization, "quick-look" materialbalance calculations, black-oil and compositional reservoir simulation, well testanalysis, process simulation, etc.
1.1.2 How to Use the ManualEngineers with little or no experience in fluid sampling, PVT analysis, andequation of state (EOS) simulation, should read this manual carefully. The mainbody of the manual may not include all the general background materialrequired. However, selected PVT references are enclosed in the manual.
The experienced engineer familiar with PVT may use this manual as areference on the following subjects:
Fluid Sampling and Laboratory AnalysesChapters 2 and 3 assist in how to design, initiate, follow up, and quality- controlfluid samples and PVT analysis of laboratory data. Chapter 3 summarizes thesampling procedures used to collect fluids and the experimental methods used tomeasure fluid properties. Procedures and recommendations related to initiatingfluid sampling and PVT analyses are presented in Chapter 2. We urge theengineers to use the order forms included for fluid sampling, compositionalanalyses, and PVT studies.
PVT Requirements/Oil and Gas CorrelationsChapter 4 summarizes PVT requirements and correlations. This chapter isuseful as a reference for engineers working with prospect evaluation, wheremeasured PVT data are often unavailable and must be calculated fromcorrelations. Engineers who already use certain PVT correlations (e.g. on aspreadsheet) may find useful the discussions related to each correlation.
Example Calculations: Correlations and EOS SimulationPerhaps the most important contribution of this manual are the examplecalculations in Chapter 5. The examples are based on several different fluidsystems from the Visund field: Brent North II oil, gas and water samples,Statfjord undersaturated oil samples, and Lunde condensate samples.
Oil and gas PVT properties for Brent North are calculated from correlations in
NORSK Field Development & Technology MANUALHYDRO Reservoir Technology PVT ANALYSIS
Chapter 1 About the Manual Rev. 0.6Page 2November 1998
Sections 5.2 and 5.3. Section 5.4 gives a short discussion of the steps involvedin using an equation of state model, and how the program PVTx (or a similarprogram) handles the various steps in an EOS characterization. Examplecalculations using an EOS model are presented in Sections 5.5-5.8, includingPVTx input files. These examples include EOS predictions, CN+
characterization using TBP data, regression, pseudoization, generation ofmodified BO parameters, slim-tube simulations, and compositional gradients.
1.2 Other Norsk Hydro Manuals Related to PVT
1.2.1 Well Test ManualProduction Technology F&T has generated an internal manual on well testplanning and operations. The manual includes procedures and description oftools used for fluid sampling, and this manual is recommended for engineersordering and planning fluid sampling.
1.2.2 Reservoir Simulation ManualReservoir Technology F&T has recently completed a reservoir simulationmanual including a short description of the PVT input required for Eclipse 100.
The ECLIPSE 200 options, e.g. Solvent- (Todd-Longstaff), GI-, and Polymer-options have recently been described in a report which also specifies the requiredPVT input.
1.2.3 Manual for Laboratory PVT AnalysisA manual for laboratory PVT analysis exists at the Fluid Laboratory Departmentat the U&P Research Centre in Bergen. This manual gives detailed proceduresfor performing various PVT experiments and compositional analyses. Standardmethods for measuring physical properties, and the accuracy of measured dataare also included.
1.3 PVT Manual RevisionsThis manual is not yet fully complete. Special PVT experiments like swelling,multi-contact gas injection and slim-tube experiments are yet to be described.
A library of programs related to fluid analysis and EOS simulation will laterbe organized and described in this manual. Also, as new methods and toolsbecome available, descriptions of these will be added to the manual.
NORSK Field Development & Technology MANUALHYDRO Reservoir Technology PVT ANALYSIS
Chapter 2 Initiating a PVT Study Rev. 0.6Page 1November 1998
2. INITIATING A PVT STUDY
2.1 Ordering a PVT Study
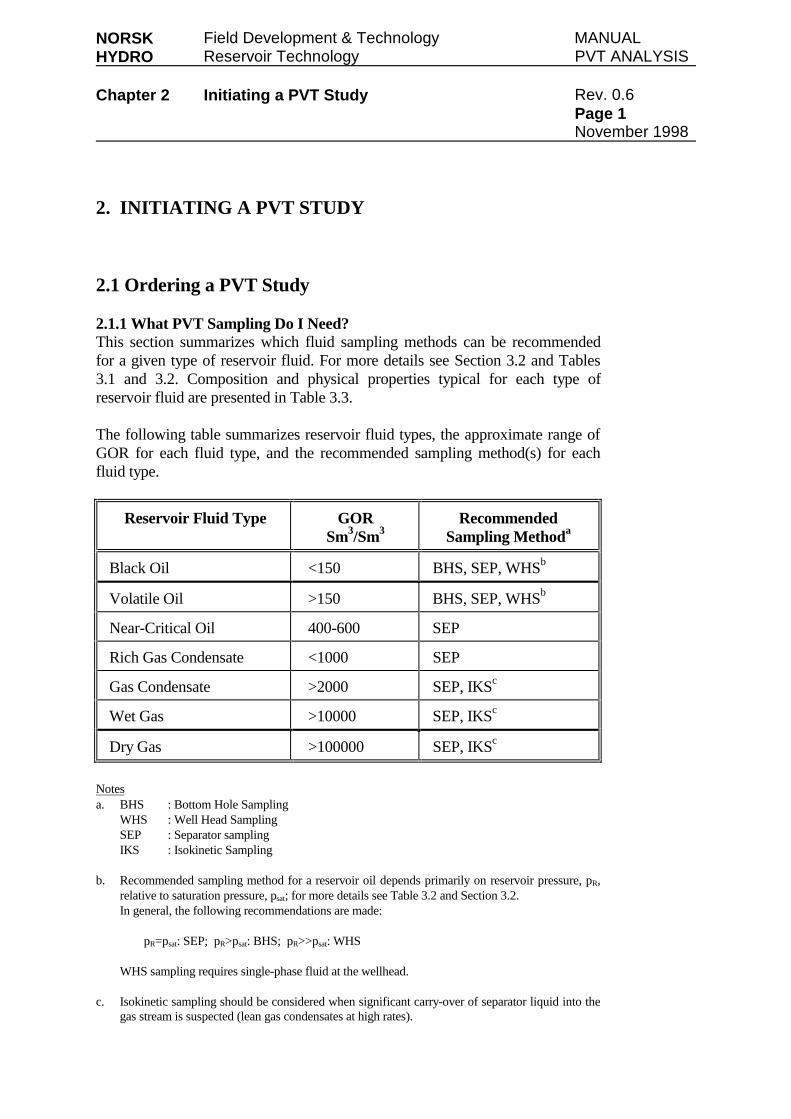
2.1.1 What PVT Sampling Do I Need?This section summarizes which fluid sampling methods can be recommendedfor a given type of reservoir fluid. For more details see Section 3.2 and Tables3.1 and 3.2. Composition and physical properties typical for each type ofreservoir fluid are presented in Table 3.3.
The following table summarizes reservoir fluid types, the approximate range ofGOR for each fluid type, and the recommended sampling method(s) for eachfluid type.
Reservoir Fluid Type GORSm3/Sm3
RecommendedSampling Methoda
Black Oil <150 BHS, SEP, WHSb
Volatile Oil >150 BHS, SEP, WHSb
Near-Critical Oil 400-600 SEP
Rich Gas Condensate <1000 SEP
Gas Condensate >2000 SEP, IKSc
Wet Gas >10000 SEP, IKSc
Dry Gas >100000 SEP, IKSc
Notesa. BHS : Bottom Hole Sampling
WHS : Well Head SamplingSEP : Separator samplingIKS : Isokinetic Sampling
b. Recommended sampling method for a reservoir oil depends primarily on reservoir pressure, pR,relative to saturation pressure, psat; for more details see Table 3.2 and Section 3.2.In general, the following recommendations are made:
pR=psat: SEP; pR>psat: BHS; pR>>psat: WHS
WHS sampling requires single-phase fluid at the wellhead.
c. Isokinetic sampling should be considered when significant carry-over of separator liquid into thegas stream is suspected (lean gas condensates at high rates).

NORSK Field Development & Technology MANUALHYDRO Reservoir Technology PVT ANALYSIS
Chapter 2 Initiating a PVT Study Rev. 0.6Page 2November 1998
2.1.2 Summary of Available PVT StudiesThis section summarizes the standard PVT studies that are available at PVTlaboratories (Norsk Hydro in-house and commercial labs).
An overview of the standard PVT experiments is given on the following pages. The summary tables focus on the objectives of each experiment, measured andcalculated data resulting from the experiment (non-standard data, with addedcost, are noted in brackets []), and finally, the cost and time required to performan experiment are given. For a detailed description of each experiment, seeSection 3.4.
2.1.3 What PVT Studies Do I Need?This section defines the standard PVT experiments that are recommended for a given type ofreservoir fluid. Which experiment to perform is to some extent dependent on the developmentphase of the well/field. When the well is an appraisal well, the fluid sampling and PVT programmay be less extensive.
Reservoir FluidType
BHS/SEPComp.
TBP DLE CCE CVD SST MST
Black Oil • m • • N • •
Volatile Oil • m • • N • •
Near-Critical Oil • m m • • • •
Rich Gas Cond. • m N • • • m
Gas Condensate • m N • • • m
Wet Gas • m N • N • N
Dry Gas • N N • N • N
Water m N N m N m N
Note: • standard experiment m can be performed N not performed
NORSK Field Development & Technology MANUALHYDRO Reservoir Technology PVT ANALYSIS
Chapter 2 Initiating a PVT Study Rev. 0.6Page 3November 1998
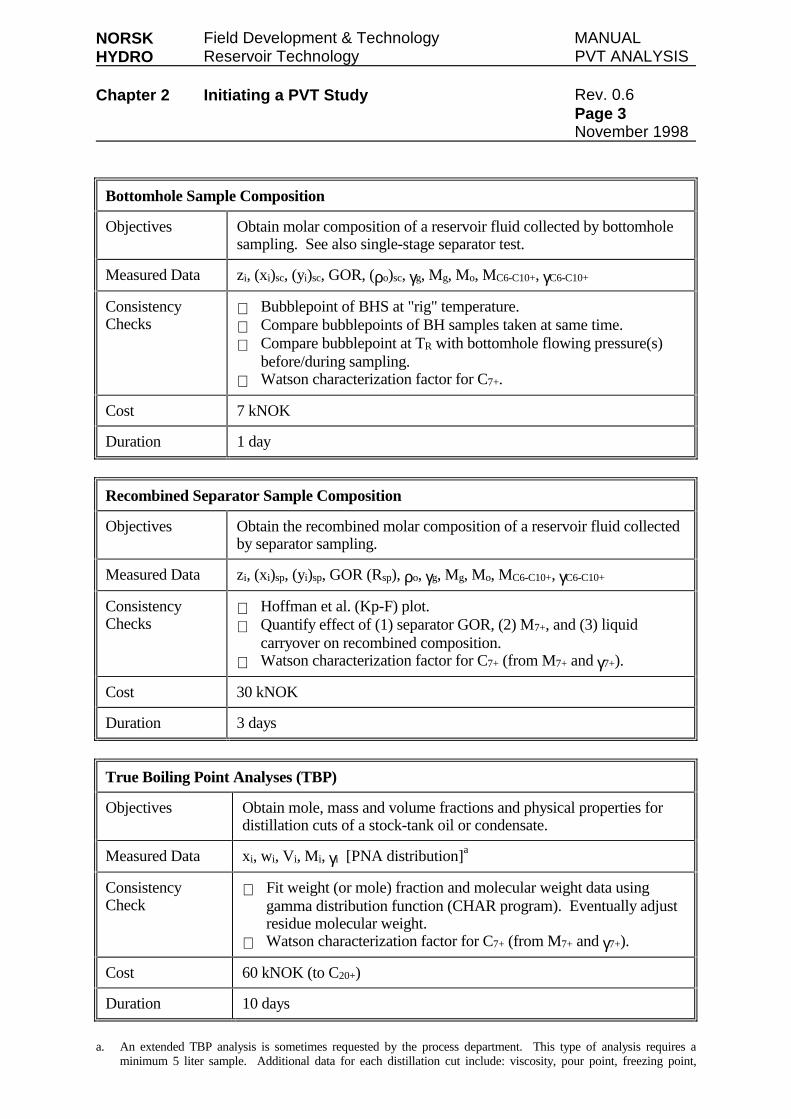
Bottomhole Sample Composition
Objectives Obtain molar composition of a reservoir fluid collected by bottomholesampling. See also single-stage separator test.
Measured Data zi, (xi)sc, (yi)sc, GOR, (ρo)sc, γg, Mg, Mo, MC6-C10+, γC6-C10+
ConsistencyChecks
⋅ Bubblepoint of BHS at "rig" temperature.⋅ Compare bubblepoints of BH samples taken at same time.⋅ Compare bubblepoint at TR with bottomhole flowing pressure(s)
before/during sampling.⋅ Watson characterization factor for C7+.
Cost 7 kNOK
Duration 1 day
Recombined Separator Sample Composition
Objectives Obtain the recombined molar composition of a reservoir fluid collectedby separator sampling.
Measured Data zi, (xi)sp, (yi)sp, GOR (Rsp), ρo, γg, Mg, Mo, MC6-C10+, γC6-C10+
ConsistencyChecks
⋅ Hoffman et al. (Kp-F) plot.⋅ Quantify effect of (1) separator GOR, (2) M7+, and (3) liquid
carryover on recombined composition.⋅ Watson characterization factor for C7+ (from M7+ and γ7+).
Cost 30 kNOK
Duration 3 days
True Boiling Point Analyses (TBP)
Objectives Obtain mole, mass and volume fractions and physical properties fordistillation cuts of a stock-tank oil or condensate.
Measured Data xi, wi, Vi, Mi, γi [PNA distribution]a
ConsistencyCheck
⋅ Fit weight (or mole) fraction and molecular weight data usinggamma distribution function (CHAR program). Eventually adjustresidue molecular weight.
⋅ Watson characterization factor for C7+ (from M7+ and γ7+).
Cost 60 kNOK (to C20+)
Duration 10 days
a. An extended TBP analysis is sometimes requested by the process department. This type of analysis requires aminimum 5 liter sample. Additional data for each distillation cut include: viscosity, pour point, freezing point,

NORSK Field Development & Technology MANUALHYDRO Reservoir Technology PVT ANALYSIS
Chapter 2 Initiating a PVT Study Rev. 0.6Page 4November 1998
refractive index, and enthalpy.
NORSK Field Development & Technology MANUALHYDRO Reservoir Technology PVT ANALYSIS
Chapter 2 Initiating a PVT Study Rev. 0.6Page 5November 1998
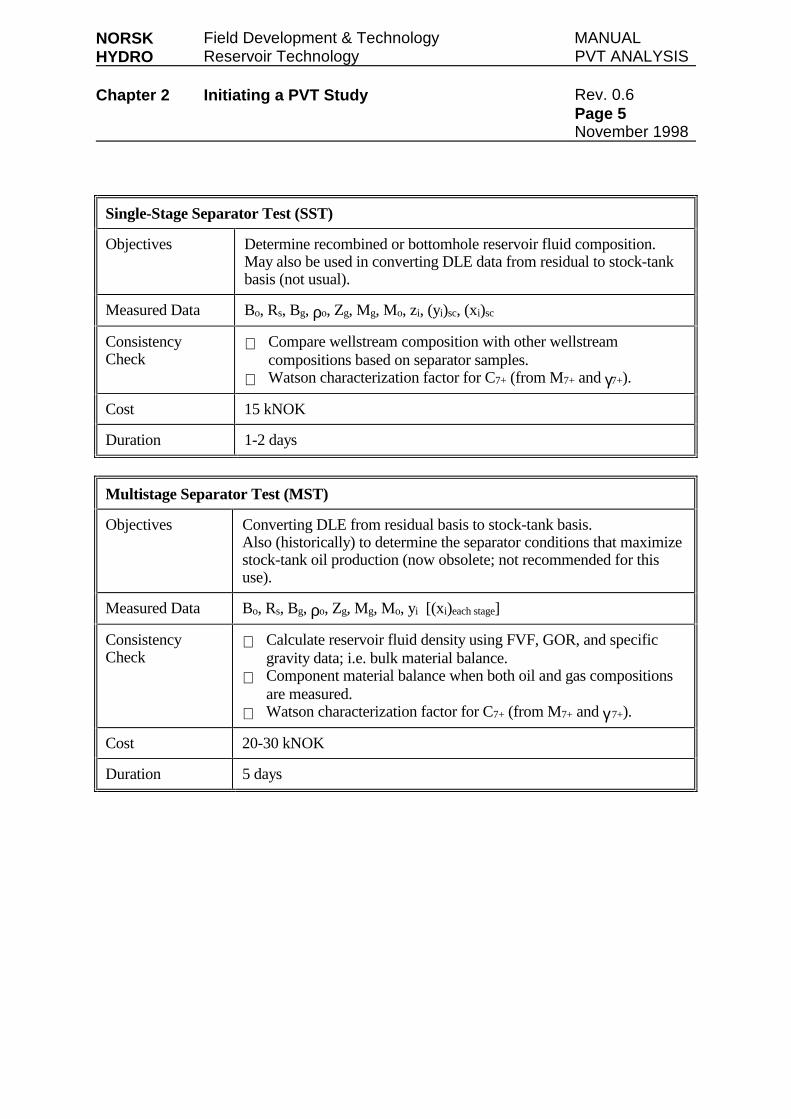
Single-Stage Separator Test (SST)
Objectives Determine recombined or bottomhole reservoir fluid composition.May also be used in converting DLE data from residual to stock-tankbasis (not usual).
Measured Data Bo, Rs, Bg, ρo, Zg, Mg, Mo, zi, (yi)sc, (xi)sc
ConsistencyCheck
⋅ Compare wellstream composition with other wellstreamcompositions based on separator samples.
⋅ Watson characterization factor for C7+ (from M7+ and γ7+).
Cost 15 kNOK
Duration 1-2 days
Multistage Separator Test (MST)
Objectives Converting DLE from residual basis to stock-tank basis.Also (historically) to determine the separator conditions that maximizestock-tank oil production (now obsolete; not recommended for thisuse).
Measured Data Bo, Rs, Bg, ρo, Zg, Mg, Mo, yi [(xi)each stage]
ConsistencyCheck
⋅ Calculate reservoir fluid density using FVF, GOR, and specificgravity data; i.e. bulk material balance.
⋅ Component material balance when both oil and gas compositionsare measured.
⋅ Watson characterization factor for C7+ (from M7+ and γ 7+).
Cost 20-30 kNOK
Duration 5 days

NORSK Field Development & Technology MANUALHYDRO Reservoir Technology PVT ANALYSIS
Chapter 2 Initiating a PVT Study Rev. 0.6Page 6November 1998
Constant Volume Depletion (CVD):
Objectives Provides volumetric and compositional data for gas condensate andvolatile oil reservoirs producing by pressure depletion.
Measured Data psat, Vro, Gp, Zg, g, yi, MgN+, γ gN+ [(xi)last stage]
ConsistencyCheck
⋅ Component and bulk material balance (see Whitson and Torp,1983).
⋅ K-value (Kp-F) plots based on material balance results.⋅ Compare relative oil volume data with CCE relative oil volume
data.⋅ Plot data versus pressure to identify erroneous data (data not
following physically acceptable trends).
Cost 65 kNOK
Duration 10 days
Constant Composition Expansions (CCE) - Gas Condensates
Objectives Determine dewpoint pressure and volumetric properties at reservoirtemperature (and eventually at other lower temperatures).
Measured Data pd, Vro, Vrt, Zg, g, Bgw
ConsistencyCheck
⋅ Compare reported Z-factors with values calculated fromcomposition and the Standing-Katz chart (p≥pd).
⋅ Plot data versus pressure to identify erroneous data (data notfollowing physically acceptable trends).
Cost 20 kNOK
Duration 3 days
NORSK Field Development & Technology MANUALHYDRO Reservoir Technology PVT ANALYSIS
Chapter 2 Initiating a PVT Study Rev. 0.6Page 7November 1998
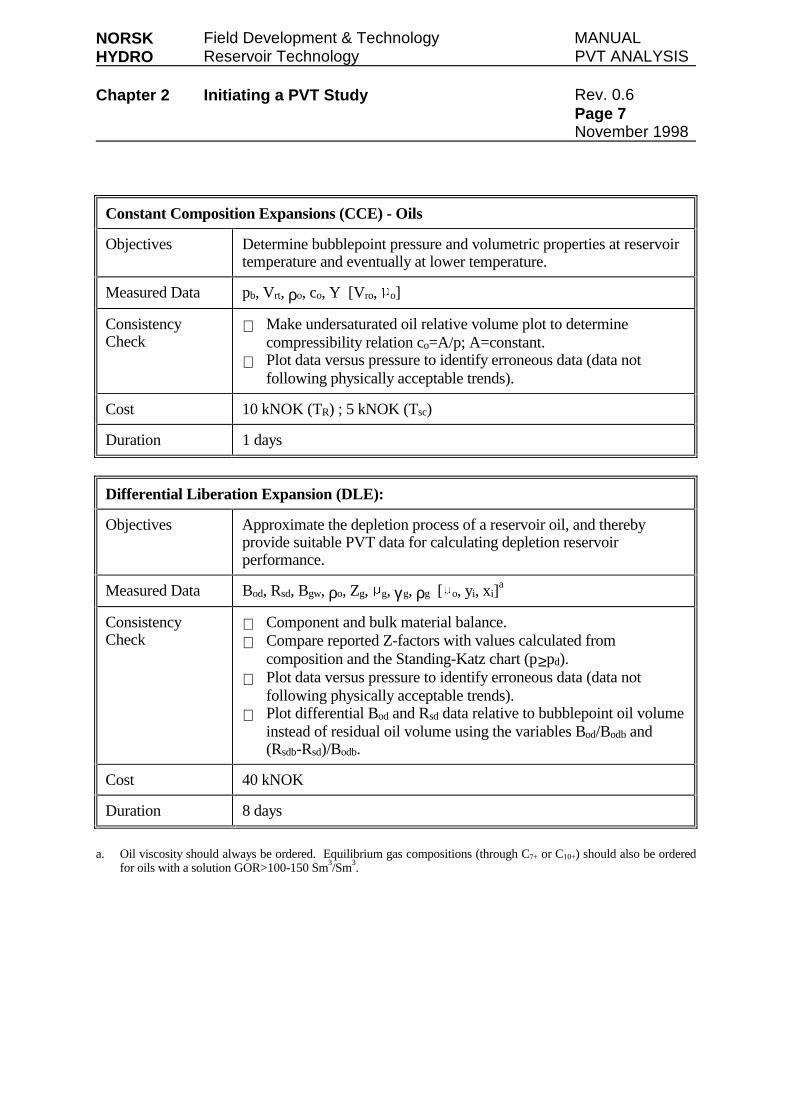
Constant Composition Expansions (CCE) - Oils
Objectives Determine bubblepoint pressure and volumetric properties at reservoirtemperature and eventually at lower temperature.
Measured Data pb, Vrt, ρo, co, Y [Vro, o]
ConsistencyCheck
⋅ Make undersaturated oil relative volume plot to determinecompressibility relation co=A/p; A=constant.
⋅ Plot data versus pressure to identify erroneous data (data notfollowing physically acceptable trends).
Cost 10 kNOK (TR) ; 5 kNOK (Tsc)
Duration 1 days
Differential Liberation Expansion (DLE):
Objectives Approximate the depletion process of a reservoir oil, and therebyprovide suitable PVT data for calculating depletion reservoirperformance.
Measured Data Bod, Rsd, Bgw, ρo, Zg, g, γ g, ρg [ o, yi, xi]a
ConsistencyCheck
⋅ Component and bulk material balance.⋅ Compare reported Z-factors with values calculated from
composition and the Standing-Katz chart (p≥pd).⋅ Plot data versus pressure to identify erroneous data (data not
following physically acceptable trends).⋅ Plot differential Bod and Rsd data relative to bubblepoint oil volume
instead of residual oil volume using the variables Bod/Bodb and(Rsdb-Rsd)/Bodb.
Cost 40 kNOK
Duration 8 days
a. Oil viscosity should always be ordered. Equilibrium gas compositions (through C7+ or C10+) should also be orderedfor oils with a solution GOR>100-150 Sm3/Sm3.
NORSK Field Development & Technology MANUALHYDRO Reservoir Technology PVT ANALYSIS
Chapter 2 Initiating a PVT Study Rev. 0.6Page 8November 1998
2.1.4 Contact & Cooperation with Other Engineering GroupsWhen ordering PVT sampling and analyses, Reservoir Technology R&Tcooperates with Production Technology and Process Technology to collectsamples for analyses performed by these departments.
Fluid analyses performed or purchased by other departments may include:
Production Technology:• Wax Point, Hydrate and Asphaltene Analyses (large separator samples
required)• Formation Water/Brine Analyses
Process Technology:• TBP-Analyses with high-temperature cuts (minimum 5 liter sample)• CCEs specified at temperatures lower than reservoir temperature for
process simulation (also ordered by Reservoir Technology and used byProduction Technology in well hydraulics)
Production Geology: • Formation water/brine resistivity for petrophysical analyses• Geochemical analyses of collected fluids (natural tracers, Strontium-
isotope analyses, etc.)
Most of these special studies require large samples of separator or tank oil.
Design and planning of fluid sampling in cooperation with the departmentresponsible for well testing is important. Well test design and samplepreparations that may affect sampling should be discussed and included in plansbefore sampling is performed.
Handling and transportation of the sample bottles after sampling should also bediscussed. Wax-, hydrate- and asphaltene analyses may be adversely affected ifthe temperature of the sample bottles drop below about 30oC (even for a shortperiod).
2.1.5 Forms for Ordering Standard PVT StudiesSpecial forms have been generated for planning and ordering PVT samples andanalyses. Use of these forms (which are divided into three parts) isrecommended. The three parts are:
Part I describes fluid sampling (formations, conditions, methods) and quality control of the samples collected.
Part II describes compositional analyses of the samples collected. Someguidelines for quality control of compositional analyses are also discussed.Part III specifies which PVT experiments should be performed, andrecommended design of the experiments (number of pressure steps, whichproperties to measure, etc.).
NORSK Field Development & Technology MANUALHYDRO Reservoir Technology PVT ANALYSIS
Chapter 2 Initiating a PVT Study Rev. 0.6Page 9November 1998
The laboratory chosen to perform the PVT analyses should present a qualitycontrol of Part I before continuing to Parts II and III. This will ensure thatcompositional analyses and PVT experiments to be performed are based on thesample(s) considered most representative for the actual formation(s). Thepurchaser should also require a preliminary report of Part II results beforecontinuing with Part III.
It is also important that the reservoir-, production-, and process engineers alltake part in filling out the forms, and eventually approve the plans for samplingand analyses by signing the forms (page 1).
2.1.6 Ordering Special PVT StudiesSpecial PVT studies like Swelling Experiments, Multi-Contact Gas InjectionExperiments and Slimtube Experiments should be designed and ordered incooperation with PVT specialists. These experiments are considered importantfor evaluation of EOR methods such as miscible and immiscible gas injection,and WAG (water-alternating gas).
2.1.7 Following Up an Ongoing PVT StudyThe order form discussed in Section 2.1.5 includes a few hints regarding followup of an ongoing PVT study. Some suggestions are:
• Stay in contact with the PVT laboratory during all phases of the study.
• Remind the PVT laboratory to respond back after quality control of samplebottles, to ensure that the PVT study will be continued based on the bestsamples.
• Remind the PVT laboratory to respond back after the compositional analyseshave been performed and quality checked. The PVT laboratory should askfor your permission before they initiate the PVT experiments (i.e. theyshould not start before the compositional analyses have been approved).
• Ask the PVT laboratory for all measured data; sometimes even "raw-data"may be needed to check questionable reported data.
NORSK Field Development & Technology MANUALHYDRO Reservoir Technology PVT ANALYSIS
Chapter 2 Initiating a PVT Study Rev. 0.6Page 11November 1998
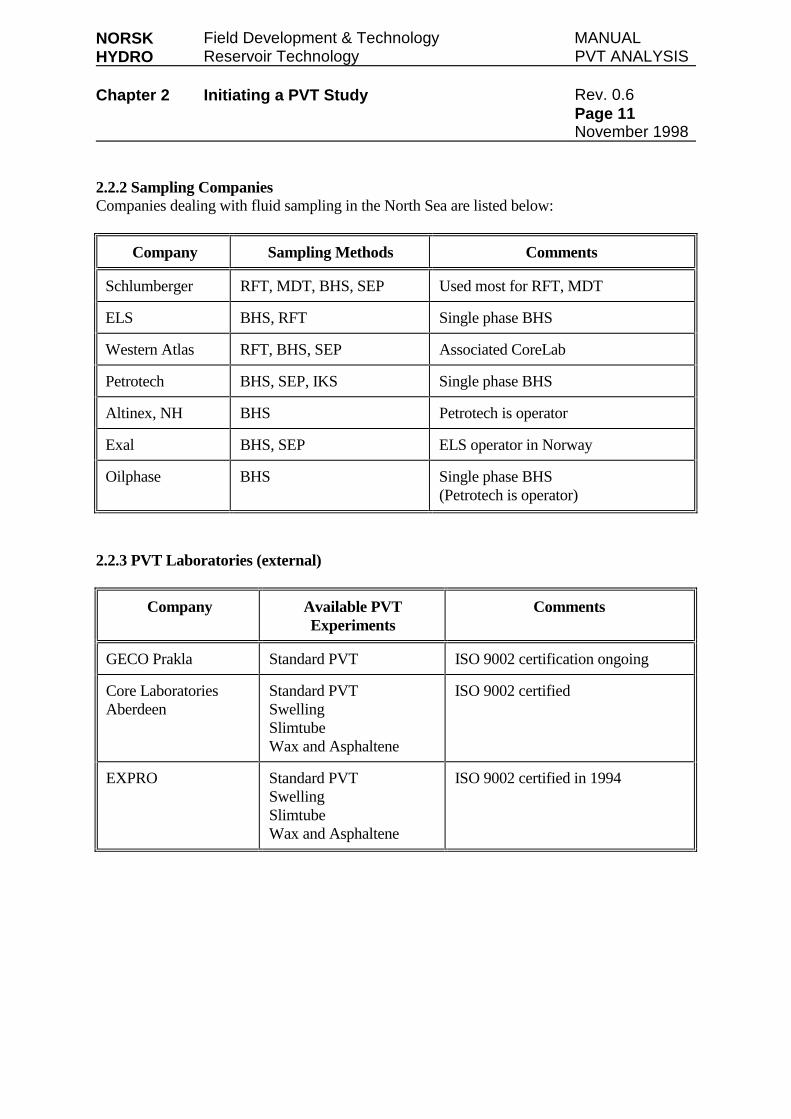
2.2.2 Sampling CompaniesCompanies dealing with fluid sampling in the North Sea are listed below:
Company Sampling Methods Comments
Schlumberger RFT, MDT, BHS, SEP Used most for RFT, MDT
ELS BHS, RFT Single phase BHS
Western Atlas RFT, BHS, SEP Associated CoreLab
Petrotech BHS, SEP, IKS Single phase BHS
Altinex, NH BHS Petrotech is operator
Exal BHS, SEP ELS operator in Norway
Oilphase BHS Single phase BHS(Petrotech is operator)
2.2.3 PVT Laboratories (external)
Company Available PVTExperiments
Comments
GECO Prakla Standard PVT ISO 9002 certification ongoing
Core LaboratoriesAberdeen
Standard PVTSwellingSlimtubeWax and Asphaltene
ISO 9002 certified
EXPRO Standard PVTSwellingSlimtubeWax and Asphaltene
ISO 9002 certified in 1994
NORSK Field Development & Technology MANUALHYDRO Reservoir Technology PVT ANALYSIS
Chapter 2 Initiating a PVT Study Rev. 0.6Page 12November 1998
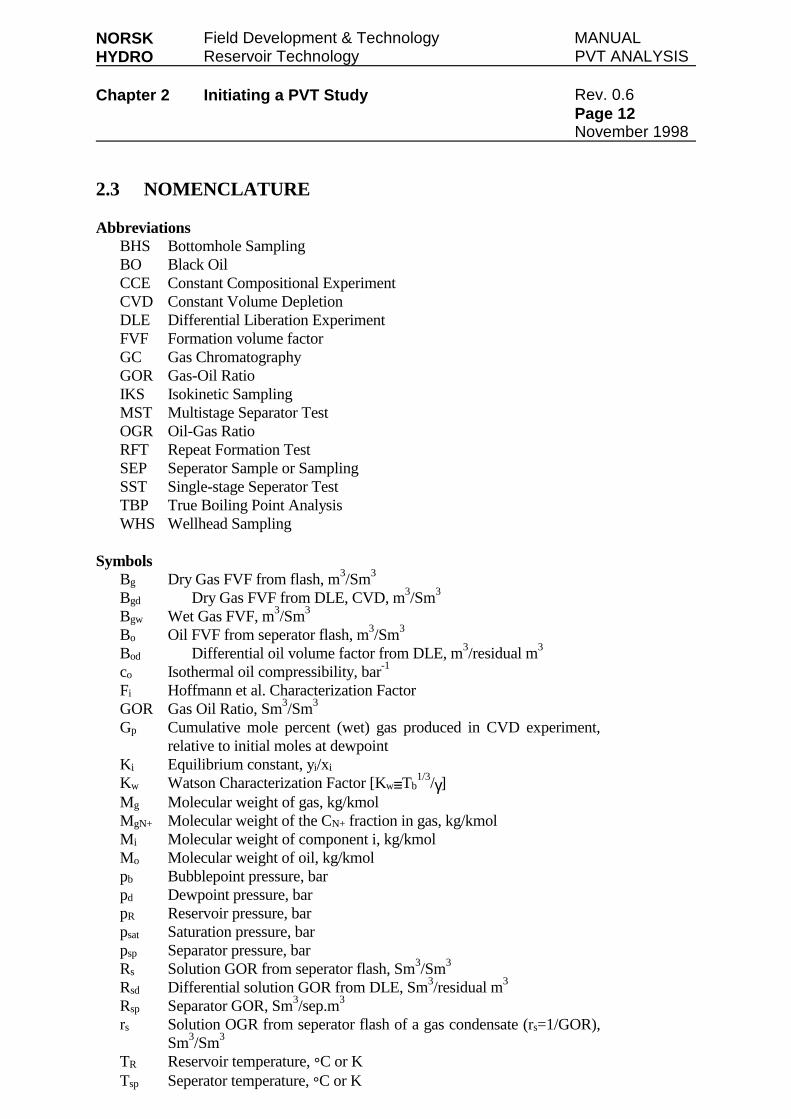
2.3 NOMENCLATURE
AbbreviationsBHS Bottomhole SamplingBO Black OilCCE Constant Compositional ExperimentCVD Constant Volume DepletionDLE Differential Liberation ExperimentFVF Formation volume factorGC Gas ChromatographyGOR Gas-Oil RatioIKS Isokinetic SamplingMST Multistage Separator TestOGR Oil-Gas RatioRFT Repeat Formation TestSEP Seperator Sample or SamplingSST Single-stage Seperator TestTBP True Boiling Point AnalysisWHS Wellhead Sampling
SymbolsBg Dry Gas FVF from flash, m3/Sm3
Bgd Dry Gas FVF from DLE, CVD, m3/Sm3
Bgw Wet Gas FVF, m3/Sm3
Bo Oil FVF from seperator flash, m3/Sm3
Bod Differential oil volume factor from DLE, m3/residual m3
co Isothermal oil compressibility, bar-1
Fi Hoffmann et al. Characterization FactorGOR Gas Oil Ratio, Sm3/Sm3
Gp Cumulative mole percent (wet) gas produced in CVD experiment,relative to initial moles at dewpoint
Ki Equilibrium constant, yi/xi
Kw Watson Characterization Factor [Kw≡Tb1/3/γ]
Mg Molecular weight of gas, kg/kmolMgN+ Molecular weight of the CN+ fraction in gas, kg/kmolMi Molecular weight of component i, kg/kmolMo Molecular weight of oil, kg/kmolpb Bubblepoint pressure, barpd Dewpoint pressure, barpR Reservoir pressure, barpsat Saturation pressure, barpsp Separator pressure, barRs Solution GOR from seperator flash, Sm3/Sm3
Rsd Differential solution GOR from DLE, Sm3/residual m3
Rsp Separator GOR, Sm3/sep.m3
rs Solution OGR from seperator flash of a gas condensate (rs=1/GOR),Sm3/Sm3
TR Reservoir temperature, °C or KTsp Seperator temperature, °C or K
NORSK Field Development & Technology MANUALHYDRO Reservoir Technology PVT ANALYSIS
Chapter 2 Initiating a PVT Study Rev. 0.6Page 13November 1998
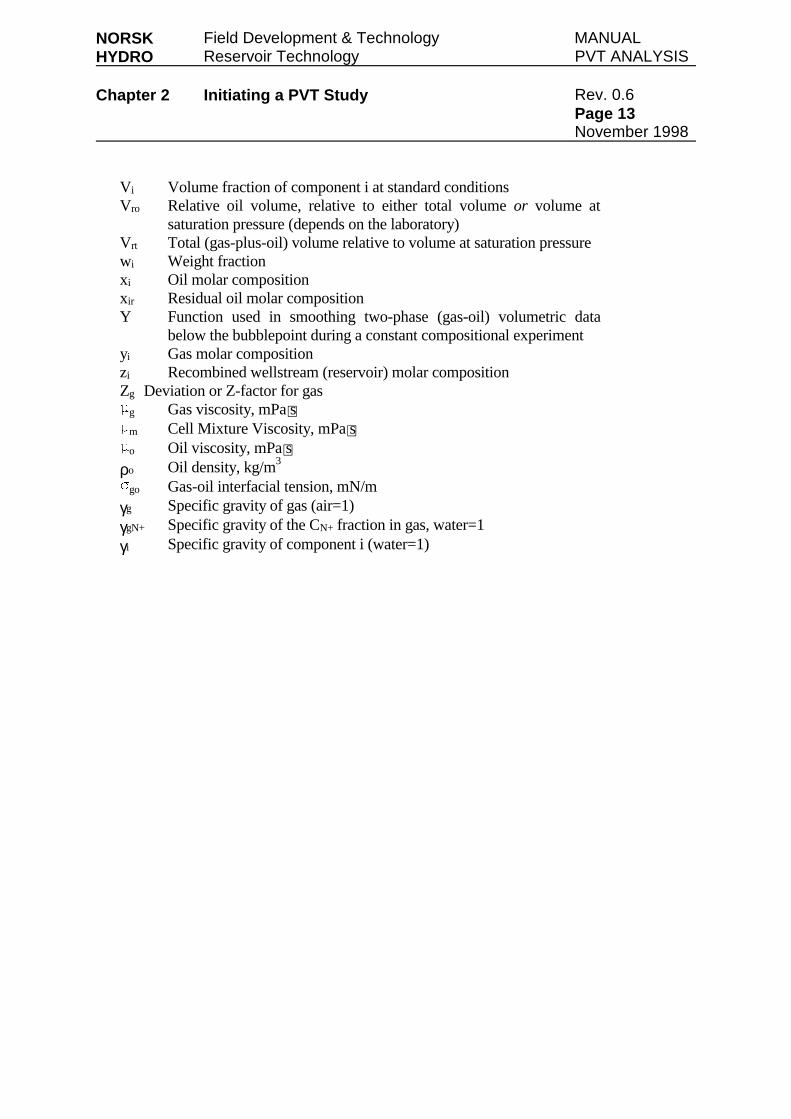
Vi Volume fraction of component i at standard conditionsVro Relative oil volume, relative to either total volume or volume at
saturation pressure (depends on the laboratory)Vrt Total (gas-plus-oil) volume relative to volume at saturation pressurewi Weight fractionxi Oil molar compositionxir Residual oil molar compositionY Function used in smoothing two-phase (gas-oil) volumetric data
below the bubblepoint during a constant compositional experimentyi Gas molar compositionzi Recombined wellstream (reservoir) molar compositionZg Deviation or Z-factor for gas
g Gas viscosity, mPa⋅sm Cell Mixture Viscosity, mPa⋅so Oil viscosity, mPa⋅s
ρo Oil density, kg/m3
go Gas-oil interfacial tension, mN/mγg Specific gravity of gas (air=1) γgN+ Specific gravity of the CN+ fraction in gas, water=1γi Specific gravity of component i (water=1)
NORSK Field Development & Technology MANUALHYDRO Reservoir Technology PVT ANALYSIS
Chapter 3 Fluid Sampling & Laboratory Data Rev. 0.6Page 1
Curtis H. Whitson (PERA a/s) November 1998
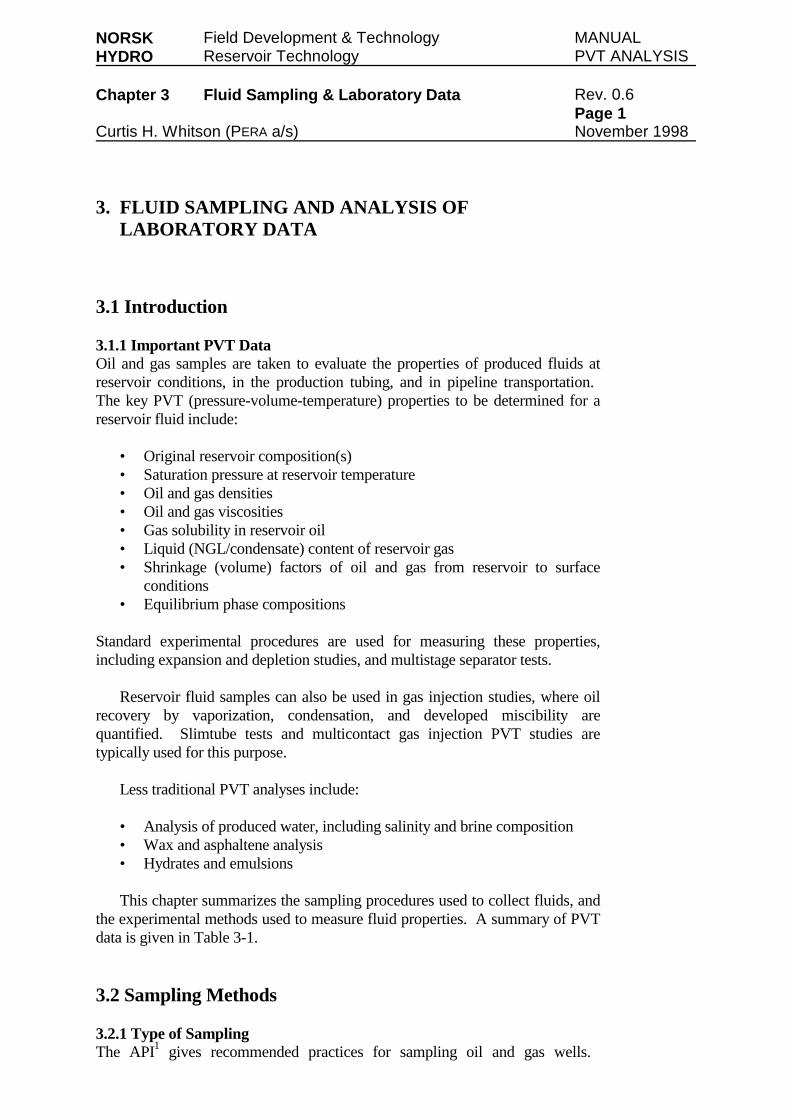
3. FLUID SAMPLING AND ANALYSIS OFLABORATORY DATA
3.1 Introduction
3.1.1 Important PVT DataOil and gas samples are taken to evaluate the properties of produced fluids atreservoir conditions, in the production tubing, and in pipeline transportation.The key PVT (pressure-volume-temperature) properties to be determined for areservoir fluid include:
• Original reservoir composition(s)• Saturation pressure at reservoir temperature• Oil and gas densities• Oil and gas viscosities• Gas solubility in reservoir oil• Liquid (NGL/condensate) content of reservoir gas• Shrinkage (volume) factors of oil and gas from reservoir to surface
conditions• Equilibrium phase compositions
Standard experimental procedures are used for measuring these properties,including expansion and depletion studies, and multistage separator tests.
Reservoir fluid samples can also be used in gas injection studies, where oilrecovery by vaporization, condensation, and developed miscibility arequantified. Slimtube tests and multicontact gas injection PVT studies aretypically used for this purpose.
Less traditional PVT analyses include:
• Analysis of produced water, including salinity and brine composition• Wax and asphaltene analysis• Hydrates and emulsions
This chapter summarizes the sampling procedures used to collect fluids, andthe experimental methods used to measure fluid properties. A summary of PVTdata is given in Table 3-1.
3.2 Sampling Methods
3.2.1 Type of SamplingThe API1 gives recommended practices for sampling oil and gas wells.
NORSK Field Development & Technology MANUALHYDRO Reservoir Technology PVT ANALYSIS
Chapter 3 Fluid Sampling & Laboratory Data Rev. 0.6Page 2
Curtis H. Whitson (PERA a/s) November 1998
Furthermore, Norsk Hydro has a chapter on Sampling Procedures in their WellTesting Manual2. Several sampling methods can be used to collect reservoirfluids, including
• RFT Sampling• Bottomhole sampling• Separator sampling• Wellhead sampling
The choice of method depends primarily on (1) whether the reservoir fluid is anoil or gas, and (2) whether the reservoir fluid is saturated (or nearly saturated) atreservoir conditions. The second condition is determined by whether the wellproduces single phase fluid into the wellbore at the flowing bottomhole pressure.
Table 3-2 gives a Schlumberger-produced look-up table for determiningsample requirements for various situations in the testing of oil and gascondensate reservoirs.
3.2.2 Representative SamplesBefore field development starts, the primary goal of sampling is to obtain"representative" samples of the fluid or fluids found in the reservoir at initialconditions. It may be difficult to obtain a representative sample because of two-phase flow effects near the wellbore. This occurs when a well is produced witha flowing bottomhole pressures below the saturation pressure of the reservoirfluid(s).a
Misleading fluid samples may also be obtained if gas coning or oil coningoccurs.
The best (most representative) samples are usually obtained when thereservoir fluid is single phase at the point of sampling, be it bottomhole or at thesurface. Even this condition, however, may not ensure representative sampling(see section 3.2.5).
Because reservoir fluid composition can vary areally, between fault blocks,and as a function of depth, we are actually interested in obtaining a sample ofreservoir fluid that is representative of the volume being drained by the wellduring the test.
Unfortunately, the concept of a "representative" sample is usually
aIf a significant positive skin effect exists, then the region near the wellbore that actually is
below the saturation pressure may be insignificant (i.e. consisting of a volume that will practicallynot effect produced fluid sampling). The well testing engineer should quantify the pressure dropdue to damage skin (if it exists) at the rate when the well experiences the lowest wellbore flowingpressure. In fact, they should provide an adjusted flowing wellbore pressure plot versus timeduring sampling that shows the effect of positive skin. The adjusted flowing pressure is probablybetter to use in evaluating if wellbore conditions were in fact condusive to sampling.
NORSK Field Development & Technology MANUALHYDRO Reservoir Technology PVT ANALYSIS
Chapter 3 Fluid Sampling & Laboratory Data Rev. 0.6Page 3
Curtis H. Whitson (PERA a/s) November 1998
A sample that correctly reflects the composition of reservoir fluid at thedepth or depths being tested.
If we suspect or know that a sample is not "representative" (according to thisdefinition), then we tend to do nothing with the sample. Or we question thevalidity of the PVT analysis done on the "unrepresentative" sample, andconsequently don't include the measured data when developing our EOS fluidcharacterization.
In general, we should not use this definition of "representivity." First of all,it is a definition that costs our industry in terms of wasted money and time, andlost opportunity. Some points to keep in mind are:
Any fluid sample that produces from a reservoir is automaticallyrepresentative of that reservoir. After all, the sampleis produced from thereservoir!
The final EOS fluid characterization of the reservoir fluid(s) should berequired to matchall (accurate) PVT measurements ofall samples producedfrom the reservoir, independent of whether the samples are representative ofinsitu compositions.
Accuracy of PVT Data≠ Representivity of Sample
Accurate PVT measurements can be made onboth representative andunrepresentative samples. Inaccurate PVT measurements can also be madeon both types of samples; bad PVT datashouldbe ignored.
Furthermore, an EOS fluid characterization is used to predict compositionalchanges during depletion which represent a much greater variation than thecompositional differences shown by "representative" and "unrepresentative"samples.
Another misconception in "representative" fluid sampling of gas condensatesis that it is difficult to obtain insitu-representative samples in saturated gascondensate reservoirs (with underlying oil).The exact opposite is true!We canreadily show that if a gas condensate is initially saturated and in contact with anunderlying oil zone, then a near-perfect insitu-representative sample can beobtained (at the gas-oil contact). Independent of whether the reservoir gas andreservoir oil samples collected are insitu-representative.
3.2.3 Define the Fluid TypeFor a new discovery it is important that the fluid type and saturation conditionscan be estimated based on somewhat limited production data. Such data mightinclude producing gas-oil ratio, stock-tank oil and separator gas gravity,reservoir temperature, and initial reservoir pressure. Produced wellstreamcomposition may also be available.
NORSK Field Development & Technology MANUALHYDRO Reservoir Technology PVT ANALYSIS
Chapter 3 Fluid Sampling & Laboratory Data Rev. 0.6Page 4
Curtis H. Whitson (PERA a/s) November 1998
Correlations such as presented by Standing and Glasø (section 4.4) can beused to estimate bubblepoint pressure with an accuracy of 5 to 10%. Whencomposition is available, an equation of state can be used to predict thesaturation pressure (bubblepoint or dewpoint) with about the same accuracy.Better predictions can usually be expected for oils, but with accuratecomposition and C7+ properties, dewpoint predictions of gas condensates alsocan be expected.
Figure 3-1 shows a typical pressure-temperature diagram for a reservoirfluid. The phase envelope defines the locus of bubblepoints and dewpointsjoined at the critical point. A reservoir with temperature less than the criticalpoint is defined as anoil reservoir. A reservoir with temperature between thecritical temperature and the cricondentherm is defined as agas condensatereservoir. If reservoir temperature is higher than the cricondentherm then thereservoir is defined as agas reservoir.
Further qualtitative fluid definitions are sometimes used. For example, oilreservoirs are classified in two categories:black-oil resevoirsand volatile oilreservoirs(determined according to their initial solution GOR and STO gravity;approximately, black-oil: Rs<150 Sm3/Sm3 and volatile oil: Rs>150 Sm3/Sm3).
Gas reservoirs are sometimes classified aswet gas reservoirs(producingsome liquid at surface conditions) ordry gas reservoirs(neglible surface liquidproduction). Furthermore, gas condensate reservoirs are sometimes grouped intothe categorieslean gas condensate reservoirs(GOR>2000 Sm3/Sm3) and richgas condensate reservoirs(GOR<1000 Sm3/Sm3).
Returning to Figure 3-1, a resevoir fluid is a single phase at conditionsoutside the phase envelope. Within the phase envelope, two phases (gas and oil)exist. Any time two phases coexist locally (e.g. gas and oil within a pore), eachphase separately is in a saturated state; the oil is at its bubblepoint and the gas isat its dewpoint. This fundamental concept is instrumental in understandingreservoir phase behavior.a
Initially a reservoir will always be at a pressure and temperature that is oneor outside the phase envelope. During production and subsequent pressurereduction in the reservoir, the system may enter the two-phase region.b
aLikewise, the concept of saturated phases applies to water and hydrocarbon phases in local
equilibrium. For example, in an oil-water system system,bothphases are saturated - with respectto each other. Even though the oil is highly undersaturated with respect to a gas phase, the oil isstill saturated - with respect to water; likewise, water is saturated with components in the oil phase.
bAfter the reservoir enters the two-phase region, differential amounts of reservoir gas and oil
are produced, according to relative permeability and viscosity ratios of the two phases.Subsequently, the remaining reservoir fluid does not have the same composition, and its phaseenvelope will therefore change from the original phase envelope. It is therefore of limited use todesign reservoir behavior during depletion based on the original p-T diagram.
NORSK Field Development & Technology MANUALHYDRO Reservoir Technology PVT ANALYSIS
Chapter 3 Fluid Sampling & Laboratory Data Rev. 0.6Page 5
Curtis H. Whitson (PERA a/s) November 1998
In practice there are three types of fluid systems in a given geologicalformation with vertical hydrodynamic communication. As shown in Figure 3-1,these are:
• Undersaturated System with Uniform Composition
• Saturated System with Uniform Composition
• Saturated and/or Undersaturated System with Compositional Gradient
A primary objective of fluid analyses in new discoveries is to establish the typeof fluid system. However, without production from several intervals and/orseveral wells, it will be difficult to establish the classification with any greatcertainty.
Ula is an example of an undersaturated oil reservoir with relatively uniformcomposition. Sleipner is an example of an undersaturated gas condensatereservoir with relatively uniform composition. Troll is a saturated reservoir withfairly uniform composition in the gas cap and in the oil.
Oseberg is an example of a saturated/undersaturated reservoir withsignificant compositional variation with depth (particularly in the oil). Anotherexmaple is the Statfjord formation in the Statfjord field.
Eldfisk and Ekofisk fields are examples of undersaturated oil reservoirs withsome compositional variation with depth.3 Interestingly, the variation ofcomposition (bubblepoint) with depth is not the same in the two main geologicalformations (Ekofisk and Tor).
The Statfjord formation in the Brent field is perhaps the most unusual fluidtype.4 The reservoir is undersaturated throughout, but the composition variesfrom a somewhat volatile oil at the bottom to a gas condensate at the top. Atsome depth a transition from bubblepoint to dewpoint occurs - but without a gas-oil contact! The point of transition is marked by a mixture with criticaltemperature equal to reservoir temperature (at that depth); at the transition,reservoir pressure is higher than the saturation (critical) pressure of the mixture(see Figure 3-1).
3.2.4 Conditioning a Well Before SamplingA well should normally be "conditioned" before sampling, particularly for gascondensate and saturated oil wells. First the well is produced long enough toclean up all chemicals that were used during the well completion. Next, the rateis stepwise decreased until the flowing bottomhole pressure is larger than theestimated saturation pressure (if possible).
The final flow rate must be large enough to maintain a stable producingGOR and wellhead pressure, even if the flowing bottomhole pressure is less than
NORSK Field Development & Technology MANUALHYDRO Reservoir Technology PVT ANALYSIS
Chapter 3 Fluid Sampling & Laboratory Data Rev. 0.6Page 6
Curtis H. Whitson (PERA a/s) November 1998
the saturation pressure. Also, the final flow rate should be maintained longenough to ensure that the producing GOR is more-or-less constant.
A constant producing GOR does not necessarily indicate that the producedwellstream is "representative" of the original reservoir fluid. In fact, it may notbe possible to obtain a truly representative sample for reservoir oil and gascondensate systems initially in a saturated state.
Sample containers are usually shipped by boat to land, and thereafter by airor ground transport to the PVT laboratory. As requested by the field operator,compositional analysis and standard PVT experiments are performed on thesamples at a PVT laboratory.
3.2.5 RFT SamplingRepeat Formation Tester (RFT) sampling (open wellbore sampling) is probablythe least accurate of all methods of sampling, mostly because of the limitedvolume of sampling. However, RFT samples should be valid under thefollowing conditions:
• Undersaturated oil• High Permeability• Water-based mud used when drilling
If oil-based mud is used during drilling then the samples can only be used forapproximate compositional analysis. The hydrocarbon components found in theoil-based mud must be backed out of (subtracted from) the overall composition.
The greatest advantage of RFT sampling is that the fluid is defined for aprecise depth. Many reservoirs exhibit compositional variation with depth.Accurate RFT samples can help establish this variation, typically a task that isvery difficult.
3.2.6 Bottomhole SamplingUndersaturated oils are usually sampled with bottomhole containers lowered intothe wellbore on a wireline (Figure 3-3, Figure 3-1). The bottomhole sample istaken while the well is flowing at a relatively low rate. The flowing bottomholepressure should always be higher than the estimated bubblepoint pressure of thereservoir oil.
Bottomhole oil samples can also be taken when a well is shutin. Theflowing bottomhole pressure prior to shutin should be higher than thebubblepoint pressure.
The typical procedure for bottomhole sampling includes:
• Install sample container in the production tubing• Make pressure gradient measurements going into the hole• Position sampler at the specified depth• Produce the well at a low, stable rate (following conditioning)
NORSK Field Development & Technology MANUALHYDRO Reservoir Technology PVT ANALYSIS
Chapter 3 Fluid Sampling & Laboratory Data Rev. 0.6Page 7
Curtis H. Whitson (PERA a/s) November 1998
• Sample during the flow test (dynamic sample) or after shuting in the well(static sample)
Traditional bottomhole samplers are often transferred to a sample containerwhile still on the drilling rig. (Norsk Hydro tries to practice transfer on landwhen possible.) The procedure for this transfer includes:
• Measure the opening pressure of the BH sampler• Heat the BH sampler to about 80oC• Mix the sample by agitation/rotation• Transfer to sample container
The saturation pressure of the sample is measured in the sample container at theprevailing temperature.
To ensure that representative samples have been obtained, at least two (andpreferably three) BH samples should have the same bubblepoint pressure atambient temperature, within 3 to 4%.
3.2.7 Wellhead SamplingIf a produced oil is single phase at the wellhead then a sample can be takenupstream to the choke. Several wellhead sampling methods can be used:
• Fill a membrane sampler by displacing the backpressure fluid (ethyleneglycol)
• Fill a piston cylinder sampler• Fill an open cylinder containing mercury (sometimes not allowed
offshore, e.g. in Norway)
Successful wellhead samples should be very accurate if the temperature is abovethe wax appearance point (WAP). Usually wellhead samples can only be takenfrom high-pressure, deep wells that are highly undersaturated (e.g. Embla). Ingeneral, wellhead (or bottomhole) samples are preferred for asphaltene studies.
3.2.8 Separator SamplingSeparator sampling is used for gas condensates and saturated oils. Separatorsamples are also taken for gas injection studies requiring large sample volumes,and for special studies involving analysis of asphaltene precipitation, wax(paraffin) point, emulsions, hydrates, and corrosion.
The method relies on sampling separately the gas and oil leaving the primaryseparator (Figure 3-1). The samples should be taken simultaneously, filling thesample containers at a constant rate of about 1 liter/minute. The 20 liter gasbottles are initially evacuated. The separator oil (about 600 cm3) can becollected in a membrane bottle by displacing ethylene glycol, a piston cylinder,or a mercury-filled container (not allowed offshore Norway). A good rule-of-thumb is that it takes about one-half hour to collect a set of separator samples.
Criteria for valid separator sampling include:
NORSK Field Development & Technology MANUALHYDRO Reservoir Technology PVT ANALYSIS
Chapter 3 Fluid Sampling & Laboratory Data Rev. 0.6Page 8
Curtis H. Whitson (PERA a/s) November 1998
• Stable separator pressure and temperature, liquid level, and flow rates.Excessive carryover (due to high rates) should be avoided.
• Critical flow through the choke, requiring that separator pressure is lessthan 1/2 of the wellhead flowing pressure. Sometimes this criterioncannot be achieved, and strictly speaking it is not necessary if separatorconditions are stable.
Separator gas and separator oil rates are measured during the sampling todetermine the ratio with which to recombine the separator samples. Therecombined mixture should yield an overall fluid representing the wellstreamthat entered the separator. This wellstream hopefully represents the reservoirfluid. Measured separator gas rates are corrected in the laboratory using standardorifice equations.
Separator gas rate is about 3 to 10% accurate (Daniel mixer), and the liquidrate should be 2 to 5% accurate using a rotameter. Carryover of separator oil inthe gas stream may be a problem for high-rate gas condensate wells (particularlylean condensate wells). As much as 30-40% of the separator oil (condensate)may be carried over in the gas stream of a lean condensate producing into astandard 20-foot separator. The separator gas sampler may or may not capturethe carried-over liquid. Irregardless, the potential error in calculated wellstreamcomposition may be significant for large carryover (low separator efficiency).
Three types of separator sampling can then be requested:
• Standard sampling• Isokinetic sampling• Mini-laboratory (Thorton) sampling
Standard separator sampling should almost always be collected for gascondensate and saturated oils.
If carryover is suspected, isokinetic samples can be taken to quantify theseparator efficiency, and thereby establish the neccesary corrections to make avalid recombination. A more expensive alternative is the Thorton samplingtechnique for gas condensates.
3.2.9 Isokinetic SamplingIsokinetic sampling may be recommended for lean gas condensates withdocumented low separator efficiency, characterized by significant carryover ofseparator oil into the separator gas stream. The method is based on sampling theseparator gas twice:
• First, a sample of the oil-free gas is taken by sampling in the samedirection as gas flows.
NORSK Field Development & Technology MANUALHYDRO Reservoir Technology PVT ANALYSIS
Chapter 3 Fluid Sampling & Laboratory Data Rev. 0.6Page 9
Curtis H. Whitson (PERA a/s) November 1998
• Second, a sample of the separator gas containing the entrained(carryover) separator oil is taken by sampling against the direction of gasflow at a properly controlled sampling rate (isokinetically).
Comparing the two sample compositions, carryover or separator efficiency canbe quantified. 1 shows the isokinetic sampling equipment.
3.2.10 Mini-Laboratory (Thorton) SamplingA mixing block is placed in a vertical 2.3" flowline, upstream from a 5/64"sample line lodged perpendicular to flow. The sampling assembly is locateddownstream to the choke and upstream to the separator (Figure 3-1). A minilaboratory separator is used to analyze the wellstream sample by conducting acontrolled multistage separation, with compositions and separator GORsmeasured directly, and wellstream recombination calculated onsite.
The mini-laboratory sampling approach is expensive and therefore notusually recommended. Careful separator sampling, eventually with isokineticsample control of liquid carryover, should usually be sufficient for most gascondensate reservoirs.
3.2.11 Sample Treatment at the PVT LaboratoryWhen the samples arrive at the PVT laboratory the samples must be checked forquality and possible leakage. Several methods can be used to check sampleconsistency. It is important to establish which samples should be used for thePVT study, mainly based on these consistency checks.
Bottomhole and wellhead oil samples are brought to the same temperaturethat was used to determine the bubblepoint on the wellsite. The bubblepoint isdetermined for each sample, and if the bubblepoints from the laboratory and thewellsite check within 1% for a given sample then it is considered valid.
Several problems may cause lab and wellsite bubblepoints to deviate. If theoil is somewhat volatile (GOR>150 Sm3/Sm3) then it may be difficult tomeasure the bubblepoint graphically using a pressure-volume plot. This is atypical problem for high bubblepoint oils (pb>250 bar). Another problem is thatequilibrium may not have been reached at each pressure when measurementswere conducted on the wellsite. Finally, the pressure gauges may have beenimproperly calibrated.
Separator samples also can be checked for leakage (look in the sample box!).The oil sample is checked by measuring the bubblepoint at separatortemperature. If the measured bubblepoint is within about 1-2% of the separatorpressure then the oil sample is considered valid.
The pressure in the gas sample bottle is checked against the separatorpressure. Note that the opening pressure at room temperature may be larger thanseparator pressure because the sample container may have been colder thanroom tempearature when filled at the separator. The basic control relation for
NORSK Field Development & Technology MANUALHYDRO Reservoir Technology PVT ANALYSIS
Chapter 3 Fluid Sampling & Laboratory Data Rev. 0.6Page 10
Curtis H. Whitson (PERA a/s) November 1998
checking opening pressure of gas samples is
where pressures and temperatures are given in absolute units. It may be difficultto establish the proper "Tsp" in this equation, as the actual temperature may beaffected by the atmospheric conditions, as well as temperature reduction duringthe "flashing" of gas into the sample bottle.
3.3 Compositional Analysis and Quality ControlPVT studies are usually based on one or more samples taken during a productiontest. Bottomhole samples can be obtained by wireline using a high-pressurecontainer, either during the production test or during a shutin period. Separatorsamples may also be taken during a production test.
This section discusses how wellstream compositions are determined. Thestandard approach consists of first separating the high-pressure sample into low-pressure gas and oil samples which are each analyzed using gas chromatography(GC). The overall mixture composition is obtained by mathematicallyrecombining the separated gas and oil compositions.
The standard components quantified in petroleum reservoir fluids include
• Non-Hydrocarbons N2 CO2 H2S
• Hydrocarbons C1 C2 C3 iC4 nC4 iC5 nC5 C6s C7+
(or C7 C8 C9 C10+)
Table 3-2 lists example compositions of the main fluid types, together withrelevant reservoir and surface properties. Figure 3-1 illustrates the classificationof fluid types based on composition in the form of a simple ternary diagram.Also shown is the classification based on producing (initial) gas-oil ratio and oil-gas ratio.
3.3.1 Gas ChromatographyCompositional measurements are made using gas chromatography andsometimes true boiling point (TBP) distillation. Gas chromatography measuresthe weight (mass) fraction of individual components in a mixture. TBP analysisgives additional information about the amount and properties of heaviercomponents (heptanes and heavier, C7+).
Gas chromatography is based on selective separation of components astemperature is increased in a capillary tube (Figure 3-1)5. The sample is injectedto the GC, followed by a carrier gas such as helium or nitrogen. As temperatureincreases, the lighter components separate and move together with the carrier gasto a flaming ion detector (FID).
T
Tp=p
sp
openingspopening (3-1)
NORSK Field Development & Technology MANUALHYDRO Reservoir Technology PVT ANALYSIS
Chapter 3 Fluid Sampling & Laboratory Data Rev. 0.6Page 11
Curtis H. Whitson (PERA a/s) November 1998
Instead of a carrier gas, a carrier liquid or supercritical fluid can be used totransport separated components. These methods are referred to as liquidchromatography and supercritical fluid chromatography, respectively.
The FID signal for a component is shown as a peak on the chromatographicline (Figure 3-1). The relative mass of a component is given by the area underthe peak, divided by the total area created by all components in the mixture.Note that FID only responds to organic compounds. A particular component canbe identified by the time (temperature) when its peak appears. For example, themethane peak appears before the ethane peak, which occurs before the propanepeak, and so on.
A thermal capacity detector (TCD) may be used in some chromatographs.This dector measures the difference in thermal capacity between the pure carriergas and the carrier gas mixed with the component being detected. Thedifference in thermal capacity is a function of the number of molecules of thecomponent. In contrast to the FID, which measures relative mass of eachcomponent, the TCD measures relative moles of each component. Also, theTCD can be used for both hydrocarbon and nonhydrocarbon compounds.
Norsk Hydro uses TCD for non-hydrocarbons, and FID for hydrocarbons.
Accurate quantitative GC analysis depends on reproducible retention times,and known dector response for the range of components being analyzed. Severalsources of error in GC analysis are given below:
• Improper handling of the sample before injection• Method used for injection• Decomposition of sample during analysis• Bad chromatographic system; tailing or overuse of the system• Variation in detector response• Calibration errors• Error in response area measurements (integration)
3.3.2 Natural Gas AnalysisA packed column with TCD is used to separate nonhydrocarbon (inorganic)components such as nitrogen, carbon dioxide, and hydrogen sulphide, as well asmethane and ethane. Chromatographic separation using FID in a capillarycolumn is used for components methane through decane.
An external standard and response factor are used to quantify the analysismore precisely. The response factor for FID includes (implicitly) the molecularweight to convert from mass to mole fraction. Finally, the FID and TCDanalyses are combined using ethane analyses to "bridge" the combination of thetwo analyses, where normalization with a volume correction is used.
3.3.3 Oil/Condensate GC Analysis
NORSK Field Development & Technology MANUALHYDRO Reservoir Technology PVT ANALYSIS
Chapter 3 Fluid Sampling & Laboratory Data Rev. 0.6Page 12
Curtis H. Whitson (PERA a/s) November 1998
A capillary column with FID is used to analyse atmospheric oil and condensatesamples. The analysis can be carried out to carbon numbers 30 or greater, but aninternal standard such as squaline is usually needed to ensure accuratequantitative conversion of response areas to mass fractions. Figure 3-1 shows atypical oil chromatogram (of a stock-tank condensate).
Simulated distillation (SIMDIS) by GC analysis may also be used. SIMDISis usually conducted with a 30-50 m capillary column using Helium as thecarrying gas with a diluted sample (1:100), temperatures from 50o-280oC at4oC/min.
Conversion from mass fraction to mole fraction requires molecular weightsof all components. Because molecular weights are not measured, and for a givencarbon number the molecular weight may vary by 5 or 10 molecular weight units(depending on the type of hydrocarbons found in the particular carbon number),conversion to mole fractions is only approximate.
Many laboratories use paraffin molecular weights (given by the relationMi=14i+2) to convert GC mass fractions to mole fractions. The molecularweights given by Katz and Firoozabadi6 for carbon numbers up to C45 areprobably more accurate for stock tank oils and condensates (Charts 3 and 4 intheFluid Properties Data Book)7.
3.3.4 True Boiling Point (TBP) AnalysisTrue boiling point distillation may supplement traditional GC analysis of oil andcondensate samples. TBP distillation separates an oil into cuts or fractionsaccording to the range of boiling points used for separation. Figure 3-1 definestypical refined petroleum products in terms of carbon number fractions. Figure3-1 illustrates the range of carbon number fractions containing varioushydrocarbon compounds (e.g. n-alkanes).
The recommended standard6 uses normal boiling points of paraffins toseparate individual carbon number fractions. To avoid decomposition("cracking") of the oil during distillation, vacuum is applied in four stages toreduce the distillation temperatures for heavier components:
• Atmospheric (1013.0 mbar)• 100 torr (133.0 mbar)• 10 torr (13.0 mbar)• 2 torr (2.6 mbar)
The distillation usually proceeds from C7 (or C9) to about C25, plus a residue(~C26+). Figure 3-1 shows a TBP distillation apparatus recommended in ASTMD-2892.8
The mass, volume, molecular weight, and density (specific gravity) of eachdistilled fraction is measured directly. Table 3-4 gives results of TBP distillationof stock-tank oil. Reported densities are at a temperature of 15oC (60oF) and
NORSK Field Development & Technology MANUALHYDRO Reservoir Technology PVT ANALYSIS
Chapter 3 Fluid Sampling & Laboratory Data Rev. 0.6Page 13
Curtis H. Whitson (PERA a/s) November 1998
atmospheric pressure. Some of the heavier fractions may have a higher pourpoint than 15oC (i.e the fraction is not fluid at 15oC), and the measured density ismade at a higher temperature (Table 3-5). This density is then corrected to thereported value using standard thermal correction tables.
Because the separation of components in a given distillation cut is onlyapproximate, some overlap is observed. For example, the C12 cut may contain10% C11 compounds, 85% C12 compounds, and 5% C13 compounds. Theoverlap worsens at lower distillation pressures because the difference indistillation temperatures is reduced between cuts. Table 3-6 and Figure 3-1show the overlap for an example TBP distillation.
The overlap can be corrected to yield an "ideal" distillation curve (Table 3-7). The resulting ideal distillation curve should be quite similar to the simulateddistillation curve, as shown in Figure 3-1.
One advantage with TBP analysis is that measured molecular weights areavailable for converting from mass to mole fraction. Molecular weights aremeasured using a cryoscopic method (freezing point depression), a method thatis sensitive to error and probably reliable at best to about ±2 to 5%. Measuredmolecular weights are compared with GC-based calculated molecular weights inTable 3-5.
Table 3-8 summaries the GC/TBP analysis of the example stock-tank oil,where results are provided through C10+.
Average boiling points are taken from the tables of Katz and Firoozabadi.6
With these boiling points and with measured specific gravities the criticalproperties and acentric factors of the fractions can be estimated fromcorrelations. Critical properties are needed in PVT calculations with an equationof state (EOS). Reservoir, pipeflow, and process simulations may also requireEOS calculations.
It is recommended that at least one TBP analysis be measured for eachreservoir fluid in a given field. As an extreme example, a field such as Visundmight require up to four TBP studies:
• (1) gas cap and (2) equilibrium oil samples in the Brent formation• (3) gas condensate in the Statfjord formation• (4) near-critical oil in the Lunde formation
Note that it may be difficult to use several TBP analyses to come up with asingle EOS characterization for reservoirs with multiple fluids (e.g.compositional variation or gas cap/oil). The examples in sections 5.5.2 and5.6.2 discuss the use of TBP data in EOS fluid characterization.
Mass fractions measured from TBP analysis should be reasonably close tomass fractions determined from simulated distillation. However, SIMDIS does

NORSK Field Development & Technology MANUALHYDRO Reservoir Technology PVT ANALYSIS
Chapter 3 Fluid Sampling & Laboratory Data Rev. 0.6Page 14
Curtis H. Whitson (PERA a/s) November 1998
not provide properties of the individual fractions (molecular weight and density).
NORSK Field Development & Technology MANUALHYDRO Reservoir Technology PVT ANALYSIS
Chapter 3 Fluid Sampling & Laboratory Data Rev. 0.6Page 15
Curtis H. Whitson (PERA a/s) November 1998
3.3.5 Bottomhole Sample CompositionTable 3-8 shows the reported wellstream composition of a reservoir oil, whereC6, C7, C8, C9, and C10+ specific gravities and molecular weights are alsoreported. In the example report, composition is given both as mole and weightpercent, though many laboratories only report molar composition.Experimentally, the composition of a bottomhole sample is determined by(Figure 3-3, Figure 3-1):
• Flashing the sample to atmospheric conditions.• Measuring the quantities of surface gas and oil.• Determining the normalized weight fractions of surface samples by gas
chromatography.• Measuring molecular weight and specific gravity of the surface oil.• Converting weight fractions to normalized mole fractions.• Recombining mathematically to the wellstream composition.
The most probable source of error in wellstream composition of abottomhole sample is the surface oil molecular weight which usually is accuratewithin 5 to 10%. TBP data, if available, can be used to check surface oilmolecular weight.
3.3.6 Recombined Sample CompositionTable 3-10 presents the separator oil and gas compositional analyses of a gascondensate fluid, together with recombined wellstream composition. Theseparator oil composition is obtained using the same procedure as forbottomhole oil samples. This involves bringing the separator oil to standardconditions, measuring properties and compositions of the resulting surface oiland gas, and recombining these compositions to give the separator oilcomposition which is reported as shown in Table 3-10.
The separator gas sample is introduced directly into a gas chromatograph.Weight fractions are converted to mole fractions using appropriate molecularweights. C7+ molecular weight is back-calculated using measured separator gasspecific gravity.
The separator oil and gas compositions can be checked for consistency usingthe Hoffman et al.9 K-value method and Standing's10 low-pressure K-valueequations (section 3.4.10).
Table 3-12 gives a summary of equations used to correct test separator gas-oil ratio for use in recombination.
3.4 PVT Experiments
3.4.1 Multistage Separator TestThe multistage separator test is conducted on oil samples primarily to provide abasis for converting differential liberation data from a residual oil to a stock-tank
NORSK Field Development & Technology MANUALHYDRO Reservoir Technology PVT ANALYSIS
Chapter 3 Fluid Sampling & Laboratory Data Rev. 0.6Page 16
Curtis H. Whitson (PERA a/s) November 1998
oil basis (see section 3.4.4).
Occasionally, several separator tests are conducted to determine the separatorconditions that maximize stock-tank oil production. Usually two or three stagesof separation are used, with the last stage being at atmospheric pressure andnear-ambient temperature (15 to 25°C). The multistage separator test can alsobe conducted for rich gas condensate fluids.
Figure 3-1 illustrates schematically how the separator test is performed.Initially the reservoir sample is brought to saturation conditions and the volumeis measured. The sample is then brought to the pressure and temperature of thefirst-stage separator. All of the gas is removed and the oil volume at theseparator stage is noted, together with the volume, number of moles, and specificgravity of the removed gas. If requested, the composition of gas samples can bemeasured.
The oil remaining after gas removal is brought to the conditions of the nextseparator stage. The gas is again removed and quantified by moles and specificgravity. Oil volume is noted, and the process is repeated until stock-tankconditions are reached. The final oil volume and specific gravity are measuredat 15.5oC and one atmosphere.
Table 3-13 gives results from a three-stage separator test. Gas removed ateach stage is quantified as standard gas volume per volume of stock-tank oil.Sometimes an additional column of data is reported, giving standard gas volumeper volume of separator oil; note, you can not add GORs reported relative toseparator oil volumes.
3.4.2 Constant Composition Expansion - OilsFor an oil sample the constant composition expansion (CCE) experiment is usedto determine the bubblepoint pressure, the undersaturated oil density andisothermal oil compressibility, and the two-phase volumetric behavior atpressures below the bubblepoint. Table 3-14 presents data from an exampleCCE experiment for a reservoir oil.
The procedure for the CCE experiment is shown in Figure 3-1. A PVT cellis filled with a known mass of reservoir fluid and brought to reservoirtemperature. Temperature is held constant during the experiment. The sampleis initially brought to a condition somewhat above the initial reservoir pressure,ensuring that the fluid is single phase. As the pressure is lowered, oil volumeexpands and is recorded.
The fluid is agitated at each pressure by rotating the cell. This avoids thephenomenon ofsupersaturationor metastable equilibriumwhere a mixtureremains as a single phase, even though it should split into two phases.Sometimes supersaturation occurs 3 to 7 bar below the actual bubblepointpressure. By agitating the mixture at each new pressure, the condition ofsupersaturation is avoided and the bubblepoint can be determined more
NORSK Field Development & Technology MANUALHYDRO Reservoir Technology PVT ANALYSIS
Chapter 3 Fluid Sampling & Laboratory Data Rev. 0.6Page 17
Curtis H. Whitson (PERA a/s) November 1998
accurately.
Just below the bubblepoint the total volume will increase more rapidlybecause gas evolves from the oil. This yields a higher system compressibility.Visually, gas can be seen at the top of the cell (if a visual cell is used). The totalvolume is recorded after the two-phase mixture is brought to equilibrium.Pressure is lowered in steps of 1 to 15 bar, where equilibrium is obtained at eachpressure. When the lowest pressure is reached, total volume is 3 to 5 timeslarger than the original bubblepoint volume.
The recorded cell volumes are plotted versus pressure, and the resultingcurve should be similar to one of the curves shown in Figure 3-1. For a "blackoil" the discontinuity in volume at the bubblepoint is sharp. The bubblepointpressure and bubblepoint volume are easily read from the intersection of thepressure-volume trends from the single-phase and the two-phase regions.
Volatile oils do not exhibit the same clear discontinuity in volumetricbehavior at the bubblepoint pressure (Figure 3-1). Instead, the p-V curve ispractically continuous in the region of the bubblepoint because undersaturatedoil compressibility is similar to the effective two-phase compressibility justbelow the bubblepoint. This makes it difficult to determine the bubblepoint ofvolatile oils using a pressure-volume plot.a Instead, a windowed cell is used forvisual observation of the first bubble of gas at the bubbleopint. Liquid shrinkagebelow the bubblepoint can also be measured in a visual cell during the constantcomposition expansion.
Reported data from commercial laboratories usually include bubblepointpressure, bubblepoint density or specific volume, and isothermal compressibilityof the undersaturated oil at pressures above the bubblepoint. The oil's thermalexpansion may also be reported, indicated by the ratio of undersaturated oilvolume at a specific pressure and reservoir temperature to the oil volume at thesame pressure and a lower temperature.
Total volume below the bubblepoint can be correlated by the Y function,defined as
where p and pb are given in absolute pressure units. Plotting Y versus pressureshould yield a straight line, as shown in Figure 3-1. The linear trend can be usedto smooth total volume data at pressures below the bubblepoint.
aReported bubblepoint pressures measured at the wellsite on bottomhole samples of volatile
oils are obviously subject to large inaccuracy because a pressure-volume plot is used. This shouldbe kept in mind when comparing laboratory-measured bubblepoint with wellsite-determinedbubblepoint in the selection (rejection) of valid samples.
1-)V/V(
1-/p)p(=
1-V
1-/p)p(Y
bt
b
rt
b≡ (3-2)
NORSK Field Development & Technology MANUALHYDRO Reservoir Technology PVT ANALYSIS
Chapter 3 Fluid Sampling & Laboratory Data Rev. 0.6Page 18
Curtis H. Whitson (PERA a/s) November 1998
3.4.3 Constant Composition Expansion - Gas CondensatesThe CCE experiment for a gas condensate reports the total relative volume,defined as the volume of the gas or gas-plus-oil mixture divided by the dewpointvolume. Z-factors are also reported, at the dewpoint pressure and above.a Table3-15 and Figure 3-1 gives example CCE data for a gas condensate.
Wet-gas FVF (or its inverse) is reported at the dewpoint and/or initialreservoir pressure. These values represent the gas equivalent or wet-gas volumeat standard conditions produced from one volume of reservoir gas.
Most CCE experiments are conducted in a visual cell for gas condensates.Relative oil (condensate) volumes are reported at pressures below the dewpoint,where relative oil volume is usually defined as the oil volume divided by thetotal volume of gas-plus-oil; in some reports, however, relative oil volume isdefined as the oil volume divided by the dewpoint volume (Norsk Hydropractice).
3.4.4 Differential Liberation ExpansionThe differential liberation expansion (DLE) experiment is designed toapproximate the depletion process of an oil reservoir, and thereby providesuitable PVT data for calculating reservoir performance. Figure 3-1 illustratesthe laboratory procedure of a DLE experiment. Figure 3-1 through Figure 3-1and Table 3-16 through Table 3-19 give DLE data for an oil sample.
A blind cell is filled with an oil sample which is brought to a single phase atreservoir temperature. Pressure is decreased until the fluid reaches itsbubblepoint, where the oil volume is recorded; knowing the initial mass of thesample, the bubblepoint density can be calculated.
The pressure is decreased below the bubblepoint and the cell is agitated untilequilibrium is reached. All gas is removed at constant pressure, and the volume,moles, and specific gravity of the removed gas are measured. Sometimes gascompositions are also measured. The remaining oil volume is also recorded.This procedure is repeated 10 to 15 times at decreasing pressures, and finally atatmospheric pressure.
The final oil is cooled, where the resulting "residual" oil volume and specificgravity are measured (or calculated) at 15.5°C. Residual oil composition mayalso be reported.b
aIf Z-factors are also reportedbelowthe dewpoint then they represent ficticious, non-physical
quantities thatshould not be used.
bNoneof the data reported for the residual oil should be used as data in doing an EOS fluid
characterization. The reason is simply that the process used in the lab from the next-to-last stage toatmospheric pressure (and reservoir temperature) is not a single flash as simulated by an EOS. Thelast-stage depletion process may be conducted differently by various laboratories; usually it is ableeding process, or bleeding/flash/bleeding process.
NORSK Field Development & Technology MANUALHYDRO Reservoir Technology PVT ANALYSIS
Chapter 3 Fluid Sampling & Laboratory Data Rev. 0.6Page 19
Curtis H. Whitson (PERA a/s) November 1998
Based on measured data, other properties arecalculated, includingdifferential solution gas-oil ratio (Rsd), differential oil FVF (Bod), oil density, andgas Z-factor.
3.4.5 Converting from Differential to Stock-Tank BasisTraditionally the most important step in the application of oil PVT data forreservoir calculations is the conversion of differential solution gas-oil ratio (Rsd)and differential oil FVF (Bod) to a stock-tank oil basis. For engineeringcalculations, volume factors Rs and Bo are used to relate reservoir oil volumes toproduced surface volumes.
Differential properties Rsd and Bod reported in the DLE report are relative toresidual oil volume, i.e., the oil volume at the end of the DLE experiment,corrected from reservoir to standard temperature. The equations traditionallyused to convert differential volume factors to a stock-tank basis are:
where Bob and Rsb are the bubblepoint oil FVF and solution GOR, respectively,from a multistage separator flash. Rsdband Bodb are differential volume factors atthe bubblepoint pressure. The term (Bob/Bodb) is used to eliminate the residualoil volume from the Rsd and Bod data. Note that the conversion from differentialto "flash" data depends on the separator conditions because Bob and Rsb dependon separator conditions.
The conversions given by Eqs. (3-3) and (3-4) are only approximate. Figure3-1 shows the conversion of differential Bod to flash Bo for the example oil withdifferential data reported in Table 3-16 through Table 3-19.
A more accurate method was suggested by Dodson et al.11 Their methodrequires that some of the equilibrium oil be taken at each stage of a depletionexperiment (DLE, CCE, or CVD (see section 3.4.6)) and flashed through amultistage separator. The multistage separation gives Rs and Bo directly. Thislaboratory procedure is costly and time-consuming, and therefore never used.However, the method is readily simulated with an equation of state model(Whitson and Torp12; Coats13).
Figure 3-1 shows oil volume factors and solution GORs calculated using thestandard conversion given by Eqs. (3-3) and (3-4), compared with the Dodsonmethod (Whitson and Torp procedure) using an EOS. The oil is slightlyvolatile, and it is seen that the approximate conversion gives approximately thesame results as using the more rigorous Dodson method.
Figure 3-1 shows a similar comparison for a highly (near-critical) volatile
)B
B)(R-R(-R=Rodb
obsdsdbsbs (3-3)
)B
B(B=Bodb
obodo (3-4)
NORSK Field Development & Technology MANUALHYDRO Reservoir Technology PVT ANALYSIS
Chapter 3 Fluid Sampling & Laboratory Data Rev. 0.6Page 20
Curtis H. Whitson (PERA a/s) November 1998
oil. The difference in both oil volume factor and solution GOR is significant,and clearly the traditional conversion of DLE data can not be used for this typeof fluid.
It should be realized that even when dealing with a slightly volatile oil(GOR>125 Sm3/Sm3), a modified black-oil (MBO) PVT formulation should beused in reservoir calculations (material balance and simulation). The MBOformulation is compared with the traditional black-oil formulation in Figure 3-1.The main difference is that the MBO treatment accounts for the ability ofreservoir gas to volatilize intermediate and heavier components that produce asuface condensate when produced.
The ratio of surface condensate produced from reservoir gas to surface gasproduced from reservoir gas is the solution oil-gas ratio RV (sometimes writtenrs). The gas FVF also must be adjusted from the traditional definition to accountfor the reservoir gas that becomes condensate at the surface (i.e. that the molesof reservoir gas does not equal the moles of surface gas, as is assumed in thetraditional definition of gas FVF). The resulting gas FVF is called "dry" gasFVF, with symbol Bgd.
3.4.6 Constant Volume DepletionThe constant volume depletion (CVD) experiment is designed to providevolumetric and compositional data for gas condensate (and volatile oil)reservoirs producing by pressure depletion. The stepwise procedure of a CVDexperiment is shown schematically in Figure 3-1. Table 3-19 and Table 3-21give CVD data for an example gas condensate fluid.
The CVD experiment provides data that can be used directly in reservoirengineer calculations, including:
• Reservoir material balance giving recovery of total wellstream (wet gasrecovery) versus average reservoir pressure.
• Produced wellstream composition and surface products (sales gas,condensate, and NGLs) versus reservoir pressure.
• Average oil saturation in the reservoir (liquid dropout andrevaporization) that occurs during pressure depletion.
For most gas condensate reservoirs producing by depletion, the recoveries andoil saturations versus pressure from the CVD analysis closely approximate actualfield performance.a If other recovery mechanisms such as water drive and gas
aThe basic assumption is that hydrocarbons condensed in the reservoir,on the whole(i.e.
neglecting local saturation effects near the wellbore), do not flow in significant amounts toproduction wells. The reason is simply that the relative mobility of oil is much smaller than thereservoir gas mobility.
NORSK Field Development & Technology MANUALHYDRO Reservoir Technology PVT ANALYSIS
Chapter 3 Fluid Sampling & Laboratory Data Rev. 0.6Page 21
Curtis H. Whitson (PERA a/s) November 1998
cycling are considered, the basic data required for reservoir engineering are stilltaken mainly from a CVD report.
3.4.7 PVT Data AccuracyThe accuracy of PVT measurements is difficult to quantify. Norsk Hydro has,however, studied the problem and Table 3-22 gives guidelines for measurementaccuracies of most PVT data.
3.4.8 PVT Consistency ChecksThe quality of PVT data may vary from poor to excellent. It may not beobvious, however, when inaccurate data are reported. Several methods can beused to determine the quality of reported PVT data. The recommendedconsistency checks given below should be used for PVT data that will be used inreservoir studies, or in the development of an equation of state characterization.
3.4.9 Watson Characterization FactorThe C7+ molecular weight is highly susceptible to error, with an accuracyranging from 2 to 10%. Specific gravity of C7+, on the other hand, should beaccurate within a fraction of a percent.
The characterization factor Kw was introduced by Watson14 to qualitativelydescribe the relative paraffinicity of a petroleum product. Kw is defined as
γ/T=K 3/1bw , where Tb is the normal boiling point inoR andγ is the specific
gravity relative to water.
Stock-tank oils and condensates contain many hundreds of hydrocarboncompounds. Because STO consists mainly of the C7+ material, thecharacterization or "paraffinicity" of a reservoir fluid can be described by theWatson characterization factor of the C7+ fraction.
The following table gives the range of the Watson characterization factor forpure compounds in the three main hydrocarbon families, and for stock-tankoils/condensates.
HydrocarbonType
PureCompound
Stock-Tank Oil/Condensate (C7+)
ParaffinNaptheneAromatic
12-1410-128-10
12-12.5
11-11.5
Whitson15 gives an approximate relation for Kw that can be used forheptanes-plus,
Austad et al. show that for a given formation in a reservoir, Kw7+ should be very
γ-0.84573+7
0.15178+7+7w M4.5579=K (3-5)
NORSK Field Development & Technology MANUALHYDRO Reservoir Technology PVT ANALYSIS
Chapter 3 Fluid Sampling & Laboratory Data Rev. 0.6Page 22
Curtis H. Whitson (PERA a/s) November 1998
constant, even during depletion and even if the STO gravity varies initially(Figure 3-1).
Based on this observation, it is recommended that Kw7+ be calculated foreach new PVT sample in a field/reservoir. A plot of M7+ versusγ7+ can beupdated with each new sample, where a line of constant Kw7+ is drawn for thefield average. Deviation of ±0.03 in Kw7+ is acceptable. Larger deviations inKw7+ from the field/reservoir average may (probably) indicate an error in themeasured M7+.
If larger errors in M7+ are found, then potential errors in reported molarcomposition should be checked.
3.4.10 Hoffman et al. Kp-F PlotThe consistency of separator gas and oil compositions can be checked using adiagnostic plot proposed by Hoffman, Crump, and Hocott.9 They show that K-values (on a log scale) plotted versus a component factor Fi (on a linear scale)should result in a straight-line relationship.
To apply this method to separator samples, the K-values are calculated firstfrom separator gas and oil compositions, Ki=yi/xi where yi=separator gas molarcomposition and xi=separator oil molar composition.
The Hoffman characterization factor Fi is given by
where Tbi is the normal boiling point inoR, Tsp is the separator temperature inoR, and bi is a component constant given formally by
where pci is critical pressure in psia, psc is standard pressure in psia, and Tci iscritical temperature inoR.
Standing10 gives modified values of bi and Tbi to be used with the Hoffmanet al. method, as shown in Table 3-23. Standing also gives the expected slopeand intercept of the line as a function of pressure and temperature for typicalseparator conditions,
where
with psp given in psia.
)T/1-T/(1b=F spbiii (3-6)
T/1-T/1
)p/plog(=b
cibi
sccii (3-7)
Fc+a=pKlog ispi (3-8)
p103.5-p101.7-0.89=c
p1015.0+p104.5+1.20=a2sp
8-sp
4-
2sp
-8sp
-4
××
××(3-9)
NORSK Field Development & Technology MANUALHYDRO Reservoir Technology PVT ANALYSIS
Chapter 3 Fluid Sampling & Laboratory Data Rev. 0.6Page 23
Curtis H. Whitson (PERA a/s) November 1998
According to Standing, the correlations for a and c are valid up to pressuresof 70 bar and temperatures from 5 to 95oC.
A plot of measured separator K-values using this method should not deviatesignificantly from the Standing straight line. Heptanes plus, nonhydrocarbons,and components with small amounts (<0.5 mol-%) in either the separator oil orgas sample may deviate from the straight line without causing concern.However, if the key hydrocarbons methane through hexane show significantdeviation from the straight line, the compositional analysis should be used withscrutiny.
Figure 3-1 shows a Kp-F plot for the separator sample given earlier (Table3-10).
3.4.11 Correcting GOR for Liquid CarryoverThe reported separator GOR (Rsp) may be in error for several reasons:
• Incorrect separator oil rate• Incorrect separator gas rate• Carryover of separator oil in separator gas stream• Gas in the oil line• Incorrect measurement of the "meter factor"• Combination of the above
It is probably reasonable to say that reported GOR has an accuracy of 5 to 15%,with even greater errors possible for lean gas condensates producing at highrates.
The recombined wellstream zi composition is calculated from
where Fgsp is the total mole fraction of total wellstream that leaves the separatorin the gas stream,a
where ρosp is the separator oil density in kg/m3, Mosp is the separator oilmolecular weight (kg/kmol), and Rsp is separator gas-oil ratio in Sm3/sep. m3.
If the GC analyses are done properly, both separator oil composition xi andseparator gas composition yi should be correct, even if carryover is a problem.
aWhen carryover occurs, Fgsp calculated using test GOR willalso include the entrained liquid
that is carried over in the gas stream leaving the separator. This is because the measured gas rateincludes the amount (moles) of carryover.
x)F-(1+yF=z igspigspi (3-10)
��
���
� ρ
RM23.68+1=F
sposp
osp
-1
gsp (3-11)
NORSK Field Development & Technology MANUALHYDRO Reservoir Technology PVT ANALYSIS
Chapter 3 Fluid Sampling & Laboratory Data Rev. 0.6Page 24
Curtis H. Whitson (PERA a/s) November 1998
The traditional method of sampling gas (downstream) will minimize the amountof carryover that enters the gas sample container. Also, if the gas sample isbrought to separator conditions before charging the chromatograph, onlyequilibrium gas will be removed for analysis, and the carryover separator oil willremain in the sample container.
We can usually assume with reasonable accuracy that the separator gas andoil compositions, as reported, can be used for recombination if the Hoffman etal. plot is acceptable. To obtain a valid wellstream composition from Eq. (3-10),however, the recombination GOR may need to be corrected (for one of severalreasons).
If carryover exists then the separator gas rate reflects both the amount(moles) of separator gas ng plus the moles of carryover separator oilÿno, thetotal being expressed as a standard gas volume (Figure 3-1). The separator oilrate reflects the total separator oil rate no lessthe moles of separator oil carryover(i.e. oo
*o nnn ∆−= ). In terms of an overall molar balance,
and in terms of a component molar balance,
where yi and xi are standard separator samples (i.e. true equilibrium phase)compositions (assuming downstream sampling of the separator gas collects littleif any of the carryover separator oil). An isokinetic gas sample, on the otherhand, represents the separator gas plus carryover separator oil*
iy .
Defining the separator oil carryover�ospas
the effect of carryover on wellstream composition is calculated by firstcorrecting the test gas mole fraction (Fgsp)test calculated from the test GOR. Thecorrected gas mole fraction reflects thetrue fraction of the total wellstream thatis separator gas (ng/n),
Furthermore, the measured test separator GOR (Rsp)test can be corrected forcarryover to yield the true separator GOR,
)n+n(+n=
n+n=n
o*og
og
∆(3-12)
nx+)n+n(y=
nx+nx+ny=
nx+ny=nz
*oiog
*i
*oioigi
oigii
∆
∆ (3-13)
n
n
o
oosp
∆≡δ (3-14)
δδ
osp
osptestgsp
g
og
gcorrgsp
-1
-)F(=
nn=
n+n
n=)F(
(3-15)
NORSK Field Development & Technology MANUALHYDRO Reservoir Technology PVT ANALYSIS
Chapter 3 Fluid Sampling & Laboratory Data Rev. 0.6Page 25
Curtis H. Whitson (PERA a/s) November 1998
Table 3-12 and section 4.3.2 discuss the corrections to reported wellsiteseparator test GOR. The corrections result in a test GOR (Rsp)test that is thenused in Eq. (3-11) to determine (Fgsp)test(referred to in the equations above).
1-)F/(1
1-)F/(1)R(=)R(=)R(
corrgsp
testgsptestsptruespcorrsp (3-16)
NORSK Field Development & Technology MANUALHYDRO Reservoir Technology PVT ANALYSIS
Chapter 3 Fluid Sampling & Laboratory Data Rev. 0.6Page 26
Curtis H. Whitson (PERA a/s) November 1998
3.5 References1. API Recommended Practice for Sampling Petroleum Reservoir Fluids,
American Petroleum Institute (1966)44.
2. "Well Testing Manual," Norsk Hydro.
3. Belery, P. and da Silva, F.V.: "Gravity and Thermal Diffusion inHydrocarbon Reservoirs," paper presented at the Third Chalk ResearchProgram, Copenhagen (1990).
4. Bath, P.G.H., van der Burgh, J., and Ypma, J.G.J.: "Enhanced Oil Recoveryin the North Sea," 11th World Petroleum Congress (1983).
5. Freyss, H.,et al.: "PVT Analysis for the Oil Reservoirs,"The TechnicalReview (Schlumberger)(1989)37, No. 1, 4-15.
6. Katez, D.L., and Firoozabadi, A.: "Predicting Phase Behavior ofCondensate/Crude-Oil Systems Using Methane Interaction Coefficients,"JPT(Nov. 1978) 1649-1655; Trans., AIME,265.
7. Whitson, C.H.: Petroleum Engineering Fluid Properties Data Book,Trondheim, Norway (1994).
8. "Distillation of Crude Petroleum (15-Theoritical Plate Column): DesignationD2892-84, "Annual Book of ASTM Standards, (1984) 821-860.
9. Hoffmann, A.E., Crump, J.S., and Hocott, C.R.: "Equilibrium Constants fora Gas-Condensate System,"Trans., AIME (1953)198, 1-10.
10. Standing, M.B.: "A Set of Equations for Computing Equilibrium Ratios of aCrude Oil/Natural Gas System at Pressures Below 1,000 psia,"JPT (Sept.1979) 1193-1195.
11. Dodson, C.R., Goodwill, D., and Mayer, E.H.: "Application of LaboratoryPVT Data to Reservoir Engineering Problems,"Trans., AIME (1953) 198,287-298.
12. Whitson, C.H. and Torp, S.B.: "Evaluating Constant Volume DepletionData,"JPT(March 1983) 610-620;Trans., AIME, 275.
13. Coats, K.H.: "Simulation of Gas Condensate Reservoir Performance,"JPT(Oct. 1985) 1870-1886.
14. Watson, K.M., Nelson, E.F., and Murphy, G.B.: "Characterization ofPetroleum Fractions,"Ind. Eng. Chem.(1935)27, 1460-1464.
15. Whitson, C.H.: "Characterizing Hydrocarbon Plus Fractions,"SPEJ(Aug.1983) 683-694;Trans., AIME, 275.
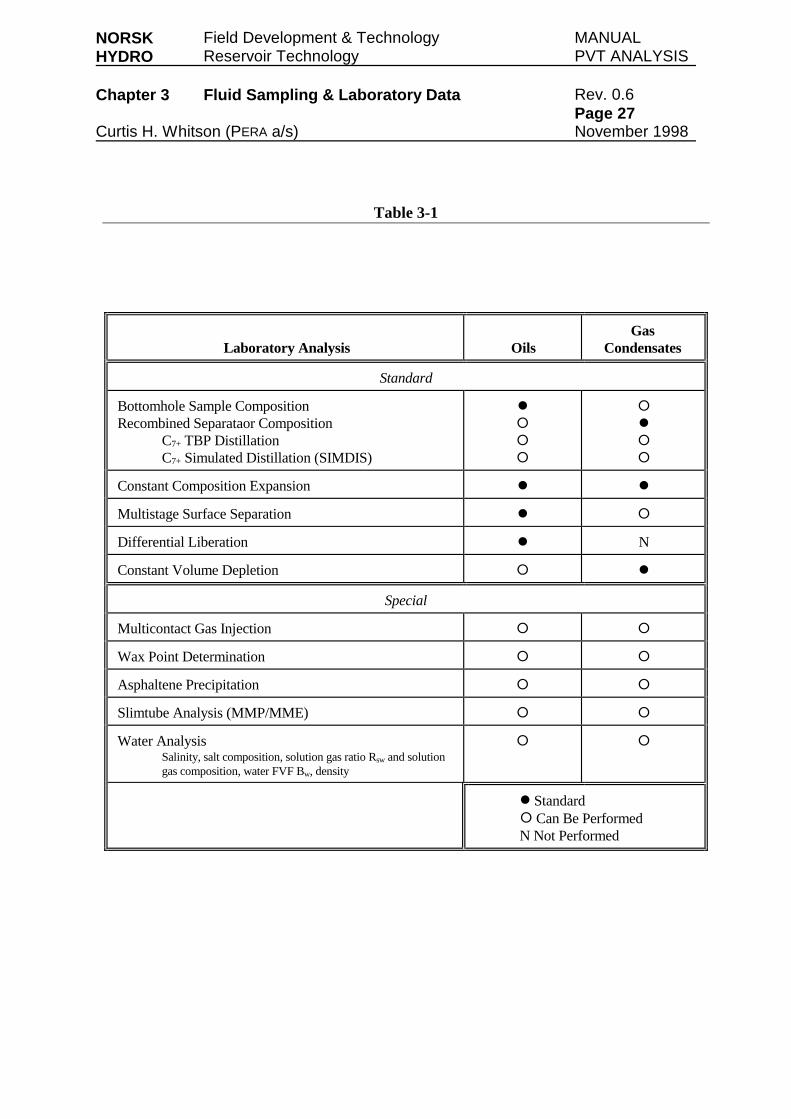
NORSK Field Development & Technology MANUALHYDRO Reservoir Technology PVT ANALYSIS
Chapter 3 Fluid Sampling & Laboratory Data Rev. 0.6Page 27
Curtis H. Whitson (PERA a/s) November 1998
Table 3-1
Laboratory Analysis OilsGas
Condensates
Standard
Bottomhole Sample CompositionRecombined Separataor Composition
C7+ TBP DistillationC7+ Simulated Distillation (SIMDIS)
�
�
�
�
�
�
�
�
Constant Composition Expansion � �
Multistage Surface Separation � �
Differential Liberation � N
Constant Volume Depletion � �
Special
Multicontact Gas Injection � �
Wax Point Determination � �
Asphaltene Precipitation � �
Slimtube Analysis (MMP/MME) � �
Water AnalysisSalinity, salt composition, solution gas ratio Rsw and solutiongas composition, water FVF Bw, density
� �
� Standard� Can Be PerformedN Not Performed
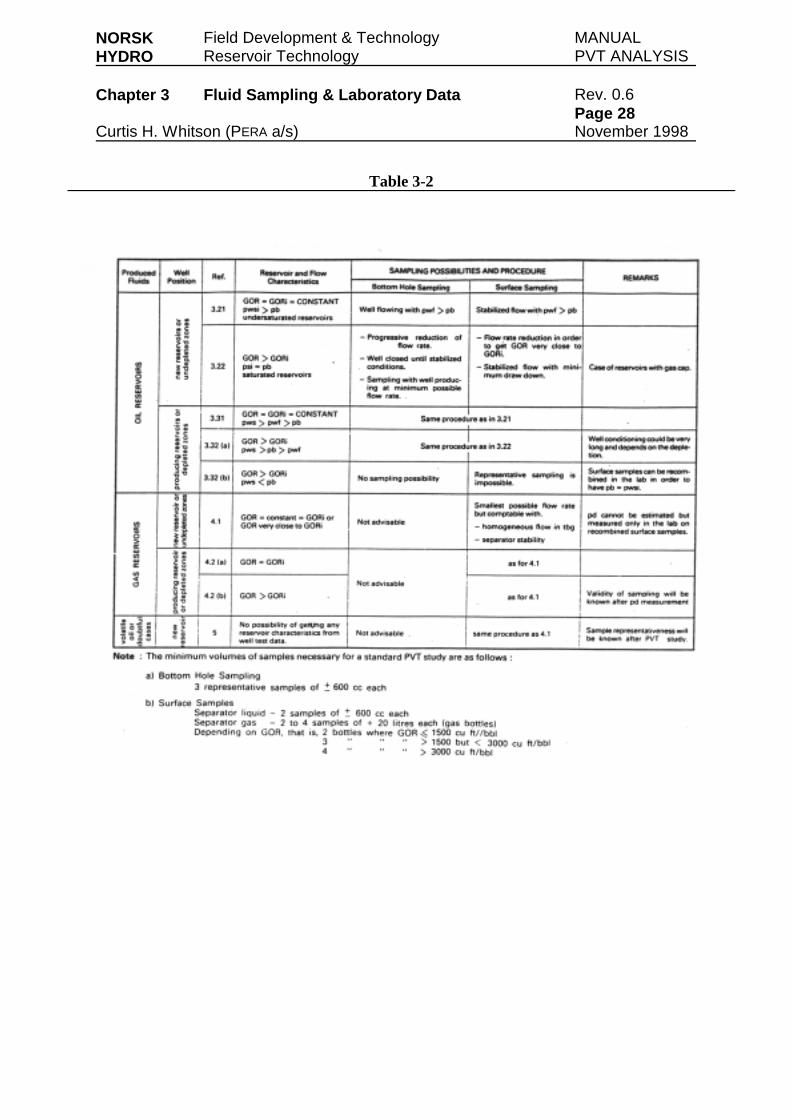
NORSK Field Development & Technology MANUALHYDRO Reservoir Technology PVT ANALYSIS
Chapter 3 Fluid Sampling & Laboratory Data Rev. 0.6Page 28
Curtis H. Whitson (PERA a/s) November 1998
Table 3-2
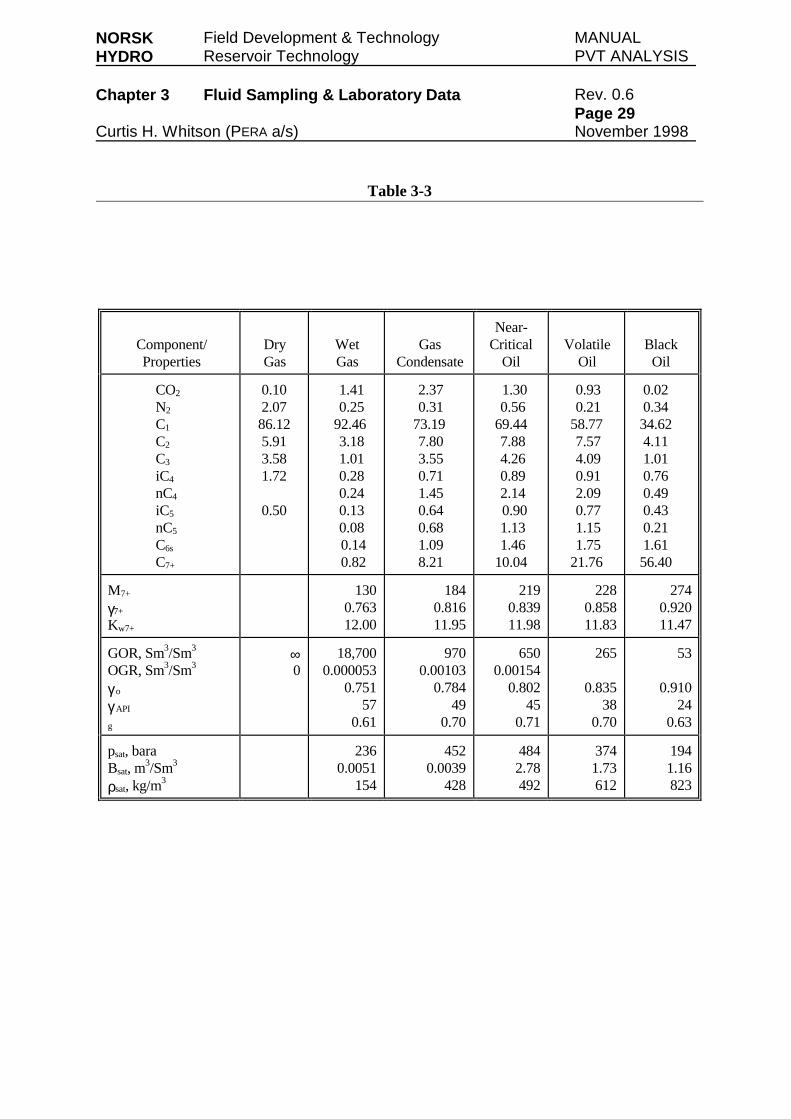
NORSK Field Development & Technology MANUALHYDRO Reservoir Technology PVT ANALYSIS
Chapter 3 Fluid Sampling & Laboratory Data Rev. 0.6Page 29
Curtis H. Whitson (PERA a/s) November 1998
Table 3-3
Component/Properties
DryGas
WetGas
GasCondensate
Near-Critical
OilVolatile
OilBlack
Oil
CO2
N2
C1
C2
C3
iC4
nC4
iC5
nC5
C6s
C7+
0.102.0786.125.913.581.72
0.50
1.410.25
92.463.181.010.280.240.130.080.140.82
2.370.31
73.197.803.550.711.450.640.681.098.21
1.300.56
69.447.884.260.892.140.901.131.46
10.04
0.930.21
58.777.574.090.912.090.771.151.75
21.76
0.020.3434.624.111.010.760.490.430.211.6156.40
M7+
γ7+
Kw7+
1300.76312.00
1840.81611.95
2190.83911.98
2280.85811.83
2740.92011.47
GOR, Sm3/Sm3
OGR, Sm3/Sm3
γ o
γ API
g
∞0
18,7000.000053
0.75157
0.61
9700.00103
0.78449
0.70
6500.00154
0.80245
0.71
265
0.83538
0.70
53
0.91024
0.63
psat, baraBsat, m3/Sm3
ρsat, kg/m3
2360.0051
154
4520.0039
428
4842.78492
3741.73612
1941.16823
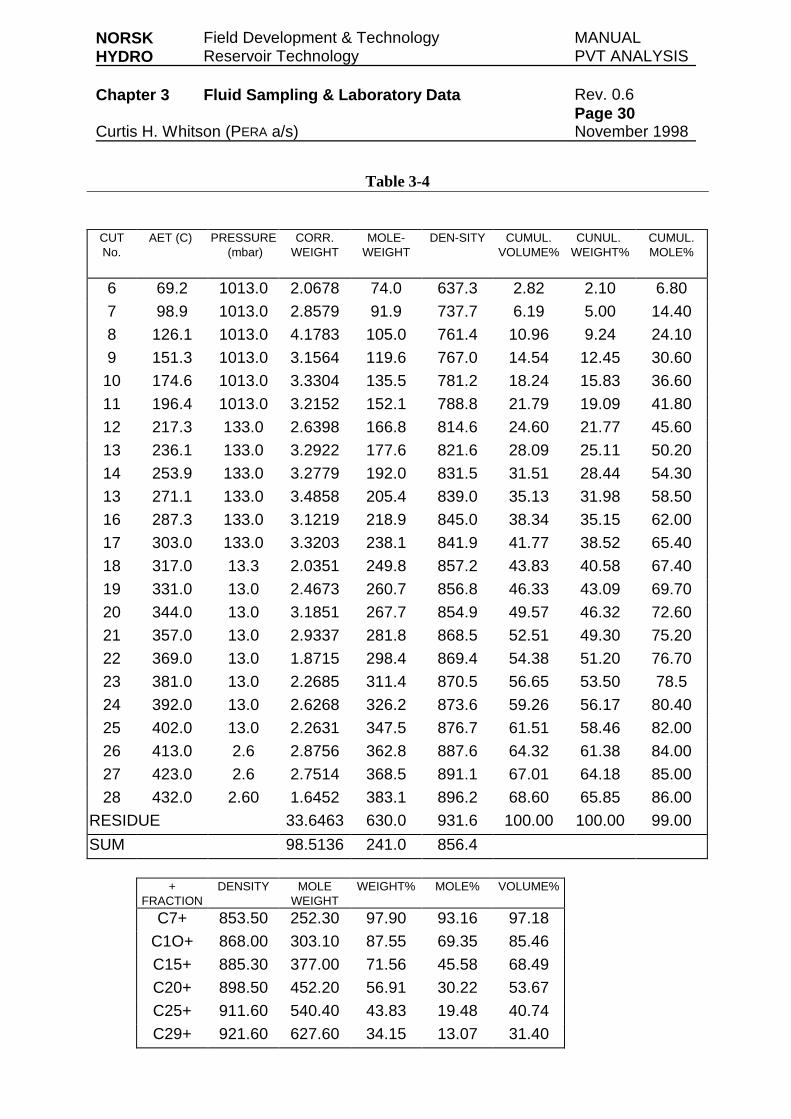
NORSK Field Development & Technology MANUALHYDRO Reservoir Technology PVT ANALYSIS
Chapter 3 Fluid Sampling & Laboratory Data Rev. 0.6Page 30
Curtis H. Whitson (PERA a/s) November 1998
Table 3-4
CUTNo.
AET (C) PRESSURE(mbar)
CORR.WEIGHT
MOLE-WEIGHT
DEN-SITY CUMUL.VOLUME%
CUNUL.WEIGHT%
CUMUL.MOLE%
6 69.2 1013.0 2.0678 74.0 637.3 2.82 2.10 6.80
7 98.9 1013.0 2.8579 91.9 737.7 6.19 5.00 14.40
8 126.1 1013.0 4.1783 105.0 761.4 10.96 9.24 24.10
9 151.3 1013.0 3.1564 119.6 767.0 14.54 12.45 30.60
10 174.6 1013.0 3.3304 135.5 781.2 18.24 15.83 36.60
11 196.4 1013.0 3.2152 152.1 788.8 21.79 19.09 41.80
12 217.3 133.0 2.6398 166.8 814.6 24.60 21.77 45.60
13 236.1 133.0 3.2922 177.6 821.6 28.09 25.11 50.20
14 253.9 133.0 3.2779 192.0 831.5 31.51 28.44 54.30
13 271.1 133.0 3.4858 205.4 839.0 35.13 31.98 58.50
16 287.3 133.0 3.1219 218.9 845.0 38.34 35.15 62.00
17 303.0 133.0 3.3203 238.1 841.9 41.77 38.52 65.40
18 317.0 13.3 2.0351 249.8 857.2 43.83 40.58 67.40
19 331.0 13.0 2.4673 260.7 856.8 46.33 43.09 69.70
20 344.0 13.0 3.1851 267.7 854.9 49.57 46.32 72.60
21 357.0 13.0 2.9337 281.8 868.5 52.51 49.30 75.20
22 369.0 13.0 1.8715 298.4 869.4 54.38 51.20 76.70
23 381.0 13.0 2.2685 311.4 870.5 56.65 53.50 78.5
24 392.0 13.0 2.6268 326.2 873.6 59.26 56.17 80.40
25 402.0 13.0 2.2631 347.5 876.7 61.51 58.46 82.00
26 413.0 2.6 2.8756 362.8 887.6 64.32 61.38 84.00
27 423.0 2.6 2.7514 368.5 891.1 67.01 64.18 85.00
28 432.0 2.60 1.6452 383.1 896.2 68.60 65.85 86.00
RESIDUE 33.6463 630.0 931.6 100.00 100.00 99.00
SUM 98.5136 241.0 856.4
+FRACTION
DENSITY MOLEWEIGHT
WEIGHT% MOLE% VOLUME%
C7+ 853.50 252.30 97.90 93.16 97.18
C1O+ 868.00 303.10 87.55 69.35 85.46
C15+ 885.30 377.00 71.56 45.58 68.49
C20+ 898.50 452.20 56.91 30.22 53.67
C25+ 911.60 540.40 43.83 19.48 40.74
C29+ 921.60 627.60 34.15 13.07 31.40
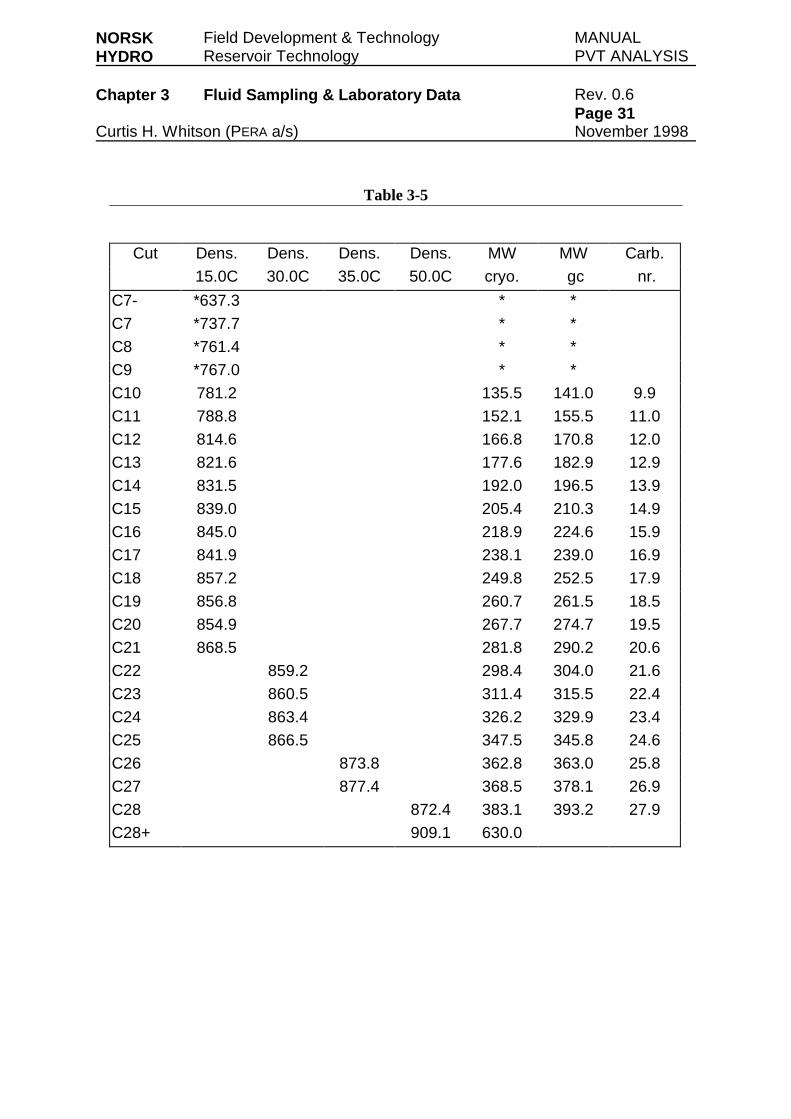
NORSK Field Development & Technology MANUALHYDRO Reservoir Technology PVT ANALYSIS
Chapter 3 Fluid Sampling & Laboratory Data Rev. 0.6Page 31
Curtis H. Whitson (PERA a/s) November 1998
Table 3-5
Cut Dens. Dens. Dens. Dens. MW MW Carb.
15.0C 30.0C 35.0C 50.0C cryo. gc nr.
C7- *637.3 * *
C7 *737.7 * *
C8 *761.4 * *
C9 *767.0 * *
C10 781.2 135.5 141.0 9.9
C11 788.8 152.1 155.5 11.0
C12 814.6 166.8 170.8 12.0
C13 821.6 177.6 182.9 12.9
C14 831.5 192.0 196.5 13.9
C15 839.0 205.4 210.3 14.9
C16 845.0 218.9 224.6 15.9
C17 841.9 238.1 239.0 16.9
C18 857.2 249.8 252.5 17.9
C19 856.8 260.7 261.5 18.5
C20 854.9 267.7 274.7 19.5
C21 868.5 281.8 290.2 20.6
C22 859.2 298.4 304.0 21.6
C23 860.5 311.4 315.5 22.4
C24 863.4 326.2 329.9 23.4
C25 866.5 347.5 345.8 24.6
C26 873.8 362.8 363.0 25.8
C27 877.4 368.5 378.1 26.9
C28 872.4 383.1 393.2 27.9
C28+ 909.1 630.0
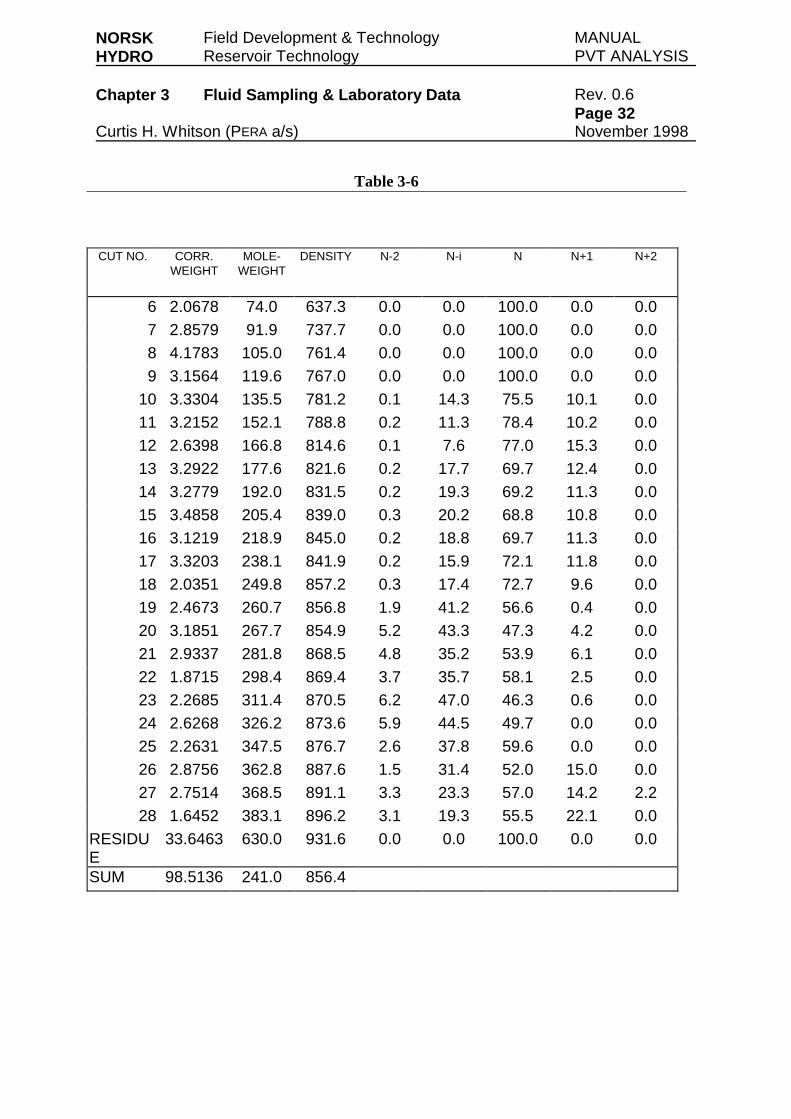
NORSK Field Development & Technology MANUALHYDRO Reservoir Technology PVT ANALYSIS
Chapter 3 Fluid Sampling & Laboratory Data Rev. 0.6Page 32
Curtis H. Whitson (PERA a/s) November 1998
Table 3-6
CUT NO. CORR.WEIGHT
MOLE-WEIGHT
DENSITY N-2 N-i N N+1 N+2
6 2.0678 74.0 637.3 0.0 0.0 100.0 0.0 0.0
7 2.8579 91.9 737.7 0.0 0.0 100.0 0.0 0.0
8 4.1783 105.0 761.4 0.0 0.0 100.0 0.0 0.0
9 3.1564 119.6 767.0 0.0 0.0 100.0 0.0 0.0
10 3.3304 135.5 781.2 0.1 14.3 75.5 10.1 0.0
11 3.2152 152.1 788.8 0.2 11.3 78.4 10.2 0.0
12 2.6398 166.8 814.6 0.1 7.6 77.0 15.3 0.0
13 3.2922 177.6 821.6 0.2 17.7 69.7 12.4 0.0
14 3.2779 192.0 831.5 0.2 19.3 69.2 11.3 0.0
15 3.4858 205.4 839.0 0.3 20.2 68.8 10.8 0.0
16 3.1219 218.9 845.0 0.2 18.8 69.7 11.3 0.0
17 3.3203 238.1 841.9 0.2 15.9 72.1 11.8 0.0
18 2.0351 249.8 857.2 0.3 17.4 72.7 9.6 0.0
19 2.4673 260.7 856.8 1.9 41.2 56.6 0.4 0.0
20 3.1851 267.7 854.9 5.2 43.3 47.3 4.2 0.0
21 2.9337 281.8 868.5 4.8 35.2 53.9 6.1 0.0
22 1.8715 298.4 869.4 3.7 35.7 58.1 2.5 0.0
23 2.2685 311.4 870.5 6.2 47.0 46.3 0.6 0.0
24 2.6268 326.2 873.6 5.9 44.5 49.7 0.0 0.0
25 2.2631 347.5 876.7 2.6 37.8 59.6 0.0 0.0
26 2.8756 362.8 887.6 1.5 31.4 52.0 15.0 0.0
27 2.7514 368.5 891.1 3.3 23.3 57.0 14.2 2.2
28 1.6452 383.1 896.2 3.1 19.3 55.5 22.1 0.0
RESIDUE
33.6463 630.0 931.6 0.0 0.0 100.0 0.0 0.0
SUM 98.5136 241.0 856.4
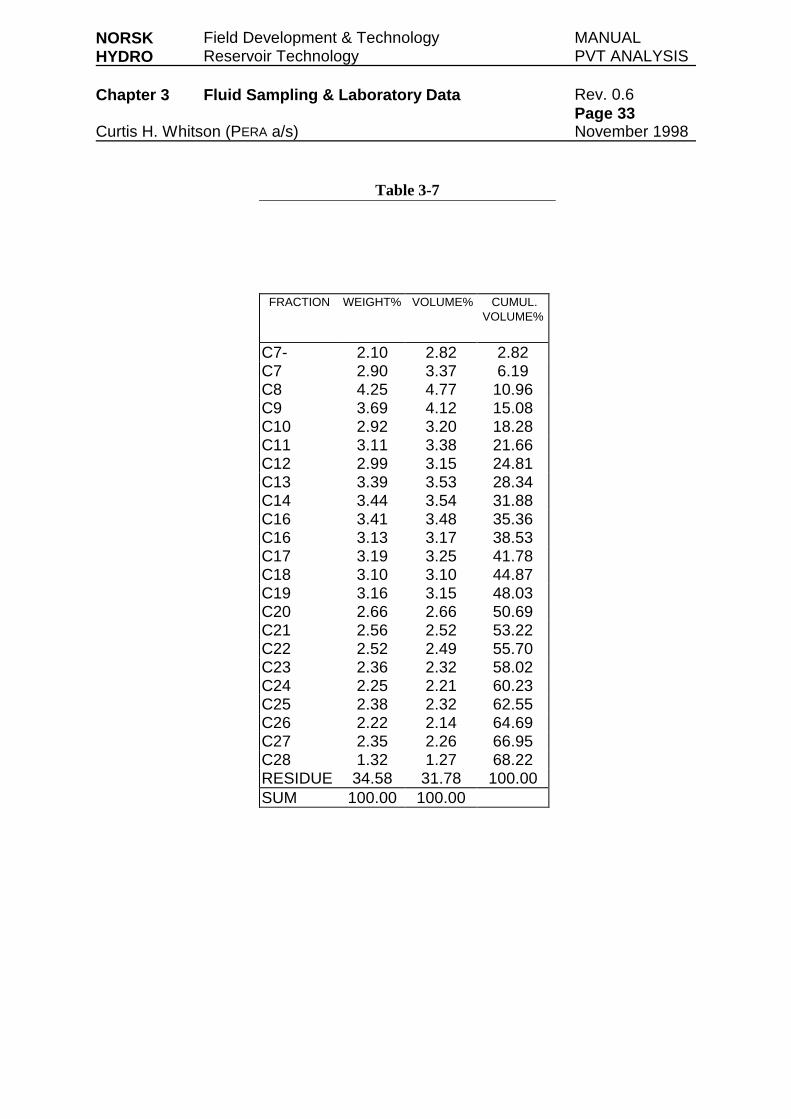
NORSK Field Development & Technology MANUALHYDRO Reservoir Technology PVT ANALYSIS
Chapter 3 Fluid Sampling & Laboratory Data Rev. 0.6Page 33
Curtis H. Whitson (PERA a/s) November 1998
Table 3-7
FRACTION WEIGHT% VOLUME% CUMUL.VOLUME%
C7- 2.10 2.82 2.82C7 2.90 3.37 6.19C8 4.25 4.77 10.96C9 3.69 4.12 15.08C10 2.92 3.20 18.28C11 3.11 3.38 21.66C12 2.99 3.15 24.81C13 3.39 3.53 28.34C14 3.44 3.54 31.88C16 3.41 3.48 35.36C16 3.13 3.17 38.53C17 3.19 3.25 41.78C18 3.10 3.10 44.87C19 3.16 3.15 48.03C20 2.66 2.66 50.69C21 2.56 2.52 53.22C22 2.52 2.49 55.70C23 2.36 2.32 58.02C24 2.25 2.21 60.23C25 2.38 2.32 62.55C26 2.22 2.14 64.69C27 2.35 2.26 66.95C28 1.32 1.27 68.22RESIDUE 34.58 31.78 100.00SUM 100.00 100.00
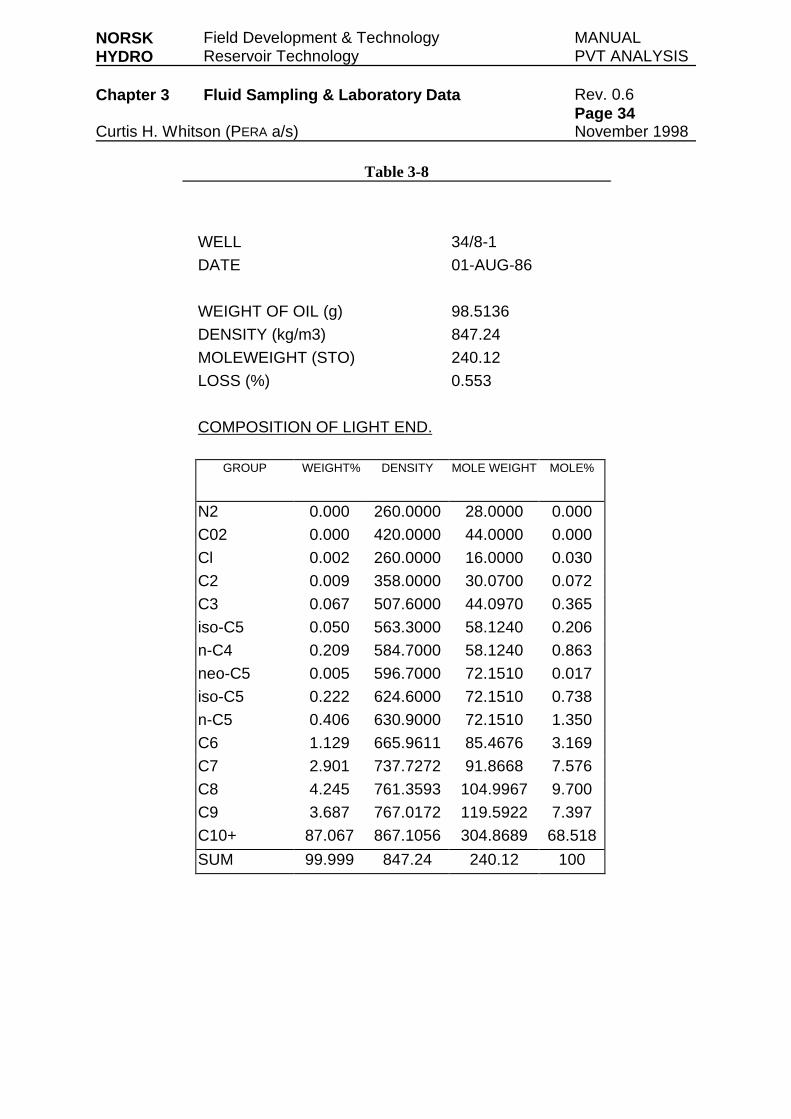
NORSK Field Development & Technology MANUALHYDRO Reservoir Technology PVT ANALYSIS
Chapter 3 Fluid Sampling & Laboratory Data Rev. 0.6Page 34
Curtis H. Whitson (PERA a/s) November 1998
Table 3-8
WELL 34/8-1
DATE 01-AUG-86
WEIGHT OF OIL (g) 98.5136
DENSITY (kg/m3) 847.24
MOLEWEIGHT (STO) 240.12
LOSS (%) 0.553
COMPOSITION OF LIGHT END.
GROUP WEIGHT% DENSITY MOLE WEIGHT MOLE%
N2 0.000 260.0000 28.0000 0.000
C02 0.000 420.0000 44.0000 0.000
Cl 0.002 260.0000 16.0000 0.030
C2 0.009 358.0000 30.0700 0.072
C3 0.067 507.6000 44.0970 0.365
iso-C5 0.050 563.3000 58.1240 0.206
n-C4 0.209 584.7000 58.1240 0.863
neo-C5 0.005 596.7000 72.1510 0.017
iso-C5 0.222 624.6000 72.1510 0.738
n-C5 0.406 630.9000 72.1510 1.350
C6 1.129 665.9611 85.4676 3.169
C7 2.901 737.7272 91.8668 7.576
C8 4.245 761.3593 104.9967 9.700
C9 3.687 767.0172 119.5922 7.397
C10+ 87.067 867.1056 304.8689 68.518
SUM 99.999 847.24 240.12 100
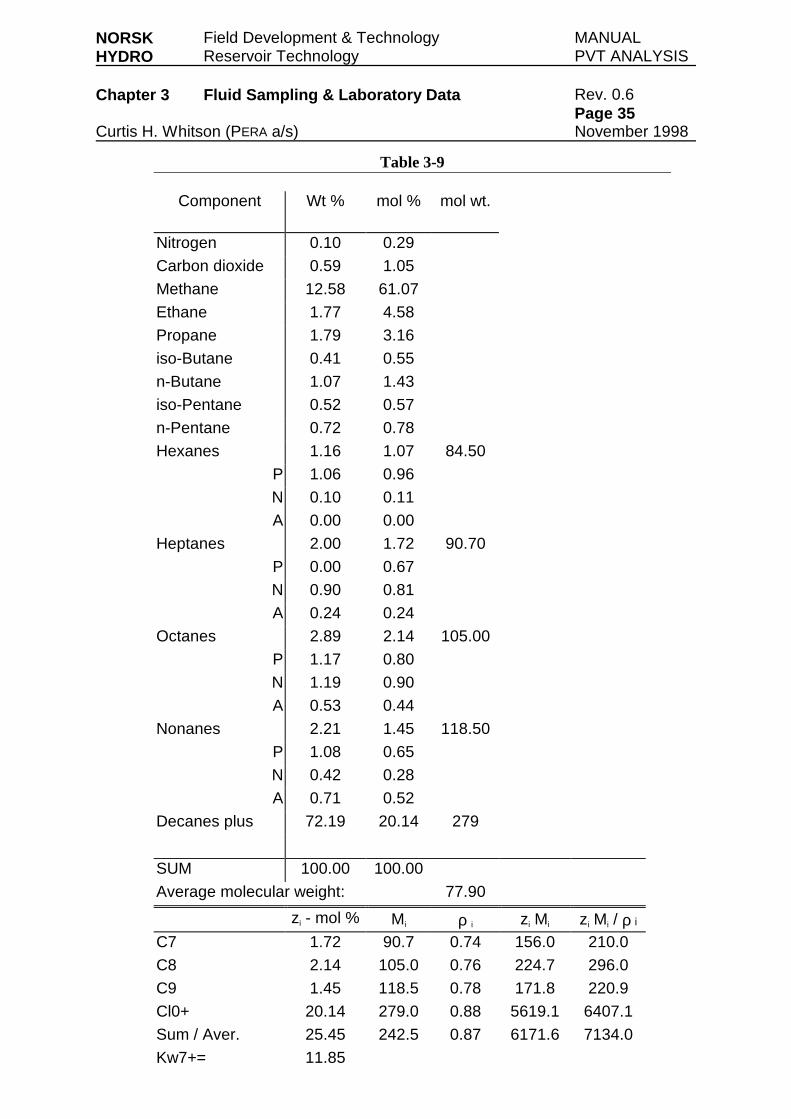
NORSK Field Development & Technology MANUALHYDRO Reservoir Technology PVT ANALYSIS
Chapter 3 Fluid Sampling & Laboratory Data Rev. 0.6Page 35
Curtis H. Whitson (PERA a/s) November 1998
Table 3-9
Component Wt % mol % mol wt.
Nitrogen 0.10 0.29
Carbon dioxide 0.59 1.05
Methane 12.58 61.07
Ethane 1.77 4.58
Propane 1.79 3.16
iso-Butane 0.41 0.55
n-Butane 1.07 1.43
iso-Pentane 0.52 0.57
n-Pentane 0.72 0.78
Hexanes 1.16 1.07 84.50
P 1.06 0.96
N 0.10 0.11
A 0.00 0.00
Heptanes 2.00 1.72 90.70
P 0.00 0.67
N 0.90 0.81
A 0.24 0.24
Octanes 2.89 2.14 105.00
P 1.17 0.80
N 1.19 0.90
A 0.53 0.44
Nonanes 2.21 1.45 118.50
P 1.08 0.65
N 0.42 0.28
A 0.71 0.52
Decanes plus 72.19 20.14 279
SUM 100.00 100.00
Average molecular weight: 77.90
zi - mol % Mi ρ i zi Mi zi Mi / ρ=
i
C7 1.72 90.7 0.74 156.0 210.0
C8 2.14 105.0 0.76 224.7 296.0
C9 1.45 118.5 0.78 171.8 220.9
Cl0+ 20.14 279.0 0.88 5619.1 6407.1
Sum / Aver. 25.45 242.5 0.87 6171.6 7134.0
Kw7+= 11.85
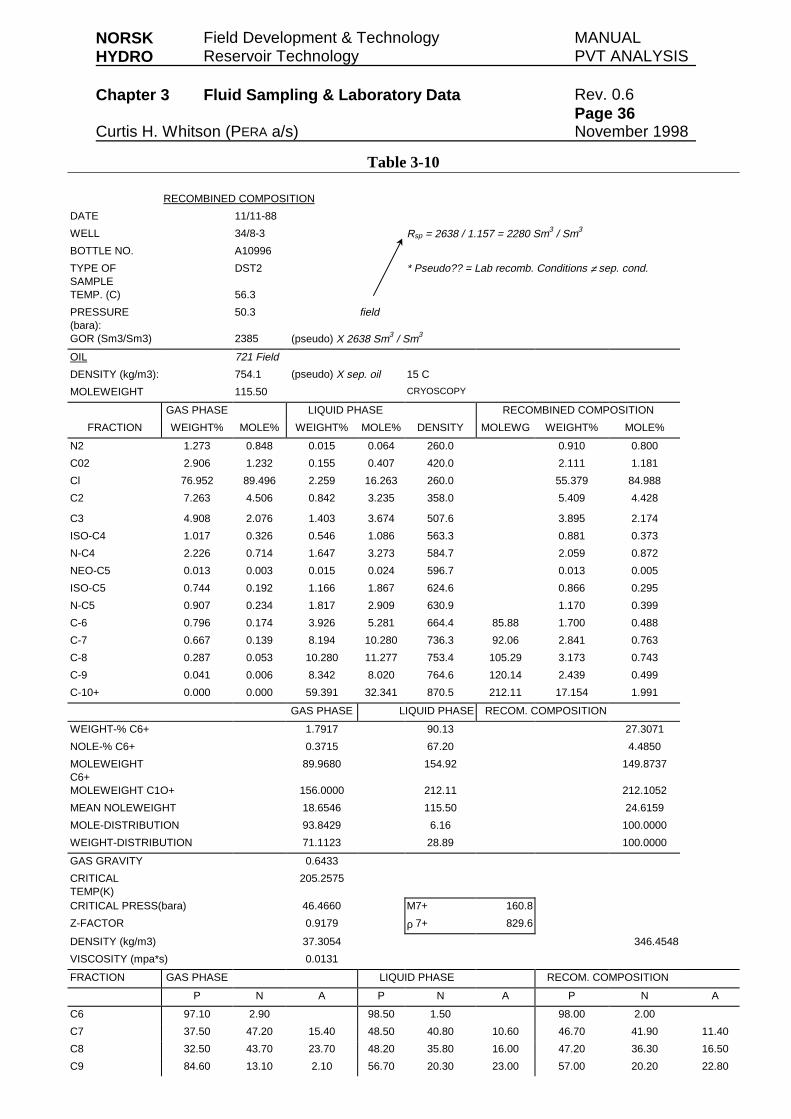
NORSK Field Development & Technology MANUALHYDRO Reservoir Technology PVT ANALYSIS
Chapter 3 Fluid Sampling & Laboratory Data Rev. 0.6Page 36
Curtis H. Whitson (PERA a/s) November 1998
Table 3-10
RECOMBINED COMPOSITION
DATE 11/11-88
WELL 34/8-3 Rsp = 2638 / 1.157 = 2280 Sm3 / Sm3
BOTTLE NO. A10996
TYPE OFSAMPLE
DST2 * Pseudo?? = Lab recomb. Conditions ≠=
sep. cond.
TEMP. (C) 56.3
PRESSURE(bara):
50.3 field
GOR (Sm3/Sm3) 2385 (pseudo) X 2638 Sm3 / Sm3
OIL 721 Field
DENSITY (kg/m3): 754.1 (pseudo) X sep. oil 15 C
MOLEWEIGHT 115.50 CRYOSCOPY
GAS PHASE LIQUID PHASE RECOMBINED COMPOSITION
FRACTION WEIGHT% MOLE% WEIGHT% MOLE% DENSITY MOLEWG WEIGHT% MOLE%
N2 1.273 0.848 0.015 0.064 260.0 0.910 0.800
C02 2.906 1.232 0.155 0.407 420.0 2.111 1.181
Cl 76.952 89.496 2.259 16.263 260.0 55.379 84.988
C2 7.263 4.506 0.842 3.235 358.0 5.409 4.428
C3 4.908 2.076 1.403 3.674 507.6 3.895 2.174
ISO-C4 1.017 0.326 0.546 1.086 563.3 0.881 0.373
N-C4 2.226 0.714 1.647 3.273 584.7 2.059 0.872
NEO-C5 0.013 0.003 0.015 0.024 596.7 0.013 0.005
ISO-C5 0.744 0.192 1.166 1.867 624.6 0.866 0.295
N-C5 0.907 0.234 1.817 2.909 630.9 1.170 0.399
C-6 0.796 0.174 3.926 5.281 664.4 85.88 1.700 0.488
C-7 0.667 0.139 8.194 10.280 736.3 92.06 2.841 0.763
C-8 0.287 0.053 10.280 11.277 753.4 105.29 3.173 0.743
C-9 0.041 0.006 8.342 8.020 764.6 120.14 2.439 0.499
C-10+ 0.000 0.000 59.391 32.341 870.5 212.11 17.154 1.991
GAS PHASE LIQUID PHASE RECOM. COMPOSITION
WEIGHT-% C6+ 1.7917 90.13 27.3071
NOLE-% C6+ 0.3715 67.20 4.4850
MOLEWEIGHTC6+
89.9680 154.92 149.8737
MOLEWEIGHT C1O+ 156.0000 212.11 212.1052
MEAN NOLEWEIGHT 18.6546 115.50 24.6159
MOLE-DISTRIBUTION 93.8429 6.16 100.0000
WEIGHT-DISTRIBUTION 71.1123 28.89 100.0000
GAS GRAVITY 0.6433
CRITICALTEMP(K)
205.2575
CRITICAL PRESS(bara) 46.4660 M7+ 160.8
Z-FACTOR 0.9179 ρ 7+ 829.6
DENSITY (kg/m3) 37.3054 346.4548
VISCOSITY (mpa*s) 0.0131
FRACTION GAS PHASE LIQUID PHASE RECOM. COMPOSITION
P N A P N A P N A
C6 97.10 2.90 98.50 1.50 98.00 2.00
C7 37.50 47.20 15.40 48.50 40.80 10.60 46.70 41.90 11.40
C8 32.50 43.70 23.70 48.20 35.80 16.00 47.20 36.30 16.50
C9 84.60 13.10 2.10 56.70 20.30 23.00 57.00 20.20 22.80
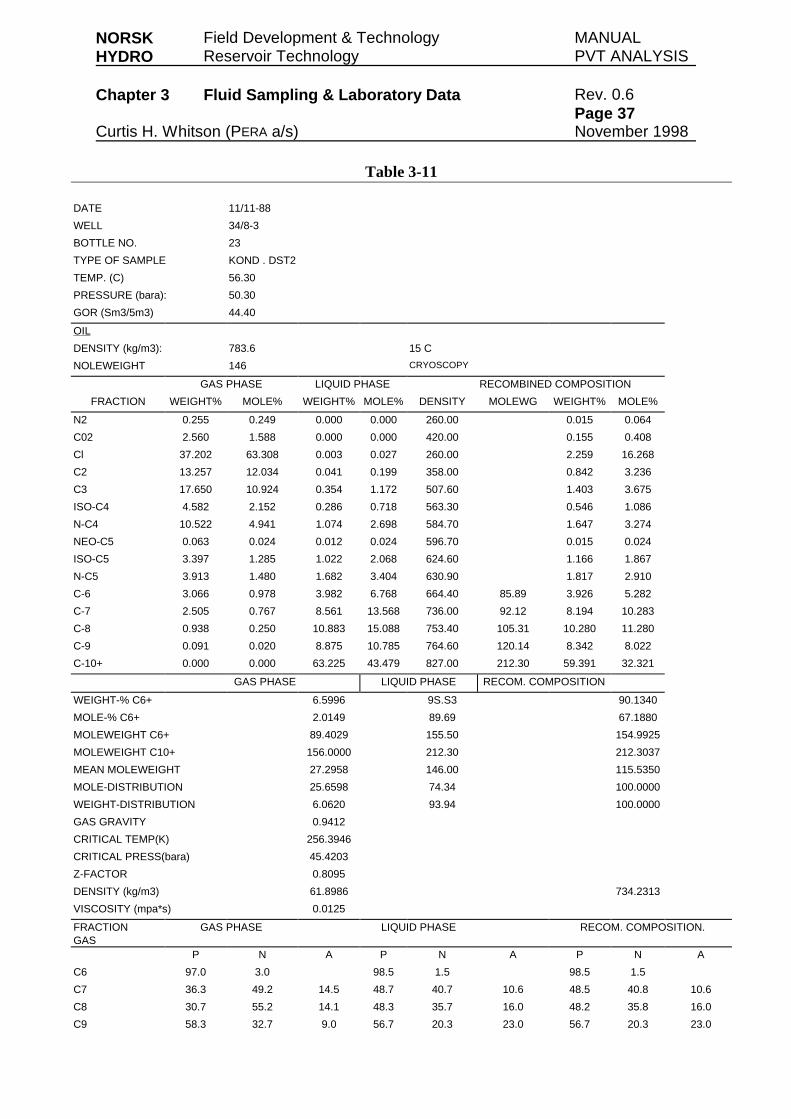
NORSK Field Development & Technology MANUALHYDRO Reservoir Technology PVT ANALYSIS
Chapter 3 Fluid Sampling & Laboratory Data Rev. 0.6Page 37
Curtis H. Whitson (PERA a/s) November 1998
Table 3-11
DATE 11/11-88
WELL 34/8-3
BOTTLE NO. 23
TYPE OF SAMPLE KOND . DST2
TEMP. (C) 56.30
PRESSURE (bara): 50.30
GOR (Sm3/5m3) 44.40
OIL
DENSITY (kg/m3): 783.6 15 C
NOLEWEIGHT 146 CRYOSCOPY
GAS PHASE LIQUID PHASE RECOMBINED COMPOSITION
FRACTION WEIGHT% MOLE% WEIGHT% MOLE% DENSITY MOLEWG WEIGHT% MOLE%
N2 0.255 0.249 0.000 0.000 260.00 0.015 0.064
C02 2.560 1.588 0.000 0.000 420.00 0.155 0.408
Cl 37.202 63.308 0.003 0.027 260.00 2.259 16.268
C2 13.257 12.034 0.041 0.199 358.00 0.842 3.236
C3 17.650 10.924 0.354 1.172 507.60 1.403 3.675
ISO-C4 4.582 2.152 0.286 0.718 563.30 0.546 1.086
N-C4 10.522 4.941 1.074 2.698 584.70 1.647 3.274
NEO-C5 0.063 0.024 0.012 0.024 596.70 0.015 0.024
ISO-C5 3.397 1.285 1.022 2.068 624.60 1.166 1.867
N-C5 3.913 1.480 1.682 3.404 630.90 1.817 2.910
C-6 3.066 0.978 3.982 6.768 664.40 85.89 3.926 5.282
C-7 2.505 0.767 8.561 13.568 736.00 92.12 8.194 10.283
C-8 0.938 0.250 10.883 15.088 753.40 105.31 10.280 11.280
C-9 0.091 0.020 8.875 10.785 764.60 120.14 8.342 8.022
C-10+ 0.000 0.000 63.225 43.479 827.00 212.30 59.391 32.321
GAS PHASE LIQUID PHASE RECOM. COMPOSITION
WEIGHT-% C6+ 6.5996 9S.S3 90.1340
MOLE-% C6+ 2.0149 89.69 67.1880
MOLEWEIGHT C6+ 89.4029 155.50 154.9925
MOLEWEIGHT C10+ 156.0000 212.30 212.3037
MEAN MOLEWEIGHT 27.2958 146.00 115.5350
MOLE-DISTRIBUTION 25.6598 74.34 100.0000
WEIGHT-DISTRIBUTION 6.0620 93.94 100.0000
GAS GRAVITY 0.9412
CRITICAL TEMP(K) 256.3946
CRITICAL PRESS(bara) 45.4203
Z-FACTOR 0.8095
DENSITY (kg/m3) 61.8986 734.2313
VISCOSITY (mpa*s) 0.0125
FRACTIONGAS
GAS PHASE LIQUID PHASE RECOM. COMPOSITION.
P N A P N A P N A
C6 97.0 3.0 98.5 1.5 98.5 1.5
C7 36.3 49.2 14.5 48.7 40.7 10.6 48.5 40.8 10.6
C8 30.7 55.2 14.1 48.3 35.7 16.0 48.2 35.8 16.0
C9 58.3 32.7 9.0 56.7 20.3 23.0 56.7 20.3 23.0
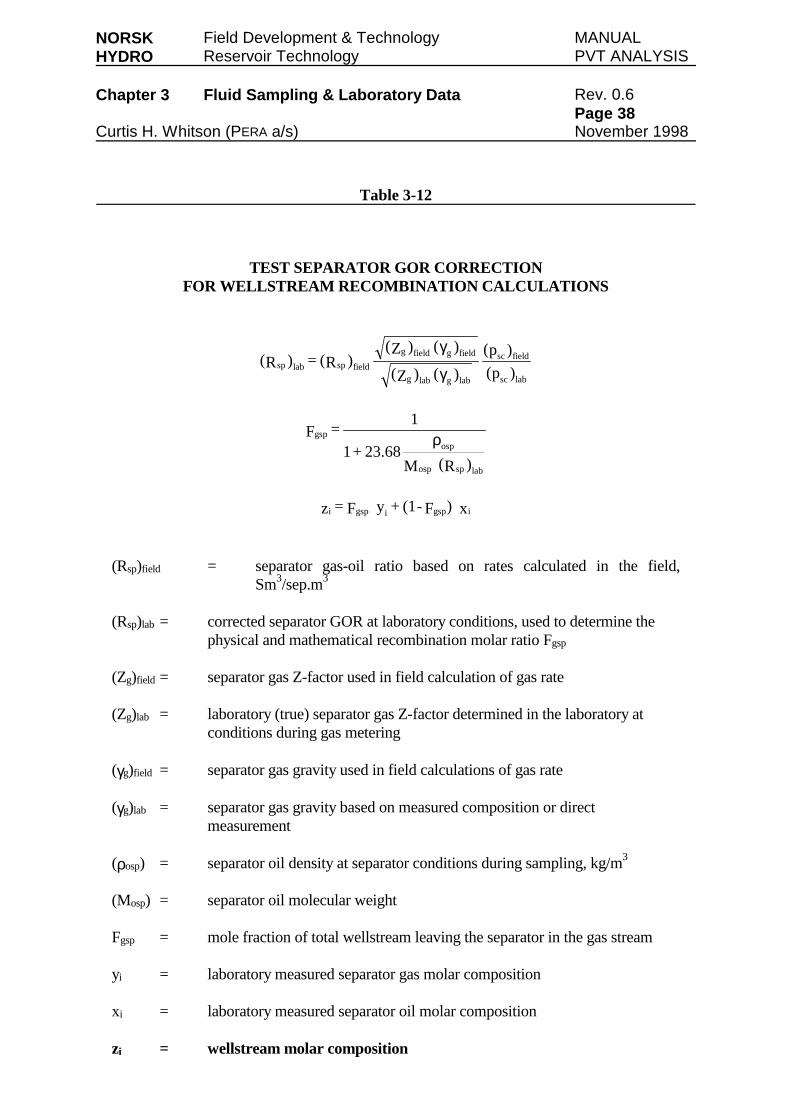
NORSK Field Development & Technology MANUALHYDRO Reservoir Technology PVT ANALYSIS
Chapter 3 Fluid Sampling & Laboratory Data Rev. 0.6Page 38
Curtis H. Whitson (PERA a/s) November 1998
Table 3-12
TEST SEPARATOR GOR CORRECTIONFOR WELLSTREAM RECOMBINATION CALCULATIONS
)p(
)p(
)()Z(
)()Z()R(=)R(
labsc
fieldsc
labglabg
fieldgfieldg
fieldsplabspγ
γ
)R(M23.68+1
1=F
labsposp
ospgsp ρ
x)F-(1+yF=z igspigspi
(Rsp)field = separator gas-oil ratio based on rates calculated in the field,Sm3/sep.m3
(Rsp)lab = corrected separator GOR at laboratory conditions, used to determine thephysical and mathematical recombination molar ratio Fgsp
(Zg)field = separator gas Z-factor used in field calculation of gas rate
(Zg)lab = laboratory (true) separator gas Z-factor determined in the laboratory atconditions during gas metering
(γg)field = separator gas gravity used in field calculations of gas rate
(γg)lab = separator gas gravity based on measured composition or directmeasurement
(ρosp) = separator oil density at separator conditions during sampling, kg/m3
(Mosp) = separator oil molecular weight
Fgsp = mole fraction of total wellstream leaving the separator in the gas stream
yi = laboratory measured separator gas molar composition
xi = laboratory measured separator oil molar composition
zi = wellstream molar composition
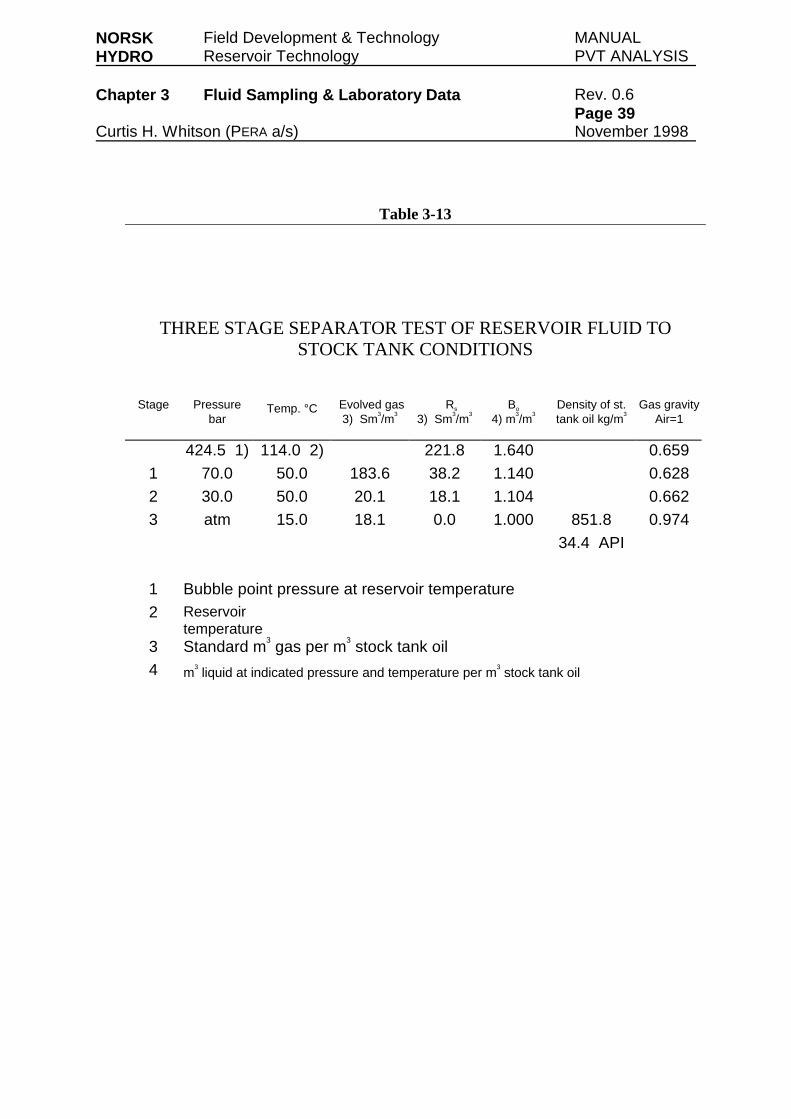
NORSK Field Development & Technology MANUALHYDRO Reservoir Technology PVT ANALYSIS
Chapter 3 Fluid Sampling & Laboratory Data Rev. 0.6Page 39
Curtis H. Whitson (PERA a/s) November 1998
Table 3-13
THREE STAGE SEPARATOR TEST OF RESERVOIR FLUID TOSTOCK TANK CONDITIONS
Stage Pressurebar
Temp. °C Evolved gas3) Sm
3/m
3Rs
3) Sm3/m
3Bo
4) m3/m
3Density of st.tank oil kg/m
3Gas gravity
Air=1
424.5 1) 114.0 2) 221.8 1.640 0.659
1 70.0 50.0 183.6 38.2 1.140 0.628
2 30.0 50.0 20.1 18.1 1.104 0.662
3 atm 15.0 18.1 0.0 1.000 851.8 0.974
34.4 API
1 Bubble point pressure at reservoir temperature
2 Reservoirtemperature
3 Standard m3
gas per m3
stock tank oil
4 m3
liquid at indicated pressure and temperature per m3
stock tank oil
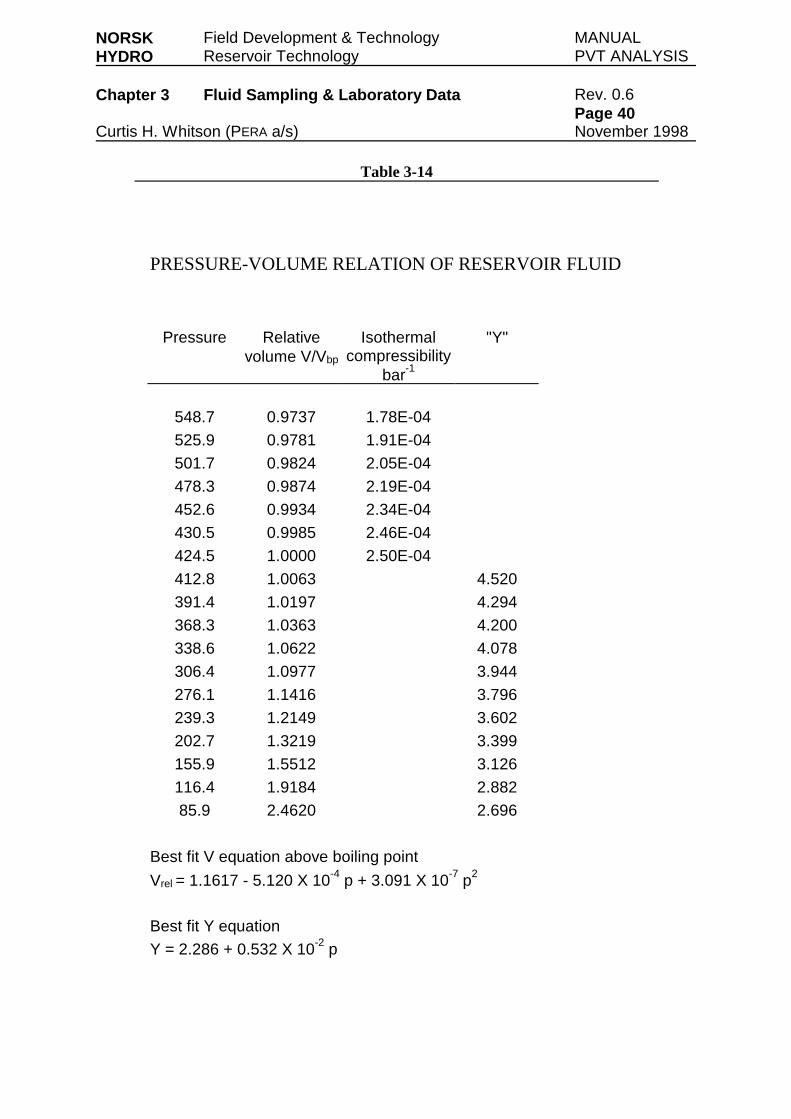
NORSK Field Development & Technology MANUALHYDRO Reservoir Technology PVT ANALYSIS
Chapter 3 Fluid Sampling & Laboratory Data Rev. 0.6Page 40
Curtis H. Whitson (PERA a/s) November 1998
Table 3-14
PRESSURE-VOLUME RELATION OF RESERVOIR FLUID
Pressure Relativevolume V/Vbp
Isothermalcompressibility
bar-1
"Y"
548.7 0.9737 1.78E-04
525.9 0.9781 1.91E-04
501.7 0.9824 2.05E-04
478.3 0.9874 2.19E-04
452.6 0.9934 2.34E-04
430.5 0.9985 2.46E-04
424.5 1.0000 2.50E-04
412.8 1.0063 4.520
391.4 1.0197 4.294
368.3 1.0363 4.200
338.6 1.0622 4.078
306.4 1.0977 3.944
276.1 1.1416 3.796
239.3 1.2149 3.602
202.7 1.3219 3.399
155.9 1.5512 3.126
116.4 1.9184 2.882
85.9 2.4620 2.696
Best fit V equation above boiling point
Vrel = 1.1617 - 5.120 X 10⁻⁴ p + 3.091 X 10⁻⁷ p2
Best fit Y equation
Y = 2.286 + 0.532 X 10⁻² p
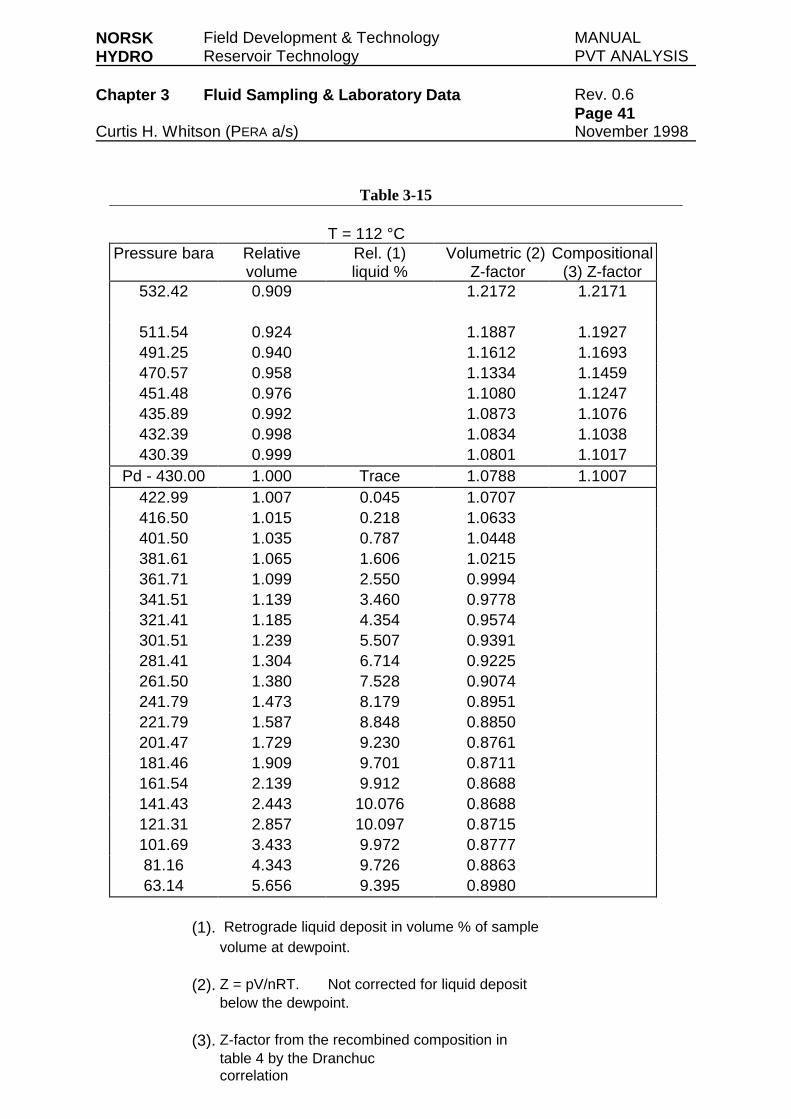
NORSK Field Development & Technology MANUALHYDRO Reservoir Technology PVT ANALYSIS
Chapter 3 Fluid Sampling & Laboratory Data Rev. 0.6Page 41
Curtis H. Whitson (PERA a/s) November 1998
Table 3-15
T = 112 °CPressure bara Relative
volumeRel. (1)liquid %
Volumetric (2)Z-factor
Compositional(3) Z-factor
532.42 0.909 1.2172 1.2171
511.54 0.924 1.1887 1.1927491.25 0.940 1.1612 1.1693470.57 0.958 1.1334 1.1459451.48 0.976 1.1080 1.1247435.89 0.992 1.0873 1.1076432.39 0.998 1.0834 1.1038430.39 0.999 1.0801 1.1017
Pd - 430.00 1.000 Trace 1.0788 1.1007422.99 1.007 0.045 1.0707416.50 1.015 0.218 1.0633401.50 1.035 0.787 1.0448381.61 1.065 1.606 1.0215361.71 1.099 2.550 0.9994341.51 1.139 3.460 0.9778321.41 1.185 4.354 0.9574301.51 1.239 5.507 0.9391281.41 1.304 6.714 0.9225261.50 1.380 7.528 0.9074241.79 1.473 8.179 0.8951221.79 1.587 8.848 0.8850201.47 1.729 9.230 0.8761181.46 1.909 9.701 0.8711161.54 2.139 9.912 0.8688141.43 2.443 10.076 0.8688121.31 2.857 10.097 0.8715101.69 3.433 9.972 0.877781.16 4.343 9.726 0.886363.14 5.656 9.395 0.8980
(1). Retrograde liquid deposit in volume % of samplevolume at dewpoint.
(2). Z = pV/nRT. Not corrected for liquid depositbelow the dewpoint.
(3). Z-factor from the recombined composition intable 4 by the Dranchuccorrelation
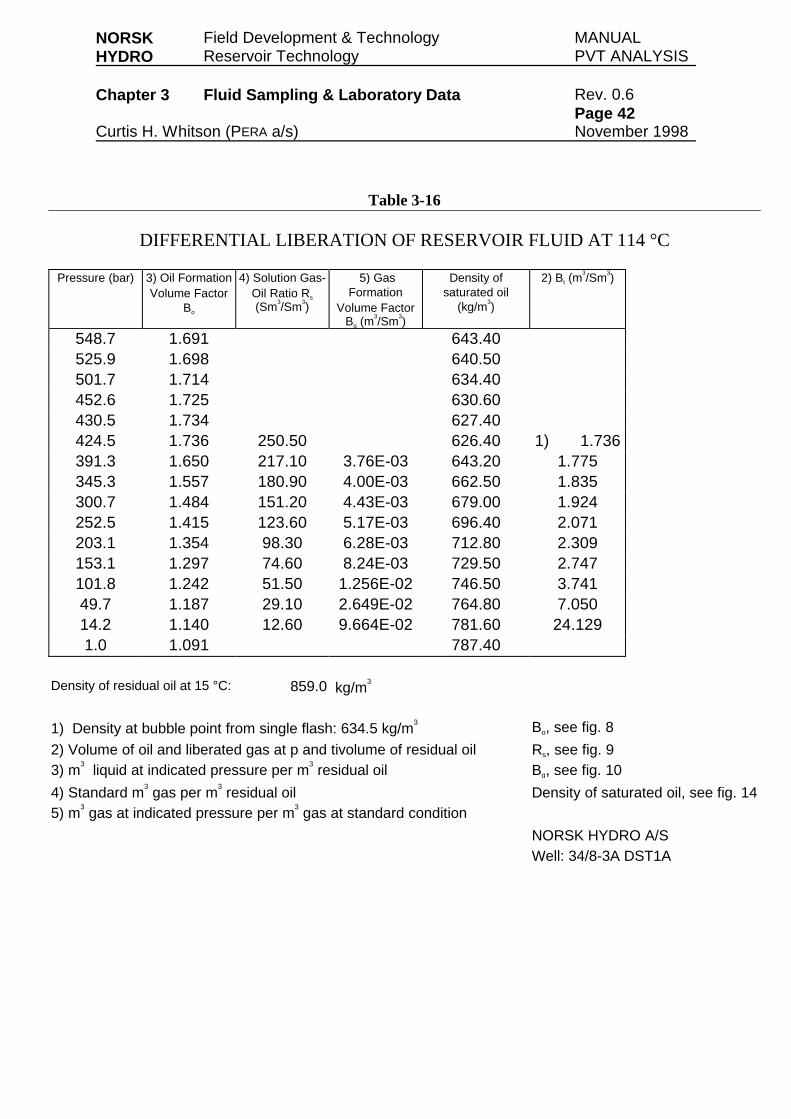
NORSK Field Development & Technology MANUALHYDRO Reservoir Technology PVT ANALYSIS
Chapter 3 Fluid Sampling & Laboratory Data Rev. 0.6Page 42
Curtis H. Whitson (PERA a/s) November 1998
Table 3-16
DIFFERENTIAL LIBERATION OF RESERVOIR FLUID AT 114 °C
Pressure (bar) 3) Oil FormationVolume Factor
Bo
4) Solution Gas-Oil Ratio Rs
(Sm3/Sm
3)
5) GasFormation
Volume FactorBg (m
3/Sm
3)
Density ofsaturated oil
(kg/m3)
2) Bt (m3/Sm
3)
548.7 1.691 643.40525.9 1.698 640.50501.7 1.714 634.40452.6 1.725 630.60430.5 1.734 627.40424.5 1.736 250.50 626.40 1) 1.736391.3 1.650 217.10 3.76E-03 643.20 1.775345.3 1.557 180.90 4.00E-03 662.50 1.835300.7 1.484 151.20 4.43E-03 679.00 1.924252.5 1.415 123.60 5.17E-03 696.40 2.071203.1 1.354 98.30 6.28E-03 712.80 2.309153.1 1.297 74.60 8.24E-03 729.50 2.747101.8 1.242 51.50 1.256E-02 746.50 3.74149.7 1.187 29.10 2.649E-02 764.80 7.05014.2 1.140 12.60 9.664E-02 781.60 24.1291.0 1.091 787.40
Density of residual oil at 15 °C: 859.0 kg/m3
1) Density at bubble point from single flash: 634.5 kg/m3 Bo, see fig. 8
2) Volume of oil and liberated gas at p and tivolume of residual oil Rs, see fig. 93) m
3liquid at indicated pressure per m
3residual oil Bg, see fig. 10
4) Standard m3
gas per m3
residual oil Density of saturated oil, see fig. 145) m
3gas at indicated pressure per m
3gas at standard condition
NORSK HYDRO A/SWell: 34/8-3A DST1A
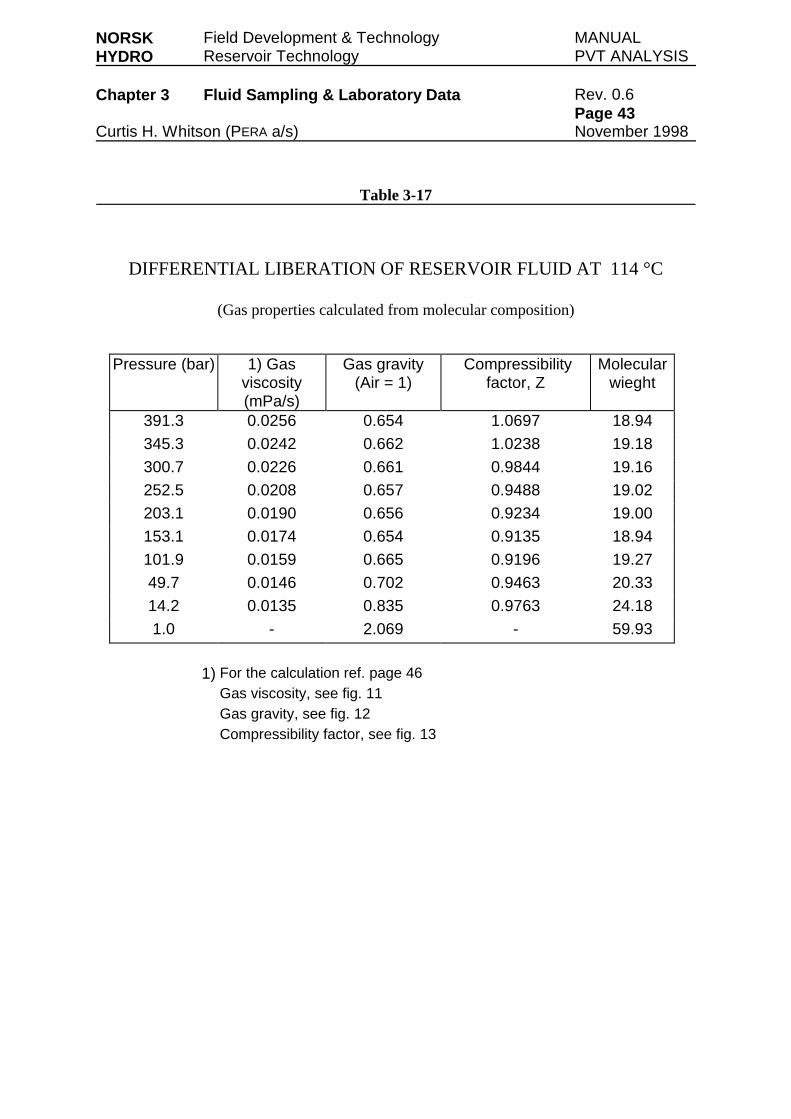
NORSK Field Development & Technology MANUALHYDRO Reservoir Technology PVT ANALYSIS
Chapter 3 Fluid Sampling & Laboratory Data Rev. 0.6Page 43
Curtis H. Whitson (PERA a/s) November 1998
Table 3-17
DIFFERENTIAL LIBERATION OF RESERVOIR FLUID AT 114 °C
(Gas properties calculated from molecular composition)
Pressure (bar) 1) Gasviscosity(mPa/s)
Gas gravity(Air = 1)
Compressibilityfactor, Z
Molecularwieght
391.3 0.0256 0.654 1.0697 18.94
345.3 0.0242 0.662 1.0238 19.18
300.7 0.0226 0.661 0.9844 19.16
252.5 0.0208 0.657 0.9488 19.02
203.1 0.0190 0.656 0.9234 19.00
153.1 0.0174 0.654 0.9135 18.94
101.9 0.0159 0.665 0.9196 19.27
49.7 0.0146 0.702 0.9463 20.33
14.2 0.0135 0.835 0.9763 24.18
1.0 - 2.069 - 59.93
1) For the calculation ref. page 46Gas viscosity, see fig. 11Gas gravity, see fig. 12Compressibility factor, see fig. 13
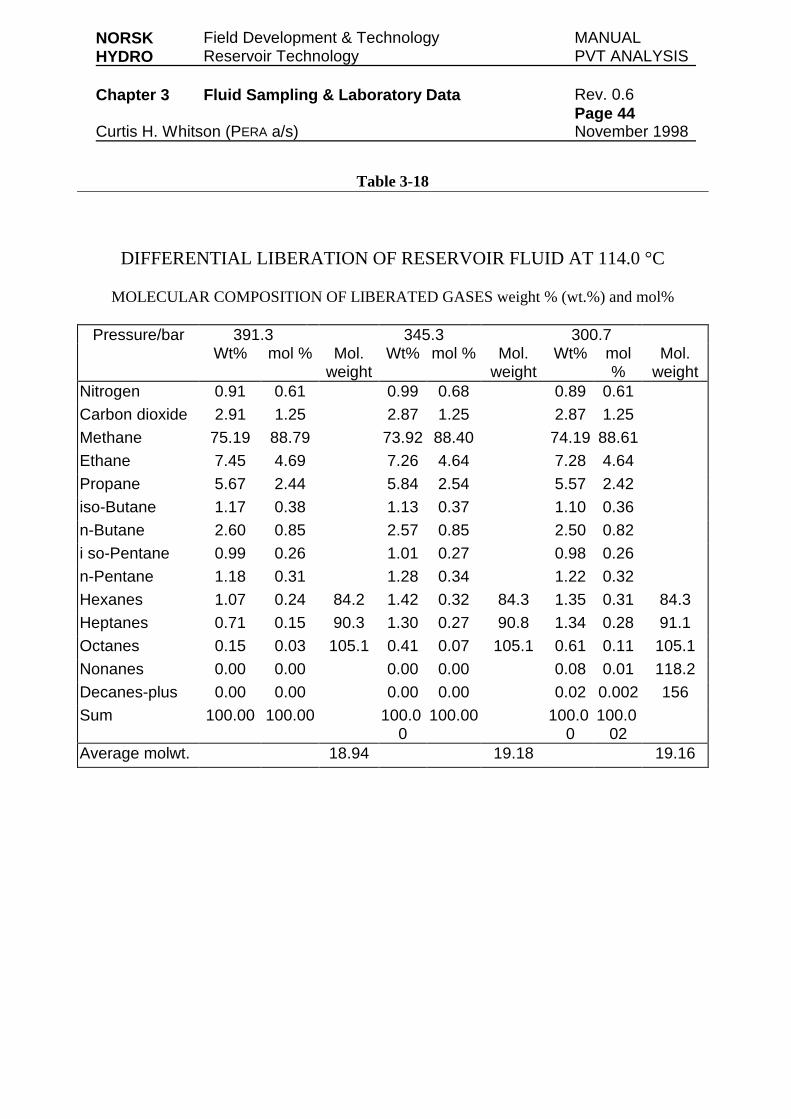
NORSK Field Development & Technology MANUALHYDRO Reservoir Technology PVT ANALYSIS
Chapter 3 Fluid Sampling & Laboratory Data Rev. 0.6Page 44
Curtis H. Whitson (PERA a/s) November 1998
Table 3-18
DIFFERENTIAL LIBERATION OF RESERVOIR FLUID AT 114.0 °C
MOLECULAR COMPOSITION OF LIBERATED GASES weight % (wt.%) and mol%
Pressure/bar 391.3 345.3 300.7Wt% mol % Mol.
weightWt% mol % Mol.
weightWt% mol
%Mol.
weightNitrogen 0.91 0.61 0.99 0.68 0.89 0.61
Carbon dioxide 2.91 1.25 2.87 1.25 2.87 1.25
Methane 75.19 88.79 73.92 88.40 74.19 88.61
Ethane 7.45 4.69 7.26 4.64 7.28 4.64
Propane 5.67 2.44 5.84 2.54 5.57 2.42
iso-Butane 1.17 0.38 1.13 0.37 1.10 0.36
n-Butane 2.60 0.85 2.57 0.85 2.50 0.82
i so-Pentane 0.99 0.26 1.01 0.27 0.98 0.26
n-Pentane 1.18 0.31 1.28 0.34 1.22 0.32
Hexanes 1.07 0.24 84.2 1.42 0.32 84.3 1.35 0.31 84.3
Heptanes 0.71 0.15 90.3 1.30 0.27 90.8 1.34 0.28 91.1
Octanes 0.15 0.03 105.1 0.41 0.07 105.1 0.61 0.11 105.1
Nonanes 0.00 0.00 0.00 0.00 0.08 0.01 118.2
Decanes-plus 0.00 0.00 0.00 0.00 0.02 0.002 156
Sum 100.00 100.00 100.00
100.00 100.00
100.002
Average molwt. 18.94 19.18 19.16
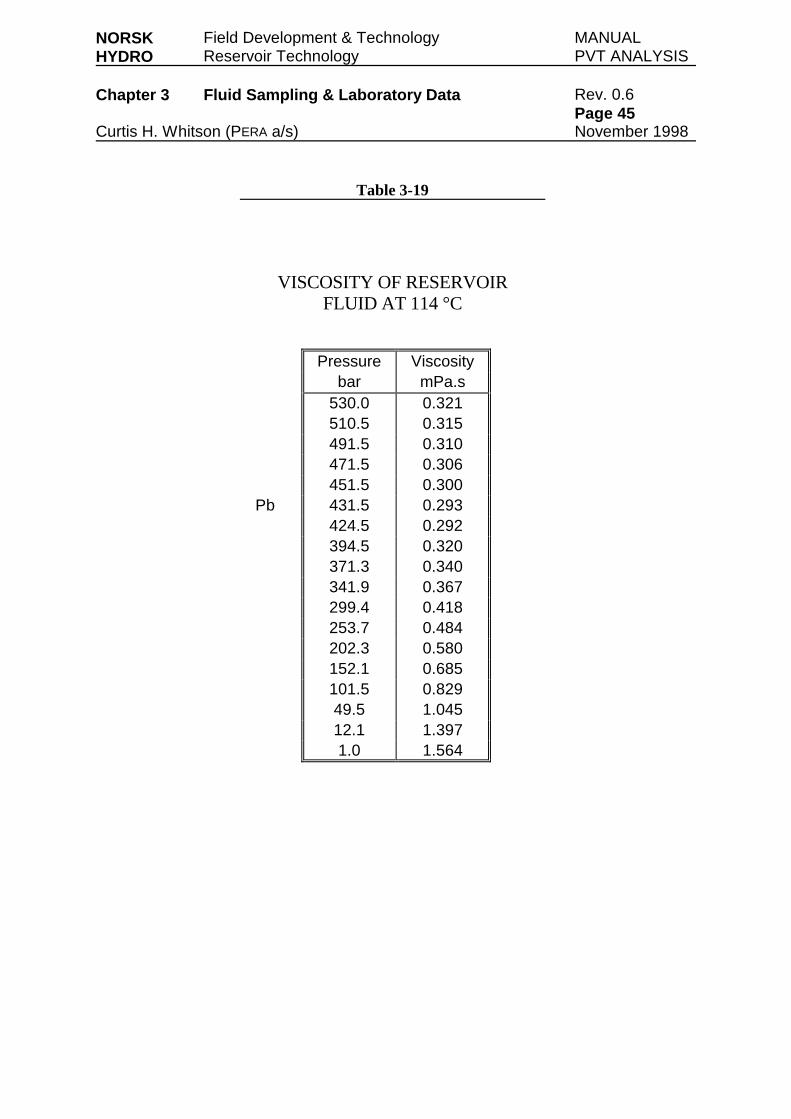
NORSK Field Development & Technology MANUALHYDRO Reservoir Technology PVT ANALYSIS
Chapter 3 Fluid Sampling & Laboratory Data Rev. 0.6Page 45
Curtis H. Whitson (PERA a/s) November 1998
Table 3-19
VISCOSITY OF RESERVOIRFLUID AT 114 °C
Pressure Viscositybar mPa.s
530.0 0.321510.5 0.315491.5 0.310471.5 0.306451.5 0.300
Pb 431.5 0.293424.5 0.292394.5 0.320371.3 0.340341.9 0.367299.4 0.418253.7 0.484202.3 0.580152.1 0.685101.5 0.82949.5 1.04512.1 1.3971.0 1.564
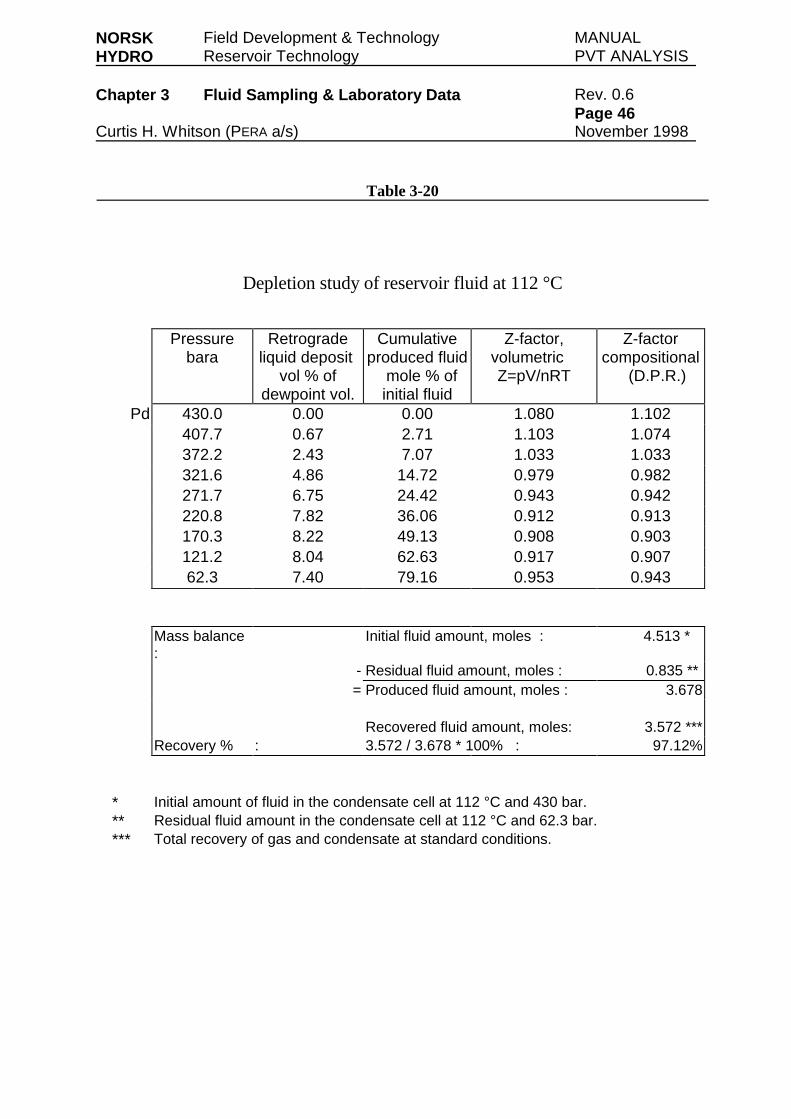
NORSK Field Development & Technology MANUALHYDRO Reservoir Technology PVT ANALYSIS
Chapter 3 Fluid Sampling & Laboratory Data Rev. 0.6Page 46
Curtis H. Whitson (PERA a/s) November 1998
Table 3-20
Depletion study of reservoir fluid at 112 °C
Pressurebara
Retrogradeliquid deposit
vol % ofdewpoint vol.
Cumulativeproduced fluid
mole % ofinitial fluid
Z-factor,volumetricZ=pV/nRT
Z-factorcompositional
(D.P.R.)
Pd 430.0 0.00 0.00 1.080 1.102407.7 0.67 2.71 1.103 1.074372.2 2.43 7.07 1.033 1.033321.6 4.86 14.72 0.979 0.982271.7 6.75 24.42 0.943 0.942220.8 7.82 36.06 0.912 0.913170.3 8.22 49.13 0.908 0.903121.2 8.04 62.63 0.917 0.90762.3 7.40 79.16 0.953 0.943
Mass balance:
Initial fluid amount, moles : 4.513 *
- Residual fluid amount, moles : 0.835 **= Produced fluid amount, moles : 3.678
Recovered fluid amount, moles: 3.572 ***Recovery % : 3.572 / 3.678 * 100% : 97.12%
* Initial amount of fluid in the condensate cell at 112 °C and 430 bar.** Residual fluid amount in the condensate cell at 112 °C and 62.3 bar.*** Total recovery of gas and condensate at standard conditions.
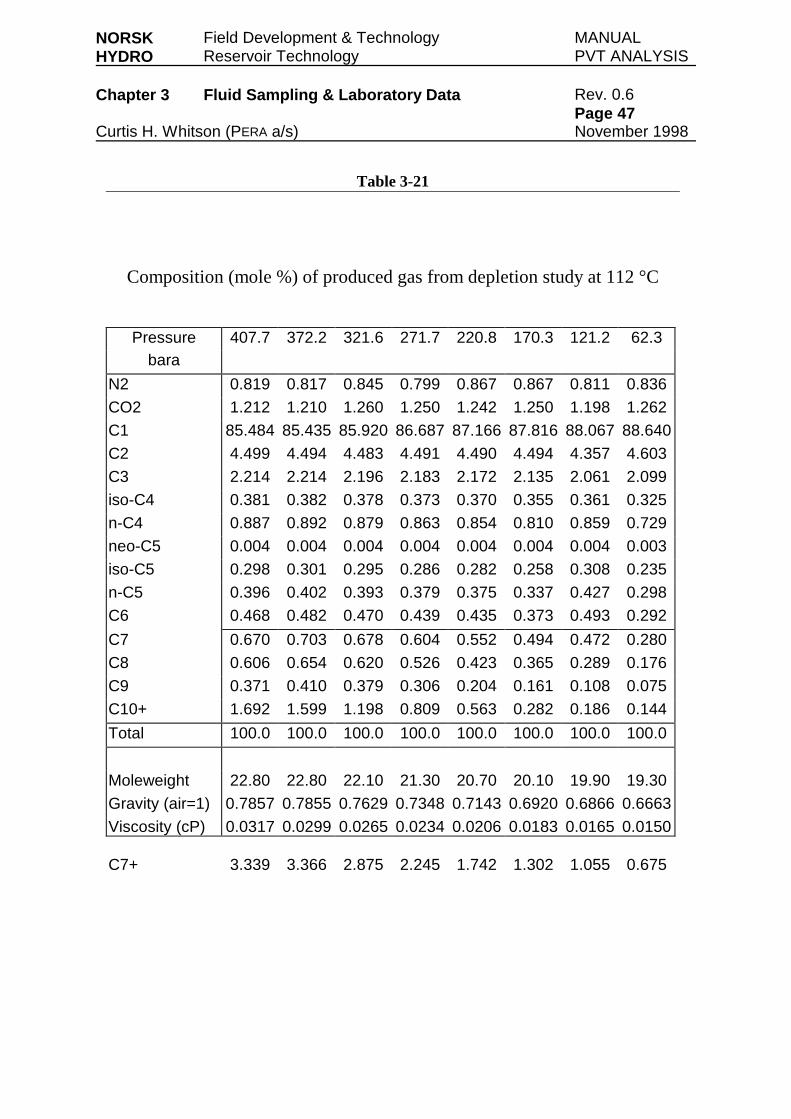
NORSK Field Development & Technology MANUALHYDRO Reservoir Technology PVT ANALYSIS
Chapter 3 Fluid Sampling & Laboratory Data Rev. 0.6Page 47
Curtis H. Whitson (PERA a/s) November 1998
Table 3-21
Composition (mole %) of produced gas from depletion study at 112 °C
Pressure 407.7 372.2 321.6 271.7 220.8 170.3 121.2 62.3bara
N2 0.819 0.817 0.845 0.799 0.867 0.867 0.811 0.836
CO2 1.212 1.210 1.260 1.250 1.242 1.250 1.198 1.262
C1 85.484 85.435 85.920 86.687 87.166 87.816 88.067 88.640
C2 4.499 4.494 4.483 4.491 4.490 4.494 4.357 4.603
C3 2.214 2.214 2.196 2.183 2.172 2.135 2.061 2.099
iso-C4 0.381 0.382 0.378 0.373 0.370 0.355 0.361 0.325
n-C4 0.887 0.892 0.879 0.863 0.854 0.810 0.859 0.729
neo-C5 0.004 0.004 0.004 0.004 0.004 0.004 0.004 0.003
iso-C5 0.298 0.301 0.295 0.286 0.282 0.258 0.308 0.235
n-C5 0.396 0.402 0.393 0.379 0.375 0.337 0.427 0.298
C6 0.468 0.482 0.470 0.439 0.435 0.373 0.493 0.292
C7 0.670 0.703 0.678 0.604 0.552 0.494 0.472 0.280
C8 0.606 0.654 0.620 0.526 0.423 0.365 0.289 0.176
C9 0.371 0.410 0.379 0.306 0.204 0.161 0.108 0.075
C10+ 1.692 1.599 1.198 0.809 0.563 0.282 0.186 0.144
Total 100.0 100.0 100.0 100.0 100.0 100.0 100.0 100.0
Moleweight 22.80 22.80 22.10 21.30 20.70 20.10 19.90 19.30
Gravity (air=1) 0.7857 0.7855 0.7629 0.7348 0.7143 0.6920 0.6866 0.6663
Viscosity (cP) 0.0317 0.0299 0.0265 0.0234 0.0206 0.0183 0.0165 0.0150
C7+ 3.339 3.366 2.875 2.245 1.742 1.302 1.055 0.675

NORSK Field Development & Technology MANUALHYDRO Reservoir Technology PVT ANALYSIS
Chapter 3 Fluid Sampling & Laboratory Data Rev. 0.6Page 48
Curtis H. Whitson (PERA a/s) November 1998
Table 3-22
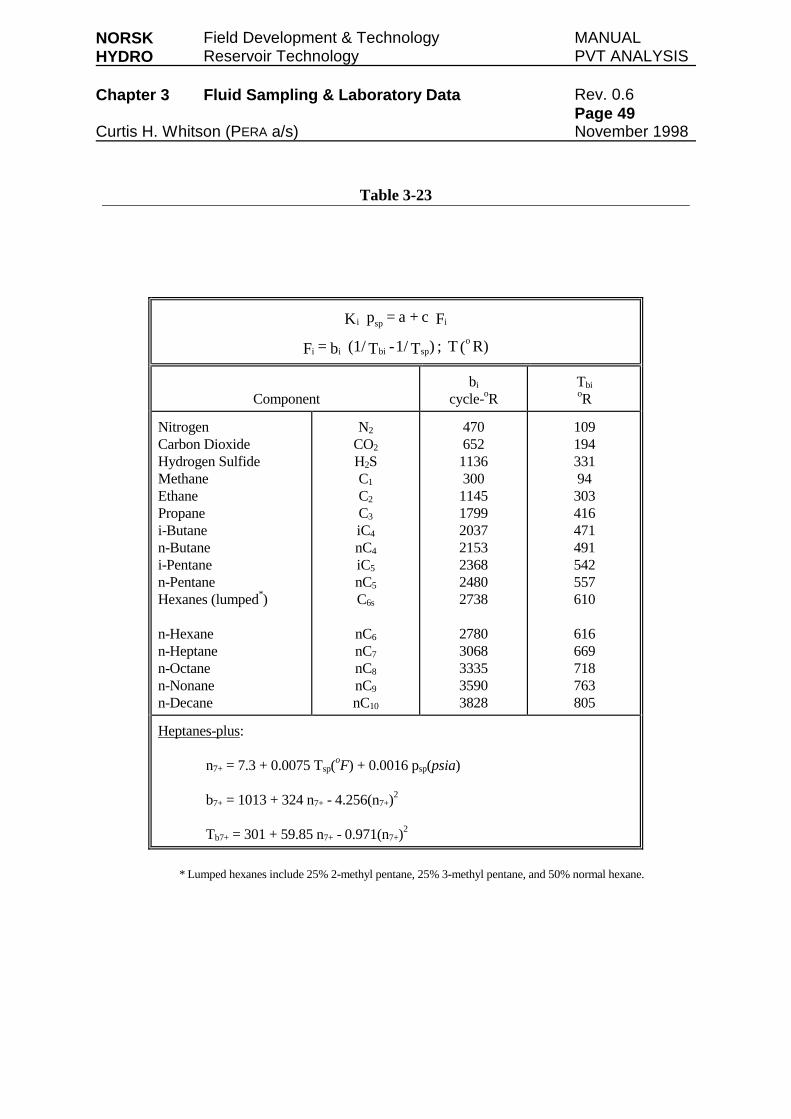
NORSK Field Development & Technology MANUALHYDRO Reservoir Technology PVT ANALYSIS
Chapter 3 Fluid Sampling & Laboratory Data Rev. 0.6Page 49
Curtis H. Whitson (PERA a/s) November 1998
Table 3-23
R)(T;)T1/-T(1/b=F
Fc+a=pKo
spbiii
ispi
Componentbi
cycle-oRTbioR
NitrogenCarbon DioxideHydrogen SulfideMethaneEthanePropanei-Butanen-Butanei-Pentanen-PentaneHexanes (lumped*)
n-Hexanen-Heptanen-Octanen-Nonanen-Decane
N2
CO2
H2SC1
C2
C3
iC4
nC4
iC5
nC5
C6s
nC6
nC7
nC8
nC9
nC10
470652
1136300
1145179920372153236824802738
27803068333535903828
10919433194303416471491542557610
616669718763805
Heptanes-plus:
n7+ = 7.3 + 0.0075 Tsp(oF) + 0.0016 psp(psia)
b7+ = 1013 + 324 n7+ - 4.256(n7+)2
Tb7+ = 301 + 59.85 n7+ - 0.971(n7+)2
* Lumped hexanes include 25% 2-methyl pentane, 25% 3-methyl pentane, and 50% normal hexane.

NORSK Field Development & Technology MANUALHYDRO Reservoir Technology PVT ANALYSIS
Chapter 3 Fluid Sampling & Laboratory Data Rev. 0.6Page 50
Curtis H. Whitson (PERA a/s) November 1998
Table 3-24
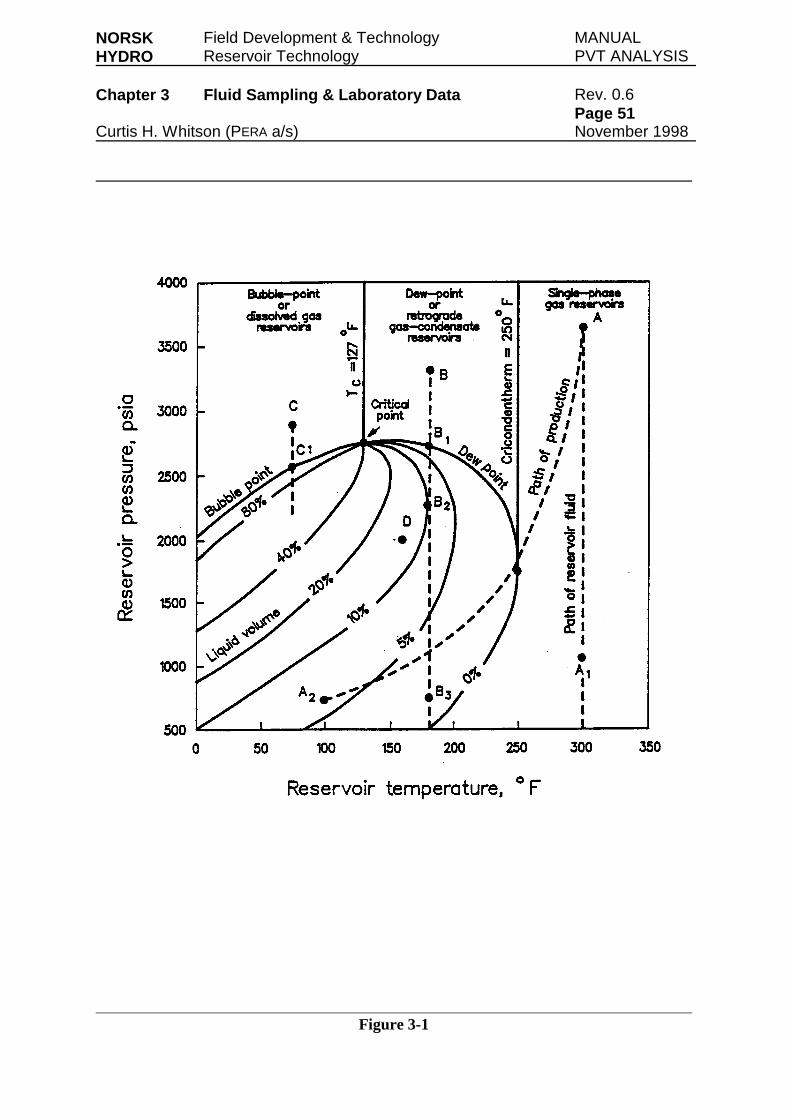
NORSK Field Development & Technology MANUALHYDRO Reservoir Technology PVT ANALYSIS
Chapter 3 Fluid Sampling & Laboratory Data Rev. 0.6Page 51
Curtis H. Whitson (PERA a/s) November 1998
Figure 3-1
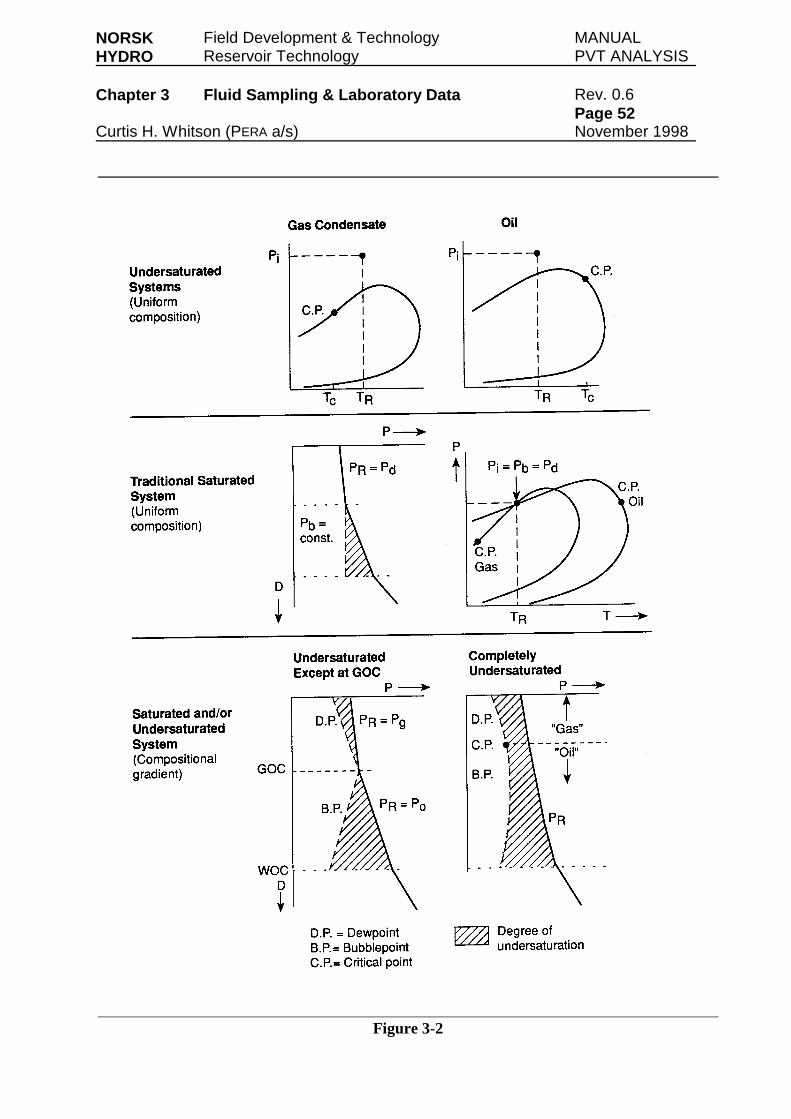
NORSK Field Development & Technology MANUALHYDRO Reservoir Technology PVT ANALYSIS
Chapter 3 Fluid Sampling & Laboratory Data Rev. 0.6Page 52
Curtis H. Whitson (PERA a/s) November 1998
Figure 3-2
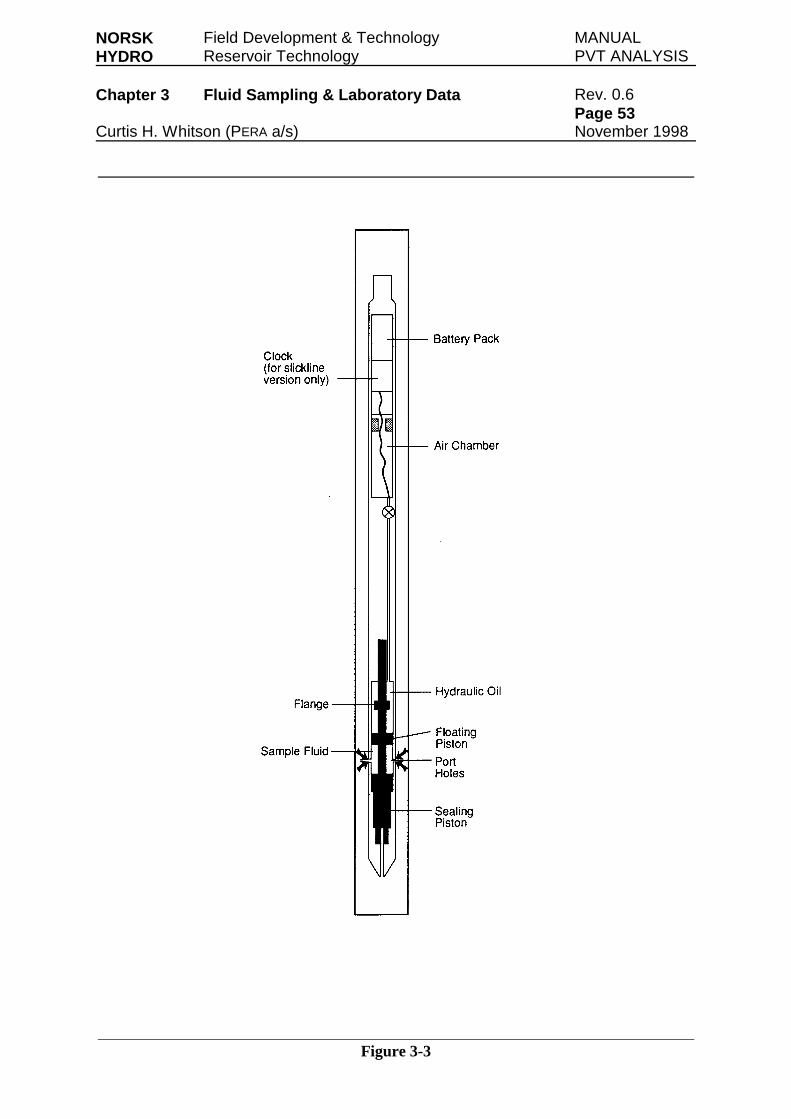
NORSK Field Development & Technology MANUALHYDRO Reservoir Technology PVT ANALYSIS
Chapter 3 Fluid Sampling & Laboratory Data Rev. 0.6Page 53
Curtis H. Whitson (PERA a/s) November 1998
Figure 3-3
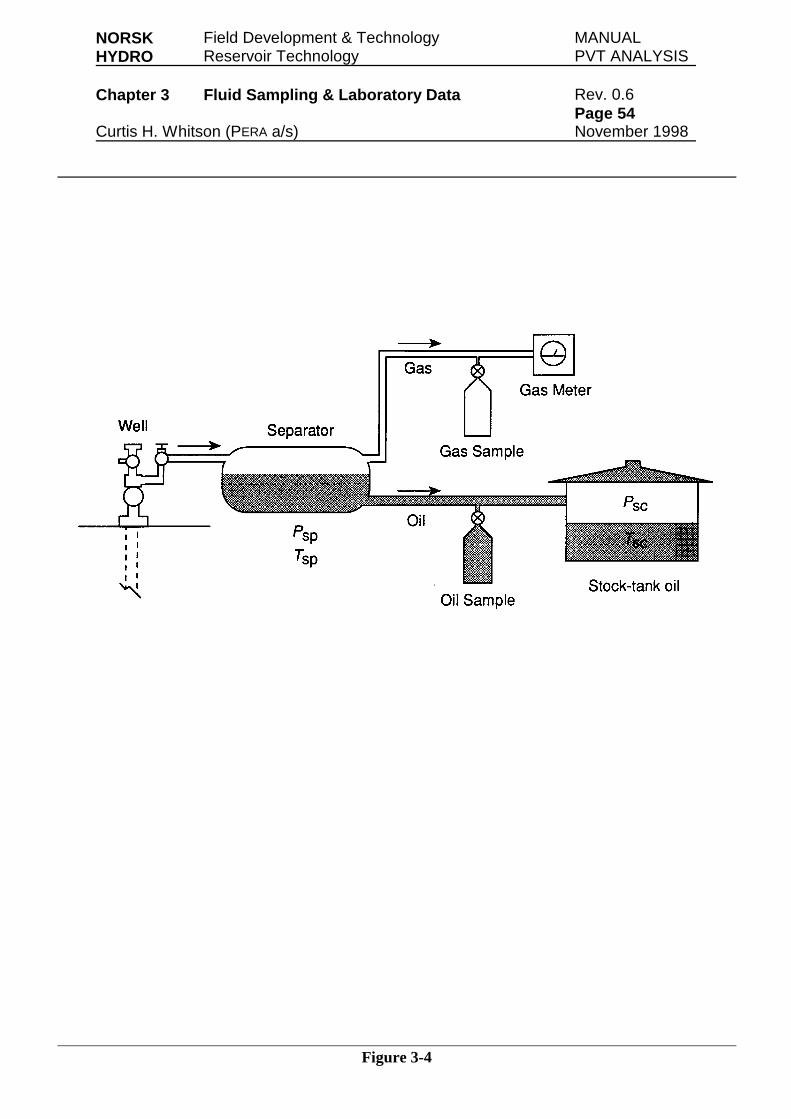
NORSK Field Development & Technology MANUALHYDRO Reservoir Technology PVT ANALYSIS
Chapter 3 Fluid Sampling & Laboratory Data Rev. 0.6Page 54
Curtis H. Whitson (PERA a/s) November 1998
Figure 3-4
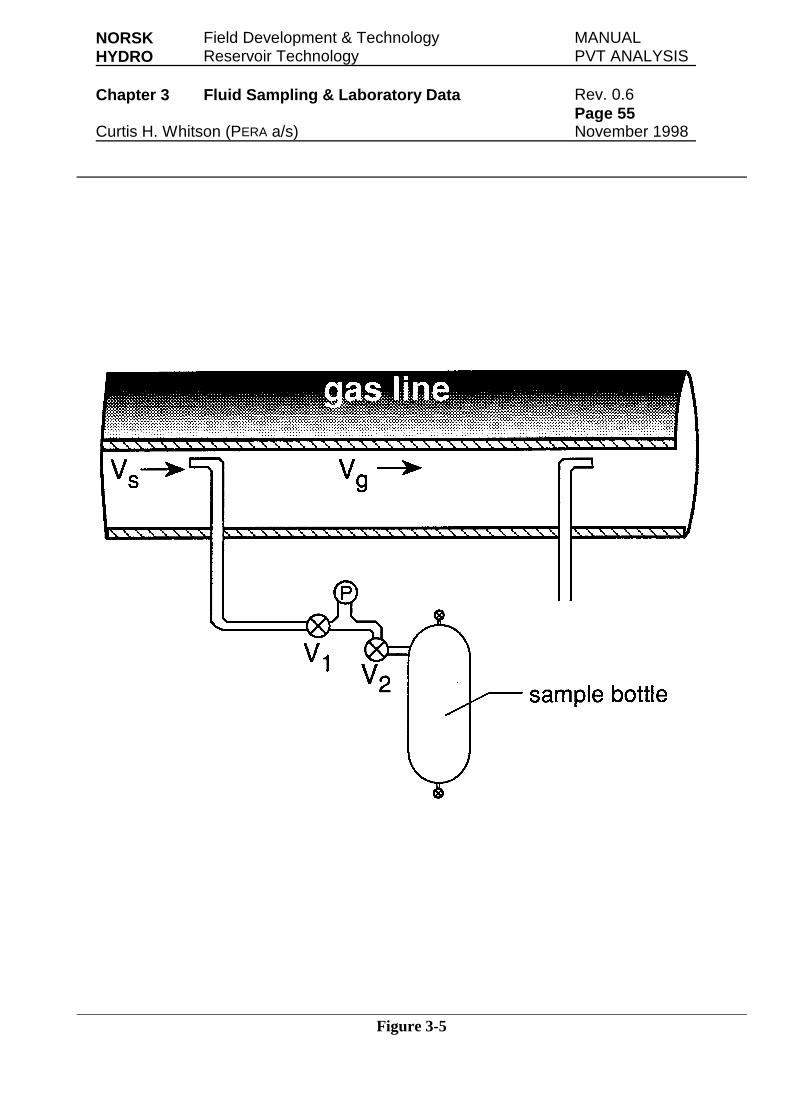
NORSK Field Development & Technology MANUALHYDRO Reservoir Technology PVT ANALYSIS
Chapter 3 Fluid Sampling & Laboratory Data Rev. 0.6Page 55
Curtis H. Whitson (PERA a/s) November 1998
Figure 3-5
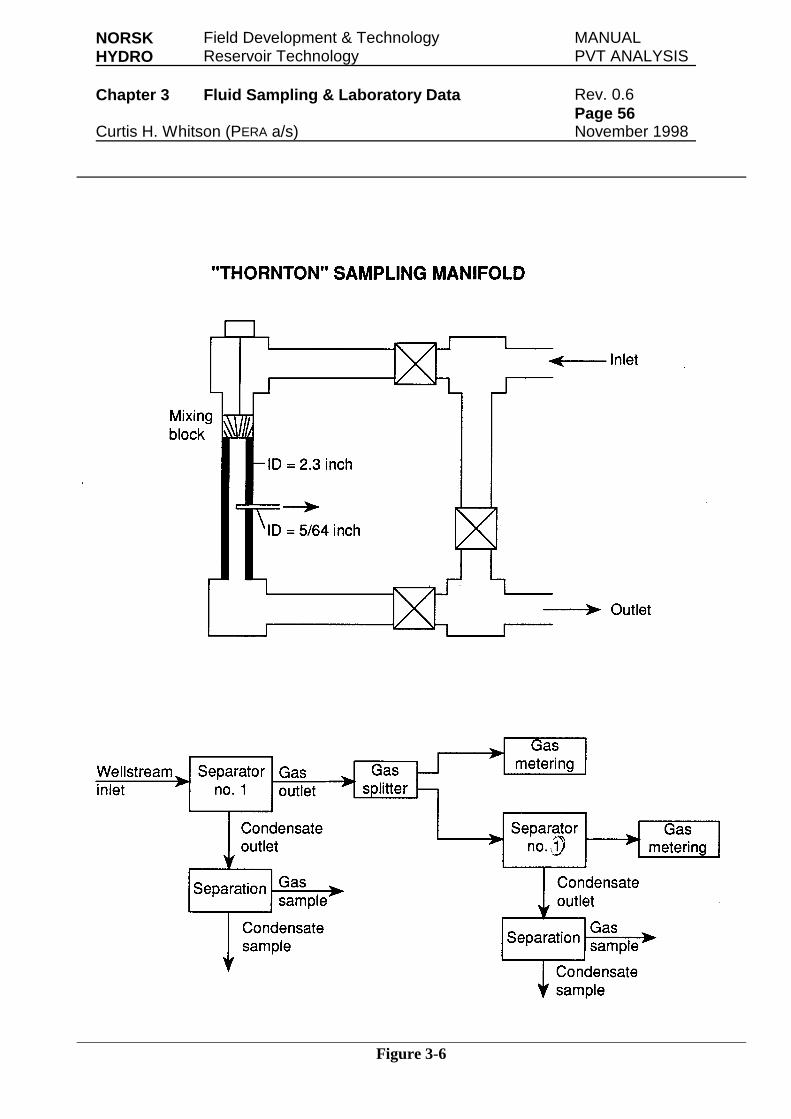
NORSK Field Development & Technology MANUALHYDRO Reservoir Technology PVT ANALYSIS
Chapter 3 Fluid Sampling & Laboratory Data Rev. 0.6Page 56
Curtis H. Whitson (PERA a/s) November 1998
Figure 3-6
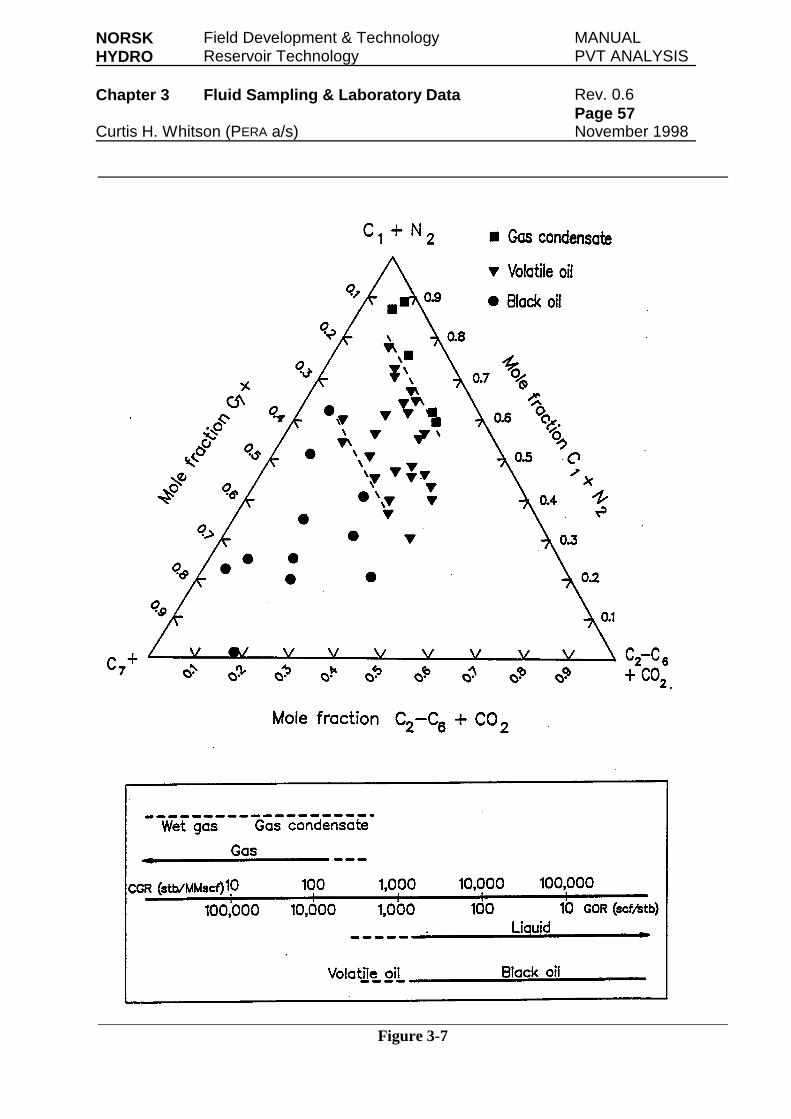
NORSK Field Development & Technology MANUALHYDRO Reservoir Technology PVT ANALYSIS
Chapter 3 Fluid Sampling & Laboratory Data Rev. 0.6Page 57
Curtis H. Whitson (PERA a/s) November 1998
Figure 3-7
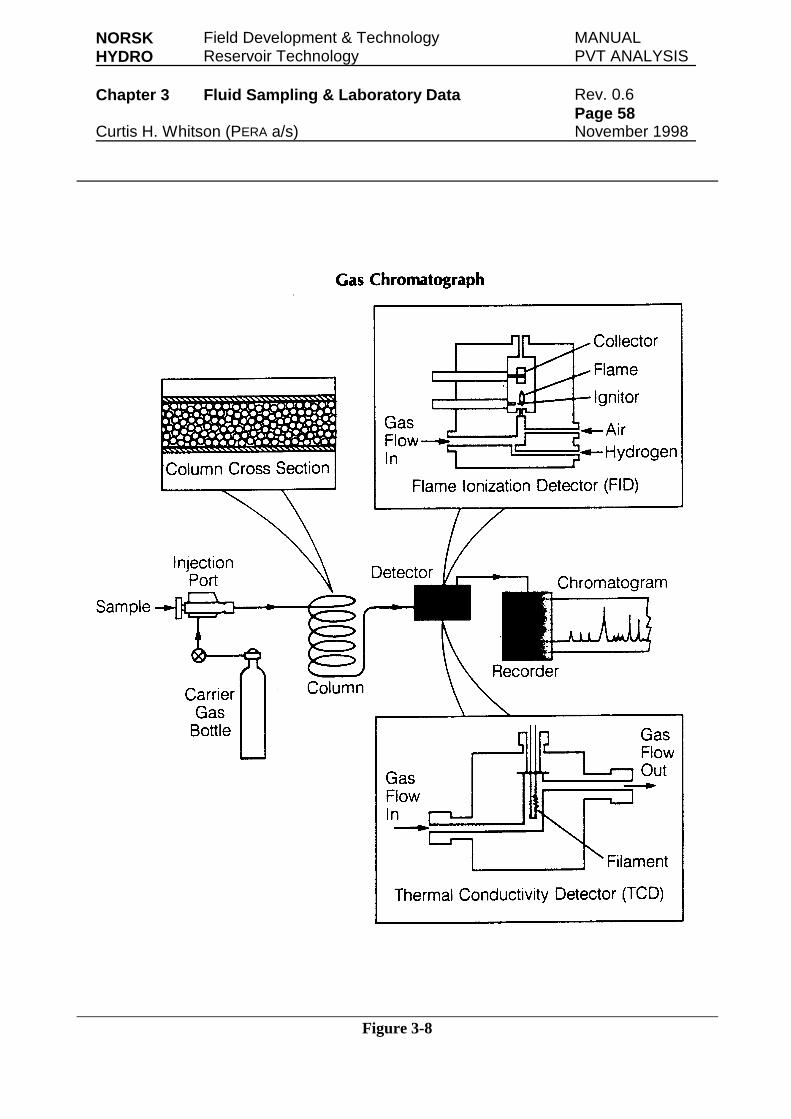
NORSK Field Development & Technology MANUALHYDRO Reservoir Technology PVT ANALYSIS
Chapter 3 Fluid Sampling & Laboratory Data Rev. 0.6Page 58
Curtis H. Whitson (PERA a/s) November 1998
Figure 3-8
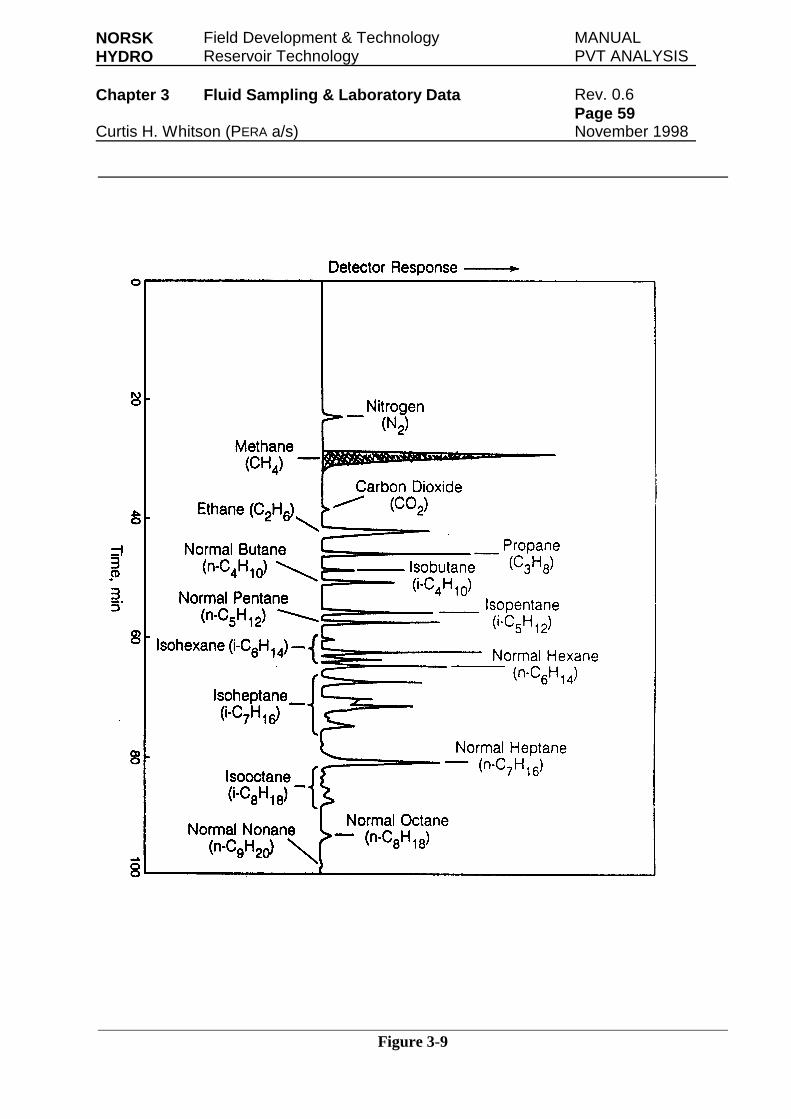
NORSK Field Development & Technology MANUALHYDRO Reservoir Technology PVT ANALYSIS
Chapter 3 Fluid Sampling & Laboratory Data Rev. 0.6Page 59
Curtis H. Whitson (PERA a/s) November 1998
Figure 3-9
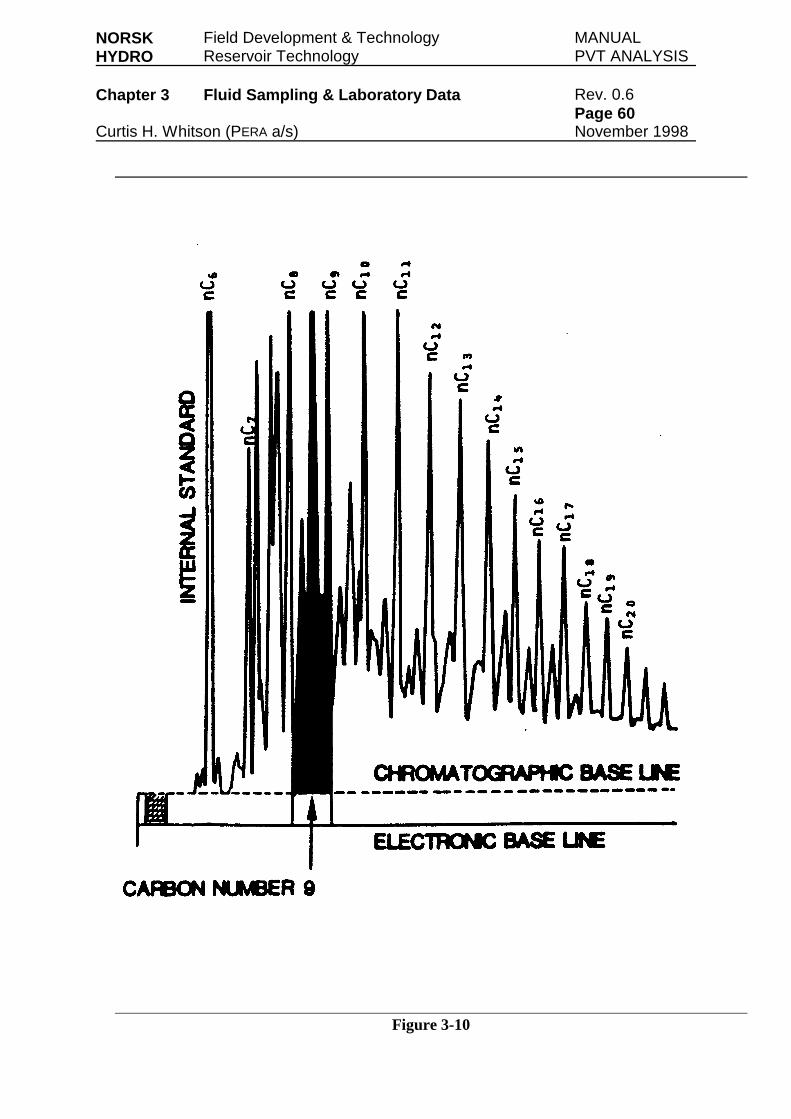
NORSK Field Development & Technology MANUALHYDRO Reservoir Technology PVT ANALYSIS
Chapter 3 Fluid Sampling & Laboratory Data Rev. 0.6Page 60
Curtis H. Whitson (PERA a/s) November 1998
Figure 3-10
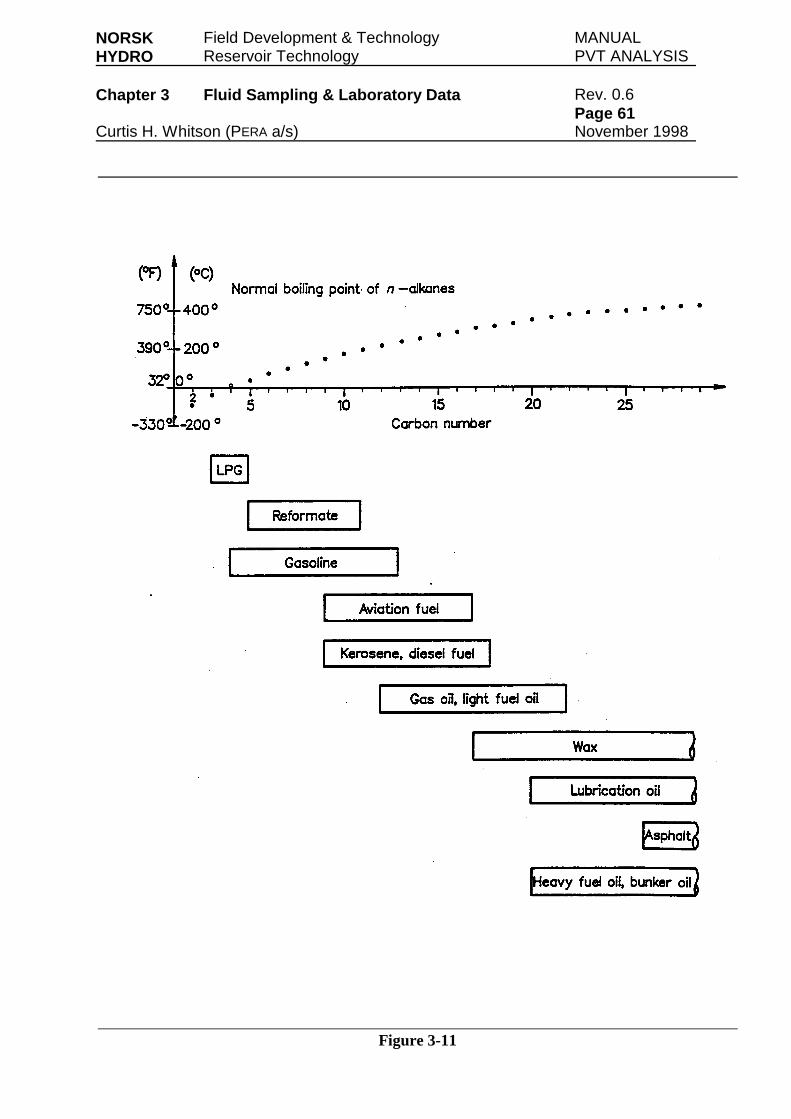
NORSK Field Development & Technology MANUALHYDRO Reservoir Technology PVT ANALYSIS
Chapter 3 Fluid Sampling & Laboratory Data Rev. 0.6Page 61
Curtis H. Whitson (PERA a/s) November 1998
Figure 3-11
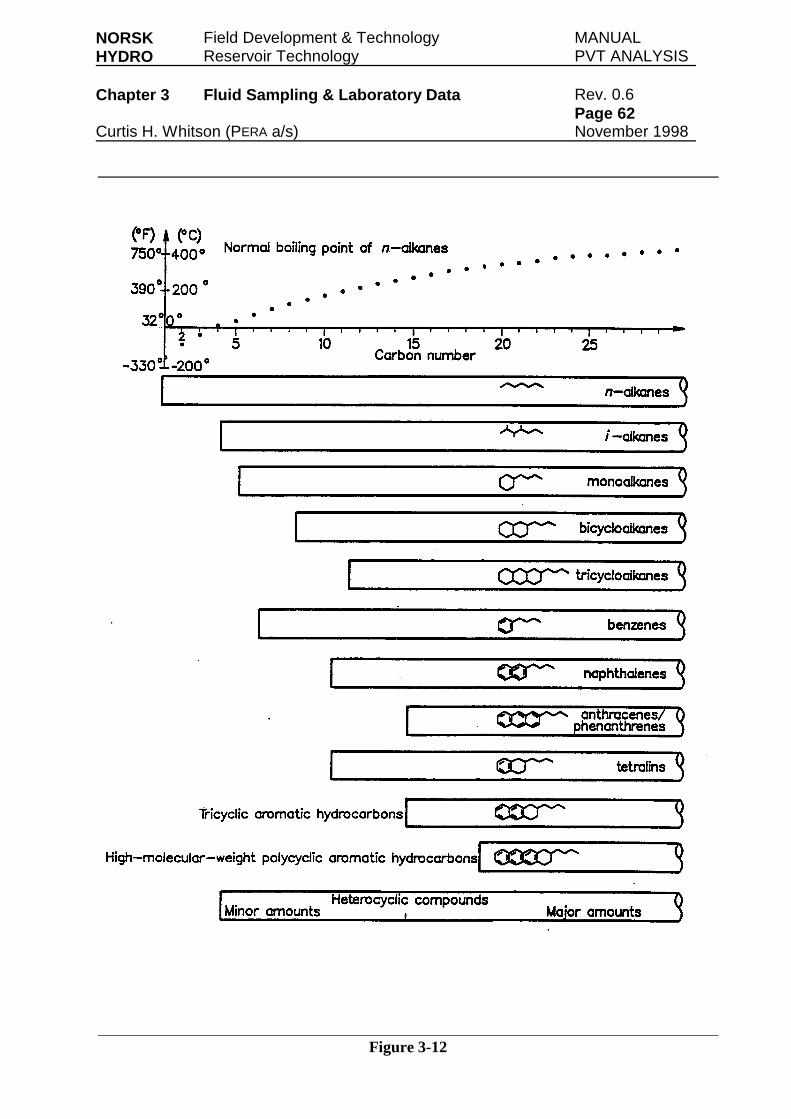
NORSK Field Development & Technology MANUALHYDRO Reservoir Technology PVT ANALYSIS
Chapter 3 Fluid Sampling & Laboratory Data Rev. 0.6Page 62
Curtis H. Whitson (PERA a/s) November 1998
Figure 3-12
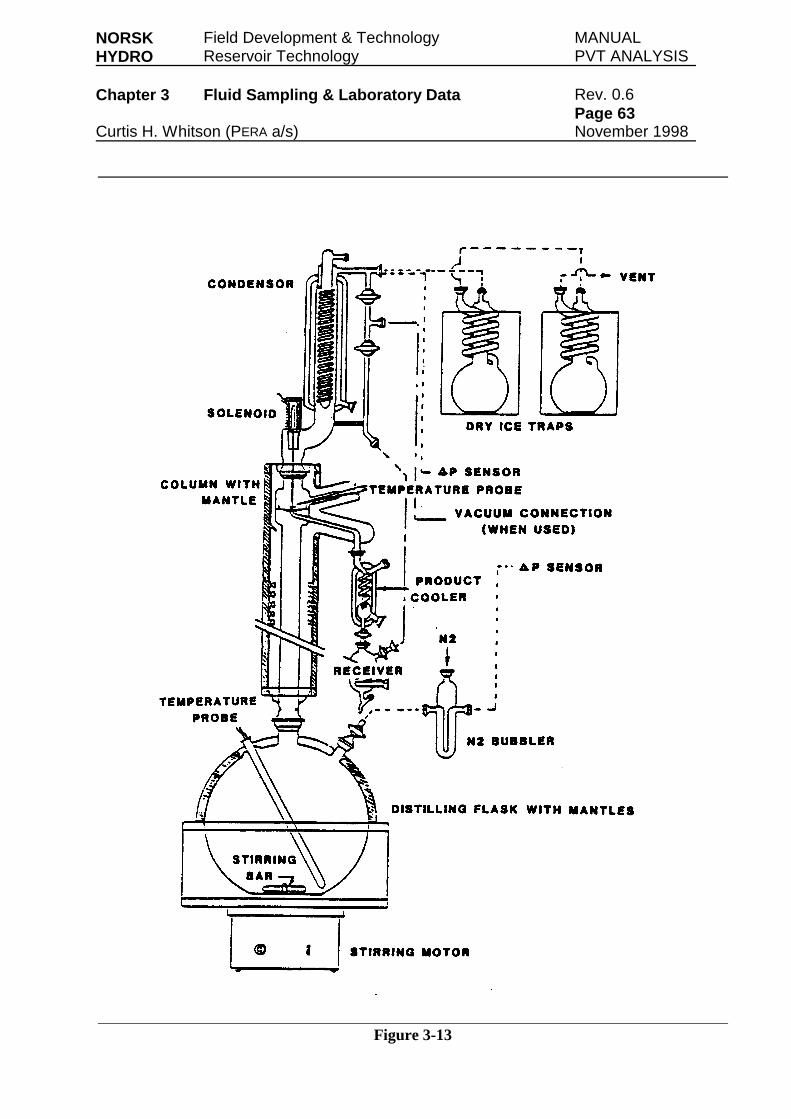
NORSK Field Development & Technology MANUALHYDRO Reservoir Technology PVT ANALYSIS
Chapter 3 Fluid Sampling & Laboratory Data Rev. 0.6Page 63
Curtis H. Whitson (PERA a/s) November 1998
Figure 3-13
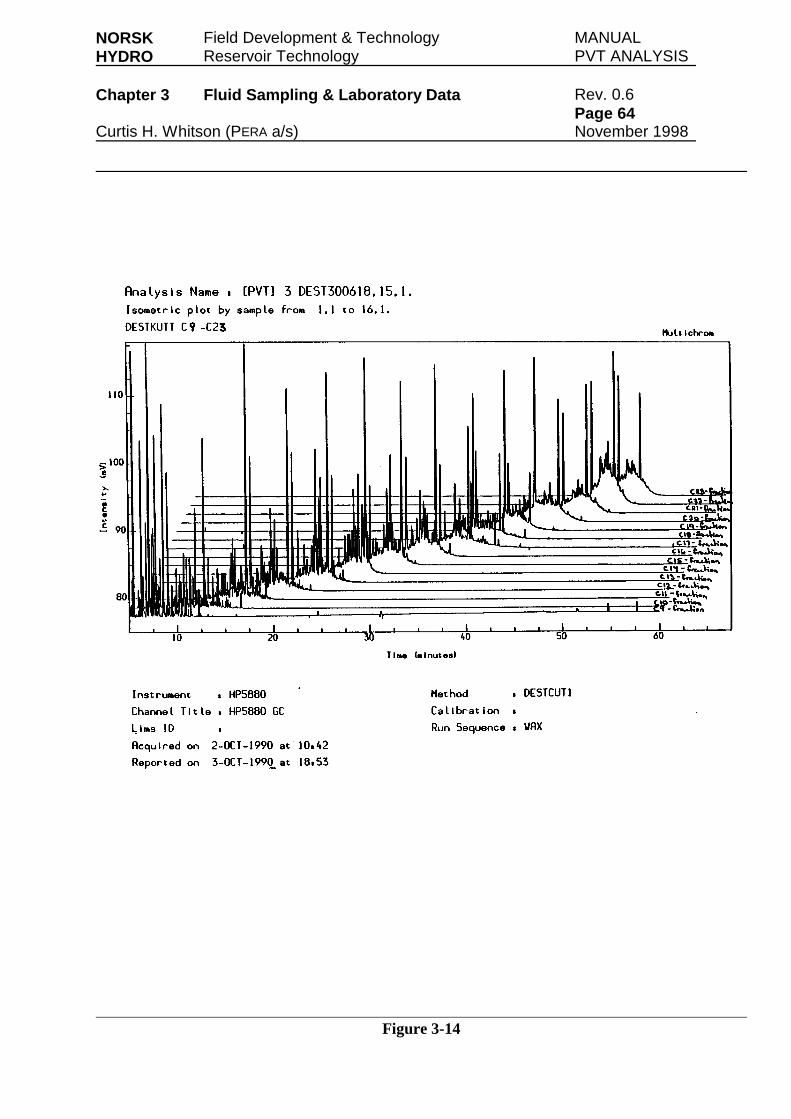
NORSK Field Development & Technology MANUALHYDRO Reservoir Technology PVT ANALYSIS
Chapter 3 Fluid Sampling & Laboratory Data Rev. 0.6Page 64
Curtis H. Whitson (PERA a/s) November 1998
Figure 3-14
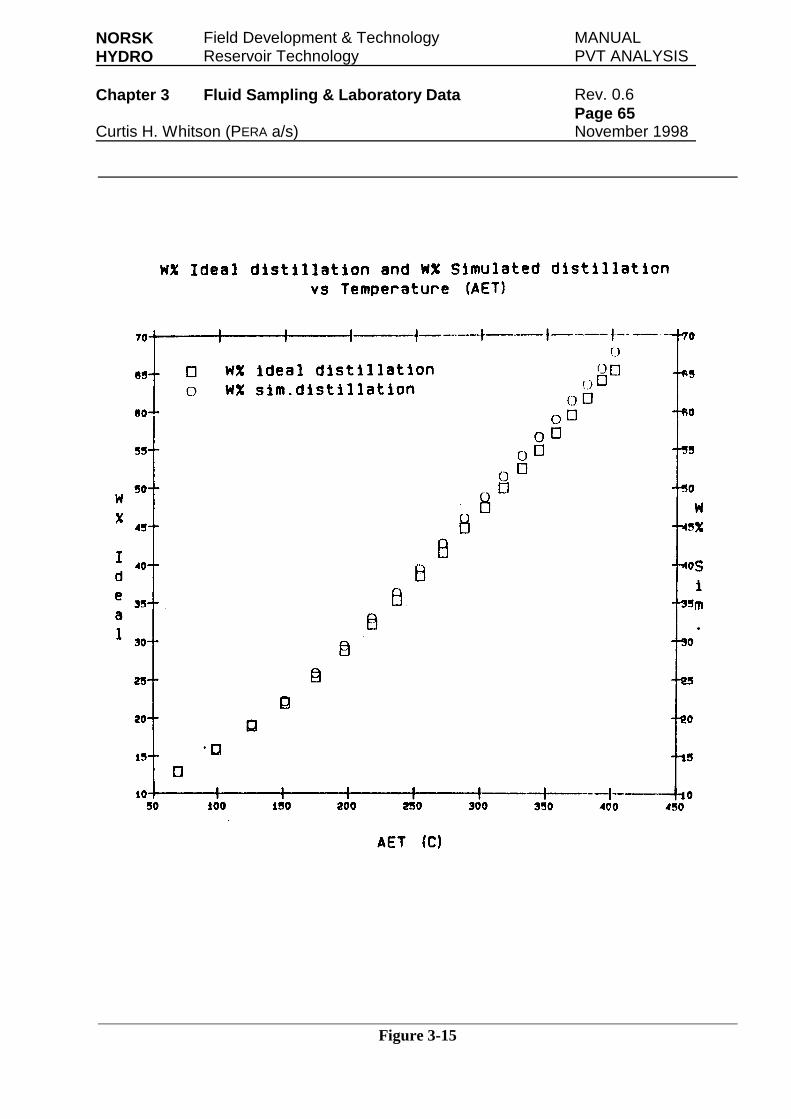
NORSK Field Development & Technology MANUALHYDRO Reservoir Technology PVT ANALYSIS
Chapter 3 Fluid Sampling & Laboratory Data Rev. 0.6Page 65
Curtis H. Whitson (PERA a/s) November 1998
Figure 3-15
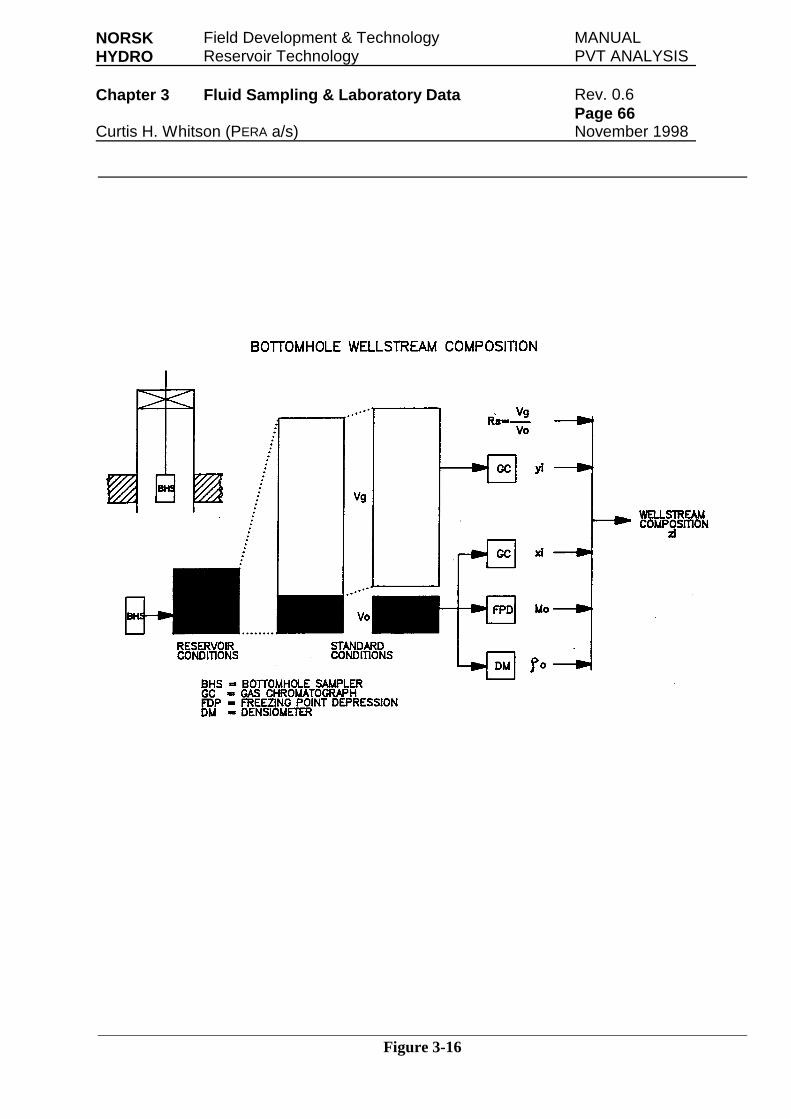
NORSK Field Development & Technology MANUALHYDRO Reservoir Technology PVT ANALYSIS
Chapter 3 Fluid Sampling & Laboratory Data Rev. 0.6Page 66
Curtis H. Whitson (PERA a/s) November 1998
Figure 3-16
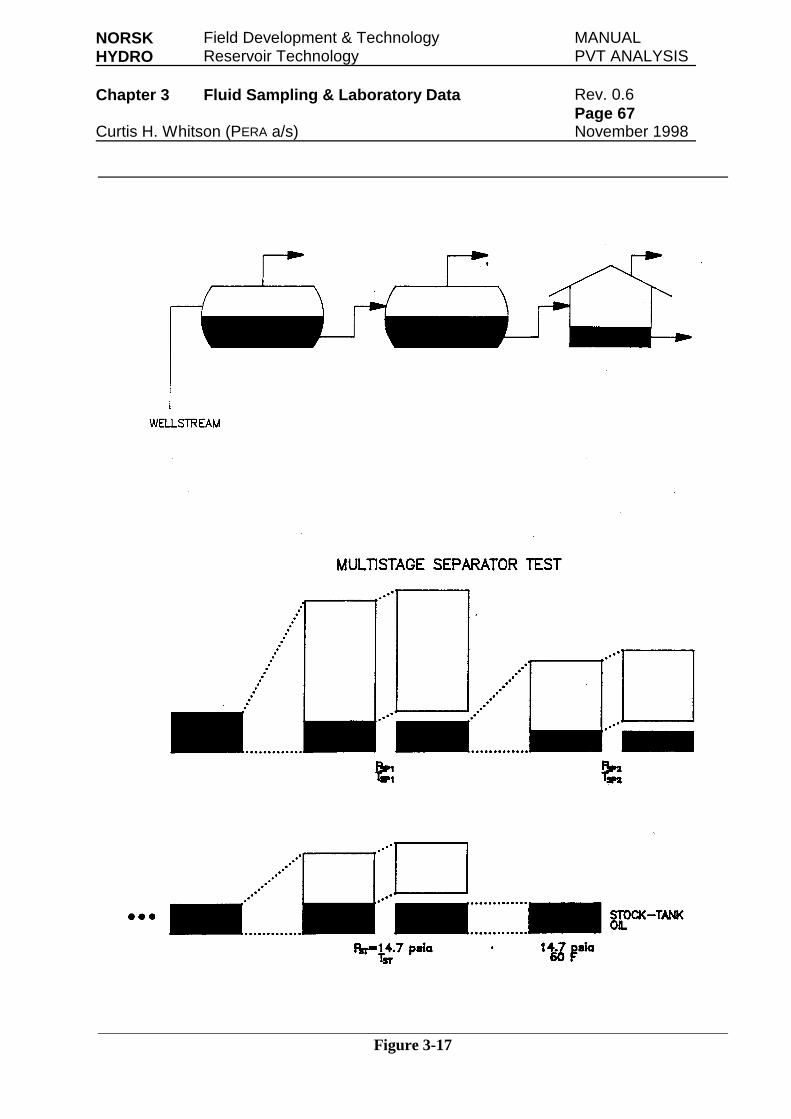
NORSK Field Development & Technology MANUALHYDRO Reservoir Technology PVT ANALYSIS
Chapter 3 Fluid Sampling & Laboratory Data Rev. 0.6Page 67
Curtis H. Whitson (PERA a/s) November 1998
Figure 3-17
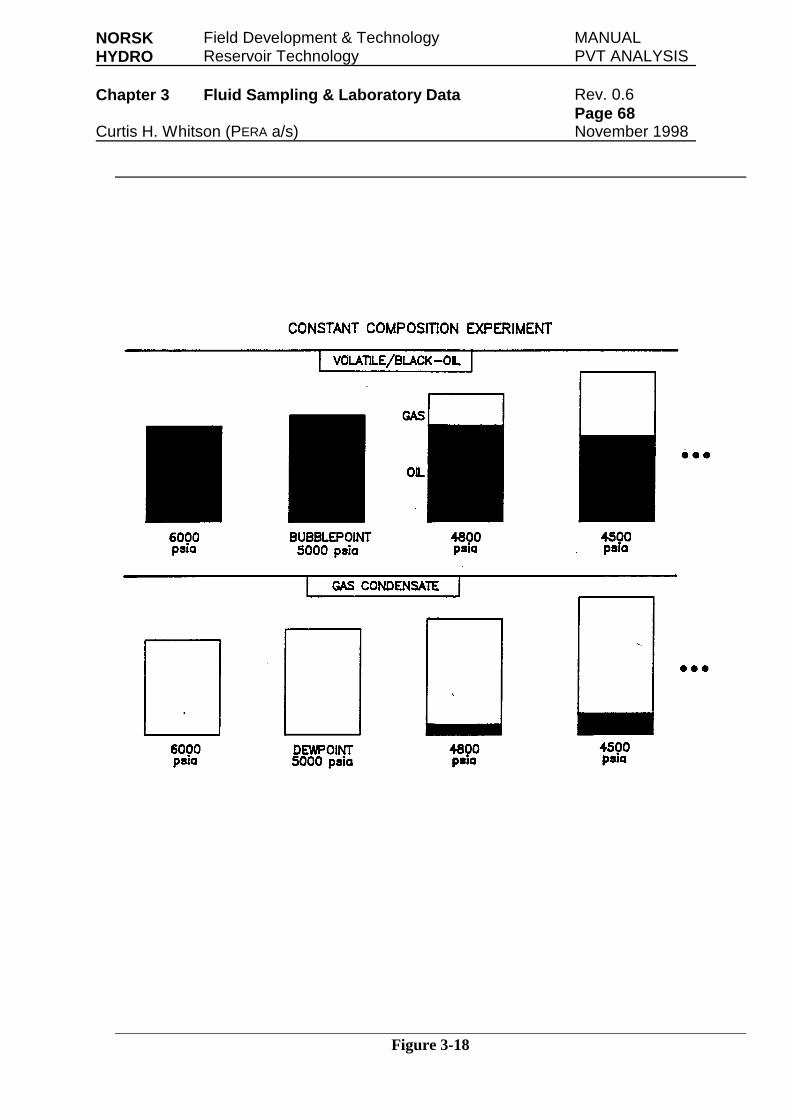
NORSK Field Development & Technology MANUALHYDRO Reservoir Technology PVT ANALYSIS
Chapter 3 Fluid Sampling & Laboratory Data Rev. 0.6Page 68
Curtis H. Whitson (PERA a/s) November 1998
Figure 3-18
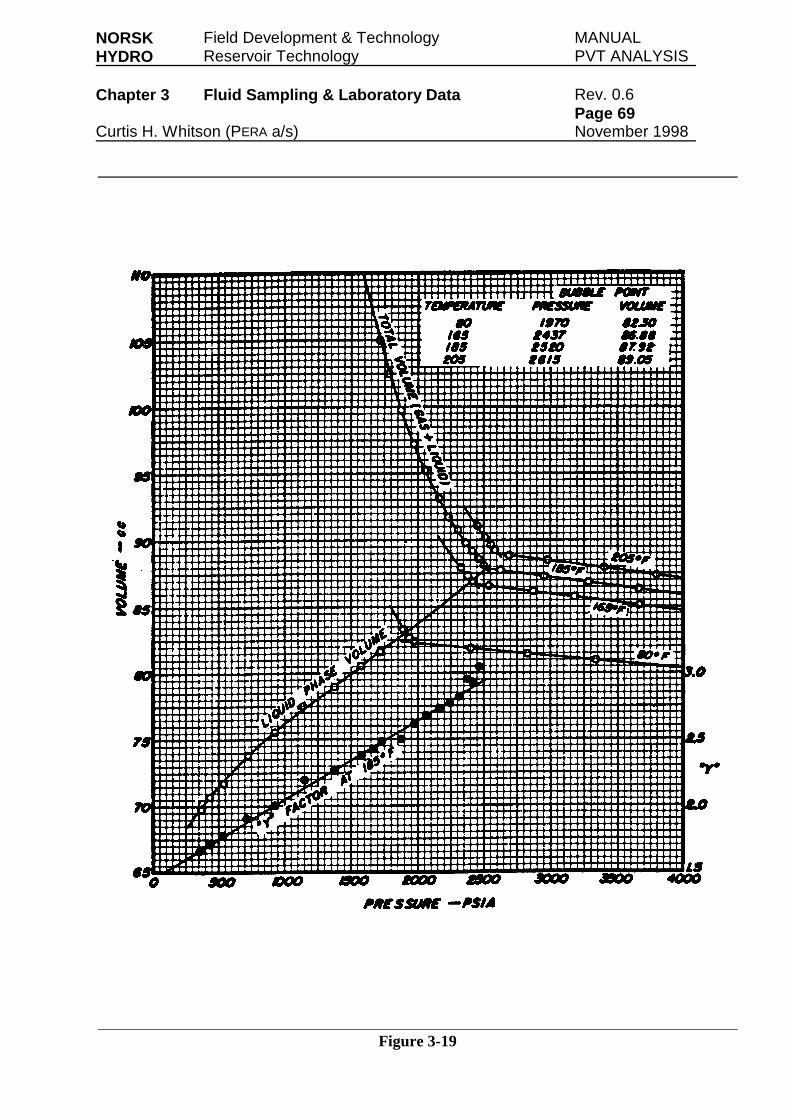
NORSK Field Development & Technology MANUALHYDRO Reservoir Technology PVT ANALYSIS
Chapter 3 Fluid Sampling & Laboratory Data Rev. 0.6Page 69
Curtis H. Whitson (PERA a/s) November 1998
Figure 3-19
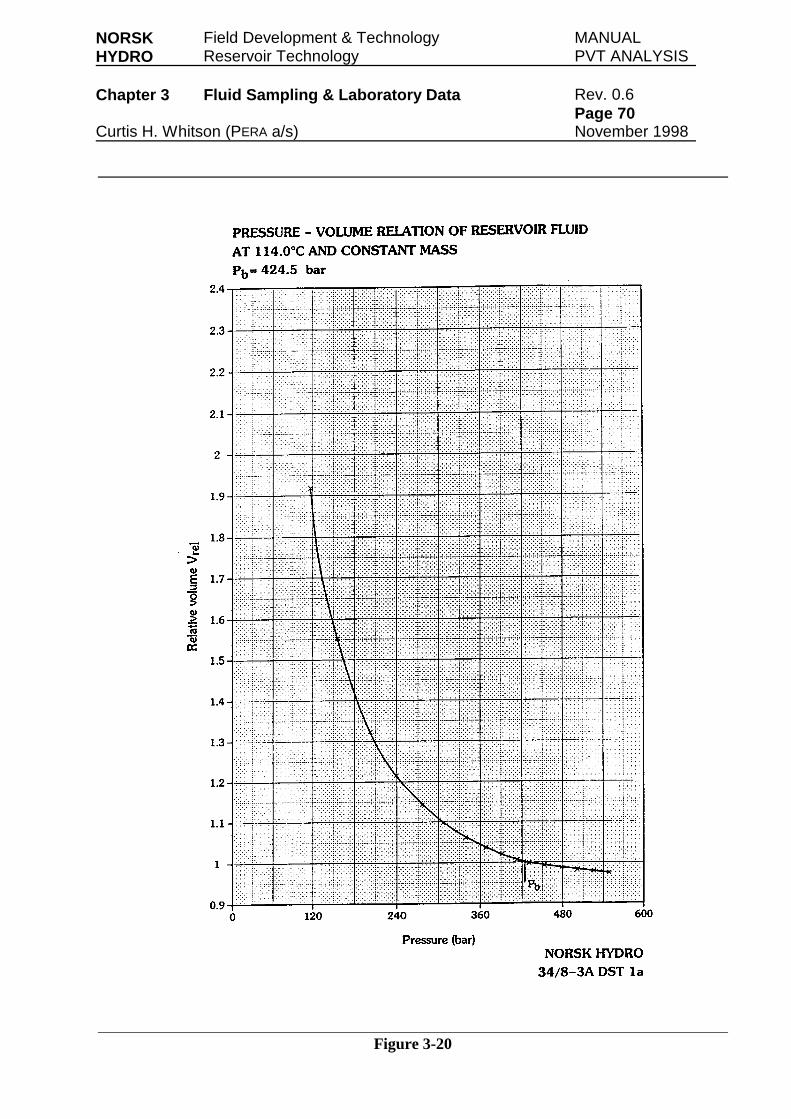
NORSK Field Development & Technology MANUALHYDRO Reservoir Technology PVT ANALYSIS
Chapter 3 Fluid Sampling & Laboratory Data Rev. 0.6Page 70
Curtis H. Whitson (PERA a/s) November 1998
Figure 3-20
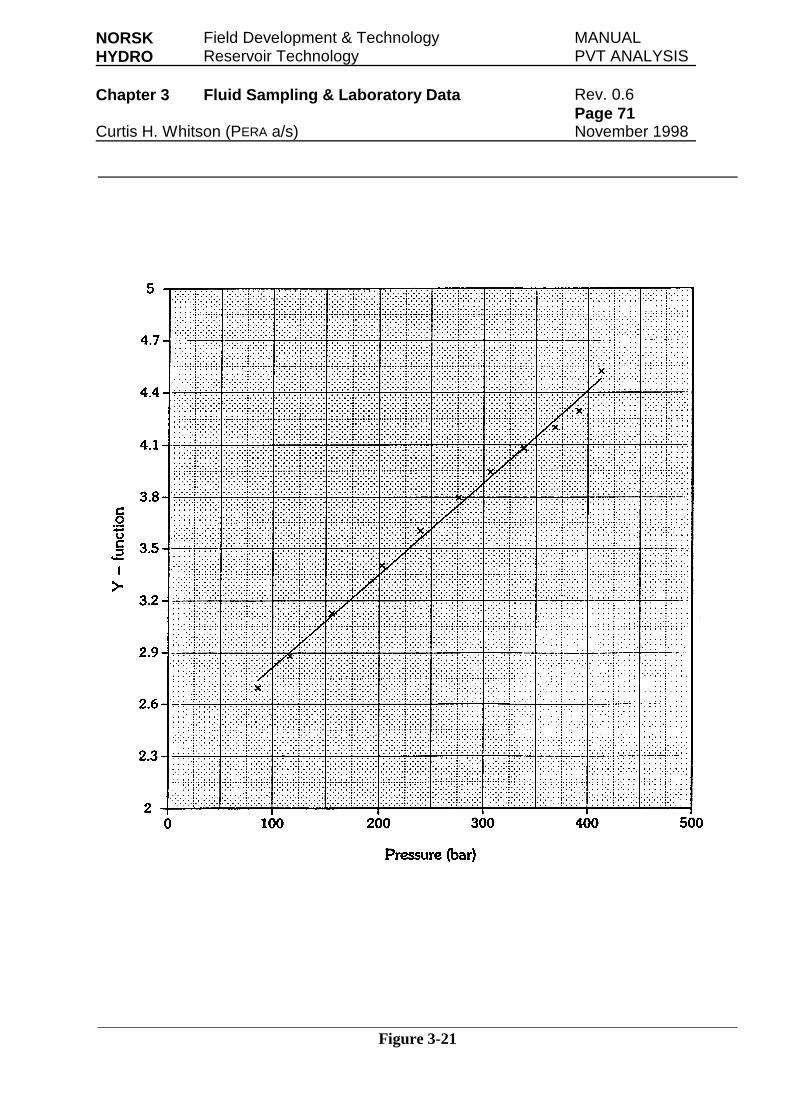
NORSK Field Development & Technology MANUALHYDRO Reservoir Technology PVT ANALYSIS
Chapter 3 Fluid Sampling & Laboratory Data Rev. 0.6Page 71
Curtis H. Whitson (PERA a/s) November 1998
Figure 3-21
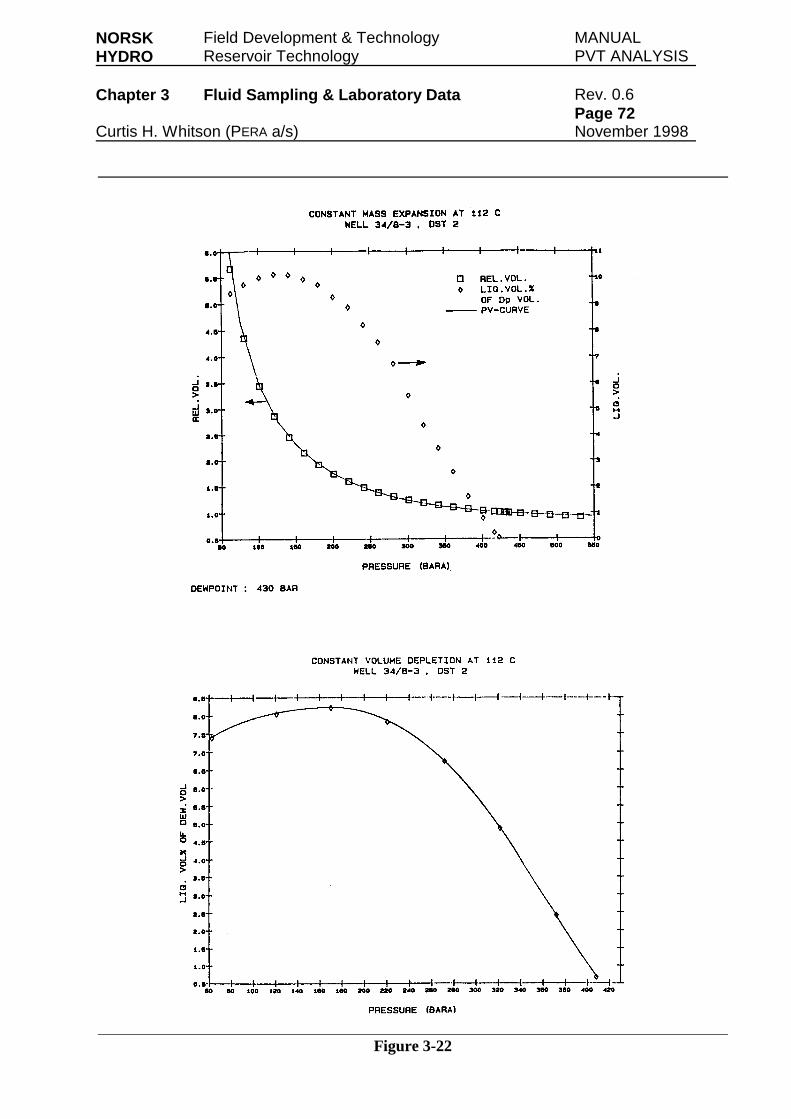
NORSK Field Development & Technology MANUALHYDRO Reservoir Technology PVT ANALYSIS
Chapter 3 Fluid Sampling & Laboratory Data Rev. 0.6Page 72
Curtis H. Whitson (PERA a/s) November 1998
Figure 3-22
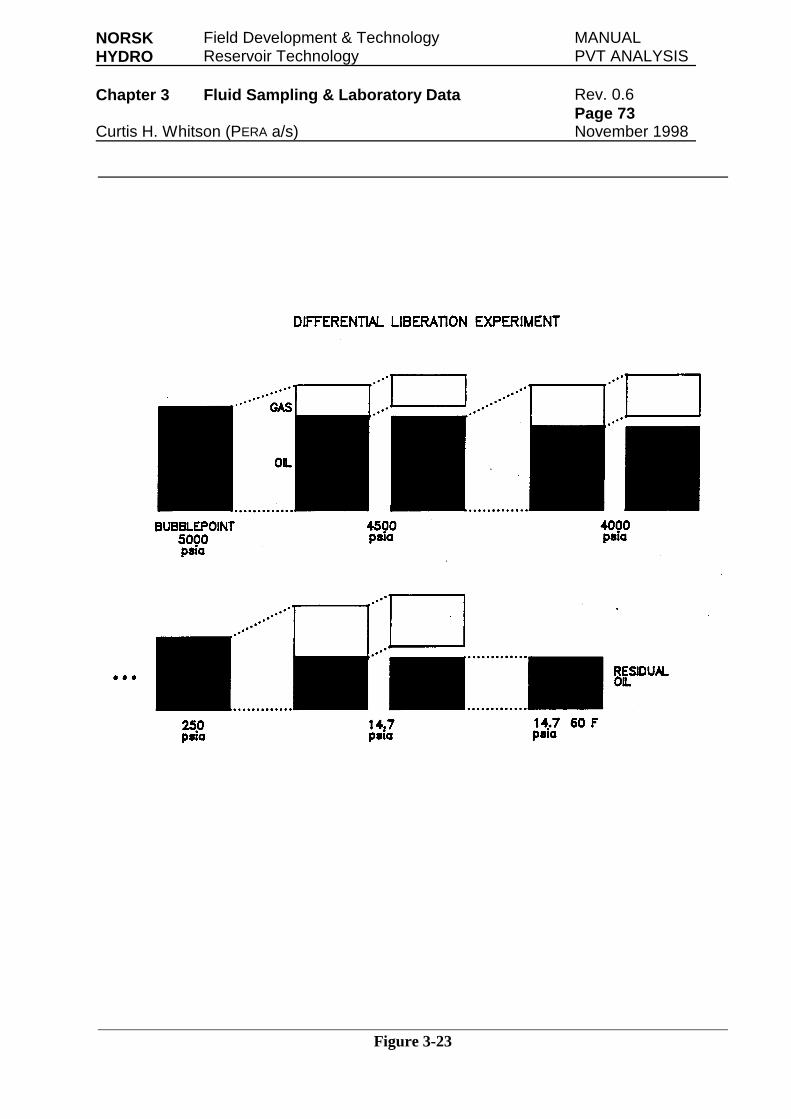
NORSK Field Development & Technology MANUALHYDRO Reservoir Technology PVT ANALYSIS
Chapter 3 Fluid Sampling & Laboratory Data Rev. 0.6Page 73
Curtis H. Whitson (PERA a/s) November 1998
Figure 3-23
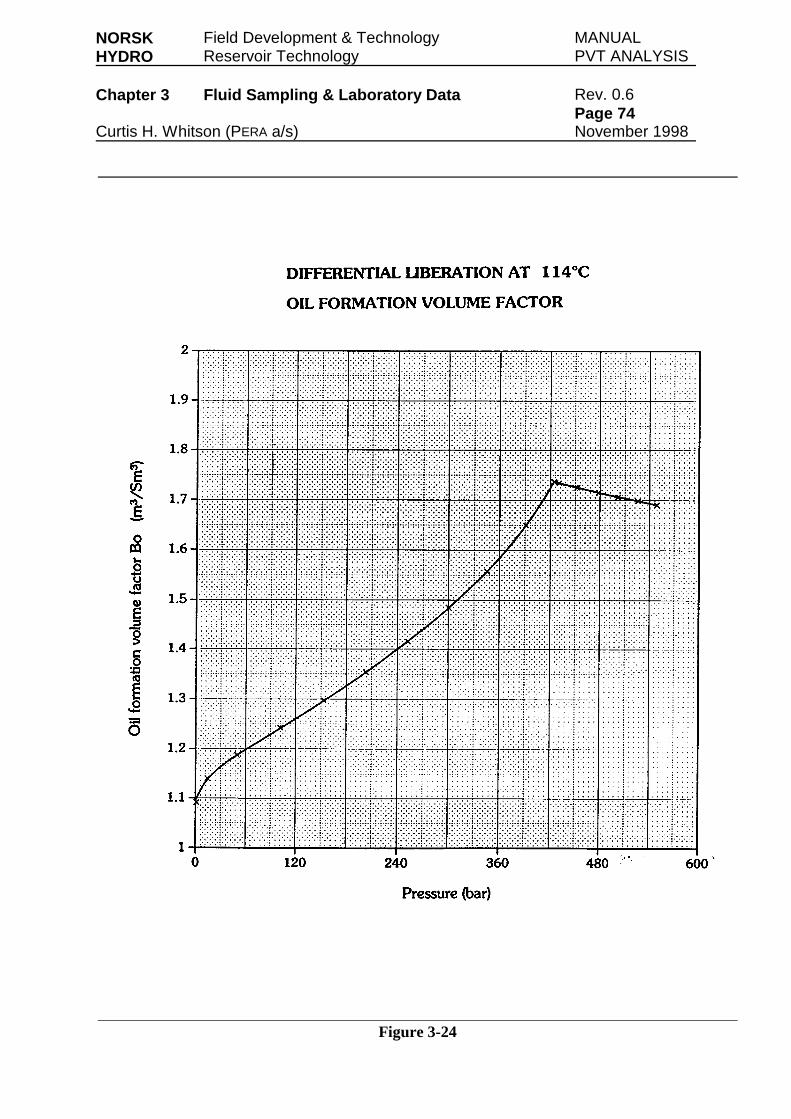
NORSK Field Development & Technology MANUALHYDRO Reservoir Technology PVT ANALYSIS
Chapter 3 Fluid Sampling & Laboratory Data Rev. 0.6Page 74
Curtis H. Whitson (PERA a/s) November 1998
Figure 3-24
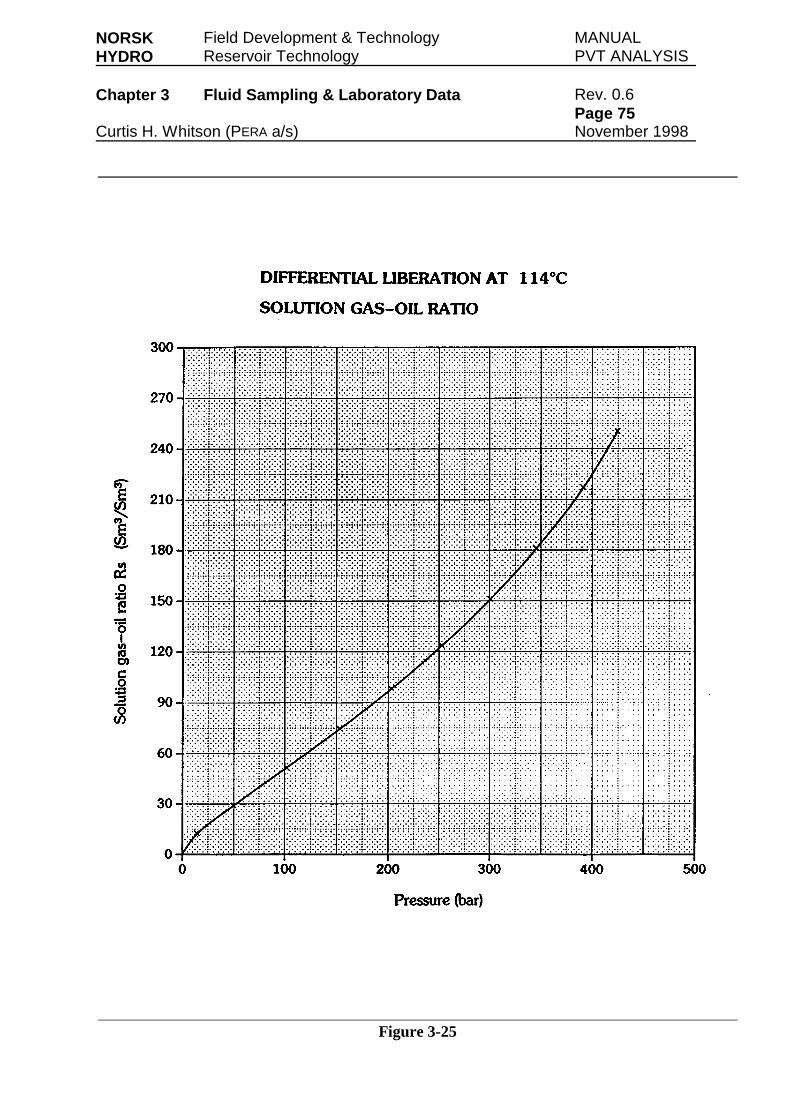
NORSK Field Development & Technology MANUALHYDRO Reservoir Technology PVT ANALYSIS
Chapter 3 Fluid Sampling & Laboratory Data Rev. 0.6Page 75
Curtis H. Whitson (PERA a/s) November 1998
Figure 3-25
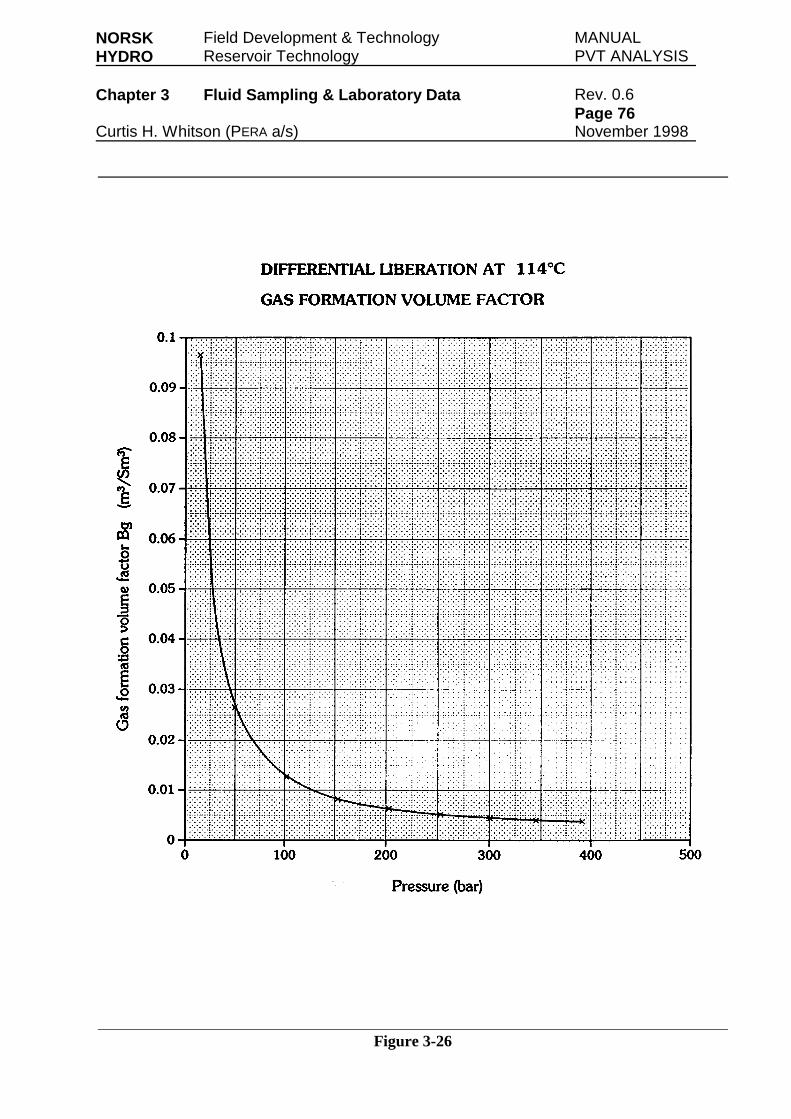
NORSK Field Development & Technology MANUALHYDRO Reservoir Technology PVT ANALYSIS
Chapter 3 Fluid Sampling & Laboratory Data Rev. 0.6Page 76
Curtis H. Whitson (PERA a/s) November 1998
Figure 3-26
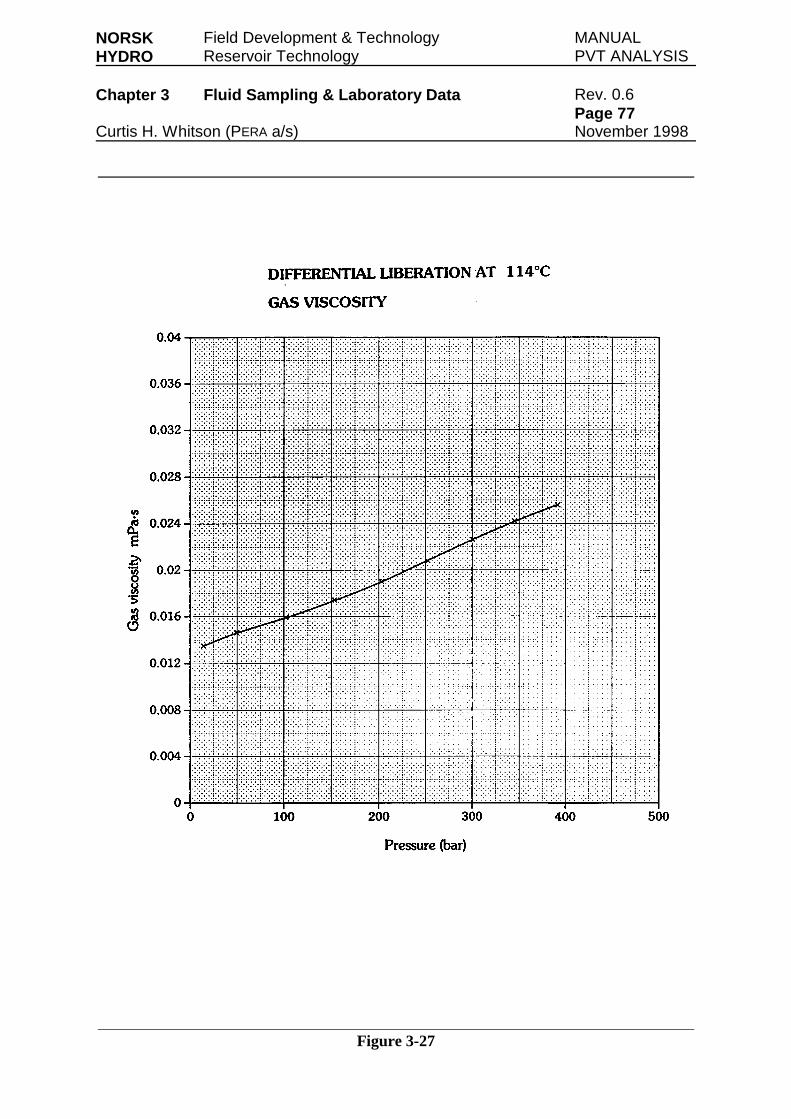
NORSK Field Development & Technology MANUALHYDRO Reservoir Technology PVT ANALYSIS
Chapter 3 Fluid Sampling & Laboratory Data Rev. 0.6Page 77
Curtis H. Whitson (PERA a/s) November 1998
Figure 3-27
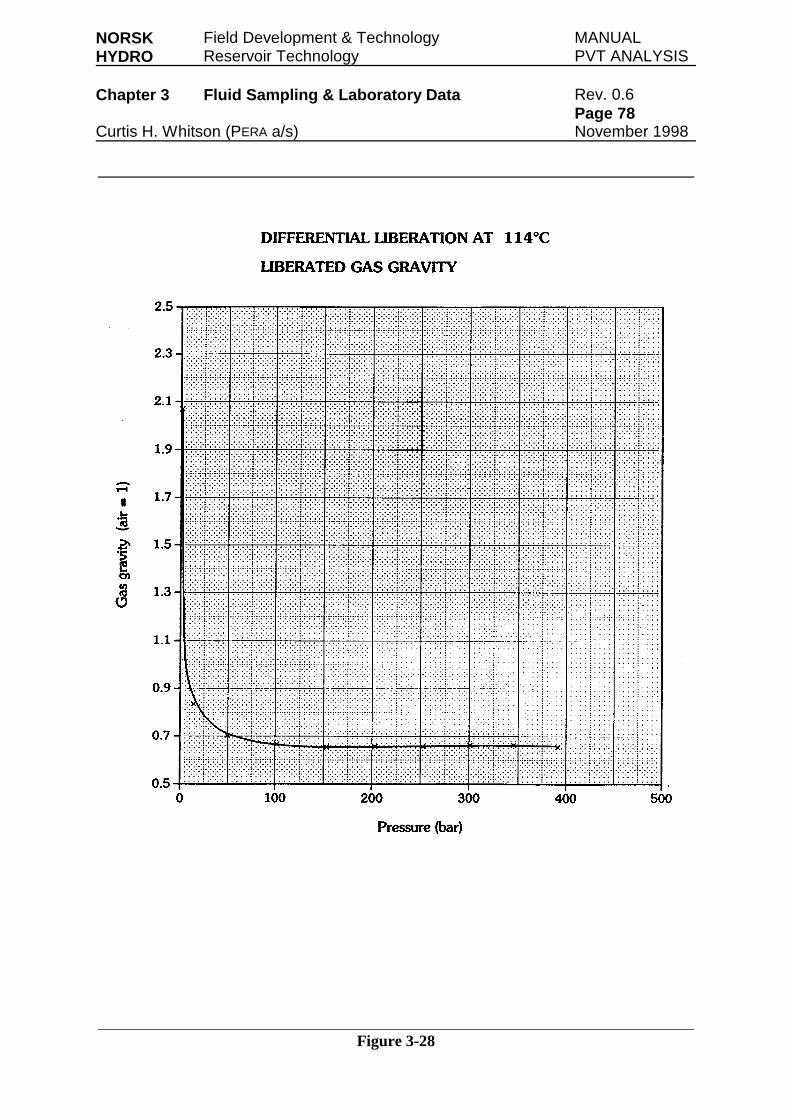
NORSK Field Development & Technology MANUALHYDRO Reservoir Technology PVT ANALYSIS
Chapter 3 Fluid Sampling & Laboratory Data Rev. 0.6Page 78
Curtis H. Whitson (PERA a/s) November 1998
Figure 3-28
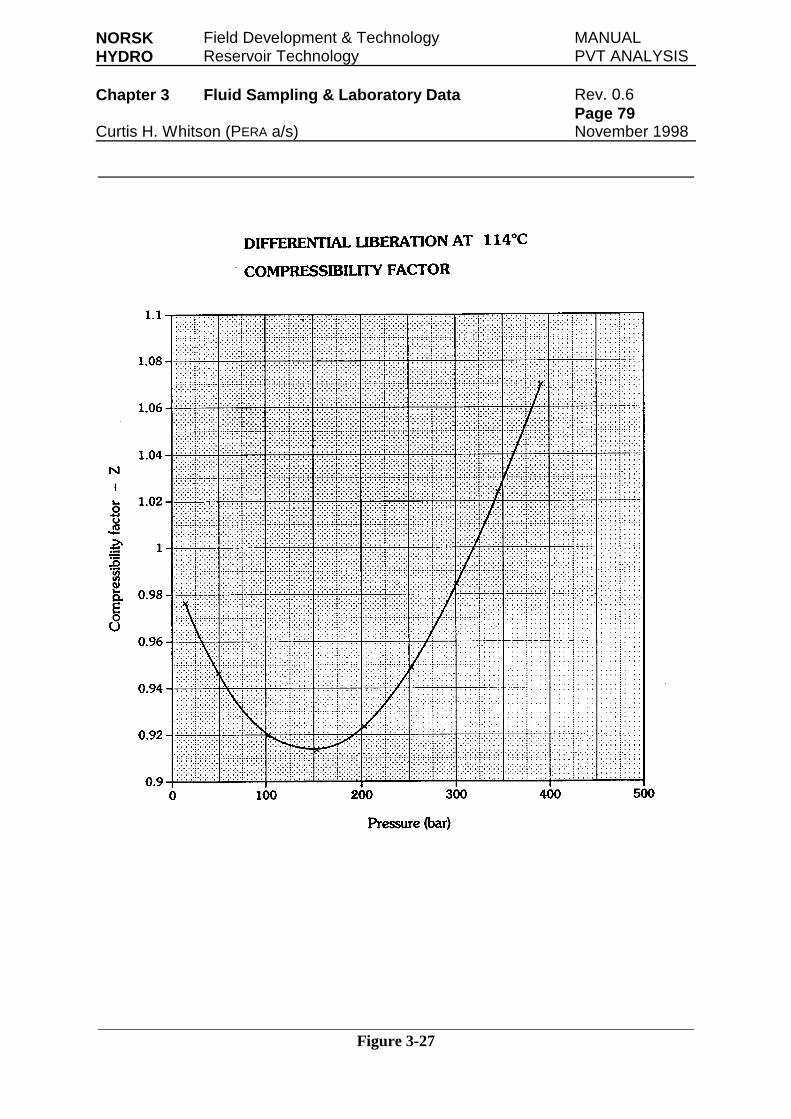
NORSK Field Development & Technology MANUALHYDRO Reservoir Technology PVT ANALYSIS
Chapter 3 Fluid Sampling & Laboratory Data Rev. 0.6Page 79
Curtis H. Whitson (PERA a/s) November 1998
Figure 3-27
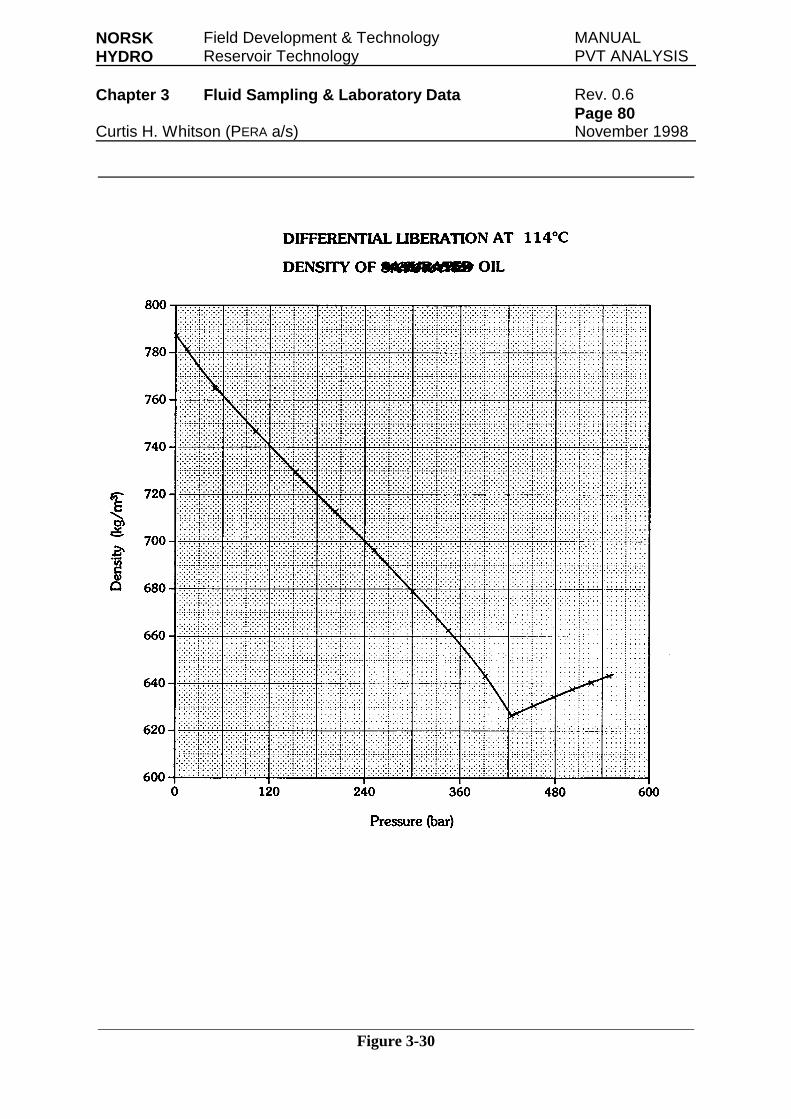
NORSK Field Development & Technology MANUALHYDRO Reservoir Technology PVT ANALYSIS
Chapter 3 Fluid Sampling & Laboratory Data Rev. 0.6Page 80
Curtis H. Whitson (PERA a/s) November 1998
Figure 3-30
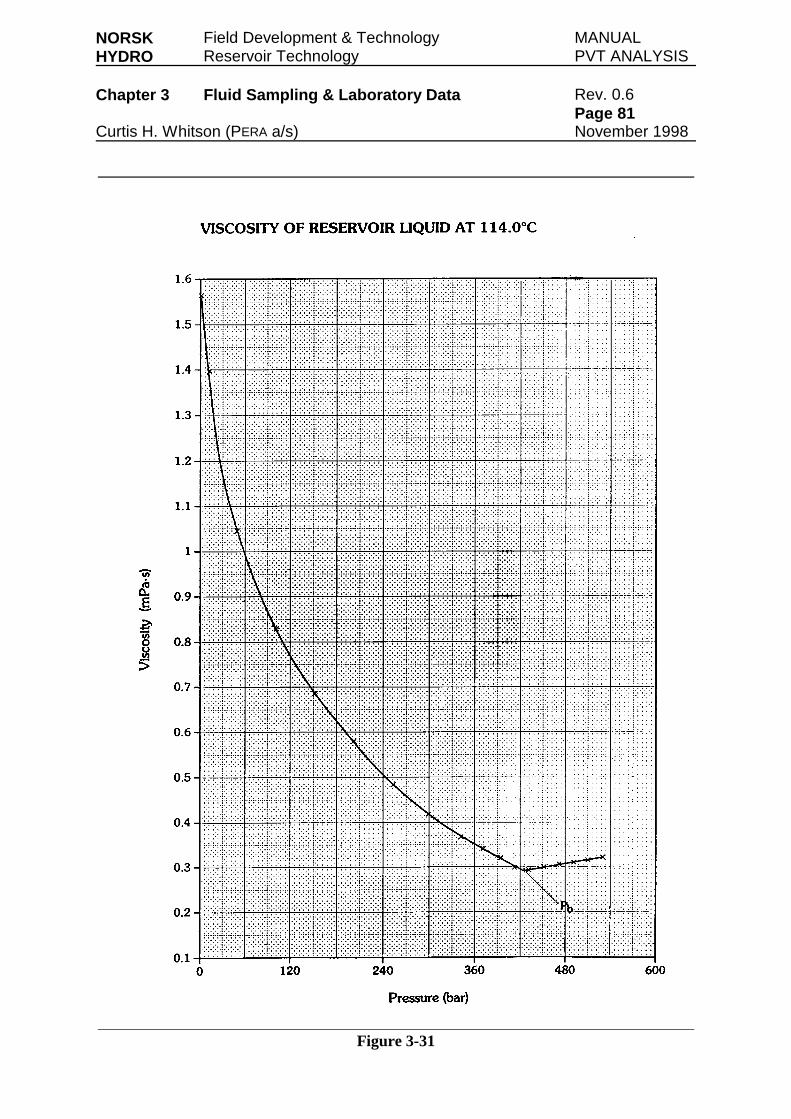
NORSK Field Development & Technology MANUALHYDRO Reservoir Technology PVT ANALYSIS
Chapter 3 Fluid Sampling & Laboratory Data Rev. 0.6Page 81
Curtis H. Whitson (PERA a/s) November 1998
Figure 3-31
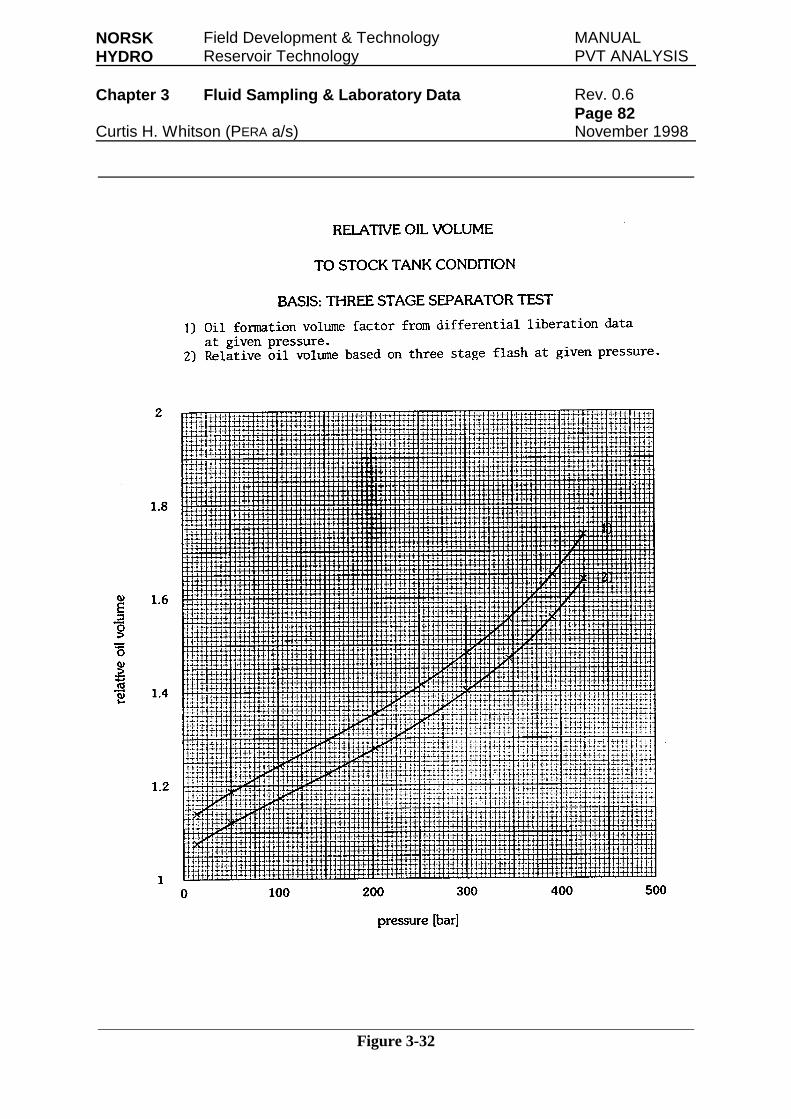
NORSK Field Development & Technology MANUALHYDRO Reservoir Technology PVT ANALYSIS
Chapter 3 Fluid Sampling & Laboratory Data Rev. 0.6Page 82
Curtis H. Whitson (PERA a/s) November 1998
Figure 3-32
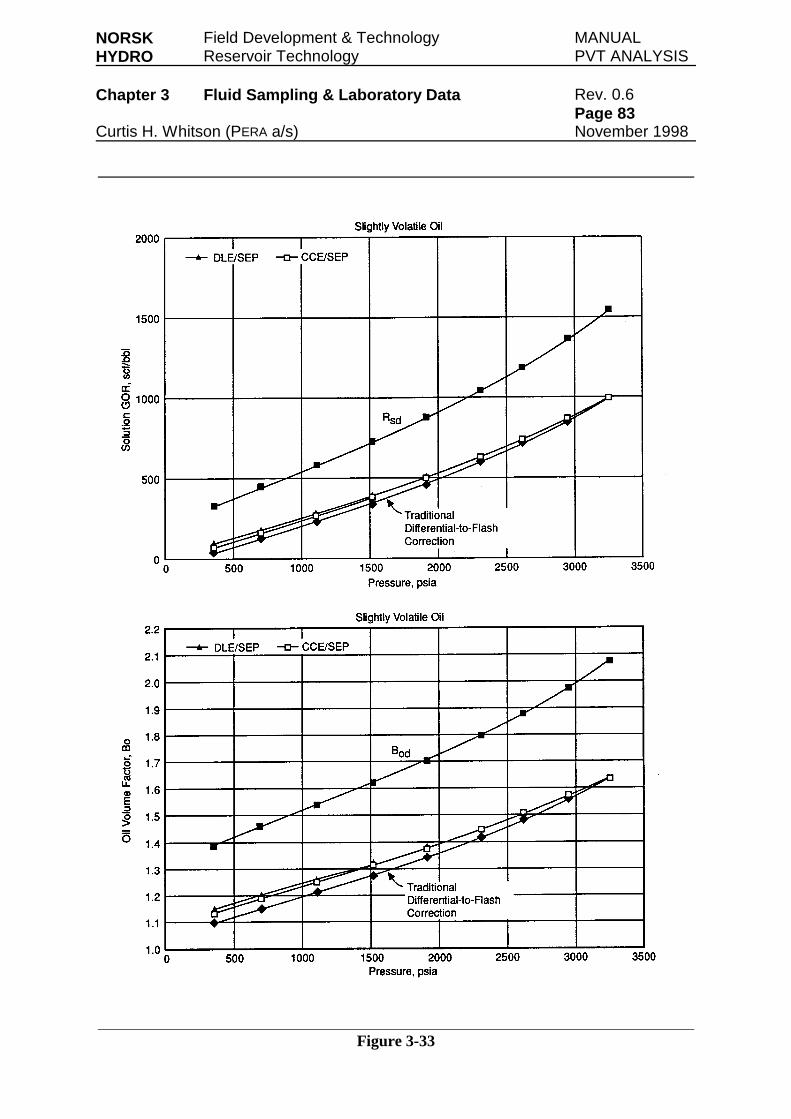
NORSK Field Development & Technology MANUALHYDRO Reservoir Technology PVT ANALYSIS
Chapter 3 Fluid Sampling & Laboratory Data Rev. 0.6Page 83
Curtis H. Whitson (PERA a/s) November 1998
Figure 3-33
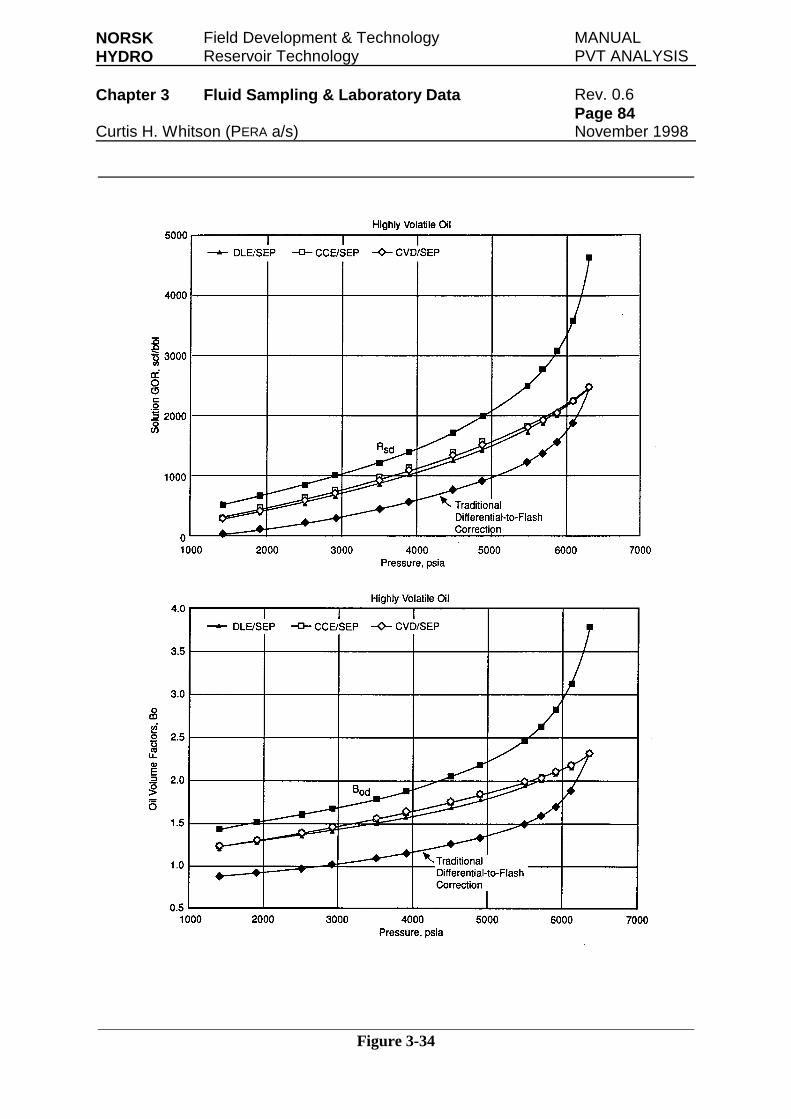
NORSK Field Development & Technology MANUALHYDRO Reservoir Technology PVT ANALYSIS
Chapter 3 Fluid Sampling & Laboratory Data Rev. 0.6Page 84
Curtis H. Whitson (PERA a/s) November 1998
Figure 3-34
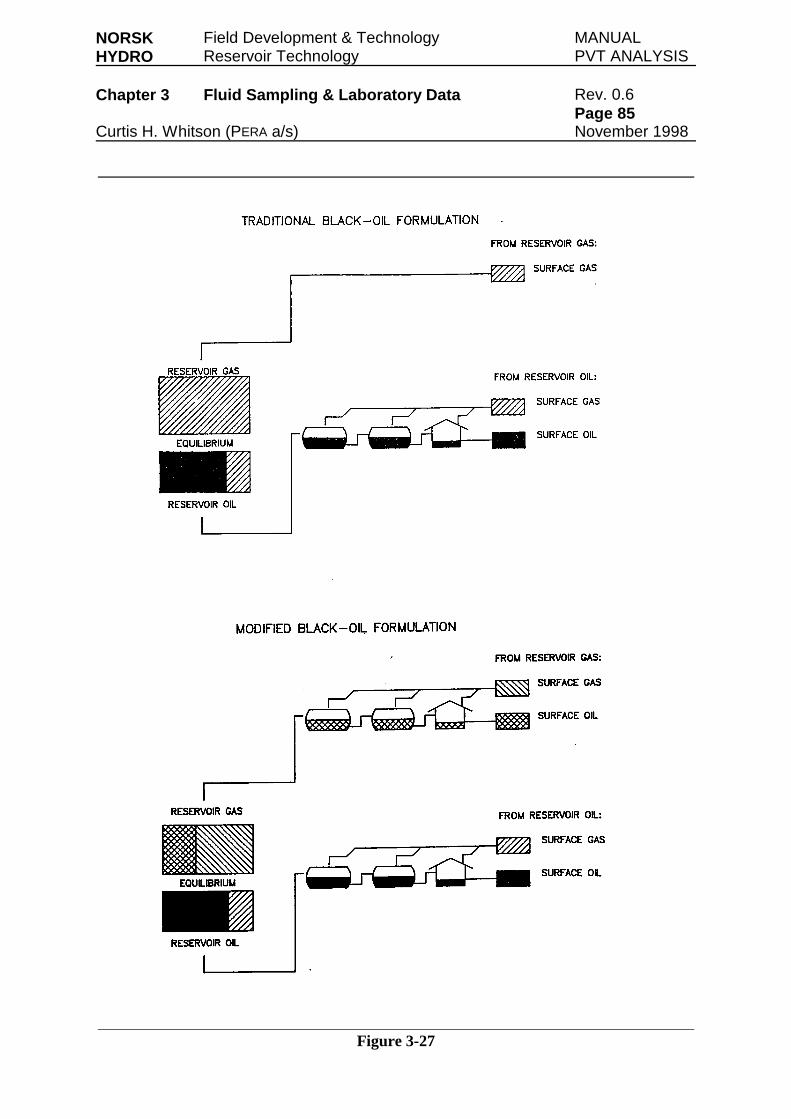
NORSK Field Development & Technology MANUALHYDRO Reservoir Technology PVT ANALYSIS
Chapter 3 Fluid Sampling & Laboratory Data Rev. 0.6Page 85
Curtis H. Whitson (PERA a/s) November 1998
Figure 3-27
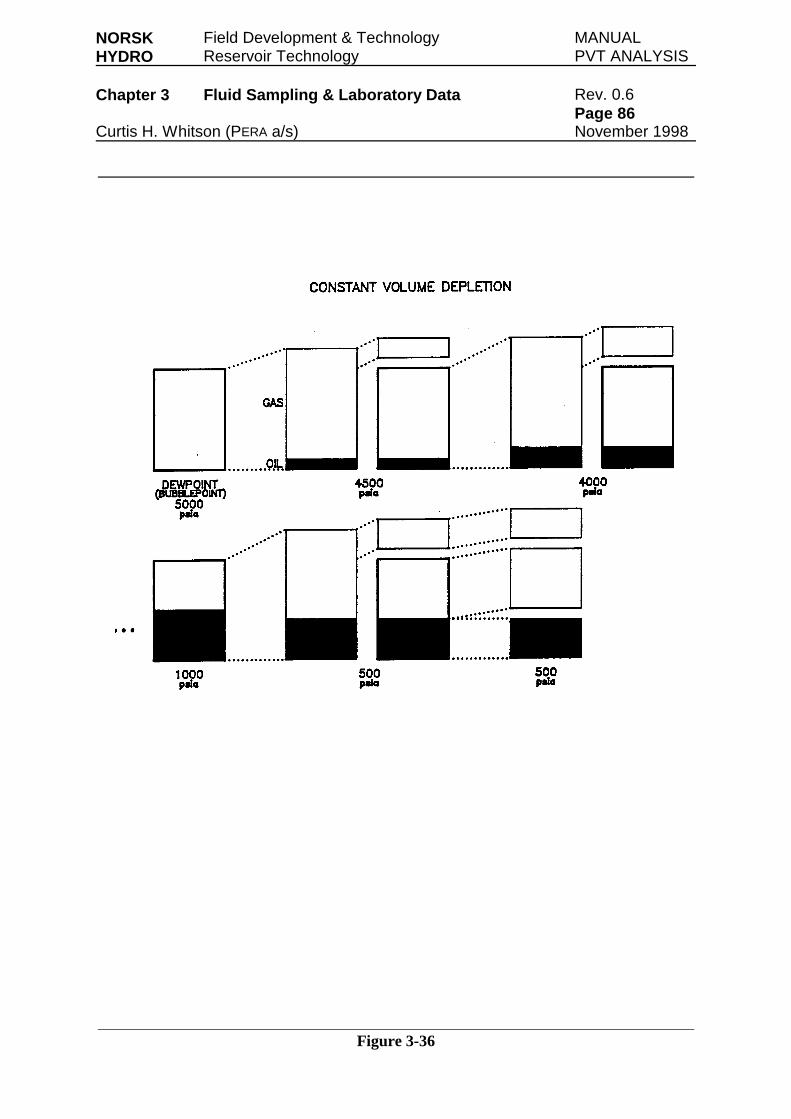
NORSK Field Development & Technology MANUALHYDRO Reservoir Technology PVT ANALYSIS
Chapter 3 Fluid Sampling & Laboratory Data Rev. 0.6Page 86
Curtis H. Whitson (PERA a/s) November 1998
Figure 3-36
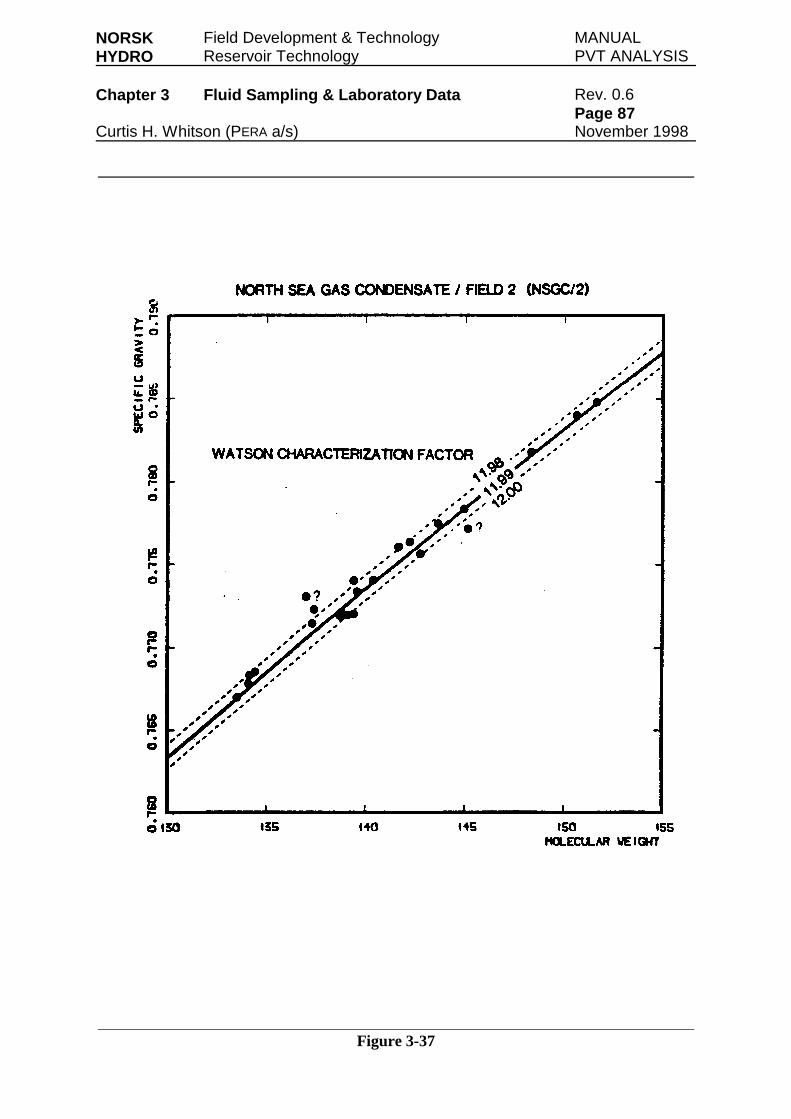
NORSK Field Development & Technology MANUALHYDRO Reservoir Technology PVT ANALYSIS
Chapter 3 Fluid Sampling & Laboratory Data Rev. 0.6Page 87
Curtis H. Whitson (PERA a/s) November 1998
Figure 3-37
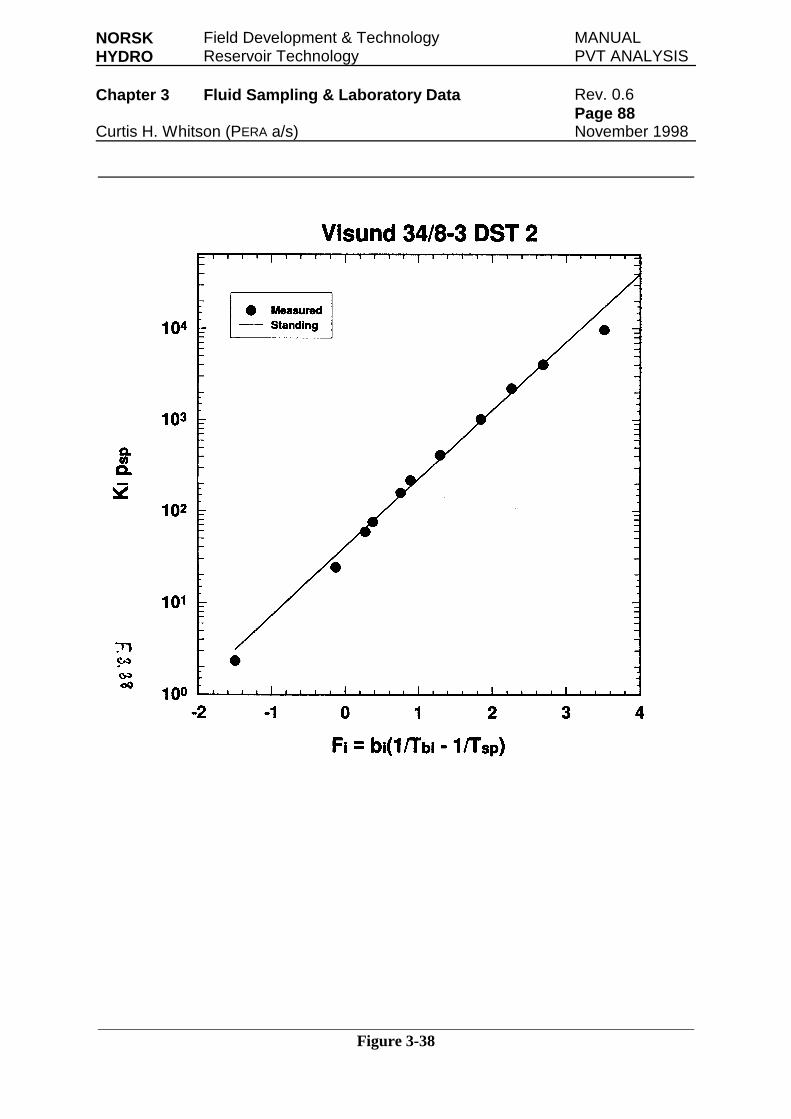
NORSK Field Development & Technology MANUALHYDRO Reservoir Technology PVT ANALYSIS
Chapter 3 Fluid Sampling & Laboratory Data Rev. 0.6Page 88
Curtis H. Whitson (PERA a/s) November 1998
Figure 3-38
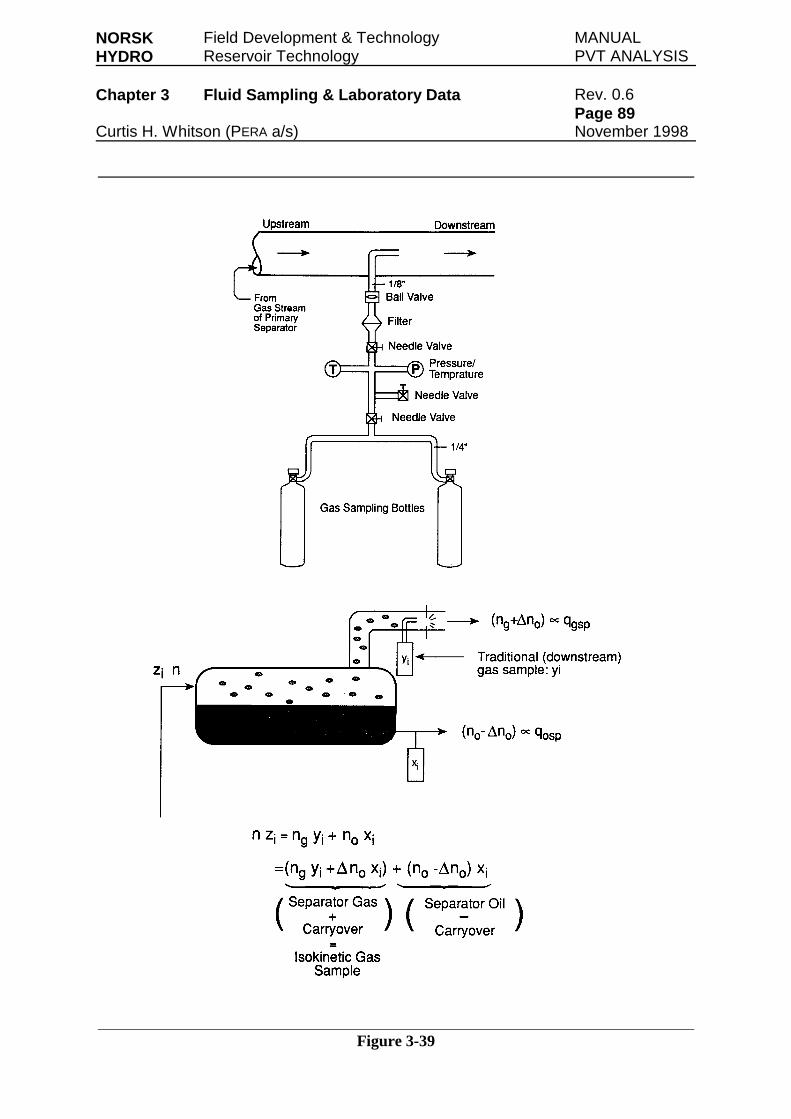
NORSK Field Development & Technology MANUALHYDRO Reservoir Technology PVT ANALYSIS
Chapter 3 Fluid Sampling & Laboratory Data Rev. 0.6Page 89
Curtis H. Whitson (PERA a/s) November 1998
Figure 3-39
NORSK Field Development & Technology MANUALHYDRO Reservoir Technology PVT ANALYSIS
Chapter 4 PVT Requirements and Correlations Rev. 0.6Page 1
Curtis H. Whitson (PERA a/s) November 1998
4. PVT REQUIREMENTS AND CORRELATIONS
4.1 Introduction
4.1.1 Where Do Measured PVT Data Come From?In this chapter we look at how to use measured PVT data in reservoircalculations. Measured PVT data may include:
• Production data from a well test, including separator GOR, stock-tank oiland separator gas gravities (γo and γg), and reservoir temperature.
• Standard laboratory PVT analyses (see chapter 3), includingcompositional analysis, constant composition expansion, a depletionexperiment, and perhaps a multistage separator test.
• Special laboratory PVT analyses such as multiple-contact gas injectionstudies and slimtube displacements.
Production data will almost always be available from the initial discovery of areservoir. Standard laboratory tests may take one to six months to obtain.Special PVT analyses may not be available for several years, as they are usuallyordered only after gas injection has been deemed a viable development strategy.
4.1.2 Why Do We Need PVT Data?All reservoirs require black-oil PVT properties for volumetric calculations.Most reservoirs will eventually be studied with a black-oil reservoir simulator.Some reservoirs may also require compositional simulation. The following listgives the primary applications of PVT data in reservoir calculations:
• Volumetric calculations of original gas and oil in place.
• Interpretation of well test and production data.
• Material balance calculations.
• Deliverability (inflow performance) calculations.
• Black-oil reservoir simulation of depletion, water injection, and somegas injection processes.
• Compositional (EOS) reservoir simulation of gas condensate and volatileoil systems, reservoirs with compositional variation, and gas injectionprocesses.
NORSK Field Development & Technology MANUALHYDRO Reservoir Technology PVT ANALYSIS
Chapter 4 PVT Requirements and Correlations Rev. 0.6Page 2
Curtis H. Whitson (PERA a/s) November 1998
• Compositional (EOS) process simulation
It is clear from this list that we must develop black-oil PVT properties for areservoir as early as possible. In particular we need as a function of pressure: (1)volume factors Bo and Bg, and (2) solution gas-oil ratio Rs and/or oil-gas ratio rs.
The saturation pressure of a reservoir fluid must also be determined as soonas possible. PVT properties are discontinous at the saturation pressure, and thereservoir production performance may be significantly different above andbelow the saturation pressure.
4.1.3 How do we get PVT Data?PVT properties can be obtained from three primary sources:
• Empirical PVT correlations.
• Laboratory measurements.
• Equation of state fluid characterization.
Depending on the time since discovery, the type and size of the hydrocarbonaccumulation, and the type of reservoir model being used, any or all three ofthese sources may be used to obtain the necessary PVT data.
Empirical correlations are useful in two situations. First, when the onlyinformation available is data from production tests. Correlations can be used toestimate the black-oil properties Bo, Bg, and Rs as a function of pressure. Asecond application of correlations is to fit measured data from a given reservoiror field, using the developed correlations to interpolate and extrapolate PVTproperties as a function of temperature and "composition" (e.g. STO gravity).
Laboratory measured PVT data can be used directly to determine black-oilproperties for low- and moderately-volatile reservoir oils. The properties soderived (Bo, Bg, Rs, and sometimes rs) relate surface oil and gas volumes for aspecific set of separator conditions to volumes at reservoir conditions.
Laboratory measured PVT data can alternatively be used to tune an equation-of-state PVT model, with the resulting PVT model (hopefully) being able togenerate more accurate black-oil properties for a wider range of reservoircompositions and temperatures.
Equation of state models can be fairly accurate for predictions of depletion-type processes, where the overall compositional effects are not large. Severalequations of state characterization methods are even what might be termed"predictive," meaning that they predict saturation pressure, gas and oil densitiesand volumes with reasonable accuracy, based only on fluid composition andproperties of the heaviest fraction (e.g. C7+).
Usually the predictions of laboratory PVT data are not sufficiently accurate
NORSK Field Development & Technology MANUALHYDRO Reservoir Technology PVT ANALYSIS
Chapter 4 PVT Requirements and Correlations Rev. 0.6Page 3
Curtis H. Whitson (PERA a/s) November 1998
and adjustments to the EOS model must be made. This process may be difficult,even with automated nonlinear regression methods for modifying the EOSmodel. Usually, however, a match of the experimental data can be obtained.The resulting EOS model will then be valid for predicting depletion-typeprocesses.
A word of caution. For an EOS model to accurately predict PVT behavior ofsystems with varying compositions, near-critical behavior, and developedmiscibility processes, special care must be taken when tuning the EOS model. Itis particularly important to include all available PVT data when tuning the EOS,including multi-contact gas injection experiments (e.g. swelling tests) andslimtube results if available.
4.1.4 Coming Up With PVT Data Can Be Difficult!Many petroleum reservoirs recently discovered and currently being developedhave rather complicated PVT behavior. For example, it is not uncommon thatcomposition and PVT properties vary with depth, or that different geologicalformations in the same field produce significantly different fluids.
A result of this more complicated PVT behavior is that a field (or even asingle geological formation) can not be described properly by a single set ofPVT properties. Composition can vary. Saturation pressure can vary. Stock-tank oil gravity can vary. Producing GOR can vary. Reservoir temperature canvary.
Particular care must be given to how PVT properties are developed forreservoir modelling. Reservoir simulators may not be able to handle themultitude of PVT-related problems for some fields. This will demandcontinuing improvements in the PVT capabilities of reservoir simulators. But inlieu of these improvements, some improvisation may be required to solve ourproblems. For further discussion, see the Norsk Hydro publication "Handbok forReservoar Simulering.1
4.2 Eclipse 100 PVT FormatsThe following sections are taken directly from the ECL100 user's manual.2
Alternate ECL100 PVT input formats (simplified oil and gas tables, PVCO andPVDG) are not given here but may be found in the ECL100 documentation.
Other EOS-based programs such as PVTSIM and Intera's PVT generate filesusing ECL100 (PVTO and PVTG) format. Even with identical EOScharacterizations, one fundamental difference will be found between how thevarious EOS programs generated ECL100 PVTO (and PVTG) data at pressuresgreater than the original saturation pressure.
At pressures greater than the (original) saturation pressure, the various EOSprograms may or may not extend (extrapolate) the saturated properties for p>psat.PVTx does not extend saturated properties beyond the original saturation
NORSK Field Development & Technology MANUALHYDRO Reservoir Technology PVT ANALYSIS
Chapter 4 PVT Requirements and Correlations Rev. 0.6Page 4
Curtis H. Whitson (PERA a/s) November 1998
pressure. This must be done manually, using different feeds with highersaturation pressures, and then "splicing" the ECL100 output files together.Section 5.4.5 (Generating Modified Black-Oil PVT) discusses this approach, andhow other EOS programs extrapolate saturated PVT properties.
Basically, the recommended approach for extrapolating saturated data (if atall) depends on the reservoir process being simulated. Gas injection requires oneapproach, while compositional variation with depth requires another approach.Some gas injection processes cannot be modelled adequately using ECL100.Alternatives include using a more complicated black-oil PVT formulation suchas found in the ECL200 "GI" approach, or using fully compositional (EOS)simulation.
4.2.1 PVTO - General Oil PVT TableThe ECL100 PVT table for saturated oil is specified with the PVTO command.A copy of the current version of the PVTO command from Intera's users manualis shown on the following page. It is recommended that the PVTO command beused instead of the alternative PVCO and PVDO commands, unless a particularapplication clearly calls for the use of an alternative PVT input format.
The PVTO table is automatically generated by PVTx using the PRINTECL100 print keyword (with an optional unit specification), and by specifyingmultistage separator commands SEPA in at least one depletion experiment(CCE, CVD, and/or DLE). For example,
PRINT ECL100 SI*DLE FEED=1DEGC BARATEMP=123* tsp pspSEPA 60 60SEPA 25 15SEPA 15.5 1.0135DATA345 / psat500 / at least one pressure > psat must be input !!!400350325300.../end
Note, at least one pressure greater than the calculated saturation pressure must beinput when generating ECL100 PVT files.
Don't forget to put the ECLIPSE file-opening command in the file pvtxfil.
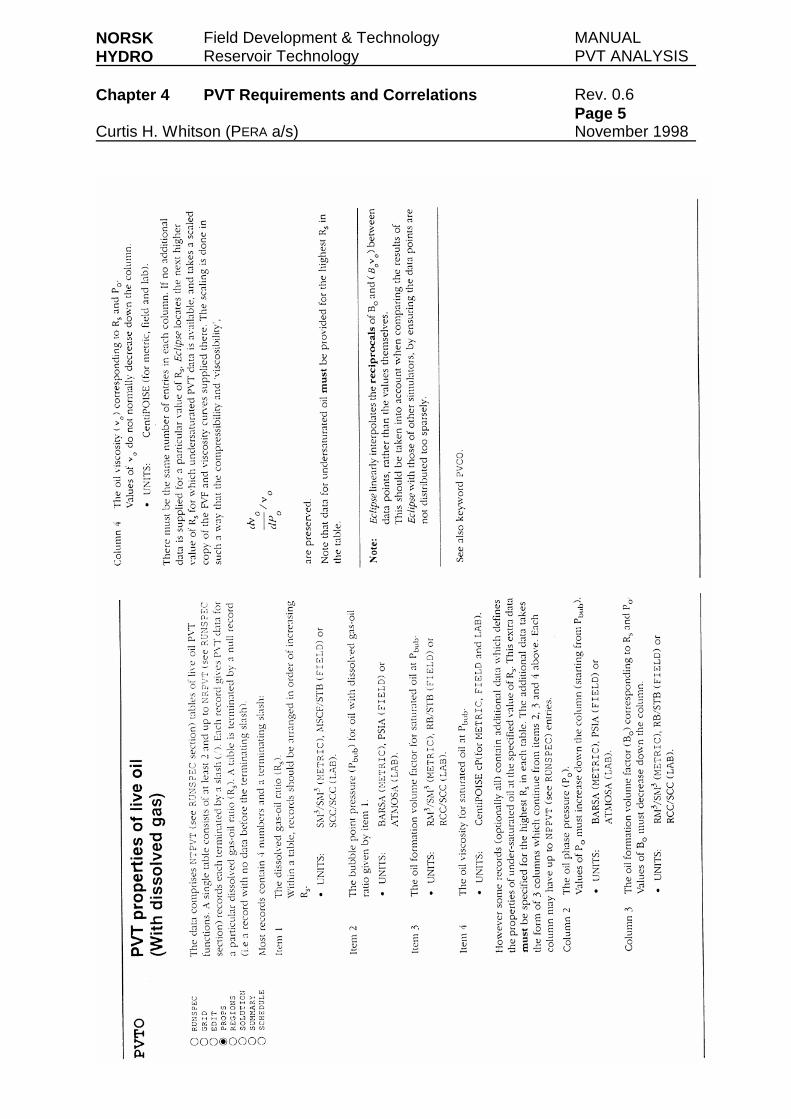
NORSK Field Development & Technology MANUALHYDRO Reservoir Technology PVT ANALYSIS
Chapter 4 PVT Requirements and Correlations Rev. 0.6Page 5
Curtis H. Whitson (PERA a/s) November 1998
NORSK Field Development & Technology MANUALHYDRO Reservoir Technology PVT ANALYSIS
Chapter 4 PVT Requirements and Correlations Rev. 0.6Page 6
Curtis H. Whitson (PERA a/s) November 1998
4.2.2 PVTG - General Gas PVT TableThe ECL100 PVT table for saturated gas (including "vapourized oil", i.e.dissolved condensate) is specified with the PVTO command. A copy of thecurrent version of the PVTG command from Intera's users manual is shown onthe following page. It is recommended that the PVTG command be used insteadof the alternative PVDG command, unless the particular application clearly callsfor the use of PVDG (the gas is truly "dry").
The PVTG table is automatically generated by PVTx using the PRINTECL100 print keyword (with optional unit definition), and by specifyingmultistage separator commands SEPA in at least one depletion experiment(CCE, CVD, or DLE). For example,
PRINT ECL100 SI*CVD FEED=1DEGC BARATEMP=136* tsp pspSEPA 50 45SEPA 23 12SEPA 15.5 1.0135DATA382 / psat500 / at least one pressure > psat must be input !!!400350325300.../end
Note, at least one pressure greater than the calculated saturation pressure must beinput when generating ECL100 PVT files.
Don't forget to put the ECLIPSE file-opening command in the file pvtxfil.
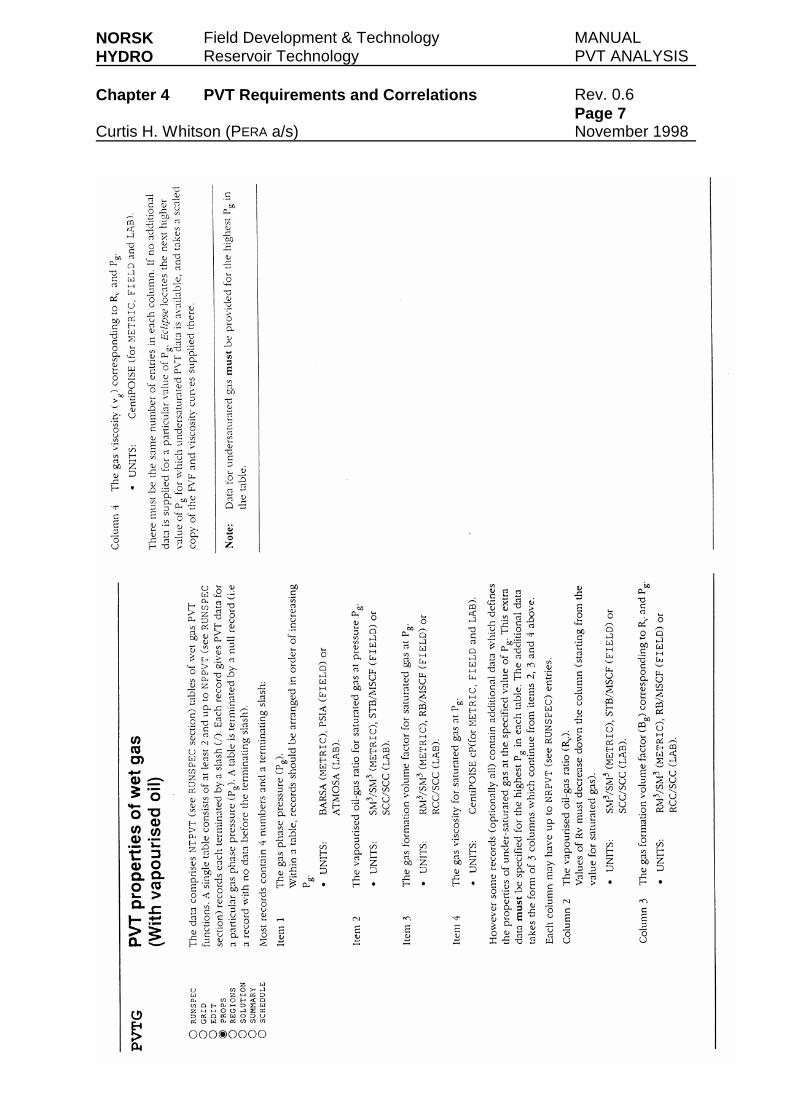
NORSK Field Development & Technology MANUALHYDRO Reservoir Technology PVT ANALYSIS
Chapter 4 PVT Requirements and Correlations Rev. 0.6Page 7
Curtis H. Whitson (PERA a/s) November 1998
NORSK Field Development & Technology MANUALHYDRO Reservoir Technology PVT ANALYSIS
Chapter 4 PVT Requirements and Correlations Rev. 0.6Page 8
Curtis H. Whitson (PERA a/s) November 1998
4.2.3 PVTW - General Water PVT TableWater properties are input to ECL100 using the water PVT table PVTW. Thisinput basically consists of specifying a reference pressure (e.g. initial reservoirpressure), water FVF and viscosity at the reference pressure, and watercompressibility and "viscosibility" at the reference pressure.
These data can be obtained from generalized correlations in the Fluid DataBook (Charts x-x), or for a specific reservoir system using the BIPWAT Lotus 1-2-3 spreadsheet and PVTx (see section 5.8 for an example of the latter).
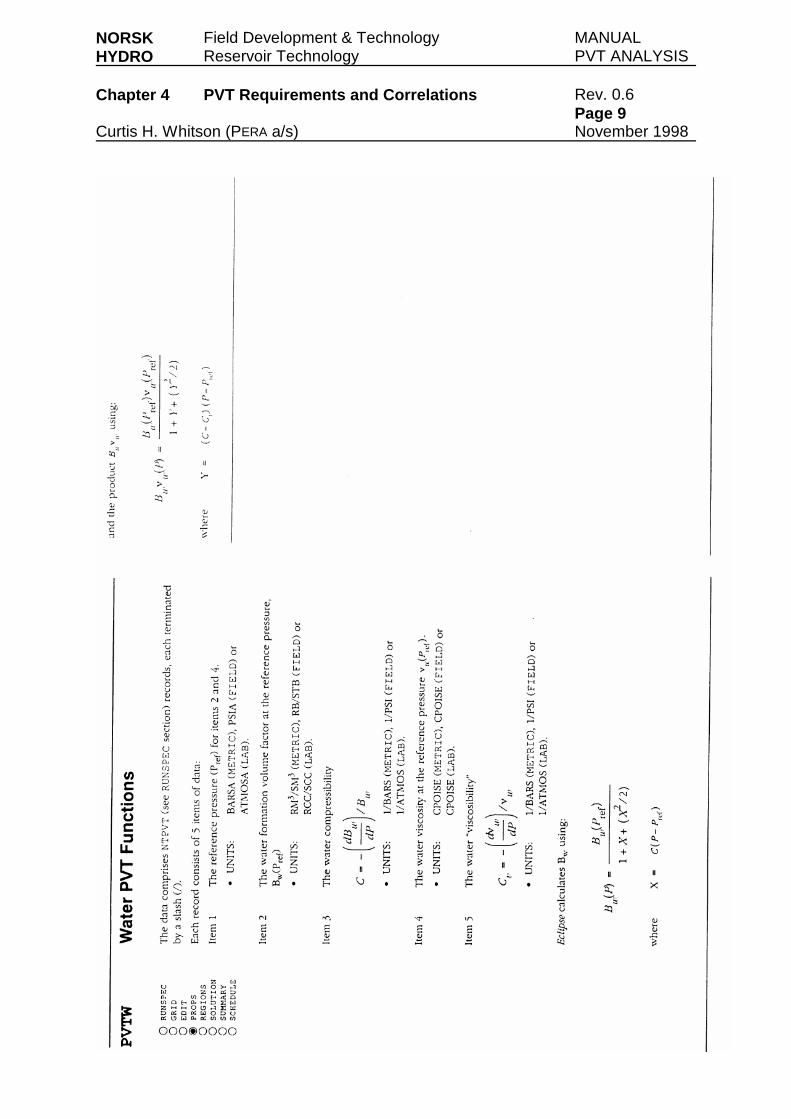
NORSK Field Development & Technology MANUALHYDRO Reservoir Technology PVT ANALYSIS
Chapter 4 PVT Requirements and Correlations Rev. 0.6Page 9
Curtis H. Whitson (PERA a/s) November 1998
NORSK Field Development & Technology MANUALHYDRO Reservoir Technology PVT ANALYSIS
Chapter 4 PVT Requirements and Correlations Rev. 0.6Page 10
Curtis H. Whitson (PERA a/s) November 1998
4.3 PVT Data from Production Test Results
4.3.1 What Data Are Available?Results from production testing of a discovery oil well will provide sufficientinformation to generate a complete set of PVT data for most reservoirengineering calculations, including screening simulation studies. The basic datarequired are:
• Reservoir temperature, TR
• Stock-tank oil gravity, γo
• Total average surface gas gravity, γg
• Producing (solution) gas-oil ratio, Rs
Reservoir temperature is measured during logging and pressure transient tests.Separator gas and oil measurements are made on site during production testing.
4.3.2 Separator RatesField measurement of GOR is based on test separator gas rate given as astandard gas volume (at 1 atm and 15 oC), and either (a) separator oil ratereported at separator conditions, or (b) stock-tank oil rate. Table 3-12 givescorrections for separator gas rates that influence the recombination GOR usedfor calculating the wellstream composition.
The relation between stock-tank oil rate and separator oil rate is given by ashrinkage factor, the inverse of separator oil FVF (bosp=1/Bosp),
conditionsseparatoratoilvolume
oiltank-stockvolume=b=
B
1=Shrinkage osp
osp
The shrinkage factor bosp usually ranges from 0.8 to 0.95 for offshore testseparator conditions. It is important to determine which oil rate has actuallybeen reported in a given test.
Stock-tank oil rates are usually denoted SM3/D or STB/D, although it is notuncommon that they are misleadingly labeled M3/D or BBL/D. Separator ratesare usually denoted M3/D or BBL/D. If you are lucky, both rates are reported,together with the shrinkage factor used. If in doubt about what oil rate isreported, ask the well testing engineer or call the testing/sampling company whoreported the rate.
The oil rate equation that yields stock-tank volumetric rate qo from meteredtest separator rate qmeter is
)f-(1bCq=q BSWospmetermetero
where Cmeter is a correction to the meter reading (calibration factor), and fBSW isthe BS&W (basic sediments and water) fraction.
NORSK Field Development & Technology MANUALHYDRO Reservoir Technology PVT ANALYSIS
Chapter 4 PVT Requirements and Correlations Rev. 0.6Page 11
Curtis H. Whitson (PERA a/s) November 1998
In closing, several precautions should be made to obtain a representativeGOR. First, the well should be produced at sufficiently high rates to ensurestable flow conditions. The GOR should be constant or changing smoothly andgradually on a fixed choke. It is more important to have a stable GOR conditionwith a higher rate, than to maintain a high wellbore flowing pressure to avoidtwo-phase flow near the wellbore.
4.3.3 Using Separator Test DataBefore separator test data from an oil well can be used in PVT correlations it isnecessary to estimate surface data that are not usually measured. Figure 4-1illustrates a typical separator test, where measured and calculated data areindicated. Measured data usually include:
• First stage separator gas rate, qg1, Sm3/d
• First stage separator oil rate, qosp, sep. m3/d, or stock-tank oil rate, qo,Sm3/d
• First stage separator gas gravity, γg1
• Stock-tank oil gravity, γo
Shrinkage (1/Bosp) is either measured or estimated from a correlation.
Based on the reported test information, the following additional quantitiesshould be calculated:
1. Additional gas in solution in separator oil, Rs+ (scf/STB), and the specificgravity of the solution gas, γg+
where
with psp given in psia and Tsp given in oF.
RA+A=
)AA-(1AA=R
s+32g+
31
21s+
γ(4-1)
101.4+
18.2
p=A )T0.00091-(0.01251sp
1.205
11spAPIγ (4-2)
γγ
API6-
3
API2
)103.57(-=A
0.02+0.25=A(4-3)
NORSK Field Development & Technology MANUALHYDRO Reservoir Technology PVT ANALYSIS
Chapter 4 PVT Requirements and Correlations Rev. 0.6Page 12
Curtis H. Whitson (PERA a/s) November 1998
2. Separator oil volume factor, Bosp (if not reported)
with Rs+ given in scf/STB and Tsp given in oF.
3. First stage separator GOR relative to STO, Rs1 (if not reported)
4. Total solution gas-oil ratio, Rs
5. Total average gas specific gravity γ g
The quantities Rs, γ g, γo (or γAPI) and reservoir temperature are used in the oil
correlations discussed below.
4.4 Oil PVT CorrelationsThis section discusses how to use PVT correlations to generate PVT data used inreservoir engineering calculations, including black-oil data for reservoirsimulation.
Oil PVT correlations are useful in several situations. Primarily we use themfor estimating key PVT properties of new discoveries, before laboratory PVTdata are available (one to six months after discovery). Correlations also can beused to fit measured PVT data, with the intention of interpolating andextrapolating in temperature and composition (i.e. API gravity). Finally, oilPVT correlations are often used for production calculations (e.g. pressure loss intubing) and estimating separator oil shrinkage factors; PVT properties arerequired at temperatures lower than studied in the standard PVT tests conductedat reservoir temperature.
4.4.1 Solution Gas-Oil RatioThe variation in solution GOR with pressure, Rs(p), can be estimated from abubblepoint pressure correlation. The traditional form of bubblepoint pressurecorrelations is
T1.25+)(R=A
A)1012(+0.9759=B
sp0.5
o
g+s+
1.2-5osp
γγ (4-4)
BR=q
q=R osp1sp
o
1g1s (4-5)
R+R=R s+1ss (4-6)
R+R
R+R=
s+1s
s+g+1s1g
g
γγγ (4-7)
NORSK Field Development & Technology MANUALHYDRO Reservoir Technology PVT ANALYSIS
Chapter 4 PVT Requirements and Correlations Rev. 0.6Page 13
Curtis H. Whitson (PERA a/s) November 1998
),T,,R(f=p gosb γγFor example, the Standing correlation3 is
The Glasø correlation4 is also recommended, as it was developed for North Seafields. The Lasater correlation5 is also recommended.
Assuming a saturated condition at some pressure p, this relation can be solvedfor Rs,
),T,(p,F=R gos γγ
where F is the inverse function of f. The pressure p can be less than or greaterthan the original bubblepoint pressure predicted at reservoir temperature.
For the Standing bubblepoint correlation, Rs(p) is given by
with p in psia, T in oF, and Rs in scf/STB.
4.4.2 Solution GOR Above Initial Bubblepoint PressureUsually the solution GOR is assumed constant at pressures greater than theoriginal bubblepoint pressure. However, this is strictly true only when thepressure decreases monotonically. Two situations in a reservoir may cause theoil to be saturated with more gas than originally in solution:
• Gas is injected at a pressure above the initial bubblepoint.
• Pressure builds up in a region of the reservoir with relatively high gassaturation (e.g. near the wellbore, or at the top of a layer undergoinggravity segregation).
In either situation, the oil can locally become saturated with more gas thanoriginally in solution.
2 illustrates the behavior of Rs(p). The upper figure shows the behavior thatwill be predicted by most empirical PVT correlation, where a monotonicrelationship exists between Rs and pressure. The only correlation that does notgive an approximately linear increase in Rs with pressure is the Lasatercorrelation, which has the limiting condition p=0.84T/γg for infinite Rs (T is in
10)R(=A
1.4)18.2(A-=p
API0.0125-T0.000910.83
g
s
b
γ
γ× (4-8)
10
101.4)p+(0.055=R T0.00091
0.0125 1.205
gs
APIγ
γ (4-9)
NORSK Field Development & Technology MANUALHYDRO Reservoir Technology PVT ANALYSIS
Chapter 4 PVT Requirements and Correlations Rev. 0.6Page 14
Curtis H. Whitson (PERA a/s) November 1998
oR and p is in psia).
The lower figure shows the actual behavior that would be expected for aleaner gas and a richer gas dissolving into a reservoir oil. A "rich" gas might beprimary separator gas, and a "lean" gas might be a highly-processed, methane-rich gas. Several points are worth noting.
• Lean gas elevates the bubblepoint faster (more readily) than a rich gas.Therefore it takes more rich gas to elevate the bubblepoint to a givenpressure.
• Extrapolating the Rs(p) curve with an empirical bubblepoint correlationwill result in a function that is more applicable to a "richer" gas.
• A critical point is reached where the addition of more gas results in amixture exhibiting a dewpoint instead of a bubblepoint.
• The Rs(p) is not monotonic forever. A maximum pressure willeventually be reached for most systems.
• The arrows indicate the initial direction that will be traversed on aparticular curve. However, depending on the situation, it is possible tomove either direction on any of the curves.
4.4.3 Saturated Oil Volume FactorSaturated oil FVF correlations are given by a function of the form
),T,,R(f=B gosob γγ
Subscript b indicates that the oil is saturated at the current pressure, which is thebubblepoint pressure of the oil, containing dissolved gas given by Rs. Note thatpressure does not enter the calculation of Bob directly, but only indirectly throughRs(p).
The Standing correlation3 for Bob is given as
The Glasø correlation4, developed for North Sea reservoirs, is alsorecommended.
Referring now to Figure 4-2, the saturated part of the curve is shown with asolid line and dashed lines are used for the undersaturated states. The saturatedoil FVF must be calculated along the solid line using an appropriate correlation.
T1.25+)(R=A
A)1012(+0.9759=B
0.5
o
gs
1.2-5ob
γγ (4-10)
NORSK Field Development & Technology MANUALHYDRO Reservoir Technology PVT ANALYSIS
Chapter 4 PVT Requirements and Correlations Rev. 0.6Page 15
Curtis H. Whitson (PERA a/s) November 1998
4.4.4 Undersaturated Oil FVF and CompressibilityThe oil FVF can be very important to the reservoir performance of highly-undersaturated oils. In fact, pressure depletion and recovery of these reservoirsare almost solely determined by Bo (in the absense of water drive).
Undersaturated oil FVF is calculated from undersaturated oilcompressibility. With several simplifying assumptions, the common relation
can be derived. In this relation co is assumed to be constant for all pressuresgreater than the bubblepoint. The result is a linear relationship between Bo and pfor p>pb. This assumption is not really valid for oils with GOR>150 Sm3/Sm3.
The Vazquez correlation6 for undersaturated oil compressibility is frequentlyused,
with p in psia, T in oF, and Rs in scf/STB. γgc is a corrected separator gas gravitygiven by
with Tsp in oF and psp in psia. McCain7 notes that this correlation tends tounderpredict oil compressibility, particularly at highly undersaturated conditions.
Using the pressure depedence given by the Vazquez correlation, an exactrelation for undersaturated oil FVF relation can be derived from the definition ofisothermal compressibility, c=-(dV/dp)/V,
resulting in
where A is given by the Vazuez correlation (Eq. (4-12)), or determined fromexperimental data (e.g. from the slope of a log-log plot of Vo/Vob versus p/pb).
For highly undersaturated, light-oil reservoirs (e.g. Embla Field),
)]p(p-c-[1BB boobo ≈ (4-11)
101433)-12.61+1180-T17.2+R(5=A
A/p=c5-
APIgcsb
o
×γγ (4-12)
)]114.7
plog(T)100.5912(+[1= sp
spAPI4-
ggc γγγ (4-13)
dp]p1
exp[AB
dp](p)cexp[B=B
p
p
ob
o
p
p
obo
b
b
= ∫
∫(4-14)
)/pp(B=BA
bobo (4-15)
NORSK Field Development & Technology MANUALHYDRO Reservoir Technology PVT ANALYSIS
Chapter 4 PVT Requirements and Correlations Rev. 0.6Page 16
Curtis H. Whitson (PERA a/s) November 1998
undersaturated Bo can be significantly nonlinear (Figure 4-2). For suchreservoirs the integral relation above should be used for oil FVF, where thepressure dependence of co is taken into account.
4.4.5 Oil DensityDensity of reservoir oil varies from 0.5 g/cm3 for light volatile oils to 0.95
g/cm3 for heavy crudes with little or no solution gas. Several methods havesuccessfully been used to correlate oil density, including extensions of ideal-solution mixing, equations of state, corresponding-states correlations, andempirical correlations.
Oil density based on black-oil properties is given by
with ρo in kg/m3, Bo in m3/Sm3, and Rs in Sm3/Sm3. Correlations can be used toestimate Rs and Bo from γo, γg, pressure, and temperature.
Standing-Katz MethodStanding and Katz3,8,9 give an accurate method for estimating oil densities
using an extension of ideal-solution mixing,
where ρpo is the pseudoliquid density at standard conditions, and the terms ∆ρT
and ∆ρp give corrections for temperature and pressure, respectively.
Pseudoliquid density is calculated using ideal-solution mixing andcorrelations for the apparent liquid densities of ethane and methane at standardconditions. Given oil composition xi, ρpo is calculated from
where Standing and Katz show that apparent liquid densities ρi (kg/m3) of C2
and C1 are a function of the densities ρ2+ and ρpo (also in kg/m3), respectively(Chart x, Fluids Data Book),
where
B
R1.224+1000=
o
sgoo
γγρ (4-16)
ρρρρ Tppoo -+= ∆∆ (4-17)
ρ
ρ
i
iiN
1=i
ii
N
1=ipo
Mx
Mx=
∑
∑(4-18)
ρρρρ
po1
+22
0.45+4.998=
0.3167+245.1=(4-19)
NORSK Field Development & Technology MANUALHYDRO Reservoir Technology PVT ANALYSIS
Chapter 4 PVT Requirements and Correlations Rev. 0.6Page 17
Curtis H. Whitson (PERA a/s) November 1998
Application of these correlations results in an apparent trial-and-error calculationfor ρpo. Standing10 presents a graphical correlation (Chart x, Fluids Data Book)based on these relations, where ρpo is found from ρ3+ and weight fractions of C2
and C1 (w2 and w1).
The pressure correction ∆ρp is a function of ρpo, and ∆ρT is a function of(ρpo+∆ρp). Madrazo11 introduced modified curves for ∆ρp and ∆ρT whichimprove predictions at higher pressures and temperatures. Standing3 gives best-fit equations for his original graphical correlations of ∆ρp and ∆ρT,
with ρ in kg/m3, p in bara, and T in oC. These equations are not recommended attemperatures greater than 115oC; instead, Madrazo's graphical correlation can beused. The correction factors can also be used to determine isothermalcompressibility and oil formation volume factor at undersaturated conditions.
The treatment of nonhydrocarbons in the Standing-Katz method has notreceived much attention, and the method is not recommended whenconcentrations of nonhydrocarbons exceed 10 mole percent. Standing3 suggeststhat an apparent liquid density of 479 kg/m3 can be used for nitrogen, but hedoes not address how the nonhydrocarbons should be considered in thecalculation procedure - i.e., as part of the C3+ material or following thecalculation of ρ2 and ρ1. Madrazo indicates that the volume contribution ofnonhydrocarbons can be neglected completely if the total content is less than 6mole percent. Vogel and Yarborough12 suggest the weight fraction of nitrogenshould be added to the weight fraction of ethane.
In the absence of oil composition, Katz13 suggests that the pseudoliquiddensity ρpo (in kg/m3) be calculated from stock-tank oil gravity γo, solution gas-oil ratio Rs, and apparent liquid density of the surface gas ρga taken from agraphical correlation (Chart x, Fluid Data Book),
ρ
ρ
i
iiC
C=i
ii
C
C=i+2
Mx
Mx=
+7
2
+7
2
∑
∑(4-20)
( )[ ]( )[ ] p10263+0.299103.364-
p1016.181+0.1670.2323=20.00376-5-
-0.00265p
po
po
ρ
ρ
×
ρ∆(4-21)
( )[ ]( )[ ]100.0622-108.1)28T-(1.816.02-
+101.363+0.013328)T-(1.816.02=)+0.00477(-6-2
ppo-2.455
T
ppo ρ∆ρ×
ρ∆ρ×ρ∆(4-22)
NORSK Field Development & Technology MANUALHYDRO Reservoir Technology PVT ANALYSIS
Chapter 4 PVT Requirements and Correlations Rev. 0.6Page 18
Curtis H. Whitson (PERA a/s) November 1998
Standing gives an equation for ρga,
with ρga in kg/m3 and Rs in Sm3/Sm3.
The Alani-Kennedy14 method for calculating oil density is a modification ofthe original van der Waals' EOS, with constants a and b given as functions oftemperature for normal paraffins C1 to C10, and iso-butane; two sets ofcoefficients are reported for methane (for temperatures from 20° to 150°C, andfrom 150° to 240°C) and two sets for ethane (for temperatures from 38° to120°C, and from 120° to 240°C). Lohrenz et al.15 give Alani-Kennedytemperature-dependent coefficients for nonhydrocarbons N2, CO2, and H2S.
The Alani-Kennedy method has been outdated by more predictive cubicequations of state, such as the Peng-Robinson or Soave-Redlich-Kwong EOSusing volume translation.
Rackett16 and Hankinson et al.17,18 give accurate correlations for purecomponent saturated liquid densities, and although these correlations can beextended to mixtures, they have not been tested extensively for reservoirsystems.
Cubic EOS with Volume TranslationThe Standing-Katz method is limited somewhat by a temperature constraint
of about 250oF. Given oil composition (and C7+ molecular weight and specificgravity), the most general and accurate method for estimating densities (andother volumetric properties) is the PR or SRK EOS with volume translation.
It is highly recommended to use the default PVTx fluid characterizationsgenerated using the PVTxIN data set generator programa; either the Whitson C7+
splitting routine for the PR EOS, or the Pederen et al. C7+ procedure for the SRKEOS. Three C7+ fractions is recommended, as oil volumetric properties are notvery sensitive to the total number of C7+ fractions.
aThe C7+ characterization method, and particularly the correct use of volume translation
dictates the accuracy of cubic EOS oil volumetric predictions. The volume translation coefficientsare usually constants for pure components, determined by matching the saturated liquid density atT=0.7Tc, where the volume shift for C7+ fractions is determined by matching the specific gravity ofeach fraction.
ργ
γγρ
ga
gs
gsopo R
1.224+1
R1.224+1000= (4-23)
]log)log33.93-(94.75+
10[38.5216.02=
gAPI
-0.00326ga
API
γγ
×ρ γ
(4-24)
NORSK Field Development & Technology MANUALHYDRO Reservoir Technology PVT ANALYSIS
Chapter 4 PVT Requirements and Correlations Rev. 0.6Page 19
Curtis H. Whitson (PERA a/s) November 1998
4.4.6 Saturated Oil ViscosityOil viscosity can not be estimated reliably, perhaps within ±30% at best. Therecommend correlations are based on two criteria:
• The correlations should extrapolate reasonably for light and heavy stock-tank crudes.
• In the exploration phase, when little data is available, it is important tomake conservative estimates of key reservoir parameters.
Most correlations have the functional form given by Chew and Connally19,
where µoD is dead-oil viscosity estimated as a function of temperature and stock-tank oil gravity. A1 and A2 are functions of solution GOR, Rs.
The recommended correlation for µoD is given by Bergman20,
with µoD in cp and T in oF. This correlation is recommended because it isapplicable at reservoir temperatures and at seabed temperatures approaching0oC. The Glasø correlation4 is also well suited for this wide temperature range,
with µoD in cp and T in oF. The Bergman correlation predicts dead-oilviscosities slightly higher than the Glaso correlation (Figure 4-2).
The recommended correlations for A1 and A2 are given by Aziz et al.21,
with Rs in scf/STB. These correlations predict slightly higher viscosities thanmost other correlations (for A1 and A2). The functional form of the Aziz et al.correlations are well-behaved at high Rs values, approaching constant valuesA1=0.2 and A2=0.43 (there is no physical meaning attached to these constants).
The Beggs and Robinson correlations22 for A1 and A2, which are commonlyused, also behave reasonably at high Rs values. However, the Beggs andRobinson correlation predicts considerably lower saturated oil viscosities than
)(A= AoD1ob
2µµ (4-25)
γγγ
µ
API1
2APIAPI0
10oD
0.0185+3.20-=a
0.00033+0.194-22.33=a
310)ln(T+a+a=1)+ln(ln
(4-26)
)(log
T)103.141(=36.447]-T)g[10.313(lo
API
-3.44410oD
γ×
µ(4-27)
100.57+0.43=A
100.80+0.20=AR0.00072-
2
R-0.000811
s
s
××
(4-28)
NORSK Field Development & Technology MANUALHYDRO Reservoir Technology PVT ANALYSIS
Chapter 4 PVT Requirements and Correlations Rev. 0.6Page 20
Curtis H. Whitson (PERA a/s) November 1998
the Aziz correlation for Rs<150 Sm3/Sm3 (see Figure 4-2).
4.4.7 Undersaturated Oil Viscosity and "Viscosibility"Undersaturated oil viscosity is very nearly a linear function of pressure, even athigh pressures and for relatively volatile oils. Two correlations are
recommended. The first, which is commonly used, is given by Vazquez6,with p in psia and viscosities in cp.
The second correlation is given by Standing (originally as a chart10, and laterfit to the following equation23),
with p in psia and viscosities in cp. Based on this correlation, undersaturated oilviscosity is a linear function of pressure, with the slope given as a function ofbubblepoint oil viscosity µob. Note that the quantity "viscosibility" used in theECL100/ECL200 models is given by (see Figure 4-2)
with viscosibility in 1/psi. Multiply by 14.5 to get 1/bar.
The Vazquez correlation predicts somewhat higher viscosities than theStanding correlation, up to about p=2pb. At higher pressures, the Vazquezcorrelation may give considerably higher viscosities, as shown in Figure 4-2.
The Standing correlation is recommended in general. The Vazquezcorrelation may have an abrupt increase in viscosity at higher pressures, abehavior that cannot be readily explained physically. The Standing correlation isonly slightly more optimistic (lower µo values) than the Vazquez correlation, theStanding correlation is simpler, and it extrapolates in a physically consistentmanner at high pressures.
4.5 Gas PVT CorrelationsThis section gives correlations for PVT properties of natural gases, including:
• Gas Volumetric Properties - Review• Z-factor Correlations• Gas Pseudocritical Properties
p)108.98-3exp(-11.51p2.6=A
)p(p/=5-1.187
Abobo
×
µµ(4-29)
µ×µ×µµ 0.56ob
5-1.6ob
5-
b
obo 103.8+102.4=pp-
-(4-30)
µ×µ×≈
µµ
0.44-ob
5-0.6ob
5-
p=po
ob
103.8+102.4
)dp
d(
1=ityViscosibil
b (4-31)
NORSK Field Development & Technology MANUALHYDRO Reservoir Technology PVT ANALYSIS
Chapter 4 PVT Requirements and Correlations Rev. 0.6Page 21
Curtis H. Whitson (PERA a/s) November 1998
• Wellstream Gravity of Wet Gases and Gas Condensates• Gas Viscosity• Total Volume Factor
4.5.1 Gas Volumetric PropertiesMost gases at low pressure follow the ideal-gas law,
where
R=10.73146 psia ft3 oR-1 lbmol-1
R=8.3143 kPa m3 K-1 kmol-1
R=0.083143 bar m3 K-1 kmol-1
Application of the ideal-gas law results in two useful engineeringapproximations.
First, the standard molar volume representing the volume occupied by onemole of gas at standard conditions is independent of the gas composition:
Second, the specific gravity of a gas defines the gas molecular weight,
For gas mixtures at moderate to high pressure or at low temperature theideal-gas law does not hold because the volume of the constituent molecules, aswell as their intermolecular forces, strongly affect the volumetric behavior of thegas.
The real gas law includes a correction term, the Z-factor,This is the standard equation for describing the volumetric behavior of reservoirgases. All volumetric properties of gases can be derived from the real-gas law.
Gas density is given by
nRT=pV (4-32)
kmol/Sm23.69
lbmol/scf379.5
pRT
n
)V()v(
3
sc
scscgscg
==
==
(4-33)
γρρ
γ
gg
g
air
g
scair
scgg
28.97=M
28.97M=
M
M=)(
)(=
(4-34)
nZRT=pV (4-35)
ZRT
p28.97=
ZRT
pM= gg
g
γρ (4-36)
NORSK Field Development & Technology MANUALHYDRO Reservoir Technology PVT ANALYSIS
Chapter 4 PVT Requirements and Correlations Rev. 0.6Page 22
Curtis H. Whitson (PERA a/s) November 1998
For wet-gas and gas-condensate mixtures, wellstream gravity γw shouldalways be used instead of γg in calculating pseudocritical properties.
Gas compressibility cg is given by
For sweet natural gas (i.e., not containing H2S) at pressures less than about 70bara, the second term in Eq. (4-37) is negligible and cg≈1/p is a reasonableapproximation.
Gas volume factor Bg is defined as the ratio of gas volume at specified p andT to the ideal-gas volume at standard conditions,
which for SI units (psc=1.013 bara and Tsc=15.56°C=288.7 K) is
with temperature in K and pressure in bar.
Because Bg is inversely proportional to pressure, the inverse volume factorbg=1/Bg is commonly used. For SI units (bara and K),
4.5.2 Z-Factor and CompressibilityStanding and Katz24 present a generalized Z-factor chart which has become anindustry standard for predicting the volumetric behavior of natural gases. Manyempirical equations and equations of state have been fit to the original Standing-Katz chart. For example, Hall and Yarborough25 present an accuraterepresentation of the Standing-Katz chart using a Carnahan-Starling hard-sphereequation of state,
)p
Z(
Z
1-
p
1=
)p
V(
V
1-=c
T
g
gg
∂∂
∂∂
(4-37)
p
TZ)
T
p(=B
sc
scg (4-38)
p
TZ0.00351=Bg (4-39)
TZ
p285=)Sm/Sm(b 33
g (4-40)
T/1=t
])t-exp[-1.2(1t0.06125=
y
p=Z
pr
2
pr
α
α
(4-41)
NORSK Field Development & Technology MANUALHYDRO Reservoir Technology PVT ANALYSIS
Chapter 4 PVT Requirements and Correlations Rev. 0.6Page 23
Curtis H. Whitson (PERA a/s) November 1998
where the reduced density y (the product of a van der Waals covolume anddensity) is obtained by solving the relation
t82.218.132
232
3
432
pr
y)t4.42t242.2-t(90.7
y)t58.4t9.76-t(14.76-
)y1(yyyy
p0)y(F
++++
−−+++α−==
(4-42)
with
The derivative ∂Z/∂p used in the definition of cg is given by
An initial value of y=0.001 can be used with a Newton-Raphson procedurewhere convergence should be obtained in 3 to 10 iterations for F(y)=10-8.
Based on Takacs26 comparison of 8 correlations representing the Standing-Katz chart, the Hall-Yarborough and Dranchuk-Abou-Kassem27 equations givethe most accurate representation for a broad range of temperature and pressure.Both equations are valid for 1≤Tr≤3 and 0.2≤pr≤25-30.
For many petroleum engineering applications the Brill and Beggs28 equationgives a satisfactory representation (±1-2%) of the original Standing-Katz Z-factor chart for 1.2<Tr<2. Also, this equation can be solved explicitly for Z. Themain limitations are that reduced temperature must be greater than 1.2 (≈25°C)and less than 2.0 (≈170°C), and reduced pressure should be less than 15 (≈700bara).
The Standing-Katz Z-factor correlation may require special treatment for wetgas and gas condensate fluids containing significant amounts of heptanes-plusmaterial, and for gas mixtures with significant amounts of nonhydrocarbons.Also, several authors have noted an apparent discrepancy in the Standing-KatzZ-factor chart for 1.05<Tr<1.15, which has been "smoothed" in the Hall-
y)t42.4+t242.2t-t)(90.72.82+(2.18+
y)t9.16+t19.52t-(29.52-)y-(1
y+y4-y4y+4+1=
dy
dF
t2.82+1.1832
324
432
(4-42)
∂∂
dydFy
p
-y
1
p=)
p
Z(
2pr
pcT
αα
(4-43)
NORSK Field Development & Technology MANUALHYDRO Reservoir Technology PVT ANALYSIS
Chapter 4 PVT Requirements and Correlations Rev. 0.6Page 24
Curtis H. Whitson (PERA a/s) November 1998
Yarborough correlations.
The Hall-Yarborough (or the Dranchuk-Abou-Kassem) equation isrecommended for most natural gases. With today's computing capabilities it isnormally unnecessary to choose simple, less reliable equations such as the Brilland Beggs equation.
4.5.3 Gas Pseudocritical PropertiesZ-factor, viscosity and other gas properties have been accurately correlated usingcorresponding-states principles, where the property is correlated in terms ofreduced pressure and temperature:
where pr=p/pc and Tr=T/Tc. Such corresponding-states relations should be validfor most pure compounds when component critical properties pc and Tc are used.The same relations can be used for gas mixtures if the mixture pseudocriticalproperties ppc and Tpc are used. Pseudocritical properties of gases can beestimated using gas composition and mixing rules, or from correlations based ongas specific gravity.
Sutton29 suggest the following correlations for hydrocarbon gas mixtures,
He claims his equations are reliable for calculating pseudocritical properties withthe Standing-Katz Z-factor chart; he even suggests that this method is superior tousing composition and mixing rules(?).
Kay's mixing rule30 is typically used when gas composition is available,
where the pseudocritical properties of the C7+ fraction can be estimated from theMatthews et al. correlations3,31,
)T,p(f=/
)T,p(f=Z
rrogg
rr
µµ(4-44)
γγ
γγ2gHCgHCpcHC
2gHCgHCpcHC
3.6-131-756.8=p
74.0-349.5+169.2=T(4-45)
pyp
Ty=T
cii
N
1=ipc
cii
N
1=ipc
= ∑
∑(4-46)
NORSK Field Development & Technology MANUALHYDRO Reservoir Technology PVT ANALYSIS
Chapter 4 PVT Requirements and Correlations Rev. 0.6Page 25
Curtis H. Whitson (PERA a/s) November 1998
Kay's mixing rule is usually adequate for lean natural gases in the absense ofnonhydrocarbons. Sutton suggests that pseudocriticals calculated using Kay'smixing rule are adequate up to γg_0.85, but that errors in calculated Z-factorsincrease linearly at higher specific gravities, reaching 10 to 15% for γg>1.5.
When significant quantities of nonhydrocarbons CO2 and H2S are present,Wichert and Aziz32 suggest corrections to arrive at pseudocritical properties thatyield reliable Z-factors from the Standing-Katz chart. The Wichert and Azizcorrections are given by,
where *pcT and *
pcp are mixture pseudocriticals based on Kay's mixing rule. This
method was developed from extensive data from natural gases containingnonhydrocarbons, with CO2 molar concentration ranging from 0 to 55% and H2Sranging from 0 to 74%.
If only gas gravity and nonhydrocarbon content are known, the hydrocarbonspecific gravity is first calculated from
Hydrocarbon pseudocriticals are then calculated from Eqs. (4-45), and thesevalues are adjusted for nonhydrocarbon content based on Kay's mixing rule,
*pcT and *
pcp are used in the Wichert-Aziz equations using CO2 and H2S mole
fractions to obtain mixture Tpc and ppc.
0.8)-53.7)](-Mlog(852-[2319+
61.1)-Mlog(431-1188=p
log3800)-Mlog(2450+
71.2)-Mlog(364+608=T
+7+7
+7+7c
+7+7
+7+7c
γ
γ(4-47)
)y-y15(+])y+y(-)y+y([120=
)y-(1y+T
)-T(p=p
-T=T
4SH
0.5SH
1.6SHCO
0.9SHCO
SHSH*pc
*pc
*pc
pc
*pcpc
222222
22
ε
εε
ε
(4-48)
y-y-y-1
M/)My+My+My(-=
SHCON
airSHSHCOCONNggHC
222
222222γ
γ (4-49)
Ty+Ty+Ty+
T)y-y-y-(1=T
py+py+py+
p)y-y-y-(1=p
ScHSHcCOCOcNN
cHCSHCON*pc
ScHSHcCOCOcNN
pcHCSHCON
*pc
222222
222
222222
222
(4-50)
NORSK Field Development & Technology MANUALHYDRO Reservoir Technology PVT ANALYSIS
Chapter 4 PVT Requirements and Correlations Rev. 0.6Page 26
Curtis H. Whitson (PERA a/s) November 1998
The Sutton correlations (Eqs. 4-45)) are recommended for hydrocarbonpseudocritical properties. If composition is available, Kay's mixing rule shouldbe used with the Matthews et al. pseudocriticals for C7+. Gases containingsignificant amounts of nonhydrocarbons CO2 and H2S should always becorrected using the Wichert-Aziz equations. Finally, for gas-condensate fluidsthe wellstream gravity γw (discussed below) should replace γg in the equationsabove.
4.5.4 Wellstream GravityGas mixtures that produce condensate at surface conditions usually exist as asingle phase gas in the reservoir and production tubing. This can be verified bydetermining the dewpoint pressure at the prevailing temperature. If properties ofthe wellstream are desired at conditions where the mixture is single-phase, it isnecessary to convert surface gas and surface oil properties to a wellstreamspecific gravity γw. This gravity should be used instead of γg to estimatepseudocritical properties.
Wellstream gravity represents the average molecular weight of the producedmixture (relative to air) and it is readily calculated from the producingoil(condensate)-gas ratio rp, average surface gas gravity gγ , surface condensate
gravity γo, and surface condensate molecular weight Mo,
with rp in Sm3/Sm3. Average surface gas gravity is given by
Eq. (4-51) is presented graphically in Chart 22 of the Fluid Properties DataBook33.
When Mo is not available, the recommended correlation for estimating Mo isgiven by Cragoe34,35,
This correlation gives reasonable values of Mo for both surface condensates andstock-tank oils.
A typical problem is that all of the data required to calculate wellstream gasvolumes and wellstream specific gravity are not available and must be estimated.In practice, we often have reported only the first stage separator GOR (relative
)/M(r102.368+1
r816+=
op4
opgw γ×
γγγ (4-51)
GOR
GOR=
i
N
1=i
gii
N
1=ig sp
sp
∑
∑ γγ (4-52)
5.9-
6084=M
API
o γ(4-53)
NORSK Field Development & Technology MANUALHYDRO Reservoir Technology PVT ANALYSIS
Chapter 4 PVT Requirements and Correlations Rev. 0.6Page 27
Curtis H. Whitson (PERA a/s) November 1998
to STO volume) and gas specific gravity, Rs1 and γg1, the stock-tank oil gravityγo, and the primary separator conditions psp1 and Tsp1.
The same approach as discussed in the section on oil PVT correlations canbe used here (Eqs. (4-1) to (4-7)). The total producing oil-gas ratio is simply
rp = rs = 1/Rs = 1/(Rs1+Rs+)
The wellstream gravity γw is calculated using rp, γo, Mo, and γ gin Eq. (4-51).
4.5.5 Wet Gas and Dry Gas Volume FactorsThus far Bg has been defined assuming that the gas volume at p and T remains asa gas at standard conditions. For wet gases and gas condensates the surface gaswill not contain all of the original gas mixture because surface condensate isproduced after separation. For these mixtures the traditional definition of Bg
may still be used, but we refer to this quantity as a hypothetical wet-gas volumefactor (Bgw) calculated from Eq. (4-38).
If the reservoir gas yields condensate at the surface, the dry-gas volumefactor Bgd is sometimes used (for example in modified black-oil simulators),
with rs in Sm3/Sm3, Bgd and Bgw in m3/Sm3, T in K, p in bara; Cog is a conversionfrom surface oil volume in Sm3 to an "equivalent" surface gas in Sm3,
If condensate molecular weight Mog is not measured then it can be estimatedwith the Cragoe correlation,
The term (1+Cogrs)-1 represents the mole fraction of reservoir gas that
becomes dry surface gas after separation and usually ranges from 0.85 for richgas condensates to 1.0 for dry gases.
)rC+(1B=
)rC+(1p
ZT)
T
p(=B
soggw
sogsc
scgd
(4-54)
)SmSm(
M102.368=
)STBscf
(M
133,000=
)ft
lbmol(
M62.4)
STBft(5.615)
lbmolscf
(379=C
3
3
og
og4
og
og
3og
og3
og
γ×
γ
γ××
(4-55)
5.9-
6084=M
API
o γ(4-56)
NORSK Field Development & Technology MANUALHYDRO Reservoir Technology PVT ANALYSIS
Chapter 4 PVT Requirements and Correlations Rev. 0.6Page 28
Curtis H. Whitson (PERA a/s) November 1998
An approximate correlation for estimating solution oil-gas ratio is (Whitson,1994, unpublished)
with rs and r in Sm3/Sm3, Rs and R in Sm3/Sm3, and p in bara. R is the solutiongas-oil ratio of a hypothetical reservoir oil in equilibrium with the reservoir gasat 5000 psia (345 bara). A bubblepoint correlation can be used to estimate Rusing the approximate relations
(γg)reservoir oil ≈ (γg)resrevoir gas
(γAPI)reservoir oil ≈ 90 - (γAPI)reservoir gas
The correlation given by Eq. 4-54 is shown in Figure 4-9.The correlation estimates reasonable magnitude and pressure
dependence of rs, but it is probably not more accurate than about 10 to 20%.
4.5.6 Total Formation Volume FactorThe total formation volume factor Bt is defined as the volume of a two-phase,gas-oil mixture at elevated pressure and temperature, divided by the stock-tankoil volume resulting when the two-phase mixture is brought to surfaceconditions,
Bt is used for calculating the oil in-place for gas-condensate reservoirs,where Vt=Vg Assuming one reservoir m3 of hydrocarbon pore volume, theinitial condensate in place in Sm3 is given by N=1/Bt, and the initial "dry"separator gas in place is Gd=NRp. Rp is the initial producing gas-oil ratio.
When reservoir pressure is greater than or equal to the dewpoint pressure,Bt=Vg/(Vo)sc, and Bt is given by
with Rp in Sm3/Sm3. Condensate molecular weight Mo can be estimated fromthe Cragoe correlation,
psia)(5000bara345atR=R;R101.25=r
)p104+(0.08r=r
s*s
*s
6-*s
2.5-7*ss
××
(4-57)
)V(V+V
=Bsco
got (4-58)
)M
102.368+R(p
ZT)
T
p(=
RB=B
o
o4p
sc
sc
pgdt
γ×(4-59)
5.9-
6084=M
API
o γ(4-60)
NORSK Field Development & Technology MANUALHYDRO Reservoir Technology PVT ANALYSIS
Chapter 4 PVT Requirements and Correlations Rev. 0.6Page 29
Curtis H. Whitson (PERA a/s) November 1998
4.5.7 Gas ViscosityViscosity of reservoir gases generally ranges from 0.01 to 0.03 cp at standardand reservoir conditions, reaching up to 0.1 cp for near-critical gas condensates.Gas viscosities are rarely measured because most laboratories do not have therequired equipment.
The most common gas viscosity correlation is given by Lee, Gonzales, andEakin36
with ρg in g/cm3 and T in oR. This correlation is used by most reservoirlaboratories when reporting gas viscosities based on measured specific gravities.McCain7 claims that the correlation is reliable within 2-4% for gases with γg<1,with errors approaching 20% for rich gas condensates with γg>1.5.
Gases at very high pressure or with significant amounts of nonhydrocarbonsshould use the Lucas viscosity correlation37. Another correlation frequently usedis the Carr, Kobayashi, and Burrows correlation38.
4.6 Water/Brine PVT Correlations
4.6.1 IntroductionThe connate or "original" water found in petroleum reservoirs usually containsdissolved salts, consisting mainly of sodium chloride (NaCl), and solution gasconsisting mainly of CO2, methane and ethane. Initial water saturation can rangefrom 5 to 50% of the pore volume in the net-pay intervals of a reservior whereproduction is primarily oil and gas. Higher water saturations are found in non-net pay, in the aquifer, and where water has swept oil or gas during a waterfloodor water influx.
From a reservoir depletion point of view, the amount of water connectedwith a reservoir is as important as the properties of the water, particularly inmaterial balance calculations where the water expansion (compressibility timeswater volume) may contribute significantly to pressure support. From aproduction point of view, the mobility of water is important, requiring thedetermination of water saturations (i.e. relative permeability) and waterviscosity. For surface processing calculations, the composition of water, thewater content in the produced wellstream, and the conditions where water andhydrocarbons coexist must be defined.
A0.2224-2.447=A
0.29231+/T)(986.4+3.448=A
T+558.0+209.2
T)0.46555+(9.37910=A
)Aexp(A=
12
g1
g
1.5g4-
0
Ag10g
2
γ
γγ
×
ρµ
(4-61)
NORSK Field Development & Technology MANUALHYDRO Reservoir Technology PVT ANALYSIS
Chapter 4 PVT Requirements and Correlations Rev. 0.6Page 30
Curtis H. Whitson (PERA a/s) November 1998
The three most important aspects of water-hydrocarbon phase behavior are:
• Mutual solubilities of gas and water• Volumetric behavior of reservoir brines• Hydrate formation and treatment
This section presents PVT correlations for water-hydrocarbon systems. Thestandard PVT properties, solution gas-water ratio Rsw, isothermal watercompressibility cw, water formation volume factor Bw, water viscosity µw, andwater content in gas rsw are correlated in terms of pressure, temperature, andsalinity using graphical charts and empirical equations. Correlations for water-hydrocarbon interfacial tension σwh are also presented.
At high temperatures and pressures, some correlations and the existingwater-property data base are not adequate. Equations of state have been usedwith reasonable success in predicting mutual solubilities and phase properties ofhydrocarbon-water systems at temperatures up to 200°C and pressures greaterthan 700 bara,. The effect of salinity on gas-water phase behavior has also, tosome extent, been treated by EOS methods.
4.6.2 Properties and CorrelationsLike all reservoir fluids, the properties of formation waters depend oncomposition, temperature, and pressure. Reservoir water is seldom pure, and itusually contains dissolved gases and salts. Total dissolved solids (TDS) usuallyconsist mainly of NaCl, ranging from 10,000 ppm to about 300,000 ppm. Seawater has a salinity of about 30,000 ppm. Table 4-1 gives the composition ofseveral reservoir brines.
Water is limited by how much salt it can keep in solution. The limitingconcentration for NaCl brine is given by,
with T in °C and *swC in ppm. If reservoir temperature is known but a water
sample cannot be obtained, this relation gives the limiting salinity of thereservoir brine. Usually the salinity of a brine is less than 80% of the valuegiven by Eq. (4-62). Otherwise, the best estimate of brine salinity can be takenfrom a neighboring reservoir in the same geological formation.
Scale buildup in tubing and surface equipment is caused by the precipitationof salts in produced brine. Scale is usually caused by precipitation of calciumcarbonate, calcium sulfate (e.g. gypsum), barium or strontium sulfates, and ironcompounds. Temperature, pressure, total salinity and salt composition are theprimary variables determining the severity of scaling. Note that Eq. (4-62)should not be used for the detection of conditions that result in scale buildup.
Dissolved gas in water is usually less than 30 scf/STB (about 0.4 molpercent) at normal reservoir conditions. The effect of salt and gas content on
T1.06+T72+262,180=C 2*sw (4-62)
NORSK Field Development & Technology MANUALHYDRO Reservoir Technology PVT ANALYSIS
Chapter 4 PVT Requirements and Correlations Rev. 0.6Page 31
Curtis H. Whitson (PERA a/s) November 1998
water properties can be important, and the following discussion gives methods toestimate fluid properties in terms of temperature, pressure, dissolved gas, andsalinity. Methods for estimating the PVT properties of formation water areusually based on first estimating the properties of pure water at reservoirtemperature and pressure, then correcting the pure-water properties for salinityand dissolved gas.
4.6.3 SalinityThe cations dissolved in formation waters usually include Na+, K+, Ca++, Mg++,and the anions include Cl-, SO4
--, HCO3-. Most formation waters contain
primarily sodium chloride (NaCl). Suspended salts, entrained solids, andcorrosion-causing bacteria may also be present in reservoir waters, but theseconstituents do not usually affect the PVT properties of formation waters. Thegeochemistry of formation waters can be useful in detecting foreign waterencroachment, and in determining its source. Table 4-1 gives examplecompositions of reservoir brines.
Salinity defines the concentration of salts in a saline solution (brine), and itmay be specified as one of several quantities: weight fraction (ws), mole fraction(xs), molality (csw), molarity (csv), parts per million by weight (Csw), and parts permillion by volume (Csv). These quantities are formally defined in Table 4-2,where ms is the mass of salt in g, o
wm is the mass of pure water in g, ns is the
moles of salt in gmol, own is the moles of pure water in gmol, and Vw is the
volume of the brine mixture in cm3.
Some common conversions for the various concentrations are
where the last two equations apply for NaCl brines. If brine density ρw atstandard conditions (1.0135 bara and 15.5°C) is not reported, it can be estimatedfrom the Rowe-Chou density correlation{Rowe, 1970 #342} for NaCl,
with ρw in g/cm3 and ws in weight fraction TDS. For many engineeringapplications ρw=1 g/cm3 is assumed, and the mass of salt is considerednegligible compared with the mass of pure water, resulting in the approximaterelations:
1+c17.110=C
1-C10
17.1=c
w10=C=C
C=C
1-sw
6
sw
1-sw
6sw
s6
w
svsw
swwsv
ρ
ρ
(4-63)
)w0.26055+w0.7114-(1.0009=)T,p( -12ssscscwρ (4-64)
NORSK Field Development & Technology MANUALHYDRO Reservoir Technology PVT ANALYSIS
Chapter 4 PVT Requirements and Correlations Rev. 0.6Page 32
Curtis H. Whitson (PERA a/s) November 1998
where the constant 17.1(10-6) applies for NaCl brines.
4.6.4 Gas Solubilities in Water/BrineThe solubility of natural gases in water is rather complicated to estimate fromempirical correlations. However, the effect of gas solubility is usually minorexcept at high temperatures. At temperatures less than about 150°C andpressures less than 350 bara, solubility is usually less than 0.4 mol percent, orabout 5.5 Sm3/Sm3. According to Dodson and Standing's results40, this amountof dissolved gas causes an increase of about 25 percent in water compressibility,e.g. from 5.5(10-5) to 7.0(10-5) bar-1. Experimental gas solubilities for C1-C4,non-hydrocarbons, natural gas, and a few binaries and ternaries are available inthe literature.
At reservoir conditions the solubility of methane in water and the effect ofsalinity are the most important variables affecting water properties. Thefollowing empirical equation gives a reasonable fit of the Culbertson andMcKetta solubility data41 for methane in pure water at conditions 38<T<175°Cand 0<p<700 bara,
where
A00 = 0.299E+00 A10 = 2.283E-03A01 = -1.273E-03 A11 = -1.870E-05A02 = 0.000E+00 A12 = 7.494E-08A03 = 0.000E+00 A13 = -7.881E-11
A20 = -2.850E-07 A30 = 1.181E-11A21 = 2.720E-09 A31 = -1.082E-13A22 = -1.123E-11 A32 = 4.275E-16A23 = 1.361E-14 A33 = -4.846E-19
with T in °F and p in psia. Gas solubility expressed as a solution gas-water ratioRsw at standard conditions is given by
with Rsw in Sm3/Sm3; replacing the constant 1313 with 7370 yields Rsw inscf/STB.
A standard two-phase flash calculation using a cubic EOS gives surprisingly
s6
s
ssvsw
sswsv
C)10(1.17c
CCC
ccc
−≈
=≈=≈
(4-65)
∑∑ pTA10=x
ijij
3
0j=
3
0=i
3-C1
(4-66)
x1313_x-1
x1313=R gg
gsw (4-67)
NORSK Field Development & Technology MANUALHYDRO Reservoir Technology PVT ANALYSIS
Chapter 4 PVT Requirements and Correlations Rev. 0.6Page 33
Curtis H. Whitson (PERA a/s) November 1998
accurate prediction of gas solubilities, as discussed later in this chapter. Thisapproach is the recommended procedure for estimating gas solubilities ofhydrocarbon-water/brine mixtures at high pressures and temperatures.
4.6.5 Salinity Correction for SolubilitiesSetchenow42 (sometimes written Secenov) gives the following relation forcorrecting the hydrocarbon solubility in pure water for salt content,
where ks is the Setchenow constant and cs is salt concentration; (φ)w and (φ)ow
are the fugacity coefficients of component i at infinite dilution in the salt solutionand in pure water, respectively. Both molality and molarity have been used inthe literature for defining Setchenow constants, though molality (csw) is nowconsidered the preferred concentration, where the Setchenow constant has theunit molality-1 (i.e., kg/gmol).
The ratio of infinite-dilution fugacity coefficients is traditionally assumed togive an accurate estimate of the ratio of solubilities, yielding the relation
where oswR is the solubility of gas in pure water and Rsw is the solubility of gas in
brine. For ks>0 the gas solubility is less in brines than in pure water, a factwhich has led to the use of "salting-out coefficient" for ks.
The Setchenow constant is more or less independent of pressure, though it isa strong function of temperature. Cramer gives a detailed treatment ofSetchenow (and Henry's) constants for the C1-NaCl system using data attemperatures up to 300°C and pressures up to 135 bara. Søreide and Whitson43
give a best-fit relation for the Cramer correlation44,
with ks in molality-1 and T in °F. Using relations suggested by Pawlikowski andPrausnitz42 relating ks of methane to ks of other hydrocarbons, Søreide andWhitson propose the following relation for hydrocarbon ks,
with ks in molality-1 and the normal boiling point Tbi in K.
φ
φ∞
∞
→ )(
)(logclim=k o
wi
wi1-s
0cs
s
(4-68)
1010=x
x
RR Ck)1017.1(-ck-
og
g
osw
sw ss6-
ss ≈≈ (4-69)
T)102.612(-T)102.6614(+
T)107.692(-0.1813=)k(39-26-
-4NaCl-Cs
1 (4-70)
111.6)-T0.000445(+)k(=k biNaCl-Cssi 1(4-71)
NORSK Field Development & Technology MANUALHYDRO Reservoir Technology PVT ANALYSIS
Chapter 4 PVT Requirements and Correlations Rev. 0.6Page 34
Curtis H. Whitson (PERA a/s) November 1998
Clever and Holland45 give salting-out correlations for C1-NaCl and CO2-NaCl systems. The correlation for CO2-NaCl is
with T in K and ks in molality-1. The temperature range for Eq. (4-72) is4<T<350°C. The Setchenow coefficient varies somewhat with pressure for theCO2-NaCl system, thereby making Eq. (4-72) less accurate than hydrocarbon-NaCl correlations.
4.6.6 Equilibrium Conditions in Oil/Gas-Water SystemsAll phases - oil, gas, and water - in a reservoir are initially in thermodynamicequilibrium. This implies that the water phase contains finite quantities of allhydrocarbon and nonhydrocarbon components found in the hydrocarbon phases,and that the hydrocarbon phases contain a finite quantity of water. The amountof lighter compounds (C1, C2, N2, CO2, and H2S) in the water phase can besignificant, depending mainly on the amount of each component in thehydrocarbon phase(s). The amount of C3+ hydrocarbons found in water isusually small and can be neglected.
The K-value representing the ratio of the mole fraction of component i in thehydrocarbon phase to the mole fraction of component i in the water phase,Ki=zi,HC/xi,AQ, is approximately constant at a given pressure and temperature,independent of overall hydrocarbon composition and whether the hydrocarbon issingle phase or two-phase. For example, the amount of methane dissolved inwater for a methane-rich natural gas will be higher than the amount of methanedissolved in water for an oil (above its bubblepoint). Furthermore, the amountof methane dissolved in water for a gas-oil system with overall methane contentof 40 mol-% will probably be about the same as for a single-phase oil with 40mol-% methane.
An oil that is undersaturated (with respect to gas) is still in equilibrium withthe water phase. When pressure is lowered, a new equilibrium state is reachedbetween the gas-undersaturated oil and water. The result is that some of themethane will move from the water to the oil (without forming free gas). That is,the solution gas-water ratio decreases. At some lower pressure the oil will reachits bubblepoint (with respect to gas), and further reduction in pressure will yieldtwo sources of free gas: (1) gas coming out of solution from the oil, and (2) gascoming out of solution from the water.
Therefore, for an undersaturated oil reservoir, the solution gas-water ratio ofreservoir brine will continuously decrease from the initial reservoir pressuredown to the reservoir oil's bubblepoint pressure, and further at lower pressures.Correspondingly, the reservoir oil solution GOR will increase (albeit slightly)from initial pressure to the bubblepoint pressure, thereafter decreasing below thebubblepoint. An EOS can be used to quantify the changing solution gas-waterand gas-oil ratios in this situation.
T)100.438362(+T)100.253024(-
T)100.157492(-0.257555=)k(38-25-
-3NaCl-COs
2 (4-72)
NORSK Field Development & Technology MANUALHYDRO Reservoir Technology PVT ANALYSIS
Chapter 4 PVT Requirements and Correlations Rev. 0.6Page 35
Curtis H. Whitson (PERA a/s) November 1998
4.6.7 Water/Brine FVF and CompressibilityThe FVF of reservoir water Bw depends on pressure, temperature, salinity, anddissolved gas. Contrary to saturated oil volumetric behavior, the liquid volumeof a gas-saturated water increases with decreasing pressure. That is, theexpansion due to isothermal compressibility is larger than the shrinkage due togas coming out of solution.
The pressure dependence of Bw given by Dodson and Standing40 for gas-saturated water/brine will apply to all gas reservoirs and oil reservoirs withappreciable solution gas. Even if the oil is undersaturated, as discussed earlier,the solution gas-water ratio will decrease continuously from the initial pressureto the oil bubblepoint pressure and further thereafter.
The formation volume factor owB of brine at atmospheric pressure, reservoir
temperature, and without dissolved gas is given by
Long and Chierici46 give experimental data and correlations for the density ofpure water and NaCl brine solutions, though the proposed correlationsextrapolate poorly at temperatures greater than about 120°C.
The following correlation is given by Rowe and Chou39 for water and NaClbrine specific volume at zero pressure (also applicable at atmospheric pressure),
with in cm3/g, T in K, and ws as weight fraction of NaCl. The effect of pressureon FVF can be calculated using the definition of water compressibility,
which when integrated gives
Using the compressibility data reported by Rowe and Chou covering theconditions 20<T<175°C, 10<p<310 bara, and 0<ws<0.3, a general correlation
)T,p(v
T),p(v=T),p(
)T,p(=B
scscw
scow
scow
scscwow ρ
ρ(4-73)
T)100.223982(T+0.0154305-2.84851=A
T)100.170552(T-0.0111766+2.5166-=A
T100674.1+T1127.522-
T)100.9270048(T+0.01035794-5.916365=A
wA+wA+A=T),p(
1=T),p(v
24-2
24-1
2-1-
25-0
2s2s10
scow
scow ρ
(4-74)
)p
B(B
1-=c T,C
w
w
*w s∂
∂(4-75)
∫−=p
0
*w
scow
*w dp)T,p(c
)T,p(B)T,p(B
ln (4-76)
NORSK Field Development & Technology MANUALHYDRO Reservoir Technology PVT ANALYSIS
Chapter 4 PVT Requirements and Correlations Rev. 0.6Page 36
Curtis H. Whitson (PERA a/s) November 1998
for the compressibility of a brine (without solution gas), *wc , is
with c*w in psi-1, p in psia, T in °F, and ws in weight fraction of NaCl. Solving
Eq. (4-76) for the FVF of a brine without solution gas, B*w gives
where A0 and A1 are given in Eq. (4-77). Eq. (4-78) results in water and brinedensities that are within 0.5 percent of values given by the highly accuratecorrelation of Rogers and Pitzer47 for 15<T<200°C, 0<p<1,000 bara, and0<Cs<300,000 ppm. For the same range of conditions, Eq. (4-77) calculatesisothermal compressibilities within about five percent of the values given byRogers and Pitzer.
Using Dodson and Standing's data for pure water saturated with a naturalgas, an approximate correction for dissolved gas on water/brine FVF at saturatedconditions is given by
with Rsw in scf/STB. This relation fits the Dodson-Standing data at 150, 200,and 250°F, but overpredicts the effect of dissolved gas at 100°F.
Dodson and Standing also give a correction for the effect of dissolved gas onwater/brine compressibility,
with Rsw in scf/STB. This relation is only valid for undersaturated oil-watersystems above the oil bubblepoint pressure.
4.6.8 Water/Brine Viscosity
Tw0.125-w50+8=A
]T)101.45(-
T)101.9(+w0.58+[0.31410=A
)pA+A(=T)(p,c
ss1
26-
4-s
60
-110
*w
(4-77)
)pAA+(1T),p(B=T)(p,B
)A/(-1
0
1sc
ow
*w
1× (4-78)
)R0.0001+(1T)(p,B=)RT,(p,B 1.5sw
*wsww × (4-79)
)R0.00877+(1T)(p,c=)RT,(p,c sw*wsww × (4-80)
NORSK Field Development & Technology MANUALHYDRO Reservoir Technology PVT ANALYSIS
Chapter 4 PVT Requirements and Correlations Rev. 0.6Page 37
Curtis H. Whitson (PERA a/s) November 1998
The viscosity of pure water and NaCl brines are functions of temperature andsalinity, and can be estimated from the following equations presented by Kestinet al.48 who report an accuracy of ±0.5% in the range 20<T<150°C, 0<p<350bara, and 0<Csw<300,000 ppm (0<csw<5 molality),
wherea11 = 3.324E-2 a21 = -3.96E-2 a31 = 1.2378a12 = 3.624E-3 a22 = 1.02E-2 a32 = -1.303E-3a13 = -1.879E-4 a23 = -7.02E-4 a33 = 3.060E-6a34 = 2.550E-8
with µ in cp, T in °C, and p in MPa. The pressure correction A0 given by Kestinet al. contains 13 constants and does not extrapolate well at high temperatures.The pressure correction for A0 given above is a more well-behaved equation,with only small deviations from the original Kestin et al. correlation (at lowtemperatures).
The effect of dissolved gas on water viscosity has not been reported.Intuitively, one might suspect that water viscosity decreases with increasing gassolubility, though Collins suggests that dissolved gas may increase brineviscosity. Systems saturated with CO2 do show an increase in viscosity withincreasing gas solubility.
4.6.9 Solubility of Water in Natural GasThe solubility of pure water in methane is given by McKetta and Wehe41 whogive charts for correcting pure water solubilities for salinity and gas gravity(based mainly on the results of Dodson and Standing). A best-fit equation forthese charts is
cp1.002=20
T+96)iT-(20
a=20
log
ca=A
ca=A
)]cexp(-0.2590)0.01(T-+[0.810=A
logA+A=log
p)A+(1=
ow
i3
4
=1io
w
ow
iswi2
3
=1i2
iswi1
3
=1i1
sw3-
0
o20w
ow
21ow
*w
*w0w
µ
µµ
µµ
µµ
µµ
∑
∑
∑ (4-81)
NORSK Field Development & Technology MANUALHYDRO Reservoir Technology PVT ANALYSIS
Chapter 4 PVT Requirements and Correlations Rev. 0.6Page 38
Curtis H. Whitson (PERA a/s) November 1998
with T in °F, p in psia, and Cs in ppm or mg/L. Eq. (4-82) yields an absoluteaverage deviation of 2.5 percent for o
wy , with a maximum error less than 10
percent for 35<T<240°C and 15<p<700 bara. Mole fraction of water in gas yw
can be converted to a water-gas ratio rsw using the relation
with rsw in Sm3/Sm3. Replacing the constant 7.58⋅10-4 with 135 yields rsw inSTB/MMscf, and replacing with 47,300 yields rsw in lb/MMscf.
The correction term for salinity As proposed by Dodson and Standing isbased on limited results for one low-salinity brine. The salinity correction givenby Katz, et al.49 (given in Eq. (4-82)) is based on the lowering of vapor pressurefor brine solutions at 100°C, where the assumption is made that
where pvw is the brine vapor pressure and ovwp is the pure-water vapor pressure,
both measured at 100°C. Very little data is available to confirm these twosalinity corrections. However, EOS calculations indicate that the Katz et al.correlation is probably valid up to a molality of about 3; at larger molalities theEOS-calculated ratio o
ww y/y is less than predicted by the Katz et al. correlation.
Finally, water that is dissolved in reservoir gas and oil mixtures will notcontain salts (i.e. it is fresh water), a fact that can help in identifying the origin ofproduced water.
4.6.10 Water/Brine-Hydrocarbon Interfacial TensionThe interfacial tension of water-hydrocarbon systems σwh varies from about 72mN/m (72 dynes/cm) for water/brine-gas systems at atmospheric conditions to20-30 mN/m for water/brine-STO systems at atmospheric conditions. Thevariation in σwh is nearly linear with the density difference between water andthe hydrocarbon phase ∆ρwh (i.e., ∆ρwo or ∆ρwg), where σwh=72 mN/m at∆ρwh=∆ρwg=1 g/cm3. This can be expressed in equation form as
C)103.92(-1=A
T)101.83(-T)101.55(
0.55-+1=A
16.44p+ln1.117-460T+
9625p-ln142.3p+0.05227=yln
AAy=y
1.44s
9-s
1.288-41.446-g
4
gg
ow
sgoww
γγ (4-82)
y107.58y-1
y107.58=r w
4-
w
w4-sw ×≈× (4-83)
C)(100p
)CC,(100p
y
yovw
svwow
w
°°
≈ (4-84)
NORSK Field Development & Technology MANUALHYDRO Reservoir Technology PVT ANALYSIS
Chapter 4 PVT Requirements and Correlations Rev. 0.6Page 39
Curtis H. Whitson (PERA a/s) November 1998
where σo is the intercept at ∆ρwh=0.
Ramey50, in an unpublished SPE paper, proposes a correlation for σwh basedon the Macleod parameter σ1/4/∆ρ. This parameter was plotted versus ∆ρ usingdata for brines with stock-tank oil, saturated and undersaturated reservoir oils,and natural gases. Ramey's graphical correlation is represented surprisingly wellwith Eq. (4-85), where σo=15; a near-exact fit of his correlation is given by
Data presented by Ramey which do not lie on his general correlation arerepresented accurately by Eq. (4-85) with σo ranging from 5 to 30.
Firoozabadi and Ramey51 consider the interfacial tension of water andhydrocarbons using data for distilled water and pure hydrocarbons. They arriveat a similar graphical relation to the original Ramey correlation, with the additionof reduced temperature as a correlating parameter. Their correlation does not,unfortunately, predict water/brine-oil IFTs with more accuracy than the originalRamey correlation (or Eq. (4-85)). Water-gas IFTs reported by various authorsshow considerable scatter, and it would seem that any correlation will only giveapproximate IFT values for such systems until consistent data becomesavailable.
Mutual solubility effects of gas dissolved in water and water dissolved in gasmay affect interfacial tensions, perhaps explaining some of the difference inmethane-brine and methane-water IFTs reported in the literature. Otherwise, theseemingly erratic behavior of some water/brine-oil IFT data may be explained byaromatic compounds and asphaltenes. Also, crude oil samples exposed toatmospheric conditions for longer periods of time may experience oxidation thatcan affect IFT measurements.
4.6.11 Equation-of-State PredictionsMutual solubilities and volumetric properties of water-hydrocarbon systems canbe predicted with reasonable accuracy using one of several modifications toexisting cubic equations of state. Other types of equations of state also havebeen applied to these systems, but without a clearly superior predictivecapability. Although cubic EOSs are not widely used for reservoir water-hydrocarbon systems, it is expected that this approach will eventually replace theempirical correlations presently being used.
To improve vapor pressure predictions of water (and solubilities of water inthe non-aqueous phase), Peng and Robinson52 propose a modified correctionterm α (applied to the EOS constant a) for pure water in the temperature range0.44<Tr<0.72 (15<T<200°C). The recommended Søreide-Whitson relation43 forαH2O of pure water (or NaCl brine) to be used with the Peng-Robinson EOS is
ρσσσ whoo
wh )-(72+= ∆ (4-85)
ρσ whwg 36+20= ∆ (4-86)
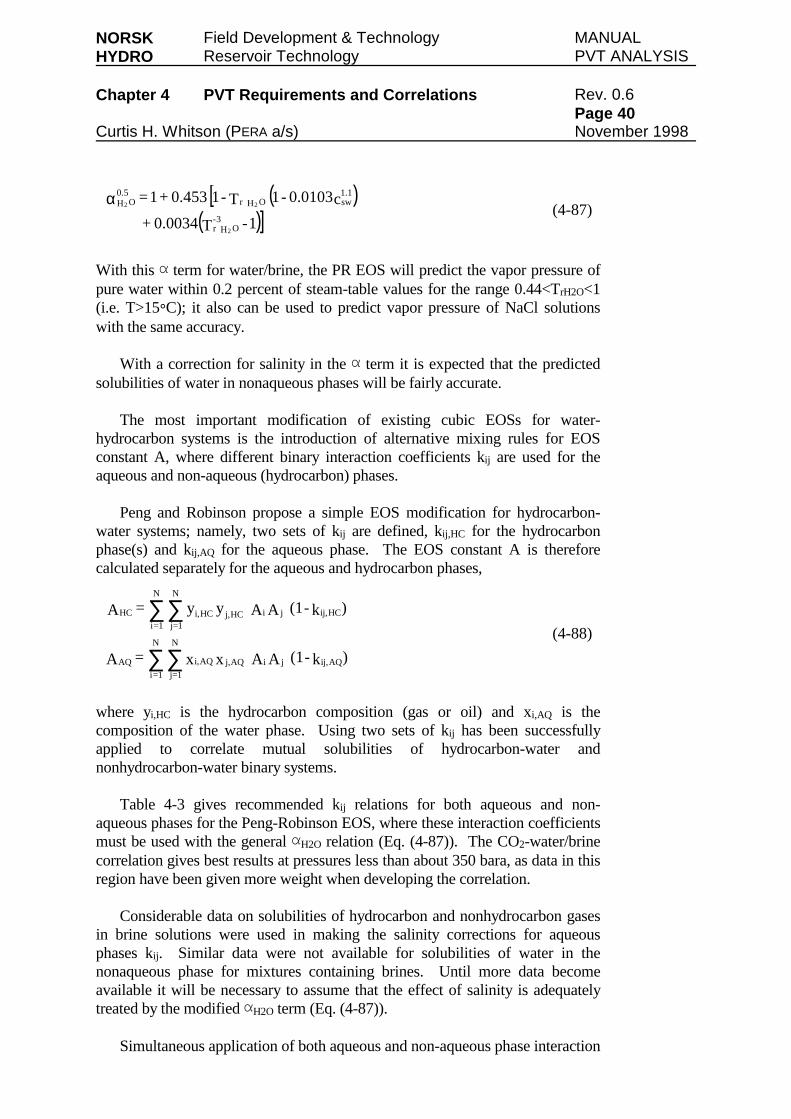
NORSK Field Development & Technology MANUALHYDRO Reservoir Technology PVT ANALYSIS
Chapter 4 PVT Requirements and Correlations Rev. 0.6Page 40
Curtis H. Whitson (PERA a/s) November 1998
With this α term for water/brine, the PR EOS will predict the vapor pressure ofpure water within 0.2 percent of steam-table values for the range 0.44<TrH2O<1(i.e. T>15°C); it also can be used to predict vapor pressure of NaCl solutionswith the same accuracy.
With a correction for salinity in the α term it is expected that the predictedsolubilities of water in nonaqueous phases will be fairly accurate.
The most important modification of existing cubic EOSs for water-hydrocarbon systems is the introduction of alternative mixing rules for EOSconstant A, where different binary interaction coefficients kij are used for theaqueous and non-aqueous (hydrocarbon) phases.
Peng and Robinson propose a simple EOS modification for hydrocarbon-water systems; namely, two sets of kij are defined, kij,HC for the hydrocarbonphase(s) and kij,AQ for the aqueous phase. The EOS constant A is thereforecalculated separately for the aqueous and hydrocarbon phases,
where yi,HC is the hydrocarbon composition (gas or oil) and xi,AQ is thecomposition of the water phase. Using two sets of kij has been successfullyapplied to correlate mutual solubilities of hydrocarbon-water andnonhydrocarbon-water binary systems.
Table 4-3 gives recommended kij relations for both aqueous and non-aqueous phases for the Peng-Robinson EOS, where these interaction coefficientsmust be used with the general αH2O relation (Eq. (4-87)). The CO2-water/brinecorrelation gives best results at pressures less than about 350 bara, as data in thisregion have been given more weight when developing the correlation.
Considerable data on solubilities of hydrocarbon and nonhydrocarbon gasesin brine solutions were used in making the salinity corrections for aqueousphases kij. Similar data were not available for solubilities of water in thenonaqueous phase for mixtures containing brines. Until more data becomeavailable it will be necessary to assume that the effect of salinity is adequatelytreated by the modified αH2O term (Eq. (4-87)).
Simultaneous application of both aqueous and non-aqueous phase interaction
( )[( )]1-T0.0034+
c0.0103-1T-10.453+1=3-
OHr
1.1swOHr
0.5OH
2
22α(4-87)
)k-(1AAxx=A
)k-(1AAyy=A
AQij,jiAQj,AQi,
N
1j=
N
1=iAQ
HCij,jiHCj,HCi,
N
1j=
N
1=iHC
∑∑
∑∑(4-88)
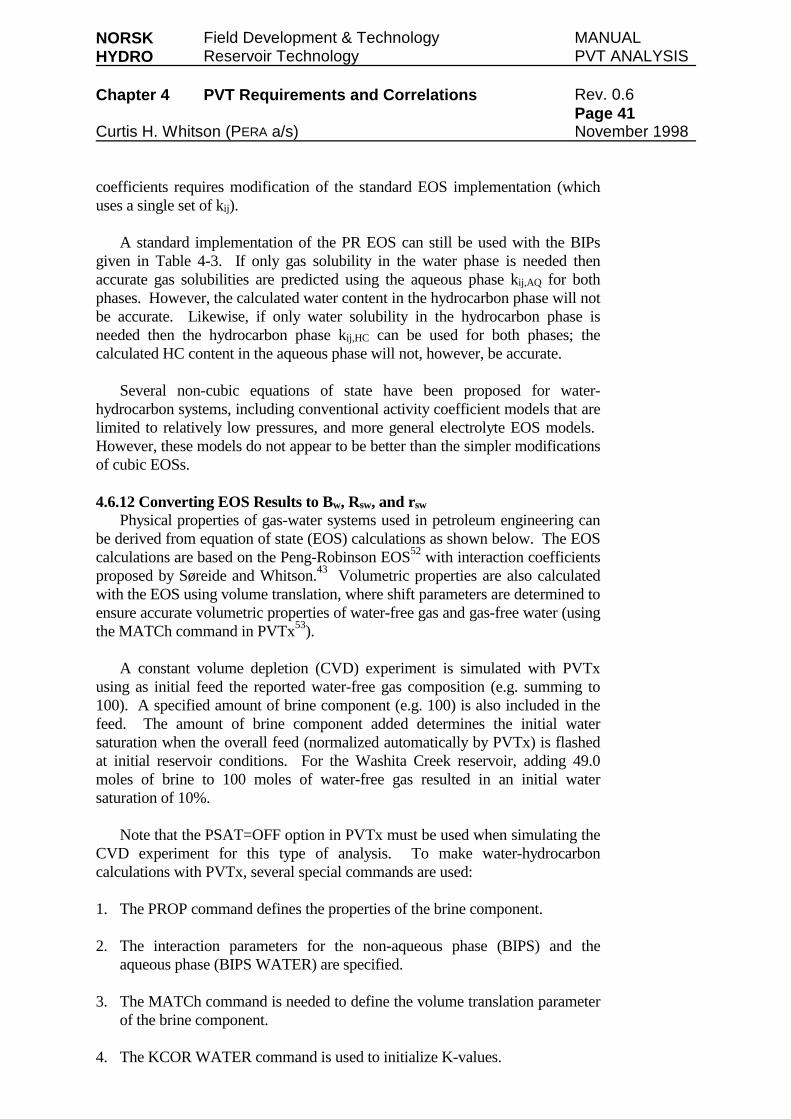
NORSK Field Development & Technology MANUALHYDRO Reservoir Technology PVT ANALYSIS
Chapter 4 PVT Requirements and Correlations Rev. 0.6Page 41
Curtis H. Whitson (PERA a/s) November 1998
coefficients requires modification of the standard EOS implementation (whichuses a single set of kij).
A standard implementation of the PR EOS can still be used with the BIPsgiven in Table 4-3. If only gas solubility in the water phase is needed thenaccurate gas solubilities are predicted using the aqueous phase kij,AQ for bothphases. However, the calculated water content in the hydrocarbon phase will notbe accurate. Likewise, if only water solubility in the hydrocarbon phase isneeded then the hydrocarbon phase kij,HC can be used for both phases; thecalculated HC content in the aqueous phase will not, however, be accurate.
Several non-cubic equations of state have been proposed for water-hydrocarbon systems, including conventional activity coefficient models that arelimited to relatively low pressures, and more general electrolyte EOS models.However, these models do not appear to be better than the simpler modificationsof cubic EOSs.
4.6.12 Converting EOS Results to Bw, Rsw, and rsw
Physical properties of gas-water systems used in petroleum engineering canbe derived from equation of state (EOS) calculations as shown below. The EOScalculations are based on the Peng-Robinson EOS52 with interaction coefficientsproposed by Søreide and Whitson.43 Volumetric properties are also calculatedwith the EOS using volume translation, where shift parameters are determined toensure accurate volumetric properties of water-free gas and gas-free water (usingthe MATCh command in PVTx53).
A constant volume depletion (CVD) experiment is simulated with PVTxusing as initial feed the reported water-free gas composition (e.g. summing to100). A specified amount of brine component (e.g. 100) is also included in thefeed. The amount of brine component added determines the initial watersaturation when the overall feed (normalized automatically by PVTx) is flashedat initial reservoir conditions. For the Washita Creek reservoir, adding 49.0moles of brine to 100 moles of water-free gas resulted in an initial watersaturation of 10%.
Note that the PSAT=OFF option in PVTx must be used when simulating theCVD experiment for this type of analysis. To make water-hydrocarboncalculations with PVTx, several special commands are used:
1. The PROP command defines the properties of the brine component.
2. The interaction parameters for the non-aqueous phase (BIPS) and theaqueous phase (BIPS WATER) are specified.
3. The MATCh command is needed to define the volume translation parameterof the brine component.
4. The KCOR WATER command is used to initialize K-values.
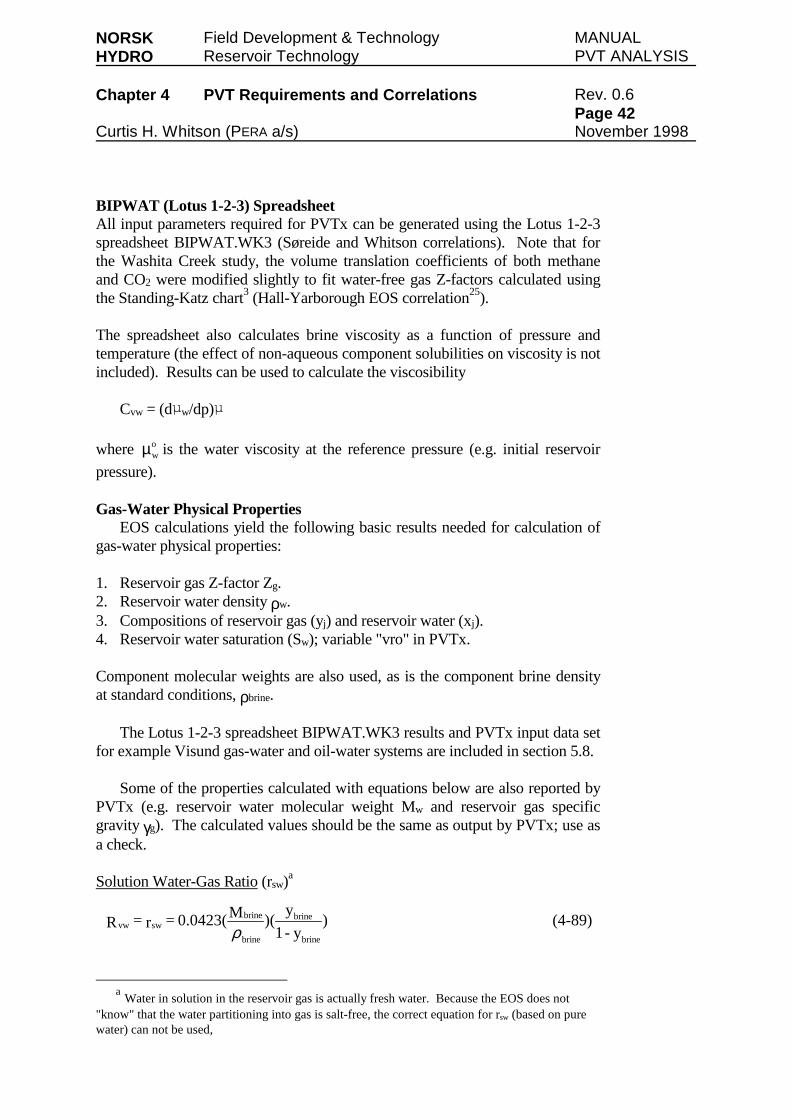
NORSK Field Development & Technology MANUALHYDRO Reservoir Technology PVT ANALYSIS
Chapter 4 PVT Requirements and Correlations Rev. 0.6Page 42
Curtis H. Whitson (PERA a/s) November 1998
BIPWAT (Lotus 1-2-3) SpreadsheetAll input parameters required for PVTx can be generated using the Lotus 1-2-3spreadsheet BIPWAT.WK3 (Søreide and Whitson correlations). Note that forthe Washita Creek study, the volume translation coefficients of both methaneand CO2 were modified slightly to fit water-free gas Z-factors calculated usingthe Standing-Katz chart3 (Hall-Yarborough EOS correlation25).
The spreadsheet also calculates brine viscosity as a function of pressure andtemperature (the effect of non-aqueous component solubilities on viscosity is notincluded). Results can be used to calculate the viscosibility
Cvw = (dµw/dp)µ
where owµ is the water viscosity at the reference pressure (e.g. initial reservoir
pressure).
Gas-Water Physical PropertiesEOS calculations yield the following basic results needed for calculation of
gas-water physical properties:
1. Reservoir gas Z-factor Zg.2. Reservoir water density ρw.3. Compositions of reservoir gas (yj) and reservoir water (xj).4. Reservoir water saturation (Sw); variable "vro" in PVTx.
Component molecular weights are also used, as is the component brine densityat standard conditions, ρbrine.
The Lotus 1-2-3 spreadsheet BIPWAT.WK3 results and PVTx input data setfor example Visund gas-water and oil-water systems are included in section 5.8.
Some of the properties calculated with equations below are also reported byPVTx (e.g. reservoir water molecular weight Mw and reservoir gas specificgravity γg). The calculated values should be the same as output by PVTx; use asa check.
Solution Water-Gas Ratio (rsw)a
aWater in solution in the reservoir gas is actually fresh water. Because the EOS does not
"know" that the water partitioning into gas is salt-free, the correct equation for rsw (based on purewater) can not be used,
)y-1
y)(M0.0423(=r=R
brine
brine
brine
brineswvw ρ
(4-89)
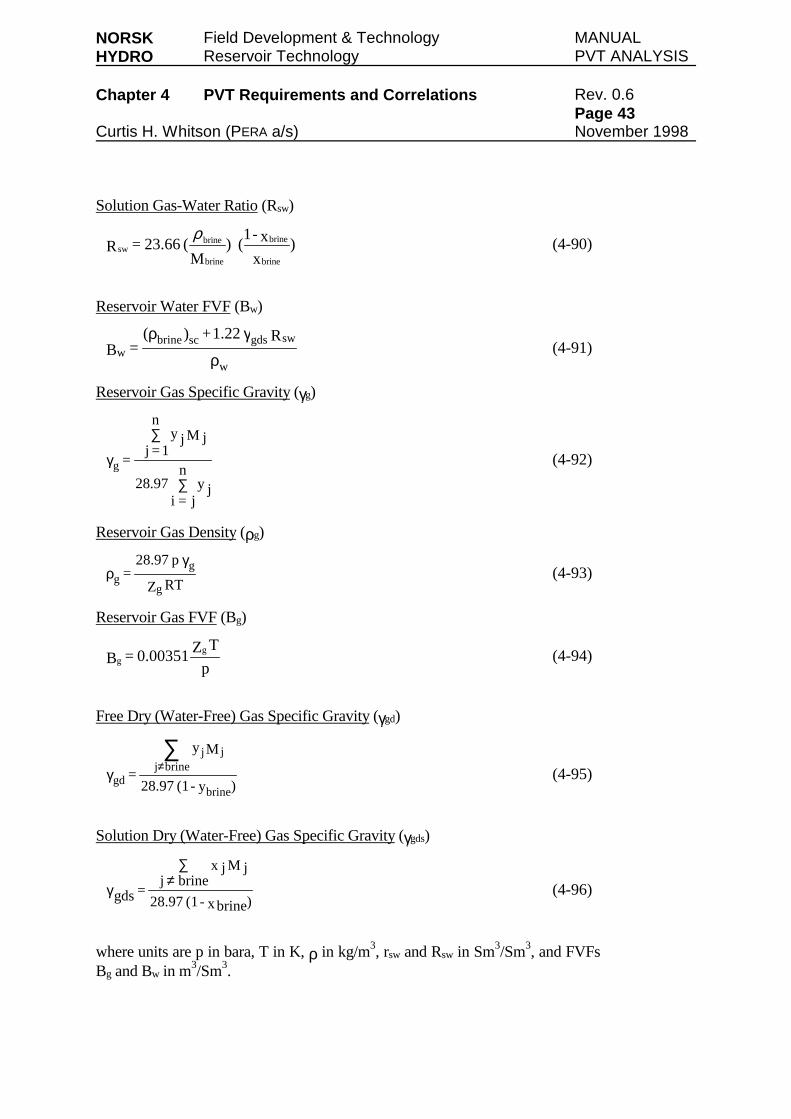
NORSK Field Development & Technology MANUALHYDRO Reservoir Technology PVT ANALYSIS
Chapter 4 PVT Requirements and Correlations Rev. 0.6Page 43
Curtis H. Whitson (PERA a/s) November 1998
Solution Gas-Water Ratio (Rsw)
Reservoir Water FVF (Bw)
Reservoir Gas Specific Gravity (γg)
Reservoir Gas Density (ρg)
Reservoir Gas FVF (Bg)
Free Dry (Water-Free) Gas Specific Gravity (γgd)
Solution Dry (Water-Free) Gas Specific Gravity (γgds)
where units are p in bara, T in K, ρ in kg/m3, rsw and Rsw in Sm3/Sm3, and FVFsBg and Bw in m3/Sm3.
)x
x-1()
M(23.66=R
brine
brine
brine
brinesw
ρ(4-90)
ρ
γρ
w
swgdsscbrinew
R1.22+)(=B (4-91)
y jn
j=i97.28
M jy jn
1=j=g
∑
∑
γ (4-92)
RTZ
p28.97=
g
gg
γρ (4-93)
p
TZ0.00351=Bg
g (4-94)
)y-(128.97
My
=brine
jjbrinej
gd
∑≠γ (4-95)
)xbrine-(128.97
M jx jbrinej
=gds
∑≠
γ (4-96)
NORSK Field Development & Technology MANUALHYDRO Reservoir Technology PVT ANALYSIS
Chapter 4 PVT Requirements and Correlations Rev. 0.6Page 44
Curtis H. Whitson (PERA a/s) November 1998
4.7 References
1. "Handbok for Reservoar Simulering," Norsk Hydro.
2. "ECL100 User's Manual," Intera (1993).
3. Standing, M.B.: Volumetric and Phase Behavior of Oil Field HydrocarbonSystems, 8th printing, Society of Petroleum Engineers, Dallas (1977).
4. Glasø, Ø.: "Generalized Pressure-Volume-Temperature Correlations," JPT(Nov. 1980) 785-795.
5. Lasater, J.A.: "Bubble Point Pressure Correlation," Trans., AIME (1958)213, 379.
6. Vazquez, M. and Beggs, H.D.: "Correlations for Fluid Physical PropertyPrediction," JPT (June 1980) 32, 968-970.
7. McCain, W.D., Jr.: "Reservoir Fluid Property Correlations - State of theArt," SPERE (May 1991) 6, No. 2, 266-272.
8. Standing, M.B. and Katz, D.L.: "Density of Crude Oils Saturated withNatural Gas," Trans., AIME (1942) 146, 159-165.
9. Standing, M.B.: Oil-System Correlations, P.P. Handbook (ed.),McGraw-Hill Book Co. (1962).
10. Standing, M.B.: Petroleum Engineering Data Book, Norwegian Institute ofTechnology, Department of Petroleum Engineering and Applied Geophysics,Trondheim (1974).
11. Madrazo, A.: "Liquid-Density Correlation of Hydrocarbon Systems," Trans.,AIME (1960) 219, 386-389.
12. Vogel, J.L. and Yarborough, L.: "The Effect of Nitrogen on the PhaseBehavior and Physical Properties of Reservoir Fluids," paper SPE 8815presented at the 1980 SPE Annual Technical Conference and Exhibition,Tulsa, April 20-23.
13. Katz, D.L.: "Prediction of the Shrinkage of Crude Oils," Drilling andProduction Practice, API (1942) 137-147.
14. Alani, G.H. and Kennedy, H.T.: "Volumes of Liquid Hydrocarbons at HighTemperatures and Pressures," Trans., AIME (1960) 219, ?-?
15. Lohrenz, J., Bray, B.G., and Clark, C.R.: "Calculating Viscosities of
NORSK Field Development & Technology MANUALHYDRO Reservoir Technology PVT ANALYSIS
Chapter 4 PVT Requirements and Correlations Rev. 0.6Page 45
Curtis H. Whitson (PERA a/s) November 1998
Reservoir Fluids from Their Compositions," JPT (Oct. 1964) 1171-1176;Trans., AIME, 231.
16. Rackett, H.G.: "Equation of State for Saturated Liquids," J. Chem. Eng. Data(1970) 15, No. 4, 514-517.
17. Hankinson, R.W. and Thomson, G.H.: "A New Correlation for SaturatedDensities of Liquids and Their Mixtures," AIChE J. (1979) 25, No. 4,653-663.
18. Hankinson, R.W., et al.: "Volume Correction Factors for Lubricating Oils,"Oil & Gas J. (Sept. 28, 1981) 297-308.
19. Chew, J.N. and Connally, C.A.: "A Viscosity Correlation for Gas-SaturatedCrude Oils," Trans., AIME (1959) 216, 23-25.
20. Bergman, D.F.: "Oil Viscosity Correlations," Personal Communication(1992).
21. Aziz, K., Govier, G.W., and Fogarasi, M.: "Pressure Drop in WellsProducing Oil and Gas," J. Can. Pet. Tech. (July-Sept. 1972) 38-48.
22. Beggs, H.D. and Robinson, J.R.: "Estimating the Viscosity of Crude OilSystems," JPT (Sept. 1975) 27, No. 9, 1140-1141.
23. Whitson, C.H. and Brule, M.R.: Phase Behavior, Monograph, SPE ofAIME, Dallas (1994) (in print).
24. Standing, M.B. and Katz, D.L.: "Density of Natural Gases," Trans., AIME(1942) 146, 140-149.
25. Hall, K.R. and Yarborough, L.: "A New Equation of State for Z-factorCalculations," Oil & Gas J. (June 18, 1973) 82-90.
26. Takacs, G.: "Comparisons Made for Computer Z-factor Calculations," Oil &Gas J. (Dec. 20, 1976) 64-66.
27. Dranchuk, P.M. and Abou-Kassem, J.H.: "Calculation of Z-Factors forNatural Gases Using Equations of State," J. Can. Pet. Tech. (July-Sept.1975) 14, No. 3, 34-36.
28. Brill, J.P. and Beggs, H.D.: "Two-Phase Flow in Pipes," U. Tulsa (1974)INTERCOMP Course, The Hague.
29. Sutton, R.P.: "Compressibility Factors for High-Molecular Weight ReservoirGases," paper SPE 14265 presented at the 1985 SPE Technical Conferenceand Exhibition, Las Vegas, Sept. 22-25.
30. Kay, W.B.: "Density of Hydrocarbon Gases and Vapors at High Temperature
NORSK Field Development & Technology MANUALHYDRO Reservoir Technology PVT ANALYSIS
Chapter 4 PVT Requirements and Correlations Rev. 0.6Page 46
Curtis H. Whitson (PERA a/s) November 1998
and Pressure," Ind. Eng. Chem. (1936) No. 28, 1014-1019.
31. Matthews, T.A., Roland, C.H., and Katz, D.L.: "High Pressure GasMeasurement," Proc., NGAA, 41 (1942).
32. Wichert, E. and Aziz, K.: "Calculate Z's for Sour Gases," Hydro. Proc. (May1972) 51, 119-122.
33. Whitson, C.H.: Petroleum Engineering Fluid Properties Data Book,Trondheim, Norway (1994).
34. Cragoe, C.S.: "Thermodynamic Properties of Petroleum Products," U.S.Dept. Commerce (1929) 97.
35. Amyx, J.W., Bass, D.M., Jr., and Whiting, R.L.: Petroleum ReservoirEngineering, McGraw-Hill Book Co., New York (1960).
36. Lee, A.L., Gonzalez, M.H., and Eakin, B.E.: "The Viscosity of NaturalGases," JPT (Aug. 1966) 997-1000; Trans., AIME, 237.
37. Lucas, K.: Chem. Ing. Tech. (1981) 53, 959.
38. Carr, N.L., Kobayashi, R., and Burrows, D.B.: "Viscosity of HydrocarbonGases Under Pressure," Trans., AIME (1954) 201, 264-272.
39. Rowe, A.M. and Chou, J.C.S.: "Pressure-Volume-Temperature-CorrelationRelation of Aqueous NaCl Solutions," J. Chem. Eng. Data (1970) 15, 61-66.
40. Dodson, C.R. and Standing, M.B.: "Pressure, Volume, Temperature andSolubility Relations for Natural Gas-Water Mixtures," Drill. and Prod.Prac., API (1944) 173-179.
41. McKetta, J.J. and Wehe, A.H.: "Hydrocarbon-Water and Formation WaterCorrelations," Petroleum Production Handbook, T.C. Frick and R.W. Taylor(ed.), SPE, Dallas (1962) Volume II, 22-13.
42. Pawlikowski, E.M. and Prausnitz, J.M.: "Estimation of Setchenow Constantsfor Nonpolar Gases in Common Salts at Moderate Temperatures," Ind. Eng.Chem. Fund. (1983).
43. Soreide, I. and Whitson, C.H.: "Peng-Robinson Predictions forHydrocarbons, CO2, N2 and H2S With Pure Water and NaCl-Brines," FluidPhase Equilibria (1992) 77, 217-240.
44. Cramer, S.D.: "Solubility of Methane in Brines From 0 to 300oC," Ind. Eng.Chem. Proc. Des. Dev. (1984) 23, No. 3, 533-538.
NORSK Field Development & Technology MANUALHYDRO Reservoir Technology PVT ANALYSIS
Chapter 4 PVT Requirements and Correlations Rev. 0.6Page 47
Curtis H. Whitson (PERA a/s) November 1998
45. Clever, H.L. and Holland, C.J.: "Solubility of Argon Gas in Aqueous AlkaliHalide Solutions," J. Chem. Eng. Data (July 1968) 13, No. 3, 411-414.
46. Long, G. and Chierici, G.: "Salt Content Changes Compressibility ofReservoir Brines," Pet. Eng. (July 1961) B-25 - B-31.
47. Rogers, P.S.Z. and Pitzer, K.S.: "Volumetric Properties of Aqueous SodiumChloride Solutions," J. Phys. Chem. Ref. Data (1982) 11, 1, 15-81.
48. Kestin, J., Khalifa, H.E., and Correia, R.J.: "Tables of the Dynamic andKinematic Viscosity of Aqueous NaCl Solutions in the Temperature Range20-150oC and the Pressure Range 0.1-35 MPa," J. Phys. Chem. Ref. Data(1981) 10, No. 1, 71-87.
49. Katz, D.L., et al.: Handbook of Natural Gas Engineering, McGraw HillBook Co., Inc., New York (1959).
50. Ramey, H.J., Jr.: "Correlations of Surface and Interfacial Tensions ofReservoir Fluids," paper SPE 4429 unsolicitated.
51. Firoozabadi, A. and Ramey, H.J., Jr.: "Surface Tension ofWater-Hydrocarbon Systems at Reservoir Conditions," paper 873830presented at the 1987 SPE Annual Technical Conference and Exhibition,Calgary, June 7-10 (1987).
52. Peng, D.Y. and Robinson, D.B.: "A New-Constant Equation of State," Ind.Eng. Chem. Fund. (1976) 15, No. 1, 59-64.
53. Whitson, C.H.: "An Equation-of-State Based Program for Simulating &Matching PVT Experiments with Multiparameter Nonlinear Regression,"Pera a/s, Trondheim, Norway (1994) Version 94-02,.
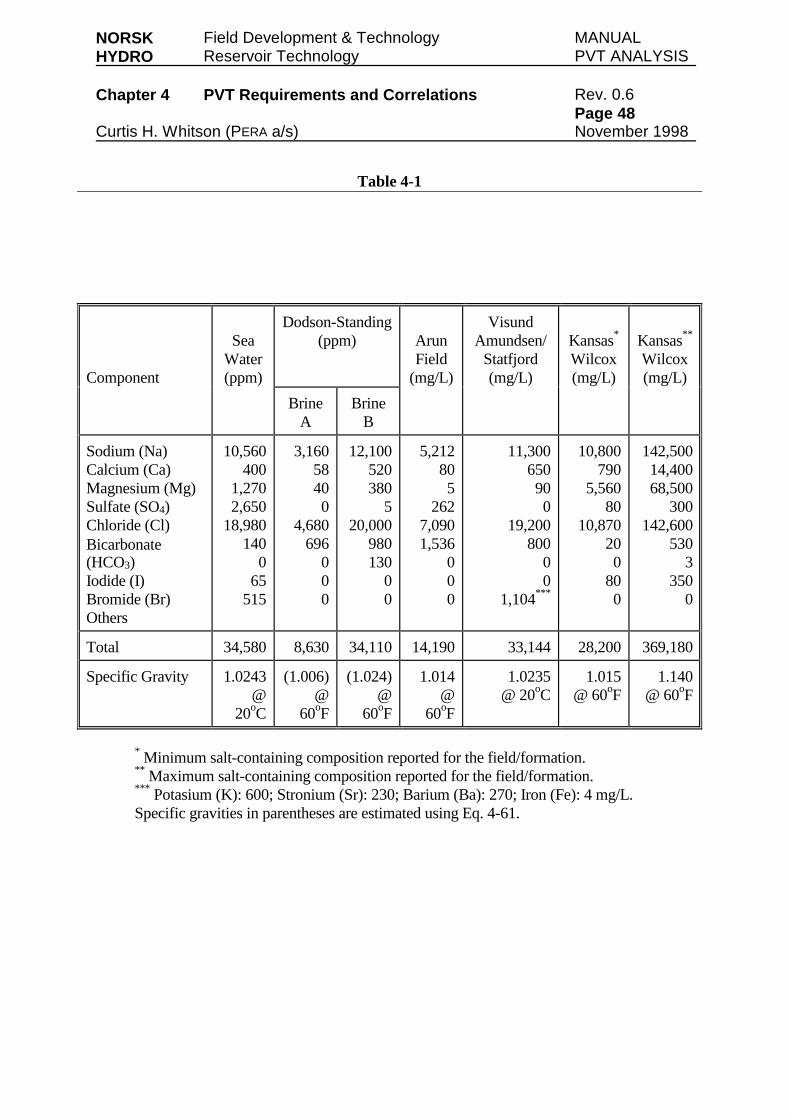
NORSK Field Development & Technology MANUALHYDRO Reservoir Technology PVT ANALYSIS
Chapter 4 PVT Requirements and Correlations Rev. 0.6Page 48
Curtis H. Whitson (PERA a/s) November 1998
Table 4-1
Component
SeaWater(ppm)
Dodson-Standing(ppm) Arun
Field(mg/L)
VisundAmundsen/
Statfjord(mg/L)
Kansas*
Wilcox(mg/L)
Kansas**
Wilcox(mg/L)
BrineA
BrineB
Sodium (Na)Calcium (Ca)Magnesium (Mg)Sulfate (SO4)Chloride (Cl)Bicarbonate(HCO3)Iodide (I)Bromide (Br)Others
10,560400
1,2702,650
18,980140
065
515
3,16058400
4,680696
000
12,100520380
520,000
980130
00
5,212805
2627,0901,536
000
11,300650900
19,200800
00
1,104***
10,800790
5,56080
10,870200
800
142,50014,40068,500
300142,600
5303
3500
Total 34,580 8,630 34,110 14,190 33,144 28,200 369,180
Specific Gravity 1.0243@
20oC
(1.006)@
60oF
(1.024)@
60oF
1.014@
60oF
1.0235@ 20oC
1.015@ 60oF
1.140@ 60oF
* Minimum salt-containing composition reported for the field/formation.** Maximum salt-containing composition reported for the field/formation.*** Potasium (K): 600; Stronium (Sr): 230; Barium (Ba): 270; Iron (Fe): 4 mg/L.Specific gravities in parentheses are estimated using Eq. 4-61.
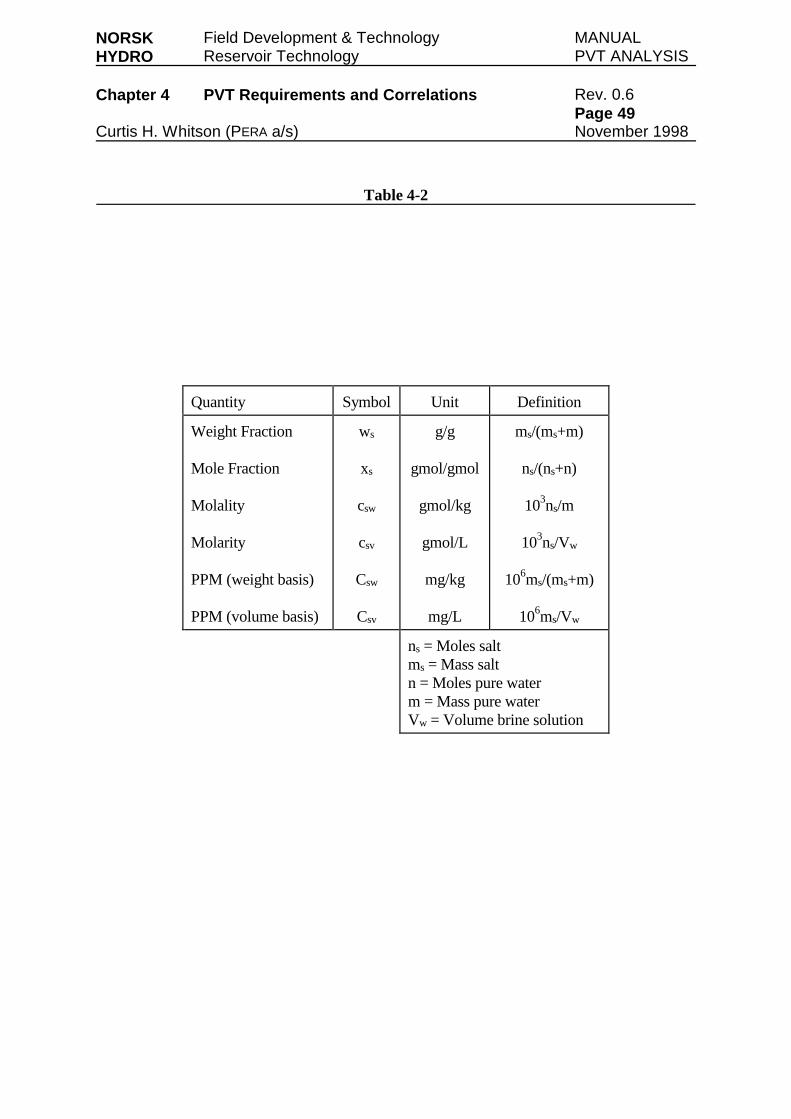
NORSK Field Development & Technology MANUALHYDRO Reservoir Technology PVT ANALYSIS
Chapter 4 PVT Requirements and Correlations Rev. 0.6Page 49
Curtis H. Whitson (PERA a/s) November 1998
Table 4-2
Quantity Symbol Unit Definition
Weight Fraction
Mole Fraction
Molality
Molarity
PPM (weight basis)
PPM (volume basis)
ws
xs
csw
csv
Csw
Csv
g/g
gmol/gmol
gmol/kg
gmol/L
mg/kg
mg/L
ms/(ms+m)
ns/(ns+n)
103ns/m
103ns/Vw
106ms/(ms+m)
106ms/Vw
ns = Moles saltms = Mass saltn = Moles pure waterm = Mass pure waterVw = Volume brine solution
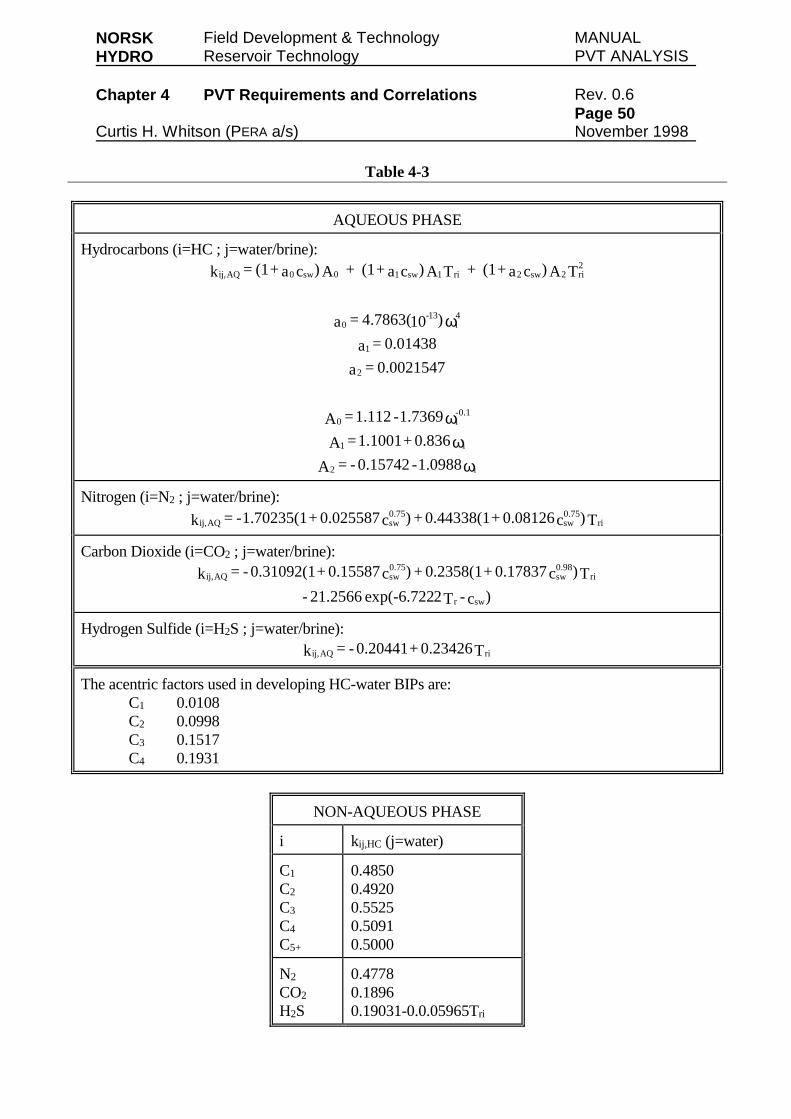
NORSK Field Development & Technology MANUALHYDRO Reservoir Technology PVT ANALYSIS
Chapter 4 PVT Requirements and Correlations Rev. 0.6Page 50
Curtis H. Whitson (PERA a/s) November 1998
Table 4-3
AQUEOUS PHASE
Hydrocarbons (i=HC ; j=water/brine):
ωω
ω
ω
i2
i1
0.1-i0
2
1
4i
13-0
2ri2sw2ri1sw10sw0AQij,
1.0988-0.15742-=A
0.836+1.1001=A
1.7369-1.112=A
0.0021547=a
0.01438=a
)104.7863(=a
TA)ca+(1+TA)ca+(1+A)ca+(1=k
Nitrogen (i=N2 ; j=water/brine):
T)c0.08126+0.44338(1+)c0.025587+1.70235(1-=k ri0.75sw
0.75swAQij,
Carbon Dioxide (i=CO2 ; j=water/brine):
)c-T2exp(-6.72221.2566-
T)c0.17837+0.2358(1+)c0.15587+0.31092(1-=k
swr
ri0.98sw
0.75swAQij,
Hydrogen Sulfide (i=H2S ; j=water/brine):T0.23426+0.20441-=k riAQij,
The acentric factors used in developing HC-water BIPs are:C1 0.0108C2 0.0998C3 0.1517C4 0.1931
NON-AQUEOUS PHASE
i kij,HC (j=water)
C1
C2
C3
C4
C5+
0.48500.49200.55250.50910.5000
N2
CO2
H2S
0.47780.18960.19031-0.0.05965Tri

NORSK Field Development & Technology MANUALHYDRO Reservoir Technology PVT ANALYSIS
Chapter 4 PVT Requirements and Correlations Rev. 0.6Page 51
Curtis H. Whitson (PERA a/s) November 1998
Table 4-4
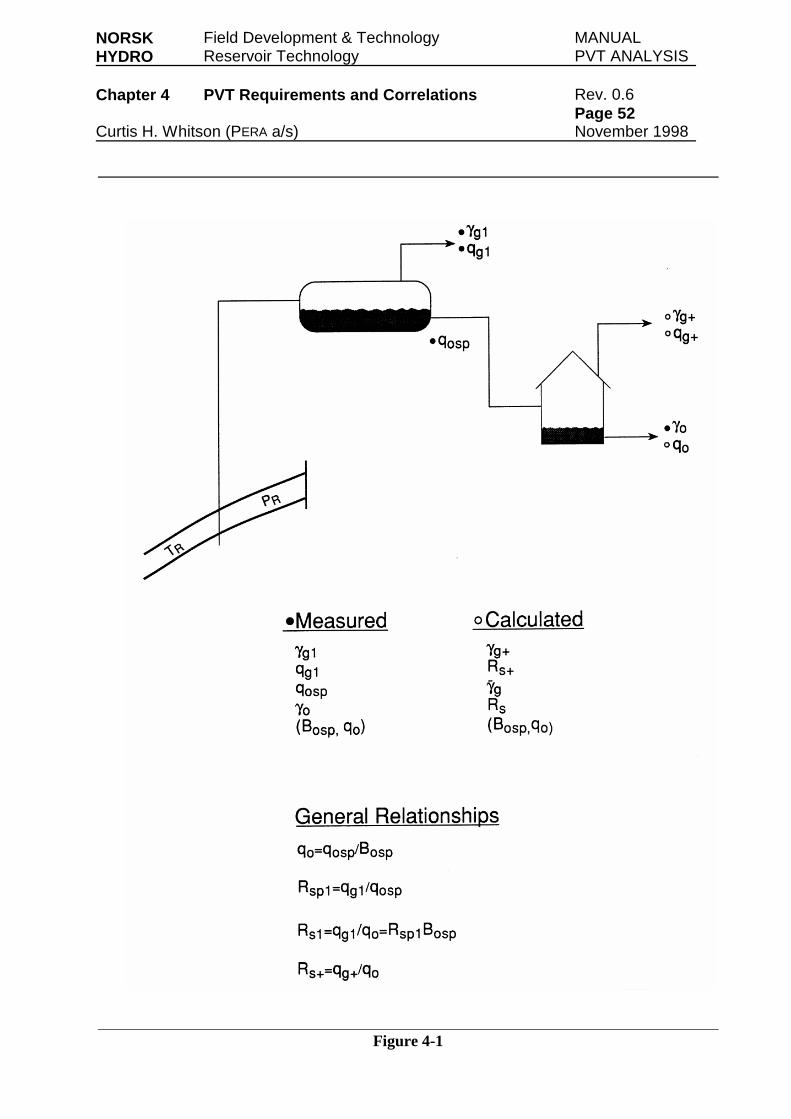
NORSK Field Development & Technology MANUALHYDRO Reservoir Technology PVT ANALYSIS
Chapter 4 PVT Requirements and Correlations Rev. 0.6Page 52
Curtis H. Whitson (PERA a/s) November 1998
Figure 4-1
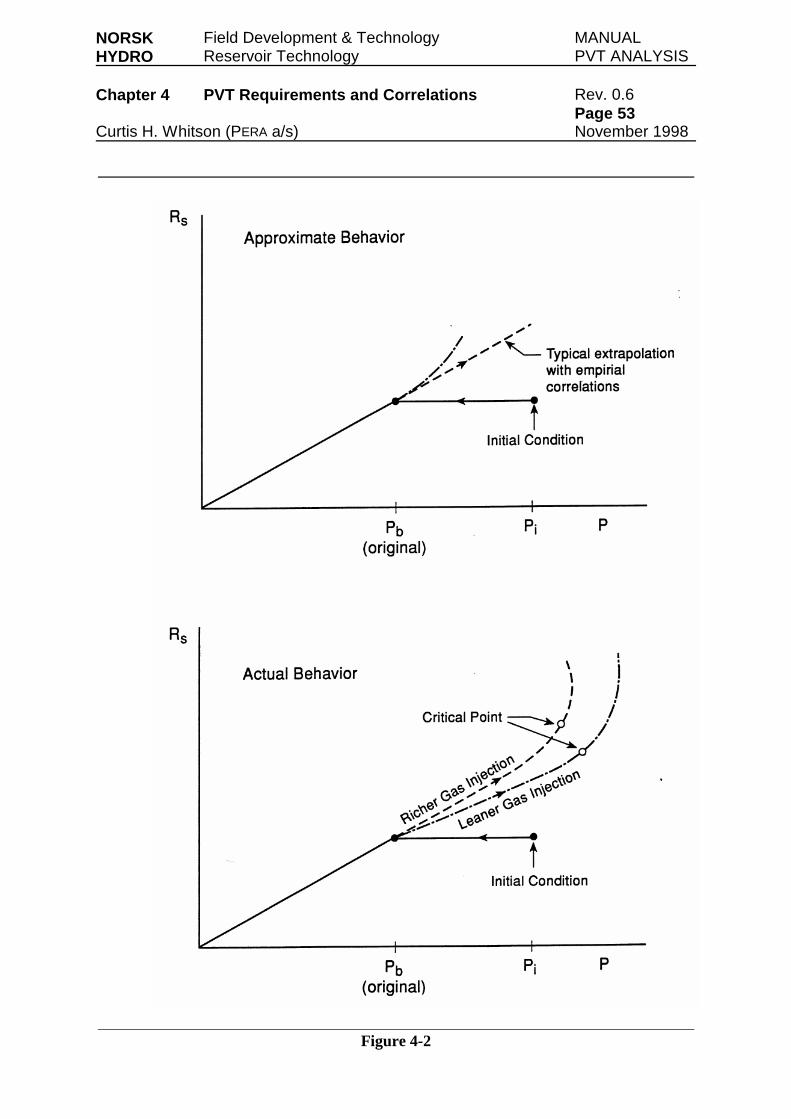
NORSK Field Development & Technology MANUALHYDRO Reservoir Technology PVT ANALYSIS
Chapter 4 PVT Requirements and Correlations Rev. 0.6Page 53
Curtis H. Whitson (PERA a/s) November 1998
Figure 4-2
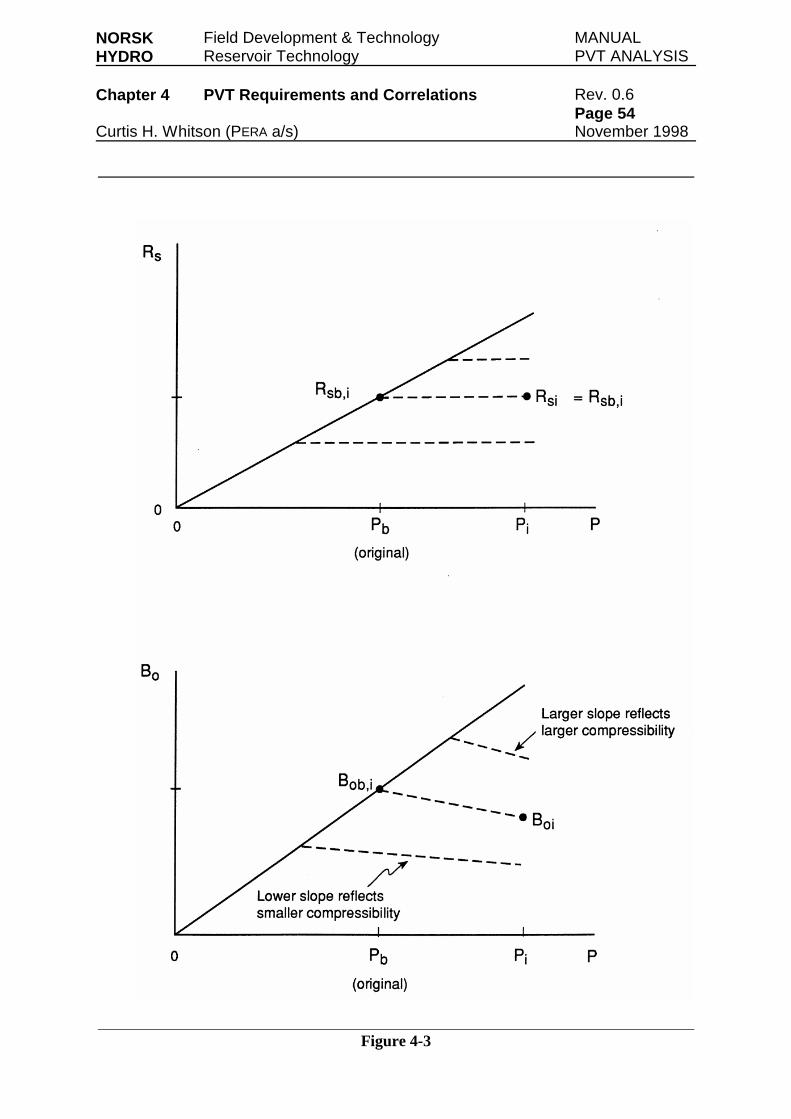
NORSK Field Development & Technology MANUALHYDRO Reservoir Technology PVT ANALYSIS
Chapter 4 PVT Requirements and Correlations Rev. 0.6Page 54
Curtis H. Whitson (PERA a/s) November 1998
Figure 4-3
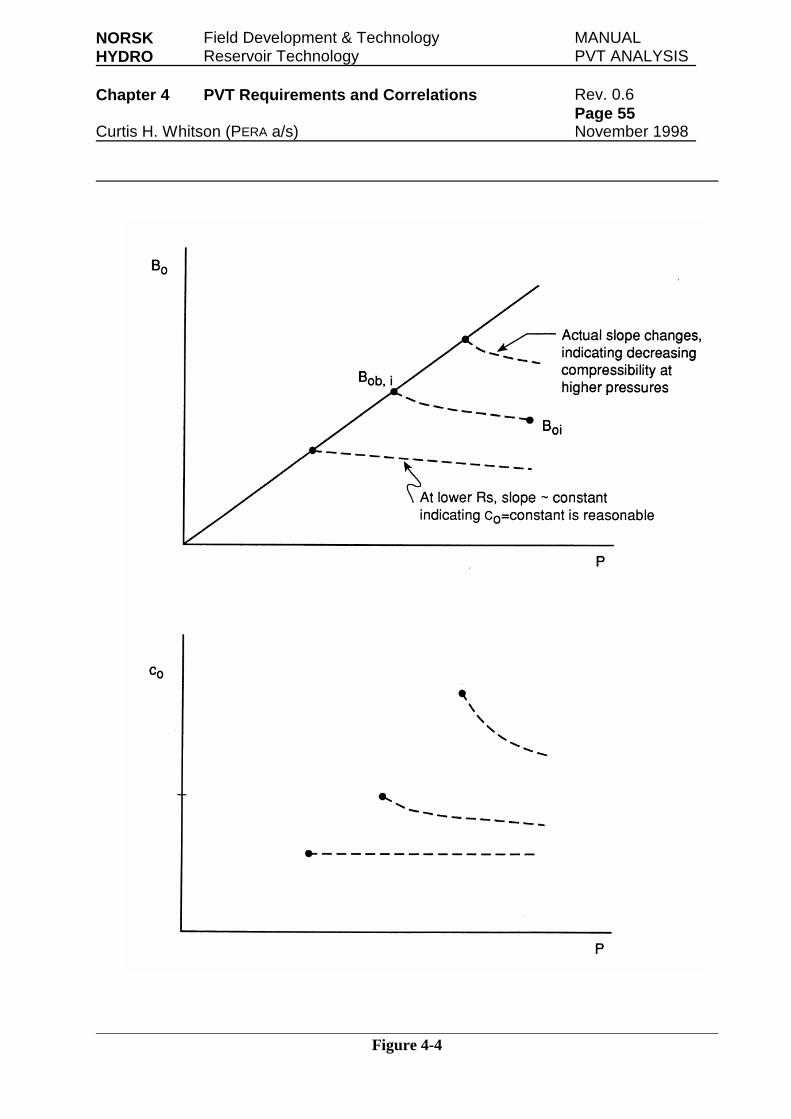
NORSK Field Development & Technology MANUALHYDRO Reservoir Technology PVT ANALYSIS
Chapter 4 PVT Requirements and Correlations Rev. 0.6Page 55
Curtis H. Whitson (PERA a/s) November 1998
Figure 4-4
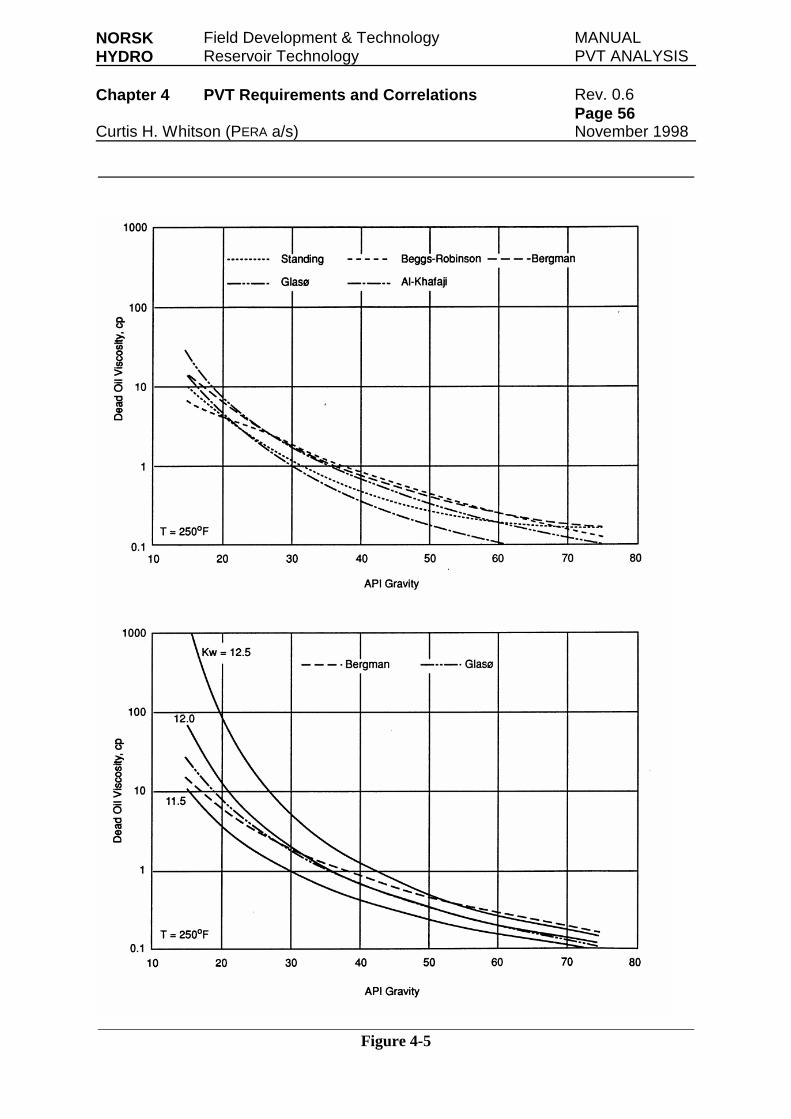
NORSK Field Development & Technology MANUALHYDRO Reservoir Technology PVT ANALYSIS
Chapter 4 PVT Requirements and Correlations Rev. 0.6Page 56
Curtis H. Whitson (PERA a/s) November 1998
Figure 4-5
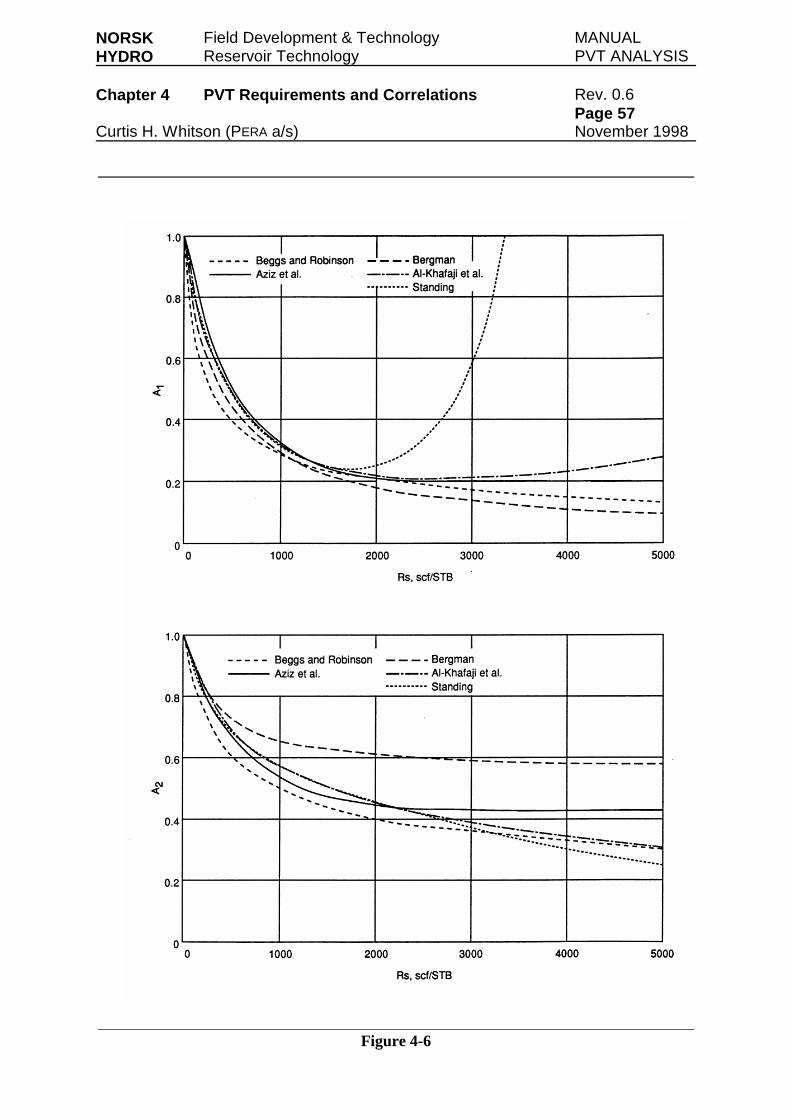
NORSK Field Development & Technology MANUALHYDRO Reservoir Technology PVT ANALYSIS
Chapter 4 PVT Requirements and Correlations Rev. 0.6Page 57
Curtis H. Whitson (PERA a/s) November 1998
Figure 4-6
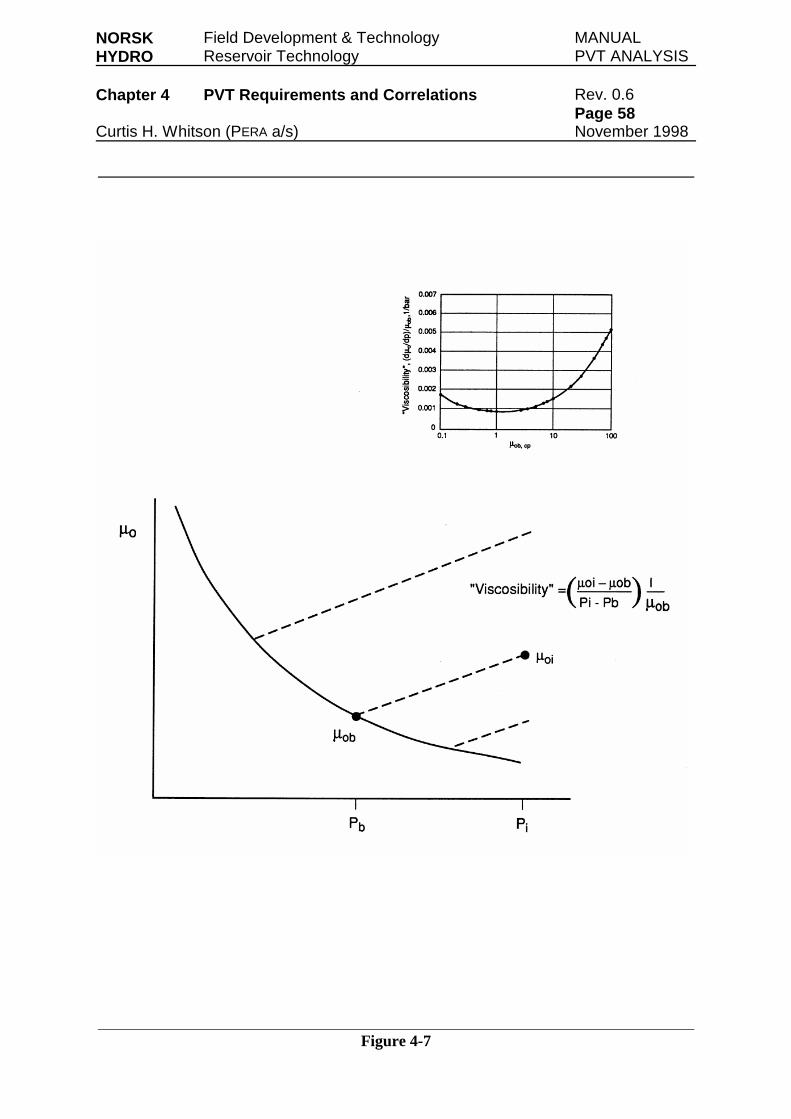
NORSK Field Development & Technology MANUALHYDRO Reservoir Technology PVT ANALYSIS
Chapter 4 PVT Requirements and Correlations Rev. 0.6Page 58
Curtis H. Whitson (PERA a/s) November 1998
Figure 4-7
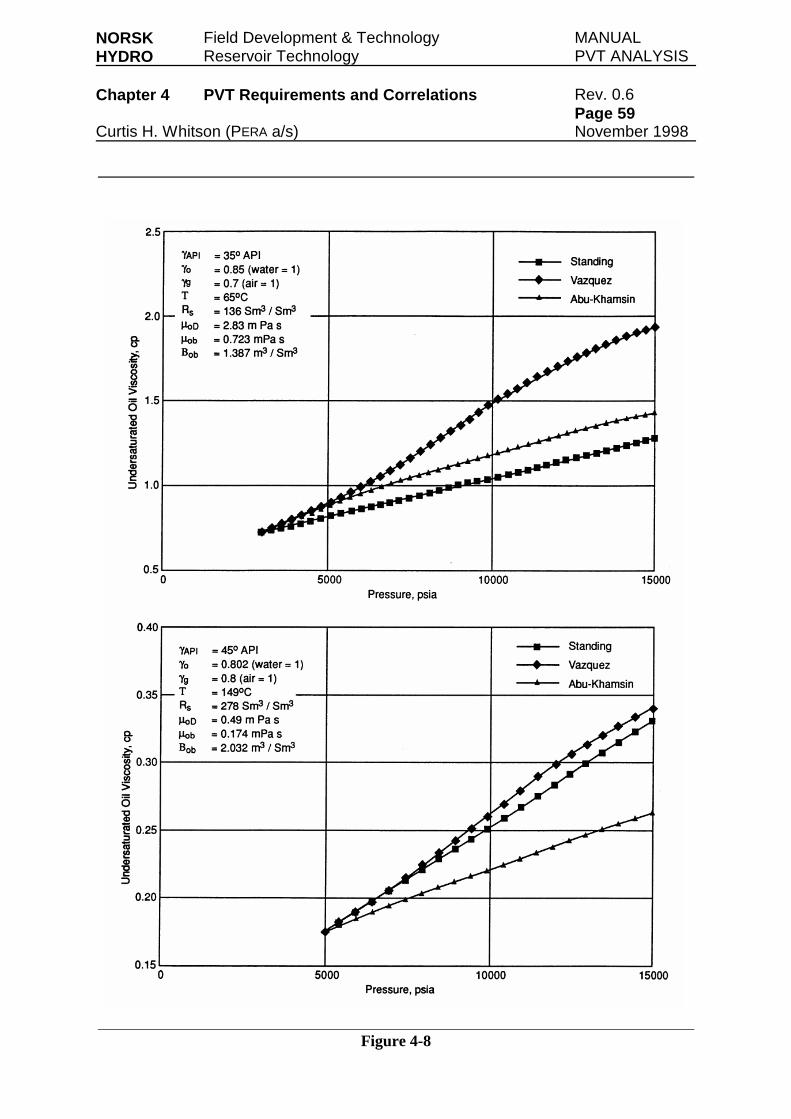
NORSK Field Development & Technology MANUALHYDRO Reservoir Technology PVT ANALYSIS
Chapter 4 PVT Requirements and Correlations Rev. 0.6Page 59
Curtis H. Whitson (PERA a/s) November 1998
Figure 4-8
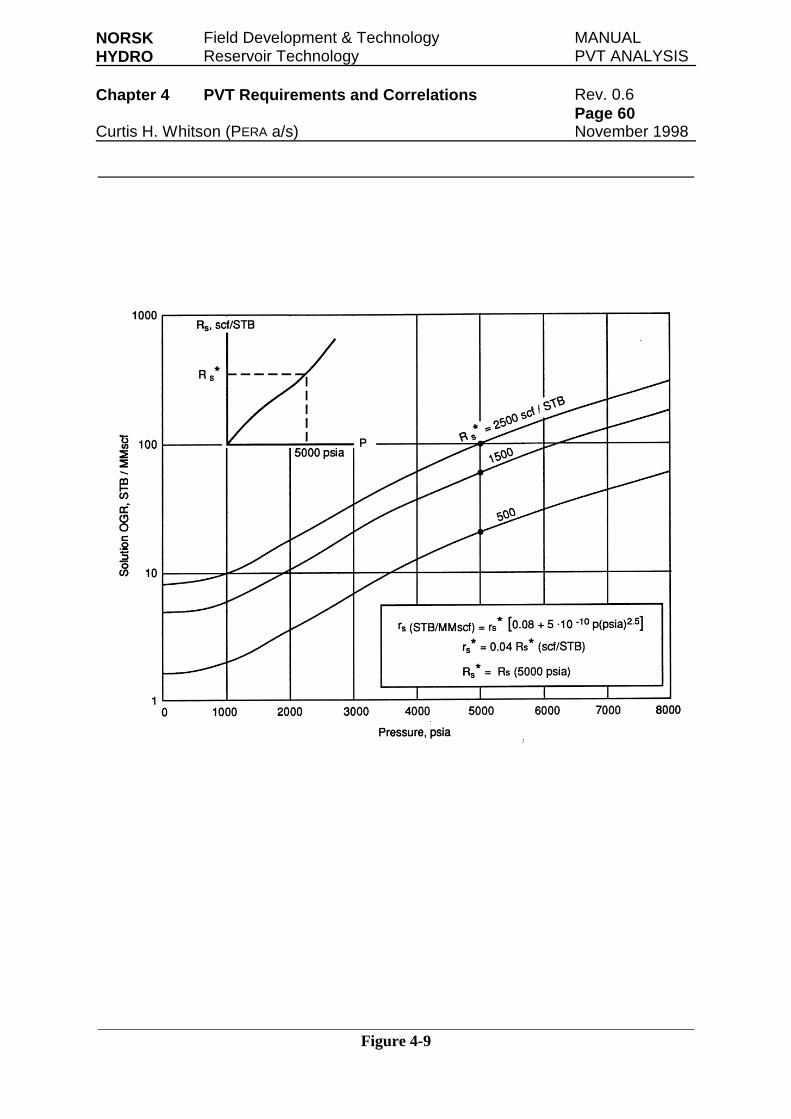
NORSK Field Development & Technology MANUALHYDRO Reservoir Technology PVT ANALYSIS
Chapter 4 PVT Requirements and Correlations Rev. 0.6Page 60
Curtis H. Whitson (PERA a/s) November 1998
Figure 4-9
Related Documents