NORMAL MRI BRAIN DR. PIYUSH OJHA DM RESIDENT DEPARTMENT OF NEUROLOGY GOVT MEDICAL COLLEGE, KOTA

Welcome message from author
This document is posted to help you gain knowledge. Please leave a comment to let me know what you think about it! Share it to your friends and learn new things together.
Transcript

NORMAL MRI BRAIN
DR. PIYUSH OJHADM RESIDENT
DEPARTMENT OF NEUROLOGYGOVT MEDICAL COLLEGE, KOTA
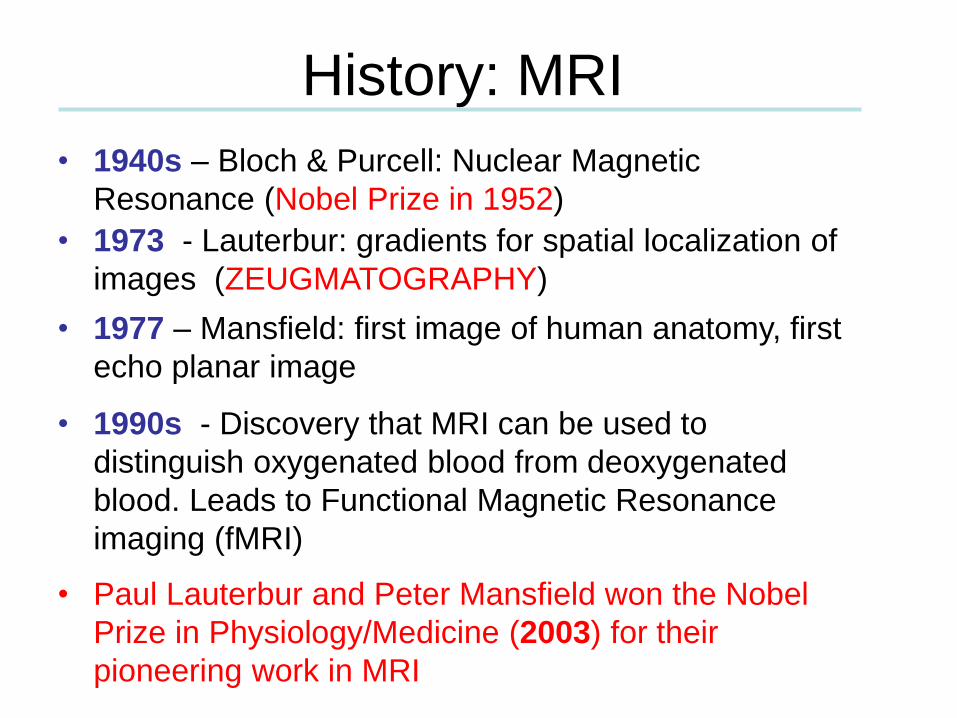
History: MRI
• Paul Lauterbur and Peter Mansfield won the Nobel
Prize in Physiology/Medicine (2003) for their
pioneering work in MRI
• 1940s – Bloch & Purcell: Nuclear Magnetic
Resonance (Nobel Prize in 1952)
• 1990s - Discovery that MRI can be used to
distinguish oxygenated blood from deoxygenated
blood. Leads to Functional Magnetic Resonance
imaging (fMRI)
• 1973 - Lauterbur: gradients for spatial localization of
images (ZEUGMATOGRAPHY)
• 1977 – Mansfield: first image of human anatomy, first
echo planar image
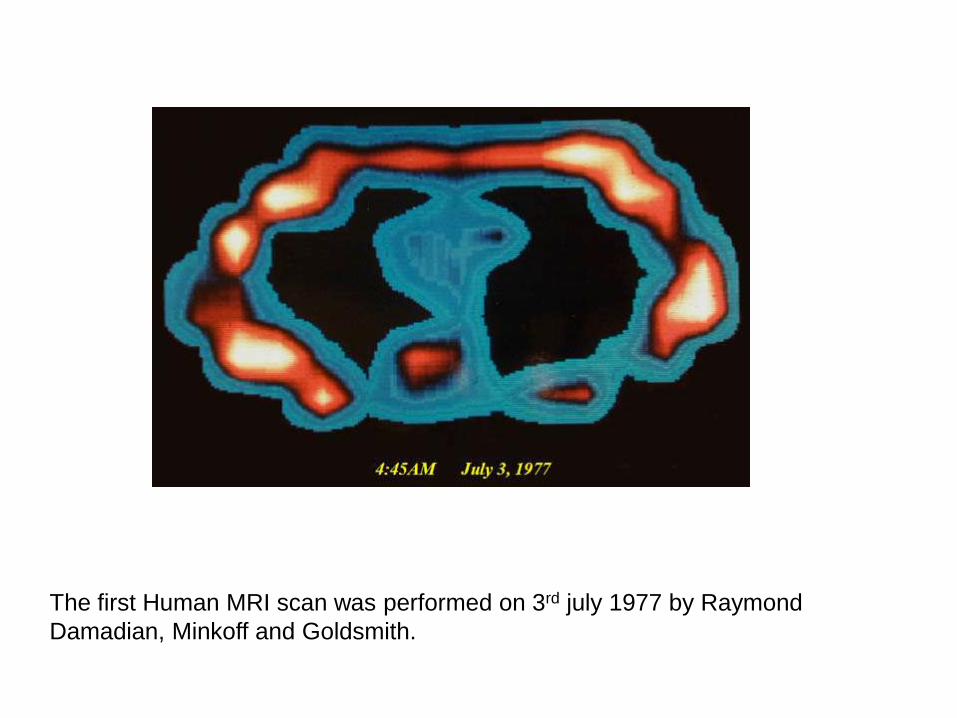
The first Human MRI scan was performed on 3rd july 1977 by Raymond
Damadian, Minkoff and Goldsmith.
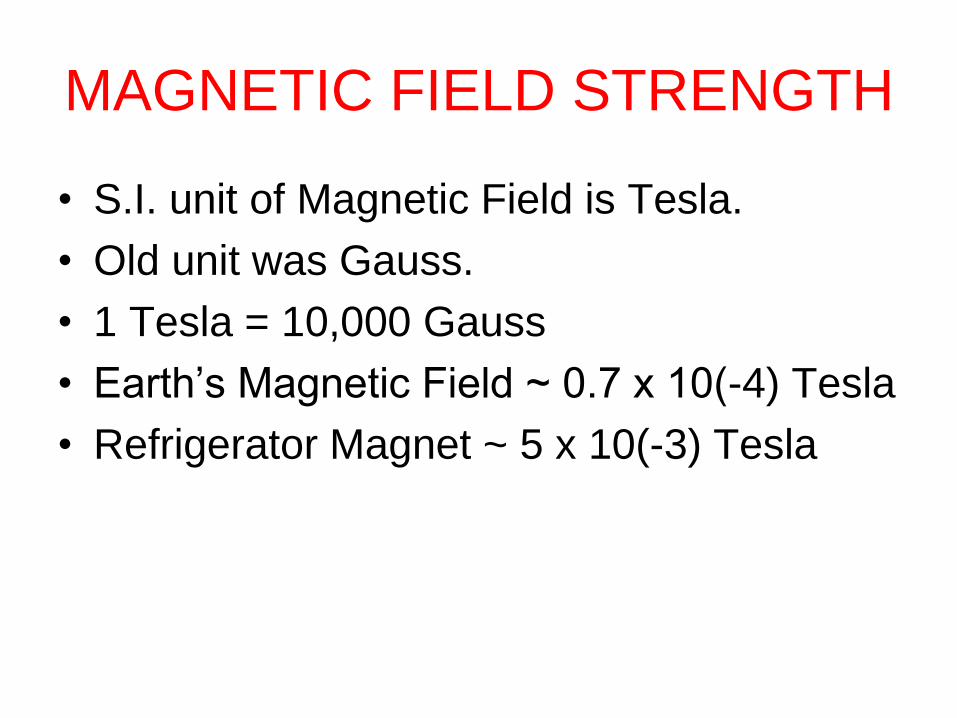
MAGNETIC FIELD STRENGTH
• S.I. unit of Magnetic Field is Tesla.
• Old unit was Gauss.
• 1 Tesla = 10,000 Gauss
• Earth’s Magnetic Field ~ 0.7 x 10(-4) Tesla
• Refrigerator Magnet ~ 5 x 10(-3) Tesla
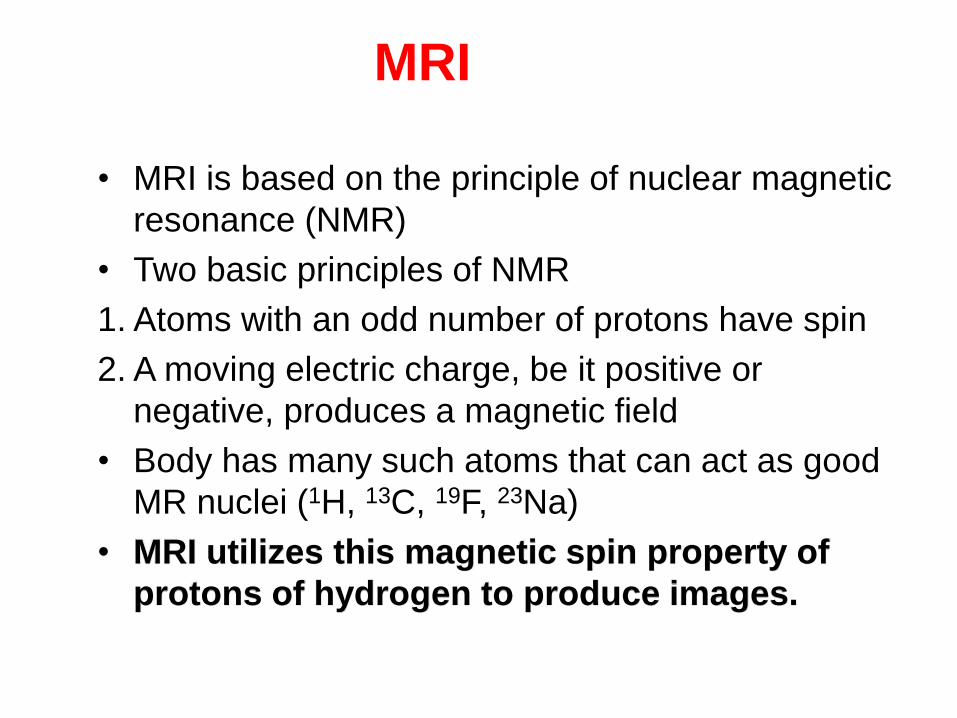
• MRI is based on the principle of nuclear magnetic
resonance (NMR)
• Two basic principles of NMR
1. Atoms with an odd number of protons have spin
2. A moving electric charge, be it positive or
negative, produces a magnetic field
• Body has many such atoms that can act as good
MR nuclei (1H, 13C, 19F, 23Na)
• MRI utilizes this magnetic spin property of
protons of hydrogen to produce images.
MRI
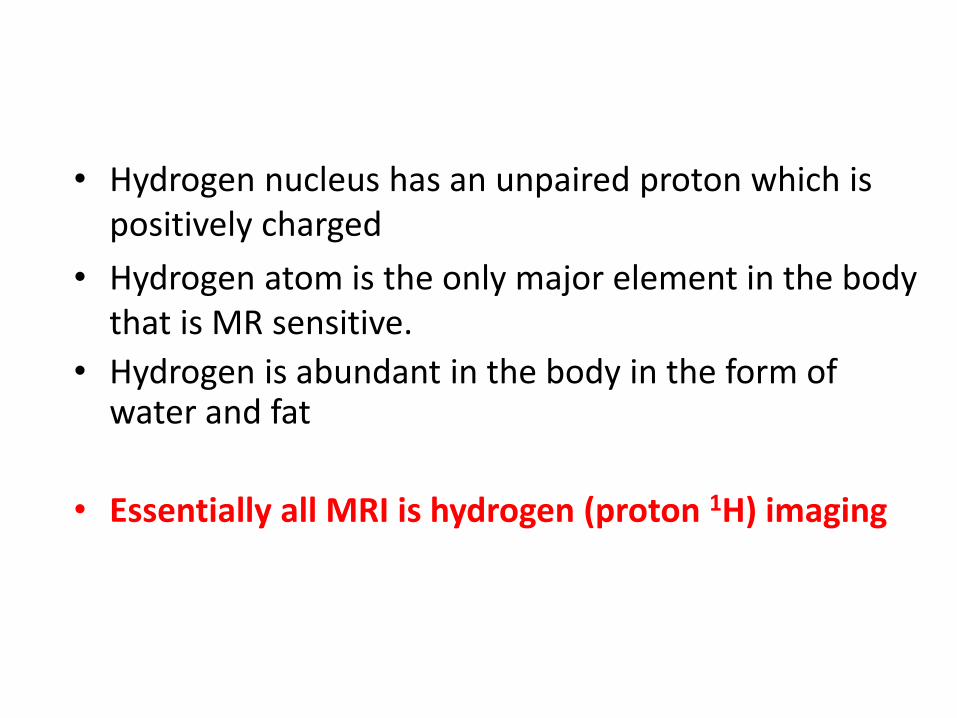
• Hydrogen nucleus has an unpaired proton which is positively charged
• Hydrogen atom is the only major element in the body that is MR sensitive.
• Hydrogen is abundant in the body in the form of water and fat
• Essentially all MRI is hydrogen (proton 1H) imaging

• TE (echo time) : time interval in which signals are measured after RF excitation
• TR (repetition time) : the time between two excitations is called repetition time.
• By varying the TR and TE one can obtain T1WI and T2WI.
• In general a short TR (<1000ms) and short TE (<45 ms) scan is T1WI.
• Long TR (>2000ms) and long TE (>45ms) scan is T2WI.
TR & TE
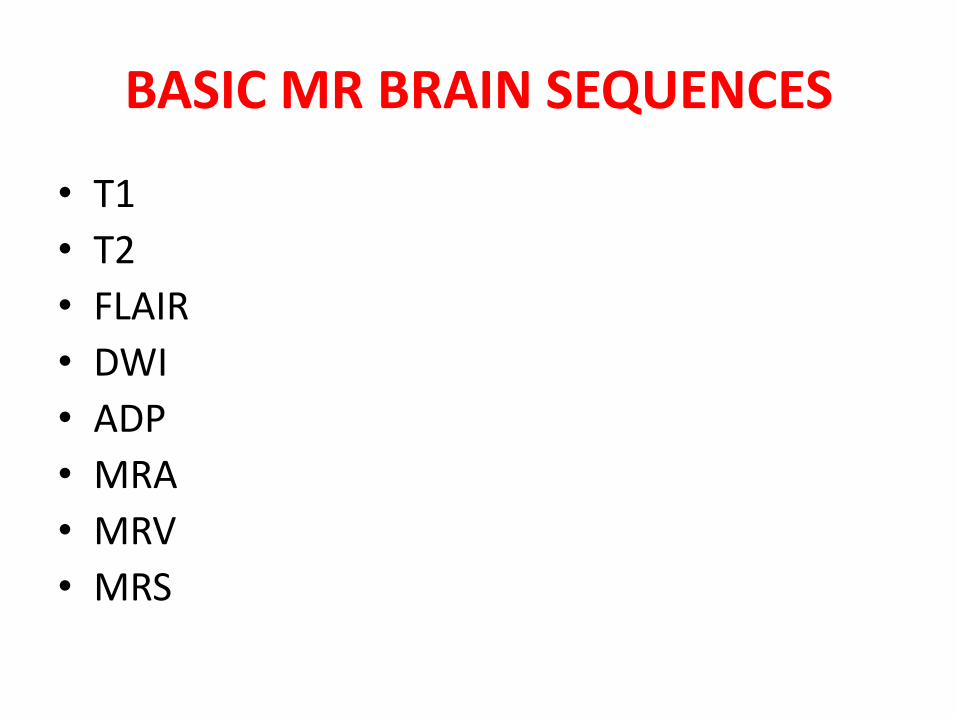
BASIC MR BRAIN SEQUENCES
• T1
• T2
• FLAIR
• DWI
• ADP
• MRA
• MRV
• MRS
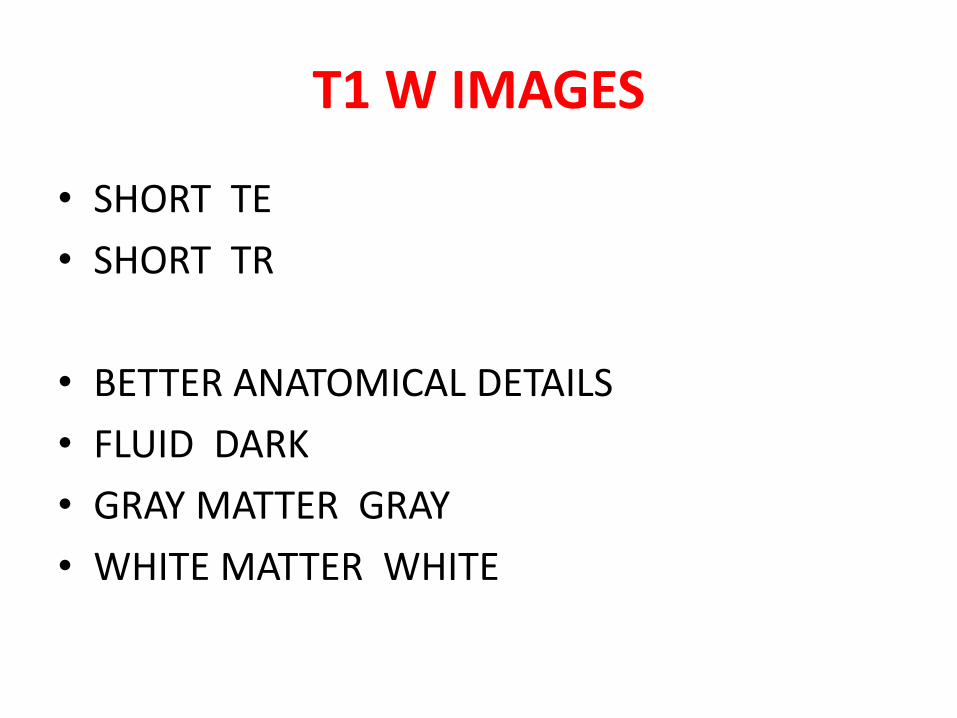
• SHORT TE
• SHORT TR
• BETTER ANATOMICAL DETAILS
• FLUID DARK
• GRAY MATTER GRAY
• WHITE MATTER WHITE
T1 W IMAGES

• MOST PATHOLOGIES DARK ON T1
• BRIGHT ON T1– Fat
– Haemorrhage
– Melanin
– Early Calcification
– Protein Contents (Colloid cyst/ Rathke cyst)
– Posterior Pituitary appears BRIGHT ON T1
– Gadolinium

T1 W IMAGES
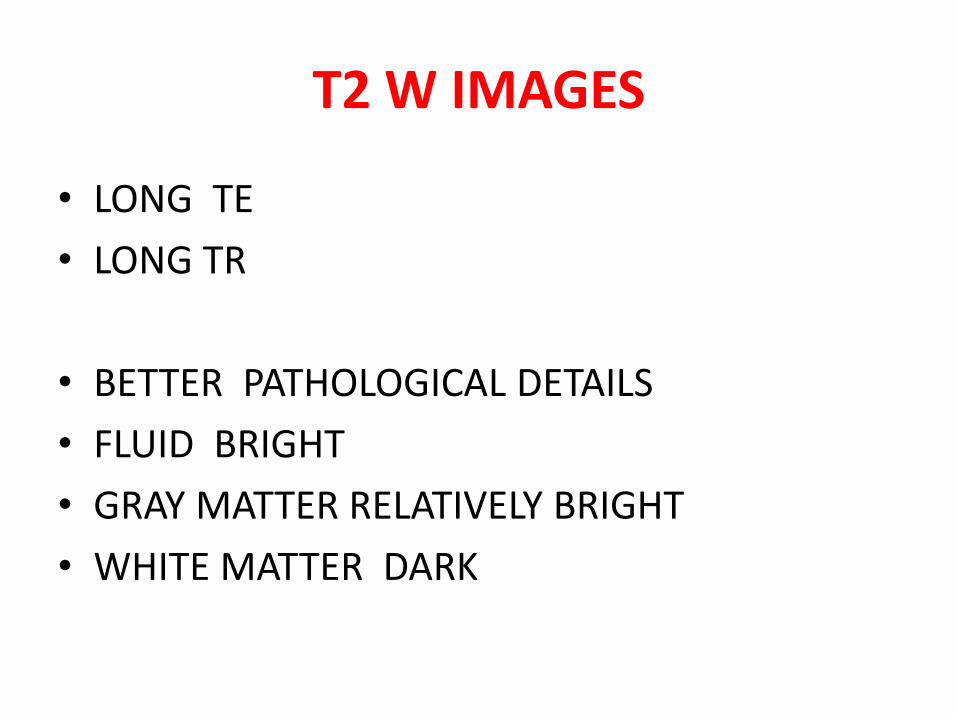
• LONG TE
• LONG TR
• BETTER PATHOLOGICAL DETAILS
• FLUID BRIGHT
• GRAY MATTER RELATIVELY BRIGHT
• WHITE MATTER DARK
T2 W IMAGES
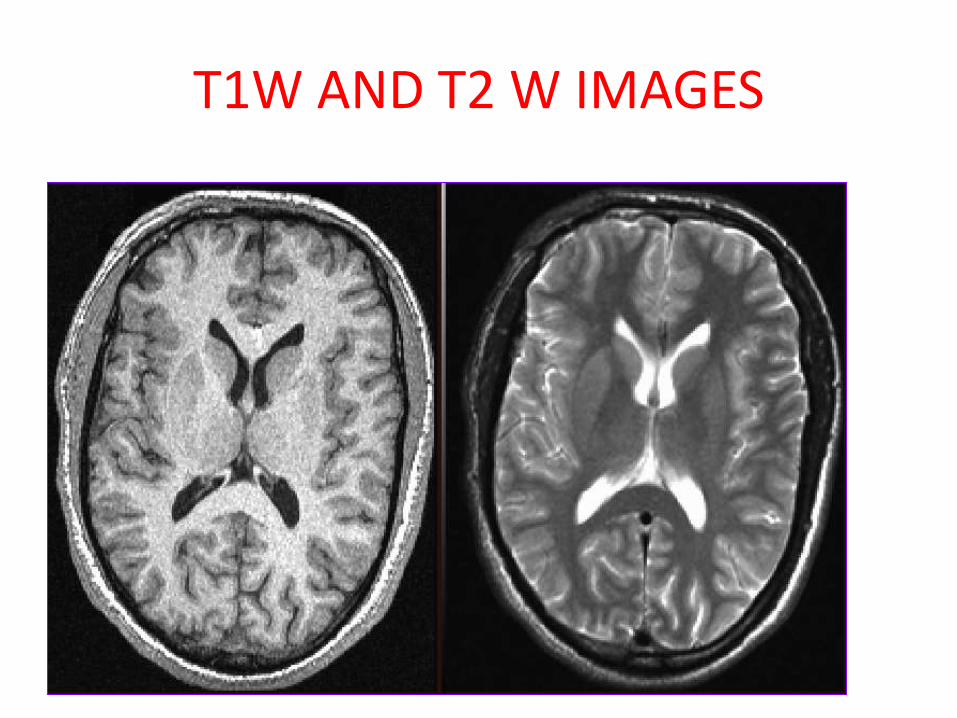
T1W AND T2 W IMAGES
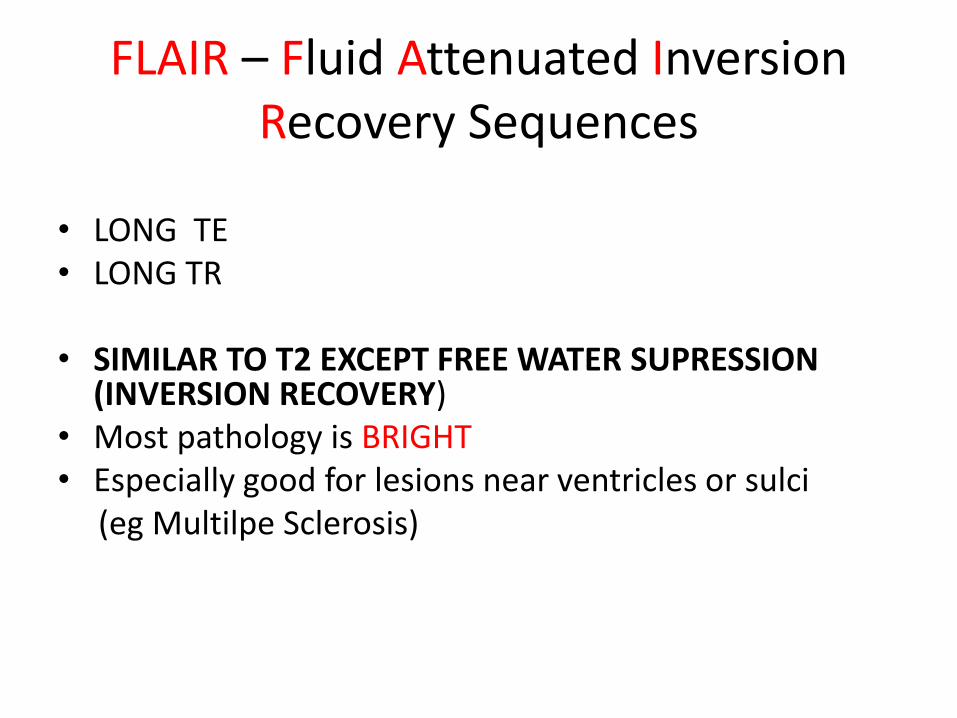
• LONG TE• LONG TR
• SIMILAR TO T2 EXCEPT FREE WATER SUPRESSION (INVERSION RECOVERY)
• Most pathology is BRIGHT• Especially good for lesions near ventricles or sulci
(eg Multilpe Sclerosis)
FLAIR – Fluid Attenuated Inversion Recovery Sequences
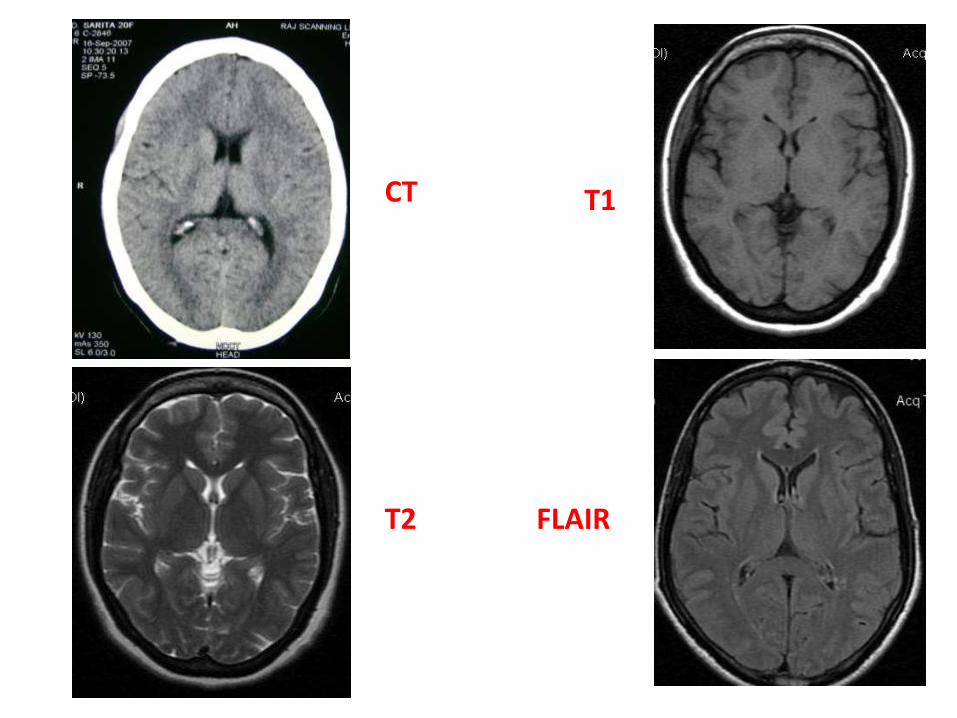
CT
FLAIRT2
T1
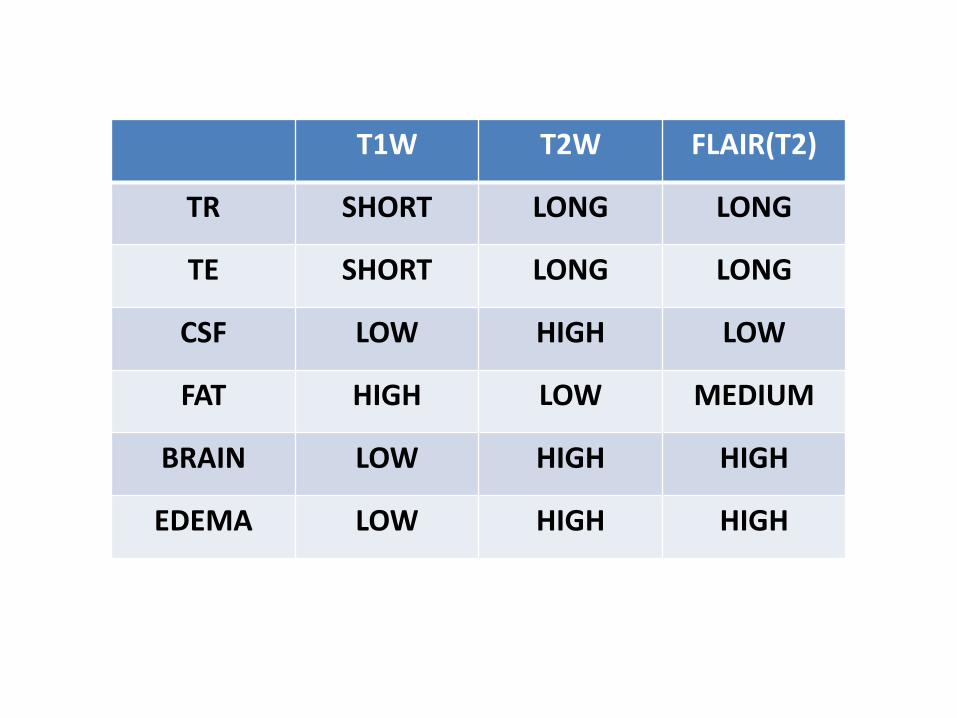
T1W T2W FLAIR(T2)
TR SHORT LONG LONG
TE SHORT LONG LONG
CSF LOW HIGH LOW
FAT HIGH LOW MEDIUM
BRAIN LOW HIGH HIGH
EDEMA LOW HIGH HIGH

MRI BRAIN :AXIAL SECTIONS
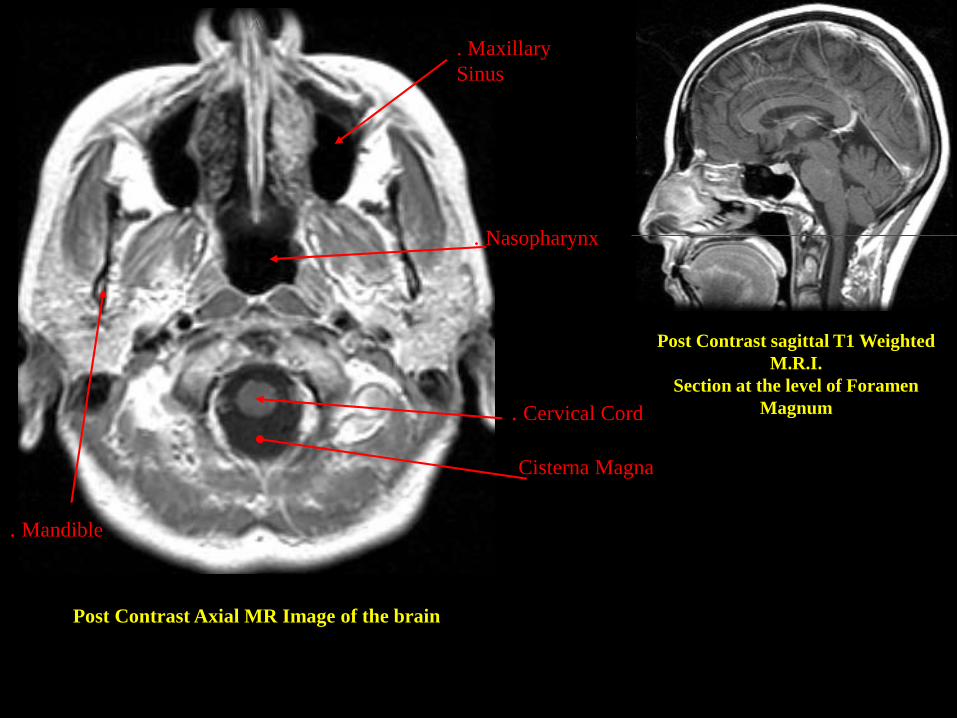
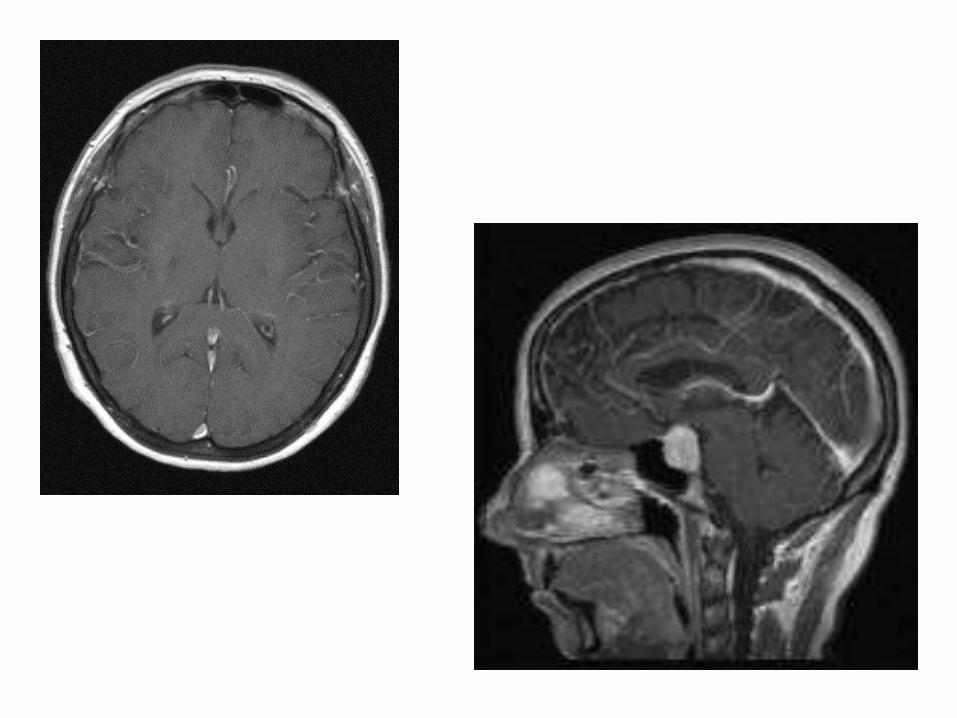
Post Contrast Axial MR Image of the brain
Post Contrast sagittal T1 Weighted
M.R.I.
Section at the level of Foramen
Magnum
Cisterna Magna
. Cervical Cord
. Nasopharynx
. Mandible
. Maxillary
Sinus
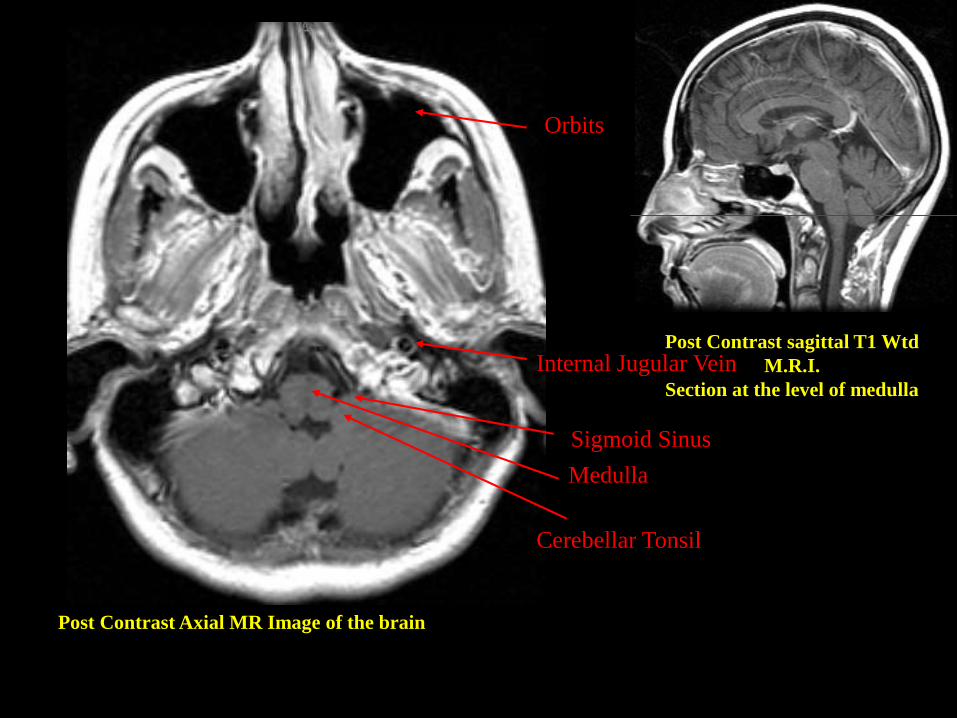
Post Contrast Axial MR Image of the brain
Post Contrast sagittal T1 Wtd
M.R.I.
Section at the level of medulla
Sigmoid Sinus
Medulla
Internal Jugular Vein
Cerebellar Tonsil
Orbits

ICA
Temporal
lobe
Post Contrast sagittal T1 Wtd
M.R.I.
Section at the level of Pons
Cerebellar
Hemisphere
Vermis
IV Ventricle
Pons
Basilar Artery
Cavernous Sinus
MCPIAC
Mastoid
Sinus
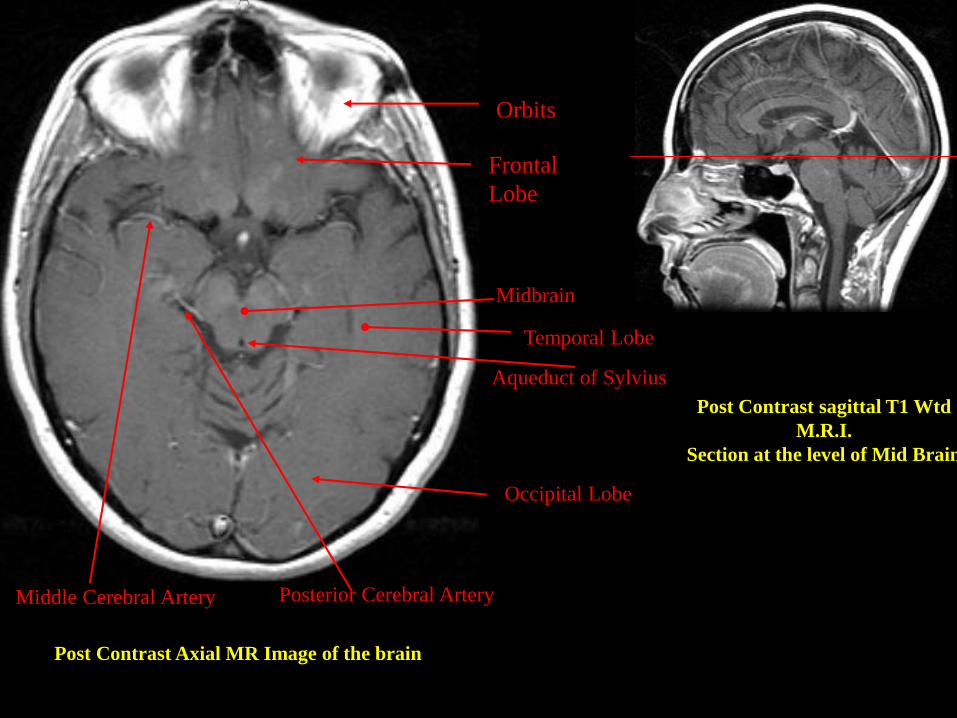
Post Contrast Axial MR Image of the brain
Post Contrast sagittal T1 Wtd
M.R.I.
Section at the level of Mid Brain
Aqueduct of Sylvius
Orbits
Posterior Cerebral ArteryMiddle Cerebral Artery
Midbrain
Frontal
Lobe
Temporal Lobe
Occipital Lobe
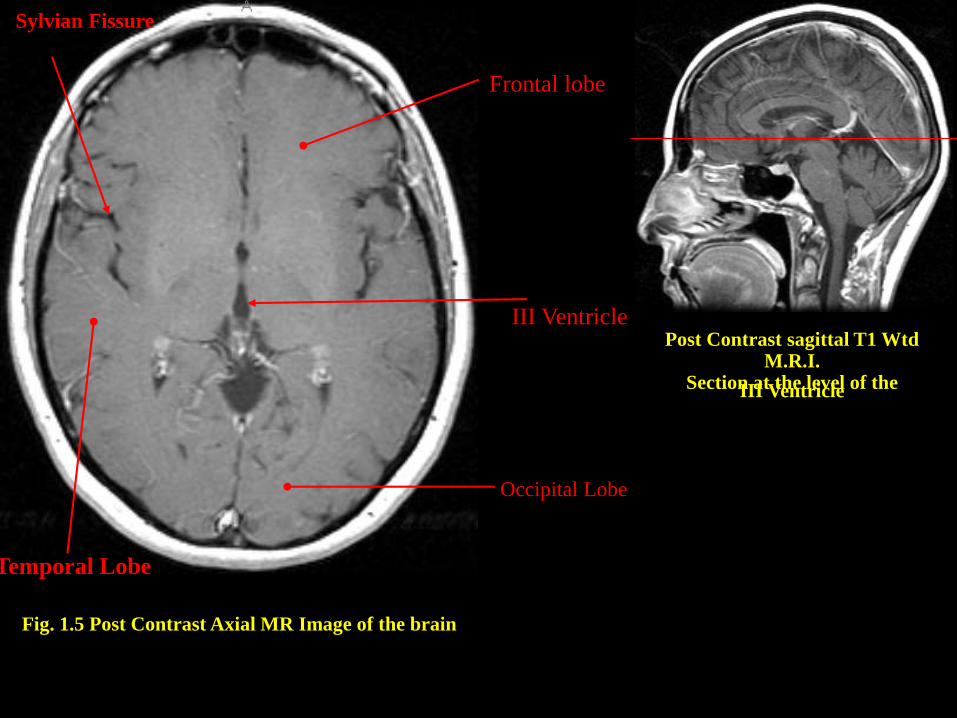
Fig. 1.5 Post Contrast Axial MR Image of the brain
Post Contrast sagittal T1 Wtd M.R.I.
Section at the level of theIII Ventricle
Occipital Lobe
III Ventricle
Frontal lobe
Temporal Lobe
Sylvian Fissure
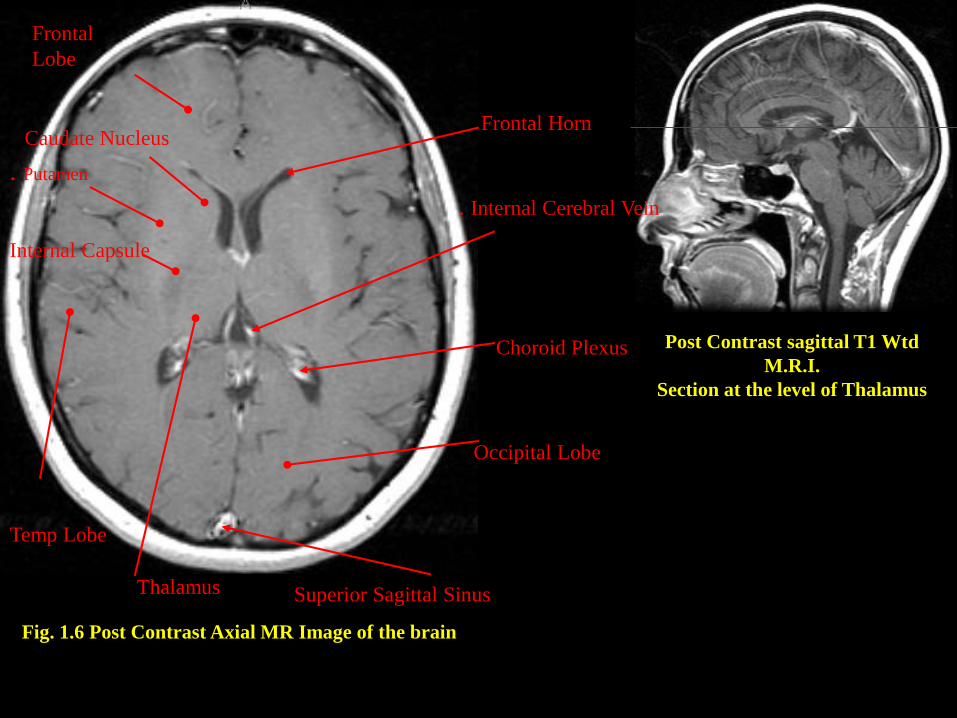
Fig. 1.6 Post Contrast Axial MR Image of the brain
Post Contrast sagittal T1 Wtd
M.R.I.
Section at the level of Thalamus
Superior Sagittal Sinus
Occipital Lobe
Choroid Plexus
. Internal Cerebral Vein
Frontal Horn
Thalamus
Temp Lobe
Internal Capsule
. Putamen
Caudate Nucleus
Frontal
Lobe

Post Contrast sagittal T1 Wtd
M.R.I.
Section at the level of Corpus
Callosum
Genu of corpus callosum
Splenium of corpus callosum
Choroid plexus within the
body of lateral ventricle

Post Contrast Axial MR Image of the brain
Post Contrast sagittal T1 Wtd
M.R.I.
Section at the level of Body of
Corpus Callosum
Parietal Lobe
Body of the
Corpus Callosum
Frontal Lobe
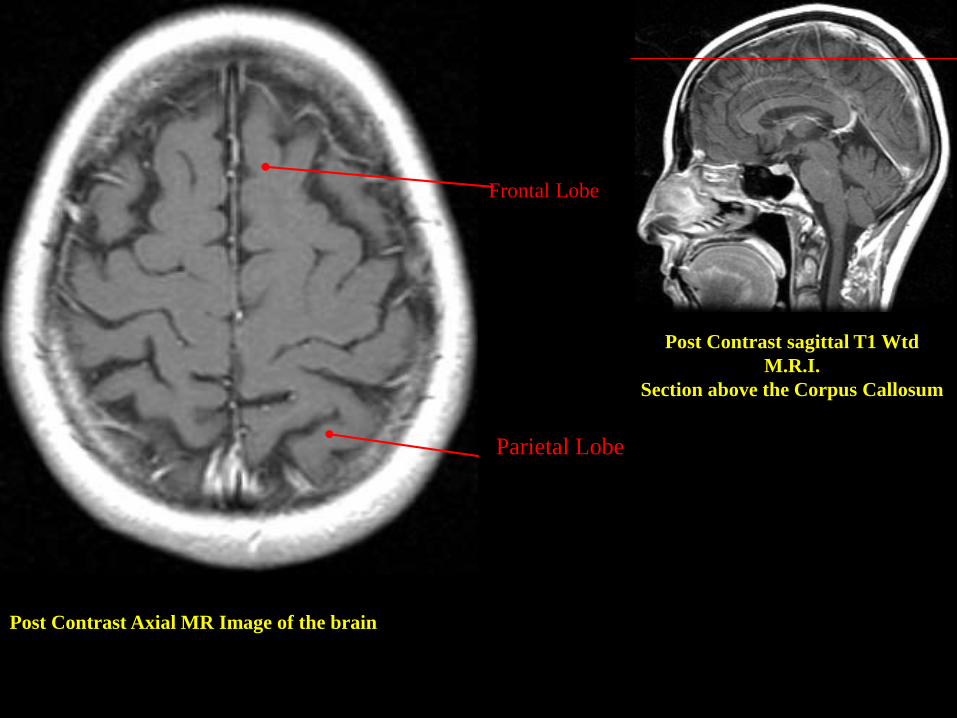
Post Contrast Axial MR Image of the brain
Post Contrast sagittal T1 Wtd
M.R.I.
Section above the Corpus Callosum
Parietal Lobe
Frontal Lobe

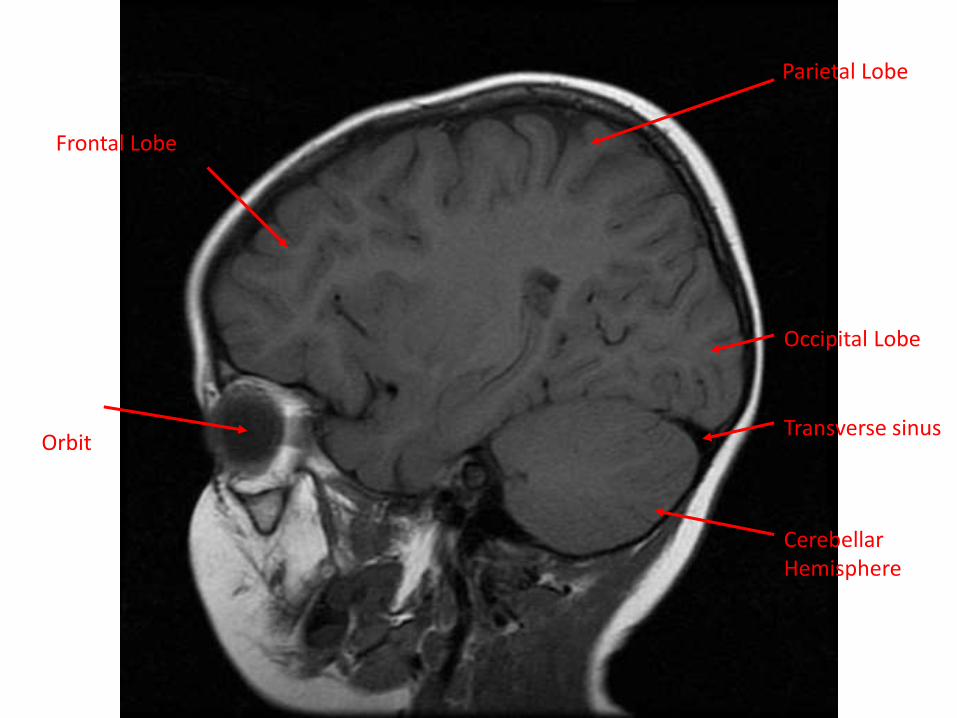
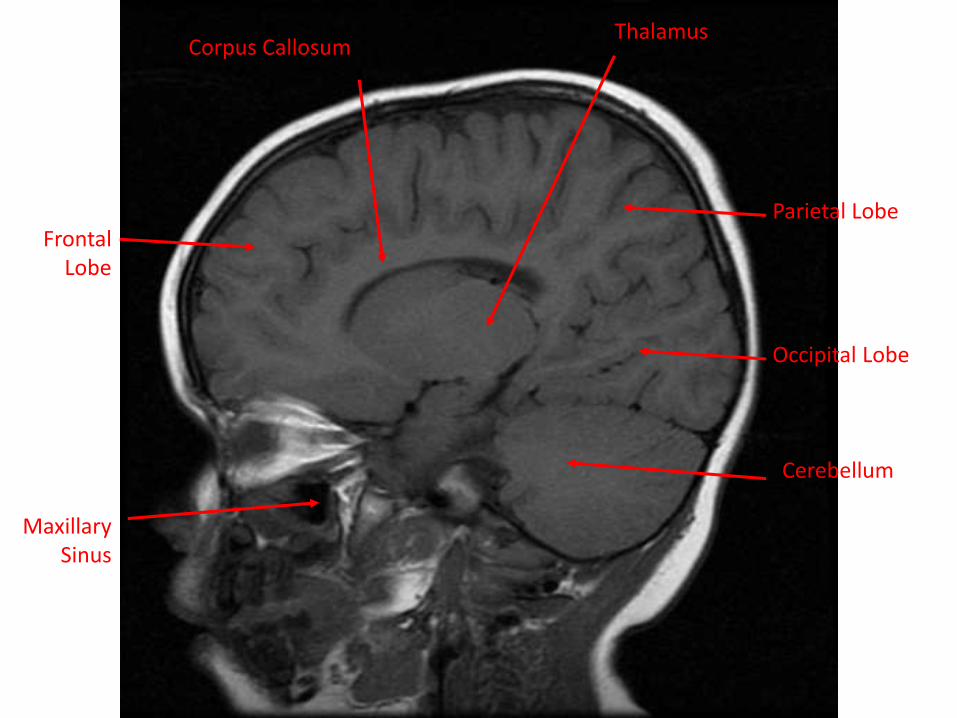
MRI BRAIN :SAGITTAL SECTIONS
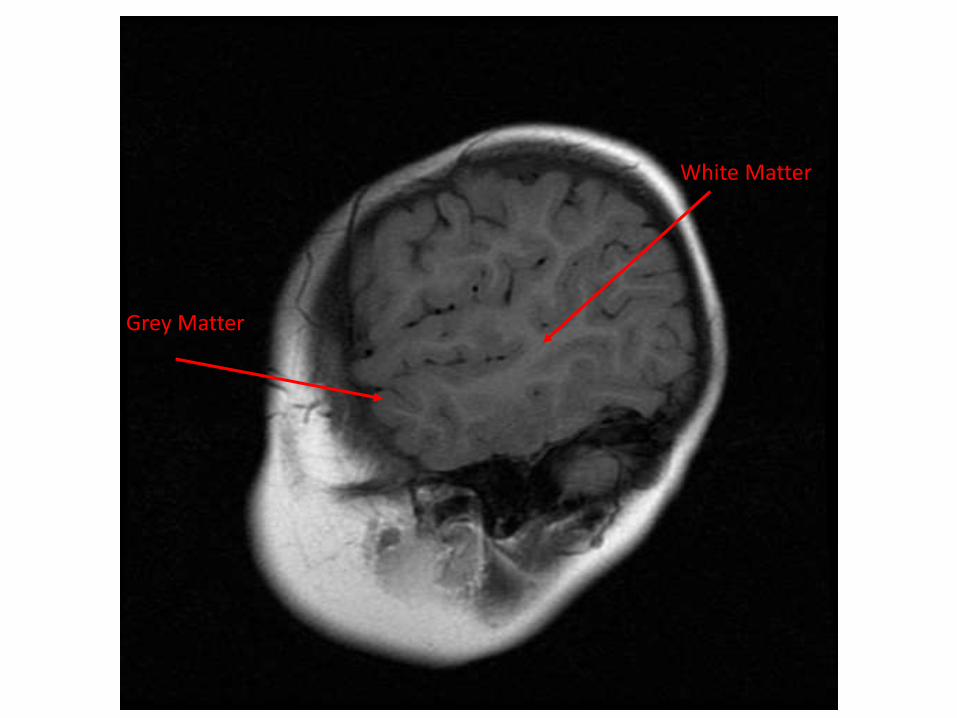
Grey Matter
White Matter
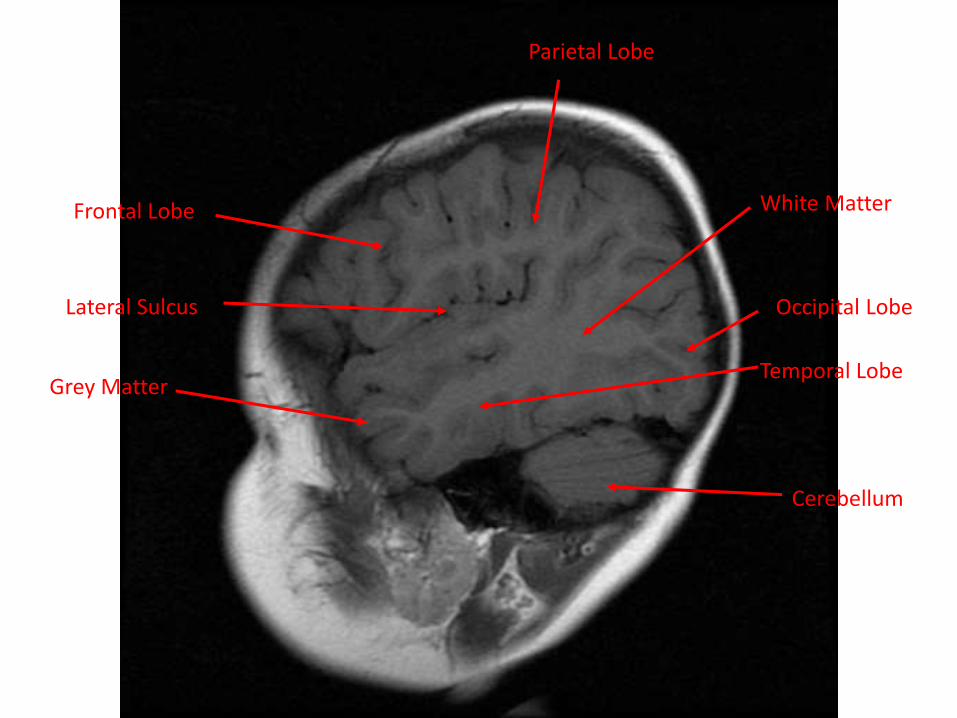
White Matter
Cerebellum
Grey Matter
Frontal Lobe
Parietal Lobe
Temporal Lobe
Lateral Sulcus Occipital Lobe
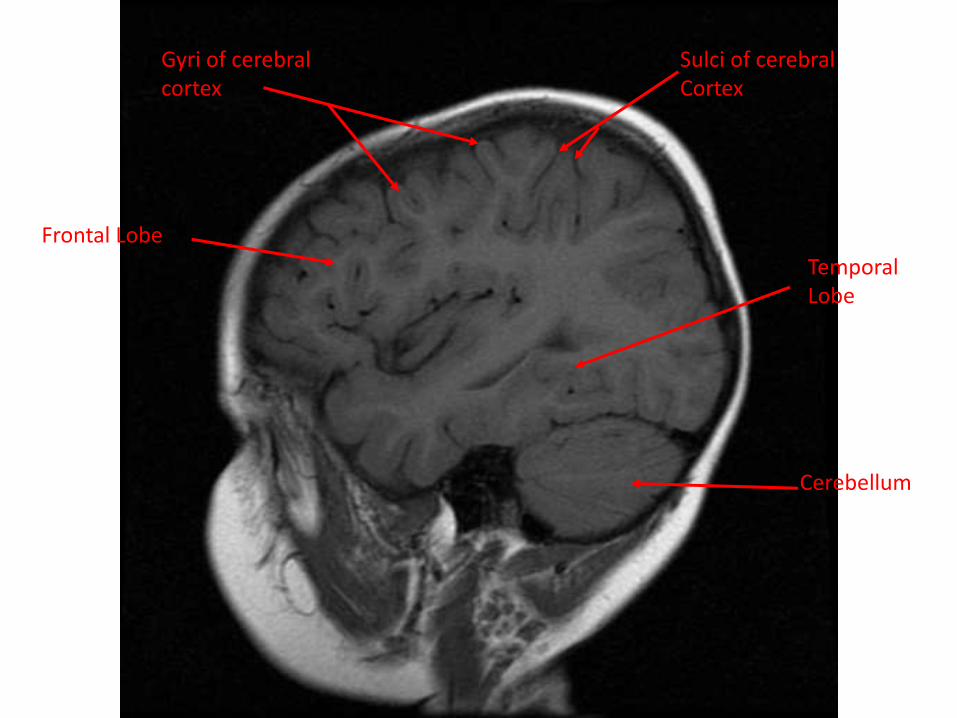
Gyri of cerebral cortex
Sulci of cerebral Cortex
Cerebellum
Frontal Lobe
TemporalLobe
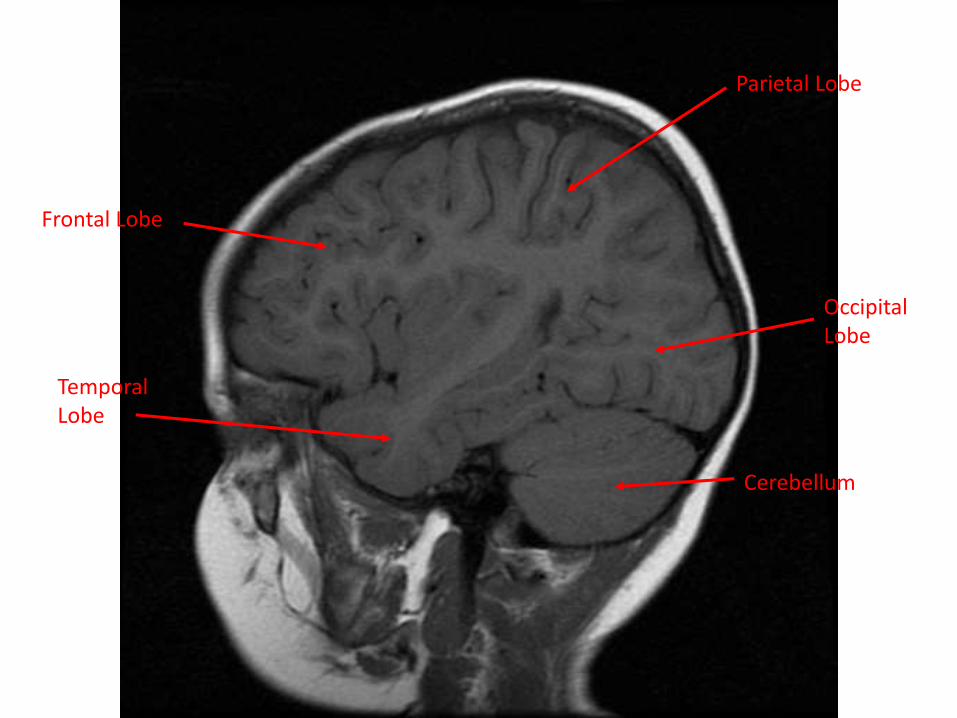
Frontal Lobe
Temporal Lobe
Parietal Lobe
OccipitalLobe
Cerebellum
Frontal Lobe
Parietal Lobe
Orbit
Occipital Lobe
Transverse sinus
CerebellarHemisphere
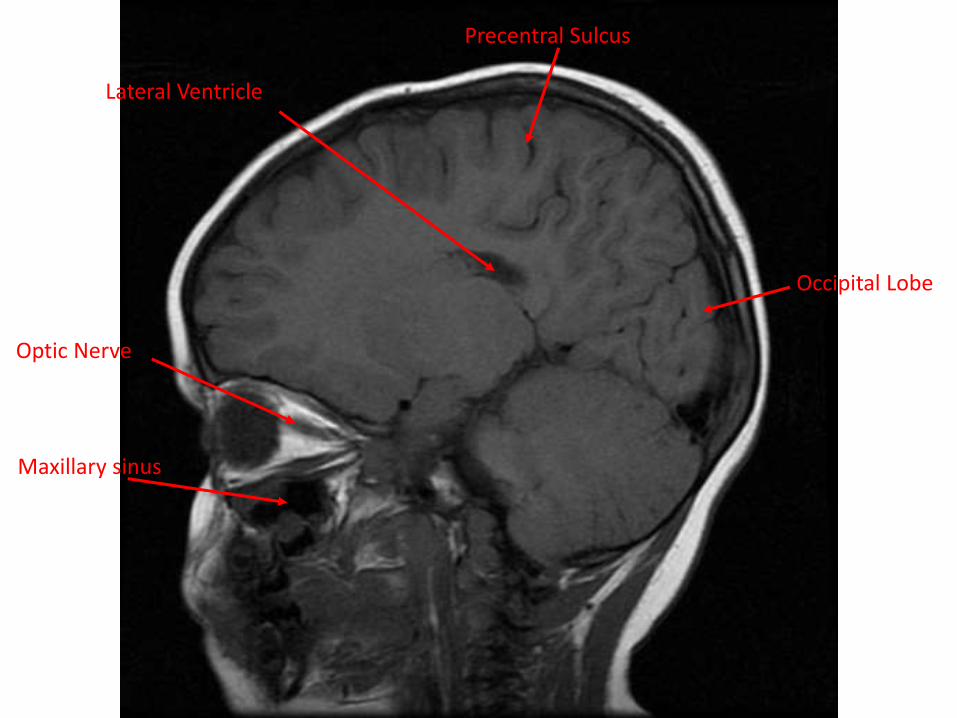
Optic Nerve
Precentral Sulcus
Lateral Ventricle
Occipital Lobe
Maxillary sinus

Caudate Nucleus
Corpus callosum
Thalamus
Tongue
Pons
TentoriumCerebell

Splenium of Corpus callosum
Pons
Ethmoid air Cells
Inferior nasalConcha
Midbrain
Fourth Ventricle
Genu of CorpusCallosum
Hypophysis
Thalamus
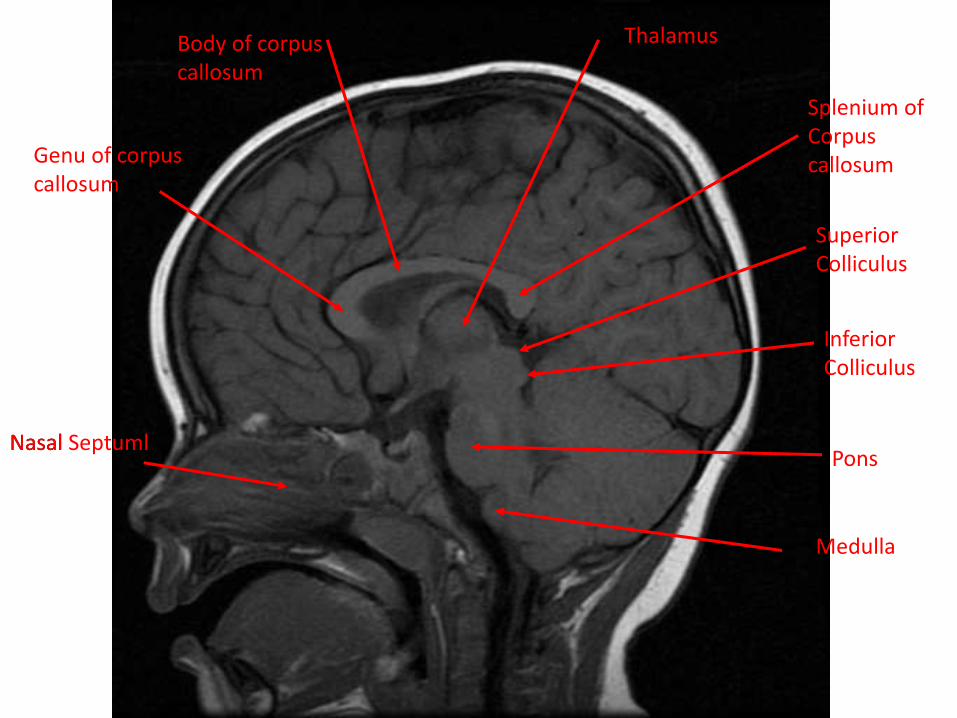
Splenium of Corpus callosumGenu of corpus
callosum
Pons
SuperiorColliculus
Inferior Colliculus
NasalNasal Septuml
Medulla
Body of corpus callosum
Thalamus
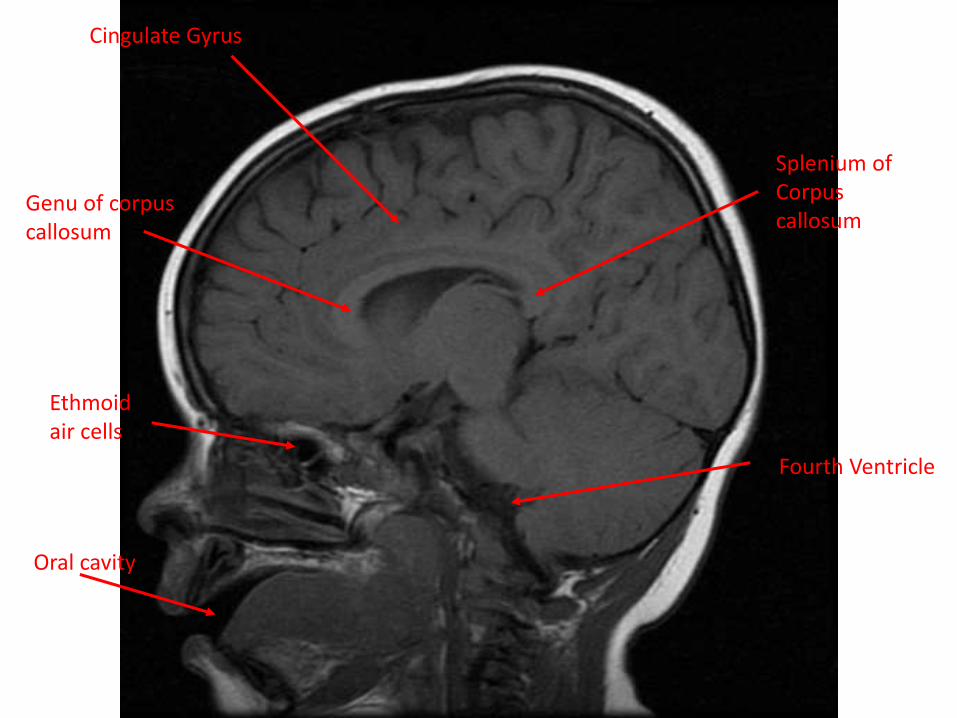
Cingulate Gyrus
Genu of corpuscallosum
Ethmoidair cells
Oral cavity
Splenium of Corpus callosum
Fourth Ventricle
FrontalLobe
MaxillarySinus
Parietal Lobe
Occipital Lobe
Corpus CallosumThalamus
Cerebellum
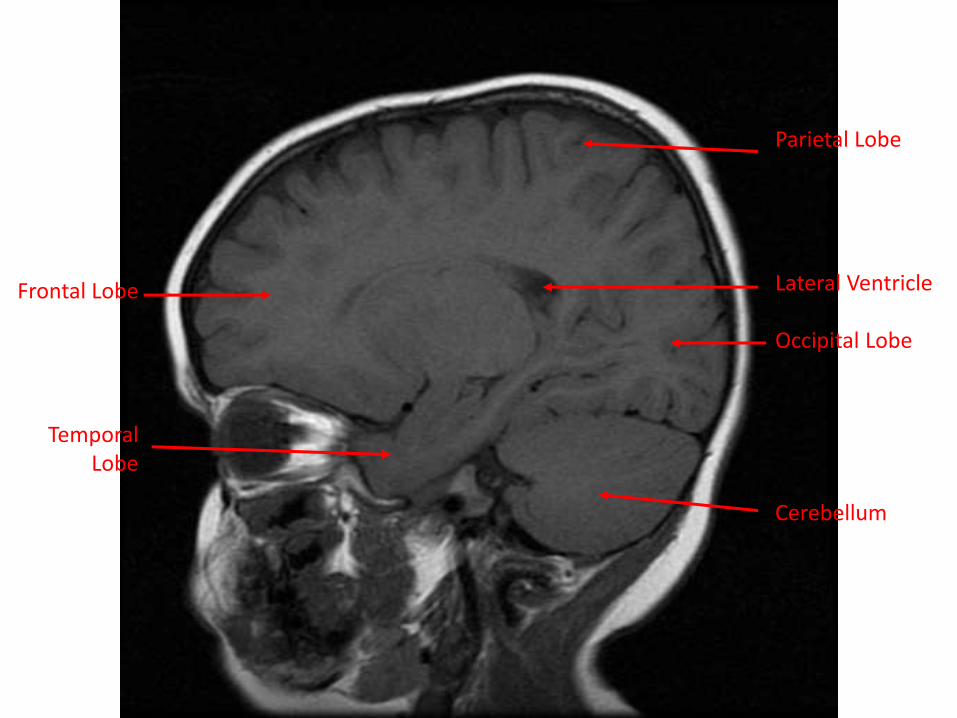
Frontal Lobe
TemporalLobe
Parietal Lobe
Lateral Ventricle
Occipital Lobe
Cerebellum

Frontal Lobe
Parietal Lobe
Superior Temporal Gyrus
Lateral Sulcus
Inferior Temporal Gyrus
Middle Temporal Gyrus
External Auditory Meatus

. Bone
Inferior sagittal sinus
Corpus callosum
Internal cerebral vein
Vein of Galen
Superior sagittal sinus
Parietal lobe
Occipital lobe
Straight sinus
. Vermis
. IV ventricle
Cerebellar tonsil
Mass intermediaof thalamus
Sphenoid Sinus
MRI BRAIN :CORONAL SECTIONS
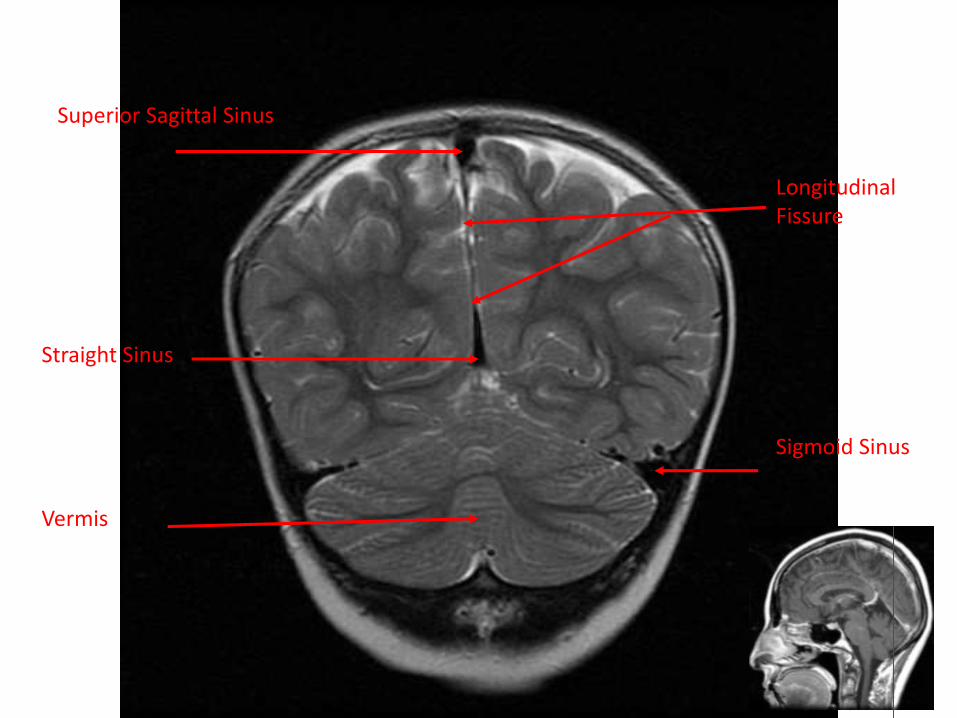
LongitudinalFissure
Straight Sinus
Superior Sagittal Sinus
Sigmoid Sinus
Vermis

Straight Sinus
Cerebellum
Lateral Ventricle,Occipital Horn

Arachnoid Villi
Great CerebralVein
TentoriumCerebelli
Falx Cerebri
Lateral Ventricle
Vermis ofCerebellum
Cerebellum
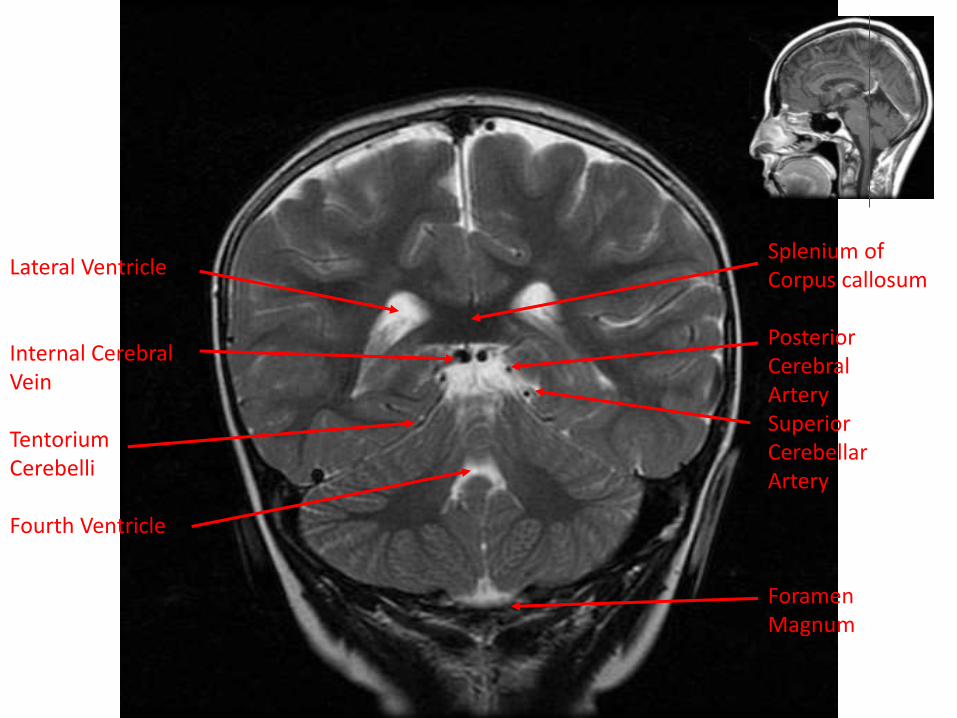
Splenium ofCorpus callosum
Posterior CerebralArterySuperior CerebellarArtery
Foramen Magnum
Lateral Ventricle
Internal CerebralVein
TentoriumCerebelli
Fourth Ventricle
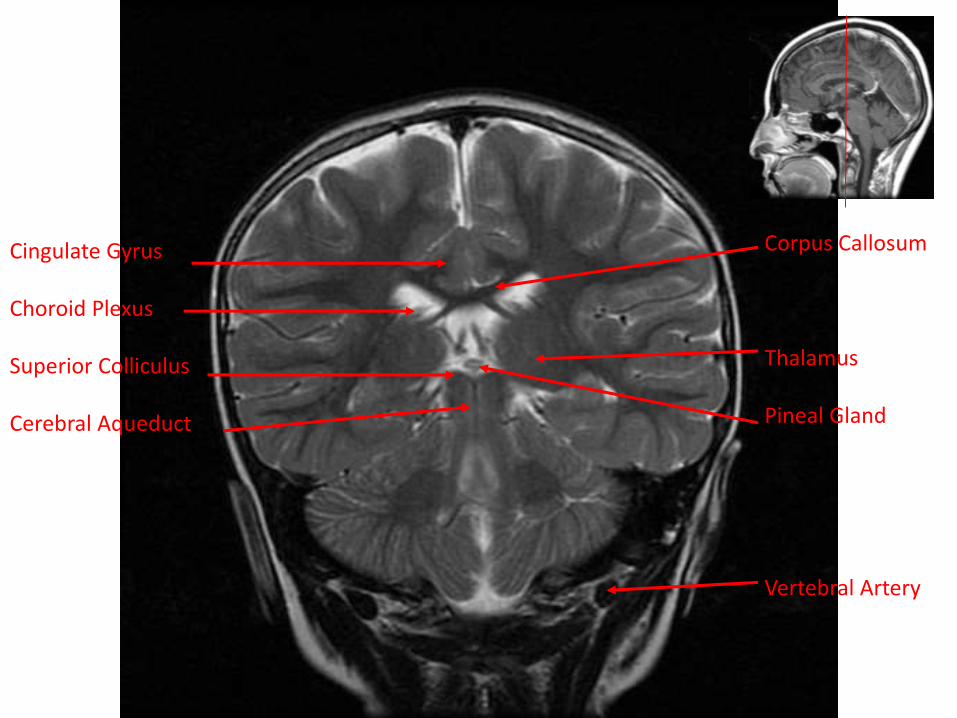
Cingulate Gyrus
Choroid Plexus
Superior Colliculus
Cerebral Aqueduct
Corpus Callosum
Thalamus
Pineal Gland
Vertebral Artery
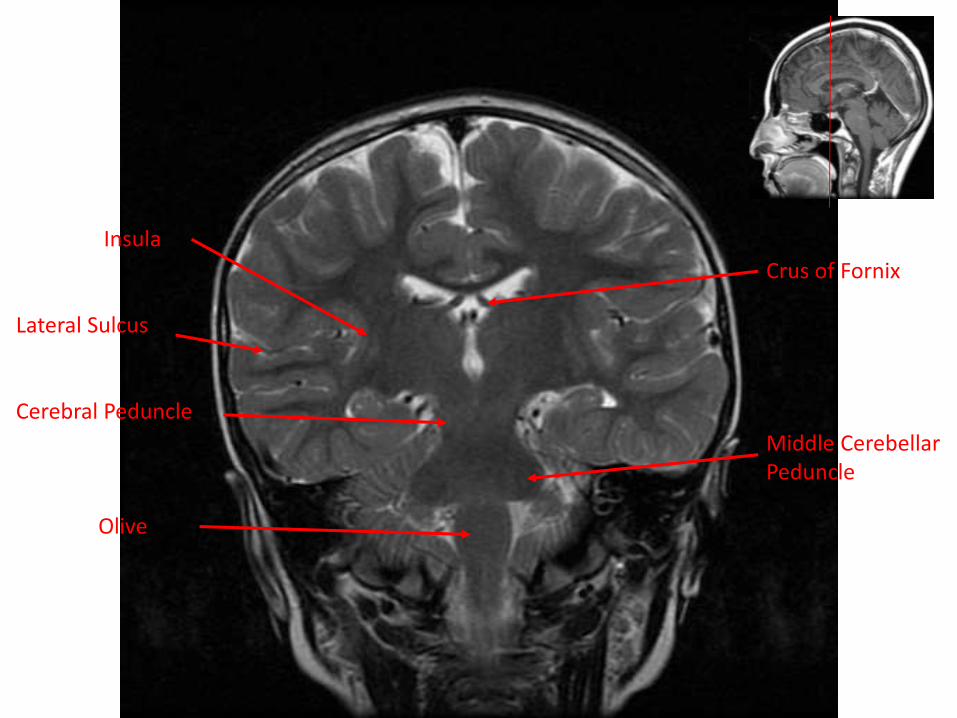
Insula
Lateral Sulcus
Cerebral Peduncle
Olive
Crus of Fornix
Middle CerebellarPeduncle
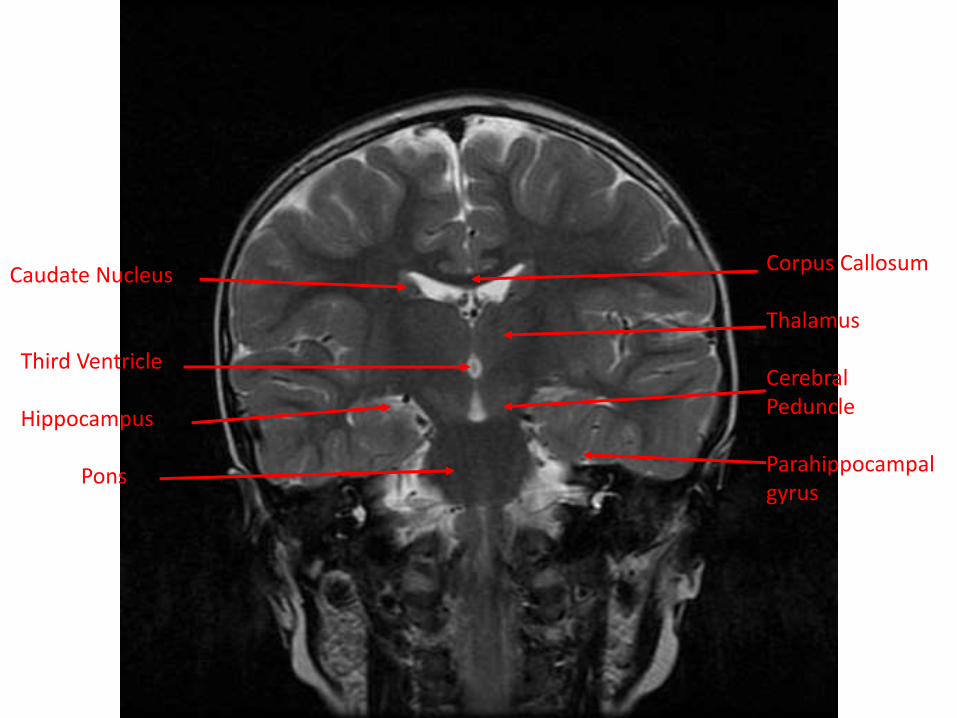
Caudate Nucleus
Third Ventricle
Hippocampus
Pons
Corpus Callosum
Thalamus
CerebralPeduncle
Parahippocampalgyrus
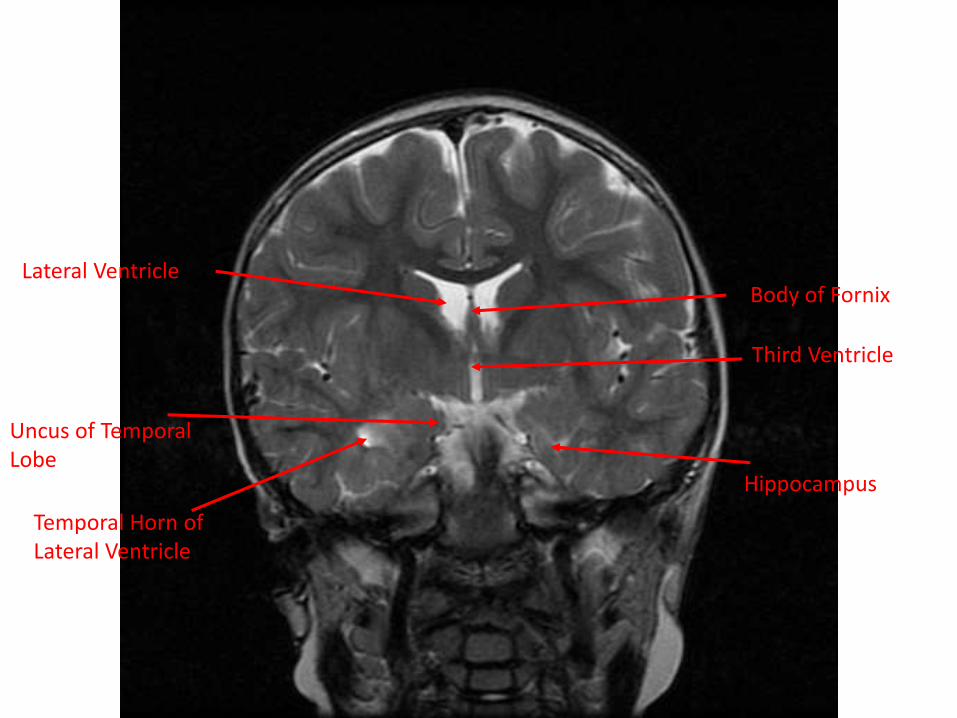
Lateral VentricleBody of Fornix
Temporal Horn of Lateral Ventricle
Uncus of Temporal Lobe
Third Ventricle
Hippocampus
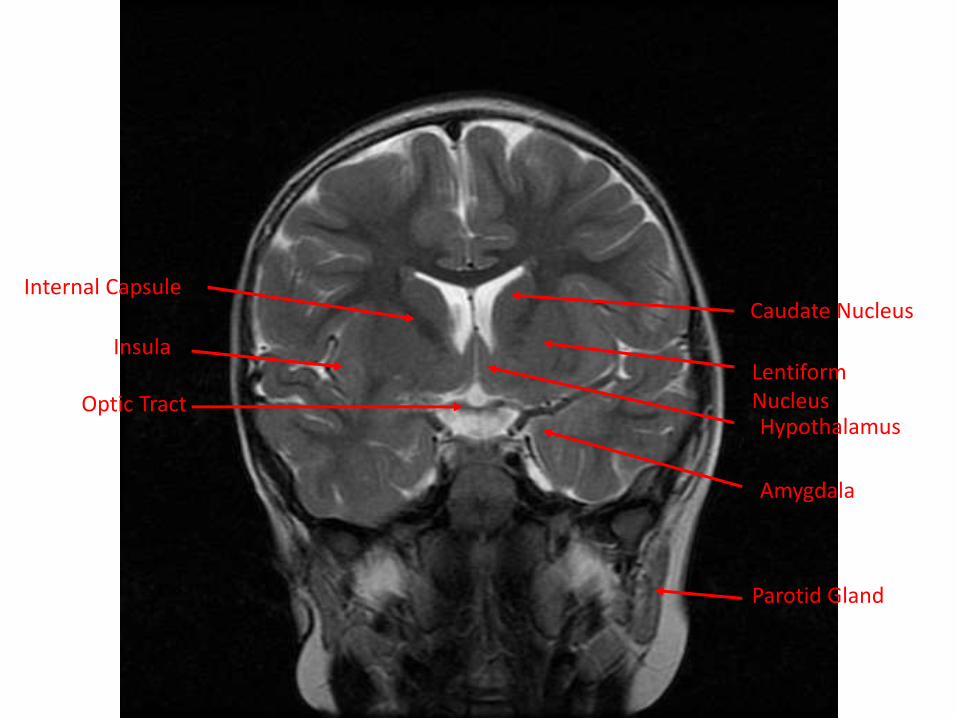
Internal CapsuleCaudate Nucleus
Optic Tract
InsulaLentiformNucleus
Parotid Gland
Amygdala
Hypothalamus
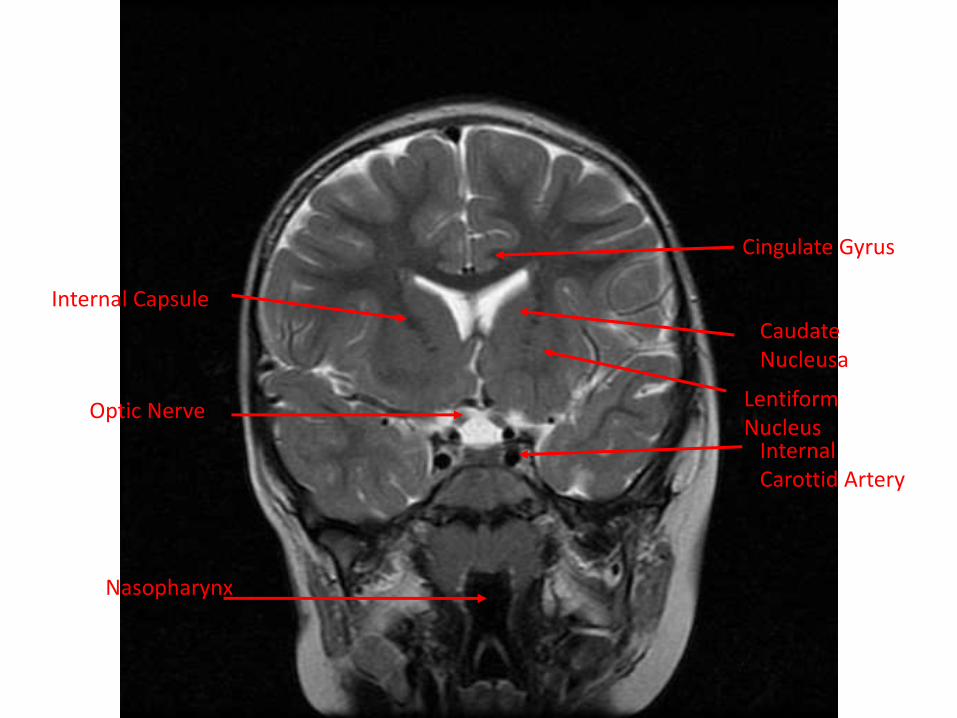
Internal Capsule
Cingulate Gyrus
Optic Nerve
Nasopharynx
Internal Carottid Artery
LentiformNucleus
Caudate Nucleusa
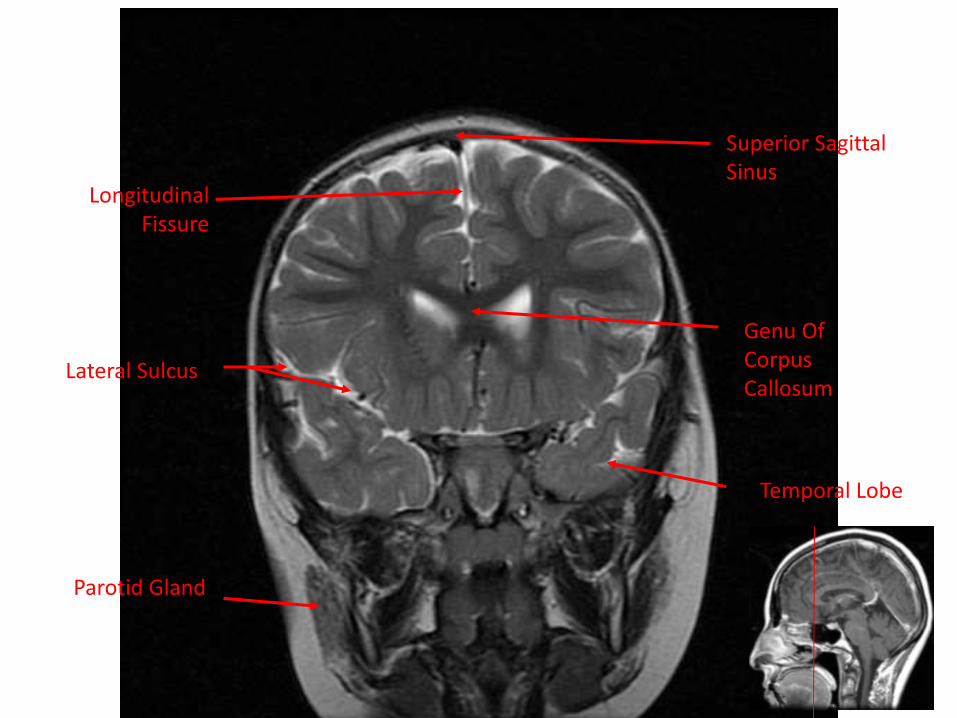
LongitudinalFissure
Superior SagittalSinus
Lateral Sulcus
Parotid Gland
Genu Of Corpus Callosum
Temporal Lobe
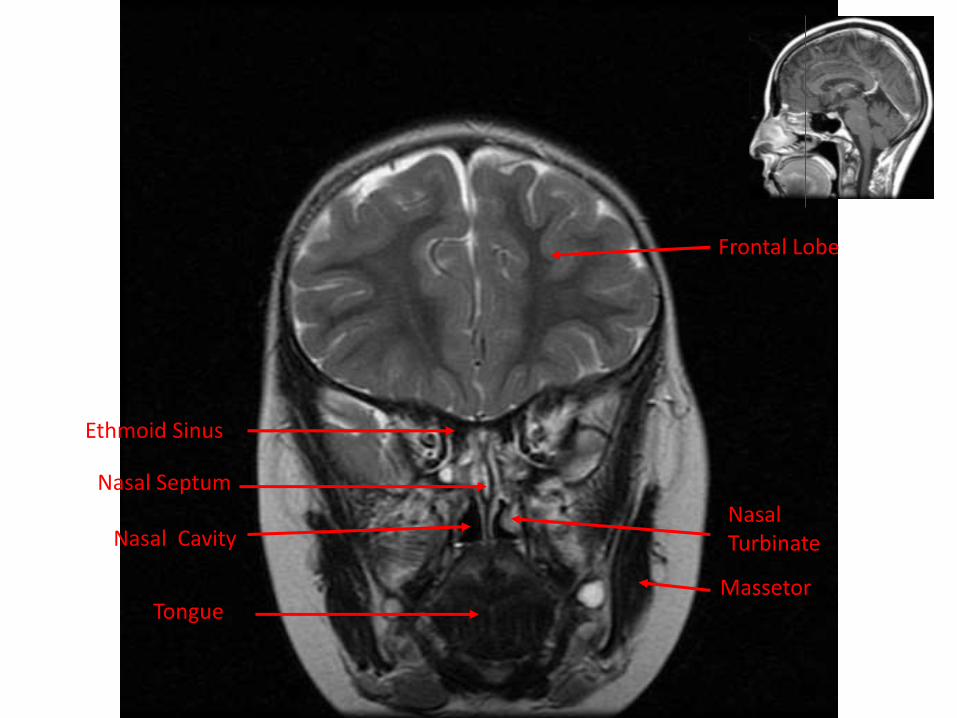
Ethmoid Sinus
Frontal Lobe
Nasal Turbinate
Massetor
Nasal Septum
Nasal Cavity
Tongue

Medial Rectus
Frontal Lobe
Lateral Rectus
Inferior Turbinate
Superior Rectus
Inferior Rectus
Maxillary Sinus
Tooth
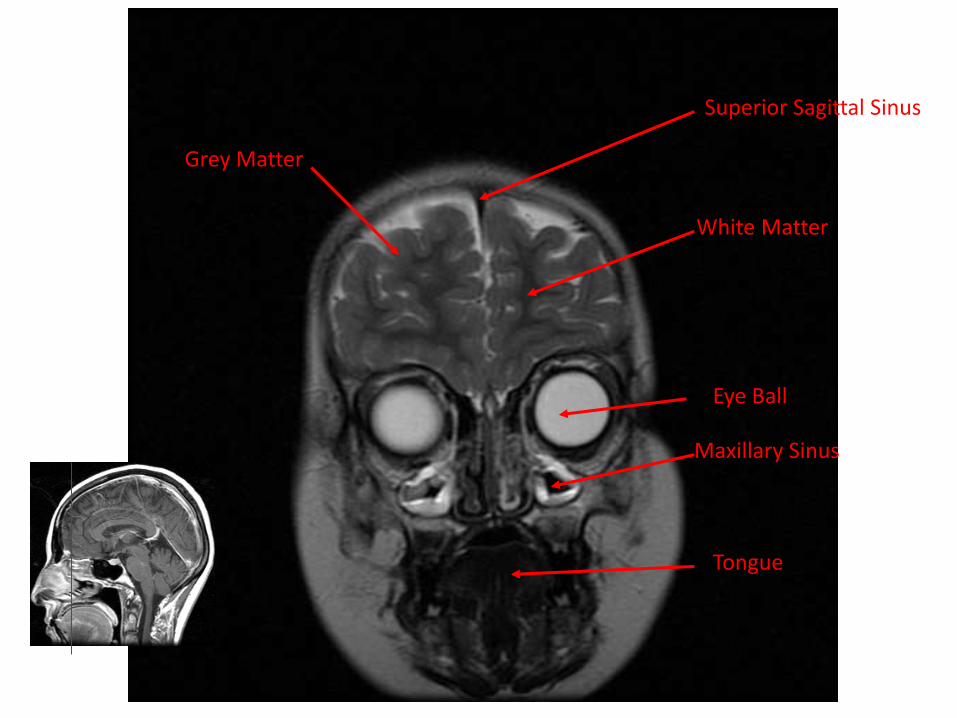
Grey Matter
Superior Sagittal Sinus
White Matter
Eye Ball
Maxillary Sinus
Tongue
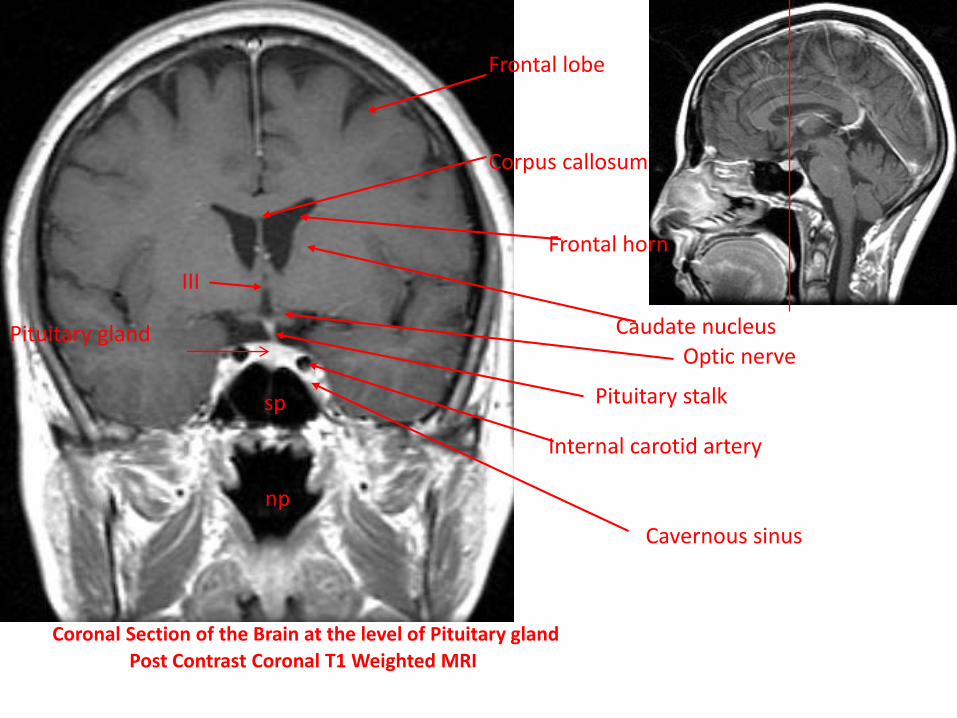
Coronal Section of the Brain at the level of Pituitary gland
Post Contrast Coronal T1 Weighted MRI
sp
np
Frontal lobe
Corpus callosum
Frontal horn
Caudate nucleus
III
Pituitary stalk
Pituitary glandOptic nerve
Internal carotid artery
Cavernous sinus
FLAIR & STIR SEQUENCES

Short TI inversion-recovery (STIR) sequence
• In STIR sequences, an inversion-recovery pulse is used to null the signal from fat (180° RF Pulse).
• STIR sequences provide excellent depiction of bone marrow edema which may be the only indication of an occult fracture.
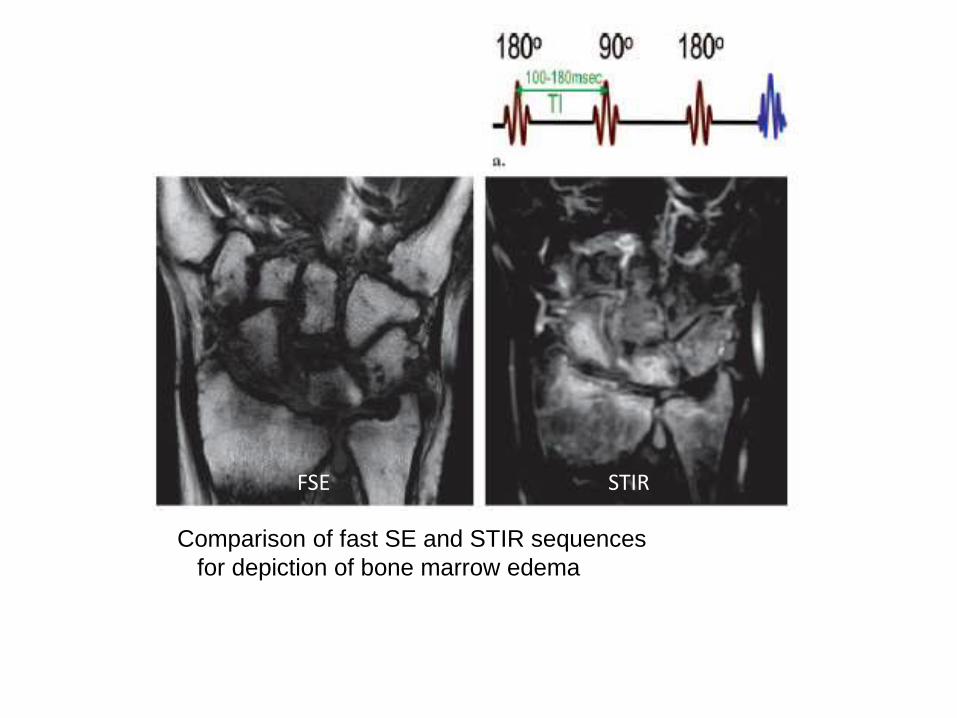
Comparison of fast SE and STIR sequences
for depiction of bone marrow edema
FSE STIR
Fluid-attenuated inversion recovery
(FLAIR)
• First described in 1992 and has become one of the corner stones of
brain MR imaging protocols
• An IR sequence with a long TR and TE and an inversion time (TI) that
is tailored to null the signal from CSF
• Nulled tissue remains dark and all other tissues have higher signal
intensities.
• Most pathologic processes show increased SI on T2-WI,
and the conspicuity of lesions that are located close to
interfaces b/w brain parenchyma and CSF may be poor in
conventional T2-WI sequences.
• FLAIR images are heavily T2-weighted with CSF signal
suppression, highlights hyper-intense lesions and improves
their conspicuity and detection, especially when located
adjacent to CSF containing spaces
Clinical Applications of FLAIR sequences:
• Used to evaluate diseases affecting the brain parenchyma neighboring the CSF-containing spaces for eg: MS & other demyelinatingdisorders.
• Unfortunately, less sensitive for lesions involving the brainstem & cerebellum, owing to CSF pulsation artifacts
• Mesial temporal sclerosis (MTS) (thin section coronal FLAIR)
• Tuberous Sclerosis – for detection of Hamartomatous lesions.
• Helpful in evaluation of neonates with perinatal HIE.
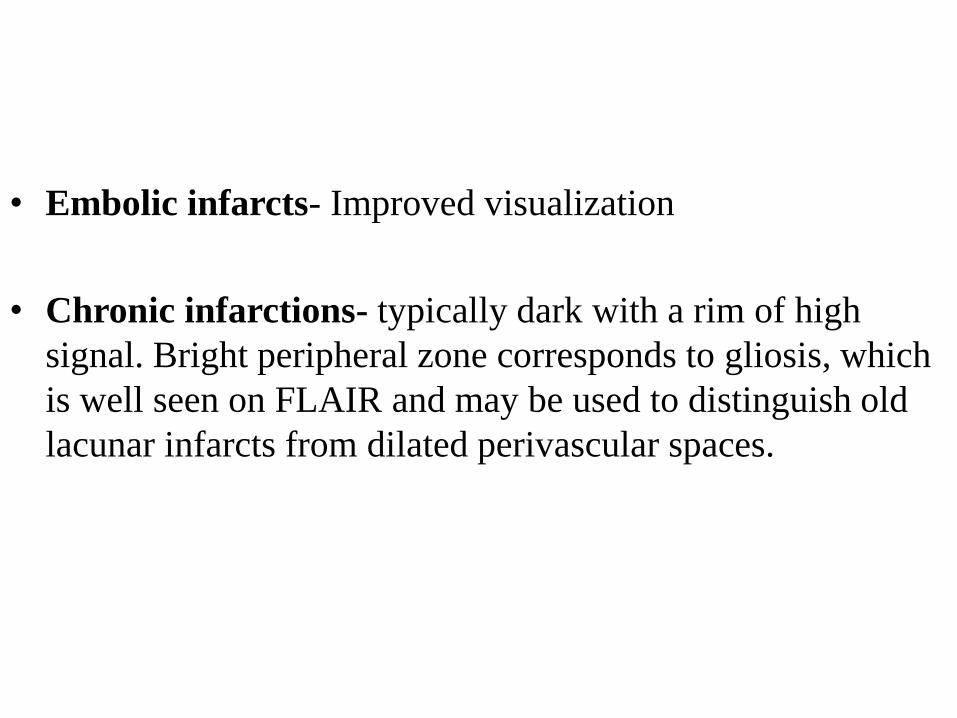
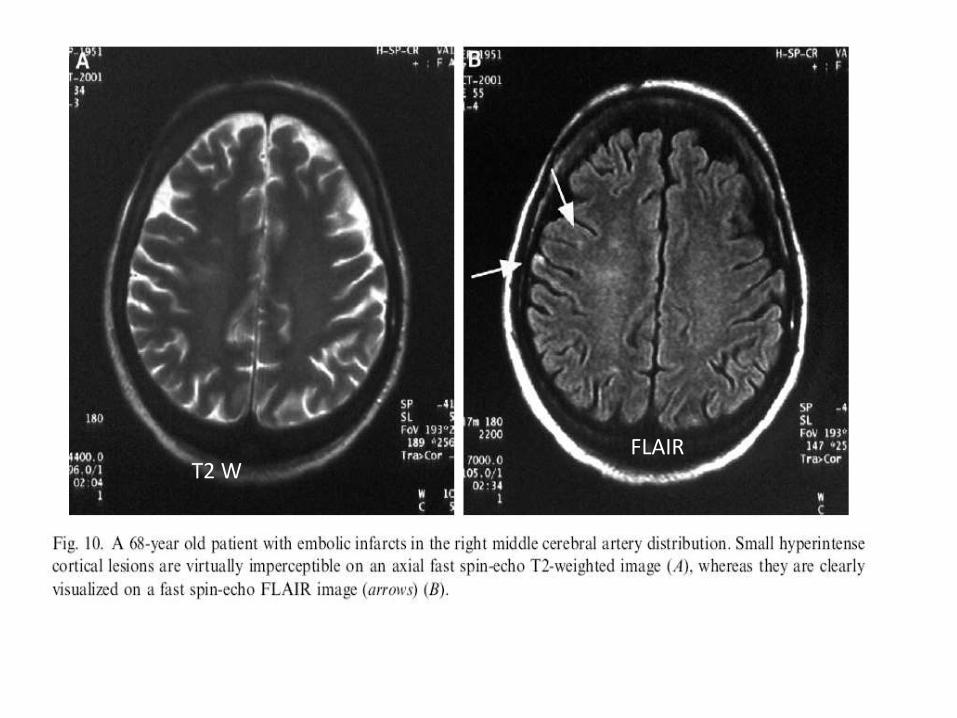
• Embolic infarcts- Improved visualization
• Chronic infarctions- typically dark with a rim of high
signal. Bright peripheral zone corresponds to gliosis, which
is well seen on FLAIR and may be used to distinguish old
lacunar infarcts from dilated perivascular spaces.
T2 WFLAIR
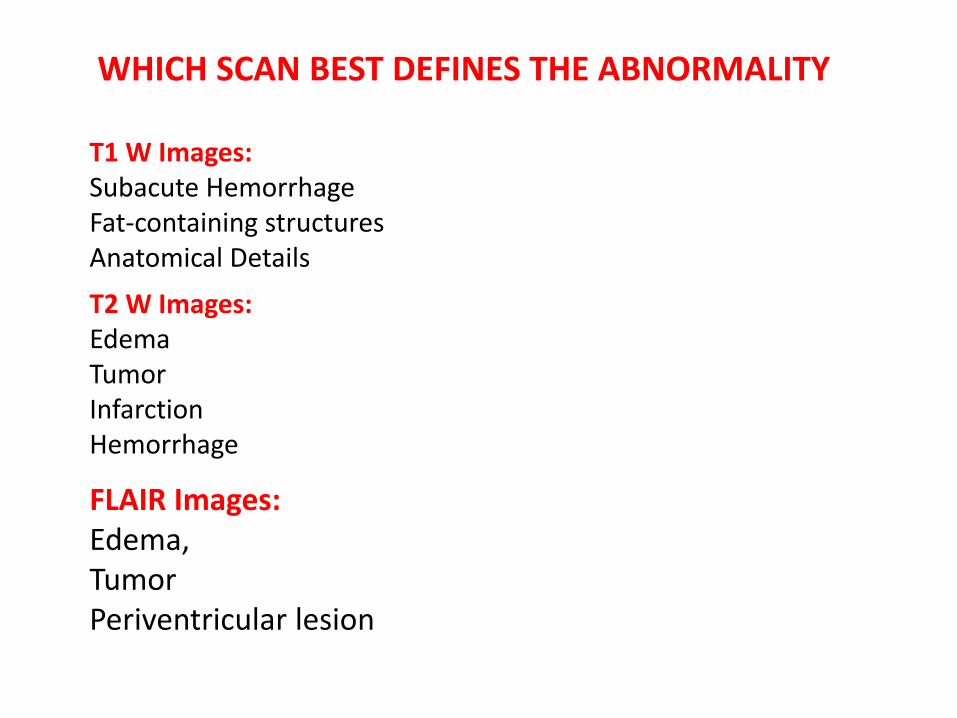
T1 W Images:Subacute HemorrhageFat-containing structuresAnatomical Details
T2 W Images:EdemaTumorInfarctionHemorrhage
FLAIR Images:Edema, TumorPeriventricular lesion
WHICH SCAN BEST DEFINES THE ABNORMALITY
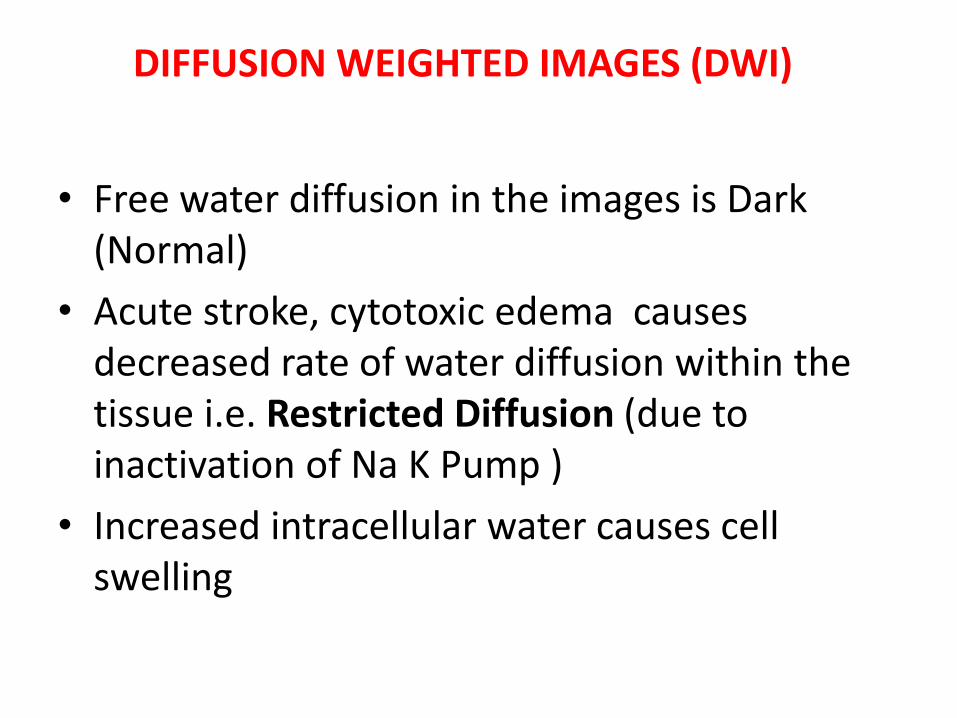
• Free water diffusion in the images is Dark (Normal)
• Acute stroke, cytotoxic edema causes decreased rate of water diffusion within the tissue i.e. Restricted Diffusion (due to inactivation of Na K Pump )
• Increased intracellular water causes cell swelling
DIFFUSION WEIGHTED IMAGES (DWI)
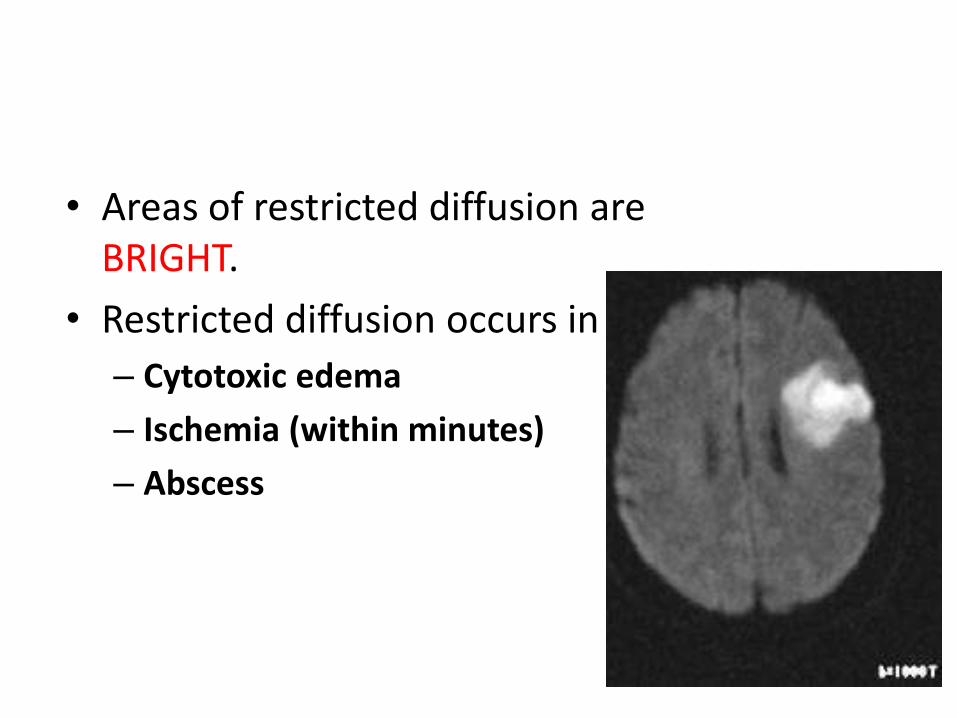
• Areas of restricted diffusion are BRIGHT.
• Restricted diffusion occurs in
– Cytotoxic edema
– Ischemia (within minutes)
– Abscess
Other Causes of Positive DWI
• Bacterial abscess, Epidermoid Tumor
• Acute demyelination
• Acute Encephalitis
• CJD
• T2 shine through ( High ADC)

T2 SHINE THROUGH
• Refers to high signal on DWI images that is not due to restricted diffusion, but rather to high T2 signal which 'shines through' to the DWI image.
• T2 shine through occurs because of long T2 decay time in some normal tissue.
• Most often seen with sub-acute infarctions, due to Vasogenic edema but can be seen in other pathologic abnormalities i.e epidermoid cyst.
• To confirm true restricted diffusion - compare the DWI image to the ADC.
• In cases of true restricted diffusion, the region of increased DWI signal will demonstrate low signal on ADC.
• In contrast, in cases of T2 shine-through, the ADC will be normal or high signal.
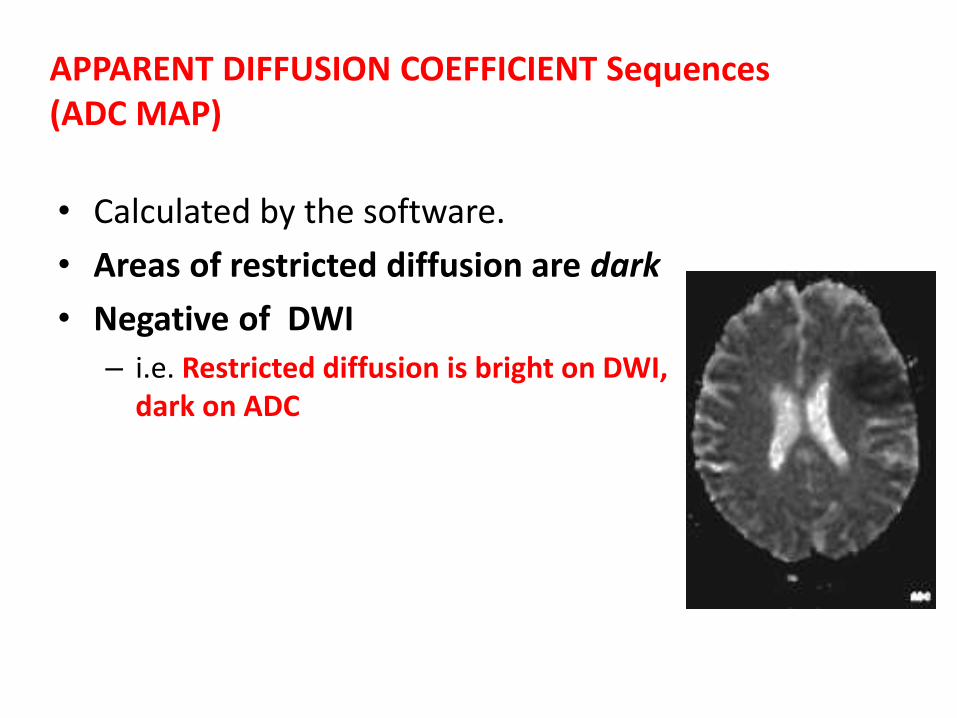
• Calculated by the software.
• Areas of restricted diffusion are dark
• Negative of DWI
– i.e. Restricted diffusion is bright on DWI, dark on ADC
APPARENT DIFFUSION COEFFICIENT Sequences (ADC MAP)
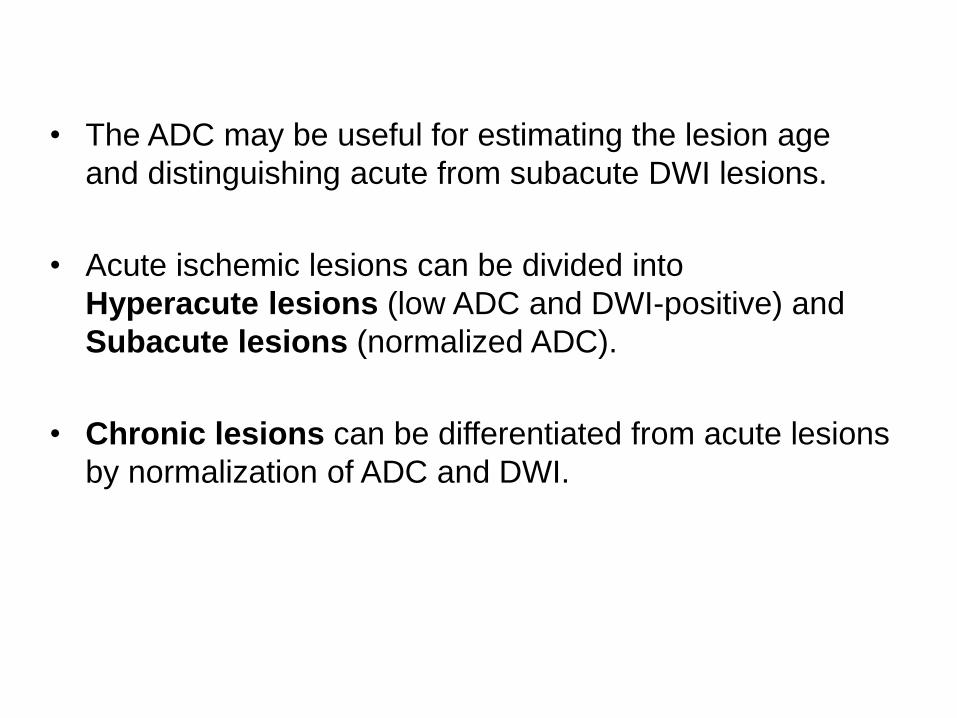
• The ADC may be useful for estimating the lesion age
and distinguishing acute from subacute DWI lesions.
• Acute ischemic lesions can be divided into
Hyperacute lesions (low ADC and DWI-positive) and
Subacute lesions (normalized ADC).
• Chronic lesions can be differentiated from acute lesions
by normalization of ADC and DWI.
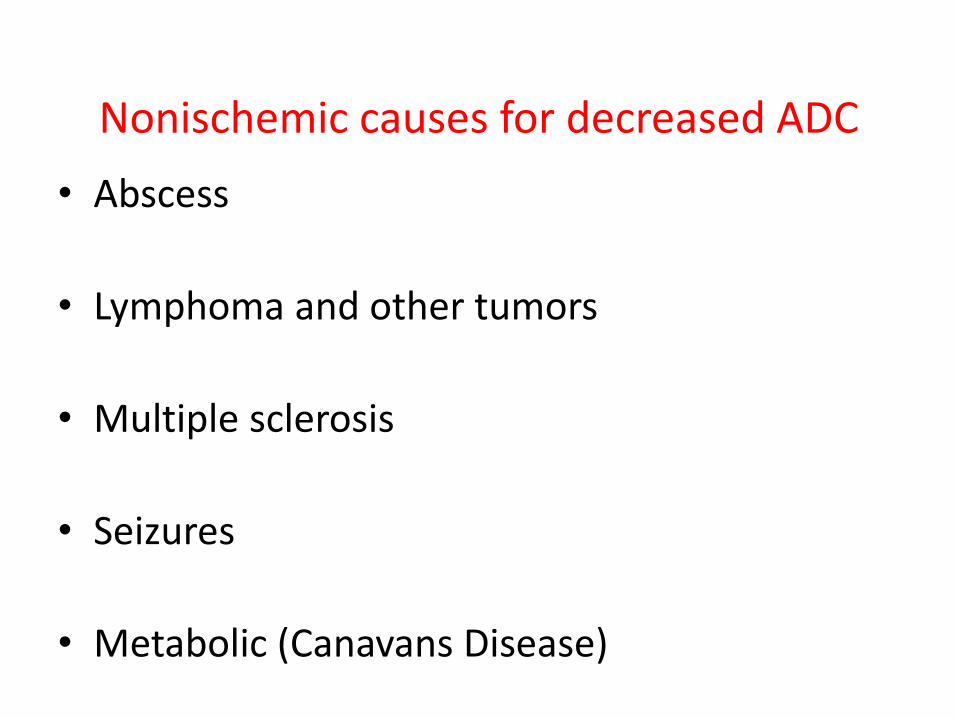
Nonischemic causes for decreased ADC
• Abscess
• Lymphoma and other tumors
• Multiple sclerosis
• Seizures
• Metabolic (Canavans Disease)
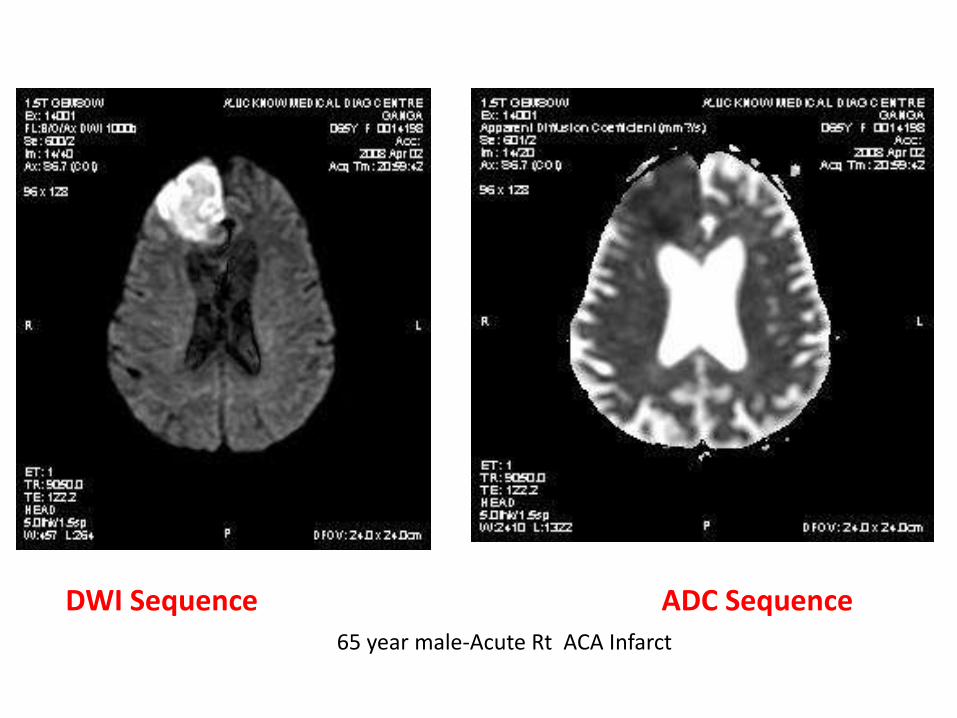
65 year male-Acute Rt ACA Infarct
DWI Sequence ADC Sequence
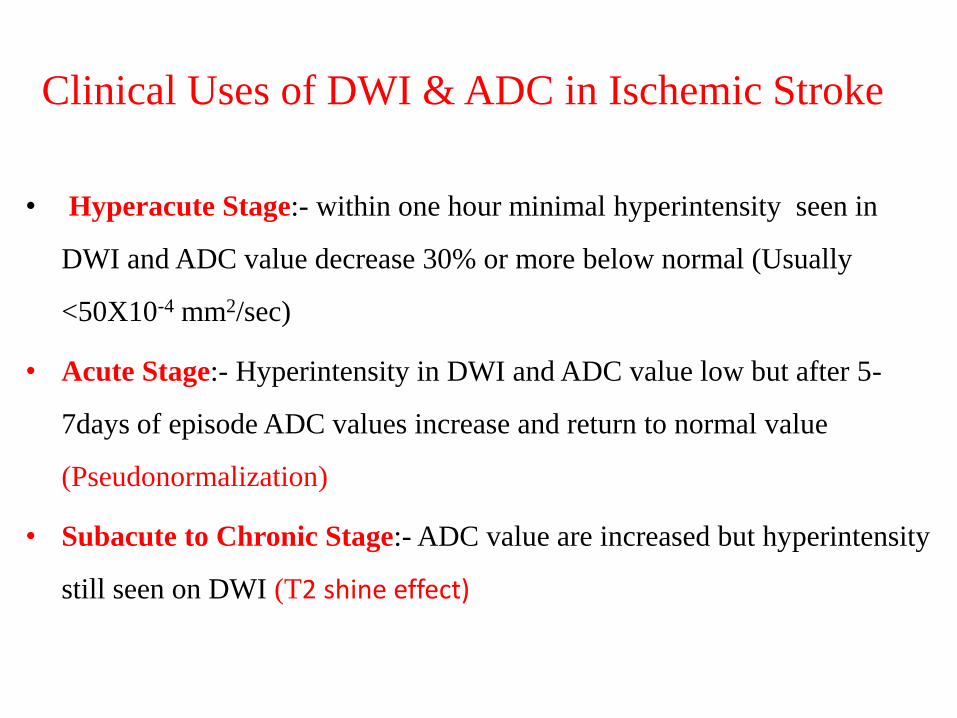
Clinical Uses of DWI & ADC in Ischemic Stroke
• Hyperacute Stage:- within one hour minimal hyperintensity seen in
DWI and ADC value decrease 30% or more below normal (Usually
<50X10-4 mm2/sec)
• Acute Stage:- Hyperintensity in DWI and ADC value low but after 5-
7days of episode ADC values increase and return to normal value
(Pseudonormalization)
• Subacute to Chronic Stage:- ADC value are increased but hyperintensity
still seen on DWI (T2 shine effect)
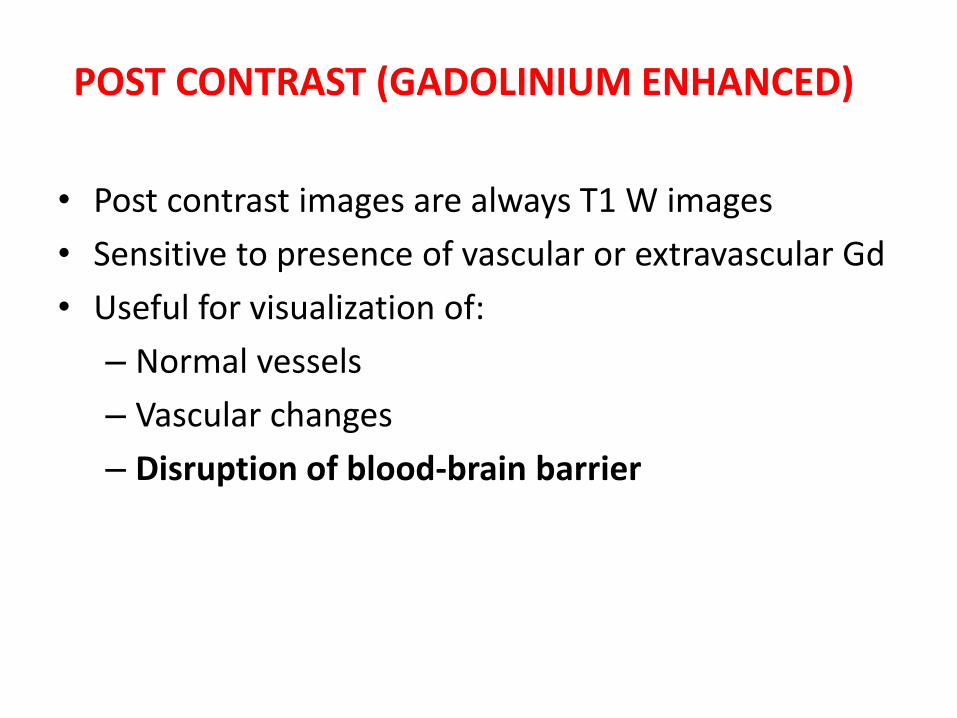
• Post contrast images are always T1 W images
• Sensitive to presence of vascular or extravascular Gd
• Useful for visualization of:
– Normal vessels
– Vascular changes
– Disruption of blood-brain barrier
POST CONTRAST (GADOLINIUM ENHANCED)

MR ANGIOGRAPHY / VENOGRAPHY
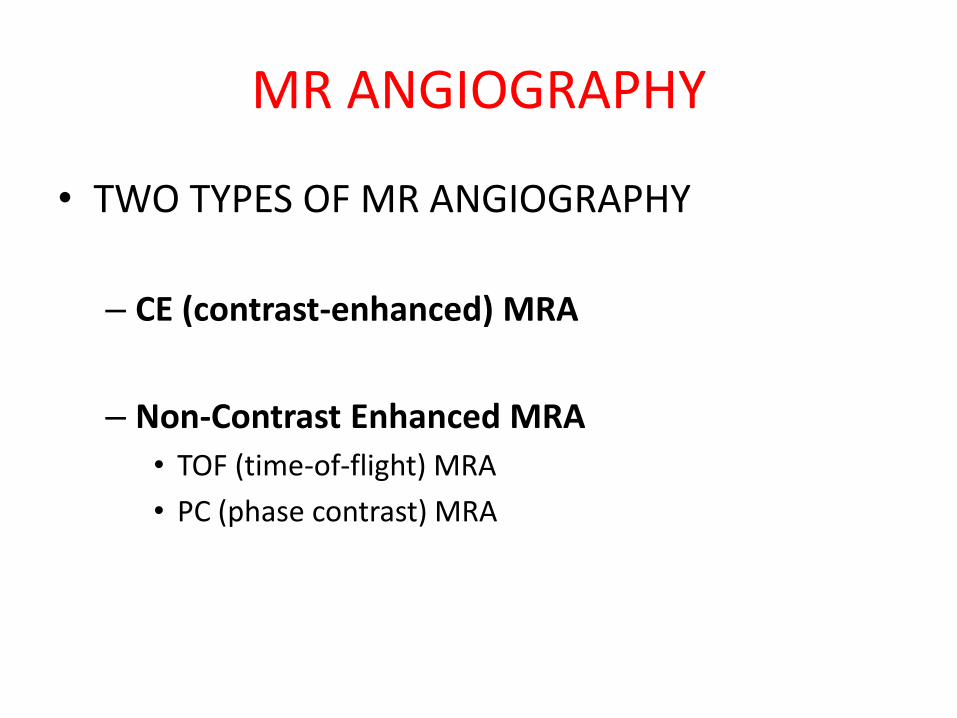
• TWO TYPES OF MR ANGIOGRAPHY
– CE (contrast-enhanced) MRA
– Non-Contrast Enhanced MRA
• TOF (time-of-flight) MRA
• PC (phase contrast) MRA
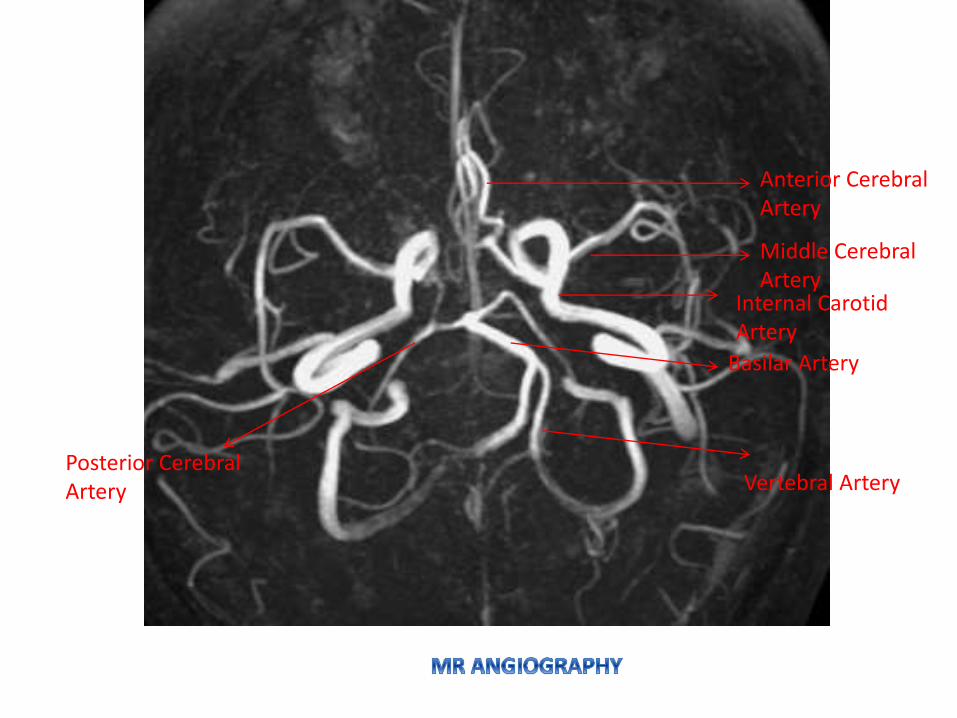
MR ANGIOGRAPHY
CE (CONTRAST ENHANCED) MRA
T1-shortening agent, Gadolinium, injected iv as contrast
Gadolinium reduces T1 relaxation time
When TR<<T1, minimal signal from background tissues
Result is increased signal from Gd containing structures
Faster gradients allow imaging in a single breathhold
CAN BE USED FOR MRA, MRV
FASTER (WITHIN SECONDS)
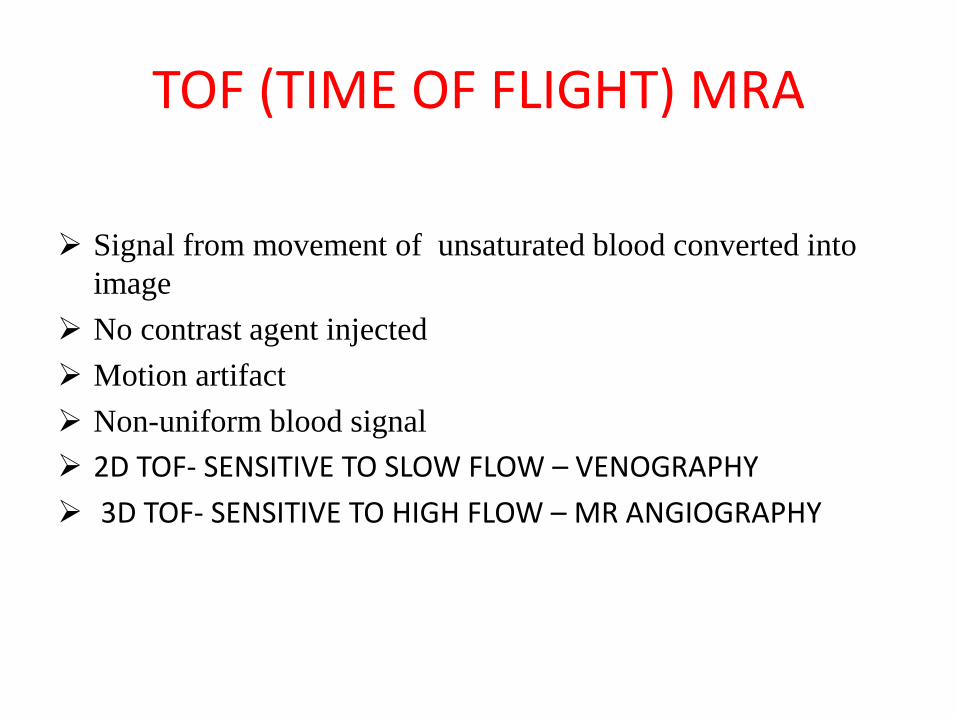
TOF (TIME OF FLIGHT) MRA
Signal from movement of unsaturated blood converted into
image
No contrast agent injected
Motion artifact
Non-uniform blood signal
2D TOF- SENSITIVE TO SLOW FLOW – VENOGRAPHY
3D TOF- SENSITIVE TO HIGH FLOW – MR ANGIOGRAPHY
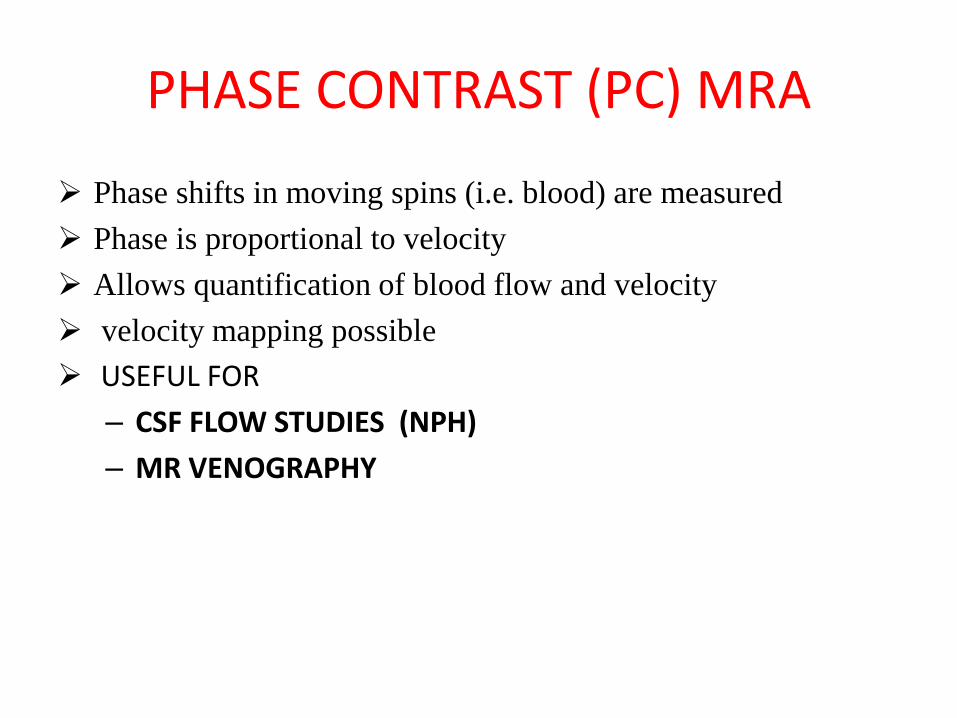
PHASE CONTRAST (PC) MRA
Phase shifts in moving spins (i.e. blood) are measured
Phase is proportional to velocity
Allows quantification of blood flow and velocity
velocity mapping possible
USEFUL FOR
– CSF FLOW STUDIES (NPH)
– MR VENOGRAPHY
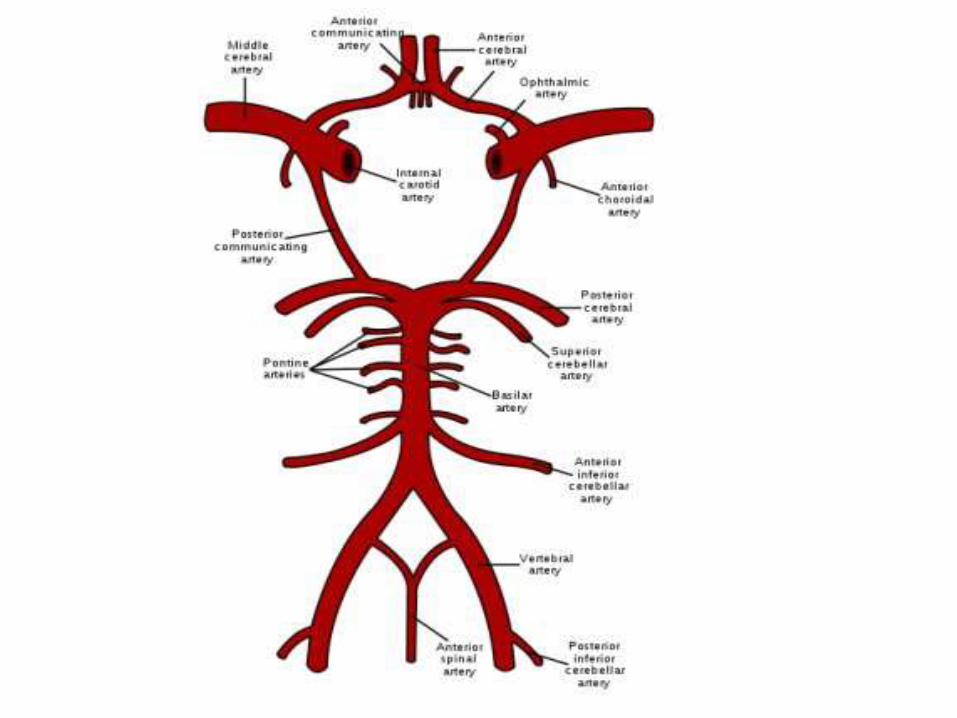

Internal Carotid Artery
Basilar Artery
Vertebral Artery
Middle Cerebral Artery
Anterior Cerebral Artery
Posterior Cerebral Artery
Posterior Inferior Cerebellar Artery
Superior Cerebellar Artery
Anterior Inferior Cerebellar Artery
Vertebral Artery
Basilar Artery
Posterior Cerebral Artery
Internal Carotid Artery
Anterior Cerebral Artery
Middle Cerebral Artery

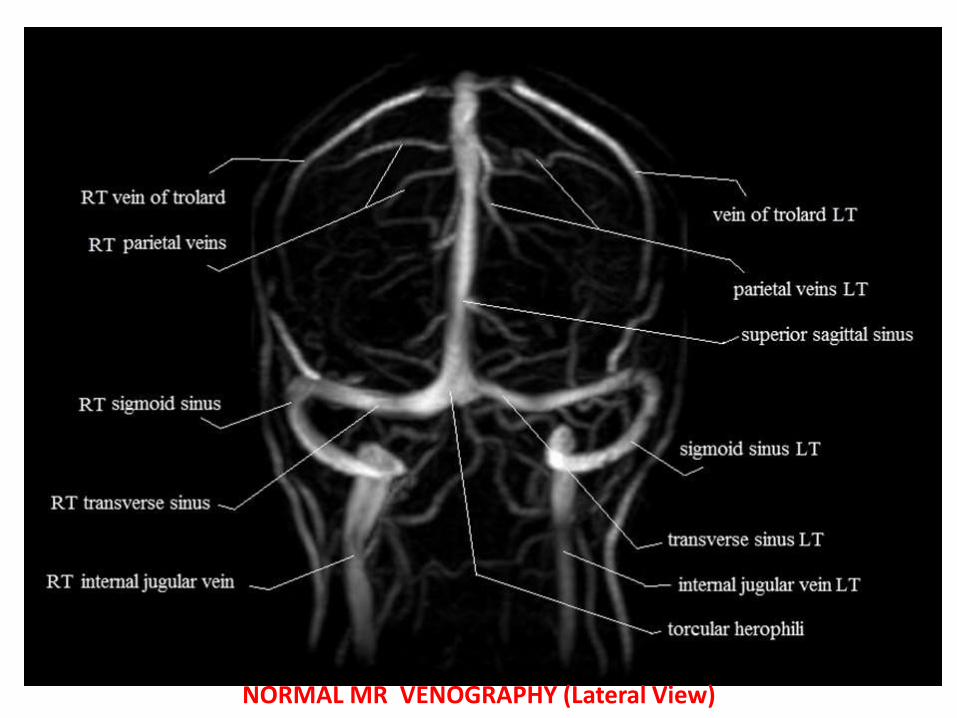
MR VENOGRAPHY

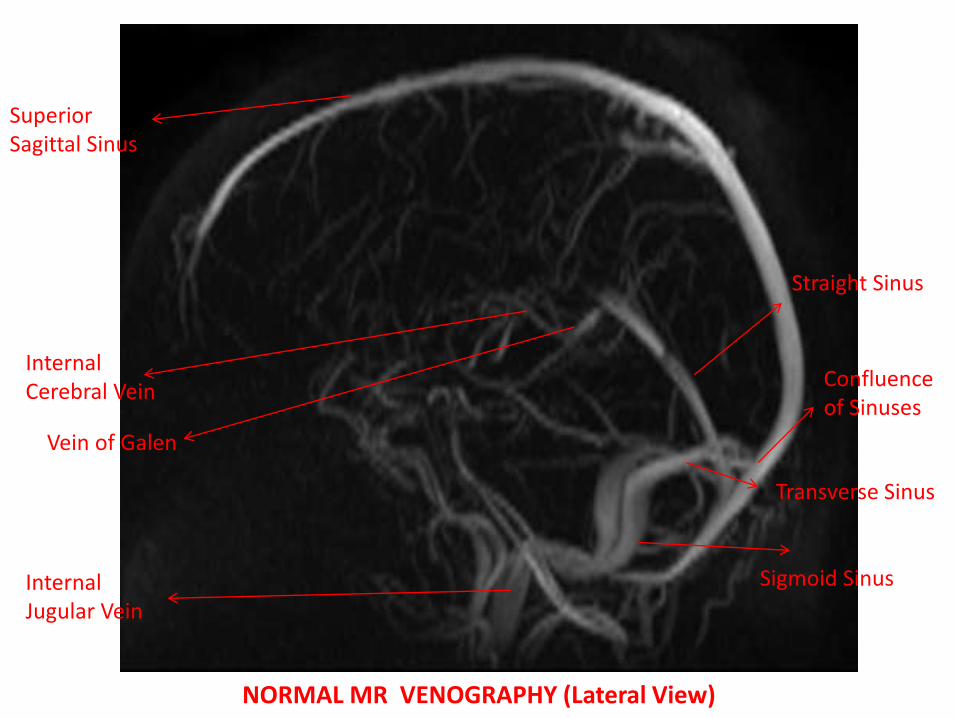
NORMAL MR VENOGRAPHY (Lateral View)
Superior Sagittal Sinus
Internal Jugular Vein
Sigmoid Sinus
Transverse Sinus
Confluence of Sinuses
Straight Sinus
Vein of Galen
Internal Cerebral Vein
NORMAL MR VENOGRAPHY (Lateral View)
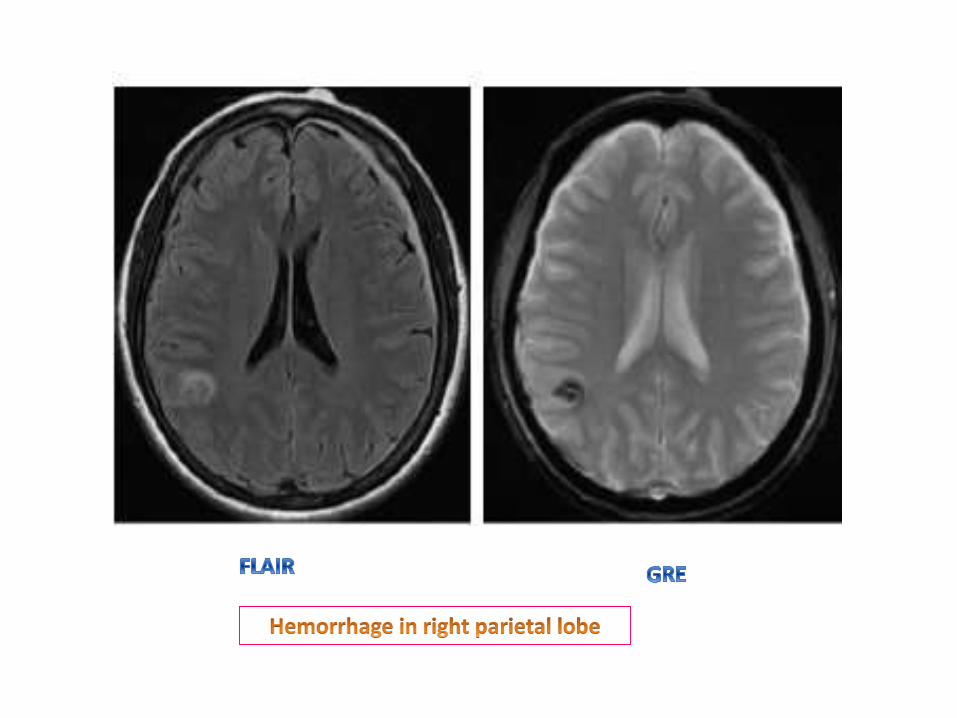
• Form of T2-weighted image which is susceptible to iron, calcium or blood.
• Blood, bone, calcium appear dark
• Areas of blood often appears much larger than reality (BLOOMING)
• Useful for: – Identification of haemorrhage / calcification
Look for: DARK only
GRE Sequences (GRADIENT RECALLED ECHO)

• Non-invasive physiologic imaging of brain that measures relative levels of various tissue metabolites.
• Used to complement MRI in characterization of various tissues.
MR SPECTROSCOPY

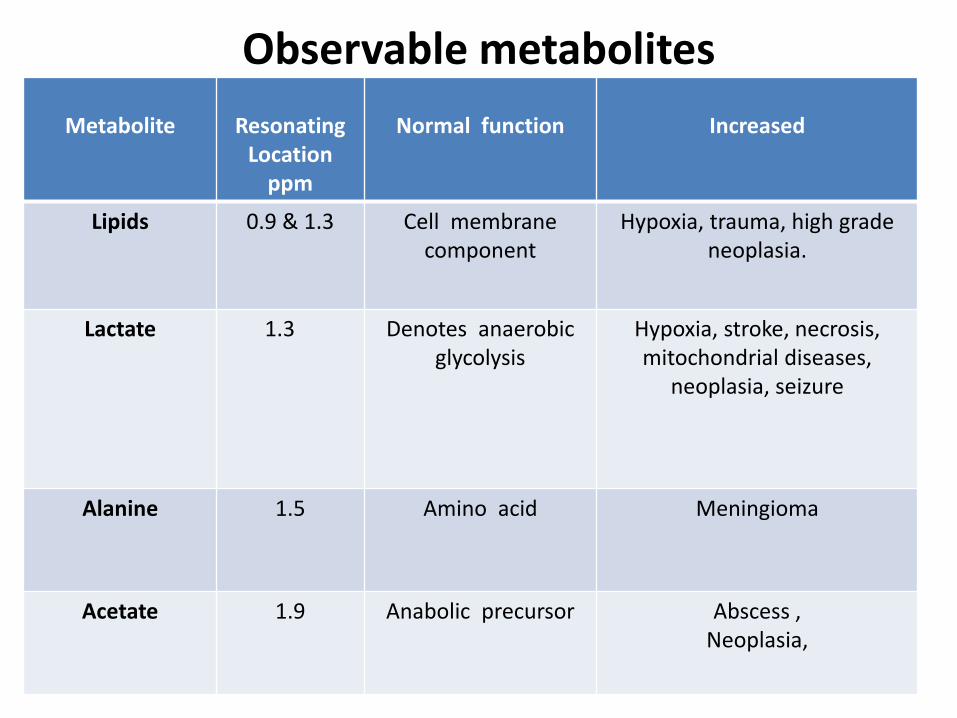
Observable metabolites
Metabolite ResonatingLocation
ppm
Normal function Increased
Lipids 0.9 & 1.3 Cell membranecomponent
Hypoxia, trauma, high grade neoplasia.
Lactate 1.3 Denotes anaerobic glycolysis
Hypoxia, stroke, necrosis, mitochondrial diseases,
neoplasia, seizure
Alanine 1.5 Amino acid Meningioma
Acetate 1.9 Anabolic precursor Abscess ,Neoplasia,
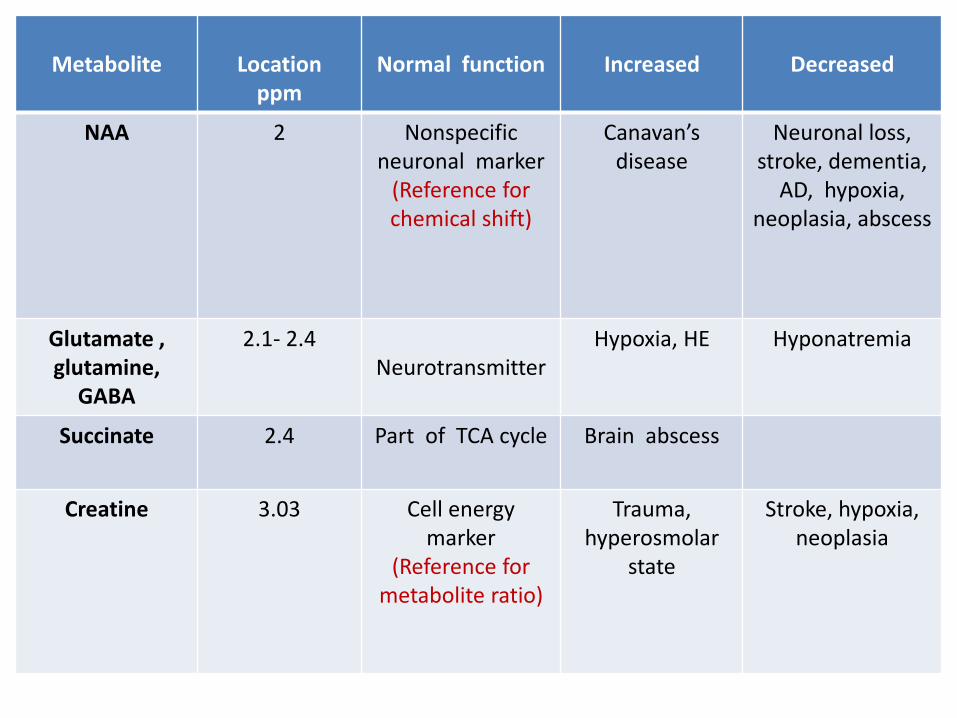
Metabolite Location ppm
Normal function Increased Decreased
NAA 2 Nonspecific neuronal marker
(Reference for chemical shift)
Canavan’sdisease
Neuronal loss,stroke, dementia,
AD, hypoxia, neoplasia, abscess
Glutamate , glutamine,
GABA
2.1- 2.4Neurotransmitter
Hypoxia, HE Hyponatremia
Succinate 2.4 Part of TCA cycle Brain abscess
Creatine 3.03 Cell energy marker
(Reference for metabolite ratio)
Trauma, hyperosmolar
state
Stroke, hypoxia,neoplasia
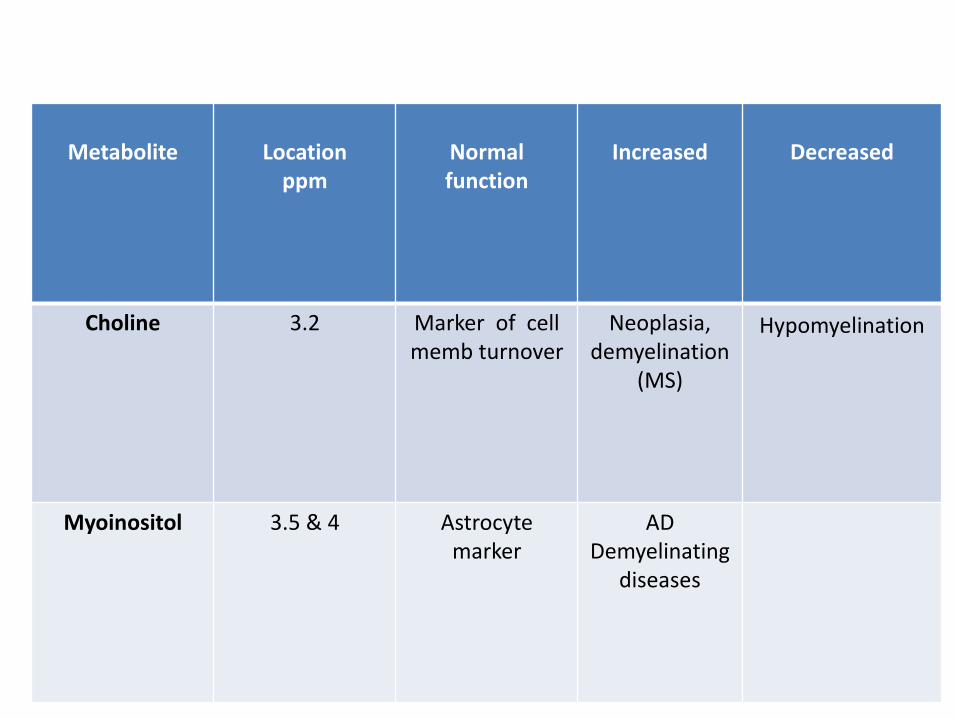
Metabolite Location ppm
Normal function
Increased Decreased
Choline 3.2 Marker of cell memb turnover
Neoplasia, demyelination
(MS)
Hypomyelination
Myoinositol 3.5 & 4 Astrocytemarker
ADDemyelinating
diseases
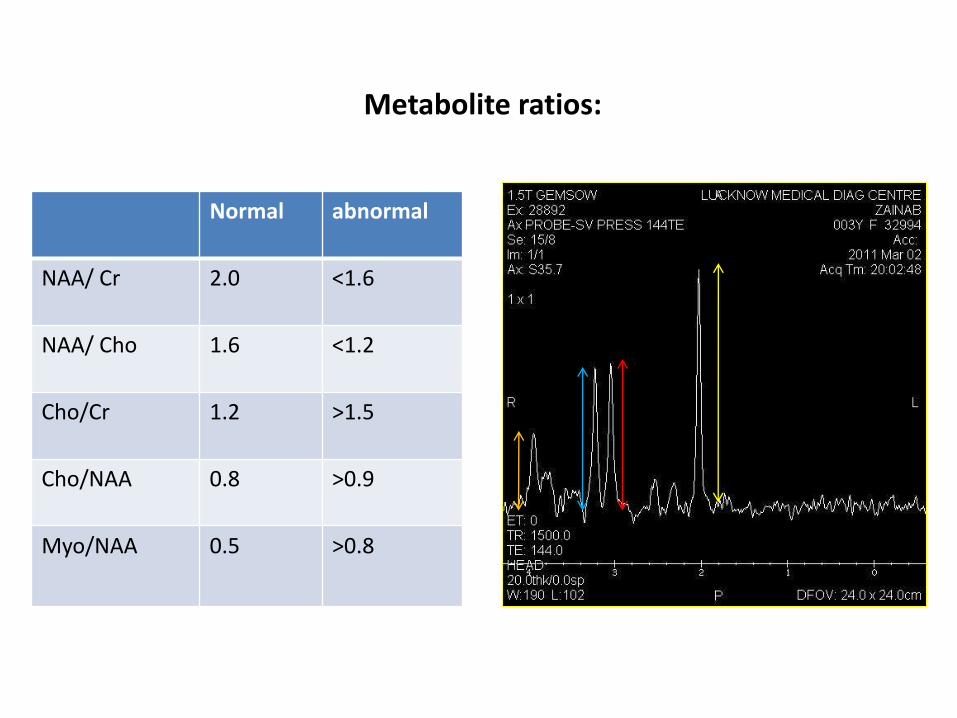
Metabolite ratios:
Normal abnormal
NAA/ Cr 2.0 <1.6
NAA/ Cho 1.6 <1.2
Cho/Cr 1.2 >1.5
Cho/NAA 0.8 >0.9
Myo/NAA 0.5 >0.8

MRS
Dec NAA/CrInc acetate,
succinate, amino acid, lactate
Neuodegenerative
Alzheimer
Dec NAA/CrDec NAA/
ChoInc
Myo/NAA
Slightly inc Cho/ CrCho/NAA
Normal Myo/NAA± lipid/lactate
Inc Cho/CrMyo/NAACho/NAA
Dec NAA/Cr± lipid/lactate
MalignancyDemyelinating
disease Pyogenicabscess
• ICSOLs
• Differentiate Neoplasms from NonneoplasticBrain Masses
• Radiation Necrosis versus Recurrent Tumor
• Inborn Errors of Metabolism
• RESEARCH PURPOSE FOR NEURODEGENERATIVE DISEASES
MRS APPLICATION
Perfusion is the process of nutritive delivery of arterial
blood to a capillary bed in the biological tissue
means that the tissue is not getting
enough blood with oxygen and nutritive elements
(ischemia)
means neoangiogenesis – increased
capillary formation (e.g. tumor activity)
PERFUSION STUDIES

Stroke
Detection and assessment of ischemic stroke
(Lower perfusion )
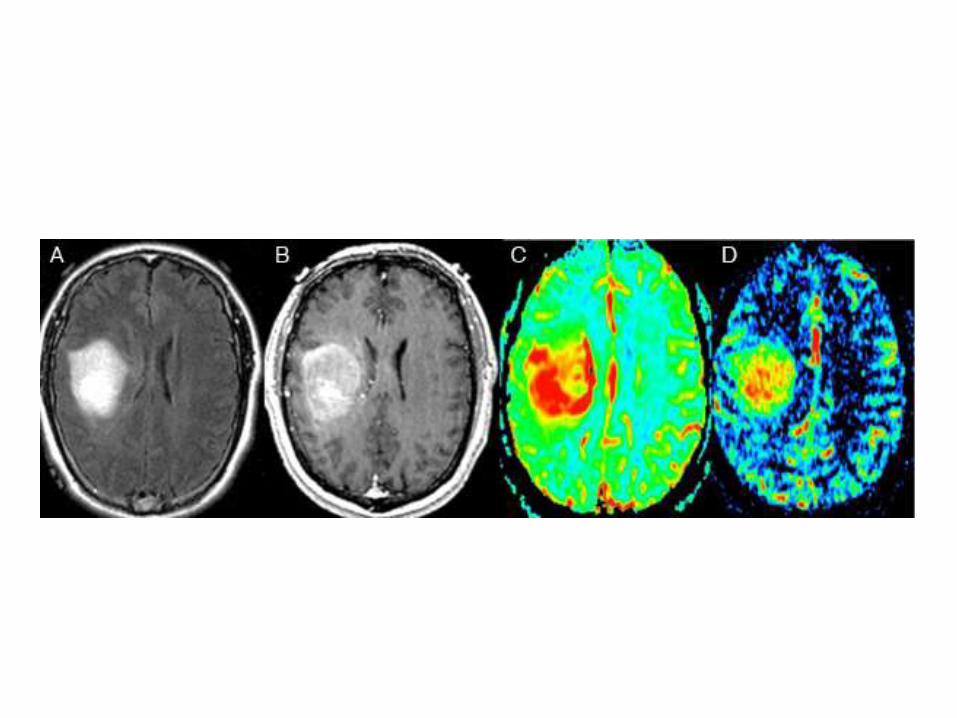
Tumors
Diagnosis, staging, assessment of
tumour grade and prognosis
Treatment response
Post treatment evaluation
Prognosis of therapy effectiveness
(Higher perfusion)
APPLICATIONS OF PERFUSION IMAGING
REFERENCES• CT and MRI of the whole body – John R Haaga (5th
edition)
• Osborne Brain : Imaging, Pathology and Anatomy
• Neurologic Clinics (Neuroimaging) : February 2009, volume 27
• Bradley ‘s Neurology in Clinical Practice (6th edition)
• Adams and Victor’s: Principles of Neurology (10th
edition)
• Understanding MRI : basic MR physics : Stuart Currie et al : BMJ 2012
• Harrison’s textbook of Internal Medicine (18th
edition)

THANK YOU
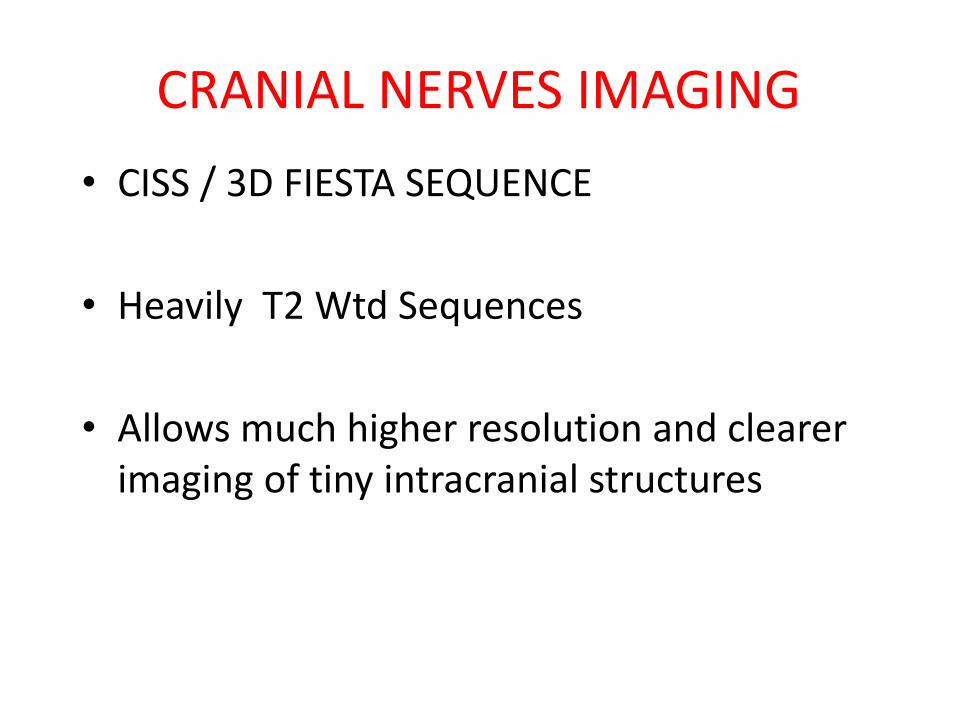
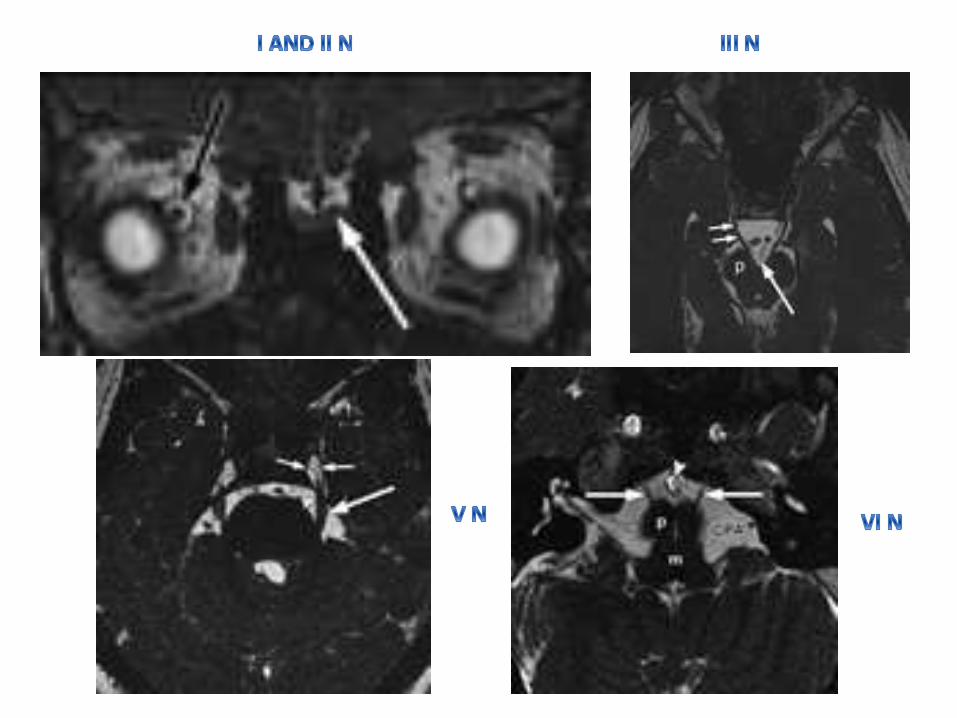
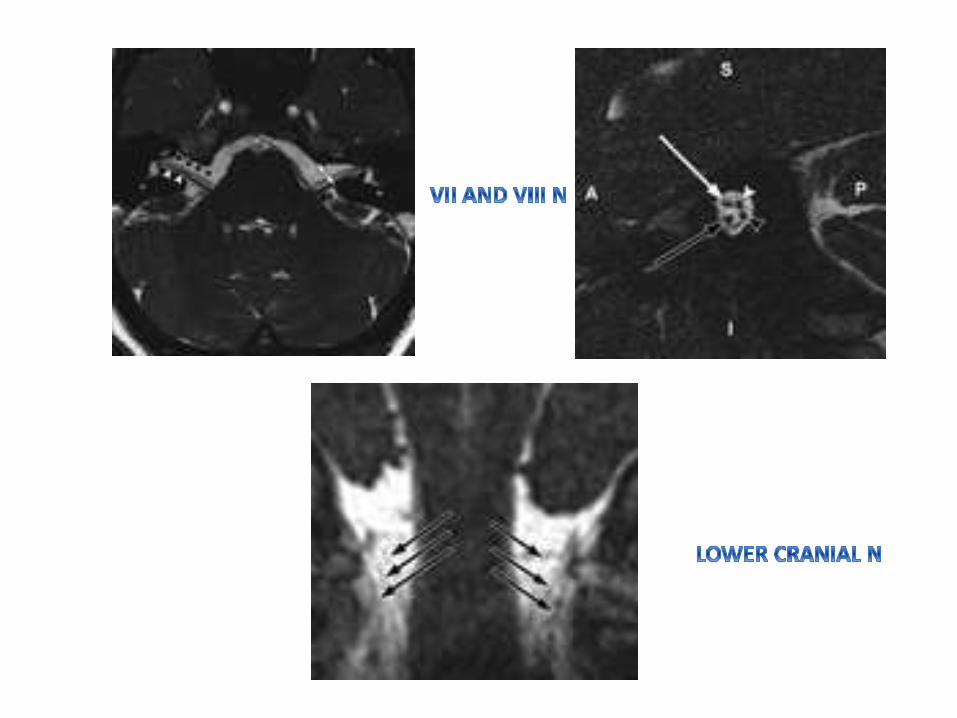
• CISS / 3D FIESTA SEQUENCE
• Heavily T2 Wtd Sequences
• Allows much higher resolution and clearer imaging of tiny intracranial structures
CRANIAL NERVES IMAGING

MAGNETIZATION TRANSFER (MT) MRI
• MT is a recently developed MR technique that alters contrast
of tissue on the basis of macromolecular environments.
• MTC is most useful in two basic area, improving image
contrast and tissue characterization.
• MT is accepted as an additional way to generate unique
contrast in MRI that can be used to our advantage in a variety
of clinical applications.
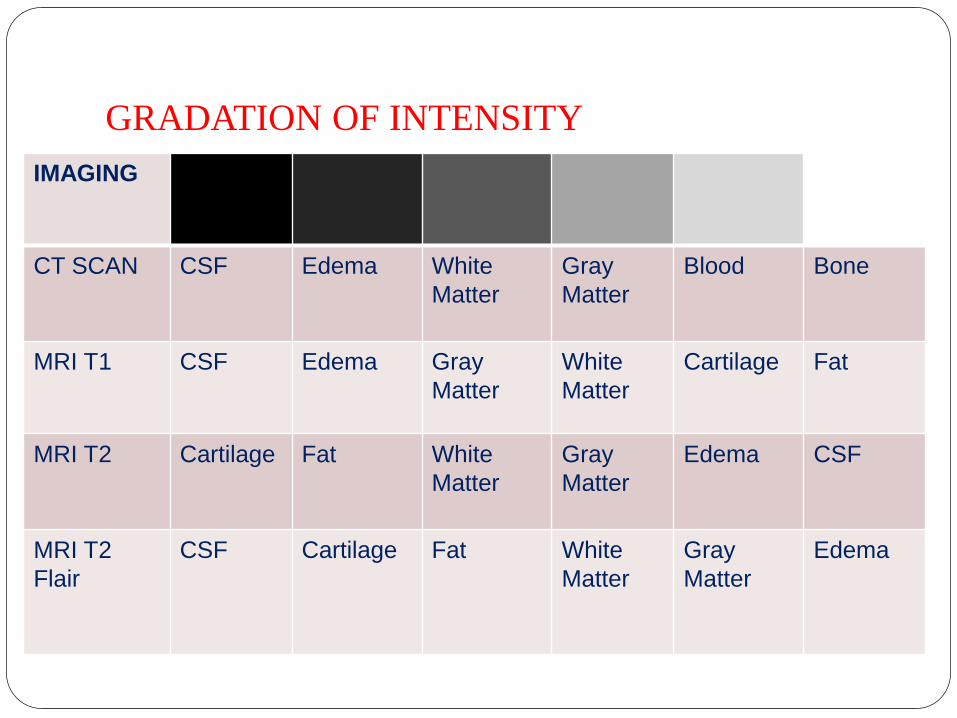
GRADATION OF INTENSITY
IMAGING
CT SCAN CSF Edema White
Matter
Gray
Matter
Blood Bone
MRI T1 CSF Edema Gray
Matter
White
Matter
Cartilage Fat
MRI T2 Cartilage Fat White
Matter
Gray
Matter
Edema CSF
MRI T2
Flair
CSF Cartilage Fat White
Matter
Gray
Matter
Edema
Related Documents