Normal modes for predicting protein motions: A comprehensive database assessment and associated Web tool VADIM ALEXANDROV, URSULA LEHNERT, NATHANIEL ECHOLS, DUNCAN MILBURN, DONALD ENGELMAN, AND MARK GERSTEIN Department of Molecular Biophysics and Biochemistry, Yale University, New Haven, Connecticut 06520, USA (RECEIVED June 11, 2004; FINAL REVISION November 4, 2004; ACCEPTED November 5, 2004) Abstract We carry out an extensive statistical study of the applicability of normal modes to the prediction of mobile regions in proteins. In particular, we assess the degree to which the observed motions found in a compre- hensive data set of 377 nonredundant motions can be modeled by a single normal-mode vibration. We describe each motion in our data set by vectors connecting corresponding atoms in two crystallographically known conformations. We then measure the geometric overlap of these motion vectors with the displace- ment vectors of the lowest-frequency mode, for one of the conformations. Our study suggests that the lowest mode contains useful information about the parts of a protein that move most (i.e., have the largest amplitudes) and about the direction of this movement. Based on our findings, we developed a Web tool for motion prediction (available from http://molmovdb.org/nma) and apply it here to four representative mo- tions—from bacteriorhodopsin, calmodulin, insulin, and T7 RNA polymerase. In the analysis of protein dynamics, an important goal is the description of slow large-amplitude motions. These mo- tions, while strongly damped, typically describe conforma- tional changes which are essential for the functioning of proteins. Only global collective motions can significantly change the exposed surface of the protein and hence in- fluence interactions with its environment. Such structural rearrangements in the protein can occur on a local level within a single domain or can involve large movements of protein domains in a multidomain protein. Protein dynamics thus cover a broad timescale: 10 -14 –10 sec (Wilcox et al. 1988). However, many large-amplitude conformational changes are not on a timescale accessible by most time- dependent theoretical methods, such as phase space sam- pling techniques (e.g., molecular dynamics). Therefore, in order to gain insight into the mechanism of slow, large- amplitude motions, one must resort to the use of a time- independent approach, such as normal mode analysis (Lev- itt et al. 1985). Normal mode analysis (NMA) is a fast and simple method to calculate vibrational modes and protein flexibil- ity. In NMA, sometimes restrained to C atoms only, the atoms are modeled as point masses connected by springs, which represent the interatomic force fields. One particular type of NMA is the elastic network model. In this model, the springs connecting each node to all other neighboring nodes are of equal strength, and only the atom pairs within a cutoff distance are considered. All existing NMA techniques have important common limitations resulting from the use of the harmonic approxi- mation, the neglect of solvent damping, and the absence of information about energy barriers and multiple minima on the potential energy surface (Elber and Karplus 1987; Frauenfelder et al. 1988; Hong et al. 1990). In fact, the most interesting biologically significant low-frequency motions in a realistic environment are overdamped and hence not vibrational at all, rendering the corresponding normal mode frequencies of little physical significance (Go et al. 1983; Reprint requests to: Mark Gerstein, Department of Molecular Biophysics and Biochemistry, 266 Whitney Avenue, Yale University, New Haven, CT 06520, USA; e-mail: [email protected]; fax: (360) 838-7861. Article and publication are at http://www.proteinscience.org/cgi/doi/ 10.1110/ps.04882105. Protein Science (2005), 14:633–643. Published by Cold Spring Harbor Laboratory Press. Copyright © 2005 The Protein Society 633

Welcome message from author
This document is posted to help you gain knowledge. Please leave a comment to let me know what you think about it! Share it to your friends and learn new things together.
Transcript

Normal modes for predicting protein motions:A comprehensive database assessment andassociated Web tool
VADIM ALEXANDROV, URSULA LEHNERT, NATHANIEL ECHOLS,DUNCAN MILBURN, DONALD ENGELMAN, AND MARK GERSTEINDepartment of Molecular Biophysics and Biochemistry, Yale University, New Haven, Connecticut 06520, USA
(RECEIVED June 11, 2004; FINAL REVISION November 4, 2004; ACCEPTED November 5, 2004)
Abstract
We carry out an extensive statistical study of the applicability of normal modes to the prediction of mobileregions in proteins. In particular, we assess the degree to which the observed motions found in a compre-hensive data set of 377 nonredundant motions can be modeled by a single normal-mode vibration. Wedescribe each motion in our data set by vectors connecting corresponding atoms in two crystallographicallyknown conformations. We then measure the geometric overlap of these motion vectors with the displace-ment vectors of the lowest-frequency mode, for one of the conformations. Our study suggests that the lowestmode contains useful information about the parts of a protein that move most (i.e., have the largestamplitudes) and about the direction of this movement. Based on our findings, we developed a Web tool formotion prediction (available from http://molmovdb.org/nma) and apply it here to four representative mo-tions—from bacteriorhodopsin, calmodulin, insulin, and T7 RNA polymerase.
In the analysis of protein dynamics, an important goal is thedescription of slow large-amplitude motions. These mo-tions, while strongly damped, typically describe conforma-tional changes which are essential for the functioning ofproteins. Only global collective motions can significantlychange the exposed surface of the protein and hence in-fluence interactions with its environment. Such structuralrearrangements in the protein can occur on a local levelwithin a single domain or can involve large movements ofprotein domains in a multidomain protein. Protein dynamicsthus cover a broad timescale: 10−14–10 sec (Wilcox et al.1988). However, many large-amplitude conformationalchanges are not on a timescale accessible by most time-dependent theoretical methods, such as phase space sam-pling techniques (e.g., molecular dynamics). Therefore, inorder to gain insight into the mechanism of slow, large-
amplitude motions, one must resort to the use of a time-independent approach, such as normal mode analysis (Lev-itt et al. 1985).
Normal mode analysis (NMA) is a fast and simplemethod to calculate vibrational modes and protein flexibil-ity. In NMA, sometimes restrained to C� atoms only, theatoms are modeled as point masses connected by springs,which represent the interatomic force fields. One particulartype of NMA is the elastic network model. In this model,the springs connecting each node to all other neighboringnodes are of equal strength, and only the atom pairs withina cutoff distance are considered.
All existing NMA techniques have important commonlimitations resulting from the use of the harmonic approxi-mation, the neglect of solvent damping, and the absence ofinformation about energy barriers and multiple minima onthe potential energy surface (Elber and Karplus 1987;Frauenfelder et al. 1988; Hong et al. 1990). In fact, the mostinteresting biologically significant low-frequency motionsin a realistic environment are overdamped and hence notvibrational at all, rendering the corresponding normal modefrequencies of little physical significance (Go et al. 1983;
Reprint requests to: Mark Gerstein, Department of Molecular Biophysicsand Biochemistry, 266 Whitney Avenue, Yale University, New Haven, CT06520, USA; e-mail: [email protected]; fax: (360) 838-7861.
Article and publication are at http://www.proteinscience.org/cgi/doi/10.1110/ps.04882105.
Protein Science (2005), 14:633–643. Published by Cold Spring Harbor Laboratory Press. Copyright © 2005 The Protein Society 633

Kottalam and Case 1990; Horiuchi and Go 1991; Amadei etal. 1993). Therefore, the identification and characterizationof low-frequency domain motions by using NMA mightseem questionable. Nevertheless, comparisons of low-fre-quency normal modes and the directions of large-amplitudefluctuations in molecular dynamics simulations indicateclear similarities (Amadei et al. 1993; Hayward et al. 1997).Close directional coincidence of the lowest normal modeaxes and the first principal component axes obtained frommolecular dynamic simulations has been observed (Hay-ward et al. 1997). In addition, the axes of the first modeswere found to be overwhelmingly closure axes. A lesserdegree of correspondence was observed for the secondmodes.
It has also been shown that the low-frequency modesdescribing the large-scale real-world motions of a proteincan be related to fundamental biological characteristics(Brooks and Karplus 1985; Thomas et al. 1999). For ex-ample, Bahar and Jernigan (1998) successfully analyzed thevibrational dynamics of transfer RNAs, both free and com-plexed with the cognate synthetase, using the elastic net-work model. They examined the global mode of motion oftRNAGln complexed with glutaminyl-tRNA synthetase,and established that certain residues that cluster near theATP binding site form a hinge-bending region controllingthe cooperative motion and thereby the catalytic function ofthe enzyme. Normal modes have been successfully used todisplay concerted motions of proteins (Noguti and Go 1982;Brooks and Karplus 1983; Go et al. 1983; Levy et al. 1984;Levitt et al. 1985; Henry et al. 1986), including slow mo-tions between protein domains as in the hinge-bending mo-tion of lysozyme (Brooks and Karplus 1985; Gibrat and Go1990). It was recently shown that the first step of the gatingmechanism in the mechanosensitive channel (MscL) can bedescribed with only the three lowest-frequency modes(Valadie et al. 2003). Those results clearly indicate thatthe movement associated with these modes is an iris-likemovement involving both tilts and twists. Several otherworks showed that low-frequency modes overlap with realconformational changes (Thomas et al. 1999; Tama andSanejouand 2001). There is also evidence to suggest thatproper, symmetric normal mode vibration of binding pock-ets is crucial to correct biological activity in some proteins(Thomas et al. 1996a,b; Hinsen 1998).
Experimental data on protein motions from incoherentneutron scattering and resulting observations of the densityof states were also found to agree with simulations (Smith etal. 1987; Cusack et al. 1988). In particular, inelastic neutronscattering spectra have resolved the density of states formyoglobin in the low-frequency regime at room tempera-ture (Cusack and Doster 1990). Site-selective fluorescencespectroscopy of Zn-substituted myoglobin has obtained thisdensity without the use of model shape functions (Ahn et al.1993). Resonance Raman spectra generated by psec laser
pulses have also been interpreted by analyzing relaxation ofprotein normal modes (Alden et al. 1992).
Despite the large body of successful NMA applications inprotein dynamics studies, both theoretical and experimentalnormal modes have only been compared to actual motionson a case-by-case basis. Few analyses have attempted to dothis comprehensively in a database framework. Thus, theneed for statistical assessment of the overall reliability andapplicability of NMA to the description of various aspectsof protein motion becomes apparent. In our previous work(Krebs et al. 2002) we performed a large-scale databasestudy of molecular motions within the MolMovDB (Ger-stein and Krebs 1998; Krebs and Gerstein 2000; Echols etal. 2003) framework. The results indicate that the lowest-frequency normal mode contributes the most to the decom-position of the real (observed) motion in a linear combina-tion of the first 20 normal modes, in agreement with thefindings mentioned above. In the present work, we asked towhat degree the direction of the observed motion, describedby vectors connecting corresponding atoms of a protein inits initial and final conformation, coincides with the dis-placement vectors of the lowest normal modes for the initialconformation. Since structure pairs may not always beavailable, the other main motivation behind this work was todevelop an easy-to-use motion prediction technique capableof assessing the direction of the actual protein motion.
Therefore, we constructed a comprehensive set of ob-served nonredundant molecular motions which we used toassess the quality of NMA predictions. If structures of twoalternative conformations (one assigned to be “initial” andthe other, “final”) are known, a direct comparison can bedone between the difference vector of the two conforma-tions and the calculated displacement vector of the lowestnormal mode. Our results suggest that the top 2%–3% of themost significant interdomain movements in a protein cannevertheless be modeled successfully by a set of the corre-sponding lowest normal mode displacement vectors. Wedeveloped ab initio selection criteria based on either indirectexperimental evidence (B-factors) or structural variabilitywithin the corresponding fold family (in the multiple struc-tural alignment sense) to single out those NMA displace-ment vectors that accurately model the most mobile parts ofthe molecule. Since portions of the molecule moving themost usually represent the most “biologically interesting”parts in a protein and normally serve as an approximatedescription of the overall motion, the goal of obtaining a fastqualitative prediction of the overall motion has beenachieved.
Results and Discussion
Constructing a new set of nonredundant motions
The set of all chain sequences (∼33,000 entries) extractedfrom all crystallographically determined proteins deposited
Alexandrov et al.
634 Protein Science, vol. 14

in the PDB was subjected to all-versus-all sequence align-ment using the FASTA program (Pearson and Lipman1988). The pairs with greater than 99% identity (∼700,000pairs) were selected for the initial pool of tentative motions.Structural alignment for this set of tentative structure pairswas performed using the Least Square Fit (LSQ) method toselect pairs with root-mean-squared deviation (RMSD)greater than 1.5 Å. To achieve an optimal superposition ofthe two structures, we used our in-house structural align-ment routine, which finds the solution for the parameters ofthe RMSD-minimizing rotation matrix (RM) as suggestedby Kabsch (1976). This RMSD value was used to select thefinal (comprehensive) set of structures within the chosenRMSD cutoff of 1.5 Å.
In this comprehensive set of 13,571 structure pairs,11,217 were successfully “morphed,” i.e., a motion pathwaycould be constructed by the morph server. From those, 7467were located in the CATH database (Orengo et al. 1997) bytheir PDB and chain identifiers (Fig. 2). Morphs falling intothe same near-identical CATH level (defined as all se-quences with 99% identity) were taken and examined col-lectively to identify a single best representative morph.Where possible, structure pairs with one domain missingwere discarded and the groupings were further reduced bytaking only those pairs with sequence length greater than themean for each set, thus eliminating truncated proteins. Fi-nally, the morph with the median overall RMSD betweenthe initial and final frames was selected as the representativeentry. In those families where the set was too small toperform this procedure, the morph with the highest RMSD(and in some cases, the only available morph) was selectedby default. Thus the final (nonredundant) set of 377 morphshad no more than 95% sequence identity between any twoentries. These morphs, in the context of the overall CATHschema, are displayed at http://molmovdb.org/nma.
We calculated a histogram of RMSD values for our newnonredundant set of motion pairs (Fig. 3). It shows thatmore than 90% of the RMSD values lie in the 1.5–5.5 Åinterval.
Statistical analysis of NMA directionalcorrelations with observed motions
We used an average correlation cosine squared, which wefurther refer to as the S-statistic (equation 4), as an overallquantitative measure of the NMA predicted motions. Thisquantity simply reflects the degree of average directionalsimilarity between the observed motion vectors and the nor-mal mode displacement vectors. The larger values of S cor-respond to the lower average angle between the two sets ofvectors.
First, we calculated the value of S and S2 for each motionpair in our data set, and plotted histograms of these values(Figs. 4, 5). The S2 statistic appears to be useful because thecorresponding values of the average angle are mapped more
Figure 1. Notations used in the paper. Rij is the vector connecting atom ito atom j in the experimental (initial) structure. �j is the difference vectorbetween atom i in the displaced (final) structure and the same atom in theinitial structure. Dj is the lowest normal mode displacement vector for atomj in the initial conformation. �j is the angle between vectors Dj and �j foratom j.
Figure 2. An illustration of the scheme that was used to identify the dataset of nonredundant domain motions.
Figure 3. Distribution of RMSD scores (in Å) for the nonredundant set ofdomain motions.
Normal modes for predicting protein motions
www.proteinscience.org 635
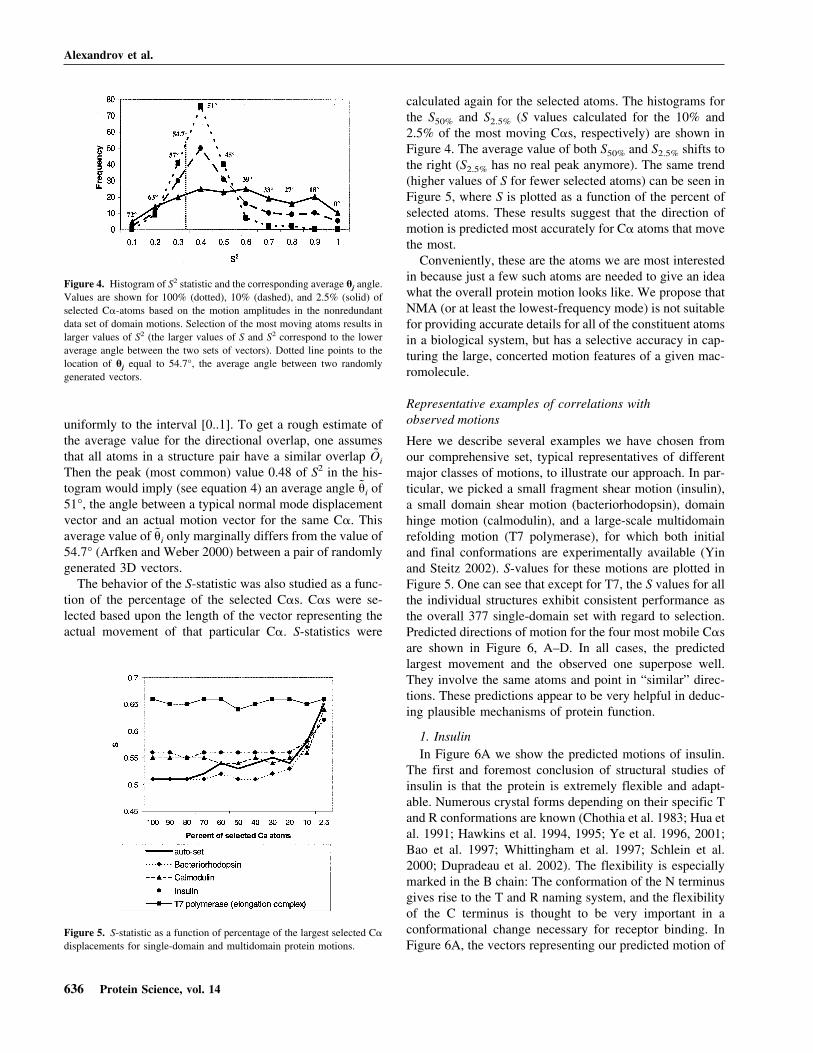
uniformly to the interval [0..1]. To get a rough estimate ofthe average value for the directional overlap, one assumesthat all atoms in a structure pair have a similar overlap Oi
Then the peak (most common) value 0.48 of S2 in the his-togram would imply (see equation 4) an average angle �i of51°, the angle between a typical normal mode displacementvector and an actual motion vector for the same C�. Thisaverage value of �i only marginally differs from the value of54.7° (Arfken and Weber 2000) between a pair of randomlygenerated 3D vectors.
The behavior of the S-statistic was also studied as a func-tion of the percentage of the selected C�s. C�s were se-lected based upon the length of the vector representing theactual movement of that particular C�. S-statistics were
calculated again for the selected atoms. The histograms forthe S50% and S2.5% (S values calculated for the 10% and2.5% of the most moving C�s, respectively) are shown inFigure 4. The average value of both S50% and S2.5% shifts tothe right (S2.5% has no real peak anymore). The same trend(higher values of S for fewer selected atoms) can be seen inFigure 5, where S is plotted as a function of the percent ofselected atoms. These results suggest that the direction ofmotion is predicted most accurately for C� atoms that movethe most.
Conveniently, these are the atoms we are most interestedin because just a few such atoms are needed to give an ideawhat the overall protein motion looks like. We propose thatNMA (or at least the lowest-frequency mode) is not suitablefor providing accurate details for all of the constituent atomsin a biological system, but has a selective accuracy in cap-turing the large, concerted motion features of a given mac-romolecule.
Representative examples of correlations withobserved motions
Here we describe several examples we have chosen fromour comprehensive set, typical representatives of differentmajor classes of motions, to illustrate our approach. In par-ticular, we picked a small fragment shear motion (insulin),a small domain shear motion (bacteriorhodopsin), domainhinge motion (calmodulin), and a large-scale multidomainrefolding motion (T7 polymerase), for which both initialand final conformations are experimentally available (Yinand Steitz 2002). S-values for these motions are plotted inFigure 5. One can see that except for T7, the S values for allthe individual structures exhibit consistent performance asthe overall 377 single-domain set with regard to selection.Predicted directions of motion for the four most mobile C�sare shown in Figure 6, A–D. In all cases, the predictedlargest movement and the observed one superpose well.They involve the same atoms and point in “similar” direc-tions. These predictions appear to be very helpful in deduc-ing plausible mechanisms of protein function.
1. InsulinIn Figure 6A we show the predicted motions of insulin.
The first and foremost conclusion of structural studies ofinsulin is that the protein is extremely flexible and adapt-able. Numerous crystal forms depending on their specific Tand R conformations are known (Chothia et al. 1983; Hua etal. 1991; Hawkins et al. 1994, 1995; Ye et al. 1996, 2001;Bao et al. 1997; Whittingham et al. 1997; Schlein et al.2000; Dupradeau et al. 2002). The flexibility is especiallymarked in the B chain: The conformation of the N terminusgives rise to the T and R naming system, and the flexibilityof the C terminus is thought to be very important in aconformational change necessary for receptor binding. InFigure 6A, the vectors representing our predicted motion of
Figure 5. S-statistic as a function of percentage of the largest selected C�
displacements for single-domain and multidomain protein motions.
Figure 4. Histogram of S2 statistic and the corresponding average �j angle.Values are shown for 100% (dotted), 10% (dashed), and 2.5% (solid) ofselected C�-atoms based on the motion amplitudes in the nonredundantdata set of domain motions. Selection of the most moving atoms results inlarger values of S2 (the larger values of S and S2 correspond to the loweraverage angle between the two sets of vectors). Dotted line points to thelocation of �j equal to 54.7°, the average angle between two randomlygenerated vectors.
Alexandrov et al.
636 Protein Science, vol. 14

insulin suggest that chain B is indeed quite mobile: Allsignificant motion vectors are located in chain B. Further-more, the vector of motion at residue PHE 1B pointingalong the helix axes suggests that this whole helix partici-pates in a concerted motion. The other three vectors in thehinge region (PRO 28B, LYS 29B, and ALA 30B) pointingin almost perpendicular direction to the first vector, suggestthat the motion of chain B is a small fragment shear motion.
This result relates to the experimental evidence that the�-turn motion in chain B (residues B24–B30) is essentialfor the enzymatic activity of insulin (Bao et al. 1997).
2. Calmodulin
Figure 6B shows the predicted movement of calmodulin,a ubiquitous eukaryotic Ca2+-binding protein that partici-
Figure 6. Real motion (red) and NMA-predicted (blue) vectors for the motion of (A) insulin (d7insb_SCOP domain), (B) calmodulin (d2bbm_domain),(C) bacteriorhodopsin (d1c8sa_SCOP domain), and (D) T7 polymerase (elongation complex). In D, labels 1, 2 , 3, and 4 represent residues THR 596, VAL597, THR 598, and GLY 603, respectively. Arrows indicate only the directions of the motion.
Normal modes for predicting protein motions
www.proteinscience.org 637

pates in numerous cellular regulatory processes. The X-raystructure (Babu et al. 1985, 1987, 1988; Kretsinger et al.1986) of this highly conserved 148-residue protein has adumbbell-like shape in which two globular domains areconnected by a seven-turn �-helix. The binding of Ca2+ toeither domain induces a conformational change in that do-main, which further induces some other catalytic activity(such as activation of phosphorylase kinase). Much effortwas put into determining the details of calmodulin structureand the mechanism of its Ca2+-induced conformationalchange (Kretsinger et al. 1986; Sekharudu and Sundaralin-gam 1993; Cook et al. 1994; Chin et al. 1997; Wilson andBrunger 2000; Kurokawa et al. 2001; Han et al. 2002; Hoelzet al. 2003; Yamauchi et al. 2003). The results of our cal-culations help to interpret the available experimental data.The vectors of the predicted largest moving parts of themolecule (Fig. 6B) indicate the direction along which theEF-hand is most likely to move. This movement, in agree-ment with the existing experimental evidence (Persechiniand Kretsinger 1988; Reuland et al. 2003) also suggests thatcalmodulin’s central helix serves as a flexible rather than asa rigid spacer, a property that probably further increases therange of target sequences to which calmodulin can bind(Putkey et al. 1988).
3. Bacteriorhodopsin
Bacteriorhodopsin undergoes conformational changesduring its catalytic cycle. These conformational changes aremainly restricted to the cytoplasmic side of the protein andfor the most part involve helices E, F, and G. This confor-mational change represents a crucial step in the activity ofthe native protein (Luecke et al. 1999; Subramaniam et al.1999; Sass et al. 2000). The largest predicted motions inbacteriorhodopsin are shown in Figure 6C. We observe thelargest movements for residues VAL101 (helix C), PHE153(helix E), and VAL177 (helix F) on the cytoplasmic side ofthe protein. Our prediction of the described movements ofthe cytoplasmic ends of the helices correlates well with theexperimentally observed structural changes related to thefunctional activity of bacteriorhodopsin (Luecke et al. 1999;Subramaniam et al. 1999; Luecke 2000).
4. T7 Polymerase
Studies of the bacteriophage T7 RNA polymerase reac-tion are crucial in the fundamental understanding of themechanism of transcription (Jia and Patel 1997a,b), and arealso important in biotechnology development (Roe et al.1988; Majumdar et al. 1989). The high efficiency of T7RNAP makes it a widely used tool in producing RNA invitro and in microarray gene expression. The motion of T7RNA polymerase is one of the largest recorded motions inthe MolMovDB by any set of criteria. It involves partialrefolding of about 250 residues in the N-terminal domain inorder to unbind the promoter and open up an exit channel
for the nascent RNA (Yin and Steitz 2002). Conformationalchanges this large are not unheard of (e.g., fusion-triggeringconformational change of a fusion domain from influenzahemagglutinin) (Bullough et al. 1994; Han et al. 2001). Still,a motion of this size is quite unexpected for a polymerasethat is in the act of transcribing RNA. There is a goodchance that additional intermediate stages exist (Y. Yin andT. Steitz, pers. comm.). The normal mode characteristics ofthe motion for this large multidomain protein differ signifi-cantly from the single-domain motions both in terms of themagnitudes of the displacement vectors and statistical char-acteristics. For the three single-domain proteins mentionedabove, the S-statistic exhibits the same behavior as the onecalculated for the whole data set, i.e., S reaches its maximalvalues (minimal average �i) for those atoms that move themost. It turns out that a restricted C� selection based onanticipated motion magnitude is not necessary for T7 poly-merase. Moreover, for T7 polymerase, NMA predicts thedirection of movement for all C�s with slightly greater ac-curacy compared to the predictions for 2.5% the C�s withthe largest motions in our single-domain motion set. Thisprobably happens because the employed NMA allows oneto see only the most prominent details of motion, which arebetter distinguished in a concerted multidomain movementthan in a smaller fragment motion. Recently Cui et al.(2004) determined that “the character of the lowest-fre-quency modes of the �(E) subunit is highly correlated withthe large �(E) to �(TP) transition,” which is in agreementwith our findings. However, more experimental data areneeded to prove whether NMA is better suited for largermotions.
Selection criteria for single-structure predictions
The above analysis suggests that the information about theprotein motion contained in the lowest-frequency normalmode vectors can be divided into two parts: (1) the partrelated to the large-amplitude concerted motion and (2) thesmaller scale part related to local “jittering.” We can ex-clude the latter part if we restrict our attention to the atomsthat move the most.
It becomes apparent that additional criteria are necessaryto ensure a reliable prediction of the largest motions whenonly one conformation is available. The ability to predictatoms that move the most as well as the directions of theirmotion can be very useful for gaining further insight aboutthe mechanism of protein function in cases where confor-mational changes are unknown or where no high-resolutionstructures exist.
In general, C�s with large motions cannot be reliablyselected based on the calculated NMA amplitudes—the cor-relation coefficient between the sets of normal mode dis-placements and the corresponding real motion vectors in ourdata set turns out to be only 0.34. Therefore, we used B-
Alexandrov et al.
638 Protein Science, vol. 14

factors to select the C�s with the largest motion vectors.The correlation coefficient calculated for the B-factors ver-sus observed motion amplitudes averaged over our data setappeared to be 0.77. When predicting the direction of themotion, we are guaranteed on average to have seven or eightout of 10 atoms that move the most in our NMA descriptionof the real motion based on a B-factor selection criterion.When B-factors for a particular structure are not available,one can select the C�s that move the most based on theirstructural variation in the multiple structural alignment forthe corresponding fold family. In our study, we built mul-tiple structural alignments for every motion pair in our dataset in the following way: For each initial conformation, 10structures (if available) were selected from the correspond-ing fold family. In order to find an average core structure,the 10 structures are aligned and the average RMSD valueis minimized (Alexandrov and Gerstein 2004). The C� con-sensus positions with the largest structural deviation areassumed to represent the positions that move the most in theobserved motion of the original structure. The correlationcoefficient between the positional variations and the ob-served motion amplitudes averaged among all C�s in thedata set was found to be 0.83. Thus, the core structures canserve as an independent reliable criterion for selecting themost mobile atoms in a protein family and particularly forNMA predictions of directions of motions.
Results of single structure predictionsfrom testing and training data
Since the number of proteins in our nonredundant set ofmotions is limited, we refined the cut-off value for ourS-statistic by using 10-fold cross-validation. The data set of377 proteins was split into 10 equally balanced subsets, eachcontaining ∼38 structures from the original set. Structures ineach subset were selected completely randomly. Each struc-ture belonged to only a single subset, and there were noduplicated structures in any subset. The optimal value forthe cutoff, which turned out to be 2.5%, has been deter-mined in each subset based on the remaining ∼340 struc-tures that belonged to the other nine subsets.
In practice, selecting four atoms based on their B-factorsfor a single structure is sufficient to satisfy this thresholdrequirement, as well as to build an overall qualitative pictureof the overall protein motion. Motion prediction based ononly a single “best” atom selection is also a viable alterna-tive. The distribution of average absolute angles
�N�B� ≡
1
N �imax B
N
�i
based on the one-atom �(B)1 and four-atom �(B)
4 largest B-factor selection criteria for the entire data set is shown in
Figure 7. Both distributions appear to be very similar. Onecan see that accurate motion direction predictions (<30°deviation from the observed direction) occur commonly butnot all the time. This is expected, however since NMA is nota very accurate description of real-life motion and the long-est trajectory in a protein motion is rarely a straight line.Therefore, an otherwise correctly predicted initial directionof motion (NMA prediction) might deviate noticeably fromthe vector connecting its initial and final positions. Thissuggests, in turn, that a picture represented by four atomswith the largest B-factors tends to be a better visual descrip-tion of the overall motion, particularly in cases involvinghinge motion or large-domain motion (from a statisticalpoint of view, however, both one-atom and four-atom mo-tion descriptions are nearly equivalent, since they both sat-isfy the 2.5% selection criterion).
Implementation of working prediction server
We have set up an NMA Web tool at http://molmovdb.org//nma/ to illustrate the main findings in the paper and toprovide a motion-prediction service to the community (Fig.8). The tool allows a researcher to identify the key residuesinvolved in the motion and their most probable direction.Given either a PDB/SCOP ID or an uploaded structure (Fig.8A), the server calculates the lowest normal mode of thesubmitted query, finds and highlights the most mobile struc-tural regions, and shows the direction of the four C� atomsthat move the most (Fig. 8B). Selection of the four mostaccurate NMA vectors is based on either supplied B-factorsor the prebuilt multiple structural alignment for the corre-sponding fold family. The four selected atoms are shown inred in the calculated lowest-frequency-normal-mode movie.A static picture with all residues ranked and highlighted
Figure 7. Histogram of the average angle between the lowest-frequencynormal mode vectors and the corresponding observed displacement vectorsfor the selected C� with the largest B-factors in the nonredundant data setof domain motions. �4
(B) distribution is represented by the solid line, and�1
(B) by the dashed line.
Normal modes for predicting protein motions
www.proteinscience.org 639

based on their motion amplitudes (red, largest motion; blue,smallest motion) is also provided (Fig. 8B).
Conclusion
An extensive statistical study to show the applicability ofNormal Mode Analysis to the prediction of protein flexibil-ity was performed on a new, comprehensive data set ofnonredundant single-domain motions. The motions weremodeled by using the lowest-frequency normal mode, andpredictions were assessed by directional overlap statistics.Our results suggest that it is possible to extract informationfrom the lowest-frequency normal mode, which identifiesthe most mobile parts of the protein as well as their direc-tions by focusing on a few C� atoms that move the most.We propose that the lowest-frequency NMA can selectivelypredict the atoms and the direction of conformationalchanges occurring in proteins. While the normal modeanalysis is based on finding vibrations that do not actuallyoccur in the over-damped condition of a protein in its en-vironment, it appears to usefully indicate the propensity ofthe structure to change in a particular direction. We find thatmotion prediction gains reliability if additional criteria, suchas crystallographic B-factors and RMSD values from mul-tiple structural alignments, are built into the motion analy-sis. A Web tool for prediction of protein motion and flex-ibility was developed to demonstrate the described ap-proach.
Materials and methods
Basic NMA framework and its MMTK implementation
See Figure 1 for the notation used throughout. The concept ofNormal Mode Analysis is to find a set of basis vectors (normalmodes) describing the molecule’s concerted atomic motion andspanning the set of all 3N − 6 degrees of freedom. For very largemolecules, it is often of more interest to find a small subset of thesenormal modes that in some way seem especially important. Bymodeling the interatomic bonds as springs and analyzing the pro-tein as a large set of coupled harmonic oscillators, one can calcu-late a frequency of periodic motion associated with each normalmode, and then attempt to find normal modes with low frequen-cies.
The principal of normal mode analysis is to solve an eigenvalueequation of the form
q + F � q = 0 (1)
where q is a vector representing the displacements in three dimen-sions of the various atoms of the molecule, and F is a matrix thatcan be computed from the mass of the system and potential energyfunctions. Solutions to the above system are vectors of periodicfunctions (the normal modes) vibrating in unison at the character-istic frequency of the mode.
We used MMTK (Hinsen 2000) to carry out NMA on prepro-cessed PDB file pairs containing only C� coordinates. The nu-merical Python module (Ascher et al. 2000) was employed to carryout all linear algebra computations. Each residue was approxi-mated as a single virtual atom with mass of the correspondingamino acid and centered at its C� coordinate. The MMTK defor-mation force field was used to model interatomic C� interactions.
Figure 8. Screenshot of the NMA motion and flexibility prediction server: (A) input page and (B) results page.
Alexandrov et al.
640 Protein Science, vol. 14

In this model, the energy is computed as the difference between adisplaced model and the experimental structure using the formula:
Ei =1
2 �j=1
N
k�Rij�0���|Rij
�0� + di − dj | − |Rij�0� |�2
, (2)
where k is a constant, R(0)ij is the vector connecting atom i to atom
j in the experimental structure, di is the difference vector betweenatom i in the displaced (final) structure and the same atom in theinitial structure. Furthermore, in the practical implementation ofthe NMA used here (Hinsen 2000), the force constant value de-creases with distance as an exponential function to allow its effi-cient evaluation with a cutoff not significantly larger then theinteratomic equilibrium distance R(0)
ij .In order to accelerate our computations, we restricted MMTK to
compute only the 20 lowest-frequency normal modes. In our ear-lier work (Krebs et al. 2002) we showed that this truncation isadequate for qualitative characterization of the lowest-frequencyprotein motions.
Statistical measures for assessing overlap
A means of quantifying the similarity of the displacement betweenthe PDB structures and the normal mode displacement vectors canbe achieved in terms of the following quantities:
Oi ≡ cos ��i� = abs � �➝
i � Di➝
| �➝i| � |Di➝|� (3)
In the above formula, we define the “directional overlap” Oi forone particular atom i as the absolute value of the cosine of theangle between the displacement vector D➝i of the lowest frequencymode and the observed direction of motion �
➝i (Fig. 1).
We use these individual directional overlaps Oi to define thesecond order statistic, S-statistic:
S =�1
N�i=1
N
Oi2 =�1
N�i=1
N
�cos��i��2, (4)
which serves as an overall quantitative measure of the similarity indirectionality between the observed motion vectors and the normalmode displacement vectors.
We also define an overlap measure in relation to atom selection.The quantity SP% is defined as
Sp%� =� 1
M�i=1
M
Oi2, (5)
where the sum is carried over the first P percent of C�s with thelargest difference vectors
→� i (M ≡ N · 0.01P). When the number
of selected atoms is small, it is convenient to rewrite the quantityS�
P% as
StopM� =� 1
M�i=1
M
Oi2, (6)
in order to explicitly indicate the number M of C�s with the largestdifference vectors entering the sum in equations 5 and 6. Quanti-ties SB
P% and SBtopM are defined in exactly the same way as their
counterparts S�P% and S�
topM except that the selection of C�s iscarried with respect to their corresponding B-factors, rather thanthe difference vectors.
For robustness, we can also define an average angle �(B)N
�N�B� ≡
1
N �imax B
N
�i, (7)
where summation is carried over N < M angles �i corresponding tothe C� atoms with the largest B-factors.
Acknowledgments
M.G. thanks the NIH (grant P01 GM54160) for support. U.L.thanks the DAAD for a postdoctoral fellowship.
References
Ahn, J.S., Kanematsu, Y., and Kushida, T. 1993. Site-selective fluorescencespectroscopy in dye-doped polymers. I. Determination of the site-energydistribution and the single-site fluorescence spectrum. Phys. Rev. B Con-dens. Matter 48: 9058–9065.
Alden, R., Schneebeck, M., Ondrias, M., Courtney, S., and Friedman, J. 1992.Mode-specific relaxation dynamics of photoexcited Fe(II) protoporphyrinIX in hemoglobin. J. Raman Spectrosc. 23: 569–574.
Alexandrov, V. and Gerstein, M. 2004. Using 3D hidden Markov models thatexplicitly represent spatial coordinates to model and compare protein struc-tures. BMC Bioinformatics 5: 2.
Amadei, A., Linssen, A.B., and Berendsen, H.J. 1993. Essential dynamics ofproteins. Proteins 17: 412–425.
Arfken, G.B. and Weber, H. 2000. Mathematical methods for physicists. Aca-demic Press, New York.
Ascher, D., Dubois, P.F., Hinsen, K., Hugunin, J., and Oliphant, T. 2000.Numerical python. Lawrence Livermore National Laboratory, Livermore,CA.
Babu, Y.S., Sack, J.S., Greenhough, T.J., Bugg, C.E., Means, A.R., and Cook,W.J. 1985. Three-dimensional structure of calmodulin. Nature 315: 37–40.
Babu, Y.S., Bugg, C.E., and Cook, W.J. 1987. X-ray diffraction studies ofcalmodulin. Methods Enzymol. 139: 632–642.
———. 1988. Structure of calmodulin refined at 2.2 Å resolution. J. Mol. Biol.204: 191–204.
Bahar, I. and Jernigan, R.L. 1998. Vibrational dynamics of transfer RNAs:Comparison of the free and synthetase-bound forms. J. Mol. Biol. 281:871–884.
Bao, S.J., Xie, D.L., Zhang, J.P., Chang, W.R., and Liang, D.C. 1997. Crystalstructure of desheptapeptide(B24–B30)insulin at 1.6 Å resolution: Implica-tions for receptor binding. Proc. Natl. Acad. Sci. 94: 2975–2980.
Brooks, B. and Karplus, M. 1983. Harmonic dynamics of proteins: Normalmodes and fluctuations in bovine pancreatic trypsin inhibitor. Proc. Natl.Acad. Sci. 80: 6571–6575.
———. 1985. Normal modes for specific motions of macromolecules: Appli-cation to the hinge-bending mode of lysozyme. Proc. Natl. Acad. Sci.82: 4995–4999.
Bullough, P.A., Hughson, F.M., Skehel, J.J., and Wiley, D.C. 1994. Structureof influenza haemagglutinin at the pH of membrane fusion. Nature 371:37–43.
Chin, D., Winkler, K.E., and Means, A.R. 1997. Characterization of substratephosphorylation and use of calmodulin mutants to address implicationsfrom the enzyme crystal structure of calmodulin-dependent protein kinase I.J. Biol. Chem. 272: 31235–31240.
Chothia, C., Lesk, A.M., Dodson, G.G., and Hodgkin, D.C. 1983. Transmissionof conformational change in insulin. Nature 302: 500–505.
Cook, W.J., Walter, L.J., and Walter, M.R. 1994. Drug binding by calmodulin:Crystal structure of a calmodulin-trifluoperazine complex. Biochemistry 33:15259–15265.
Cui, Q., Li, G., Ma, J., and Karplus, M. 2004. A normal mode analysis of
Normal modes for predicting protein motions
www.proteinscience.org 641

structural plasticity in the biomolecular motor F(1)-ATPase. J. Mol. Biol.340: 345–372.
Cusack, S. and Doster, W. 1990. Temperature dependence of the low frequencydynamics of myoglobin. Measurement of the vibrational frequency distri-bution by inelastic neutron scattering. Biophys. J. 58: 243–251.
Cusack, S., Smith, J., Finney, J., Tidor, B., and Karplus, M. 1988. Inelasticneutron scattering analysis of picosecond internal protein dynamics. Com-parison of harmonic theory with experiment. J. Mol. Biol. 202: 903–908.
Dupradeau, F.Y., Richard, T., Le Flem, G., Oulyadi, H., Prigent, Y., and Monti,J.P. 2002. A new B-chain mutant of insulin: Comparison with the insulincrystal structure and role of sulfonate groups in the B-chain structure.J. Pept. Res. 60: 56–64.
Echols, N., Milburn, D., and Gerstein, M. 2003. MolMovDB: Analysis andvisualization of conformational change and structural flexibility. NucleicAcids Res. 31: 478–482.
Elber, R. and Karplus, M. 1987. Multiple conformational states of proteins:A molecular dynamics analysis of myoglobin. Science 235: 318–321.
Frauenfelder, H., Parak, F., and Young, R.D. 1988. Conformational substates inproteins. Annu. Rev. Biophys. Biophys. Chem. 17: 451–479.
Gerstein, M. and Krebs, W. 1998. A database of macromolecular motions.Nucleic Acids Res. 26: 4280–4290.
Gibrat, J.F. and Go, N. 1990. Normal mode analysis of human lysozyme: Studyof the relative motion of the two domains and characterization of the har-monic motion. Proteins 8: 258–279.
Go, N., Noguti, T., and Nishikawa, T. 1983. Dynamics of a small globularprotein in terms of low-frequency vibrational modes. Proc. Natl. Acad. Sci.80: 3696–3700.
Han, X., Bushweller, J.H., Cafiso, D.S., and Tamm, L.K. 2001. Membranestructure and fusion-triggering conformational change of the fusion domainfrom influenza hemagglutinin. Nat. Struct. Biol. 8: 715–720.
Han, B.G., Han, M., Sui, H., Yaswen, P., Walian, P.J., and Jap, B.K. 2002.Crystal structure of human calmodulin-like protein: Insights into its func-tional role. FEBS Lett. 521: 24–30.
Hawkins, B.L., Cross, K.J., and Craik, D.J. 1994. A 1H-NMR determination ofthe solution structure of the A-chain of insulin: Comparison with the crystalstructure and an examination of the role of solvent. Biochim. Biophys. Acta1209: 177–182.
Hawkins, B., Cross, K., and Craik, D. 1995. Solution structure of the B-chain ofinsulin as determined by 1H NMR spectroscopy. Comparison with thecrystal structure of the insulin hexamer and with the solution structure of theinsulin monomer. Int. J. Pept. Protein Res. 46: 424–433.
Hayward, S., Kitao, A., and Berendsen, H.J. 1997. Model-free methods ofanalyzing domain motions in proteins from simulation: A comparison ofnormal mode analysis and molecular dynamics simulation of lysozyme.Proteins 27: 425–437.
Henry, E.R., Eaton, W.A., and Hochstrasser, R.M. 1986. Molecular dynamicssimulations of cooling in laser-excited heme proteins. Proc. Natl. Acad. Sci.83: 8982–8986.
Hinsen, K. 1998. Analysis of domain motions by approximate normal modecalculations. Proteins 33: 417–429.
———. 2000. The molecular modeling toolkit: A new approach to molecularsimulations. J. Comp. Chem. 21: 79–85.
Hoelz, A., Nairn, A.C., and Kuriyan, J. 2003. Crystal structure of a tetradeca-meric assembly of the association domain of Ca2+/calmodulin-dependentkinase II. Mol. Cell 11: 1241–1251.
Hong, M.K., Braunstein, D., Cowen, B.R., Frauenfelder, H., Iben, I.E., Mourant,J.R., Ormos, P., Scholl, R., Schulte, A., Steinbach, P.J., et al. 1990. Con-formational substates and motions in myoglobin. External influences onstructure and dynamics. Biophys. J. 58: 429–436.
Horiuchi, T., and Go, N. 1991. Projection of Monte Carlo and molecular dy-namics trajectories onto the normal mode axes: Human lysozyme. Proteins10: 106–116.
Hua, Q.X., Shoelson, S.E., Kochoyan, M., and Weiss, M.A. 1991. Receptorbinding redefined by a structural switch in a mutant human insulin. Nature354: 238–241.
Jia, Y. and Patel, S.S. 1997a. Kinetic mechanism of GTP binding and RNAsynthesis during transcription initiation by bacteriophage T7 RNA polymer-ase. J. Biol. Chem. 272: 30147–30153.
———. 1997b. Kinetic mechanism of transcription initiation by bacteriophageT7 RNA polymerase. Biochemistry 36: 4223–4232.
Kabsch, W. 1976. A solution for the best rotation to relate two sets of vectors.Acta Cryst. A32: 922–923.
Kottalam, J. and Case, D.A. 1990. Langevin modes of macromolecules: Appli-cations to crambin and DNA hexamers. Biopolymers 29: 1409–1421.
Krebs, W.G. and Gerstein, M. 2000. The morph server: A standardized system
for analyzing and visualizing macromolecular motions in a database frame-work. Nucleic Acids Res. 28: 1665–1675.
Krebs, W.G., Alexandrov, V., Wilson, C.A., Echols, N., Yu, H., and Gerstein,M. 2002. Normal mode analysis of macromolecular motions in a databaseframework: Developing mode concentration as a useful classifying statistic.Proteins 48: 682–695.
Kretsinger, R.H., Rudnick, S.E., and Weissman, L.J. 1986. Crystal structure ofcalmodulin. J. Inorg. BioChem. 28: 289–302.
Kurokawa, H., Osawa, M., Kurihara, H., Katayama, N., Tokumitsu, H., Swin-dells, M.B., Kainosho, M., and Ikura, M. 2001. Target-induced conforma-tional adaptation of calmodulin revealed by the crystal structure of a com-plex with nematode Ca(2+)/calmodulin-dependent kinase kinase peptide.J. Mol. Biol. 312: 59–68.
Levitt, M., Sander, C., and Stern, P.S. 1985. Protein normal-mode dynamics:Trypsin inhibitor, crambin, ribonuclease and lysozyme. J. Mol. Biol. 181:423–447.
Levy, R.M., Srinivasan, A.R., Olson, W.K., and McCammon, J.A. 1984. Quasi-harmonic method for studying very low frequency modes in proteins. Bio-polymers 23: 1099–1112.
Luecke, H. 2000. Atomic resolution structures of bacteriorhodopsin photocycleintermediates: The role of discrete water molecules in the function of thislight-driven ion pump. Biochim. Biophys. Acta 1460: 133–156.
Luecke, H., Schobert, B., Richter, H.T., Cartailler, J.P., and Lanyi, J.K. 1999.Structural changes in bacteriorhodopsin during ion transport at 2 Å resolu-tion. Science 286: 255–261.
Majumdar, D., Lieberman, K.R., and Wyche, J.H. 1989. Use of modified T7DNA polymerase in low melting point agarose for DNA gap filling andmolecular cloning. Biotechniques 7: 188–191.
Marques, O. and Sanejouand, Y.H. 1995. Hinge-bending motion in citrate syn-thase arising from normal mode calculations. Proteins 23: 557–560.
Miller, D.W. and Agard, D.A. 1999. Enzyme specificity under dynamic control:A normal mode analysis of �-lytic protease. J. Mol. Biol. 286: 267–278.
Noguti, T. and Go, N. 1982. Collective variable description of small-amplitudeconformational fluctuations in a globular protein. Nature 296: 776–778.
Orengo, C.A., Michie, A.D., Jones, S., Jones, D.T., Swindells, M.B., and Thorn-ton, J.M. 1997. CATH—A hierarchic classification of protein domain struc-tures. Structure 5: 1093–1108.
Pearson, W.R. and Lipman, D.J. 1988. Improved tools for biological sequencecomparison. Proc. Natl. Acad. Sci. 85: 2444–2448.
Persechini, A. and Kretsinger, R.H. 1988. The central helix of calmodulinfunctions as a flexible tether. J. Biol. Chem. 263: 12175–12178.
Putkey, J.A., Ono, T., VanBerkum, M.F., and Means, A.R. 1988. Functionalsignificance of the central helix in calmodulin. J. Biol. Chem. 263: 11242–11249.
Reuland, S.N., Vlasov, A.P., and Krupenko, S.A. 2003. Disruption of a cal-modulin central helix-like region of 10-formyltetrahydrofolate dehydroge-nase impairs its dehydrogenase activity by uncoupling the functional do-mains. J. Biol. Chem. 278: 22894–22900.
Roe, B.A., Johnston-Dow, L., and Mardis, E. 1988. Use of a chemically modi-fied T7 DNA polymerase for manual and automated sequencing of super-coiled DNA. Biotechniques 6: 520.
Sass, H.J., Buldt, G., Gessenich, R., Hehn, D., Neff, D., Schlesinger, R., Ber-endzen, J., and Ormos, P. 2000. Structural alterations for proton transloca-tion in the M state of wild-type bacteriorhodopsin. Nature 406: 649–653.
Schlein, M., Havelund, S., Kristensen, C., Dunn, M.F., and Kaarsholm, N.C.2000. Ligand-induced conformational change in the minimized insulin re-ceptor. J. Mol. Biol. 303: 161–169.
Sekharudu, C.Y. and Sundaralingam, M. 1993. A model for the calmodulin-peptide complex based on the troponin C crystal packing and its similarityto the NMR structure of the calmodulin-myosin light chain kinase peptidecomplex. Protein Sci. 2: 620–625.
Smith, J., Cusack, S., Poole, P., and Finney, J. 1987. Direct measurement ofhydration-related dynamic changes in lysozyme using inelastic neutron scat-tering spectroscopy. J. Biomol. Struct. Dyn. 4: 583–588.
Subramaniam, S., Lindahl, M., Bullough, P., Faruqi, A.R., Tittor, J., Oesterhelt,D., Brown, L., Lanyi, J., and Henderson, R. 1999. Protein conformationalchanges in the bacteriorhodopsin photocycle. J. Mol. Biol. 287: 145–161.
Tama, F. and Sanejouand, Y.H. 2001. Conformational change of proteins aris-ing from normal mode calculations. Protein Eng. 14: 1–6.
Thomas, A., Field, M.J., Mouawad, L., and Perahia, D. 1996a. Analysis of thelow frequency normal modes of the T-state of aspartate transcarbamylase. J.Mol. Biol. 257: 1070–1087.
Thomas, A., Field, M.J., and Perahia, D. 1996b. Analysis of the low-frequencynormal modes of the R state of aspartate transcarbamylase and a comparisonwith the T state modes. J. Mol. Biol. 261: 490–506.
Thomas, A., Hinsen, K., Field, M.J., and Perahia, D. 1999. Tertiary and qua-
Alexandrov et al.
642 Protein Science, vol. 14

ternary conformational changes in aspartate transcarbamylase: A normalmode study. Proteins 34: 96–112.
Valadie, H., Lacapcre, J.J., Sanejouand, Y.H., and Etchebest, C. 2003. Dynami-cal properties of the MscL of Escherichia coli: A normal mode analysis. J.Mol. Biol. 332: 657–674.
Whittingham, J.L., Havelund, S., and Jonassen, I. 1997. Crystal structure of aprolonged-acting insulin with albumin-binding properties. Biochemistry 36:2826–2831.
Wilcox, G.L., Quiocho, F.A., Levinthal, C., Harvey, S.C., Maggiora, G.M., andMcCammon, J.A. 1988. Symposium overview. Minnesota Conference onSupercomputing in Biology: Proteins, Nucleic Acids, and Water. J. Comput.Aided Mol. Des. 1: 271–281.
Wilson, M.A. and Brunger, A.T. 2000. The 1.0 Å crystal structure of Ca(2+)-
bound calmodulin: An analysis of disorder and implications for functionallyrelevant plasticity. J. Mol. Biol. 301: 1237–1256.
Yamauchi, E., Nakatsu, T., Matsubara, M., Kato, H., and Taniguchi, H. 2003.Crystal structure of a MARCKS peptide containing the calmodulin-bindingdomain in complex with Ca2+-calmodulin. Nat. Struct. Biol. 10: 226–231.
Ye, S., Wan, Z., Liu, C., Chang, W., and Liang, D. 1996. Crystal structure of(L-Arg)-B0 bovine insulin at 0.21 nm resolution. Sci. China C Life Sci. 39:465–473.
Ye, J., Chang, W., and Liang, D. 2001. Crystal structure of destripeptide (B28–B30) insulin: Implications for insulin dissociation. Biochim. Biophys. Acta1547: 18–25.
Yin, Y.W. and Steitz, T.A. 2002. Structural basis for the transition from initia-tion to elongation transcription in T7 RNA polymerase. Science 298: 1387–1395.
Normal modes for predicting protein motions
www.proteinscience.org 643
Related Documents