lACC Vol. 4, No.2 August 1984: \43-50 Normal Intracardiac and Great Vessel Doppler Flow Velocities in Infants and Children EHUD GRENADIER, MD,* CARLOS OLIVEIRA LIMA, MD, HUGH D. ALLEN, MD, FACC, DAVID J. SAHN, MD, FACC, JESUS VARGAS BARRON, MD, LILLIAM M. VALDES-CRUZ, MD, FACC, STANLEY J. GOLDBERG, MD, FACC Tucson, Arizona and Haifa, Israel 343 Normal two-dimensional pulsed Doppler echocardio- graphic velocity profiles for sites within the heart and great vessels in a group of 102 normal infants and chil- dren are presented. Qualitatively, waveforms mimic ex- pected hemodynamic events at the various sites. All waveforms had a rapid initial deflection followed by spectral broadening after attainment of peak velocity. Quantitative angle-corrected peak velocities were generally lower on the right side than on the left side of the heart. DitTerences in tricuspid (mean 61.8 cm/s) ver- sus mitral (mean 81.1 cm/s) outflow and pulmonary (mean 76.1 cm/s) versus aortic (mean 88.5 cm/s) outflow were Applications of Doppler echocardiography have assumed increasing importance in the noninvasive diagnosis and management of children with congenital heart disease. Qual- itative applications of Doppler studies have included the detection of disturbed flow due to valve stenosis (1-8) or regurgitation (9-17) and localization of flow disturbances associated with ventricular septal defect, atrial septal defect and patent ductus arteriosus (18-24). Newer generation Doppler devices display quantitative spectral outputs of Doppler frequency shifts that allow de- termination of normal and abnormal flow velocities. This, combined with two-dimensional imaging, allows localiza- tion of the sites of sampling and vector of the angle of flow with reference to the Doppler sample. These instrumentation advances have made available new opportunities for apply- ing Doppler technology to clinical cardiology. Quantitative applications of Doppler echocardiography have included estimation of the gradient across stenotic valves (1-7,2:1), estimation of cardiac output (26-30) and deter- ruination of the pulmonary to systemic flow ratio (QP:QS) Frorn the University of Arizona, Tucson, Arizona and *Carmel Hos- pital, Haifa, Israel. Manuscript received October II, 1983; revised manu- script received February 21, 1984; accepted March 16, 1984. Address for reprints: Hugh D. Allen, MD, Department of Pediatrics, University of Arizona, Health Sciences Center, Tucson, Arizona 85724. © 1984 by the American College of Cardiology significant (p < 0.01). The only significant age-related ditTerences were in the pulmonary artery (mean for new- borns 67.7 cm/s versus 79.6 cm/s for older children, p < 0.01). Aortic data obtained from interrogation sites in which flowwas closeto 0 or 180 0 were similar, whereas aortic peak velocity data obtained from apical long-axis or subcostal views were greater. These differences were probably induced from inaccuracies in azimuthal (ele- vational) angles that cannot be measured. These normal Doppler data should be useful for com- parisons with data obtained for children with various forms of congenitalheart diseasethat affect flow dynamics. in left to right shunting lesions (26). Since such quantitation of intracardiac Doppler flow velocities has assumed increas- ing importance in children with congenital heart disease, we designed this study to characterize and establish normal values for intracardiac and great vessel Doppler flow ve- locities in normal infants, children and young adults. Methods Study subjects. One hundred-two normal children under- went two-dimensional echocardiographic Doppler examina- tion during this study. All subjects were free of cardiovascular disease by physical examination. Informed written consent was obtained according to aHuman Subjects Committee-approved protocol. The children's ages ranged from 3 days to 22 years with amean(± SD)of6.01 ± 5.12. The first phase of this study emphasized Doppler eval- uation of flow velocities in the aorta (n = 36) and pulmonary artery (n = 82). This part of the study was performed in 84 of the children (28 infants and 56 older subjects). Studies in the next 18 subjects included additional interrogation of velocities within cardiac chambers and velocities of atrio- ventricular valve flows. Doppler echocardiography. Ultrasonic examinations were performed with patients in a quiet rest state in either 0735-1097/84/$3.00

Welcome message from author
This document is posted to help you gain knowledge. Please leave a comment to let me know what you think about it! Share it to your friends and learn new things together.
Transcript
lACC Vol. 4, No.2August 1984: \43-50
Normal Intracardiac and Great Vessel Doppler Flow Velocities inInfants and Children
EHUD GRENADIER, MD,* CARLOS OLIVEIRA LIMA, MD, HUGH D. ALLEN, MD, FACC,
DAVID J. SAHN, MD, FACC, JESUS VARGAS BARRON, MD,
LILLIAM M. VALDES-CRUZ, MD, FACC, STANLEY J. GOLDBERG, MD, FACC
Tucson, Arizona and Haifa, Israel
343
Normal two-dimensional pulsed Doppler echocardiographic velocity profiles for sites within the heart andgreat vessels in a group of 102 normal infants and children are presented. Qualitatively, waveforms mimic expected hemodynamic events at the various sites. Allwaveforms had a rapid initial deflection followed byspectral broadening after attainment of peak velocity.
Quantitative angle-corrected peak velocities weregenerally lower on the right side than on the left side ofthe heart. DitTerences in tricuspid (mean 61.8 cm/s) versus mitral (mean81.1 cm/s)outflow and pulmonary (mean76.1 cm/s) versus aortic (mean 88.5 cm/s) outflow were
Applications of Doppler echocardiography have assumedincreasing importance in the noninvasive diagnosis andmanagement of children with congenital heart disease. Qualitative applications of Doppler studies have included thedetection of disturbed flow due to valve stenosis (1-8) orregurgitation (9-17) and localization of flow disturbancesassociated with ventricular septal defect, atrial septal defectand patent ductus arteriosus (18-24).
Newer generation Doppler devices display quantitativespectral outputs of Doppler frequency shifts that allow determination of normal and abnormal flow velocities. This,combined with two-dimensional imaging, allows localization of the sites of sampling and vector of the angle of flowwith reference to the Doppler sample. These instrumentationadvances have made available new opportunities for applying Doppler technology to clinical cardiology.
Quantitative applications of Doppler echocardiographyhave included estimation of the gradient across stenotic valves(1-7,2:1), estimation of cardiac output (26-30) and deterruination of the pulmonary to systemic flow ratio (QP:QS)
Frorn the University of Arizona, Tucson, Arizona and *Carmel Hospital, Haifa, Israel. Manuscript received October II, 1983; revised manuscript received February 21, 1984; accepted March 16, 1984.
Address for reprints: Hugh D. Allen, MD, Department of Pediatrics,University of Arizona, Health Sciences Center, Tucson, Arizona 85724.
© 1984 by the American College of Cardiology
significant (p < 0.01). The only significant age-relatedditTerences were in the pulmonary artery (mean for newborns 67.7 cm/s versus 79.6 cm/s for older children,p < 0.01). Aortic data obtained from interrogation sitesin which flowwas closeto 0 or 1800 were similar, whereasaortic peak velocity data obtained from apical long-axisor subcostal views were greater. These differences wereprobably induced from inaccuracies in azimuthal (elevational) angles that cannot be measured.
These normal Doppler data should be useful for comparisons with data obtained for children with variousforms ofcongenitalheart diseasethat affectflow dynamics.
in left to right shunting lesions (26). Since such quantitationof intracardiac Doppler flow velocities has assumed increasing importance in children with congenital heart disease,we designed this study to characterize and establish normalvalues for intracardiac and great vessel Doppler flow velocities in normal infants, children and young adults.
MethodsStudy subjects. One hundred-two normal children under
went two-dimensional echocardiographic Doppler examination during this study. All subjects were free of cardiovasculardisease by physical examination. Informed written consent wasobtained according to aHuman Subjects Committee-approvedprotocol. The children's ages ranged from 3days to 22 yearswithamean(± SD)of6.01 ± 5.12.
The first phase of this study emphasized Doppler evaluation of flow velocities in the aorta (n = 36) and pulmonaryartery (n = 82). This part of the study was performed in84 of the children (28 infants and 56 older subjects). Studiesin the next 18 subjects included additional interrogation ofvelocities within cardiac chambers and velocities of atrioventricular valve flows.
Doppler echocardiography. Ultrasonic examinationswere performed with patients in a quiet rest state in either
0735-1097/84/$3.00
344 GRENADIER ET AL.NORMAL DOPPLER VELOCITIES IN CHILDREN
lACC Vol. 4. No.2August 1984:343-50
a supine or a right anterior oblique position. Studies wereperformed with two instruments. The first was a commercially available mechanical sector scanner with a single element transducer (3.5 or 5 MHz) that could be oscillatedthrough a 30 to 75° arc (Electronics for Medicine/Honeywell). When imaging the heart or great vesselswith this instrument, the Doppler sample volume can bepositioned at any depth along any information line withinthe sector arc for measurement of Doppler velocity. Sampling rate varies with depth. At 6 em depth, sampling rateis 13,OOO/s (pulse repetition frequency), and the maximalnonambiguously detectable velocity (Nyquist velocity) is143 cm/s at 3.5 MHz interrogation frequency. At 6 to 10cm depth, the sampling rate is 7,800ls and maximal detectable velocity is 85 cm/s.
After the sample volume is positioned in a selected cavityor vessel, Doppler sampling is switched on and the preciselocalization is confirmed by an audio signal and a spectraldisplay of the Doppler shift frequency obtained from fastFourier transform spectral analysis. Spectral analysis is performed 200 times/s, providing visual and hard copy quantitative velocity displays. Real time two-dimensional echocardiographic images, Doppler waveforms and simultaneouslead II electrocardiographic tracings are displayed on a monitor and recorded as page prints on a strip chart recorder.
The second instrument used in this study was a phasedarray sector scanner (Irex IIIB) that, while sampling at 2.5to 3.5 MHz, includes a 2 MHz Doppler interrogation capability (PEDOF) that provides both pulsed and continuousDoppler capability. Doppler sampling is performed at 2MHz interrogation frequency. Both two-dimensional echocardiographic images and Doppler velocity curves can beobtained simultaneously from the same transducer array,but pulsed or continuous wave Doppler sampling is accomplished only with a fixed central interrogation line in thesector. In the pulsed mode, the maximal unambiguouslydetectable velocity to a depth of 6 cm is 160 cm/s.
In this system, Doppler outputs are available as an audiosignal and as a spectral output sampled with a variable rate.Two-dimensional images were recorded on video tape andpulsed spectral Doppler outputs and simultaneous lead IIelectrocardiograms were recorded on hard copy page prints.
Ultrasonic examination technique. Standard two-dimensional echocardiographic examination (31,32) was performed. Doppler sample volume was then placed in thefollowing areas: right atrium (apical four chamber plane),tricuspid outflow (apical four chamber plane with samplevolume distal to the tricuspid valve and in the right ventricle), main pulmonary artery (short-axis plane), left atrialcavity (apical four chamber plane), mitral valve outflow(apical four chamber plane with sample volume in the leftventricle distal to the mitral valve), ascending aorta (apicalleft ventricular outflow plane, apical long-axis plane, subcostal left ventricular outflow and suprasternal long-axis
II "I I I , I I I 0 I 0 I 0 0 I 0 I 0 - .. , e lll
Figure 1. Pulmonary artery (P.A). The range-gated sample volume shown as short parallel lines on the Doppler cursor is locatedin the middle of the short-axis image of the main pulmonary artery.Depth of the sample volume is indicated on the calibration scaleat the left ofthe image (5 to 6 em), The A mode echogram showingthe ramp settings and gain is indicated to the left of the calibrationmarkings. The spectral display of the flow velocity in the pulmonary artery is shown below the two-dimensional echocardiographic image. The velocity scale is located to the right of thecurves (peak velocity -79 cm/s). Range of measurable velocitiesis from - 107 to 64 cm/s. Time scale is shown in seconds (heavylines = I second intervals). The zero line is shown traversing theimage. The centimeter scale on the left is the same as on the twodimensional echocardiographic image. An electrocardiogram isdisplayed for timing purposes. Ao. = aorta; R.A = right atrium.
plane) and descending aorta (suprasternal plane) (Fig. I to3).
The best quality Doppler flow velocity tracings were attained in this study by centering the sample volume in thetwo-dimensional image of a cavity or vessel, avoiding wallsor valves, and then adjusting its position until the highest
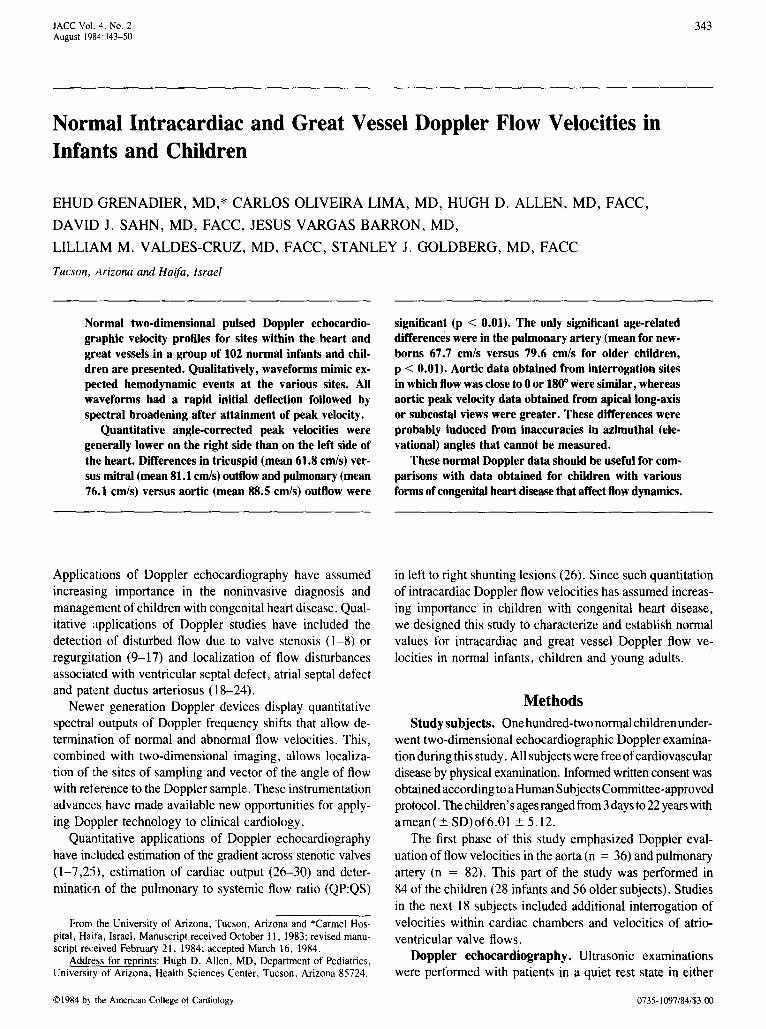
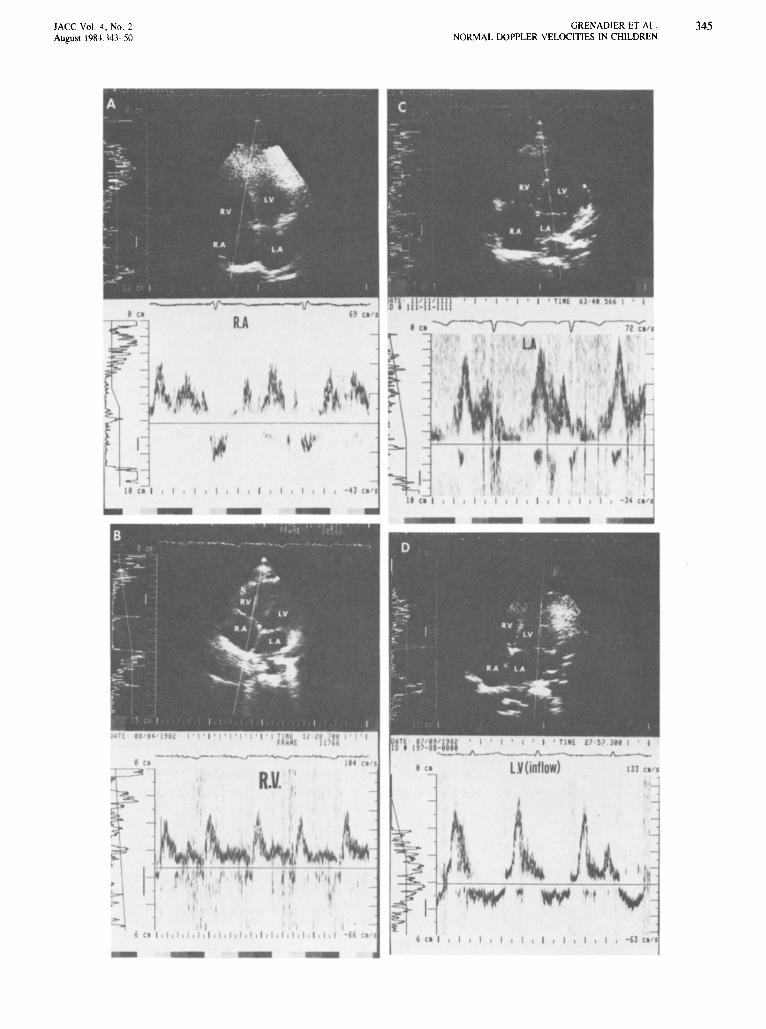
Figure 2. Short-axis plane. The right atrium (R.A), right atrialoutflow into the right ventricle (R.V.), left atrium (L.A) and leftatrial outflow into the left ventricle (L.V [inflow]) are shown.Doppler interrogation sites are shown in the various sample volumelocations in apical four chamber two-dimensional echocardiographic images. See text and Figure I for details.
JACC Vol. 4 , No. 2August 1981343-50
GRENADIER ET AL.NORMAL DOPPLER VELOCITIES IN CHILDREN
345
---~-..-..• ' 0
pi
COl
-J--~__-~.•. 'I
.v.
- 0
I , I
• el
, CO I , I , I , I
I ,
IA
LV (inflo )
I , I , I , I , I
· H Co'
IJJ Co"
346 GRENADIER ET AL.NORMAL DOPPLER VELOCITIES IN CHILDREN
lACC Vol. 4, No.2August 1984:343-50
phasic velocity with the narrowest spectral width was obtained. The audio outputs were used for further guidanceof the sample volume. Sample volume size was determinedby vessel diameter or chamber size. The smallest volumethat delivered the best maximal signal was employed. Maximal velocity was then recorded. Sample volume angle withreference to flow direction was manually estimated from thetwo-dimensional image with a protractor. Since obliquityof flow velocity to the sampling plane cannot be assessed,no correction can be applied for the elevational or azimuthalplane. Adjusting the sample volume to obtain maximal velocities probably minimizes this potential error. Correctionof flow velocity (V) to angle (0) was accomplished (V/cos0).
Waveform velocities were then evaluated qualitatively forconfiguration and quantitatively for peak phasic (diastolicor systolic) velocity in cm/s. Peak velocity was measuredto the top of the heaviest signal on the velocity curve.Velocity measurements were performed on a digitizing padthat was linked to an Apple II + computer. A softwareprogram specifically designed for velocity measurement wasemployed (Biodata, Inc.) At least two observers evaluatedeach tracing. Peak velocity measurements were made overat least 3 beats/min and were averaged. Spectral width wasmeasured on records obtained from the Electronics for Medicine/Honeywell device by measuring the thickness of thespectrum at the peak of the curve. Since spectral width varieswith gain settings, gain sensitivity was held constant duringan individual examination.
For each area sampled, mean and range population datawere recorded as spectral width, peak maximal velocity,interrogation angle (0) and angle-corrected maximal velocity.
Unpaired t testing was used to compare data obtainedfrom different sites and from the same site using differentapproaches. Regression analyses were performed for comparison of data with age.
ResultsWaveform analysis. Pulmonary velocities, best de
tected from the frontal short-axis view with the sample volume in the main pulmonary artery, registered as a negativewaveform (Fig. 1). The initial deflection was coherent andwas followed by spectral broadening after reaching its peak.At end-systole, the wave returned to zero and velocity wasthen generally at or near zero during diastole.
Right atrial velocities, best detected from the apical fourchamber view (Fig. 2), were mainly diastolic and towardthe transducer and were, therefore, positive with respect tothe zero-crossing line.
Tricuspid velocities were best recorded from the apicalfour chamber view with the sample volume placed in theright ventricular inflow tract (Fig. 2). Velocity profiles closelyresembled the M-mode tricuspid valve tracing. The initial
increase was rapid to the peak. This phase was followed byspectral broadening of the downslope. Next, a smaller peakwas associated with late atrial contraction. The waveformwas fairly flat during systole.
Left atrial velocities, best detected from the apical fourchamber view (Fig. 2), closely resembled the waveformsfound in the right atrium. Since the left atrium is distantfrom the transducer, accurate sampling was sometimes quitedifficult, especially in older children and young adults.
Mitral valve velocities, best detected from the apical fourchamber view with the sample volume located in the leftventricular inflow tract (Fig. 2), closely resembled those ofthe tricuspid valve.
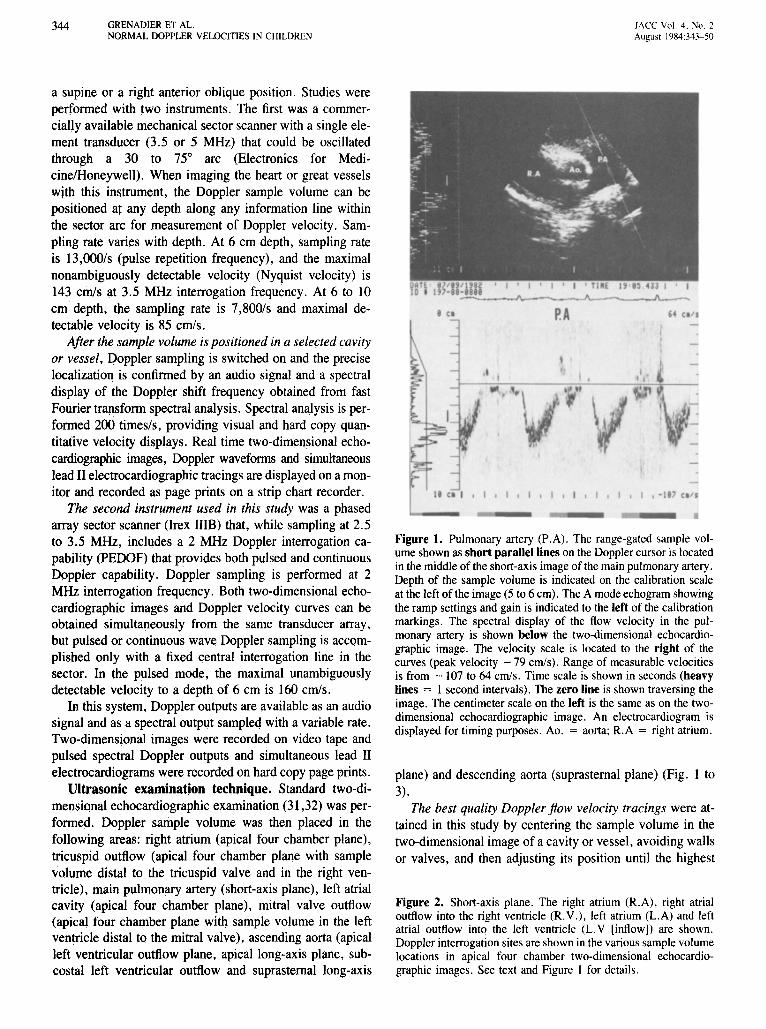
Ascending aortic velocities can be sampled from severalsites, including the apical long-axis view, the apical leftventricular outflow view, the subcostal left ventricular outflow view and the suprasternal long-axis view (Fig. 3). Sinceflow is away from the transducer in the apical and subcostalviews, the waveforms were negative, whereas the waveforms sampled from the suprasternal position were positive.In all cases, the initial deflection was abrupt, spectral broadening occurred at peak and the downslope reached the zeroline fairly abruptly. During diastole, a slight reversal of flowwas usually noted in the ascending aorta.
Descending aortic flow sampled from the suprasternalnotch was negative with respect to the sample volume. Thewaveform was similar to that of the ascending aorta, exceptthat it was flat instead of reversed during diastole.
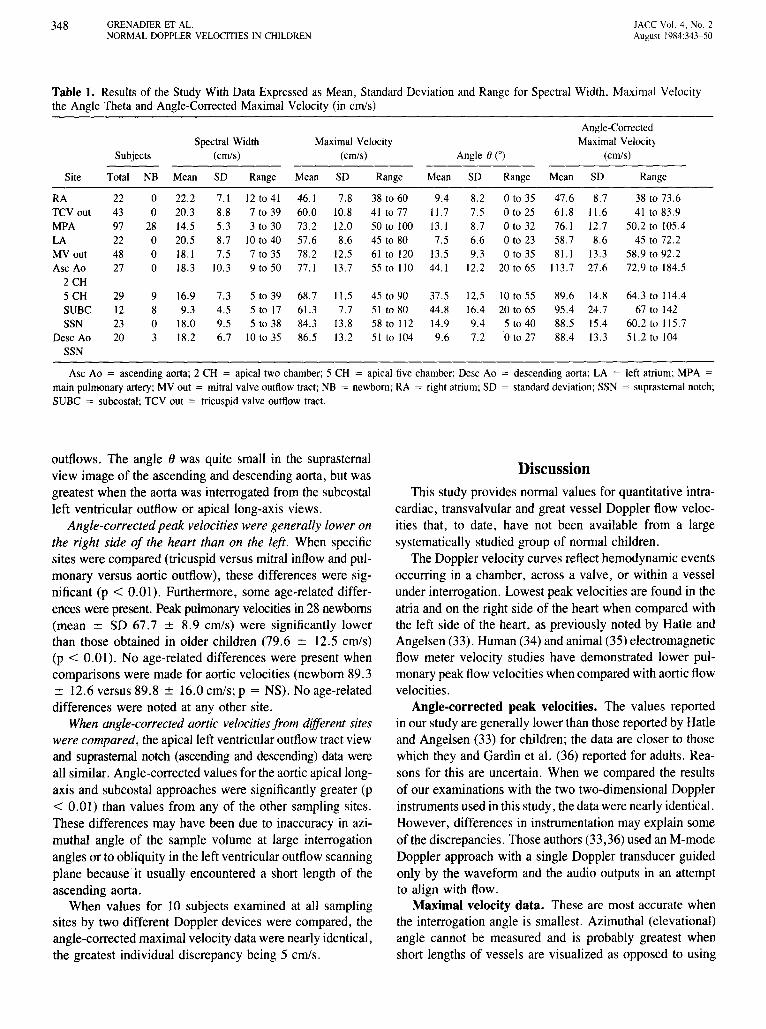
Quantitative waveform analysis. Table I shows quantitative data for spectral width, maximal velocities, angleof interrogation and angle-corrected maximal velocities foreach site studied.
Mean spectral widths were similar in all areas studiedwith the exception of those from the subcostal aorta whichshowed very little spectral broadening. Peak systolic spectral widths were generally less in the great vessels than werepeak diastolic spectral widths in the atria or across atrioventricular valves. Spectral widths did not vary significantlywithin a single examination at a given site when the Dopplerdevice's range span was changed and gain sensitivity washeld constant.
The interrogation angle (0) was closest to 0 or 1800,
parallel to flow, when the apical four chamber view wasused for interrogation of the atria and atrioventricular valve
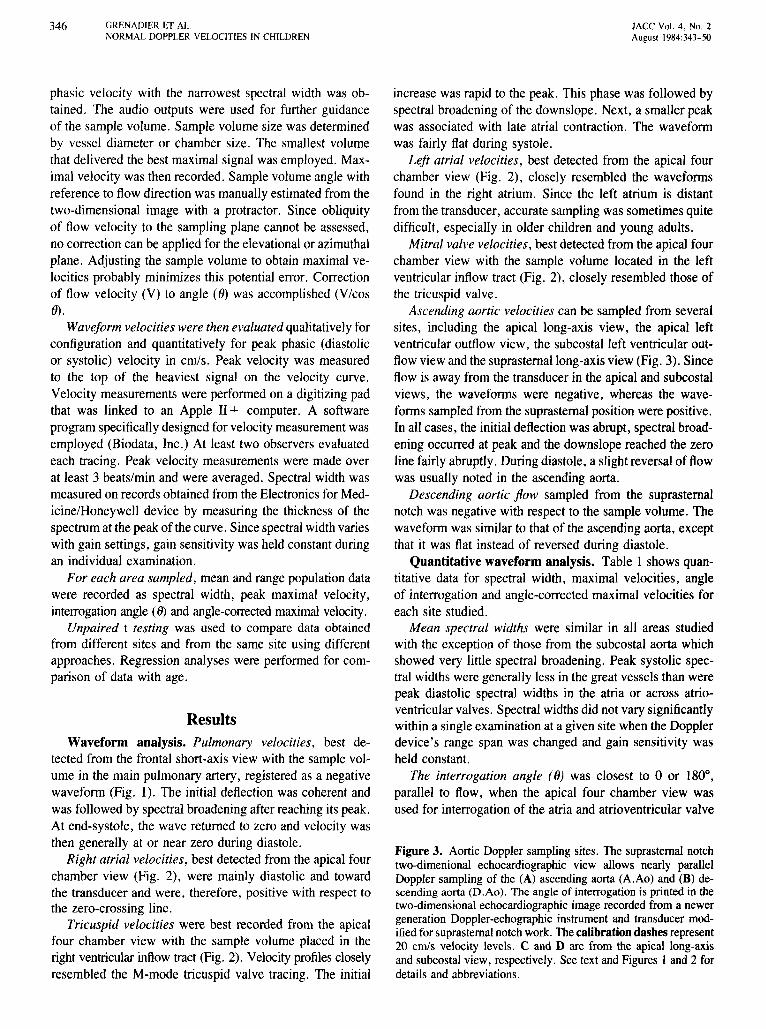
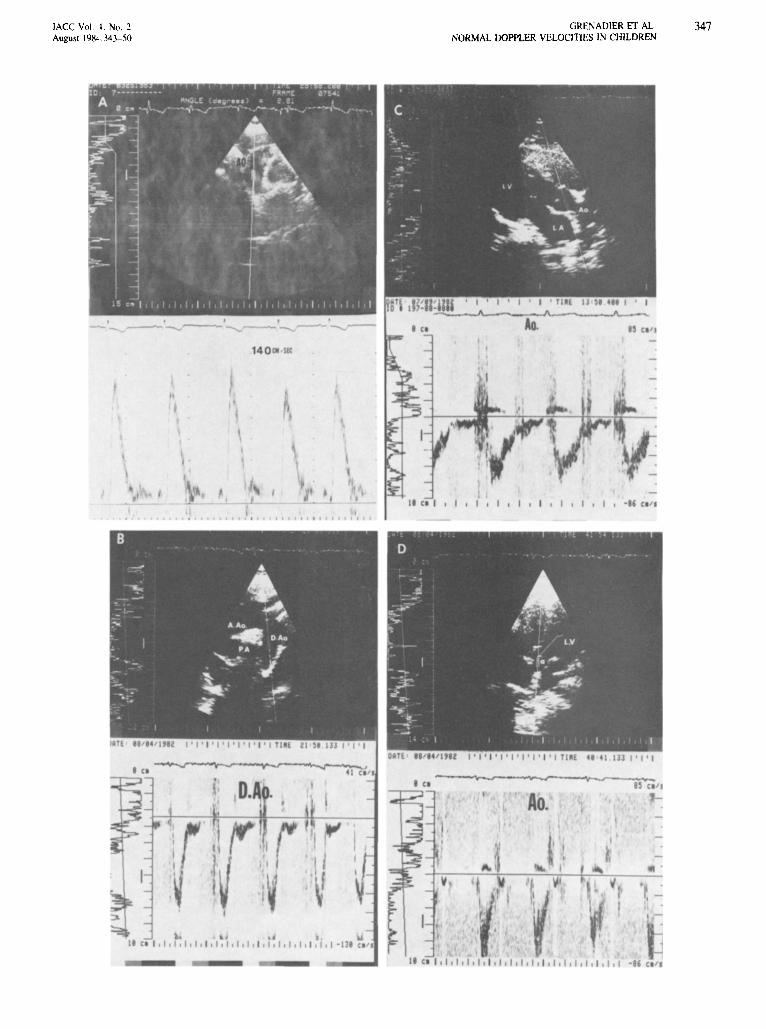
Figure 3. Aortic Doppler sampling sites. The suprasternal notchtwo-dimenional echocardiographic view allows nearly parallelDoppler sampling of the (A) ascending aorta (A.Ao) and (B) descending aorta (D.Ao). The angleof interrogation is printedin thetwo-dimensional echocardiographic imagerecorded from a newergeneration Doppler-echographic instrument and transducer modifiedforsuprasternal notchwork. Thecalibration dashes represent20 cm/s velocity levels. C and D are from the apical long-axisand subcostal view, respectively. See text and Figures I and 2 fordetails and abbreviations.
IACC Vol. I . No. 2August 198··.:343-50
t(l
..II CI I I I. I I , I , I , I , I ,I I I. I I. I I
GRENADIER ET AL.NORMAL DOPPLER VELOCITIES IN CHILDREN
, CI 'I
o.
\ -
.t CI I . I. I . I. I , I , I , I. I , I , I , I. I , I • I , I , I I I ." CI 'I
347
348 GRENADIER ET AL.NORMAL DOPPLER VELOCITIES IN CHILDREN
lACC Vol. 4, No.2August 1984:343-50
Table 1. Results of the Study With Data Expressed as Mean, Standard Deviation and Range for Spectral Width, Maximal Velocitythe Angle Theta and Angle-Corrected Maximal Velocity (in cm/s)
Angle-CorrectedSpectral Width Maximal Velocity Maximal Velocity
Subjects (cmls) (cmls) Angle ()COl (cmls)
Site Total NB Mean SD Range Mean SD Range Mean SD Range Mean SD Range
RA 22 0 22.2 7.1 12 to 41 46.1 7.8 38 to 60 9.4 8.2 oto 35 47.6 8.7 38 to 73.6TCYout 43 0 20.3 8.8 7 to 39 60.0 10.8 41 to 77 I\.7 7.5 oto 25 6\.8 I\.6 41 to 83.9MPA 97 28 14.5 5.3 3 to 30 73.2 12.0 50 to 100 13.1 8.7 oto 32 76.1 12.7 50.2 to 105.4
LA 22 0 20.5 8.7 10 to 40 57.6 8.6 45 to 80 7.5 6.6 oto 23 58.7 8.6 45 to 72.2MY out 48 0 18.1 7.5 7 to 35 78.2 12.5 61 to 120 13.5 9.3 oto 35 8\.1 13.3 58.9 to 92.2
Asc Ao 27 0 18.3 10.3 9 to 50 77.1 13.7 55 to 110 44.1 12.2 20 to 65 113.7 27.6 72.9 to 184.52 CH5 CH 29 9 16.9 7.3 5 to 39 68.7 11.5 45 to 90 37.5 12.5 10 to 55 89.6 14.8 64.3 to 114.4
SUBC 12 8 9.3 4.5 5 to 17 61.3 7.7 51 to 80 44.8 16.4 20 to 65 95.4 24.7 67 to 142SSN 23 0 18.0 9.5 5 to 38 84.3 13.8 58 to 112 14.9 9.4 5 to 40 88.5 15.4 60.2 to 115.7
Desc Ao 20 3 18.2 6.7 10 to 35 86.5 13.2 51 to 104 9.6 7.2 oto 27 88.4 13.3 5\.2 to 104
SSN
Asc Ao = ascending aorta; 2 CH = apical two chamber; 5 CH = apical five chamber; Desc Ao = descending aorta; LA = left atrium; MPA =
main pulmonary artery; MY out = mitral valve outflow tract; NB = newborn; RA = right atrium; SD = standard deviation; SSN = suprasternal notch;SUBC = subcostal; TCV out = tricuspid valve outflow tract.
outflows, The angle () was quite small in the suprasternalview image of the ascending and descending aorta, but wasgreatest when the aorta was interrogated from the subcostalleft ventricular outflow or apical long-axis views.
Angle-corrected peak velocities were generally lower onthe right side of the heart than on the left. When specificsites were compared (tricuspid versus mitral inflow and pulmonary versus aortic outflow), these differences were significant (p < 0.01). Furthermore, some age-related differences were present. Peak pulmonary velocities in 28 newborns(mean ± SD 67.7 ± 8.9 cm/s) were significantly lowerthan those obtained in older children (79.6 ± 12.5 cmis)(p < 0.01). No age-related differences were present whencomparisons were made for aortic velocities (newborn 89.3± 12.6 versus 89.8 ± 16.0 cmis; P = NS). No age-relateddifferences were noted at any other site.
When angle-corrected aortic velocitiesfrom different siteswere compared, the apical left ventricular outflow tract viewand suprasternal notch (ascending and descending) data wereall similar. Angle-corrected values for the aortic apical longaxis and subcostal approaches were significantly greater (p< 0.01) than values from any of the other sampling sites.These differences may have been due to inaccuracy in azimuthal angle of the sample volume at large interrogationangles or to obliquity in the left ventricular outflow scanningplane because it usually encountered a short length of theascending aorta.
When values for 10 subjects examined at all samplingsites by two different Doppler devices were compared, theangle-corrected maximal velocity data were nearly identical,the greatest individual discrepancy being 5 cmis.
DiscussionThis study provides normal values for quantitative intra
cardiac, transvalvular and great vessel Doppler flow velocities that, to date, have not been available from a largesystematically studied group of normal children.
The Doppler velocity curves reflect hemodynamic eventsoccurring in a chamber, across a valve, or within a vesselunder interrogation. Lowest peak velocities are found in theatria and on the right side of the heart when compared withthe left side of the heart, as previously noted by Hatle andAngelsen (33). Human (34) and animal (35) electromagneticflow meter velocity studies have demonstrated lower pulmonary peak flow velocities when compared with aortic flowvelocities.
Angle-corrected peak velocities. The values reportedin our study are generally lower than those reported by Hadeand Angelsen (33) for children; the data are closer to thosewhich they and Gardin et al. (36) reported for adults. Reasons for this are uncertain. When we compared the resultsof our examinations with the two two-dimensional Dopplerinstruments used in this study, the data were nearly identical.However, differences in instrumentation may explain someof the discrepancies. Those authors (33,36) used an M-modeDoppler approach with a single Doppler transducer guidedonly by the waveform and the audio outputs in an attemptto align with flow.
Maximal velocity data. These are most accurate whenthe interrogation angle is smallest. Azimuthal (elevational)angle cannot be measured and is probably greatest whenshort lengths of vessels are visualized as opposed to using
JACCVol. <c, No.2August 1984 343-50
GRENADIER ET AL.NORMAL DOPPLER VELOCITIES IN CHILDREN
349
"down or up the barrel" views. This might explain thediscrepant high velocities noted in aortas when the apicallong-axis and subcostal views were utilized. Since the subcostal plane of interrogation had limited usefulness or success except for obtaining flow information from the aortain newborns, in whom the aorta is close enough to be evaluated at a high pulse repetition frequency, the problem maynot be a practical one.
Quantitative angle-corrected velocities were significantlylower on the right than on the left side of the heart. Thedifferences are probably due to lower pressures and resistances on the right side of heart compared with those foundon the left side of the heart.
Conclusion. In this study, we were able to characterizeand measure normal Doppler velocity profiles for sites withinthe heart and great vessels in a group of normal children.These data should be useful for comparison with data obtained from children with various forms of congenital heartdisease that affect intracardiac, transvalvular or great vesselflow dynamics.
We thank Cheryl Czaplicki for typing and editing this manuscript andYvonne Carnahan and Linda Feldman for performing many of the echocardiographic examinations.
ReferencesI. Hatle L, Brubakk A, Tromsdal A, Angelsen B. Noninvasive assess
men: of pressure drop in mitral stenosis by Doppler ultrasound. BrHeaJ1 J 1978;40:131-40.
2. Holen J, Aaslid R, Landmark K, Simonsen S. Determination of pressure gradient in mitral stenosis with a noninvasive ultrasound Dopplertechnique. Acta Med Scand 1976;199:455-60.
3. Holen J, Simonsen S. Determination of pressure gradient in mitralstenosis with Doppler echocardiography. Br Heart J 1979;41:529-35.
4. Hatie L, Angelsen BA, Tromsdal A. Noninvasive assessment of aorticstenosis by Doppler ultrasound. Br Heart J 1980;43:284-92.
5. Holen J, Aaslid R, Landmark K, Simonsen S, Ostrem T. Determination of effective orifice area in mitral stenosis from noninvasiveultrasound Doppler data and mitral flow rate. Acta Med Scand1977;201:83-8.
6. Thuillez C, Theroux P, Bourassa MG, Blanchard D. Pulsed Dopplerechocardiographic study of mitral stenosis. Circulation 1980;61 :381-7.
7. Young JB, Quinones MA, Waggoner AD, Miller RR. Diagnosis andquantification of aortic stenosis with pulsed Doppler echocardiography. Am J Cardiol 1980;45:987-94.
8. Boughner DR. Assessment of aortic insufficiency by transcutaneousDoppler ultrasound. Circulation 1975;52:874-9.
9. Sequeira RF, Watt J. Assessment of aortic regurgitation by transcutaneous aortovelography. Br Heart J 1977;39:929-30.
10. Quinones MA, Young JB, Waggoner AD, Ostojic MC, Ribeiro LGT,Miller RR. Assessment of pulsed Doppler echocardiography in detection and quantification of aortic and mitral regurgitation. Br HeartJ 1980;44:612-20.
11. Benchimol A, Harris CL, Desser KB. Noninvasive diagnosis of tricuspid insufficiency utilizing the external Doppler flowmeter probe.Am J Cardiol 1973;32:868-73.
12. Abbasi AS, Allen MW, De Christofaro D, Ungar J. Detection andestimation of the degree of mitral regurgitation by range gated pulsedDoppler echocardiography. Circulation 1980;61:143-7.
13. Miyatake K, Kinoshita N, Nageta S, et aJ. Intracardiac flow patternin mitral regurgitation studied with combined use of the ultrasonicpulsed Doppler technique and cross-sectional echocardiography. AmJ Cardiol 1980;45:155-62.
14. Nichol PM, Boughner DR, Persand JA. Noninvasive assessment ofmitral regurgitation by transcutaneous Doppler ultrasound. Circulation1976;54:656-61.
15. Holen J, Simonsen S, Froysaker T. An ultrasound Doppler techniquefor the noninvasive determination of the pressure gradient in the BjorkShiley mitral valve. Circulation 1979;59:436-42.
16. Joyner CR, Harrison FS, Gruber JW. Diagnosis of hypertrophic subaortic stenosis with a Doppler velocity flow detector. Ann Intern Med1971;74:692-6.
17. Boughner DR, Shield RL, Persaud JA. Hypertrophic obstructive cardiomyopathy. Assessment of echocardiographic and Doppler ultrasound techniques. Br Heart J 1975;37:917-23.
18. Stevenson JG, Kawabori I, Dooley T, Guntheroth WG. Diagnosis ofventricular septal defect by pulsed Doppler echocardiography-s-sensitivity, specificity and limitations. Circulation 1978;58:322-6.
19. Magherini A, Azzolina G, Wiechmann V, Fantini F. Pulsed Dopplerechocardiography for diagnosis of ventricular septal defects. Br HeartJ 1980;43:143-7.
20. Hatle L, Rokseth R. Noninvasive diagnosis and assessment of ventricular septal defect by Doppler ultrasound. Acta Med Scand1981;645:47-56.
21. Stevenson JG, Kawabori I, Guntheroth WG. Noninvasive detectionof pulmonary hypertension in patent ductus arteriosus by pulsed Doppler echocardiography. Circulation 1979;60:355-9.
22. Feldtman RW, Andrassy RJ, Alexander JA, Stanford W. Dopplerultrasonic flow detection as an adjunct in the diagnosis of patent ductusarteriosus in premature infants. J Thorac Cardiovasc Surg1976;72:288-90.
23. Johnson SL, Rubenstein S, Kawabori I, Dooley DK, Baker DW. Thedetection of atrial septal defect by pulsed Doppler flowmeter (abstr).Circulation 1976;53(suppl II):II-168.
24. Goldberg SJ, Areias JC, Spitaels SEC, de Villeneuve VH. Use oftime interval histographic output from echo Doppler to detect left-toright atrial shunts. Circulation 1978;58:147-52.
25. Oliveira Lima C, Sahn OJ, Valdes-Cruz LM, et at. Noninvasive prediction of transvalvular pressure gradient in patients with pulmonarystenosis by quantitative two-dimensional echo Doppler studies. Circulation 1983;67:866-71.
26. Vargas Barron J, Sahn DJ, Valdes-Cruz LM, et at. Quantification ofthe ratio of pulmonary: systemic blood flow in patients with ventricularseptal defect by two-dimensional range gated Doppler echocardiography (abstr). Circulation 1982;66(suppl Il):II-318.
27. Kolettis M, Jenkins BS, Webb-Pebloe MM. Assessment of left ventricular function by indices derived from aortic flow velocity. Br HeartJ 1976;38:18-31.
28. Magnin PA, Stewart JA, Myers S, Von Ramm 0, Kisslo JA. Combined Doppler and phased array echocardiographic assessment of cardiac output. Circulation 1981;63:388-92.
29. Elkayam U, Gardin JM, Berkley BA, Hughes CA, Henry WL. Theuse of Doppler flow velocity measurements to assess the hemodynamicresponse to vasodilators in patients with heart failure. Circulation1983;67:377-83.
30. Huntsman LL, Stewart DK, Barnes SR, Franklin SB, Colocousis JS,Hessel EA. Noninvasive Doppler determination of cardiac output inman. Clinical validation. Circulation 1983;67:593-602.

350 GRENADIER ET AL.NORMAL DOPPLER VELOCITIES IN CHILDREN
lACC Vol. 4, No.2August 1984:343-50
31. Goldberg SJ, Allen HD, Sahn DJ. Pediatric and Adolescent Echocardiography:A Handbook. 2nd ed. Chicago: Year Book Medical,1980:104-19.
32. Sahn DJ, Anderson F. Two-Dimensional Anatomy of the Heart: AnAtlas for Echocardiographers. New York: John Wiley & Sons,1982:3-56.
33. Hatle L, Angelsen B. Doppler Ultrasound in Cardiology. PhysicalPrinciples and Clinical Applications. Philadelphia: Lea & Febiger,1982:72.
34. Murgo JP, Altobelli SA, Dorethy JF, Logsdon JR, McGranahan GH.Normal ventricular ejection dynamics in man during rest and exercise.In: Leon SF, Shaver JA, eds. Physiologic Principles of Heart Soundsand Murmurs. Dallas: American Heart Association, 1975:92.
35. Franklin DL, van Clitters RL, Rushmer RF. Balance between rightand left ventricular output. Circ Res 1962;10:17-26.
36. Gardin JM, Iseri LT, Elkayam U, et 'II. Use of Doppler echocardiography in the noninvasive assessment of left ventricular dysfunctionin patients with dilated cardiomyopathy(sbstr). Circulation 1980;62:200.
Related Documents