Norges Bank 1 Economic perspectives Charts Address by Governor Svein Gjedrem at the meeting of the Supervisory Council of Norges Bank on Thursday, 14 February 2008

Norges Bank 1 Economic perspectives Charts Address by Governor Svein Gjedrem at the meeting of the Supervisory Council of Norges Bank on Thursday, 14 February.
Dec 11, 2015
Welcome message from author
This document is posted to help you gain knowledge. Please leave a comment to let me know what you think about it! Share it to your friends and learn new things together.
Transcript
Norges Bank
1
Economic perspectives Charts
Address by Governor Svein Gjedrem at the meeting of the Supervisory Council of Norges
Bank on Thursday, 14 February 2008
Norges Bank
2
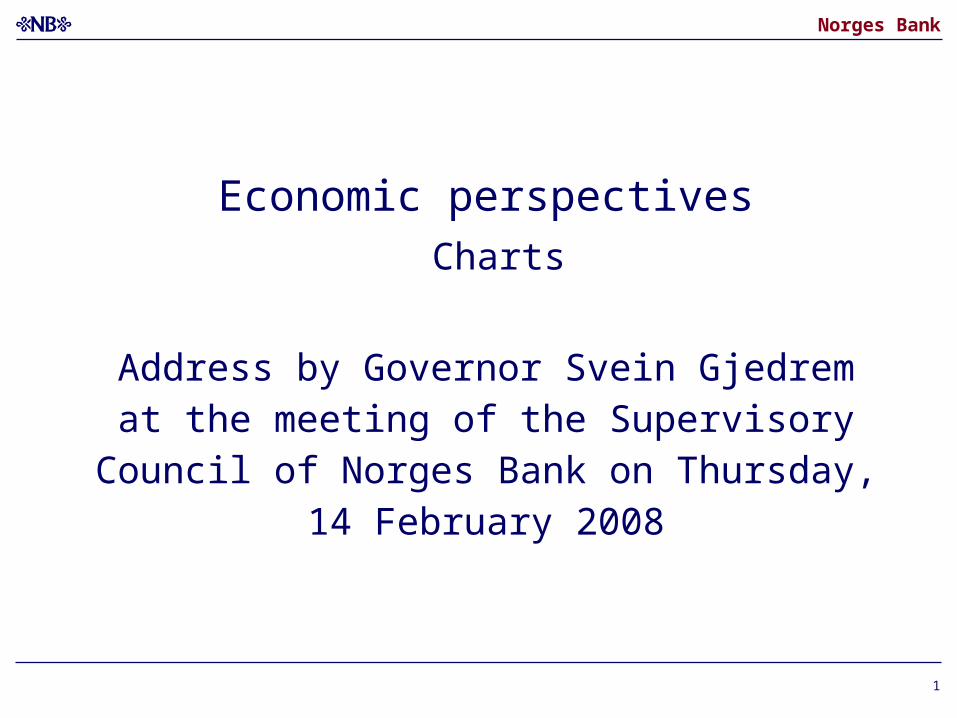
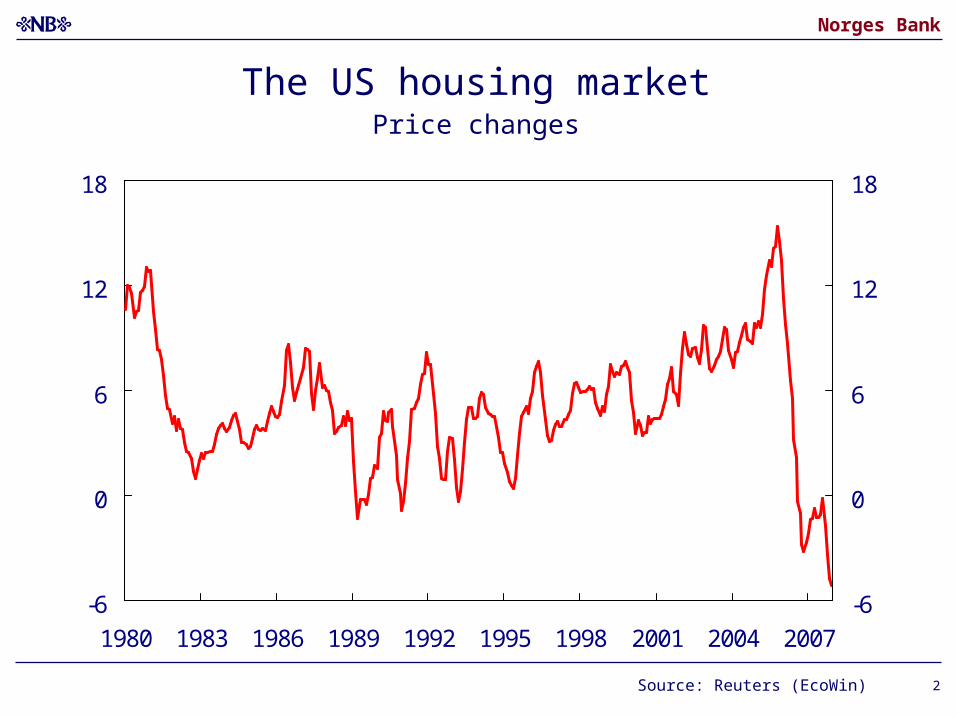
The US housing marketPrice changes
Source: Reuters (EcoWin)
-6
0
6
12
18
1980 1983 1986 1989 1992 1995 1998 2001 2004 2007
-6
0
6
12
18

Norges Bank
3Photo: AFP/SCANPIX
Norges Bank
4
80
90
100
110
120
Jan-07 Mar-07 May-07 Jul-07 Sep-07 Nov-07 Jan-08
80
90
100
110
120
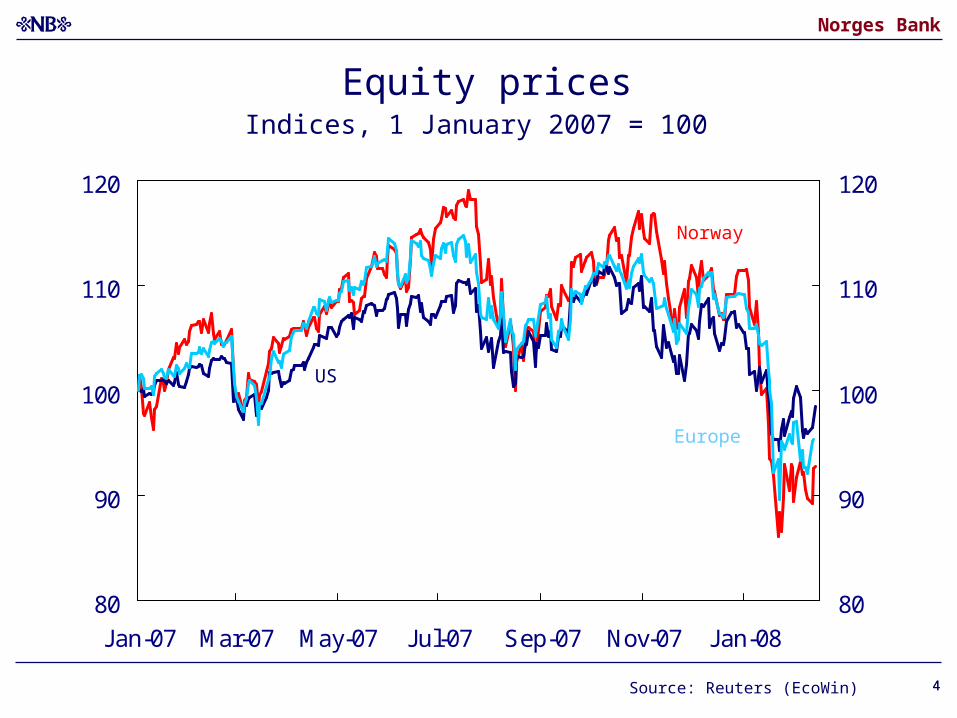
Equity pricesIndices, 1 January 2007 = 100
Source: Reuters (EcoWin)
US
Norway
Europe
4
Norges Bank
5
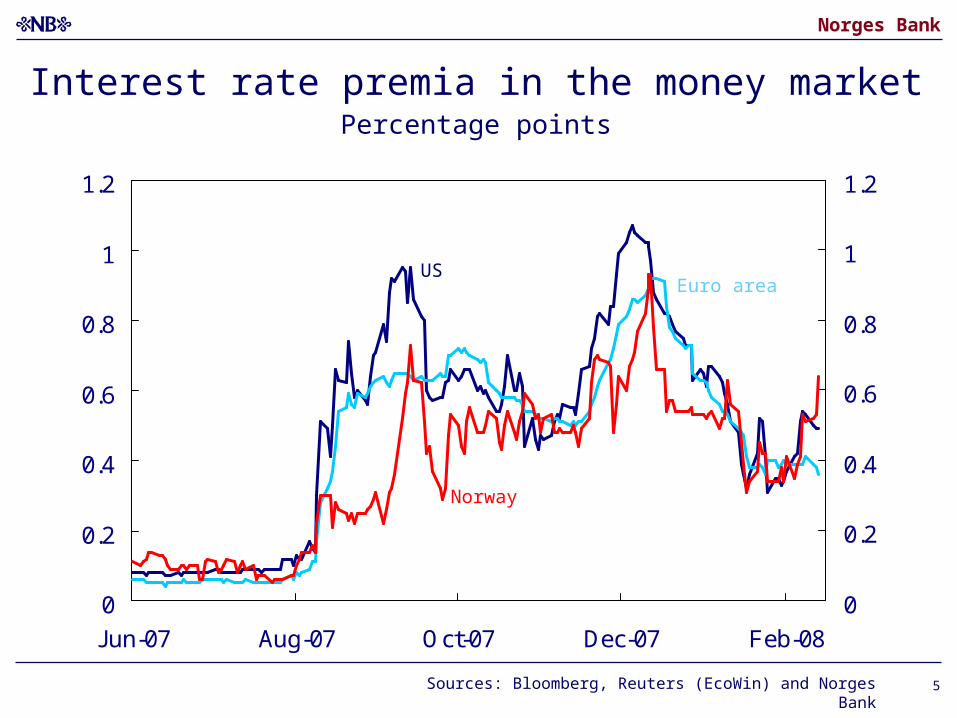
Interest rate premia in the money marketPercentage points
0
0.2
0.4
0.6
0.8
1
1.2
Jun-07 Aug-07 Oct-07 Dec-07 Feb-08
0
0.2
0.4
0.6
0.8
1
1.2
Norway
Sources: Bloomberg, Reuters (EcoWin) and Norges Bank
USEuro area
Norges Bank
6
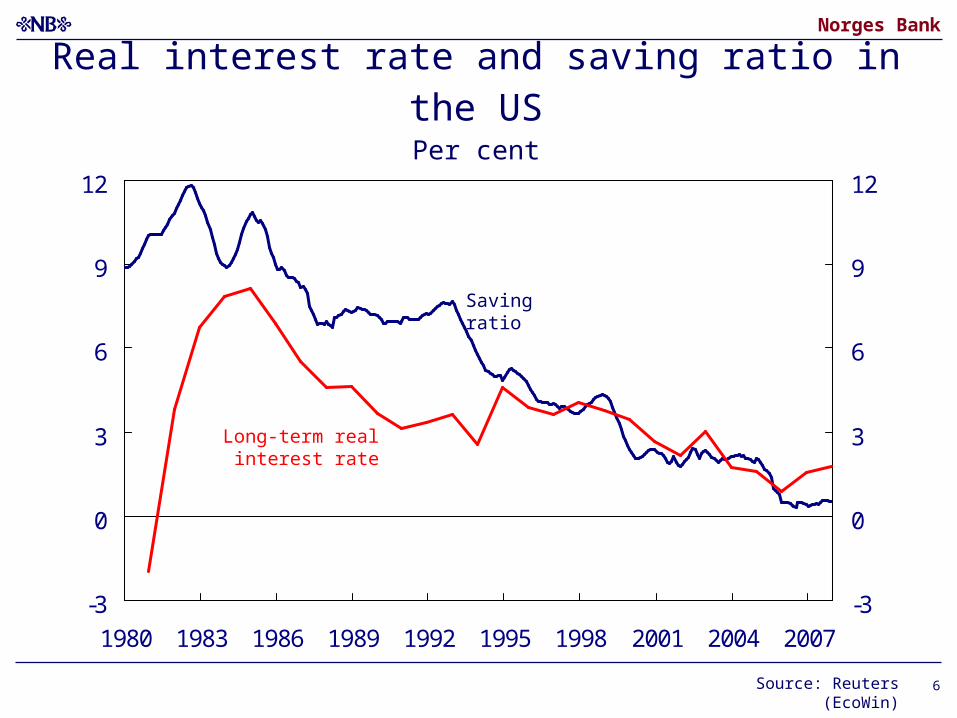
Real interest rate and saving ratio in the USPer cent
-3
0
3
6
9
12
1980 1983 1986 1989 1992 1995 1998 2001 2004 2007
-3
0
3
6
9
12
Source: Reuters (EcoWin)
Saving ratio
Long-term real interest rate
Norges Bank
7
-9
-6
-3
0
3
6
9
1980 1983 1986 1989 1992 1995 1998 2001 2004 2007
-9
-6
-3
0
3
6
9
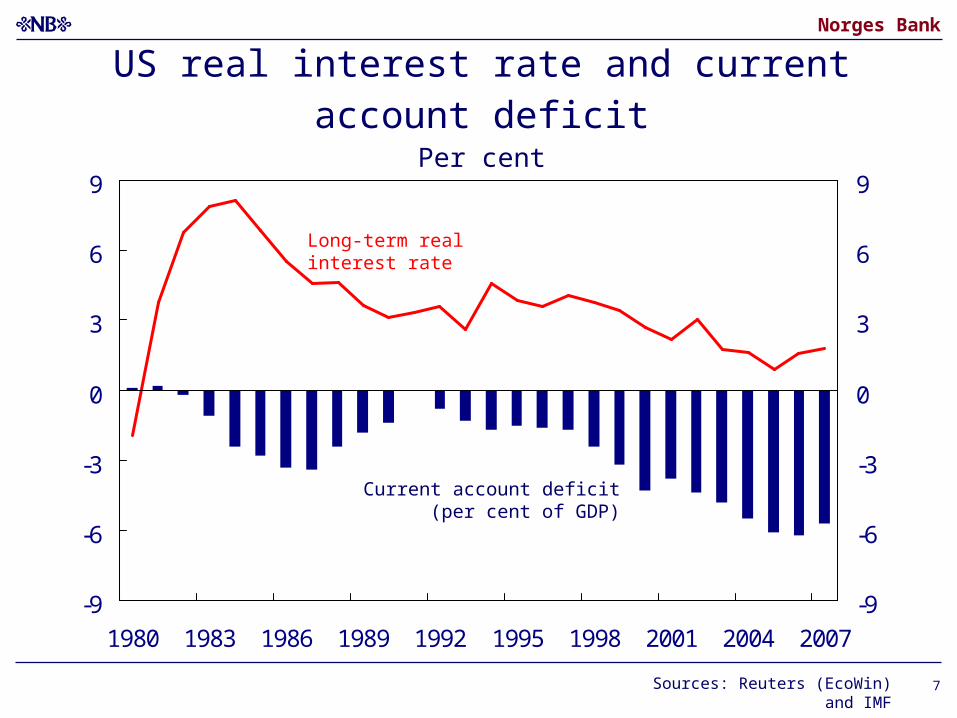
US real interest rate and current account deficitPer cent
Sources: Reuters (EcoWin) and IMF
Current account deficit(per cent of GDP)
Long-term real interest rate
Norges Bank
8
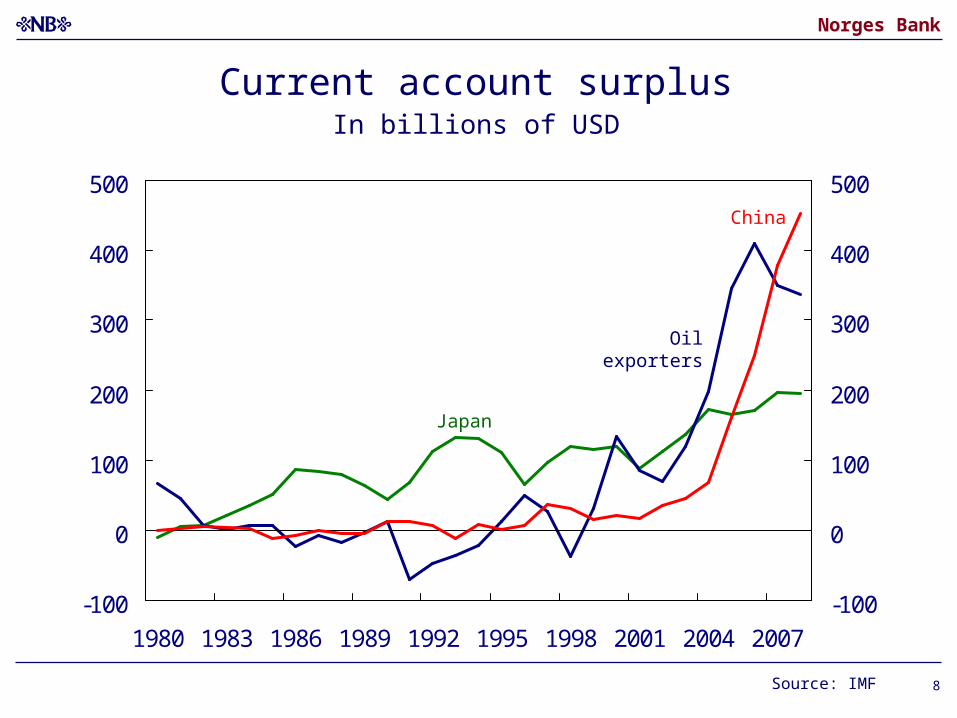
Current account surplusIn billions of USD
-100
0
100
200
300
400
500
1980 1983 1986 1989 1992 1995 1998 2001 2004 2007
-100
0
100
200
300
400
500
Source: IMF
Japan
Oil exporters
China
Norges Bank
9
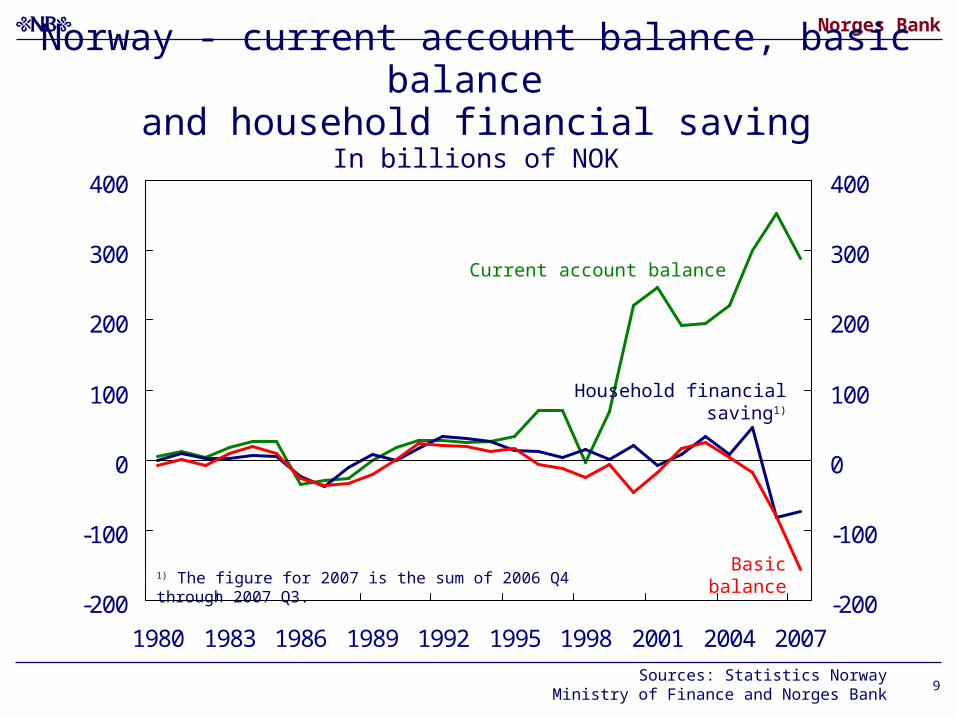
Norway - current account balance, basic balance and household financial saving
In billions of NOK
-200
-100
0
100
200
300
400
1980 1983 1986 1989 1992 1995 1998 2001 2004 2007
-200
-100
0
100
200
300
400
Sources: Statistics Norway Ministry of Finance and Norges Bank
1) The figure for 2007 is the sum of 2006 Q4 through 2007 Q3.
Current account balance
Basic balance
Household financial saving1)
Norges Bank
10
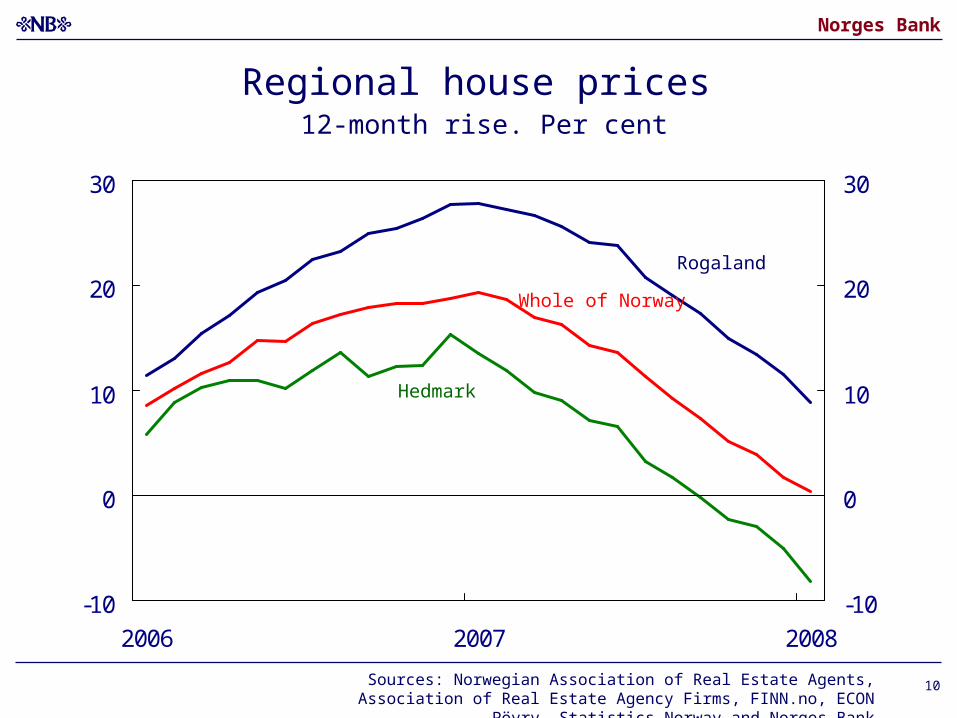
Regional house prices 12-month rise. Per cent
-10
0
10
20
30
2006 2007 2008
-10
0
10
20
30
Rogaland
Hedmark
Whole of Norway
Sources: Norwegian Association of Real Estate Agents, Association of Real Estate Agency Firms, FINN.no, ECON Pöyry, Statistics Norway and Norges Bank
Norges Bank
11
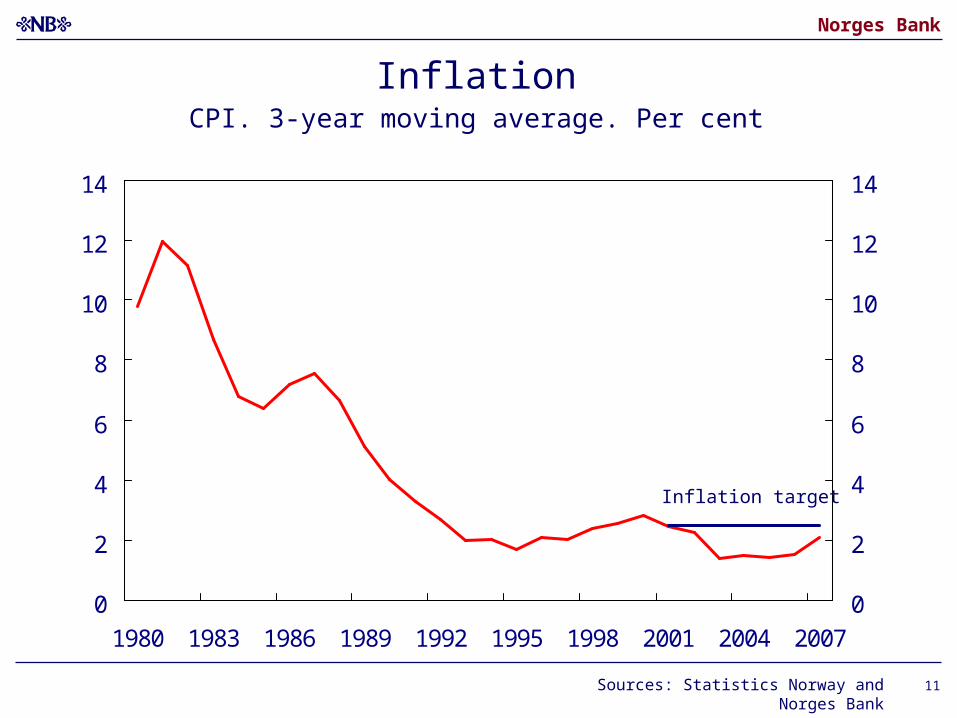
InflationCPI. 3-year moving average. Per cent
0
2
4
6
8
10
12
14
1980 1983 1986 1989 1992 1995 1998 2001 2004 2007
0
2
4
6
8
10
12
14
Sources: Statistics Norway and Norges Bank
Inflation target
Norges Bank
12
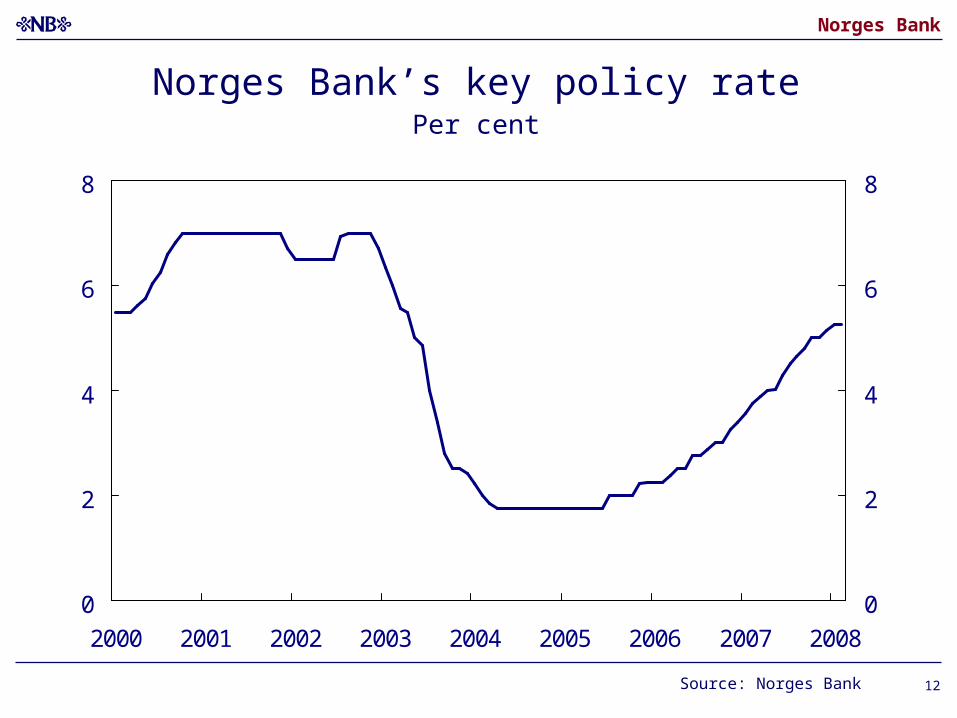
Norges Bank’s key policy ratePer cent
Source: Norges Bank
0
2
4
6
8
2000 2001 2002 2003 2004 2005 2006 2007 2008
0
2
4
6
8
Norges Bank
13
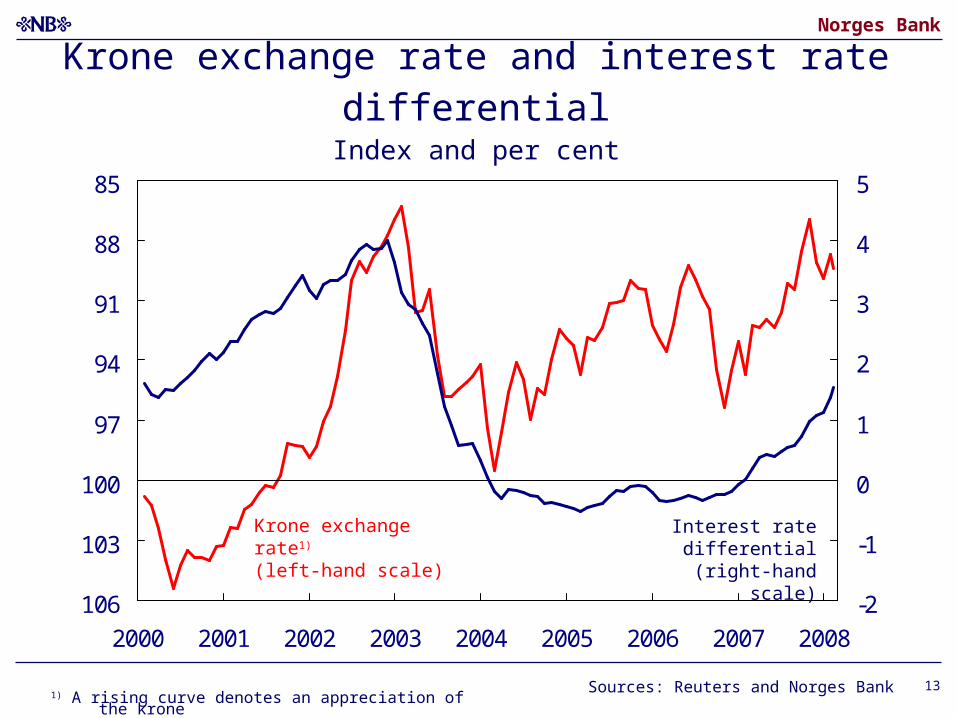
Krone exchange rate and interest rate differentialIndex and per cent
85
88
91
94
97
100
103
106
2000 2001 2002 2003 2004 2005 2006 2007 2008
-2
-1
0
1
2
3
4
5
Sources: Reuters and Norges Bank
Krone exchange rate1)
(left-hand scale)Interest rate differential
(right-hand scale)
1) A rising curve denotes an appreciation of the krone
Norges Bank
14
-10
10
30
50
1970 1980 1990 2000
0
5
10
15
20
25
30
35
40
2004 2005 2006 2007
Romania
Latvia
Estland
Litauen
Polen
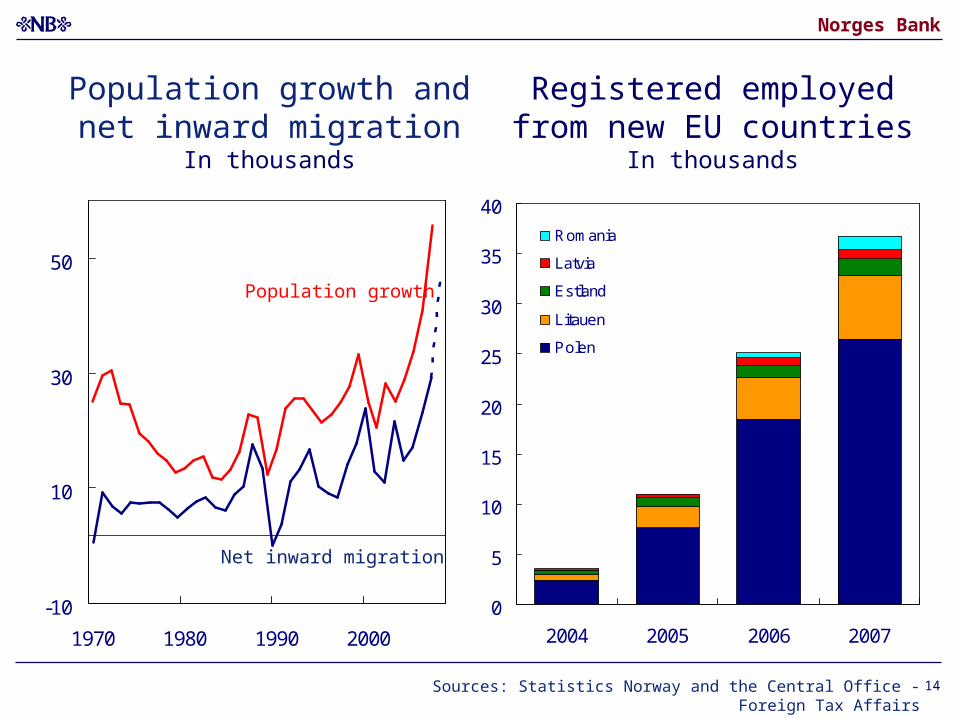
Registered employed from new EU countries
In thousands
Population growth and net inward migration
In thousands
Population growth
Net inward migration
Sources: Statistics Norway and the Central Office - Foreign Tax Affairs
Norges Bank
15
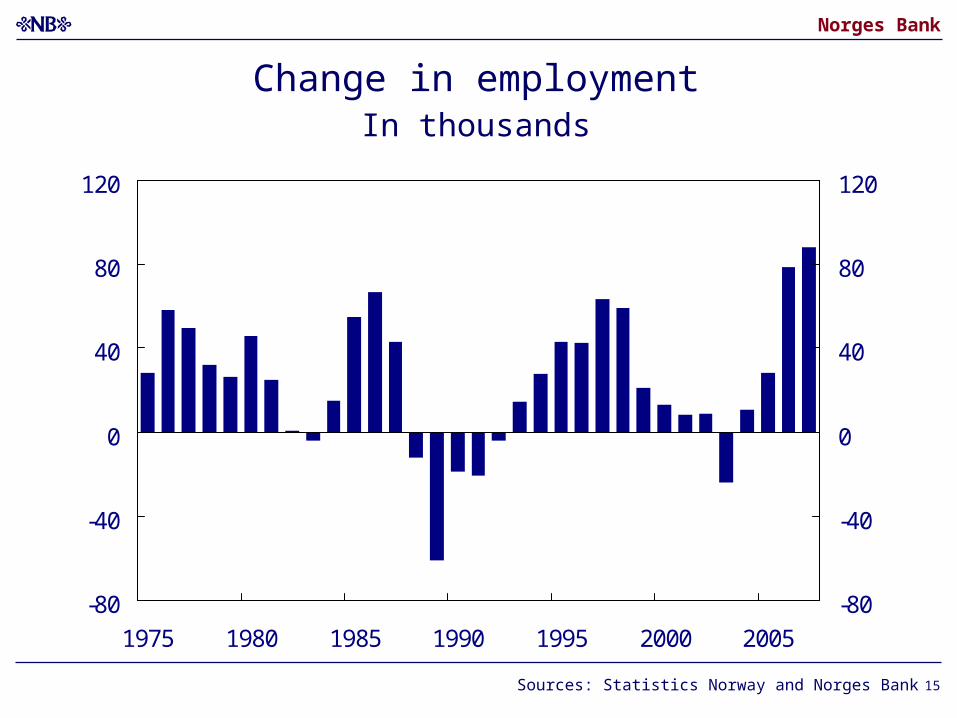
Change in employmentIn thousands
-80
-40
0
40
80
120
-80
-40
0
40
80
120
1975 1980 1985 1990 1995 2000 2005
Sources: Statistics Norway and Norges Bank
Norges Bank
16
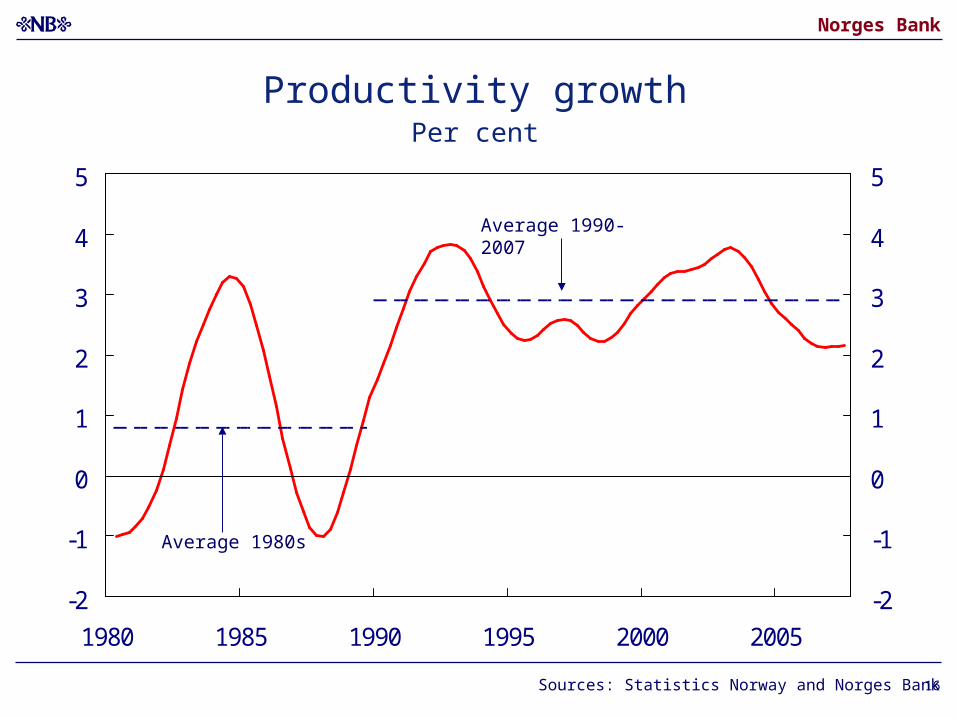
Productivity growthPer cent
-2
-1
0
1
2
3
4
5
1980 1985 1990 1995 2000 2005
-2
-1
0
1
2
3
4
5
Sources: Statistics Norway and Norges Bank
Average 1980s
Average 1990-2007
Norges Bank
17
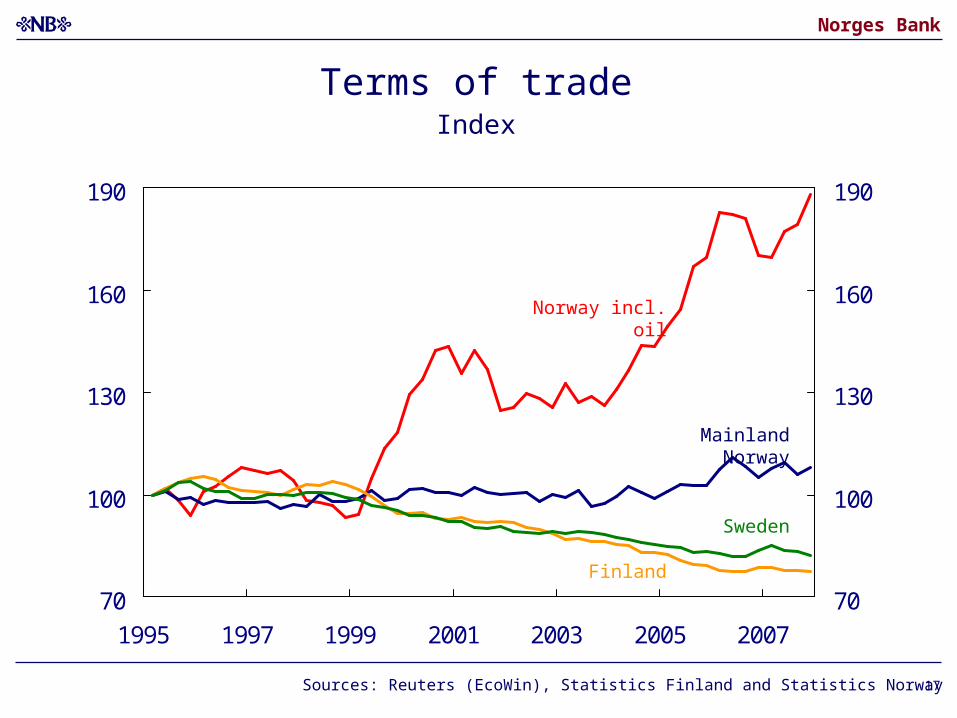
Terms of tradeIndex
70
100
130
160
190
1995 1997 1999 2001 2003 2005 2007
70
100
130
160
190
Mainland Norway
Norway incl. oil
Sources: Reuters (EcoWin), Statistics Finland and Statistics Norway
Sweden
Finland
Norges Bank
18
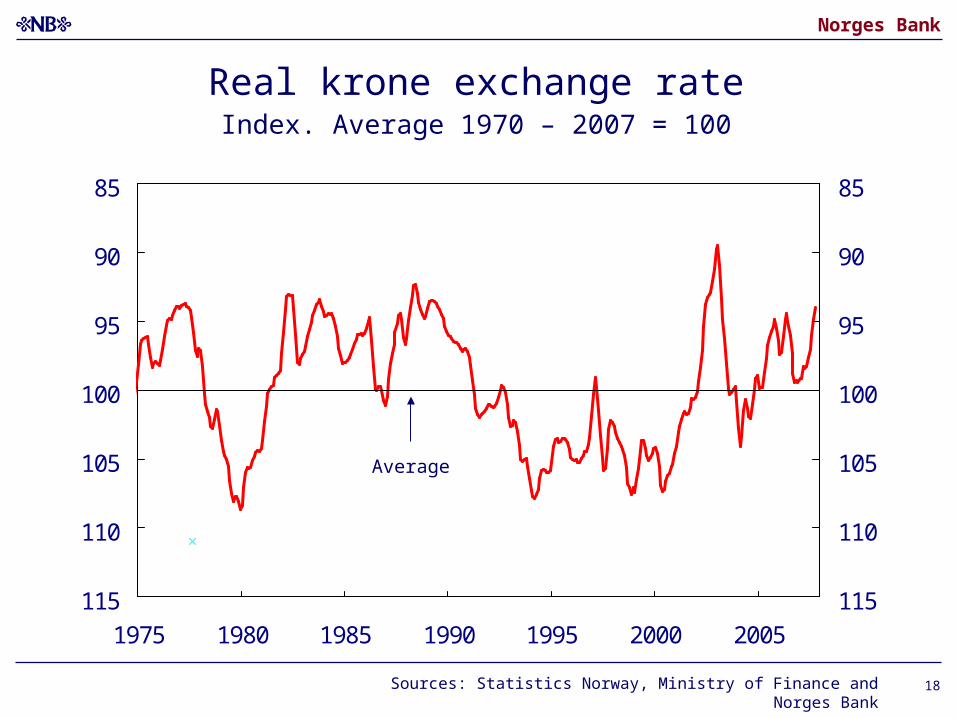
Real krone exchange rateIndex. Average 1970 – 2007 = 100
85
90
95
100
105
110
115
1975 1980 1985 1990 1995 2000 2005
85
90
95
100
105
110
115
Sources: Statistics Norway, Ministry of Finance and Norges Bank
Average
Norges Bank
19
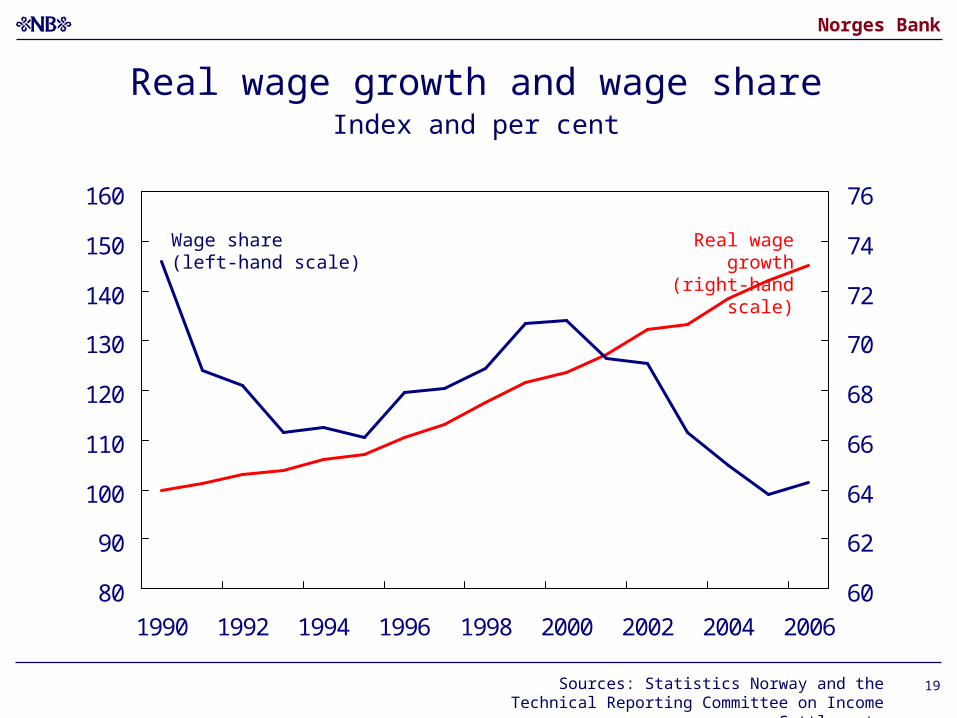
Real wage growth and wage shareIndex and per cent
80
90
100
110
120
130
140
150
160
1990 1992 1994 1996 1998 2000 2002 2004 2006
60
62
64
66
68
70
72
74
76
Sources: Statistics Norway and the Technical Reporting Committee on Income Settlements
Real wage growth(right-hand scale)
Wage share (left-hand scale)
Norges Bank
20
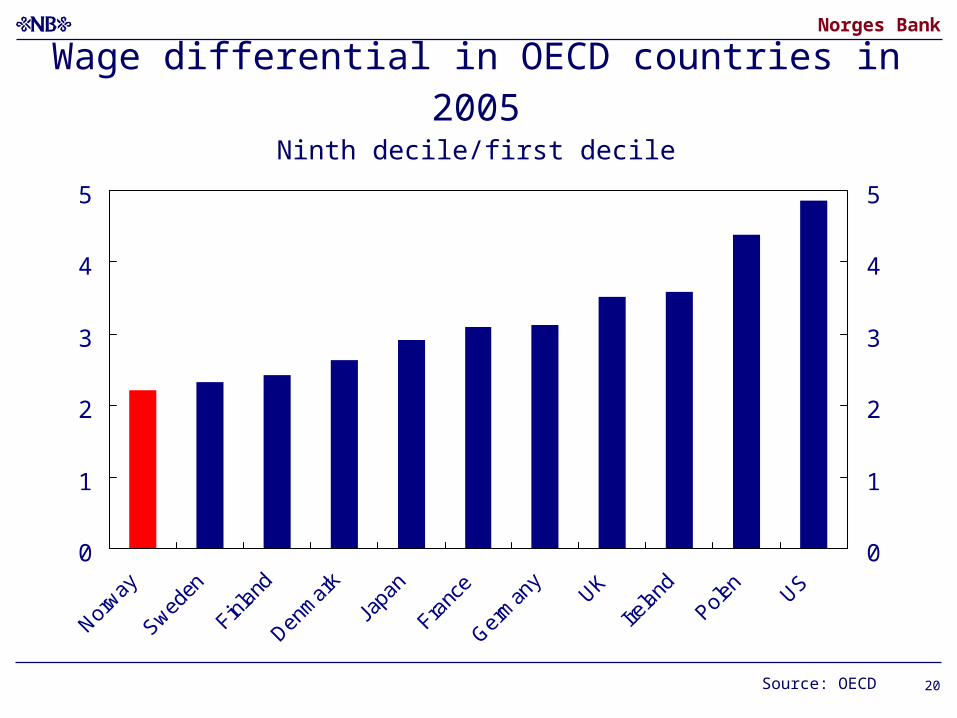
Wage differential in OECD countries in 2005Ninth decile/first decile
0
1
2
3
4
5
Norway
Sweden
Finlan
d
Denm
ark
Japa
n
Franc
e
Germ
any
UK
Irelan
d
Polen
US
0
1
2
3
4
5
Source: OECD
Norges Bank
21
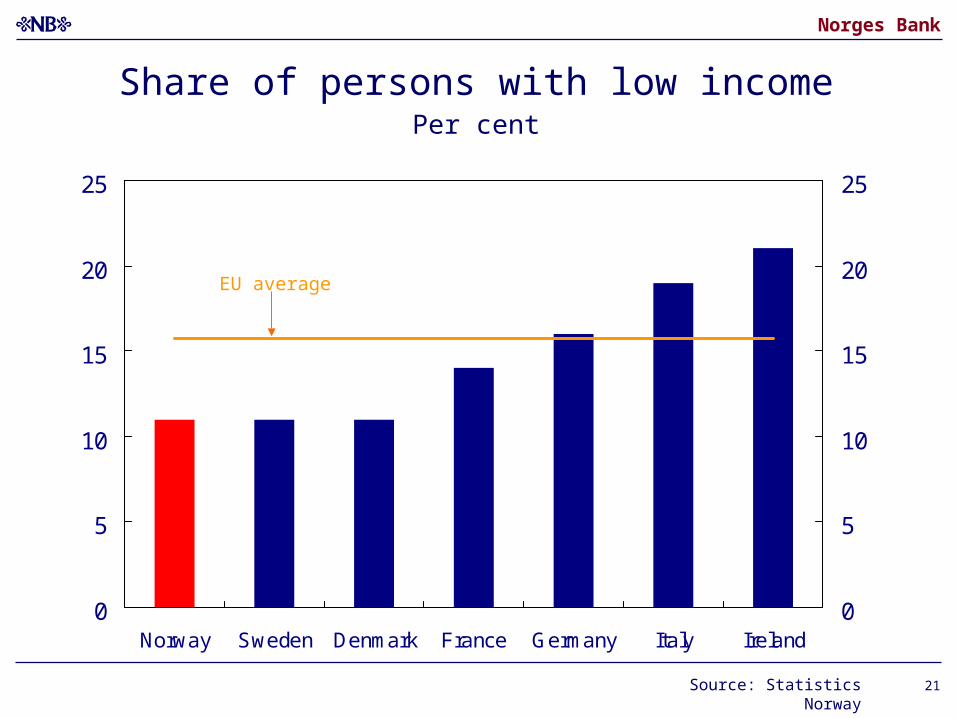
Share of persons with low incomePer cent
0
5
10
15
20
25
Norway Sweden Denmark France Germany Italy Ireland0
5
10
15
20
25
Source: Statistics Norway
EU average
Norges Bank
22
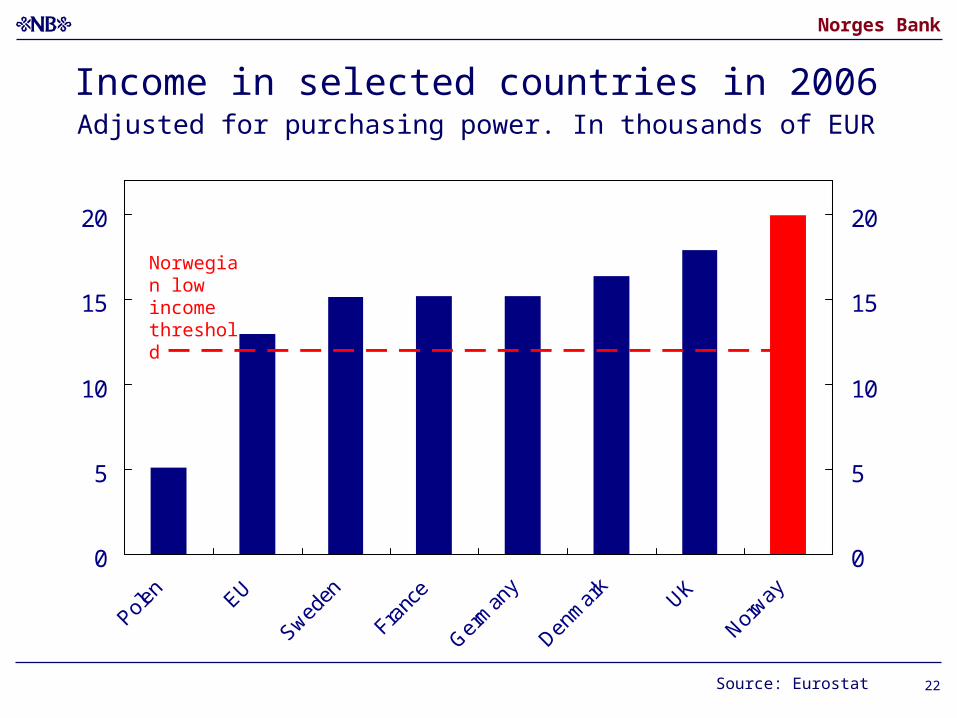
Income in selected countries in 2006Adjusted for purchasing power. In thousands of EUR
0
5
10
15
20
Polen EU
Sweden
Franc
e
Germ
any
Denm
ark
UK
Norway
0
5
10
15
20
Source: Eurostat
Norwegian low income threshold
Norges Bank
23
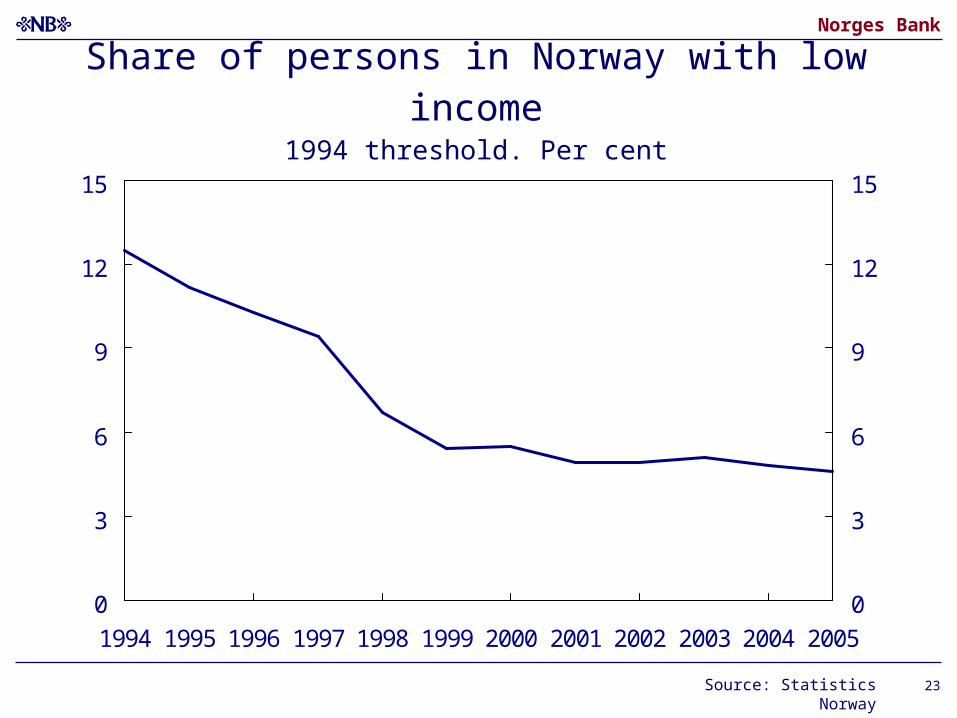
Share of persons in Norway with low income1994 threshold. Per cent
0
3
6
9
12
15
1994 1995 1996 1997 1998 1999 2000 2001 2002 2003 2004 2005
0
3
6
9
12
15
Source: Statistics Norway
Norges Bank
24
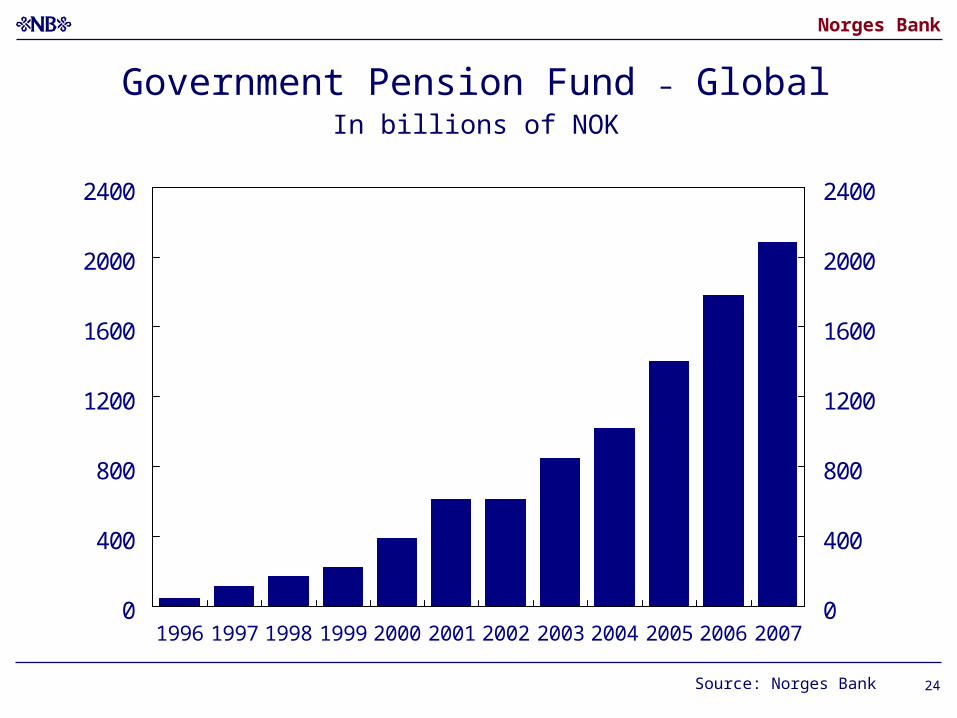
Government Pension Fund – GlobalIn billions of NOK
0
400
800
1200
1600
2000
2400
1996 1997 1998 1999 2000 2001 2002 2003 2004 2005 2006 20070
400
800
1200
1600
2000
2400
Source: Norges Bank
Norges Bank
25
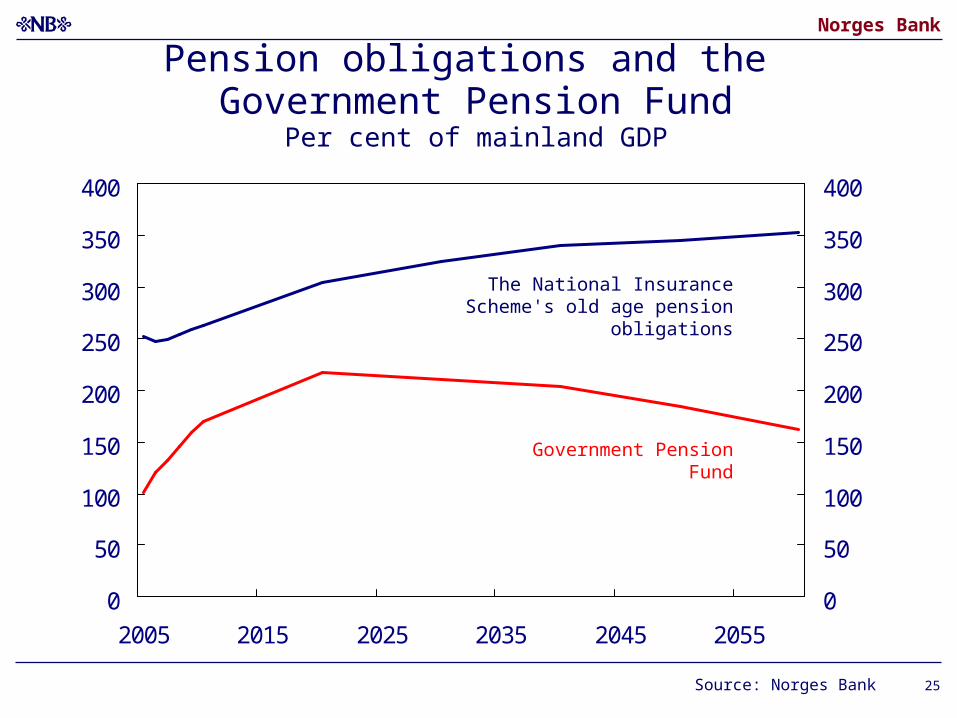
Pension obligations and the Government Pension Fund
Per cent of mainland GDP
0
50
100
150
200
250
300
350
400
2005 2015 2025 2035 2045 2055
0
50
100
150
200
250
300
350
400
The National Insurance Scheme's old age pension obligations
Government Pension Fund
Source: Norges Bank
Norges Bank
26
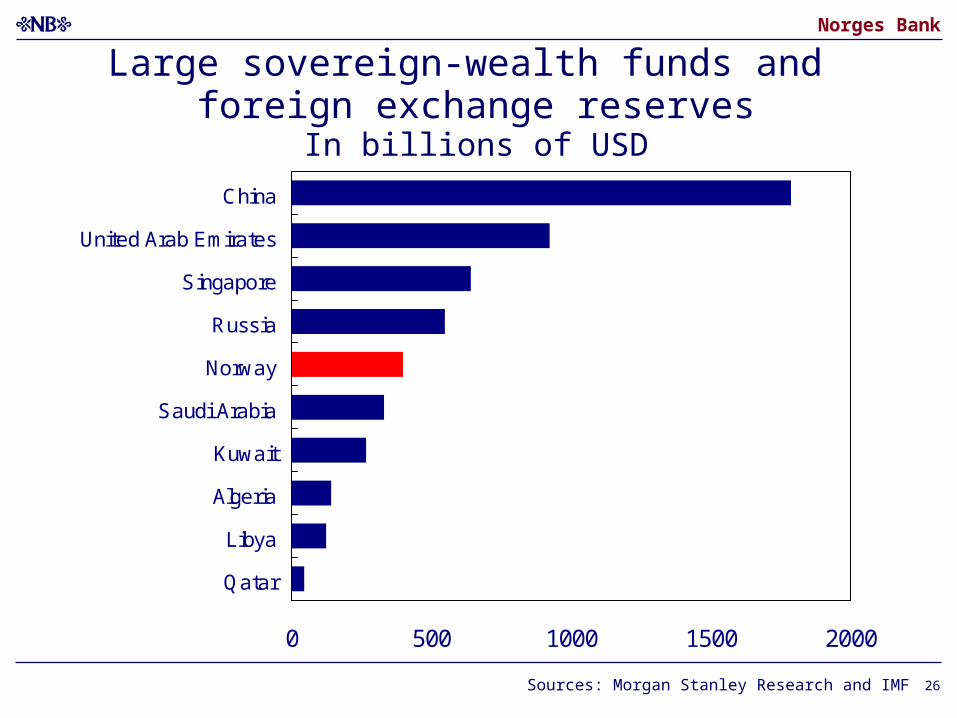
Large sovereign-wealth funds and foreign exchange reserves
In billions of USD
0 500 1000 1500 2000
China
United Arab Emirates
Singapore
Russia
Norway
Saudi Arabia
Kuwait
Algeria
Libya
Qatar
Sources: Morgan Stanley Research and IMF
Related Documents