Norfolk County – Asset Management Plan – Roads An overview of the County’s Asset Management Practices based on the Ontario Ministry of Infrastructure’s Building Together Initiative Prepared for: Norfolk County 183 Main St. Delhi, Ontario N4B 2M3 Prepared by: Stantec Consulting Ltd. 49 Frederick St. Kitchener, Ontario February 21, 2014

Welcome message from author
This document is posted to help you gain knowledge. Please leave a comment to let me know what you think about it! Share it to your friends and learn new things together.
Transcript

Norfolk County – Asset Management Plan – Roads
An overview of the County’s Asset Management Practices based on the Ontario Ministry of Infrastructure’s Building Together Initiative
Prepared for: Norfolk County 183 Main St. Delhi, Ontario N4B 2M3
Prepared by: Stantec Consulting Ltd. 49 Frederick St. Kitchener, Ontario
February 21, 2014


Sign-off Sheet
This document entitled Norfolk County – Asset Management Plan – Roads was prepared by Stantec Consulting Ltd. for the account of Norfolk County. The material in it reflects Stantec’s best judgment in light of the information available to it at the time of preparation. Any use which a third party makes of this report, or any reliance on or decisions made based on it, are the responsibilities of such third parties. Stantec Consulting Ltd. accepts no responsibility for damages, if any, suffered by any third party as a result of decisions made or actions based on this report.
Prepared by (signature)
Andy Dalziel, B.Eng. Principal Infrastructure Management & Pavement Engineering


NORFOLK COUNTY – ASSET MANAGEMENT PLAN – ROADS
Table of Contents
EXECUTIVE SUMMARY ............................................................................................................. III
1.0 INTRODUCTION ...........................................................................................................1.1 1.1 GOALS AND OBJECTIVES .............................................................................................. 1.1
1.1.1 Scope of Work .............................................................................................. 1.1
2.0 STATE OF LOCAL INFRASTRUCTURE .............................................................................2.1 2.1 ROADS ............................................................................................................................. 2.2
2.1.1 Valuations ..................................................................................................... 2.4 2.1.2 Age and Remaining Service Life ............................................................... 2.5 2.1.3 Asset Condition ............................................................................................ 2.8 2.1.4 ‘NOW’ Needs ............................................................................................... 2.9 2.1.5 ‘1 to 5’ Year Needs ...................................................................................... 2.9 2.1.6 ‘6 to 10’ Year Needs .................................................................................... 2.9 2.1.7 ‘ADEQ’ ........................................................................................................ 2.10 2.1.8 Asset Data Maintenance Strategy ......................................................... 2.10
3.0 DESIRED LEVELS OF SERVICE .......................................................................................3.1
4.0 ASSET MANAGEMENT STRATEGY ................................................................................4.1 4.1 NON-INFRASTRUCTURE SOLUTIONS .............................................................................. 4.1 4.2 MAINTENANCE ACTIVITIES ............................................................................................. 4.1 4.3 REHABILITATION ACTIVITIES ........................................................................................... 4.4 4.4 REPLACEMENT ACTIVITIES.............................................................................................. 4.5 4.5 DISPOSAL ACTIVITIES ...................................................................................................... 4.5 4.6 EXPANSION ACTIVITIES .................................................................................................. 4.5 4.7 PROCUREMENT METHODS ............................................................................................. 4.6 4.8 RISKS ................................................................................................................................. 4.6 4.9 ASSET MANAGEMENT PLAN FUTURE UPDATES ............................................................ 4.7
5.0 FINANCING STRATEGY ................................................................................................5.1 5.1 HISTORICAL INVESTMENTS ............................................................................................. 5.1 5.2 FUTURE INVESTMENT REQUIREMENTS ............................................................................ 5.1 5.3 BUDGET PROJECTIONS - CAPITAL ................................................................................ 5.2
ch \\cd1004-f01\01620\active\162010337\phase\report\final_draft\rpt_norfolk_amp_roads_20140221.docx i
NORFOLK COUNTY – ASSET MANAGEMENT PLAN – ROADS
LIST OF TABLES Table 2.1: Road Network Inventory Summary ....................................................................... 2.3 Table 2.2: Roadside Assets Not Included in Asset Management Plan ............................... 2.3 Table 2.3: FIR Schedule of Tangible Capital Assets (Schedule 51) ..................................... 2.4 Table 2.4: Road Network Replacement Value ..................................................................... 2.4 Table 3.1: Improvement Recommendations by Time of Need ........................................... 3.1 Table 4.1: Rehabilitation Recommendations by Time of Need .......................................... 4.4 Table 4.2: Replacement Recommendations by Time of Need .......................................... 4.5 Table 4.3: Risks Associated with Not Reaching Defined Level of Service Targets ............ 4.6 Table 5.1: FIR Schedule of Operating Expenses (Schedule 40) ........................................... 5.1 Table 5.2: Improvement Recommendations by Time of Need ........................................... 5.1 Table 5.3 : Budget Projections & Funding Sources 2014 - 2023 ........................................... 5.2
LIST OF FIGURES Figure 2.1: Asset Replacement Value per Serviced Property ............................................. 2.2 Figure 2.2: Remaining Service Life ........................................................................................... 2.6 Figure 2.3: Condition Rating ..................................................................................................... 2.7 Figure 2.4: ‘NOW’ Need Road ................................................................................................. 2.9 Figure 2.5: ‘1 to 5’ Year Needs ................................................................................................. 2.9 Figure 2.6: ‘6 to 10’ Year Need ................................................................................................ 2.9 Figure 2.7: ADEQ ...................................................................................................................... 2.10 Figure 4.1: Impact of Different Maintenance Strategies on Pavement Performance .... 4.2 Figure 4.2: Alternative Maintenance Strategies .................................................................... 4.3 Figure 4.3: Deterioration vs. Treatment Selection .................................................................. 4.3
ii ch \\cd1004-f01\01620\active\162010337\phase\report\final_draft\rpt_norfolk_amp_roads_20140221.docx

NORFOLK COUNTY – ASSET MANAGEMENT PLAN – ROADS
Executive Summary
Municipalities are stewards of Community infrastructure. Well-managed infrastructure fosters prosperity, growth, and quality of life for a Community’s residents, businesses, and visitors.
Most Canadian municipalities are struggling to maintain existing infrastructure under current tax and rate levels. They continue to deal with downloaded responsibilities and, at the same time, face growing needs to maintain and renew aged and decaying infrastructure.
The subject of asset management has been gaining increasing public awareness as a result of the introduction of Bill 175, the Sustainable Water and Sewage Systems Act in 2002, and the implementation of “Full Cost Accounting” through the Public Sector Accounting Board (PSAB). The emphasis is now being placed on not only knowing the true cost of providing services to your customers today, but also understanding what will be required to maintain the services virtually in perpetuity (or as long as they are required), through the use of life cycle costing. In other words, we are moving towards Sustainable Asset Management.
Ontario’s Ministry of Infrastructure has also recently released guidelines for the development of Municipal Asset Management Plans, which supports the Province’s 10-year infrastructure plan “Building Together”. The objective of these guidelines is to provide a basis for the standardization and consistency of asset management practices across Ontario’s municipalities.
This document follows the Ministry’s guidelines for the development of an Asset Management Plan for Roads (pavements), Bridges, and Large Culverts.
Road Network
The condition of the County’s road network was assessed generally in accordance with the Ministry of Transportation Ontario (MTO) Inventory Manual for Municipal Roads from 1991 (Inventory Manual or IM). The results of this condition assessment are summarized with the report entitled 2013 Road Needs Study Update. The condition survey identifies the condition of each road asset by its time of need and recommended rehabilitation strategy.
The Road Needs Study provides an overview of the overall condition of the road system, by road section, including such factors as structural adequacy, drainage, and surface condition. The study also provides an indication of apparent deficiencies in horizontal and vertical alignment elements as per the Ministry of Transportation Ontario’s manual, Geometric Design Standards for Ontario Highways.
The study provides an overview of the physical and financial needs of the road system at a network level, which can be used for programming and budgeting. However, once a road
ch \\cd1004-f01\01620\active\162010337\phase\report\final_draft\rpt_norfolk_amp_roads_20140221.docx iii

NORFOLK COUNTY – ASSET MANAGEMENT PLAN – ROADS
section reaches the project design stage, further detailed review, investigation, and design is required to address the specific requirements of the project.
The County’s road assets are summarized in the following table:
Table ES.1: Surface Type and Roadside Environment
Surface Type
Lane-km
Roadside Environment Total % of
Total Rural
Semi-Urban Urban
Asphalt on Concrete 0.80 0.80 0.0%
Earth 69.88 0.54 70.42 1.7%
Gravel, Stone, Other Loosetop 125.20 7.10 132.30 3.2%
High Class Bituminous - asphalt 903.55 119.40 377.88 1,400.83 34.3%
Int. Class Bituminous - Mulch 2.76 2.76 0.1%
Low Class Bituminous - surface treated 2,280.41 179.56 19.71 2,479.68 60.7%
Total 3,379.04 310.16 397.59 4,086.79
% of Total 82.7% 7.6% 9.7%
The current replacement value of these road assets is estimated to be approximately $1.4 billion; therefore, the County’s road network represents a significant asset portfolio that must be maintained to ensure safe travel for the residents of the County and other road users.
The County has implemented WorkTech’s Asset Manager Foundation software, which includes pavement management capabilities that allow the assessment of the current pavement conditions, predict pavement deterioration, determine current and future maintenance, rehabilitation, and replacement needs, and calculate funding requirements to attain desired levels of service.
The field assessment utilized the WorkTech software to capture the pavement condition data, as well as drainage, surface condition, maintenance demand, instances of substandard vertical and horizontal alignment, dimensional information, and other attributes. The information was used to score each section based on the Inventory Manual, which classifies roads as ‘NOW’, ‘1 to 5’, or ‘6 to 10’ year needs for reconstruction. The Time of Need is a prediction of the time until the road requires reconstruction, not the time frame until action is required. For example, a road may be categorized as a ‘6 to 10’ year need with a resurfacing recommendation. This road should be resurfaced as soon as possible, to further defer the need to reconstruct.
‘NOW’ needs represent road sections that require reconstruction or major rehabilitation due to the level of deterioration. The ‘NOW’ needs are the backlog of work required on the road system; however, ‘NOW’ needs may not necessarily be the priority, depending on funding levels.
iv ch \\cd1004-f01\01620\active\162010337\phase\report\final_draft\rpt_norfolk_amp_roads_20140221.docx

NORFOLK COUNTY – ASSET MANAGEMENT PLAN – ROADS
Construction improvements identified within this time period are representative of roads that have little or no service life left and are in poor condition.
‘1 to 5’ identifies road sections where reconstruction is anticipated within the next five years, based upon a review of their current condition. These roads can be good candidates for resurfacing treatments that would extend the life of the road (depending on any other deficiencies), deferring the need to reconstruct.
‘6 to 10’ identifies road sections where reconstruction improvements are anticipated within six to ten years, based upon a review of their current condition. These roads can be good candidates for resurfacing treatments that would extend the life of the road (depending on any other deficiencies), thus deferring the need to reconstruct.
‘ADEQ’ identifies road sections that do not have reconstruction or resurfacing needs, although minor maintenance such as crack sealing or spot drainage improvements may be required.
Table ES.2 summarizes the improvement recommendations identified through the analysis carried out in the asset management system by time of need.
Table ES.2: Improvement Recommendations by Time of Need
Improvement Class
Time of Need
Total NOW 1-5 6-10 ADEQ
CL-km Cost
(million) CL-km Cost
(million) CL-km Cost
(million) CL-km Cost
(million) CL-km Cost $ (million)
Construction 462.04 $204.2 226.77 $85.1 90.20 $33.0 60.53 $30.6 839.53 $352.9
Rehabilitation 73.1 $11.1 148.87 $34.7 178.89 $18.3 2.59 $0.1 403.45 $64.2
Maintenance 3.46 $- 0.68 $- 383.84 $- 97.82 $0.1 485.80 $0.1
No Treatment 301.28 301.28
Total 538.6 $215.3 376.32 $119.8 652.93 $51.3 462.22 $30.8 2,030.06 $417.2
Through the Road Needs Study the investment required to address the NOW needs is estimated to be $215.3 million with an additional $171.1 million estimated to address roads which require some form of rehabilitation as soon as possible to slow their deterioration to the point where a reconstruction treatment would be required.
It should be noted that the needs identified in Table ES.2 represent the current reconstruction backlog as well as the timing that the remaining roads in the network will reach the point where they would require reconstruction to return them to an adequate (ADEQ) condition.
ch \\cd1004-f01\01620\active\162010337\phase\report\final_draft\rpt_norfolk_amp_roads_20140221.docx v
NORFOLK COUNTY – ASSET MANAGEMENT PLAN – ROADS
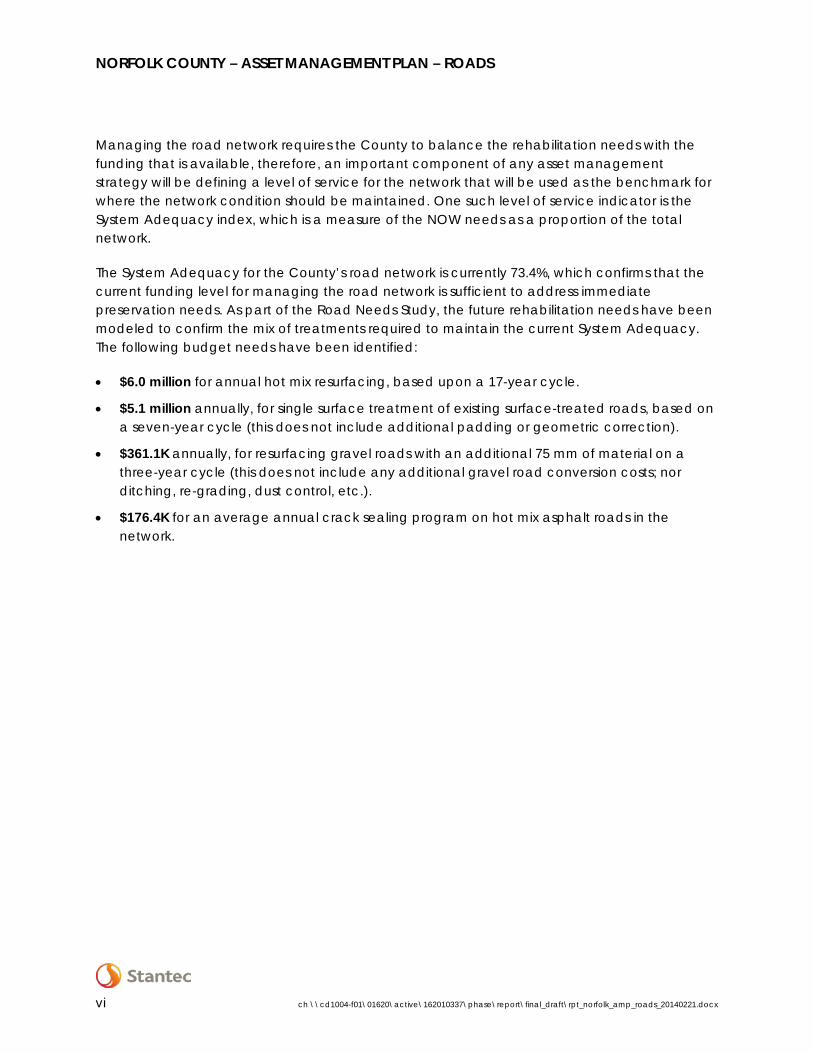
Managing the road network requires the County to balance the rehabilitation needs with the funding that is available, therefore, an important component of any asset management strategy will be defining a level of service for the network that will be used as the benchmark for where the network condition should be maintained. One such level of service indicator is the System Adequacy index, which is a measure of the NOW needs as a proportion of the total network.
The System Adequacy for the County’s road network is currently 73.4%, which confirms that the current funding level for managing the road network is sufficient to address immediate preservation needs. As part of the Road Needs Study, the future rehabilitation needs have been modeled to confirm the mix of treatments required to maintain the current System Adequacy. The following budget needs have been identified:
• $6.0 million for annual hot mix resurfacing, based upon a 17-year cycle.
• $5.1 million annually, for single surface treatment of existing surface-treated roads, based on a seven-year cycle (this does not include additional padding or geometric correction).
• $361.1K annually, for resurfacing gravel roads with an additional 75 mm of material on a three-year cycle (this does not include any additional gravel road conversion costs; nor ditching, re-grading, dust control, etc.).
• $176.4K for an average annual crack sealing program on hot mix asphalt roads in the network.
vi ch \\cd1004-f01\01620\active\162010337\phase\report\final_draft\rpt_norfolk_amp_roads_20140221.docx

NORFOLK COUNTY – ASSET MANAGEMENT PLAN – ROADS
1.0 Introduction
1.1 GOALS AND OBJECTIVES
This Asset Management Plan has been prepared in response to the Ontario Ministry of Infrastructure’s Building Together initiative, and provides the County with a medium-term business plan for ensuring long-term sustainability of the County’s infrastructure.
1.1.1 Scope of Work
The scope and format of this document follows the Ministry of Infrastructure’s Building Together: Guide for Municipal Asset Management Plans. The Guide outlines the specific elements of a detailed asset management plan, which includes:
1. Summary 2. Introduction 3. State of Local Infrastructure 4. Desired Levels of Service 5. Asset Management Strategy 6. Financing Strategy
The County has developed individual Asset Management Plans following the Ministry’s guidelines and suggested format for roads, bridges, and water and wastewater systems. The County is not responsible for social housing, an asset group to be included, if applicable, as per the Ministry’s guide.
This document focuses on the County’s road (pavement) infrastructure.
ch \\cd1004-f01\01620\active\162010337\phase\report\final_draft\rpt_norfolk_amp_roads_20140221.docx 1.1


NORFOLK COUNTY – ASSET MANAGEMENT PLAN – ROADS
2.0 State of Local Infrastructure
A State of the Infrastructure report provides the County with an understanding of the true cost of maintaining the infrastructure that is required to provide the services to the Community. The following State of the Infrastructure (SotI) assessment was developed through a Life Cycle Analysis, covering the County’s road network.
The County’s road network consist of approximately 4,100 lane-km (or 2,030 centreline-km) of Asphalt, Surface Treated, Gravel and Earth roads which are distributed across the rural, urban and semi-urban regions within the County.
In November 2003, the National Guide for Sustainable Municipal Infrastructure published a Best Practices for Municipal Infrastructure Asset Management. This publication included a listing of seven questions, which could be used as a framework for an asset management plan. The SotIR employs this framework:
1. What do you have and where is it? (Inventory)
2. What is it worth? (Costs/Replacement Rates)
3. What is its condition and expected remaining service life? (Condition and Capability Analysis)
4. What is the level of service expectation, and what needs to be done? (Capital and Operating Plans)
5. When do you need to do it? (Capital and Operating Plans)
6. How much will it cost and what is the acceptable level of risk(s)? (Short- and Long-term Financial Plan)
7. How do you ensure long-term affordability? (Short- and Long-term Financial Plan)
The County’s Public Works assets have a replacement value of $2.2 billion. The breakdown of those replacement values per serviced property, based on serviced properties and households in the County, are shown in Figure 2.1 below.
It can be noted that the road network account for approximately 63.5% or $1.4 billion, of the total asset replacement value for the County’s infrastructure.
ch \\cd1004-f01\01620\active\162010337\phase\report\final_draft\rpt_norfolk_amp_roads_20140221.docx 2.1

NORFOLK COUNTY – ASSET MANAGEMENT PLAN – ROADS
State of Local Infrastructure February 21, 2014
Figure 2.1: Asset Replacement Value per Serviced Property
2.1 ROADS
The County’s road network consists of a group of components, including road sections, curbs, signs, bridges, and so forth. The State of the Infrastructure analysis of these components was based upon existing inventories; the sources for these inventories include the County’s current asset management Geodatabase and WorkTech Asset Management System. The following table summarizes these inventories.
The Visible Infrastructure
The Invisible Infrastructure
Road System:Inventory
Road Length: 2,030 kmBridges & Culverts: 242
Replacement: Roads - $1.4 billionBridges & Culverts - $212 million
Per household: $56,700
Sanitary System:Inventory
Pipe Length: 220 km# of Manholes: 2,910
Replacement: $238.9 MPer serviced
property: $15,900
Water System:Inventory
Pipe Length: 309 km# of Valves: 1,600
Replacement: $229.2 MPer serviced
property: $15,280
Plants:Replacement Value
Water: $56 millionWastewater: $69 million
Per serviced property: $8,300
2.2 ch \\cd1004-f01\01620\active\162010337\phase\report\final_draft\rpt_norfolk_amp_roads_20140221.docx

NORFOLK COUNTY – ASSET MANAGEMENT PLAN – ROADS
State of Local Infrastructure February 21, 2014
Table 2.1: Road Network Inventory Summary
Surface Type
Lane-km
Roadside Environment Total % of
Total Rural Semi-Urban Urban
Asphalt on Concrete 0.80 0.80 0.0%
Earth 69.88 0.54 70.42 1.7%
Gravel, Stone, Other Loosetop 125.20 7.10 132.30 3.2%
High Class Bituminous - asphalt 903.55 119.40 377.88 1,400.83 34.3%
Int. Class Bituminous - Mulch 2.76 2.76 0.1%
Low Class Bituminous - surface treated 2,280.41 179.56 19.71 2,479.68 60.7%
Total 3,379.04 310.16 397.59 4,086.79
% of Total 82.7% 7.6% 9.7%
At the time of preparing this Asset Management Plan the County did not have a comprehensive inventory of the roadside assets shown in Table 2.2. However, it is clear that the road network would represent the majority of the asset portfolio and will hence drive the major investment and management decisions.
Table 2.2: Roadside Assets Not Included in Asset Management Plan
Asset Type Asset Component
Roadside Assets
Sidewalk
Curb
Signs
Street Lighting
Walkways
Retaining Wall
Signals
Pavement Marking
Level RR Crossings
Shoulders 1
Ditches 1
Guard Rails
Driveway Culverts 1 Costs are included in road replacement cost calculations
ch \\cd1004-f01\01620\active\162010337\phase\report\final_draft\rpt_norfolk_amp_roads_20140221.docx 2.3

NORFOLK COUNTY – ASSET MANAGEMENT PLAN – ROADS
State of Local Infrastructure February 21, 2014
2.1.1 Valuations
The County’s State of the Infrastructure and asset management software analyses (and reported results herein) analyses did not use inflation rate factors.
2.1.1.1 Financial Accounting Valuation
Based upon the County’s 2012 Financial Information Return filed with the Ministry of Municipal Affairs the Net Book Value of the County’s Roads assets at the end of 2012 was $250 million. The assets included in this figure are outlined in Table 2.3 below.
Table 2.3: FIR Schedule of Tangible Capital Assets (Schedule 51)
Asset Type Asset Component 2012 Closing
Net Book Value (million)
Roads and Traffic Systems
Roads - Paved $204.6
Roads - Unpaved $12.3
Roads - Bridges and Culverts $16.1
Roads - Traffic Operations & Roadside $16.6
Street Lighting $0.6
2.1.1.2 Replacement Cost Valuation
The estimated current replacement value of the road network and associated bridges/culverts assets is $1.37 billion, as shown in Table 2.4. If this total asset value is translated to provide an average value for each of the approximately 28,240 households within the County, then an average household will be responsible for approximately $48,500 of road infrastructure.
Table 2.4: Road Network Replacement Value
Asset Type
Asset Component Inventory
Unit Replacement
Cost
Current Replacement
Value (millions)
Road Network Road Sections
2,030 km (4,100 lane-km)
$675,000/km $1,370
This document focuses on the County’s road (pavement) segments.
2.4 ch \\cd1004-f01\01620\active\162010337\phase\report\final_draft\rpt_norfolk_amp_roads_20140221.docx

NORFOLK COUNTY – ASSET MANAGEMENT PLAN – ROADS
State of Local Infrastructure February 21, 2014
2.1.2 Age and Remaining Service Life
The Inventory Manual classifies roads as ‘NOW’, ‘1 to 5’, or ‘6 to 10’ year needs for reconstruction. The Time of Need is a prediction of the time until the road requires reconstruction or the remaining service life, not the time frame until action is required. For example, a road may be categorized as a ‘6 to 10’ year need with a resurfacing recommendation. This road should be resurfaced as soon as possible, to further defer the need to reconstruct.
‘NOW’ needs represent road sections that require reconstruction or major rehabilitation due to the level of deterioration. The ‘NOW’ needs are the backlog of work required on the road system; however, ‘NOW’ needs may not necessarily be the priority, depending on funding levels. Construction improvements identified within this time period are representative of roads that have little or no service life left and are in poor condition.
‘1 to 5’ identifies road sections where reconstruction is anticipated within the next five years, based upon a review of their current condition. These roads can be good candidates for resurfacing treatments that would extend the life of the road (depending on any other deficiencies), deferring the need to reconstruct.
‘6 to 10’ identifies road sections where reconstruction improvements are anticipated within six to ten years, based upon a review of their current condition. These roads can be good candidates for resurfacing treatments that would extend the life of the road (depending on any other deficiencies), thus deferring the need to reconstruct.
‘ADEQ’ identifies road sections that do not have reconstruction or resurfacing needs, although minor maintenance such as crack sealing or spot drainage improvements may be required.
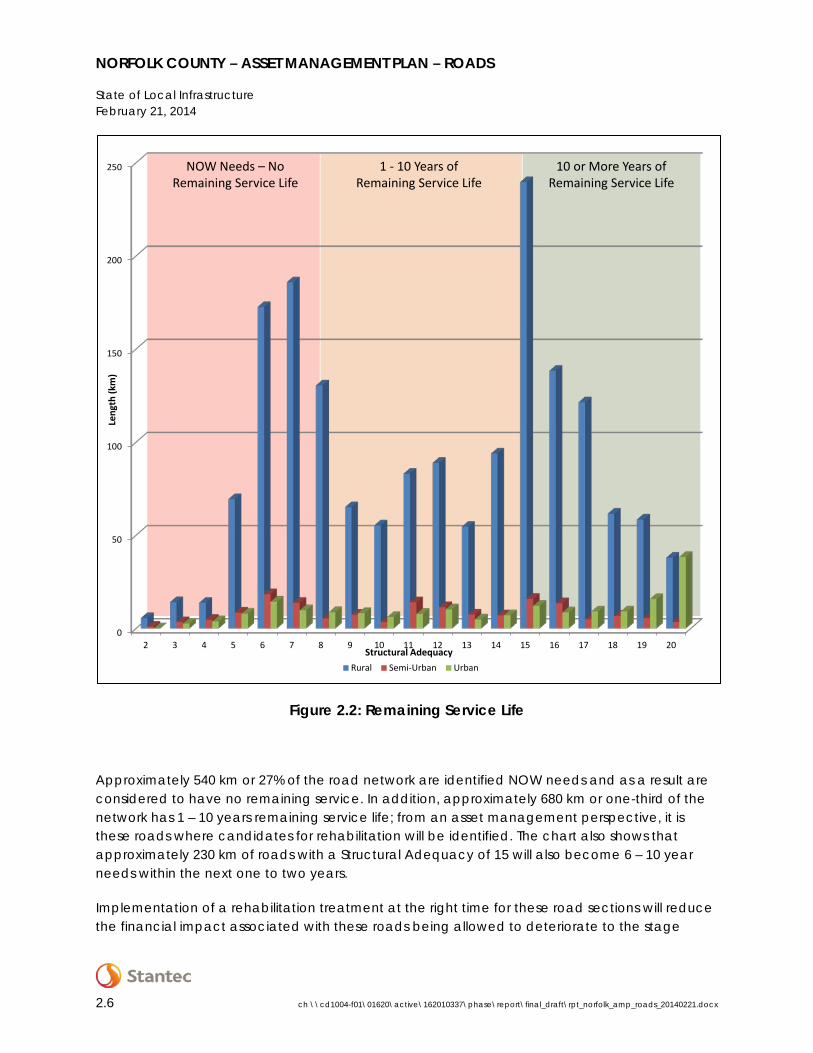
Figure 2.2 illustrates the distribution of the remaining service life for the County’s road network based upon the results of the 2013 condition assessment.
ch \\cd1004-f01\01620\active\162010337\phase\report\final_draft\rpt_norfolk_amp_roads_20140221.docx 2.5
NORFOLK COUNTY – ASSET MANAGEMENT PLAN – ROADS
State of Local Infrastructure February 21, 2014
Figure 2.2: Remaining Service Life
Approximately 540 km or 27% of the road network are identified NOW needs and as a result are considered to have no remaining service. In addition, approximately 680 km or one-third of the network has 1 – 10 years remaining service life; from an asset management perspective, it is these roads where candidates for rehabilitation will be identified. The chart also shows that approximately 230 km of roads with a Structural Adequacy of 15 will also become 6 – 10 year needs within the next one to two years.
Implementation of a rehabilitation treatment at the right time for these road sections will reduce the financial impact associated with these roads being allowed to deteriorate to the stage
0
50
100
150
200
250
2 3 4 5 6 7 8 9 10 11 12 13 14 15 16 17 18 19 20
Rural Semi-Urban Urban
NOW Needs – No Remaining Service Life
1 - 10 Years of Remaining Service Life
10 or More Years of Remaining Service Life
Leng
th (k
m)
Structural Adequacy
2.6 ch \\cd1004-f01\01620\active\162010337\phase\report\final_draft\rpt_norfolk_amp_roads_20140221.docx
NORFOLK COUNTY – ASSET MANAGEMENT PLAN – ROADS
State of Local Infrastructure February 21, 2014
where they will require the more expensive reconstruction treatments to restore them to and “adequate” condition.
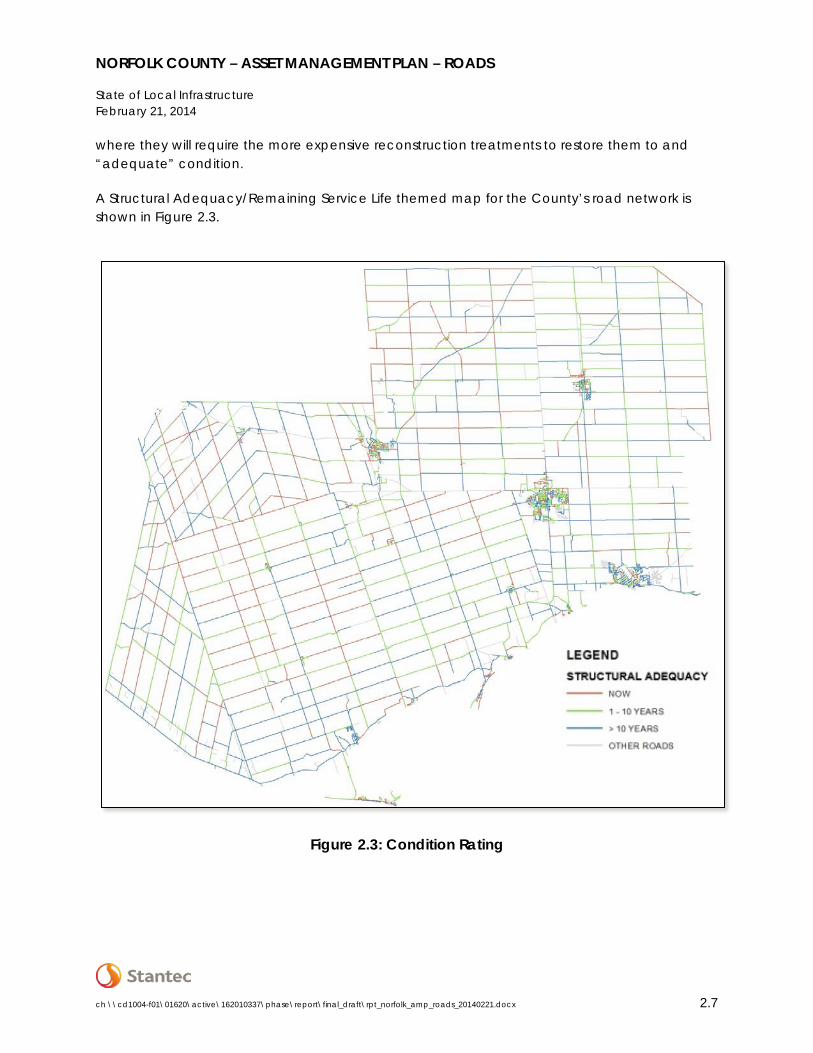
A Structural Adequacy/Remaining Service Life themed map for the County’s road network is shown in Figure 2.3.
Figure 2.3: Condition Rating
ch \\cd1004-f01\01620\active\162010337\phase\report\final_draft\rpt_norfolk_amp_roads_20140221.docx 2.7

NORFOLK COUNTY – ASSET MANAGEMENT PLAN – ROADS
State of Local Infrastructure February 21, 2014
2.1.3 Asset Condition
The County’s WorkTech Asset Manager Foundation system stores current pavement conditions, predicts future pavement performance through asset classes and deterioration curves that Stantec has entered into the system, and allows for various types of analyses, including recommendations of maintenance and rehabilitation programs based on needs, budgetary limits, or desired levels of service.
The County conducts a network-wide pavement condition assessment on a five-year cycle, with the most recent completed in the summer of 2013, and previously in 2008. The pavement condition assessment is based upon road condition rating methodology previously prescribed by the MTO, in the Inventory Manual for Municipal Roads (1991). The survey methodology is described below:
2.1.3.1 Pavement Condition Assessment Methodology
2.1.3.1.1 Ratings The Inventory Manual offers a holistic review of each road section, developing a Time of Need (TON) or an Adequate rating in six areas that are critical to municipal decision making:
1. Geometrics 2. Surface Type 3. Surface Width 4. Capacity 5. Structural Adequacy 6. Drainage
Evaluations of each road section were completed generally in accordance with the MTO’s Inventory Manual for Municipal Roads (1991). Data collected was entered directly into WorkTech’s Asset Foundation software. Condition ratings, Time of Need, Priority Ratings, and associated costs were then calculated by the software, in accordance with the Inventory Manual.
Field data is obtained through a visual examination of the road system and includes: structural adequacy, level of service, maintenance demand, horizontal and vertical alignment, surface and shoulder width, surface condition, and drainage. The Condition Rating is calculated based upon a combination of other calculations and data. A key component of the condition assessment is the identification of Time of Need (TON) ratings, which are estimates of the time before the road would require reconstruction.
It is important to note that for the purposes of managing the County’s road network the NOW needs are roads that require reconstruction; however, it is not intended that ‘1 to 5’ and ‘6 to 10’ year needs are to be acted on in that timeframe. Prudent asset management suggests that the ‘1 to 5’ and ‘6 to 10’ year needs are current candidates for resurfacing treatments that will
2.8 ch \\cd1004-f01\01620\active\162010337\phase\report\final_draft\rpt_norfolk_amp_roads_20140221.docx

NORFOLK COUNTY – ASSET MANAGEMENT PLAN – ROADS
State of Local Infrastructure February 21, 2014
elevate their structural status to ‘ADEQ’, and offer the greatest return on investment for the County.
The Time of Need ratings are described more fully below:
2.1.4 ‘NOW’ Needs
‘NOW’ needs represent the backlog of work required on the road system, but not necessarily the priority dependent upon funding levels. Construction improvements identified within this time period are representative of roads that have little or no service life left and are in poor condition. For most agencies, these road sections are not the priority, where funding is limited. It should be noted that a resurfacing strategy is never a ‘NOW’ need, with the exception of a PR1 or PR2 treatment recommendation (Pulverize and resurface one or two lifts of asphalt). The other exception would be when the surface type is inadequate for the traffic volume.
If a road with a rehabilitation strategy of “resurface” deteriorates too far, it becomes a ‘NOW’ construction need. A ‘NOW’ need rating may also be triggered by substandard ratings in any of the Structural Adequacy, Surface Type, Surface Width, Capacity, Drainage, or Geometrics data fields.
2.1.5 ‘1 to 5’ Year Needs
‘1 to 5’ Identifies road sections where reconstruction is anticipated within the next five years, based upon a review of their current condition. These roads can be good candidates for resurfacing treatments that would extend the life of the road (depending on any other deficiencies), thus deferring the need to reconstruct.
2.1.6 ‘6 to 10’ Year Needs
‘6 to 10’ Identifies road sections where reconstruction improvements are anticipated within six to ten years, based upon a review of their current condition. These roads can be good candidates for resurfacing treatments that would extend the life of the road (depending on any other deficiencies), thus deferring the need to reconstruct.
Figure 2.4: ‘NOW’ Need Road
Figure 2.6: ‘6 to 10’ Year Need
Figure 2.5: ‘1 to 5’ Year Needs
ch \\cd1004-f01\01620\active\162010337\phase\report\final_draft\rpt_norfolk_amp_roads_20140221.docx 2.9
NORFOLK COUNTY – ASSET MANAGEMENT PLAN – ROADS
State of Local Infrastructure February 21, 2014
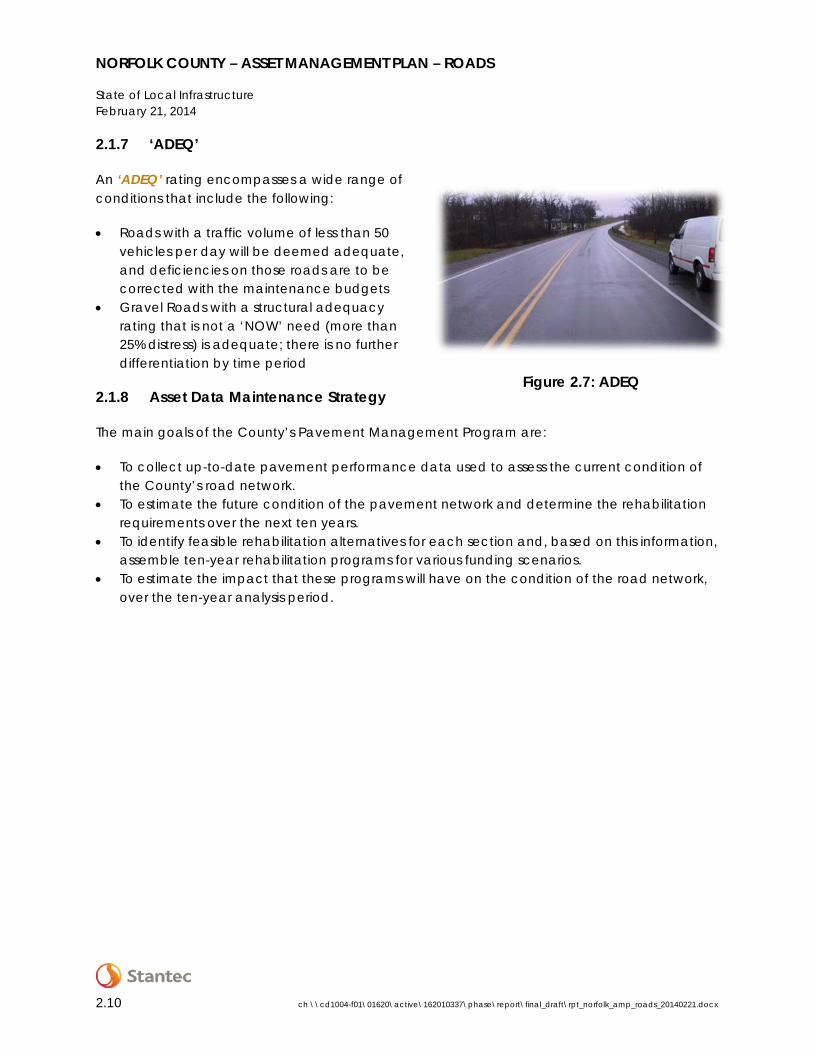
2.1.7 ‘ADEQ’
An ‘ADEQ’ rating encompasses a wide range of conditions that include the following:
• Roads with a traffic volume of less than 50 vehicles per day will be deemed adequate, and deficiencies on those roads are to be corrected with the maintenance budgets
• Gravel Roads with a structural adequacy rating that is not a ‘NOW’ need (more than 25% distress) is adequate; there is no further differentiation by time period
2.1.8 Asset Data Maintenance Strategy
The main goals of the County’s Pavement Management Program are:
• To collect up-to-date pavement performance data used to assess the current condition of the County’s road network.
• To estimate the future condition of the pavement network and determine the rehabilitation requirements over the next ten years.
• To identify feasible rehabilitation alternatives for each section and, based on this information, assemble ten-year rehabilitation programs for various funding scenarios.
• To estimate the impact that these programs will have on the condition of the road network, over the ten-year analysis period.
Figure 2.7: ADEQ
2.10 ch \\cd1004-f01\01620\active\162010337\phase\report\final_draft\rpt_norfolk_amp_roads_20140221.docx
NORFOLK COUNTY – ASSET MANAGEMENT PLAN – ROADS
3.0 Desired Levels of Service
Levels of Service for roads are a combination of required and desired maintenance and performance targets. Required targets include minimum maintenance standards, as specified by the Ministry of Transportation. Performance targets are based on pavement condition measurements, and are values/goals deemed acceptable and desirable by the County/Community.
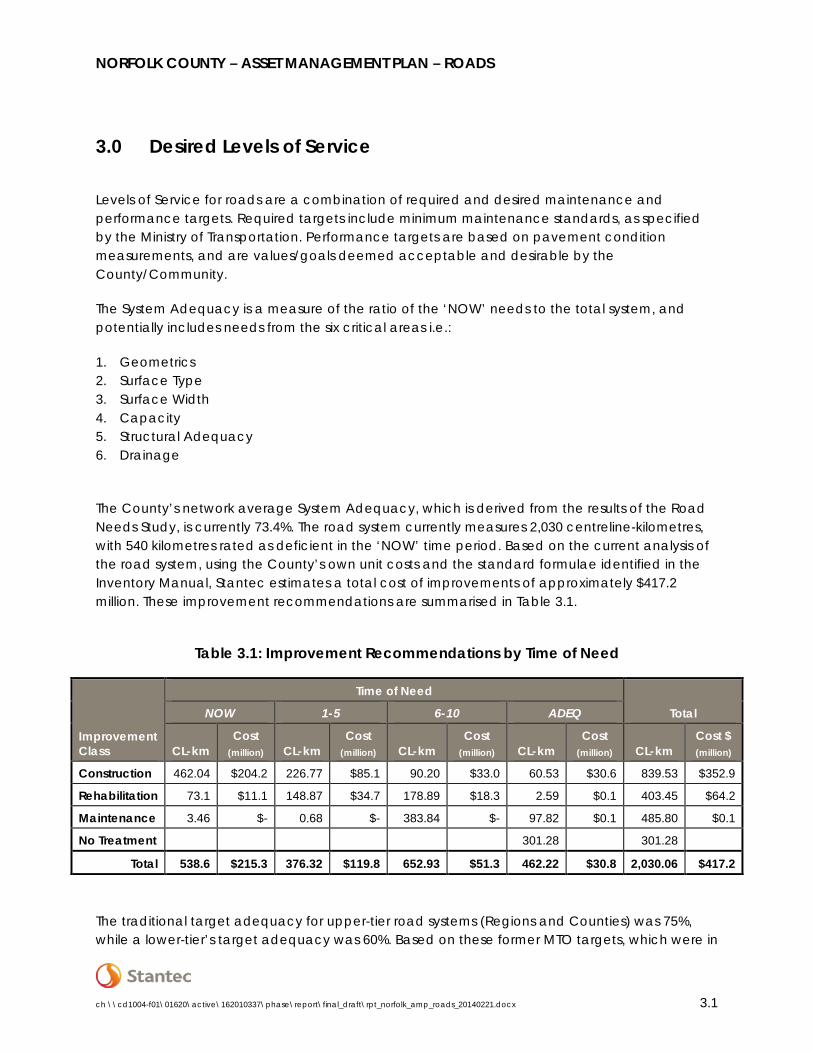
The System Adequacy is a measure of the ratio of the ‘NOW’ needs to the total system, and potentially includes needs from the six critical areas i.e.:
1. Geometrics 2. Surface Type 3. Surface Width 4. Capacity 5. Structural Adequacy 6. Drainage
The County’s network average System Adequacy, which is derived from the results of the Road Needs Study, is currently 73.4%. The road system currently measures 2,030 centreline-kilometres, with 540 kilometres rated as deficient in the ‘NOW’ time period. Based on the current analysis of the road system, using the County’s own unit costs and the standard formulae identified in the Inventory Manual, Stantec estimates a total cost of improvements of approximately $417.2 million. These improvement recommendations are summarised in Table 3.1.
Table 3.1: Improvement Recommendations by Time of Need
Improvement Class
Time of Need
Total NOW 1-5 6-10 ADEQ
CL-km Cost
(million) CL-km Cost
(million) CL-km Cost
(million) CL-km Cost
(million) CL-km Cost $ (million)
Construction 462.04 $204.2 226.77 $85.1 90.20 $33.0 60.53 $30.6 839.53 $352.9
Rehabilitation 73.1 $11.1 148.87 $34.7 178.89 $18.3 2.59 $0.1 403.45 $64.2
Maintenance 3.46 $- 0.68 $- 383.84 $- 97.82 $0.1 485.80 $0.1
No Treatment 301.28 301.28
Total 538.6 $215.3 376.32 $119.8 652.93 $51.3 462.22 $30.8 2,030.06 $417.2
The traditional target adequacy for upper-tier road systems (Regions and Counties) was 75%, while a lower-tier’s target adequacy was 60%. Based on these former MTO targets, which were in
ch \\cd1004-f01\01620\active\162010337\phase\report\final_draft\rpt_norfolk_amp_roads_20140221.docx 3.1

NORFOLK COUNTY – ASSET MANAGEMENT PLAN – ROADS
Desired Levels of Service February 21, 2014
effect when the municipal grant system was in place, the target adequacy for the County should be 75%, as a minimum. The minimum target adequacies were established by MTO, to reflect the nature and purpose of the road system. The minimum target for the County should be to maintain the road network at the current Structural Adequacy rating of 73.4%.
Within future iterations of this Asset Management Plan, the County will consider further refining its service level targets for roads. Under consideration will be:
• A desired System Adequacy distribution (for the network and/or for each functional class)
• A maximum desired backlog of work or “NOW” needs
• A determination of funding and service goals for maintenance versus rehabilitation/replacement activities
• Seeking further Community input to further refine expectations and targets
3.2 ch \\cd1004-f01\01620\active\162010337\phase\report\final_draft\rpt_norfolk_amp_roads_20140221.docx

NORFOLK COUNTY – ASSET MANAGEMENT PLAN – ROADS
4.0 Asset Management Strategy
4.1 NON-INFRASTRUCTURE SOLUTIONS
Accurate and reasonable population/traffic growth forecasting allows the County to adequately plan road expansion activities, and ensure that infrastructure is built only to meet reasonable demands.
On a project-by-project basis, Environmental Assessment studies will explore various options, including alternatives to building new infrastructure, for any major developments being considered in the County.
4.2 MAINTENANCE ACTIVITIES
The County abides by the Ministry’s minimum maintenance standards (Ontario Regulation 239/02), which specifies the frequency that roads need to be patrolled, and issues, including potholes, cracking, winter maintenance, and so forth, be addressed based on road classification, determined by the posted speed and the Average Annual Daily Traffic (AADT).
Pavement structure life expectancy is a function of quality throughout the pavement life. Pavement life expectancy will vary, depending upon the following factors:
• Quality of initial design • Quality of maintenance programming • Adequate, appropriate drainage to a legal adequate outlet, and quality maintenance of
the drainage systems • Traffic volumes • Traffic type
A conventionally designed and constructed flexible road pavement structure for an arterial road, should last at least 40 years, before it needs to be reconstructed. During that 40-year life span, two or three hot mix overlays will be required. A local road, carrying less traffic volume and substantially less truck loads, should last at least 50 years, before full reconstruction is required. Again, two or three overlays will be required within this life span. Proper maintenance programming will maximize these life expectancies.
Maintenance programs should include the following components:
• Spot improvements to the asphalt surface • Spot improvements to the road drainage system • Crack sealing • Resurfacing/overlays at the appropriate time • Pavement preservation strategies, if appropriate, including:
− Microsurfacing
ch \\cd1004-f01\01620\active\162010337\phase\report\final_draft\rpt_norfolk_amp_roads_20140221.docx 4.1

NORFOLK COUNTY – ASSET MANAGEMENT PLAN – ROADS
Asset Management Strategy February 21, 2014
− Crack sealing − Surface treatment − Slurry seals − Other preservation alternatives
Optimal timing of maintenance and rehabilitation efforts is the key to maximizing the life expectancy of existing pavement structures. A number of road agencies and institutions have developed deterioration curves and/or graphical depictions that illustrate the life cycle of a pavement structure. Figure 4.1 and Figure 4.2 provide two such examples, clearly illustrating that pavement life expectancy increases with appropriate maintenance. Timing of major maintenance, such as an overlay, is dependent upon the purpose of the road, and can vary from 12 to 25 years.
Source: Development of a new asphalt pavement performance prediction model; Ningyuan Li, Ralph Haas, and Wei-Chau Xie
Figure 4.1: Impact of Different Maintenance Strategies on Pavement Performance
4.2 ch \\cd1004-f01\01620\active\162010337\phase\report\final_draft\rpt_norfolk_amp_roads_20140221.docx

NORFOLK COUNTY – ASSET MANAGEMENT PLAN – ROADS
Asset Management Strategy February 21, 2014
Source: Wirtgen Cold Recycling Manual
Figure 4.2: Alternative Maintenance Strategies
Within the analysis which was carried out to identify maintenance and rehabilitation needs it is assumed that roads are differentiated by surface type and traffic volume; it is also assumed that each road classification will deteriorate at a different rate. In Figure 4.3, typical levels of improvements have been superimposed over the deterioration curves used to model the pavement performance, to illustrate the general timelines for implementing the treatments. An important concept to remember is that as a road deteriorates the cost of rehabilitation increases.
Figure 4.3: Deterioration vs. Treatment Selection
ch \\cd1004-f01\01620\active\162010337\phase\report\final_draft\rpt_norfolk_amp_roads_20140221.docx 4.3

NORFOLK COUNTY – ASSET MANAGEMENT PLAN – ROADS
Asset Management Strategy February 21, 2014
The use of an asset/pavement management system allows the County to realize the benefits of lower-cost treatments such as preventive maintenance and light rehabilitation activities, by targeting interventions within the network, before more costly treatments, or full replacement, become necessary. The management philosophy applied within the County, with respect to the road network, is to “Apply the right treatment to the right asset at the right time”. Essentially, keeping the good roads good.
4.3 REHABILITATION ACTIVITIES
The County uses WorkTech Asset Manager Foundation asset management software to determine the most cost-beneficial pavement maintenance and rehabilitation strategies to be applied, at the optimal time.
The system uses the results of the Road Needs Study, coupled with predictive pavement deterioration curves, to determine appropriate Maintenance and Rehabilitation (M&R) treatments for each segment in the County’s road network. Applying early intervention strategies extends the life of the pavement significantly at a low cost; therefore, the cost-benefit of these types of interventions is typically high.
Allowing pavements to deteriorate further, triggers the need for heavier rehabilitation. Although heavy rehabilitation is typically less cost-effective than maintenance and light rehabilitation, it is still preferable to apply this type of treatment, instead of the more costly full reconstruction of a road section.
The County’s rehabilitation program is summarized in, below.
Table 4.1: Rehabilitation Recommendations by Time of Need
Improvement Class
Time of Need
NOW 1-5 6-10 ADEQ
CL-km Cost
(million) CL-km Cost
(million) CL-km Cost
(million) CL-km Cost
(million)
Pulverize & Resurface – Double Lift 70.73 $10.6 112.34 $23.0 6.04 $1.0 0.17 $0.02
Resurface - Single Lift 0 0 0 0 98.01 $12.8 0 0
Resurface - Double Lift 2.37 $0.4 32.91 $11.6 9.46 $2.4 0.06 $0.02
Single Surface Treatment 0 0 3.62 $0.1 38.14 $1.1 0.05 $0
Single Surface Treatment (spot ditching) 0 0 0 0 27.25 $1.0 2.31 $0.08
Total 73.1 $11.00 148.87 $34.70 178.89 $18.30 2.59 $0.12
4.4 ch \\cd1004-f01\01620\active\162010337\phase\report\final_draft\rpt_norfolk_amp_roads_20140221.docx

NORFOLK COUNTY – ASSET MANAGEMENT PLAN – ROADS
Asset Management Strategy February 21, 2014
4.4 REPLACEMENT ACTIVITIES
A road section which is identified as a NOW need for structural adequacy is considered to have failed, and is no longer salvageable. It may also indicate that the road is under-designed for its current traffic loading; therefore, it will be necessary to reconstruct road. As identified in Table 3.1, the County owns approximately 462 km of roads that have been identified as NOW needs and require. A road section may also be classified as a NOW need for drainage, capacity, geometry, surface width, and surface type. For purposes of modeling a program development though, the structural adequacy rating is utilized.
Table 4.2 summarizes the County’s replacement recommendations by time of need:
Table 4.2: Replacement Recommendations by Time of Need
Improvement Class
Time of Need
NOW 1-5 6-10 ADEQ
CL-km Cost
(million) CL-km Cost
(million) CL-km Cost
(million) CL-km Cost
(million)
Construction 0.62 0 0 0 0 0 0 0
Base & Surface Repair 297.88 $77.8 198.16 $54.5 74.01 $20.1 15.61 $12.3
Reconstruction 104.01 $60.5 12.69 $11.0 7.35 $3.0 43.34 $16.5
Resurface – Double Lift 0 0 0.15 $0.1 0 0 0 0
Reconstruction – nominal storm sewers 35.43 $37.1 2.14 $2.2 1.58 $0.8 0.21 $0.1
Reconstruction – install storm sewers 23.22 $28.5 13.63 $17.2 6.71 $9.0 1.32 $1.7
Resurface & Widen 0.88 $0.2 0 0 0.55 $0.1 0.04 $0.01
Total 462.04 $204.1 226.77 $85.0 90.20 $33.00 60.52 $30.61
Any pavement reconstruction activities will be coordinated with other pending and/or desirable projects at the same location, such as sewer or watermain replacement, in order to minimize disruption to the Community, and minimize overall project costs.
4.5 DISPOSAL ACTIVITIES
The County does not anticipate the need for road decommissioning.
4.6 EXPANSION ACTIVITIES
The County expects modest growth in the foreseeable future. Expansion activities are reflected in the County’s Official Plan. All major expansion projects are subject to Environmental
ch \\cd1004-f01\01620\active\162010337\phase\report\final_draft\rpt_norfolk_amp_roads_20140221.docx 4.5
NORFOLK COUNTY – ASSET MANAGEMENT PLAN – ROADS
Asset Management Strategy February 21, 2014
Assessment studies, which evaluate the necessity of expansion of the asset portfolio and assess overall impact on the Community, environment, and so forth, for the various options available.
4.7 PROCUREMENT METHODS
To ensure the most efficient allocation of resources and funds, the County will consider:
• Bundling projects when issuing tenders, to realize cost-benefits of economy of scale
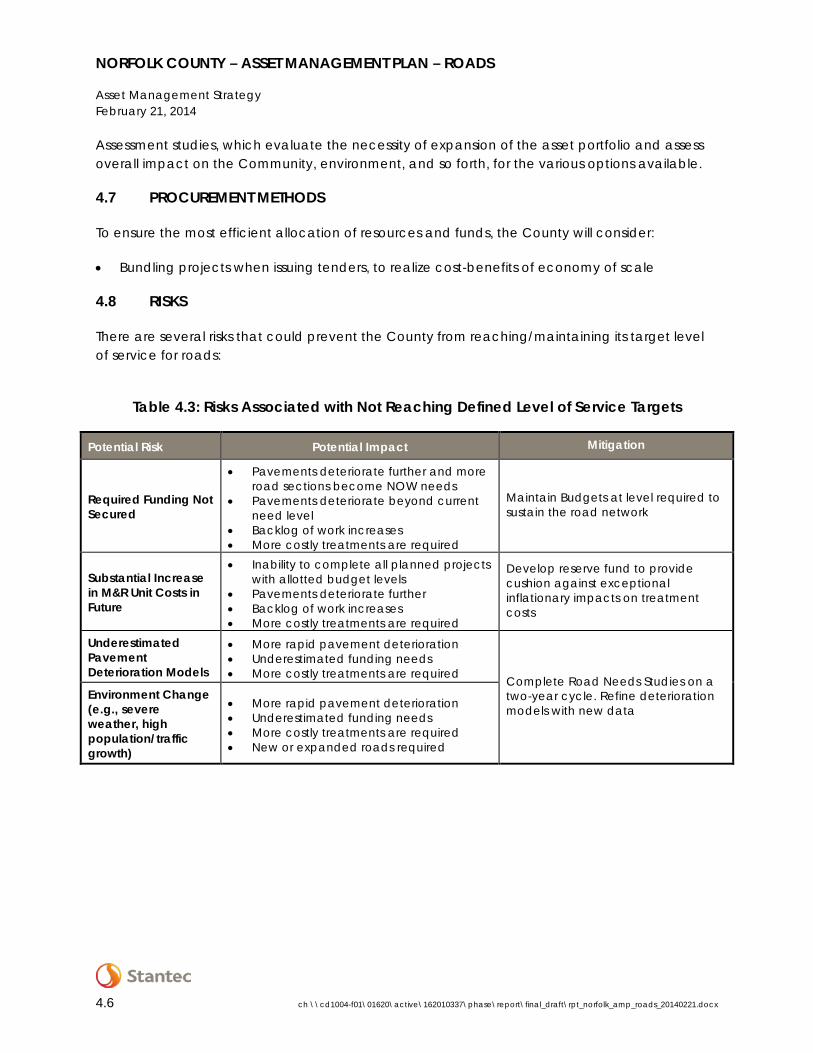
4.8 RISKS
There are several risks that could prevent the County from reaching/maintaining its target level of service for roads:
Table 4.3: Risks Associated with Not Reaching Defined Level of Service Targets
Potential Risk Potential Impact Mitigation
Required Funding Not Secured
• Pavements deteriorate further and more road sections become NOW needs
• Pavements deteriorate beyond current need level
• Backlog of work increases • More costly treatments are required
Maintain Budgets at level required to sustain the road network
Substantial Increase in M&R Unit Costs in Future
• Inability to complete all planned projects with allotted budget levels
• Pavements deteriorate further • Backlog of work increases • More costly treatments are required
Develop reserve fund to provide cushion against exceptional inflationary impacts on treatment costs
Underestimated Pavement Deterioration Models
• More rapid pavement deterioration • Underestimated funding needs • More costly treatments are required Complete Road Needs Studies on a
two-year cycle. Refine deterioration models with new data
Environment Change (e.g., severe weather, high population/traffic growth)
• More rapid pavement deterioration • Underestimated funding needs • More costly treatments are required • New or expanded roads required
4.6 ch \\cd1004-f01\01620\active\162010337\phase\report\final_draft\rpt_norfolk_amp_roads_20140221.docx

NORFOLK COUNTY – ASSET MANAGEMENT PLAN – ROADS
Asset Management Strategy February 21, 2014
4.9 ASSET MANAGEMENT PLAN FUTURE UPDATES
The Asset Management Plan for roads is a living document, and will require regular review and refinement. Specifically, the County will:
• Review the Asset Management Plan annually and confirm validity of assumptions • Update the Asset Management Plan every five years • Commit to regular updates of pavement condition assessment (2-year inspection cycle) • Update all pertinent attribute and modeling data in its pavement management software.
Particular emphasis should be placed on updating/maintaining: − Traffic data (AADT count, growth %, truck traffic %) − Pavement structural composition − Subgrade strength − Geometry (length, width, number of lanes) − Maintenance and rehabilitation treatment lists and unit costs − After-rehabilitation benefit levels − Decision tree matrices − Inflation rate and discount rate values − History of work performed
• Further refine its level of service targets by engaging in a Community outreach program, to help identify the desired levels of service of County’s residents.
ch \\cd1004-f01\01620\active\162010337\phase\report\final_draft\rpt_norfolk_amp_roads_20140221.docx 4.7


NORFOLK COUNTY – ASSET MANAGEMENT PLAN – ROADS
5.0 Financing Strategy
5.1 HISTORICAL INVESTMENTS
The County’s investment in road operations for the period 2011-2012 is summarized below.
Table 5.1: FIR Schedule of Operating Expenses (Schedule 40)
Asset Type Asset Component 2011 1
(million) 2012 1
(million)
Roads and Traffic
Systems
Roads - Paved $12.981 $12.350
Roads - Unpaved 0 0
Roads - Traffic Operations & Roadside $0.202 $0.511
Street Lighting $0.685 $0.736
Total $13.868 $13.597 1 Excludes amortization expense & interest on long term debt
This data was derived from the Financial Information Return (FIR) filed with the Ministry of Municipal Affairs and Housing (http://oraweb.mah.gov.on.ca/fir/welcome.htm).
5.2 FUTURE INVESTMENT REQUIREMENTS
Through the Road Needs Study the investment required to address the NOW needs is estimated to be $215.3 million with an additional $171.1 million estimated to address roads which require some form of rehabilitation as soon as possible to slow their deterioration to the point where a reconstruction treatment would be required. Table 5.2 summarizes these rehabilitation needs:
Table 5.2: Improvement Recommendations by Time of Need
Improvement Class
Time of Need
Total NOW 1-5 6-10 ADEQ
CL-km Cost
(million) CL-km Cost
(million) CL-km Cost
(million) CL-km Cost
(million) CL-km Cost $ (million)
Construction 462.04 $204.2 226.77 $85.1 90.20 $33.0 60.53 $30.6 839.53 $352.9
Rehabilitation 73.1 $11.1 148.87 $34.7 178.89 $18.3 2.59 $0.1 403.45 $64.2
Maintenance 3.46 $- 0.68 $- 383.84 $- 97.82 $0.1 485.80 $0.1
No Treatment 301.28 301.28
Total 538.6 $215.3 376.32 $119.8 652.93 $51.3 462.22 $30.8 2,030.06 $417.2
ch \\cd1004-f01\01620\active\162010337\phase\report\final_draft\rpt_norfolk_amp_roads_20140221.docx 5.1
NORFOLK COUNTY – ASSET MANAGEMENT PLAN – ROADS
Financing Strategy February 21, 2014
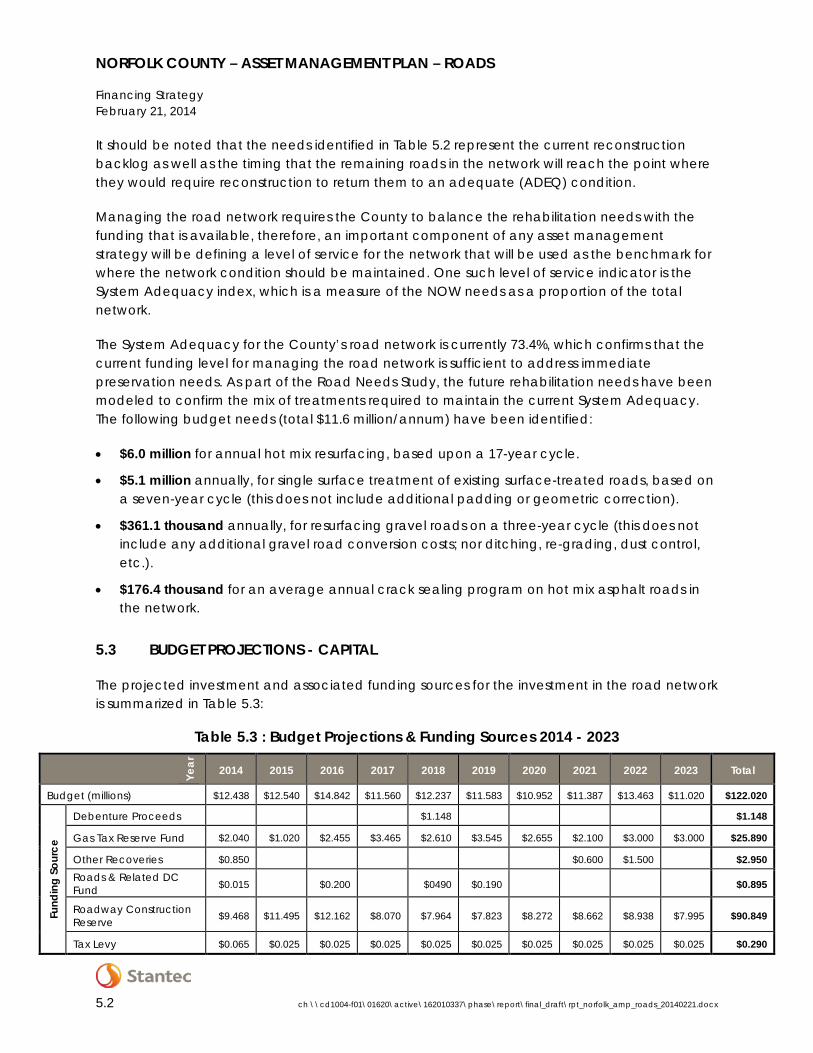
It should be noted that the needs identified in Table 5.2 represent the current reconstruction backlog as well as the timing that the remaining roads in the network will reach the point where they would require reconstruction to return them to an adequate (ADEQ) condition.
Managing the road network requires the County to balance the rehabilitation needs with the funding that is available, therefore, an important component of any asset management strategy will be defining a level of service for the network that will be used as the benchmark for where the network condition should be maintained. One such level of service indicator is the System Adequacy index, which is a measure of the NOW needs as a proportion of the total network.
The System Adequacy for the County’s road network is currently 73.4%, which confirms that the current funding level for managing the road network is sufficient to address immediate preservation needs. As part of the Road Needs Study, the future rehabilitation needs have been modeled to confirm the mix of treatments required to maintain the current System Adequacy. The following budget needs (total $11.6 million/annum) have been identified:
• $6.0 million for annual hot mix resurfacing, based upon a 17-year cycle.
• $5.1 million annually, for single surface treatment of existing surface-treated roads, based on a seven-year cycle (this does not include additional padding or geometric correction).
• $361.1 thousand annually, for resurfacing gravel roads on a three-year cycle (this does not include any additional gravel road conversion costs; nor ditching, re-grading, dust control, etc.).
• $176.4 thousand for an average annual crack sealing program on hot mix asphalt roads in the network.
5.3 BUDGET PROJECTIONS - CAPITAL
The projected investment and associated funding sources for the investment in the road network is summarized in Table 5.3:
Table 5.3 : Budget Projections & Funding Sources 2014 - 2023
Year
2014 2015 2016 2017 2018 2019 2020 2021 2022 2023 Total
Budget (millions) $12.438 $12.540 $14.842 $11.560 $12.237 $11.583 $10.952 $11.387 $13.463 $11.020 $122.020
Fund
ing
Sour
ce
Debenture Proceeds $1.148 $1.148
Gas Tax Reserve Fund $2.040 $1.020 $2.455 $3.465 $2.610 $3.545 $2.655 $2.100 $3.000 $3.000 $25.890
Other Recoveries $0.850 $0.600 $1.500 $2.950 Roads & Related DC Fund $0.015 $0.200 $0490 $0.190 $0.895
Roadway Construction Reserve $9.468 $11.495 $12.162 $8.070 $7.964 $7.823 $8.272 $8.662 $8.938 $7.995 $90.849
Tax Levy $0.065 $0.025 $0.025 $0.025 $0.025 $0.025 $0.025 $0.025 $0.025 $0.025 $0.290
5.2 ch \\cd1004-f01\01620\active\162010337\phase\report\final_draft\rpt_norfolk_amp_roads_20140221.docx
Related Documents