Strategy Market Research 26 November 2019 Nordea View November 2019: TRUE bears vs TINA bulls The equity market has been in FOMO mode, driven by the Federal Reserve’s turnaround, perceived QE and positive trade deal headlines. Investors seem to have concluded that the economy will strengthen in 2020. In the short term, we believe the equity market has taken this too far: the economy is still weak, trade war risks have been priced out and we expect downward revisions to earnings estimates. The medium-term allocation outlook is more difficult, and we have decided to present a 2020 outlook with two opposing views from the bearish and bullish camps within our team. Nordea Bears Inc believes the market is suffering from Tail Risk Under-Estimation (TRUE) and that a prolonged earnings recession will punish the equity market. Nordea Bulls Ltd argues that the equity risk premium is high enough to weather an earnings recession and that the business cycle is about to turn upwards. This battle is still ongoing, but for now the bear arguments have the edge and we stay underweight equities vs bonds. Our current view In 2019, being correct on the macro outlook has not helped us get the equity market right and we had not expected the huge returns delivered. On the other Nordea Markets - Analysts Mikael Sarwe Head of Market Strategy [email protected] Carl Grapenfelt Head of Market Research [email protected] Arvid Böhm Head of Equity Strategy [email protected] Martin Enlund Chief FX Strategist [email protected] Lars Mouland Chief FI Strategist [email protected] Andreas Steno Larsen Senior FX Strategist [email protected] hand, our long-standing view from spring 2018 that the asset duration should be overweight in long bonds instead of equities has still been correct. Currently, we feel that complacency towards cyclical, geopolitical and earnings risks has gone too far with VIX at 12% and we expect a correction in the coming months. 2020: Nordea Bears Inc We argue that the equity market is suffering from Tail Risk Under-Estimation (TRUE). Our outlook for 2020 has the slowdown moving from global manufacturing to domestic demand and labour markets weakening around the world. The earnings recession that has just started will deepen in this scenario, implying poor risk/reward for owning equities at current high valuation levels. 2020: Nordea Bulls Ltd Global liquidity and relaxed monetary conditions are about to lift economic activity; geopolitical concerns are well discounted; and bonds are expensive and offer no compensation for the risk (negative term premium). In contrast, equities do compensate for the risk, and should be able to weather a sluggish earnings outlook or even a shallow earnings recession. Equities: Valuation and estimates With global equities flirting with a marked earnings recession and sales revision trends turning increasingly negative, we are perplexed, as multiples are again near or have passed multiyear highs. Although history rarely repeats itself (it rhymes), our US earnings recession study suggests earnings recessions are not short and stocks rarely emerge unscathed. While we accept the TINA argument, we believe 5-5.5% expected returns for equities leaves markets vulnerable to tail risk. We still have conviction in our underweight of US stocks, as we see tentative signs that their EPS momentum supremacy is coming to an end. Equity styles: There is a new tune playing The great valuation divide is finally contracting, giving us confidence that valuation is growing in importance. While we remain relative value bulls, we acknowledge that if one of our tail-risk scenarios materialises, value stocks may fall into old habits, ie underperform as US ten-year rates fall. The history books reveal several instances where value has protected the downside in falling markets, and thus we believe that any material value weakness should be used as an opportunity. STOCK TO BOND & MACRO SURPRISES Source: Macrobond and Nordea IMPORTANT INFORMATION AND DISCLOSURES AT THE END OF THIS REPORT

Welcome message from author
This document is posted to help you gain knowledge. Please leave a comment to let me know what you think about it! Share it to your friends and learn new things together.
Transcript
StrategyMarket Research
26 November 2019
Nordea View
November 2019: TRUE bears vs TINA bulls
The equity market has been in FOMO mode, driven by the Federal Reserve’s turnaround, perceived QE and positive trade deal headlines. Investors seem to have concluded that the economy will strengthen in 2020. In the short term, we believe the equity market has taken this too far: the economy is still weak, trade war risks have been priced out and we expect downward revisions to earnings estimates. The medium-term allocation outlook is more difficult, and we have decided to present a 2020 outlook with two opposing views from the bearish and bullish camps within our team. Nordea Bears Inc believes the market is suffering from Tail Risk Under-Estimation (TRUE) and that a prolonged earnings recession will punish the equity market. Nordea Bulls Ltd argues that the equity risk premium is high enough to weather an earnings recession and that the business cycle is about to turn upwards. This battle is still ongoing, but for now the bear arguments have the edge and we stay underweight equities vs bonds.
Our current viewIn 2019, being correct on the macro outlook has not helped us get the equity market right and we had not expected the huge returns delivered. On the other
Nordea Markets - AnalystsMikael SarweHead of Market [email protected]
Carl GrapenfeltHead of Market [email protected]
Arvid BöhmHead of Equity Strategy [email protected]
Martin EnlundChief FX [email protected]
Lars MoulandChief FI [email protected]
Andreas Steno LarsenSenior FX [email protected]
hand, our long-standing view from spring 2018 that the asset duration should be overweight in long bonds instead of equities has still been correct. Currently, we feel that complacency towards cyclical, geopolitical and earnings risks has gone too far with VIX at 12% and we expect a correction in the coming months.
2020: Nordea Bears IncWe argue that the equity market is suffering from Tail Risk Under-Estimation (TRUE). Our outlook for 2020 has the slowdown moving from global manufacturing to domestic demand and labour markets weakening around the world. The earnings recession that has just started will deepen in this scenario, implying poor risk/reward for owning equities at current high valuation levels.
2020: Nordea Bulls LtdGlobal liquidity and relaxed monetary conditions are about to lift economic activity; geopolitical concerns are well discounted; and bonds are expensive and offer no compensation for the risk (negative term premium). In contrast, equities do compensate for the risk, and should be able to weather a sluggish earnings outlook or even a shallow earnings recession.
Equities: Valuation and estimatesWith global equities flirting with a marked earnings recession and sales revision trends turning increasingly negative, we are perplexed, as multiples are again near or have passed multiyear highs. Although history rarely repeats itself (it rhymes), our US earnings recession study suggests earnings recessions are not short and stocks rarely emerge unscathed. While we accept the TINA argument, we believe 5-5.5% expected returns for equities leaves markets vulnerable to tail risk. We still have conviction in our underweight of US stocks, as we see tentative signs that their EPS momentum supremacy is coming to an end.
Equity styles: There is a new tune playing The great valuation divide is finally contracting, giving us confidence that valuation is growing in importance. While we remain relative value bulls, we acknowledge that if one of our tail-risk scenarios materialises, value stocks may fall into old habits, ie underperform as US ten-year rates fall. The history books reveal several instances where value has protected the downside in falling markets, and thus we believe that any material value weakness should be used as an opportunity.
STOCK TO BOND & MACRO SURPRISES
Source: Macrobond and Nordea
IMPORTANT INFORMATION AND DISCLOSURES AT THE END OF THIS REPORT
Market Research26 November 2019
2020: Nordea Bears IncThe equity market has been in full-fledged TINA and FOMO mode, zooming in on the Federal Reserve’s policy turnaround, perceived QE and positive trade deal headlines saving all days. Investors seem to have concluded that this will create a stronger economy in 2020. We argue that the equity market is suffering from Tail Risk Under-Estimation (TRUE). Our outlook for 2020 has the slowdown moving from global manufacturing to domestic demand and labour markets weakening around the world. The earnings recession that has just started will continue and deepen, implying poor risk/reward for owning equities at current valuation levels.
We did not expect anything near the huge return the equity markets have delivered in 2019
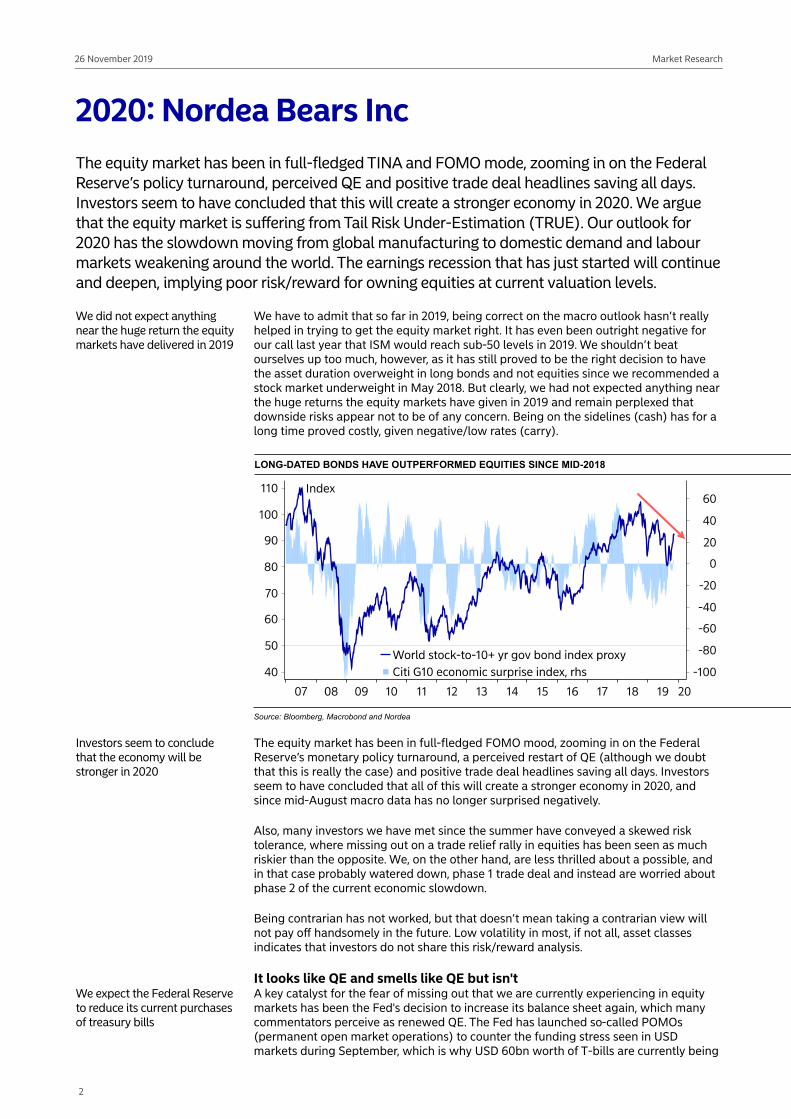
We have to admit that so far in 2019, being correct on the macro outlook hasn’t really helped in trying to get the equity market right. It has even been outright negative for our call last year that ISM would reach sub-50 levels in 2019. We shouldn’t beat ourselves up too much, however, as it has still proved to be the right decision to have the asset duration overweight in long bonds and not equities since we recommended a stock market underweight in May 2018. But clearly, we had not expected anything near the huge returns the equity markets have given in 2019 and remain perplexed that downside risks appear not to be of any concern. Being on the sidelines (cash) has for a long time proved costly, given negative/low rates (carry).
LONG-DATED BONDS HAVE OUTPERFORMED EQUITIES SINCE MID-2018
Source: Bloomberg, Macrobond and Nordea
Investors seem to conclude that the economy will be stronger in 2020
The equity market has been in full-fledged FOMO mood, zooming in on the Federal Reserve’s monetary policy turnaround, a perceived restart of QE (although we doubt that this is really the case) and positive trade deal headlines saving all days. Investors seem to have concluded that all of this will create a stronger economy in 2020, and since mid-August macro data has no longer surprised negatively.
Also, many investors we have met since the summer have conveyed a skewed risk tolerance, where missing out on a trade relief rally in equities has been seen as much riskier than the opposite. We, on the other hand, are less thrilled about a possible, and in that case probably watered down, phase 1 trade deal and instead are worried about phase 2 of the current economic slowdown.
Being contrarian has not worked, but that doesn’t mean taking a contrarian view will not pay off handsomely in the future. Low volatility in most, if not all, asset classes indicates that investors do not share this risk/reward analysis.
It looks like QE and smells like QE but isn't We expect the Federal Reserve to reduce its current purchases of treasury bills
A key catalyst for the fear of missing out that we are currently experiencing in equity markets has been the Fed's decision to increase its balance sheet again, which many commentators perceive as renewed QE. The Fed has launched so-called POMOs (permanent open market operations) to counter the funding stress seen in USD markets during September, which is why USD 60bn worth of T-bills are currently being
2
Market Research26 November 2019
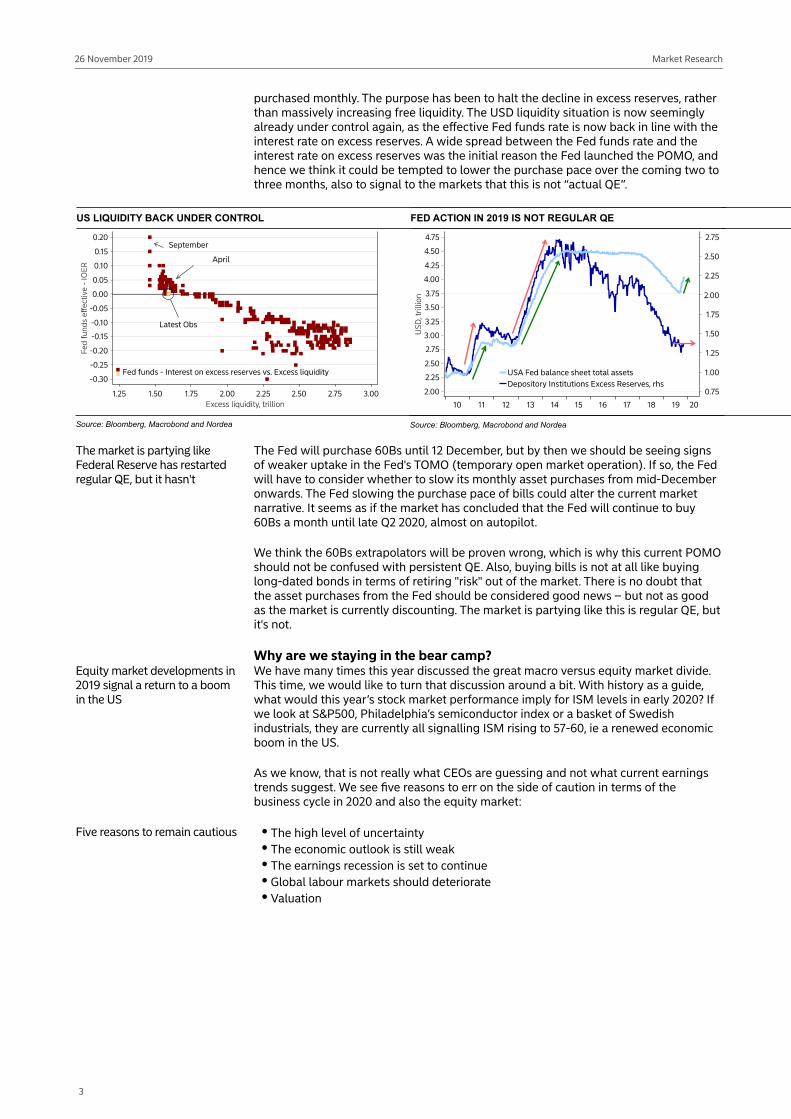
purchased monthly. The purpose has been to halt the decline in excess reserves, rather than massively increasing free liquidity. The USD liquidity situation is now seemingly already under control again, as the effective Fed funds rate is now back in line with the interest rate on excess reserves. A wide spread between the Fed funds rate and the interest rate on excess reserves was the initial reason the Fed launched the POMO, and hence we think it could be tempted to lower the purchase pace over the coming two to three months, also to signal to the markets that this is not “actual QE”.
US LIQUIDITY BACK UNDER CONTROL
Source: Bloomberg, Macrobond and Nordea
FED ACTION IN 2019 IS NOT REGULAR QE
Source: Bloomberg, Macrobond and Nordea
The market is partying like Federal Reserve has restarted regular QE, but it hasn't
The Fed will purchase 60Bs until 12 December, but by then we should be seeing signs of weaker uptake in the Fed's TOMO (temporary open market operation). If so, the Fed will have to consider whether to slow its monthly asset purchases from mid-December onwards. The Fed slowing the purchase pace of bills could alter the current market narrative. It seems as if the market has concluded that the Fed will continue to buy 60Bs a month until late Q2 2020, almost on autopilot.
We think the 60Bs extrapolators will be proven wrong, which is why this current POMO should not be confused with persistent QE. Also, buying bills is not at all like buying long-dated bonds in terms of retiring "risk" out of the market. There is no doubt that the asset purchases from the Fed should be considered good news – but not as good as the market is currently discounting. The market is partying like this is regular QE, but it's not.
Why are we staying in the bear camp?Equity market developments in 2019 signal a return to a boom in the US
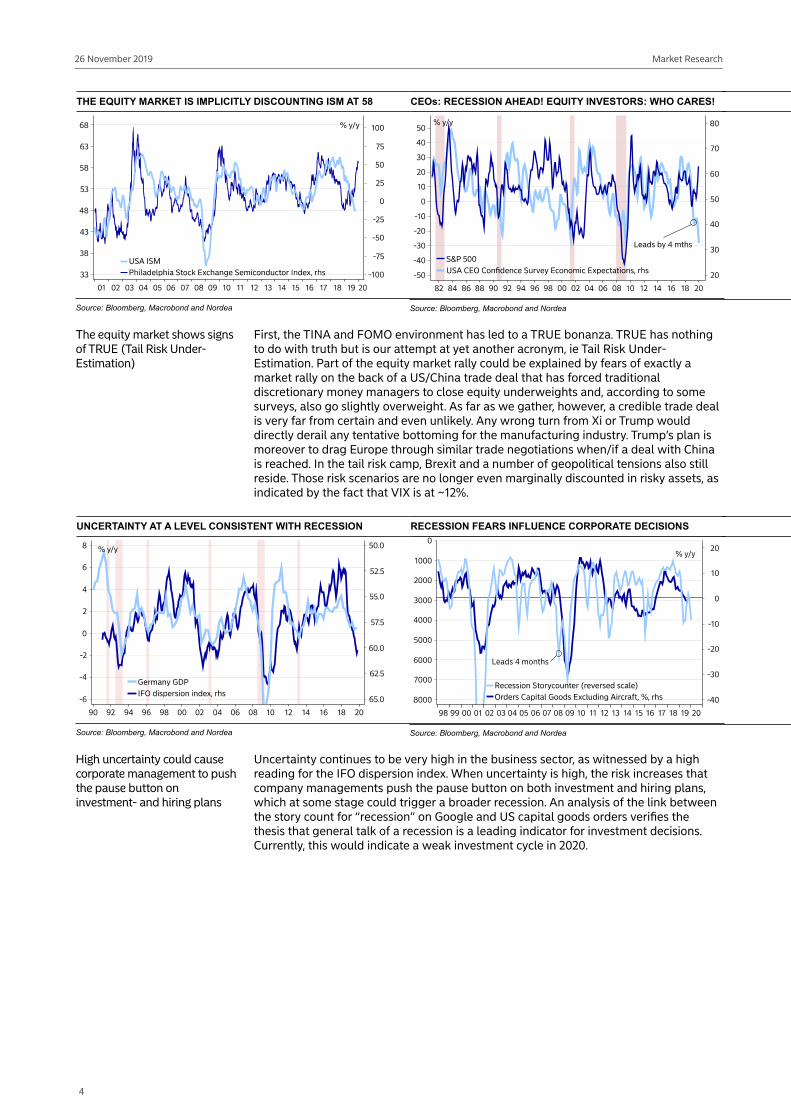
We have many times this year discussed the great macro versus equity market divide. This time, we would like to turn that discussion around a bit. With history as a guide, what would this year’s stock market performance imply for ISM levels in early 2020? If we look at S&P500, Philadelphia’s semiconductor index or a basket of Swedish industrials, they are currently all signalling ISM rising to 57-60, ie a renewed economic boom in the US.
As we know, that is not really what CEOs are guessing and not what current earnings trends suggest. We see five reasons to err on the side of caution in terms of the business cycle in 2020 and also the equity market:
Five reasons to remain cautious The high level of uncertaintyThe economic outlook is still weakThe earnings recession is set to continueGlobal labour markets should deteriorateValuation
3
Market Research26 November 2019
THE EQUITY MARKET IS IMPLICITLY DISCOUNTING ISM AT 58
Source: Bloomberg, Macrobond and Nordea
CEOs: RECESSION AHEAD! EQUITY INVESTORS: WHO CARES!
Source: Bloomberg, Macrobond and Nordea
The equity market shows signs of TRUE (Tail Risk Under-Estimation)
First, the TINA and FOMO environment has led to a TRUE bonanza. TRUE has nothing to do with truth but is our attempt at yet another acronym, ie Tail Risk Under-Estimation. Part of the equity market rally could be explained by fears of exactly a market rally on the back of a US/China trade deal that has forced traditional discretionary money managers to close equity underweights and, according to some surveys, also go slightly overweight. As far as we gather, however, a credible trade deal is very far from certain and even unlikely. Any wrong turn from Xi or Trump would directly derail any tentative bottoming for the manufacturing industry. Trump’s plan is moreover to drag Europe through similar trade negotiations when/if a deal with China is reached. In the tail risk camp, Brexit and a number of geopolitical tensions also still reside. Those risk scenarios are no longer even marginally discounted in risky assets, as indicated by the fact that VIX is at ~12%.
UNCERTAINTY AT A LEVEL CONSISTENT WITH RECESSION
Source: Bloomberg, Macrobond and Nordea
RECESSION FEARS INFLUENCE CORPORATE DECISIONS
Source: Bloomberg, Macrobond and Nordea
High uncertainty could cause corporate management to push the pause button on investment- and hiring plans
Uncertainty continues to be very high in the business sector, as witnessed by a high reading for the IFO dispersion index. When uncertainty is high, the risk increases that company managements push the pause button on both investment and hiring plans, which at some stage could trigger a broader recession. An analysis of the link between the story count for “recession” on Google and US capital goods orders verifies the thesis that general talk of a recession is a leading indicator for investment decisions. Currently, this would indicate a weak investment cycle in 2020.
4
Market Research26 November 2019
GLOBAL LIQUIDITY INDICATES SLOWDOWN IN ALL OF 2020
Source: Bloomberg, Macrobond and Nordea
LIKELIHOOD OF JAPANESE RECESSION IS INCREASING
Source: Bloomberg, Macrobond and Nordea
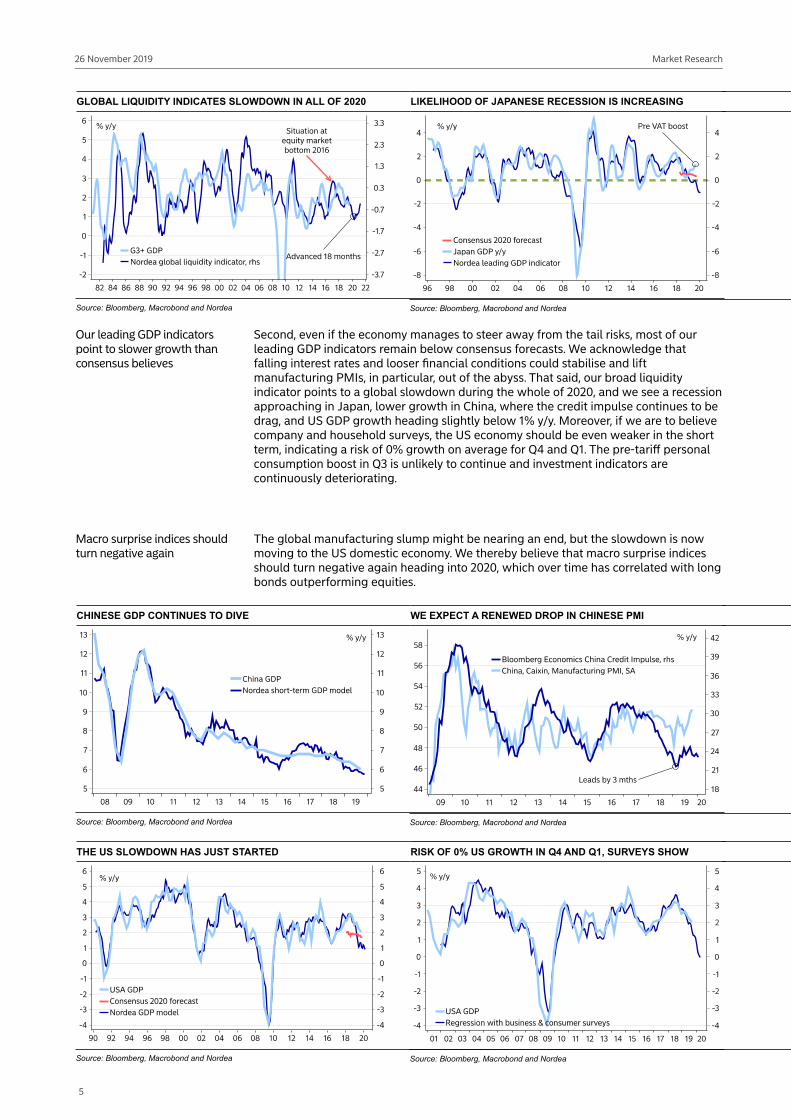
Our leading GDP indicators point to slower growth than consensus believes
Second, even if the economy manages to steer away from the tail risks, most of our leading GDP indicators remain below consensus forecasts. We acknowledge that falling interest rates and looser financial conditions could stabilise and lift manufacturing PMIs, in particular, out of the abyss. That said, our broad liquidity indicator points to a global slowdown during the whole of 2020, and we see a recession approaching in Japan, lower growth in China, where the credit impulse continues to be drag, and US GDP growth heading slightly below 1% y/y. Moreover, if we are to believe company and household surveys, the US economy should be even weaker in the short term, indicating a risk of 0% growth on average for Q4 and Q1. The pre-tariff personal consumption boost in Q3 is unlikely to continue and investment indicators are continuously deteriorating.
Macro surprise indices should turn negative again
The global manufacturing slump might be nearing an end, but the slowdown is now moving to the US domestic economy. We thereby believe that macro surprise indices should turn negative again heading into 2020, which over time has correlated with long bonds outperforming equities.
CHINESE GDP CONTINUES TO DIVE
Source: Bloomberg, Macrobond and Nordea
WE EXPECT A RENEWED DROP IN CHINESE PMI
Source: Bloomberg, Macrobond and Nordea
THE US SLOWDOWN HAS JUST STARTED
Source: Bloomberg, Macrobond and Nordea
RISK OF 0% US GROWTH IN Q4 AND Q1, SURVEYS SHOW
Source: Bloomberg, Macrobond and Nordea
5
Market Research26 November 2019
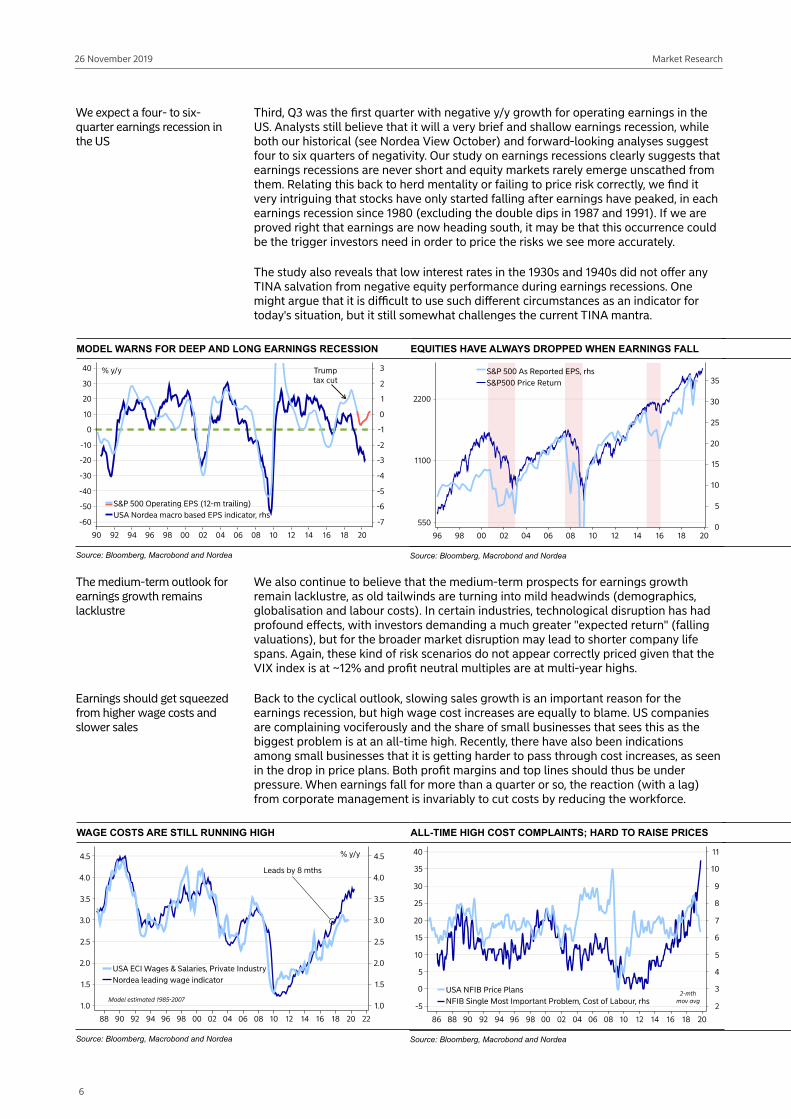
We expect a four- to six-quarter earnings recession in the US
Third, Q3 was the first quarter with negative y/y growth for operating earnings in the US. Analysts still believe that it will a very brief and shallow earnings recession, while both our historical (see Nordea View October) and forward-looking analyses suggest four to six quarters of negativity. Our study on earnings recessions clearly suggests that earnings recessions are never short and equity markets rarely emerge unscathed from them. Relating this back to herd mentality or failing to price risk correctly, we find it very intriguing that stocks have only started falling after earnings have peaked, in each earnings recession since 1980 (excluding the double dips in 1987 and 1991). If we are proved right that earnings are now heading south, it may be that this occurrence could be the trigger investors need in order to price the risks we see more accurately.
The study also reveals that low interest rates in the 1930s and 1940s did not offer any TINA salvation from negative equity performance during earnings recessions. One might argue that it is difficult to use such different circumstances as an indicator for today's situation, but it still somewhat challenges the current TINA mantra.
MODEL WARNS FOR DEEP AND LONG EARNINGS RECESSION
Source: Bloomberg, Macrobond and Nordea
EQUITIES HAVE ALWAYS DROPPED WHEN EARNINGS FALL
Source: Bloomberg, Macrobond and Nordea
The medium-term outlook for earnings growth remains lacklustre
We also continue to believe that the medium-term prospects for earnings growth remain lacklustre, as old tailwinds are turning into mild headwinds (demographics, globalisation and labour costs). In certain industries, technological disruption has had profound effects, with investors demanding a much greater "expected return" (falling valuations), but for the broader market disruption may lead to shorter company life spans. Again, these kind of risk scenarios do not appear correctly priced given that the VIX index is at ~12% and profit neutral multiples are at multi-year highs.
Earnings should get squeezed from higher wage costs and slower sales
Back to the cyclical outlook, slowing sales growth is an important reason for the earnings recession, but high wage cost increases are equally to blame. US companies are complaining vociferously and the share of small businesses that sees this as the biggest problem is at an all-time high. Recently, there have also been indications among small businesses that it is getting harder to pass through cost increases, as seen in the drop in price plans. Both profit margins and top lines should thus be under pressure. When earnings fall for more than a quarter or so, the reaction (with a lag) from corporate management is invariably to cut costs by reducing the workforce.
WAGE COSTS ARE STILL RUNNING HIGH
Source: Bloomberg, Macrobond and Nordea
ALL-TIME HIGH COST COMPLAINTS; HARD TO RAISE PRICES
Source: Bloomberg, Macrobond and Nordea
6
Market Research26 November 2019
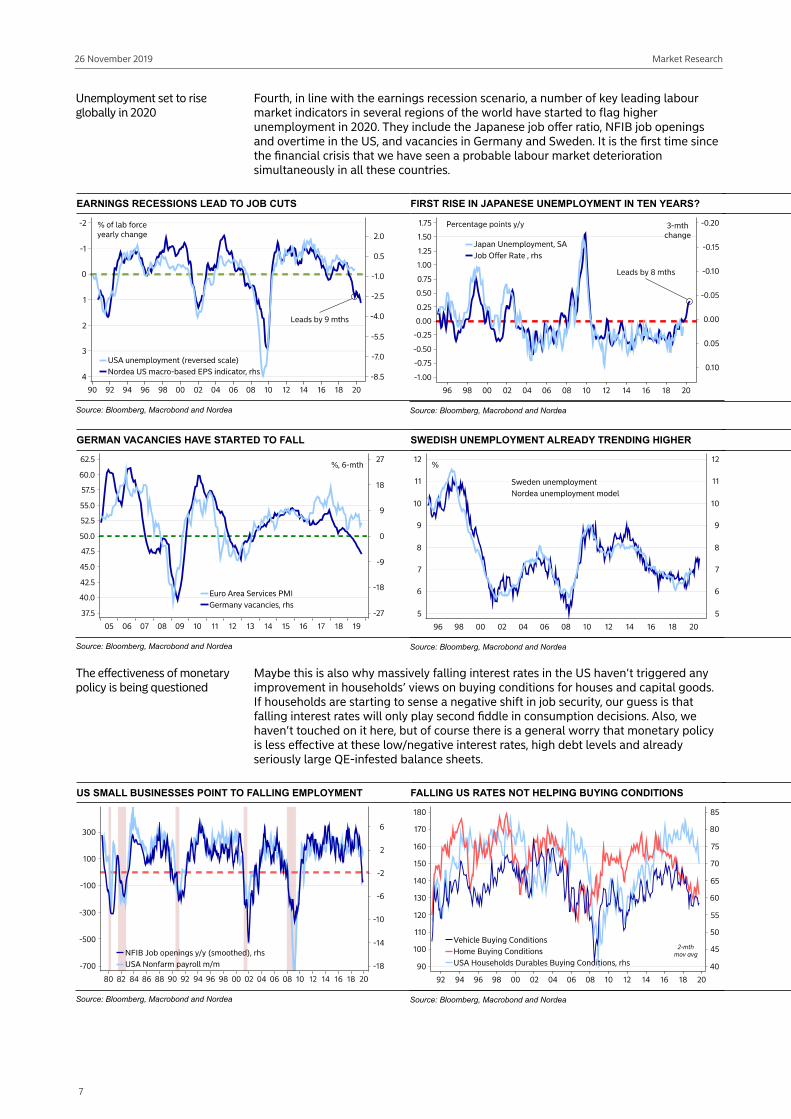
Unemployment set to rise globally in 2020
Fourth, in line with the earnings recession scenario, a number of key leading labour market indicators in several regions of the world have started to flag higher unemployment in 2020. They include the Japanese job offer ratio, NFIB job openings and overtime in the US, and vacancies in Germany and Sweden. It is the first time since the financial crisis that we have seen a probable labour market deterioration simultaneously in all these countries.
EARNINGS RECESSIONS LEAD TO JOB CUTS
Source: Bloomberg, Macrobond and Nordea
FIRST RISE IN JAPANESE UNEMPLOYMENT IN TEN YEARS?
Source: Bloomberg, Macrobond and Nordea
GERMAN VACANCIES HAVE STARTED TO FALL
Source: Bloomberg, Macrobond and Nordea
SWEDISH UNEMPLOYMENT ALREADY TRENDING HIGHER
Source: Bloomberg, Macrobond and Nordea
The effectiveness of monetary policy is being questioned
Maybe this is also why massively falling interest rates in the US haven’t triggered any improvement in households’ views on buying conditions for houses and capital goods. If households are starting to sense a negative shift in job security, our guess is that falling interest rates will only play second fiddle in consumption decisions. Also, we haven’t touched on it here, but of course there is a general worry that monetary policy is less effective at these low/negative interest rates, high debt levels and already seriously large QE-infested balance sheets.
US SMALL BUSINESSES POINT TO FALLING EMPLOYMENT
Source: Bloomberg, Macrobond and Nordea
FALLING US RATES NOT HELPING BUYING CONDITIONS
Source: Bloomberg, Macrobond and Nordea
7
Market Research26 November 2019
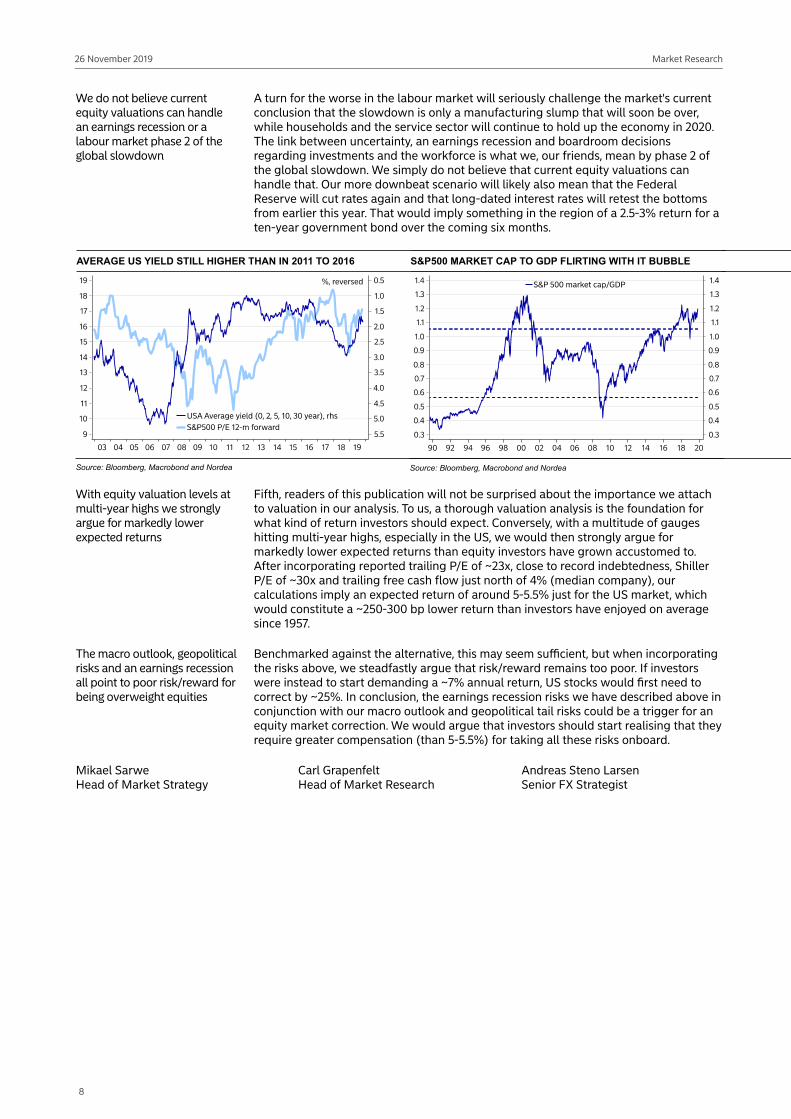
We do not believe current equity valuations can handle an earnings recession or a labour market phase 2 of the global slowdown
A turn for the worse in the labour market will seriously challenge the market's current conclusion that the slowdown is only a manufacturing slump that will soon be over, while households and the service sector will continue to hold up the economy in 2020. The link between uncertainty, an earnings recession and boardroom decisions regarding investments and the workforce is what we, our friends, mean by phase 2 of the global slowdown. We simply do not believe that current equity valuations can handle that. Our more downbeat scenario will likely also mean that the Federal Reserve will cut rates again and that long-dated interest rates will retest the bottoms from earlier this year. That would imply something in the region of a 2.5-3% return for a ten-year government bond over the coming six months.
AVERAGE US YIELD STILL HIGHER THAN IN 2011 TO 2016
Source: Bloomberg, Macrobond and Nordea
S&P500 MARKET CAP TO GDP FLIRTING WITH IT BUBBLE
Source: Bloomberg, Macrobond and Nordea
With equity valuation levels at multi-year highs we strongly argue for markedly lower expected returns
Fifth, readers of this publication will not be surprised about the importance we attach to valuation in our analysis. To us, a thorough valuation analysis is the foundation for what kind of return investors should expect. Conversely, with a multitude of gauges hitting multi-year highs, especially in the US, we would then strongly argue for markedly lower expected returns than equity investors have grown accustomed to. After incorporating reported trailing P/E of ~23x, close to record indebtedness, Shiller P/E of ~30x and trailing free cash flow just north of 4% (median company), our calculations imply an expected return of around 5-5.5% just for the US market, which would constitute a ~250-300 bp lower return than investors have enjoyed on average since 1957.
The macro outlook, geopolitical risks and an earnings recession all point to poor risk/reward for being overweight equities
Benchmarked against the alternative, this may seem sufficient, but when incorporating the risks above, we steadfastly argue that risk/reward remains too poor. If investors were instead to start demanding a ~7% annual return, US stocks would first need to correct by ~25%. In conclusion, the earnings recession risks we have described above in conjunction with our macro outlook and geopolitical tail risks could be a trigger for an equity market correction. We would argue that investors should start realising that they require greater compensation (than 5-5.5%) for taking all these risks onboard.
Mikael SarweHead of Market Strategy
Carl GrapenfeltHead of Market Research
Andreas Steno LarsenSenior FX Strategist
8

Market Research26 November 2019
2020: Nordea Bulls LtdOverbought equities in the short term suggests a correction could be imminent. That risk aside, we believe it is time to change tack and overweight equities versus bonds. Global liquidity and relaxed monetary conditions are about to lift economic activity; geopolitical concerns are well discounted; and bonds are expensive and offer no compensation for the risk. In contrast, equities do compensate for the risk, and should be able to weather a sluggish but shallow earnings cycle.
Macroeconomic backdropQE or not QE subordinated to a turn in the business cycle
Adding liquidity normally lifts economic activity
Many market participants seem to believe that what the Fed launched in October with its T-bill purchase programme is similar to a substantial QE programme. Whether one agrees with this conclusion or not, what usually happens when the Fed starts injecting liquidity is that the global manufacturing PMI starts to climb, as it has been doing. Its internal components (orders versus inventories) suggest that further improvement in the main index towards 51 may be in the pipeline. The fact that other central banks have been easing monetary policy should also help global activity, with for instance the ECB recently restarting its QE programme.
GLOBAL MANUFACTURING TENDS TO RISE WHEN THE FED ADDS LIQUIDITY
Source: Macrobond and Nordea
POSITIVE MACRO SURPRISES TO TRIGGER EQUITY OUTPERFORMANCE VERSUS BONDS
Source: Macrobond and Nordea
Better financial conditions correlate well with a China recovery
As a consequence of this year’s central bank easing, financial conditions have become more supportive of global growth. For instance, the 2019 easing of Asian financial conditions has paved the way for a fairly sharp recovery in China’s PMI.
CHINA PMI BOOSTED BY EASIER FINANCIAL CONDITIONS
Source: Macrobond and Nordea
9

Market Research26 November 2019
Trough signals are broadening The improvements in PMI manufacturing figures are not isolated to China, however. Tracking the sequential changes for G8 economies for November, including recent flash updates, extends the positive momentum. Close to two thirds of the economies are now experiencing a monthly improvement, the highest level since July 2018.
THE SEQUENTIAL PMI CHANGE SUGGESTS FURTHER IMPROVEMENT AHEAD
Source: Macrobond and Nordea
History suggests Europe and the US will see an activity uptick as well
These more positive global developments may soon start to show in both European and US figures. For instance, German manufacturing orders might need to pick up, as demand from EM Asia should be improving. Adding to that, German austerity measures are coming to an end, which could add public spending/investments worth 1% of GDP starting from 2020. US industrial sentiment also normally reacts positively to global developments, barring a significant escalation in the China/US situation. Nordea's leading stimulus indicator has over the last 6-9 months been arguing for a recovery in the forward-looking business cycle. The OECD leading indicators now appear to be responding accordingly. The very long lead on business activity retrieved from changes to (long) interest rates suggests a pickup could last well into 2021.
GERMAN FACTORY ORDERS MAY PICK UP BASED ON GLOBAL DEVELOPMENTS
Source: Macrobond and Nordea
STIMULUS INDICTORS HAVE LONG PREDICTED A RECOVERY, WHICH IS NOW GAINING SUPPORT FROM OECD LEI
Source: Macrobond and Nordea
10

Market Research26 November 2019
US YIELD CHANGES WORK WITH A LAG; THE INFLECTION POINT FOR A TURNAROUND IS WITHIN REACH
Source: Macrobond and Nordea
IF GLOBAL PMI CONTINUES TO PICK UP, THE EARNINGS RECESSION MAY BE MILD
Source: Macrobond and Nordea
Base effects are becoming more favourable too
While the outlook for world trade may remain uncertain, base effects are helpful over the next six months. World trade and eg Korean exports, a bellwether for trade, dropped at the end of 2018 and at the beginning of 2019. Should trade volumes or exports hold at their latest levels, this will mean y/y growth rates becoming less negative – or perhaps even positive.
TRADE BASE EFFECTS BENIGN OVER THE NEXT SIX MONTHS
Source: Macrobond and Nordea
GEOPOLITICAL RISK WELL REHEARSED
Source: Macrobond and Nordea
Geopolitical risk well discounted
While market participants may have become less worried about the China/US trade war, economic-political uncertainty remains high and could drop further. We argue a further drop in uncertainty will dent the dollar, which would add to the tailwinds for global activity – especially when the calendar reads 2020. A new year may lead to more risk-taking overall.
Market valuationAre we being paid to take on the risk?
In the short term, we could argue that a complacent attitude towards risk has moved the needle in a less favourable direction. Our risk-adjusted valuation model, where we deflate a valuation metric with market volatility, currently suggests poor risk/reward.
STRETCHED CONDITIONS IN RISK-ADJUSTED TERMS
Source: Macrobond and Nordea
ELEVATED ERP SHOULD CUSHION CORRECTION RISKS
Source: Macrobond and Nordea
11
Market Research26 November 2019
Equity investors are being compensated for the higher risk
This market behaviour in essence reflects an interest rate-driven market. The equity risk premium (ERP) is 4.1 percentage points (pp). The average for the last two decades is 3.1 pp. In the direct aftermath of the great financial crisis, and during the following EUR crisis, the ERP reached 6-7 pp. However, since 2014, the level has not reached much higher than the current levels. Amid the double dips in the market in 2015-16, a very similar ERP was evident. As macro conditions stabilised in late 2016, the ERP dropped as the P/E (12-month forward-looking) rose from 16.5x to 18.5x – a multiple expansion of 12%. This suggests, or at least does not rule out, that the current elevated ERP has incorporated the elevated geopolitical and business cycle uncertainty that risks taking its toll on earnings. Should these risks ease, we should expect the ERP to contract, as it has done historically.
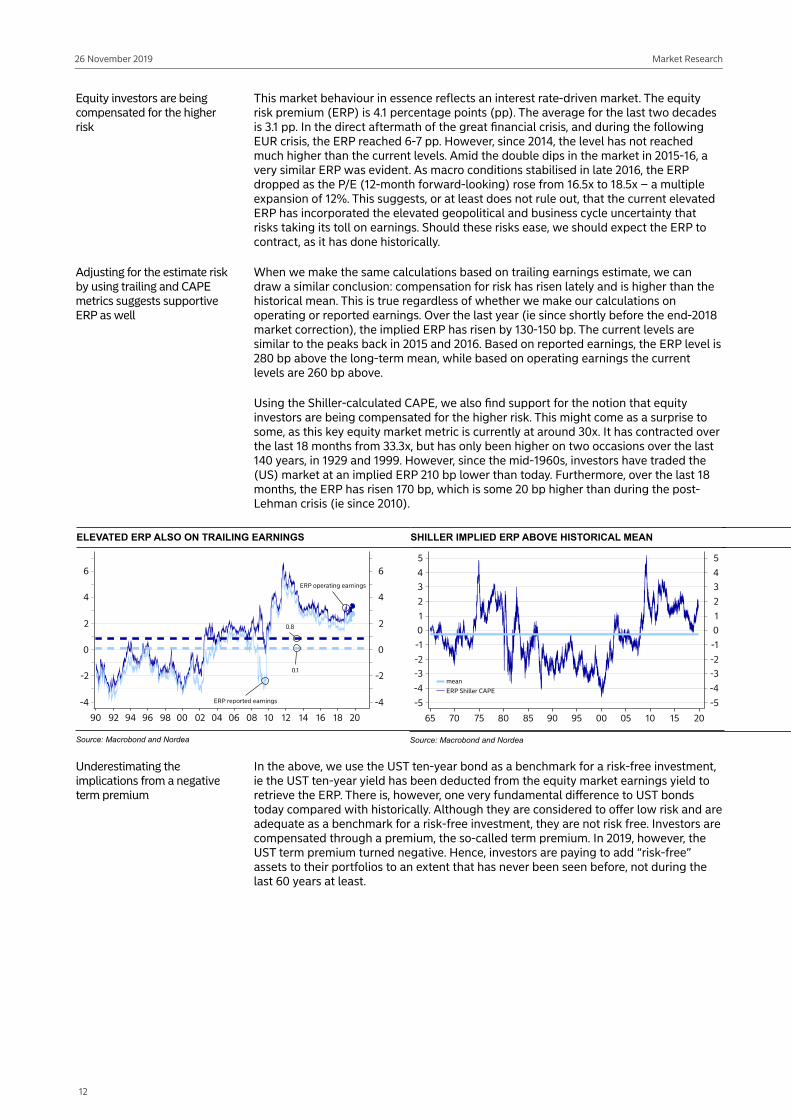
Adjusting for the estimate risk by using trailing and CAPE metrics suggests supportive ERP as well
When we make the same calculations based on trailing earnings estimate, we can draw a similar conclusion: compensation for risk has risen lately and is higher than the historical mean. This is true regardless of whether we make our calculations on operating or reported earnings. Over the last year (ie since shortly before the end-2018 market correction), the implied ERP has risen by 130-150 bp. The current levels are similar to the peaks back in 2015 and 2016. Based on reported earnings, the ERP level is 280 bp above the long-term mean, while based on operating earnings the current levels are 260 bp above.
Using the Shiller-calculated CAPE, we also find support for the notion that equity investors are being compensated for the higher risk. This might come as a surprise to some, as this key equity market metric is currently at around 30x. It has contracted over the last 18 months from 33.3x, but has only been higher on two occasions over the last 140 years, in 1929 and 1999. However, since the mid-1960s, investors have traded the (US) market at an implied ERP 210 bp lower than today. Furthermore, over the last 18 months, the ERP has risen 170 bp, which is some 20 bp higher than during the post-Lehman crisis (ie since 2010).
ELEVATED ERP ALSO ON TRAILING EARNINGS
Source: Macrobond and Nordea
SHILLER IMPLIED ERP ABOVE HISTORICAL MEAN
Source: Macrobond and Nordea
Underestimating the implications from a negative term premium
In the above, we use the UST ten-year bond as a benchmark for a risk-free investment, ie the UST ten-year yield has been deducted from the equity market earnings yield to retrieve the ERP. There is, however, one very fundamental difference to UST bonds today compared with historically. Although they are considered to offer low risk and are adequate as a benchmark for a risk-free investment, they are not risk free. Investors are compensated through a premium, the so-called term premium. In 2019, however, the UST term premium turned negative. Hence, investors are paying to add “risk-free” assets to their portfolios to an extent that has never been seen before, not during the last 60 years at least.
12

Market Research26 November 2019
Bond investors should be most concerned
BONDS TRADING AT A NEGATIVE TERM PREMIUM
Source: Federal Reserve NY and Nordea
Equity and bond risk compensation differ significantly
This could explain why key equity valuation metrics and ERP have changed in terms of how they correlate. Furthermore, when we calculate the difference between ERP and the term premium, we note that only a few months ago the spread reached levels close to 6 pp. This was not far from levels seen in the midst of the EUR crises. The spread was close to twice as high as it was during 2017-18 (before the market corrected in late 2018). In short, this suggests that equity investors are being well compensated to hold equity risk in their portfolios and the real market imbalance rests on the shoulders of the bond market.
Bond investors are having to pay for low-risk investments
EQUITY AND BOND RISK PREMIUMS REVEAL THE REAL MARKET IMBALANCE
Source: Macrobond and Nordea
Earnings outlookCan the market absorb lofty earnings expectations?
Market consensus expects a shallow profit recession for 2019 of -1%; for next year, profits are expected to rise by close to 8%. The earnings recession was also shallow back in 2015: profits dropped 3% and recovered by 3% the following year. The cyclical downturn back in 2015-16 was heavily influenced by the contraction seen in Energy, but profits within the highly cyclical Materials sector also fell a whopping 44% in 2015, rebounding by 47% in 2016.
13

Market Research26 November 2019
NET PROFIT GROWTH BY SECTOR, S&P 500, CONSENSUS ESTIMATESSector 2014 2015 2016 2017 2018 2019E 2020E 2021ECommunication Services -0.5% 18.6% 16.7% 21.3% 15.5% 0.0% 14.2% 13.1%Consumer Discretionary 2.8% 9.6% 9.2% 8.2% 16.1% -0.2% 10.4% 10.5%Consumer Staples 4.7% -3.3% 5.6% 5.4% 9.1% -0.7% 5.0% 5.6%Energy -1.7% -75.4% -83.6% 849.2% 92.4% -29.8% 20.3% 12.4%Financials 1.4% 9.1% -0.7% 9.0% 19.7% 3.7% -0.8% 3.0%Health Care 14.2% 12.9% 7.1% 7.3% 10.1% 11.7% 8.6% 9.2%Industrials 16.6% 0.1% -4.4% 7.2% 17.7% -3.3% 14.6% 7.7%Information Technology 5.9% 3.3% 2.8% 19.1% 23.2% -3.2% 6.0% 11.0%Materials 4.6% -44.0% 47.2% 64.3% 45.0% -23.5% 14.1% 12.3%Real Estate 22.6% 10.1% 26.9% -8.0% 10.3% 6.9% -15.0% 10.6%Utilities 6.8% 3.1% 7.5% -1.5% 17.4% 7.4% 6.3% 5.5%Total 5.8% -3.0% 2.8% 15.1% 20.1% -0.9% 7.6% 8.8%
Source: FactSet
Oil prices suggest ongoing flat profits for the energy sector
We flag a number of macro-oriented models suggesting that a significant earnings recession is in the making. When seeking to translate these projections on a sector basis we end up with a different outcome. The Energy sector is normally strongly correlated with the price of oil. The market currently expects a 20% rebound in profits for 2020. Should we impose a naïve forecast, setting the oil price unchanged from current levels until the end of 2020 we get a 1.5-3.0% pick up. We hence assume 2% for the Energy sector in 2020.
The financial sector normally correlates well with the equity market
Financials normally sees a strong correlation with equity market returns. This is tricky as we easily get into an autocorrelation problem. Removing index changes from the equation, we set the equity market return to 4% with an equal split between dividends and buybacks, hence assuming an unchanged market price index.
Sub trend profit growth for Health Care still suggests a good rise
The Health Care sector normally offers low profit growth volatility. Average yearly growth since 2014 has been around 10%. Consensus expects sub trend growth in both 2020 and 2021. Although a small delta, and as experienced in 2016 and 2017, consensus risks underestimating sub trend growth rates. We assume, similar to 2016 and 2017, a 7% profit increase for the sector.
IT sector profits represent a structural bet on a few major caps in our view
Information Technology is a challenge. Splitting the sector into Software and Hardware, the former profit pool is mostly collected by Facebook, Alphabet and Microsoft. In Hardware the flagship is Apple. We see little in the current business cycle that risks derailing these businesses. The negative earnings growth seen for 2019 is to a large extent base effect after two very strong years, bolstered by tax incentives and a strong business cycle. We have however trimmed the consensus outlook down to 5% growth in 2020.
Negative profits seen for highly cyclical sectors in 2020 despite a business cycle trough
Given the clear business cycle downswing, we have sharply reduced estimates relative to the consensus outlook for the cyclical Materials and Industrials sectors. We assume that instead of a rebound in profits, the recession will continue in 2020 for Industrials. However, for Materials, which is estimated to see profits shrink by close to 25% this year, we lean on several trough signals and expect profits to rise. The 15% rise expected by consensus seems a bit too lofty even for our more bullish approach. We have reduced it to a 5% profit rise, which correlates well with the recovery in industrial metals seen lately, in our view.
Communications Services is making inroads into other areas of discretionary spending
For Communication Services, we note that retail employment, real disposable incomes and propensity to save are all important in gauging demand. However, in contrast to other “discretionary” spending, these tend to have a more consumer staple demand profile. Additionally, many of the sector names are also making inroads into other “old” retail-oriented businesses. Nevertheless, they are not immune to the business cycle. We shave off half the growth expected by consensus estimates, to a 7% rise in 2020E.
New business models keep margin pressure high among Consumer Staples companies
However, for the Consumer Discretionary sector we flip the consensus 10% profit rise to a 5% decline. Although the industrial cycle is approaching a turn, the labour market normally lags. This should weigh on discretionary spending in 2020. And for Consumer Staples we allow only for profits to remain mostly unchanged (instead of the 5% rise expected by consensus, we assume a 2% decline). Apart from sluggish labour markets, structurally more intense competition implies ongoing significant pressure on margins.
14

Market Research26 November 2019
US Federal Reserve policy actions may partly protect Real Estate profits
Utilities remains steady
Given the outlook for interest rates on the back of the US Federal Reserve's relaxed policy, the 15% drop in Real Estate profits that consensus sees appears far too harsh. We have adjusted this to a 5% decline. However, should this be wrong, and consensus correct, aggregated profits would only be trimmed by 0.1 pp, we calculate. For Utilities we have assumed little economic policy interference and have trimmed the increase in profits to 5% to better align with the longer-term trend.
ADJUSTED 2020 US PROFIT OUTLOOK BY SECTOR
Profit share Consensus 2020E, % Nordea 2020E, % Diff.Communication Services 0.10 14.2 7.0 -7.2Con Discr 0.08 10.4 -5.0 -15.4Con staples 0.08 5.0 -2.0 -7.0Energy 0.04 20.3 2.0 -18.3Financials 0.18 -0.8 4.0 4.8Health Care 0.16 8.6 7.0 -1.6Industrials 0.10 14.6 -2.0 -16.6Information Technology 0.20 6.0 5.0 -1.0Materials 0.03 14.1 5.0 -9.1Real Estate 0.02 -15.0 -5.0 10.0Utilities 0.03 6.3 5.0 -1.3
7.6 3.0 -4.6
Source: FactSet and Nordea
Some y/y growth in 2020E profits, but soft
These adjustments imply that profit would “only” rise by 3% next year, relative to the consensus expected 7.6%. Our calculations are based on net profits. On our numbers, imposing a run-rate buyback estimate would lift the EPS growth rate by approximately 2 pp. What we have estimated above is that consensus is about 5 pp too optimistic. Therefore the forward-looking P/E for 2020 is 5% higher, keeping all else equal. With the starting point of 17.2x P/E, this is actually 18.1x. The earnings yield shrinks to 5.5%, and the implied ERP drops to 3.8 pp.
Given that the market has passed through a shallow earnings recession and is back to growth (although initially soft), we should be able to assume that the ERP mean reverts to 3%. (Should the negative term premium remain, we could easily argue for a lower ERP still.) An 80 bp lower ERP would allow 1.3 P/E units worth of multiple expansion and hence a P/E of 19.4x. This would suggest that some 7.2% return is visible from current levels, and for the S&P 500 Index to reach 3,350 over the next six-12 months. As we approach the end of 2020, and should consensus be correct in forecasting a 9% profit rise in 2021, the forward looking P/E would be 17.8x.
The bond market2019 has been a remarkable year for bonds, 2020 will not see a repeat
With the US Federal Reserve doing a full 180 degree turn from last year's hiking cycle, bonds have had a stellar year. The Barclays US Treasury Bond Index has returned more than 7% YTD as 10Y Treasury Rates have fallen by almost a full percentage point. The US Federal Reserve has cut rates three times this year as insurance against the possibility of an adverse outcome on US consumers from the trade war and spill over from global manufacturing weakness. Recent Bank comments make it clear that it thinks it has now taken out all the insurance the economy needs.
We see current US Federal Reserve expectations as fair
It has also set a high bar to remove the insurance cuts by saying this is contingent upon seeing inflation above 2% on a sustained basis (last seen in 2004-08). In addition, the Bank rarely hikes rates in an election year in fear of this being interpreted as political. Thus, we see the current market expectation of one more rate cut over the next two years as fair and we expect the market to keep pricing in some downside to the current Fed Funds rate.
15

Market Research26 November 2019
BOND YIELDS HAVE A TENDENCY TO TURN HIGHER ONCE A QE PROGRAMME STARTS
Source: Macrobond and Nordea
Steady bonds offer less than a third of expected equity returns
The link between Fed Funds expectations and Treasury Rates has been very stable in 2019 and we expect this to continue in 2020 (see below). Hence, with stable Fed Funds expectations, we see Treasury Rates staying put. Except for the shortest bonds, the implied forward rates are close to spot rates. We thus expect bonds to return close to current yields, ie below 2% for most US Treasuries. To see returns above the 7.2% we expect for the S&P 500, we would need to see close to a repeat of this year’s fall in rates, something that would probably take another three to four rate cuts. On the other hand, it only takes about 25-30 bp of higher rates to wipe out next year’s return in the US bond market.
US TREASURY RATES ARE DETERMINED BY FED EXPECTATIONS FOR THE NEXT TWO YEARS
Source: Macrobond and Nordea
Arvid BöhmHead of Equity Strategy
Martin EnlundChief FX strategist
Lars MoulandChief FI strategist
16
Market Research26 November 2019
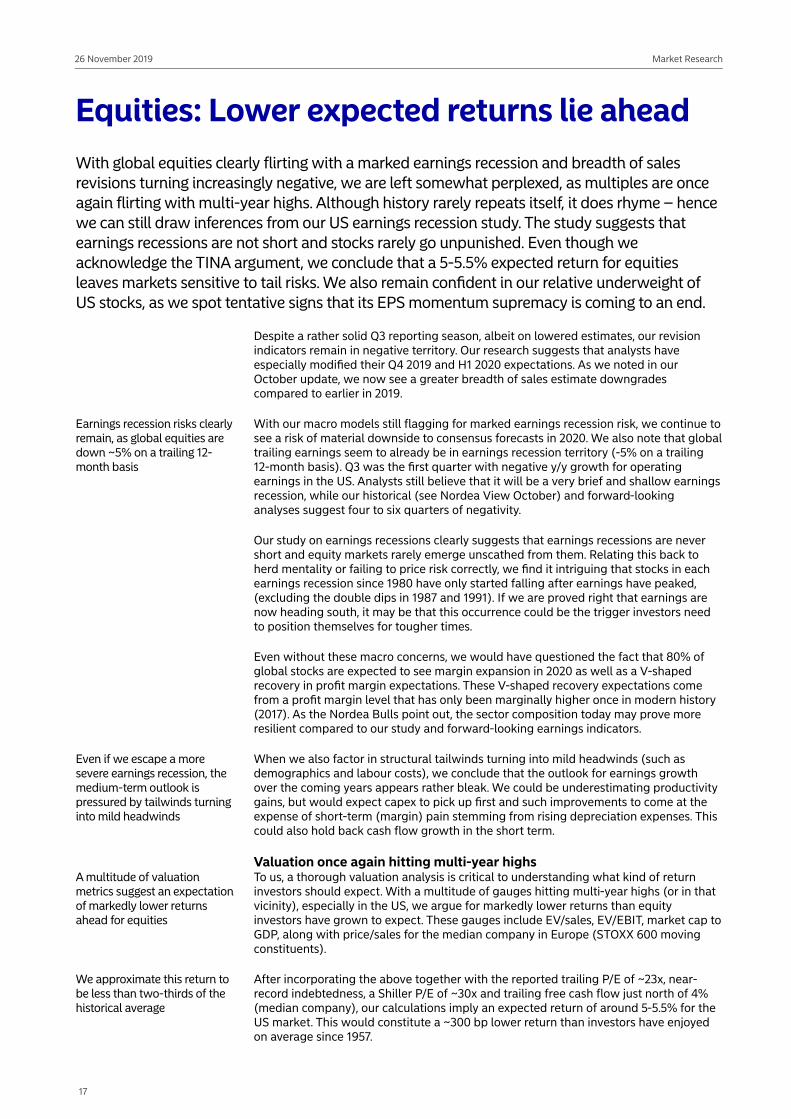
Equities: Lower expected returns lie aheadWith global equities clearly flirting with a marked earnings recession and breadth of sales revisions turning increasingly negative, we are left somewhat perplexed, as multiples are once again flirting with multi-year highs. Although history rarely repeats itself, it does rhyme – hence we can still draw inferences from our US earnings recession study. The study suggests that earnings recessions are not short and stocks rarely go unpunished. Even though we acknowledge the TINA argument, we conclude that a 5-5.5% expected return for equities leaves markets sensitive to tail risks. We also remain confident in our relative underweight of US stocks, as we spot tentative signs that its EPS momentum supremacy is coming to an end.
Despite a rather solid Q3 reporting season, albeit on lowered estimates, our revision indicators remain in negative territory. Our research suggests that analysts have especially modified their Q4 2019 and H1 2020 expectations. As we noted in our October update, we now see a greater breadth of sales estimate downgrades compared to earlier in 2019.
Earnings recession risks clearly remain, as global equities are down ~5% on a trailing 12-month basis
With our macro models still flagging for marked earnings recession risk, we continue to see a risk of material downside to consensus forecasts in 2020. We also note that global trailing earnings seem to already be in earnings recession territory (-5% on a trailing 12-month basis). Q3 was the first quarter with negative y/y growth for operating earnings in the US. Analysts still believe that it will be a very brief and shallow earnings recession, while our historical (see Nordea View October) and forward-looking analyses suggest four to six quarters of negativity.
Our study on earnings recessions clearly suggests that earnings recessions are never short and equity markets rarely emerge unscathed from them. Relating this back to herd mentality or failing to price risk correctly, we find it intriguing that stocks in each earnings recession since 1980 have only started falling after earnings have peaked, (excluding the double dips in 1987 and 1991). If we are proved right that earnings are now heading south, it may be that this occurrence could be the trigger investors need to position themselves for tougher times.
Even without these macro concerns, we would have questioned the fact that 80% of global stocks are expected to see margin expansion in 2020 as well as a V-shaped recovery in profit margin expectations. These V-shaped recovery expectations come from a profit margin level that has only been marginally higher once in modern history (2017). As the Nordea Bulls point out, the sector composition today may prove more resilient compared to our study and forward-looking earnings indicators.
Even if we escape a more severe earnings recession, the medium-term outlook is pressured by tailwinds turning into mild headwinds
When we also factor in structural tailwinds turning into mild headwinds (such as demographics and labour costs), we conclude that the outlook for earnings growth over the coming years appears rather bleak. We could be underestimating productivity gains, but would expect capex to pick up first and such improvements to come at the expense of short-term (margin) pain stemming from rising depreciation expenses. This could also hold back cash flow growth in the short term.
Valuation once again hitting multi-year highsA multitude of valuation metrics suggest an expectation of markedly lower returns ahead for equities
To us, a thorough valuation analysis is critical to understanding what kind of return investors should expect. With a multitude of gauges hitting multi-year highs (or in that vicinity), especially in the US, we argue for markedly lower returns than equity investors have grown to expect. These gauges include EV/sales, EV/EBIT, market cap to GDP, along with price/sales for the median company in Europe (STOXX 600 moving constituents).
We approximate this return to be less than two-thirds of the historical average
After incorporating the above together with the reported trailing P/E of ~23x, near-record indebtedness, a Shiller P/E of ~30x and trailing free cash flow just north of 4% (median company), our calculations imply an expected return of around 5-5.5% for the US market. This would constitute a ~300 bp lower return than investors have enjoyed on average since 1957.
17
Market Research26 November 2019
Benchmarked against the alternative, it may seem sufficient, but when incorporating the risks above, we steadfastly argue that the risk/reward remains too poor to play an overshoot like the one we witnessed in 1999. If Investors were to instead start demanding ~7% annual return, US stocks would first need to correct ~25%, before offering 7% per annum.
Given the tail risks, this warrants a defensive equity market stance
In conclusion, the earnings recession risks we have described above in conjunction with our macro outlook and geopolitical tail risks could be sufficient as a trigger for an equity market correction. We would argue that investors should start realising that they require greater compensation (more than 5-5.5%) for taking all these risks onboard.
We believe Europe and emerging markets offer higher return prospects when compared to the US
We continue to see the greatest valuation risk in the US, and steadfastly continue to argue for US underperformance. We take comfort from recent relative performance development (Europe versus US), which appears to coincide with US earnings momentum supremacy abating. We struggle to see the US regaining its relative earnings momentum strength, making for solid odds of further underperformance against both European and Emerging market equities.
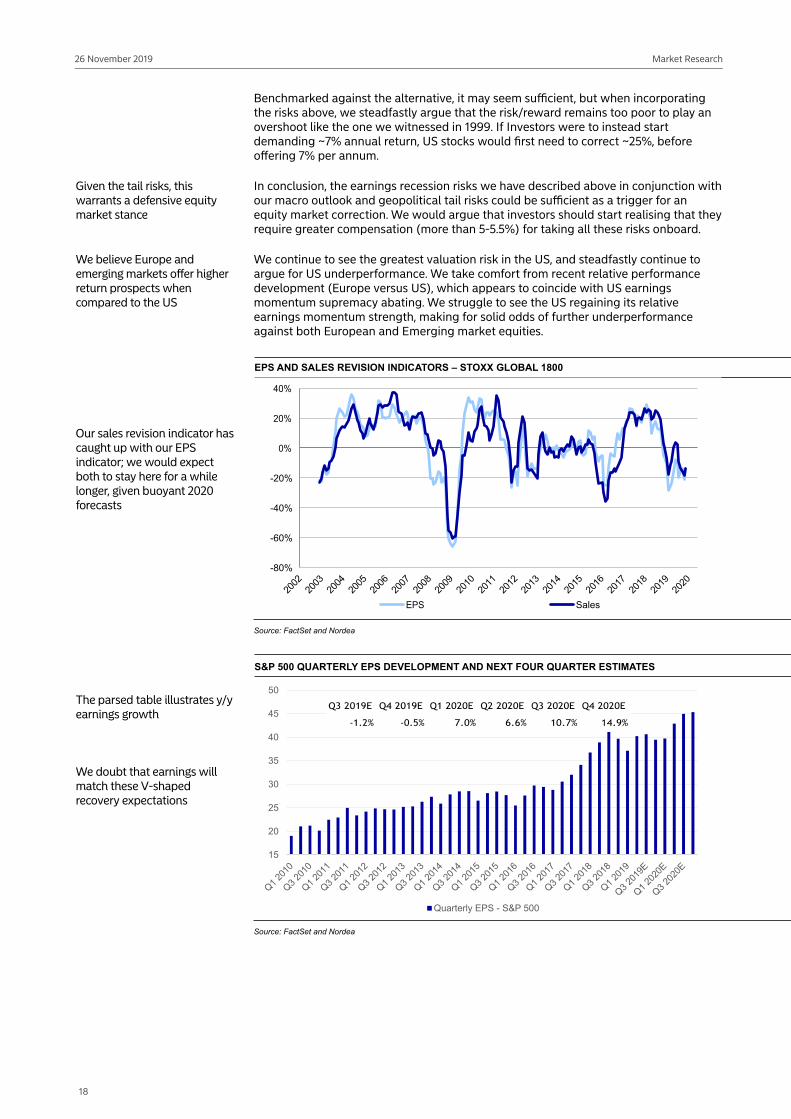
Our sales revision indicator has caught up with our EPS indicator; we would expect both to stay here for a while longer, given buoyant 2020 forecasts
EPS AND SALES REVISION INDICATORS – STOXX GLOBAL 1800
-80%
-60%
-40%
-20%
Sales
Source: FactSet and Nordea
The parsed table illustrates y/y earnings growth
We doubt that earnings will match these V-shaped recovery expectations
S&P 500 QUARTERLY EPS DEVELOPMENT AND NEXT FOUR QUARTER ESTIMATES
15
20
25
30
35
40
45
50
Quarterly EPS - S&P 500
Source: FactSet and Nordea
18
Market Research26 November 2019
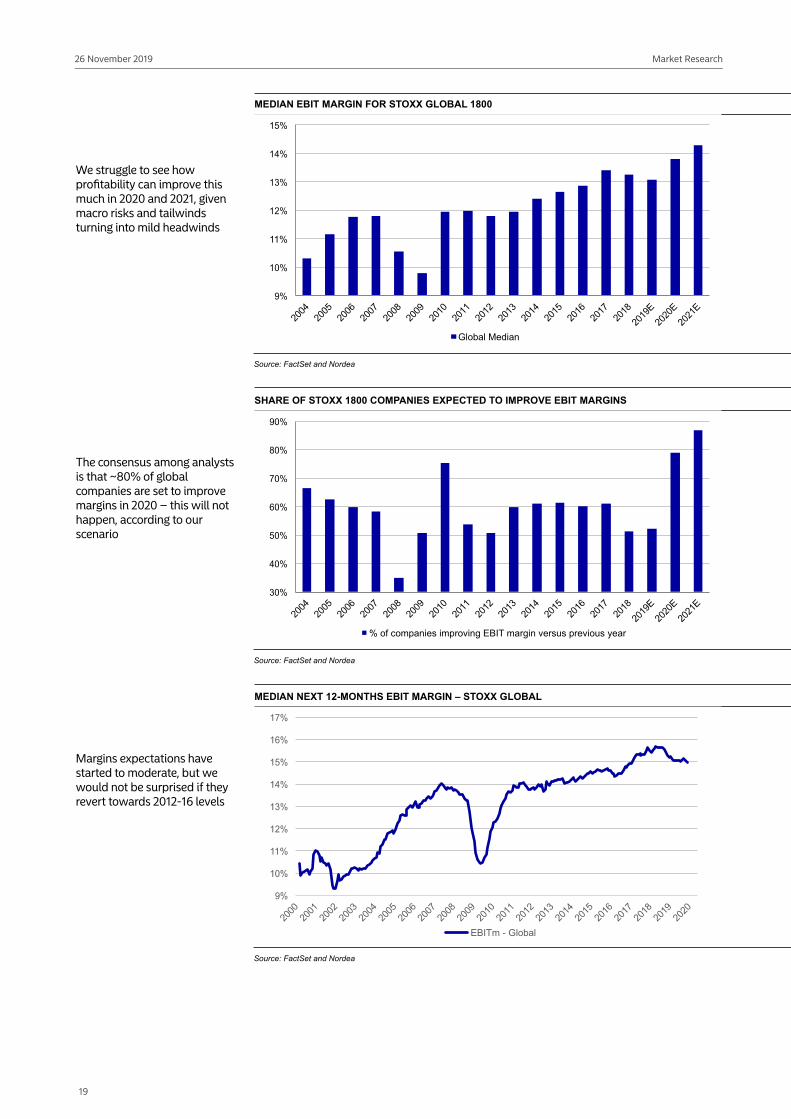
We struggle to see how profitability can improve this much in 2020 and 2021, given macro risks and tailwinds turning into mild headwinds
MEDIAN EBIT MARGIN FOR STOXX GLOBAL 1800
11%
Global Median
Source: FactSet and Nordea
The consensus among analysts is that ~80% of global companies are set to improve margins in 2020 – this will not happen, according to our scenario
SHARE OF STOXX 1800 COMPANIES EXPECTED TO IMPROVE EBIT MARGINS
% of companies improving EBIT margin versus previous year
Source: FactSet and Nordea
Margins expectations have started to moderate, but we would not be surprised if they revert towards 2012-16 levels
MEDIAN NEXT 12-MONTHS EBIT MARGIN – STOXX GLOBAL
11%
EBITm - Global
Source: FactSet and Nordea
19
Market Research26 November 2019
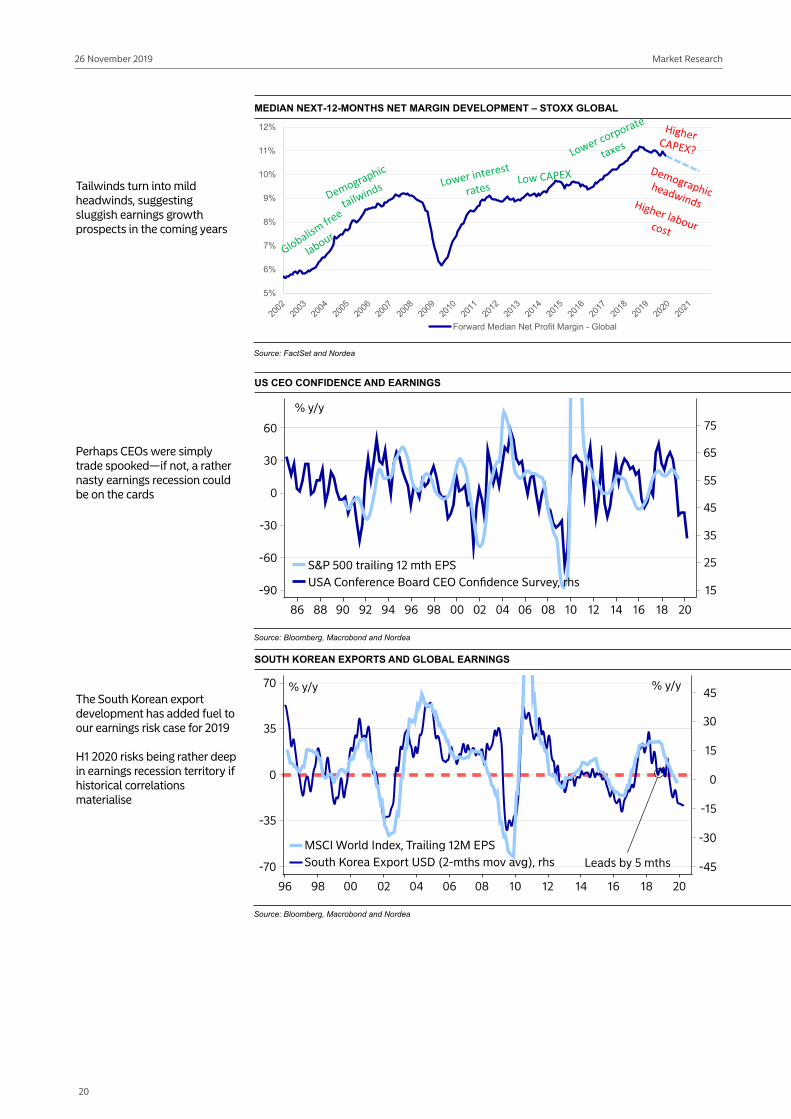
Tailwinds turn into mild headwinds, suggesting sluggish earnings growth prospects in the coming years
MEDIAN NEXT-12-MONTHS NET MARGIN DEVELOPMENT – STOXX GLOBAL
5%
6%
7%
8%
9%
10%
11%
12%
Forward Median Net Profit Margin - Global
Source: FactSet and Nordea
Perhaps CEOs were simply trade spooked—if not, a rather nasty earnings recession could be on the cards
US CEO CONFIDENCE AND EARNINGS
Source: Bloomberg, Macrobond and Nordea
The South Korean export development has added fuel to our earnings risk case for 2019
H1 2020 risks being rather deep in earnings recession territory if historical correlations materialise
SOUTH KOREAN EXPORTS AND GLOBAL EARNINGS
Source: Bloomberg, Macrobond and Nordea
20
Market Research26 November 2019
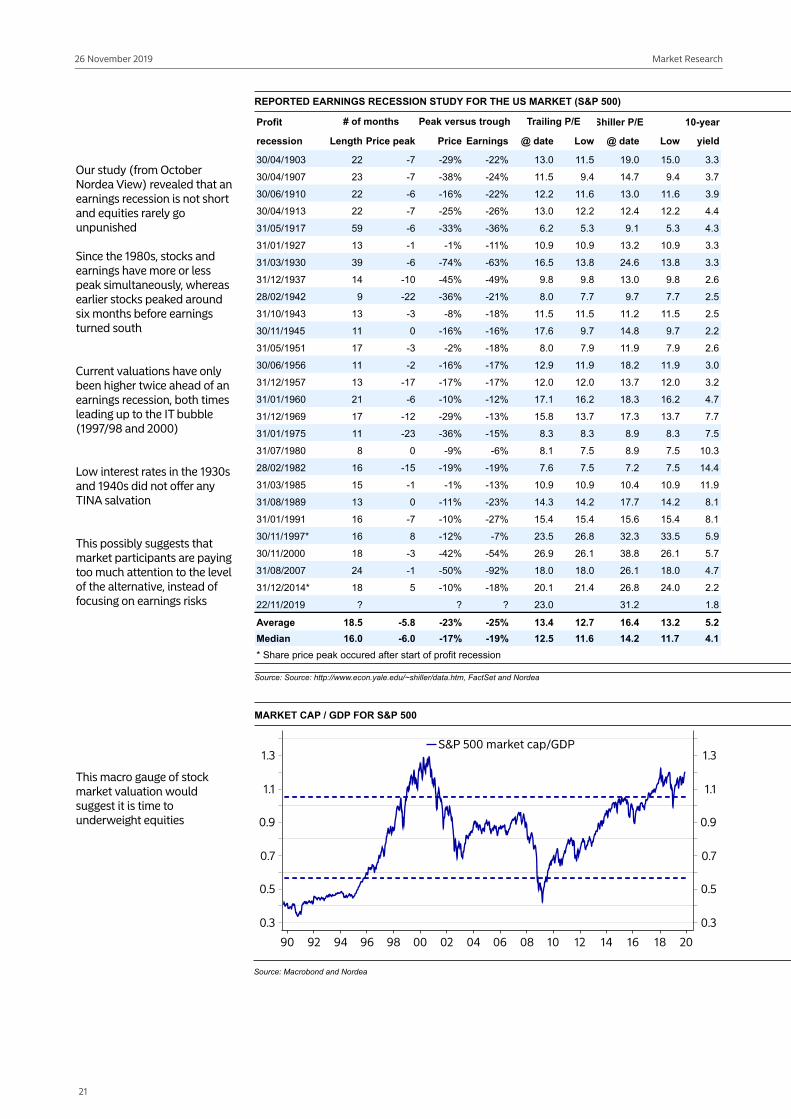
Our study (from October Nordea View) revealed that an earnings recession is not short and equities rarely go unpunished
Since the 1980s, stocks and earnings have more or less peak simultaneously, whereas earlier stocks peaked around six months before earnings turned south
Current valuations have only been higher twice ahead of an earnings recession, both times leading up to the IT bubble (1997/98 and 2000)
Low interest rates in the 1930s and 1940s did not offer any TINA salvation
This possibly suggests that market participants are paying too much attention to the level of the alternative, instead of focusing on earnings risks
REPORTED EARNINGS RECESSION STUDY FOR THE US MARKET (S&P 500)
Profit Shiller P/E 10-year
recession Length Price peak Price Earnings @ date Low @ date Low yield
30/04/1903 22 -7 -29% -22% 13.0 19.0 15.0 3.3
30/04/1907 23 -7 -38% -24% 9.4 14.7 9.4 3.7
30/06/1910 22 -6 -16% -22% 12.2 13.0 3.9
30/04/1913 22 -7 -25% -26% 13.0 12.2 12.4 12.2 4.4
31/05/1917 59 -6 -33% -36% 6.2 5.3 9.1 5.3 4.3
31/01/1927 13 -1 -1% 10.9 10.9 13.2 10.9 3.3
31/03/1930 39 -6 -74% -63% 16.5 13.8 24.6 13.8 3.3
31/12/1937 14 -10 -45% -49% 9.8 9.8 13.0 9.8 2.6
28/02/1942 9 -22 -36% -21% 8.0 7.7 9.7 7.7 2.5
31/10/1943 13 -3 -8% -18% 2.5
30/11/1945 0 -16% -16% 17.6 9.7 14.8 9.7 2.2
31/05/1951 17 -3 -2% -18% 8.0 7.9 7.9 2.6
30/06/1956 -2 -16% -17% 12.9 18.2 3.0
31/12/1957 13 -17 -17% -17% 12.0 12.0 13.7 12.0 3.2
31/01/1960 21 -6 -10% -12% 17.1 16.2 18.3 16.2 4.7
31/12/1969 17 -12 -29% -13% 15.8 13.7 17.3 13.7 7.7
31/01/1975 -23 -36% -15% 8.3 8.3 8.9 8.3 7.5
31/07/1980 8 0 -9% -6% 8.1 7.5 8.9 7.5 10.3
28/02/1982 16 -15 -19% -19% 7.6 7.5 7.2 7.5 14.4
31/03/1985 15 -1 -1% -13% 10.9 10.9 10.4 10.9
31/08/1989 13 0 -23% 14.3 14.2 17.7 14.2 8.1
31/01/1991 16 -7 -10% -27% 15.4 15.4 15.6 15.4 8.1
30/11/1997* 16 8 -12% -7% 23.5 26.8 32.3 33.5 5.9
30/11/2000 18 -3 -42% -54% 26.9 26.1 38.8 26.1 5.7
31/08/2007 24 -1 -50% -92% 18.0 18.0 26.1 18.0 4.7
31/12/2014* 18 5 -10% -18% 20.1 21.4 26.8 24.0 2.2
22/11/2019 ? ? ? 23.0 31.2 1.8
Average 18.5 -5.8 -23% -25% 13.4 12.7 16.4 13.2 5.2Median 16.0 -6.0 -17% -19% 12.5 11.6 14.2 11.7 4.1* Share price peak occured after start of profit recession
Peak versus trough Trailing P/E# of months
Source: Source: http://www.econ.yale.edu/~shiller/data.htm, FactSet and Nordea
This macro gauge of stock market valuation would suggest it is time to underweight equities
MARKET CAP / GDP FOR S&P 500
Source: Macrobond and Nordea
21
Market Research26 November 2019
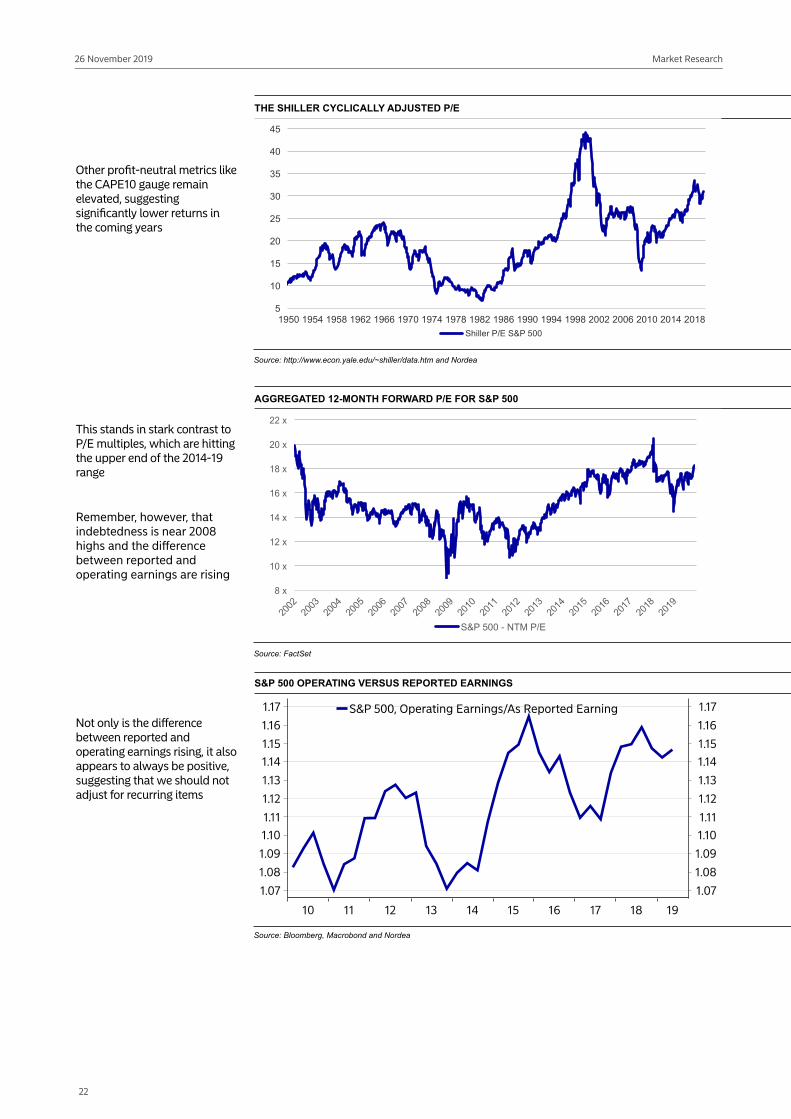
Other profit-neutral metrics like the CAPE10 gauge remain elevated, suggesting significantly lower returns in the coming years
THE SHILLER CYCLICALLY ADJUSTED P/E
5
10
15
20
25
30
35
40
45
1950 1954 1958 1962 1966 1970 1974 1978 1982 1986 1990 1994 1998 2002 2006 2010 2014 2018Shiller P/E S&P 500
Source: http://www.econ.yale.edu/~shiller/data.htm and Nordea
This stands in stark contrast to P/E multiples, which are hitting the upper end of the 2014-19 range
Remember, however, that indebtedness is near 2008 highs and the difference between reported and operating earnings are rising
AGGREGATED 12-MONTH FORWARD P/E FOR S&P 500
S&P 500 - NTM P/E
Source: FactSet
Not only is the difference between reported and operating earnings rising, it also appears to always be positive, suggesting that we should not adjust for recurring items
S&P 500 OPERATING VERSUS REPORTED EARNINGS
Source: Bloomberg, Macrobond and Nordea
22
Market Research26 November 2019
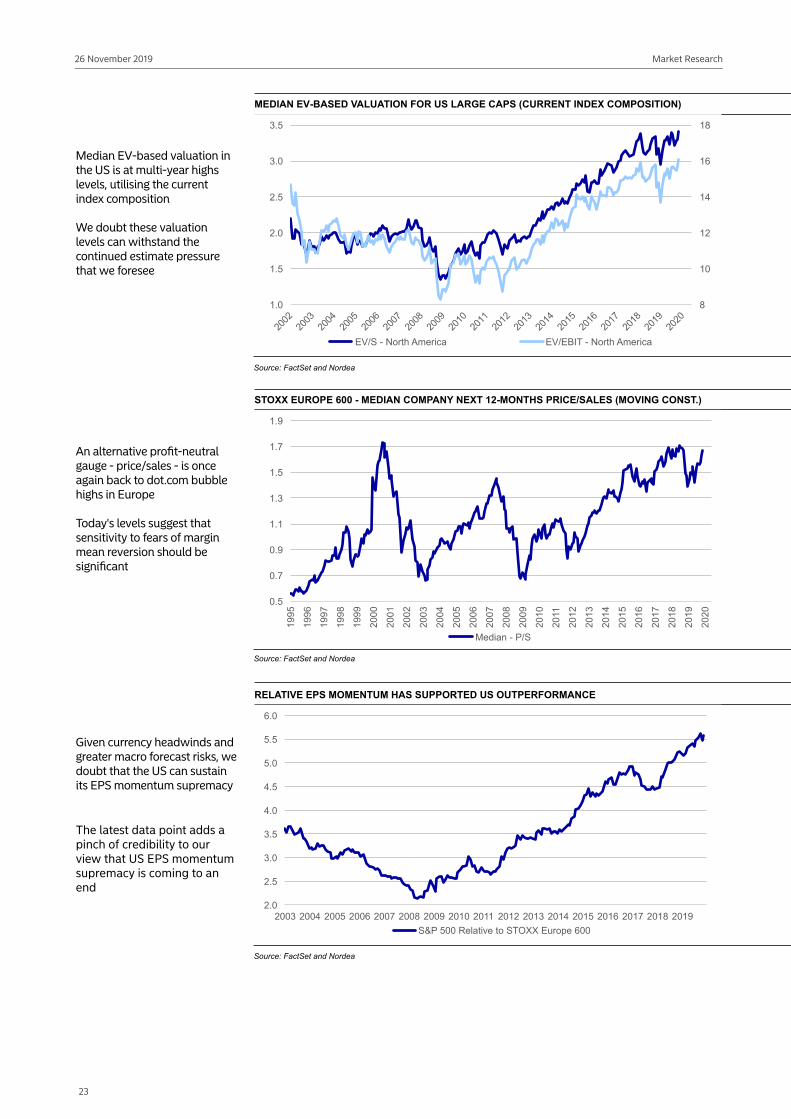
Median EV-based valuation in the US is at multi-year highs levels, utilising the current index composition
We doubt these valuation levels can withstand the continued estimate pressure that we foresee
MEDIAN EV-BASED VALUATION FOR US LARGE CAPS (CURRENT INDEX COMPOSITION)
8
10
12
14
16
18
1.0
1.5
2.0
2.5
3.0
3.5
EV/S - North America EV/EBIT - North America
Source: FactSet and Nordea
An alternative profit-neutral gauge - price/sales - is once again back to dot.com bubble highs in Europe
Today's levels suggest that sensitivity to fears of margin mean reversion should be significant
STOXX EUROPE 600 - MEDIAN COMPANY NEXT 12-MONTHS PRICE/SALES (MOVING CONST.)
0.5
0.7
0.9
1.1
1.3
1.5
1.7
1.9
Median - P/S
Source: FactSet and Nordea
Given currency headwinds and greater macro forecast risks, we doubt that the US can sustain its EPS momentum supremacy
The latest data point adds a pinch of credibility to our view that US EPS momentum supremacy is coming to an end
RELATIVE EPS MOMENTUM HAS SUPPORTED US OUTPERFORMANCE
2.0
2.5
3.0
3.5
4.0
4.5
5.0
5.5
6.0
2003 2004 2005 2006 2007 2008 2009 2010 2011 2012 2013 2014 2015 2016 2017 2018 2019S&P 500 Relative to STOXX Europe 600
Source: FactSet and Nordea
23
Market Research26 November 2019
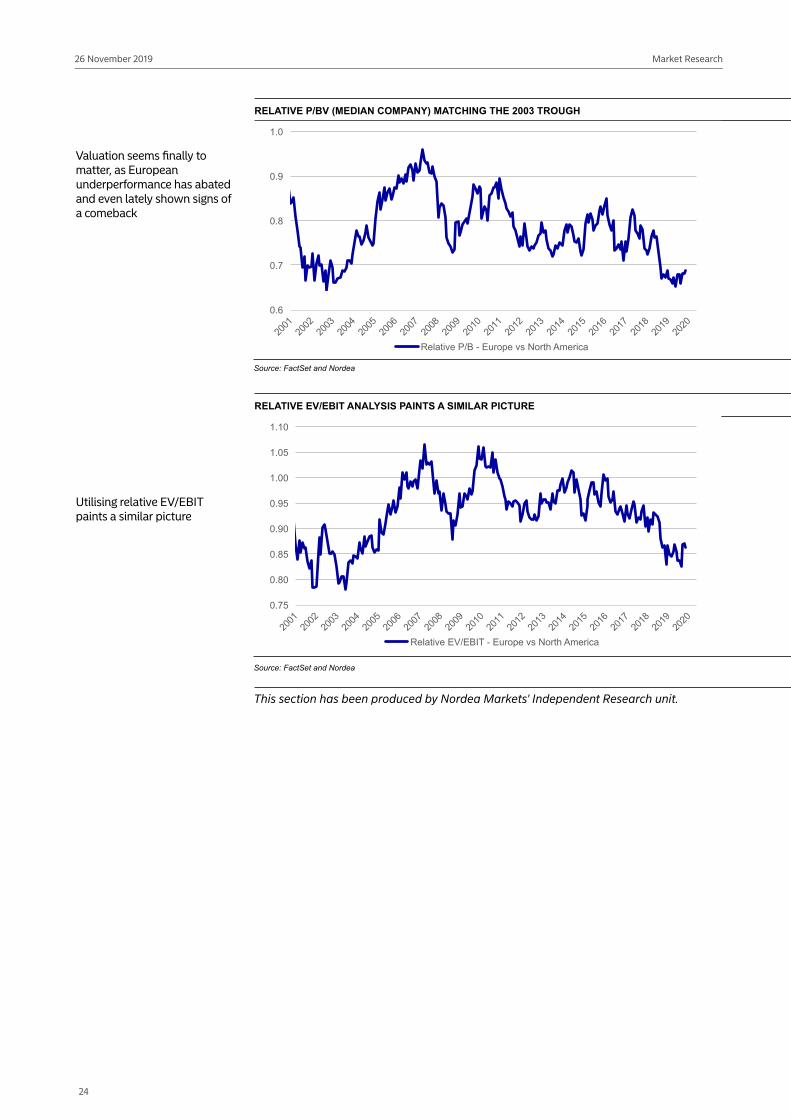
Valuation seems finally to matter, as European underperformance has abated and even lately shown signs of a comeback
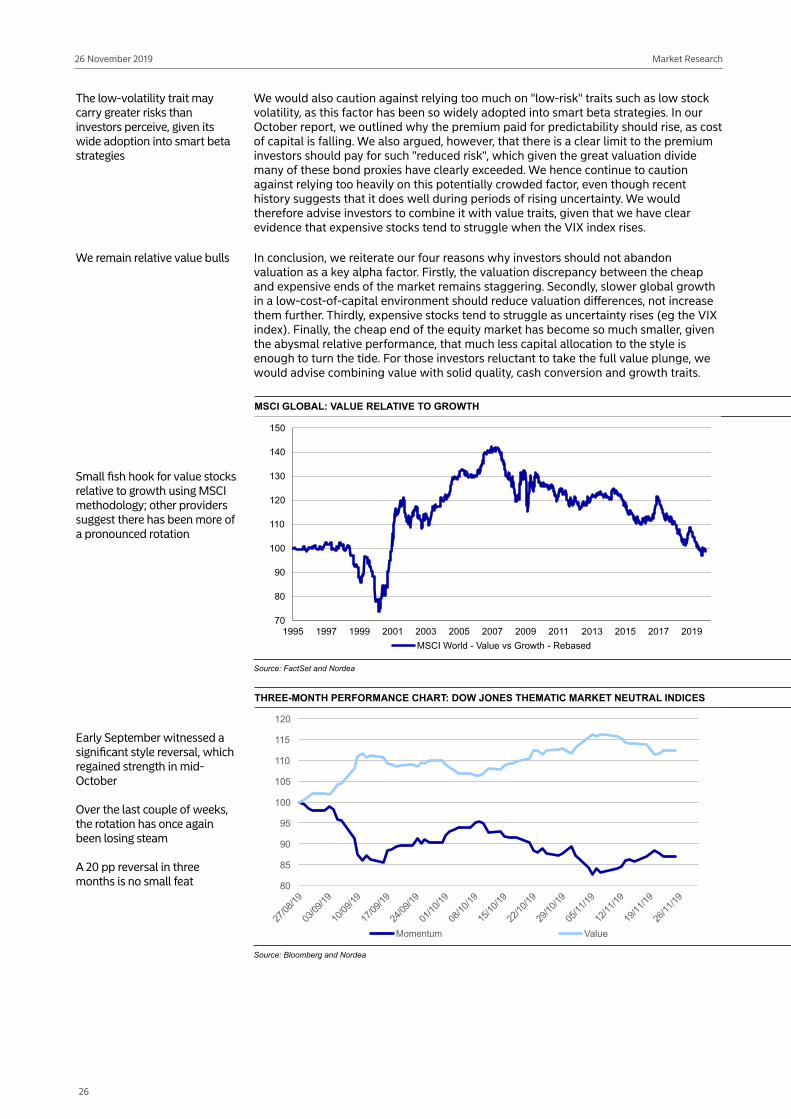
Utilising relative EV/EBIT paints a similar picture
RELATIVE P/BV (MEDIAN COMPANY) MATCHING THE 2003 TROUGH
0.6
0.7
0.8
0.9
1.0
Relative P/B - Europe vs North America
Source: FactSet and Nordea
RELATIVE EV/EBIT ANALYSIS PAINTS A SIMILAR PICTURE
0.75
0.80
0.85
0.90
0.95
1.00
1.05
1.10
Relative EV/EBIT - Europe vs North America
Source: FactSet and Nordea
This section has been produced by Nordea Markets' Independent Research unit.
24

Market Research26 November 2019
Equity styles: There is a new tune playingThe great valuation divide is finally contracting, giving us the confidence to proclaim that valuation is at last growing in importance. While we remain relative value bulls, we acknowledge that if one of our tail-risk scenarios materialises, value stocks may fall into old habits, ie underperforming as US ten-year rates fall. If they do, we argue that investors could get a second chance to play the rotation. The history books reveal several instances where value traits have protected the downside, which is why we believe that any sign of value weakness should be used as an opportunity. A more risk-averse way to play valuations growingin importance would be to combine value traits with solid quality, cash conversion and growth traits, which is backed up by the fact that our Greenblatt-inspired model is at record discount levels.
Over the past three months, there has been a new tune playing in the style world. Value stocks have staged a small recovery, while low volatility and momentum have struggled. The great valuation divide has also contracted, which, we argue, reveals that valuations appear to be growing in importance. The fact that interest rates have risen during the same period has clearly played its part in the style development.
Success factors of 2018 and H1 2019 have become losers over the past three months
We would argue, however, that the relative valuation appeal of the cheap end of the equity market has had some bearing on the new tune playing. We would also argue that positioning has contributed greatly to the size of moves we have seen. We therefore retain our view that positioning holds more significance for cracking the style conundrum.
Positioning and relative valuation key in our style conclusions
We have previously argued that the cheap end of the equity market has become so much smaller in size, thereby requiring a materially lower capital injection to reignite the style. The latest developments corroborate this thesis, in our view. We argue that changes in long-term style waves in growth versus value have more to do with fear/greed and mathematics than just what happens to global growth and interest rates. This is why we pay such close attention to the great valuation divide.
Tail risk scenario may offer a second chance to play the value hand
Having said that, if one of our tail risks materialises (a marked earnings recession, an increase in geopolitical uncertainty, the slowdown spreading to the services and labour market), there is a risk that value stocks will fall into their old habits and underperform as US rates approach the lows we observed in August. However, we would reiterate that holding value stocks protected the downside during the market corrections we witnessed during the 1980s and as the IT bubble collapsed. In those instances, interest rates also fell. During the past 12 years, any market correction has coincided with value weakness, which in our view is why there is such scepticism towards the old premise that a robust valuation analysis protects investors' downside. We conclude that, fundamentally, value stocks should not underperform in such a tail-risk scenario, but if they do, this could offer a second chance to play the contrarian card.
Combining valuation with quality also makes sense, given the unusually high discount to the market
Even though the great valuation divide has contracted somewhat, our risk/reward analysis remains intact: being valuation focused, and thereby contrarian, continues to provide good odds for a significant payoff. Given that the valuation factor has been shunned to such an extent for so long, we also find that multi-factor models including valuation, like our Greenblatt-inspired model (reasonably priced quality stocks), are also at multiyear lows from a relative valuation standpoint. Investors who for the above-mentioned reasons would hesitate to take the full value plunge could, we argue, gain exposure by combining value traits with other factor traits to a greater degree into their stock-picking processes.
We continue to warn against momentum traits, due to the high uncertainty
We also find it intriguing that the momentum factor (both price and estimate revisions) has struggled in conjunction with uncertainty gauges rising significantly, such as the IFO dispersion index and the CEO confidence survey. We have long held the view that when uncertainty is growing, estimate revisions should matter less for stock picking. In short, despite estimate revision momentum having had such amazing success in recent years, we continue to question its effectiveness when uncertainty is this high. We thus continue to caution against relying on the earnings momentum factor too much.
25
Market Research26 November 2019
The low-volatility trait may carry greater risks than investors perceive, given its wide adoption into smart beta strategies
We would also caution against relying too much on "low-risk" traits such as low stock volatility, as this factor has been so widely adopted into smart beta strategies. In our October report, we outlined why the premium paid for predictability should rise, as cost of capital is falling. We also argued, however, that there is a clear limit to the premium investors should pay for such "reduced risk", which given the great valuation divide many of these bond proxies have clearly exceeded. We hence continue to caution against relying too heavily on this potentially crowded factor, even though recent history suggests that it does well during periods of rising uncertainty. We would therefore advise investors to combine it with value traits, given that we have clear evidence that expensive stocks tend to struggle when the VIX index rises.
We remain relative value bulls In conclusion, we reiterate our four reasons why investors should not abandon valuation as a key alpha factor. Firstly, the valuation discrepancy between the cheap and expensive ends of the market remains staggering. Secondly, slower global growth in a low-cost-of-capital environment should reduce valuation differences, not increase them further. Thirdly, expensive stocks tend to struggle as uncertainty rises (eg the VIX index). Finally, the cheap end of the equity market has become so much smaller, given the abysmal relative performance, that much less capital allocation to the style is enough to turn the tide. For those investors reluctant to take the full value plunge, we would advise combining value with solid quality, cash conversion and growth traits.
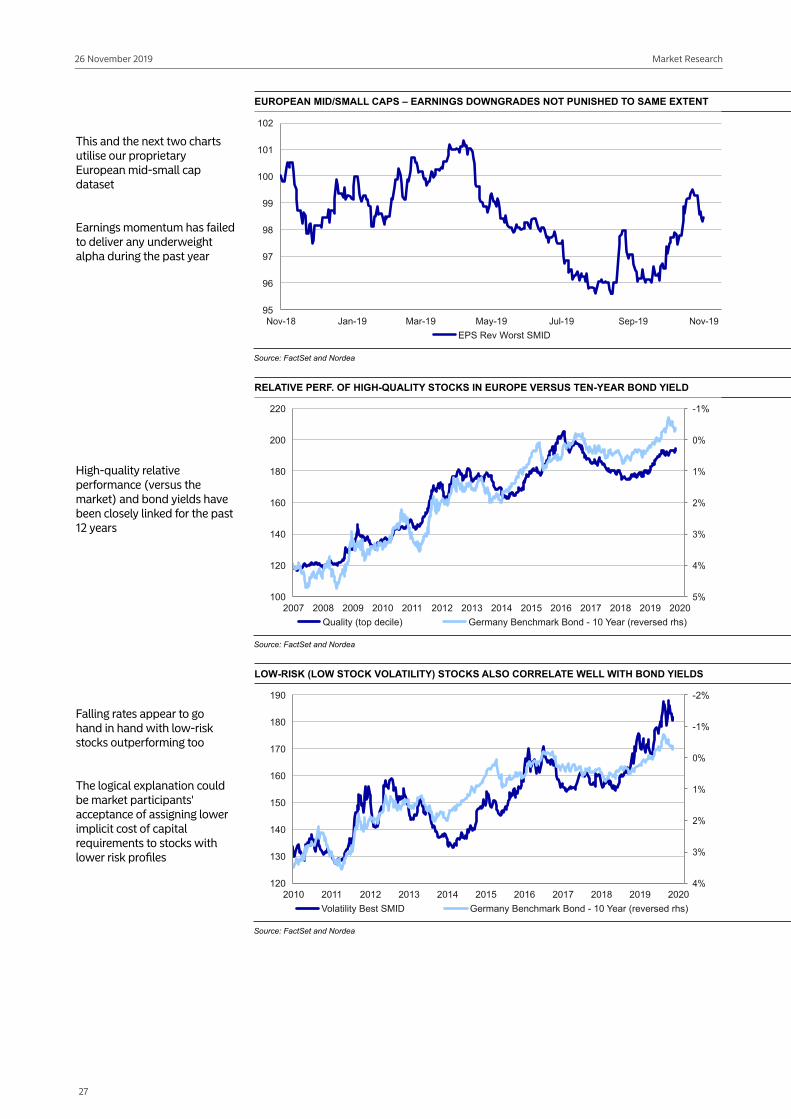
Small fish hook for value stocks relative to growth using MSCI methodology; other providers suggest there has been more of a pronounced rotation
MSCI GLOBAL: VALUE RELATIVE TO GROWTH
70
80
90
100
110
120
130
140
150
1995 1997 1999 2001 2003 2005 2007 2009 2011 2013 2015 2017 2019MSCI World - Value vs Growth - Rebased
Source: FactSet and Nordea
Early September witnessed a significant style reversal, which regained strength in mid-October
Over the last couple of weeks, the rotation has once again been losing steam
A 20 pp reversal in three months is no small feat
THREE-MONTH PERFORMANCE CHART: DOW JONES THEMATIC MARKET NEUTRAL INDICES
80
85
90
95
100
105
110
115
120
Value
Source: Bloomberg and Nordea
26
Market Research26 November 2019
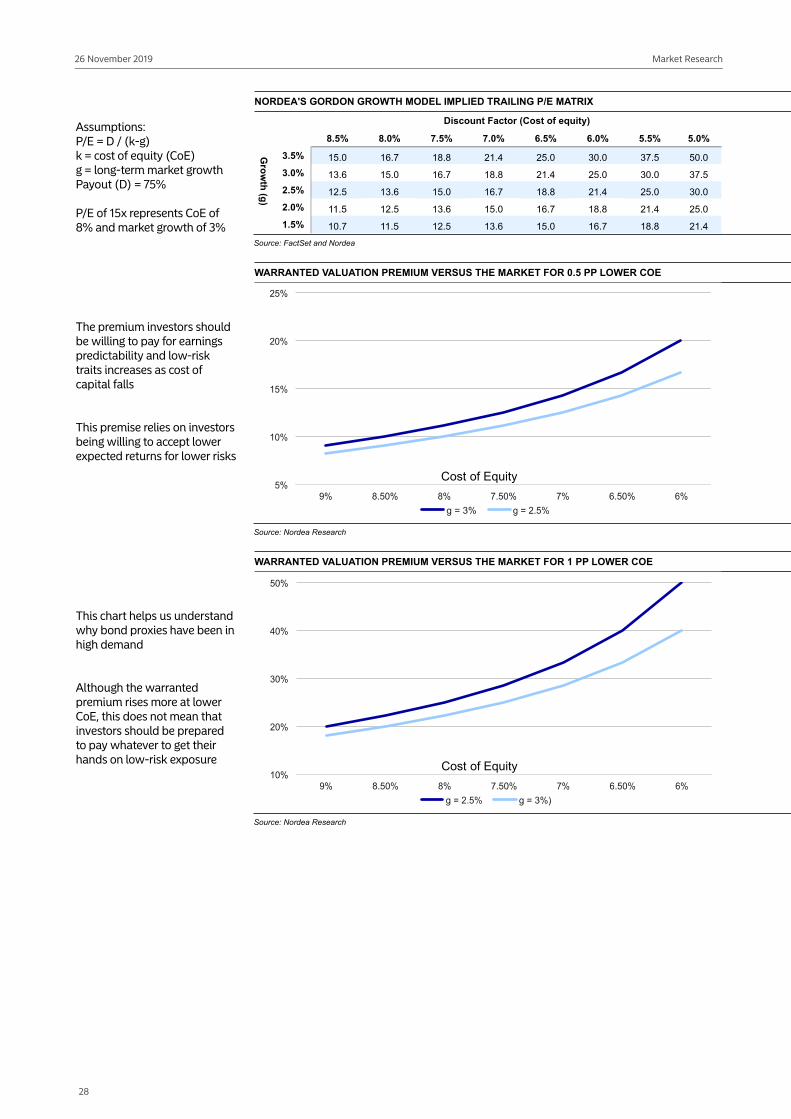
This and the next two charts utilise our proprietary European mid-small cap dataset
Earnings momentum has failed to deliver any underweight alpha during the past year
EUROPEAN MID/SMALL CAPS – EARNINGS DOWNGRADES NOT PUNISHED TO SAME EXTENT
95
96
97
98
99
100
101
102
Jan-19 Mar-19 May-19EPS Rev Worst SMID
Source: FactSet and Nordea
High-quality relative performance (versus the market) and bond yields have been closely linked for the past 12 years
RELATIVE PERF. OF HIGH-QUALITY STOCKS IN EUROPE VERSUS TEN-YEAR BOND YIELD
-1%
100
120
140
160
180
200
220
2007 2008 2009 2010 2011 2012 2013 2014 2015 2016 2017 2018 2019 2020Quality (top decile) Germany Benchmark Bond - 10 Year (reversed rhs)
Source: FactSet and Nordea
Falling rates appear to gohand in hand with low-riskstocks outperforming too
The logical explanation couldbe market participants'acceptance of assigning lowerimplicit cost of capitalrequirements to stocks withlower risk profiles
LOW-RISK (LOW STOCK VOLATILITY) STOCKS ALSO CORRELATE WELL WITH BOND YIELDS
-2%
-1%
120
130
140
150
160
170
180
190
2010 2011 2012 2013 2014 2015 2016 2017 2018 2019 2020Volatility Best SMID Germany Benchmark Bond - 10 Year (reversed rhs)
Source: FactSet and Nordea
27
Market Research26 November 2019
Assumptions:P/E = D / (k-g) k = cost of equity (CoE)g = long-term market growthPayout (D) = 75%
P/E of 15x represents CoE of 8% and market growth of 3%
NORDEA'S GORDON GROWTH MODEL IMPLIED TRAILING P/E MATRIX
8.5% 8.0% 7.5% 7.0% 6.5% 6.0% 5.5% 5.0%
3.5% 15.0 16.7 18.8 21.4 25.0 30.0 37.5 50.03.0% 13.6 15.0 16.7 18.8 21.4 25.0 30.0 37.52.5% 12.5 13.6 15.0 16.7 18.8 21.4 25.0 30.02.0% 12.5 13.6 15.0 16.7 18.8 21.4 25.01.5% 10.7 12.5 13.6 15.0 16.7 18.8 21.4
Discount Factor (Cost of equity)
Source: FactSet and Nordea
The premium investors shouldbe willing to pay for earningspredictability and low-risk traits increases as cost of capital falls
This premise relies on investors being willing to accept lower expected returns for lower risks
WARRANTED VALUATION PREMIUM VERSUS THE MARKET FOR 0.5 PP LOWER COE
g = 3%
Cost of Equity
Source: Nordea Research
This chart helps us understandwhy bond proxies have been in high demand
Although the warranted premium rises more at lower CoE, this does not mean that investors should be prepared to pay whatever to get their hands on low-risk exposure
WARRANTED VALUATION PREMIUM VERSUS THE MARKET FOR 1 PP LOWER COE
Cost of Equity
Source: Nordea Research
28
Market Research26 November 2019
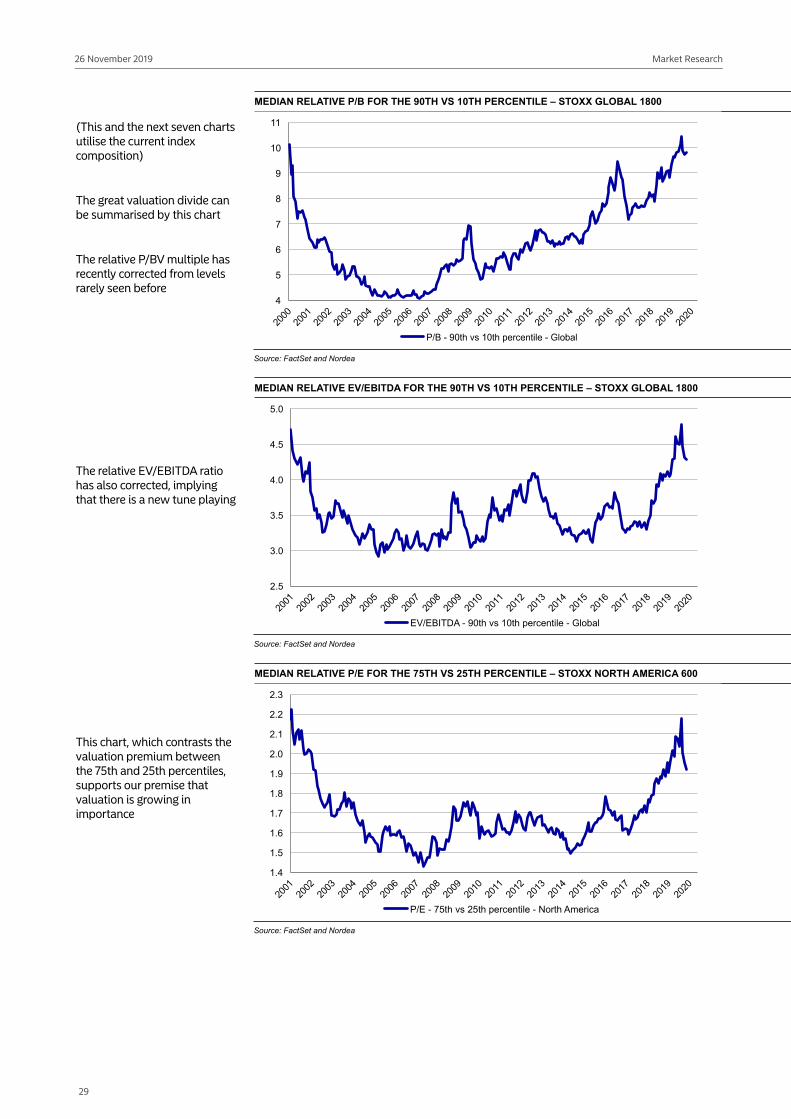
(This and the next seven charts utilise the current index composition)
The great valuation divide can be summarised by this chart
The relative P/BV multiple has recently corrected from levels rarely seen before
MEDIAN RELATIVE P/B FOR THE 90TH VS 10TH PERCENTILE – STOXX GLOBAL 1800
4
5
6
7
8
9
10
Source: FactSet and Nordea
The relative EV/EBITDA ratio has also corrected, implying that there is a new tune playing
MEDIAN RELATIVE EV/EBITDA FOR THE 90TH VS 10TH PERCENTILE – STOXX GLOBAL 1800
2.5
3.0
3.5
4.0
4.5
5.0
EV/EBITDA - 90th vs 10th percentile - Global
Source: FactSet and Nordea
This chart, which contrasts the valuation premium between the 75th and 25th percentiles, supports our premise that valuation is growing in importance
MEDIAN RELATIVE P/E FOR THE 75TH VS 25TH PERCENTILE – STOXX NORTH AMERICA 600
1.4
1.5
1.6
1.7
1.8
1.9
2.0
2.1
2.2
2.3
P/E - 75th vs 25th percentile - North America
Source: FactSet and Nordea
29
Market Research26 November 2019
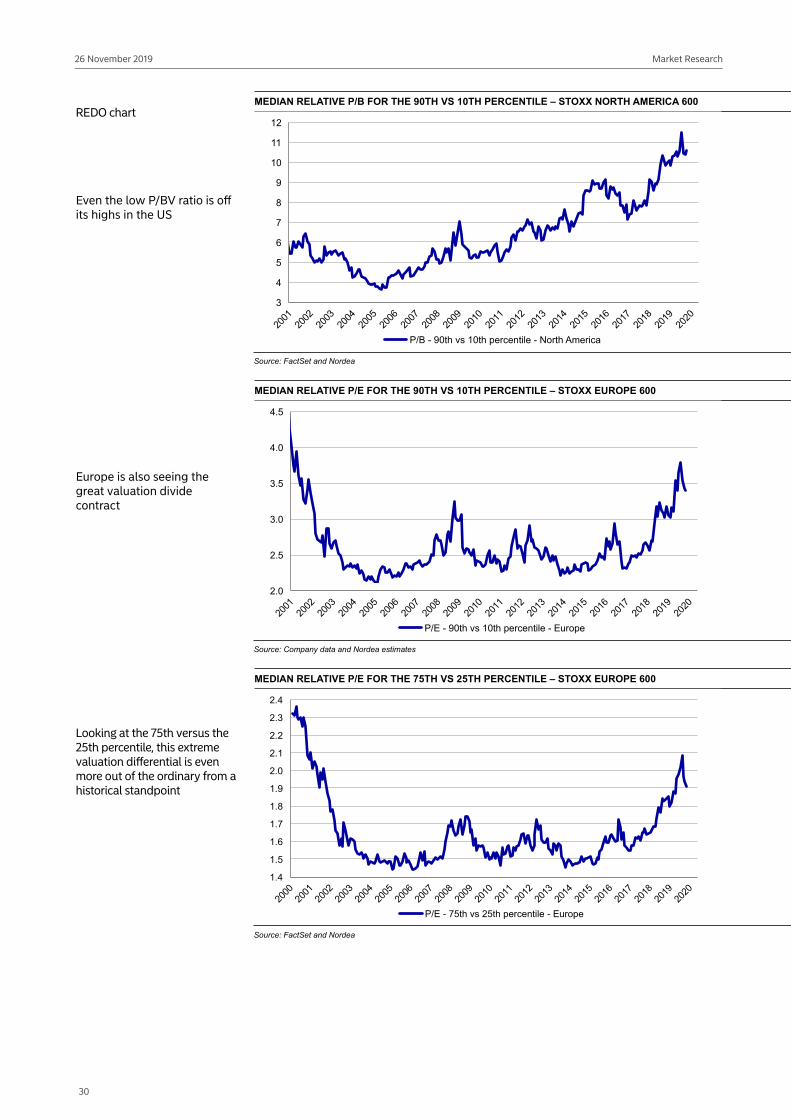
REDO chart
Even the low P/BV ratio is off its highs in the US
MEDIAN RELATIVE P/B FOR THE 90TH VS 10TH PERCENTILE – STOXX NORTH AMERICA 600
3
4
5
6
7
8
9
10
12
P/B - 90th vs 10th percentile - North America
Source: FactSet and Nordea
Europe is also seeing the great valuation divide contract
MEDIAN RELATIVE P/E FOR THE 90TH VS 10TH PERCENTILE – STOXX EUROPE 600
2.0
2.5
3.0
3.5
4.0
4.5
P/E - 90th vs 10th percentile - Europe
Source: Company data and Nordea estimates
Looking at the 75th versus the 25th percentile, this extreme valuation differential is even more out of the ordinary from a historical standpoint
MEDIAN RELATIVE P/E FOR THE 75TH VS 25TH PERCENTILE – STOXX EUROPE 600
1.4
1.5
1.6
1.7
1.8
1.9
2.0
2.1
2.2
2.3
2.4
P/E - 75th vs 25th percentile - Europe
Source: FactSet and Nordea
30
Market Research26 November 2019
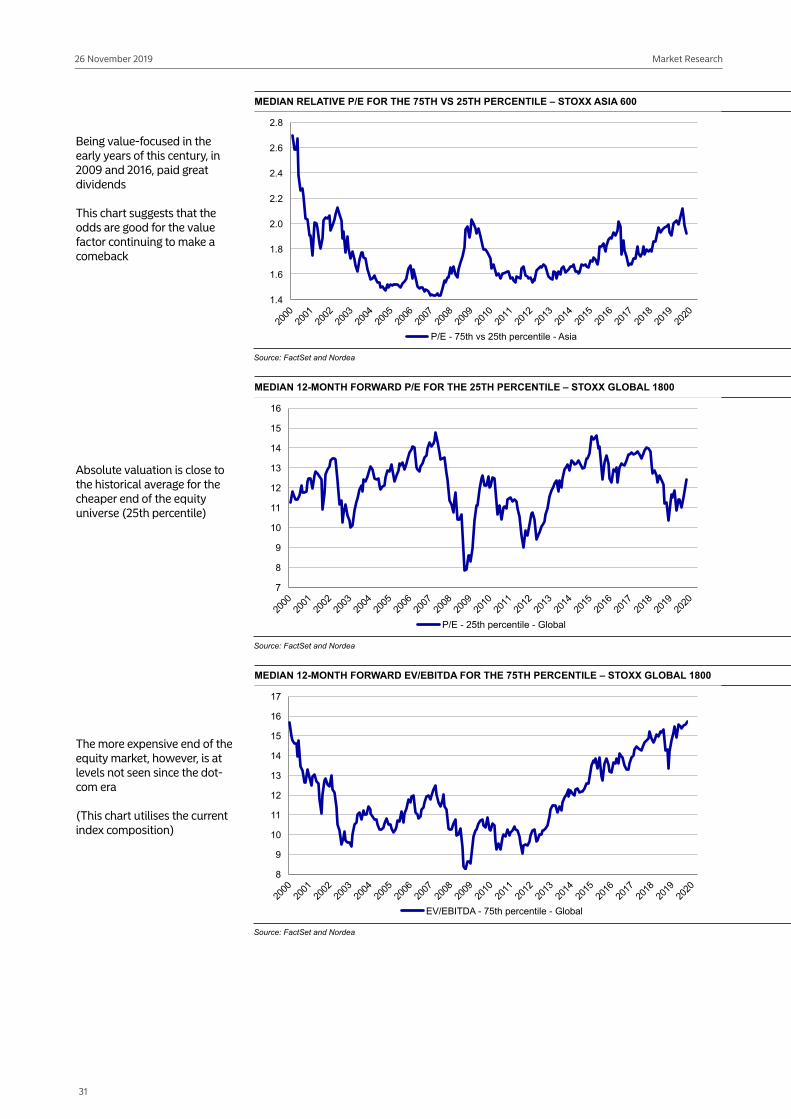
Being value-focused in the early years of this century, in 2009 and 2016, paid great dividends
This chart suggests that the odds are good for the value factor continuing to make a comeback
MEDIAN RELATIVE P/E FOR THE 75TH VS 25TH PERCENTILE – STOXX ASIA 600
1.4
1.6
1.8
2.0
2.2
2.4
2.6
2.8
P/E - 75th vs 25th percentile - Asia
Source: FactSet and Nordea
Absolute valuation is close to the historical average for the cheaper end of the equity universe (25th percentile)
MEDIAN 12-MONTH FORWARD P/E FOR THE 25TH PERCENTILE – STOXX GLOBAL 1800
7
8
9
10
12
13
14
15
16
P/E - 25th percentile - Global
Source: FactSet and Nordea
The more expensive end of the equity market, however, is at levels not seen since the dot-com era
(This chart utilises the current index composition)
MEDIAN 12-MONTH FORWARD EV/EBITDA FOR THE 75TH PERCENTILE – STOXX GLOBAL 1800
8
9
10
12
13
14
15
16
17
EV/EBITDA - 75th percentile - Global
Source: FactSet and Nordea
31
Market Research26 November 2019
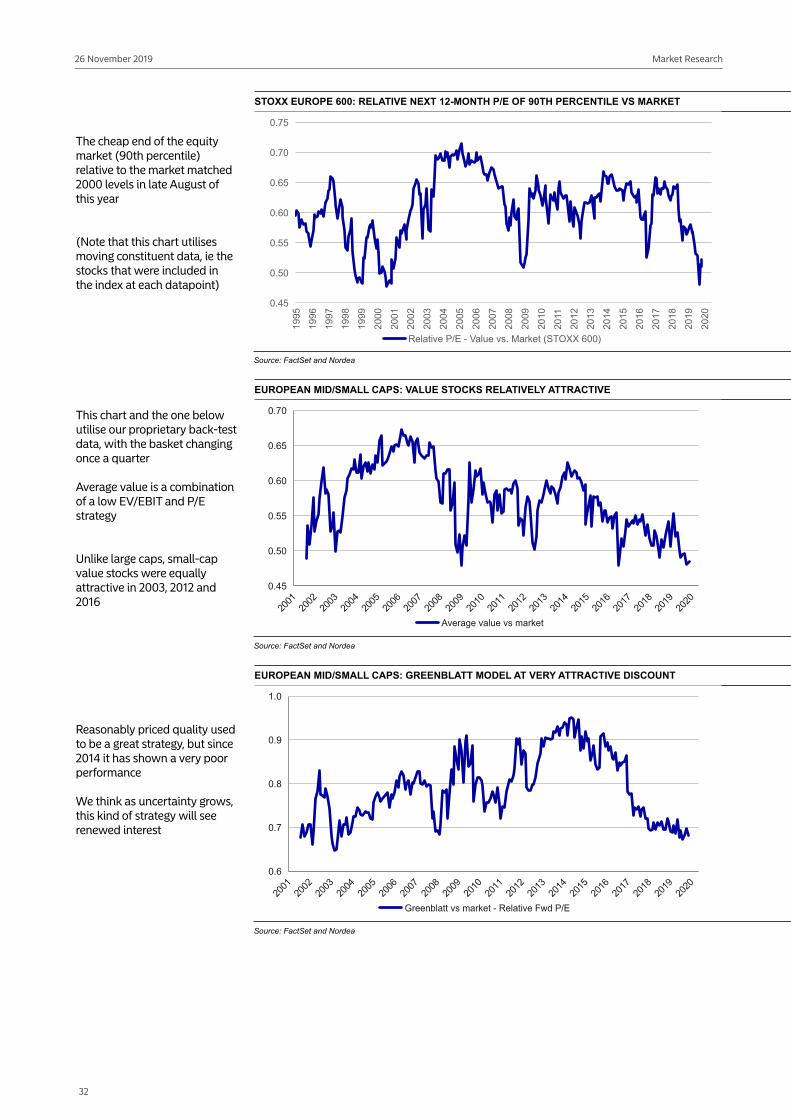
The cheap end of the equity market (90th percentile) relative to the market matched 2000 levels in late August of this year
(Note that this chart utilises moving constituent data, ie the stocks that were included in the index at each datapoint)
STOXX EUROPE 600: RELATIVE NEXT 12-MONTH P/E OF 90TH PERCENTILE VS MARKET
0.45
0.50
0.55
0.60
0.65
0.70
0.75
Relative P/E - Value vs. Market (STOXX 600)
Source: FactSet and Nordea
This chart and the one below utilise our proprietary back-test data, with the basket changing once a quarter
Average value is a combination of a low EV/EBIT and P/E strategy
Unlike large caps, small-cap value stocks were equally attractive in 2003, 2012 and 2016
EUROPEAN MID/SMALL CAPS: VALUE STOCKS RELATIVELY ATTRACTIVE
0.45
0.50
0.55
0.60
0.65
0.70
Source: FactSet and Nordea
Reasonably priced quality used to be a great strategy, but since 2014 it has shown a very poor performance
We think as uncertainty grows, this kind of strategy will see renewed interest
EUROPEAN MID/SMALL CAPS: GREENBLATT MODEL AT VERY ATTRACTIVE DISCOUNT
0.6
0.7
0.8
0.9
1.0
Source: FactSet and Nordea
32
Market Research26 November 2019
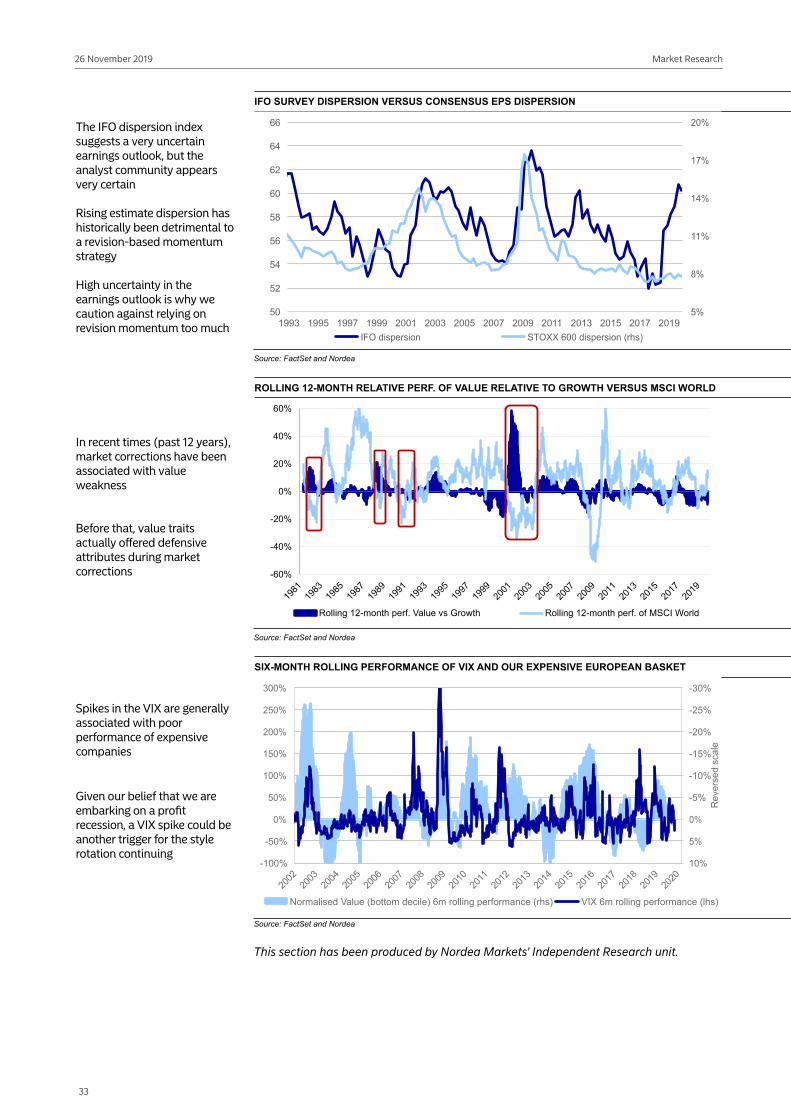
The IFO dispersion index suggests a very uncertain earnings outlook, but the analyst community appears very certain
Rising estimate dispersion has historically been detrimental to a revision-based momentum strategy
High uncertainty in the earnings outlook is why we caution against relying on revision momentum too much
IFO SURVEY DISPERSION VERSUS CONSENSUS EPS DISPERSION
11%
50
52
54
56
58
60
62
64
66
1993 1995 1997 1999 2001 2003 2005 2007 2009 2011 2013 2015 2017 2019
Source: FactSet and Nordea
In recent times (past 12 years), market corrections have been associated with value weakness
Before that, value traits actually offered defensive attributes during market corrections
ROLLING 12-MONTH RELATIVE PERF. OF VALUE RELATIVE TO GROWTH VERSUS MSCI WORLD
-60%
-40%
-20%
0%
20%
40%
60%
Rolling 12-month perf. Value vs Growth Rolling 12-month perf. of MSCI World
Source: FactSet and Nordea
Spikes in the VIX are generally associated with poor performance of expensive companies
Given our belief that we are embarking on a profit recession, a VIX spike could be another trigger for the style rotation continuing
SIX-MONTH ROLLING PERFORMANCE OF VIX AND OUR EXPENSIVE EUROPEAN BASKET
-30%
-25%
-20%
-15%
-10%
-5%
-100%
-50%
Normalised Value (bottom decile) 6m rolling performance (rhs) VIX 6m rolling performance (lhs)
Source: FactSet and Nordea
This section has been produced by Nordea Markets' Independent Research unit.
33

Nordea Bank Abp Nordea Bank Abp, filial i Sverige Nordea Danmark, Filial af Nordea Bank Abp, Finland
Nordea Bank Abp, filial i Norge
Nordea Markets Division, Research Visiting address: Aleksis Kiven katu 7, Helsinki FI-00020 Nordea Finland
Nordea Markets Division, Research Visiting address: Smålandsgatan 17 SE-105 71 Stockholm Sweden
Nordea Markets Division, Research Visiting address: Grønjordsvej 10 DK-2300 Copenhagen S Denmark
Nordea Markets Division, Research Visiting address: Essendropsgate 7 N-0107 Oslo Norway
Tel: +358 9 1651 Fax: +358 9 165 59710
Tel: +46 8 614 7000 Fax: +46 8 534 911 60
Tel: +45 3333 3333 Fax: +45 3333 1520
Tel: +47 2248 5000 Fax: +47 2256 8650
Reg. no.: 2858394-9 Satamaradankatu 5 Helsinki
Confidential
Disclaimer Nordea Markets is the commercial name for Nordea’s international capital markets operation. The information provided herein is intended for background information only and for the sole use of the intended recipient. The views and other information provided herein are the current views of Nordea Markets as of the date of this document and are subject to change without notice. This notice is not an exhaustive description of the described product or the risks related to it, and it should not be relied on as such, nor is it a substitute for the judgement of the recipient. This report should be considered marketing material as the macro and FX sections have not been produced in accordance with the regulations designed to promote the independence of investment research and it is not subject to any legal prohibition on dealing ahead of the dissemination of the report. The information provided herein is not intended to constitute and does not constitute investment advice nor is the information intended as an offer or solicitation for the purchase or sale of any financial instrument. The information contained herein has no regard to the specific investment objectives, the financial situation or particular needs of any particular recipient. Relevant and specific professional advice should always be obtained before making any investment or credit decision. It is important to note that past performance is not indicative of future results. In the United States, to the extent that this publication or report includes an analysis of the price or market for any derivative and is not otherwise exempt from the applicable U.S. Commodity Futures Trading Commission (CFTC) regulations, it is approved for distribution in the United States to US persons that are eligible contract participants from a CFTC perspective. Nordea Bank Abp is a provisionally registered swap dealer with the CFTC. Any derivatives transactions with US persons must be effected in accordance with the provisions of the Dodd-Frank Wall Street Reform and Consumer Protection Act.
Completion date: 25 Nov ember 2019, 15:55 CET
Related Documents