Nonthyrotoxic Prevention of Diet-Induced Insulin Resistance by 3,5-Diiodo-L-Thyronine in Rats Pieter de Lange, 1 Federica Cioffi, 2 Rosalba Senese, 1 Maria Moreno, 2 Assunta Lombardi, 3 Elena Silvestri, 2 Rita De Matteis, 4 Lillà Lionetti, 3 Maria Pina Mollica, 3 Fernando Goglia, 2 and Antonia Lanni 1 OBJECTIVE—High-fat diets (HFDs) are known to induce in- sulin resistance. Previously, we showed that 3,5-diiodothyronine (T2), concomitantly administered to rats on a 4-week HFD, pre- vented gain in body weight and adipose mass. Here we investi- gated whether and how T2 prevented HFD-induced insulin resistance. RESEARCH DESIGN AND METHODS—We investigated the biochemical targets of T2 related to lipid and glucose homeosta- sis over time using various techniques, including genomic and proteomic profiling, immunoblotting, transient transfection, and enzyme activity analysis. RESULTS—Here we show that, in rats, HFD feeding induced insulin resistance (as expected), whereas T2 administration pre- vented its onset. T2 did so by rapidly stimulating hepatic fatty acid oxidation, decreasing hepatic triglyceride levels, and improv- ing the serum lipid profile, while at the same time sparing skeletal muscle from fat accumulation. At the mechanistic level, 1) trans- fection studies show that T2 does not act via thyroid hormone receptor b; 2) AMP-activated protein kinase is not involved in triggering the effects of T2; 3) in HFD rats, T2 rapidly increases hepatic nuclear sirtuin 1 (SIRT1) activity; 4) in an in vitro assay, T2 directly activates SIRT1; and 5) the SIRT1 targets peroxisome proliferator–activated receptor (PPAR)-g coactivator (PGC-1a) and sterol regulatory element–binding protein (SREBP)-1c are deacetylated with concomitant upregulation of genes involved in mitochondrial biogenesis and downregulation of lipogenic genes, and PPARa/d-induced genes are upregulated, whereas genes in- volved in hepatic gluconeogenesis are downregulated. Proteomic analysis of the hepatic protein profile supported these changes. CONCLUSIONS—T2, by activating SIRT1, triggers a cascade of events resulting in improvement of the serum lipid profile, prevention of fat accumulation, and, finally, prevention of diet- induced insulin resistance. Diabetes 60:2730–2739, 2011 O besity and associated disorders (including insu- lin resistance, glucose intolerance, dyslipidemia, and hypertension) are approaching epidemic proportions worldwide (1,2). Increasing lipid oxidation in the liver is a key target for improving dis- turbed glucose homeostasis. Thyroid hormones (THs) are important inducers of both lipid metabolism and meta- bolic rate by increasing energy expenditure (3), and their potential use as hypolipidemic agents has been consid- ered. However, THs cause a clinical thyrotoxic state—as manifested by cardiac tachyarrhythmia, systolic hyper- tension, heart failure, and skeletal muscle weakness— that abolishes their usage for this purpose. Instead, current research is focusing on the development of TH analogs that are both tissue and TH receptor (TR) selective (in partic- ular, for the TRb isoform, which is predominantly involved in TH-induced lipid metabolism) (rev. in 4–7). We recently showed that a natural TH derivative, 3,5-diiodo-L-thyronine (T2), prevents adiposity and body weight gain when ad- ministered to rats receiving a high-fat diet (HFD) without unfavorable side effects, usually caused by 3,5,39-triiodo-L- thyronine (T3), by increasing both energy expenditure and hepatic fatty acid oxidation rate, a process involving AMP-activated protein kinase (AMPK) (8). To investigate whether T2 ameliorates glucose homeostasis, we studied whether and how T2 treatment in rats receiving an HFD would influence lipid accumulation, glucose tolerance, and insulin resistance. Important regulators of lipid/glucose homeostasis include AMPK and the NAD + -dependent deacetylase sirtuin 1 (SIRT1). AMPK is a known metabolic sensor of cellular ATP levels (9), whereas SIRT1 has also emerged as an important regulator of metabolic balance (10–16) that acts in response to an increase in the in- tracellular NAD + /NADH ratio. To examine whether AMPK and/or SIRT1 triggered the beneficial effects of T2 on energy homeostasis, we studied hepatic AMPK phosphorylation and SIRT1 activity over time, in relation to metabolic parameters and the expression of AMPK/SIRT1 target genes/ proteins involved therein, and we evaluated whether T2 was also able to directly activate SIRT1. RESEARCH DESIGN AND METHODS Animal experiments. All animals received humane care according to the criteria outlined in the Guide for the Care and Use of Laboratory Animals prepared by the National Academy of Sciences and published by the National Institutes of Health. Male Wistar rats (250–300 g) (Charles River Laboratories) were kept one per cage in a temperature-controlled room at 28°C under a 12-h light/12-h dark cycle. Water was available ad libitum. Rats were divided into five groups. The first group (group N) received a standard diet (total metab- olizable percentage of energy: 60.4 carbohydrates, 29 proteins, 10.6 fat J/J; 15.88 KJ gross energy/g; Muscedola, Milan, Italy). The second (group HFD) received an HFD (consisting of 280 g diet supplemented with 395 g lyophilized lamb meat [Liomellin, Milan, Italy], 120 g cellulose [Sigma-Aldrich, St. Louis, MO], 20 g mineral mix [ICN Biomedical, Solon, OH], 7 g vitamin mix [ICN], and 200 g low-salt butter [Lurpak, Denmark]) (total metabolizable percentage of energy: 21 carbohydrates, 29 proteins, 50 fat J/J; 19.85 KJ gross energy/g). The third group (group HFD-T2) received the same HFD together with a daily injection of T2 (25 mg/100 g body wt intraperitoneally) (Sigma-Aldrich). Ani- mals in groups N and HFD were sham-injected. In most experiments, animals of the first, second, and third groups were killed at 1 h, 6 h, 1 day, 1 week, 2 weeks, or 4 weeks after the beginning of their diet/treatment schedule. The fourth group [group HFD-(T2)-C] received the above HFD for 1 or 6 h with From the 1 Dipartimento di Scienze della Vita, Seconda Università degli Studi di Napoli, Caserta, Italy; the 2 Dipartimento di Scienze per la Biologia, la Geologia e l’Ambiente, Università degli Studi del Sannio, Benevento, Italy; the 3 Dipartimento delle Scienze Biologiche, Sez. Fisiologia ed Igiene, Univer- sità degli Studi di Napoli “Federico II,” Napoli, Italy; and the 4 Dipartimento di Scienze Biomolecolari, Università di Urbino “Carlo Bo,” Urbino, Italy. Corresponding author: Fernando Goglia, [email protected], or Antonia Lanni, [email protected]. Received 16 February 2011 and accepted 28 July 2011. DOI: 10.2337/db11-0207 Ó 2011 by the American Diabetes Association. Readers may use this article as long as the work is properly cited, the use is educational and not for profit, and the work is not altered. See http://creativecommons.org/licenses/by -nc-nd/3.0/ for details. 2730 DIABETES, VOL. 60, NOVEMBER 2011 diabetes.diabetesjournals.org ORIGINAL ARTICLE

Welcome message from author
This document is posted to help you gain knowledge. Please leave a comment to let me know what you think about it! Share it to your friends and learn new things together.
Transcript
Nonthyrotoxic Prevention of Diet-Induced InsulinResistance by 3,5-Diiodo-L-Thyronine in RatsPieter de Lange,
1Federica Cioffi,
2Rosalba Senese,
1Maria Moreno,
2Assunta Lombardi,
3
Elena Silvestri,2Rita De Matteis,
4Lillà Lionetti,
3Maria Pina Mollica,
3Fernando Goglia,
2and
Antonia Lanni1
OBJECTIVE—High-fat diets (HFDs) are known to induce in-sulin resistance. Previously, we showed that 3,5-diiodothyronine(T2), concomitantly administered to rats on a 4-week HFD, pre-vented gain in body weight and adipose mass. Here we investi-gated whether and how T2 prevented HFD-induced insulinresistance.
RESEARCH DESIGN AND METHODS—We investigated thebiochemical targets of T2 related to lipid and glucose homeosta-sis over time using various techniques, including genomic andproteomic profiling, immunoblotting, transient transfection, andenzyme activity analysis.
RESULTS—Here we show that, in rats, HFD feeding inducedinsulin resistance (as expected), whereas T2 administration pre-vented its onset. T2 did so by rapidly stimulating hepatic fattyacid oxidation, decreasing hepatic triglyceride levels, and improv-ing the serum lipid profile, while at the same time sparing skeletalmuscle from fat accumulation. At the mechanistic level, 1) trans-fection studies show that T2 does not act via thyroid hormonereceptor b; 2) AMP-activated protein kinase is not involved intriggering the effects of T2; 3) in HFD rats, T2 rapidly increaseshepatic nuclear sirtuin 1 (SIRT1) activity; 4) in an in vitro assay,T2 directly activates SIRT1; and 5) the SIRT1 targets peroxisomeproliferator–activated receptor (PPAR)-g coactivator (PGC-1a)and sterol regulatory element–binding protein (SREBP)-1c aredeacetylated with concomitant upregulation of genes involved inmitochondrial biogenesis and downregulation of lipogenic genes,and PPARa/d-induced genes are upregulated, whereas genes in-volved in hepatic gluconeogenesis are downregulated. Proteomicanalysis of the hepatic protein profile supported these changes.
CONCLUSIONS—T2, by activating SIRT1, triggers a cascade ofevents resulting in improvement of the serum lipid profile,prevention of fat accumulation, and, finally, prevention of diet-induced insulin resistance. Diabetes 60:2730–2739, 2011
Obesity and associated disorders (including insu-lin resistance, glucose intolerance, dyslipidemia,and hypertension) are approaching epidemicproportions worldwide (1,2). Increasing lipid
oxidation in the liver is a key target for improving dis-turbed glucose homeostasis. Thyroid hormones (THs) are
important inducers of both lipid metabolism and meta-bolic rate by increasing energy expenditure (3), and theirpotential use as hypolipidemic agents has been consid-ered. However, THs cause a clinical thyrotoxic state—asmanifested by cardiac tachyarrhythmia, systolic hyper-tension, heart failure, and skeletal muscle weakness—that abolishes their usage for this purpose. Instead, currentresearch is focusing on the development of TH analogs thatare both tissue and TH receptor (TR) selective (in partic-ular, for the TRb isoform, which is predominantly involvedin TH-induced lipid metabolism) (rev. in 4–7). We recentlyshowed that a natural TH derivative, 3,5-diiodo-L-thyronine(T2), prevents adiposity and body weight gain when ad-ministered to rats receiving a high-fat diet (HFD) withoutunfavorable side effects, usually caused by 3,5,39-triiodo-L-thyronine (T3), by increasing both energy expenditure andhepatic fatty acid oxidation rate, a process involvingAMP-activated protein kinase (AMPK) (8). To investigatewhether T2 ameliorates glucose homeostasis, we studiedwhether and how T2 treatment in rats receiving an HFDwould influence lipid accumulation, glucose tolerance,and insulin resistance. Important regulators of lipid/glucosehomeostasis include AMPK and the NAD+-dependentdeacetylase sirtuin 1 (SIRT1). AMPK is a known metabolicsensor of cellular ATP levels (9), whereas SIRT1 has alsoemerged as an important regulator of metabolic balance(10–16) that acts in response to an increase in the in-tracellular NAD+/NADH ratio. To examine whether AMPKand/or SIRT1 triggered the beneficial effects of T2 on energyhomeostasis, we studied hepatic AMPK phosphorylationand SIRT1 activity over time, in relation to metabolicparameters and the expression of AMPK/SIRT1 target genes/proteins involved therein, and we evaluated whether T2 wasalso able to directly activate SIRT1.
RESEARCH DESIGN AND METHODS
Animal experiments. All animals received humane care according to thecriteria outlined in the Guide for the Care and Use of Laboratory Animals
prepared by the National Academy of Sciences and published by the NationalInstitutes of Health. Male Wistar rats (250–300 g) (Charles River Laboratories)were kept one per cage in a temperature-controlled room at 28°C under a 12-hlight/12-h dark cycle. Water was available ad libitum. Rats were divided intofive groups. The first group (group N) received a standard diet (total metab-olizable percentage of energy: 60.4 carbohydrates, 29 proteins, 10.6 fat J/J;15.88 KJ gross energy/g; Muscedola, Milan, Italy). The second (group HFD)received an HFD (consisting of 280 g diet supplemented with 395 g lyophilizedlamb meat [Liomellin, Milan, Italy], 120 g cellulose [Sigma-Aldrich, St. Louis,MO], 20 g mineral mix [ICN Biomedical, Solon, OH], 7 g vitamin mix [ICN], and200 g low-salt butter [Lurpak, Denmark]) (total metabolizable percentage ofenergy: 21 carbohydrates, 29 proteins, 50 fat J/J; 19.85 KJ gross energy/g). Thethird group (group HFD-T2) received the same HFD together with a dailyinjection of T2 (25 mg/100 g body wt intraperitoneally) (Sigma-Aldrich). Ani-mals in groups N and HFD were sham-injected. In most experiments, animalsof the first, second, and third groups were killed at 1 h, 6 h, 1 day, 1 week,2 weeks, or 4 weeks after the beginning of their diet/treatment schedule. Thefourth group [group HFD-(T2)-C] received the above HFD for 1 or 6 h with
From the 1Dipartimento di Scienze della Vita, Seconda Università degli Studidi Napoli, Caserta, Italy; the 2Dipartimento di Scienze per la Biologia, laGeologia e l’Ambiente, Università degli Studi del Sannio, Benevento, Italy;the 3Dipartimento delle Scienze Biologiche, Sez. Fisiologia ed Igiene, Univer-sità degli Studi di Napoli “Federico II,” Napoli, Italy; and the 4Dipartimento diScienze Biomolecolari, Università di Urbino “Carlo Bo,” Urbino, Italy.
Corresponding author: Fernando Goglia, [email protected], or AntoniaLanni, [email protected].
Received 16 February 2011 and accepted 28 July 2011.DOI: 10.2337/db11-0207� 2011 by the American Diabetes Association. Readers may use this article as
long as the work is properly cited, the use is educational and not for profit,and the work is not altered. See http://creativecommons.org/licenses/by-nc-nd/3.0/ for details.
2730 DIABETES, VOL. 60, NOVEMBER 2011 diabetes.diabetesjournals.org
ORIGINAL ARTICLE
a concomitant intraperitoneal injection of T2 (see third group) and/or Com-pound C (an AMPK inhibitor) (Sigma-Aldrich) at 1 mg/100 g body wt. The fifthgroup [group HFD-(T2)-EX] received the above HFD for 1 day with a con-comitant intraperitoneal injection of T2 (see third group) and/or EX-527(a SIRT1 inhibitor) (Sigma-Aldrich) at 1 mg/100 g body wt. Body weight andfood consumption were monitored throughout the course of treatment (Fig. 1A).At the end of the schedules, rats were anesthetized by an intraperitonealinjection of chloral hydrate (40 mg/100 g body wt) and then killed by de-capitation. For each experimental condition, 10 animals were used. Liver,heart, gastrocnemius muscle, and abdominal white adipose tissue were excised,weighed, and either immediately processed for isolation of mitochondria orhistochemical analysis or immediately frozen in liquid nitrogen and stored at280°C for later processing.Measurements of metabolic parameters. Total body composition analysiswas performed as previously reported (17). Respiratory parameters were re-corded using an indirect open-circuit calorimeter (Panlab, Cornella, Barcelona,Spain). Measurements were performed every 15 min for 60 min in each cage.The serum levels of cholesterol and triglycerides were determined by standardprocedures (18). Plasma adiponectin levels were measured using a commer-cially available kit (B-Bridge International, Mountain View, CA). Liver andmuscle triglyceride contents were determined using an Infinity kit (Sigma-Aldrich). For the oral glucose tolerance test, rats were fasted overnight andthen orally dosed with glucose (3 g/kg body wt) dissolved in water. For theinsulin tolerance test, rats were fasted for 5 h and then injected intra-peritoneally with insulin (homolog rapid-acting, 10 units/kg body wt in sterilesaline; Novartis, Basel, Switzerland). Samples of blood were collected beforethe oral glucose tolerance test and insulin tolerance test and at various timesthereafter (as indicated in the figures), and glucose and insulin values weredetermined by means of a glucose monitor (BRIO, Ascensia, NY), calibratedfor use with rats and ELISA (Mercodia rat insulin; Mercodia, Uppsala, Sweden),respectively. In a subgroup of animals, insulin-dependent hepatic AKT phos-phorylation was measured 15 min after insulin injection.Histochemical analysis. Sections of livers were fixed in formol calcium, and10-mm frozen sections were subsequently stained with Sudan Black B for thedetection of fat according to standard procedures. Muscle cryosections (6 mm)were obtained using a cryostat (Leica CM1850) at 229°C and collected ontoroom-temperature glass slides; then lipid droplets were stained by the neutrallipid dye Oil Red O. Abdominal white adipose tissue (omental depot) was4% formaldehyde-fixed and paraffin-embedded. The 4-mm-thick sections wereobtained and stained by hematoxylin and eosin to assess morphology.Determination of enzyme activity. Liver nuclei and mitochondria wereseparated, with the mitochondria being isolated as previously described (19).The rate of mitochondrial fatty acid oxidation was assessed as describedpreviously (19). Total carnitine palmitoyl transferase (CPT) (CPT1 plus CPT2)activity was measured as reported by Alexson and Nedergaard (20). Forthe in vitro SIRT1 activity assay, 0.1 nmol/L to 1 mmol/L T2 or resveratrol(RSV) was added to purified SIRT1 protein. For the in vivo SIRT1 activityassay, SIRT1 protein was immunoprecipitated in its native form from nu-clear extracts prepared according to instructions provided by Millipore (Milan,Italy) using a polyclonal antibody against SIRT1 from Cyclex (Nagano, Japan)and a Catch and Release v2.0 kit from Millipore. Protein concentrationsof all samples were determined using the Bio-Rad DC method (Bio-RadLaboratories). SIRT1 activity was determined as the NAD-dependent andnicotinamide-inhibitable ability of the native isolated SIRT1 protein to deace-tylate an acetylated lysine residue linked to a fluorophore using a histonedeacetylase assay kit (Abnova, Taiwan, China). To determine whether agiven compound caused a nonspecific induction of fluorescence, incuba-tions were included in which the compound was added after stopping thereaction. When used at the maximal concentration (1 mmol/L), RSV causeda nonspecific induction of fluorescence, with values that amounted to not.12% of the total activity induced by RSV. Across the concentration rangeused here, T2 did not cause any increased fluorescence after addition of thestop solution.Immunoblotting. Immunoblot analysis was performed as described previously(21). Polyclonal antibodies used for AMPK and phosphorylated AMPK (Thr172),acetyl-CoA carboxylase (ACC) (Ser79), and Akt/protein kinase B (Akt) andphosphorylated Akt (Ser473) were all from Cell Signaling Technology (Beverly,MA); for SIRT1 from Cyclex (Nagano, Japan); for ACC from Upstate Bio-technology (Lake Placid, NY); and for b-actin and tubulin (loading controls) fromSigma-Aldrich and Santa Cruz Biotechnology (Santa Cruz, CA), respectively.Deacetylation measurements. Liver nuclear extracts (2 mg), isolated asdescribed above, were immunoprecipitated (see above) with polyclonalantibodies against the peroxisome proliferator–activated receptor (PPAR)-gcoactivator (PGC-1a) (Chemicon, Temecula, CA) and sterol regulatory element–binding protein (SREBP)-1c (Santa Cruz), and acetylation of the proteinswas measured by immunoblotting using an anti–Ac-Lysine antibody (CellSignaling).
Cell culture and transient transfection assays. Rat myoblastic L6 cellsobtained from the Cell Bank (Interlab Cell Line Collection) of the National Institutefor Cancer Research (Genova, Italy) were transfected as described (22). Hormoneswere added to the medium at concentrations within the range of 0–100 nm.Gene and protein expression profiling
Quantitative real-time PCR. Quantitative PCR was performed as describedpreviously, on RNA extracted from liver (23).Proteomic analysis. Protein extracts were prepared from liver of each an-imal, and each individual protein was assessed separately as described bySilvestri et al. (24). Differentially expressed proteins were identified by meansof matrix-assisted laser desorption/ionization time of flight mass spectrometry(MALDI-ToF MS) (25).Statistical analysis. Results are expressed as means 6 SEM. The statisticalsignificance of differences between groups was determined using one-wayANOVA followed by a Student-Newman-Keuls test. Differences were consid-ered significant at P , 0.05.
RESULTS
Four weeks of T2 administration prevents HFD-inducedchanges in systemic metabolic parameters withoutaffecting lean body mass. The lower body weight inHFD-T2 rats versus HFD rats was primarily due to a de-crease in adipose mass, since no significant difference inprotein gain and muscle was found among the three groups(Fig. 1A). Heart weight, an important thyrotoxicosis marker,did not differ among the groups (ratio heart weight/bodyweight [mg/g], N: 0.28 6 0.02, HFD: 0.26 6 0.003, HFD-T2:0.256 0.007). Analysis of whole-body O2 consumption (VO2)showed that energy expenditure was significantly higher inHFD-T2 rats than in N and HFD rats (Fig. 1A). Furthermore,the respiratory quotient, which reflects the ratio of carbo-hydrate to fatty acid oxidation, was significantly lower inHFD and HFD-T2 rats than in N rats (Fig. 1A), indicatingthat HFD and HFD-T2 rats used a relatively greater amountof fatty acids as a fuel source. Serum levels of cholesterol,nonesterified fatty acids, and triglycerides were compa-rable between HFD-T2 and N animals and were signifi-cantly higher in the HFD group than in the other two groups(Fig. 1A). HFD-T2 rats had a better tolerance to a glucoseload than HFD rats, and the tolerance of the latter groupwas comparable to that of N animals at the late time pointsof the oral glucose tolerance test (Fig. 1B). Insulin tolerancetests revealed that the reduction in glucose due to insulinadministration was comparable between HFD-T2 and Nanimals, but was impaired in HFD animals (Fig. 1B). Theseresults reveal that the development of insulin resistanceduring HFD feeding can be prevented by T2 administration.Four weeks of T2 administration prevents HFD-induced changes in ectopic fat accumulation throughincreased hepatic mitochondrial fatty acid oxidation.After 4 weeks of treatment, T2 had prevented fat storagein the tissues predominantly involved in lipid and glucosehomeostasis (such as gastrocnemius muscle, abdominalwhite adipose tissue, and liver), as revealed by histolog-ical analysis (Fig. 1C). Accordingly, accumulation of tri-glyceride in muscle and liver was prevented (Fig. 1D), aswas the hypertrophy of white adipocytes (Fig. 1C). Mito-chondrial fatty acid oxidation was unaltered in gastroc-nemius (Fig. 1E), soleus, and extensor digitorum longusmuscle (values [nmoles oxygen/mg protein 3 min] for so-leus: N: 28.02 6 5.1, HFD: 28.92 6 3.3, HFD-T2: 26.89 64.21; and for extensor digitorum longus: N: 24.81 6 2.2,HFD: 48.23 6 3.6, HFD-T2: 57.52 6 5.3). T2 treatment in-creased hepatic mitochondrial fatty acid oxidation (Fig. 1E),which indicates that the liver drives T2-induced systemicfat depletion, consistent with an increased hepatic phos-phorylation of AMPK (Thr172) with respect to HFD animals(Fig. 1F).
P. DE LANGE AND ASSOCIATES
diabetes.diabetesjournals.org DIABETES, VOL. 60, NOVEMBER 2011 2731
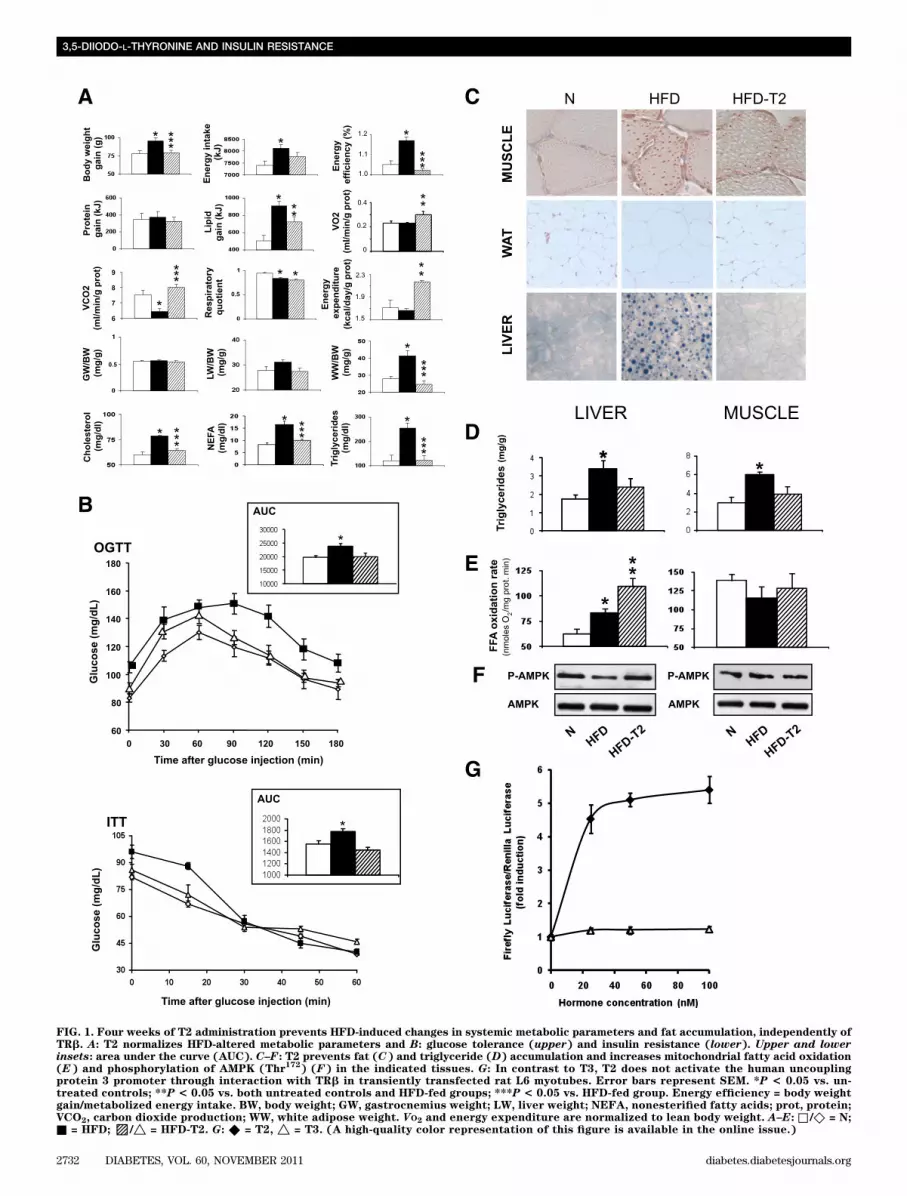
FIG. 1. Four weeks of T2 administration prevents HFD-induced changes in systemic metabolic parameters and fat accumulation, independently ofTRb. A: T2 normalizes HFD-altered metabolic parameters and B: glucose tolerance (upper) and insulin resistance (lower). Upper and lowerinsets: area under the curve (AUC). C–F: T2 prevents fat (C) and triglyceride (D) accumulation and increases mitochondrial fatty acid oxidation(E) and phosphorylation of AMPK (Thr
172) (F) in the indicated tissues. G: In contrast to T3, T2 does not activate the human uncoupling
protein 3 promoter through interaction with TRb in transiently transfected rat L6 myotubes. Error bars represent SEM. *P < 0.05 vs. un-treated controls; **P < 0.05 vs. both untreated controls and HFD-fed groups; ***P < 0.05 vs. HFD-fed group. Energy efficiency = body weightgain/metabolized energy intake. BW, body weight; GW, gastrocnemius weight; LW, liver weight; NEFA, nonesterified fatty acids; prot, protein;VCO2, carbon dioxide production; WW, white adipose weight. VO2 and energy expenditure are normalized to lean body weight. A–E: □ /◇ = N;■ = HFD;▨/△ = HFD-T2. G: ◆ = T2, △ = T3. (A high-quality color representation of this figure is available in the online issue.)
3,5-DIIODO-L-THYRONINE AND INSULIN RESISTANCE
2732 DIABETES, VOL. 60, NOVEMBER 2011 diabetes.diabetesjournals.org

FIG. 2. T2 rapidly prevents hepatic and serum fat accumulation. A: Hepatic fat accumulation (assessed by Sudan black staining) is prevented byT2 administration to rats simultaneously fed an HFD. B: T2 rapidly normalizes levels of nonesterified fatty acids, triglycerides, and cholesterol.Levels were measured at the indicated time points after T2 injection. C: Hepatic mitochondrial fatty acid oxidation (FFA OX) rapidly increasesin response to T2 treatment. D: Phosphorylation of AMPK (Thr
172) increases only after 4 weeks of T2 treatment, and phosphorylation of
Akt (Ser473
) does not change in response to T2 treatment. Representative blots are shown. The histograms represent values obtained after4 weeks of treatment. E: T2 normalizes serum adiponectin levels. F: After 4 weeks, neither HFD nor HFD-T2 treatment alters insulin-inducedhepatic Akt (Ser
473) phosphorylation with respect to controls (N). Error bars represent SEM. *P< 0.05 vs. untreated controls; **P< 0.05 vs. both
untreated controls and HFD-fed groups; ***P < 0.05 vs. HFD-fed group; #P < 0.05 vs. sham-injected animals. B: △, N;◇, HFD; □, HFD-T2. C–F: □, N;■, HFD;▨, HFD-T2; prot, protein. (A high-quality color representation of this figure is available in the online issue.)
P. DE LANGE AND ASSOCIATES
diabetes.diabetesjournals.org DIABETES, VOL. 60, NOVEMBER 2011 2733

FIG. 3. Hepatic induction of fatty acid oxidation by T2 in HFD animals does not involve AMPK but is associated with SIRT1 activation. A: Com-pound C effectively inhibits AMPK Thr
172and ACC Ser
79phosphorylation within 1 and 6 h, respectively, of its simultaneous administration with
T2. Positions of ACC isoforms 1 and 2 are indicated at the right. The increase of fatty acid oxidation persisted at 6 h after injection of T2 plusCompound C. SIRT1 nuclear protein activity increased at 6 h after injection of T2 and was not inhibited by Compound C. B: T2 is a specific ac-tivator of SIRT1. The effects of T2 and RSV (positive control) were compared using a fluorescence-based deacetylation assay (x-axis: logarithmicscale). Inlay: Other tested TH metabolites either inhibit SIRT1 activity (T3) or are ineffective (T1, T0). C: T2 induces prolonged activation ofSIRT1. Upper: Nuclear SIRT1 protein. Middle: mRNA levels in livers of animals treated as indicated underneath the bars. Lower: Hepatic nuclearSIRT1 activity. Ratios are shown for values from HFD-T2 animals over those from HFD animals at the indicated time points.D: T2 treatment causes
3,5-DIIODO-L-THYRONINE AND INSULIN RESISTANCE
2734 DIABETES, VOL. 60, NOVEMBER 2011 diabetes.diabetesjournals.org

T2 does not directly elicit transcription through THreceptor b. Because the transcriptional effects of T3 onlipid metabolism are predominantly exerted through TRb(7), we asked whether the phenotype observed above wasdue to T2 directly affecting transcription through TRb. Toaddress this question, we performed a cotransfection ex-periment using rat L6 myoblasts. A luciferase expressionvector containing the human uncoupling protein 3 (UCP3)promoter, a known target of T3 through TRb (22,26), wascotransfected with two expression vectors containing thehuman thyroid hormone receptor b (hTRb) and myoblastdetermination protein 1 (MyoD), respectively. In the pres-ence of 25 nmol/L T3, luciferase activity increased sharplyto 4.5-fold versus control, while in the presence of 100nmol/L T3, luciferase activity values reached 5.5-fold ver-sus control (Fig. 1G). Across the concentration range usedhere (0–100 nmol/L for each hormone), T2 did not signifi-cantly increase luciferase activity, showing that the effectsof T2 described above are not mediated via increasedtranscription of target genes through TRb.T2 rapidly prevents hepatic and serum fat accumu-lations. A 6-h exposure to the HFD already induced asubstantial lipid-droplet accumulation. In contrast, thiseffect was lacking in the HFD-T2 group at that time point(Fig. 2A) and indeed at time points of up to 4 weeks(maximum treatment period) (Fig. 2A). Importantly, T2treatment consistently prevented the HFD-dependent in-creases in serum cholesterol, triglycerides, and nones-terified fatty acids (Fig. 2B). Accordingly, mitochondrialfree fatty acid oxidation was already elevated by T2 atthe 6-h time point, and this increase persisted throughoutthe treatment period (Fig. 2C). We did not observe increa-ses in AMPK phosphorylation in the HFD-T2 rats in theinvestigated time points up to 2 weeks of treatment. Actu-ally, AMPK phosphorylation was lower in the HFD andHFD-T2 rats than in the N controls. Only after 4 weeks oftreatment was there a T2-induced increase in AMPK phos-phorylation toward N levels (Fig. 2D), and at that time point,plasma adiponectin levels were elevated, too (Fig. 2E).Basal hepatic Akt phosphorylation (Ser473) did not changeduring feeding on the HFD (Fig. 2D), and it was notinhibited in response to insulin after 4 weeks of HFDtreatment (Fig. 2F). T2 had no apparent effect on this result.The plasma ALT level, well documented as a marker ofhepatocyte damage, was significantly (P , 0.05) elevatedin HFD rats, whereas administration of T2 to HFD ratsprevented this increase (actual values: 38 6 1.3, 47 6 2.0,and 36 6 1.0 units/L for N, HFD, and HFD-T2 groups,respectively).Rapid induction of hepatic fatty acid oxidation byT2 in HFD animals involves not AMPK, but SIRT1activation. To examine whether a transient phosphory-lation of AMPK between 0 and 6 h might have triggered theobserved T2-induced increase in liver fatty acid oxidation,we concomitantly administered T2 and Compound C toa subgroup of HFD animals. There was an almost completeinhibition of AMPK phosphorylation by Compound C at
both 1 and 6 h after T2 injection (Fig. 3A, left and centerpanels). However, the T2-induced increase in mitochon-drial fatty acid oxidation in the liver was not differentbetween the HFD-T2–Compound C and HFD-T2 groups(Fig. 3A, far right upper panel), although CPT activity wassignificantly lower in the former group than in all otherconditions examined (Fig. 3A, far right center panel). Be-sides AMPK, SIRT1 has emerged as an interesting targetin the amelioration of diet-induced metabolic disorders.To examine the involvement of SIRT1 in the effects broughtabout by T2 in vivo, we isolated hepatic nuclei and im-munoprecipitated nuclear SIRT1 protein under native con-ditions. In agreement with the rapid preventive effect ofT2 on fat accumulation, in the HFD-T2 group, hepaticSIRT1 activity was already elevated at the 6-h time point byaround twofold versus the HFD group (Fig. 3A, far rightlower panel). A quantitatively similar result was obtainedfor the HFD-T2–Compound C group, showing that the acti-vating effect of T2 on SIRT1 is AMPK independent (Fig. 3A,far right lower panel). We then examined whether T2could directly activate purified SIRT1. For this, we used afluorescence-based deacetylation assay, with the naturallyoccurring SIRT1 activator RSV as a positive control. Thehalf-maximal inhibitory concentration (IC50) values were8.5 and 17 mmol/L for RSV and T2, respectively, with bothactivities being inhibitable by nicotinamide (Fig. 3B). Otheriodothyronines (T1 and T0) did not stimulate SIRT1 activityat concentrations of 1 mmol/L, whereas T3 inhibited it (seeinlay, Fig. 3B). With time, The SIRT1-activity ratio be-tween the HFD-T2 and HFD groups remained elevated(at around two- to threefold vs. control) (up to 4 weeks)(Fig. 3C, lower). In the HFD-T2 group, SIRT1 nuclearprotein levels did not alter significantly with time (Fig. 3C,upper), nor did SIRT1mRNA levels (Fig. 3C, middle). HFDtreatment caused acetylation of SIRT1 targets SREBP-1cand PGC-1a, which was effectively prevented by T2 co-administration (Fig. 3D). Overnight inhibition of SIRT1activity with EX-527 abolished T2-induced mitochondrialfatty acid oxidation (Fig. 3D, left upper panel) as well asdeacetylation of SREBP-1c and PGC-1a (Fig. 3D, left lowerpanel).T2 shifts hepatic gene and protein-expression profilestoward increased lipid handling and decreased gluco-neogenesis, associated with “early” SIRT1- and “late”SIRT1/AMPK-induced increases in cell signaling. Theeffects of T2 through SIRT1 clearly involve inhibition of li-pogenesis and increased mitochondrial activity, throughdeacetylation of SREBP-1c and PGC-1a. Acetylated SREBP-1cinduces transcription of critical lipogenic genes, and we foundthat after 2 weeks in the HFD-T2 animals, the SREBP-1ctarget genes ACC and fatty acid synthase (FAS) weredownregulated (Fig. 4A). A third gene involved in lipo-genesis, Spot 14 (S14), was also downregulated by T2,and a lipolytic gene, hepatic lipase (HL), involved in down-regulation of triglycerides, was upregulated (Fig. 4A). Re-garding mitochondrial biogenesis, T2 deacetylated PGC-1abut did not increase PGC-1a gene expression, and neither
deacetylation of SIRT1 target proteins, consistent with increased fatty acid oxidation. Left panel: Mitochondrial fatty acid oxidation in HFD orHFD-T2 animals treated for 1 day (left panel) in the presence or absence of the specific SIRT1 inhibitor EX-527 (EX). Left and right panel: In thesame animals, as well as in animals treated for 4 weeks, hepatic nuclear extracts (2 mg) were immunoprecipitated with an anti–PGC-1a (upper) oranti–SREBP-1c antibody (lower) and analyzed with anti-acetyllysine antibody vs. PGC-1a or SREBP-1c. Numbers indicate the ratio acetylated overtotal protein. Upper right panel: No variation in total PGC-1a, SREBP-1c, and tubulin (control) protein levels in nuclear extracts between N, HFD,and HFD-T2 animals (input). A, C, and D: Representative blots are shown. D: Dividing lines indicate omissions/rearrangements of lanes from thesame gel. Error bars represent SEM. *P < 0.05 vs. untreated controls; **P < 0.05 vs. both untreated controls and HFD-fed groups. □, N; ■, HFD;
▨, HFD-T2; ▧, HFD-T2–Compound C; dotted bars, HFD-T2-EX-527; light dotted bars, HFD-EX-527. B: ◇, RSV; □, T2. FFA, free fatty acid;FU, fluorescence units; IP, immunoprecipitated; IB, immunoblotted.
P. DE LANGE AND ASSOCIATES
diabetes.diabetesjournals.org DIABETES, VOL. 60, NOVEMBER 2011 2735

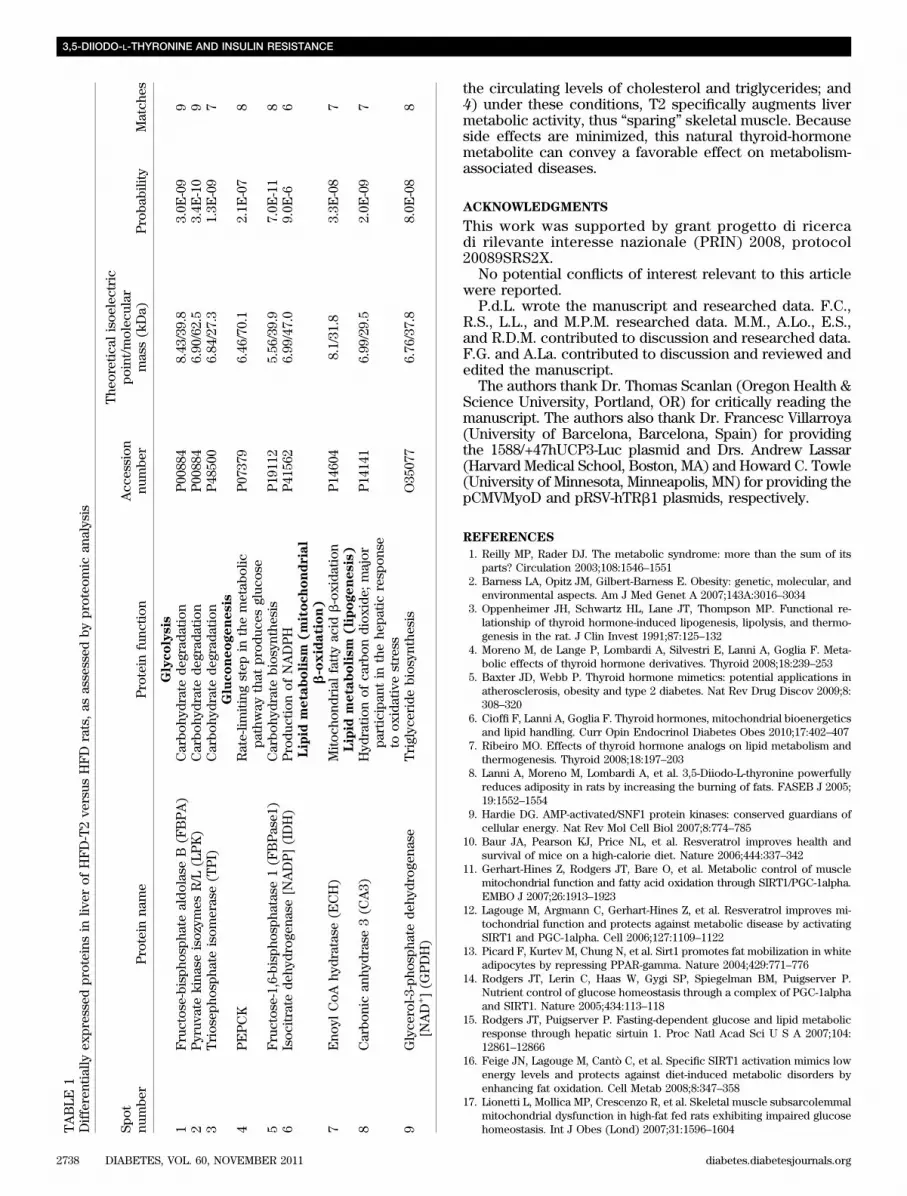
that of nuclear respiratory factors 1 and 2 (NRF1 andNRF2). However, those of mitochondrial transcription fac-tor A and cytochrome oxidase subunit IV were increased inthe HFD-T2 animals (Fig. 4B). Because fatty acid oxidationis known to be governed by PPARa and PPARd in the liver,we measured the expression of PPARa and PPARd, as wellas the expression of a number of known PPARa/d targetgenes. PPARs were targets of both AMPK and SIRT1, andgene expression was measured at both the 2-week timepoint (when only SIRT1 activity was increased) and the4-week time point (when both SIRT1 and AMPK activitieswere increased). The PPARa/d target genes were as follows:CPT1a and CPT2 (each involved in mitochondrial fatty aciduptake), acyl-CoA oxidase (AOX; a key enzyme in peroxi-somal fatty acid oxidation), uncoupling protein 2 (UCP2;a PPAR target gene that is not translated into protein in theliver), and mitochondrial thioesterase I (MTE I; involved inmitochondrial lipid handling). In addition, because glucosetolerance was significantly ameliorated in HFD-T2 rats, wemeasured the expression of key genes in glucose homeo-stasis, which have been shown to be targets of AMPK andSIRT1. These key genes were as follows: phosphoenolpyr-uvate carboxykinase (PEPCK; which converts oxaloacetateto phosphoenolpyruvate and carbon dioxide), liver pyru-vate kinase (LPK; a glycolytic enzyme that converts phos-phoenolpyruvate to pyruvate), and glucose-6-phosphatase(G6Pase; which converts glucose-6-phosphate to glucose,which is then released from the hepatocyte). At 2 weeks,HFD-T2 rats displayed (vs. HFD rats) the following: 1) in-creased expression of PPARa, but not of PPARd (Fig. 4C);2) significant upregulation of the expression of CPT1a andCPT2 (Fig. 4D); and 3) significant reductions in the ex-pression of LPK and G6Pase (Fig. 4E). At 4 weeks (again vs.HFD animals), HFD-T2 animals displayed significantlyincreased expression of both PPARa and PPARd (Fig. 4F)and of all the above-mentioned PPARa/d target genes(Fig. 4G). The expression of LPK and G6Pase were down-regulated (as at 2 weeks), and that of PEPCK was stillunaltered by T2 (Fig. 4H). Subsequently, we performeda high-resolution differential proteomic analysis on liversfrom N, HFD, and HFD-T2 rats. From the spots showingdifferential expression among the three analyzed groups,nine protein spots were identified and selected as proteinsinvolved in glucose or lipid metabolism (Fig. 4I and J andTable 1). T2 treatment 1) prevented the induced elevationsin glycolytic (LPK) and gluconeogenic (PEPCK, fructose-1,6-bisphosphatase 1 [FBPase1], and isocitrate dehydrogenase[IDH]) enzymes (Fig. 4I and Table 1), 2) had a strong pos-itive impact on the expression of enzymes involved in fattyacid oxidation (enoyl CoA hydratase [ECH]), and 3) hadnormalizing effects on lipogenic proteins (carbonic anhy-drase 3 [CA3] and glycerol-3-phosphate dehydrogenase[GPDH]) (Fig. 4J and Table 1).
DISCUSSION
Coadministration of T2 to HFD-fed rats protects against fataccumulation and the resulting insulin resistance, primar-ily by promoting hepatic fat consumption, thereby avoid-ing a serum lipid increase. We identify SIRT1 as a maintarget recruited in mediating the effects of T2 and excludea triggering role for the AMPK-ACC-CPT axis under thepresent conditions. We further found that T2 does not actthrough TRb (involved in the TH-mediated regulation oflipid metabolism [7,27]). TH derivatives GC-1 (soberitome)and KB2115 (eprotirome) show hypolipidemic effects similar
to those provoked by T2, and clinical trials are now inprogress (4,5). By acting through TRb, however, they re-duce serum thyrotropin and thyroxine levels in animals withpotencies similar to those of their beneficial cholesterol-lowering effects (5), whereas T2 does not (8). The increasein liver mitochondrial fatty acid oxidation induced by T2was rapid in onset, preventing the HFD-induced rise inserum lipid parameters. The early significant stimulation ofhepatic fatty acid oxidation and inhibition of lipogenesisby T2 leads to 1) prevention of hepatic fat accumulation,2) a consequent absence of increases in the serum lipidconcentration, 3) a blockage of delivery of fat to themuscle and unaltered fatty acid oxidation in various mus-cles, and 4) at least in part, decreased delivery of fat intoadipocytes. Given the well-known dangerous effects ofectopic fat accumulation on insulin sensitivity, the aboveactions of T2 on lipid handling counteract the HFD-inducedinsulin resistance. Whereas several observations supportthe idea that AMPK and SIRT1 act in concert to ensure anappropriate cellular response and adaptation to environ-mental modifications (28,29), others have shown that SIRT1can also act independent of AMPK (16), and our presentresults are in favor of this. SIRT1 has recently been shownto be crucial for hepatic lipid homeostasis (30,31) and actsin cooperation with other factors to improve insulin sen-sitivity. Hepatic SIRT1 knockout animals exhibit lowerbasal hepatic Akt phosphorylation levels (30), which thoseauthors interpreted as a sign of decreased insulin sensi-tivity. However, in the current study, we did not observe aT2-mediated increase in Akt/PKB (protein kinase B) phos-phorylation (Ser473) during feeding on the HFD, neither inthe absence nor in the presence of insulin. Interestingly,mice overexpressing SIRT1 display enhanced hepatic in-sulin sensitivity, an effect that correlates with an increasein plasma adiponectin (32), which is in accordance withthe increase the plasma adiponectin level by T2. In linewith the above, the action of T2, through deacetylationof SIRT1 targets SREBP-1c and PGC-1a (16,31), involvesgenetic reprogramming of lipid/glucose utilization andmitochondrial biogenesis, as well as an enhancement ofPPARa/d signaling. SIRT1 mRNA levels themselves werenot altered. Importantly, the expression of G6Pase andLPK were decreased, which would result in reductions inboth glucose release and glycolysis, and contribute to theimproved glucose tolerance brought about by T2 ad-ministration. Proteomic analysis confirmed several ofthese changes in gene expression and also revealed post-transcriptional modifications. For instance, whereas themRNA level of PEPCK remained unaltered after up to4 weeks of T2 treatment, the protein was clearly down-regulated, as were other proteins involved in gluconeo-genesis, thus showing that gluconeogenesis can be inhibitedby T2 in the liver in rats on an HFD. Moreover, the T2-induced downregulation of LPK suggested a decreasedglycolysis in the liver in HFD-T2 rats. In addition, T2markedly reduced the protein expression levels of enzymessuch as CA3 (involved in hepatic de novo lipogenesis [33])and GPDH (involved in triacilglycerol formation) while in-creasing the expression of proteins involved in fatty acidoxidation (such as enoyl-CoA hydratase). These effectswould contribute to the antisteatotic effect of T2 (34).
In summary, this study demonstrates that 1) T2 preventsHFD-induced insulin resistance and glucose intolerance;2) it does so by directly activating SIRT1 in an AMPK-independent manner, blocking accumulation of ingestedfat in the liver; 3) this effect is reflected by a reduction in
3,5-DIIODO-L-THYRONINE AND INSULIN RESISTANCE
2736 DIABETES, VOL. 60, NOVEMBER 2011 diabetes.diabetesjournals.org

FIG. 4. T2 shifts hepatic gene and protein expression profiles toward increased lipid handling and decreased lipogenesis and gluconeogenesis. A–H:Quantitative RT-PCR analysis showing that T2 modulates gene expression in favor of lipid reduction (A), increases expression of genes involved inmitochondrial biogenesis (B), increases PPARa/d expression (C and F), and genes involved in hepatic fatty acid oxidation (D and G), and nor-malizes the expression of genes involved in glucose homeostasis (E and H), after 2 weeks (A–E) or 4 weeks (F–H) of HFD-T2 treatment. Ex-pression was normalized to that of Cyclophilin F. I and J: Proteomic analysis revealed protein profile changes toward adjustment of hepaticglucose metabolism (I) and lipid metabolism (J) to the HFD challenge. Left: Quantification of the data (for each treatment, expressed relative tothe value obtained for control [N] rats, which was set as 1.0). Right: Representative 2D-E subsections obtained from livers of N, HFD, and HFD-T2(4 weeks) rats. Error bars represent SEM. *P < 0.05 vs. untreated controls; **P < 0.05 vs. both untreated controls and HFD-fed groups; ***P <0.05 vs. HFD-fed group. □, N; ■, HFD;▨, HFD-T2.
P. DE LANGE AND ASSOCIATES
diabetes.diabetesjournals.org DIABETES, VOL. 60, NOVEMBER 2011 2737
the circulating levels of cholesterol and triglycerides; and4) under these conditions, T2 specifically augments livermetabolic activity, thus “sparing” skeletal muscle. Becauseside effects are minimized, this natural thyroid-hormonemetabolite can convey a favorable effect on metabolism-associated diseases.
ACKNOWLEDGMENTS
This work was supported by grant progetto di ricercadi rilevante interesse nazionale (PRIN) 2008, protocol20089SRS2X.
No potential conflicts of interest relevant to this articlewere reported.
P.d.L. wrote the manuscript and researched data. F.C.,R.S., L.L., and M.P.M. researched data. M.M., A.Lo., E.S.,and R.D.M. contributed to discussion and researched data.F.G. and A.La. contributed to discussion and reviewed andedited the manuscript.
The authors thank Dr. Thomas Scanlan (Oregon Health &Science University, Portland, OR) for critically reading themanuscript. The authors also thank Dr. Francesc Villarroya(University of Barcelona, Barcelona, Spain) for providingthe 1588/+47hUCP3-Luc plasmid and Drs. Andrew Lassar(Harvard Medical School, Boston, MA) and Howard C. Towle(University of Minnesota, Minneapolis, MN) for providing thepCMVMyoD and pRSV-hTRb1 plasmids, respectively.
REFERENCES
1. Reilly MP, Rader DJ. The metabolic syndrome: more than the sum of itsparts? Circulation 2003;108:1546–1551
2. Barness LA, Opitz JM, Gilbert-Barness E. Obesity: genetic, molecular, andenvironmental aspects. Am J Med Genet A 2007;143A:3016–3034
3. Oppenheimer JH, Schwartz HL, Lane JT, Thompson MP. Functional re-lationship of thyroid hormone-induced lipogenesis, lipolysis, and thermo-genesis in the rat. J Clin Invest 1991;87:125–132
4. Moreno M, de Lange P, Lombardi A, Silvestri E, Lanni A, Goglia F. Meta-bolic effects of thyroid hormone derivatives. Thyroid 2008;18:239–253
5. Baxter JD, Webb P. Thyroid hormone mimetics: potential applications inatherosclerosis, obesity and type 2 diabetes. Nat Rev Drug Discov 2009;8:308–320
6. Cioffi F, Lanni A, Goglia F. Thyroid hormones, mitochondrial bioenergeticsand lipid handling. Curr Opin Endocrinol Diabetes Obes 2010;17:402–407
7. Ribeiro MO. Effects of thyroid hormone analogs on lipid metabolism andthermogenesis. Thyroid 2008;18:197–203
8. Lanni A, Moreno M, Lombardi A, et al. 3,5-Diiodo-L-thyronine powerfullyreduces adiposity in rats by increasing the burning of fats. FASEB J 2005;19:1552–1554
9. Hardie DG. AMP-activated/SNF1 protein kinases: conserved guardians ofcellular energy. Nat Rev Mol Cell Biol 2007;8:774–785
10. Baur JA, Pearson KJ, Price NL, et al. Resveratrol improves health andsurvival of mice on a high-calorie diet. Nature 2006;444:337–342
11. Gerhart-Hines Z, Rodgers JT, Bare O, et al. Metabolic control of musclemitochondrial function and fatty acid oxidation through SIRT1/PGC-1alpha.EMBO J 2007;26:1913–1923
12. Lagouge M, Argmann C, Gerhart-Hines Z, et al. Resveratrol improves mi-tochondrial function and protects against metabolic disease by activatingSIRT1 and PGC-1alpha. Cell 2006;127:1109–1122
13. Picard F, Kurtev M, Chung N, et al. Sirt1 promotes fat mobilization in whiteadipocytes by repressing PPAR-gamma. Nature 2004;429:771–776
14. Rodgers JT, Lerin C, Haas W, Gygi SP, Spiegelman BM, Puigserver P.Nutrient control of glucose homeostasis through a complex of PGC-1alphaand SIRT1. Nature 2005;434:113–118
15. Rodgers JT, Puigserver P. Fasting-dependent glucose and lipid metabolicresponse through hepatic sirtuin 1. Proc Natl Acad Sci U S A 2007;104:12861–12866
16. Feige JN, Lagouge M, Cantò C, et al. Specific SIRT1 activation mimics lowenergy levels and protects against diet-induced metabolic disorders byenhancing fat oxidation. Cell Metab 2008;8:347–358
17. Lionetti L, Mollica MP, Crescenzo R, et al. Skeletal muscle subsarcolemmalmitochondrial dysfunction in high-fat fed rats exhibiting impaired glucosehomeostasis. Int J Obes (Lond) 2007;31:1596–1604T
ABLE
1Differentially
expressedproteins
inliv
erof
HFD-T2ve
rsus
HFD
rats,as
assessed
byproteo
mic
analysis
Spot
numbe
rProtein
name
Protein
func
tion
Acc
ession
numbe
r
The
oretical
isoe
lectric
point/molec
ular
mass(kDa)
Proba
bility
Match
es
Glycolysis
1Fructose-bispho
spha
tealdo
lase
B(FBPA)
Carbo
hydratede
grad
ation
P00
884
8.43
/39.8
3.0E
-09
92
Pyruv
atekina
seisozym
esR/L
(LPK)
Carbo
hydratede
grad
ation
P00
884
6.90
/62.5
3.4E
-10
93
Triosep
hospha
teisom
erase(TPI)
Carbo
hydratede
grad
ation
P48
500
6.84
/27.3
1.3E
-09
7Gluconeogenesis
4PEPCK
Rate-lim
itingstep
inthemetab
olic
pathway
that
prod
uces
gluc
ose
P07
379
6.46
/70.1
2.1E
-07
8
5Fructose-1,6-bispho
spha
tase
1(FBPase1
)Carbo
hydratebiosyn
thesis
P19
112
5.56
/39.9
7.0E
-11
86
Isoc
itrate
dehy
drog
enase[N
ADP](IDH)
Produ
ctionof
NADPH
P41
562
6.99
/47.0
9.0E
-66
Lipid
metabolism
(mitochondrial
b-oxidation)
7Eno
ylCoA
hydratase(E
CH)
Mitoc
hond
rial
fattyac
idb-oxida
tion
P14
604
8.1/31
.83.3E
-08
7Lipid
metabolism
(lipogenesis)
8Carbo
nican
hydrase3(C
A3)
Hyd
ration
ofca
rbon
diox
ide;
major
participan
tin
thehe
paticrespon
seto
oxidativestress
P14
141
6.99
/29.5
2.0E
-09
7
9Glyce
rol-3
-pho
spha
tede
hydrog
enase
[NAD+](G
PDH)
Triglyc
eridebiosyn
thesis
O35
077
6.76
/37.8
8.0E
-08
8
3,5-DIIODO-L-THYRONINE AND INSULIN RESISTANCE
2738 DIABETES, VOL. 60, NOVEMBER 2011 diabetes.diabetesjournals.org
18. Mollica MP, Lionetti L, Moreno M, et al. 3,5-Diiodo-l-thyronine, by modu-lating mitochondrial functions, reverses hepatic fat accumulation in ratsfed a high-fat diet. J Hepatol 2009;51:363–370
19. Moreno M, Lanni A, Lombardi A, Goglia F. How the thyroid controls me-tabolism in the rat: different roles for triiodothyronine and diiodothyr-onines. J Physiol 1997;505:529–538
20. Alexson SEH, Nedergaard J. A novel type of short- and medium-chain acyl-CoA hydrolases in brown adipose tissue mitochondria. J Biol Chem 1988;263:13564–13571
21. de Lange P, Farina P, Moreno M, et al. Sequential changes in the signaltransduction responses of skeletal muscle following food deprivation.FASEB J 2006;20:2579–2581
22. de Lange P, Feola A, Ragni M, et al. Differential 3,5,39-triiodothyronine-mediated regulation of uncoupling protein 3 transcription: role of Fattyacids. Endocrinology 2007;148:4064–4072
23. Senese R, Valli V, Moreno M, et al. Uncoupling protein 3 expression levelsinfluence insulin sensitivity, fatty acid oxidation, and related signalingpathways. Pflugers Arch 2011;461:153–164
24. Silvestri E, Moreno M, Schiavo L, et al. A proteomics approach to identifyprotein expression changes in rat liver following administration of 3,5,39-triiodo-L-thyronine. J Proteome Res 2006;5:2317–2327
25. Lombardi A, Silvestri E, Cioffi F, et al. Defining the transcriptomic andproteomic profiles of rat ageing skeletal muscle by the use of a cDNAarray, 2D- and Blue native-PAGE approach. J Proteomics 2009;72:708–721
26. Solanes G, Pedraza N, Iglesias R, Giralt M, Villarroya F. The human un-coupling protein-3 gene promoter requires MyoD and is induced by reti-noic acid in muscle cells. FASEB J 2000;14:2141–2143
27. Cable EE, Finn PD, Stebbins JW, et al. Reduction of hepatic steatosis inrats and mice after treatment with a liver-targeted thyroid hormone re-ceptor agonist. Hepatology 2009;49:407–417
28. Fulco M, Sartorelli V. Comparing and contrasting the roles of AMPK andSIRT1 in metabolic tissues. Cell Cycle 2008;7:3669–3679
29. Cantó C, Jiang LQ, Deshmukh AS, et al. Interdependence of AMPK andSIRT1 for metabolic adaptation to fasting and exercise in skeletal muscle.Cell Metab 2010;11:213–219
30. Purushotham A, Schug TT, Xu Q, Surapureddi S, Guo X, Li X. Hepatocyte-specific deletion of SIRT1 alters fatty acid metabolism and results in he-patic steatosis and inflammation. Cell Metab 2009;9:327–338
31. Ponugoti B, Kim D-H, Xiao Z, et al. SIRT1 deacetylates and inhibits SREBP-1C activity in regulation of hepatic lipid metabolism. J Biol Chem 2010;285:33959–33970
32. Banks AS, Kon N, Knight C, et al. SirT1 gain of function increases energyefficiency and prevents diabetes in mice. Cell Metab 2008;8:333–341
33. Lynch CJ, Fox H, Hazen SA, Stanley BA, Dodgson S, Lanoue KF. Role ofhepatic carbonic anhydrase in de novo lipogenesis. Biochem J 1995;310:197–202
34. Supuran CT, Di Fiore A, De Simone G. Carbonic anhydrase inhibitors asemerging drugs for the treatment of obesity. Expert Opin Emerg Drugs2008;13:383–392
P. DE LANGE AND ASSOCIATES
diabetes.diabetesjournals.org DIABETES, VOL. 60, NOVEMBER 2011 2739
Related Documents